Los Angeles · San Francisco · Sacramento · Fresno · Ontario · San Diego Portland · Norfolk · Cleveland · Abuja · Beijing July 18, 2008 California State Board of Equalization 450 N Street Sacramento, California 94279 Document No. 20803001.2 Revised Attention: David Gau Regarding: Limited Indoor Air Quality Survey 7 TH Floor Dear Mr. Gau: On various dates in March and April of 2008, industrial hygienists with Hygiene Technologies International, Inc. (HygieneTech) conducted a limited indoor air quality survey on the 7 TH Floor of the California State Board of Equalization building located at the above referenced address. At the time of the survey, various samples were collected and direct-reading instruments were used to assess the general indoor air quality, with a clear emphasis on establishing fungal growth exposure potential data. I have enclosed our report, which included general observations, samples and direct-reading results, a discussion of the data, conclusions, and recommendations. If you have any comments or questions regarding the information contained in this report, please do not hesitate to contact our offices directly at (310) 370-8370. Sincerely, HYGIENE TECHNOLOGIES INTERNATIONAL, INC. Brian P. Daly, CIH, PE President

Welcome message from author
This document is posted to help you gain knowledge. Please leave a comment to let me know what you think about it! Share it to your friends and learn new things together.
Transcript

L o s A n g e l e s · S a n F r a n c i s c o · S a c r a m e n t o · F r e s n o · O n t a r i o · S a n D i e g o P o r t l a n d · N o r f o l k · C l e v e l a n d · A b u j a · B e i j i n g
July 18, 2008 California State Board of Equalization 450 N Street Sacramento, California 94279
Document No. 20803001.2 Revised Attention: David Gau Regarding: Limited Indoor Air Quality Survey 7TH Floor Dear Mr. Gau: On various dates in March and April of 2008, industrial hygienists with Hygiene Technologies International, Inc. (HygieneTech) conducted a limited indoor air quality survey on the 7TH Floor of the California State Board of Equalization building located at the above referenced address. At the time of the survey, various samples were collected and direct-reading instruments were used to assess the general indoor air quality, with a clear emphasis on establishing fungal growth exposure potential data. I have enclosed our report, which included general observations, samples and direct-reading results, a discussion of the data, conclusions, and recommendations. If you have any comments or questions regarding the information contained in this report, please do not hesitate to contact our offices directly at (310) 370-8370. Sincerely, HYGIENE TECHNOLOGIES INTERNATIONAL, INC.
Brian P. Daly, CIH, PE President

L o s A n g e l e s · S a n F r a n c i s c o · S a c r a m e n t o · F r e s n o · O n t a r i o · S a n D i e g o P o r t l a n d · N o r f o l k · C l e v e l a n d · A b u j a · B e i j i n g
LIMITED INDOOR AIR QUALITY SURVEY
450 N STREET – 7TH FLOOR
SACRAMENTO, CALIFORNIA
PREPARED FOR:
CALIFORNIA STATE BOARD OF EQUALIZATION 450 N STREET
SACRAMENTO, CALIFORNIA
PREPARED BY:
HYGIENE TECHNOLOGIES INTERNATIONAL, INC. 3625 DEL AMO BOULEVARD, SUITE 180
TORRANCE, CALIFORNIA
JULY 18, 2008

California State Board of Equalization Limited Indoor Air Quality Survey – 7TH Floor Document No. 20803001.2 Revised Page 1
1.0 BACKGROUND On various dates in March and April of 2008, industrial hygienists with Hygiene Technologies International, Inc. (HygieneTech) conducted a limited indoor air quality survey on the 7TH Floor of the California State Board of Equalization Building located at 450 N Street in Sacramento, California. During the survey, a variety of samples were collected and direct-reading instruments were used to assess the general indoor air quality on the 7TH Floor of the subject building. Various air and surface samples were collected in order to assess fungal growth exposure potentials and to establish fungal growth assessment information on selected building material surfaces. In addition, air samples were collected throughout the floor for fibrous dust, microbial volatile organic compounds (MVOCs), and total dust analysis and direct-reading instruments were used to determine airborne volatile organic compounds (VOCs), carbon dioxide (CO2), ozone (O3), air temperature, and relative humidity. 2.0 OBSERVATIONS The interior building materials of the 7TH Floor included, but were not limited to, metal window frames; painted gypsum board and/or metal window sills; metal doorjambs and door frames; painted gypsum board walls in the general work areas; tile covered walls and painted gypsum board ceilings in the restrooms; suspended 2' by 4' ceiling tiles in the general work areas; vinyl cove base; carpet flooring in the general work areas; and ceramic or vinyl tile flooring in the restrooms and break rooms. The furnishings in the surveyed areas included desks, upholstered chairs, shelves, fabric covered cubicles, office supplies, computers, and other electronic office equipment. The furnishings did not appear to support fungal growth, nor did they appear to have been affected in any other manner by water intrusion. 3.0 SAMPLING AND ANALYSIS Air samples were collected and subsequently analyzed for fungi (including yeasts, molds, rusts, smuts, and mushrooms) by trained and experienced microbiologists at a laboratory accredited by the American Industrial Hygiene Association (AIHA) and that successfully participates in the AIHA Environmental Microbiology Proficiency Analytical Testing (EMPAT) Program. Other samples were collected for airborne fibers, MVOCs, and total dust determinations using SKC® brand Airchek® 52 sampling pumps and the appropriate sampling media. Pump flow rates were established and verified using a BIOS DryCal DC-Lite primary flow meter. Those samples were collected and analyzed along with blanks (identical sampling media through which no air was drawn), when necessary, at laboratories accredited by the American Industrial Hygiene Association (AIHA) through successful participation in the National Institute for Occupational Safety and Health (NIOSH) Proficiency Analytical Testing Program. Direct-reading instruments were used to determine airborne O3, and VOC levels, the results of which appear in Table 20803001-116 in Appendix A of this report. A discussion of the airborne CO2 data, along with air temperature and relative humidity results, appears in Section 4.0 of this report. Additional information concerning the specific sampling and analytical methods appears below.

California State Board of Equalization Limited Indoor Air Quality Survey – 7TH Floor Document No. 20803001.2 Revised Page 2
3.0 SAMPLING AND ANALYSIS (CONTINUED) 3.1 Airborne Total Fungi
Air samples for airborne total (viable and nonviable) fungi determinations were collected using Zefon brand Bio-Pumps™ equipped with Allergenco-D™ cassettes. Such samples were collected at various 7TH Floor locations and samples were also collected outdoors on the applicable survey date for comparison purposes. The resultant data, which are presented in spores/M3, appear in Table 20803001-110.
3.2 Airborne Viable Fungi
Air samples for airborne viable fungi determinations were collected on malt extract agar (MEA) using a Gast brand high volume air-sampling pump equipped with an Aerotech 6™ Single Stage Bioaerosol Sampler. Two outdoor samples were also collected on the applicable survey date for comparison purpose. The media was incubated prior to enumeration of colony-forming units per agar plate and the resultant data, presented in colony forming units per cubic meter of air (CFU/ M3), can be found in Table 20803001-111.
3.3 Surface Fungi Growth Potentials
Surface samples were collected for fungal growth assessment using Scotch® brand cellophane tape segments affixed to microscope slides. Additionally, surface fungi samples were collected from various heating, ventilating, and air conditioning (HVAC) supply air register surfaces using Healthlink® Transporters™ (Rayon tipped swabs immersed in 0.5 ml modified Stuart’s transport medium). These data are presented in Table 20803001-112.
3.4 Airborne Fibrous Dust
Area air samples for fibrous dust were collected at stationary locations on 25-millimeter diameter, 0.8-micrometer pore size, mixed cellulose ester filters. The samples were analyzed by phase contrast microscopy (PCM) in accordance with the NIOSH Method 7400. These data are presented in fibers per cubic centimeter (f/cc) of air in Table 20803001-113.
3.5 Airborne Total Dust
Area air samples for total dust determination were collected at stationary locations on filter cassettes containing pre-weighed 37-millimeter diameter, polyvinyl chloride filters having a pore size of five micrometers. The samples were analyzed by gravimetric method in accordance with the NIOSH Method 0500. These data are presented in milligrams per cubic meter of air (mg/M3) and appear in 20803001-114.
3.6 Microbial Volatile Organic Compounds Area samples for MVOCs were collected on solid sorbent tubes equipped with Sagelock fittings.
The samples were analyzed by gas chromatography/ mass spectrometry, modified for MVOCs following the AIHA field guide. These data are presented in mg/M3 and appear in Table 20803001-115.

California State Board of Equalization Limited Indoor Air Quality Survey – 7TH Floor Document No. 20803001.2 Revised Page 3
3.0 SAMPLING AND ANALYSIS (CONTINUED) 3.7 Airborne Volatile Organic Compounds
Direct-reading air measurements for VOCs were also recorded at various locations on the 7TH Floor using a RAE Systems, Inc. Mini-RAE 2000 photoionization detector, which is capable of detecting a wide variety of unsaturated hydrocarbons at airborne concentrations ranging from 0.1 to 10,000 parts per million (ppm). Prior to the survey, this instrument was calibrated using a 100-ppm isobutylene gas standard. These data are presented in parts per million (ppm).
3.8 Airborne Ozone
Direct-reading air measurements for O3 were recorded at various locations using a Dräger colorimetric detector tube apparatus with the appropriate detector tubes. The data are presented in ppm.
3.9 Airborne Carbon Dioxide
Direct-reading air measurements for airborne CO2 concentrations were recorded at a stationary location using a Telaire®7001 Carbon Dioxide and Temperature Monitor along with the HOBO® data logger. The data are presented in ppm.
3.10 Air Temperature and Relative Humidity Air temperature and relative humidity data were recorded at a stationary location using a
Telaire®7001 Carbon Dioxide and Temperature Monitor along with the HOBO® data logger. 4.0 DISCUSSION 4.1 Airborne Total Fungi
The airborne total fungi data showed common spore types outdoors, such as Alternaria, ascospores, basidiospores, Cladosporium, colorless spores typical of Penicillium and Aspergillus species, Epicoccum, Oidium, other brown, rusts, and smuts, with basidiospores predominating in both samples. Indoors, the data showed airborne concentrations of common fungal spores that included one or more of the following: Alternaria, ascospores, basidiospores, Bipolaris/Drechslera group, Cladosporium, colorless spores typical of Penicillium and Aspergillus species, Epicoccum, other brown, rust, and/or smuts. Indoors, the distribution of fungal spore types detected in the surveyed areas was generally consistent with those found outdoors, and the overall data within the tested areas were generally well below the overall data recorded outdoors. Note, however, that an above-background level of colorless spores typical of Penicillium and Aspergillus species was detected in Cubicle 96.03.

California State Board of Equalization Limited Indoor Air Quality Survey – 7TH Floor Document No. 20803001.2 Revised Page 4
4.0 DISCUSSION (CONTINUED) 4.2 Airborne Viable Fungi
The viable fungi data recorded outdoors showed an overall level of 442 CFU/M3 in both samples, with Cladosporium predominating. Indoors, low levels of common fungi were found including Aspergillus fumigatus, A. niger, Aureobasidium, Cladosporium, non-sporulating fungi, Penicillium, and/or yeasts. However, note that a slightly above-background level of Aspergillus niger was detected at approximate breathing zone height in Cubicle 96.03.
4.3 Surface Fungal Growth Potentials
The surface assessment data involving the samples collected from various cubicle partitions throughout the 7TH Floor indicated no evidence of fungal growth on those surfaces. However, the surface assessment data involving samples collected from the HVAC supply air registers indicated fungal growth involving brown hyphae and/or unknown hyphal structures on all eight of the registers sampled. Be advised that visible accumulation of debris, dust, and other particulates was observed on the reverse side of all sampled HVAC supply air registers, and that such conditions are indicative of an environment that may promote fungal growth.
4.4 Airborne Fibrous Dust
The data recorded in the surveyed areas indicated that airborne fibrous dusts were either not detected above the laboratory detection limit of 0.004 f/cc or were detected at levels ranging from 0.004 to 0.006 f/cc. Because the samples were collected at stationary locations at approximate breathing zone height, the resultant data are expected to represent building occupant exposure potentials for those persons working in or passing through the areas monitored. These data, which are expected to represent employee exposure potentials to fibers of various types, including man-made and natural mineral fibers, cellulosics (paper or wood composition), gypsum, and other fibrous dusts common in the environment, are well below the current Cal-OSHA 8-hour TWA PEL for asbestos fibers of 0.1 f/cc, the most restrictive exposure limit for fibrous dusts.
4.5 Airborne Total Dust
Common dust that is typically identified in buildings usually contains a wide variety of materials
including, but not limited to, gypsum crystals, cellulosic particles, fiberglass fragments, mineral grains from soil, fungi spores, fine glass fibers, textile and wood fibers, iron or steel fragments, dead skin cells, insect parts, animal dander, and pollens. Generally, exposure to low levels of such materials does not produce ill effects in most persons. In fact, these so-called nuisance dusts have a long history of little adverse effect to the lungs and are not known to produce significant diseases or toxic effects, such as collagen (scar tissue) formation, when exposure are kept under reasonable control.
The data recorded in the surveyed areas showed that airborne total dust was not detected at or above the respective laboratory analytical detection limits. Because the samples were collected at stationary locations at approximate breathing zone height, the resultant data are expected to represent building occupant exposure potentials for those persons working in or passing through the areas monitored. These data are well below the State of California, Department of Industrial Relations, Division of Occupational Safety and Health (Cal-OSHA) 8-hour time-weighted average

California State Board of Equalization Limited Indoor Air Quality Survey – 7TH Floor Document No. 20803001.2 Revised Page 5
4.0 DISCUSSION (CONTINUED)
4.5 Airborne Total Dust (Continued) (TWA) permissible exposure limit (PEL) for total dust of 10 mg/M3, as defined in Title 8 of the California Code of Regulations, Section 5155 (T8, CCR § 5155). Note that these laboratory detection limits are also below the American Conference of Governmental Industrial Hygienists 8-hour TWA threshold limit value (TLV-TWA) for particulate (not otherwise classified) of 10 mg/M3; and, for all but one sample, below the U.S. Environmental Protection Agency (EPA) National Ambient Air Quality Primary Standard of 0.26 mg/M3 (24-hour standard) and the American Society of Heating, Refrigerating, and Air-Conditioning Engineers, Inc. (ASHRAE) theoretical value for non-occupational environments of 1/10 of the TLV.
4.6 Airborne Microbial Volatile Organic Compounds
Microbial Volatile Organic Compounds (MVOCs) are composed of low molecular weight alcohols, aldehydes, amines, ketones, terpenes, aromatic and chlorinated hydrocarbons, and sulfur-based compounds that are known to be byproducts of microbial metabolism. MVOCs have a very low odor threshold, thus, making them easily detectable by smell. They often have strong odors and are responsible for the smells generally associated with fungal growth.
The airborne MVOC data indicated the presence of 3-methylfuran at levels ranging from 17 ng/m3 to 79 ng/m3, 2-methyl-1-propanol at levels ranging from 197 to 269 ng/ m3, 1-butanol at 189 ng/ m3, dimethyl disulphide at levels ranging from 49 to 93 ng/ m3, 2-hexanone at levels ranging from 54 ng/m3 to 72 ng/m3, and 2-heptanone at levels ranging from 89 ng/m3 to 114 ng/m3. Microbial growth related 3-methylfuran, 2-methyl-1-propanol, 1-butanol, dimethyl disulfide, 2-hexanone, and 2-heptanone would not be expected to be present indoors without additional MVOCs such as ethanol, 1-octen-3-ol, 2-octen-1-ol, benzyl cyanide, 2-methyl-isoborneol, geosmin (1-10-dimethyl-trans-9-decalol), and/or terpenes also being present. The fact that 3-methylfuran, 2-methyl-1-propanol, 1-butanol, dimethyl disulfide, 2-hexanone, and 2-heptanone were detected at low levels without the other above mentioned MVOCs would indicate that its presence on the 7TH Floor was most likely not fungal growth related and attributable to personal products such as perfumes and other personal cosmetic products. All such data are well below the applicable Cal-OSHA 8-hour TWA PELs as defined in T8, CCR § 5155.
4.7 Airborne Volatile Organic Compounds With the use of a direct-reading photoionization detector, VOCs were not detected at or above the
instrument detection limit of 0.1 ppm. Because these data were recorded at stationary locations at approximate breathing zone height, the results are expected to represent building occupant exposure potentials for those persons occupying or passing through the areas monitored. These data were well below the surrogate Cal-OSHA PELs that are often used for comparative purposes regarding VOC exposures, such as those for gasoline, hexane, and varnish makers and painters (VM&P) naphtha.

California State Board of Equalization Limited Indoor Air Quality Survey – 7TH Floor Document No. 20803001.2 Revised Page 6
4.0 DISCUSSION (CONTINUED) 4.8 Airborne Ozone
O3 was not detected at or above the Dräger instrument detection limits of 0.05 ppm. 4.9 Airborne Carbon Dioxide The direct-reading results indicated that CO2 was detected at levels ranging from 522 to 767 ppm on
the 7TH Floor. While these data were somewhat higher than the expected outdoor CO2 levels, which generally range between 320 and 350 ppm, they are considered normal for occupied indoor environments and they are all well below the Cal-OSHA 8-hour TWA PEL for CO2 of 5000 ppm (T8, CCR, § 5155). They are also below the level of 1000 ppm, which is essentially equivalent to the recommended upper limit for building occupant comfort and odor control established by ASHRAE (not greater than 700 ppm above the outdoor CO2 value) as stated in ASHRAE 62-2001.
Based on historic studies performed by HygieneTech, building occupant complaints of "stuffy" air often begin when CO2 levels exceed 800 ppm. HygieneTech has also found that some sensitive persons may experience discomfort, including eye irritation and headache, when CO2 levels reach 1,000 ppm. Such symptoms are not believed to be the result of an unhealthful exposure to CO2; rather, they are thought to be the result of exposure to other common indoor air pollutants which, if not exhausted and/or diluted, can accumulate over time.
4.10 Air Temperature and Relative Humidity
Air temperatures ranged between 75.22 and 78.01 degrees Fahrenheit (°F) on April 9, 2008. Based on the experience of HygieneTech, the air temperatures perceived as comfortable by most persons in office environments, and recommended by ASHRAE for occupant comfort, range between 68.0 and 74.5°F (winter) and 73.0 and 79.0°F (summer). The air temperatures recorded in the surveyed areas were generally within the comfort range recommended for the summer months. Relative humidity data were recorded indoors at levels ranging from 23.8 to 32.9 percent. Such levels were well within the 20 to 60 percent relative humidity level range recommended by ASHRAE for occupant comfort. Note that HygieneTech recommends that the relative humidity in buildings not exceed 50 percent in order to limit the potential for fungal growth.
5.0 CONCLUSIONS 5.1 The airborne total and viable fungi data recorded in the surveyed areas showed airborne fungi
levels that were generally below those recorded outdoors and therefore considered unremarkable. Although above-background levels of colorless spores typical of Penicillium and Aspergillus species and Aspergillus niger were detected in Cubicle 96.03, they were likely anomalies. There was no visual evidence of water intrusion in any neighboring area as this cubicle was located in an open office environment amongst numerous other cubicles. Additionally, other air samples collected nearby within the same general office area were unremarkable. Overall, the data are not believed to pose a health risk beyond that posed by the outdoor environment where exposures to airborne fungi are expected.

California State Board of Equalization Limited Indoor Air Quality Survey – 7TH Floor Document No. 20803001.2 Revised Page 7
5.0 CONCLUSIONS (CONTINUED) 5.2 The surface fungal growth potentials data collected from the HVAC supply air registers indicated
fungal growth involving brown hyphae and/or unknown hyphal structures on all register surface tested. Be advised that visible accumulation of debris, dust, and other particulates was observed on the reverse side of all sampled HVAC supply air registers, and that such conditions are indicative of an environment that may promote fungal growth. However, note that the airborne fungi results discussed above would suggest that such fungal growth did not appear to have adversely affected the indoor air quality on the 7TH Floor.
5.3 The airborne total and fibrous dust, VOC, and O3 recorded during the survey were unremarkable.
Collectively, the data were well below applicable Cal-OSHA 8-hour TWA PELs and/or other occupational, non-occupational, ASHRAE, or foreign guidelines. The data are not expected to represent conditions that pose a measurable health risk to the building occupants.
5.4 The airborne MVOC data indicated the presence of 3-methylfuran at levels ranging from 17 ng/m3 to
79 ng/m3, 2-methyl-1-propanol at levels ranging from 197 to 269 ng/ m3, 1-butanol at 189 ng/ m3, dimethyl disulphide at levels ranging from 49 to 93 ng/ m3, 2-hexanone at levels ranging from 54 ng/m3 to 72 ng/m3, and 2-heptanone at levels ranging from 89 ng/m3 to 114 ng/m3. Microbial growth related 3-methylfuran, 2-methyl-1-propanol, 1-butanol, dimethyl disulfide, 2-hexanone, and 2-heptanone would not be expected to be present indoors without additional MVOCs such as ethanol, 1-octen-3-ol, 2-octen-1-ol, benzyl cyanide, 2-methyl-isoborneol, geosmin (1-10-dimethyl-trans-9-decalol), and/or terpenes also being present. The fact that 3-methylfuran, 2-methyl-1-propanol, 1-butanol, dimethyl disulfide, 2-hexanone, and 2-heptanone were detected at low levels without the other above mentioned MVOCs would indicate that its presence on the 7TH Floor was most likely not fungal growth related and attributable to personal products such as perfumes and other personal cosmetic products. All such data are well below the applicable Cal-OSHA 8-hour TWA PELs as defined in T8, CCR § 5155.
5.5 Air temperatures ranged between 75.22 and 78.01 degrees Fahrenheit (°F) on the survey date.
Based on the experience of HygieneTech, the air temperatures perceived as comfortable by most persons in office environments, and recommended by ASHRAE for occupant comfort, range between 68.0 and 74.5°F (winter) and 73.0 and 79.0°F (summer). The air temperatures recorded in the surveyed areas were generally higher than the comfort range recommended for the winter months. Relative humidity data were recorded indoors at levels ranging from 23.8 to 32.9 percent, levels that were well within the 20 to 60 percent relative humidity level range recommended by ASHRAE for occupant comfort. Note that HygieneTech recommends that the relative humidity in buildings not exceed 50 percent in order to limit the potential for fungal growth.
5.6 Be advised that the data provided in this report only represent fungal growth and exposure
potentials that existed at the time the survey was performed and at the precise sample locations only, the latter of which were selected based on the available background information provided. Note that fungal growth and exposure potentials may change due to changes in environmental conditions (such as those caused by water intrusion), use of mechanical systems, or other factors. Also be advised that additional fungal growth may exist at one or more locations in the structure that were not specifically assessed during the survey.

California State Board of Equalization Limited Indoor Air Quality Survey – 7TH Floor Document No. 20803001.2 Revised Page 8
6.0 RECOMMENDATIONS All such recommendations are based strictly on the assessment information and analytical data that were available to HygieneTech at the time this report was prepared. Be advised that, in order to establish data that accurately reflects all the fungal growth sites on the 7TH Floor, additional assessment evaluations may be required as more information is known regarding the history of water intrusion episodes in discrete building areas. 6.1 If not yet established, an accurate record of all air monitoring results should be maintained in
accordance with Cal-OSHA regulation found in T8, CCR § 3204. All affected employees should be informed that the exposure potential data in this report exist and that those persons, or their representatives, have a right to access relevant exposure data and medical records.
6.2 Routine cleaning of the HVAC supply air registers on the 7TH Floor should be performed to
preclude the build-up of dust and debris, which may potentially contribute to fungal growth on those surfaces.
6.3 Also be advised that the exposure data recorded during the survey may not be sufficiently broad
to adequately assess the suitability of the indoor air quality for all individuals, particularly those who are extremely sensitive to certain chemical and/or biological substances or for those individuals with immune system deficiencies. Although not expected, if persons occupying or passing through the 7TH Floor do experience non-specific ill effects of unknown etiology, then those affected should be referred to a medical professional in order to determine or specify the possible cause(s) of such reactions. If more information becomes available, further investigation and air monitoring may be warranted.
HYGIENE TECHNOLOGIES INTERNATIONAL, INC.
Kenny K. Hsi, CIH Technical Director
Date: July 18, 2008
Brian P. Daly, CIH, PE President
Date: July 18, 2008

HYGIENE TECHNOLOGIES INTERNATIONAL, INC. CLIENT: California State Board of Equalization
450 N Street Sacramento, California 94279
APPENDIX A
TABLE 20803001-110 AIRBORNE TOTAL FUNGI RESULTS
7TH FLOOR SACRAMENTO, CALIFORNIA
MARCH 3 AND 6, 2008
Page 1
Background debris is an indication of the amount of non-biological particulate matter present on the slide and is graded (from least to greatest) as 1+ to 4+.
Results reported in spores per cubic meter of air (spores/M3) SAMPLE NUMBER 20803001-TM01AC 20803001-TM02AC 20803001-TM03AC 20803001-TM04AC SAMPLING LOCATION/ACTIVITIES
Column M18 area; Cubicle 004; within
ceiling plenum/ Sampling activities
only
Column L18 area; Cubicle 008; within
ceiling plenum/ Sampling activities
only
Column K18 area; Cubicle 067; within
ceiling plenum/ Sampling activities
only
Column K21 area; Cubicle 076; within
ceiling plenum/ Sampling activities
only DATE 03-03-08 03-03-08 03-03-08 03-03-08 START/STOP 11:30:00/11:35:00 11:40:00/11:45:00 11:44:00/11:49:00 11:50:00/11:55:00 SAMPLE TIME 5 minutes 5 minutes 5 minutes 5 minutes
Alternaria Arthrinium
Ascospores
Aureobasidium
Basidiospores 53 53 53
Bipolaris/Drechslera group
Botrytis
Chaetomium
Cladosporium 53 107 107
Curvularia
Epicoccum
Myrothecium
Nigrospora
Oidium
Other brown 13
Penicillium/Aspergillus types 107 53 53 53
Pithomyces
Rusts
Smuts (Periconia, Myxomycetes) 13
Stachybotrys
Torula
Ulocladium
Hyphal fragments <13 <13 <13 13
Background particulates* 2+ 2+ 2+ 2+
TOTAL** 239 160 213 106

HYGIENE TECHNOLOGIES INTERNATIONAL, INC. CLIENT: California State Board of Equalization
450 N Street Sacramento, California 94279
APPENDIX A
TABLE 20803001-110 AIRBORNE TOTAL FUNGI RESULTS
7TH FLOOR SACRAMENTO, CALIFORNIA
MARCH 3 AND 6, 2008
Page 2
Background debris is an indication of the amount of non-biological particulate matter present on the slide and is graded (from least to greatest) as 1+ to 4+.
Results reported in spores per cubic meter of air (spores/M3) SAMPLE NUMBER 20803001-TM05AC 20803001-TM06AC 20803001-TM07AC 20803001-TM08AC SAMPLING LOCATION/ACTIVITIES
Column K22 area; Cubicle 098; within
ceiling plenum/ Sampling activities
only
Column N22 area; Cubicle 106; within
ceiling plenum/ Sampling activities
only
Column N21 area; Cubicle 127; within
ceiling plenum/ Sampling activities
only
Area between Column N18 and N21; Cubicle
132; within ceiling plenum/Sampling
activities only DATE 03-03-08 03-03-08 03-03-08 03-03-08 START/STOP 11:56:00/12:01:00 12:00:00/12:05:00 13:45:00/13:50:00 13:55:00/14:00:00 SAMPLE TIME 5 minutes 5 minutes 5 minutes 5 minutes
Alternaria 13 Arthrinium
Ascospores
Aureobasidium
Basidiospores 53 107
Bipolaris/Drechslera group 13
Botrytis
Chaetomium
Cladosporium 53 160 107
Curvularia
Epicoccum
Myrothecium
Nigrospora
Oidium
Other brown 13
Penicillium/Aspergillus types 53 107 53 160
Pithomyces
Rusts 13
Smuts (Periconia, Myxomycetes) 27 40
Stachybotrys
Torula
Ulocladium
Hyphal fragments <13 <13 53 40
Background particulates* 2+ 2+ 3+ 3+
TOTAL** 53 173 306 440

HYGIENE TECHNOLOGIES INTERNATIONAL, INC. CLIENT: California State Board of Equalization
450 N Street Sacramento, California 94279
APPENDIX A
TABLE 20803001-110 AIRBORNE TOTAL FUNGI RESULTS
7TH FLOOR SACRAMENTO, CALIFORNIA
MARCH 3 AND 6, 2008
Page 3
Background debris is an indication of the amount of non-biological particulate matter present on the slide and is graded (from least to greatest) as 1+ to 4+.
Results reported in spores per cubic meter of air (spores/M3) SAMPLE NUMBER 20803001-TM01OUTME 20803001-TM18ME 20803001-TM19ME 20803001-TM20ME SAMPLING LOCATION/ACTIVITIES
Outdoors; about 30 feet east of building;
approximately five feet above ground/Normal
outdoor activities
Column N22 area; Cubicle 96.03; about center; approximately
five feet above floor/Normal office
activities
Column M22; Cubicle 89; about center;
approximately five feet above floor/Normal
office activities
Column L 22 area; about three feet south of Cubicle
100; approximately five feet above
floor/Normal office activities
DATE 03-06-08 03-06-08 03-06-08 03-06-08 START/STOP 10:52:00/10:57:00 14:57:00/15:02:00 15:06:00/15:11:00 15:12:00/15:17:00 SAMPLE TIME 5 minutes 5 minutes 5 minutes 5 minutes
Alternaria 13 Arthrinium
Ascospores 427
Aureobasidium
Basidiospores 747 53
Bipolaris/Drechslera group
Botrytis
Chaetomium
Cladosporium 160
Curvularia
Epicoccum 13
Nigrospora
Oidium
Other brown 13
Other colorless
Penicillium/Aspergillus types 533 1,210 160 53
Pithomyces
Rusts 13
Smuts (Periconia, Myxomycetes) 13 13 13
Stachybotrys
Stemphylium
Torula
Ulocladium
Hyphal fragments 53 <13 <13 <13
Background particulates* 3+ 3+ 3+ 2+
TOTAL** 1,932 1,210 173 119
HYGIENE TECHNOLOGIES INTERNATIONAL, INC. CLIENT: California State Board of Equalization
450 N Street Sacramento, California 94279
APPENDIX A
TABLE 20803001-110 AIRBORNE TOTAL FUNGI RESULTS
7TH FLOOR SACRAMENTO, CALIFORNIA
MARCH 3 AND 6, 2008
Page 4
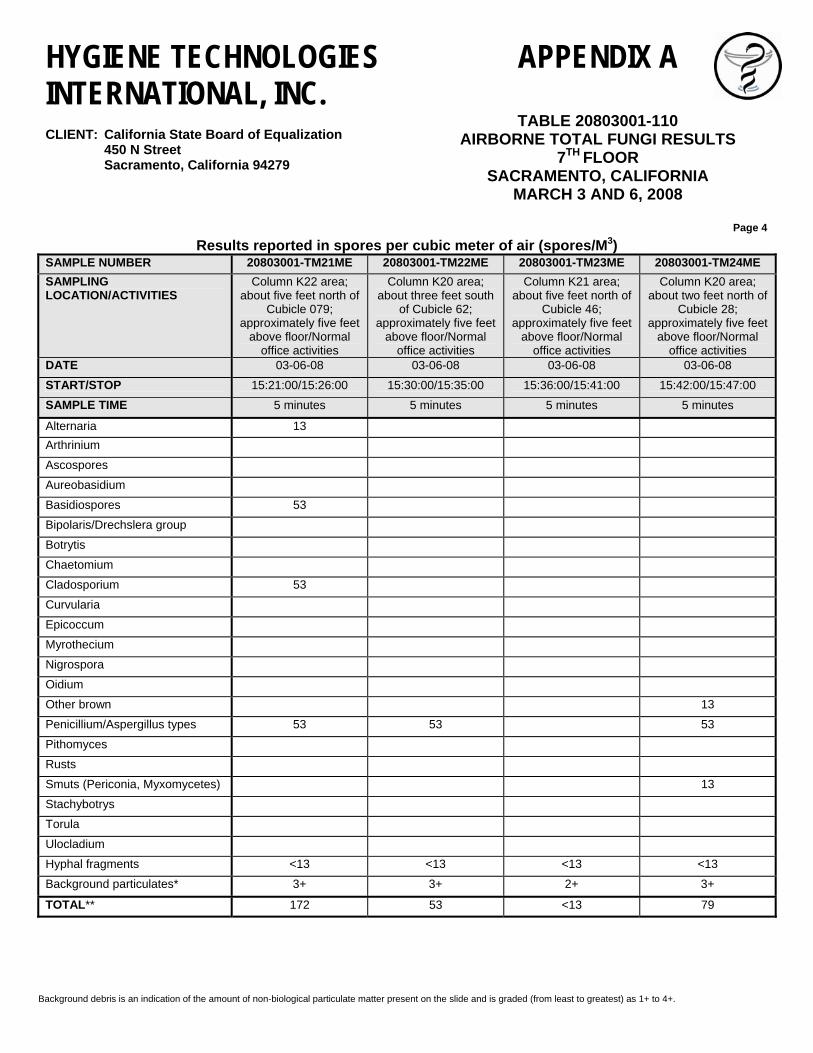
Background debris is an indication of the amount of non-biological particulate matter present on the slide and is graded (from least to greatest) as 1+ to 4+.
Results reported in spores per cubic meter of air (spores/M3) SAMPLE NUMBER 20803001-TM21ME 20803001-TM22ME 20803001-TM23ME 20803001-TM24ME SAMPLING LOCATION/ACTIVITIES
Column K22 area; about five feet north of
Cubicle 079; approximately five feet
above floor/Normal office activities
Column K20 area; about three feet south
of Cubicle 62; approximately five feet
above floor/Normal office activities
Column K21 area; about five feet north of
Cubicle 46; approximately five feet
above floor/Normal office activities
Column K20 area; about two feet north of
Cubicle 28; approximately five feet
above floor/Normal office activities
DATE 03-06-08 03-06-08 03-06-08 03-06-08 START/STOP 15:21:00/15:26:00 15:30:00/15:35:00 15:36:00/15:41:00 15:42:00/15:47:00 SAMPLE TIME 5 minutes 5 minutes 5 minutes 5 minutes
Alternaria 13 Arthrinium
Ascospores
Aureobasidium
Basidiospores 53
Bipolaris/Drechslera group
Botrytis
Chaetomium
Cladosporium 53
Curvularia
Epicoccum
Myrothecium
Nigrospora
Oidium
Other brown 13
Penicillium/Aspergillus types 53 53 53
Pithomyces
Rusts
Smuts (Periconia, Myxomycetes) 13
Stachybotrys
Torula
Ulocladium
Hyphal fragments <13 <13 <13 <13
Background particulates* 3+ 3+ 2+ 3+
TOTAL** 172 53 <13 79

HYGIENE TECHNOLOGIES INTERNATIONAL, INC. CLIENT: California State Board of Equalization
450 N Street Sacramento, California 94279
APPENDIX A
TABLE 20803001-110 AIRBORNE TOTAL FUNGI RESULTS
7TH FLOOR SACRAMENTO, CALIFORNIA
MARCH 3 AND 6, 2008
Page 5
Background debris is an indication of the amount of non-biological particulate matter present on the slide and is graded (from least to greatest) as 1+ to 4+.
Results reported in spores per cubic meter of air (spores/M3) SAMPLE NUMBER 20803001-TM25ME 20803001-TM26ME 20803001-TM27ME 20803001-TM28ME SAMPLING LOCATION/ACTIVITIES
Column K19 area; Cubicle 68; about
center; approximately five feet above
floor/Normal office activities
Column K18 area; about five feet west of
Cubicle 009; approximately five feet
above floor/Normal office activities
Column L18 area; about three feet west
of Cubicle 007; approximately five feet
above floor/Normal office activities
Column M18; about three feet west of
Cubicle 165; approximately five feet
above floor/Normal office activities
DATE 03-06-08 03-06-08 03-06-08 03-06-08 START/STOP 15:51:00/15:56:00 15:57:00/16:02:00 16:05:00/16:10:00 16:11:00/16:16:00 SAMPLE TIME 5 minutes 5 minutes 5 minutes 5 minutes
Alternaria 27 Arthrinium
Ascospores
Aureobasidium
Basidiospores
Bipolaris/Drechslera group
Botrytis
Chaetomium
Cladosporium 213 53
Curvularia
Epicoccum
Myrothecium
Nigrospora
Oidium
Other brown
Penicillium/Aspergillus types 53 53 107 107
Pithomyces
Rusts
Smuts (Periconia, Myxomycetes) 53
Stachybotrys
Torula
Ulocladium
Hyphal fragments 13 13 <13 13
Background particulates* 3+ 3+ 3+ 3+
TOTAL** 319 133 107 107

HYGIENE TECHNOLOGIES INTERNATIONAL, INC. CLIENT: California State Board of Equalization
450 N Street Sacramento, California 94279
APPENDIX A
TABLE 20803001-110 AIRBORNE TOTAL FUNGI RESULTS
7TH FLOOR SACRAMENTO, CALIFORNIA
MARCH 3 AND 6, 2008
Page 6
Background debris is an indication of the amount of non-biological particulate matter present on the slide and is graded (from least to greatest) as 1+ to 4+.
Results reported in spores per cubic meter of air (spores/M3) SAMPLE NUMBER 20803001-TM29ME 20803001-TM30ME 20803001-TM31ME 20803001-TM32ME SAMPLING LOCATION/ACTIVITIES
Column N18 area; about 10 feet south of
Cubicle 135; approximately five feet
above floor/Normal office activities
Area between Columns N21 and
N22; Cubicle 132.01; about center;
approximately five feet above floor/Normal
office activities
Area between Columns N21 and N22; Cubicle 137;
about center; approximately five feet
above floor/Normal office activities
Area between Columns N21 and N22; Cubicle 126;
about center; approximately five feet
above floor/Normal office activities
DATE 03-06-08 03-06-08 03-06-08 03-06-08 START/STOP 16:20:00/16:25:00 16:30:00/16:35:00 16:36:00/16:41:00 16:42:00/16:47:00 SAMPLE TIME 5 minutes 5 minutes 5 minutes 5 minutes
Alternaria Arthrinium
Ascospores 13
Aureobasidium
Basidiospores 53
Bipolaris/Drechslera group
Botrytis
Chaetomium
Cladosporium 280
Curvularia
Epicoccum
Myrothecium
Nigrospora
Oidium
Other brown
Penicillium/Aspergillus types 107 53
Pithomyces
Rusts 13
Smuts (Periconia, Myxomycetes) 13
Stachybotrys
Torula
Ulocladium
Hyphal fragments <13 <13 13 <13
Background particulates* 3+ 3+ 3+ 2+
TOTAL** 133 13 386 <13

HYGIENE TECHNOLOGIES INTERNATIONAL, INC. CLIENT: California State Board of Equalization
450 N Street Sacramento, California 94279
APPENDIX A
TABLE 20803001-110 AIRBORNE TOTAL FUNGI RESULTS
7TH FLOOR SACRAMENTO, CALIFORNIA
MARCH 3 AND 6, 2008
Page 7
Background debris is an indication of the amount of non-biological particulate matter present on the slide and is graded (from least to greatest) as 1+ to 4+.
Results reported in spores per cubic meter of air (spores/M3) SAMPLE NUMBER 20803001-TM33ME 20803001-TM34OUTME SAMPLING LOCATION/ACTIVITIES
Column N21 area; about two feet south
of Cubicle 115; approximately five
feet above floor/Normal office
activities
Outdoors; about 30 feet east of building;
approximately five feet above ground/Normal
outdoor activities
This column intentionally left blank
This column intentionally left blank
DATE 03-06-08 03-06-08 START/STOP 16:51:00/16:56:00 17:00:00/17:05:00 SAMPLE TIME 5 minutes 5 minutes
Alternaria Arthrinium
Ascospores 427
Aureobasidium
Basidiospores 53 1,440
Bipolaris/Drechslera group
Botrytis
Chaetomium
Cladosporium 907
Curvularia
Epicoccum 13
Myrothecium
Nigrospora
Oidium 13
Other brown 27
Penicillium/Aspergillus types 53 693
Pithomyces
Rusts 27
Smuts (Periconia, Myxomycetes) 13 67
Stachybotrys
Ulocladium
Hyphal fragments <13 80
Background particulates* 3+ 3+
TOTAL** 119 3,614

HYGIENE TECHNOLOGIES INTERNATIONAL, INC. CLIENT: California State Board of Equalization
450 N Street Sacramento, California
APPENDIX A
TABLE 20803001-111 AIRBORNE VIABLE FUNGI RESULTS
7TH FLOOR SACRAMENTO, CALIFORNIA
MARCH 6, 2008
Page 1
Results reported in colony forming units per cubic meter of air (CFU/M3) SAMPLE NUMBER 20803001-VM01OUTME 20803001-VM10ME 20803001-VM11ME 20803001-VM12ME SAMPLING LOCATION/ACTIVITIES
Outdoor; about 25 feet east of building;
approximately five feet above ground/Normal
outdoor activities
Column N22 area; Cubicle 96.03; about center; approximately
five feet above floor/Normal office
activities
Column L22 area; about three feet south of
Cubicle 100; approximately five feet
above floor/Normal office activities
Column K22 area; about five feet north
of Cubicle 079; approximately five
feet above floor/Normal office
activities START/STOP 10:58:00/11:00:00 15:03:00/15:05:00 15:18:00/15:20:00 15:27:00/15:29:00 SAMPLE TIME 2 minutes 2 minutes 2 minutes 2 minutes
Acremonium Alternaria
Aspergillus fumigatus
Aspergillus niger 18 212 35
Aspergillus other
Aspergillus versicolor
Aureobasidium
Beauveria
Bipolaris/Drechslera group
Botrytis
Chaetomium
Cladosporium 371 18 18
Curvularia
Epicoccum
Nigrospora
Memnoniella
Myrothecium
Non-sporulating fungi 18
Others
Paecilomyces
Penicillium 35
Rhizopus 18
Sporobolomyces
Stachybotrys
Torula herbarum
Trichoderma
Ulocladium
Yeasts
TOTAL 442 212 53 36

HYGIENE TECHNOLOGIES INTERNATIONAL, INC. CLIENT: California State Board of Equalization
450 N Street Sacramento, California
APPENDIX A
TABLE 20803001-111 AIRBORNE VIABLE FUNGI RESULTS
7TH FLOOR SACRAMENTO, CALIFORNIA
MARCH 6, 2008
Page 2
Results reported in colony forming units per cubic meter of air (CFU/M3) SAMPLE NUMBER 20803001-VM13ME 20803001-VM14ME 20803001-VM15ME 20803001-VM16ME SAMPLING LOCATION/ACTIVITIES
Column K20 area; about two feet north of Cubicle 28; approximately five
feet above floor/Normal office activities
Column K18 area; about five feet west of
Cubicle 009; approximately five feet
above floor/Normal office activities
Column M18; about three feet west of
Cubicle 165; approximately five feet
above floor/Normal office activities
Column N18 area; about 10 feet south of
Cubicle 135; approximately five
feet above floor/Normal office
activities START/STOP 15:48:00/15:50:00 16:03:00/16:05:00 16:17:00/16:19:00 16:26:00/16:28:00 SAMPLE TIME 2 minutes 2 minutes 2 minutes 2 minutes
Acremonium Alternaria
Aspergillus fumigatus
Aspergillus niger
Aspergillus other
Aspergillus versicolor
Aureobasidium 18
Beauveria
Bipolaris/Drechslera group
Botrytis
Chaetomium
Cladosporium 35 18 18
Curvularia
Epicoccum
Nigrospora
Memnoniella
Myrothecium
Non-sporulating fungi 18
Others
Paecilomyces
Penicillium
Phoma/coelomycetes
Sporobolomyces
Stachybotrys
Torula herbarum
Trichoderma
Ulocladium
Yeasts 35
TOTAL 88 18 36 <18

HYGIENE TECHNOLOGIES INTERNATIONAL, INC. CLIENT: California State Board of Equalization
450 N Street Sacramento, California
APPENDIX A
TABLE 20803001-111 AIRBORNE VIABLE FUNGI RESULTS
7TH FLOOR SACRAMENTO, CALIFORNIA
MARCH 6, 2008
Page 3
Results reported in colony forming units per cubic meter of air (CFU/M3) SAMPLE NUMBER 20803001-VM17ME 20803001-VM18OUTME SAMPLING LOCATION/ACTIVITIES
Area between Column N21 and N22; Cubicle
126; about center; approximately five feet
above floor/Normal office activities
Outdoor; about 25 feet east of building;
approximately five feet above ground/Normal
outdoor activities
This column intentionally left blank
This column intentionally left
blank
START/STOP 16:48:00/16:50:00 17:06:00/17:08:00 SAMPLE TIME 2 minutes 2 minutes
Acremonium Alternaria
Aspergillus flavus
Aspergillus niger 35
Aspergillus other
Aspergillus versicolor
Aureobasidium
Beauveria
Bipolaris/Drechslera group
Botrytis
Chaetomium
Cladosporium 283
Curvularia
Epicoccum 18
Nigrospora
Memnoniella
Mucor 18
Non-sporulating fungi 18 35
Others
Paecilomyces
Penicillium 53
Phoma/coelomycetes
Sporobolomyces
Stachybotrys
Torula herbarum
Trichoderma
Ulocladium
Yeasts
TOTAL 18 442

HYGIENE TECHNOLOGIES INTERNATIONAL, INC. CLIENT: California State Board of Equalization
450 N Street Sacramento, California 94279
APPENDIX A
TABLE 20803001-112 SURFACE FUNGAL GROWTH POTENTIALS
7TH FLOOR SACRAMENTO, CALIFORNIA
MARCH 3 AND 4, 2008
Page 1
* Includes basidiospores (mushroom spores), myxomycetes, plant pathogens such as ascospores, rusts and smuts, and a mix of saprophytic genera with no particular spore type predominating (indicative of normal trapping).
**Quantities of fungi are graded (from least to greatest) as <1+ to 4+.
DATE SAMPLE NUMBER
SAMPLING LOCATION
AMORPHOUS DEBRIS
MISCELLANEOUS FUNGI/POLLEN
FUNGI SEEN WITH UNDERLYING
MYCELIAL AND/OR SPORULATING STRUCTURES**
OTHER COMMENTS
GENERAL IMPRESSION
03-03-08 20803001-S01AC
Column M 18 area; Cubicle 003; ceiling; from reverse side of
HVAC supply air register
Heavy Very few 2+ brown hyphae with no associated spores, ID unknown (hyphae)
Many dark amorphous
particles detected, not biological in appearance
Fungal growth
03-03-08 20803001-S02AC
Column L18 area; Cubicle 008; ceiling; from reverse side of
HVAC supply air register
Heavy Very few <1+ brown hyphae with no associated
spores, ID unknown (hyphae fragment)
Many dark amorphous
particles detected, not biological in appearance
Minimal fungal growth
03-03-08 20803001-S03AC
Column K18 area; Cubicle 067; ceiling; from reverse side of
HVAC supply air register
Heavy Very few <1+ brown hyphae with no associated
spores, ID unknown (hyphae fragment))
Many dark amorphous
particles detected, not biological in appearance
Minimal fungal growth
03-03-08 20803001-S04AC
Column K21 area; Cubicle 076; ceiling; from reverse side of
HVAC supply air register
Heavy Very few 2+ brown hyphae with no associated spores, ID unknown (hyphae)
Many dark amorphous
particles detected, not biological in appearance
Fungal growth
03-03-08 20803001-S05AC
Column K22 area; Cubicle 098; ceiling; from reverse side of
HVAC supply air register
Heavy Very few 2+ brown hyphae with no associated spores, ID unknown (hyphae)
Many dark amorphous
particles detected, not biological in appearance
Fungal growth
03-03-08 20803001-S06AC
Column N22 area; Cubicle 106; from
reverse side of HVAC supply air register
Heavy Very few <1+ brown hyphae with no associated
spores, ID unknown (hyphae fragment))
Many dark amorphous
particles detected, not biological in appearance
Minimal fungal growth
03-03-08 20803001-S07AC
Column N21 area; Cubicle 127; from
reverse side of HVAC supply air register
Heavy Very few <1+ brown hyphae with no associated
spores, ID unknown (hyphae fragment))
Many dark amorphous
particles detected, not biological in appearance
Minimal fungal growth
03-03-08 20803001-S08AC
Area between Column N18 and N21 area; Cubicle 132; ceiling; from reverse side of
HVAC supply air register
Heavy Very few <1+ brown hyphae with no associated
spores, ID unknown (hyphae fragment))
Many dark amorphous
particles detected, not biological in appearance
Minimal fungal growth
03-04-08 20803001-TL21AC
Column K22 area; Cubicle 079; northern cubicle partition; about
center; from top horizontal surface
Light Very few None None Background

HYGIENE TECHNOLOGIES INTERNATIONAL, INC. CLIENT: California State Board of Equalization
450 N Street Sacramento, California 94279
APPENDIX A
TABLE 20803001-112 SURFACE FUNGAL GROWTH POTENTIALS
7TH FLOOR SACRAMENTO, CALIFORNIA
MARCH 3 AND 4, 2008
Page 2
* Includes basidiospores (mushroom spores), myxomycetes, plant pathogens such as ascospores, rusts and smuts, and a mix of saprophytic genera with no particular spore type predominating (indicative of normal trapping).
**Quantities of fungi are graded (from least to greatest) as <1+ to 4+.
DATE SAMPLE NUMBER
SAMPLING LOCATION
AMORPHOUS DEBRIS
MISCELLANEOUS FUNGI/POLLEN
FUNGI SEEN WITH UNDERLYING
MYCELIAL AND/OR SPORULATING STRUCTURES**
OTHER COMMENTS
GENERAL IMPRESSION
03-04-08 20803001-TL22AC
Column K21 area; Cubicle 075; eastern
cubicle partition; about center; from top
horizontal surface
Light Very few None None Background
03-04-08 20803001-TL23AC
Column K20 area; Cubicle 033; western
cubicle partition; about center; from top
horizontal surface
Light Very few None None Background
03-04-08 20803001-TL24AC
Column K19 area; Cubicle 071; southern cubicle partition; about
center; from top horizontal surface
Light Very few None None Background
03-04-08 20803001-TL25AC
Column K18 area; Cubicle 067; southern
partition at eastern end; from top horizontal
surface
Light Very few None None Background
03-04-08 20803001-TL26AC
Column K18 area; Cubicle 020; western
cubicle partition; about center; from top
horizontal surface
Light Very few None None Background
03-04-08 20803001-TL27AC
Column K18 area; Cubicle 008; eastern
cubicle partition; about center; from top
horizontal surface
Moderate Very few None None Background
03-04-08 20803001-TL28AC
Column L18 area; Cubicle 006; eastern
cubicle partition; about center; from top
horizontal surface
Light Very few None None Background
03-04-08 20803001-TL29AC
Column M18 area; Cubicle 166; northern cubicle partition; about
center; from top horizontal surface
Light Very few None None Background
03-04-08 20803001-TL30AC
Column M18 area; Cubicle 002; eastern
cubicle partition; about center; from top
horizontal surface
Moderate Very few None None Background
03-04-08 20803001-TL31AC
Column N18 area; Cubicle 134; northern cubicle partition; about
center; from top horizontal surface
Light Very few None None Background

HYGIENE TECHNOLOGIES INTERNATIONAL, INC. CLIENT: California State Board of Equalization
450 N Street Sacramento, California 94279
APPENDIX A
TABLE 20803001-112 SURFACE FUNGAL GROWTH POTENTIALS
7TH FLOOR SACRAMENTO, CALIFORNIA
MARCH 3 AND 4, 2008
Page 3
* Includes basidiospores (mushroom spores), myxomycetes, plant pathogens such as ascospores, rusts and smuts, and a mix of saprophytic genera with no particular spore type predominating (indicative of normal trapping).
**Quantities of fungi are graded (from least to greatest) as <1+ to 4+.
DATE SAMPLE NUMBER
SAMPLING LOCATION
AMORPHOUS DEBRIS
MISCELLANEOUS FUNGI/POLLEN
FUNGI SEEN WITH UNDERLYING
MYCELIAL AND/OR SPORULATING STRUCTURES**
OTHER COMMENTS
GENERAL IMPRESSION
03-04-08 20803001-TL32AC
Area between Column N18 and N21 ;Cubicle 132; northern cubicle
partition; about center; from top horizontal
surface
Light Very few None None Background
03-04-08 20803001-TL33AC
Area between Column N18 and N21; Cubicle 139; western cubicle
partition; about center; from top horizontal
surface
Scant Very few None None Background
03-04-08 20803001-TL34AC
Area between Column N18 and N21; Cubicle 130; northern cubicle
partition; about center; from top horizontal
surface
Light Very few None None Background
03-04-08 20803001-TL35AC
Area between Column N21 and N22; Cubicle 126; northern cubicle
partition; about center; from top horizontal
surface
Light Very few None None Background
03-04-08 20803001-TL36AC
Column N21 area; Cubicle 117; southern cubicle partition; about
center; from top horizontal surface
Scant Very few None None Background
03-04-08 20803001-TL37AC
Column N22 area; Cubicle 107; western
cubicle partition; about center; from top
horizontal surface
Scant Very few None None Background
03-04-08 20803001-TL38AC
Column M22 area; Cubicle 104; western
cubicle partition; about center; from top
horizontal surface
Scant Very few None None Background
03-04-08 20803001-TL39AC
Column L22 area; Cubicle 100; northern
cubicle partition at eastern end; from top
horizontal surface
Light Very few None None Background
03-04-08 20803001-TL40AC
Southwestern corner; Column K22 area;
Cubicle 097; western cubicle partition at
southern end; from top horizontal surface
Moderate Very few None A few colorless
spores typical of Penicillium/
Aspergillus detected
Background

HYGIENE TECHNOLOGIES INTERNATIONAL, INC. CLIENT: California State Board of Equalization
450 N Street Sacramento, California 94279
APPENDIX A
TABLE 20803001-113 AIRBORNE FIBERS RESULTS
7TH FLOOR SACRAMENTO, CALIFORNIA
MARCH 17, 2008
LEGEND PPE: Personal protective equipment <: Less than N/A: Not applicable f/cc: Fibers per cubic centimeter of air PEL: Cal-OSHA 8-hour time-weighted average permissible exposure limit
NAME/ REFERENCE
LOCATION/ ACTIVITIES
PPE USED
SAMPLE NUMBER
START/ STOP
SAMPLE TIME CONTAMINANT
RESULTS (f/cc)
PEL (f/cc)
Area Sample Column K20 area; about two feet west of Cubicle 61; approximately six feet above floor/Normal office activities
N/A 20803001-F01JL
9:35 17:41
486 minutes
Fibers <0.004 0.1
Area Sample Column K22 area; Cubicle 66; approximately six feet above floor/Normal office activities
N/A 20803001-F02JL
9:37 17:42
485 minutes
Fibers <0.004 0.1
Area Sample Column L22 area; Cubicle 87; approximately six feet above floor/Normal office activities
N/A 20803001-F03JL
9:39 17:44
485 minutes
Fibers <0.004 0.1
Area Sample Column N22 area; about one foot west of Cubicle 96.03; approximately six feet above floor /Normal office activities
N/A 20803001-F04JL
9:40 17:45
485 minutes
Fibers 0.004 0.1
Area Sample Column N21 area; Cubicle 137; approximately six feet above floor/ Normal office activities
N/A 20803001-F05JL
9:42 17:46
484 minutes
Fibers <0.004 0.1
Area Sample Column N18 area; about two feet west of room 712; approximately six feet above floor /Normal office activities
N/A 20803001-F06JL
9:44 17:47
483 minutes
Fibers 0.005 0.1
Area Sample Column L18 area; about two feet south of Cubicle 71; approximately six feet above floor/Normal office activities
N/A 20803001-F07JL
9:46 17:49
483 minutes
Fibers 0.006 0.1
Blank N/A N/A 20803001-F08BLANKJL
N/A N/A Fibers All data blank corrected
N/A

HYGIENE TECHNOLOGIES INTERNATIONAL, INC. CLIENT: California State Board of Equalization
450 N Street Sacramento, California 94279
APPENDIX A
TABLE 20803001- AIRBORNE TOTAL DUST RESULTS
7TH FLOOR SACRAMENTO, CALIFORNIA
MARCH 3, 2008
LEGEND PPE: Personal protective equipment <: Less than N/A: Not applicable mg/M3: Milligrams per cubic meter PEL: Cal-OSHA 8-hour time-weighted average permissible exposure limit
NAME/ REFERENCE
LOCATION/ ACTIVITIES
PPE USED
SAMPLE NUMBER
START/ STOP
SAMPLE TIME CONTAMINANT
RESULTS (mg/M3)
PEL (mg/M3)
Area Sample Column K18 area; about two feet south of Cubicle 37; approximately six feet above floor/Normal office activities
N/A 20803001-TD01CL
10:20/ 14:05
225 minutes
Total dust <0.22 10
Area Sample Column K20 area; about two feet east of Cubicle 61; approximately six feet above floor/Normal office activities
N/A 20803001-TD02CL
10:27/ 14:07
220 minutes
Total dust <0.23 10
Area Sample Column K22 area; about two feet north of Cubicle 79; approximately six feet above floor/Normal office activities
N/A 20803001-TD03CL
10:35/ 14:11
216 minutes
Total dust <0.23 10
Area Sample Column L22 area; at Cubicle 087; approximately six feet above floor/Normal office activities
N/A 20803001-TD04CL
10:37/ 14:14
217 minutes
Total dust <0.23 10
Area Sample Column N22 area; about two feet east of Cubicle 107; approximately six feet above floor/Normal office activities
N/A 20803001-TD05CL
10:40/ 14:16
216 minutes
Total dust <0.23 10
Area Sample Column N22 area; about two feet south of Cubicle 125 approximately six feet above floor/Normal office activities
N/A 20803001-TD06CL
10:45/ 14:19
214 Minutes
Total dust <0.23 10
Area Sample Area between Column N18 and N21 area; about two feet south of Cubicle 130; approximately six feet above floor/Normal office
activities
N/A 20803001-TD07CL
10:49/ 14:20
211 Minutes
Total dust <0.24 10
Area Sample Column N18 area; about two feet west of Room 712; approximately six feet above floor/Normal office activities
N/A 20803001-TD08CL
10:55/ 14:25
210 Minutes
Total dust <0.24 10
Area Sample Column M18 area; adjacent to Cubicle 166; approximately six feet above floor/Normal office activities
N/A 20803001-TD09CL
10:58/ 14:27
209 Minutes
Total dust <0.24 10
Area Sample Column L18 area; adjacent to Cubicle 012; approximately six feet above floor/Normal office activities
N/A 20803001-TD10CL
11:02/ 13:13
131 minutes
Total dust <0.38 10
Blank N/A N/A 20803001-TD011CL
N/A N/A Total dust All data blank corrected
N/A

HYGIENE TECHNOLOGIES INTERNATIONAL, INC. CLIENT: California State Board of Equalization
450 N Street Sacramento, California 94279
APPENDIX A
TABLE 20803001-115 MICROBIAL VOLATILE ORGANIC COMPOUNDS
7TH FLOOR SACRAMENTO, CALIFORNIA
MARCH 5 AND 7, 2008
Page 1
LEGEND PPE: Personal protective equipment <: Less than N/A: Not applicable mg/M3: Milligrams per cubic meter PEL: Cal-OSHA 8-hour time-weighted average permissible exposure limit nd: Not detected
DATE NAME/110
REFERENCE LOCATION/ ACTIVITIES
PPE USED
SAMPLE NUMBER
START/ STOP
SAMPLE TIME CONTAMINANT
RESULTS (mg/m3)
PEL (mg/m3)
03-05-08 Area Sample Column K20 area; Cubicle 044; about center; approximately six feet above floor/Normal office
activities
N/A 20803001-M01AC
15:28/ 17:09
101 minutes
3-Methylfuran 2-Methyl-1-propanol
1-Butanol 3-Methyl-2-butanol
2-Pentanol 3-Methyl-2-butanol DImethyl disulfide Ethyl isobutyrate
2-Hexanone 2-Heptanone
5-Methyl-3-heptanone 1-Octen-3-ol 3-Octanone 3-Octanol
2-Pentylfuran 2-Octen-1-ol
2-Methoxy-2-1(methylethyl) pyrazine 2-Nonanone Fenchone
2-Methyl-isoborneol a-Terpineol
Borneol Geosmin
Thujopsene
17 x10-6 197 x10-6 189 x10-6
nd nd nd
49 x10-6 nd
54 x10-6 114 x10-6
nd nd nd nd nd nd nd nd nd nd nd nd nd nd
N/A N/A 300 N/A N/A N/A N/A N/A 410 468 N/A N/A N/A N/A N/A N/A N/A N/A N/A N/A N/A N/A N/A N/A

HYGIENE TECHNOLOGIES INTERNATIONAL, INC. CLIENT: California State Board of Equalization
450 N Street Sacramento, California 94279
APPENDIX A
TABLE 20803001-115 MICROBIAL VOLATILE ORGANIC COMPOUNDS
7TH FLOOR SACRAMENTO, CALIFORNIA
MARCH 5 AND 7, 2008
Page 2
LEGEND PPE: Personal protective equipment <: Less than N/A: Not applicable mg/M3: Milligrams per cubic meter PEL: Cal-OSHA 8-hour time-weighted average permissible exposure limit nd: Not detected
DATE NAME/110
REFERENCE LOCATION/ ACTIVITIES
PPE USED
SAMPLE NUMBER
START/ STOP
SAMPLE TIME CONTAMINANT
RESULTS (mg/m3)
PEL (mg/m3)
03-05-08 Area Sample Column L22 area; Cubicle 087; about center; approximately six feet above floor/Normal office
activities
N/A 20803001-M02AC
15:42/ 17:12
90 minutes
3-Methylfuran 2-Methyl-1-propanol
1-Butanol 3-Methyl-2-butanol
2-Pentanol 3-Methyl-2-butanol Dimethyl disulfide Ethyl isobutyrate
2-Hexanone 2-Heptanone
5-Methyl-3-heptanone 1-Octen-3-ol 3-Octanone 3-Octanol
2-Pentylfuran 2-Octen-1-ol
2-Methoxy-2-1(methylethyl) pyrazine 2-Nonanone Fenchone
2-Methyl-isoborneol a-Terpineol
Borneol Geosmin
Thujopsene
44 x10-6 269 x10-6
nd nd nd nd
93 x10-6 nd
72 x10-6 111 x10-66
nd nd nd nd nd nd nd nd nd nd nd nd nd nd
N/A N/A 300 N/A N/A N/A N/A N/A 410 468 N/A N/A N/A N/A N/A N/A N/A N/A N/A N/A N/A N/A N/A N/A

HYGIENE TECHNOLOGIES INTERNATIONAL, INC. CLIENT: California State Board of Equalization
450 N Street Sacramento, California 94279
APPENDIX A
TABLE 20803001-115 MICROBIAL VOLATILE ORGANIC COMPOUNDS
7TH FLOOR SACRAMENTO, CALIFORNIA
MARCH 5 AND 7, 2008
Page 3
LEGEND PPE: Personal protective equipment <: Less than N/A: Not applicable mg/M3: Milligrams per cubic meter PEL: Cal-OSHA 8-hour time-weighted average permissible exposure limit nd: Not detected
DATE NAME/
REFERENCE LOCATION/ ACTIVITIES
PPE USED
SAMPLE NUMBER
START/ STOP
SAMPLE TIME CONTAMINANT
RESULTS (mg/m3)
PEL (mg/m3)
03-07-08 Area Sample Area between Columns N18 and N21; Cubicle 137;
approximately six feet above floor/Normal office activities
N/A 20803001-M11AC
9:06/ 10:38 92 minutes
3-Methylfuran 2-Methyl-1-propanol
1-Butanol 3-Methyl-2-butanol
2-Pentanol 3-Methyl-2-butanol
Methyl disulfide Ethyl isobutyrate
2-Hexanone 2-Heptanone
5-Methyl-3-heptanone 1-Octen-3-ol 3-Octanone 3-Octanol
2-Pentylfuran 2-Octen-1-ol
2-Methoxy-2-1(methylethyl) pyrazine 2-Nonanone Fenchone
2-Methyl-isoborneol a-Terpineol
Borneol Geosmin
Thujopsene
54 x10-6 nd nd nd nd nd nd nd
59 x10-6 89 x10-6
nd nd nd nd nd nd nd nd nd nd nd nd nd nd
N/A N/A 300 N/A N/A N/A N/A N/A 410 468 N/A N/A N/A N/A N/A N/A N/A N/A N/A N/A N/A N/A N/A N/A

HYGIENE TECHNOLOGIES INTERNATIONAL, INC. CLIENT: California State Board of Equalization
450 N Street Sacramento, California 94279
APPENDIX A
TABLE 20803001-115 MICROBIAL VOLATILE ORGANIC COMPOUNDS
7TH FLOOR SACRAMENTO, CALIFORNIA
MARCH 5 AND 7, 2008
Page 4
LEGEND PPE: Personal protective equipment <: Less than N/A: Not applicable mg/M3: Milligrams per cubic meter PEL: Cal-OSHA 8-hour time-weighted average permissible exposure limit nd: Not detected
DATE NAME/
REFERENCE LOCATION/ ACTIVITIES
PPE USED
SAMPLE NUMBER
START/ STOP
SAMPLE TIME CONTAMINANT
RESULTS (mg/m3)
PEL (mg/m3)
03-07-08 Area Sample Column L18 area; about six feet west of Cubicle 007;
approximately six feet above floor/Normal office activities
N/A 20803001-M12AC
9:10/ 10:41 91 minutes
3-Methylfuran 2-Methyl-1-propanol
1-Butanol 3-Methyl-2-butanol
2-Pentanol 3-Methyl-2-butanol
Methyl disulfide Ethyl isobutyrate
2-Hexanone 2-Heptanone
5-Methyl-3-heptanone 1-Octen-3-ol 3-Octanone 3-Octanol
2-Pentylfuran 2-Octen-1-ol
2-Methoxy-2-1(methylethyl) pyrazine 2-Nonanone Fenchone
2-Methyl-isoborneol a-Terpineol
Borneol Geosmin
Thujopsene
79 x10-6 nd nd nd nd nd nd nd
62 x10-6 107 x10-6
nd nd nd nd nd nd nd nd nd nd nd nd nd nd
N/A N/A 300 N/A N/A N/A N/A N/A 410 468 N/A N/A N/A N/A N/A N/A N/A N/A N/A N/A N/A N/A N/A N/A
HYGIENE TECHNOLOGIES INTERNATIONAL, INC. CLIENT: California State Board of Equalization
450 N Street Sacramento, California 94279
APPENDIX A
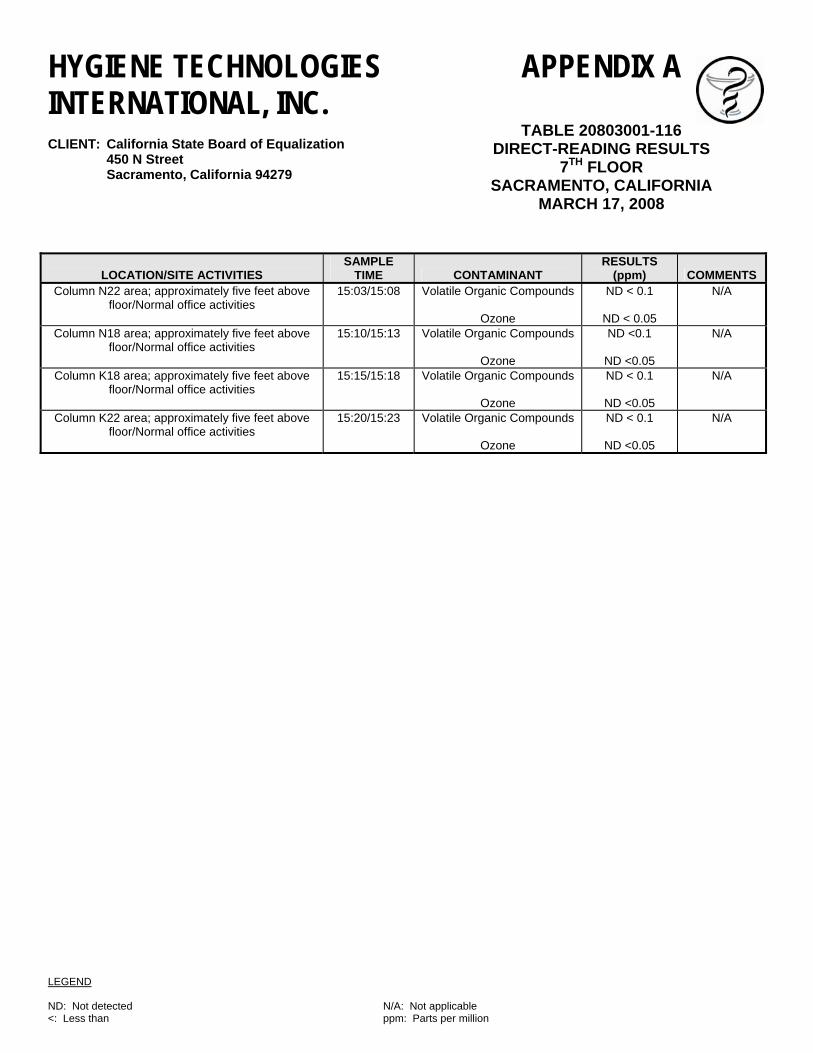
TABLE 20803001-116 DIRECT-READING RESULTS
7TH FLOOR SACRAMENTO, CALIFORNIA
MARCH 17, 2008
LEGEND ND: Not detected N/A: Not applicable <: Less than ppm: Parts per million
LOCATION/SITE ACTIVITIES SAMPLE
TIME CONTAMINANT RESULTS
(ppm) COMMENTS Column N22 area; approximately five feet above
floor/Normal office activities 15:03/15:08 Volatile Organic Compounds
Ozone
ND < 0.1
ND < 0.05
N/A
Column N18 area; approximately five feet above floor/Normal office activities
15:10/15:13 Volatile Organic Compounds
Ozone
ND <0.1
ND <0.05
N/A
Column K18 area; approximately five feet above floor/Normal office activities
15:15/15:18 Volatile Organic Compounds
Ozone
ND < 0.1
ND <0.05
N/A
Column K22 area; approximately five feet above floor/Normal office activities
15:20/15:23 Volatile Organic Compounds
Ozone
ND < 0.1
ND <0.05
N/A

EMLab P&K
Approved by:
Lab ManagerDr. Kamashwaran Ramanathan
Report for:
Mr. Wes FreyHygiene Technologies International, Inc.: Northern California3127 Bowen Island StreetWest Sacramento, CA 95691
Regarding: Project: 20803001EML ID: 396775
EMLab P&K
This coversheet is included with your report in order to comply with AIHA and ISO accreditation requirements.
For clarity, we report the number of significant digits as calculated; but, due to the nature of this type of biological data, the number of significant digits that is used for interpretation should generally be one or two. All samples were received in acceptable condition unless noted in the Report Comments portion in the body of the report. Due to the nature of the analyses performed, field blank corrections of results is not a standard practice. The results relate only to the items tested.
EMLab P&K ("the Company") shall have no liability to the client or the client's customer with respect to decisions or recommendations made, actions taken or courses of conduct implemented by either the client or the client's customer as a result of or based upon the Test Results. In no event shall the Company be liable to the client with respect to the Test Results except for the Company's own willful misconduct or gross negligence nor shall the Company be liable for incidental or consequential damages or lost profits or revenues to the fullest extent such liability may be disclaimed by law, even if the Company has been advised of the possibility of such damages, lost profits or lost revenues. In no event shall the Company's liability with respect to the Test Results exceed the amount paid to the Company by the client therefor.
Document Number: 200091 - Revision Number: 5
Dates of Analysis:Spore trap analysis: 03-10-2008
Project SOPs: Spore trap analysis (I100000)

EMLab P&K11720 North Creek Pkwy N, #400, Bothell, WA 98011(650) 829-5800 Fax (650) 829-5852 www.emlab.com
Client: Hygiene Technologies International, Inc.: Northern CaliforniaC/O: Mr. Wes FreyRe: 20803001
Date of Sampling: 03-07-2008Date of Receipt: 03-07-2008Date of Report: 03-10-2008
SPORE TRAP REPORT: NON-VIABLE METHODOLOGYLocation: 20803001-
TM01OUTME20803001-TM02ME
20803001-TM03ME
20803001-TM04ME
Comments (see below) None None None None
Lab ID-Version‡: 1743091-1 1743092-1 1743093-1 1743094-1
raw ct. spores/m3 raw ct. spores/m3 raw ct. spores/m3 raw ct. spores/m3Alternaria 1 13ArthriniumAscospores* 8 427AureobasidiumBasidiospores* 14 747 1 53Bipolaris/Drechslera groupBotrytisChaetomiumCladosporium 3 160 1 53CurvulariaEpicoccum 1 13FusariumMyrotheciumNigrosporaOidium 1 13Other brown 1 13Other colorless 1 13Penicillium/Aspergillus types† 10 533 1 53 1 53PithomycesRusts* 1 13 1 13Smuts*, Periconia, Myxomycetes* 1 13StachybotrysStemphyliumTorulaUlocladiumZygomycetesBackground debris (1-4+)†† 3+ 3+ 2+ 3+Hyphal fragments/m3 53 13 < 13 < 13Pollen/m3 267 13 < 13 13Skin cells (1-4+) 1+ 1+ 1+ 1+Sample volume (liters) 75 75 75 75TOTAL SPORE/m3 1,932 106 66 79Comments:
EMLab ID: 396775, Page 1 of 9
* Most of these spore types are not seen with culturable methods (Andersen sampling), although some may appear as non-sporulating fungi. Most of the basidiospores are "mushroom" spores while the rusts and smuts are plant pathogens.† The spores of Aspergillus and Penicillium (and others such as Acremonium, Paecilomyces) are small and round with very few distinguishing characteristics. They cannot be differentiated by non-viable sampling methods. Also, some species with very small spores are easily missed, and may be undercounted.††Background debris indicates the amount of non-biological particulate matter present on the trace (dust in the air) and the resulting visibility for the analyst. It is rated from 1+ (low) to 4+ (high). Counts from areas with 4+ background debris should be regarded as minimal counts and may be higher then reported. It is important to account for samples volumes when evaluating dust levels.The Limit of Detection is the product of a raw count of 1 and 100 divided by the percent read. The analytical sensitivity (counts/m3) is the product of the Limit of Detection and 1000 divided by the sample volume.‡ A "Version" greater than 1 indicates amended data.

EMLab P&K11720 North Creek Pkwy N, #400, Bothell, WA 98011(650) 829-5800 Fax (650) 829-5852 www.emlab.com
Client: Hygiene Technologies International, Inc.: Northern CaliforniaC/O: Mr. Wes FreyRe: 20803001
Date of Sampling: 03-07-2008Date of Receipt: 03-07-2008Date of Report: 03-10-2008
SPORE TRAP REPORT: NON-VIABLE METHODOLOGYLocation: 20803001-
TM05ME20803001-TM06ME
20803001-TM07ME
20803001-TM08ME
Comments (see below) None None None None
Lab ID-Version‡: 1743095-1 1743096-1 1743097-1 1743098-1
raw ct. spores/m3 raw ct. spores/m3 raw ct. spores/m3 raw ct. spores/m3Alternaria 1 13ArthriniumAscospores*AureobasidiumBasidiospores* 1 53 1 53Bipolaris/Drechslera groupBotrytisChaetomiumCladosporium 1 53 1 53CurvulariaEpicoccumFusariumMyrotheciumNigrosporaOidiumOther brownOther colorlessPenicillium/Aspergillus types† 1 53 1 53 1 53PithomycesRusts*Smuts*, Periconia, Myxomycetes* 1 13StachybotrysStemphyliumTorulaUlocladiumZygomycetesBackground debris (1-4+)†† 3+ 3+ 3+ 2+Hyphal fragments/m3 < 13 < 13 < 13 < 13Pollen/m3 13 < 13 < 13 < 13Skin cells (1-4+) 2+ 1+ 1+ 1+Sample volume (liters) 75 75 75 75TOTAL SPORE/m3 172 53 106 66Comments:
EMLab ID: 396775, Page 2 of 9
* Most of these spore types are not seen with culturable methods (Andersen sampling), although some may appear as non-sporulating fungi. Most of the basidiospores are "mushroom" spores while the rusts and smuts are plant pathogens.† The spores of Aspergillus and Penicillium (and others such as Acremonium, Paecilomyces) are small and round with very few distinguishing characteristics. They cannot be differentiated by non-viable sampling methods. Also, some species with very small spores are easily missed, and may be undercounted.††Background debris indicates the amount of non-biological particulate matter present on the trace (dust in the air) and the resulting visibility for the analyst. It is rated from 1+ (low) to 4+ (high). Counts from areas with 4+ background debris should be regarded as minimal counts and may be higher then reported. It is important to account for samples volumes when evaluating dust levels.The Limit of Detection is the product of a raw count of 1 and 100 divided by the percent read. The analytical sensitivity (counts/m3) is the product of the Limit of Detection and 1000 divided by the sample volume.‡ A "Version" greater than 1 indicates amended data.

EMLab P&K11720 North Creek Pkwy N, #400, Bothell, WA 98011(650) 829-5800 Fax (650) 829-5852 www.emlab.com
Client: Hygiene Technologies International, Inc.: Northern CaliforniaC/O: Mr. Wes FreyRe: 20803001
Date of Sampling: 03-07-2008Date of Receipt: 03-07-2008Date of Report: 03-10-2008
SPORE TRAP REPORT: NON-VIABLE METHODOLOGYLocation: 20803001-
TM09ME20803001-TM10ME
20803001-TM11ME
20803001-TM12ME
Comments (see below) None None None None
Lab ID-Version‡: 1743099-1 1743100-1 1743101-1 1743102-1
raw ct. spores/m3 raw ct. spores/m3 raw ct. spores/m3 raw ct. spores/m3AlternariaArthriniumAscospores*AureobasidiumBasidiospores*Bipolaris/Drechslera groupBotrytisChaetomiumCladosporium 1 53 1 53CurvulariaEpicoccumFusariumMyrotheciumNigrosporaOidiumOther brownOther colorlessPenicillium/Aspergillus types† 2 107 1 53 1 53 1 53PithomycesRusts*Smuts*, Periconia, Myxomycetes*StachybotrysStemphyliumTorulaUlocladiumZygomycetesBackground debris (1-4+)†† 3+ 2+ 2+ 2+Hyphal fragments/m3 13 < 13 < 13 < 13Pollen/m3 13 < 13 < 13 13Skin cells (1-4+) 2+ 1+ 1+ 1+Sample volume (liters) 75 75 75 75TOTAL SPORE/m3 160 53 106 53Comments:
EMLab ID: 396775, Page 3 of 9
* Most of these spore types are not seen with culturable methods (Andersen sampling), although some may appear as non-sporulating fungi. Most of the basidiospores are "mushroom" spores while the rusts and smuts are plant pathogens.† The spores of Aspergillus and Penicillium (and others such as Acremonium, Paecilomyces) are small and round with very few distinguishing characteristics. They cannot be differentiated by non-viable sampling methods. Also, some species with very small spores are easily missed, and may be undercounted.††Background debris indicates the amount of non-biological particulate matter present on the trace (dust in the air) and the resulting visibility for the analyst. It is rated from 1+ (low) to 4+ (high). Counts from areas with 4+ background debris should be regarded as minimal counts and may be higher then reported. It is important to account for samples volumes when evaluating dust levels.The Limit of Detection is the product of a raw count of 1 and 100 divided by the percent read. The analytical sensitivity (counts/m3) is the product of the Limit of Detection and 1000 divided by the sample volume.‡ A "Version" greater than 1 indicates amended data.

EMLab P&K11720 North Creek Pkwy N, #400, Bothell, WA 98011(650) 829-5800 Fax (650) 829-5852 www.emlab.com
Client: Hygiene Technologies International, Inc.: Northern CaliforniaC/O: Mr. Wes FreyRe: 20803001
Date of Sampling: 03-07-2008Date of Receipt: 03-07-2008Date of Report: 03-10-2008
SPORE TRAP REPORT: NON-VIABLE METHODOLOGYLocation: 20803001-
TM13ME20803001-TM14ME
20803001-TM15ME
20803001-TM16ME
Comments (see below) None None None None
Lab ID-Version‡: 1743103-1 1743104-1 1743105-1 1743106-1
raw ct. spores/m3 raw ct. spores/m3 raw ct. spores/m3 raw ct. spores/m3AlternariaArthriniumAscospores*AureobasidiumBasidiospores* 1 53Bipolaris/Drechslera groupBotrytisChaetomiumCladosporium 1 53 1 53 1 53CurvulariaEpicoccumFusariumMyrotheciumNigrosporaOidiumOther brownOther colorlessPenicillium/Aspergillus types† 1 53 1 53 1 53PithomycesRusts*Smuts*, Periconia, Myxomycetes* 1 13 1 13StachybotrysStemphyliumTorulaUlocladiumZygomycetesBackground debris (1-4+)†† 3+ 3+ 3+ 2+Hyphal fragments/m3 < 13 40 < 13 < 13Pollen/m3 < 13 13 < 13 13Skin cells (1-4+) 1+ 1+ 3+ 1+Sample volume (liters) 75 75 75 75TOTAL SPORE/m3 106 119 53 119Comments:
EMLab ID: 396775, Page 4 of 9
* Most of these spore types are not seen with culturable methods (Andersen sampling), although some may appear as non-sporulating fungi. Most of the basidiospores are "mushroom" spores while the rusts and smuts are plant pathogens.† The spores of Aspergillus and Penicillium (and others such as Acremonium, Paecilomyces) are small and round with very few distinguishing characteristics. They cannot be differentiated by non-viable sampling methods. Also, some species with very small spores are easily missed, and may be undercounted.††Background debris indicates the amount of non-biological particulate matter present on the trace (dust in the air) and the resulting visibility for the analyst. It is rated from 1+ (low) to 4+ (high). Counts from areas with 4+ background debris should be regarded as minimal counts and may be higher then reported. It is important to account for samples volumes when evaluating dust levels.The Limit of Detection is the product of a raw count of 1 and 100 divided by the percent read. The analytical sensitivity (counts/m3) is the product of the Limit of Detection and 1000 divided by the sample volume.‡ A "Version" greater than 1 indicates amended data.

EMLab P&K11720 North Creek Pkwy N, #400, Bothell, WA 98011(650) 829-5800 Fax (650) 829-5852 www.emlab.com
Client: Hygiene Technologies International, Inc.: Northern CaliforniaC/O: Mr. Wes FreyRe: 20803001
Date of Sampling: 03-07-2008Date of Receipt: 03-07-2008Date of Report: 03-10-2008
SPORE TRAP REPORT: NON-VIABLE METHODOLOGYLocation: 20803001-
TM17ME20803001-TM18ME
20803001-TM19ME
20803001-TM20ME
Comments (see below) None A None None
Lab ID-Version‡: 1743107-1 1743108-1 1743109-1 1743110-1
raw ct. spores/m3 raw ct. spores/m3 raw ct. spores/m3 raw ct. spores/m3AlternariaArthriniumAscospores*AureobasidiumBasidiospores* 1 53Bipolaris/Drechslera groupBotrytisChaetomiumCladosporiumCurvulariaEpicoccumFusariumMyrotheciumNigrosporaOidiumOther brownOther colorlessPenicillium/Aspergillus types† 1 53 43 1,210 3 160 1 53PithomycesRusts*Smuts*, Periconia, Myxomycetes* 1 13 1 13StachybotrysStemphyliumTorulaUlocladiumZygomycetesBackground debris (1-4+)†† 2+ 3+ 3+ 2+Hyphal fragments/m3 < 13 < 13 < 13 < 13Pollen/m3 < 13 13 < 13 < 13Skin cells (1-4+) 1+ 1+ 1+ 1+Sample volume (liters) 75 75 75 75TOTAL SPORE/m3 53 1,210 173 119Comments:A) 27 of the raw count Penicillium/Aspergillus type spores were present as a clump of 11 and a clump of 16 spores.
EMLab ID: 396775, Page 5 of 9
* Most of these spore types are not seen with culturable methods (Andersen sampling), although some may appear as non-sporulating fungi. Most of the basidiospores are "mushroom" spores while the rusts and smuts are plant pathogens.† The spores of Aspergillus and Penicillium (and others such as Acremonium, Paecilomyces) are small and round with very few distinguishing characteristics. They cannot be differentiated by non-viable sampling methods. Also, some species with very small spores are easily missed, and may be undercounted.††Background debris indicates the amount of non-biological particulate matter present on the trace (dust in the air) and the resulting visibility for the analyst. It is rated from 1+ (low) to 4+ (high). Counts from areas with 4+ background debris should be regarded as minimal counts and may be higher then reported. It is important to account for samples volumes when evaluating dust levels.The Limit of Detection is the product of a raw count of 1 and 100 divided by the percent read. The analytical sensitivity (counts/m3) is the product of the Limit of Detection and 1000 divided by the sample volume.‡ A "Version" greater than 1 indicates amended data.

EMLab P&K11720 North Creek Pkwy N, #400, Bothell, WA 98011(650) 829-5800 Fax (650) 829-5852 www.emlab.com
Client: Hygiene Technologies International, Inc.: Northern CaliforniaC/O: Mr. Wes FreyRe: 20803001
Date of Sampling: 03-07-2008Date of Receipt: 03-07-2008Date of Report: 03-10-2008
SPORE TRAP REPORT: NON-VIABLE METHODOLOGYLocation: 20803001-
TM21ME20803001-TM22ME
20803001-TM23ME
20803001-TM24ME
Comments (see below) None None None None
Lab ID-Version‡: 1743111-1 1743112-1 1743113-1 1743114-1
raw ct. spores/m3 raw ct. spores/m3 raw ct. spores/m3 raw ct. spores/m3Alternaria 1 13ArthriniumAscospores*AureobasidiumBasidiospores* 1 53Bipolaris/Drechslera groupBotrytisChaetomiumCladosporium 1 53CurvulariaEpicoccumFusariumMyrotheciumNigrosporaOidiumOther brown 1 13Other colorlessPenicillium/Aspergillus types† 1 53 1 53 1 53PithomycesRusts*Smuts*, Periconia, Myxomycetes* 1 13StachybotrysStemphyliumTorulaUlocladiumZygomycetesBackground debris (1-4+)†† 3+ 3+ 2+ 3+Hyphal fragments/m3 < 13 < 13 < 13 < 13Pollen/m3 13 < 13 < 13 13Skin cells (1-4+) 1+ 1+ 1+ 1+Sample volume (liters) 75 75 75 75TOTAL SPORE/m3 172 53 < 13 79Comments:
EMLab ID: 396775, Page 6 of 9
* Most of these spore types are not seen with culturable methods (Andersen sampling), although some may appear as non-sporulating fungi. Most of the basidiospores are "mushroom" spores while the rusts and smuts are plant pathogens.† The spores of Aspergillus and Penicillium (and others such as Acremonium, Paecilomyces) are small and round with very few distinguishing characteristics. They cannot be differentiated by non-viable sampling methods. Also, some species with very small spores are easily missed, and may be undercounted.††Background debris indicates the amount of non-biological particulate matter present on the trace (dust in the air) and the resulting visibility for the analyst. It is rated from 1+ (low) to 4+ (high). Counts from areas with 4+ background debris should be regarded as minimal counts and may be higher then reported. It is important to account for samples volumes when evaluating dust levels.The Limit of Detection is the product of a raw count of 1 and 100 divided by the percent read. The analytical sensitivity (counts/m3) is the product of the Limit of Detection and 1000 divided by the sample volume.‡ A "Version" greater than 1 indicates amended data.

EMLab P&K11720 North Creek Pkwy N, #400, Bothell, WA 98011(650) 829-5800 Fax (650) 829-5852 www.emlab.com
Client: Hygiene Technologies International, Inc.: Northern CaliforniaC/O: Mr. Wes FreyRe: 20803001
Date of Sampling: 03-07-2008Date of Receipt: 03-07-2008Date of Report: 03-10-2008
SPORE TRAP REPORT: NON-VIABLE METHODOLOGYLocation: 20803001-
TM25ME20803001-TM26ME
20803001-TM27ME
20803001-TM28ME
Comments (see below) None None None None
Lab ID-Version‡: 1743115-1 1743116-1 1743117-1 1743118-1
raw ct. spores/m3 raw ct. spores/m3 raw ct. spores/m3 raw ct. spores/m3Alternaria 2 27ArthriniumAscospores*AureobasidiumBasidiospores*Bipolaris/Drechslera groupBotrytisChaetomiumCladosporium 4 213 1 53CurvulariaEpicoccumFusariumMyrotheciumNigrosporaOidiumOther brownOther colorlessPenicillium/Aspergillus types† 1 53 1 53 2 107 2 107PithomycesRusts*Smuts*, Periconia, Myxomycetes* 4 53StachybotrysStemphyliumTorulaUlocladiumZygomycetesBackground debris (1-4+)†† 3+ 3+ 3+ 3+Hyphal fragments/m3 13 13 < 13 13Pollen/m3 < 13 < 13 < 13 13Skin cells (1-4+) 1+ 1+ 1+ 1+Sample volume (liters) 75 75 75 75TOTAL SPORE/m3 319 133 107 107Comments:
EMLab ID: 396775, Page 7 of 9
* Most of these spore types are not seen with culturable methods (Andersen sampling), although some may appear as non-sporulating fungi. Most of the basidiospores are "mushroom" spores while the rusts and smuts are plant pathogens.† The spores of Aspergillus and Penicillium (and others such as Acremonium, Paecilomyces) are small and round with very few distinguishing characteristics. They cannot be differentiated by non-viable sampling methods. Also, some species with very small spores are easily missed, and may be undercounted.††Background debris indicates the amount of non-biological particulate matter present on the trace (dust in the air) and the resulting visibility for the analyst. It is rated from 1+ (low) to 4+ (high). Counts from areas with 4+ background debris should be regarded as minimal counts and may be higher then reported. It is important to account for samples volumes when evaluating dust levels.The Limit of Detection is the product of a raw count of 1 and 100 divided by the percent read. The analytical sensitivity (counts/m3) is the product of the Limit of Detection and 1000 divided by the sample volume.‡ A "Version" greater than 1 indicates amended data.

EMLab P&K11720 North Creek Pkwy N, #400, Bothell, WA 98011(650) 829-5800 Fax (650) 829-5852 www.emlab.com
Client: Hygiene Technologies International, Inc.: Northern CaliforniaC/O: Mr. Wes FreyRe: 20803001
Date of Sampling: 03-07-2008Date of Receipt: 03-07-2008Date of Report: 03-10-2008
SPORE TRAP REPORT: NON-VIABLE METHODOLOGYLocation: 20803001-
TM29ME20803001-TM30ME
20803001-TM31ME
20803001-TM32ME
Comments (see below) None None B None
Lab ID-Version‡: 1743119-1 1743120-1 1743121-1 1743122-1
raw ct. spores/m3 raw ct. spores/m3 raw ct. spores/m3 raw ct. spores/m3AlternariaArthriniumAscospores* 1 13AureobasidiumBasidiospores* 1 53Bipolaris/Drechslera groupBotrytisChaetomiumCladosporium 21 280CurvulariaEpicoccumFusariumMyrotheciumNigrosporaOidiumOther brownOther colorlessPenicillium/Aspergillus types† 2 107 1 53PithomycesRusts* 1 13Smuts*, Periconia, Myxomycetes* 1 13StachybotrysStemphyliumTorulaUlocladiumZygomycetesBackground debris (1-4+)†† 3+ 3+ 3+ 2+Hyphal fragments/m3 < 13 < 13 13 < 13Pollen/m3 < 13 < 13 < 13 < 13Skin cells (1-4+) 1+ 1+ 1+ 1+Sample volume (liters) 75 75 75 75TOTAL SPORE/m3 133 13 386 < 13Comments:B) The 21 raw count Cladosporium spores were present as a single clump.
EMLab ID: 396775, Page 8 of 9
* Most of these spore types are not seen with culturable methods (Andersen sampling), although some may appear as non-sporulating fungi. Most of the basidiospores are "mushroom" spores while the rusts and smuts are plant pathogens.† The spores of Aspergillus and Penicillium (and others such as Acremonium, Paecilomyces) are small and round with very few distinguishing characteristics. They cannot be differentiated by non-viable sampling methods. Also, some species with very small spores are easily missed, and may be undercounted.††Background debris indicates the amount of non-biological particulate matter present on the trace (dust in the air) and the resulting visibility for the analyst. It is rated from 1+ (low) to 4+ (high). Counts from areas with 4+ background debris should be regarded as minimal counts and may be higher then reported. It is important to account for samples volumes when evaluating dust levels.The Limit of Detection is the product of a raw count of 1 and 100 divided by the percent read. The analytical sensitivity (counts/m3) is the product of the Limit of Detection and 1000 divided by the sample volume.‡ A "Version" greater than 1 indicates amended data.

EMLab P&K11720 North Creek Pkwy N, #400, Bothell, WA 98011(650) 829-5800 Fax (650) 829-5852 www.emlab.com
Client: Hygiene Technologies International, Inc.: Northern CaliforniaC/O: Mr. Wes FreyRe: 20803001
Date of Sampling: 03-07-2008Date of Receipt: 03-07-2008Date of Report: 03-10-2008
SPORE TRAP REPORT: NON-VIABLE METHODOLOGYLocation: 20803001-TM33ME 20803001-TM34OUTMEComments (see below) None None
Lab ID-Version‡: 1743123-1 1743124-1
raw ct. spores/m3 raw ct. spores/m3AlternariaArthriniumAscospores* 8 427AureobasidiumBasidiospores* 1 53 27 1,440Bipolaris/Drechslera groupBotrytisChaetomiumCladosporium 17 907CurvulariaEpicoccum 1 13FusariumMyrotheciumNigrosporaOidium 1 13Other brown 2 27Other colorlessPenicillium/Aspergillus types† 1 53 13 693PithomycesRusts* 2 27Smuts*, Periconia, Myxomycetes* 1 13 5 67StachybotrysStemphyliumTorulaUlocladiumZygomycetesBackground debris (1-4+)†† 3+ 3+Hyphal fragments/m3 < 13 80Pollen/m3 13 387Skin cells (1-4+) 1+ 1+Sample volume (liters) 75 75TOTAL SPORE/m3 119 3,614Comments:
EMLab ID: 396775, Page 9 of 9
* Most of these spore types are not seen with culturable methods (Andersen sampling), although some may appear as non-sporulating fungi. Most of the basidiospores are "mushroom" spores while the rusts and smuts are plant pathogens.† The spores of Aspergillus and Penicillium (and others such as Acremonium, Paecilomyces) are small and round with very few distinguishing characteristics. They cannot be differentiated by non-viable sampling methods. Also, some species with very small spores are easily missed, and may be undercounted.††Background debris indicates the amount of non-biological particulate matter present on the trace (dust in the air) and the resulting visibility for the analyst. It is rated from 1+ (low) to 4+ (high). Counts from areas with 4+ background debris should be regarded as minimal counts and may be higher then reported. It is important to account for samples volumes when evaluating dust levels.The Limit of Detection is the product of a raw count of 1 and 100 divided by the percent read. The analytical sensitivity (counts/m3) is the product of the Limit of Detection and 1000 divided by the sample volume.‡ A "Version" greater than 1 indicates amended data.

EMLab P&K11720 North Creek Pkwy N, #400, Bothell, WA 98011(650) 829-5800 Fax (650) 829-5852 www.emlab.com
Client: Hygiene Technologies International, Inc.: Northern CaliforniaC/O: Mr. Wes FreyRe: 20803001
Date of Sampling: 03-07-2008Date of Receipt: 03-07-2008Date of Report: 03-10-2008
MoldRANGE™: Extended Outdoor ComparisonOutdoor Location: 20803001-TM01OUTME
Fungi Identified Outdoor Typical Outdoor Data by Date† Typical Outdoor Data by Location‡
data Month: March State: CA
spores/m3 low med high freq % low med high freq %
Generally able to grow indoors* Alternaria 13 7 27 210 43 7 27 230 60 Bipolaris/Drechslera group - 7 13 120 12 7 13 120 14 Chaetomium - 7 13 120 8 7 13 110 19 Cladosporium 160 40 350 4,400 91 53 640 6,500 98 Curvularia - 7 13 210 6 7 13 210 7 Epicoccum 13 7 13 210 16 7 13 160 21 Nigrospora - 7 13 110 7 7 13 170 8 Other brown 13 7 13 80 34 7 13 80 37 Penicillium/Aspergillus types 533 27 160 1,700 83 40 210 2,500 89 Stachybotrys - 7 13 360 3 7 13 330 5 Torula - 7 13 170 8 7 13 150 13Seldom found growing indoors** Ascospores 427 13 150 2,100 75 13 110 1,800 73 Basidiospores 747 13 360 6,000 91 13 270 6,900 95 Oidium - 7 13 330 14 7 13 200 20 Rusts 13 7 13 320 17 7 13 270 29 Smuts, Periconia, Myxomycetes 13 7 27 310 54 8 40 480 71TOTAL SPORES/M3 1,932
† The Typical Outdoor Data by Date represents the typical outdoor spore levels across North America for the month indicated. The last column represents the frequency of occurrence. The low, medium, and high values represent the 2.5, 50, and 97.5 percentile values of the spore type when it is detected. For example, if the frequency of occurrence is 63% and the low value is 53, it would mean that the given spore type is detected 63% of the time and, when detected, 2.5% of the time it is present in levels above the detection limit and below 53 spores/m3. These values are updated periodically, and if enough data is not available to make a statistically meaningful assessment, it is indicated with a dash.
‡ The Typical Outdoor Data by Location represents the typical outdoor spore levels for the region indicated for the entire year. As with the Typical Outdoor Data by Date, the four columns represent the frequency of occurrence and the typical low, medium, and high concentration values for the spore type indicated. These values are updated periodically, and if enough data is not available to make a statistically meaningfulassessment, it is indicated with a dash.
*The spores in this category are generally capable of growing on wet building materials in addition to growing outdoors. Building related growth is dependent upon the fungal type, moisture level, type of material, and other factors. Cladosporium is one of the predominant spore types worldwide and is frequently present in high numbers. Penicillium/Aspergillus species colonize both outdoor and indoor wet surfaces rapidly and are very easily dispersed. Other genera are usually present in lesser numbers.
**These fungi are generally not found growing on wet building materials. For example, the rusts and smuts are obligate plant pathogens. However, in each group there are notable exceptions. For example, agents of wood decay are members of the basidiomycetes and high counts ofa single morphological type of basidiospore on an inside sample should be considered significant.
Interpretation of the data contained in this report is left to the client or the persons who conducted the field work. This report is provided for informational and comparative purposes only and should not be relied upon for any other purpose. "Typical outdoor data" are based on the results of the analysis of samples delivered to and analyzed by EMLab P&K and assumptions regarding the origins of those samples. Sampling techniques, contaminants infecting samples, unrepresentative samples and other similar or dissimilar factors may affect these results. In addition, EMLab P&K may not have received and tested a representative number of samples for every region or time period. EMLab P&K hereby disclaims any liability for any and all direct, indirect, punitive, incidental, special or consequential damages arising out of the use or interpretation of the data contained in, or any actions taken or omitted in reliance upon, this report.
EMLab ID: 396775, Page 1 of 2© 2008 EMLab P&K, Patent Pending

EMLab P&K11720 North Creek Pkwy N, #400, Bothell, WA 98011(650) 829-5800 Fax (650) 829-5852 www.emlab.com
Client: Hygiene Technologies International, Inc.: Northern CaliforniaC/O: Mr. Wes FreyRe: 20803001
Date of Sampling: 03-07-2008Date of Receipt: 03-07-2008Date of Report: 03-10-2008
MoldRANGE™: Extended Outdoor ComparisonOutdoor Location: 20803001-TM34OUTME
Fungi Identified Outdoor Typical Outdoor Data by Date† Typical Outdoor Data by Location‡
data Month: March State: CA
spores/m3 low med high freq % low med high freq %
Generally able to grow indoors* Alternaria - 7 27 210 43 7 27 230 60 Bipolaris/Drechslera group - 7 13 120 12 7 13 120 14 Chaetomium - 7 13 120 8 7 13 110 19 Cladosporium 907 40 350 4,400 91 53 640 6,500 98 Curvularia - 7 13 210 6 7 13 210 7 Epicoccum 13 7 13 210 16 7 13 160 21 Nigrospora - 7 13 110 7 7 13 170 8 Other brown 27 7 13 80 34 7 13 80 37 Penicillium/Aspergillus types 693 27 160 1,700 83 40 210 2,500 89 Stachybotrys - 7 13 360 3 7 13 330 5 Torula - 7 13 170 8 7 13 150 13Seldom found growing indoors** Ascospores 427 13 150 2,100 75 13 110 1,800 73 Basidiospores 1,440 13 360 6,000 91 13 270 6,900 95 Oidium 13 7 13 330 14 7 13 200 20 Rusts 27 7 13 320 17 7 13 270 29 Smuts, Periconia, Myxomycetes 67 7 27 310 54 8 40 480 71TOTAL SPORES/M3 3,614
† The Typical Outdoor Data by Date represents the typical outdoor spore levels across North America for the month indicated. The last column represents the frequency of occurrence. The low, medium, and high values represent the 2.5, 50, and 97.5 percentile values of the spore type when it is detected. For example, if the frequency of occurrence is 63% and the low value is 53, it would mean that the given spore type is detected 63% of the time and, when detected, 2.5% of the time it is present in levels above the detection limit and below 53 spores/m3. These values are updated periodically, and if enough data is not available to make a statistically meaningful assessment, it is indicated with a dash.
‡ The Typical Outdoor Data by Location represents the typical outdoor spore levels for the region indicated for the entire year. As with the Typical Outdoor Data by Date, the four columns represent the frequency of occurrence and the typical low, medium, and high concentration values for the spore type indicated. These values are updated periodically, and if enough data is not available to make a statistically meaningfulassessment, it is indicated with a dash.
*The spores in this category are generally capable of growing on wet building materials in addition to growing outdoors. Building related growth is dependent upon the fungal type, moisture level, type of material, and other factors. Cladosporium is one of the predominant spore types worldwide and is frequently present in high numbers. Penicillium/Aspergillus species colonize both outdoor and indoor wet surfaces rapidly and are very easily dispersed. Other genera are usually present in lesser numbers.
**These fungi are generally not found growing on wet building materials. For example, the rusts and smuts are obligate plant pathogens. However, in each group there are notable exceptions. For example, agents of wood decay are members of the basidiomycetes and high counts ofa single morphological type of basidiospore on an inside sample should be considered significant.
Interpretation of the data contained in this report is left to the client or the persons who conducted the field work. This report is provided for informational and comparative purposes only and should not be relied upon for any other purpose. "Typical outdoor data" are based on the results of the analysis of samples delivered to and analyzed by EMLab P&K and assumptions regarding the origins of those samples. Sampling techniques, contaminants infecting samples, unrepresentative samples and other similar or dissimilar factors may affect these results. In addition, EMLab P&K may not have received and tested a representative number of samples for every region or time period. EMLab P&K hereby disclaims any liability for any and all direct, indirect, punitive, incidental, special or consequential damages arising out of the use or interpretation of the data contained in, or any actions taken or omitted in reliance upon, this report.
EMLab ID: 396775, Page 2 of 2© 2008 EMLab P&K, Patent Pending

EMLab P&K11720 North Creek Pkwy N, #400, Bothell, WA 98011(650) 829-5800 Fax (650) 829-5852 www.emlab.com
Client: Hygiene Technologies International, Inc.: Northern CaliforniaC/O: Mr. Wes FreyRe: 20803001
Date of Sampling: 03-07-2008Date of Receipt: 03-07-2008Date of Report: 03-10-2008
MoldSTAT™: Supplementary Statistical Spore Trap ReportOutdoor Summary: 20803001-TM01OUTME:
Species detected Outdoor sample spores/m3 Typical outdoor ranges Freq.<100 1K 10K >100K (North America) %
Alternaria 13 7 - 27 - 390 55Ascospores 427 13 - 160 - 4,200 76
Basidiospores 747 13 - 320 - 14,000 92Cladosporium 160 40 - 530 - 8,500 95
Epicoccum 13 7 - 13 - 320 24Other brown 13 7 - 13 - 93 35
Penicillium/Aspergillus types 533 27 - 210 - 2,600 85Rusts 13 7 - 15 - 310 23
Smuts, Periconia, Myxomycetes 13 7 - 40 - 760 70Total 1,932
The "Typical outdoor ranges" and "Freq. %" columns show the typical low, medium, and high spore counts per cubic meter and the frequency of occurrence for the given spore type. The low, medium, and high values represent the 2.5, 50, and 97.5 percentile values when the spore type is detected. For example, if the low value is 53 and the frequency of occurence is 63%, it would mean that we typically detect the given spore type on 63 percent of all outdoor samples and, when detected, 2.5% of the time it is present in levels below 53 spores/m3.
Indoor Samples
Location: 20803001-TM02ME% of outdoor total
spores/m3Friedman chi-
square*(indoor variation)
Agreement ratio**(indoor/outdoor)
Spearman rank correlation***
(indoor/outdoor)
MoldSCORE****(indoor/outdoor)
Result: 5% dF: 31Result: 10.0000
Critical value: N/AInside Similar: N/A
Result: 0.3636 dF: 9Result: 0.6958
Critical value: 0.5833Outside Similar: Yes
Score: 103Result: Low
Species Detected Spores/m3<100 1K 10K >100K
Basidiospores 53Cladosporium 53
Total 106
EMLab ID: 396775, Page 1 of 13© 2008 EMLab P&K

EMLab P&K11720 North Creek Pkwy N, #400, Bothell, WA 98011(650) 829-5800 Fax (650) 829-5852 www.emlab.com
Client: Hygiene Technologies International, Inc.: Northern CaliforniaC/O: Mr. Wes FreyRe: 20803001
Date of Sampling: 03-07-2008Date of Receipt: 03-07-2008Date of Report: 03-10-2008
MoldSTAT™: Supplementary Statistical Spore Trap ReportLocation: 20803001-TM03ME% of outdoor total
spores/m3Friedman chi-
square*(indoor variation)
Agreement ratio**(indoor/outdoor)
Spearman rank correlation***
(indoor/outdoor)
MoldSCORE****(indoor/outdoor)
Result: 3% dF: 31Result: 10.0000
Critical value: N/AInside Similar: N/A
Result: 0.1818 dF: 10Result: 0.3030
Critical value: 0.5515Outside Similar: No
Score: 106Result: Low
Species Detected Spores/m3<100 1K 10K >100K
Oidium 13Penicillium/Aspergillus types 53
Total 66
Location: 20803001-TM04ME% of outdoor total
spores/m3Friedman chi-
square*(indoor variation)
Agreement ratio**(indoor/outdoor)
Spearman rank correlation***
(indoor/outdoor)
MoldSCORE****(indoor/outdoor)
Result: 4% dF: 31Result: 10.0000
Critical value: N/AInside Similar: N/A
Result: 0.3333 dF: 10Result: 0.1606
Critical value: 0.5515Outside Similar: No
Score: 105Result: Low
Species Detected Spores/m3<100 1K 10K >100K
Other colorless 13Penicillium/Aspergillus types 53
Rusts 13Total 79
EMLab ID: 396775, Page 2 of 13© 2008 EMLab P&K

EMLab P&K11720 North Creek Pkwy N, #400, Bothell, WA 98011(650) 829-5800 Fax (650) 829-5852 www.emlab.com
Client: Hygiene Technologies International, Inc.: Northern CaliforniaC/O: Mr. Wes FreyRe: 20803001
Date of Sampling: 03-07-2008Date of Receipt: 03-07-2008Date of Report: 03-10-2008
MoldSTAT™: Supplementary Statistical Spore Trap ReportLocation: 20803001-TM05ME% of outdoor total
spores/m3Friedman chi-
square*(indoor variation)
Agreement ratio**(indoor/outdoor)
Spearman rank correlation***
(indoor/outdoor)
MoldSCORE****(indoor/outdoor)
Result: 8% dF: 31Result: 10.0000
Critical value: N/AInside Similar: N/A
Result: 0.6154 dF: 9Result: 0.7500
Critical value: 0.5833Outside Similar: Yes
Score: 105Result: Low
Species Detected Spores/m3<100 1K 10K >100K
Alternaria 13Basidiospores 53Cladosporium 53
Penicillium/Aspergillus types 53Total 172
Location: 20803001-TM06ME% of outdoor total
spores/m3Friedman chi-
square*(indoor variation)
Agreement ratio**(indoor/outdoor)
Spearman rank correlation***
(indoor/outdoor)
MoldSCORE****(indoor/outdoor)
Result: 2% dF: 31Result: 10.0000
Critical value: N/AInside Similar: N/A
Result: 0.2000 dF: 9Result: 0.6583
Critical value: 0.5833Outside Similar: Yes
Score: 106Result: Low
Species Detected Spores/m3<100 1K 10K >100K
Penicillium/Aspergillus types 53Total 53
Location: 20803001-TM07ME% of outdoor total
spores/m3Friedman chi-
square*(indoor variation)
Agreement ratio**(indoor/outdoor)
Spearman rank correlation***
(indoor/outdoor)
MoldSCORE****(indoor/outdoor)
Result: 5% dF: 31Result: 10.0000
Critical value: N/AInside Similar: N/A
Result: 0.3636 dF: 9Result: 0.8458
Critical value: 0.5833Outside Similar: Yes
Score: 104Result: Low
Species Detected Spores/m3<100 1K 10K >100K
Basidiospores 53Penicillium/Aspergillus types 53
Total 106
EMLab ID: 396775, Page 3 of 13© 2008 EMLab P&K
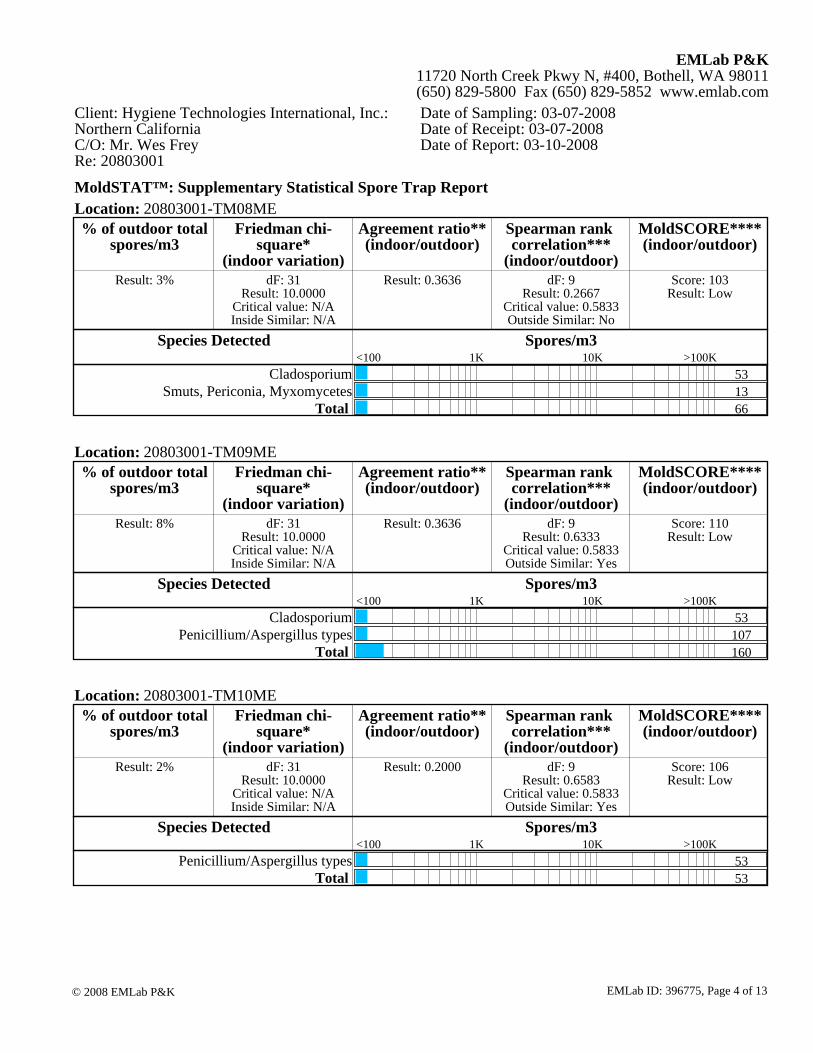
EMLab P&K11720 North Creek Pkwy N, #400, Bothell, WA 98011(650) 829-5800 Fax (650) 829-5852 www.emlab.com
Client: Hygiene Technologies International, Inc.: Northern CaliforniaC/O: Mr. Wes FreyRe: 20803001
Date of Sampling: 03-07-2008Date of Receipt: 03-07-2008Date of Report: 03-10-2008
MoldSTAT™: Supplementary Statistical Spore Trap ReportLocation: 20803001-TM08ME% of outdoor total
spores/m3Friedman chi-
square*(indoor variation)
Agreement ratio**(indoor/outdoor)
Spearman rank correlation***
(indoor/outdoor)
MoldSCORE****(indoor/outdoor)
Result: 3% dF: 31Result: 10.0000
Critical value: N/AInside Similar: N/A
Result: 0.3636 dF: 9Result: 0.2667
Critical value: 0.5833Outside Similar: No
Score: 103Result: Low
Species Detected Spores/m3<100 1K 10K >100K
Cladosporium 53Smuts, Periconia, Myxomycetes 13
Total 66
Location: 20803001-TM09ME% of outdoor total
spores/m3Friedman chi-
square*(indoor variation)
Agreement ratio**(indoor/outdoor)
Spearman rank correlation***
(indoor/outdoor)
MoldSCORE****(indoor/outdoor)
Result: 8% dF: 31Result: 10.0000
Critical value: N/AInside Similar: N/A
Result: 0.3636 dF: 9Result: 0.6333
Critical value: 0.5833Outside Similar: Yes
Score: 110Result: Low
Species Detected Spores/m3<100 1K 10K >100K
Cladosporium 53Penicillium/Aspergillus types 107
Total 160
Location: 20803001-TM10ME% of outdoor total
spores/m3Friedman chi-
square*(indoor variation)
Agreement ratio**(indoor/outdoor)
Spearman rank correlation***
(indoor/outdoor)
MoldSCORE****(indoor/outdoor)
Result: 2% dF: 31Result: 10.0000
Critical value: N/AInside Similar: N/A
Result: 0.2000 dF: 9Result: 0.6583
Critical value: 0.5833Outside Similar: Yes
Score: 106Result: Low
Species Detected Spores/m3<100 1K 10K >100K
Penicillium/Aspergillus types 53Total 53
EMLab ID: 396775, Page 4 of 13© 2008 EMLab P&K

EMLab P&K11720 North Creek Pkwy N, #400, Bothell, WA 98011(650) 829-5800 Fax (650) 829-5852 www.emlab.com
Client: Hygiene Technologies International, Inc.: Northern CaliforniaC/O: Mr. Wes FreyRe: 20803001
Date of Sampling: 03-07-2008Date of Receipt: 03-07-2008Date of Report: 03-10-2008
MoldSTAT™: Supplementary Statistical Spore Trap ReportLocation: 20803001-TM11ME% of outdoor total
spores/m3Friedman chi-
square*(indoor variation)
Agreement ratio**(indoor/outdoor)
Spearman rank correlation***
(indoor/outdoor)
MoldSCORE****(indoor/outdoor)
Result: 5% dF: 31Result: 10.0000
Critical value: N/AInside Similar: N/A
Result: 0.3636 dF: 9Result: 0.6208
Critical value: 0.5833Outside Similar: Yes
Score: 104Result: Low
Species Detected Spores/m3<100 1K 10K >100K
Cladosporium 53Penicillium/Aspergillus types 53
Total 106
Location: 20803001-TM12ME% of outdoor total
spores/m3Friedman chi-
square*(indoor variation)
Agreement ratio**(indoor/outdoor)
Spearman rank correlation***
(indoor/outdoor)
MoldSCORE****(indoor/outdoor)
Result: 2% dF: 31Result: 10.0000
Critical value: N/AInside Similar: N/A
Result: 0.2000 dF: 9Result: 0.6583
Critical value: 0.5833Outside Similar: Yes
Score: 106Result: Low
Species Detected Spores/m3<100 1K 10K >100K
Penicillium/Aspergillus types 53Total 53
Location: 20803001-TM13ME% of outdoor total
spores/m3Friedman chi-
square*(indoor variation)
Agreement ratio**(indoor/outdoor)
Spearman rank correlation***
(indoor/outdoor)
MoldSCORE****(indoor/outdoor)
Result: 5% dF: 31Result: 10.0000
Critical value: N/AInside Similar: N/A
Result: 0.3636 dF: 9Result: 0.6208
Critical value: 0.5833Outside Similar: Yes
Score: 104Result: Low
Species Detected Spores/m3<100 1K 10K >100K
Cladosporium 53Penicillium/Aspergillus types 53
Total 106
EMLab ID: 396775, Page 5 of 13© 2008 EMLab P&K

EMLab P&K11720 North Creek Pkwy N, #400, Bothell, WA 98011(650) 829-5800 Fax (650) 829-5852 www.emlab.com
Client: Hygiene Technologies International, Inc.: Northern CaliforniaC/O: Mr. Wes FreyRe: 20803001
Date of Sampling: 03-07-2008Date of Receipt: 03-07-2008Date of Report: 03-10-2008
MoldSTAT™: Supplementary Statistical Spore Trap ReportLocation: 20803001-TM14ME% of outdoor total
spores/m3Friedman chi-
square*(indoor variation)
Agreement ratio**(indoor/outdoor)
Spearman rank correlation***
(indoor/outdoor)
MoldSCORE****(indoor/outdoor)
Result: 6% dF: 31Result: 10.0000
Critical value: N/AInside Similar: N/A
Result: 0.5000 dF: 9Result: 0.7000
Critical value: 0.5833Outside Similar: Yes
Score: 103Result: Low
Species Detected Spores/m3<100 1K 10K >100K
Basidiospores 53Penicillium/Aspergillus types 53
Smuts, Periconia, Myxomycetes 13Total 119
Location: 20803001-TM15ME% of outdoor total
spores/m3Friedman chi-
square*(indoor variation)
Agreement ratio**(indoor/outdoor)
Spearman rank correlation***
(indoor/outdoor)
MoldSCORE****(indoor/outdoor)
Result: 2% dF: 31Result: 10.0000
Critical value: N/AInside Similar: N/A
Result: 0.2000 dF: 9Result: 0.5083
Critical value: 0.5833Outside Similar: No
Score: 103Result: Low
Species Detected Spores/m3<100 1K 10K >100K
Cladosporium 53Total 53
Location: 20803001-TM16ME% of outdoor total
spores/m3Friedman chi-
square*(indoor variation)
Agreement ratio**(indoor/outdoor)
Spearman rank correlation***
(indoor/outdoor)
MoldSCORE****(indoor/outdoor)
Result: 6% dF: 31Result: 10.0000
Critical value: N/AInside Similar: N/A
Result: 0.5000 dF: 9Result: 0.4500
Critical value: 0.5833Outside Similar: No
Score: 103Result: Low
Species Detected Spores/m3<100 1K 10K >100K
Cladosporium 53Penicillium/Aspergillus types 53
Smuts, Periconia, Myxomycetes 13Total 119
EMLab ID: 396775, Page 6 of 13© 2008 EMLab P&K

EMLab P&K11720 North Creek Pkwy N, #400, Bothell, WA 98011(650) 829-5800 Fax (650) 829-5852 www.emlab.com
Client: Hygiene Technologies International, Inc.: Northern CaliforniaC/O: Mr. Wes FreyRe: 20803001
Date of Sampling: 03-07-2008Date of Receipt: 03-07-2008Date of Report: 03-10-2008
MoldSTAT™: Supplementary Statistical Spore Trap ReportLocation: 20803001-TM17ME% of outdoor total
spores/m3Friedman chi-
square*(indoor variation)
Agreement ratio**(indoor/outdoor)
Spearman rank correlation***
(indoor/outdoor)
MoldSCORE****(indoor/outdoor)
Result: 2% dF: 31Result: 10.0000
Critical value: N/AInside Similar: N/A
Result: 0.2000 dF: 9Result: 0.6583
Critical value: 0.5833Outside Similar: Yes
Score: 106Result: Low
Species Detected Spores/m3<100 1K 10K >100K
Penicillium/Aspergillus types 53Total 53
Location: 20803001-TM18ME% of outdoor total
spores/m3Friedman chi-
square*(indoor variation)
Agreement ratio**(indoor/outdoor)
Spearman rank correlation***
(indoor/outdoor)
MoldSCORE****(indoor/outdoor)
Result: 62% dF: 31Result: 10.0000
Critical value: N/AInside Similar: N/A
Result: 0.2000 dF: 9Result: 0.6583
Critical value: 0.5833Outside Similar: Yes
Score: 225Result: Medium
Species Detected Spores/m3<100 1K 10K >100K
Penicillium/Aspergillus types 1,210Total 1,210
Location: 20803001-TM19ME% of outdoor total
spores/m3Friedman chi-
square*(indoor variation)
Agreement ratio**(indoor/outdoor)
Spearman rank correlation***
(indoor/outdoor)
MoldSCORE****(indoor/outdoor)
Result: 8% dF: 31Result: 10.0000
Critical value: N/AInside Similar: N/A
Result: 0.3636 dF: 9Result: 0.4333
Critical value: 0.5833Outside Similar: No
Score: 118Result: Low
Species Detected Spores/m3<100 1K 10K >100K
Penicillium/Aspergillus types 160Smuts, Periconia, Myxomycetes 13
Total 173
EMLab ID: 396775, Page 7 of 13© 2008 EMLab P&K

EMLab P&K11720 North Creek Pkwy N, #400, Bothell, WA 98011(650) 829-5800 Fax (650) 829-5852 www.emlab.com
Client: Hygiene Technologies International, Inc.: Northern CaliforniaC/O: Mr. Wes FreyRe: 20803001
Date of Sampling: 03-07-2008Date of Receipt: 03-07-2008Date of Report: 03-10-2008
MoldSTAT™: Supplementary Statistical Spore Trap ReportLocation: 20803001-TM20ME% of outdoor total
spores/m3Friedman chi-
square*(indoor variation)
Agreement ratio**(indoor/outdoor)
Spearman rank correlation***
(indoor/outdoor)
MoldSCORE****(indoor/outdoor)
Result: 6% dF: 31Result: 10.0000
Critical value: N/AInside Similar: N/A
Result: 0.5000 dF: 9Result: 0.7000
Critical value: 0.5833Outside Similar: Yes
Score: 103Result: Low
Species Detected Spores/m3<100 1K 10K >100K
Basidiospores 53Penicillium/Aspergillus types 53
Smuts, Periconia, Myxomycetes 13Total 119
Location: 20803001-TM21ME% of outdoor total
spores/m3Friedman chi-
square*(indoor variation)
Agreement ratio**(indoor/outdoor)
Spearman rank correlation***
(indoor/outdoor)
MoldSCORE****(indoor/outdoor)
Result: 8% dF: 31Result: 10.0000
Critical value: N/AInside Similar: N/A
Result: 0.6154 dF: 9Result: 0.7500
Critical value: 0.5833Outside Similar: Yes
Score: 105Result: Low
Species Detected Spores/m3<100 1K 10K >100K
Alternaria 13Basidiospores 53Cladosporium 53
Penicillium/Aspergillus types 53Total 172
Location: 20803001-TM22ME% of outdoor total
spores/m3Friedman chi-
square*(indoor variation)
Agreement ratio**(indoor/outdoor)
Spearman rank correlation***
(indoor/outdoor)
MoldSCORE****(indoor/outdoor)
Result: 2% dF: 31Result: 10.0000
Critical value: N/AInside Similar: N/A
Result: 0.2000 dF: 9Result: 0.6583
Critical value: 0.5833Outside Similar: Yes
Score: 106Result: Low
Species Detected Spores/m3<100 1K 10K >100K
Penicillium/Aspergillus types 53Total 53
EMLab ID: 396775, Page 8 of 13© 2008 EMLab P&K

EMLab P&K11720 North Creek Pkwy N, #400, Bothell, WA 98011(650) 829-5800 Fax (650) 829-5852 www.emlab.com
Client: Hygiene Technologies International, Inc.: Northern CaliforniaC/O: Mr. Wes FreyRe: 20803001
Date of Sampling: 03-07-2008Date of Receipt: 03-07-2008Date of Report: 03-10-2008
MoldSTAT™: Supplementary Statistical Spore Trap ReportLocation: 20803001-TM23ME% of outdoor total
spores/m3Friedman chi-
square*(indoor variation)
Agreement ratio**(indoor/outdoor)
Spearman rank correlation***
(indoor/outdoor)
MoldSCORE****(indoor/outdoor)
Result: < 1% dF: 31Result: 10.0000
Critical value: N/AInside Similar: N/A
Result: 0.0000 dF: N/AResult: N/A
Critical value: N/AOutside Similar: N/A
Score: 100Result: Low
Species Detected Spores/m3<100 1K 10K >100K
None Detected N/A
Location: 20803001-TM24ME% of outdoor total
spores/m3Friedman chi-
square*(indoor variation)
Agreement ratio**(indoor/outdoor)
Spearman rank correlation***
(indoor/outdoor)
MoldSCORE****(indoor/outdoor)
Result: 4% dF: 31Result: 10.0000
Critical value: N/AInside Similar: N/A
Result: 0.5000 dF: 9Result: 0.2417
Critical value: 0.5833Outside Similar: No
Score: 107Result: Low
Species Detected Spores/m3<100 1K 10K >100K
Other brown 13Penicillium/Aspergillus types 53
Smuts, Periconia, Myxomycetes 13Total 79
Location: 20803001-TM25ME% of outdoor total
spores/m3Friedman chi-
square*(indoor variation)
Agreement ratio**(indoor/outdoor)
Spearman rank correlation***
(indoor/outdoor)
MoldSCORE****(indoor/outdoor)
Result: 16% dF: 31Result: 10.0000
Critical value: N/AInside Similar: N/A
Result: 0.5000 dF: 9Result: 0.3917
Critical value: 0.5833Outside Similar: No
Score: 112Result: Low
Species Detected Spores/m3<100 1K 10K >100K
Cladosporium 213Penicillium/Aspergillus types 53
Smuts, Periconia, Myxomycetes 53Total 319
EMLab ID: 396775, Page 9 of 13© 2008 EMLab P&K

EMLab P&K11720 North Creek Pkwy N, #400, Bothell, WA 98011(650) 829-5800 Fax (650) 829-5852 www.emlab.com
Client: Hygiene Technologies International, Inc.: Northern CaliforniaC/O: Mr. Wes FreyRe: 20803001
Date of Sampling: 03-07-2008Date of Receipt: 03-07-2008Date of Report: 03-10-2008
MoldSTAT™: Supplementary Statistical Spore Trap ReportLocation: 20803001-TM26ME% of outdoor total
spores/m3Friedman chi-
square*(indoor variation)
Agreement ratio**(indoor/outdoor)
Spearman rank correlation***
(indoor/outdoor)
MoldSCORE****(indoor/outdoor)
Result: 6% dF: 31Result: 10.0000
Critical value: N/AInside Similar: N/A
Result: 0.5000 dF: 9Result: 0.4500
Critical value: 0.5833Outside Similar: No
Score: 110Result: Low
Species Detected Spores/m3<100 1K 10K >100K
Alternaria 27Cladosporium 53
Penicillium/Aspergillus types 53Total 133
Location: 20803001-TM27ME% of outdoor total
spores/m3Friedman chi-
square*(indoor variation)
Agreement ratio**(indoor/outdoor)
Spearman rank correlation***
(indoor/outdoor)
MoldSCORE****(indoor/outdoor)
Result: 5% dF: 31Result: 10.0000
Critical value: N/AInside Similar: N/A
Result: 0.2000 dF: 9Result: 0.6583
Critical value: 0.5833Outside Similar: Yes
Score: 112Result: Low
Species Detected Spores/m3<100 1K 10K >100K
Penicillium/Aspergillus types 107Total 107
Location: 20803001-TM28ME% of outdoor total
spores/m3Friedman chi-
square*(indoor variation)
Agreement ratio**(indoor/outdoor)
Spearman rank correlation***
(indoor/outdoor)
MoldSCORE****(indoor/outdoor)
Result: 5% dF: 31Result: 10.0000
Critical value: N/AInside Similar: N/A
Result: 0.2000 dF: 9Result: 0.6583
Critical value: 0.5833Outside Similar: Yes
Score: 112Result: Low
Species Detected Spores/m3<100 1K 10K >100K
Penicillium/Aspergillus types 107Total 107
EMLab ID: 396775, Page 10 of 13© 2008 EMLab P&K

EMLab P&K11720 North Creek Pkwy N, #400, Bothell, WA 98011(650) 829-5800 Fax (650) 829-5852 www.emlab.com
Client: Hygiene Technologies International, Inc.: Northern CaliforniaC/O: Mr. Wes FreyRe: 20803001
Date of Sampling: 03-07-2008Date of Receipt: 03-07-2008Date of Report: 03-10-2008
MoldSTAT™: Supplementary Statistical Spore Trap ReportLocation: 20803001-TM29ME% of outdoor total
spores/m3Friedman chi-
square*(indoor variation)
Agreement ratio**(indoor/outdoor)
Spearman rank correlation***
(indoor/outdoor)
MoldSCORE****(indoor/outdoor)
Result: 6% dF: 31Result: 10.0000
Critical value: N/AInside Similar: N/A
Result: 0.5000 dF: 9Result: 0.5083
Critical value: 0.5833Outside Similar: No
Score: 111Result: Low
Species Detected Spores/m3<100 1K 10K >100K
Ascospores 13Penicillium/Aspergillus types 107
Rusts 13Total 133
Location: 20803001-TM30ME% of outdoor total
spores/m3Friedman chi-
square*(indoor variation)
Agreement ratio**(indoor/outdoor)
Spearman rank correlation***
(indoor/outdoor)
MoldSCORE****(indoor/outdoor)
Result: < 1% dF: 31Result: 10.0000
Critical value: N/AInside Similar: N/A
Result: 0.2000 dF: 9Result: 0.2833
Critical value: 0.5833Outside Similar: No
Score: 103Result: Low
Species Detected Spores/m3<100 1K 10K >100K
Smuts, Periconia, Myxomycetes 13Total 13
Location: 20803001-TM31ME% of outdoor total
spores/m3Friedman chi-
square*(indoor variation)
Agreement ratio**(indoor/outdoor)
Spearman rank correlation***
(indoor/outdoor)
MoldSCORE****(indoor/outdoor)
Result: 19% dF: 31Result: 10.0000
Critical value: N/AInside Similar: N/A
Result: 0.5000 dF: 9Result: 0.7917
Critical value: 0.5833Outside Similar: Yes
Score: 116Result: Low
Species Detected Spores/m3<100 1K 10K >100K
Basidiospores 53Cladosporium 280
Penicillium/Aspergillus types 53Total 386
EMLab ID: 396775, Page 11 of 13© 2008 EMLab P&K

EMLab P&K11720 North Creek Pkwy N, #400, Bothell, WA 98011(650) 829-5800 Fax (650) 829-5852 www.emlab.com
Client: Hygiene Technologies International, Inc.: Northern CaliforniaC/O: Mr. Wes FreyRe: 20803001
Date of Sampling: 03-07-2008Date of Receipt: 03-07-2008Date of Report: 03-10-2008
MoldSTAT™: Supplementary Statistical Spore Trap ReportLocation: 20803001-TM32ME% of outdoor total
spores/m3Friedman chi-
square*(indoor variation)
Agreement ratio**(indoor/outdoor)
Spearman rank correlation***
(indoor/outdoor)
MoldSCORE****(indoor/outdoor)
Result: < 1% dF: 31Result: 10.0000
Critical value: N/AInside Similar: N/A
Result: 0.0000 dF: N/AResult: N/A
Critical value: N/AOutside Similar: N/A
Score: 100Result: Low
Species Detected Spores/m3<100 1K 10K >100K
None Detected N/A
Location: 20803001-TM33ME% of outdoor total
spores/m3Friedman chi-
square*(indoor variation)
Agreement ratio**(indoor/outdoor)
Spearman rank correlation***
(indoor/outdoor)
MoldSCORE****(indoor/outdoor)
Result: 6% dF: 31Result: 10.0000
Critical value: N/AInside Similar: N/A
Result: 0.5000 dF: 9Result: 0.7000
Critical value: 0.5833Outside Similar: Yes
Score: 103Result: Low
Species Detected Spores/m3<100 1K 10K >100K
Basidiospores 53Penicillium/Aspergillus types 53
Smuts, Periconia, Myxomycetes 13Total 119
* The Friedman chi-square statistic is a non-parametric test that examines variation in a set of data (in this case, all indoor spore counts). The null hypothesis (H0) being tested is that there is no meaningful difference in the data for all indoor locations. The alternative hypothesis (used if the test disproves the null hypothesis) is that there is a difference between the indoor locations. The null hypothesis is rejected when the result of the test is greater than the critical value. The critical value that is displayed is based on the degrees of freedom (dF) of the test and a significance level of 0.05.
** An agreement ratio is a simple method for assessing the similarity of two samples (in this case the indoor sample and the outdoor summary) based on the spore types present. A score of one indicates that the types detected in one location are the same as that in the other. A score of zero indicates that none of the types detected indoors are present outdoors. Typically, an agreement of 0.8 or higher is considered high.
*** The Spearman rank correlation is a non-parametric test that examines correlation between two sets of data (in this case the indoor location and the outdoor summary). The null hypothesis (H0) being tested is that the indoor and outdoor samples are unrelated. The alternative hypothesis (used if the test disproves the null hypothesis) is that the samples are similar. The null hypothesis is rejected when the result of the test is greater than the critical value. The critical value that is displayed is based on the degrees of freedom (dF) of the test and a significance level of 0.05.
EMLab ID: 396775, Page 12 of 13© 2008 EMLab P&K

EMLab P&K11720 North Creek Pkwy N, #400, Bothell, WA 98011(650) 829-5800 Fax (650) 829-5852 www.emlab.com
Client: Hygiene Technologies International, Inc.: Northern CaliforniaC/O: Mr. Wes FreyRe: 20803001
Date of Sampling: 03-07-2008Date of Receipt: 03-07-2008Date of Report: 03-10-2008
MoldSTAT™: Supplementary Statistical Spore Trap Report**** MoldSCORE™ is a specialized method for examining air sampling data. It is a score between 100 and 300, with 100 indicating a greater likelihood that the airborne indoor spores originated from the outside, and 300 indicating a greater likelihood that they originated from an inside source. The Result displayed is based on the numeric score given and will be either Low, Medium, or High, indicating a low, medium, or high likelihood that the spores detected originated from an indoor source. EMLab P&Kreserves the right to, and may at anytime, modify or change the MoldScore algorithm without notice.
Interpretation of the data contained in this report is left to the client or the persons who conducted the field work. This report is provided for informational and comparative purposes only and should not be relied upon for any other purpose. "Typical outdoor ranges" are based on the results of the analysis of samples delivered to and analyzed by EMLab P&K and assumptions regarding the origins of those samples. Sampling techniques, contaminants infecting samples, unrepresentative samples and other similar or dissimilar factors may affect these results. With the statistical analysis provided, as with all statistical comparisons and analyses, false-positive and false-negative results can and do occur. EMLab P&K hereby disclaims any liability for any and all direct, indirect, punitive, incidental, special or consequential damages arising out of the data contained in, or any actions taken or omitted in reliance upon, this report.
EMLab ID: 396775, Page 13 of 13© 2008 EMLab P&K

EMLab P&K11720 North Creek Pkwy N, #400, Bothell, WA 98011(650) 829-5800 Fax (650) 829-5852 www.emlab.com
Client: Hygiene Technologies International, Inc.: Northern CaliforniaC/O: Mr. Wes FreyRe: 20803001
Date of Sampling: 03-07-2008Date of Receipt: 03-07-2008Date of Report: 03-10-2008
MoldSTAT™: Supplementary Statistical Spore Trap ReportOutdoor Summary: 20803001-TM34OUTME:
Species detected Outdoor sample spores/m3 Typical outdoor ranges Freq.<100 1K 10K >100K (North America) %
Ascospores 427 13 - 160 - 4,200 76Basidiospores 1,440 13 - 320 - 14,000 92Cladosporium 907 40 - 530 - 8,500 95
Epicoccum 13 7 - 13 - 320 24Oidium 13 7 - 13 - 230 15
Other brown 27 7 - 13 - 93 35Penicillium/Aspergillus types 693 27 - 210 - 2,600 85
Rusts 27 7 - 15 - 310 23Smuts, Periconia, Myxomycetes 67 7 - 40 - 760 70
Total 3,614The "Typical outdoor ranges" and "Freq. %" columns show the typical low, medium, and high spore counts per cubic meter and the frequency of occurrence for the given spore type. The low, medium, and high values represent the 2.5, 50, and 97.5 percentile values when the spore type is detected. For example, if the low value is 53 and the frequency of occurence is 63%, it would mean that we typically detect the given spore type on 63 percent of all outdoor samples and, when detected, 2.5% of the time it is present in levels below 53 spores/m3.
Indoor Samples
Location: 20803001-TM02ME% of outdoor total
spores/m3Friedman chi-
square*(indoor variation)
Agreement ratio**(indoor/outdoor)
Spearman rank correlation***
(indoor/outdoor)
MoldSCORE****(indoor/outdoor)
Result: 2% dF: 31Result: 10.0000
Critical value: N/AInside Similar: N/A
Result: 0.3636 dF: 9Result: 0.7708
Critical value: 0.5833Outside Similar: Yes
Score: 102Result: Low
Species Detected Spores/m3<100 1K 10K >100K
Basidiospores 53Cladosporium 53
Total 106
EMLab ID: 396775, Page 1 of 13© 2008 EMLab P&K

EMLab P&K11720 North Creek Pkwy N, #400, Bothell, WA 98011(650) 829-5800 Fax (650) 829-5852 www.emlab.com
Client: Hygiene Technologies International, Inc.: Northern CaliforniaC/O: Mr. Wes FreyRe: 20803001
Date of Sampling: 03-07-2008Date of Receipt: 03-07-2008Date of Report: 03-10-2008
MoldSTAT™: Supplementary Statistical Spore Trap ReportLocation: 20803001-TM03ME% of outdoor total
spores/m3Friedman chi-
square*(indoor variation)
Agreement ratio**(indoor/outdoor)
Spearman rank correlation***
(indoor/outdoor)
MoldSCORE****(indoor/outdoor)
Result: 1% dF: 31Result: 10.0000
Critical value: N/AInside Similar: N/A
Result: 0.3636 dF: 9Result: 0.1750
Critical value: 0.5833Outside Similar: No
Score: 106Result: Low
Species Detected Spores/m3<100 1K 10K >100K
Oidium 13Penicillium/Aspergillus types 53
Total 66
Location: 20803001-TM04ME% of outdoor total
spores/m3Friedman chi-
square*(indoor variation)
Agreement ratio**(indoor/outdoor)
Spearman rank correlation***
(indoor/outdoor)
MoldSCORE****(indoor/outdoor)
Result: 2% dF: 31Result: 10.0000
Critical value: N/AInside Similar: N/A
Result: 0.3333 dF: 10Result: 0.0606
Critical value: 0.5515Outside Similar: No
Score: 106Result: Low
Species Detected Spores/m3<100 1K 10K >100K
Other colorless 13Penicillium/Aspergillus types 53
Rusts 13Total 79
EMLab ID: 396775, Page 2 of 13© 2008 EMLab P&K

EMLab P&K11720 North Creek Pkwy N, #400, Bothell, WA 98011(650) 829-5800 Fax (650) 829-5852 www.emlab.com
Client: Hygiene Technologies International, Inc.: Northern CaliforniaC/O: Mr. Wes FreyRe: 20803001
Date of Sampling: 03-07-2008Date of Receipt: 03-07-2008Date of Report: 03-10-2008
MoldSTAT™: Supplementary Statistical Spore Trap ReportLocation: 20803001-TM05ME% of outdoor total
spores/m3Friedman chi-
square*(indoor variation)
Agreement ratio**(indoor/outdoor)
Spearman rank correlation***
(indoor/outdoor)
MoldSCORE****(indoor/outdoor)
Result: 4% dF: 31Result: 10.0000
Critical value: N/AInside Similar: N/A
Result: 0.4615 dF: 10Result: 0.6333
Critical value: 0.5515Outside Similar: Yes
Score: 105Result: Low
Species Detected Spores/m3<100 1K 10K >100K
Alternaria 13Basidiospores 53Cladosporium 53
Penicillium/Aspergillus types 53Total 172
Location: 20803001-TM06ME% of outdoor total
spores/m3Friedman chi-
square*(indoor variation)
Agreement ratio**(indoor/outdoor)
Spearman rank correlation***
(indoor/outdoor)
MoldSCORE****(indoor/outdoor)
Result: 1% dF: 31Result: 10.0000
Critical value: N/AInside Similar: N/A
Result: 0.2000 dF: 9Result: 0.5083
Critical value: 0.5833Outside Similar: No
Score: 107Result: Low
Species Detected Spores/m3<100 1K 10K >100K
Penicillium/Aspergillus types 53Total 53
Location: 20803001-TM07ME% of outdoor total
spores/m3Friedman chi-
square*(indoor variation)
Agreement ratio**(indoor/outdoor)
Spearman rank correlation***
(indoor/outdoor)
MoldSCORE****(indoor/outdoor)
Result: 2% dF: 31Result: 10.0000
Critical value: N/AInside Similar: N/A
Result: 0.3636 dF: 9Result: 0.6958
Critical value: 0.5833Outside Similar: Yes
Score: 105Result: Low
Species Detected Spores/m3<100 1K 10K >100K
Basidiospores 53Penicillium/Aspergillus types 53
Total 106
EMLab ID: 396775, Page 3 of 13© 2008 EMLab P&K

EMLab P&K11720 North Creek Pkwy N, #400, Bothell, WA 98011(650) 829-5800 Fax (650) 829-5852 www.emlab.com
Client: Hygiene Technologies International, Inc.: Northern CaliforniaC/O: Mr. Wes FreyRe: 20803001
Date of Sampling: 03-07-2008Date of Receipt: 03-07-2008Date of Report: 03-10-2008
MoldSTAT™: Supplementary Statistical Spore Trap ReportLocation: 20803001-TM08ME% of outdoor total
spores/m3Friedman chi-
square*(indoor variation)
Agreement ratio**(indoor/outdoor)
Spearman rank correlation***
(indoor/outdoor)
MoldSCORE****(indoor/outdoor)
Result: 1% dF: 31Result: 10.0000
Critical value: N/AInside Similar: N/A
Result: 0.3636 dF: 9Result: 0.4917
Critical value: 0.5833Outside Similar: No
Score: 102Result: Low
Species Detected Spores/m3<100 1K 10K >100K
Cladosporium 53Smuts, Periconia, Myxomycetes 13
Total 66
Location: 20803001-TM09ME% of outdoor total
spores/m3Friedman chi-
square*(indoor variation)
Agreement ratio**(indoor/outdoor)
Spearman rank correlation***
(indoor/outdoor)
MoldSCORE****(indoor/outdoor)
Result: 4% dF: 31Result: 10.0000
Critical value: N/AInside Similar: N/A
Result: 0.3636 dF: 9Result: 0.6083
Critical value: 0.5833Outside Similar: Yes
Score: 112Result: Low
Species Detected Spores/m3<100 1K 10K >100K
Cladosporium 53Penicillium/Aspergillus types 107
Total 160
Location: 20803001-TM10ME% of outdoor total
spores/m3Friedman chi-
square*(indoor variation)
Agreement ratio**(indoor/outdoor)
Spearman rank correlation***
(indoor/outdoor)
MoldSCORE****(indoor/outdoor)
Result: 1% dF: 31Result: 10.0000
Critical value: N/AInside Similar: N/A
Result: 0.2000 dF: 9Result: 0.5083
Critical value: 0.5833Outside Similar: No
Score: 107Result: Low
Species Detected Spores/m3<100 1K 10K >100K
Penicillium/Aspergillus types 53Total 53
EMLab ID: 396775, Page 4 of 13© 2008 EMLab P&K

EMLab P&K11720 North Creek Pkwy N, #400, Bothell, WA 98011(650) 829-5800 Fax (650) 829-5852 www.emlab.com
Client: Hygiene Technologies International, Inc.: Northern CaliforniaC/O: Mr. Wes FreyRe: 20803001
Date of Sampling: 03-07-2008Date of Receipt: 03-07-2008Date of Report: 03-10-2008
MoldSTAT™: Supplementary Statistical Spore Trap ReportLocation: 20803001-TM11ME% of outdoor total
spores/m3Friedman chi-
square*(indoor variation)
Agreement ratio**(indoor/outdoor)
Spearman rank correlation***
(indoor/outdoor)
MoldSCORE****(indoor/outdoor)
Result: 2% dF: 31Result: 10.0000
Critical value: N/AInside Similar: N/A
Result: 0.3636 dF: 9Result: 0.6208
Critical value: 0.5833Outside Similar: Yes
Score: 105Result: Low
Species Detected Spores/m3<100 1K 10K >100K
Cladosporium 53Penicillium/Aspergillus types 53
Total 106
Location: 20803001-TM12ME% of outdoor total
spores/m3Friedman chi-
square*(indoor variation)
Agreement ratio**(indoor/outdoor)
Spearman rank correlation***
(indoor/outdoor)
MoldSCORE****(indoor/outdoor)
Result: 1% dF: 31Result: 10.0000
Critical value: N/AInside Similar: N/A
Result: 0.2000 dF: 9Result: 0.5083
Critical value: 0.5833Outside Similar: No
Score: 107Result: Low
Species Detected Spores/m3<100 1K 10K >100K
Penicillium/Aspergillus types 53Total 53
Location: 20803001-TM13ME% of outdoor total
spores/m3Friedman chi-
square*(indoor variation)
Agreement ratio**(indoor/outdoor)
Spearman rank correlation***
(indoor/outdoor)
MoldSCORE****(indoor/outdoor)
Result: 2% dF: 31Result: 10.0000
Critical value: N/AInside Similar: N/A
Result: 0.3636 dF: 9Result: 0.6208
Critical value: 0.5833Outside Similar: Yes
Score: 105Result: Low
Species Detected Spores/m3<100 1K 10K >100K
Cladosporium 53Penicillium/Aspergillus types 53
Total 106
EMLab ID: 396775, Page 5 of 13© 2008 EMLab P&K

EMLab P&K11720 North Creek Pkwy N, #400, Bothell, WA 98011(650) 829-5800 Fax (650) 829-5852 www.emlab.com
Client: Hygiene Technologies International, Inc.: Northern CaliforniaC/O: Mr. Wes FreyRe: 20803001
Date of Sampling: 03-07-2008Date of Receipt: 03-07-2008Date of Report: 03-10-2008
MoldSTAT™: Supplementary Statistical Spore Trap ReportLocation: 20803001-TM14ME% of outdoor total
spores/m3Friedman chi-
square*(indoor variation)
Agreement ratio**(indoor/outdoor)
Spearman rank correlation***
(indoor/outdoor)
MoldSCORE****(indoor/outdoor)
Result: 3% dF: 31Result: 10.0000
Critical value: N/AInside Similar: N/A
Result: 0.5000 dF: 9Result: 0.6583
Critical value: 0.5833Outside Similar: Yes
Score: 105Result: Low
Species Detected Spores/m3<100 1K 10K >100K
Basidiospores 53Penicillium/Aspergillus types 53
Smuts, Periconia, Myxomycetes 13Total 119
Location: 20803001-TM15ME% of outdoor total
spores/m3Friedman chi-
square*(indoor variation)
Agreement ratio**(indoor/outdoor)
Spearman rank correlation***
(indoor/outdoor)
MoldSCORE****(indoor/outdoor)
Result: 1% dF: 31Result: 10.0000
Critical value: N/AInside Similar: N/A
Result: 0.2000 dF: 9Result: 0.5833
Critical value: 0.5833Outside Similar: Yes
Score: 103Result: Low
Species Detected Spores/m3<100 1K 10K >100K
Cladosporium 53Total 53
Location: 20803001-TM16ME% of outdoor total
spores/m3Friedman chi-
square*(indoor variation)
Agreement ratio**(indoor/outdoor)
Spearman rank correlation***
(indoor/outdoor)
MoldSCORE****(indoor/outdoor)
Result: 3% dF: 31Result: 10.0000
Critical value: N/AInside Similar: N/A
Result: 0.5000 dF: 9Result: 0.5750
Critical value: 0.5833Outside Similar: No
Score: 105Result: Low
Species Detected Spores/m3<100 1K 10K >100K
Cladosporium 53Penicillium/Aspergillus types 53
Smuts, Periconia, Myxomycetes 13Total 119
EMLab ID: 396775, Page 6 of 13© 2008 EMLab P&K

EMLab P&K11720 North Creek Pkwy N, #400, Bothell, WA 98011(650) 829-5800 Fax (650) 829-5852 www.emlab.com
Client: Hygiene Technologies International, Inc.: Northern CaliforniaC/O: Mr. Wes FreyRe: 20803001
Date of Sampling: 03-07-2008Date of Receipt: 03-07-2008Date of Report: 03-10-2008
MoldSTAT™: Supplementary Statistical Spore Trap ReportLocation: 20803001-TM17ME% of outdoor total
spores/m3Friedman chi-
square*(indoor variation)
Agreement ratio**(indoor/outdoor)
Spearman rank correlation***
(indoor/outdoor)
MoldSCORE****(indoor/outdoor)
Result: 1% dF: 31Result: 10.0000
Critical value: N/AInside Similar: N/A
Result: 0.2000 dF: 9Result: 0.5083
Critical value: 0.5833Outside Similar: No
Score: 107Result: Low
Species Detected Spores/m3<100 1K 10K >100K
Penicillium/Aspergillus types 53Total 53
Location: 20803001-TM18ME% of outdoor total
spores/m3Friedman chi-
square*(indoor variation)
Agreement ratio**(indoor/outdoor)
Spearman rank correlation***
(indoor/outdoor)
MoldSCORE****(indoor/outdoor)
Result: 33% dF: 31Result: 10.0000
Critical value: N/AInside Similar: N/A
Result: 0.2000 dF: 9Result: 0.5083
Critical value: 0.5833Outside Similar: No
Score: 234Result: Medium
Species Detected Spores/m3<100 1K 10K >100K
Penicillium/Aspergillus types 1,210Total 1,210
Location: 20803001-TM19ME% of outdoor total
spores/m3Friedman chi-
square*(indoor variation)
Agreement ratio**(indoor/outdoor)
Spearman rank correlation***
(indoor/outdoor)
MoldSCORE****(indoor/outdoor)
Result: 4% dF: 31Result: 10.0000
Critical value: N/AInside Similar: N/A
Result: 0.3636 dF: 9Result: 0.4083
Critical value: 0.5833Outside Similar: No
Score: 120Result: Low
Species Detected Spores/m3<100 1K 10K >100K
Penicillium/Aspergillus types 160Smuts, Periconia, Myxomycetes 13
Total 173
EMLab ID: 396775, Page 7 of 13© 2008 EMLab P&K

EMLab P&K11720 North Creek Pkwy N, #400, Bothell, WA 98011(650) 829-5800 Fax (650) 829-5852 www.emlab.com
Client: Hygiene Technologies International, Inc.: Northern CaliforniaC/O: Mr. Wes FreyRe: 20803001
Date of Sampling: 03-07-2008Date of Receipt: 03-07-2008Date of Report: 03-10-2008
MoldSTAT™: Supplementary Statistical Spore Trap ReportLocation: 20803001-TM20ME% of outdoor total
spores/m3Friedman chi-
square*(indoor variation)
Agreement ratio**(indoor/outdoor)
Spearman rank correlation***
(indoor/outdoor)
MoldSCORE****(indoor/outdoor)
Result: 3% dF: 31Result: 10.0000
Critical value: N/AInside Similar: N/A
Result: 0.5000 dF: 9Result: 0.6583
Critical value: 0.5833Outside Similar: Yes
Score: 105Result: Low
Species Detected Spores/m3<100 1K 10K >100K
Basidiospores 53Penicillium/Aspergillus types 53
Smuts, Periconia, Myxomycetes 13Total 119
Location: 20803001-TM21ME% of outdoor total
spores/m3Friedman chi-
square*(indoor variation)
Agreement ratio**(indoor/outdoor)
Spearman rank correlation***
(indoor/outdoor)
MoldSCORE****(indoor/outdoor)
Result: 4% dF: 31Result: 10.0000
Critical value: N/AInside Similar: N/A
Result: 0.4615 dF: 10Result: 0.6333
Critical value: 0.5515Outside Similar: Yes
Score: 105Result: Low
Species Detected Spores/m3<100 1K 10K >100K
Alternaria 13Basidiospores 53Cladosporium 53
Penicillium/Aspergillus types 53Total 172
Location: 20803001-TM22ME% of outdoor total
spores/m3Friedman chi-
square*(indoor variation)
Agreement ratio**(indoor/outdoor)
Spearman rank correlation***
(indoor/outdoor)
MoldSCORE****(indoor/outdoor)
Result: 1% dF: 31Result: 10.0000
Critical value: N/AInside Similar: N/A
Result: 0.2000 dF: 9Result: 0.5083
Critical value: 0.5833Outside Similar: No
Score: 107Result: Low
Species Detected Spores/m3<100 1K 10K >100K
Penicillium/Aspergillus types 53Total 53
EMLab ID: 396775, Page 8 of 13© 2008 EMLab P&K

EMLab P&K11720 North Creek Pkwy N, #400, Bothell, WA 98011(650) 829-5800 Fax (650) 829-5852 www.emlab.com
Client: Hygiene Technologies International, Inc.: Northern CaliforniaC/O: Mr. Wes FreyRe: 20803001
Date of Sampling: 03-07-2008Date of Receipt: 03-07-2008Date of Report: 03-10-2008
MoldSTAT™: Supplementary Statistical Spore Trap ReportLocation: 20803001-TM23ME% of outdoor total
spores/m3Friedman chi-
square*(indoor variation)
Agreement ratio**(indoor/outdoor)
Spearman rank correlation***
(indoor/outdoor)
MoldSCORE****(indoor/outdoor)
Result: < 1% dF: 31Result: 10.0000
Critical value: N/AInside Similar: N/A
Result: 0.0000 dF: N/AResult: N/A
Critical value: N/AOutside Similar: N/A
Score: 100Result: Low
Species Detected Spores/m3<100 1K 10K >100K
None Detected N/A
Location: 20803001-TM24ME% of outdoor total
spores/m3Friedman chi-
square*(indoor variation)
Agreement ratio**(indoor/outdoor)
Spearman rank correlation***
(indoor/outdoor)
MoldSCORE****(indoor/outdoor)
Result: 2% dF: 31Result: 10.0000
Critical value: N/AInside Similar: N/A
Result: 0.5000 dF: 9Result: 0.2417
Critical value: 0.5833Outside Similar: No
Score: 107Result: Low
Species Detected Spores/m3<100 1K 10K >100K
Other brown 13Penicillium/Aspergillus types 53
Smuts, Periconia, Myxomycetes 13Total 79
Location: 20803001-TM25ME% of outdoor total
spores/m3Friedman chi-
square*(indoor variation)
Agreement ratio**(indoor/outdoor)
Spearman rank correlation***
(indoor/outdoor)
MoldSCORE****(indoor/outdoor)
Result: 8% dF: 31Result: 10.0000
Critical value: N/AInside Similar: N/A
Result: 0.5000 dF: 9Result: 0.5667
Critical value: 0.5833Outside Similar: No
Score: 109Result: Low
Species Detected Spores/m3<100 1K 10K >100K
Cladosporium 213Penicillium/Aspergillus types 53
Smuts, Periconia, Myxomycetes 53Total 319
EMLab ID: 396775, Page 9 of 13© 2008 EMLab P&K

EMLab P&K11720 North Creek Pkwy N, #400, Bothell, WA 98011(650) 829-5800 Fax (650) 829-5852 www.emlab.com
Client: Hygiene Technologies International, Inc.: Northern CaliforniaC/O: Mr. Wes FreyRe: 20803001
Date of Sampling: 03-07-2008Date of Receipt: 03-07-2008Date of Report: 03-10-2008
MoldSTAT™: Supplementary Statistical Spore Trap ReportLocation: 20803001-TM26ME% of outdoor total
spores/m3Friedman chi-
square*(indoor variation)
Agreement ratio**(indoor/outdoor)
Spearman rank correlation***
(indoor/outdoor)
MoldSCORE****(indoor/outdoor)
Result: 3% dF: 31Result: 10.0000
Critical value: N/AInside Similar: N/A
Result: 0.3333 dF: 10Result: 0.3606
Critical value: 0.5515Outside Similar: No
Score: 111Result: Low
Species Detected Spores/m3<100 1K 10K >100K
Alternaria 27Cladosporium 53
Penicillium/Aspergillus types 53Total 133
Location: 20803001-TM27ME% of outdoor total
spores/m3Friedman chi-
square*(indoor variation)
Agreement ratio**(indoor/outdoor)
Spearman rank correlation***
(indoor/outdoor)
MoldSCORE****(indoor/outdoor)
Result: 2% dF: 31Result: 10.0000
Critical value: N/AInside Similar: N/A
Result: 0.2000 dF: 9Result: 0.5083
Critical value: 0.5833Outside Similar: No
Score: 114Result: Low
Species Detected Spores/m3<100 1K 10K >100K
Penicillium/Aspergillus types 107Total 107
Location: 20803001-TM28ME% of outdoor total
spores/m3Friedman chi-
square*(indoor variation)
Agreement ratio**(indoor/outdoor)
Spearman rank correlation***
(indoor/outdoor)
MoldSCORE****(indoor/outdoor)
Result: 2% dF: 31Result: 10.0000
Critical value: N/AInside Similar: N/A
Result: 0.2000 dF: 9Result: 0.5083
Critical value: 0.5833Outside Similar: No
Score: 114Result: Low
Species Detected Spores/m3<100 1K 10K >100K
Penicillium/Aspergillus types 107Total 107
EMLab ID: 396775, Page 10 of 13© 2008 EMLab P&K

EMLab P&K11720 North Creek Pkwy N, #400, Bothell, WA 98011(650) 829-5800 Fax (650) 829-5852 www.emlab.com
Client: Hygiene Technologies International, Inc.: Northern CaliforniaC/O: Mr. Wes FreyRe: 20803001
Date of Sampling: 03-07-2008Date of Receipt: 03-07-2008Date of Report: 03-10-2008
MoldSTAT™: Supplementary Statistical Spore Trap ReportLocation: 20803001-TM29ME% of outdoor total
spores/m3Friedman chi-
square*(indoor variation)
Agreement ratio**(indoor/outdoor)
Spearman rank correlation***
(indoor/outdoor)
MoldSCORE****(indoor/outdoor)
Result: 3% dF: 31Result: 10.0000
Critical value: N/AInside Similar: N/A
Result: 0.5000 dF: 9Result: 0.3083
Critical value: 0.5833Outside Similar: No
Score: 113Result: Low
Species Detected Spores/m3<100 1K 10K >100K
Ascospores 13Penicillium/Aspergillus types 107
Rusts 13Total 133
Location: 20803001-TM30ME% of outdoor total
spores/m3Friedman chi-
square*(indoor variation)
Agreement ratio**(indoor/outdoor)
Spearman rank correlation***
(indoor/outdoor)
MoldSCORE****(indoor/outdoor)
Result: < 1% dF: 31Result: 10.0000
Critical value: N/AInside Similar: N/A
Result: 0.2000 dF: 9Result: 0.3583
Critical value: 0.5833Outside Similar: No
Score: 103Result: Low
Species Detected Spores/m3<100 1K 10K >100K
Smuts, Periconia, Myxomycetes 13Total 13
Location: 20803001-TM31ME% of outdoor total
spores/m3Friedman chi-
square*(indoor variation)
Agreement ratio**(indoor/outdoor)
Spearman rank correlation***
(indoor/outdoor)
MoldSCORE****(indoor/outdoor)
Result: 10% dF: 31Result: 10.0000
Critical value: N/AInside Similar: N/A
Result: 0.5000 dF: 9Result: 0.8333
Critical value: 0.5833Outside Similar: Yes
Score: 112Result: Low
Species Detected Spores/m3<100 1K 10K >100K
Basidiospores 53Cladosporium 280
Penicillium/Aspergillus types 53Total 386
EMLab ID: 396775, Page 11 of 13© 2008 EMLab P&K

EMLab P&K11720 North Creek Pkwy N, #400, Bothell, WA 98011(650) 829-5800 Fax (650) 829-5852 www.emlab.com
Client: Hygiene Technologies International, Inc.: Northern CaliforniaC/O: Mr. Wes FreyRe: 20803001
Date of Sampling: 03-07-2008Date of Receipt: 03-07-2008Date of Report: 03-10-2008
MoldSTAT™: Supplementary Statistical Spore Trap ReportLocation: 20803001-TM32ME% of outdoor total
spores/m3Friedman chi-
square*(indoor variation)
Agreement ratio**(indoor/outdoor)
Spearman rank correlation***
(indoor/outdoor)
MoldSCORE****(indoor/outdoor)
Result: < 1% dF: 31Result: 10.0000
Critical value: N/AInside Similar: N/A
Result: 0.0000 dF: N/AResult: N/A
Critical value: N/AOutside Similar: N/A
Score: 100Result: Low
Species Detected Spores/m3<100 1K 10K >100K
None Detected N/A
Location: 20803001-TM33ME% of outdoor total
spores/m3Friedman chi-
square*(indoor variation)
Agreement ratio**(indoor/outdoor)
Spearman rank correlation***
(indoor/outdoor)
MoldSCORE****(indoor/outdoor)
Result: 3% dF: 31Result: 10.0000
Critical value: N/AInside Similar: N/A
Result: 0.5000 dF: 9Result: 0.6583
Critical value: 0.5833Outside Similar: Yes
Score: 105Result: Low
Species Detected Spores/m3<100 1K 10K >100K
Basidiospores 53Penicillium/Aspergillus types 53
Smuts, Periconia, Myxomycetes 13Total 119
* The Friedman chi-square statistic is a non-parametric test that examines variation in a set of data (in this case, all indoor spore counts). The null hypothesis (H0) being tested is that there is no meaningful difference in the data for all indoor locations. The alternative hypothesis (used if the test disproves the null hypothesis) is that there is a difference between the indoor locations. The null hypothesis is rejected when the result of the test is greater than the critical value. The critical value that is displayed is based on the degrees of freedom (dF) of the test and a significance level of 0.05.
** An agreement ratio is a simple method for assessing the similarity of two samples (in this case the indoor sample and the outdoor summary) based on the spore types present. A score of one indicates that the types detected in one location are the same as that in the other. A score of zero indicates that none of the types detected indoors are present outdoors. Typically, an agreement of 0.8 or higher is considered high.
*** The Spearman rank correlation is a non-parametric test that examines correlation between two sets of data (in this case the indoor location and the outdoor summary). The null hypothesis (H0) being tested is that the indoor and outdoor samples are unrelated. The alternative hypothesis (used if the test disproves the null hypothesis) is that the samples are similar. The null hypothesis is rejected when the result of the test is greater than the critical value. The critical value that is displayed is based on the degrees of freedom (dF) of the test and a significance level of 0.05.
EMLab ID: 396775, Page 12 of 13© 2008 EMLab P&K

EMLab P&K11720 North Creek Pkwy N, #400, Bothell, WA 98011(650) 829-5800 Fax (650) 829-5852 www.emlab.com
Client: Hygiene Technologies International, Inc.: Northern CaliforniaC/O: Mr. Wes FreyRe: 20803001
Date of Sampling: 03-07-2008Date of Receipt: 03-07-2008Date of Report: 03-10-2008
MoldSTAT™: Supplementary Statistical Spore Trap Report**** MoldSCORE™ is a specialized method for examining air sampling data. It is a score between 100 and 300, with 100 indicating a greater likelihood that the airborne indoor spores originated from the outside, and 300 indicating a greater likelihood that they originated from an inside source. The Result displayed is based on the numeric score given and will be either Low, Medium, or High, indicating a low, medium, or high likelihood that the spores detected originated from an indoor source. EMLab P&Kreserves the right to, and may at anytime, modify or change the MoldScore algorithm without notice.
Interpretation of the data contained in this report is left to the client or the persons who conducted the field work. This report is provided for informational and comparative purposes only and should not be relied upon for any other purpose. "Typical outdoor ranges" are based on the results of the analysis of samples delivered to and analyzed by EMLab P&K and assumptions regarding the origins of those samples. Sampling techniques, contaminants infecting samples, unrepresentative samples and other similar or dissimilar factors may affect these results. With the statistical analysis provided, as with all statistical comparisons and analyses, false-positive and false-negative results can and do occur. EMLab P&K hereby disclaims any liability for any and all direct, indirect, punitive, incidental, special or consequential damages arising out of the data contained in, or any actions taken or omitted in reliance upon, this report.
EMLab ID: 396775, Page 13 of 13© 2008 EMLab P&K

EMLab P&K11720 North Creek Pkwy N, #400, Bothell, WA 98011(650) 829-5800 Fax (650) 829-5852 www.emlab.com
Client: Hygiene Technologies International, Inc.: Northern CaliforniaC/O: Mr. Wes FreyRe: 20803001
Date of Sampling: 03-07-2008Date of Receipt: 03-07-2008Date of Report: 03-10-2008
MoldSCORE™: Spore Trap ReportOutdoor Sample: 20803001-TM01OUTME
Fungi Identified Outdoor sample spores/m3 Raw Spores/<100 1K 10K >100K count m3
Generally able to grow indoors*Alternaria 1 13Bipolaris/Drechslera group ND < 13Chaetomium ND < 13Cladosporium 3 160Curvularia ND < 13Epicoccum 1 13Nigrospora ND < 13Other brown 1 13Penicillium/Aspergillus types† 10 533Stachybotrys ND < 13Torula ND < 13Seldom found growing indoors**Ascospores†† 8 427Basidiospores†† 14 747Rusts 1 13Smuts, Periconia, Myxomycetes†† 1 13Total 1,932
Location: 20803001-TM02MEFungi Identified Indoor sample spores/m3 Raw Spores/
<100 1K 10K >100K count m3MoldSCORE‡
100 200 300 Score
Generally able to grow indoors*Alternaria ND < 13Bipolaris/Drechslera group ND < 13Chaetomium ND < 13Cladosporium 1 53Curvularia ND < 13Nigrospora ND < 13Penicillium/Aspergillus types† ND < 13Stachybotrys ND < 13Torula ND < 13Seldom found growing indoors**Ascospores†† ND < 13Basidiospores†† 1 53Rusts ND < 13Smuts, Periconia, Myxomycetes†† ND < 13Total 106
100100100103100100100100100
100101100100
Final MoldSCORE 103
EMLab ID: 396775, Page 1 of 17© 2008 EMLab P&K

EMLab P&K11720 North Creek Pkwy N, #400, Bothell, WA 98011(650) 829-5800 Fax (650) 829-5852 www.emlab.com
Client: Hygiene Technologies International, Inc.: Northern CaliforniaC/O: Mr. Wes FreyRe: 20803001
Date of Sampling: 03-07-2008Date of Receipt: 03-07-2008Date of Report: 03-10-2008
MoldSCORE™: Spore Trap ReportLocation: 20803001-TM03ME
Fungi Identified Indoor sample spores/m3 Raw Spores/<100 1K 10K >100K count m3
MoldSCORE‡100 200 300 Score
Generally able to grow indoors*Alternaria ND < 13Bipolaris/Drechslera group ND < 13Chaetomium ND < 13Cladosporium ND < 13Curvularia ND < 13Nigrospora ND < 13Penicillium/Aspergillus types† 1 53Stachybotrys ND < 13Torula ND < 13Seldom found growing indoors**Ascospores†† ND < 13Basidiospores†† ND < 13Oidium 1 13Rusts ND < 13Smuts, Periconia, Myxomycetes†† ND < 13Total 66
100100100100100100106100100
100100105100100
Final MoldSCORE 106
Location: 20803001-TM04MEFungi Identified Indoor sample spores/m3 Raw Spores/
<100 1K 10K >100K count m3MoldSCORE‡
100 200 300 Score
Generally able to grow indoors*Alternaria ND < 13Bipolaris/Drechslera group ND < 13Chaetomium ND < 13Cladosporium ND < 13Curvularia ND < 13Nigrospora ND < 13Other colorless 1 13Penicillium/Aspergillus types† 1 53Stachybotrys ND < 13Torula ND < 13Seldom found growing indoors**Ascospores†† ND < 13Basidiospores†† ND < 13Rusts 1 13Smuts, Periconia, Myxomycetes†† ND < 13Total 79
100100100100100100105105100100
100100105100
Final MoldSCORE 105
EMLab ID: 396775, Page 2 of 17© 2008 EMLab P&K

EMLab P&K11720 North Creek Pkwy N, #400, Bothell, WA 98011(650) 829-5800 Fax (650) 829-5852 www.emlab.com
Client: Hygiene Technologies International, Inc.: Northern CaliforniaC/O: Mr. Wes FreyRe: 20803001
Date of Sampling: 03-07-2008Date of Receipt: 03-07-2008Date of Report: 03-10-2008
MoldSCORE™: Spore Trap ReportLocation: 20803001-TM05ME
Fungi Identified Indoor sample spores/m3 Raw Spores/<100 1K 10K >100K count m3
MoldSCORE‡100 200 300 Score
Generally able to grow indoors*Alternaria 1 13Bipolaris/Drechslera group ND < 13Chaetomium ND < 13Cladosporium 1 53Curvularia ND < 13Nigrospora ND < 13Penicillium/Aspergillus types† 1 53Stachybotrys ND < 13Torula ND < 13Seldom found growing indoors**Ascospores†† ND < 13Basidiospores†† 1 53Rusts ND < 13Smuts, Periconia, Myxomycetes†† ND < 13Total 172
105100100102100100101100100
100100100100
Final MoldSCORE 105
Location: 20803001-TM06MEFungi Identified Indoor sample spores/m3 Raw Spores/
<100 1K 10K >100K count m3MoldSCORE‡
100 200 300 Score
Generally able to grow indoors*Alternaria ND < 13Bipolaris/Drechslera group ND < 13Chaetomium ND < 13Cladosporium ND < 13Curvularia ND < 13Nigrospora ND < 13Penicillium/Aspergillus types† 1 53Stachybotrys ND < 13Torula ND < 13Seldom found growing indoors**Ascospores†† ND < 13Basidiospores†† ND < 13Rusts ND < 13Smuts, Periconia, Myxomycetes†† ND < 13Total 53
100100100100100100106100100
100100100100
Final MoldSCORE 106
EMLab ID: 396775, Page 3 of 17© 2008 EMLab P&K

EMLab P&K11720 North Creek Pkwy N, #400, Bothell, WA 98011(650) 829-5800 Fax (650) 829-5852 www.emlab.com
Client: Hygiene Technologies International, Inc.: Northern CaliforniaC/O: Mr. Wes FreyRe: 20803001
Date of Sampling: 03-07-2008Date of Receipt: 03-07-2008Date of Report: 03-10-2008
MoldSCORE™: Spore Trap ReportLocation: 20803001-TM07ME
Fungi Identified Indoor sample spores/m3 Raw Spores/<100 1K 10K >100K count m3
MoldSCORE‡100 200 300 Score
Generally able to grow indoors*Alternaria ND < 13Bipolaris/Drechslera group ND < 13Chaetomium ND < 13Cladosporium ND < 13Curvularia ND < 13Nigrospora ND < 13Penicillium/Aspergillus types† 1 53Stachybotrys ND < 13Torula ND < 13Seldom found growing indoors**Ascospores†† ND < 13Basidiospores†† 1 53Rusts ND < 13Smuts, Periconia, Myxomycetes†† ND < 13Total 106
100100100100100100104100100
100101100100
Final MoldSCORE 104
Location: 20803001-TM08MEFungi Identified Indoor sample spores/m3 Raw Spores/
<100 1K 10K >100K count m3MoldSCORE‡
100 200 300 Score
Generally able to grow indoors*Alternaria ND < 13Bipolaris/Drechslera group ND < 13Chaetomium ND < 13Cladosporium 1 53Curvularia ND < 13Nigrospora ND < 13Penicillium/Aspergillus types† ND < 13Stachybotrys ND < 13Torula ND < 13Seldom found growing indoors**Ascospores†† ND < 13Basidiospores†† ND < 13Rusts ND < 13Smuts, Periconia, Myxomycetes†† 1 13Total 66
100100100103100100100100100
100100100103
Final MoldSCORE 103
EMLab ID: 396775, Page 4 of 17© 2008 EMLab P&K

EMLab P&K11720 North Creek Pkwy N, #400, Bothell, WA 98011(650) 829-5800 Fax (650) 829-5852 www.emlab.com
Client: Hygiene Technologies International, Inc.: Northern CaliforniaC/O: Mr. Wes FreyRe: 20803001
Date of Sampling: 03-07-2008Date of Receipt: 03-07-2008Date of Report: 03-10-2008
MoldSCORE™: Spore Trap ReportLocation: 20803001-TM09ME
Fungi Identified Indoor sample spores/m3 Raw Spores/<100 1K 10K >100K count m3
MoldSCORE‡100 200 300 Score
Generally able to grow indoors*Alternaria ND < 13Bipolaris/Drechslera group ND < 13Chaetomium ND < 13Cladosporium 1 53Curvularia ND < 13Nigrospora ND < 13Penicillium/Aspergillus types† 2 107Stachybotrys ND < 13Torula ND < 13Seldom found growing indoors**Ascospores†† ND < 13Basidiospores†† ND < 13Rusts ND < 13Smuts, Periconia, Myxomycetes†† ND < 13Total 160
100100100103100100110100100
100100100100
Final MoldSCORE 110
Location: 20803001-TM10MEFungi Identified Indoor sample spores/m3 Raw Spores/
<100 1K 10K >100K count m3MoldSCORE‡
100 200 300 Score
Generally able to grow indoors*Alternaria ND < 13Bipolaris/Drechslera group ND < 13Chaetomium ND < 13Cladosporium ND < 13Curvularia ND < 13Nigrospora ND < 13Penicillium/Aspergillus types† 1 53Stachybotrys ND < 13Torula ND < 13Seldom found growing indoors**Ascospores†† ND < 13Basidiospores†† ND < 13Rusts ND < 13Smuts, Periconia, Myxomycetes†† ND < 13Total 53
100100100100100100106100100
100100100100
Final MoldSCORE 106
EMLab ID: 396775, Page 5 of 17© 2008 EMLab P&K

EMLab P&K11720 North Creek Pkwy N, #400, Bothell, WA 98011(650) 829-5800 Fax (650) 829-5852 www.emlab.com
Client: Hygiene Technologies International, Inc.: Northern CaliforniaC/O: Mr. Wes FreyRe: 20803001
Date of Sampling: 03-07-2008Date of Receipt: 03-07-2008Date of Report: 03-10-2008
MoldSCORE™: Spore Trap ReportLocation: 20803001-TM11ME
Fungi Identified Indoor sample spores/m3 Raw Spores/<100 1K 10K >100K count m3
MoldSCORE‡100 200 300 Score
Generally able to grow indoors*Alternaria ND < 13Bipolaris/Drechslera group ND < 13Chaetomium ND < 13Cladosporium 1 53Curvularia ND < 13Nigrospora ND < 13Penicillium/Aspergillus types† 1 53Stachybotrys ND < 13Torula ND < 13Seldom found growing indoors**Ascospores†† ND < 13Basidiospores†† ND < 13Rusts ND < 13Smuts, Periconia, Myxomycetes†† ND < 13Total 106
100100100103100100104100100
100100100100
Final MoldSCORE 104
Location: 20803001-TM12MEFungi Identified Indoor sample spores/m3 Raw Spores/
<100 1K 10K >100K count m3MoldSCORE‡
100 200 300 Score
Generally able to grow indoors*Alternaria ND < 13Bipolaris/Drechslera group ND < 13Chaetomium ND < 13Cladosporium ND < 13Curvularia ND < 13Nigrospora ND < 13Penicillium/Aspergillus types† 1 53Stachybotrys ND < 13Torula ND < 13Seldom found growing indoors**Ascospores†† ND < 13Basidiospores†† ND < 13Rusts ND < 13Smuts, Periconia, Myxomycetes†† ND < 13Total 53
100100100100100100106100100
100100100100
Final MoldSCORE 106
EMLab ID: 396775, Page 6 of 17© 2008 EMLab P&K

EMLab P&K11720 North Creek Pkwy N, #400, Bothell, WA 98011(650) 829-5800 Fax (650) 829-5852 www.emlab.com
Client: Hygiene Technologies International, Inc.: Northern CaliforniaC/O: Mr. Wes FreyRe: 20803001
Date of Sampling: 03-07-2008Date of Receipt: 03-07-2008Date of Report: 03-10-2008
MoldSCORE™: Spore Trap ReportLocation: 20803001-TM13ME
Fungi Identified Indoor sample spores/m3 Raw Spores/<100 1K 10K >100K count m3
MoldSCORE‡100 200 300 Score
Generally able to grow indoors*Alternaria ND < 13Bipolaris/Drechslera group ND < 13Chaetomium ND < 13Cladosporium 1 53Curvularia ND < 13Nigrospora ND < 13Penicillium/Aspergillus types† 1 53Stachybotrys ND < 13Torula ND < 13Seldom found growing indoors**Ascospores†† ND < 13Basidiospores†† ND < 13Rusts ND < 13Smuts, Periconia, Myxomycetes†† ND < 13Total 106
100100100103100100104100100
100100100100
Final MoldSCORE 104
Location: 20803001-TM14MEFungi Identified Indoor sample spores/m3 Raw Spores/
<100 1K 10K >100K count m3MoldSCORE‡
100 200 300 Score
Generally able to grow indoors*Alternaria ND < 13Bipolaris/Drechslera group ND < 13Chaetomium ND < 13Cladosporium ND < 13Curvularia ND < 13Nigrospora ND < 13Penicillium/Aspergillus types† 1 53Stachybotrys ND < 13Torula ND < 13Seldom found growing indoors**Ascospores†† ND < 13Basidiospores†† 1 53Rusts ND < 13Smuts, Periconia, Myxomycetes†† 1 13Total 119
100100100100100100103100100
100101100102
Final MoldSCORE 103
EMLab ID: 396775, Page 7 of 17© 2008 EMLab P&K

EMLab P&K11720 North Creek Pkwy N, #400, Bothell, WA 98011(650) 829-5800 Fax (650) 829-5852 www.emlab.com
Client: Hygiene Technologies International, Inc.: Northern CaliforniaC/O: Mr. Wes FreyRe: 20803001
Date of Sampling: 03-07-2008Date of Receipt: 03-07-2008Date of Report: 03-10-2008
MoldSCORE™: Spore Trap ReportLocation: 20803001-TM15ME
Fungi Identified Indoor sample spores/m3 Raw Spores/<100 1K 10K >100K count m3
MoldSCORE‡100 200 300 Score
Generally able to grow indoors*Alternaria ND < 13Bipolaris/Drechslera group ND < 13Chaetomium ND < 13Cladosporium 1 53Curvularia ND < 13Nigrospora ND < 13Penicillium/Aspergillus types† ND < 13Stachybotrys ND < 13Torula ND < 13Seldom found growing indoors**Ascospores†† ND < 13Basidiospores†† ND < 13Rusts ND < 13Smuts, Periconia, Myxomycetes†† ND < 13Total 53
100100100103100100100100100
100100100100
Final MoldSCORE 103
Location: 20803001-TM16MEFungi Identified Indoor sample spores/m3 Raw Spores/
<100 1K 10K >100K count m3MoldSCORE‡
100 200 300 Score
Generally able to grow indoors*Alternaria ND < 13Bipolaris/Drechslera group ND < 13Chaetomium ND < 13Cladosporium 1 53Curvularia ND < 13Nigrospora ND < 13Penicillium/Aspergillus types† 1 53Stachybotrys ND < 13Torula ND < 13Seldom found growing indoors**Ascospores†† ND < 13Basidiospores†† ND < 13Rusts ND < 13Smuts, Periconia, Myxomycetes†† 1 13Total 119
100100100103100100103100100
100100100102
Final MoldSCORE 103
EMLab ID: 396775, Page 8 of 17© 2008 EMLab P&K

EMLab P&K11720 North Creek Pkwy N, #400, Bothell, WA 98011(650) 829-5800 Fax (650) 829-5852 www.emlab.com
Client: Hygiene Technologies International, Inc.: Northern CaliforniaC/O: Mr. Wes FreyRe: 20803001
Date of Sampling: 03-07-2008Date of Receipt: 03-07-2008Date of Report: 03-10-2008
MoldSCORE™: Spore Trap ReportLocation: 20803001-TM17ME
Fungi Identified Indoor sample spores/m3 Raw Spores/<100 1K 10K >100K count m3
MoldSCORE‡100 200 300 Score
Generally able to grow indoors*Alternaria ND < 13Bipolaris/Drechslera group ND < 13Chaetomium ND < 13Cladosporium ND < 13Curvularia ND < 13Nigrospora ND < 13Penicillium/Aspergillus types† 1 53Stachybotrys ND < 13Torula ND < 13Seldom found growing indoors**Ascospores†† ND < 13Basidiospores†† ND < 13Rusts ND < 13Smuts, Periconia, Myxomycetes†† ND < 13Total 53
100100100100100100106100100
100100100100
Final MoldSCORE 106
Location: 20803001-TM18MEFungi Identified Indoor sample spores/m3 Raw Spores/
<100 1K 10K >100K count m3MoldSCORE‡
100 200 300 Score
Generally able to grow indoors*Alternaria ND < 13Bipolaris/Drechslera group ND < 13Chaetomium ND < 13Cladosporium ND < 13Curvularia ND < 13Nigrospora ND < 13Penicillium/Aspergillus types† 43 1,210Stachybotrys ND < 13Torula ND < 13Seldom found growing indoors**Ascospores†† ND < 13Basidiospores†† ND < 13Rusts ND < 13Smuts, Periconia, Myxomycetes†† ND < 13Total 1,210
100100100100100100225100100
100100100100
Final MoldSCORE 225
EMLab ID: 396775, Page 9 of 17© 2008 EMLab P&K

EMLab P&K11720 North Creek Pkwy N, #400, Bothell, WA 98011(650) 829-5800 Fax (650) 829-5852 www.emlab.com
Client: Hygiene Technologies International, Inc.: Northern CaliforniaC/O: Mr. Wes FreyRe: 20803001
Date of Sampling: 03-07-2008Date of Receipt: 03-07-2008Date of Report: 03-10-2008
MoldSCORE™: Spore Trap ReportLocation: 20803001-TM19ME
Fungi Identified Indoor sample spores/m3 Raw Spores/<100 1K 10K >100K count m3
MoldSCORE‡100 200 300 Score
Generally able to grow indoors*Alternaria ND < 13Bipolaris/Drechslera group ND < 13Chaetomium ND < 13Cladosporium ND < 13Curvularia ND < 13Nigrospora ND < 13Penicillium/Aspergillus types† 3 160Stachybotrys ND < 13Torula ND < 13Seldom found growing indoors**Ascospores†† ND < 13Basidiospores†† ND < 13Rusts ND < 13Smuts, Periconia, Myxomycetes†† 1 13Total 173
100100100100100100118100100
100100100102
Final MoldSCORE 118
Location: 20803001-TM20MEFungi Identified Indoor sample spores/m3 Raw Spores/
<100 1K 10K >100K count m3MoldSCORE‡
100 200 300 Score
Generally able to grow indoors*Alternaria ND < 13Bipolaris/Drechslera group ND < 13Chaetomium ND < 13Cladosporium ND < 13Curvularia ND < 13Nigrospora ND < 13Penicillium/Aspergillus types† 1 53Stachybotrys ND < 13Torula ND < 13Seldom found growing indoors**Ascospores†† ND < 13Basidiospores†† 1 53Rusts ND < 13Smuts, Periconia, Myxomycetes†† 1 13Total 119
100100100100100100103100100
100101100102
Final MoldSCORE 103
EMLab ID: 396775, Page 10 of 17© 2008 EMLab P&K

EMLab P&K11720 North Creek Pkwy N, #400, Bothell, WA 98011(650) 829-5800 Fax (650) 829-5852 www.emlab.com
Client: Hygiene Technologies International, Inc.: Northern CaliforniaC/O: Mr. Wes FreyRe: 20803001
Date of Sampling: 03-07-2008Date of Receipt: 03-07-2008Date of Report: 03-10-2008
MoldSCORE™: Spore Trap ReportLocation: 20803001-TM21ME
Fungi Identified Indoor sample spores/m3 Raw Spores/<100 1K 10K >100K count m3
MoldSCORE‡100 200 300 Score
Generally able to grow indoors*Alternaria 1 13Bipolaris/Drechslera group ND < 13Chaetomium ND < 13Cladosporium 1 53Curvularia ND < 13Nigrospora ND < 13Penicillium/Aspergillus types† 1 53Stachybotrys ND < 13Torula ND < 13Seldom found growing indoors**Ascospores†† ND < 13Basidiospores†† 1 53Rusts ND < 13Smuts, Periconia, Myxomycetes†† ND < 13Total 172
105100100102100100101100100
100100100100
Final MoldSCORE 105
Location: 20803001-TM22MEFungi Identified Indoor sample spores/m3 Raw Spores/
<100 1K 10K >100K count m3MoldSCORE‡
100 200 300 Score
Generally able to grow indoors*Alternaria ND < 13Bipolaris/Drechslera group ND < 13Chaetomium ND < 13Cladosporium ND < 13Curvularia ND < 13Nigrospora ND < 13Penicillium/Aspergillus types† 1 53Stachybotrys ND < 13Torula ND < 13Seldom found growing indoors**Ascospores†† ND < 13Basidiospores†† ND < 13Rusts ND < 13Smuts, Periconia, Myxomycetes†† ND < 13Total 53
100100100100100100106100100
100100100100
Final MoldSCORE 106
EMLab ID: 396775, Page 11 of 17© 2008 EMLab P&K

EMLab P&K11720 North Creek Pkwy N, #400, Bothell, WA 98011(650) 829-5800 Fax (650) 829-5852 www.emlab.com
Client: Hygiene Technologies International, Inc.: Northern CaliforniaC/O: Mr. Wes FreyRe: 20803001
Date of Sampling: 03-07-2008Date of Receipt: 03-07-2008Date of Report: 03-10-2008
MoldSCORE™: Spore Trap ReportLocation: 20803001-TM23ME
Fungi Identified Indoor sample spores/m3 Raw Spores/<100 1K 10K >100K count m3
MoldSCORE‡100 200 300 Score
Generally able to grow indoors*Alternaria ND < 13Bipolaris/Drechslera group ND < 13Chaetomium ND < 13Cladosporium ND < 13Curvularia ND < 13Nigrospora ND < 13Penicillium/Aspergillus types† ND < 13Stachybotrys ND < 13Torula ND < 13Seldom found growing indoors**Ascospores†† ND < 13Basidiospores†† ND < 13Rusts ND < 13Smuts, Periconia, Myxomycetes†† ND < 13Total N/A
100100100100100100100100100
100100100100
Final MoldSCORE 100
Location: 20803001-TM24MEFungi Identified Indoor sample spores/m3 Raw Spores/
<100 1K 10K >100K count m3MoldSCORE‡
100 200 300 Score
Generally able to grow indoors*Alternaria ND < 13Bipolaris/Drechslera group ND < 13Chaetomium ND < 13Cladosporium ND < 13Curvularia ND < 13Nigrospora ND < 13Other brown 1 13Penicillium/Aspergillus types† 1 53Stachybotrys ND < 13Torula ND < 13Seldom found growing indoors**Ascospores†† ND < 13Basidiospores†† ND < 13Rusts ND < 13Smuts, Periconia, Myxomycetes†† 1 13Total 79
100100100100100100105105100100
100100100102
Final MoldSCORE 107
EMLab ID: 396775, Page 12 of 17© 2008 EMLab P&K

EMLab P&K11720 North Creek Pkwy N, #400, Bothell, WA 98011(650) 829-5800 Fax (650) 829-5852 www.emlab.com
Client: Hygiene Technologies International, Inc.: Northern CaliforniaC/O: Mr. Wes FreyRe: 20803001
Date of Sampling: 03-07-2008Date of Receipt: 03-07-2008Date of Report: 03-10-2008
MoldSCORE™: Spore Trap ReportLocation: 20803001-TM25ME
Fungi Identified Indoor sample spores/m3 Raw Spores/<100 1K 10K >100K count m3
MoldSCORE‡100 200 300 Score
Generally able to grow indoors*Alternaria ND < 13Bipolaris/Drechslera group ND < 13Chaetomium ND < 13Cladosporium 4 213Curvularia ND < 13Nigrospora ND < 13Penicillium/Aspergillus types† 1 53Stachybotrys ND < 13Torula ND < 13Seldom found growing indoors**Ascospores†† ND < 13Basidiospores†† ND < 13Rusts ND < 13Smuts, Periconia, Myxomycetes†† 4 53Total 319
100100100112100100100100100
100100100110
Final MoldSCORE 112
Location: 20803001-TM26MEFungi Identified Indoor sample spores/m3 Raw Spores/
<100 1K 10K >100K count m3MoldSCORE‡
100 200 300 Score
Generally able to grow indoors*Alternaria 2 27Bipolaris/Drechslera group ND < 13Chaetomium ND < 13Cladosporium 1 53Curvularia ND < 13Nigrospora ND < 13Penicillium/Aspergillus types† 1 53Stachybotrys ND < 13Torula ND < 13Seldom found growing indoors**Ascospores†† ND < 13Basidiospores†† ND < 13Rusts ND < 13Smuts, Periconia, Myxomycetes†† ND < 13Total 133
110100100103100100103100100
100100100100
Final MoldSCORE 110
EMLab ID: 396775, Page 13 of 17© 2008 EMLab P&K

EMLab P&K11720 North Creek Pkwy N, #400, Bothell, WA 98011(650) 829-5800 Fax (650) 829-5852 www.emlab.com
Client: Hygiene Technologies International, Inc.: Northern CaliforniaC/O: Mr. Wes FreyRe: 20803001
Date of Sampling: 03-07-2008Date of Receipt: 03-07-2008Date of Report: 03-10-2008
MoldSCORE™: Spore Trap ReportLocation: 20803001-TM27ME
Fungi Identified Indoor sample spores/m3 Raw Spores/<100 1K 10K >100K count m3
MoldSCORE‡100 200 300 Score
Generally able to grow indoors*Alternaria ND < 13Bipolaris/Drechslera group ND < 13Chaetomium ND < 13Cladosporium ND < 13Curvularia ND < 13Nigrospora ND < 13Penicillium/Aspergillus types† 2 107Stachybotrys ND < 13Torula ND < 13Seldom found growing indoors**Ascospores†† ND < 13Basidiospores†† ND < 13Rusts ND < 13Smuts, Periconia, Myxomycetes†† ND < 13Total 107
100100100100100100112100100
100100100100
Final MoldSCORE 112
Location: 20803001-TM28MEFungi Identified Indoor sample spores/m3 Raw Spores/
<100 1K 10K >100K count m3MoldSCORE‡
100 200 300 Score
Generally able to grow indoors*Alternaria ND < 13Bipolaris/Drechslera group ND < 13Chaetomium ND < 13Cladosporium ND < 13Curvularia ND < 13Nigrospora ND < 13Penicillium/Aspergillus types† 2 107Stachybotrys ND < 13Torula ND < 13Seldom found growing indoors**Ascospores†† ND < 13Basidiospores†† ND < 13Rusts ND < 13Smuts, Periconia, Myxomycetes†† ND < 13Total 107
100100100100100100112100100
100100100100
Final MoldSCORE 112
EMLab ID: 396775, Page 14 of 17© 2008 EMLab P&K

EMLab P&K11720 North Creek Pkwy N, #400, Bothell, WA 98011(650) 829-5800 Fax (650) 829-5852 www.emlab.com
Client: Hygiene Technologies International, Inc.: Northern CaliforniaC/O: Mr. Wes FreyRe: 20803001
Date of Sampling: 03-07-2008Date of Receipt: 03-07-2008Date of Report: 03-10-2008
MoldSCORE™: Spore Trap ReportLocation: 20803001-TM29ME
Fungi Identified Indoor sample spores/m3 Raw Spores/<100 1K 10K >100K count m3
MoldSCORE‡100 200 300 Score
Generally able to grow indoors*Alternaria ND < 13Bipolaris/Drechslera group ND < 13Chaetomium ND < 13Cladosporium ND < 13Curvularia ND < 13Nigrospora ND < 13Penicillium/Aspergillus types† 2 107Stachybotrys ND < 13Torula ND < 13Seldom found growing indoors**Ascospores†† 1 13Basidiospores†† ND < 13Rusts 1 13Smuts, Periconia, Myxomycetes†† ND < 13Total 133
100100100100100100111100100
100100105100
Final MoldSCORE 111
Location: 20803001-TM30MEFungi Identified Indoor sample spores/m3 Raw Spores/
<100 1K 10K >100K count m3MoldSCORE‡
100 200 300 Score
Generally able to grow indoors*Alternaria ND < 13Bipolaris/Drechslera group ND < 13Chaetomium ND < 13Cladosporium ND < 13Curvularia ND < 13Nigrospora ND < 13Penicillium/Aspergillus types† ND < 13Stachybotrys ND < 13Torula ND < 13Seldom found growing indoors**Ascospores†† ND < 13Basidiospores†† ND < 13Rusts ND < 13Smuts, Periconia, Myxomycetes†† 1 13Total 13
100100100100100100100100100
100100100103
Final MoldSCORE 103
EMLab ID: 396775, Page 15 of 17© 2008 EMLab P&K

EMLab P&K11720 North Creek Pkwy N, #400, Bothell, WA 98011(650) 829-5800 Fax (650) 829-5852 www.emlab.com
Client: Hygiene Technologies International, Inc.: Northern CaliforniaC/O: Mr. Wes FreyRe: 20803001
Date of Sampling: 03-07-2008Date of Receipt: 03-07-2008Date of Report: 03-10-2008
MoldSCORE™: Spore Trap ReportLocation: 20803001-TM31ME
Fungi Identified Indoor sample spores/m3 Raw Spores/<100 1K 10K >100K count m3
MoldSCORE‡100 200 300 Score
Generally able to grow indoors*Alternaria ND < 13Bipolaris/Drechslera group ND < 13Chaetomium ND < 13Cladosporium 21 280Curvularia ND < 13Nigrospora ND < 13Penicillium/Aspergillus types† 1 53Stachybotrys ND < 13Torula ND < 13Seldom found growing indoors**Ascospores†† ND < 13Basidiospores†† 1 53Rusts ND < 13Smuts, Periconia, Myxomycetes†† ND < 13Total 386
100100100116100100100100100
100100100100
Final MoldSCORE 116
Location: 20803001-TM32MEFungi Identified Indoor sample spores/m3 Raw Spores/
<100 1K 10K >100K count m3MoldSCORE‡
100 200 300 Score
Generally able to grow indoors*Alternaria ND < 13Bipolaris/Drechslera group ND < 13Chaetomium ND < 13Cladosporium ND < 13Curvularia ND < 13Nigrospora ND < 13Penicillium/Aspergillus types† ND < 13Stachybotrys ND < 13Torula ND < 13Seldom found growing indoors**Ascospores†† ND < 13Basidiospores†† ND < 13Rusts ND < 13Smuts, Periconia, Myxomycetes†† ND < 13Total N/A
100100100100100100100100100
100100100100
Final MoldSCORE 100
EMLab ID: 396775, Page 16 of 17© 2008 EMLab P&K

EMLab P&K11720 North Creek Pkwy N, #400, Bothell, WA 98011(650) 829-5800 Fax (650) 829-5852 www.emlab.com
Client: Hygiene Technologies International, Inc.: Northern CaliforniaC/O: Mr. Wes FreyRe: 20803001
Date of Sampling: 03-07-2008Date of Receipt: 03-07-2008Date of Report: 03-10-2008
MoldSCORE™: Spore Trap ReportLocation: 20803001-TM33ME
Fungi Identified Indoor sample spores/m3 Raw Spores/<100 1K 10K >100K count m3
MoldSCORE‡100 200 300 Score
Generally able to grow indoors*Alternaria ND < 13Bipolaris/Drechslera group ND < 13Chaetomium ND < 13Cladosporium ND < 13Curvularia ND < 13Nigrospora ND < 13Penicillium/Aspergillus types† 1 53Stachybotrys ND < 13Torula ND < 13Seldom found growing indoors**Ascospores†† ND < 13Basidiospores†† 1 53Rusts ND < 13Smuts, Periconia, Myxomycetes†† 1 13Total 119
100100100100100100103100100
100101100102
Final MoldSCORE 103
*The spores in this category are generally capable of growing on wet building materials in addition to growing outdoors. Building related growth is dependent upon the fungal type, moisture level, type of material, and other factors. Cladosporium is one of the predominant spore types worldwide and is frequently present in high numbers. Penicillium/Aspergillus species colonize both outdoor and indoor wet surfaces rapidly and are very easily dispersed. Other genera are usually present in lesser numbers.
**These fungi are generally not found growing on wet building materials. For example, the rusts and smuts are obligate plant pathogens. However, in each group there are notable exceptions. For example, agents of wood decay are members of the basidiomycetes and high counts ofa single morphological type of basidiospore on an inside sample should be considered significant.
†The spores of Aspergillus and Penicillium (and others such as Acremonium, Paecilomyces) are small and round with very few distinguishing characteristics. They cannot be differentiated by non-viable sampling methods.
††Most of these spore types are not seen with culturable methods (Anderson sampling), although some may appear as non-sporulating fungi. Most of the basidiospores are "mushroom" spores.
‡Rated on a scale from 100 to 300. A rating less than 150 is low and indicates a low probability of spores originating inside. A rating greater than 250 is high and indicates a high probability that the spores originated from inside, presumably from indoor mold growth. A rating between150 and 250 indicates a moderate likelihood of indoor fungal growth. MoldSCORE is NOT intended for wall cavity samples. It is intended for ambient air samples in residences. Using the analysis on other samples (like wall cavity samples) will lead to misleading results.
EMLab ID: 396775, Page 17 of 17© 2008 EMLab P&K
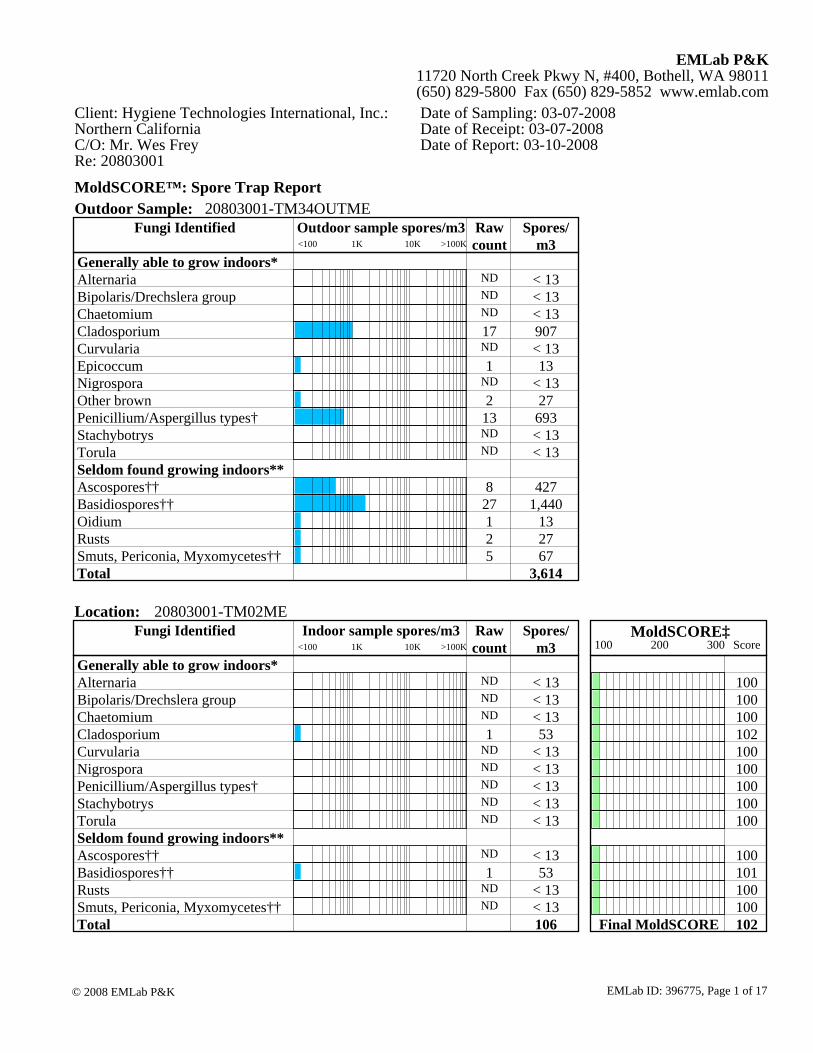
EMLab P&K11720 North Creek Pkwy N, #400, Bothell, WA 98011(650) 829-5800 Fax (650) 829-5852 www.emlab.com
Client: Hygiene Technologies International, Inc.: Northern CaliforniaC/O: Mr. Wes FreyRe: 20803001
Date of Sampling: 03-07-2008Date of Receipt: 03-07-2008Date of Report: 03-10-2008
MoldSCORE™: Spore Trap ReportOutdoor Sample: 20803001-TM34OUTME
Fungi Identified Outdoor sample spores/m3 Raw Spores/<100 1K 10K >100K count m3
Generally able to grow indoors*Alternaria ND < 13Bipolaris/Drechslera group ND < 13Chaetomium ND < 13Cladosporium 17 907Curvularia ND < 13Epicoccum 1 13Nigrospora ND < 13Other brown 2 27Penicillium/Aspergillus types† 13 693Stachybotrys ND < 13Torula ND < 13Seldom found growing indoors**Ascospores†† 8 427Basidiospores†† 27 1,440Oidium 1 13Rusts 2 27Smuts, Periconia, Myxomycetes†† 5 67Total 3,614
Location: 20803001-TM02MEFungi Identified Indoor sample spores/m3 Raw Spores/
<100 1K 10K >100K count m3MoldSCORE‡
100 200 300 Score
Generally able to grow indoors*Alternaria ND < 13Bipolaris/Drechslera group ND < 13Chaetomium ND < 13Cladosporium 1 53Curvularia ND < 13Nigrospora ND < 13Penicillium/Aspergillus types† ND < 13Stachybotrys ND < 13Torula ND < 13Seldom found growing indoors**Ascospores†† ND < 13Basidiospores†† 1 53Rusts ND < 13Smuts, Periconia, Myxomycetes†† ND < 13Total 106
100100100102100100100100100
100101100100
Final MoldSCORE 102
EMLab ID: 396775, Page 1 of 17© 2008 EMLab P&K

EMLab P&K11720 North Creek Pkwy N, #400, Bothell, WA 98011(650) 829-5800 Fax (650) 829-5852 www.emlab.com
Client: Hygiene Technologies International, Inc.: Northern CaliforniaC/O: Mr. Wes FreyRe: 20803001
Date of Sampling: 03-07-2008Date of Receipt: 03-07-2008Date of Report: 03-10-2008
MoldSCORE™: Spore Trap ReportLocation: 20803001-TM03ME
Fungi Identified Indoor sample spores/m3 Raw Spores/<100 1K 10K >100K count m3
MoldSCORE‡100 200 300 Score
Generally able to grow indoors*Alternaria ND < 13Bipolaris/Drechslera group ND < 13Chaetomium ND < 13Cladosporium ND < 13Curvularia ND < 13Nigrospora ND < 13Penicillium/Aspergillus types† 1 53Stachybotrys ND < 13Torula ND < 13Seldom found growing indoors**Ascospores†† ND < 13Basidiospores†† ND < 13Oidium 1 13Rusts ND < 13Smuts, Periconia, Myxomycetes†† ND < 13Total 66
100100100100100100106100100
100100105100100
Final MoldSCORE 106
Location: 20803001-TM04MEFungi Identified Indoor sample spores/m3 Raw Spores/
<100 1K 10K >100K count m3MoldSCORE‡
100 200 300 Score
Generally able to grow indoors*Alternaria ND < 13Bipolaris/Drechslera group ND < 13Chaetomium ND < 13Cladosporium ND < 13Curvularia ND < 13Nigrospora ND < 13Other colorless 1 13Penicillium/Aspergillus types† 1 53Stachybotrys ND < 13Torula ND < 13Seldom found growing indoors**Ascospores†† ND < 13Basidiospores†† ND < 13Rusts 1 13Smuts, Periconia, Myxomycetes†† ND < 13Total 79
100100100100100100105106100100
100100105100
Final MoldSCORE 106
EMLab ID: 396775, Page 2 of 17© 2008 EMLab P&K

EMLab P&K11720 North Creek Pkwy N, #400, Bothell, WA 98011(650) 829-5800 Fax (650) 829-5852 www.emlab.com
Client: Hygiene Technologies International, Inc.: Northern CaliforniaC/O: Mr. Wes FreyRe: 20803001
Date of Sampling: 03-07-2008Date of Receipt: 03-07-2008Date of Report: 03-10-2008
MoldSCORE™: Spore Trap ReportLocation: 20803001-TM05ME
Fungi Identified Indoor sample spores/m3 Raw Spores/<100 1K 10K >100K count m3
MoldSCORE‡100 200 300 Score
Generally able to grow indoors*Alternaria 1 13Bipolaris/Drechslera group ND < 13Chaetomium ND < 13Cladosporium 1 53Curvularia ND < 13Nigrospora ND < 13Penicillium/Aspergillus types† 1 53Stachybotrys ND < 13Torula ND < 13Seldom found growing indoors**Ascospores†† ND < 13Basidiospores†† 1 53Rusts ND < 13Smuts, Periconia, Myxomycetes†† ND < 13Total 172
105100100101100100103100100
100100100100
Final MoldSCORE 105
Location: 20803001-TM06MEFungi Identified Indoor sample spores/m3 Raw Spores/
<100 1K 10K >100K count m3MoldSCORE‡
100 200 300 Score
Generally able to grow indoors*Alternaria ND < 13Bipolaris/Drechslera group ND < 13Chaetomium ND < 13Cladosporium ND < 13Curvularia ND < 13Nigrospora ND < 13Penicillium/Aspergillus types† 1 53Stachybotrys ND < 13Torula ND < 13Seldom found growing indoors**Ascospores†† ND < 13Basidiospores†† ND < 13Rusts ND < 13Smuts, Periconia, Myxomycetes†† ND < 13Total 53
100100100100100100107100100
100100100100
Final MoldSCORE 107
EMLab ID: 396775, Page 3 of 17© 2008 EMLab P&K

EMLab P&K11720 North Creek Pkwy N, #400, Bothell, WA 98011(650) 829-5800 Fax (650) 829-5852 www.emlab.com
Client: Hygiene Technologies International, Inc.: Northern CaliforniaC/O: Mr. Wes FreyRe: 20803001
Date of Sampling: 03-07-2008Date of Receipt: 03-07-2008Date of Report: 03-10-2008
MoldSCORE™: Spore Trap ReportLocation: 20803001-TM07ME
Fungi Identified Indoor sample spores/m3 Raw Spores/<100 1K 10K >100K count m3
MoldSCORE‡100 200 300 Score
Generally able to grow indoors*Alternaria ND < 13Bipolaris/Drechslera group ND < 13Chaetomium ND < 13Cladosporium ND < 13Curvularia ND < 13Nigrospora ND < 13Penicillium/Aspergillus types† 1 53Stachybotrys ND < 13Torula ND < 13Seldom found growing indoors**Ascospores†† ND < 13Basidiospores†† 1 53Rusts ND < 13Smuts, Periconia, Myxomycetes†† ND < 13Total 106
100100100100100100105100100
100101100100
Final MoldSCORE 105
Location: 20803001-TM08MEFungi Identified Indoor sample spores/m3 Raw Spores/
<100 1K 10K >100K count m3MoldSCORE‡
100 200 300 Score
Generally able to grow indoors*Alternaria ND < 13Bipolaris/Drechslera group ND < 13Chaetomium ND < 13Cladosporium 1 53Curvularia ND < 13Nigrospora ND < 13Penicillium/Aspergillus types† ND < 13Stachybotrys ND < 13Torula ND < 13Seldom found growing indoors**Ascospores†† ND < 13Basidiospores†† ND < 13Rusts ND < 13Smuts, Periconia, Myxomycetes†† 1 13Total 66
100100100102100100100100100
100100100102
Final MoldSCORE 102
EMLab ID: 396775, Page 4 of 17© 2008 EMLab P&K

EMLab P&K11720 North Creek Pkwy N, #400, Bothell, WA 98011(650) 829-5800 Fax (650) 829-5852 www.emlab.com
Client: Hygiene Technologies International, Inc.: Northern CaliforniaC/O: Mr. Wes FreyRe: 20803001
Date of Sampling: 03-07-2008Date of Receipt: 03-07-2008Date of Report: 03-10-2008
MoldSCORE™: Spore Trap ReportLocation: 20803001-TM09ME
Fungi Identified Indoor sample spores/m3 Raw Spores/<100 1K 10K >100K count m3
MoldSCORE‡100 200 300 Score
Generally able to grow indoors*Alternaria ND < 13Bipolaris/Drechslera group ND < 13Chaetomium ND < 13Cladosporium 1 53Curvularia ND < 13Nigrospora ND < 13Penicillium/Aspergillus types† 2 107Stachybotrys ND < 13Torula ND < 13Seldom found growing indoors**Ascospores†† ND < 13Basidiospores†† ND < 13Rusts ND < 13Smuts, Periconia, Myxomycetes†† ND < 13Total 160
100100100101100100112100100
100100100100
Final MoldSCORE 112
Location: 20803001-TM10MEFungi Identified Indoor sample spores/m3 Raw Spores/
<100 1K 10K >100K count m3MoldSCORE‡
100 200 300 Score
Generally able to grow indoors*Alternaria ND < 13Bipolaris/Drechslera group ND < 13Chaetomium ND < 13Cladosporium ND < 13Curvularia ND < 13Nigrospora ND < 13Penicillium/Aspergillus types† 1 53Stachybotrys ND < 13Torula ND < 13Seldom found growing indoors**Ascospores†† ND < 13Basidiospores†† ND < 13Rusts ND < 13Smuts, Periconia, Myxomycetes†† ND < 13Total 53
100100100100100100107100100
100100100100
Final MoldSCORE 107
EMLab ID: 396775, Page 5 of 17© 2008 EMLab P&K

EMLab P&K11720 North Creek Pkwy N, #400, Bothell, WA 98011(650) 829-5800 Fax (650) 829-5852 www.emlab.com
Client: Hygiene Technologies International, Inc.: Northern CaliforniaC/O: Mr. Wes FreyRe: 20803001
Date of Sampling: 03-07-2008Date of Receipt: 03-07-2008Date of Report: 03-10-2008
MoldSCORE™: Spore Trap ReportLocation: 20803001-TM11ME
Fungi Identified Indoor sample spores/m3 Raw Spores/<100 1K 10K >100K count m3
MoldSCORE‡100 200 300 Score
Generally able to grow indoors*Alternaria ND < 13Bipolaris/Drechslera group ND < 13Chaetomium ND < 13Cladosporium 1 53Curvularia ND < 13Nigrospora ND < 13Penicillium/Aspergillus types† 1 53Stachybotrys ND < 13Torula ND < 13Seldom found growing indoors**Ascospores†† ND < 13Basidiospores†† ND < 13Rusts ND < 13Smuts, Periconia, Myxomycetes†† ND < 13Total 106
100100100102100100105100100
100100100100
Final MoldSCORE 105
Location: 20803001-TM12MEFungi Identified Indoor sample spores/m3 Raw Spores/
<100 1K 10K >100K count m3MoldSCORE‡
100 200 300 Score
Generally able to grow indoors*Alternaria ND < 13Bipolaris/Drechslera group ND < 13Chaetomium ND < 13Cladosporium ND < 13Curvularia ND < 13Nigrospora ND < 13Penicillium/Aspergillus types† 1 53Stachybotrys ND < 13Torula ND < 13Seldom found growing indoors**Ascospores†† ND < 13Basidiospores†† ND < 13Rusts ND < 13Smuts, Periconia, Myxomycetes†† ND < 13Total 53
100100100100100100107100100
100100100100
Final MoldSCORE 107
EMLab ID: 396775, Page 6 of 17© 2008 EMLab P&K

EMLab P&K11720 North Creek Pkwy N, #400, Bothell, WA 98011(650) 829-5800 Fax (650) 829-5852 www.emlab.com
Client: Hygiene Technologies International, Inc.: Northern CaliforniaC/O: Mr. Wes FreyRe: 20803001
Date of Sampling: 03-07-2008Date of Receipt: 03-07-2008Date of Report: 03-10-2008
MoldSCORE™: Spore Trap ReportLocation: 20803001-TM13ME
Fungi Identified Indoor sample spores/m3 Raw Spores/<100 1K 10K >100K count m3
MoldSCORE‡100 200 300 Score
Generally able to grow indoors*Alternaria ND < 13Bipolaris/Drechslera group ND < 13Chaetomium ND < 13Cladosporium 1 53Curvularia ND < 13Nigrospora ND < 13Penicillium/Aspergillus types† 1 53Stachybotrys ND < 13Torula ND < 13Seldom found growing indoors**Ascospores†† ND < 13Basidiospores†† ND < 13Rusts ND < 13Smuts, Periconia, Myxomycetes†† ND < 13Total 106
100100100102100100105100100
100100100100
Final MoldSCORE 105
Location: 20803001-TM14MEFungi Identified Indoor sample spores/m3 Raw Spores/
<100 1K 10K >100K count m3MoldSCORE‡
100 200 300 Score
Generally able to grow indoors*Alternaria ND < 13Bipolaris/Drechslera group ND < 13Chaetomium ND < 13Cladosporium ND < 13Curvularia ND < 13Nigrospora ND < 13Penicillium/Aspergillus types† 1 53Stachybotrys ND < 13Torula ND < 13Seldom found growing indoors**Ascospores†† ND < 13Basidiospores†† 1 53Rusts ND < 13Smuts, Periconia, Myxomycetes†† 1 13Total 119
100100100100100100105100100
100101100102
Final MoldSCORE 105
EMLab ID: 396775, Page 7 of 17© 2008 EMLab P&K

EMLab P&K11720 North Creek Pkwy N, #400, Bothell, WA 98011(650) 829-5800 Fax (650) 829-5852 www.emlab.com
Client: Hygiene Technologies International, Inc.: Northern CaliforniaC/O: Mr. Wes FreyRe: 20803001
Date of Sampling: 03-07-2008Date of Receipt: 03-07-2008Date of Report: 03-10-2008
MoldSCORE™: Spore Trap ReportLocation: 20803001-TM15ME
Fungi Identified Indoor sample spores/m3 Raw Spores/<100 1K 10K >100K count m3
MoldSCORE‡100 200 300 Score
Generally able to grow indoors*Alternaria ND < 13Bipolaris/Drechslera group ND < 13Chaetomium ND < 13Cladosporium 1 53Curvularia ND < 13Nigrospora ND < 13Penicillium/Aspergillus types† ND < 13Stachybotrys ND < 13Torula ND < 13Seldom found growing indoors**Ascospores†† ND < 13Basidiospores†† ND < 13Rusts ND < 13Smuts, Periconia, Myxomycetes†† ND < 13Total 53
100100100103100100100100100
100100100100
Final MoldSCORE 103
Location: 20803001-TM16MEFungi Identified Indoor sample spores/m3 Raw Spores/
<100 1K 10K >100K count m3MoldSCORE‡
100 200 300 Score
Generally able to grow indoors*Alternaria ND < 13Bipolaris/Drechslera group ND < 13Chaetomium ND < 13Cladosporium 1 53Curvularia ND < 13Nigrospora ND < 13Penicillium/Aspergillus types† 1 53Stachybotrys ND < 13Torula ND < 13Seldom found growing indoors**Ascospores†† ND < 13Basidiospores†† ND < 13Rusts ND < 13Smuts, Periconia, Myxomycetes†† 1 13Total 119
100100100101100100105100100
100100100102
Final MoldSCORE 105
EMLab ID: 396775, Page 8 of 17© 2008 EMLab P&K

EMLab P&K11720 North Creek Pkwy N, #400, Bothell, WA 98011(650) 829-5800 Fax (650) 829-5852 www.emlab.com
Client: Hygiene Technologies International, Inc.: Northern CaliforniaC/O: Mr. Wes FreyRe: 20803001
Date of Sampling: 03-07-2008Date of Receipt: 03-07-2008Date of Report: 03-10-2008
MoldSCORE™: Spore Trap ReportLocation: 20803001-TM17ME
Fungi Identified Indoor sample spores/m3 Raw Spores/<100 1K 10K >100K count m3
MoldSCORE‡100 200 300 Score
Generally able to grow indoors*Alternaria ND < 13Bipolaris/Drechslera group ND < 13Chaetomium ND < 13Cladosporium ND < 13Curvularia ND < 13Nigrospora ND < 13Penicillium/Aspergillus types† 1 53Stachybotrys ND < 13Torula ND < 13Seldom found growing indoors**Ascospores†† ND < 13Basidiospores†† ND < 13Rusts ND < 13Smuts, Periconia, Myxomycetes†† ND < 13Total 53
100100100100100100107100100
100100100100
Final MoldSCORE 107
Location: 20803001-TM18MEFungi Identified Indoor sample spores/m3 Raw Spores/
<100 1K 10K >100K count m3MoldSCORE‡
100 200 300 Score
Generally able to grow indoors*Alternaria ND < 13Bipolaris/Drechslera group ND < 13Chaetomium ND < 13Cladosporium ND < 13Curvularia ND < 13Nigrospora ND < 13Penicillium/Aspergillus types† 43 1,210Stachybotrys ND < 13Torula ND < 13Seldom found growing indoors**Ascospores†† ND < 13Basidiospores†† ND < 13Rusts ND < 13Smuts, Periconia, Myxomycetes†† ND < 13Total 1,210
100100100100100100234100100
100100100100
Final MoldSCORE 234
EMLab ID: 396775, Page 9 of 17© 2008 EMLab P&K

EMLab P&K11720 North Creek Pkwy N, #400, Bothell, WA 98011(650) 829-5800 Fax (650) 829-5852 www.emlab.com
Client: Hygiene Technologies International, Inc.: Northern CaliforniaC/O: Mr. Wes FreyRe: 20803001
Date of Sampling: 03-07-2008Date of Receipt: 03-07-2008Date of Report: 03-10-2008
MoldSCORE™: Spore Trap ReportLocation: 20803001-TM19ME
Fungi Identified Indoor sample spores/m3 Raw Spores/<100 1K 10K >100K count m3
MoldSCORE‡100 200 300 Score
Generally able to grow indoors*Alternaria ND < 13Bipolaris/Drechslera group ND < 13Chaetomium ND < 13Cladosporium ND < 13Curvularia ND < 13Nigrospora ND < 13Penicillium/Aspergillus types† 3 160Stachybotrys ND < 13Torula ND < 13Seldom found growing indoors**Ascospores†† ND < 13Basidiospores†† ND < 13Rusts ND < 13Smuts, Periconia, Myxomycetes†† 1 13Total 173
100100100100100100120100100
100100100102
Final MoldSCORE 120
Location: 20803001-TM20MEFungi Identified Indoor sample spores/m3 Raw Spores/
<100 1K 10K >100K count m3MoldSCORE‡
100 200 300 Score
Generally able to grow indoors*Alternaria ND < 13Bipolaris/Drechslera group ND < 13Chaetomium ND < 13Cladosporium ND < 13Curvularia ND < 13Nigrospora ND < 13Penicillium/Aspergillus types† 1 53Stachybotrys ND < 13Torula ND < 13Seldom found growing indoors**Ascospores†† ND < 13Basidiospores†† 1 53Rusts ND < 13Smuts, Periconia, Myxomycetes†† 1 13Total 119
100100100100100100105100100
100101100102
Final MoldSCORE 105
EMLab ID: 396775, Page 10 of 17© 2008 EMLab P&K

EMLab P&K11720 North Creek Pkwy N, #400, Bothell, WA 98011(650) 829-5800 Fax (650) 829-5852 www.emlab.com
Client: Hygiene Technologies International, Inc.: Northern CaliforniaC/O: Mr. Wes FreyRe: 20803001
Date of Sampling: 03-07-2008Date of Receipt: 03-07-2008Date of Report: 03-10-2008
MoldSCORE™: Spore Trap ReportLocation: 20803001-TM21ME
Fungi Identified Indoor sample spores/m3 Raw Spores/<100 1K 10K >100K count m3
MoldSCORE‡100 200 300 Score
Generally able to grow indoors*Alternaria 1 13Bipolaris/Drechslera group ND < 13Chaetomium ND < 13Cladosporium 1 53Curvularia ND < 13Nigrospora ND < 13Penicillium/Aspergillus types† 1 53Stachybotrys ND < 13Torula ND < 13Seldom found growing indoors**Ascospores†† ND < 13Basidiospores†† 1 53Rusts ND < 13Smuts, Periconia, Myxomycetes†† ND < 13Total 172
105100100101100100103100100
100100100100
Final MoldSCORE 105
Location: 20803001-TM22MEFungi Identified Indoor sample spores/m3 Raw Spores/
<100 1K 10K >100K count m3MoldSCORE‡
100 200 300 Score
Generally able to grow indoors*Alternaria ND < 13Bipolaris/Drechslera group ND < 13Chaetomium ND < 13Cladosporium ND < 13Curvularia ND < 13Nigrospora ND < 13Penicillium/Aspergillus types† 1 53Stachybotrys ND < 13Torula ND < 13Seldom found growing indoors**Ascospores†† ND < 13Basidiospores†† ND < 13Rusts ND < 13Smuts, Periconia, Myxomycetes†† ND < 13Total 53
100100100100100100107100100
100100100100
Final MoldSCORE 107
EMLab ID: 396775, Page 11 of 17© 2008 EMLab P&K

EMLab P&K11720 North Creek Pkwy N, #400, Bothell, WA 98011(650) 829-5800 Fax (650) 829-5852 www.emlab.com
Client: Hygiene Technologies International, Inc.: Northern CaliforniaC/O: Mr. Wes FreyRe: 20803001
Date of Sampling: 03-07-2008Date of Receipt: 03-07-2008Date of Report: 03-10-2008
MoldSCORE™: Spore Trap ReportLocation: 20803001-TM23ME
Fungi Identified Indoor sample spores/m3 Raw Spores/<100 1K 10K >100K count m3
MoldSCORE‡100 200 300 Score
Generally able to grow indoors*Alternaria ND < 13Bipolaris/Drechslera group ND < 13Chaetomium ND < 13Cladosporium ND < 13Curvularia ND < 13Nigrospora ND < 13Penicillium/Aspergillus types† ND < 13Stachybotrys ND < 13Torula ND < 13Seldom found growing indoors**Ascospores†† ND < 13Basidiospores†† ND < 13Rusts ND < 13Smuts, Periconia, Myxomycetes†† ND < 13Total N/A
100100100100100100100100100
100100100100
Final MoldSCORE 100
Location: 20803001-TM24MEFungi Identified Indoor sample spores/m3 Raw Spores/
<100 1K 10K >100K count m3MoldSCORE‡
100 200 300 Score
Generally able to grow indoors*Alternaria ND < 13Bipolaris/Drechslera group ND < 13Chaetomium ND < 13Cladosporium ND < 13Curvularia ND < 13Nigrospora ND < 13Other brown 1 13Penicillium/Aspergillus types† 1 53Stachybotrys ND < 13Torula ND < 13Seldom found growing indoors**Ascospores†† ND < 13Basidiospores†† ND < 13Rusts ND < 13Smuts, Periconia, Myxomycetes†† 1 13Total 79
100100100100100100105106100100
100100100102
Final MoldSCORE 107
EMLab ID: 396775, Page 12 of 17© 2008 EMLab P&K

EMLab P&K11720 North Creek Pkwy N, #400, Bothell, WA 98011(650) 829-5800 Fax (650) 829-5852 www.emlab.com
Client: Hygiene Technologies International, Inc.: Northern CaliforniaC/O: Mr. Wes FreyRe: 20803001
Date of Sampling: 03-07-2008Date of Receipt: 03-07-2008Date of Report: 03-10-2008
MoldSCORE™: Spore Trap ReportLocation: 20803001-TM25ME
Fungi Identified Indoor sample spores/m3 Raw Spores/<100 1K 10K >100K count m3
MoldSCORE‡100 200 300 Score
Generally able to grow indoors*Alternaria ND < 13Bipolaris/Drechslera group ND < 13Chaetomium ND < 13Cladosporium 4 213Curvularia ND < 13Nigrospora ND < 13Penicillium/Aspergillus types† 1 53Stachybotrys ND < 13Torula ND < 13Seldom found growing indoors**Ascospores†† ND < 13Basidiospores†† ND < 13Rusts ND < 13Smuts, Periconia, Myxomycetes†† 4 53Total 319
100100100108100100100100100
100100100109
Final MoldSCORE 109
Location: 20803001-TM26MEFungi Identified Indoor sample spores/m3 Raw Spores/
<100 1K 10K >100K count m3MoldSCORE‡
100 200 300 Score
Generally able to grow indoors*Alternaria 2 27Bipolaris/Drechslera group ND < 13Chaetomium ND < 13Cladosporium 1 53Curvularia ND < 13Nigrospora ND < 13Penicillium/Aspergillus types† 1 53Stachybotrys ND < 13Torula ND < 13Seldom found growing indoors**Ascospores†† ND < 13Basidiospores†† ND < 13Rusts ND < 13Smuts, Periconia, Myxomycetes†† ND < 13Total 133
111100100101100100104100100
100100100100
Final MoldSCORE 111
EMLab ID: 396775, Page 13 of 17© 2008 EMLab P&K

EMLab P&K11720 North Creek Pkwy N, #400, Bothell, WA 98011(650) 829-5800 Fax (650) 829-5852 www.emlab.com
Client: Hygiene Technologies International, Inc.: Northern CaliforniaC/O: Mr. Wes FreyRe: 20803001
Date of Sampling: 03-07-2008Date of Receipt: 03-07-2008Date of Report: 03-10-2008
MoldSCORE™: Spore Trap ReportLocation: 20803001-TM27ME
Fungi Identified Indoor sample spores/m3 Raw Spores/<100 1K 10K >100K count m3
MoldSCORE‡100 200 300 Score
Generally able to grow indoors*Alternaria ND < 13Bipolaris/Drechslera group ND < 13Chaetomium ND < 13Cladosporium ND < 13Curvularia ND < 13Nigrospora ND < 13Penicillium/Aspergillus types† 2 107Stachybotrys ND < 13Torula ND < 13Seldom found growing indoors**Ascospores†† ND < 13Basidiospores†† ND < 13Rusts ND < 13Smuts, Periconia, Myxomycetes†† ND < 13Total 107
100100100100100100114100100
100100100100
Final MoldSCORE 114
Location: 20803001-TM28MEFungi Identified Indoor sample spores/m3 Raw Spores/
<100 1K 10K >100K count m3MoldSCORE‡
100 200 300 Score
Generally able to grow indoors*Alternaria ND < 13Bipolaris/Drechslera group ND < 13Chaetomium ND < 13Cladosporium ND < 13Curvularia ND < 13Nigrospora ND < 13Penicillium/Aspergillus types† 2 107Stachybotrys ND < 13Torula ND < 13Seldom found growing indoors**Ascospores†† ND < 13Basidiospores†† ND < 13Rusts ND < 13Smuts, Periconia, Myxomycetes†† ND < 13Total 107
100100100100100100114100100
100100100100
Final MoldSCORE 114
EMLab ID: 396775, Page 14 of 17© 2008 EMLab P&K

EMLab P&K11720 North Creek Pkwy N, #400, Bothell, WA 98011(650) 829-5800 Fax (650) 829-5852 www.emlab.com
Client: Hygiene Technologies International, Inc.: Northern CaliforniaC/O: Mr. Wes FreyRe: 20803001
Date of Sampling: 03-07-2008Date of Receipt: 03-07-2008Date of Report: 03-10-2008
MoldSCORE™: Spore Trap ReportLocation: 20803001-TM29ME
Fungi Identified Indoor sample spores/m3 Raw Spores/<100 1K 10K >100K count m3
MoldSCORE‡100 200 300 Score
Generally able to grow indoors*Alternaria ND < 13Bipolaris/Drechslera group ND < 13Chaetomium ND < 13Cladosporium ND < 13Curvularia ND < 13Nigrospora ND < 13Penicillium/Aspergillus types† 2 107Stachybotrys ND < 13Torula ND < 13Seldom found growing indoors**Ascospores†† 1 13Basidiospores†† ND < 13Rusts 1 13Smuts, Periconia, Myxomycetes†† ND < 13Total 133
100100100100100100113100100
100100105100
Final MoldSCORE 113
Location: 20803001-TM30MEFungi Identified Indoor sample spores/m3 Raw Spores/
<100 1K 10K >100K count m3MoldSCORE‡
100 200 300 Score
Generally able to grow indoors*Alternaria ND < 13Bipolaris/Drechslera group ND < 13Chaetomium ND < 13Cladosporium ND < 13Curvularia ND < 13Nigrospora ND < 13Penicillium/Aspergillus types† ND < 13Stachybotrys ND < 13Torula ND < 13Seldom found growing indoors**Ascospores†† ND < 13Basidiospores†† ND < 13Rusts ND < 13Smuts, Periconia, Myxomycetes†† 1 13Total 13
100100100100100100100100100
100100100103
Final MoldSCORE 103
EMLab ID: 396775, Page 15 of 17© 2008 EMLab P&K

EMLab P&K11720 North Creek Pkwy N, #400, Bothell, WA 98011(650) 829-5800 Fax (650) 829-5852 www.emlab.com
Client: Hygiene Technologies International, Inc.: Northern CaliforniaC/O: Mr. Wes FreyRe: 20803001
Date of Sampling: 03-07-2008Date of Receipt: 03-07-2008Date of Report: 03-10-2008
MoldSCORE™: Spore Trap ReportLocation: 20803001-TM31ME
Fungi Identified Indoor sample spores/m3 Raw Spores/<100 1K 10K >100K count m3
MoldSCORE‡100 200 300 Score
Generally able to grow indoors*Alternaria ND < 13Bipolaris/Drechslera group ND < 13Chaetomium ND < 13Cladosporium 21 280Curvularia ND < 13Nigrospora ND < 13Penicillium/Aspergillus types† 1 53Stachybotrys ND < 13Torula ND < 13Seldom found growing indoors**Ascospores†† ND < 13Basidiospores†† 1 53Rusts ND < 13Smuts, Periconia, Myxomycetes†† ND < 13Total 386
100100100112100100100100100
100100100100
Final MoldSCORE 112
Location: 20803001-TM32MEFungi Identified Indoor sample spores/m3 Raw Spores/
<100 1K 10K >100K count m3MoldSCORE‡
100 200 300 Score
Generally able to grow indoors*Alternaria ND < 13Bipolaris/Drechslera group ND < 13Chaetomium ND < 13Cladosporium ND < 13Curvularia ND < 13Nigrospora ND < 13Penicillium/Aspergillus types† ND < 13Stachybotrys ND < 13Torula ND < 13Seldom found growing indoors**Ascospores†† ND < 13Basidiospores†† ND < 13Rusts ND < 13Smuts, Periconia, Myxomycetes†† ND < 13Total N/A
100100100100100100100100100
100100100100
Final MoldSCORE 100
EMLab ID: 396775, Page 16 of 17© 2008 EMLab P&K

EMLab P&K11720 North Creek Pkwy N, #400, Bothell, WA 98011(650) 829-5800 Fax (650) 829-5852 www.emlab.com
Client: Hygiene Technologies International, Inc.: Northern CaliforniaC/O: Mr. Wes FreyRe: 20803001
Date of Sampling: 03-07-2008Date of Receipt: 03-07-2008Date of Report: 03-10-2008
MoldSCORE™: Spore Trap ReportLocation: 20803001-TM33ME
Fungi Identified Indoor sample spores/m3 Raw Spores/<100 1K 10K >100K count m3
MoldSCORE‡100 200 300 Score
Generally able to grow indoors*Alternaria ND < 13Bipolaris/Drechslera group ND < 13Chaetomium ND < 13Cladosporium ND < 13Curvularia ND < 13Nigrospora ND < 13Penicillium/Aspergillus types† 1 53Stachybotrys ND < 13Torula ND < 13Seldom found growing indoors**Ascospores†† ND < 13Basidiospores†† 1 53Rusts ND < 13Smuts, Periconia, Myxomycetes†† 1 13Total 119
100100100100100100105100100
100101100102
Final MoldSCORE 105
*The spores in this category are generally capable of growing on wet building materials in addition to growing outdoors. Building related growth is dependent upon the fungal type, moisture level, type of material, and other factors. Cladosporium is one of the predominant spore types worldwide and is frequently present in high numbers. Penicillium/Aspergillus species colonize both outdoor and indoor wet surfaces rapidly and are very easily dispersed. Other genera are usually present in lesser numbers.
**These fungi are generally not found growing on wet building materials. For example, the rusts and smuts are obligate plant pathogens. However, in each group there are notable exceptions. For example, agents of wood decay are members of the basidiomycetes and high counts ofa single morphological type of basidiospore on an inside sample should be considered significant.
†The spores of Aspergillus and Penicillium (and others such as Acremonium, Paecilomyces) are small and round with very few distinguishing characteristics. They cannot be differentiated by non-viable sampling methods.
††Most of these spore types are not seen with culturable methods (Anderson sampling), although some may appear as non-sporulating fungi. Most of the basidiospores are "mushroom" spores.
‡Rated on a scale from 100 to 300. A rating less than 150 is low and indicates a low probability of spores originating inside. A rating greater than 250 is high and indicates a high probability that the spores originated from inside, presumably from indoor mold growth. A rating between150 and 250 indicates a moderate likelihood of indoor fungal growth. MoldSCORE is NOT intended for wall cavity samples. It is intended for ambient air samples in residences. Using the analysis on other samples (like wall cavity samples) will lead to misleading results.
EMLab ID: 396775, Page 17 of 17© 2008 EMLab P&K

EMLab P&K
Approved by:
Lab ManagerDr. Kamashwaran Ramanathan
Report for:
Mr. Wes FreyHygiene Technologies International, Inc.: Northern California3127 Bowen Island StreetWest Sacramento, CA 95691
Regarding: Project: 20803001EML ID: 396775
EMLab P&K
This coversheet is included with your report in order to comply with AIHA and ISO accreditation requirements.
For clarity, we report the number of significant digits as calculated; but, due to the nature of this type of biological data, the number of significant digits that is used for interpretation should generally be one or two. All samples were received in acceptable condition unless noted in the Report Comments portion in the body of the report. Due to the nature of the analyses performed, field blank corrections of results is not a standard practice. The results relate only to the items tested.
EMLab P&K ("the Company") shall have no liability to the client or the client's customer with respect to decisions or recommendations made, actions taken or courses of conduct implemented by either the client or the client's customer as a result of or based upon the Test Results. In no event shall the Company be liable to the client with respect to the Test Results except for the Company's own willful misconduct or gross negligence nor shall the Company be liable for incidental or consequential damages or lost profits or revenues to the fullest extent such liability may be disclaimed by law, even if the Company has been advised of the possibility of such damages, lost profits or lost revenues. In no event shall the Company's liability with respect to the Test Results exceed the amount paid to the Company by the client therefor.
Document Number: 200091 - Revision Number: 5
Dates of Analysis:Culturable air fungi (Incl. Asp spp.): 03-14-2008Spore trap analysis: 03-10-2008
Project SOPs: Culturable air fungi (Incl. Asp spp.) (I100002), Spore trap analysis (I100000)

EMLab P&K1150 Bayhill Drive, Suite 100, San Bruno, CA 94066
(650) 829-5800 Fax (650) 829-5852 www.emlab.comClient: Hygiene Technologies International, Inc.: Northern CaliforniaC/O: Mr. Wes FreyRe: 20803001
Date of Sampling: 03-07-2008Date of Receipt: 03-07-2008Date of Report: 03-14-2008
CULTURABLE AIR FUNGI REPORTLocation: 20803001-
VM01OUTME20803001-VM02ME
20803001-VM03ME
20803001-VM04ME
Comments (see below) A None None None
Lab ID-Version‡: 1743073-1 1743074-1 1743075-1 1743076-1
raw ct. cfu*/m3 raw ct. cfu*/m3 raw ct. cfu*/m3 raw ct. cfu*/m3AcremoniumAlternariaAspergillus flavusAspergillus fumigatus 1 18Aspergillus nidulansAspergillus niger 1 18Aspergillus ochraceusAspergillus versicolorAureobasidiumBasidiomycetesBipolaris/Drechslera groupBotrytisChaetomiumCladosporium 20 371 1 18 1 18CurvulariaEpicoccumFusariumMucorNon-sporulating fungi 1 18PaecilomycesPenicillium 2 35 8 141 1 18PhomaRhizopus 1 18Stachybotrys chartarumUlocladiumYeastsPositive Hole 400 400 400 400Sample volume (liters) 56.6 56.6 56.6 56.6TOTAL CFU*/M3 442 141 36 54* cfu = colony forming units Positive hole correction chart used for all calculationsComments:A) The sample was overgrown with a Rhizopus species which may have reduced or eliminated the presence of other
fungi.
EMLab ID: 396775, Page 1 of 5
Note: Interpretation is left to the company and/or persons who conducted the field work. Variation is an inherent part of biological sampling. The presence or absence of a few genera in small numbers should not be considered abnormal.NORMAL SPORE LEVELS: Indoor spore levels usually average 30 to 80% of the outdoor spore level at the time of sampling, with the same general distribution of spore types. Filtered air, air-conditioned air, or air remote from outside sources may average 5 to 15% of the outside airat the time of sampling. (These percentages are guidelines, only. A major factor is the accessibility of outdoor air. A residence with open doors and windows and heavy foot traffic may average 95% of the outdoor level while high rise office buildings with little air exchange may average 2%. Dusty interiors may exceed 100% of the outdoors to some degree, but will still mirror the outdoor distribution of spore types.)PROBLEM INTERIORS: A substantial increase of one or two spore types which are inconsistent with and non-reflective of the outside distribution of spore types is usually indicative of an indoor reservoir of mold growth.The Limit of Detection is the product of a raw count of 1 and 100 divided by the percent read. The analytical sensitivity (counts/m3) is the product of the Limit of Detection and 1000 divided by the sample volume.‡ A "Version" greater than 1 indicates amended data.

EMLab P&K1150 Bayhill Drive, Suite 100, San Bruno, CA 94066
(650) 829-5800 Fax (650) 829-5852 www.emlab.comClient: Hygiene Technologies International, Inc.: Northern CaliforniaC/O: Mr. Wes FreyRe: 20803001
Date of Sampling: 03-07-2008Date of Receipt: 03-07-2008Date of Report: 03-14-2008
CULTURABLE AIR FUNGI REPORTLocation: 20803001-
VM05ME20803001-VM06ME
20803001-VM07ME
20803001-VM08ME
Comments (see below) None None None None
Lab ID-Version‡: 1743077-1 1743078-1 1743079-1 1743080-1
raw ct. cfu*/m3 raw ct. cfu*/m3 raw ct. cfu*/m3 raw ct. cfu*/m3AcremoniumAlternariaAspergillus flavusAspergillus fumigatus 1 18Aspergillus nidulansAspergillus niger 1 18Aspergillus ochraceusAspergillus versicolor 1 18AureobasidiumBasidiomycetesBipolaris/Drechslera groupBotrytisChaetomiumCladosporium 1 18CurvulariaEpicoccumFusariumMucorNon-sporulating fungiPaecilomycesPenicillium 3 53PhomaRhizopusStachybotrys chartarumUlocladiumYeastsPositive Hole 400 400 400 400Sample volume (liters) 56.6 56.6 56.6 56.6TOTAL CFU*/M3 71 36 18 < 18* cfu = colony forming units Positive hole correction chart used for all calculationsComments:
EMLab ID: 396775, Page 2 of 5
Note: Interpretation is left to the company and/or persons who conducted the field work. Variation is an inherent part of biological sampling. The presence or absence of a few genera in small numbers should not be considered abnormal.NORMAL SPORE LEVELS: Indoor spore levels usually average 30 to 80% of the outdoor spore level at the time of sampling, with the same general distribution of spore types. Filtered air, air-conditioned air, or air remote from outside sources may average 5 to 15% of the outside airat the time of sampling. (These percentages are guidelines, only. A major factor is the accessibility of outdoor air. A residence with open doors and windows and heavy foot traffic may average 95% of the outdoor level while high rise office buildings with little air exchange may average 2%. Dusty interiors may exceed 100% of the outdoors to some degree, but will still mirror the outdoor distribution of spore types.)PROBLEM INTERIORS: A substantial increase of one or two spore types which are inconsistent with and non-reflective of the outside distribution of spore types is usually indicative of an indoor reservoir of mold growth.The Limit of Detection is the product of a raw count of 1 and 100 divided by the percent read. The analytical sensitivity (counts/m3) is the product of the Limit of Detection and 1000 divided by the sample volume.‡ A "Version" greater than 1 indicates amended data.

EMLab P&K1150 Bayhill Drive, Suite 100, San Bruno, CA 94066
(650) 829-5800 Fax (650) 829-5852 www.emlab.comClient: Hygiene Technologies International, Inc.: Northern CaliforniaC/O: Mr. Wes FreyRe: 20803001
Date of Sampling: 03-07-2008Date of Receipt: 03-07-2008Date of Report: 03-14-2008
CULTURABLE AIR FUNGI REPORTLocation: 20803001-
VM09ME20803001-VM10ME
20803001-VM11ME
20803001-VM12ME
Comments (see below) None None None None
Lab ID-Version‡: 1743081-1 1743082-1 1743083-1 1743084-1
raw ct. cfu*/m3 raw ct. cfu*/m3 raw ct. cfu*/m3 raw ct. cfu*/m3AcremoniumAlternariaAspergillus flavusAspergillus fumigatusAspergillus nidulansAspergillus niger 12 212 2 35Aspergillus ochraceusAspergillus versicolorAureobasidiumBasidiomycetesBipolaris/Drechslera groupBotrytisChaetomiumCladosporium 1 18 1 18CurvulariaEpicoccumFusariumMucorNon-sporulating fungi 1 18PaecilomycesPenicillium 1 18PhomaRhizopusStachybotrys chartarumUlocladiumYeastsPositive Hole 400 400 400 400Sample volume (liters) 56.6 56.6 56.6 56.6TOTAL CFU*/M3 18 212 53 36* cfu = colony forming units Positive hole correction chart used for all calculationsComments:
EMLab ID: 396775, Page 3 of 5
Note: Interpretation is left to the company and/or persons who conducted the field work. Variation is an inherent part of biological sampling. The presence or absence of a few genera in small numbers should not be considered abnormal.NORMAL SPORE LEVELS: Indoor spore levels usually average 30 to 80% of the outdoor spore level at the time of sampling, with the same general distribution of spore types. Filtered air, air-conditioned air, or air remote from outside sources may average 5 to 15% of the outside airat the time of sampling. (These percentages are guidelines, only. A major factor is the accessibility of outdoor air. A residence with open doors and windows and heavy foot traffic may average 95% of the outdoor level while high rise office buildings with little air exchange may average 2%. Dusty interiors may exceed 100% of the outdoors to some degree, but will still mirror the outdoor distribution of spore types.)PROBLEM INTERIORS: A substantial increase of one or two spore types which are inconsistent with and non-reflective of the outside distribution of spore types is usually indicative of an indoor reservoir of mold growth.The Limit of Detection is the product of a raw count of 1 and 100 divided by the percent read. The analytical sensitivity (counts/m3) is the product of the Limit of Detection and 1000 divided by the sample volume.‡ A "Version" greater than 1 indicates amended data.

EMLab P&K1150 Bayhill Drive, Suite 100, San Bruno, CA 94066
(650) 829-5800 Fax (650) 829-5852 www.emlab.comClient: Hygiene Technologies International, Inc.: Northern CaliforniaC/O: Mr. Wes FreyRe: 20803001
Date of Sampling: 03-07-2008Date of Receipt: 03-07-2008Date of Report: 03-14-2008
CULTURABLE AIR FUNGI REPORTLocation: 20803001-
VM13ME20803001-VM14ME
20803001-VM15ME
20803001-VM16ME
Comments (see below) None None None None
Lab ID-Version‡: 1743085-1 1743086-1 1743087-1 1743088-1
raw ct. cfu*/m3 raw ct. cfu*/m3 raw ct. cfu*/m3 raw ct. cfu*/m3AcremoniumAlternariaAspergillus flavusAspergillus fumigatusAspergillus nidulansAspergillus nigerAspergillus ochraceusAspergillus versicolorAureobasidium 1 18BasidiomycetesBipolaris/Drechslera groupBotrytisChaetomiumCladosporium 2 35 1 18 1 18CurvulariaEpicoccumFusariumMucorNon-sporulating fungi 1 18PaecilomycesPenicilliumPhomaRhizopusStachybotrys chartarumUlocladiumYeasts 2 35Positive Hole 400 400 400 400Sample volume (liters) 56.6 56.6 56.6 56.6TOTAL CFU*/M3 88 18 36 < 18* cfu = colony forming units Positive hole correction chart used for all calculationsComments:
EMLab ID: 396775, Page 4 of 5
Note: Interpretation is left to the company and/or persons who conducted the field work. Variation is an inherent part of biological sampling. The presence or absence of a few genera in small numbers should not be considered abnormal.NORMAL SPORE LEVELS: Indoor spore levels usually average 30 to 80% of the outdoor spore level at the time of sampling, with the same general distribution of spore types. Filtered air, air-conditioned air, or air remote from outside sources may average 5 to 15% of the outside airat the time of sampling. (These percentages are guidelines, only. A major factor is the accessibility of outdoor air. A residence with open doors and windows and heavy foot traffic may average 95% of the outdoor level while high rise office buildings with little air exchange may average 2%. Dusty interiors may exceed 100% of the outdoors to some degree, but will still mirror the outdoor distribution of spore types.)PROBLEM INTERIORS: A substantial increase of one or two spore types which are inconsistent with and non-reflective of the outside distribution of spore types is usually indicative of an indoor reservoir of mold growth.The Limit of Detection is the product of a raw count of 1 and 100 divided by the percent read. The analytical sensitivity (counts/m3) is the product of the Limit of Detection and 1000 divided by the sample volume.‡ A "Version" greater than 1 indicates amended data.

EMLab P&K1150 Bayhill Drive, Suite 100, San Bruno, CA 94066
(650) 829-5800 Fax (650) 829-5852 www.emlab.comClient: Hygiene Technologies International, Inc.: Northern CaliforniaC/O: Mr. Wes FreyRe: 20803001
Date of Sampling: 03-07-2008Date of Receipt: 03-07-2008Date of Report: 03-14-2008
CULTURABLE AIR FUNGI REPORTLocation: 20803001-VM17ME 20803001-VM18OUTMEComments (see below) None None
Lab ID-Version‡: 1743089-1 1743090-1
raw ct. cfu*/m3 raw ct. cfu*/m3AcremoniumAlternariaAspergillus flavusAspergillus fumigatusAspergillus nidulansAspergillus niger 2 35Aspergillus ochraceusAspergillus versicolorAureobasidiumBasidiomycetesBipolaris/Drechslera groupBotrytisChaetomiumCladosporium 16 283CurvulariaEpicoccum 1 18FusariumMucor 1 18Non-sporulating fungi 1 18 2 35PaecilomycesPenicillium 3 53PhomaRhizopusStachybotrys chartarumUlocladiumYeastsPositive Hole 400 400Sample volume (liters) 56.6 56.6TOTAL CFU*/M3 18 442* cfu = colony forming units Positive hole correction chart used for all calculationsComments:
EMLab ID: 396775, Page 5 of 5
Note: Interpretation is left to the company and/or persons who conducted the field work. Variation is an inherent part of biological sampling. The presence or absence of a few genera in small numbers should not be considered abnormal.NORMAL SPORE LEVELS: Indoor spore levels usually average 30 to 80% of the outdoor spore level at the time of sampling, with the same general distribution of spore types. Filtered air, air-conditioned air, or air remote from outside sources may average 5 to 15% of the outside airat the time of sampling. (These percentages are guidelines, only. A major factor is the accessibility of outdoor air. A residence with open doors and windows and heavy foot traffic may average 95% of the outdoor level while high rise office buildings with little air exchange may average 2%. Dusty interiors may exceed 100% of the outdoors to some degree, but will still mirror the outdoor distribution of spore types.)PROBLEM INTERIORS: A substantial increase of one or two spore types which are inconsistent with and non-reflective of the outside distribution of spore types is usually indicative of an indoor reservoir of mold growth.The Limit of Detection is the product of a raw count of 1 and 100 divided by the percent read. The analytical sensitivity (counts/m3) is the product of the Limit of Detection and 1000 divided by the sample volume.‡ A "Version" greater than 1 indicates amended data.


EMLab P&K
Approved by:
Lab ManagerDr. Kamashwaran Ramanathan
Report for:
Mr. Wes FreyHygiene Technologies International, Inc.: Northern California3127 Bowen Island StreetWest Sacramento, CA 95691
Regarding: Project: 20803001EML ID: 396295
EMLab P&K
This coversheet is included with your report in order to comply with AIHA and ISO accreditation requirements.
For clarity, we report the number of significant digits as calculated; but, due to the nature of this type of biological data, the number of significant digits that is used for interpretation should generally be one or two. All samples were received in acceptable condition unless noted in the Report Comments portion in the body of the report. Due to the nature of the analyses performed, field blank corrections of results is not a standard practice. The results relate only to the items tested.
EMLab P&K ("the Company") shall have no liability to the client or the client's customer with respect to decisions or recommendations made, actions taken or courses of conduct implemented by either the client or the client's customer as a result of or based upon the Test Results. In no event shall the Company be liable to the client with respect to the Test Results except for the Company's own willful misconduct or gross negligence nor shall the Company be liable for incidental or consequential damages or lost profits or revenues to the fullest extent such liability may be disclaimed by law, even if the Company has been advised of the possibility of such damages, lost profits or lost revenues. In no event shall the Company's liability with respect to the Test Results exceed the amount paid to the Company by the client therefor.
Document Number: 200091 - Revision Number: 5
Dates of Analysis:Direct microscopic exam (Qualitative): 03-10-2008Spore trap analysis: 03-10-2008
Project SOPs: Direct microscopic exam (Qualitative) (I100005), Spore trap analysis (I100000)

EMLab P&K3800 Watt Ave., Suite 145, Sacramento, CA 95821
(650) 829-5800 Fax (650) 829-5852 www.emlab.comClient: Hygiene Technologies International, Inc.: Northern CaliforniaC/O: Mr. Wes FreyRe: 20803001
Date of Sampling: 03-03-2008Date of Receipt: 03-06-2008Date of Report: 03-10-2008
SPORE TRAP REPORT: NON-VIABLE METHODOLOGYLocation: 20803001-TM01AC 20803001-TM02AC 20803001-TM03AC 20803001-TM04ACComments (see below) None None None None
Lab ID-Version‡: 1740454-1 1740455-1 1740456-1 1740457-1
raw ct. spores/m3 raw ct. spores/m3 raw ct. spores/m3 raw ct. spores/m3AlternariaArthriniumAscospores*AureobasidiumBasidiospores* 1 53 1 53 1 53Bipolaris/Drechslera groupBotrytisChaetomiumCladosporium 1 53 2 107 2 107CurvulariaEpicoccumFusariumMyrotheciumNigrosporaOther brown 1 13Other colorlessPenicillium/Aspergillus types† 2 107 1 53 1 53 1 53PithomycesRusts*Smuts*, Periconia, Myxomycetes* 1 13StachybotrysStemphyliumTorulaUlocladiumZygomycetesBackground debris (1-4+)†† 2+ 2+ 2+ 2+Hyphal fragments/m3 < 13 < 13 < 13 13Pollen/m3 < 13 27 < 13 < 13Skin cells (1-4+) 2+ 2+ 2+ 2+Sample volume (liters) 75 75 75 75TOTAL SPORE/m3 239 160 213 106Comments:
EMLab ID: 396295, Page 1 of 2
* Most of these spore types are not seen with culturable methods (Andersen sampling), although some may appear as non-sporulating fungi. Most of the basidiospores are "mushroom" spores while the rusts and smuts are plant pathogens.† The spores of Aspergillus and Penicillium (and others such as Acremonium, Paecilomyces) are small and round with very few distinguishing characteristics. They cannot be differentiated by non-viable sampling methods. Also, some species with very small spores are easily missed, and may be undercounted.††Background debris indicates the amount of non-biological particulate matter present on the trace (dust in the air) and the resulting visibility for the analyst. It is rated from 1+ (low) to 4+ (high). Counts from areas with 4+ background debris should be regarded as minimal counts and may be higher then reported. It is important to account for samples volumes when evaluating dust levels.The Limit of Detection is the product of a raw count of 1 and 100 divided by the percent read. The analytical sensitivity (counts/m3) is the product of the Limit of Detection and 1000 divided by the sample volume.‡ A "Version" greater than 1 indicates amended data.

EMLab P&K3800 Watt Ave., Suite 145, Sacramento, CA 95821
(650) 829-5800 Fax (650) 829-5852 www.emlab.comClient: Hygiene Technologies International, Inc.: Northern CaliforniaC/O: Mr. Wes FreyRe: 20803001
Date of Sampling: 03-03-2008Date of Receipt: 03-06-2008Date of Report: 03-10-2008
SPORE TRAP REPORT: NON-VIABLE METHODOLOGYLocation: 20803001-TM05AC 20803001-TM06AC 20803001-TM07AC 20803001-TM08ACComments (see below) None None None None
Lab ID-Version‡: 1740458-1 1740459-1 1740460-1 1740461-1
raw ct. spores/m3 raw ct. spores/m3 raw ct. spores/m3 raw ct. spores/m3Alternaria 1 13ArthriniumAscospores*AureobasidiumBasidiospores* 1 53 2 107Bipolaris/Drechslera group 1 13BotrytisChaetomiumCladosporium 1 53 3 160 2 107CurvulariaEpicoccumFusariumMyrotheciumNigrosporaOther brown 1 13Other colorlessPenicillium/Aspergillus types† 1 53 2 107 1 53 3 160PithomycesRusts* 1 13Smuts*, Periconia, Myxomycetes* 2 27 3 40StachybotrysStemphyliumTorulaUlocladiumZygomycetesBackground debris (1-4+)†† 2+ 2+ 3+ 3+Hyphal fragments/m3 < 13 < 13 53 40Pollen/m3 < 13 < 13 13 < 13Skin cells (1-4+) 2+ 2+ 3+ 3+Sample volume (liters) 75 75 75 75TOTAL SPORE/m3 53 173 306 440Comments:
EMLab ID: 396295, Page 2 of 2
* Most of these spore types are not seen with culturable methods (Andersen sampling), although some may appear as non-sporulating fungi. Most of the basidiospores are "mushroom" spores while the rusts and smuts are plant pathogens.† The spores of Aspergillus and Penicillium (and others such as Acremonium, Paecilomyces) are small and round with very few distinguishing characteristics. They cannot be differentiated by non-viable sampling methods. Also, some species with very small spores are easily missed, and may be undercounted.††Background debris indicates the amount of non-biological particulate matter present on the trace (dust in the air) and the resulting visibility for the analyst. It is rated from 1+ (low) to 4+ (high). Counts from areas with 4+ background debris should be regarded as minimal counts and may be higher then reported. It is important to account for samples volumes when evaluating dust levels.The Limit of Detection is the product of a raw count of 1 and 100 divided by the percent read. The analytical sensitivity (counts/m3) is the product of the Limit of Detection and 1000 divided by the sample volume.‡ A "Version" greater than 1 indicates amended data.

EMLab P&K3800 Watt Ave., Suite 145, Sacramento, CA 95821
(650) 829-5800 Fax (650) 829-5852 www.emlab.comClient: Hygiene Technologies International, Inc.: Northern CaliforniaC/O: Mr. Wes FreyRe: 20803001
Date of Sampling: 03-03-2008Date of Receipt: 03-06-2008Date of Report: 03-10-2008
DIRECT MICROSCOPIC EXAMINATION REPORT(Wet Mount)
BackgroundDebris and/orDescription
MiscellaneousSpores Present*
MOLD GROWTH: Molds seenwith underlying mycelial and/or
sporulating structures†
OtherComments††
GeneralImpression
Lab ID-Version‡: 1740446-1: Swab sample 20803001-S01AC
Heavy Very few 2+ brown hyphae with no associated spores, ID unknown (hyphae)
Many dark amorphous
particles detected, not biological in
appearance.
Mold growth
Lab ID-Version: 1740447-1: Swab sample 20803001-S02AC
Heavy Very few < 1+ brown hyphae with no associated spores, ID unknown (hyphae fragment)
Many dark amorphous
particles detected, not biological in
appearance.
Minimal mold growth
Lab ID-Version: 1740448-1: Swab sample 20803001-S03AC
Heavy Very few < 1+ brown hyphae with no associated spores, ID unknown (hyphae fragment)
Many dark amorphous
particles detected, not biological in
appearance.
Minimal mold growth
Lab ID-Version: 1740449-1: Swab sample 20803001-S04AC
Heavy Very few 2+ brown hyphae with no associated spores, ID unknown (hyphae)
Many dark amorphous
particles detected, not biological in
appearance.
Mold growth
Lab ID-Version: 1740450-1: Swab sample 20803001-S05AC
Heavy Very few 2+ brown hyphae with no associated spores, ID unknown (hyphae)
Many dark amorphous
particles detected, not biological in
appearance.
Mold growth
Lab ID-Version: 1740451-1: Swab sample 20803001-S06AC
Heavy Very few < 1+ brown hyphae with no associated spores, ID unknown (hyphae fragment)
Many dark amorphous
particles detected, not biological in
appearance.
Minimal mold growth
Lab ID-Version: 1740452-1: Swab sample 20803001-S07AC
Heavy Very few < 1+ brown hyphae with no associated spores, ID unknown (hyphae fragment)
Many dark amorphous
particles detected, not biological in
appearance.
Minimal mold growth
EMLab ID: 396295, Page 1 of 2

BackgroundDebris and/orDescription
MiscellaneousSpores Present*
MOLD GROWTH: Molds seenwith underlying mycelial and/or
sporulating structures†
OtherComments††
GeneralImpression
Lab ID-Version‡: 1740453-1: Swab sample 20803001-S08AC
Heavy Very few 1+ brown hyphae with no associated spores, ID unknown (hyphae fragment)
Many dark amorphous
particles detected, not biological in
appearance.
Mold growth
‡ A "Version" greater than 1 indicates amended data.
EMLab ID: 396295, Page 2 of 2


EMLab P&K
Approved by:
Lab ManagerDr. Kamashwaran Ramanathan
Report for:
Mr. Wes FreyHygiene Technologies International, Inc.: Northern California3127 Bowen Island StreetWest Sacramento, CA 95691
Regarding: Project: 20803001EML ID: 396298
EMLab P&K
This coversheet is included with your report in order to comply with AIHA and ISO accreditation requirements.
For clarity, we report the number of significant digits as calculated; but, due to the nature of this type of biological data, the number of significant digits that is used for interpretation should generally be one or two. All samples were received in acceptable condition unless noted in the Report Comments portion in the body of the report. Due to the nature of the analyses performed, field blank corrections of results is not a standard practice. The results relate only to the items tested.
EMLab P&K ("the Company") shall have no liability to the client or the client's customer with respect to decisions or recommendations made, actions taken or courses of conduct implemented by either the client or the client's customer as a result of or based upon the Test Results. In no event shall the Company be liable to the client with respect to the Test Results except for the Company's own willful misconduct or gross negligence nor shall the Company be liable for incidental or consequential damages or lost profits or revenues to the fullest extent such liability may be disclaimed by law, even if the Company has been advised of the possibility of such damages, lost profits or lost revenues. In no event shall the Company's liability with respect to the Test Results exceed the amount paid to the Company by the client therefor.
Document Number: 200091 - Revision Number: 5
Dates of Analysis:Direct microscopic exam (Qualitative): 03-10-2008
Project SOPs: Direct microscopic exam (Qualitative) (I100005)

EMLab P&K1150 Bayhill Drive, Suite 100, San Bruno, CA 94066
(650) 829-5800 Fax (650) 829-5852 www.emlab.comClient: Hygiene Technologies International, Inc.: Northern CaliforniaC/O: Mr. Wes FreyRe: 20803001
Date of Sampling: 03-04-2008Date of Receipt: 03-06-2008Date of Report: 03-10-2008
DIRECT MICROSCOPIC EXAMINATION REPORT(Wet Mount)
BackgroundDebris and/orDescription
MiscellaneousSpores Present*
MOLD GROWTH: Molds seenwith underlying mycelial and/or
sporulating structures†
OtherComments††
GeneralImpression
Lab ID-Version‡: 1740482-1: Tape sample 20803001-TL01AC
Light Very few None None Normal trapping
Lab ID-Version: 1740484-1: Tape sample 20803001-TL02AC
Light Very few None None Normal trapping
Lab ID-Version: 1740485-1: Tape sample 20803001-TL03AC
Light Very few None None Normal trapping
Lab ID-Version: 1740487-1: Tape sample 20803001-TL04AC
Light Very few None None Normal trapping
Lab ID-Version: 1740489-1: Tape sample 20803001-TL05AC
Light Very few None None Normal trapping
Lab ID-Version: 1740490-1: Tape sample 20803001-TL06AC
Light Very few None None Normal trapping
Lab ID-Version: 1740492-1: Tape sample 20803001-TL07AC
Light Very few None None Normal trapping
Lab ID-Version: 1740494-1: Tape sample 20803001-TL08AC
Scant None None None No mold spores detected
Lab ID-Version: 1740496-1: Tape sample 20803001-TL09AC
Light Very few None None Normal trapping
Lab ID-Version: 1740497-1: Tape sample 20803001-TL10AC
Light Very few None None Normal trapping
Lab ID-Version: 1740499-1: Tape sample 20803001-TL11AC
Scant Very few None None Normal trapping
EMLab ID: 396298, Page 1 of 4

BackgroundDebris and/orDescription
MiscellaneousSpores Present*
MOLD GROWTH: Molds seenwith underlying mycelial and/or
sporulating structures†
OtherComments††
GeneralImpression
Lab ID-Version‡: 1740500-1: Tape sample 20803001-TL12AC
Moderate Very few None None Normal trapping
Lab ID-Version: 1740501-1: Tape sample 20803001-TL13AC
Light Very few None None Normal trapping
Lab ID-Version: 1740502-1: Tape sample 20803001-TL14AC
Light Very few None None Normal trapping
Lab ID-Version: 1740503-1: Tape sample 20803001-TL15AC
Light Very few None None Normal trapping
Lab ID-Version: 1740504-1: Tape sample 20803001-TL16AC
Light Very few None None Normal trapping
Lab ID-Version: 1740505-1: Tape sample 20803001-TL17AC
Light Very few None None Normal trapping
Lab ID-Version: 1740506-1: Tape sample 20803001-TL18AC
Scant None None None No mold spores detected
Lab ID-Version: 1740507-1: Tape sample 20803001-TL19AC
Scant None None None No mold spores detected
Lab ID-Version: 1740508-1: Tape sample 20803001-TL20AC
Moderate Very few None None Normal trapping
Lab ID-Version: 1740509-1: Tape sample 20803001-TL21AC
Light Very few None None Normal trapping
Lab ID-Version: 1740510-1: Tape sample 20803001-TL22AC
Light Very few None None Normal trapping
Lab ID-Version: 1740511-1: Tape sample 20803001-TL23AC
Light Very few None None Normal trapping
Lab ID-Version: 1740512-1: Tape sample 20803001-TL24AC
Light Very few None None Normal trapping
EMLab ID: 396298, Page 2 of 4

BackgroundDebris and/orDescription
MiscellaneousSpores Present*
MOLD GROWTH: Molds seenwith underlying mycelial and/or
sporulating structures†
OtherComments††
GeneralImpression
Lab ID-Version‡: 1740513-1: Tape sample 20803001-TL25AC
Light Very few None None Normal trapping
Lab ID-Version: 1740514-1: Tape sample 20803001-TL26AC
Light Very few None None Normal trapping
Lab ID-Version: 1740515-1: Tape sample 20803001-TL27AC
Moderate Very few None None Normal trapping
Lab ID-Version: 1740516-1: Tape sample 20803001-TL28AC
Light Very few None None Normal trapping
Lab ID-Version: 1740517-1: Tape sample 20803001-TL29AC
Light Very few None None Normal trapping
Lab ID-Version: 1740518-1: Tape sample 20803001-TL30AC
Moderate Very few None None Normal trapping
Lab ID-Version: 1740519-1: Tape sample 20803001-TL31AC
Light Very few None None Normal trapping
Lab ID-Version: 1740520-1: Tape sample 20803001-TL32AC
Light Very few None None Normal trapping
Lab ID-Version: 1740521-1: Tape sample 20803001-TL33AC
Scant Very few None None Normal trapping
Lab ID-Version: 1740522-1: Tape sample 20803001-TL34AC
Light Very few None None Normal trapping
Lab ID-Version: 1740523-1: Tape sample 20803001-TL35AC
Light Very few None None Normal trapping
Lab ID-Version: 1740524-1: Tape sample 20803001-TL36AC
Scant Very few None None Normal trapping
Lab ID-Version: 1740525-1: Tape sample 20803001-TL37AC
Scant Very few None None Normal trapping
EMLab ID: 396298, Page 3 of 4

BackgroundDebris and/orDescription
MiscellaneousSpores Present*
MOLD GROWTH: Molds seenwith underlying mycelial and/or
sporulating structures†
OtherComments††
GeneralImpression
Lab ID-Version‡: 1740526-1: Tape sample 20803001-TL38AC
Scant Very few None None Normal trapping
Lab ID-Version: 1740527-1: Tape sample 20803001-TL39AC
Light Very few None None Normal trapping
Lab ID-Version: 1740528-1: Tape sample 20803001-TL40AC
Moderate Very few None A few colorless spores typical of
Penicillium / Aspergillus
detected.
Mold growth in vicinity?
‡ A "Version" greater than 1 indicates amended data.
EMLab ID: 396298, Page 4 of 4


Related Documents