A Joint Report By: California Reinvestment Coalition Community Reinvestment Association of North Carolina Empire Justice Center Massachusetts Affordable Housing Alliance Neighborhood Economic Development Advocacy Project Ohio Fair Lending Coalition Woodstock Institute

Welcome message from author
This document is posted to help you gain knowledge. Please leave a comment to let me know what you think about it! Share it to your friends and learn new things together.
Transcript

A Joint Report By:
California Reinvestment Coalition
Community Reinvestment Association of North Carolina
Empire Justice Center
Massachusetts Affordable Housing Alliance
Neighborhood Economic Development Advocacy Project
Ohio Fair Lending Coalition
Woodstock Institute

California Reinvestment Coalition advocates for the right of low-income communities and communities of color to have fair and equal access to banking and other financial services. CRC has a membership of more than 240 nonprofit organizations and public agencies across the State. Community Reinvestment Association of North Carolina is a nonprofit, nonpartisan research and advocacy organization whose mission is to promote and protect community wealth. We advocate for change in the lending practices of financial institutions to promote wealth building for underserved communities and to end predatory lending practices that strip wealth. Empire Justice Center is a statewide non-profit law firm that works to protect and strengthen the legal rights of people in New York State who are poor, disabled or disenfranchised through: systems change advocacy, training and support to other advocates and organizations, and high quality direct civil legal representation. Massachusetts Affordable Housing Alliance’s mission is to organize for increases in public and private sector investment in affordable housing and to break down the barriers facing minority and low to moderate income first time homebuyers as they seek affordable and sustainable homeownership opportunities. Our campaigns have resulted in more than $3.3 billion of public and private sector investment in affordable housing in Massachusetts since 1985. Our grassroots Homebuyers Union organizing, in both urban and suburban communities, has been effective in engaging banks, insurance companies, and elected officials around the issues of affordable homeownership and responsible mortgage lending. Neighborhood Economic Development Advocacy Project (NEDAP) is a resource and advocacy center for community groups in New York City. Our mission is to promote community economic justice and to eliminate discriminatory economic practices that harm communities and perpetuate inequality and poverty. Ohio Fair Lending Coalition is composed of The Toledo Fair Housing Center, Empowering & Strengthening Ohio’s People, formerly known as East Side Organizing Project, SEIU Local 3 and fair lending advocates, Paul Bellamy and Charles Bromley. The Coalition challenged the merger of Sky and Huntington Banks in 2007 and it continues to be Ohio's Fair Lending Organization. Woodstock Institute is a leading nonprofit research and policy organization in the areas of fair lending, wealth creation, and financial systems reform. Woodstock Institute works locally and nationally to create a financial system in which lower-wealth persons and communities of color can safely borrow, save, and build wealth so that they can achieve economic security and community prosperity. Our key tools include: applied research; policy development; coalition building; and technical assistance.

Preface The Paying More for the American Dream series is a collaborative project of the California Reinvestment Coalition (CRC), Community Reinvestment Association of North Carolina (CRA-NC), Empire Justice Center, Massachusetts Affordable Housing Alliance (MAHA), Neighborhood Economic Development Advocacy Project (NEDAP), Ohio Fair Lending Coalition, and Woodstock Institute. This is the collaboration’s fifth annual report examining systematic inequalities in the housing finance system and their impact on lower-income neighborhoods and communities of color. The principal researchers and contributors to this report are: Charles Bromley (Ohio Fair Lending Coalition), Jim Campen (MAHA), Sarah Duda and Geoff Smith (Woodstock Institute), Alexis Iwanisziw and Sarah Ludwig (NEDAP), Adam Rust (CRA-NC), Kevin Stein (CRC), and Barbara van Kerkhove, (Empire Justice Center). Report layout and production were completed by staff at Woodstock Institute, and mapping was completed by Alexis Iwanisziw and Ben Hagen at NEDAP.

Executive Summary This report examines conventional refinance lending in seven key metropolitan areas. It looks at loan volumes in 2008 and 2009 in communities of color and in predominantly white neighborhoods. The report documents disparities in the changes in refinance lending over this period and highlights disparate 2009 denial rates based on the racial composition of communities. Finally, the report includes recommendations for federal policy reforms to ensure that financial institutions provide access to fair and affordable mortgage loans, particularly in communities of color. Access to conventional mortgage refinance lending is critical to homeowners and communities. Refinance loans are vital to homeowners seeking to benefit from lower interest rates improve their homes, finance small businesses, or pay for education. Refinance lending is especially crucial given the ongoing foreclosure crisis as homeowners struggle to stay in their homes. Access to sound refinance loans is critical to preserving community assets and neighborhood stability. Since the onset of the financial crisis lenders have significantly decreased access to conventional refinance lending in communities of color, where the foreclosure crisis is taking an especially severe toll. In contrast, lenders significantly increased conventional refinance lending in predominantly white neighborhoods. Key Findings: Between 2008 and 2009, the number of conventional refinance loans made in predominantly white neighborhoods more than doubled in all seven cities examined. During this time, however, conventional refinance lending declined sharply in communities of color in all but one of the seven cities examined. Similarly large disparities were seen in denial rates. In 2009, lenders’ denial rates in communities of color ranged from 29 percent to 60 percent, compared to 12 percent to 24 percent denial rates in predominantly white neighborhoods. Across the seven cities, in 2009:
• Conventional refinance loans to homeowners in predominantly white neighborhoods increased by an average of 129 percent. Conventional refinance loan originations in communities of color decreased by an average of 17 percent.
• Lenders were roughly two and a half times as likely to deny a conventional refinance loan to homeowners in communities of color as they were to homeowners in predominantly white neighborhoods. On average, lenders denied 34 percent of conventional refinance loan applications from homeowners in communities of color in the seven cities studied, but denied only to 14 percent of applications from homeowners in predominantly white neighborhoods.
Key Recommendations: This report raises serious questions about disparate access to conventional refinance loans in communities of color. The findings underscore the need to develop and enforce effective and strong fair lending rules, enforcement, and public policies that ensure that all communities have access to affordable, high-quality

ii
mortgage loans. To address the key findings and related issues raised by this report, the authors recommend the following:
• Expand the Community Reinvestment Act to promote responsible lending and investment.
• Improve Home Mortgage Disclosure Act data reporting requirements to bring greater transparency to mortgage lending and foreclosure prevention efforts.
• Prioritize fair lending enforcement.
• Hold lenders accountable to communities and require them to engage in meaningful foreclosure prevention.
• Ensure access to safe, affordable mortgages when updating federal mortgage programs and implementing regulations under the Dodd-Frank Act.

Introduction This fifth annual report in the Paying More for the American Dream series examines mortgage lending patterns in seven cities throughout the country. Since the series began in 2007, the U.S. mortgage market has changed dramatically – from the boom years of high-volume lending fueled by abusive subprime and option adjustable rate mortgage (ARM) loans, to the foreclosure crisis and subsequent financial meltdown that led to a dramatic contraction of mortgage lending. The reports, produced in this broader context, document lending patterns at the local level, showing inequities in access to sound and affordable mortgages. As is now widely known, the concentration of predatory subprime loans in communities of color led to high concentrations of foreclosures in these neighborhoods.1 In Chicago, for example, foreclosure rates in African American neighborhoods have been five times higher than in predominantly white neighborhoods.2 The large numbers of foreclosed homes in neighborhoods of color, tied to high concentrations of vacant and abandoned properties, have devastated entire communities.3 Years of predatory lending practices have damaged people’s credit, and the subsequent wave of foreclosures has substantially lowered property values. As a result of the economic crisis, high unemployment continues to slow economic recovery, particularly in communities of color. These factors impede many borrowers’ ability to qualify for home loans using traditional underwriting standards. To stabilize communities, access to fair and affordable refinance loans – not to mention sound loan modifications – is sorely needed. As this report shows, however, lenders have substantially decreased conventional refinance lending in communities of color – at the same time that they have more than doubled such lending in predominantly white communities. Borrowers and neighborhoods of color face both new and historical barriers to prime, conventional mortgage lending.4 Institutional discrimination, in the form of redlining and reverse redlining, persists in the mortgage market.5 Indeed, the homeownership gap between African Americans and whites has widened and is now at its widest since 1994.6
The Paying More for the American Dream series has chronicled detrimental mortgage lending trends that have disproportionately affected borrowers and neighborhoods of color:
1From Foreclosure to Re-Redlining, How America’s largest financial institutions devastated California communities. California
Reinvestment Coalition, February 2010. Available: www.calreinvest.org/system/assets/214.pdf. Curbing the Mortgage Meltdown: The Impact of Foreclosures on New York’s Economy and Communities. Empire Justice Center, August 5, 2008. Available: http://www.empirejustice.org/assets/pdf/publications/reports/curbing-the-mortgage-meltdown.pdf; The Home Foreclosure Crisis in Chicago. National People’s Action, February 2010. Available: http://showdowninamerica.org/files/images/NPA_2009_ Chicago_Foreclosure_ Report_0.pdf.
2Woodstock Institute. “2006 Chicago Area Community Lending Fact Book.” Woodstock Institute, March 2008.
3Woodstock Institute. “Left Behind: Troubled Foreclosed Properties and Servicer Accountability in Chicago.” Woodstock Institute,
January 2011. Available: http://cts.vresp.com/c/?WoodstockInstitute/733154fd09/3811c84ad8/2b2f96e418.
4Congressional Oversight Panel, "December Oversight Report: A Review of Treasury's Foreclosure Prevention Program," December 14, 2010. Also see Paying More for the American Dream IV: The Decline of Prime Mortgage Lending in Communities of Color (May 2010) at http://www.woodstockinst.org/publications/download/paying-more-for-the-american-dream-iv%3a-the-decline-of-prime-mortgage-lending-in-communities-of-color/
5James R. Follain, "A Study of Real Estate Markets in Declining Cities." Research Institute for Housing America, December 2010.
6Tom Braithwaite, “U.S. homeowners’ racial gap widens.” Financial Times, February 16, 2011. Available: http://www.ft.com/cms/s/0/064c4870-3a01-11e0-a441-00144feabdc0.html#axzz1KHdIbJE5.

Page 2
• The first report, released in March 2007, examined disparities in mortgage pricing by several of the country’s largest mortgage lenders that offered both prime and subprime loans. The key finding, now widely acknowledged, was that borrowers of color were much more likely than white borrowers to receive higher-cost subprime loans.7
• The second report, released in March 2008, looked at the geographic lending patterns of a set of defunct subprime lenders, whose loans largely fueled the foreclosure crisis. The report showed how neighborhoods of color were saturated with high-risk mortgages made by lenders that later went out of business as a result of making abusive and unaffordable loans.8
• The third report, released in April 2009, analyzed and compared the lending patterns of banks covered by the Community Reinvestment Act (CRA) with lenders that were not covered. Lenders not subject to the CRA were much more likely to make higher-cost loans to borrowers in neighborhoods of color than were lenders that were subject to the CRA.9
• The fourth report, released in April 2010, exposed sharp declines in prime mortgage lending in communities of color in the wake of the financial meltdown. In neighborhoods of color, where the foreclosure crisis has taken an especially severe toll, access to prime, conventional refinance loans declined precipitously from 2006 through 2008. The nation’s four largest banks, in particular, increased prime refinance lending to white neighborhoods while reducing prime refinance lending to communities of color.10
Building off last year’s Paying More for the American Dream analysis, this report examines how recent trends in the mortgage lending industry have led to reduced access to conventional refinance loans in communities of color. Although the authors included all conventional refinance lenders in the analysis, the nation’s four largest banks—Bank of America, Citigroup, JPMorgan Chase, and Wells Fargo—took in almost half (48 percent) of all conventional refinance loan applications nationwide in 2009 and thus are major drivers of the patterns reported.11 Following the data analysis are strong policy recommendations for ensuring fair access to credit and meaningfully enforcing laws that prohibit unfair, discriminatory, and abusive lending practices.
7See Paying More for the American Dream: A Multi-State Analysis of Higher-Cost Home Purchase Lending (March 2007) at http://www.woodstockinst.org/publications/download/paying-more-for-the-american-dream%3a--a-multi%11state-analysis-of-higher%11cost-home-purchase-lending/.
8See Paying More for the American Dream II: The Subprime Shakeout and Its Impact on Lower-Income and Minority Communities (March 2008) at http://www.woodstockinst.org/publications/download/paying-more-for-the-american-dream-%11-the-subprime-shakeout-and-its-impact-on-lower%11income-and-minority-communities/.
9See Paying More for the American Dream III: Promoting Responsible Lending to Lower-Income Communities and Communities of Color (April 2009) at http://www.woodstockinst.org/publications/download/paying-more-for-the-american-dream-iii%3a-promoting-responsible-lending-to-lower%11income-communities-and-communities-of-color/.
10See Paying More for the American Dream IV: The Decline of Prime Mortgage Lending in Communities of Color (May 2010) at http://www.woodstockinst.org/publications/download/paying-more-for-the-american-dream-iv%3a-the-decline-of-prime-mortgage-lending-in-communities-of-color/.
11Robert Avery, Neil Bhutta, Kenneth Brevoort and Glenn Canner, “The 2009 HMDA Data: The Mortgage Market in a Time of Low Interest Rates and Economic Distress.” Available: http://www.federalreserve.gov/pubs/bulletin/2010/articles/2009HMDA/default.htm and calculations by the authors using 2009 HMDA data.

Page 3
Methodology This report examines conventional refinance lending in seven metropolitan areas: Boston, Charlotte, Chicago, Cleveland, Los Angeles, New York City, and Rochester.12 The authors of this report represent organizations in each city, and the seven cities encompass both larger and smaller urban areas in different geographic regions of the country. In each metropolitan area, the authors examined conventional refinance lending in 2008 and 2009, the most recent years for which nationwide Home Mortgage Disclosure Act (HMDA) data are available. The analysis looks at changes in conventional refinance lending in communities of color (areas where 80 percent or more of the residents are people of color) in comparison to lending changes in predominantly white communities (areas where 90 percent or more of the residents are white). The analysis also includes a comparison of denial rates on conventional refinance loan applications from these neighborhoods. The primary data source for this analysis is the Home Mortgage Disclosure Act Loan Application Register data (HMDA LAR data), as collected, processed, and released each year by the federal government. The report considers direct originations of conventional, first-lien refinance mortgages on owner-occupied, one-to-four unit, site-built properties. Since very few high-cost loans were made in 2009, this analysis includes both high-cost and non-high-cost loans. (See Appendix).13 Findings Disparities in Loan Originations Conventional refinance lending to communities of color decreased dramatically between 2008 and 2009. Among the cities examined, conventional refinance lending in communities of color, decreases ranged from 9.4 percent in Los Angeles to 45.7 percent in both Cleveland and Rochester. In stark contrast, lenders more than doubled their conventional refinance lending in predominantly white neighborhoods in all seven cities (See Chart I). Disparities in Denial Rates & Applications Received In 2009, conventional refinance loan denials exposed significant disparities in loan application outcomes between communities of color and predominantly white neighborhoods. As Chart II shows, 2009 denial rates in communities of color ranged from 28.9 percent in Los Angeles to 60 percent in Cleveland. Denial rates in predominantly white neighborhoods were substantially lower, ranging from 11.7 percent in Boston to 24.4 percent in New York. As Figure I of Cleveland illustrates, conventional refinance loan denials rates were overwhelmingly higher in communities of color. Across the seven cities, on average, lenders denied 34 percent of conventional refinance loan applications they received from homeowners in communities of color, and 14 percent from those in predominantly white neighborhoods. (See other city maps in the Appendix).
12Whereas most of the study areas are metropolitan statistical areas, “Los Angeles, CA” refers to Los Angeles County and “New York,
NY”refers to the five boroughs of New York City. See individual tables in the Appendix for a description of each study area.
13The authors also analyzed loans insured by the Federal Housing Administration. Between 2008 and 2009, increased FHA lending compensated for a small portion of the decrease in conventional refinance lending in communities of color. The FHA program, however, also suffered from racial disparities in origination patterns and loan denials. Since inclusion of the FHA loans in the analysis does not substantially alter the findings, the results presented in the body of the report exclude FHA lending. See Appendix for detailed FHA data.

Page 4
Chart I. Conventional Refinance Lending Change in Volume by City and Racial/Ethnic Composition of Community, 2008 to 2009
162.
4%
105.
5%
102.
0%
127.
7%
202.
0%
110.
8%
130.
4%164.
2%
82.9
%
79.3
% 119.
9% 164.
2%
168.
2%
130.
4%
110.
8%
44.6
%
50.9
%
56.4
%
144.
1%
133.
3%
30.8
%80.2
%
-1.2
%
11.8
%
-3.6
%
73.2
%
63.1
%
31.3
%
12.3
%
-13.
3%
-41.
0%
-45.
7% -9.4
%
-14.
1%
-45.
7%-100%
-50%
0%
50%
100%
150%
200%
250%
Boston Charlotte Chicago Cleveland Los Angeles New York Rochester
< 10% of color 10% - 19% 20% - 49% 50% - 79% 80% - 100% of color
Chart II. Conventional Refinance Loan Denial Rates by City and Racial/Ethnic Composition of Community, 2009
11.7
%
15.0
%
14.1
%
18.6
%
16.8
%
24.4
%
15.6
%
12.5
%
17.4
%
15.0
%
22.3
%
17.8
%
22.2
%
15.9
%
18.1
%
22.9
%
18.3
%
27.3
%
16.7
%
25.6
%
26.7
%
21.9
%
31.4
%
24.4
%
42.7
%
21.0
%
30.9
%
35.1
%
34.9
%
40.2
%
38.9
%
60.0
%
28.9
%
39.8
%
57.8
%
0%
10%
20%
30%
40%
50%
60%
70%
Boston Charlotte Chicago Cleveland Los Angeles New York Rochester
< 10% of color 10% - 19% 20% - 49% 50% - 79% 80% - 100% of color Chart III shows disparities in denial rates between communities of color and predominantly white communities. In Rochester, for example, lenders denied conventional refinance loan applications from homeowners in communities of color 3.7 times more frequently than they denied homeowners in predominantly white neighborhoods (57.8 percent vs. 15.6 percent). In Cleveland, the denial disparity ratio was 3.2 (60.0 percent vs. 18.6 percent). In 2009, the number of conventional refinance applications that lenders received from homeowners in communities of color dropped significantly from the previous year. Among the cities examined,

Lenders denied 21.2% of all conventional refinanceloan applications in Cleveland in 2009.
Legend0% - 21.2%21.2% - 35%35% - 50%50% - 75%More than 75%Non-White Population > 50%
Figure I.Denial Rates for Conventional Refinance Loan Applications in Cleveland, OH, 2009
© 2011 - NEDAPwww.nedap.org
Sources: 2009 HMDA data, compiled by Woodstock Institute; 2010 Census data
Lake Erie
City of Cleveland
Conventional mortgage loans: Mortgage loans that are not insured or guaranteed by the Federal Housing Administration or Veterans Affairs.Non-white population: Total population excluding non-Hispanic whites.
Percentage of Loan Applications Denied, by Census Tract (2009)
BrooklynGarfield Heights
Shaker Heights
NorthOlmstead

Page 6
applications received by lenders declined by 36 percent in communities of color compared to increasing by 76 percent in predominantly white communities.
Chart III. Conventional Refinance Loan Denial Rates Disparities Between Communities of Color and Predominantly White Communities, 2009
As Chart IV illustrates, predominantly white neighborhoods in all areas examined saw significant increases in conventional refinance applications while communities of color saw declines, sometimes dramatic, in applications for conventional refinance loans. For example, in Los Angeles, conventional refinance applications in predominantly white communities increased by 157.8 percent between 2008 and 2009, yet applications declined by 34.1 percent in areas greater than 80 percent people of color.
Chart IV. Change in Conventional Refinance Applications Received in Communities of Color and Predominantly White Communities by Metropolitan Area,
2008 and 2009
124.7%
72.7% 70.5% 63.0%
157.8%
78.4%41.5%
-19.1% -32.1%-52.3% -54.0%
-34.1% -27.1%-61.7%-100%
-50%
0%
50%
100%
150%
200%
Boston Charlotte Chicago Cleveland Los Angeles New York Rochester
< 10% 80% - 100%

Page 7
The glaring disparities in conventional refinance loans made, denial rates, and applications received are troubling in several respects. Access to conventional refinance loans is acutely needed in neighborhoods of color, which have borne the brunt of the foreclosure crisis. The decrease in applications received – despite the unabating foreclosure crisis and historically low interest rates – indicates a possible failure by lenders to effectively market conventional refinance loans in communities of color. These potential indicators of redlining warrant regulatory investigation and appropriate enforcement.

Page 8
Conclusion and Recommendations New federal housing and finance policies currently under consideration should prioritize the credit needs of communities of color, which face new and historical barriers to credit, as well as major financial setbacks stemming from the foreclosure and financial crises. Mortgage lenders, including the country’s largest banks, however, have severely curtailed access to conventional refinance loans. Implementation of the Dodd-Frank Wall Street Reform and Consumer Protection Act (Dodd-Frank) and reform of the housing finance system could unintentionally create further barriers for low-income borrowers and borrowers of color seeking to buy homes or qualify for refinance loans. Proposed regulations mandate 20 percent down payments as the standard for Qualified Residential Mortgages, "safe" mortgages exempt from the securitization risk retention requirements in Dodd-Frank.14 Many borrowers will be unable to afford a 20 percent down payment and may be relegated to more expensive mortgages as a result. Reform of the Government-Sponsored Enterprises (GSEs) may effectively stop the GSEs from buying loans made to low- and moderate-income borrowers. The FHA program, which in recent years has become an ever-larger market player, is tightening standards in ways that may disproportionately and adversely restrict lending in neighborhoods of color.15 Federal regulators should pursue a multi-pronged approach that ensures fair credit access. They should: Ensure access to affordable mortgage loans. As changes to the housing finance system and FHA programs are made and Dodd-Frank is implemented, regulators must ensure that the traditional vehicle for homeownership—the affordable 30-year fixed-rate mortgage—remains available and is readily accessible to low- and moderate-income borrowers, borrowers of color, and communities of color and low- and moderate-income communities. The agencies must also ensure that the new policies do not have adverse impacts on borrowers or communities of color. Implement Dodd-Frank’s Home Mortgage Disclosure Act (HMDA) data enhancements at the loan level to allow identification of possible redlining practices. In implementing Dodd-Frank’s HMDA data enhancements, the new Consumer Financial Protection Bureau (CFPB) should require public disclosure of data at the individual application and loan levels, rather than summary or aggregated data. The authors’ extensive experience with both HMDA data, which is reported at the individual loan record level, and the CRA small business lending data, which is reported in aggregated form, has underscored the indispensible role that publicly-available loan-level data play in identifying lending patterns, including by race/ethnicity and neighborhood. The CFPB should make data on loan modifications public in the HMDA data, with information provided for each mortgage servicer, and ensure accountability in the Home Affordable Modification Program (HAMP). Expand the Community Reinvestment Act (CRA) to promote responsible lending and investment. The CRA has been effective in encouraging banks to provide sound loans, investments and services in low- and moderate-income communities, consistent with bank safety and soundness. Changes in the financial services landscape, however, have limited the CRA’s overall scope and effectiveness. The CRA regulations and enforcement must be modernized to keep pace with industry practices by: • Explicitly considering the race and ethnicity of borrowers and neighborhoods, not just income, when
determining whether institutions are meeting community credit needs.
14Bethany, McLean, “The ABCs of QRM.” Slate, February 10, 2011. Available: http://www.slate.com/id/2284673. 15National Community Reinvestment Coalition, "Working Class Families Arbitrarily Blocked from Accessing to Credit: NCRC's Fair
Lending Investigation of Credit Score Restrictions by Federal Housing Administration-Approved Lenders.” December 2010.

Page 9
• Extending banks’ CRA assessment areas beyond brick and mortar branches to all areas in which they are conducting business.
• Requiring that public input plays a meaningful role in decisions on mergers and other financial expansion activities.
• Conducting rigorous CRA examinations that hold banks and their affiliates accountable for their
performance in low- and moderate-income communities, and communities of color. Such examinations should include a review of the availability and use of mortgage products, including access to affordable 30-year fixed-rate mortgages.
Federal and state regulators must hold lenders accountable and require affordable loan modifications for struggling homeowners. The 50 State Attorneys General, which are in the process of negotiating a settlement agreement with the country’s five largest mortgage servicers, should insist upon a strong settlement that requires mortgage servicers and lenders to enter into affordable loan modifications, including principal write-downs, that keep homeowners in their homes. Prioritize fair lending enforcement. The new Consumer Financial Protection Bureau, the Department of Justice, and other federal regulators must engage in meaningful fair lending enforcement and vigorously investigate fair lending violations by banks, including in their loan modification programs.
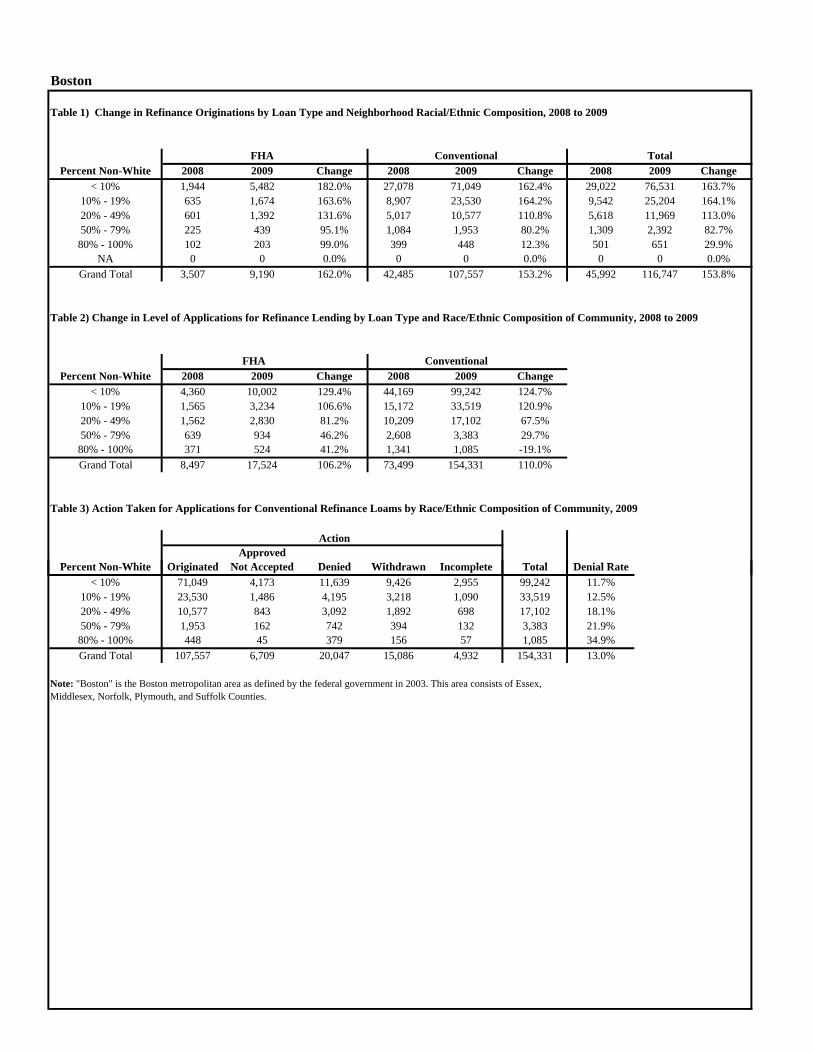
Boston
Table 1) Change in Refinance Originations by Loan Type and Neighborhood Racial/Ethnic Composition, 2008 to 2009
FHA Conventional TotalPercent Non-White 2008 2009 Change 2008 2009 Change 2008 2009 Change
< 10% 1,944 5,482 182.0% 27,078 71,049 162.4% 29,022 76,531 163.7%10% - 19% 635 1,674 163.6% 8,907 23,530 164.2% 9,542 25,204 164.1%20% - 49% 601 1,392 131.6% 5,017 10,577 110.8% 5,618 11,969 113.0%50% - 79% 225 439 95.1% 1,084 1,953 80.2% 1,309 2,392 82.7%80% - 100% 102 203 99.0% 399 448 12.3% 501 651 29.9%
NA 0 0 0.0% 0 0 0.0% 0 0 0.0%Grand Total 3,507 9,190 162.0% 42,485 107,557 153.2% 45,992 116,747 153.8%
Table 2) Change in Level of Applications for Refinance Lending by Loan Type and Race/Ethnic Composition of Community, 2008 to 2009
2008 2009 Change 2008 2009 Change< 10% 4,360 10,002 129.4% 44,169 99,242 124.7%
10% - 19% 1,565 3,234 106.6% 15,172 33,519 120.9%20% - 49% 1,562 2,830 81.2% 10,209 17,102 67.5%50% - 79% 639 934 46.2% 2,608 3,383 29.7%80% - 100% 371 524 41.2% 1,341 1,085 -19.1%Grand Total 8,497 17,524 106.2% 73,499 154,331 110.0%
Table 3) Action Taken for Applications for Conventional Refinance Loams by Race/Ethnic Composition of Community, 2009
ActionApproved
P t N Whit O i i t d N t A t d D i d Withd I l t T t l D i l R t
FHA ConventionalPercent Non-White
Percent Non-White Originated Not Accepted Denied Withdrawn Incomplete Total Denial Rate< 10% 71,049 4,173 11,639 9,426 2,955 99,242 11.7%
10% - 19% 23,530 1,486 4,195 3,218 1,090 33,519 12.5%20% - 49% 10,577 843 3,092 1,892 698 17,102 18.1%50% - 79% 1,953 162 742 394 132 3,383 21.9%80% - 100% 448 45 379 156 57 1,085 34.9%Grand Total 107,557 6,709 20,047 15,086 4,932 154,331 13.0%
Note: "Boston" is the Boston metropolitan area as defined by the federal government in 2003. This area consists of Essex, Middlesex, Norfolk, Plymouth, and Suffolk Counties.

Charlotte
Table 1) Change in Refinance Originations by Loan Type and Neighborhood Racial/Ethnic Composition, 2008 to 2009
2008 2009 Change 2008 2009 Change 2008 2009 Change< 10% 822 1,312 59.6% 6,360 13,071 105.5% 7,226 14,625 102.4%
10% - 19% 1,718 2,667 55.2% 7,746 14,171 82.9% 9,551 17,221 80.3%20% - 49% 1,500 2,257 50.5% 4,239 6,128 44.6% 5,827 8,729 49.8%50% - 79% 495 576 16.4% 1,059 1,046 -1.2% 1,574 1,691 7.4%80% - 100% 97 129 33.0% 285 247 -13.3% 386 389 0.8%
NA 1 0 -100.0% 1 0 -100.0% 2 0 -100.0%Grand Total 4,633 6,941 49.8% 19,690 34,663 76.0% 24,566 42,655 73.6%
Table 2) Change in Level of Applications for Refinance Lending by Loan and Race/Ethnic Composition of Community, 2008 to 2009
FHA ConventionalPercent Non-White 2008 2009 Change 2008 2009 Change
< 10% 1,952 2,776 42.2% 11,175 19,297 72.7%10% - 19% 3,865 5,499 42.3% 14,734 21,966 49.1%20% - 49% 3,677 5,073 38.0% 10,119 10,890 7.6%50% - 79% 1,266 1,460 15.3% 3,053 2,290 -25.0%80% - 100% 326 415 27.3% 1,005 682 -32.1%
NA 1 1 0.0% 1 5 400.0%Grand Total 11,087 15,224 37.3% 40,087 55,130 37.5%
Table 3) Action Taken for Applications for Conventional Refinance Loams by Race/Ethnic Composition of Community, 2009
ActionApproved
P t N Whit O i i t d N t A t d D i d Withd I l t T t l
Percent Non-White
D i l R t
FHA Conventional Total
Percent Non-White Originated Not Accepted Denied Withdrawn Incomplete Total<10 13,071 831 2,903 1,958 534 19,297 15.0%
10 to 20 14,171 941 3,831 2,378 645 21,966 17.4%20 to 49 percent 6,128 492 2,488 1,324 443 10,890 22.9%
50 to 80 1,046 98 723 329 109 2,290 31.4%80 plus 247 22 274 94 45 682 40.2%
NA 0 1 0 4 0 5 0.0%Grand Total 34,663 2,385 10,219 6,087 1,776 55,130 18.5%
Note: "Charlotte" is the Charlotte-Gastonia-Concord N.C.-S.C. Metropolitan Statistical Area as defined by the federal government in 2003. This area consists of five counties in N.C. (Anson, Cabarrus, Gaston, Mecklenburg, & Union plus York County in S.C.
Denial Rate

Chicago
Table 1) Change in Refinance Originations by Loan Type and Neighborhood Racial/Ethnic Composition, 2008 to 2009
Percent Non-White 2008 2009 Change 2008 2009 Change 2008 2009 Change< 10% 3,236 6,123 89.2% 27,599 55,749 102% 30,835 61,872 100.7%
10% - 19% 3,709 6,712 81.0% 28,973 51,957 79.3% 32,682 58,669 79.5%20% - 49% 5,297 8,180 54.4% 29,308 44,232 50.9% 34,605 52,412 51.5%50% - 79% 2,620 3,475 32.6% 10,835 12,114 11.8% 13,455 15,589 15.9%
80% - 100% 3,884 4,331 11.5% 6,961 4,109 -41.0% 10,845 8,440 -22.2%NA 0 0 n/a 1 3 200% 1 3 200%
Grand Total 18,746 28,821 53.7% 103,677 168,164 62.2% 122,423 196,985 60.9%
Table 2) Change in Level of Applications for Refinance Lending by Loan Type and Race/Ethnic Composition of Community, 2008 to 2009
Percent Non-White 2008 2009 Change 2008 2009 Change< 10% 6,073 10,655 75.4% 46,945 80,043 70.5%
10% - 19% 7,369 11,722 59.1% 50,835 76,792 51.1%20% - 49% 10,813 15,096 39.6% 57,733 70,326 21.8%50% - 79% 5,962 7,231 21.3% 24,797 22,002 -11.3%
80% - 100% 9,102 9,814 7.8% 23,645 11,267 -52.3%NA 0 0 n/a 2 4 100%
Grand Total 39,319 54,518 38.7% 203,957 260,434 27.7%
Table 3) Action Taken for Applications for Conventional Refinance Loams by Race/Ethnic Composition of Community, 2009
ActionApproved
Percent Non-White Originated Not Accepted Denied Withdrawn Incomplete Total
FHA Conventional Total
Denial Rate
FHA Conventional
< 10% 55,749 4,296 11,318 6,310 2,370 80,043 14.1%10% - 19% 51,957 4,457 114,900 6,350 2,538 76,792 15.0%20% - 49% 44,232 4,358 12,853 6,422 2,461 70,326 18.3%50% - 79% 12,114 1,334 5,365 2,194 995 22,002 24.4%
80% - 100% 4,109 615 4,386 1,360 797 11,267 38.9%NA 3 1 0 0 0 4 0.0%
Grand Total 168,164 15,061 45,412 22,636 9,161 260,434 17.4%
Note: "Chicago" consists of Cook, DuPage, Lake, Kane, McHenry, and Will Counties.

Cleveland
Table 1) Change in Refinance Originations by Loan Type and Neighborhood Racial/Ethnic Composition, 2008 to 2009
Percent Non-White 2008 2009 Change 2008 2009 Change 2008 2009 Change< 10% 2,238 3,775 68.7% 7,776 17,707 127.7% 10,014 21,482 114.5%
10% - 19% 473 669 41.4% 1,319 2,901 119.9% 1,792 3,570 99.2%20% - 49% 358 469 31.0% 748 1,170 56.4% 1,106 1,639 48.2%50% - 79% 259 251 -3.1% 304 293 -3.6% 563 544 -3.4%
80% - 100% 184 156 -15.2% 315 171 -45.7% 499 327 -34.5%NA 0 1 0.0% 1 4 1 5 0.0%
Grand Total 3,512 5,321 51.5% 10,463 22,246 112.6% 13,975 27,567 97.3%
Table 2) Change in Level of Applications for Refinance Lending by Loan Type and Race/Ethnic Composition of Community, 2008 to 2009
FHA ConventionalPercent Non-White 2008 2009 Change 2008 2009 Change
< 10% 5,017 7,859 56.6% 17,121 27,899 63.0%10% - 19% 1,119 1,529 36.6% 3,502 4,997 42.7%20% - 49% 1,001 1,184 18.3% 2,597 2,345 -9.7%50% - 79% 724 697 -3.7% 1,526 908 -40.5%
80% - 100% 661 549 -16.9% 1,906 876 -54.0%NA 0 2 0.0% 4 9 125.0%
Grand Total 8,522 11,820 38.7% 26,656 37,034 38.9%
Table 3) Action Taken for Applications for Conventional Refinance Loams by Race/Ethnic Composition of Community, 2009
ActionApproved
Percent Non-White Originated Not Accepted Denied Withdrawn Incomplete Total Denial Rate< 10% 17,707 1,412 5,187 2,518 1,075 27,899 18.6%
10% - 19% 2,901 261 1,115 476 244 4,997 22.3%20% - 49% 1,170 157 641 261 116 2,345 27.3%50% - 79% 293 63 388 112 52 908 42.7%
80% - 100% 171 54 526 73 52 876 60.0%NA 4 1 4 0 0 9 44.4%
Grand Total 22,246 1,948 7,861 3,440 1,539 37,034 21.2%
Note: "Cleveland" is the Cleveland Metropolitan Statistical Area, which consists of five counties: Cuyahoga, Geauga, Lake, Loraine, and Medina.
FHA Conventional Total

Los Angeles
Table 1) Change in Refinance Originations by Loan Type and Neighborhood Racial/Ethnic Composition, 2008 to 2009
Percent Non-White 2008 2009 Change 2008 2009 Change 2008 2009 Change< 10% 0 6 n/a 301 909 202.0% 301 915 204.0%
10% - 19% 41 331 707.3% 6,261 16,539 164.2% 6,302 16,870 167.7%20% - 49% 445 2,822 534.2% 19,532 47,679 144.1% 19,977 50,501 152.8%50% - 79% 524 2,617 399.4% 14,634 25,349 73.2% 15,158 27,966 84.5%
80% - 100% 724 2,909 301.8% 18,345 16,624 -9.4% 19,069 19,533 2.4%NA 2 16 700.0% 233 170 -27.0% 235 186 -20.9%
Grand Total 1,736 8,701 401.2% 59,306 107,270 80.9% 61,042 115,971 90.0%
Table 2) Change in Level of Applications for Refinance Lending by Loan Type and Race/Ethnic Composition of Community, 2008 to 2009
FHA ConventionalPercent Non-White 2008 2009 Change 2008 2009 Change
< 10% 5 17 240.0% 561 1,446 157.8%10% - 19% 200 825 312.5% 12,779 27,048 111.7%20% - 49% 1,996 6,622 231.8% 42,591 76,438 79.5%50% - 79% 2,218 6,721 203.0% 37,192 45,162 21.4%
80% - 100% 3,694 8,704 135.6% 55,425 36,528 -34.1%NA 6 34 466.7% 140 291 107.9%
Grand Total 8,119 22,923 182.3% 148,688 186,913 25.7%
Table 3) Action Taken for Applications for Conventional Refinance Loams by Race/Ethnic Composition of Community, 2009
ActionApproved
Percent Non-White Originated Not Accepted Denied Withdrawn Incomplete Total Denial Rate< 10% 909 99 243 155 40 1,446 16.8%
10% - 19% 16,539 1,784 4,808 3,075 842 27,048 17.8%20% - 49% 47,679 5,005 12,758 8,714 2,282 76,438 16.7%50% - 79% 25,349 3,335 9,489 5,422 1,567 45,162 21.0%
80% - 100% 16,624 2,786 10,541 4,954 1,623 36,528 28.9%NA 170 16 63 37 5 291 21.6%
Grand Total 107,270 13,025 37,902 22,357 6,359 186,913 20.3%
TotalFHA Conventional
Note: "Los Angeles" is defined as the metro area consisting of Los Angeles County.

New York
Table 1) Change in Refinance Originations by Loan Type and Neighborhood Racial/Ethnic Composition, 2008 to 2009
Percent Non-White 2008 2009 Change 2008 2009 Change 2008 2009 Change< 10% 85 206 142.4% 1,280 2,698 110.8% 1,365 2,904 112.7%
10% - 19% 124 253 104.0% 2,867 7,690 168.2% 2,991 7,943 165.6%20% - 49% 237 538 127.0% 4,977 11,609 133.3% 5,214 12,147 133.0%50% - 79% 268 362 35.1% 2,147 3,502 63.1% 2,415 3,864 60.0%
80% - 100% 1,363 2,038 49.5% 5,175 4,445 -14.1% 6,538 6,483 -0.8%Grand Total 2,077 3,397 63.6% 16,446 29,944 82.1% 18,523 33,341 80.0%
Table 2) Change in Level of Applications for Refinance Lendinb by Loan Type and Race/Ethnic Composition of Community, 2008 to 2009
FHA ConventionalPercent Non-White 2008 2009 Change 2008 2009 Change
< 10% 309 617 99.7% 3,120 5,566 78.4%10% - 19% 459 876 90.8% 6,284 13,918 121.5%20% - 49% 955 1,777 86.1% 12,179 23,688 94.5%50% - 79% 819 1,273 55.4% 6,567 8,282 26.1%
80% - 100% 4,340 5,989 38.0% 19,929 14,534 -27.1%Grand Total 8,890 12,541 41.1% 48,079 65,988 37.2%
Table 3) Action Taken for Applications for Conventional Refinance Loams by Race/Ethnic Composition of Community, 2009
ApprovedPercent Non-White Originated Not Accepted Denied Withdrawn Incomplete Total Denial Rate
< 10% 2,698 427 1,356 805 280 5,566 24.4%10% - 19% 7,690 996 3,087 1,498 647 13,918 22.2%20% - 49% 11,609 1,789 6,055 2,901 1,334 23,688 25.6%50% - 79% 3,502 615 2,555 1,050 560 8,282 30.9%
80% - 100% 4,445 1,141 5,788 2,019 1,141 14,534 39.8%Grand Total 29,944 4,968 18,841 8,273 3,962 65,988 28.6%
Note: "New York City" consists of the following counties: Bronx, Kings (Brooklyn), New York (Manhattan), Queens and Richmond (Staten Island).
Action
FHA Conventional Total

Rochester
Table 1) Change in Refinance Originations by Loan Type and Neighborhood Racial/Ethnic Composition, 2008 to 2009
FHA Convential TotalPercent Non-White 2008 2009 Change 2008 2009 Change 2008 2009 Change
< 10% 722 1,143 58.3% 2,621 6,038 130.4% 3,343 7,181 114.8%10% - 19% 235 388 65.1% 688 1,585 130.4% 923 1,973 113.8%20% - 49% 90 135 50.0% 169 221 30.8% 259 356 37.5%50% - 79% 40 69 72.5% 67 88 31.3% 107 157 46.7%80% - 100% 15 18 20.0% 35 19 -45.7% 50 37 -26.0%Grand Total 1,102 1,753 59.1% 3,580 7,951 122.1% 4,682 9,704 107.3%
Table 2) Change in Level of Applications for Refinance Lending by Loan Type and Race/Ethnic Composition of Community, 2008 to 2009
FHA CoventionalPercent Non-White 2008 2009 Change 2008 2009 Change
< 10% 1,831 2,683 46.5% 6,670 9,436 41.5%10% - 19% 589 898 52.5% 2,022 2,645 30.8%20% - 49% 260 290 11.5% 683 486 -28.8%50% - 79% 146 149 2.1% 428 228 -46.7%80% - 100% 78 62 -20.5% 266 102 -61.7%Grand Total 2,904 4,082 40.6% 10,069 12,897 28.1%
Table 3) Action Taken for Applications for Conventional Refinance Loams by Race/Ethnic Composition of Community, 2009
ActionApproved
Percent Non-White Originated Not Accepted Denied Withdrawn Incomplete Total Denial Rate< 10% 6,038 507 1,472 1,023 396 9,436 15.6%
10% - 19% 1,585 168 420 346 126 2,645 15.9%20% - 49% 221 29 130 69 37 486 26.7%50% - 79% 88 20 80 23 17 228 35.1%80% - 100% 19 8 59 8 8 102 57.8%Grand Total 7,951 732 2,161 1,469 584 12,897 16.8%
Note: "Rochester" is the Rochester NY Metropolitan Statistical Area as defined by the federal government in 2003. The area consists of five counties: Livingston, Monroe, Ontario, Orleans and Wayne.

All
Table 1) 7-city sum Counts of Refinance Originations by Loan Type and Neighborhood Racial/Ethnic Composition, 2008 to 2009
FHAPercent Non-White 2008 2009 2008 2009 FHA Conventional
< 10% 9,047 18,047 73,015 167,221 99.5% 129.0%10% - 19% 6,935 12,694 56,761 118,373 83.0% 108.5%20% - 49% 8,528 15,793 63,990 121,616 85.2% 90.1%50% - 79% 4,431 7,789 30,130 44,345 75.8% 47.2%
80% - 100% 6,369 9,784 31,515 26,063 53.6% -17.3%NA 3 17 236 177 466.7% -25.0%
Grand Total 35,313 64,124 255,647 477,795 81.6% 86.9%
Table 2) 7-city Denial Rates for Refinance Lending by Loan Type and Race/Ethnic Composition of Community, 2008 to 2009
FHA ConventionalCompleted Completed
Precent Non-White Denials Applications Denial Rate Denials Applications Denial Rate< 10% 8,255 33,925 24.3% 34,118 242,929 14.0%
10% - 19% 5,846 24,377 24.0% 28,946 180,885 16.0%20% - 49% 8,438 32,811 25.7% 38,017 201,275 18.9%50% - 79% 5,446 18,435 29.5% 19,342 82,255 23.5%
80% - 100% 8,592 26,046 33.0% 21,953 65,074 33.7%NA 0 3 0.0% 67 309 21.7%ALL 36,577 135,597 27.0% 142,443 772,727 18.4%
Table 3) 7-City Sums of Actions Taken for Applications for Conventional Refinance Loams by Race/Ethnic Composition of Community, 2009
ApprovedPercent Non-White Originated Not Accepted Denied Withdrawn Incomplete Total Denial Rate
Conventional Change
<10 167,221 11,745 34,118 22,195 7,650 75,708 14.0%10 to 20 118,373 10,093 132,356 17,341 6,132 62,512 46.6%
20 to 49 percent 121,616 12,673 38,017 21,583 7,371 79,644 18.9%50 to 80 44,345 5,627 19,342 9,524 3,432 37,925 23.5%80 plus 26,063 4,671 21,953 8,664 3,723 39,011 33.7%
NA 177 19 67 41 5 132 21.7%Grand Total 477,795 44,828 245,853 79,348 28,313 294,932 28.1%

0% - 13%13% - 20%20% - 40%More than 40%Non-White Population > 50%
Sources: 2009 HMDA data, compiled by Massachusetts Affordable Housing Alliance; 2010 Census data
Boston, MAConventional Refinance Loans: Applications Denied
Lenders denied 13.0% of all conventional refinanceloan applications in Boston in 2009.
Non-white population: Total population excluding non-Hispanic whites.Conventional mortgage loans: Mortgage loans that are not insured orguaranteed by the Federal Housing Administration or Veterans Affairs.
Percentage of Loan Applications Denied, by Census Tract (2009)
© 2011 - NEDAPwww.nedap.org
City of Boston

0% - 18.6%18.6% - 30%30% - 40%40% - 50%More than 50%Non-White Population > 50%
Lenders denied 18.6% of all conventionalrefinance loan applications in Charlotte in 2009.
Charlotte, NCConventional Refinance Loans: Applications Denied
Sources: 2009 HMDA data, compiled by CRA-NC; 2010 Census data
Conventional mortgage loans: Mortgage loans that are not insured or guaranteed by the Federal Housing Administration or Veterans Affairs.
Percentage of Loan Applications Denied, by Census Tract (2009)
Non-white population: Total population excluding non-Hispanic whites.
City of Charlotte
© 2011 - NEDAPwww.nedap.org

Chicago, ILConventional Refinance Loans: Applications Denied
Lake Michigan
0 - 17.4%17.4% - 35%35% - 50%More than 50%Non-White Population > 50%
Sources: 2009 HMDA data, compiled by Woodstock Institute; 2010 Census data
Lenders denied 17.4% of all conventional refinance loan applications in Chicago in 2009.
Conventional mortgage loans: Mortgage loans that are not insured orguaranteed by the Federal Housing Administration (FHA) or Veterans Affairs (VA).
Non-white population: Total population excluding non-Hispanic whites.
Percentage of Loan Applications Denied, by Census Tract (2009)
City of Chicago
© 2011 - NEDAPwww.nedap.org

Lenders denied 21.2% of all conventional refinanceloan applications in Cleveland in 2009.
Legend0% - 21.2%21.2% - 35%35% - 50%50% - 75%More than 75%Non-White Population > 50%
Cleveland, OHConventional Refinance Loans: Applications Denied
© 2011 - NEDAPwww.nedap.org
Sources: 2009 HMDA data, compiled by Woodstock Institute; 2010 Census data
Lake Erie
City of Cleveland
Conventional mortgage loans: Mortgage loans that are not insured or guaranteed by the Federal Housing Administration or Veterans Affairs.Non-white population: Total population excluding non-Hispanic whites.
Percentage of Loan Applications Denied, by Census Tract (2009)

Sources: 2009 HMDA data, compiled by California Reinvestment Coalition; 2010 Census data
Los Angeles, CAConventional Refinance Loans: Applications Denied
Lenders denied 20.3% of all conventional refinanceloan applications in Los Angeles in 2009.
Conventional mortgage loans: Mortgage loans that are not insured or guaranteed by the Federal Housing Administration or Veterans Affairs.Non-white population: Total population excluding non-Hispanic whites.
Legend0% - 20.3%20.3% - 30%30% - 40%More than 40%
Non-White Population > 50%
Percentage of Loan Applications Denied, by Census Tract (2009)
Pacific Ocean
City of Los Angeles
© 2011 - NEDAPwww.nedap.org

New York, NYConventional Refinance Loans: Applications Denied
Manhattan
Bronx
Queens
Brooklyn
Staten Island
Sources: 2009 HMDA data; 2010 Census data
Lenders denied 28.6% of all conventional refinance loan applications in New York City in 2009.
Conventional mortgage loans: Mortgage loans that are not insured orguaranteed by the Federal Housing Administration or Veterans Affairs.Non-white population: Total population excluding non-Hispanic whites.
0% - 28.6%28.6% - 35%35% - 40%More than 40%
Non-White Population > 50%
Percentage of Loan Applications Denied,by Census Tract (2009)
© 2011 - NEDAPwww.nedap.org

Lenders denied 16.8% of all conventionalrefinance loan applications in Rochester in 2009.
Rochester, NYConventional Refinance Loans: Applications Denied
Sources: 2009 HMDA data, compiled by Empire Justice Center; 2010 Census data
Legend0% - 16.8%16.8% - 25%25% - 40%40% - 55%More than 55%Non-White Population > 50%
Lake Ontario
Conventional mortgage loans: Mortgage loans that are not insured or guaranteed by the Federal Housing Administration or Veterans Affairs.Non-white population: Total population excluding non-Hispanic whites.
Percentage of Loan Applications Denied, by Census Tract (2009)
© 2011 - NEDAPwww.nedap.org
City of Rochester
Related Documents