General rights Copyright and moral rights for the publications made accessible in the public portal are retained by the authors and/or other copyright owners and it is a condition of accessing publications that users recognise and abide by the legal requirements associated with these rights. • Users may download and print one copy of any publication from the public portal for the purpose of private study or research. • You may not further distribute the material or use it for any profit-making activity or commercial gain • You may freely distribute the URL identifying the publication in the public portal If you believe that this document breaches copyright please contact us providing details, and we will remove access to the work immediately and investigate your claim. Downloaded from orbit.dtu.dk on: Jul 15, 2018 Calibration of surface roughness standards Thalmann, R.; Nicolet, A.; Meli, F.; Picotto, G. B.; Matus, M.; Carcedo, L.; Hemming, B.; Ganioglu, O.; De Chiffre, Leonardo; Saraiva, F.; Bergstrand, S.; Zelenika, S.; Tonmueanwai, A.; Tsai, C.S.; Shihua, W.; Kruger, O.; de Souza, M. M.; Salgado, J. A.; Ramotowski, Z. Published in: Metrologia Link to article, DOI: 10.1088/0026-1394/53/1A/04001 Publication date: 2016 Document Version Publisher's PDF, also known as Version of record Link back to DTU Orbit Citation (APA): Thalmann, R., Nicolet, A., Meli, F., Picotto, G. B., Matus, M., Carcedo, L., ... Ramotowski, Z. (2016). Calibration of surface roughness standards. Metrologia, 53(1A), [04001]. DOI: 10.1088/0026-1394/53/1A/04001

Welcome message from author
This document is posted to help you gain knowledge. Please leave a comment to let me know what you think about it! Share it to your friends and learn new things together.
Transcript
General rights Copyright and moral rights for the publications made accessible in the public portal are retained by the authors and/or other copyright owners and it is a condition of accessing publications that users recognise and abide by the legal requirements associated with these rights.
• Users may download and print one copy of any publication from the public portal for the purpose of private study or research. • You may not further distribute the material or use it for any profit-making activity or commercial gain • You may freely distribute the URL identifying the publication in the public portal
If you believe that this document breaches copyright please contact us providing details, and we will remove access to the work immediately and investigate your claim.
Downloaded from orbit.dtu.dk on: Jul 15, 2018
Calibration of surface roughness standards
Thalmann, R.; Nicolet, A.; Meli, F.; Picotto, G. B.; Matus, M.; Carcedo, L.; Hemming, B.; Ganioglu, O.; DeChiffre, Leonardo; Saraiva, F.; Bergstrand, S.; Zelenika, S.; Tonmueanwai, A.; Tsai, C.S.; Shihua, W.;Kruger, O.; de Souza, M. M.; Salgado, J. A.; Ramotowski, Z.Published in:Metrologia
Link to article, DOI:10.1088/0026-1394/53/1A/04001
Publication date:2016
Document VersionPublisher's PDF, also known as Version of record
Link back to DTU Orbit
Citation (APA):Thalmann, R., Nicolet, A., Meli, F., Picotto, G. B., Matus, M., Carcedo, L., ... Ramotowski, Z. (2016). Calibrationof surface roughness standards. Metrologia, 53(1A), [04001]. DOI: 10.1088/0026-1394/53/1A/04001
Federal Institute of Metrology METAS
Key Comparison EURAMET.L-K8.2013
Calibration of surface roughness standards
EURAMET project #1245
Final report
Rudolf Thalmann (METAS),
Anaïs Nicolet (METAS), Felix Meli (METAS), Gian Bartolo Picotto (INRIM), Michael Matus (BEV), Laura Carcedo (CEM), Antti Lassila (MIKES), Okhan Ganioglu (UME), Leonardo De
Chiffre (DTU-CGM), Fernanda Saraiva (IPQ), Sten Bergstrand (SP), Slobodan Zelenika (DMDM), Anusorn Tonmueanwai (NIMT), Chin-Lung Tsai (CMS/ITRI), Wang Shihua
(NMC/A*STAR), Oelof Kruger (NMISA), Marcos Motta de Souza (INMETRO), José Antonio Salgado (LNE), Zbigniew Ramotowski (GUM)
Wabern, October 2015
EURAMET.L-K8.2013 Calibration of surface roughness standards Final report
Pg. 2/57
Contents
1 Document control .................................................................................................................................4
2 Introduction ..........................................................................................................................................4
3 Organization ..........................................................................................................................................4
3.1 Participants ...................................................................................................................................4
3.2 Schedule ........................................................................................................................................6
4 Artefacts ................................................................................................................................................7
4.1 Type A2 standard ..........................................................................................................................7
4.2 Type C1 standard ..........................................................................................................................7
4.3 Type D1 standard ..........................................................................................................................8
4.4 Type D1 standard ..........................................................................................................................8
4.5 Additional type C1 standard .........................................................................................................8
4.6 Type F1 Reference data (softgauge) .............................................................................................8
5 Measuring instructions .........................................................................................................................9
5.1 Measurands ..................................................................................................................................9
5.2 Measurement and evaluation for type A2 artefact ......................................................................9
5.3 Measurement conditions for type C1 and D1 artefacts ............................................................ 10
5.4 Evaluation of type F1 reference data ......................................................................................... 10
6 Stability of artefacts ........................................................................................................................... 10
6.1 Stability measurements ............................................................................................................. 10
6.2 Condition of artefacts at the end of comparison ....................................................................... 14
6.3 Description of the damages observed at the end of the comparison ....................................... 16
7 Results ................................................................................................................................................ 17
7.1 Results and standard uncertainties as reported by participants ............................................... 17
8 Analysis of the measurement results................................................................................................. 17
8.1 Calculation of the KCRV and of the Degrees of Equivalence ..................................................... 17
8.2 Results, Reference values and Degrees of Equivalence ............................................................. 19
8.3 Summary of the En values .......................................................................................................... 43
8.4 Discussion of results ................................................................................................................... 43
8.5 Changes to results after Draft A report ..................................................................................... 44
8.5.1 BEV request from 13.02.2015 ............................................................................................ 44
8.5.2 NMISA comment from 06.03.2015 and report from 22.04.2015 ...................................... 44
8.5.3 IPQ request from 12.03.2015 ............................................................................................. 44
8.6 Comments received after Draft B.1 report ................................................................................ 45
8.6.1 INMETRO comment from 29.04.2015 ............................................................................... 45
8.6.2 NMC/A*STAR comment from 18.05.2015 ......................................................................... 45
8.6.3 GUM comment from 19.05.2015 ....................................................................................... 45
EURAMET.L-K8.2013 Calibration of surface roughness standards Final report
Pg. 3/57
8.7 En-values with results revised after draft A and draft B.1 report .............................................. 46
8.8 Linking of result to other comparisons ...................................................................................... 47
9 Softgauges .......................................................................................................................................... 48
9.1 Description of the files ............................................................................................................... 48
9.2 Results of participants................................................................................................................ 49
9.3 Graphical representation of deviations from the mean ............................................................ 50
10 Conclusions .................................................................................................................................... 51
11 References ..................................................................................................................................... 52
12 Appendix: Equipment of the participating laboratories ................................................................ 53
13 Appendix: Traceability of the participating laboratories ............................................................... 54
14 Appendix: CMCs as declared by the participating laboratories in the CIPM MRA ........................ 55
EURAMET.L-K8.2013 Calibration of surface roughness standards Final report
Pg. 4/57
1 Document control
Version Draft B.1 Issued on April 2015. Version Draft B.2 Issued on June 2015, comments participants taken in to account. Version Draft B.3 Issued on August 2015, minor typos and comment in section 8.7. Version Draft B.4 Issued on September 2015, minor editorial change. Final report Issued on October 2015, taking into account comments from CCL WG-MRA
reviewers
2 Introduction
The metrological equivalence of national measurement standards and of calibration certificates issued by national metrology institutes is established by a set of key and supplementary comparisons chosen and organized by the Consultative Committees of the CIPM or by the regional metrology organizations in collaboration with the Consultative Committees.
At its meeting in October 2012, the EURAMET Technical Committee for length, EURAMET-TCL, decided upon a key comparison on the calibration of surface roughness standards, named EURAMET.L-K8.2013, with METAS as the pilot laboratory. The comparison was registered in January 2013, measurements were made between February 2013 and February 2015. The protocol followed the instructions of the preceding comparison EURAMET.L-K8 [1] as closely as possible.
3 Organization
3.1 Participants
Table 1. List of participant laboratories and their contacts.
Laboratory Code
Contact person, Laboratory Phone, Fax, email
METAS (Pilot)
Ruedi Thalmann Federal Institute of Metrology METAS Lindenweg 50 CH-3003-Bern-Wabern Switzerland
Tel. +41 58 387 03 85 Fax +41 58 387 02 10 e-mail: [email protected]
LNE José Antonio Salgado LNE Laboratoire national de métrologie et d’essais 1, rue Gaston Boissier F-75015 Paris France
Tel. +33 1 40 43 3777 Fax +33 1 40 43 3737 e-mail: [email protected]
INRIM Gian Bartolo Picotto Istituto Nazionale di Ricerca Metrologica Strade delle Cacce, 91, 10135 Torino Italy
Tel : 39 11 3919 969 or 973 Fax : 39 11 3919 959 e-mail : [email protected]
BEV Michael Matus Bundesamt für Eich- und Vermessungswesen BEV Arltgasse 35 A-1160 Wien Austria
Tel. +43 1 21110 6540 Fax +43 1 21110 6000 e-mail: [email protected]
CEM Laura Carcedo Head of the Surface Quality Laboratory Length Area CENTRO ESPAÑOL DE METROLOGÍA
Tel. +34 918074716 Fax +34 918074807 e-mail: [email protected]
EURAMET.L-K8.2013 Calibration of surface roughness standards Final report
Pg. 5/57
Alfar, 2 - Tres Cantos 28760 Madrid Spain
MIKES Antti Lassila Mittatekniikan keskus - Centre for Metrology and Accreditation (MIKES) P.O. box 9 (Tekniikantie 1) FIN-02151 Espoo Finland
Tel: +358 2950 54413 GSM: +358 40 7678584 Fax: +358 2950 54 499 e-mail: [email protected]
UME Okhan Ganioglu TÜBİTAK UME Ulusal Metroloji Enstitüsü TÜBİTAK Gebze Yerleşkesi Barış Mah. Dr.Zeki Acar Cad. No:1 41470 Gebze / Kocaeli Turkey
Tel : +90 262 679 50 00 (ext. 5300) Fax : +90 262 679 50 01 e-mail : [email protected]
DTU-CGM Leonardo De Chiffre DTU Mekanik – CGM Produktionstorvet 427A DK-2800 Kgs. Lyngby Denmark
Tel. +45 45 25 47 60 Fax +45 45 93 01 90 e-mail: [email protected]
GUM Zbigniew Ramotowski Central Office of Measures (GUM) Director of Length & Angle Department ul. Elektoralna 2 00-139 Warszawa Poland
Tel.: +48 22 581 95 43 Fax: +48 22 620 83 78 e-mail: [email protected]
IPQ Fernanda Saraiva Instituto Portugês da Qualidade Rua António Gião, 2 2829-513 CAPARICA Portugal
Tel: + 351 21 2948160 Fax: + 351 21 2848188 e-mail: [email protected]
SP Sten Bergstrand SP Technical Research Institute of Sweden Measurement Technology Box 857 SE-501 15 Borås Sweden
Tel. +46 10 516 57 73 Fax +46 10 516 56 20 e-mail: [email protected]
DMDM Slobodan Zelenika Directorate of Measures and Precious Metals Mike Alasa 14 11000 Belgrade Serbia
Tel : +381112024421 Fax : +381112181668 e-mail: [email protected]
NIMT Anusorn Tonmueanwai Dimensional Metrology Department National Institute of Metrology Thailand 3 / 4-5 Moo 3, Klong 5, Klong Luang, Pathumthani 12120 Thailand
Tel : +662 5775100 ext 1202 Fax : +662 5775088 e-mail: [email protected]
CMS/ITRI Chin-Lung Tsai ( Walter Tsai ) CMS/ITRI Bldg. 16, No. 321, Sec. 2, Kuang Fu Rd. Hsinchu city 30011 Taiwan (R.O.C.)
Tel: +886 3 5743764 Fax: +886 3 5726445 e-mail: [email protected]
NMC/ A*STAR
Wang Shihua NMC/A*STAR
Tel : 6279 1941 Fax : 6279 1992
EURAMET.L-K8.2013 Calibration of surface roughness standards Final report
Pg. 6/57
1 Science Park Drive Singapore 118221 Singapore
e-mail: [email protected]
NMISA Oelof Kruger Bld 5 CSIR campus Meiring Naude road, Brumeria Pretoria South Africa
Tel : + 27 12 841 4340 Fax : + 27 12 841 4458 e-mail: [email protected]
INMETRO Marcos Motta de Souza Dimensional Metrology Laboratory INMETRO - National Institute of Metrology Quality and Technology Av. N.Sra. das Graças, 50 Xérem, Duque de Caxias, RJ. Brazil
Tel. +55 21 2679 9726 Fax +55 21 2679 9597 e-mail: [email protected]
3.2 Schedule
Details of the planned and actual schedules as well as date of receipt of results from the participants are shown in Table 2. The MRA states that the results should be sent within six weeks of completing the measurements.
Table 2. Schedule of the comparison.
RMO Laboratory Planned date of measurement
Actual date of measurement
Results received
EURAMET METAS Mar 2013 Feb 2013 11.03.2013
DTU-CGM Apr 2013 Apr 2013 14.08.2013
MIKES May 2013 May 2013 21.06.2013
IPQ Jun 2013 Jun 2013 08.08.2013
BEV July 2013 Jul 2013 06.09.2013
SP Aug 2013 Aug 2013 18.10.2013
INRIM Sep 2013 Sep 2013 18.04.2014
LNE Oct 2013 Oct 2013 11.04.2014
CEM Nov 2013 Nov 2013 04.09.2014
GUM Dec 2013 Dec 2013 31.01.2014
METAS Jan 2014 Jan 2014 (stability check)
13.01.2014
DMDM Feb 2013 Feb 2014 13.08.2014
UME Mar 2013 Mar 2014 27.05.2014
APMP NIMT Apr 2013 Apr 2014 06.06.2014
NMC/A*STAR May 2014 May 2014 03.10.2014
CMS/ITRI Jun 2014 Jun 2014 17.10.2014
AFRIMETS NMISA Jul 2014 Dec 2014 10.02.2015
SIM INMETRO Aug 2014 Aug 2014 08.12.2014
EURAMET METAS Sep 2014 Feb 2015 (stability check)
10.02.2015
The original schedule has been changed in the course of the comparison, mainly due to the requirement, that participants after January 2014 needed an ATA carnet and because NMISA was not ready with their equipment in the time slot originally allocated. There were no major transportation or customs problems, except import/export to and from Brazil, which took much more time. This didn't delay the comparison, since they were scheduled at the end of the circulation.
EURAMET.L-K8.2013 Calibration of surface roughness standards Final report
Pg. 7/57
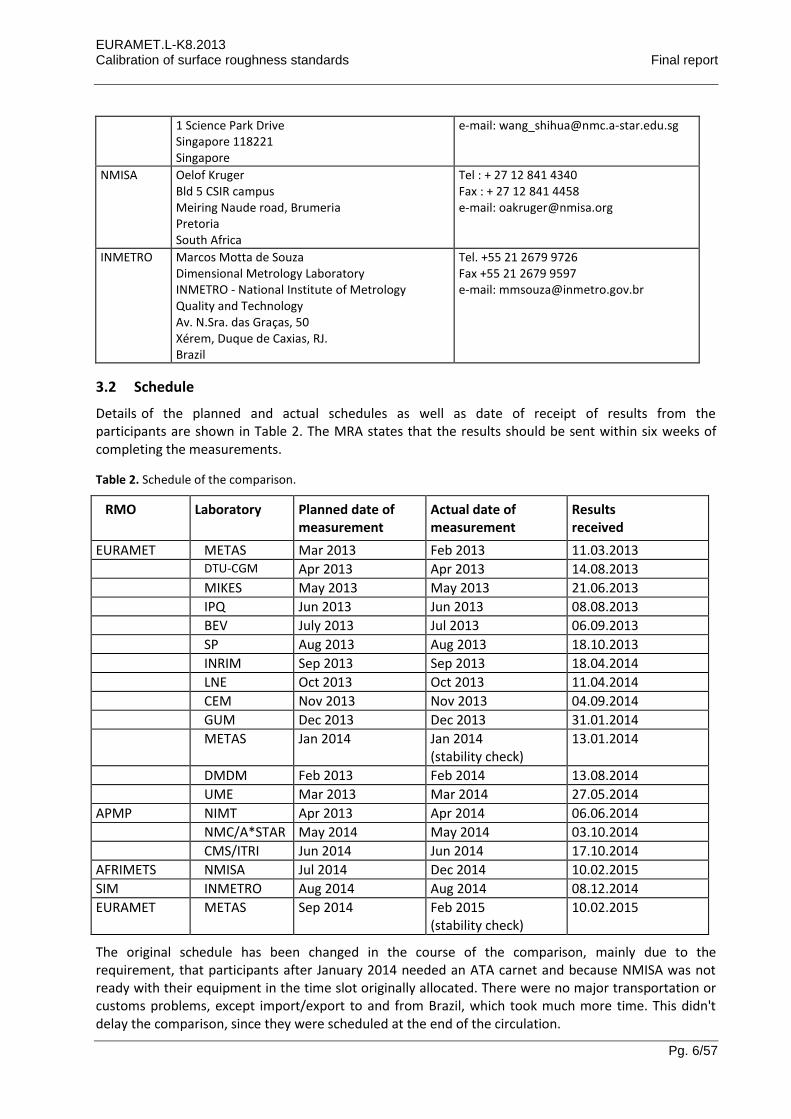
4 Artefacts
Five standards were circulated: one type A2, two type C1 and two type D1 according to ISO 5436-1 [2]. The standards were from different manufacturers and different materials. A plastic case (40 cm x 32 cm x 17 cm) containing 4 wooden boxes with the artefacts and the technical protocol was used for transportation (Figure 1).
Figure 1. Transporting case.
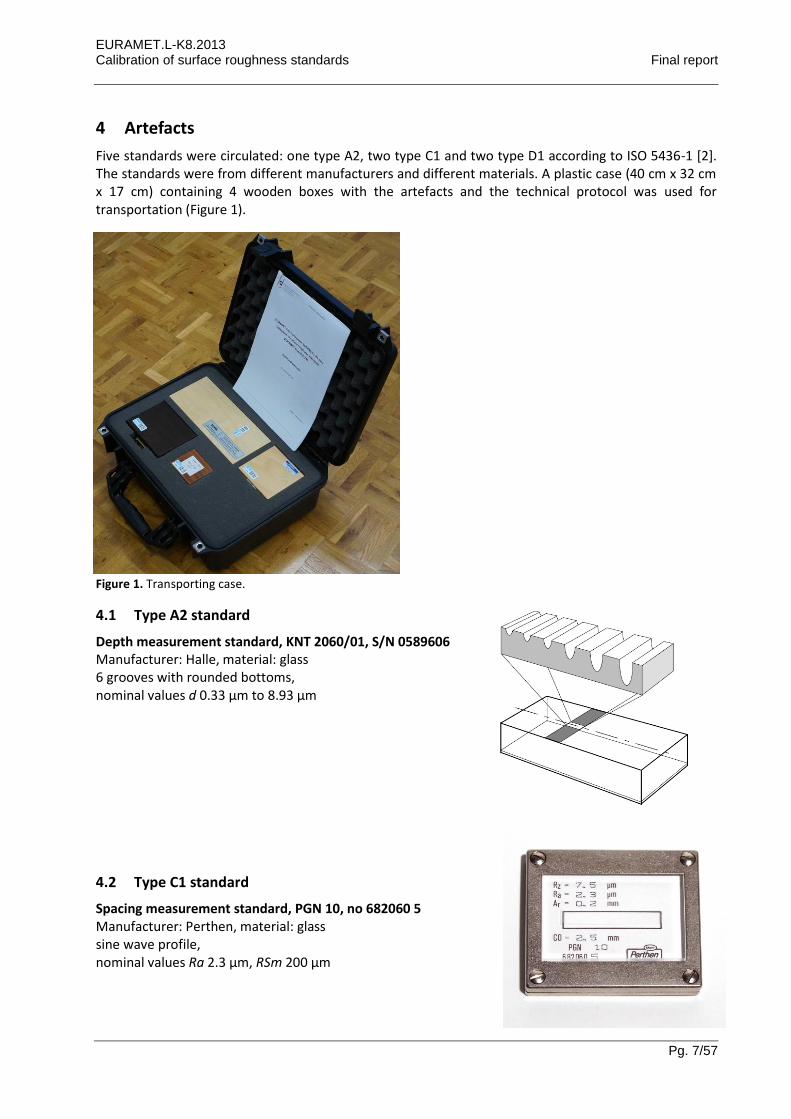
4.1 Type A2 standard
Depth measurement standard, KNT 2060/01, S/N 0589606 Manufacturer: Halle, material: glass 6 grooves with rounded bottoms, nominal values d 0.33 µm to 8.93 µm
4.2 Type C1 standard
Spacing measurement standard, PGN 10, no 682060 5 Manufacturer: Perthen, material: glass sine wave profile, nominal values Ra 2.3 µm, RSm 200 µm
EURAMET.L-K8.2013 Calibration of surface roughness standards Final report
Pg. 8/57
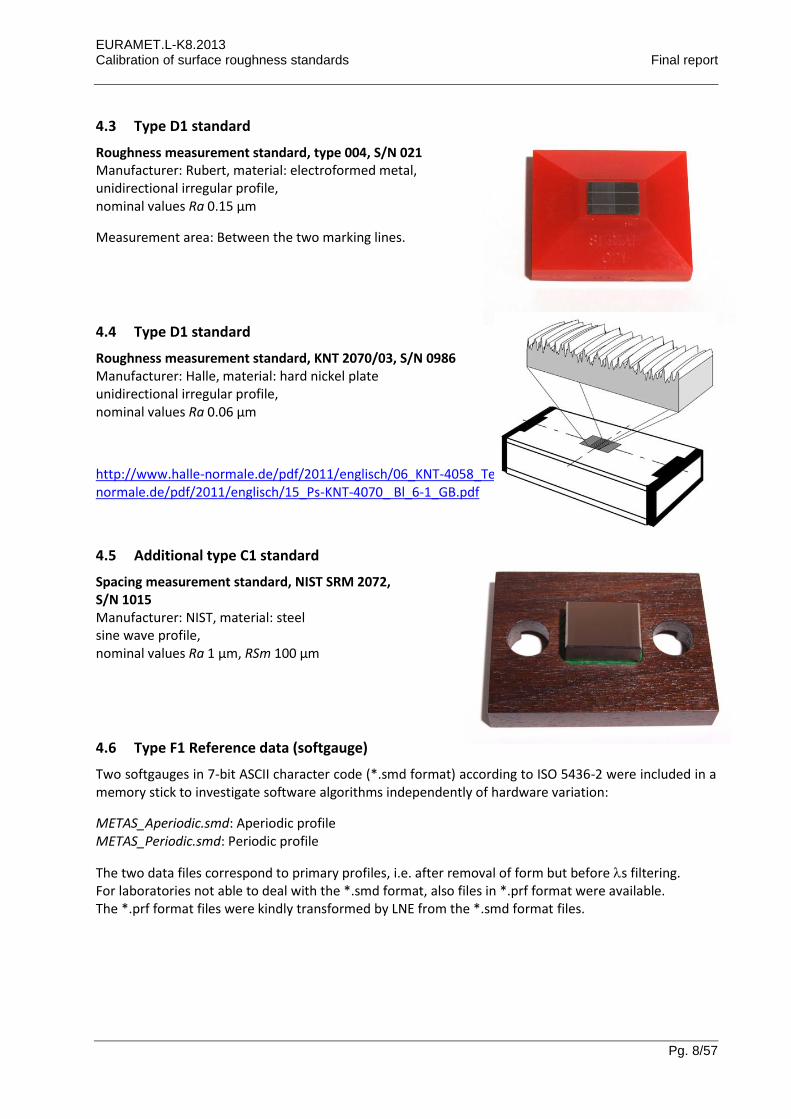
4.3 Type D1 standard
Roughness measurement standard, type 004, S/N 021 Manufacturer: Rubert, material: electroformed metal, unidirectional irregular profile, nominal values Ra 0.15 µm
Measurement area: Between the two marking lines.
4.4 Type D1 standard
Roughness measurement standard, KNT 2070/03, S/N 0986 Manufacturer: Halle, material: hard nickel plate unidirectional irregular profile, nominal values Ra 0.06 µm
http://www.halle-normale.de/pdf/2011/englisch/06_KNT-4058_Text_Bl_2-0_GB.pdfhttp://www.halle-normale.de/pdf/2011/englisch/15_Ps-KNT-4070_ Bl_6-1_GB.pdf
4.5 Additional type C1 standard
Spacing measurement standard, NIST SRM 2072, S/N 1015 Manufacturer: NIST, material: steel sine wave profile, nominal values Ra 1 µm, RSm 100 µm
4.6 Type F1 Reference data (softgauge)
Two softgauges in 7-bit ASCII character code (*.smd format) according to ISO 5436-2 were included in a memory stick to investigate software algorithms independently of hardware variation:
METAS_Aperiodic.smd: Aperiodic profile METAS_Periodic.smd: Periodic profile
The two data files correspond to primary profiles, i.e. after removal of form but before s filtering. For laboratories not able to deal with the *.smd format, also files in *.prf format were available. The *.prf format files were kindly transformed by LNE from the *.smd format files.
EURAMET.L-K8.2013 Calibration of surface roughness standards Final report
Pg. 9/57
5 Measuring instructions
5.1 Measurands
The following parameters were to be determined:
Artefact Parameters Relevant standards
Type A2 KNT 2060/01
d, Pt ISO 5436-1 [2] ISO 4287 [3]
Type C1 PGN 10
Ra, Rq, Rz, Rt, RSm ISO 5436-1 ISO 4287
Type D1 S/N 021
Ra, Rq, Rz, Rt ISO 5436-1 ISO 4287
Type D1 KNT 2070/03
Ra, Rq, Rz, Rt ISO 5436-1 ISO 4287
Type C1 SRM 2072
Ra, Rq, Rz, Rt, RSm ISO 5436-1 ISO 4287
Type F1 Ra, Rq, Rz, Rt, Rsk, (RSm)
ISO 5436-2 ISO 4287
For each parameter, its value and the observed standard deviation had to be reported.
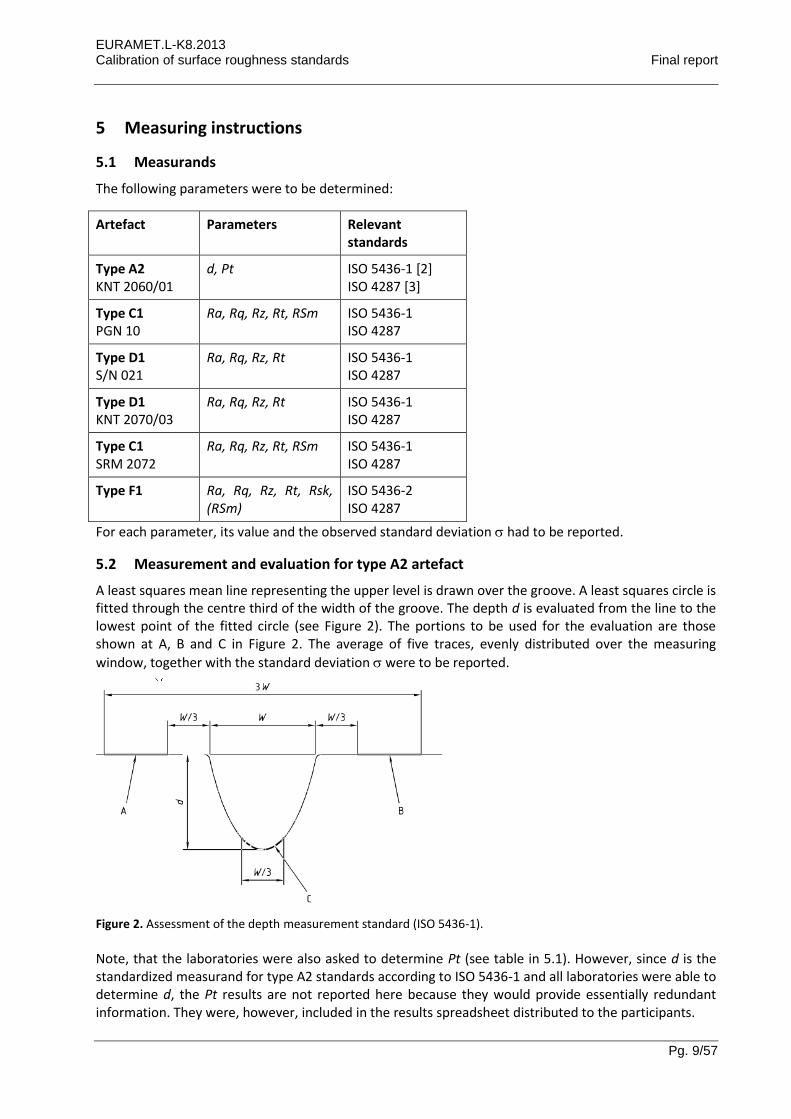
5.2 Measurement and evaluation for type A2 artefact
A least squares mean line representing the upper level is drawn over the groove. A least squares circle is fitted through the centre third of the width of the groove. The depth d is evaluated from the line to the lowest point of the fitted circle (see Figure 2). The portions to be used for the evaluation are those shown at A, B and C in Figure 2. The average of five traces, evenly distributed over the measuring
window, together with the standard deviation were to be reported.
Figure 2. Assessment of the depth measurement standard (ISO 5436-1).
Note, that the laboratories were also asked to determine Pt (see table in 5.1). However, since d is the standardized measurand for type A2 standards according to ISO 5436-1 and all laboratories were able to determine d, the Pt results are not reported here because they would provide essentially redundant information. They were, however, included in the results spreadsheet distributed to the participants.
EURAMET.L-K8.2013 Calibration of surface roughness standards Final report
Pg. 10/57
5.3 Measurement conditions for type C1 and D1 artefacts
The average of twelve traces, evenly distributed over the measuring window, together with the
standard deviation were to be reported. A Gaussian filter according to ISO 16610-21:2011 had to be applied for evaluating the R parameters.
Standard Evaluation length (mm)
c (µm) s (µm) Measuring force (mN)
Sampling spacing (µm)
Tip radius (µm)
Type C1 PGN 10
4.00 800 2.5 < 1 ≤ 0.5 2
Type D1 S/N 021
4.00 800 2.5 < 1 ≤ 0.5 2
Type D1 KNT 2070/03
1.25 250 2.5 < 1 ≤ 0.5 2
Type C1 SRM 2072
4.00 800 2.5 < 1 ≤ 0.5 2
5.4 Evaluation of type F1 reference data
The following evaluation parameters were to be respected:
Standard File name Evaluation length (mm)
c (µm) s (µm)Parameters
F1 aperiodic METAS_Aperiodic.smd 1.25 250 2.5 Ra, Rq, Rz, Rt, Rsk
F1 periodic METAS_Periodic.smd 4.00 800 2.5 Ra, Rq, Rz, Rt, Rsk, RSm
The total profile length is 7 cutoff lengths (7 c). The evaluation length ln was the five central sampling
length lr = c, thus removing one cutoff length on each side in order to avoid end effects.
6 Stability of artefacts
6.1 Stability measurements
METAS measured the samples in February 2013, in January 2014 and in February 2015, i.e. at the beginning, in the middle and at the end of the comparison. Note that only the first result in February 2013 accounts for the key comparison, the other two were to monitor the stability of the samples. For simplicity, the evaluation of these measurement data was done in the same way as for the participant's results, i.e. the deviation from the weighted mean and the En values were calculated for each parameter and each standard.
EURAMET.L-K8.2013 Calibration of surface roughness standards Final report
Pg. 11/57
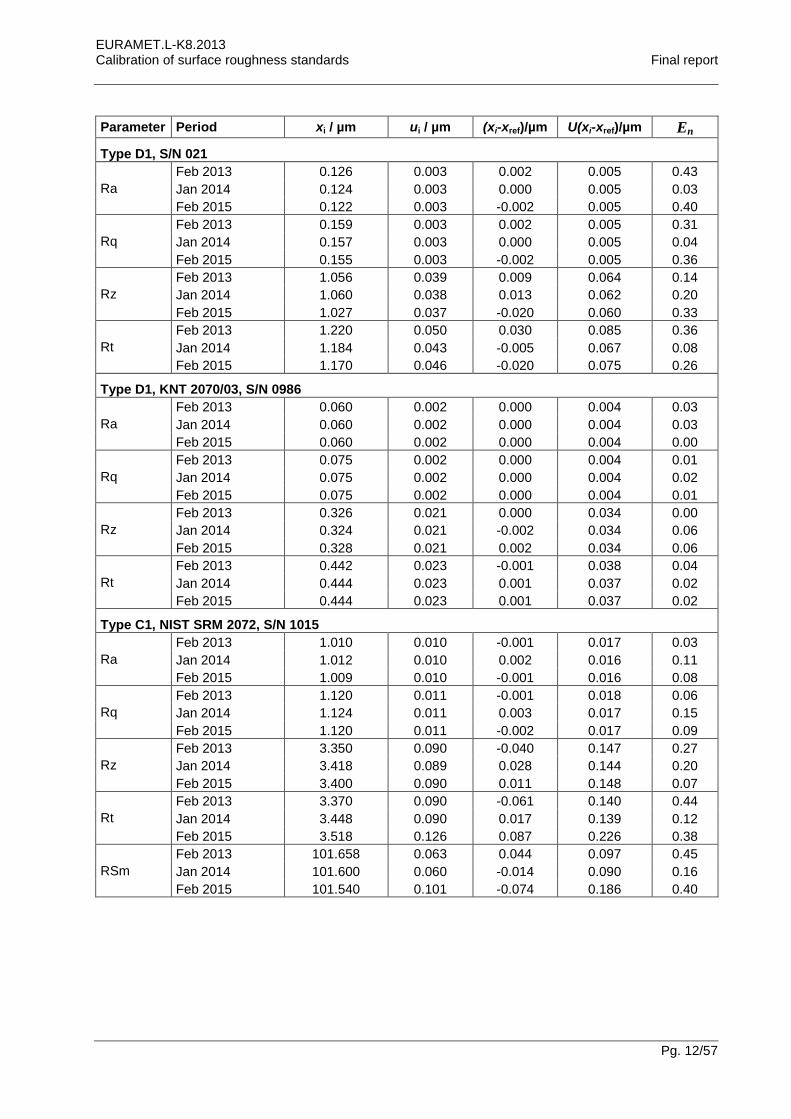
Table 3 shows the results of the stability measurements carried out by the pilot laboratory, where the "reference value" xref is the weighted mean of the three results xi. All En values are smaller than 0.5, which can be interpreted that there is no significant change within the uncertainty.
Table 3. Results of stability measurements by the pilot laboratory.
Parameter Period xi / µm ui / µm (xi-xref)/µm U(xi-xref)/µm En
Type A2, KNT 2060/01, S/N 0589606
R1, d
Feb 2013 0.317 0.010 -0.002 0.016 0.12
Jan 2014 0.315 0.011 -0.004 0.019 0.21
Feb 2015 0.324 0.010 0.005 0.016 0.32
R2, d
Feb 2013 0.405 0.011 -0.001 0.017 0.05
Jan 2014 0.407 0.011 0.001 0.017 0.07
Feb 2015 0.405 0.016 -0.001 0.029 0.03
R3, d
Feb 2013 1.343 0.011 0.001 0.019 0.06
Jan 2014 1.344 0.010 0.002 0.016 0.13
Feb 2015 1.339 0.010 -0.003 0.016 0.18
R4, d
Feb 2013 2.713 0.011 -0.003 0.018 0.17
Jan 2014 2.723 0.012 0.007 0.020 0.35
Feb 2015 2.713 0.011 -0.003 0.018 0.17
R5, d
Feb 2013 5.520 0.011 -0.004 0.018 0.22
Jan 2014 5.533 0.012 0.009 0.020 0.45
Feb 2015 5.520 0.011 -0.004 0.018 0.22
R6, d
Feb 2013 8.915 0.014 0.002 0.022 0.09
Jan 2014 8.934 0.023 0.021 0.043 0.49
Feb 2015 8.906 0.012 -0.007 0.017 0.42
Type C1, PGN 10, no 682060 5
Ra
Feb 2013 2.372 0.018 0.000 0.029 0.01
Jan 2014 2.368 0.018 -0.004 0.029 0.13
Feb 2015 2.375 0.018 0.004 0.029 0.13
Rq
Feb 2013 2.660 0.020 0.002 0.032 0.05
Jan 2014 2.654 0.021 -0.005 0.035 0.14
Feb 2015 2.662 0.021 0.003 0.035 0.09
Rz
Feb 2013 7.705 0.063 0.021 0.102 0.21
Jan 2014 7.663 0.063 -0.020 0.102 0.20
Feb 2015 7.682 0.067 -0.001 0.112 0.01
Rt
Feb 2013 7.764 0.065 0.012 0.105 0.12
Jan 2014 7.737 0.066 -0.015 0.108 0.14
Feb 2015 7.754 0.068 0.002 0.112 0.02
RSm
Feb 2013 199.930 0.067 -0.055 0.109 0.50
Jan 2014 199.990 0.067 0.005 0.109 0.05
Feb 2015 200.033 0.067 0.049 0.109 0.45
EURAMET.L-K8.2013 Calibration of surface roughness standards Final report
Pg. 12/57
Parameter Period xi / µm ui / µm (xi-xref)/µm U(xi-xref)/µm En
Type D1, S/N 021
Ra
Feb 2013 0.126 0.003 0.002 0.005 0.43
Jan 2014 0.124 0.003 0.000 0.005 0.03
Feb 2015 0.122 0.003 -0.002 0.005 0.40
Rq
Feb 2013 0.159 0.003 0.002 0.005 0.31
Jan 2014 0.157 0.003 0.000 0.005 0.04
Feb 2015 0.155 0.003 -0.002 0.005 0.36
Rz
Feb 2013 1.056 0.039 0.009 0.064 0.14
Jan 2014 1.060 0.038 0.013 0.062 0.20
Feb 2015 1.027 0.037 -0.020 0.060 0.33
Rt
Feb 2013 1.220 0.050 0.030 0.085 0.36
Jan 2014 1.184 0.043 -0.005 0.067 0.08
Feb 2015 1.170 0.046 -0.020 0.075 0.26
Type D1, KNT 2070/03, S/N 0986
Ra
Feb 2013 0.060 0.002 0.000 0.004 0.03
Jan 2014 0.060 0.002 0.000 0.004 0.03
Feb 2015 0.060 0.002 0.000 0.004 0.00
Rq
Feb 2013 0.075 0.002 0.000 0.004 0.01
Jan 2014 0.075 0.002 0.000 0.004 0.02
Feb 2015 0.075 0.002 0.000 0.004 0.01
Rz
Feb 2013 0.326 0.021 0.000 0.034 0.00
Jan 2014 0.324 0.021 -0.002 0.034 0.06
Feb 2015 0.328 0.021 0.002 0.034 0.06
Rt
Feb 2013 0.442 0.023 -0.001 0.038 0.04
Jan 2014 0.444 0.023 0.001 0.037 0.02
Feb 2015 0.444 0.023 0.001 0.037 0.02
Type C1, NIST SRM 2072, S/N 1015
Ra
Feb 2013 1.010 0.010 -0.001 0.017 0.03
Jan 2014 1.012 0.010 0.002 0.016 0.11
Feb 2015 1.009 0.010 -0.001 0.016 0.08
Rq
Feb 2013 1.120 0.011 -0.001 0.018 0.06
Jan 2014 1.124 0.011 0.003 0.017 0.15
Feb 2015 1.120 0.011 -0.002 0.017 0.09
Rz
Feb 2013 3.350 0.090 -0.040 0.147 0.27
Jan 2014 3.418 0.089 0.028 0.144 0.20
Feb 2015 3.400 0.090 0.011 0.148 0.07
Rt
Feb 2013 3.370 0.090 -0.061 0.140 0.44
Jan 2014 3.448 0.090 0.017 0.139 0.12
Feb 2015 3.518 0.126 0.087 0.226 0.38
RSm
Feb 2013 101.658 0.063 0.044 0.097 0.45
Jan 2014 101.600 0.060 -0.014 0.090 0.16
Feb 2015 101.540 0.101 -0.074 0.186 0.40
EURAMET.L-K8.2013 Calibration of surface roughness standards Final report
Pg. 13/57
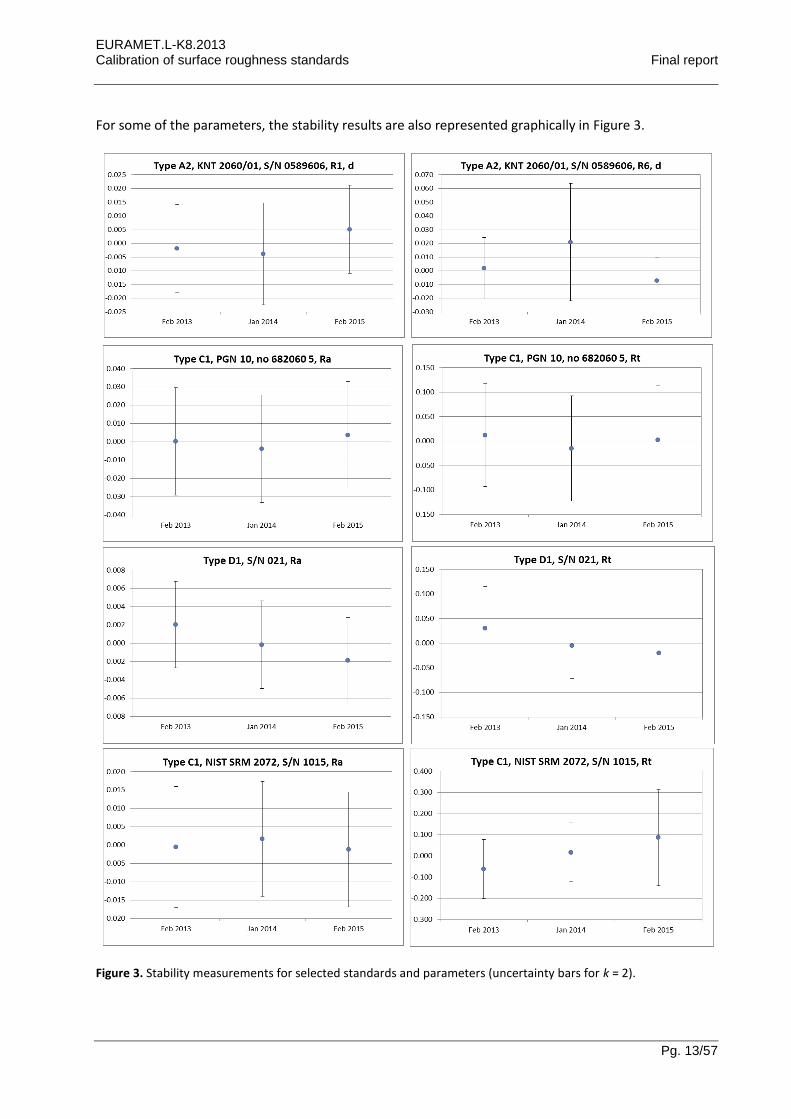
For some of the parameters, the stability results are also represented graphically in Figure 3.
Figure 3. Stability measurements for selected standards and parameters (uncertainty bars for k = 2).
EURAMET.L-K8.2013 Calibration of surface roughness standards Final report
Pg. 14/57
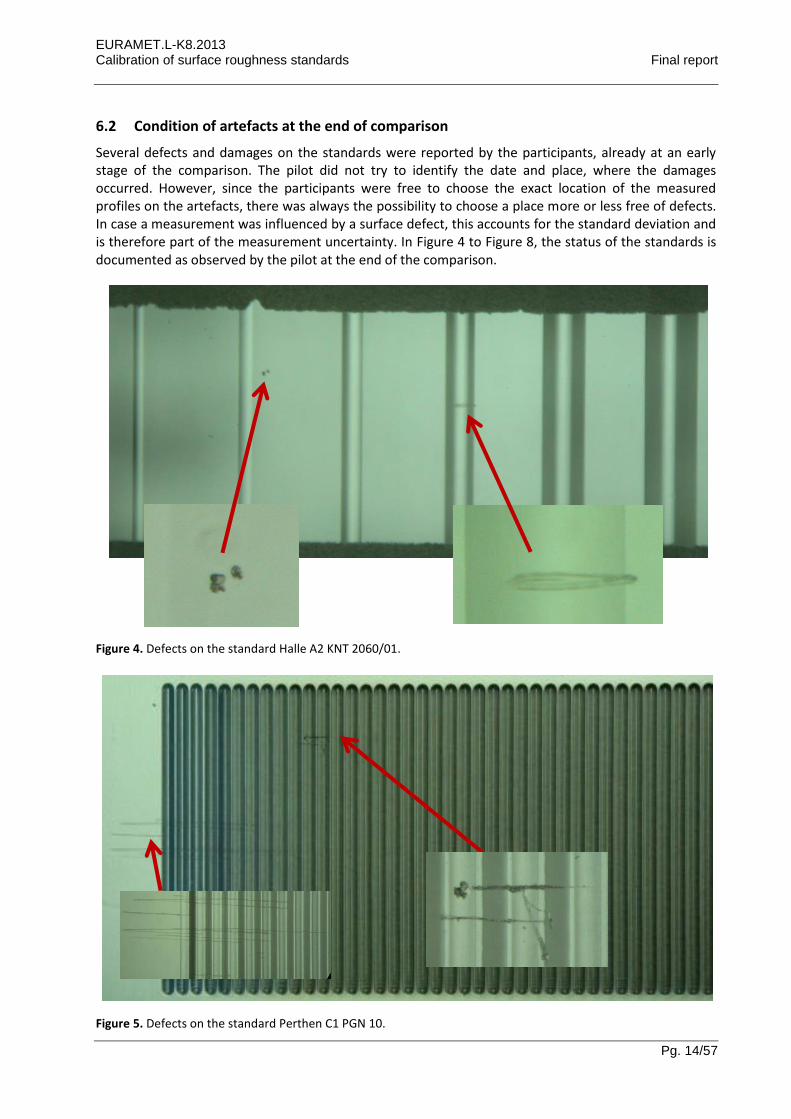
6.2 Condition of artefacts at the end of comparison
Several defects and damages on the standards were reported by the participants, already at an early stage of the comparison. The pilot did not try to identify the date and place, where the damages occurred. However, since the participants were free to choose the exact location of the measured profiles on the artefacts, there was always the possibility to choose a place more or less free of defects. In case a measurement was influenced by a surface defect, this accounts for the standard deviation and is therefore part of the measurement uncertainty. In Figure 4 to Figure 8, the status of the standards is documented as observed by the pilot at the end of the comparison.
Figure 4. Defects on the standard Halle A2 KNT 2060/01.
Figure 5. Defects on the standard Perthen C1 PGN 10.
EURAMET.L-K8.2013 Calibration of surface roughness standards Final report
Pg. 15/57
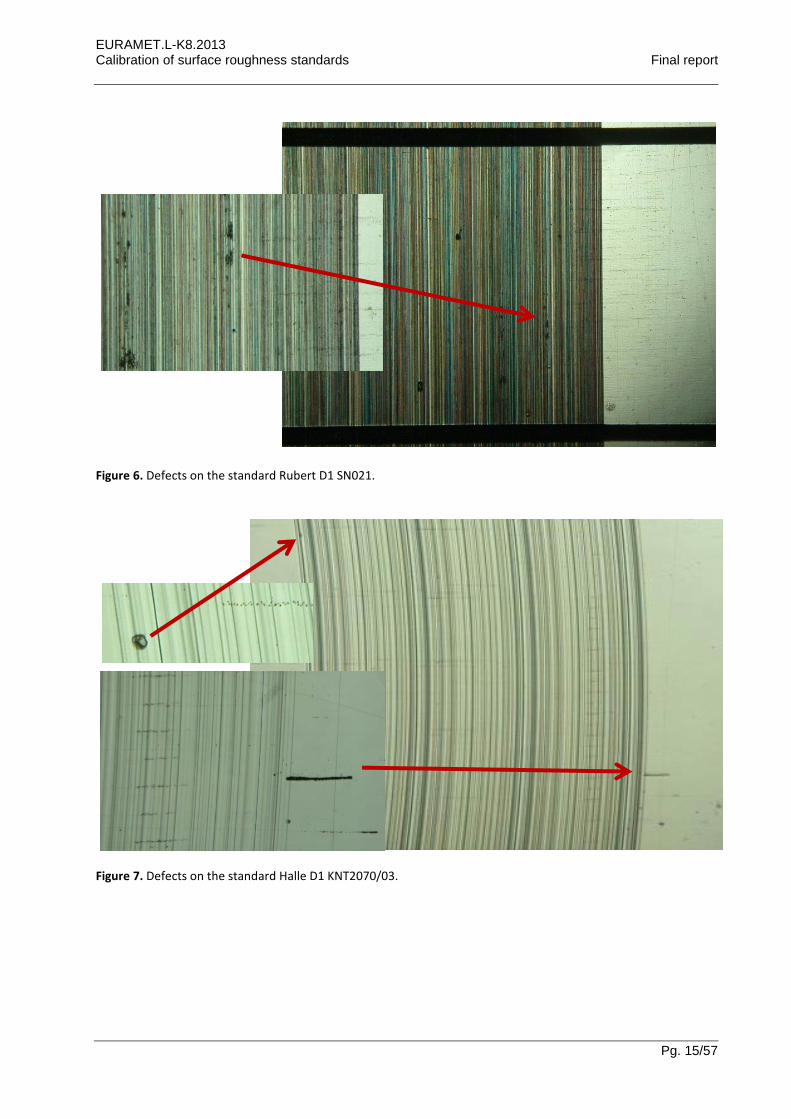
Figure 6. Defects on the standard Rubert D1 SN021.
Figure 7. Defects on the standard Halle D1 KNT2070/03.
EURAMET.L-K8.2013 Calibration of surface roughness standards Final report
Pg. 16/57
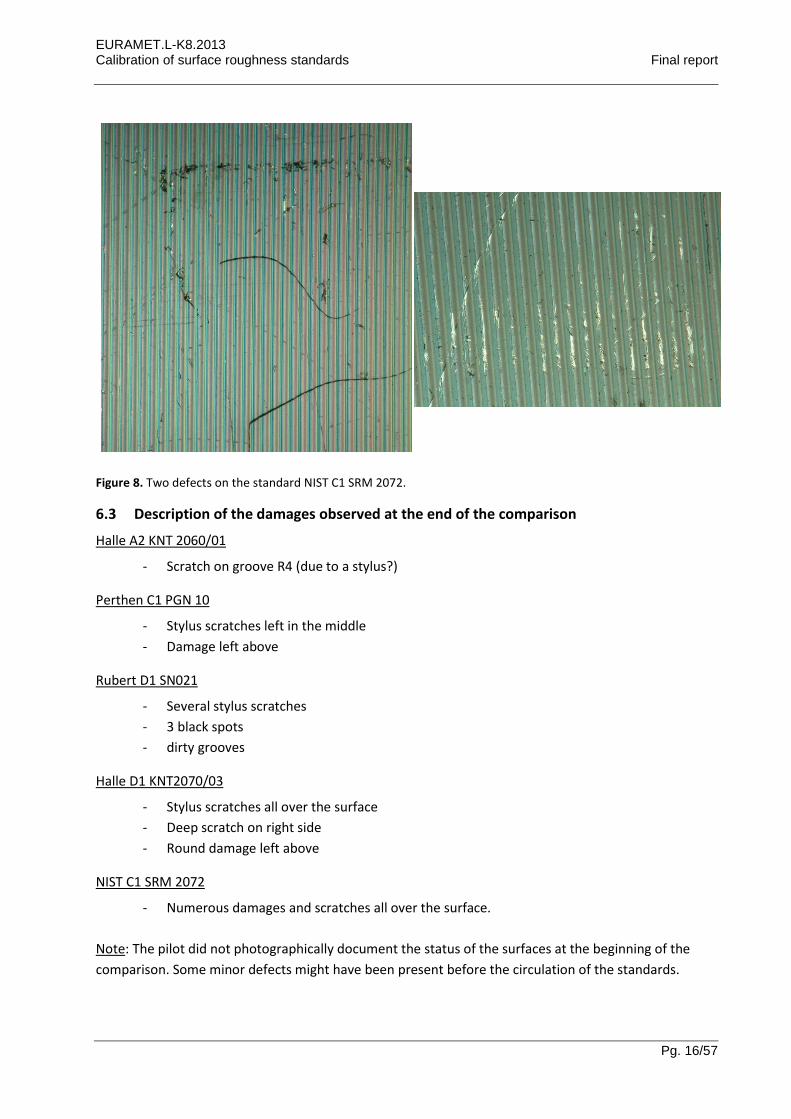
Figure 8. Two defects on the standard NIST C1 SRM 2072.
6.3 Description of the damages observed at the end of the comparison
Halle A2 KNT 2060/01
- Scratch on groove R4 (due to a stylus?)
Perthen C1 PGN 10
- Stylus scratches left in the middle
- Damage left above
Rubert D1 SN021
- Several stylus scratches
- 3 black spots
- dirty grooves
Halle D1 KNT2070/03
- Stylus scratches all over the surface
- Deep scratch on right side
- Round damage left above
NIST C1 SRM 2072
- Numerous damages and scratches all over the surface.
Note: The pilot did not photographically document the status of the surfaces at the beginning of the
comparison. Some minor defects might have been present before the circulation of the standards.
EURAMET.L-K8.2013 Calibration of surface roughness standards Final report
Pg. 17/57
7 Results
7.1 Results and standard uncertainties as reported by participants
The results had to be reported by the participants on Word forms in tables such as Table 4. These were all copied in an Excel spreadsheet EURAMET.L-K8.2013-evaluation.xlsx, which served as Draft A report of this comparison. The spread sheet allows for the evaluation of the reference values according to section 8.1 of this report, for the determination of the largest consistent subset and the degrees of equivalence. The results as they were reported by the participants are shown in section 8.2.
Table 4. Format of how the results had to be reported by the participants.
Parameter Value (µm) (µm) uc (nm) eff
Ra
Rq
Rz
Rt
RSm
standard deviation uc standard uncertainty eff number of effective degrees of freedom (if estimated)
8 Analysis of the measurement results
8.1 Calculation of the KCRV and of the Degrees of Equivalence
The Key Comparison Reference Values KCRV were calculated for each measurand using the weighted
mean. To each result xi a normalised weight wi was attributed, given by:
21
i
ixu
Cw (1)
where the normalising factor, C, is given by:
2
1
1
1
I
i ixu
C (2)
The weighted mean wx is given by:
I
i
iiw xwx1
(3)
and the uncertainty of the weighted mean is calculated by:
C
xu
xuI
i i
w
2
1
1
1)( . (4)
EURAMET.L-K8.2013 Calibration of surface roughness standards Final report
Pg. 18/57
After deriving the weighted mean and its associated standard uncertainty, the deviation of each laboratory’s result from the weighted mean is determined simply as wi xx . The uncertainty of this deviation is calculated as a combination of the uncertainties of the result, u(xi) , and the uncertainty of the weighted mean )( wxu . The uncertainty of the deviation from the weighted mean is given by
22
wiwi xuxuxxu . (5)
For the determination of the key comparison reference value KCRV, statistical consistency of the results contributing to the KCRV is required. A check for statistical consistency of the results with their associated uncertainties can be made by the so-called Birge ratio RB which compares the observed spread of the results with the spread expected from the individual reported uncertainties.
The application of least squares algorithms and the 2-test leads to the Birge ratio
w
wextB
xu
xuR , (6)
where )( wext xu is the external standard deviation
I
i
i
I
i
wii
wext
w
xxw
Ixu
1
1
2
1
1. (7)
The Birge ratio has an expectation value of RB = 1, when considering standard uncertainties. For a coverage factor of k = 2, the expectation value is increased and the data in a comparison are consistent provided that
)I/(RB 181 , (8)
where I is the number of laboratories.
For each laboratory’s result the En value is calculated, where En is defined as the ratio of the deviation from the weighted mean, divided by the expanded uncertainty of this deviation:
22
wi
wi
n
xUxU
xxE
. (9)
If statistical consistency according to equation (8) is not given, the result with the largest En is identified and excluded from the reference value and RB is calculated again. This process of excluding the result with the largest En from contributing to the weighted mean is iterated until statistical consistency is reached.
Because inconsistent results are no longer correlated with the weighted mean, when calculating their En value a positive sign is used in equation (5) and consequently in the denominator of equation (9):
22
wi
wi
n
xUxU
xxE
for results excluded from the KCRV. (10)
EURAMET.L-K8.2013 Calibration of surface roughness standards Final report
Pg. 19/57
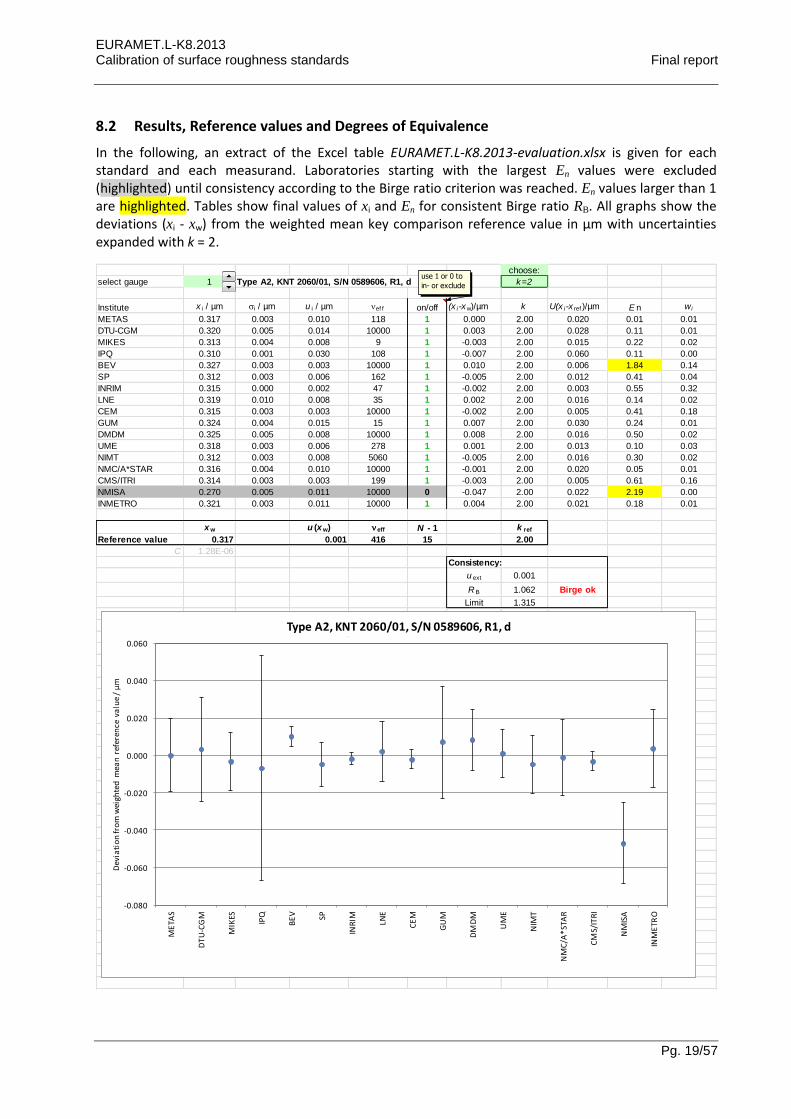
8.2 Results, Reference values and Degrees of Equivalence
In the following, an extract of the Excel table EURAMET.L-K8.2013-evaluation.xlsx is given for each standard and each measurand. Laboratories starting with the largest En values were excluded (highlighted) until consistency according to the Birge ratio criterion was reached. En values larger than 1 are highlighted. Tables show final values of xi and En for consistent Birge ratio RB. All graphs show the deviations (xi - xw) from the weighted mean key comparison reference value in µm with uncertainties expanded with k = 2.
choose:
select gauge 1 Type A2, KNT 2060/01, S/N 0589606, R1, d k=2
Institute x i / µm i / µm u i / µm ef f on/off (x i-xw)/µm k U(x i-x ref )/µm E n w i
METAS 0.317 0.003 0.010 118 1 0.000 2.00 0.020 0.01 0.01
DTU-CGM 0.320 0.005 0.014 10000 1 0.003 2.00 0.028 0.11 0.01
MIKES 0.313 0.004 0.008 9 1 -0.003 2.00 0.015 0.22 0.02
IPQ 0.310 0.001 0.030 108 1 -0.007 2.00 0.060 0.11 0.00
BEV 0.327 0.003 0.003 10000 1 0.010 2.00 0.006 1.84 0.14
SP 0.312 0.003 0.006 162 1 -0.005 2.00 0.012 0.41 0.04
INRIM 0.315 0.000 0.002 47 1 -0.002 2.00 0.003 0.55 0.32
LNE 0.319 0.010 0.008 35 1 0.002 2.00 0.016 0.14 0.02
CEM 0.315 0.003 0.003 10000 1 -0.002 2.00 0.005 0.41 0.18
GUM 0.324 0.004 0.015 15 1 0.007 2.00 0.030 0.24 0.01
DMDM 0.325 0.005 0.008 10000 1 0.008 2.00 0.016 0.50 0.02
UME 0.318 0.003 0.006 278 1 0.001 2.00 0.013 0.10 0.03
NIMT 0.312 0.003 0.008 5060 1 -0.005 2.00 0.016 0.30 0.02
NMC/A*STAR 0.316 0.004 0.010 10000 1 -0.001 2.00 0.020 0.05 0.01
CMS/ITRI 0.314 0.003 0.003 199 1 -0.003 2.00 0.005 0.61 0.16
NMISA 0.270 0.005 0.011 10000 0 -0.047 2.00 0.022 2.19 0.00
INMETRO 0.321 0.003 0.011 10000 1 0.004 2.00 0.021 0.18 0.01
x w u (x w) eff N - 1 k ref
Reference value 0.317 0.001 416 15 2.00
C 1.28E-06
Consistency:
u ext 0.001
R B 1.062 Birge ok
Limit 1.315
if contributing to
if not contributing to
-0.080
-0.060
-0.040
-0.020
0.000
0.020
0.040
0.060
ME
TAS
DT
U-C
GM
MIK
ES
IPQ
BE
V SP
INR
IM LNE
CE
M
GU
M
DM
DM
UM
E
NIM
T
NM
C/A
*ST
AR
CM
S/IT
RI
NM
ISA
INM
ETR
O
Dev
iati
on
fro
m w
eigh
ted
mea
n r
efer
ence
va
lue
/ µ
m
Type A2, KNT 2060/01, S/N 0589606, R1, d
use 1 or 0 to
in- or exclude
EURAMET.L-K8.2013 Calibration of surface roughness standards Final report
Pg. 20/57
choose:
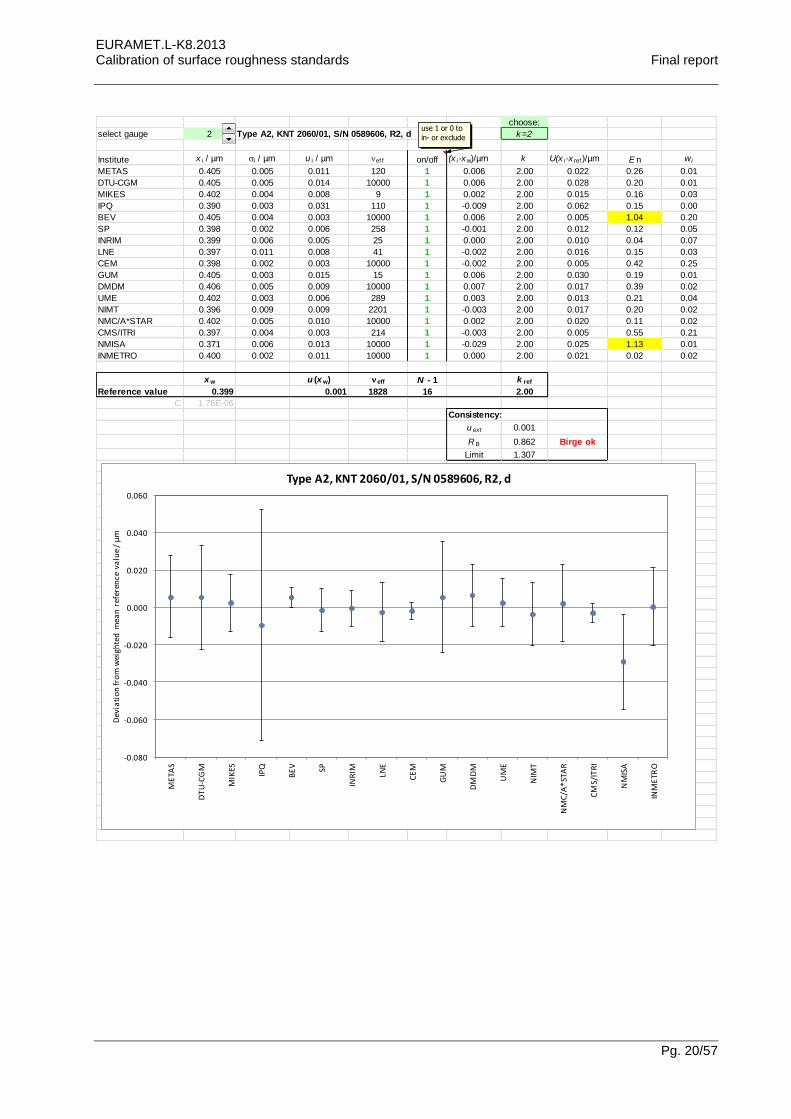
select gauge 2 Type A2, KNT 2060/01, S/N 0589606, R2, d k=2
Institute x i / µm i / µm u i / µm ef f on/off (x i-xw)/µm k U(x i-x ref )/µm E n w i
METAS 0.405 0.005 0.011 120 1 0.006 2.00 0.022 0.26 0.01
DTU-CGM 0.405 0.005 0.014 10000 1 0.006 2.00 0.028 0.20 0.01
MIKES 0.402 0.004 0.008 9 1 0.002 2.00 0.015 0.16 0.03
IPQ 0.390 0.003 0.031 110 1 -0.009 2.00 0.062 0.15 0.00
BEV 0.405 0.004 0.003 10000 1 0.006 2.00 0.005 1.04 0.20
SP 0.398 0.002 0.006 258 1 -0.001 2.00 0.012 0.12 0.05
INRIM 0.399 0.006 0.005 25 1 0.000 2.00 0.010 0.04 0.07
LNE 0.397 0.011 0.008 41 1 -0.002 2.00 0.016 0.15 0.03
CEM 0.398 0.002 0.003 10000 1 -0.002 2.00 0.005 0.42 0.25
GUM 0.405 0.003 0.015 15 1 0.006 2.00 0.030 0.19 0.01
DMDM 0.406 0.005 0.009 10000 1 0.007 2.00 0.017 0.39 0.02
UME 0.402 0.003 0.006 289 1 0.003 2.00 0.013 0.21 0.04
NIMT 0.396 0.009 0.009 2201 1 -0.003 2.00 0.017 0.20 0.02
NMC/A*STAR 0.402 0.005 0.010 10000 1 0.002 2.00 0.020 0.11 0.02
CMS/ITRI 0.397 0.004 0.003 214 1 -0.003 2.00 0.005 0.55 0.21
NMISA 0.371 0.006 0.013 10000 1 -0.029 2.00 0.025 1.13 0.01
INMETRO 0.400 0.002 0.011 10000 1 0.000 2.00 0.021 0.02 0.02
x w u (x w) eff N - 1 k ref
Reference value 0.399 0.001 1828 16 2.00
C 1.76E-06
Consistency:
u ext 0.001
R B 0.862 Birge ok
Limit 1.307
if contributing to
if not contributing to
-0.080
-0.060
-0.040
-0.020
0.000
0.020
0.040
0.060
ME
TAS
DT
U-C
GM
MIK
ES
IPQ
BE
V SP
INR
IM LNE
CE
M
GU
M
DM
DM
UM
E
NIM
T
NM
C/A
*ST
AR
CM
S/IT
RI
NM
ISA
INM
ETR
O
Dev
iati
on
fro
m w
eigh
ted
mea
n r
efer
ence
va
lue
/ µ
m
Type A2, KNT 2060/01, S/N 0589606, R2, d
use 1 or 0 to
in- or exclude
EURAMET.L-K8.2013 Calibration of surface roughness standards Final report
Pg. 21/57
choose:
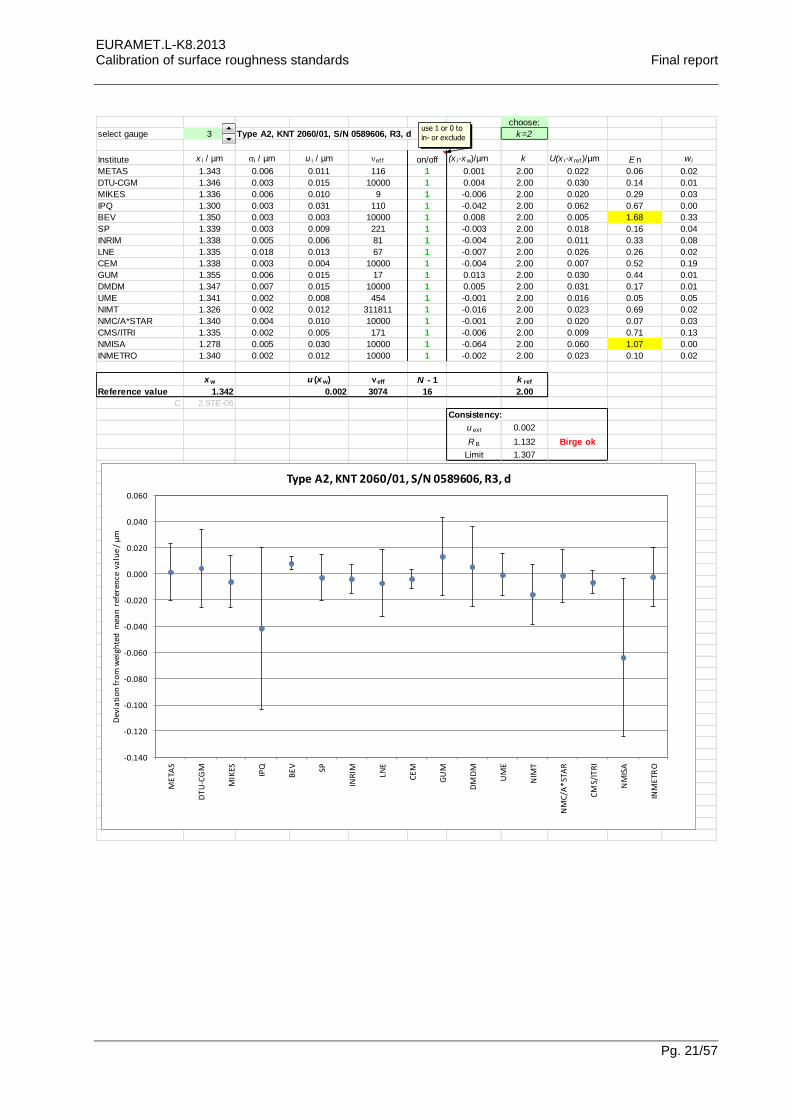
select gauge 3 Type A2, KNT 2060/01, S/N 0589606, R3, d k=2
Institute x i / µm i / µm u i / µm ef f on/off (x i-xw)/µm k U(x i-x ref )/µm E n w i
METAS 1.343 0.006 0.011 116 1 0.001 2.00 0.022 0.06 0.02
DTU-CGM 1.346 0.003 0.015 10000 1 0.004 2.00 0.030 0.14 0.01
MIKES 1.336 0.006 0.010 9 1 -0.006 2.00 0.020 0.29 0.03
IPQ 1.300 0.003 0.031 110 1 -0.042 2.00 0.062 0.67 0.00
BEV 1.350 0.003 0.003 10000 1 0.008 2.00 0.005 1.68 0.33
SP 1.339 0.003 0.009 221 1 -0.003 2.00 0.018 0.16 0.04
INRIM 1.338 0.005 0.006 81 1 -0.004 2.00 0.011 0.33 0.08
LNE 1.335 0.018 0.013 67 1 -0.007 2.00 0.026 0.26 0.02
CEM 1.338 0.003 0.004 10000 1 -0.004 2.00 0.007 0.52 0.19
GUM 1.355 0.006 0.015 17 1 0.013 2.00 0.030 0.44 0.01
DMDM 1.347 0.007 0.015 10000 1 0.005 2.00 0.031 0.17 0.01
UME 1.341 0.002 0.008 454 1 -0.001 2.00 0.016 0.05 0.05
NIMT 1.326 0.002 0.012 311811 1 -0.016 2.00 0.023 0.69 0.02
NMC/A*STAR 1.340 0.004 0.010 10000 1 -0.001 2.00 0.020 0.07 0.03
CMS/ITRI 1.335 0.002 0.005 171 1 -0.006 2.00 0.009 0.71 0.13
NMISA 1.278 0.005 0.030 10000 1 -0.064 2.00 0.060 1.07 0.00
INMETRO 1.340 0.002 0.012 10000 1 -0.002 2.00 0.023 0.10 0.02
x w u (x w) eff N - 1 k ref
Reference value 1.342 0.002 3074 16 2.00
C 2.97E-06
Consistency:
u ext 0.002
R B 1.132 Birge ok
Limit 1.307
if contributing to
if not contributing to
-0.140
-0.120
-0.100
-0.080
-0.060
-0.040
-0.020
0.000
0.020
0.040
0.060
ME
TAS
DT
U-C
GM
MIK
ES
IPQ
BE
V SP
INR
IM LNE
CE
M
GU
M
DM
DM
UM
E
NIM
T
NM
C/A
*ST
AR
CM
S/IT
RI
NM
ISA
INM
ETR
O
Dev
iati
on
fro
m w
eigh
ted
mea
n r
efer
ence
va
lue
/ µ
m
Type A2, KNT 2060/01, S/N 0589606, R3, d
use 1 or 0 to
in- or exclude
EURAMET.L-K8.2013 Calibration of surface roughness standards Final report
Pg. 22/57
choose:
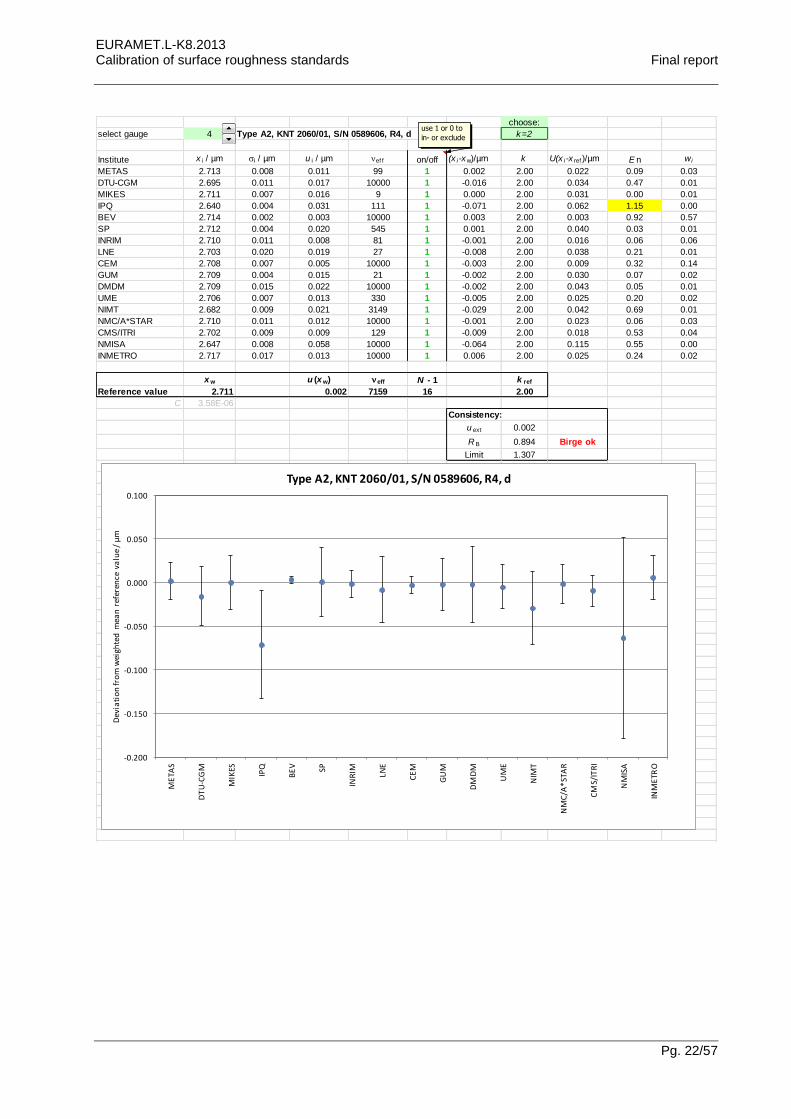
select gauge 4 Type A2, KNT 2060/01, S/N 0589606, R4, d k=2
Institute x i / µm i / µm u i / µm ef f on/off (x i-xw)/µm k U(x i-x ref )/µm E n w i
METAS 2.713 0.008 0.011 99 1 0.002 2.00 0.022 0.09 0.03
DTU-CGM 2.695 0.011 0.017 10000 1 -0.016 2.00 0.034 0.47 0.01
MIKES 2.711 0.007 0.016 9 1 0.000 2.00 0.031 0.00 0.01
IPQ 2.640 0.004 0.031 111 1 -0.071 2.00 0.062 1.15 0.00
BEV 2.714 0.002 0.003 10000 1 0.003 2.00 0.003 0.92 0.57
SP 2.712 0.004 0.020 545 1 0.001 2.00 0.040 0.03 0.01
INRIM 2.710 0.011 0.008 81 1 -0.001 2.00 0.016 0.06 0.06
LNE 2.703 0.020 0.019 27 1 -0.008 2.00 0.038 0.21 0.01
CEM 2.708 0.007 0.005 10000 1 -0.003 2.00 0.009 0.32 0.14
GUM 2.709 0.004 0.015 21 1 -0.002 2.00 0.030 0.07 0.02
DMDM 2.709 0.015 0.022 10000 1 -0.002 2.00 0.043 0.05 0.01
UME 2.706 0.007 0.013 330 1 -0.005 2.00 0.025 0.20 0.02
NIMT 2.682 0.009 0.021 3149 1 -0.029 2.00 0.042 0.69 0.01
NMC/A*STAR 2.710 0.011 0.012 10000 1 -0.001 2.00 0.023 0.06 0.03
CMS/ITRI 2.702 0.009 0.009 129 1 -0.009 2.00 0.018 0.53 0.04
NMISA 2.647 0.008 0.058 10000 1 -0.064 2.00 0.115 0.55 0.00
INMETRO 2.717 0.017 0.013 10000 1 0.006 2.00 0.025 0.24 0.02
x w u (x w) eff N - 1 k ref
Reference value 2.711 0.002 7159 16 2.00
C 3.58E-06
Consistency:
u ext 0.002
R B 0.894 Birge ok
Limit 1.307
if contributing to
if not contributing to
-0.200
-0.150
-0.100
-0.050
0.000
0.050
0.100
ME
TAS
DT
U-C
GM
MIK
ES
IPQ
BE
V SP
INR
IM LNE
CE
M
GU
M
DM
DM
UM
E
NIM
T
NM
C/A
*ST
AR
CM
S/IT
RI
NM
ISA
INM
ETR
O
Dev
iati
on
fro
m w
eigh
ted
mea
n r
efer
ence
va
lue
/ µ
m
Type A2, KNT 2060/01, S/N 0589606, R4, d
use 1 or 0 to
in- or exclude
EURAMET.L-K8.2013 Calibration of surface roughness standards Final report
Pg. 23/57
choose:
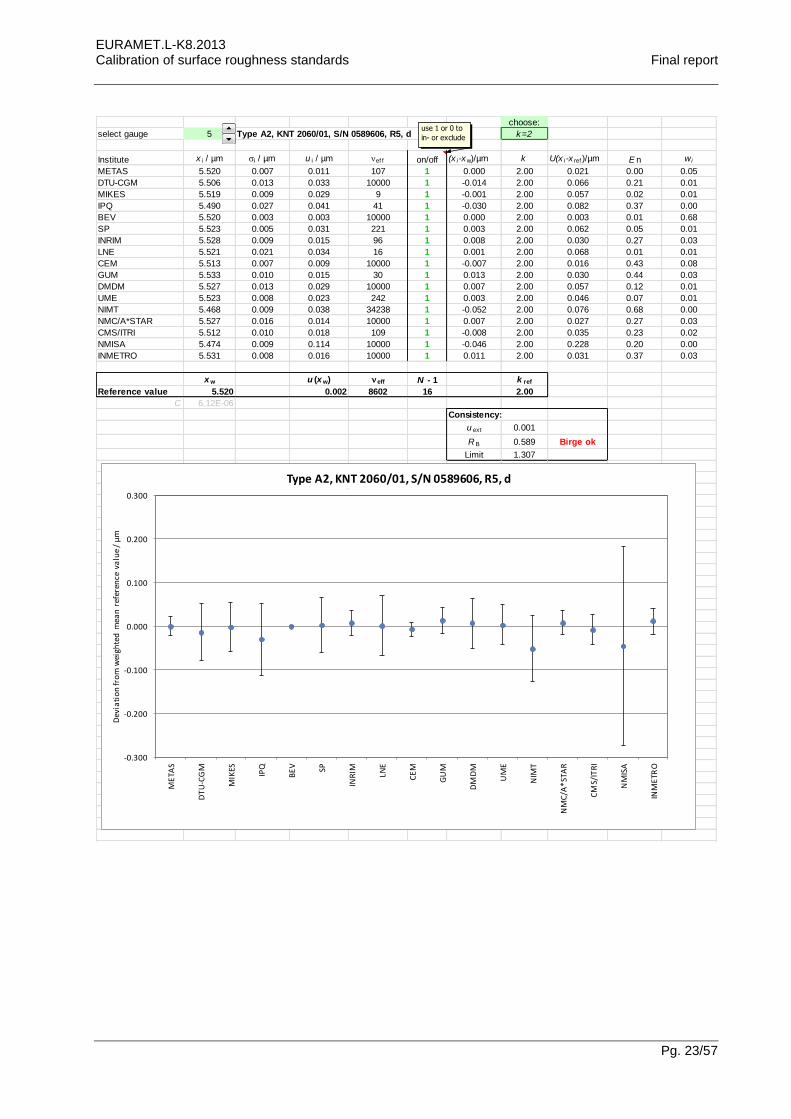
select gauge 5 Type A2, KNT 2060/01, S/N 0589606, R5, d k=2
Institute x i / µm i / µm u i / µm ef f on/off (x i-xw)/µm k U(x i-x ref )/µm E n w i
METAS 5.520 0.007 0.011 107 1 0.000 2.00 0.021 0.00 0.05
DTU-CGM 5.506 0.013 0.033 10000 1 -0.014 2.00 0.066 0.21 0.01
MIKES 5.519 0.009 0.029 9 1 -0.001 2.00 0.057 0.02 0.01
IPQ 5.490 0.027 0.041 41 1 -0.030 2.00 0.082 0.37 0.00
BEV 5.520 0.003 0.003 10000 1 0.000 2.00 0.003 0.01 0.68
SP 5.523 0.005 0.031 221 1 0.003 2.00 0.062 0.05 0.01
INRIM 5.528 0.009 0.015 96 1 0.008 2.00 0.030 0.27 0.03
LNE 5.521 0.021 0.034 16 1 0.001 2.00 0.068 0.01 0.01
CEM 5.513 0.007 0.009 10000 1 -0.007 2.00 0.016 0.43 0.08
GUM 5.533 0.010 0.015 30 1 0.013 2.00 0.030 0.44 0.03
DMDM 5.527 0.013 0.029 10000 1 0.007 2.00 0.057 0.12 0.01
UME 5.523 0.008 0.023 242 1 0.003 2.00 0.046 0.07 0.01
NIMT 5.468 0.009 0.038 34238 1 -0.052 2.00 0.076 0.68 0.00
NMC/A*STAR 5.527 0.016 0.014 10000 1 0.007 2.00 0.027 0.27 0.03
CMS/ITRI 5.512 0.010 0.018 109 1 -0.008 2.00 0.035 0.23 0.02
NMISA 5.474 0.009 0.114 10000 1 -0.046 2.00 0.228 0.20 0.00
INMETRO 5.531 0.008 0.016 10000 1 0.011 2.00 0.031 0.37 0.03
x w u (x w) eff N - 1 k ref
Reference value 5.520 0.002 8602 16 2.00
C 6.12E-06
Consistency:
u ext 0.001
R B 0.589 Birge ok
Limit 1.307
if contributing to
if not contributing to
-0.300
-0.200
-0.100
0.000
0.100
0.200
0.300
ME
TAS
DT
U-C
GM
MIK
ES
IPQ
BE
V SP
INR
IM LNE
CE
M
GU
M
DM
DM
UM
E
NIM
T
NM
C/A
*ST
AR
CM
S/IT
RI
NM
ISA
INM
ETR
O
Dev
iati
on
fro
m w
eigh
ted
mea
n r
efer
ence
va
lue
/ µ
m
Type A2, KNT 2060/01, S/N 0589606, R5, d
use 1 or 0 to
in- or exclude
EURAMET.L-K8.2013 Calibration of surface roughness standards Final report
Pg. 24/57
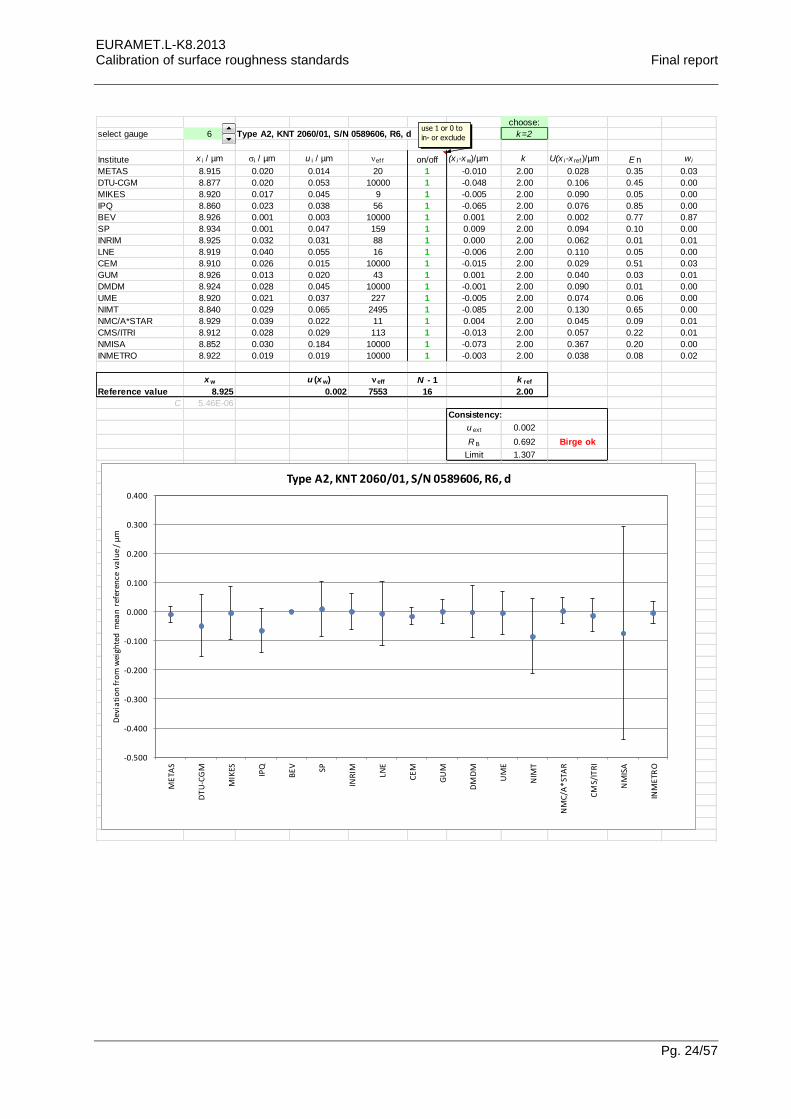
choose:
select gauge 6 Type A2, KNT 2060/01, S/N 0589606, R6, d k=2
Institute x i / µm i / µm u i / µm ef f on/off (x i-xw)/µm k U(x i-x ref )/µm E n w i
METAS 8.915 0.020 0.014 20 1 -0.010 2.00 0.028 0.35 0.03
DTU-CGM 8.877 0.020 0.053 10000 1 -0.048 2.00 0.106 0.45 0.00
MIKES 8.920 0.017 0.045 9 1 -0.005 2.00 0.090 0.05 0.00
IPQ 8.860 0.023 0.038 56 1 -0.065 2.00 0.076 0.85 0.00
BEV 8.926 0.001 0.003 10000 1 0.001 2.00 0.002 0.77 0.87
SP 8.934 0.001 0.047 159 1 0.009 2.00 0.094 0.10 0.00
INRIM 8.925 0.032 0.031 88 1 0.000 2.00 0.062 0.01 0.01
LNE 8.919 0.040 0.055 16 1 -0.006 2.00 0.110 0.05 0.00
CEM 8.910 0.026 0.015 10000 1 -0.015 2.00 0.029 0.51 0.03
GUM 8.926 0.013 0.020 43 1 0.001 2.00 0.040 0.03 0.01
DMDM 8.924 0.028 0.045 10000 1 -0.001 2.00 0.090 0.01 0.00
UME 8.920 0.021 0.037 227 1 -0.005 2.00 0.074 0.06 0.00
NIMT 8.840 0.029 0.065 2495 1 -0.085 2.00 0.130 0.65 0.00
NMC/A*STAR 8.929 0.039 0.022 11 1 0.004 2.00 0.045 0.09 0.01
CMS/ITRI 8.912 0.028 0.029 113 1 -0.013 2.00 0.057 0.22 0.01
NMISA 8.852 0.030 0.184 10000 1 -0.073 2.00 0.367 0.20 0.00
INMETRO 8.922 0.019 0.019 10000 1 -0.003 2.00 0.038 0.08 0.02
x w u (x w) eff N - 1 k ref
Reference value 8.925 0.002 7553 16 2.00
C 5.46E-06
Consistency:
u ext 0.002
R B 0.692 Birge ok
Limit 1.307
if contributing to
if not contributing to
-0.500
-0.400
-0.300
-0.200
-0.100
0.000
0.100
0.200
0.300
0.400
ME
TAS
DT
U-C
GM
MIK
ES
IPQ
BE
V SP
INR
IM LNE
CE
M
GU
M
DM
DM
UM
E
NIM
T
NM
C/A
*ST
AR
CM
S/IT
RI
NM
ISA
INM
ETR
O
Dev
iati
on
fro
m w
eigh
ted
mea
n r
efer
ence
va
lue
/ µ
m
Type A2, KNT 2060/01, S/N 0589606, R6, d
use 1 or 0 to
in- or exclude
EURAMET.L-K8.2013 Calibration of surface roughness standards Final report
Pg. 25/57
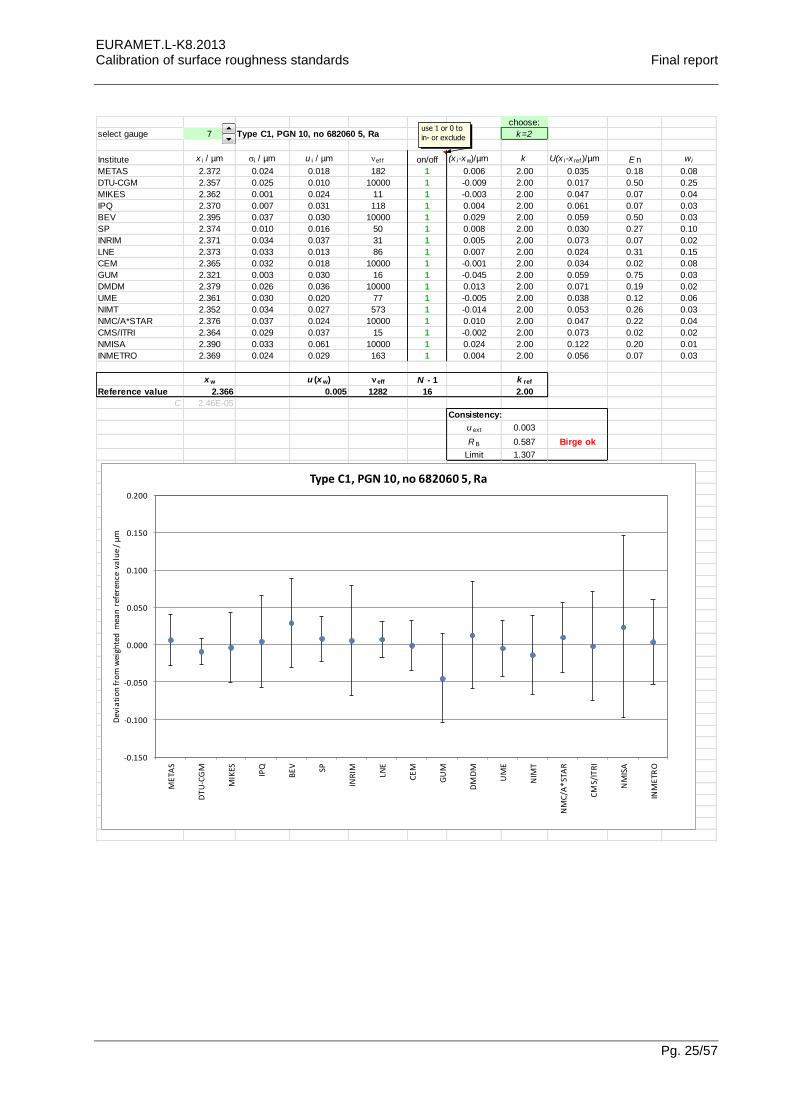
choose:
select gauge 7 Type C1, PGN 10, no 682060 5, Ra k=2
Institute x i / µm i / µm u i / µm ef f on/off (x i-xw)/µm k U(x i-x ref )/µm E n w i
METAS 2.372 0.024 0.018 182 1 0.006 2.00 0.035 0.18 0.08
DTU-CGM 2.357 0.025 0.010 10000 1 -0.009 2.00 0.017 0.50 0.25
MIKES 2.362 0.001 0.024 11 1 -0.003 2.00 0.047 0.07 0.04
IPQ 2.370 0.007 0.031 118 1 0.004 2.00 0.061 0.07 0.03
BEV 2.395 0.037 0.030 10000 1 0.029 2.00 0.059 0.50 0.03
SP 2.374 0.010 0.016 50 1 0.008 2.00 0.030 0.27 0.10
INRIM 2.371 0.034 0.037 31 1 0.005 2.00 0.073 0.07 0.02
LNE 2.373 0.033 0.013 86 1 0.007 2.00 0.024 0.31 0.15
CEM 2.365 0.032 0.018 10000 1 -0.001 2.00 0.034 0.02 0.08
GUM 2.321 0.003 0.030 16 1 -0.045 2.00 0.059 0.75 0.03
DMDM 2.379 0.026 0.036 10000 1 0.013 2.00 0.071 0.19 0.02
UME 2.361 0.030 0.020 77 1 -0.005 2.00 0.038 0.12 0.06
NIMT 2.352 0.034 0.027 573 1 -0.014 2.00 0.053 0.26 0.03
NMC/A*STAR 2.376 0.037 0.024 10000 1 0.010 2.00 0.047 0.22 0.04
CMS/ITRI 2.364 0.029 0.037 15 1 -0.002 2.00 0.073 0.02 0.02
NMISA 2.390 0.033 0.061 10000 1 0.024 2.00 0.122 0.20 0.01
INMETRO 2.369 0.024 0.029 163 1 0.004 2.00 0.056 0.07 0.03
x w u (x w) eff N - 1 k ref
Reference value 2.366 0.005 1282 16 2.00
C 2.46E-05
Consistency:
u ext 0.003
R B 0.587 Birge ok
Limit 1.307
if contributing to
if not contributing to
-0.150
-0.100
-0.050
0.000
0.050
0.100
0.150
0.200
ME
TAS
DT
U-C
GM
MIK
ES
IPQ
BE
V SP
INR
IM LNE
CE
M
GU
M
DM
DM
UM
E
NIM
T
NM
C/A
*ST
AR
CM
S/IT
RI
NM
ISA
INM
ETR
O
Dev
iati
on
fro
m w
eigh
ted
mea
n r
efer
ence
va
lue
/ µ
m
Type C1, PGN 10, no 682060 5, Ra
use 1 or 0 to
in- or exclude
EURAMET.L-K8.2013 Calibration of surface roughness standards Final report
Pg. 26/57
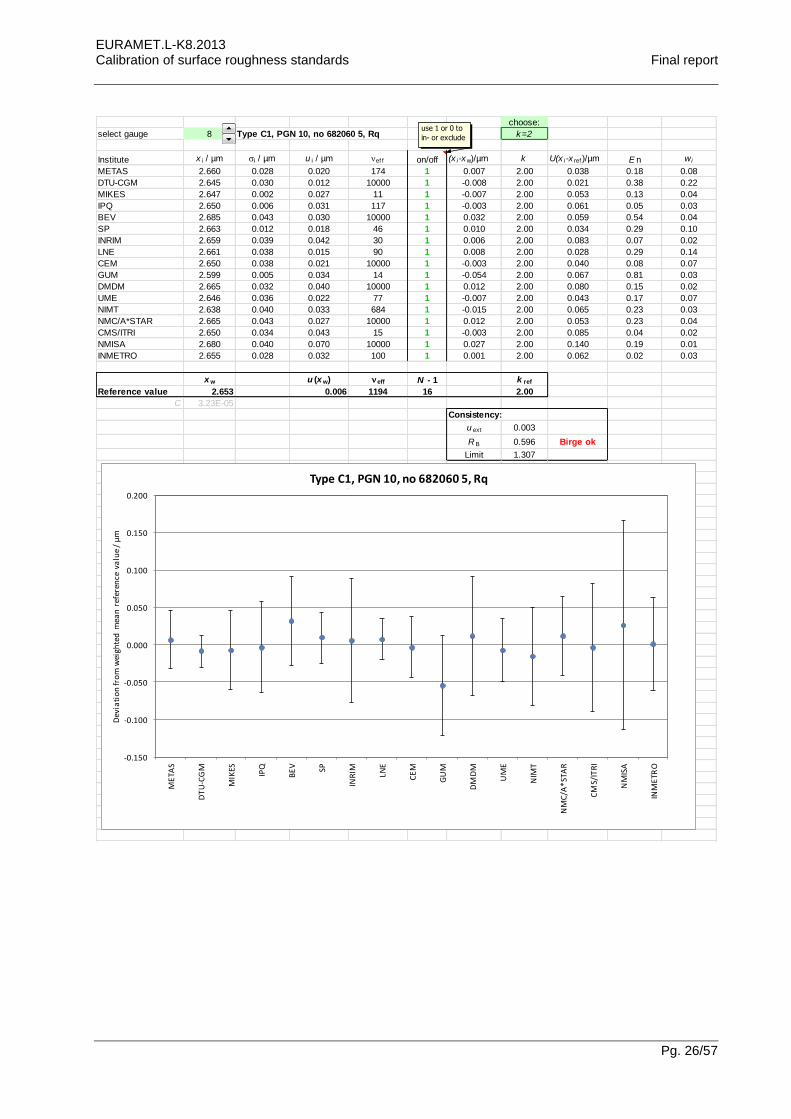
choose:
select gauge 8 Type C1, PGN 10, no 682060 5, Rq k=2
Institute x i / µm i / µm u i / µm ef f on/off (x i-xw)/µm k U(x i-x ref )/µm E n w i
METAS 2.660 0.028 0.020 174 1 0.007 2.00 0.038 0.18 0.08
DTU-CGM 2.645 0.030 0.012 10000 1 -0.008 2.00 0.021 0.38 0.22
MIKES 2.647 0.002 0.027 11 1 -0.007 2.00 0.053 0.13 0.04
IPQ 2.650 0.006 0.031 117 1 -0.003 2.00 0.061 0.05 0.03
BEV 2.685 0.043 0.030 10000 1 0.032 2.00 0.059 0.54 0.04
SP 2.663 0.012 0.018 46 1 0.010 2.00 0.034 0.29 0.10
INRIM 2.659 0.039 0.042 30 1 0.006 2.00 0.083 0.07 0.02
LNE 2.661 0.038 0.015 90 1 0.008 2.00 0.028 0.29 0.14
CEM 2.650 0.038 0.021 10000 1 -0.003 2.00 0.040 0.08 0.07
GUM 2.599 0.005 0.034 14 1 -0.054 2.00 0.067 0.81 0.03
DMDM 2.665 0.032 0.040 10000 1 0.012 2.00 0.080 0.15 0.02
UME 2.646 0.036 0.022 77 1 -0.007 2.00 0.043 0.17 0.07
NIMT 2.638 0.040 0.033 684 1 -0.015 2.00 0.065 0.23 0.03
NMC/A*STAR 2.665 0.043 0.027 10000 1 0.012 2.00 0.053 0.23 0.04
CMS/ITRI 2.650 0.034 0.043 15 1 -0.003 2.00 0.085 0.04 0.02
NMISA 2.680 0.040 0.070 10000 1 0.027 2.00 0.140 0.19 0.01
INMETRO 2.655 0.028 0.032 100 1 0.001 2.00 0.062 0.02 0.03
x w u (x w) eff N - 1 k ref
Reference value 2.653 0.006 1194 16 2.00
C 3.23E-05
Consistency:
u ext 0.003
R B 0.596 Birge ok
Limit 1.307
if contributing to
if not contributing to
-0.150
-0.100
-0.050
0.000
0.050
0.100
0.150
0.200
ME
TAS
DT
U-C
GM
MIK
ES
IPQ
BE
V SP
INR
IM LNE
CE
M
GU
M
DM
DM
UM
E
NIM
T
NM
C/A
*ST
AR
CM
S/IT
RI
NM
ISA
INM
ETR
O
Dev
iati
on
fro
m w
eigh
ted
mea
n r
efer
ence
va
lue
/ µ
m
Type C1, PGN 10, no 682060 5, Rq
use 1 or 0 to
in- or exclude
EURAMET.L-K8.2013 Calibration of surface roughness standards Final report
Pg. 27/57
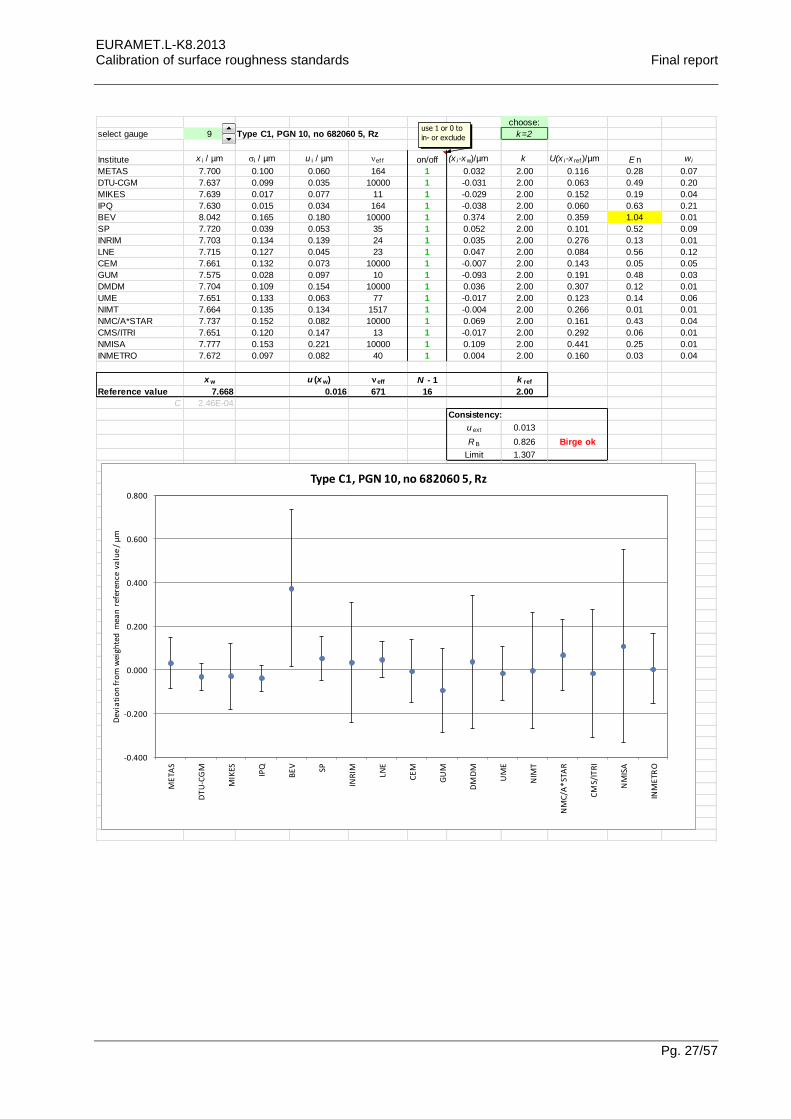
choose:
select gauge 9 Type C1, PGN 10, no 682060 5, Rz k=2
Institute x i / µm i / µm u i / µm ef f on/off (x i-xw)/µm k U(x i-x ref )/µm E n w i
METAS 7.700 0.100 0.060 164 1 0.032 2.00 0.116 0.28 0.07
DTU-CGM 7.637 0.099 0.035 10000 1 -0.031 2.00 0.063 0.49 0.20
MIKES 7.639 0.017 0.077 11 1 -0.029 2.00 0.152 0.19 0.04
IPQ 7.630 0.015 0.034 164 1 -0.038 2.00 0.060 0.63 0.21
BEV 8.042 0.165 0.180 10000 1 0.374 2.00 0.359 1.04 0.01
SP 7.720 0.039 0.053 35 1 0.052 2.00 0.101 0.52 0.09
INRIM 7.703 0.134 0.139 24 1 0.035 2.00 0.276 0.13 0.01
LNE 7.715 0.127 0.045 23 1 0.047 2.00 0.084 0.56 0.12
CEM 7.661 0.132 0.073 10000 1 -0.007 2.00 0.143 0.05 0.05
GUM 7.575 0.028 0.097 10 1 -0.093 2.00 0.191 0.48 0.03
DMDM 7.704 0.109 0.154 10000 1 0.036 2.00 0.307 0.12 0.01
UME 7.651 0.133 0.063 77 1 -0.017 2.00 0.123 0.14 0.06
NIMT 7.664 0.135 0.134 1517 1 -0.004 2.00 0.266 0.01 0.01
NMC/A*STAR 7.737 0.152 0.082 10000 1 0.069 2.00 0.161 0.43 0.04
CMS/ITRI 7.651 0.120 0.147 13 1 -0.017 2.00 0.292 0.06 0.01
NMISA 7.777 0.153 0.221 10000 1 0.109 2.00 0.441 0.25 0.01
INMETRO 7.672 0.097 0.082 40 1 0.004 2.00 0.160 0.03 0.04
x w u (x w) eff N - 1 k ref
Reference value 7.668 0.016 671 16 2.00
C 2.46E-04
Consistency:
u ext 0.013
R B 0.826 Birge ok
Limit 1.307
if contributing to
if not contributing to
-0.400
-0.200
0.000
0.200
0.400
0.600
0.800
ME
TAS
DT
U-C
GM
MIK
ES
IPQ
BE
V SP
INR
IM LNE
CE
M
GU
M
DM
DM
UM
E
NIM
T
NM
C/A
*ST
AR
CM
S/IT
RI
NM
ISA
INM
ETR
O
Dev
iati
on
fro
m w
eigh
ted
mea
n r
efer
ence
va
lue
/ µ
m
Type C1, PGN 10, no 682060 5, Rz
use 1 or 0 to
in- or exclude
EURAMET.L-K8.2013 Calibration of surface roughness standards Final report
Pg. 28/57
choose:
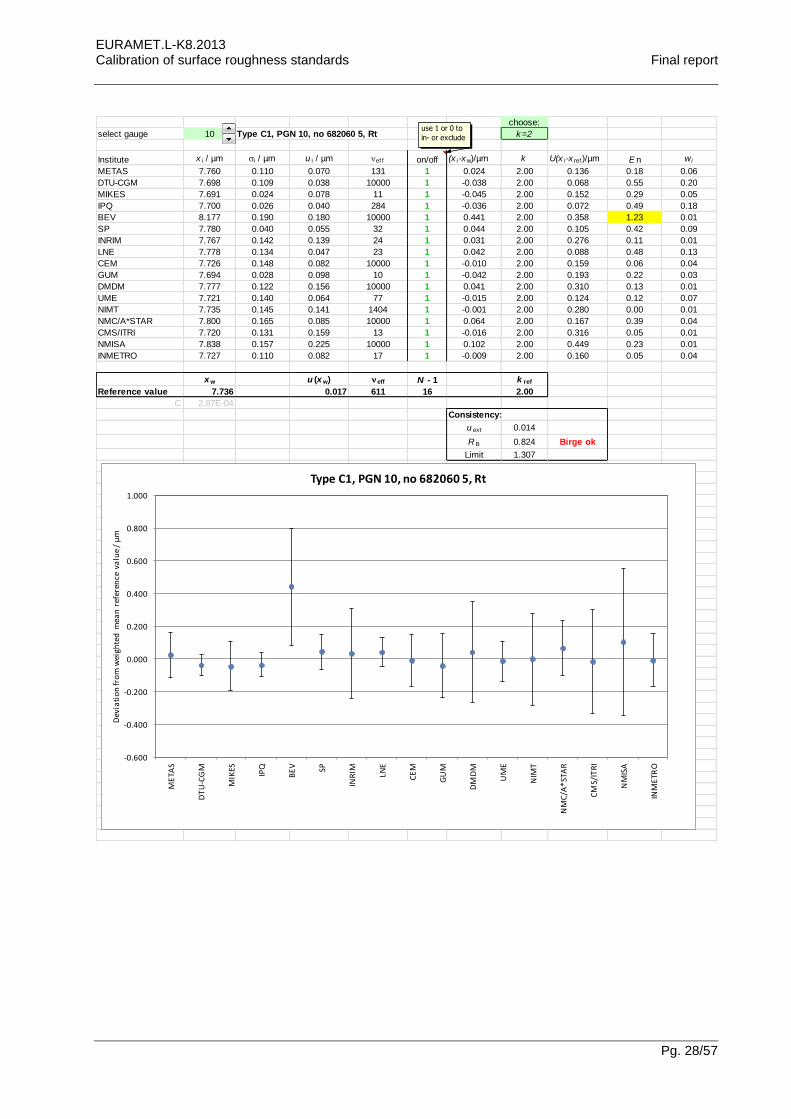
select gauge 10 Type C1, PGN 10, no 682060 5, Rt k=2
Institute x i / µm i / µm u i / µm ef f on/off (x i-xw)/µm k U(x i-x ref )/µm E n w i
METAS 7.760 0.110 0.070 131 1 0.024 2.00 0.136 0.18 0.06
DTU-CGM 7.698 0.109 0.038 10000 1 -0.038 2.00 0.068 0.55 0.20
MIKES 7.691 0.024 0.078 11 1 -0.045 2.00 0.152 0.29 0.05
IPQ 7.700 0.026 0.040 284 1 -0.036 2.00 0.072 0.49 0.18
BEV 8.177 0.190 0.180 10000 1 0.441 2.00 0.358 1.23 0.01
SP 7.780 0.040 0.055 32 1 0.044 2.00 0.105 0.42 0.09
INRIM 7.767 0.142 0.139 24 1 0.031 2.00 0.276 0.11 0.01
LNE 7.778 0.134 0.047 23 1 0.042 2.00 0.088 0.48 0.13
CEM 7.726 0.148 0.082 10000 1 -0.010 2.00 0.159 0.06 0.04
GUM 7.694 0.028 0.098 10 1 -0.042 2.00 0.193 0.22 0.03
DMDM 7.777 0.122 0.156 10000 1 0.041 2.00 0.310 0.13 0.01
UME 7.721 0.140 0.064 77 1 -0.015 2.00 0.124 0.12 0.07
NIMT 7.735 0.145 0.141 1404 1 -0.001 2.00 0.280 0.00 0.01
NMC/A*STAR 7.800 0.165 0.085 10000 1 0.064 2.00 0.167 0.39 0.04
CMS/ITRI 7.720 0.131 0.159 13 1 -0.016 2.00 0.316 0.05 0.01
NMISA 7.838 0.157 0.225 10000 1 0.102 2.00 0.449 0.23 0.01
INMETRO 7.727 0.110 0.082 17 1 -0.009 2.00 0.160 0.05 0.04
x w u (x w) eff N - 1 k ref
Reference value 7.736 0.017 611 16 2.00
C 2.87E-04
Consistency:
u ext 0.014
R B 0.824 Birge ok
Limit 1.307
if contributing to
if not contributing to
-0.600
-0.400
-0.200
0.000
0.200
0.400
0.600
0.800
1.000
ME
TAS
DT
U-C
GM
MIK
ES
IPQ
BE
V SP
INR
IM LNE
CE
M
GU
M
DM
DM
UM
E
NIM
T
NM
C/A
*ST
AR
CM
S/IT
RI
NM
ISA
INM
ETR
O
Dev
iati
on
fro
m w
eigh
ted
mea
n r
efer
ence
va
lue
/ µ
m
Type C1, PGN 10, no 682060 5, Rt
use 1 or 0 to
in- or exclude
EURAMET.L-K8.2013 Calibration of surface roughness standards Final report
Pg. 29/57
choose:
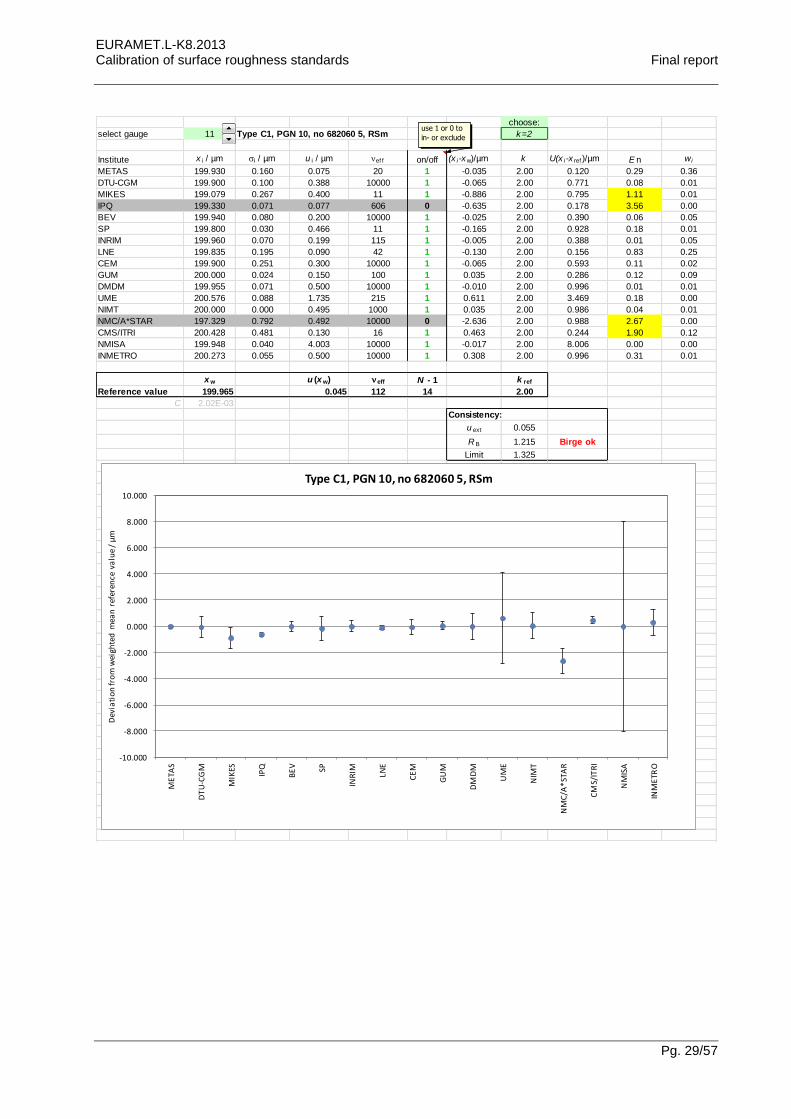
select gauge 11 Type C1, PGN 10, no 682060 5, RSm k=2
Institute x i / µm i / µm u i / µm ef f on/off (x i-xw)/µm k U(x i-x ref )/µm E n w i
METAS 199.930 0.160 0.075 20 1 -0.035 2.00 0.120 0.29 0.36
DTU-CGM 199.900 0.100 0.388 10000 1 -0.065 2.00 0.771 0.08 0.01
MIKES 199.079 0.267 0.400 11 1 -0.886 2.00 0.795 1.11 0.01
IPQ 199.330 0.071 0.077 606 0 -0.635 2.00 0.178 3.56 0.00
BEV 199.940 0.080 0.200 10000 1 -0.025 2.00 0.390 0.06 0.05
SP 199.800 0.030 0.466 11 1 -0.165 2.00 0.928 0.18 0.01
INRIM 199.960 0.070 0.199 115 1 -0.005 2.00 0.388 0.01 0.05
LNE 199.835 0.195 0.090 42 1 -0.130 2.00 0.156 0.83 0.25
CEM 199.900 0.251 0.300 10000 1 -0.065 2.00 0.593 0.11 0.02
GUM 200.000 0.024 0.150 100 1 0.035 2.00 0.286 0.12 0.09
DMDM 199.955 0.071 0.500 10000 1 -0.010 2.00 0.996 0.01 0.01
UME 200.576 0.088 1.735 215 1 0.611 2.00 3.469 0.18 0.00
NIMT 200.000 0.000 0.495 1000 1 0.035 2.00 0.986 0.04 0.01
NMC/A*STAR 197.329 0.792 0.492 10000 0 -2.636 2.00 0.988 2.67 0.00
CMS/ITRI 200.428 0.481 0.130 16 1 0.463 2.00 0.244 1.90 0.12
NMISA 199.948 0.040 4.003 10000 1 -0.017 2.00 8.006 0.00 0.00
INMETRO 200.273 0.055 0.500 10000 1 0.308 2.00 0.996 0.31 0.01
x w u (x w) eff N - 1 k ref
Reference value 199.965 0.045 112 14 2.00
C 2.02E-03
Consistency:
u ext 0.055
R B 1.215 Birge ok
Limit 1.325
if contributing to
if not contributing to
-10.000
-8.000
-6.000
-4.000
-2.000
0.000
2.000
4.000
6.000
8.000
10.000
ME
TAS
DT
U-C
GM
MIK
ES
IPQ
BE
V SP
INR
IM LNE
CE
M
GU
M
DM
DM
UM
E
NIM
T
NM
C/A
*ST
AR
CM
S/IT
RI
NM
ISA
INM
ETR
O
Dev
iati
on
fro
m w
eigh
ted
mea
n r
efer
ence
va
lue
/ µ
m
Type C1, PGN 10, no 682060 5, RSm
use 1 or 0 to
in- or exclude
EURAMET.L-K8.2013 Calibration of surface roughness standards Final report
Pg. 30/57
choose:
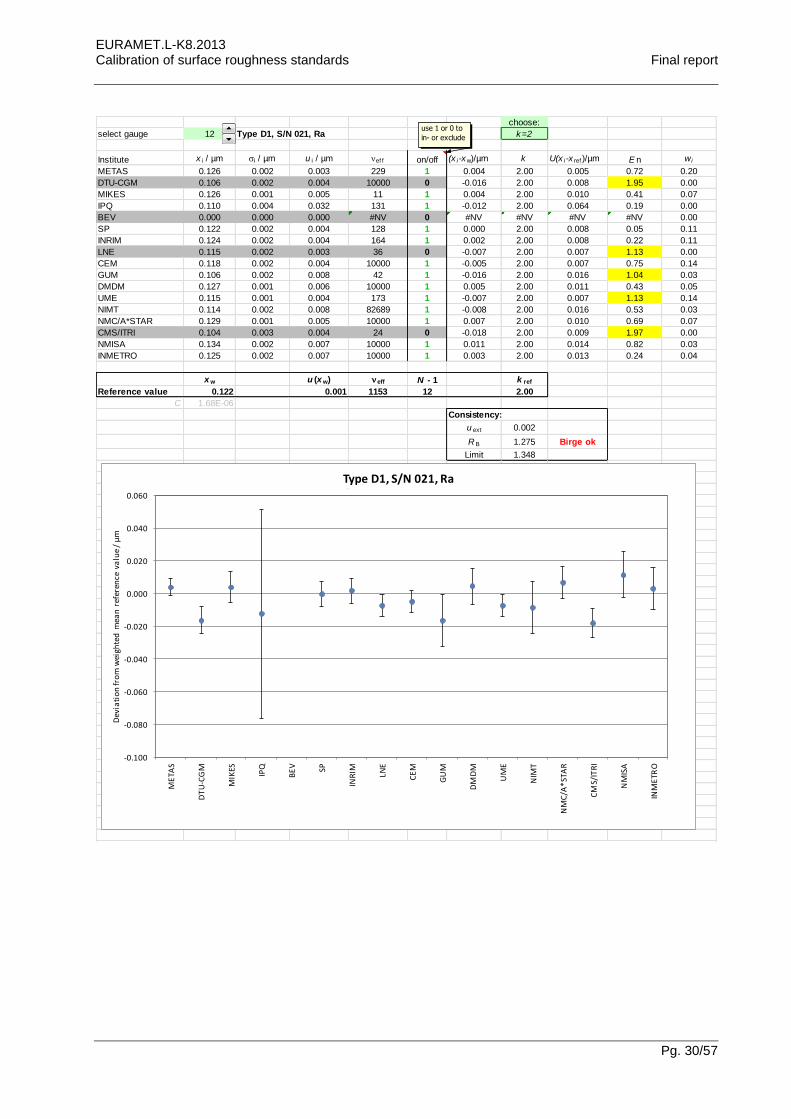
select gauge 12 Type D1, S/N 021, Ra k=2
Institute x i / µm i / µm u i / µm ef f on/off (x i-xw)/µm k U(x i-x ref )/µm E n w i
METAS 0.126 0.002 0.003 229 1 0.004 2.00 0.005 0.72 0.20
DTU-CGM 0.106 0.002 0.004 10000 0 -0.016 2.00 0.008 1.95 0.00
MIKES 0.126 0.001 0.005 11 1 0.004 2.00 0.010 0.41 0.07
IPQ 0.110 0.004 0.032 131 1 -0.012 2.00 0.064 0.19 0.00
BEV 0.000 0.000 0.000 #NV 0 #NV #NV #NV #NV 0.00
SP 0.122 0.002 0.004 128 1 0.000 2.00 0.008 0.05 0.11
INRIM 0.124 0.002 0.004 164 1 0.002 2.00 0.008 0.22 0.11
LNE 0.115 0.002 0.003 36 0 -0.007 2.00 0.007 1.13 0.00
CEM 0.118 0.002 0.004 10000 1 -0.005 2.00 0.007 0.75 0.14
GUM 0.106 0.002 0.008 42 1 -0.016 2.00 0.016 1.04 0.03
DMDM 0.127 0.001 0.006 10000 1 0.005 2.00 0.011 0.43 0.05
UME 0.115 0.001 0.004 173 1 -0.007 2.00 0.007 1.13 0.14
NIMT 0.114 0.002 0.008 82689 1 -0.008 2.00 0.016 0.53 0.03
NMC/A*STAR 0.129 0.001 0.005 10000 1 0.007 2.00 0.010 0.69 0.07
CMS/ITRI 0.104 0.003 0.004 24 0 -0.018 2.00 0.009 1.97 0.00
NMISA 0.134 0.002 0.007 10000 1 0.011 2.00 0.014 0.82 0.03
INMETRO 0.125 0.002 0.007 10000 1 0.003 2.00 0.013 0.24 0.04
x w u (x w) eff N - 1 k ref
Reference value 0.122 0.001 1153 12 2.00
C 1.68E-06
Consistency:
u ext 0.002
R B 1.275 Birge ok
Limit 1.348
if contributing to
if not contributing to
-0.100
-0.080
-0.060
-0.040
-0.020
0.000
0.020
0.040
0.060
ME
TAS
DT
U-C
GM
MIK
ES
IPQ
BE
V SP
INR
IM LNE
CE
M
GU
M
DM
DM
UM
E
NIM
T
NM
C/A
*ST
AR
CM
S/IT
RI
NM
ISA
INM
ETR
O
Dev
iati
on
fro
m w
eigh
ted
mea
n r
efer
ence
va
lue
/ µ
m
Type D1, S/N 021, Ra
use 1 or 0 to
in- or exclude
EURAMET.L-K8.2013 Calibration of surface roughness standards Final report
Pg. 31/57
choose:
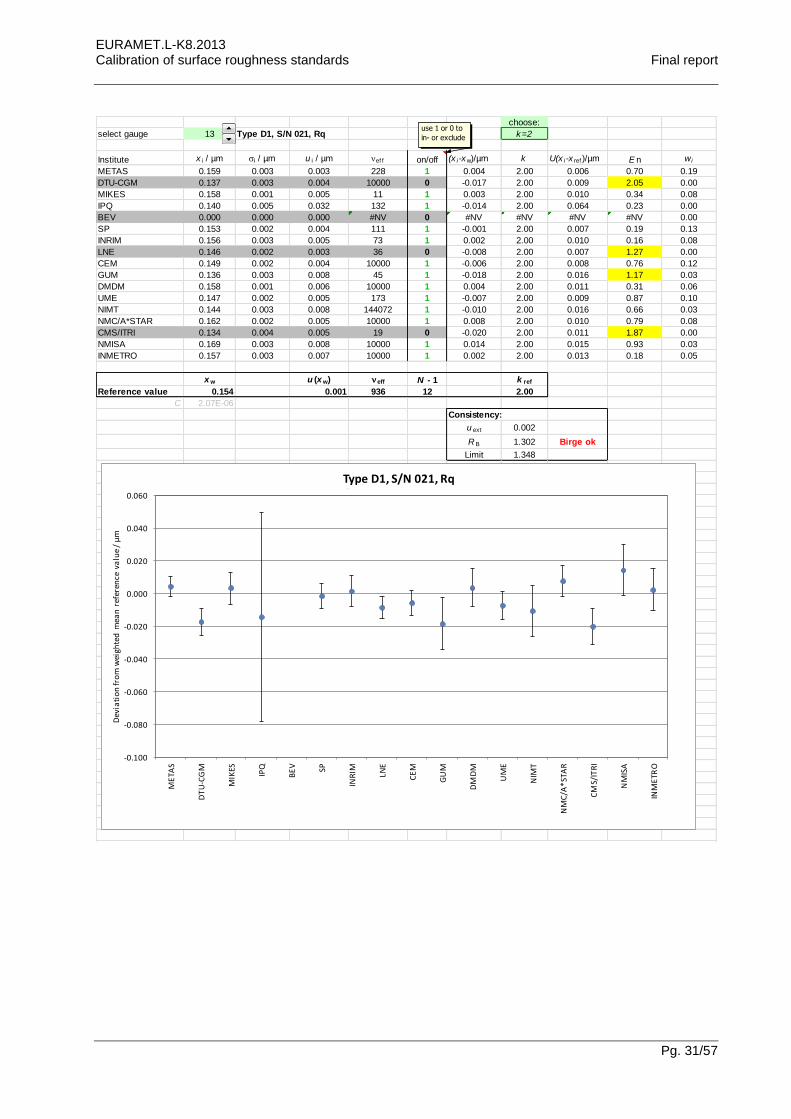
select gauge 13 Type D1, S/N 021, Rq k=2
Institute x i / µm i / µm u i / µm ef f on/off (x i-xw)/µm k U(x i-x ref )/µm E n w i
METAS 0.159 0.003 0.003 228 1 0.004 2.00 0.006 0.70 0.19
DTU-CGM 0.137 0.003 0.004 10000 0 -0.017 2.00 0.009 2.05 0.00
MIKES 0.158 0.001 0.005 11 1 0.003 2.00 0.010 0.34 0.08
IPQ 0.140 0.005 0.032 132 1 -0.014 2.00 0.064 0.23 0.00
BEV 0.000 0.000 0.000 #NV 0 #NV #NV #NV #NV 0.00
SP 0.153 0.002 0.004 111 1 -0.001 2.00 0.007 0.19 0.13
INRIM 0.156 0.003 0.005 73 1 0.002 2.00 0.010 0.16 0.08
LNE 0.146 0.002 0.003 36 0 -0.008 2.00 0.007 1.27 0.00
CEM 0.149 0.002 0.004 10000 1 -0.006 2.00 0.008 0.76 0.12
GUM 0.136 0.003 0.008 45 1 -0.018 2.00 0.016 1.17 0.03
DMDM 0.158 0.001 0.006 10000 1 0.004 2.00 0.011 0.31 0.06
UME 0.147 0.002 0.005 173 1 -0.007 2.00 0.009 0.87 0.10
NIMT 0.144 0.003 0.008 144072 1 -0.010 2.00 0.016 0.66 0.03
NMC/A*STAR 0.162 0.002 0.005 10000 1 0.008 2.00 0.010 0.79 0.08
CMS/ITRI 0.134 0.004 0.005 19 0 -0.020 2.00 0.011 1.87 0.00
NMISA 0.169 0.003 0.008 10000 1 0.014 2.00 0.015 0.93 0.03
INMETRO 0.157 0.003 0.007 10000 1 0.002 2.00 0.013 0.18 0.05
x w u (x w) eff N - 1 k ref
Reference value 0.154 0.001 936 12 2.00
C 2.07E-06
Consistency:
u ext 0.002
R B 1.302 Birge ok
Limit 1.348
if contributing to
if not contributing to
-0.100
-0.080
-0.060
-0.040
-0.020
0.000
0.020
0.040
0.060
ME
TAS
DT
U-C
GM
MIK
ES
IPQ
BE
V SP
INR
IM LNE
CE
M
GU
M
DM
DM
UM
E
NIM
T
NM
C/A
*ST
AR
CM
S/IT
RI
NM
ISA
INM
ETR
O
Dev
iati
on
fro
m w
eigh
ted
mea
n r
efer
ence
va
lue
/ µ
m
Type D1, S/N 021, Rq
use 1 or 0 to
in- or exclude
EURAMET.L-K8.2013 Calibration of surface roughness standards Final report
Pg. 32/57
choose:
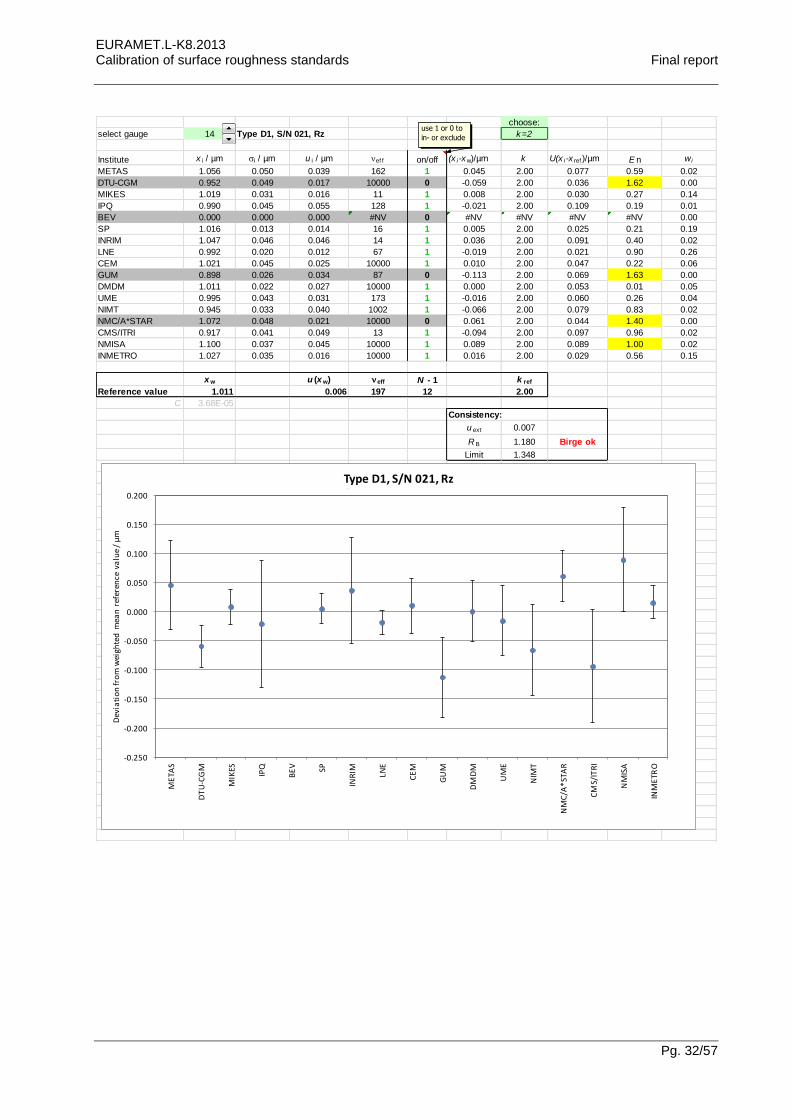
select gauge 14 Type D1, S/N 021, Rz k=2
Institute x i / µm i / µm u i / µm ef f on/off (x i-xw)/µm k U(x i-x ref )/µm E n w i
METAS 1.056 0.050 0.039 162 1 0.045 2.00 0.077 0.59 0.02
DTU-CGM 0.952 0.049 0.017 10000 0 -0.059 2.00 0.036 1.62 0.00
MIKES 1.019 0.031 0.016 11 1 0.008 2.00 0.030 0.27 0.14
IPQ 0.990 0.045 0.055 128 1 -0.021 2.00 0.109 0.19 0.01
BEV 0.000 0.000 0.000 #NV 0 #NV #NV #NV #NV 0.00
SP 1.016 0.013 0.014 16 1 0.005 2.00 0.025 0.21 0.19
INRIM 1.047 0.046 0.046 14 1 0.036 2.00 0.091 0.40 0.02
LNE 0.992 0.020 0.012 67 1 -0.019 2.00 0.021 0.90 0.26
CEM 1.021 0.045 0.025 10000 1 0.010 2.00 0.047 0.22 0.06
GUM 0.898 0.026 0.034 87 0 -0.113 2.00 0.069 1.63 0.00
DMDM 1.011 0.022 0.027 10000 1 0.000 2.00 0.053 0.01 0.05
UME 0.995 0.043 0.031 173 1 -0.016 2.00 0.060 0.26 0.04
NIMT 0.945 0.033 0.040 1002 1 -0.066 2.00 0.079 0.83 0.02
NMC/A*STAR 1.072 0.048 0.021 10000 0 0.061 2.00 0.044 1.40 0.00
CMS/ITRI 0.917 0.041 0.049 13 1 -0.094 2.00 0.097 0.96 0.02
NMISA 1.100 0.037 0.045 10000 1 0.089 2.00 0.089 1.00 0.02
INMETRO 1.027 0.035 0.016 10000 1 0.016 2.00 0.029 0.56 0.15
x w u (x w) eff N - 1 k ref
Reference value 1.011 0.006 197 12 2.00
C 3.68E-05
Consistency:
u ext 0.007
R B 1.180 Birge ok
Limit 1.348
if contributing to
if not contributing to
-0.250
-0.200
-0.150
-0.100
-0.050
0.000
0.050
0.100
0.150
0.200
ME
TAS
DT
U-C
GM
MIK
ES
IPQ
BE
V SP
INR
IM LNE
CE
M
GU
M
DM
DM
UM
E
NIM
T
NM
C/A
*ST
AR
CM
S/IT
RI
NM
ISA
INM
ETR
O
Dev
iati
on
fro
m w
eigh
ted
mea
n r
efer
ence
va
lue
/ µ
m
Type D1, S/N 021, Rz
use 1 or 0 to
in- or exclude
EURAMET.L-K8.2013 Calibration of surface roughness standards Final report
Pg. 33/57
choose:
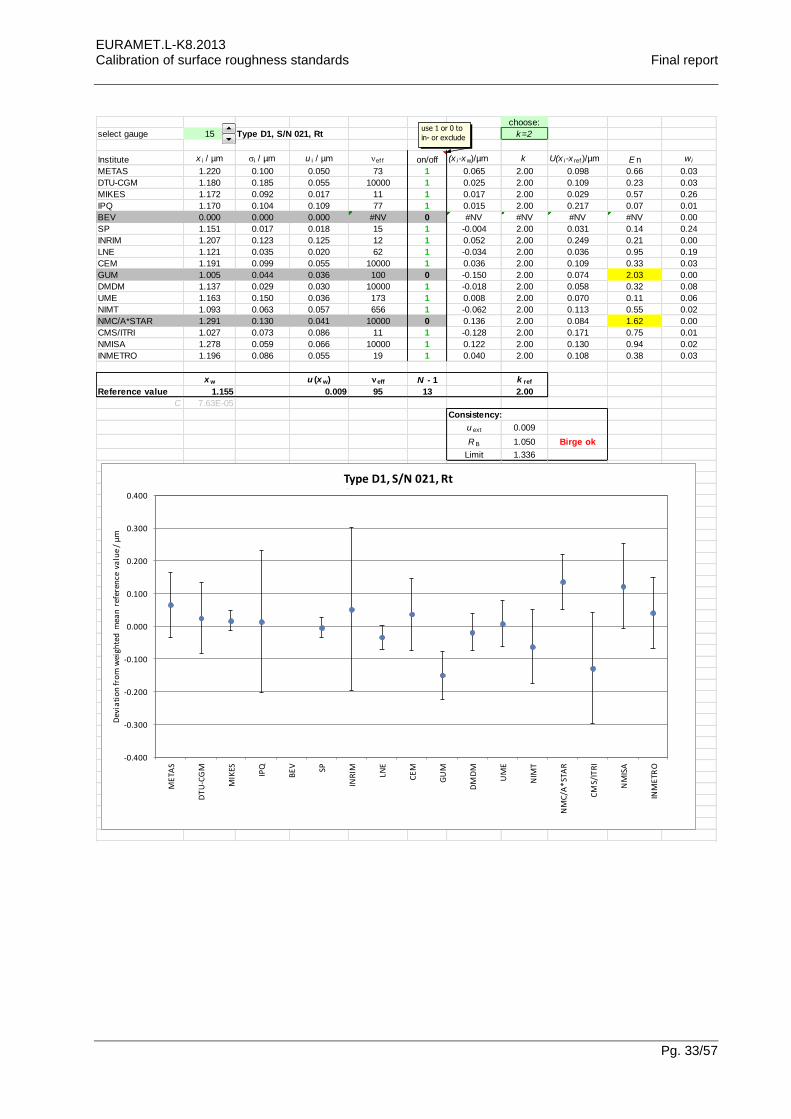
select gauge 15 Type D1, S/N 021, Rt k=2
Institute x i / µm i / µm u i / µm ef f on/off (x i-xw)/µm k U(x i-x ref )/µm E n w i
METAS 1.220 0.100 0.050 73 1 0.065 2.00 0.098 0.66 0.03
DTU-CGM 1.180 0.185 0.055 10000 1 0.025 2.00 0.109 0.23 0.03
MIKES 1.172 0.092 0.017 11 1 0.017 2.00 0.029 0.57 0.26
IPQ 1.170 0.104 0.109 77 1 0.015 2.00 0.217 0.07 0.01
BEV 0.000 0.000 0.000 #NV 0 #NV #NV #NV #NV 0.00
SP 1.151 0.017 0.018 15 1 -0.004 2.00 0.031 0.14 0.24
INRIM 1.207 0.123 0.125 12 1 0.052 2.00 0.249 0.21 0.00
LNE 1.121 0.035 0.020 62 1 -0.034 2.00 0.036 0.95 0.19
CEM 1.191 0.099 0.055 10000 1 0.036 2.00 0.109 0.33 0.03
GUM 1.005 0.044 0.036 100 0 -0.150 2.00 0.074 2.03 0.00
DMDM 1.137 0.029 0.030 10000 1 -0.018 2.00 0.058 0.32 0.08
UME 1.163 0.150 0.036 173 1 0.008 2.00 0.070 0.11 0.06
NIMT 1.093 0.063 0.057 656 1 -0.062 2.00 0.113 0.55 0.02
NMC/A*STAR 1.291 0.130 0.041 10000 0 0.136 2.00 0.084 1.62 0.00
CMS/ITRI 1.027 0.073 0.086 11 1 -0.128 2.00 0.171 0.75 0.01
NMISA 1.278 0.059 0.066 10000 1 0.122 2.00 0.130 0.94 0.02
INMETRO 1.196 0.086 0.055 19 1 0.040 2.00 0.108 0.38 0.03
x w u (x w) eff N - 1 k ref
Reference value 1.155 0.009 95 13 2.00
C 7.63E-05
Consistency:
u ext 0.009
R B 1.050 Birge ok
Limit 1.336
if contributing to
if not contributing to
-0.400
-0.300
-0.200
-0.100
0.000
0.100
0.200
0.300
0.400
ME
TAS
DT
U-C
GM
MIK
ES
IPQ
BE
V SP
INR
IM LNE
CE
M
GU
M
DM
DM
UM
E
NIM
T
NM
C/A
*ST
AR
CM
S/IT
RI
NM
ISA
INM
ETR
O
Dev
iati
on
fro
m w
eigh
ted
mea
n r
efer
ence
va
lue
/ µ
m
Type D1, S/N 021, Rt
use 1 or 0 to
in- or exclude

EURAMET.L-K8.2013 Calibration of surface roughness standards Final report
Pg. 34/57
choose:
select gauge 16 Type D1, KNT 2070/03, S/N 0986, Ra k=2
Institute x i / µm i / µm u i / µm ef f on/off (x i-xw)/µm k U(x i-x ref )/µm E n w i
METAS 0.060 0.001 0.002 147 1 0.000 2.00 0.004 0.01 0.18
DTU-CGM 0.059 0.002 0.004 10000 1 -0.001 2.00 0.008 0.12 0.05
MIKES 0.061 0.001 0.005 11 1 0.001 2.00 0.010 0.13 0.04
IPQ 0.060 0.001 0.030 108 1 0.000 2.00 0.060 0.00 0.00
BEV 0.000 0.000 0.000 #NV 0 #NV #NV #NV #NV 0.00
SP 0.060 0.001 0.004 124 1 0.000 2.00 0.008 0.01 0.05
INRIM 0.060 0.002 0.004 145 1 0.000 2.00 0.008 0.00 0.05
LNE 0.060 0.002 0.003 31 1 0.000 2.00 0.006 0.01 0.10
CEM 0.059 0.001 0.002 10000 1 -0.001 2.00 0.003 0.17 0.23
GUM 0.059 0.001 0.008 38 1 -0.001 2.00 0.016 0.06 0.01
DMDM 0.061 0.002 0.005 10000 1 0.001 2.00 0.010 0.10 0.03
UME 0.061 0.002 0.005 137 1 0.001 2.00 0.009 0.11 0.04
NIMT 0.060 0.001 0.008 1415523 1 0.000 2.00 0.015 0.00 0.01
NMC/A*STAR 0.060 0.001 0.005 10000 1 0.000 2.00 0.010 0.00 0.04
CMS/ITRI 0.060 0.001 0.003 86 1 0.000 2.00 0.006 0.01 0.10
NMISA 0.062 0.002 0.006 10000 1 0.002 2.00 0.011 0.18 0.03
INMETRO 0.061 0.002 0.006 10000 1 0.001 2.00 0.012 0.08 0.02
x w u (x w) eff N - 1 k ref
Reference value 0.060 0.001 1211 15 2.00
C 8.80E-07
Consistency:
u ext 0.000
R B 0.174 Birge ok
Limit 1.315
if contributing to
if not contributing to
-0.080
-0.060
-0.040
-0.020
0.000
0.020
0.040
0.060
0.080
ME
TAS
DT
U-C
GM
MIK
ES
IPQ
BE
V SP
INR
IM LNE
CE
M
GU
M
DM
DM
UM
E
NIM
T
NM
C/A
*ST
AR
CM
S/IT
RI
NM
ISA
INM
ETR
O
Dev
iati
on
fro
m w
eigh
ted
mea
n r
efer
ence
va
lue
/ µ
m
Type D1, KNT 2070/03, S/N 0986, Ra
use 1 or 0 to
in- or exclude
EURAMET.L-K8.2013 Calibration of surface roughness standards Final report
Pg. 35/57
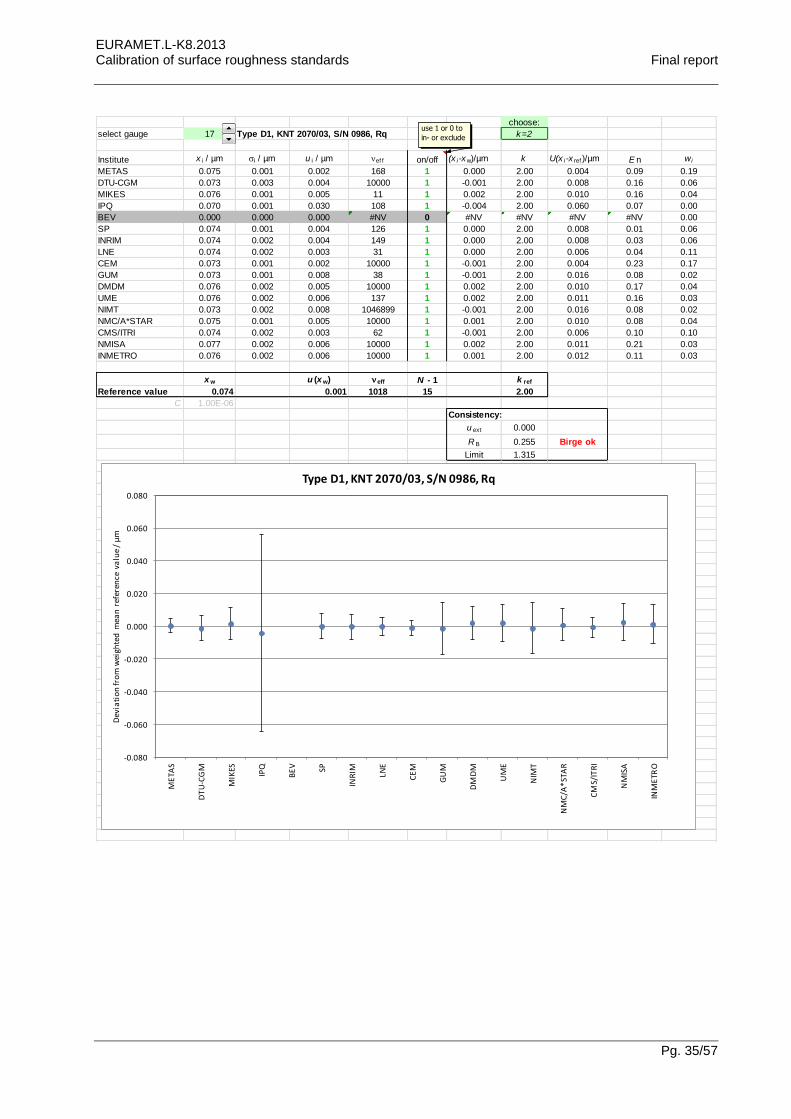
choose:
select gauge 17 Type D1, KNT 2070/03, S/N 0986, Rq k=2
Institute x i / µm i / µm u i / µm ef f on/off (x i-xw)/µm k U(x i-x ref )/µm E n w i
METAS 0.075 0.001 0.002 168 1 0.000 2.00 0.004 0.09 0.19
DTU-CGM 0.073 0.003 0.004 10000 1 -0.001 2.00 0.008 0.16 0.06
MIKES 0.076 0.001 0.005 11 1 0.002 2.00 0.010 0.16 0.04
IPQ 0.070 0.001 0.030 108 1 -0.004 2.00 0.060 0.07 0.00
BEV 0.000 0.000 0.000 #NV 0 #NV #NV #NV #NV 0.00
SP 0.074 0.001 0.004 126 1 0.000 2.00 0.008 0.01 0.06
INRIM 0.074 0.002 0.004 149 1 0.000 2.00 0.008 0.03 0.06
LNE 0.074 0.002 0.003 31 1 0.000 2.00 0.006 0.04 0.11
CEM 0.073 0.001 0.002 10000 1 -0.001 2.00 0.004 0.23 0.17
GUM 0.073 0.001 0.008 38 1 -0.001 2.00 0.016 0.08 0.02
DMDM 0.076 0.002 0.005 10000 1 0.002 2.00 0.010 0.17 0.04
UME 0.076 0.002 0.006 137 1 0.002 2.00 0.011 0.16 0.03
NIMT 0.073 0.002 0.008 1046899 1 -0.001 2.00 0.016 0.08 0.02
NMC/A*STAR 0.075 0.001 0.005 10000 1 0.001 2.00 0.010 0.08 0.04
CMS/ITRI 0.074 0.002 0.003 62 1 -0.001 2.00 0.006 0.10 0.10
NMISA 0.077 0.002 0.006 10000 1 0.002 2.00 0.011 0.21 0.03
INMETRO 0.076 0.002 0.006 10000 1 0.001 2.00 0.012 0.11 0.03
x w u (x w) eff N - 1 k ref
Reference value 0.074 0.001 1018 15 2.00
C 1.00E-06
Consistency:
u ext 0.000
R B 0.255 Birge ok
Limit 1.315
if contributing to
if not contributing to
-0.080
-0.060
-0.040
-0.020
0.000
0.020
0.040
0.060
0.080
ME
TAS
DT
U-C
GM
MIK
ES
IPQ
BE
V SP
INR
IM LNE
CE
M
GU
M
DM
DM
UM
E
NIM
T
NM
C/A
*ST
AR
CM
S/IT
RI
NM
ISA
INM
ETR
O
Dev
iati
on
fro
m w
eigh
ted
mea
n r
efer
ence
va
lue
/ µ
m
Type D1, KNT 2070/03, S/N 0986, Rq
use 1 or 0 to
in- or exclude
EURAMET.L-K8.2013 Calibration of surface roughness standards Final report
Pg. 36/57
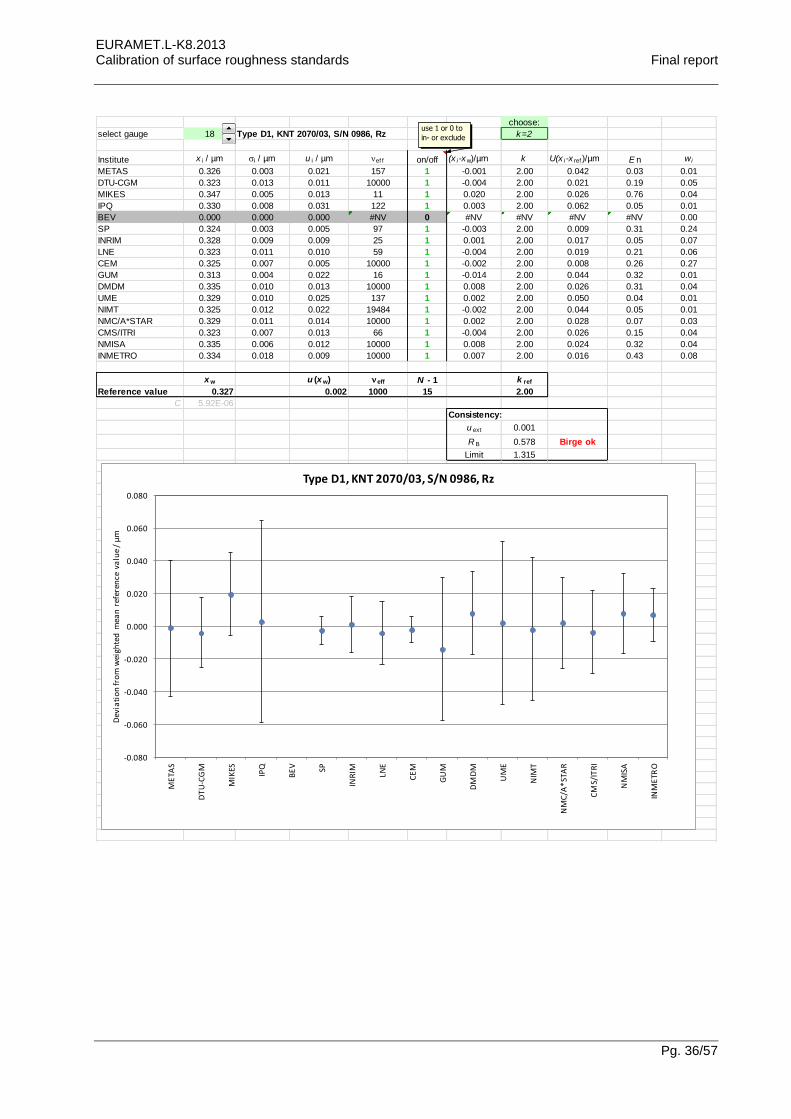
choose:
select gauge 18 Type D1, KNT 2070/03, S/N 0986, Rz k=2
Institute x i / µm i / µm u i / µm ef f on/off (x i-xw)/µm k U(x i-x ref )/µm E n w i
METAS 0.326 0.003 0.021 157 1 -0.001 2.00 0.042 0.03 0.01
DTU-CGM 0.323 0.013 0.011 10000 1 -0.004 2.00 0.021 0.19 0.05
MIKES 0.347 0.005 0.013 11 1 0.020 2.00 0.026 0.76 0.04
IPQ 0.330 0.008 0.031 122 1 0.003 2.00 0.062 0.05 0.01
BEV 0.000 0.000 0.000 #NV 0 #NV #NV #NV #NV 0.00
SP 0.324 0.003 0.005 97 1 -0.003 2.00 0.009 0.31 0.24
INRIM 0.328 0.009 0.009 25 1 0.001 2.00 0.017 0.05 0.07
LNE 0.323 0.011 0.010 59 1 -0.004 2.00 0.019 0.21 0.06
CEM 0.325 0.007 0.005 10000 1 -0.002 2.00 0.008 0.26 0.27
GUM 0.313 0.004 0.022 16 1 -0.014 2.00 0.044 0.32 0.01
DMDM 0.335 0.010 0.013 10000 1 0.008 2.00 0.026 0.31 0.04
UME 0.329 0.010 0.025 137 1 0.002 2.00 0.050 0.04 0.01
NIMT 0.325 0.012 0.022 19484 1 -0.002 2.00 0.044 0.05 0.01
NMC/A*STAR 0.329 0.011 0.014 10000 1 0.002 2.00 0.028 0.07 0.03
CMS/ITRI 0.323 0.007 0.013 66 1 -0.004 2.00 0.026 0.15 0.04
NMISA 0.335 0.006 0.012 10000 1 0.008 2.00 0.024 0.32 0.04
INMETRO 0.334 0.018 0.009 10000 1 0.007 2.00 0.016 0.43 0.08
x w u (x w) eff N - 1 k ref
Reference value 0.327 0.002 1000 15 2.00
C 5.92E-06
Consistency:
u ext 0.001
R B 0.578 Birge ok
Limit 1.315
if contributing to
if not contributing to
-0.080
-0.060
-0.040
-0.020
0.000
0.020
0.040
0.060
0.080
ME
TAS
DT
U-C
GM
MIK
ES
IPQ
BE
V SP
INR
IM LNE
CE
M
GU
M
DM
DM
UM
E
NIM
T
NM
C/A
*ST
AR
CM
S/IT
RI
NM
ISA
INM
ETR
O
Dev
iati
on
fro
m w
eigh
ted
mea
n r
efer
ence
va
lue
/ µ
m
Type D1, KNT 2070/03, S/N 0986, Rz
use 1 or 0 to
in- or exclude
EURAMET.L-K8.2013 Calibration of surface roughness standards Final report
Pg. 37/57
choose:
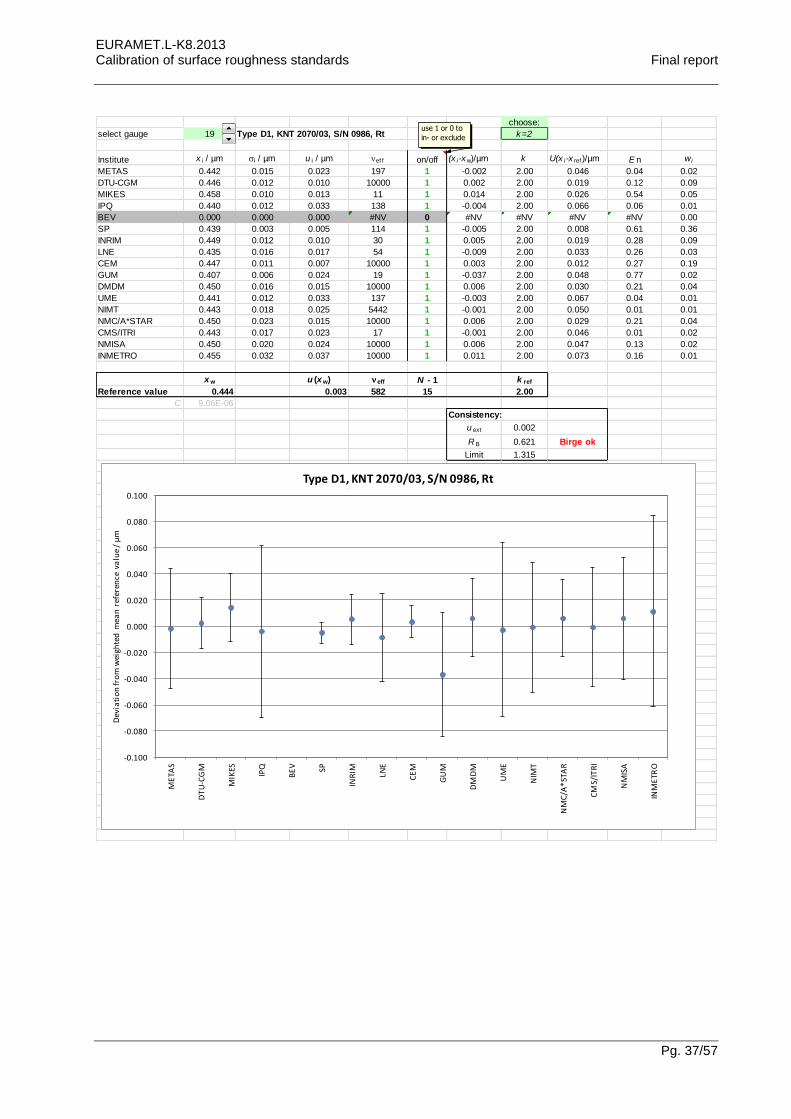
select gauge 19 Type D1, KNT 2070/03, S/N 0986, Rt k=2
Institute x i / µm i / µm u i / µm ef f on/off (x i-xw)/µm k U(x i-x ref )/µm E n w i
METAS 0.442 0.015 0.023 197 1 -0.002 2.00 0.046 0.04 0.02
DTU-CGM 0.446 0.012 0.010 10000 1 0.002 2.00 0.019 0.12 0.09
MIKES 0.458 0.010 0.013 11 1 0.014 2.00 0.026 0.54 0.05
IPQ 0.440 0.012 0.033 138 1 -0.004 2.00 0.066 0.06 0.01
BEV 0.000 0.000 0.000 #NV 0 #NV #NV #NV #NV 0.00
SP 0.439 0.003 0.005 114 1 -0.005 2.00 0.008 0.61 0.36
INRIM 0.449 0.012 0.010 30 1 0.005 2.00 0.019 0.28 0.09
LNE 0.435 0.016 0.017 54 1 -0.009 2.00 0.033 0.26 0.03
CEM 0.447 0.011 0.007 10000 1 0.003 2.00 0.012 0.27 0.19
GUM 0.407 0.006 0.024 19 1 -0.037 2.00 0.048 0.77 0.02
DMDM 0.450 0.016 0.015 10000 1 0.006 2.00 0.030 0.21 0.04
UME 0.441 0.012 0.033 137 1 -0.003 2.00 0.067 0.04 0.01
NIMT 0.443 0.018 0.025 5442 1 -0.001 2.00 0.050 0.01 0.01
NMC/A*STAR 0.450 0.023 0.015 10000 1 0.006 2.00 0.029 0.21 0.04
CMS/ITRI 0.443 0.017 0.023 17 1 -0.001 2.00 0.046 0.01 0.02
NMISA 0.450 0.020 0.024 10000 1 0.006 2.00 0.047 0.13 0.02
INMETRO 0.455 0.032 0.037 10000 1 0.011 2.00 0.073 0.16 0.01
x w u (x w) eff N - 1 k ref
Reference value 0.444 0.003 582 15 2.00
C 9.06E-06
Consistency:
u ext 0.002
R B 0.621 Birge ok
Limit 1.315
if contributing to
if not contributing to
-0.100
-0.080
-0.060
-0.040
-0.020
0.000
0.020
0.040
0.060
0.080
0.100
ME
TAS
DT
U-C
GM
MIK
ES
IPQ
BE
V SP
INR
IM LNE
CE
M
GU
M
DM
DM
UM
E
NIM
T
NM
C/A
*ST
AR
CM
S/IT
RI
NM
ISA
INM
ETR
O
Dev
iati
on
fro
m w
eigh
ted
mea
n r
efer
ence
va
lue
/ µ
m
Type D1, KNT 2070/03, S/N 0986, Rt
use 1 or 0 to
in- or exclude

EURAMET.L-K8.2013 Calibration of surface roughness standards Final report
Pg. 38/57
choose:
select gauge 20 Type C1, NIST SRM 2072, S/N 1015, Ra k=2
Institute x i / µm i / µm u i / µm ef f on/off (x i-xw)/µm k U(x i-x ref )/µm E n w i
METAS 1.010 0.003 0.010 180 1 0.001 2.00 0.020 0.04 0.04
DTU-CGM 1.008 0.005 0.005 10000 1 -0.001 2.00 0.009 0.13 0.18
MIKES 1.014 0.004 0.011 11 1 0.005 2.00 0.022 0.24 0.03
IPQ 1.000 0.001 0.035 74 1 -0.009 2.00 0.070 0.13 0.00
BEV 0.000 0.000 0.000 #NV 0 #NV #NV #NV #NV 0.00
SP 1.011 0.001 0.006 225 1 0.002 2.00 0.011 0.16 0.12
INRIM 1.012 0.003 0.011 68 1 0.003 2.00 0.022 0.13 0.04
LNE 1.009 0.003 0.007 23 1 0.000 2.00 0.013 0.01 0.09
CEM 1.010 0.002 0.004 10000 1 0.001 2.00 0.008 0.11 0.23
GUM 1.004 0.001 0.015 40 1 -0.005 2.00 0.030 0.17 0.02
DMDM 1.016 0.002 0.016 10000 1 0.007 2.00 0.032 0.22 0.02
UME 1.009 0.005 0.011 265 1 0.000 2.00 0.022 0.01 0.03
NIMT 1.001 0.002 0.011 363696 1 -0.008 2.00 0.022 0.38 0.04
NMC/A*STAR 1.010 0.002 0.010 10000 1 0.001 2.00 0.020 0.04 0.04
CMS/ITRI 1.006 0.002 0.007 136 1 -0.003 2.00 0.014 0.20 0.08
NMISA 1.009 0.003 0.024 10000 1 0.000 2.00 0.048 0.00 0.01
INMETRO 1.009 0.001 0.015 10000 1 0.000 2.00 0.030 0.00 0.02
x w u (x w) eff N - 1 k ref
Reference value 1.009 0.002 1574 15 2.00
C 4.43E-06
Consistency:
u ext 0.001
R B 0.322 Birge ok
Limit 1.315
if contributing to
if not contributing to
-0.100
-0.080
-0.060
-0.040
-0.020
0.000
0.020
0.040
0.060
0.080
ME
TAS
DT
U-C
GM
MIK
ES
IPQ
BE
V SP
INR
IM LNE
CE
M
GU
M
DM
DM
UM
E
NIM
T
NM
C/A
*ST
AR
CM
S/IT
RI
NM
ISA
INM
ETR
O
Dev
iati
on
fro
m w
eigh
ted
mea
n r
efer
ence
va
lue
/ µ
m
Type C1, NIST SRM 2072, S/N 1015, Ra
use 1 or 0 to
in- or exclude
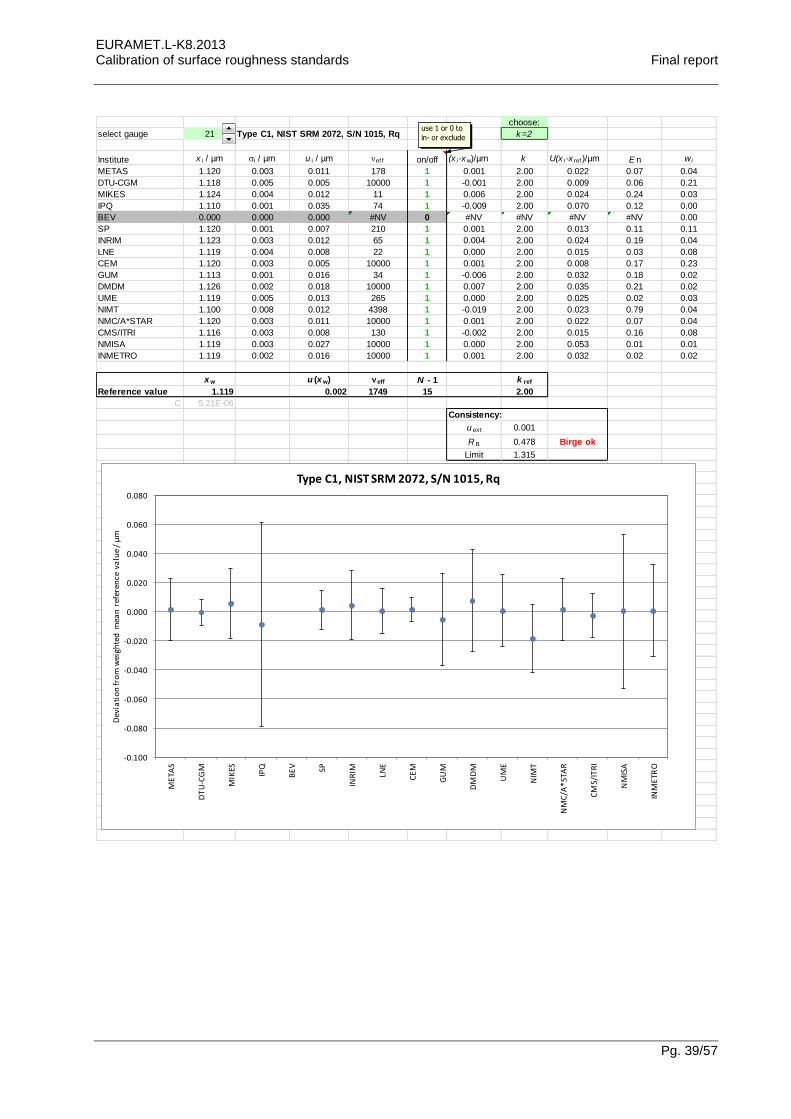
EURAMET.L-K8.2013 Calibration of surface roughness standards Final report
Pg. 39/57
choose:
select gauge 21 Type C1, NIST SRM 2072, S/N 1015, Rq k=2
Institute x i / µm i / µm u i / µm ef f on/off (x i-xw)/µm k U(x i-x ref )/µm E n w i
METAS 1.120 0.003 0.011 178 1 0.001 2.00 0.022 0.07 0.04
DTU-CGM 1.118 0.005 0.005 10000 1 -0.001 2.00 0.009 0.06 0.21
MIKES 1.124 0.004 0.012 11 1 0.006 2.00 0.024 0.24 0.03
IPQ 1.110 0.001 0.035 74 1 -0.009 2.00 0.070 0.12 0.00
BEV 0.000 0.000 0.000 #NV 0 #NV #NV #NV #NV 0.00
SP 1.120 0.001 0.007 210 1 0.001 2.00 0.013 0.11 0.11
INRIM 1.123 0.003 0.012 65 1 0.004 2.00 0.024 0.19 0.04
LNE 1.119 0.004 0.008 22 1 0.000 2.00 0.015 0.03 0.08
CEM 1.120 0.003 0.005 10000 1 0.001 2.00 0.008 0.17 0.23
GUM 1.113 0.001 0.016 34 1 -0.006 2.00 0.032 0.18 0.02
DMDM 1.126 0.002 0.018 10000 1 0.007 2.00 0.035 0.21 0.02
UME 1.119 0.005 0.013 265 1 0.000 2.00 0.025 0.02 0.03
NIMT 1.100 0.008 0.012 4398 1 -0.019 2.00 0.023 0.79 0.04
NMC/A*STAR 1.120 0.003 0.011 10000 1 0.001 2.00 0.022 0.07 0.04
CMS/ITRI 1.116 0.003 0.008 130 1 -0.002 2.00 0.015 0.16 0.08
NMISA 1.119 0.003 0.027 10000 1 0.000 2.00 0.053 0.01 0.01
INMETRO 1.119 0.002 0.016 10000 1 0.001 2.00 0.032 0.02 0.02
x w u (x w) eff N - 1 k ref
Reference value 1.119 0.002 1749 15 2.00
C 5.21E-06
Consistency:
u ext 0.001
R B 0.478 Birge ok
Limit 1.315
if contributing to
if not contributing to
-0.100
-0.080
-0.060
-0.040
-0.020
0.000
0.020
0.040
0.060
0.080
ME
TAS
DT
U-C
GM
MIK
ES
IPQ
BE
V SP
INR
IM LNE
CE
M
GU
M
DM
DM
UM
E
NIM
T
NM
C/A
*ST
AR
CM
S/IT
RI
NM
ISA
INM
ETR
O
Dev
iati
on
fro
m w
eigh
ted
mea
n r
efer
ence
va
lue
/ µ
m
Type C1, NIST SRM 2072, S/N 1015, Rq
use 1 or 0 to
in- or exclude
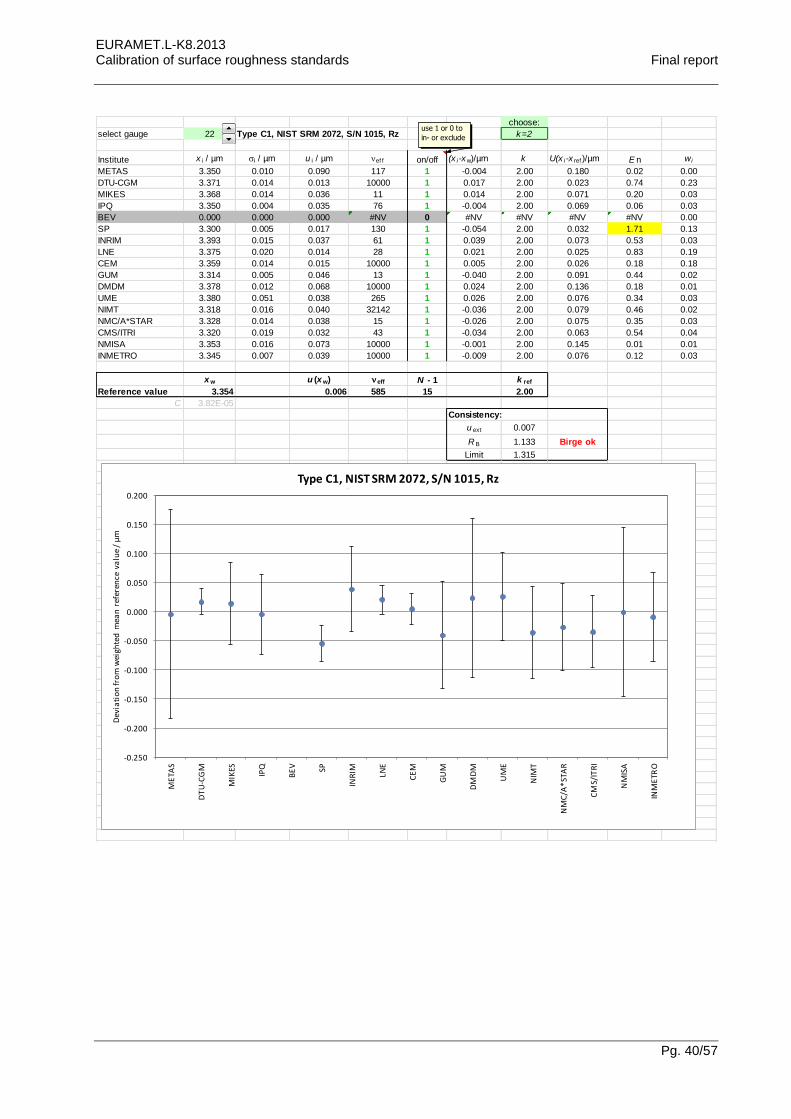
EURAMET.L-K8.2013 Calibration of surface roughness standards Final report
Pg. 40/57
choose:
select gauge 22 Type C1, NIST SRM 2072, S/N 1015, Rz k=2
Institute x i / µm i / µm u i / µm ef f on/off (x i-xw)/µm k U(x i-x ref )/µm E n w i
METAS 3.350 0.010 0.090 117 1 -0.004 2.00 0.180 0.02 0.00
DTU-CGM 3.371 0.014 0.013 10000 1 0.017 2.00 0.023 0.74 0.23
MIKES 3.368 0.014 0.036 11 1 0.014 2.00 0.071 0.20 0.03
IPQ 3.350 0.004 0.035 76 1 -0.004 2.00 0.069 0.06 0.03
BEV 0.000 0.000 0.000 #NV 0 #NV #NV #NV #NV 0.00
SP 3.300 0.005 0.017 130 1 -0.054 2.00 0.032 1.71 0.13
INRIM 3.393 0.015 0.037 61 1 0.039 2.00 0.073 0.53 0.03
LNE 3.375 0.020 0.014 28 1 0.021 2.00 0.025 0.83 0.19
CEM 3.359 0.014 0.015 10000 1 0.005 2.00 0.026 0.18 0.18
GUM 3.314 0.005 0.046 13 1 -0.040 2.00 0.091 0.44 0.02
DMDM 3.378 0.012 0.068 10000 1 0.024 2.00 0.136 0.18 0.01
UME 3.380 0.051 0.038 265 1 0.026 2.00 0.076 0.34 0.03
NIMT 3.318 0.016 0.040 32142 1 -0.036 2.00 0.079 0.46 0.02
NMC/A*STAR 3.328 0.014 0.038 15 1 -0.026 2.00 0.075 0.35 0.03
CMS/ITRI 3.320 0.019 0.032 43 1 -0.034 2.00 0.063 0.54 0.04
NMISA 3.353 0.016 0.073 10000 1 -0.001 2.00 0.145 0.01 0.01
INMETRO 3.345 0.007 0.039 10000 1 -0.009 2.00 0.076 0.12 0.03
x w u (x w) eff N - 1 k ref
Reference value 3.354 0.006 585 15 2.00
C 3.82E-05
Consistency:
u ext 0.007
R B 1.133 Birge ok
Limit 1.315
if contributing to
if not contributing to
-0.250
-0.200
-0.150
-0.100
-0.050
0.000
0.050
0.100
0.150
0.200
ME
TAS
DT
U-C
GM
MIK
ES
IPQ
BE
V SP
INR
IM LNE
CE
M
GU
M
DM
DM
UM
E
NIM
T
NM
C/A
*ST
AR
CM
S/IT
RI
NM
ISA
INM
ETR
O
Dev
iati
on
fro
m w
eigh
ted
mea
n r
efer
ence
va
lue
/ µ
m
Type C1, NIST SRM 2072, S/N 1015, Rz
use 1 or 0 to
in- or exclude
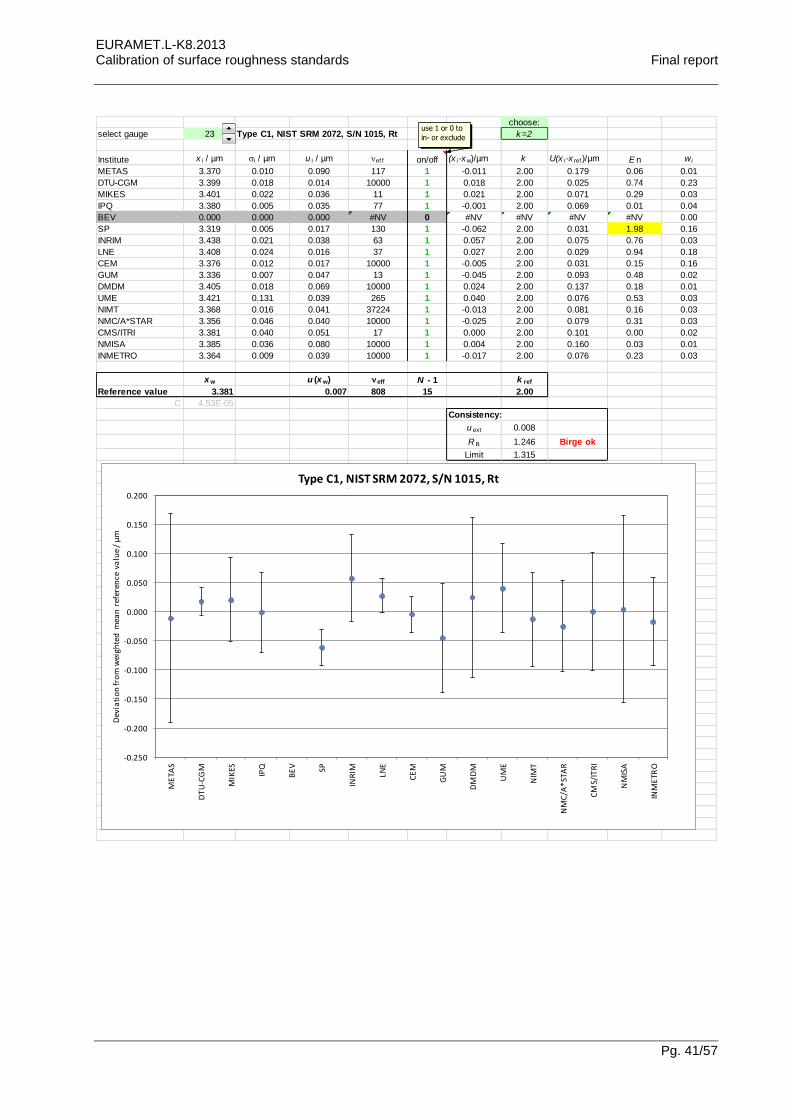
EURAMET.L-K8.2013 Calibration of surface roughness standards Final report
Pg. 41/57
choose:
select gauge 23 Type C1, NIST SRM 2072, S/N 1015, Rt k=2
Institute x i / µm i / µm u i / µm ef f on/off (x i-xw)/µm k U(x i-x ref )/µm E n w i
METAS 3.370 0.010 0.090 117 1 -0.011 2.00 0.179 0.06 0.01
DTU-CGM 3.399 0.018 0.014 10000 1 0.018 2.00 0.025 0.74 0.23
MIKES 3.401 0.022 0.036 11 1 0.021 2.00 0.071 0.29 0.03
IPQ 3.380 0.005 0.035 77 1 -0.001 2.00 0.069 0.01 0.04
BEV 0.000 0.000 0.000 #NV 0 #NV #NV #NV #NV 0.00
SP 3.319 0.005 0.017 130 1 -0.062 2.00 0.031 1.98 0.16
INRIM 3.438 0.021 0.038 63 1 0.057 2.00 0.075 0.76 0.03
LNE 3.408 0.024 0.016 37 1 0.027 2.00 0.029 0.94 0.18
CEM 3.376 0.012 0.017 10000 1 -0.005 2.00 0.031 0.15 0.16
GUM 3.336 0.007 0.047 13 1 -0.045 2.00 0.093 0.48 0.02
DMDM 3.405 0.018 0.069 10000 1 0.024 2.00 0.137 0.18 0.01
UME 3.421 0.131 0.039 265 1 0.040 2.00 0.076 0.53 0.03
NIMT 3.368 0.016 0.041 37224 1 -0.013 2.00 0.081 0.16 0.03
NMC/A*STAR 3.356 0.046 0.040 10000 1 -0.025 2.00 0.079 0.31 0.03
CMS/ITRI 3.381 0.040 0.051 17 1 0.000 2.00 0.101 0.00 0.02
NMISA 3.385 0.036 0.080 10000 1 0.004 2.00 0.160 0.03 0.01
INMETRO 3.364 0.009 0.039 10000 1 -0.017 2.00 0.076 0.23 0.03
x w u (x w) eff N - 1 k ref
Reference value 3.381 0.007 808 15 2.00
C 4.53E-05
Consistency:
u ext 0.008
R B 1.246 Birge ok
Limit 1.315
if contributing to
if not contributing to
-0.250
-0.200
-0.150
-0.100
-0.050
0.000
0.050
0.100
0.150
0.200
ME
TAS
DT
U-C
GM
MIK
ES
IPQ
BE
V SP
INR
IM LNE
CE
M
GU
M
DM
DM
UM
E
NIM
T
NM
C/A
*ST
AR
CM
S/IT
RI
NM
ISA
INM
ETR
O
Dev
iati
on
fro
m w
eigh
ted
mea
n r
efer
ence
va
lue
/ µ
m
Type C1, NIST SRM 2072, S/N 1015, Rt
use 1 or 0 to
in- or exclude
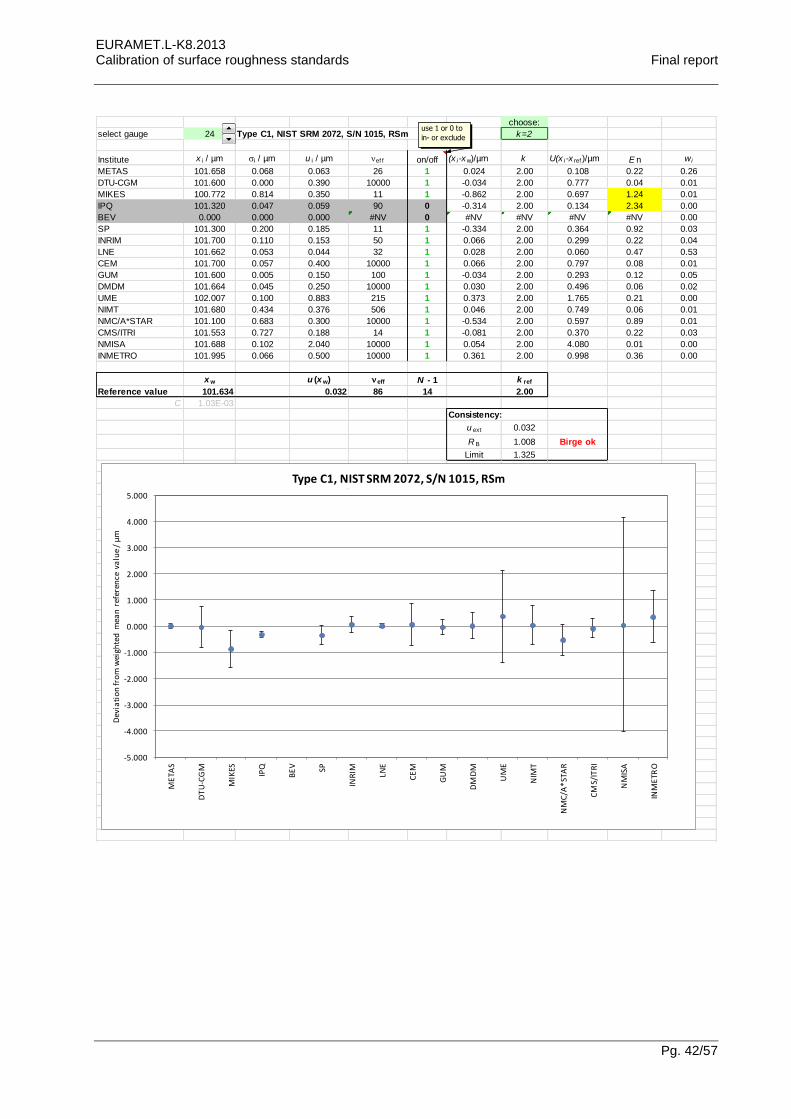
EURAMET.L-K8.2013 Calibration of surface roughness standards Final report
Pg. 42/57
choose:
select gauge 24 Type C1, NIST SRM 2072, S/N 1015, RSm k=2
Institute x i / µm i / µm u i / µm ef f on/off (x i-xw)/µm k U(x i-x ref )/µm E n w i
METAS 101.658 0.068 0.063 26 1 0.024 2.00 0.108 0.22 0.26
DTU-CGM 101.600 0.000 0.390 10000 1 -0.034 2.00 0.777 0.04 0.01
MIKES 100.772 0.814 0.350 11 1 -0.862 2.00 0.697 1.24 0.01
IPQ 101.320 0.047 0.059 90 0 -0.314 2.00 0.134 2.34 0.00
BEV 0.000 0.000 0.000 #NV 0 #NV #NV #NV #NV 0.00
SP 101.300 0.200 0.185 11 1 -0.334 2.00 0.364 0.92 0.03
INRIM 101.700 0.110 0.153 50 1 0.066 2.00 0.299 0.22 0.04
LNE 101.662 0.053 0.044 32 1 0.028 2.00 0.060 0.47 0.53
CEM 101.700 0.057 0.400 10000 1 0.066 2.00 0.797 0.08 0.01
GUM 101.600 0.005 0.150 100 1 -0.034 2.00 0.293 0.12 0.05
DMDM 101.664 0.045 0.250 10000 1 0.030 2.00 0.496 0.06 0.02
UME 102.007 0.100 0.883 215 1 0.373 2.00 1.765 0.21 0.00
NIMT 101.680 0.434 0.376 506 1 0.046 2.00 0.749 0.06 0.01
NMC/A*STAR 101.100 0.683 0.300 10000 1 -0.534 2.00 0.597 0.89 0.01
CMS/ITRI 101.553 0.727 0.188 14 1 -0.081 2.00 0.370 0.22 0.03
NMISA 101.688 0.102 2.040 10000 1 0.054 2.00 4.080 0.01 0.00
INMETRO 101.995 0.066 0.500 10000 1 0.361 2.00 0.998 0.36 0.00
x w u (x w) eff N - 1 k ref
Reference value 101.634 0.032 86 14 2.00
C 1.03E-03
Consistency:
u ext 0.032
R B 1.008 Birge ok
Limit 1.325
if contributing to
if not contributing to
-5.000
-4.000
-3.000
-2.000
-1.000
0.000
1.000
2.000
3.000
4.000
5.000
ME
TAS
DT
U-C
GM
MIK
ES
IPQ
BE
V SP
INR
IM LNE
CE
M
GU
M
DM
DM
UM
E
NIM
T
NM
C/A
*ST
AR
CM
S/IT
RI
NM
ISA
INM
ETR
O
Dev
iati
on
fro
m w
eigh
ted
mea
n r
efer
ence
va
lue
/ µ
m
Type C1, NIST SRM 2072, S/N 1015, RSm
use 1 or 0 to
in- or exclude
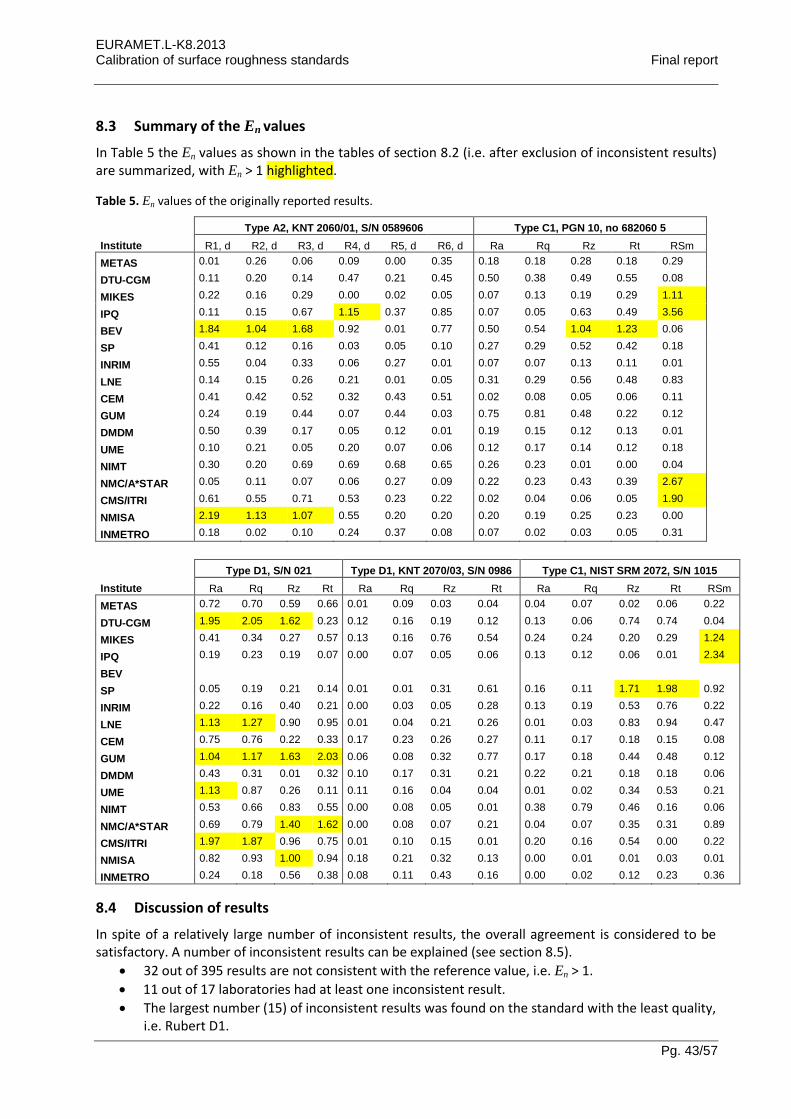
EURAMET.L-K8.2013 Calibration of surface roughness standards Final report
Pg. 43/57
8.3 Summary of the En values
In Table 5 the En values as shown in the tables of section 8.2 (i.e. after exclusion of inconsistent results) are summarized, with En > 1 highlighted.
Table 5. En values of the originally reported results.
Type A2, KNT 2060/01, S/N 0589606 Type C1, PGN 10, no 682060 5
Institute R1, d R2, d R3, d R4, d R5, d R6, d Ra Rq Rz Rt RSm
METAS 0.01 0.26 0.06 0.09 0.00 0.35 0.18 0.18 0.28 0.18 0.29
DTU-CGM 0.11 0.20 0.14 0.47 0.21 0.45 0.50 0.38 0.49 0.55 0.08
MIKES 0.22 0.16 0.29 0.00 0.02 0.05 0.07 0.13 0.19 0.29 1.11
IPQ 0.11 0.15 0.67 1.15 0.37 0.85 0.07 0.05 0.63 0.49 3.56
BEV 1.84 1.04 1.68 0.92 0.01 0.77 0.50 0.54 1.04 1.23 0.06
SP 0.41 0.12 0.16 0.03 0.05 0.10 0.27 0.29 0.52 0.42 0.18
INRIM 0.55 0.04 0.33 0.06 0.27 0.01 0.07 0.07 0.13 0.11 0.01
LNE 0.14 0.15 0.26 0.21 0.01 0.05 0.31 0.29 0.56 0.48 0.83
CEM 0.41 0.42 0.52 0.32 0.43 0.51 0.02 0.08 0.05 0.06 0.11
GUM 0.24 0.19 0.44 0.07 0.44 0.03 0.75 0.81 0.48 0.22 0.12
DMDM 0.50 0.39 0.17 0.05 0.12 0.01 0.19 0.15 0.12 0.13 0.01
UME 0.10 0.21 0.05 0.20 0.07 0.06 0.12 0.17 0.14 0.12 0.18
NIMT 0.30 0.20 0.69 0.69 0.68 0.65 0.26 0.23 0.01 0.00 0.04
NMC/A*STAR 0.05 0.11 0.07 0.06 0.27 0.09 0.22 0.23 0.43 0.39 2.67
CMS/ITRI 0.61 0.55 0.71 0.53 0.23 0.22 0.02 0.04 0.06 0.05 1.90
NMISA 2.19 1.13 1.07 0.55 0.20 0.20 0.20 0.19 0.25 0.23 0.00
INMETRO 0.18 0.02 0.10 0.24 0.37 0.08 0.07 0.02 0.03 0.05 0.31
Type D1, S/N 021 Type D1, KNT 2070/03, S/N 0986 Type C1, NIST SRM 2072, S/N 1015
Institute Ra Rq Rz Rt Ra Rq Rz Rt Ra Rq Rz Rt RSm
METAS 0.72 0.70 0.59 0.66 0.01 0.09 0.03 0.04 0.04 0.07 0.02 0.06 0.22
DTU-CGM 1.95 2.05 1.62 0.23 0.12 0.16 0.19 0.12 0.13 0.06 0.74 0.74 0.04
MIKES 0.41 0.34 0.27 0.57 0.13 0.16 0.76 0.54 0.24 0.24 0.20 0.29 1.24
IPQ 0.19 0.23 0.19 0.07 0.00 0.07 0.05 0.06 0.13 0.12 0.06 0.01 2.34
BEV
SP 0.05 0.19 0.21 0.14 0.01 0.01 0.31 0.61 0.16 0.11 1.71 1.98 0.92
INRIM 0.22 0.16 0.40 0.21 0.00 0.03 0.05 0.28 0.13 0.19 0.53 0.76 0.22
LNE 1.13 1.27 0.90 0.95 0.01 0.04 0.21 0.26 0.01 0.03 0.83 0.94 0.47
CEM 0.75 0.76 0.22 0.33 0.17 0.23 0.26 0.27 0.11 0.17 0.18 0.15 0.08
GUM 1.04 1.17 1.63 2.03 0.06 0.08 0.32 0.77 0.17 0.18 0.44 0.48 0.12
DMDM 0.43 0.31 0.01 0.32 0.10 0.17 0.31 0.21 0.22 0.21 0.18 0.18 0.06
UME 1.13 0.87 0.26 0.11 0.11 0.16 0.04 0.04 0.01 0.02 0.34 0.53 0.21
NIMT 0.53 0.66 0.83 0.55 0.00 0.08 0.05 0.01 0.38 0.79 0.46 0.16 0.06
NMC/A*STAR 0.69 0.79 1.40 1.62 0.00 0.08 0.07 0.21 0.04 0.07 0.35 0.31 0.89
CMS/ITRI 1.97 1.87 0.96 0.75 0.01 0.10 0.15 0.01 0.20 0.16 0.54 0.00 0.22
NMISA 0.82 0.93 1.00 0.94 0.18 0.21 0.32 0.13 0.00 0.01 0.01 0.03 0.01
INMETRO 0.24 0.18 0.56 0.38 0.08 0.11 0.43 0.16 0.00 0.02 0.12 0.23 0.36
8.4 Discussion of results
In spite of a relatively large number of inconsistent results, the overall agreement is considered to be satisfactory. A number of inconsistent results can be explained (see section 8.5).
32 out of 395 results are not consistent with the reference value, i.e. En > 1.
11 out of 17 laboratories had at least one inconsistent result.
The largest number (15) of inconsistent results was found on the standard with the least quality, i.e. Rubert D1.
EURAMET.L-K8.2013 Calibration of surface roughness standards Final report
Pg. 44/57
The degradation of the quality of the standards in the course of the comparison due to surface damages did hardly affect the measurement results. There is no clear trend visible from the first to the last participant, even the last participant achieved excellent results, and the stability measurements made by the pilot were all consistent (see section 6.1).
Pt values for the type A2 standard were part of the protocol in order to be compatible to the protocol of the preceding comparison EURAMET.L-K8, but do not correspond to the standardized profile depth. They were included in the evaluation spreadsheet of this comparison, but are not part of the draft B report. Therefore no further analysis is carried out on this parameter.
8.5 Changes to results after Draft A report
After sending draft A report, the pilot received three requests to change values or uncertainties:
8.5.1 BEV request from 13.02.2015
I noticed to actually have sent values for the wrong measurand for the type A2 standard. Originally our values are for the central trace (as written on our report) where "the average result together with the standard deviation" was requested. This makes only minor changes to the actual values but the standard deviation is of course much higher (and also the uncertainty). I have re-evaluated the d parameter according to this.
Attached was a report file with slightly different values and increased uncertainties.
8.5.2 NMISA comment from 06.03.2015 and report from 22.04.2015
I checked the data as the groove stds was far out and did not expect it. The laboratory had a Taylor Hobson Form Talysurf series which was upgraded to a PGI system with a newer version of the same software only months before the inter-comparison. While performing the measurements for the groove standard, Type A2, KNT 2060/01, S/N 0589606, a mistake was made in the analysis of the results. The filter is selected in two places, firstly, the primary filter and in the next instance, instead of no filter in place, we selected the primary filter again.
Our results were thus systematically lower than should be. This came to light when Draft A of the inter-comparison report was published. A re-analysis of all the measurements for the groove depth standard was done and the results are attached.
Attached was a report file with values changed accordingly.
8.5.3 IPQ request from 12.03.2015
I ask if it is possible to consider the following updates: I detect a mistake in the IPQ reported values for the surface roughness standard Type A2, KNT 2060/01, S/N 0589606, R4, d (instead of 2.64 µm it is 2.68 µm). I also made an update of the measurement uncertainty for the parameter RSm of the two standards (Type C1, PGN 10, no 682060 5, RSm and Type C1, NIST SRM 2072, S/N 1015, RSm) adding a new uncertainty component.
Additional information was received from IPQ to justify and support the above mentioned changes. The uncertainties of IPQ for RSm were changed from 77 nm to 321 nm and from 59 nm to 214 nm, respectively, introduced in the spreadsheet EURAMET.L-K8.2013-revised values.xlsx and for the analysis in section 8.6.3.
EURAMET.L-K8.2013 Calibration of surface roughness standards Final report
Pg. 45/57
8.6 Comments received after Draft B.1 report
After sending draft B.1 report, the pilot received the following comments:
8.6.1 INMETRO comment from 29.04.2015
I am really sorry, but I made a rough mistake when declaring our measurement uncertainties. Instead of sending you the “uc ” uncertainties, I declared the expanded ones (U). All our expanded uncertainties are based in the ones that we have in the KCDB App. C.
For the calibration of depth setting standards they are: (20+2H) nm; H=d or Pt (in µm)
For the calibration of roughness standards they are: (10+20P) nm; P=vertical parameters (in µm)
If it would be possible, I ask you, please, to correct our “ui ” values in the tables, dividing them by 2, as well plotting the graphs considering it.
This is an obvious mistake. In order to get a more reliable evaluation of the reference values and the degrees of equivalence, the uncertainties of INMETRO were divided by 2, and all data presented in section 8.2 were updated.
8.6.2 NMC/A*STAR comment from 18.05.2015
1) The supplier in Singapore upgraded the software and we at NMC completed the re-analysis of those raw data captured during the comparison measurement at NMC. It was confirmed that only RSm values were wrongly calculated. ...
2) The RSm values of two comparison samples (PNG 10 and NIST SRM2072) were re-calculated and corresponding uncertainties were also slightly changed due to the change of the standard deviation. The results in detail are summarized in attachment, in which new RSm values of two samples are listed. ...
3) Since our results (Rz & Rt) for the sample (Type D1, S/N 021) have the En value larger than 1, we need to study the root cause. As requested before, could you please kindly arrange to send the sample for us to do re-measurement at NMC?
Attached were detailed reports on re-analysis of RSm-values. The following revised values were introduced in the spreadsheet EURAMET.L-K8.2013-revised values.xlsx and for the analysis in section 8.7:
Standard Parameter Value (μm) σ (μm) uc (nm) νeff
PGN 10, no 682060 5, RSm 199.978 0.058 442 ∞ NIST SRM 2072, S/N 1015 RSm 101.663 0.077 228 ∞
8.6.3 GUM comment from 19.05.2015
We have once more checked very carefully our results, especially those concerning roughness standard type D1, SN 021. As you know this standard is of the worst quality with scratches and other damages. We have already noted the state of this standard in our first report.
While checking our printed measurements protocol we have noticed a mistake. Instead of giving you the real values of measurement uncertainties we claimed values given in our CMCs. Our measurements protocol prints both values for each roughness parameter. Usually these values are almost the same but at this case they have differed significantly. So if it is possible we would like to ask you to change our uncertainties values concerning Rz and Rt parameters of roughness standard type D1, SN 021. For Rz
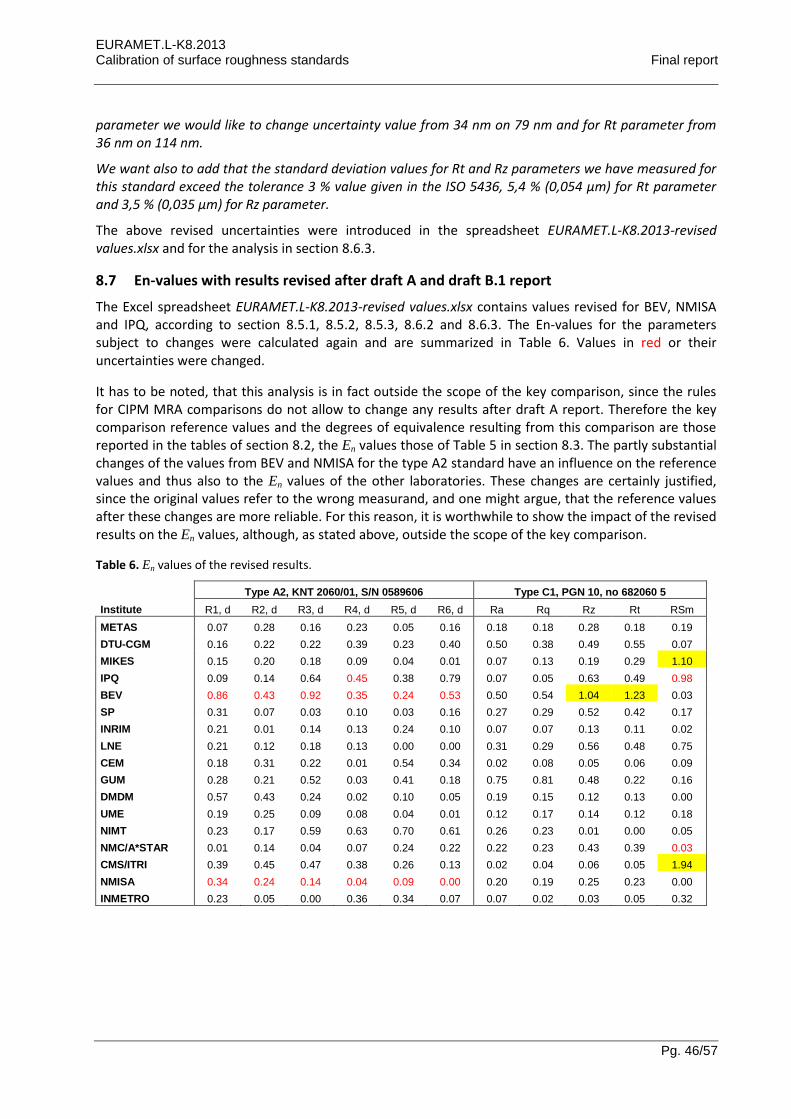
EURAMET.L-K8.2013 Calibration of surface roughness standards Final report
Pg. 46/57
parameter we would like to change uncertainty value from 34 nm on 79 nm and for Rt parameter from 36 nm on 114 nm.
We want also to add that the standard deviation values for Rt and Rz parameters we have measured for this standard exceed the tolerance 3 % value given in the ISO 5436, 5,4 % (0,054 µm) for Rt parameter and 3,5 % (0,035 µm) for Rz parameter.
The above revised uncertainties were introduced in the spreadsheet EURAMET.L-K8.2013-revised values.xlsx and for the analysis in section 8.6.3.
8.7 En-values with results revised after draft A and draft B.1 report
The Excel spreadsheet EURAMET.L-K8.2013-revised values.xlsx contains values revised for BEV, NMISA and IPQ, according to section 8.5.1, 8.5.2, 8.5.3, 8.6.2 and 8.6.3. The En-values for the parameters subject to changes were calculated again and are summarized in Table 6. Values in red or their uncertainties were changed.
It has to be noted, that this analysis is in fact outside the scope of the key comparison, since the rules for CIPM MRA comparisons do not allow to change any results after draft A report. Therefore the key comparison reference values and the degrees of equivalence resulting from this comparison are those reported in the tables of section 8.2, the En values those of Table 5 in section 8.3. The partly substantial changes of the values from BEV and NMISA for the type A2 standard have an influence on the reference values and thus also to the En values of the other laboratories. These changes are certainly justified, since the original values refer to the wrong measurand, and one might argue, that the reference values after these changes are more reliable. For this reason, it is worthwhile to show the impact of the revised results on the En values, although, as stated above, outside the scope of the key comparison.
Table 6. En values of the revised results.
Type A2, KNT 2060/01, S/N 0589606 Type C1, PGN 10, no 682060 5
Institute R1, d R2, d R3, d R4, d R5, d R6, d Ra Rq Rz Rt RSm
METAS 0.07 0.28 0.16 0.23 0.05 0.16 0.18 0.18 0.28 0.18 0.19
DTU-CGM 0.16 0.22 0.22 0.39 0.23 0.40 0.50 0.38 0.49 0.55 0.07
MIKES 0.15 0.20 0.18 0.09 0.04 0.01 0.07 0.13 0.19 0.29 1.10
IPQ 0.09 0.14 0.64 0.45 0.38 0.79 0.07 0.05 0.63 0.49 0.98
BEV 0.86 0.43 0.92 0.35 0.24 0.53 0.50 0.54 1.04 1.23 0.03
SP 0.31 0.07 0.03 0.10 0.03 0.16 0.27 0.29 0.52 0.42 0.17
INRIM 0.21 0.01 0.14 0.13 0.24 0.10 0.07 0.07 0.13 0.11 0.02
LNE 0.21 0.12 0.18 0.13 0.00 0.00 0.31 0.29 0.56 0.48 0.75
CEM 0.18 0.31 0.22 0.01 0.54 0.34 0.02 0.08 0.05 0.06 0.09
GUM 0.28 0.21 0.52 0.03 0.41 0.18 0.75 0.81 0.48 0.22 0.16
DMDM 0.57 0.43 0.24 0.02 0.10 0.05 0.19 0.15 0.12 0.13 0.00
UME 0.19 0.25 0.09 0.08 0.04 0.01 0.12 0.17 0.14 0.12 0.18
NIMT 0.23 0.17 0.59 0.63 0.70 0.61 0.26 0.23 0.01 0.00 0.05
NMC/A*STAR 0.01 0.14 0.04 0.07 0.24 0.22 0.22 0.23 0.43 0.39 0.03
CMS/ITRI 0.39 0.45 0.47 0.38 0.26 0.13 0.02 0.04 0.06 0.05 1.94
NMISA 0.34 0.24 0.14 0.04 0.09 0.00 0.20 0.19 0.25 0.23 0.00
INMETRO 0.23 0.05 0.00 0.36 0.34 0.07 0.07 0.02 0.03 0.05 0.32
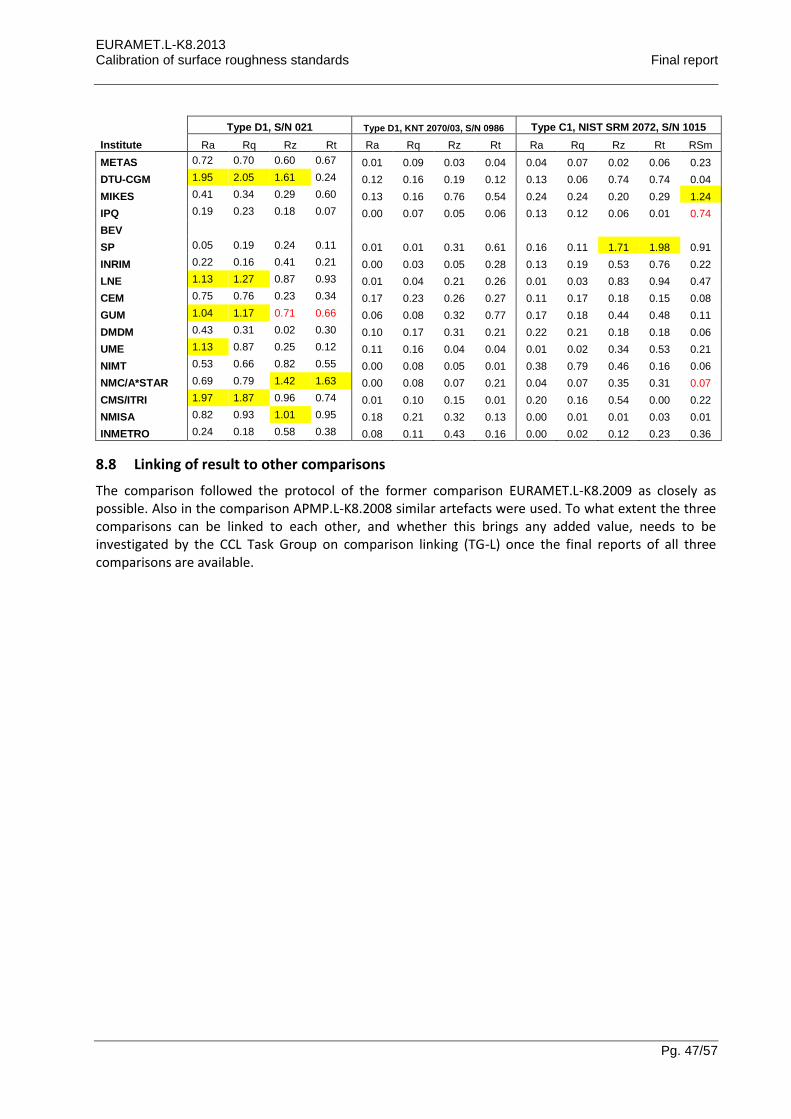
EURAMET.L-K8.2013 Calibration of surface roughness standards Final report
Pg. 47/57
Type D1, S/N 021 Type D1, KNT 2070/03, S/N 0986 Type C1, NIST SRM 2072, S/N 1015
Institute Ra Rq Rz Rt Ra Rq Rz Rt Ra Rq Rz Rt RSm
METAS 0.72 0.70 0.60 0.67 0.01 0.09 0.03 0.04 0.04 0.07 0.02 0.06 0.23
DTU-CGM 1.95 2.05 1.61 0.24 0.12 0.16 0.19 0.12 0.13 0.06 0.74 0.74 0.04
MIKES 0.41 0.34 0.29 0.60 0.13 0.16 0.76 0.54 0.24 0.24 0.20 0.29 1.24
IPQ 0.19 0.23 0.18 0.07 0.00 0.07 0.05 0.06 0.13 0.12 0.06 0.01 0.74
BEV
SP 0.05 0.19 0.24 0.11 0.01 0.01 0.31 0.61 0.16 0.11 1.71 1.98 0.91
INRIM 0.22 0.16 0.41 0.21 0.00 0.03 0.05 0.28 0.13 0.19 0.53 0.76 0.22
LNE 1.13 1.27 0.87 0.93 0.01 0.04 0.21 0.26 0.01 0.03 0.83 0.94 0.47
CEM 0.75 0.76 0.23 0.34 0.17 0.23 0.26 0.27 0.11 0.17 0.18 0.15 0.08
GUM 1.04 1.17 0.71 0.66 0.06 0.08 0.32 0.77 0.17 0.18 0.44 0.48 0.11
DMDM 0.43 0.31 0.02 0.30 0.10 0.17 0.31 0.21 0.22 0.21 0.18 0.18 0.06
UME 1.13 0.87 0.25 0.12 0.11 0.16 0.04 0.04 0.01 0.02 0.34 0.53 0.21
NIMT 0.53 0.66 0.82 0.55 0.00 0.08 0.05 0.01 0.38 0.79 0.46 0.16 0.06
NMC/A*STAR 0.69 0.79 1.42 1.63 0.00 0.08 0.07 0.21 0.04 0.07 0.35 0.31 0.07
CMS/ITRI 1.97 1.87 0.96 0.74 0.01 0.10 0.15 0.01 0.20 0.16 0.54 0.00 0.22
NMISA 0.82 0.93 1.01 0.95 0.18 0.21 0.32 0.13 0.00 0.01 0.01 0.03 0.01
INMETRO 0.24 0.18 0.58 0.38 0.08 0.11 0.43 0.16 0.00 0.02 0.12 0.23 0.36
8.8 Linking of result to other comparisons
The comparison followed the protocol of the former comparison EURAMET.L-K8.2009 as closely as possible. Also in the comparison APMP.L-K8.2008 similar artefacts were used. To what extent the three comparisons can be linked to each other, and whether this brings any added value, needs to be investigated by the CCL Task Group on comparison linking (TG-L) once the final reports of all three comparisons are available.
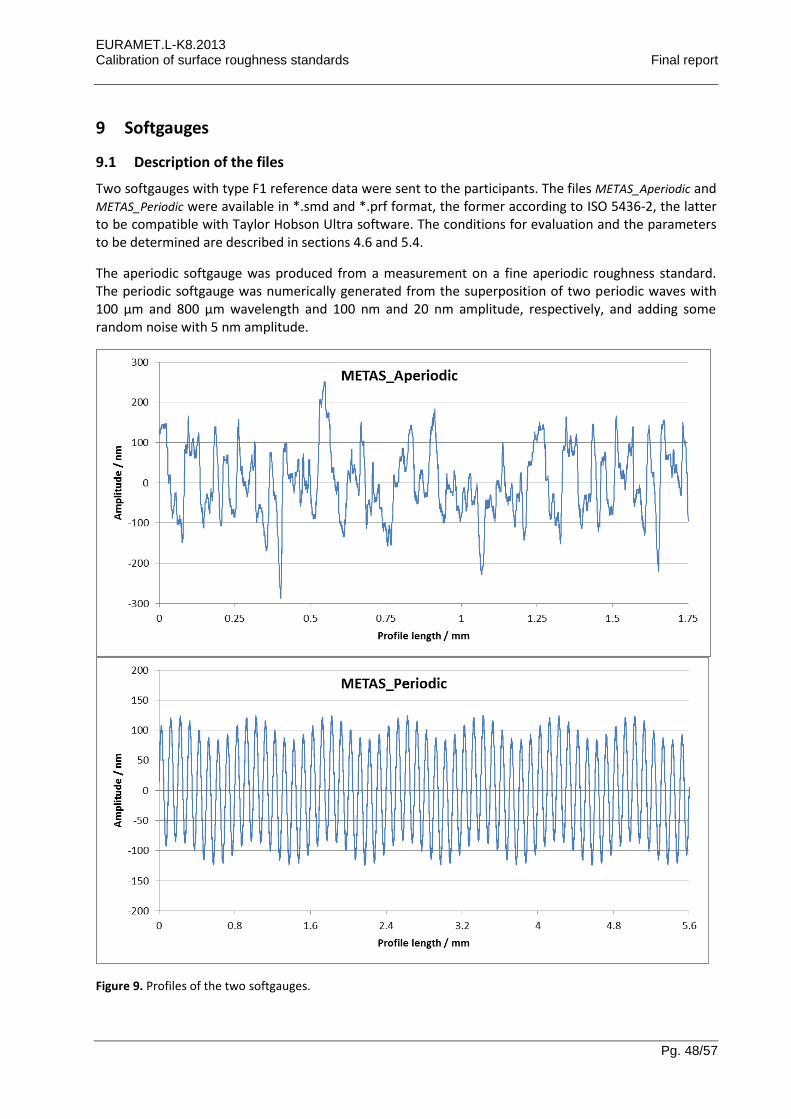
EURAMET.L-K8.2013 Calibration of surface roughness standards Final report
Pg. 48/57
9 Softgauges
9.1 Description of the files
Two softgauges with type F1 reference data were sent to the participants. The files METAS_Aperiodic and METAS_Periodic were available in *.smd and *.prf format, the former according to ISO 5436-2, the latter to be compatible with Taylor Hobson Ultra software. The conditions for evaluation and the parameters to be determined are described in sections 4.6 and 5.4.
The aperiodic softgauge was produced from a measurement on a fine aperiodic roughness standard. The periodic softgauge was numerically generated from the superposition of two periodic waves with 100 µm and 800 µm wavelength and 100 nm and 20 nm amplitude, respectively, and adding some random noise with 5 nm amplitude.
Figure 9. Profiles of the two softgauges.
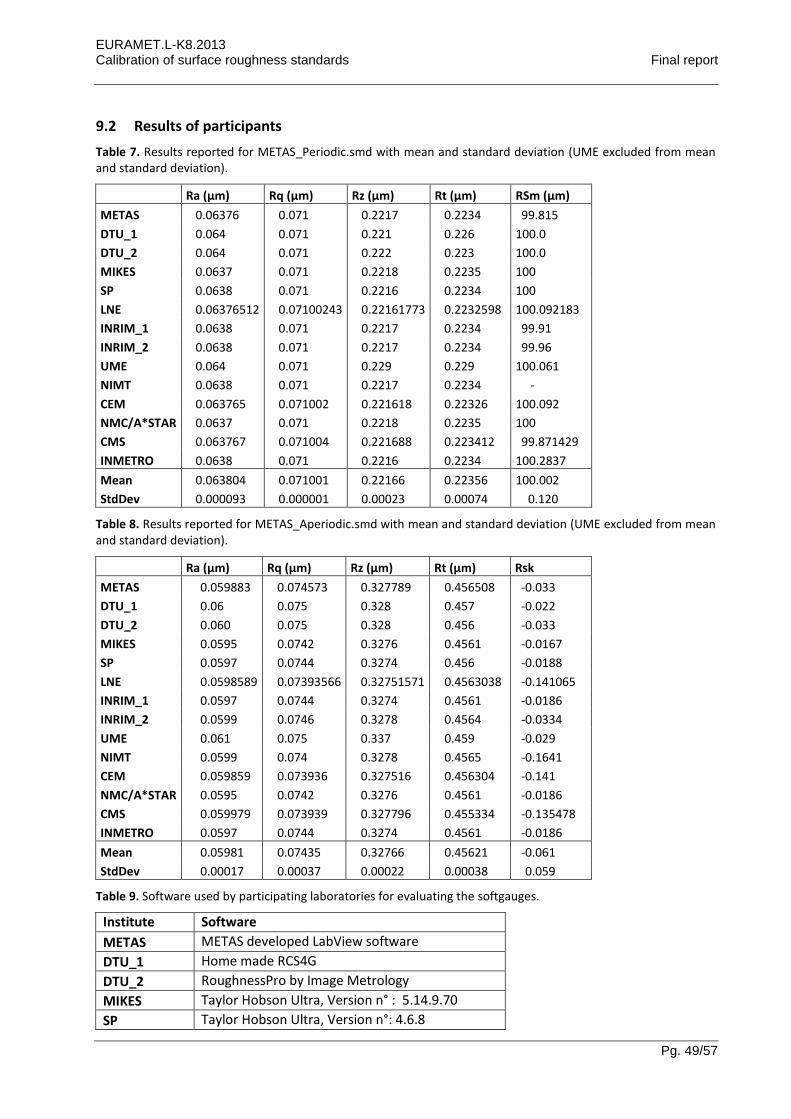
EURAMET.L-K8.2013 Calibration of surface roughness standards Final report
Pg. 49/57
9.2 Results of participants
Table 7. Results reported for METAS_Periodic.smd with mean and standard deviation (UME excluded from mean and standard deviation).
Ra (µm) Rq (µm) Rz (µm) Rt (µm) RSm (µm)
METAS 0.06376 0.071 0.2217 0.2234 99.815
DTU_1 0.064 0.071 0.221 0.226 100.0
DTU_2 0.064 0.071 0.222 0.223 100.0
MIKES 0.0637 0.071 0.2218 0.2235 100
SP 0.0638 0.071 0.2216 0.2234 100
LNE 0.06376512 0.07100243 0.22161773 0.2232598 100.092183
INRIM_1 0.0638 0.071 0.2217 0.2234 99.91
INRIM_2 0.0638 0.071 0.2217 0.2234 99.96
UME 0.064 0.071 0.229 0.229 100.061
NIMT 0.0638 0.071 0.2217 0.2234 -
CEM 0.063765 0.071002 0.221618 0.22326 100.092
NMC/A*STAR 0.0637 0.071 0.2218 0.2235 100
CMS 0.063767 0.071004 0.221688 0.223412 99.871429
INMETRO 0.0638 0.071 0.2216 0.2234 100.2837
Mean 0.063804 0.071001 0.22166 0.22356 100.002
StdDev 0.000093 0.000001 0.00023 0.00074 0.120
Table 8. Results reported for METAS_Aperiodic.smd with mean and standard deviation (UME excluded from mean and standard deviation).
Ra (µm) Rq (µm) Rz (µm) Rt (µm) Rsk
METAS 0.059883 0.074573 0.327789 0.456508 -0.033
DTU_1 0.06 0.075 0.328 0.457 -0.022
DTU_2 0.060 0.075 0.328 0.456 -0.033
MIKES 0.0595 0.0742 0.3276 0.4561 -0.0167
SP 0.0597 0.0744 0.3274 0.456 -0.0188
LNE 0.0598589 0.07393566 0.32751571 0.4563038 -0.141065
INRIM_1 0.0597 0.0744 0.3274 0.4561 -0.0186
INRIM_2 0.0599 0.0746 0.3278 0.4564 -0.0334
UME 0.061 0.075 0.337 0.459 -0.029
NIMT 0.0599 0.074 0.3278 0.4565 -0.1641
CEM 0.059859 0.073936 0.327516 0.456304 -0.141
NMC/A*STAR 0.0595 0.0742 0.3276 0.4561 -0.0186
CMS 0.059979 0.073939 0.327796 0.455334 -0.135478
INMETRO 0.0597 0.0744 0.3274 0.4561 -0.0186
Mean 0.05981 0.07435 0.32766 0.45621 -0.061
StdDev 0.00017 0.00037 0.00022 0.00038 0.059
Table 9. Software used by participating laboratories for evaluating the softgauges.
Institute Software
METAS METAS developed LabView software
DTU_1 Home made RCS4G
DTU_2 RoughnessPro by Image Metrology
MIKES Taylor Hobson Ultra, Version n° : 5.14.9.70
SP Taylor Hobson Ultra, Version n°: 4.6.8
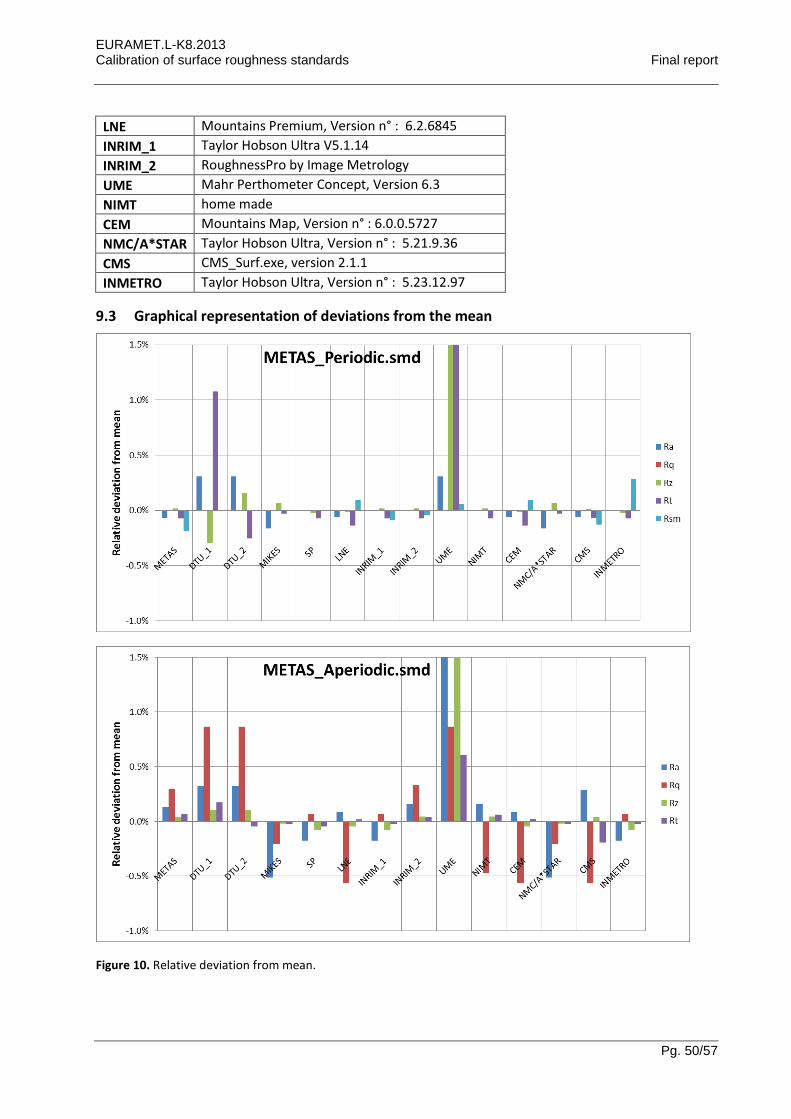
EURAMET.L-K8.2013 Calibration of surface roughness standards Final report
Pg. 50/57
LNE Mountains Premium, Version n° : 6.2.6845
INRIM_1 Taylor Hobson Ultra V5.1.14
INRIM_2 RoughnessPro by Image Metrology
UME Mahr Perthometer Concept, Version 6.3
NIMT home made
CEM Mountains Map, Version n° : 6.0.0.5727
NMC/A*STAR Taylor Hobson Ultra, Version n° : 5.21.9.36
CMS CMS_Surf.exe, version 2.1.1
INMETRO Taylor Hobson Ultra, Version n° : 5.23.12.97
9.3 Graphical representation of deviations from the mean
Figure 10. Relative deviation from mean.
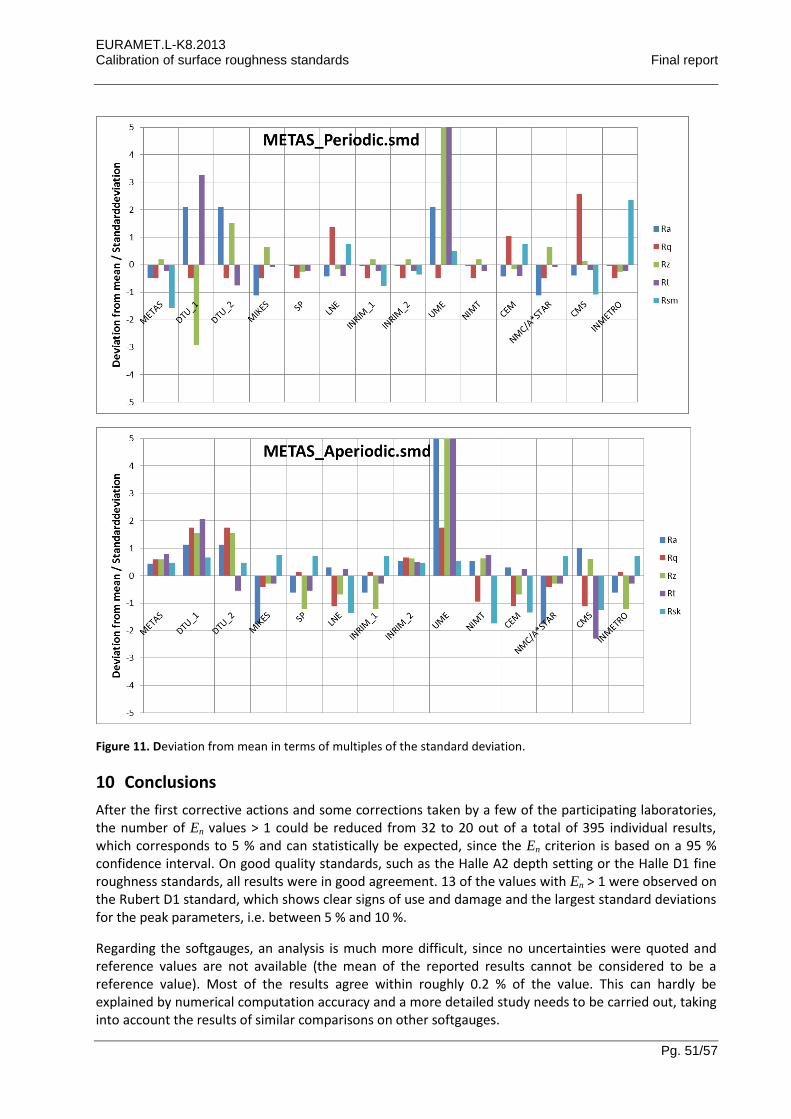
EURAMET.L-K8.2013 Calibration of surface roughness standards Final report
Pg. 51/57
Figure 11. Deviation from mean in terms of multiples of the standard deviation.
10 Conclusions
After the first corrective actions and some corrections taken by a few of the participating laboratories, the number of En values > 1 could be reduced from 32 to 20 out of a total of 395 individual results, which corresponds to 5 % and can statistically be expected, since the En criterion is based on a 95 % confidence interval. On good quality standards, such as the Halle A2 depth setting or the Halle D1 fine roughness standards, all results were in good agreement. 13 of the values with En > 1 were observed on the Rubert D1 standard, which shows clear signs of use and damage and the largest standard deviations for the peak parameters, i.e. between 5 % and 10 %.
Regarding the softgauges, an analysis is much more difficult, since no uncertainties were quoted and reference values are not available (the mean of the reported results cannot be considered to be a reference value). Most of the results agree within roughly 0.2 % of the value. This can hardly be explained by numerical computation accuracy and a more detailed study needs to be carried out, taking into account the results of similar comparisons on other softgauges.
EURAMET.L-K8.2013 Calibration of surface roughness standards Final report
Pg. 52/57
11 References
[1] Calibration of surface roughness standards , http://kcdb.bipm.org/appendixB/KCDB_ApB_info.asp?cmp_idy=986&cmp_cod=EURAMET.L-K8&prov=exalead
[2] ISO 5436-1:2000, Geometrical Product Specifications (GPS) - Surface texture: Profile method; Measurement standards - Part 1: Material measures
[3] ISO 4287:1997, Geometrical Product Specifications (GPS) - Surface texture: Profile method - Terms, definitions and surface texture parameters
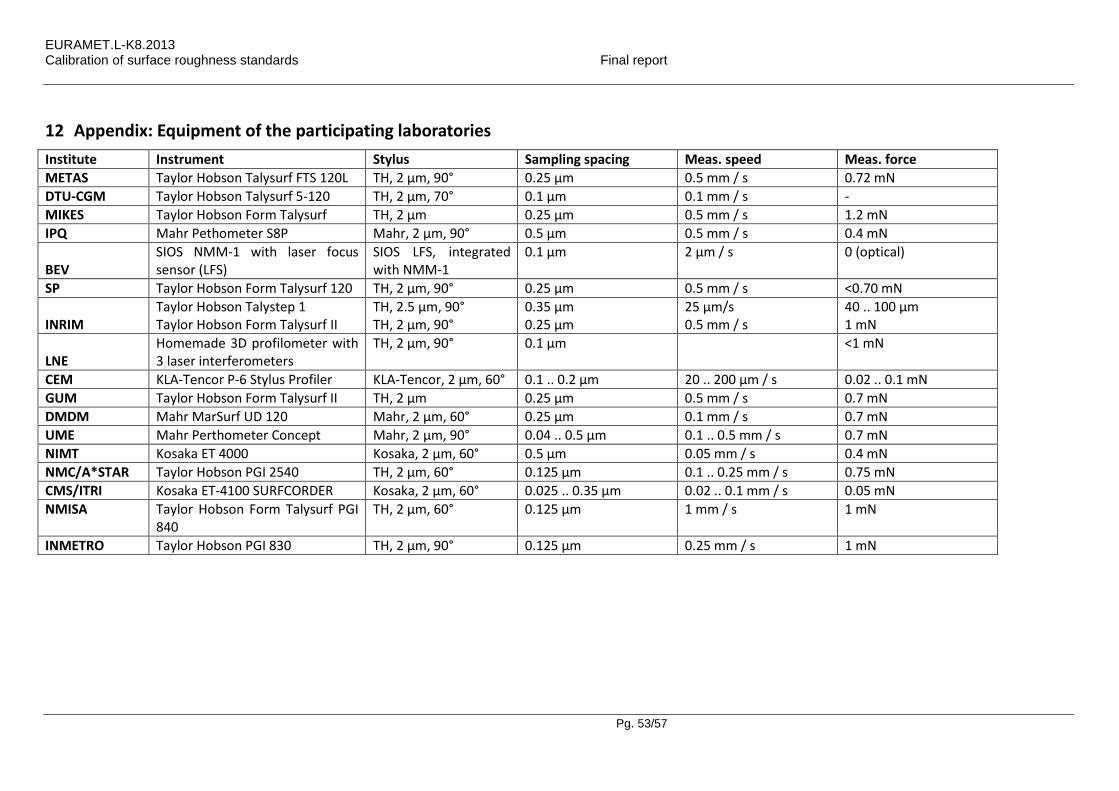
EURAMET.L-K8.2013 Calibration of surface roughness standards Final report
Pg. 53/57
12 Appendix: Equipment of the participating laboratories
Institute Instrument Stylus Sampling spacing Meas. speed Meas. force
METAS Taylor Hobson Talysurf FTS 120L TH, 2 µm, 90° 0.25 µm 0.5 mm / s 0.72 mN
DTU-CGM Taylor Hobson Talysurf 5-120 TH, 2 µm, 70° 0.1 µm 0.1 mm / s -
MIKES Taylor Hobson Form Talysurf TH, 2 µm 0.25 µm 0.5 mm / s 1.2 mN
IPQ Mahr Pethometer S8P Mahr, 2 µm, 90° 0.5 µm 0.5 mm / s 0.4 mN
BEV SIOS NMM-1 with laser focus sensor (LFS)
SIOS LFS, integrated with NMM-1
0.1 µm 2 µm / s 0 (optical)
SP Taylor Hobson Form Talysurf 120 TH, 2 µm, 90° 0.25 µm 0.5 mm / s <0.70 mN
INRIM Taylor Hobson Talystep 1 Taylor Hobson Form Talysurf II
TH, 2.5 µm, 90° TH, 2 µm, 90°
0.35 μm 0.25 µm
25 μm/s 0.5 mm / s
40 .. 100 µm 1 mN
LNE Homemade 3D profilometer with 3 laser interferometers
TH, 2 µm, 90° 0.1 µm <1 mN
CEM KLA-Tencor P-6 Stylus Profiler KLA-Tencor, 2 µm, 60° 0.1 .. 0.2 µm 20 .. 200 µm / s 0.02 .. 0.1 mN
GUM Taylor Hobson Form Talysurf II TH, 2 µm 0.25 µm 0.5 mm / s 0.7 mN
DMDM Mahr MarSurf UD 120 Mahr, 2 µm, 60° 0.25 µm 0.1 mm / s 0.7 mN
UME Mahr Perthometer Concept Mahr, 2 µm, 90° 0.04 .. 0.5 µm 0.1 .. 0.5 mm / s 0.7 mN
NIMT Kosaka ET 4000 Kosaka, 2 µm, 60° 0.5 µm 0.05 mm / s 0.4 mN
NMC/A*STAR Taylor Hobson PGI 2540 TH, 2 µm, 60° 0.125 µm 0.1 .. 0.25 mm / s 0.75 mN
CMS/ITRI Kosaka ET-4100 SURFCORDER Kosaka, 2 µm, 60° 0.025 .. 0.35 µm 0.02 .. 0.1 mm / s 0.05 mN
NMISA Taylor Hobson Form Talysurf PGI 840
TH, 2 µm, 60° 0.125 µm 1 mm / s 1 mN
INMETRO Taylor Hobson PGI 830 TH, 2 µm, 90° 0.125 µm 0.25 mm / s 1 mN
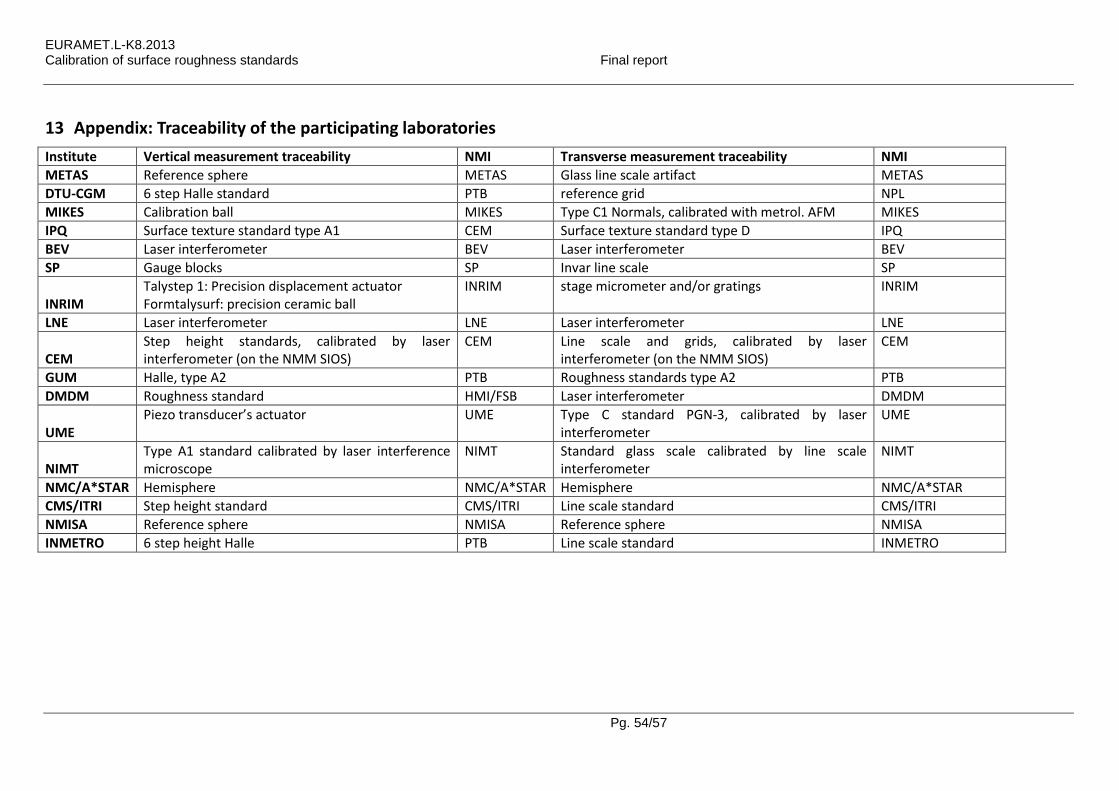
EURAMET.L-K8.2013 Calibration of surface roughness standards Final report
Pg. 54/57
13 Appendix: Traceability of the participating laboratories
Institute Vertical measurement traceability NMI Transverse measurement traceability NMI
METAS Reference sphere METAS Glass line scale artifact METAS
DTU-CGM 6 step Halle standard PTB reference grid NPL
MIKES Calibration ball MIKES Type C1 Normals, calibrated with metrol. AFM MIKES
IPQ Surface texture standard type A1 CEM Surface texture standard type D IPQ
BEV Laser interferometer BEV Laser interferometer BEV
SP Gauge blocks SP Invar line scale SP
INRIM Talystep 1: Precision displacement actuator Formtalysurf: precision ceramic ball
INRIM stage micrometer and/or gratings INRIM
LNE Laser interferometer LNE Laser interferometer LNE
CEM Step height standards, calibrated by laser interferometer (on the NMM SIOS)
CEM Line scale and grids, calibrated by laser interferometer (on the NMM SIOS)
CEM
GUM Halle, type A2 PTB Roughness standards type A2 PTB
DMDM Roughness standard HMI/FSB Laser interferometer DMDM
UME Piezo transducer’s actuator UME Type C standard PGN-3, calibrated by laser
interferometer UME
NIMT Type A1 standard calibrated by laser interference microscope
NIMT Standard glass scale calibrated by line scale interferometer
NIMT
NMC/A*STAR Hemisphere NMC/A*STAR Hemisphere NMC/A*STAR
CMS/ITRI Step height standard CMS/ITRI Line scale standard CMS/ITRI
NMISA Reference sphere NMISA Reference sphere NMISA
INMETRO 6 step height Halle PTB Line scale standard INMETRO
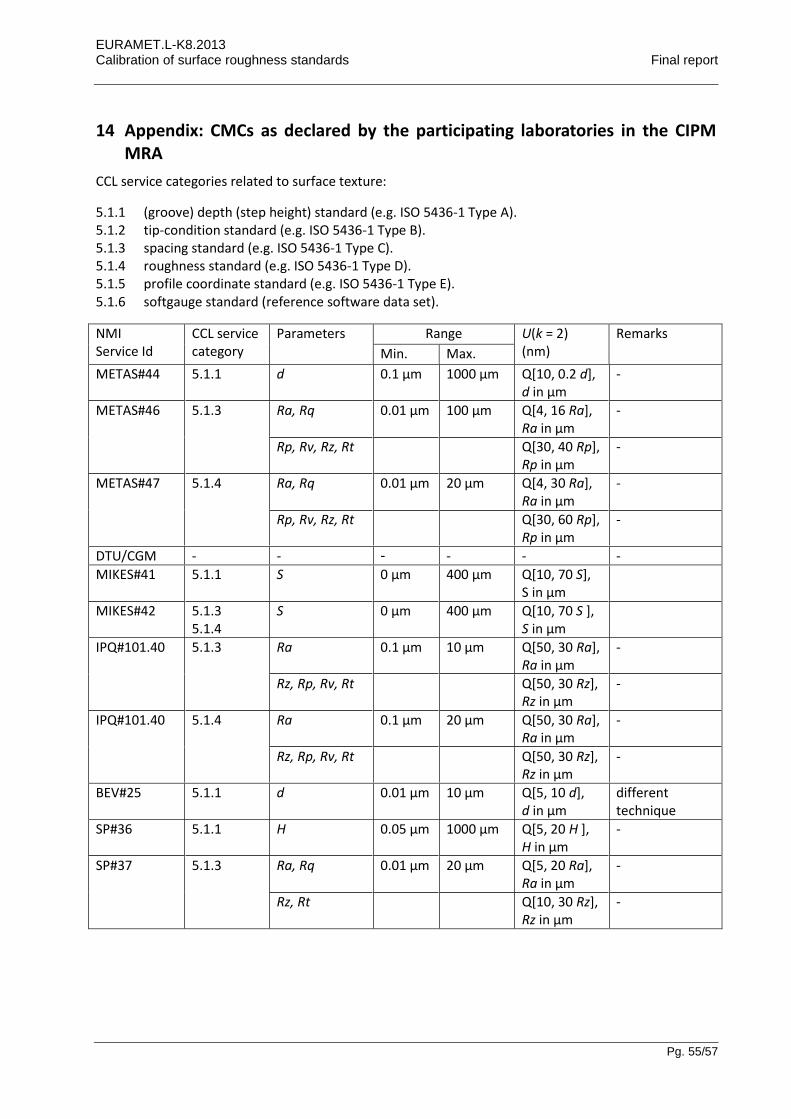
EURAMET.L-K8.2013 Calibration of surface roughness standards Final report
Pg. 55/57
14 Appendix: CMCs as declared by the participating laboratories in the CIPM MRA
CCL service categories related to surface texture:
5.1.1 (groove) depth (step height) standard (e.g. ISO 5436-1 Type A). 5.1.2 tip-condition standard (e.g. ISO 5436-1 Type B). 5.1.3 spacing standard (e.g. ISO 5436-1 Type C). 5.1.4 roughness standard (e.g. ISO 5436-1 Type D). 5.1.5 profile coordinate standard (e.g. ISO 5436-1 Type E). 5.1.6 softgauge standard (reference software data set).
NMI Service Id
CCL service category
Parameters Range U(k = 2) (nm)
Remarks
Min. Max.
METAS#44 5.1.1 d 0.1 µm 1000 µm Q[10, 0.2 d], d in μm
-
METAS#46 5.1.3 Ra, Rq 0.01 µm 100 µm Q[4, 16 Ra], Ra in µm
-
Rp, Rv, Rz, Rt Q[30, 40 Rp], Rp in µm
-
METAS#47 5.1.4 Ra, Rq 0.01 µm 20 µm Q[4, 30 Ra], Ra in µm
-
Rp, Rv, Rz, Rt Q[30, 60 Rp], Rp in µm
-
DTU/CGM - - - - - -
MIKES#41 5.1.1 S 0 µm 400 µm Q[10, 70 S], S in μm
MIKES#42 5.1.3 5.1.4
S 0 µm 400 µm Q[10, 70 S ], S in μm
IPQ#101.40 5.1.3 Ra 0.1 µm 10 µm Q[50, 30 Ra], Ra in µm
-
Rz, Rp, Rv, Rt Q[50, 30 Rz], Rz in µm
-
IPQ#101.40 5.1.4 Ra 0.1 µm 20 µm Q[50, 30 Ra], Ra in µm
-
Rz, Rp, Rv, Rt Q[50, 30 Rz], Rz in µm
-
BEV#25 5.1.1 d 0.01 µm 10 µm Q[5, 10 d], d in µm
different technique
SP#36 5.1.1 H 0.05 µm 1000 µm Q[5, 20 H ], H in μm
-
SP#37 5.1.3 Ra, Rq 0.01 µm 20 µm Q[5, 20 Ra], Ra in µm
-
Rz, Rt Q[10, 30 Rz], Rz in µm
-
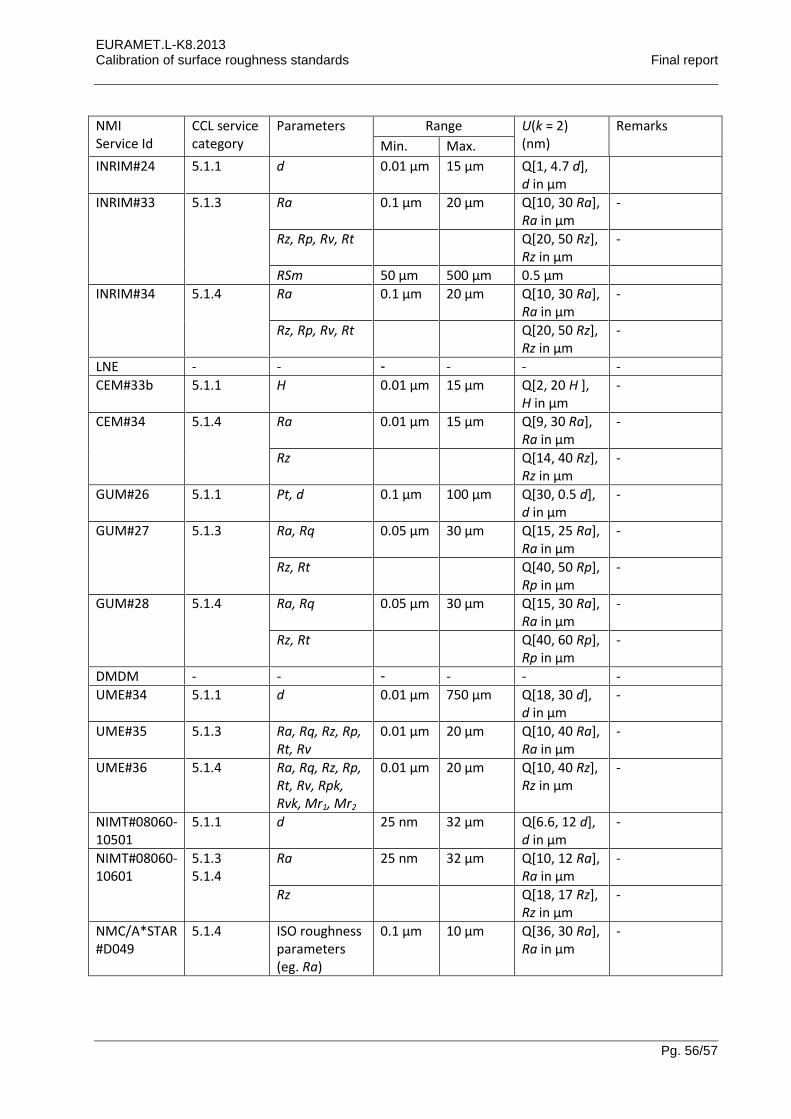
EURAMET.L-K8.2013 Calibration of surface roughness standards Final report
Pg. 56/57
NMI Service Id
CCL service category
Parameters Range U(k = 2) (nm)
Remarks
Min. Max.
INRIM#24 5.1.1 d 0.01 µm 15 µm Q[1, 4.7 d], d in µm
INRIM#33 5.1.3 Ra 0.1 µm 20 µm Q[10, 30 Ra], Ra in µm
-
Rz, Rp, Rv, Rt Q[20, 50 Rz], Rz in µm
-
RSm 50 µm 500 µm 0.5 µm
INRIM#34 5.1.4 Ra 0.1 µm 20 µm Q[10, 30 Ra], Ra in µm
-
Rz, Rp, Rv, Rt Q[20, 50 Rz], Rz in µm
-
LNE - - - - - -
CEM#33b 5.1.1 H 0.01 µm 15 µm Q[2, 20 H ], H in μm
-
CEM#34 5.1.4 Ra 0.01 µm 15 µm Q[9, 30 Ra], Ra in µm
-
Rz Q[14, 40 Rz], Rz in µm
-
GUM#26 5.1.1 Pt, d 0.1 µm 100 µm Q[30, 0.5 d], d in μm
-
GUM#27 5.1.3 Ra, Rq 0.05 µm 30 µm Q[15, 25 Ra], Ra in µm
-
Rz, Rt Q[40, 50 Rp], Rp in µm
-
GUM#28 5.1.4 Ra, Rq 0.05 µm 30 µm Q[15, 30 Ra], Ra in µm
-
Rz, Rt Q[40, 60 Rp], Rp in µm
-
DMDM - - - - - -
UME#34 5.1.1 d 0.01 µm 750 µm Q[18, 30 d], d in μm
-
UME#35 5.1.3 Ra, Rq, Rz, Rp, Rt, Rv
0.01 µm 20 µm Q[10, 40 Ra], Ra in µm
-
UME#36 5.1.4 Ra, Rq, Rz, Rp, Rt, Rv, Rpk, Rvk, Mr1, Mr2
0.01 µm 20 µm Q[10, 40 Rz], Rz in µm
-
NIMT#08060-10501
5.1.1 d 25 nm 32 µm Q[6.6, 12 d], d in μm
-
NIMT#08060-10601
5.1.3 5.1.4
Ra 25 nm 32 µm Q[10, 12 Ra], Ra in µm
-
Rz Q[18, 17 Rz], Rz in µm
-
NMC/A*STAR #D049
5.1.4 ISO roughness parameters (eg. Ra)
0.1 µm 10 µm Q[36, 30 Ra], Ra in µm
-
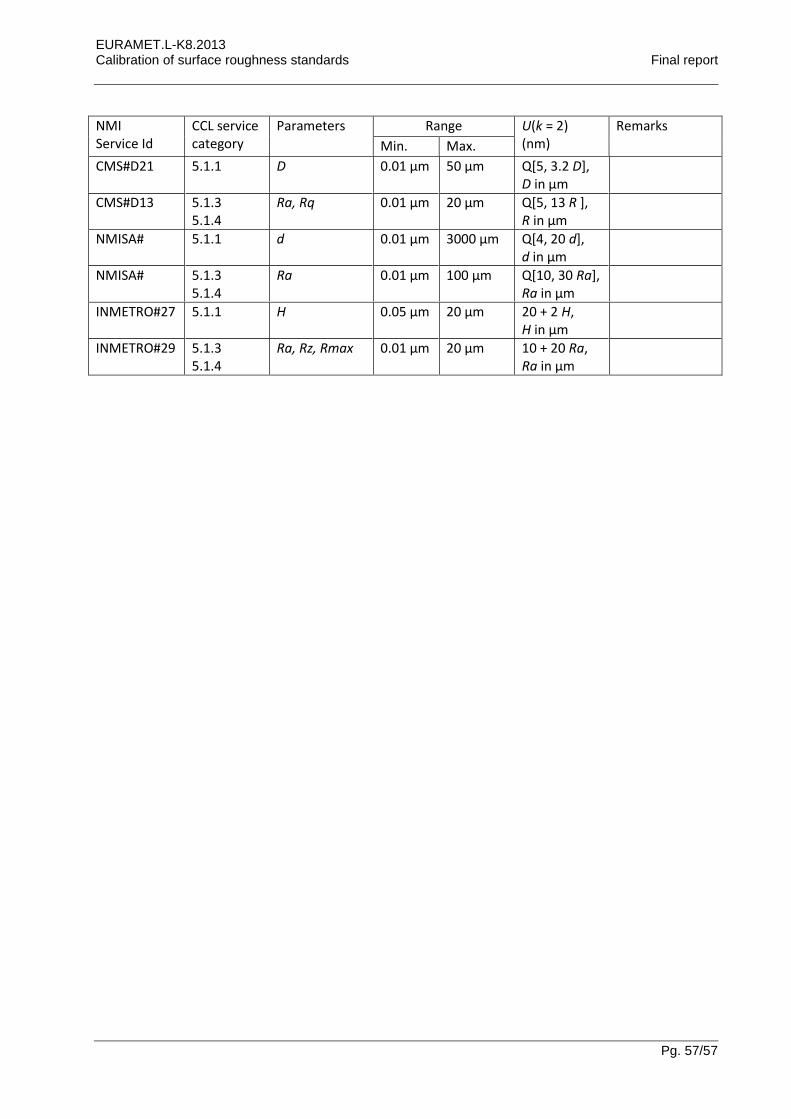
EURAMET.L-K8.2013 Calibration of surface roughness standards Final report
Pg. 57/57
NMI Service Id
CCL service category
Parameters Range U(k = 2) (nm)
Remarks
Min. Max.
CMS#D21 5.1.1 D 0.01 µm 50 µm Q[5, 3.2 D], D in μm
CMS#D13 5.1.3 5.1.4
Ra, Rq 0.01 µm 20 µm Q[5, 13 R ], R in μm
NMISA# 5.1.1 d 0.01 µm 3000 µm Q[4, 20 d], d in μm
NMISA# 5.1.3 5.1.4
Ra 0.01 µm 100 µm Q[10, 30 Ra], Ra in μm
INMETRO#27 5.1.1 H 0.05 µm 20 µm 20 + 2 H, H in μm
INMETRO#29 5.1.3 5.1.4
Ra, Rz, Rmax 0.01 µm 20 µm 10 + 20 Ra, Ra in μm
Related Documents


