Calibration of Load and Resistance Factors in LRFD Foundation Design Specifications by Oh-Sung Kwon Sarah Orton at Missouri University of Science and Technology Zuocai Wang Genda Chen A National University Transportation Center NUTC R237

Welcome message from author
This document is posted to help you gain knowledge. Please leave a comment to let me know what you think about it! Share it to your friends and learn new things together.
Transcript
Calibration of Load and Resistance Factors in LRFD Foundation
Design Specifications by
Oh-Sung Kwon Sarah Orton
at Missouri University of Science and Technology
Zuocai Wang Genda Chen
A National University Transportation Center
NUTC R237

Disclaimer
The contents of this report reflect the views of the author(s), who are responsible for the facts and the
accuracy of information presented herein. This document is disseminated under the sponsorship of
the Department of Transportation, University Transportation Centers Program and the Center for
Transportation Infrastructure and Safety NUTC program at the Missouri University of Science and
Technology, in the interest of information exchange. The U.S. Government and Center for
Transportation Infrastructure and Safety assumes no liability for the contents or use thereof.
NUTC ###
Technical Report Documen
2. Government Accession No. ecipient's Catalog No. tation Page
1. Report No.
NUTC R237
3. R
5. Report Date
February 2011
4. Title and Subtitle Calibration of Load and Resistance Factors in LRFD Foundation Design Specifications
6. Performing Organization Code 7. Author/s
Zuocai Wang, Genda Chen, Oh-Sung Kwon, and Sarah Orton
8. Performing Organization Report . No
00022979
10. Work Unit No. (TRAIS) 9. Performing Organization Name and Address
Center for Transportation Infrastructure and SafeMissouri University of Science a220 Engineering R
ty/NUTC program nd Technology
esearch Lab
.
DTRT06-G-0014
Rolla, MO 65409
11. Contract or Grant No
13. Type of Report and Period Covered
Final
12. Sponsoring Organization Name and Address
U.S. Department of Transportation Research and Innovative Techn1200 New Jersey Avenue
ology Administration , SE
14. Sponsoring Agency Code
Washington, DC 20590
15. Supplementary Notes 16. Abstract This report summarizes the findings and recommendations on the impact of foundation settlements on the reliability of bridge superstructures. As a collaborative effort of an overall initiative for the development of LRFD foundation design specifications, this study is focused on the investigatioof pros and cons for including foundation settlements in bridge designs under gravity loads. Settlement was modeled both probabilistically and deterministically. In the case of a random settlement variable, a lognormal distribution was used in reliability analysis with a fixed coefficient of variation of 0.25. Dead and live loads were modeled as random variables with normal and Gumbel Type I distributions, respectively. Considering the regional traffic condition on Missouri roadways, the effect of a live load reduction factor on bridge reliability was also investigated. Therefore, a totaof eight cases were discussed with a complete combination of settlement modeling (mean and extreme values), design consideration (settlements included and excluded), and live load reduction (unreduced and reduced live loads). Based on extensive simulations on multi-span bridges, bridges designed without due consideration on settlements can tolerate an extreme settlement of L/3500 - L/450 under unreduced live loads and up to L/3500 under reduced live loads without resulting in a reliability index below 3.5 (L=span length). Depending upon span lengths and their ratio, the reliability of existing steel-girder bridges is consistently higher than prestressed concrete and solid slab bridges. The shorter and stiffer the spans, thmore significant the settlement’s effect on the reliability of bridge superstructures. As the span length ratio becomes less than 0.75, the girder and solid slab bridges’ reliability drops significantly at small settlements. A concrete diaphragm is very susceptible to the differential settlement of bridges, particularly for moment effects. Two recommended were made to address settlement effects in bridge design: (1) settlement is considered in structural design and no special requirement is needed for foundation designs unless settlement exceeds the AASHTO recommended settlement limitof L/250, and (2) settlement is not considered in structural design as in the current MoDOT practice but ensured below the tolerable settlement (L/450 for steel girders, L/2500 for slabs, and L/3500 for prestressed concrete girders). The first method provides a direct approac
n
l
e
e.g.
h to deal with d has potential to reduce overall costs in bridge design. The second m sized foundations. settlements an ethod may result in over
17. Key Words
Reliability index, random variable, probabilistic distribution, tolerable settlement, girder bridge, prestressed concrete bridge, solidslab
lic al Information Service,
. bridge, concrete diaphragm
18. Distribution Statement
No restrictions. This document is available to the pubthrough the National TechnicSpringfield, Virginia 22161
19. Security Classification (of this report)
unclassified
20. Security Classification (of this
d
21. No. ges
143
22. Price page)
unclassifie
Of Pa
Form DOT F 1700.7 (8-72)
iii
EXECUTIVE SUMMARY Since October 2007, all state departments of transportation in the U.S. have been mandated to use the AASHTO Load and Resistance Factored Design (LRFD) Bridge Design Specifications in their federally funded bridge projects. In Missouri, these specifications had not been calibrated with its regional truck load and site conditions. As a critical part of a bridge system, the foundation not only affects the safety and stability of the overall system, but also constitutes a significant portion of bridge construction costs. Therefore, better calibrations with field data are imperative.
To this end, MoDOT recently launched a geotechnical study initiative for the development and calibration of load and resistance factors in LRFD foundation design specifications. As a support effort to that overall initiative, this study is aimed to investigate pros and cons for including foundation settlements in bridge designs under gravity loads and the effect of reducing live loads on the reliability of bridges. Settlement was modeled both probabilistically and deterministically. In the case of a random settlement variable, a lognormal distribution was adopted in reliability analysis with a fixed coefficient of variation of 0.25 based on limited studies reported in the literature. Dead and live loads were modeled as random variables with normal and Gumbel Type I distributions, respectively. In this study, a total of eight cases were analyzed with a complete combination of settlement modeling (characterized by mean and extreme values), settlement design consideration (included and excluded), and live load reduction (unreduced and reduced).
This report summarizes the findings and recommendations on the impact of foundation settlements on the reliability of the superstructure of both new and existing bridges. Based on extensive simulations on multi-span, continuous bridges, bridges designed without settlement consideration can tolerate an extreme settlement of L/3500 - L/450 under unreduced live loads and up to L/3500 under reduced live loads without resulting in a reliability index below 3.5 (L = span length). Depending upon span lengths and their ratio, the reliability of existing steel-girder bridges is consistently higher than prestressed concrete and solid slab bridges. The shorter and stiffer the spans, the more significant the settlement’s effect on the reliability of bridge superstructures. As the span length ratio becomes less than 0.75, the girder and solid slab bridges’ reliability drops significantly at small settlements. A concrete diaphragm is very susceptible to the differential settlement of bridges, particularly for moment effects.
Two methods are recommended to address settlement effects: (1) settlement is considered in superstructure and substructure design and no special requirement is needed for foundation designs unless settlement exceeds the AASHTO recommended limit of L/250, and (2) settlement is not considered in superstructure and substructure design as in the current MoDOT practice but ensured below the tolerable settlement (e.g. L/450 for steel girders, L/2500 for slabs, and L/3500 for prestressed concrete girders). The first method provides a direct approach to deal with settlements and has potential to reduce overall costs in bridge design. The potential increase in material and labor costs associated with structural design and construction expects to be trivial. The second method is an indirect approach to deal with settlements and may require oversized foundations to restrain settlement to the level that can be tolerated by the superstructure and substructure of a bridge designed without due consideration of settlement.
iv
ACKNOWLEDGEMENTS
Financial support to complete this study by Missouri Department of Transportation (MoDOT) and Missouri S&T Center for Transportation Infrastructure and Safety are greatly appreciated. The authors are grateful to Jennifer Harper for her continuing efforts to seek and provide input from MoDOT engineers and coordinate various project meetings over the duration of this project. Special thanks are due to Greg Sanders, Alan Miller, David Hagemeyer, and Aaron Kemna for their service as the Technical Advisory Panel (TAP) members of this project. Thanks are also due to Drs. Erik Loehr and Ronaldo Luna for their input from a geotechnical engineers’ point of view as well as MoDOT and Federal Highway Administration (FHWA) Missouri Division engineers for their valuable comments during various project meetings and review of the final report.
v
TABLE OF CONTENTS
TABLE OF CONTENTS .................................................................................................................v LIST OF FIGURES ...................................................................................................................... vii LIST OF TABLES ...........................................................................................................................x 1 INTRODUCTION ........................................................................................................................1
1.1 Background ..........................................................................................................................1 1.2 Objective and Scope of Work ..............................................................................................2 1.3 Organization of This Report ................................................................................................2
2 BRIDGE ANALYSIS UNDER SUPPORT SETTLEMENTS.....................................................4 2.1 Random Settlement and its Effect on Bridge Responses .....................................................4 2.2 Analysis Methods.................................................................................................................5 2.3 Bridge Analysis with MATLAB Program ...........................................................................7
2.3.1 Example 1: 2-span continuous steel girder bridge ..................................................... 8 2.3.2 Example 2: 3-span continuous prestressed concrete girder bridge ............................ 8
2.4 Bridge Analysis with Analytical Solutions ........................................................................13 2.4.1 Prismatic girder bridge with equal spans ................................................................. 13 2.4.2 Non-prismatic girder bridges with unequal spans ................................................... 15
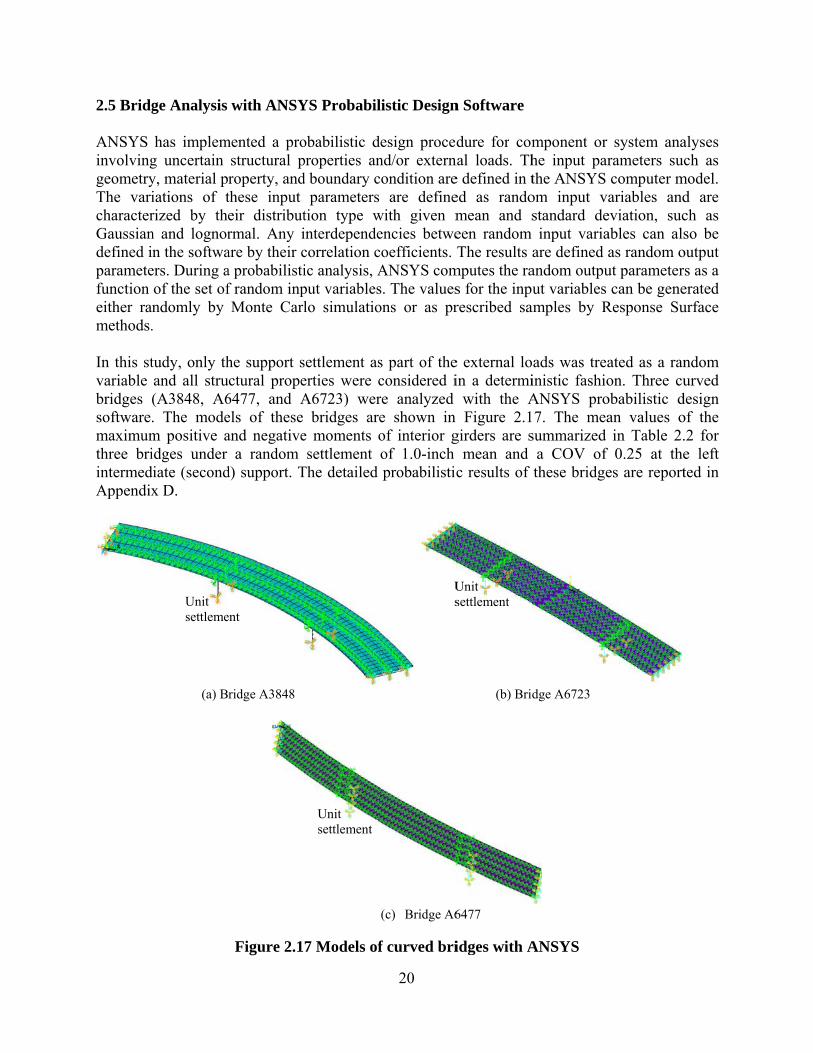
2.5 Bridge Analysis with ANSYS Probabilistic Design Software ..........................................20 2.6 Analysis with New Steel-Girder Bridges ...........................................................................21 2.7 Settlement Effect on Overall Design Loads .......................................................................22
3 STATISTICAL PROPERTIES OF LOADS AND RESISTANCES .........................................25 3.1 Statistical Parameters for Dead Load .................................................................................25 3.2 Statistical Parameters for Live Load ..................................................................................25 3.3 Statistical Parameters of Resistance ...................................................................................27 3.4 Statistical Parameters of Settlement Effects ......................................................................28
4 RELIABILITY ANALYSIS WITH SETTLEMENT EFFECTS ...............................................31 4.1 Reliability Theory ..............................................................................................................31 4.2 Reliability Index with Settlement Effect ............................................................................33
5 SETTLEMENT EFFECT ON SUPERSTRUCTURE RELIABILITY ......................................36 5.1 Load Analysis ....................................................................................................................36
5.1.1 Dead load effect ....................................................................................................... 36 5.1.2 Live load effect ........................................................................................................ 39
5.2 Strength Resistance of Selected Bridges ............................................................................41 5.3 Reliability Indices of 31 Bridge Designs with Equal Spans ..............................................42 5.4 Reliability Indices of 14 Existing Bridges .........................................................................69
5.4.1 Based on minimum resistances ................................................................................ 69 5.4.2 Based on actual resistances ...................................................................................... 82 5.4.3 Baseline at zero support settlement .......................................................................... 85
5.5 Uneven Settlement Effect on Diaphragm ..........................................................................86 6 CONCLUSIONS AND RECOMMENDATIONS .....................................................................89
6.1 Conclusions ........................................................................................................................89 6.2 Recommendations ..............................................................................................................90
REFERENCES ..............................................................................................................................92 APPENDIX A: SUPPORT MOMENTS DUE TO UNIT SETTLEMENTS AT VARIOUS
SUPPORTS ...................................................................................................................94
vi
APPENDIX B: SHEAR IN SPAN DUE TO UNIT SETTLEMENTS AT VARIOUS SUPPORTS ...................................................................................................................97
APPENDIX C: SUPPORT REACTIONS DUE TO UNIT SETTLEMENTS AT VARIOUS SUPPORTS .................................................................................................................100
APPENDIX D: BRIDGE ANALYSIS REPORT FROM ANSYS SOFTWARE .......................103 APPENDIX E: FORCES AND MOMENTS OF 31 NEW BRIDGES DUE TO A UNIT
SETTLEMENT AT SUPPORT 1 ...............................................................................120 APPENDIX F: FORCES AND MOMENTS OF 31 NEW BRIDGES DUE TO DEAD AND
LIVE LOADS .............................................................................................................123
vii
LIST OF FIGURES
Figure 1.1 Organization of this report .............................................................................................3 Figure 2.1 Support settlement sample data with COV = 25% .........................................................5 Figure 2.2 Support and span definitions of bridges with various spans ..........................................7 Figure 2.3 Bridge A3101 under a 1-inch center support settlement (Support 2) .............................9 Figure 2.4 Bridge A3101 under a random center support settlement (Support 2): mean=1 in. and
COV=0.25 ..............................................................................................................................9 Figure 2.5 Maximum positive moment distribution of Bridge A3101 under the center support
settlement (Support 2): mean=1 in. and COV=0.25 ............................................................10 Figure 2.6 Bridge A4058 under a 1-inch deterministic settlement ................................................11 Figure 2.7 Bridge A4058 under a random support settlement: mean=1 in. and COV=0.25 .........12 Figure 2.8 Histograms of the maximum positive and negative moments of Bridge A4058 under
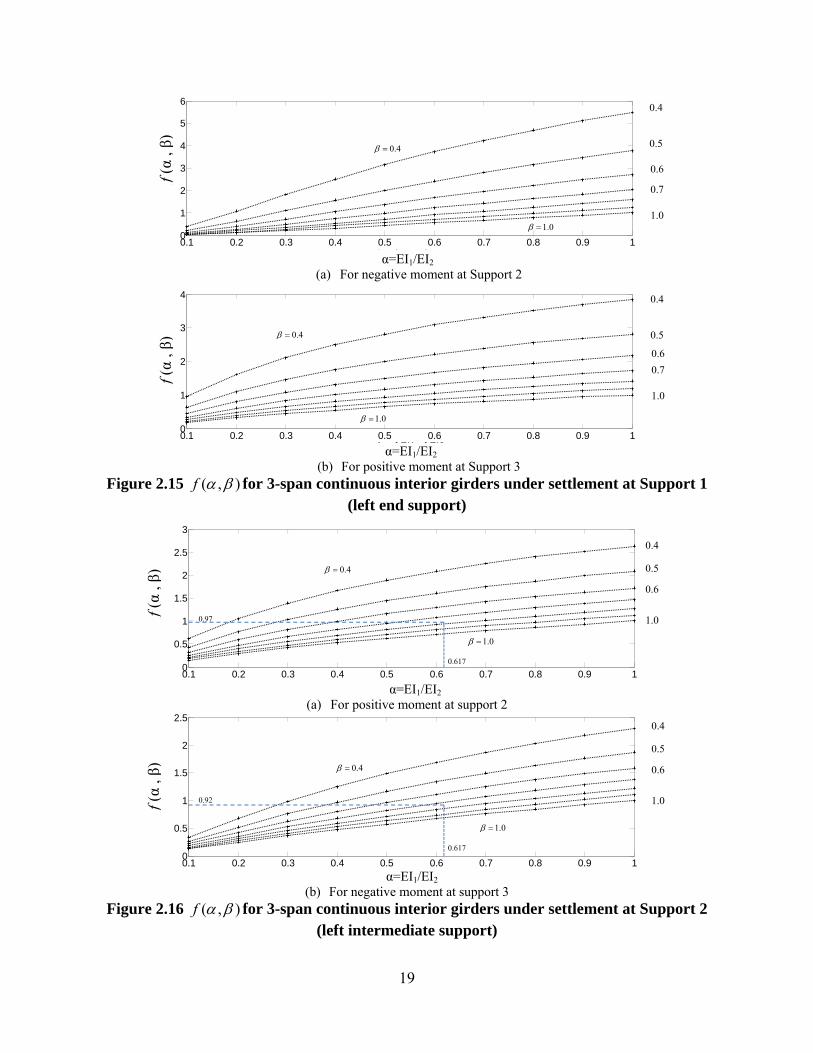
random support settlements: mean=1 in. and COV=0.25 ....................................................12 Figure 2.9 Special bridge cases ......................................................................................................13 Figure 2.10 Moment distribution of a prismatic 2-span girder of equal spans ..............................14 Figure 2.11 Maximum moments at Support 2 of the 2-span bridge ..............................................14 Figure 2.12 Moment diagrams of a 3-span girder ..........................................................................15 Figure 2.13 Maximum positive and negative moments of a 3-span bridge ...................................16 Figure 2.14 ( , )f for 2-span continuous girders .......................................................................18 Figure 2.15 ( , )f for 3-span continuous interior girders under settlement at Support 1 (left end
support) ................................................................................................................................19 Figure 2.16 ( , )f for 3-span continuous interior girders under settlement at Support 2 (left
intermediate support) ...........................................................................................................19 Figure 2.17 Models of curved bridges with ANSYS .....................................................................20 Figure 2.18 Cross section of new girder bridges ...........................................................................21 Figure 2.19 Minimum moments of inertia for new bridges ...........................................................23 Figure 2.20 Moment and shear ratios between two cases: with and without settlement effects ...24 Figure 3.1 Daily maximum moment fitted into Gumbel Type I distribution ................................26 Figure 3.2 Comparison between daily and 75-year maximum moment ........................................26 Figure 3.3 Comparison of maximum positive and negative moment distributions of Bridge
A3101: mean=1 in., COV=0.25 ...........................................................................................29 Figure 3.4 Comparison of maximum positive and negative moment distributions of Bridge
A4058 due to settlements: mean=1 in., COV=0.25 .............................................................30 Figure 5.1 Multiple-lane load ........................................................................................................39 Figure 5.2 The ratio of the real resistance to the minimum resistance ..........................................42 Figure 5.3 Reliability indices of 2-span bridges (No.1 to No.11 in Table 2.3): Case 1 ................43 Figure 5.4 Reliability indices of 3-span bridges (No.12 to No.22 in Table 2.3): Case 1 ..............44 Figure 5.5 Reliability indices of 4-span bridges (No.23 to No.31 in Table 2.3): Case 1 ..............45 Figure 5.6 Reliability indices of 2-span bridges (No.1 to No.11 in Table 2.3): Case 2 ................46 Figure 5.7 Reliability indices of 3-span bridges (No.12 to No.22 in Table 2.3): Case 2 ..............47 Figure 5.8 Reliability indices of 4-span bridges (No.23 to No.31 in Table 2.3): Case 2 ..............48 Figure 5.9 Reliability indices of 2-span bridges (No.1 to No.11 in Table 2.3): Case 3 ................49 Figure 5.10 Reliability indices of 3-span bridges (No.12 to No.22 in Table 2.3): Case 3 ............50 Figure 5.11 Reliability indices of 4-span bridges (No.23 to No.31 in Table 2.3): Case 3 ............51 Figure 5.12 Reliability indices of 2-span bridges (No.1 to No.11 in Table 2.3): Case 4 ..............52
viii
Figure 5.13 Reliability indices of 3-span bridges (No.12 to No.22 in Table 2.3): Case 4 ............53 Figure 5.14 Reliability indices of 4-span bridges (No.23 to No.31 in Table 2.3): Case 4 ............54 Figure 5.15 Reliability indices of 2-span bridges (No.1 to No.11 in Table 2.3): Case 5 ..............55 Figure 5.16 Reliability indices of 3-span bridges (No.12 to No.22 in Table 2.3): Case 5 ............56 Figure 5.17 Reliability indices of 4-span bridges (No.23 to No.31 in Table 2.3): Case 5 ............57 Figure 5.18 Reliability indices of 2-span bridges (No.1 to No.11 in Table 2.3): Case 6 ..............58 Figure 5.19 Reliability indices of 3-span bridges (No.12 to No.22 in Table 2.3): Case 6 ............59 Figure 5.20 Reliability indices of 4-span bridges (No.23 to No.31 in Table 2.3): Case 6 ............60 Figure 5.21 Reliability indices of 2-span bridges (No.1 to No.11 in Table 2.3): Case 7 ..............61 Figure 5.22 Reliability indices of 3-span bridges (No.12 to No.22 in Table 2.3): Case 7 ............62 Figure 5.23 Reliability indices of 4-span bridges (No.23 to No.31 in Table 2.3): Case 7 ............63 Figure 5.24 Reliability indices of 2-span bridges (No.1 to No.11 in Table 2.3): Case 8 ..............64 Figure 5.25 Reliability indices of 3-span bridges (No.12 to No.22 in Table 2.3): Case 8 ............65 Figure 5.26 Reliability indices of 4-span bridges (No.23 to No.31 in Table 2.3): Case 8 ............66 Figure 5.27 Reliability indices of 14 existing bridges: Case 1 ......................................................70 Figure 5.28 Reliability indices of 14 existing bridges: Case 2 ......................................................72 Figure 5.29 Reliability indices of 14 existing bridges: Case 3 ......................................................73 Figure 5.30 Reliability indices of 14 existing bridges: Case 4 ......................................................75 Figure 5.31 Reliability indices of 14 existing bridges: Case 5 ......................................................76 Figure 5.32 Reliability indices of 14 existing bridges: Case 6 ......................................................78 Figure 5.33 Reliability indices of 14 existing bridges: Case 7 ......................................................79 Figure 5.34 Reliability indices of 14 existing bridges: Case 8 ......................................................81 Figure 5.35 Reliability indices of 14 existing bridges: Case 1 ......................................................83 Figure 5.36 Reliability indices of 14 existing bridges: Case 2 ......................................................84 Figure 5.37 Reliability indices of 14 existing bridges without settlement effects .........................86 Figure 5.38 Typical concrete bent diaphragm ...............................................................................87 Figure 5.39 Typical steel bent diaphragm ......................................................................................87 Figure 5.40 Bent diaphragm of Bridge A6569 ..............................................................................87 Figure 5.41 Bent rotation due to the uneven settlement of bridge foundations .............................88 Figure 6.1 Design flow chart with two recommendations .............................................................91 Figure D.1 Finite element model of each bridge .........................................................................103 Figure D.2 Probability density function and probability distribution function of input random
variable A defined in Table D.3 .........................................................................................104 Figure D.3 Histograms of maximum moment .............................................................................106 Figure D.4 Histograms of minimum moment ..............................................................................107 Figure D.5 Histograms of maximum absolute shear force ..........................................................108 Figure D.6 Histograms of minimum absolute shear force ...........................................................109 Figure D.7 Sample histories of maximum moment .....................................................................110 Figure D.8 Sample histories of minimum moment ......................................................................111 Figure D.9 Sample histories of maximum shear force ................................................................112 Figure D.10 Sample histories of minimum shear force ...............................................................113 Figure D.11 Probability distribution functions of maximum moment ........................................114 Figure D.12 Probability distribution function of minimum moment ...........................................115 Figure D.13 Probability distribution function of maximum shear force .....................................116 Figure D.14 Probability distribution function of minimum shear force ......................................117 Figure D.15 Settlement versus maximum moment ......................................................................118

ix
Figure D.16 Settlement versus minimum moment ......................................................................119
x
LIST OF TABLES
Table 2.1 Select bridges for analysis ...............................................................................................6 Table 2.2 Means of maximum positive and negative moments in interior girders ........................21 Table 2.3 Summary of new designs of girder bridges with equal spans ........................................22 Table 2.4 Bridges analyzed under gravity loads ............................................................................23 Table 3.1 Statistical values of dead load (Nowak, 1999) ..............................................................25 Table 3.2 Statistical parameters of resistance ................................................................................27 Table 4.1 Eight design cases investigated ......................................................................................33 Table 4.2 Strength resistance factors in AASHTO LRFD specifications (2007) ..........................34 Table 5.1 Maximum positive moments of each interior girder due to dead loads excluding
wearing surface ....................................................................................................................36 Table 5.2 Maximum negative moments of each interior girder due to dead loads excluding
wearing surface ....................................................................................................................37 Table 5.3 Maximum shear forces of each interior girder due to dead loads excluding wearing
surface ..................................................................................................................................37 Table 5.4 Maximum positive moments of each interior girder due to weight of wearing surface
only ......................................................................................................................................38 Table 5.5 Maximum negative moments of each interior girder due to weight of wearing surface
only ......................................................................................................................................38 Table 5.6 Maximum shears of each interior girder due to weight of wearing surface only ..........39 Table 5.7 Maximum positive moments of each interior girder due to live load ............................40 Table 5.8 Maximum negative moments of each interior girder due to live load ...........................40 Table 5.9 Maximum shear forces of each interior girder due to live load .....................................41 Table 5.10 Minimum resistances of negative and positive moments and shear ............................41 Table 5.11 Actual resistances of negative and positive moments .................................................42 Table 5.12 Average tolerable settlements of new bridges in terms of loading effects ..................67 Table 5.13 Average tolerable settlements of new bridges in terms of bridge span numbers ........67 Table 5.14 Average tolerable settlements of existing bridges (% of span length) using the
minimum resistances ............................................................................................................81 Table 5.15 Average tolerable settlements of existing bridges (% of span length) using the actual
moment strength...................................................................................................................85 Table 5.16 Nominal resistance and maximum moment and shear due to uneven settlement .......88 Table A.1 Support moments due to unit settlements for 2-span continuous bridges ....................94 Table A.2 Support moments due to unit settlements for 3-span continuous bridges ....................94 Table A.3 Support moments due to unit settlements for 4- and 5-span continuous bridges .........95 Table B.1 Shear in spans due to unit settlements for 2-span continuous bridges ..........................97 Table B.2 Shear in spans due to unit settlements for 3-span continuous bridges ..........................97 Table B.3 Shear in spans due to unit settlements for 4- and 5-span continuous bridges ...............98 Table C.1 Support reactions due to unit settlements for 2-span continuous bridges ...................100 Table C.2 Support reactions due to unit settlements for 3-span continuous bridges ...................100 Table C.3 Support reactions due to unit settlements for 4- and 5-span continuous bridges ........101 Table D.1 Details of the finite element model .............................................................................104 Table D.2 Material properties ......................................................................................................104 Table D.3 Random input variable specifications .........................................................................104 Table D.4 Statistics of the random output parameters .................................................................105 Table E.1 Moments at various supports .......................................................................................120
xi
Table E.2 Shear forces at various supports .................................................................................121 Table E.3 Reactions at various supports .....................................................................................122 Table F.1 Maximum negative moments due to dead load excluding wearing surface ................123 Table F.2 Maximum positive moments due to dead load excluding wearing surface .................124 Table F.3 Maximum shear forces due to dead load excluding wearing surface ..........................125 Table F.4 Maximum negative moments due to weight of wearing surface .................................126 Table F.5 Maximum positive moments due to weight of wearing surface ..................................127 Table F.6 Maximum shear forces due to weight of wearing surface ...........................................128 Table F.7 Maximum negative moments due to 75-year live load including dynamic effect ......129 Table F.8 Maximum positive moments due to 75-year live load including dynamic effect .......130 Table F.9 Maximum shear forces due to 75-year live load including dynamic effect ...............131 Table F.10 Maximum negative moments due to HL-93 load including dynamic effect .............132 Table F.11 Maximum positive moments due to HL-93 load including dynamic effect ..............133 Table F.12 Maximum shear forces due to HL-93 load including dynamic effect .......................134
1
1 INTRODUCTION
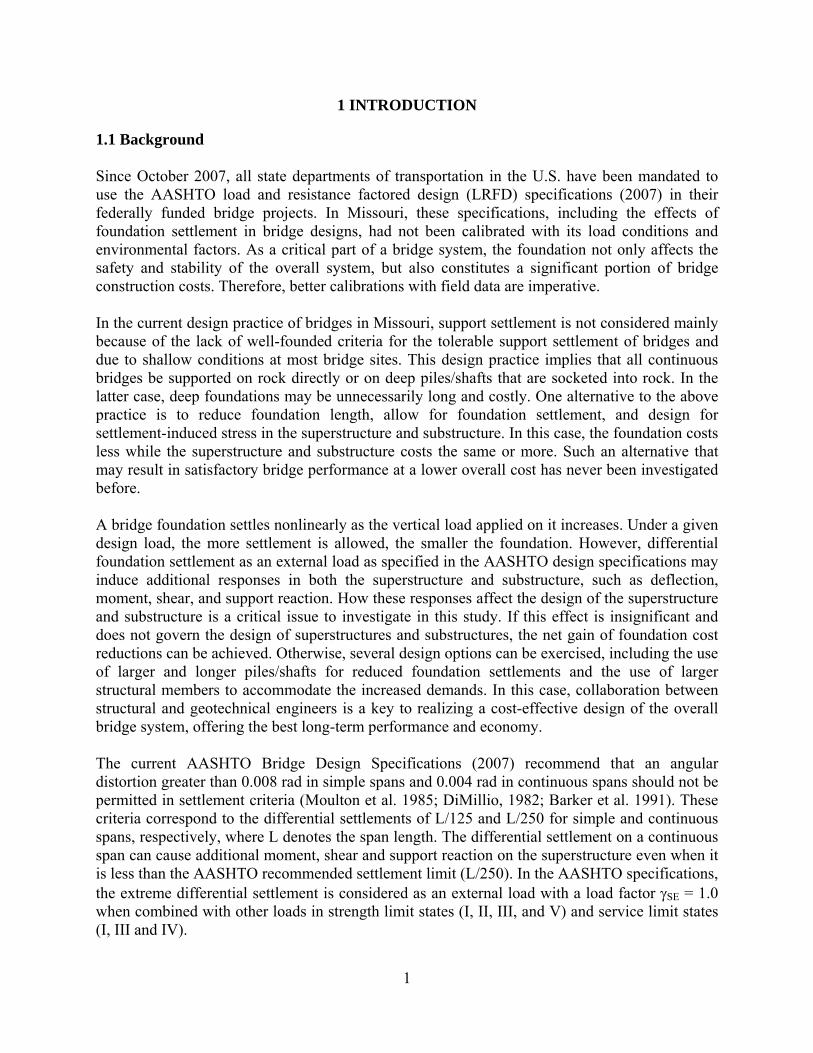
1.1 Background Since October 2007, all state departments of transportation in the U.S. have been mandated to use the AASHTO load and resistance factored design (LRFD) specifications (2007) in their federally funded bridge projects. In Missouri, these specifications, including the effects of foundation settlement in bridge designs, had not been calibrated with its load conditions and environmental factors. As a critical part of a bridge system, the foundation not only affects the safety and stability of the overall system, but also constitutes a significant portion of bridge construction costs. Therefore, better calibrations with field data are imperative. In the current design practice of bridges in Missouri, support settlement is not considered mainly because of the lack of well-founded criteria for the tolerable support settlement of bridges and due to shallow conditions at most bridge sites. This design practice implies that all continuous bridges be supported on rock directly or on deep piles/shafts that are socketed into rock. In the latter case, deep foundations may be unnecessarily long and costly. One alternative to the above practice is to reduce foundation length, allow for foundation settlement, and design for settlement-induced stress in the superstructure and substructure. In this case, the foundation costs less while the superstructure and substructure costs the same or more. Such an alternative that may result in satisfactory bridge performance at a lower overall cost has never been investigated before. A bridge foundation settles nonlinearly as the vertical load applied on it increases. Under a given design load, the more settlement is allowed, the smaller the foundation. However, differential foundation settlement as an external load as specified in the AASHTO design specifications may induce additional responses in both the superstructure and substructure, such as deflection, moment, shear, and support reaction. How these responses affect the design of the superstructure and substructure is a critical issue to investigate in this study. If this effect is insignificant and does not govern the design of superstructures and substructures, the net gain of foundation cost reductions can be achieved. Otherwise, several design options can be exercised, including the use of larger and longer piles/shafts for reduced foundation settlements and the use of larger structural members to accommodate the increased demands. In this case, collaboration between structural and geotechnical engineers is a key to realizing a cost-effective design of the overall bridge system, offering the best long-term performance and economy. The current AASHTO Bridge Design Specifications (2007) recommend that an angular distortion greater than 0.008 rad in simple spans and 0.004 rad in continuous spans should not be permitted in settlement criteria (Moulton et al. 1985; DiMillio, 1982; Barker et al. 1991). These criteria correspond to the differential settlements of L/125 and L/250 for simple and continuous spans, respectively, where L denotes the span length. The differential settlement on a continuous span can cause additional moment, shear and support reaction on the superstructure even when it is less than the AASHTO recommended settlement limit (L/250). In the AASHTO specifications, the extreme differential settlement is considered as an external load with a load factor SE = 1.0 when combined with other loads in strength limit states (I, II, III, and V) and service limit states (I, III and IV).
2
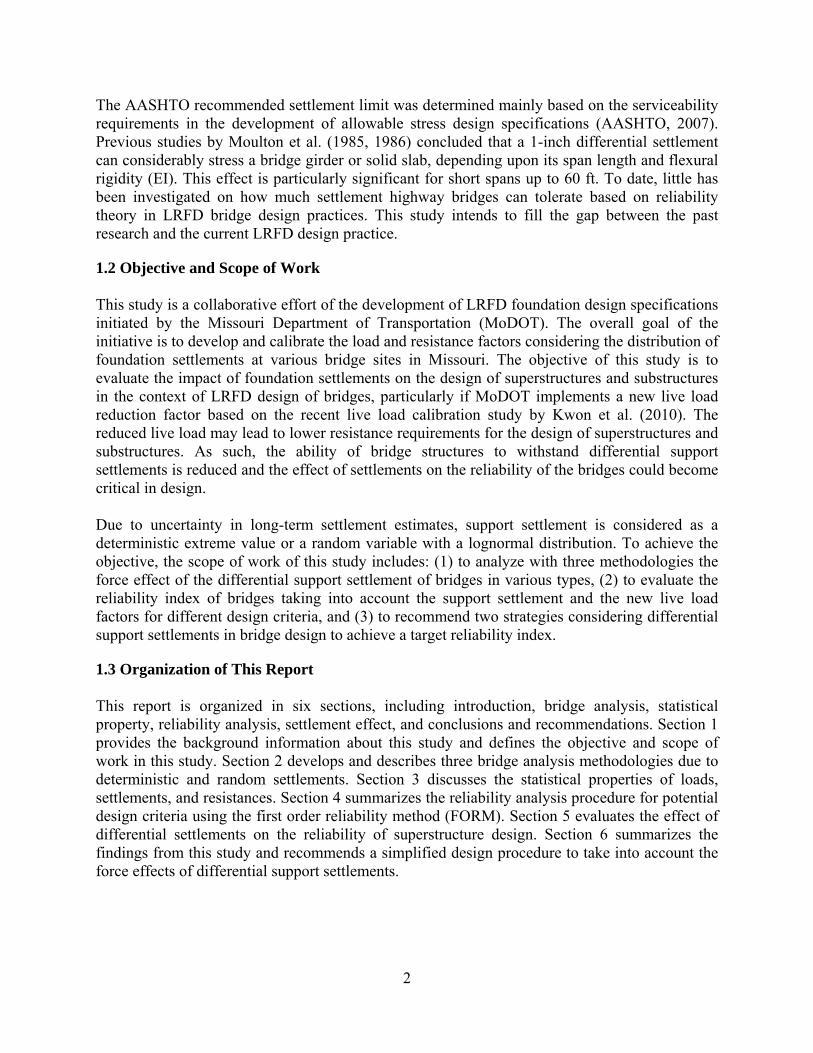
The AASHTO recommended settlement limit was determined mainly based on the serviceability requirements in the development of allowable stress design specifications (AASHTO, 2007). Previous studies by Moulton et al. (1985, 1986) concluded that a 1-inch differential settlement can considerably stress a bridge girder or solid slab, depending upon its span length and flexural rigidity (EI). This effect is particularly significant for short spans up to 60 ft. To date, little has been investigated on how much settlement highway bridges can tolerate based on reliability theory in LRFD bridge design practices. This study intends to fill the gap between the past research and the current LRFD design practice.
1.2 Objective and Scope of Work This study is a collaborative effort of the development of LRFD foundation design specifications initiated by the Missouri Department of Transportation (MoDOT). The overall goal of the initiative is to develop and calibrate the load and resistance factors considering the distribution of foundation settlements at various bridge sites in Missouri. The objective of this study is to evaluate the impact of foundation settlements on the design of superstructures and substructures in the context of LRFD design of bridges, particularly if MoDOT implements a new live load reduction factor based on the recent live load calibration study by Kwon et al. (2010). The reduced live load may lead to lower resistance requirements for the design of superstructures and substructures. As such, the ability of bridge structures to withstand differential support settlements is reduced and the effect of settlements on the reliability of the bridges could become critical in design. Due to uncertainty in long-term settlement estimates, support settlement is considered as a deterministic extreme value or a random variable with a lognormal distribution. To achieve the objective, the scope of work of this study includes: (1) to analyze with three methodologies the force effect of the differential support settlement of bridges in various types, (2) to evaluate the reliability index of bridges taking into account the support settlement and the new live load factors for different design criteria, and (3) to recommend two strategies considering differential support settlements in bridge design to achieve a target reliability index.
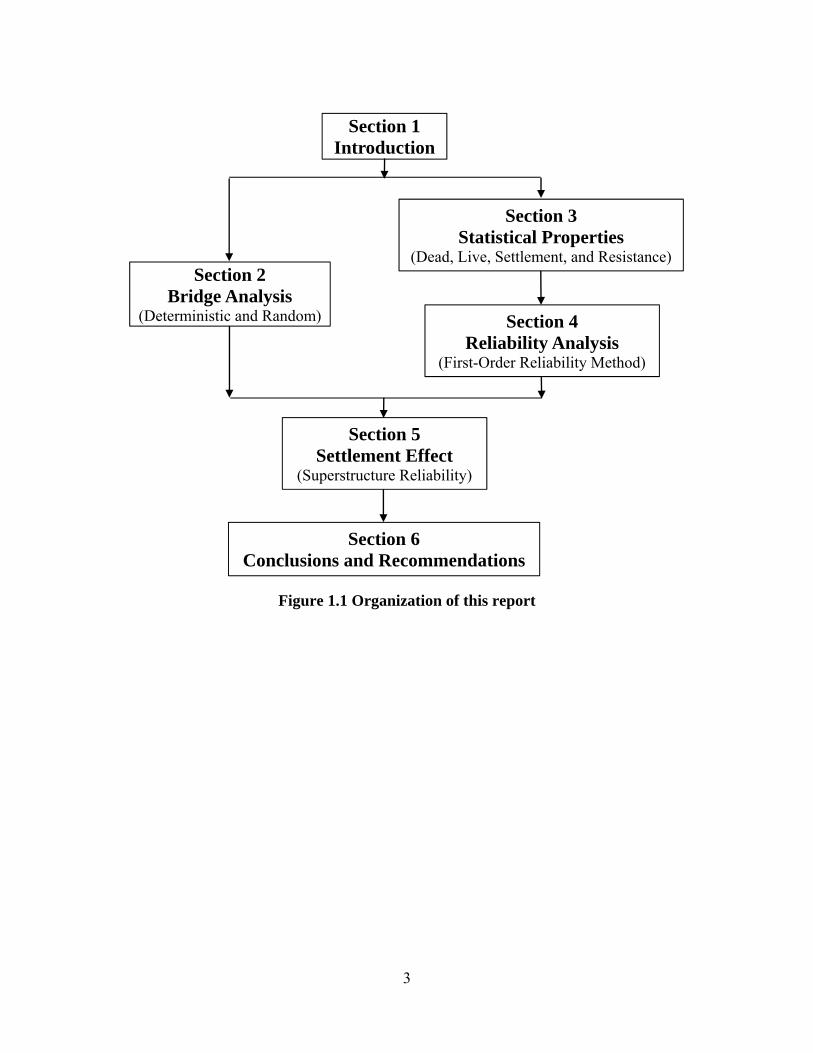
1.3 Organization of This Report This report is organized in six sections, including introduction, bridge analysis, statistical property, reliability analysis, settlement effect, and conclusions and recommendations. Section 1 provides the background information about this study and defines the objective and scope of work in this study. Section 2 develops and describes three bridge analysis methodologies due to deterministic and random settlements. Section 3 discusses the statistical properties of loads, settlements, and resistances. Section 4 summarizes the reliability analysis procedure for potential design criteria using the first order reliability method (FORM). Section 5 evaluates the effect of differential settlements on the reliability of superstructure design. Section 6 summarizes the findings from this study and recommends a simplified design procedure to take into account the force effects of differential support settlements.
3
Figure 1.1 Organization of this report
Section 2 Bridge Analysis
(Deterministic and Random)
Section 3 Statistical Properties
(Dead, Live, Settlement, and Resistance)
Section 5 Settlement Effect
(Superstructure Reliability)
Section 1 Introduction
Section 4 Reliability Analysis
(First-Order Reliability Method)
Section 6 Conclusions and Recommendations
4
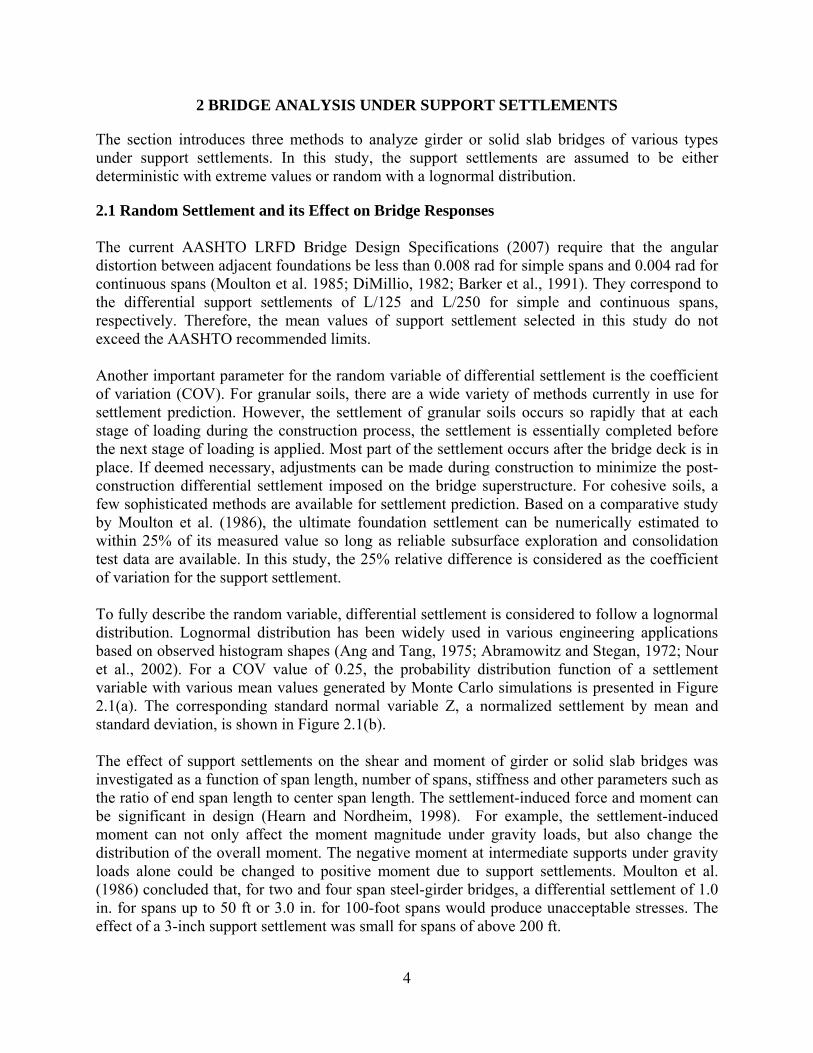
2 BRIDGE ANALYSIS UNDER SUPPORT SETTLEMENTS
The section introduces three methods to analyze girder or solid slab bridges of various types under support settlements. In this study, the support settlements are assumed to be either deterministic with extreme values or random with a lognormal distribution.
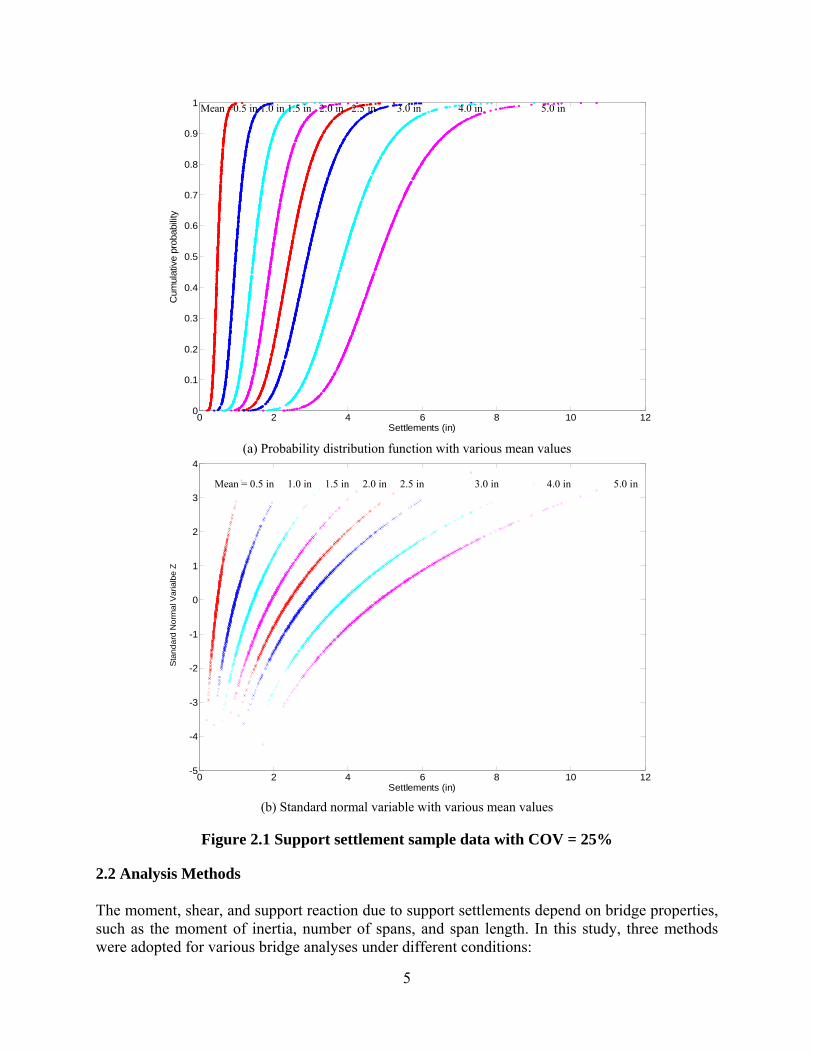
2.1 Random Settlement and its Effect on Bridge Responses The current AASHTO LRFD Bridge Design Specifications (2007) require that the angular distortion between adjacent foundations be less than 0.008 rad for simple spans and 0.004 rad for continuous spans (Moulton et al. 1985; DiMillio, 1982; Barker et al., 1991). They correspond to the differential support settlements of L/125 and L/250 for simple and continuous spans, respectively. Therefore, the mean values of support settlement selected in this study do not exceed the AASHTO recommended limits. Another important parameter for the random variable of differential settlement is the coefficient of variation (COV). For granular soils, there are a wide variety of methods currently in use for settlement prediction. However, the settlement of granular soils occurs so rapidly that at each stage of loading during the construction process, the settlement is essentially completed before the next stage of loading is applied. Most part of the settlement occurs after the bridge deck is in place. If deemed necessary, adjustments can be made during construction to minimize the post-construction differential settlement imposed on the bridge superstructure. For cohesive soils, a few sophisticated methods are available for settlement prediction. Based on a comparative study by Moulton et al. (1986), the ultimate foundation settlement can be numerically estimated to within 25% of its measured value so long as reliable subsurface exploration and consolidation test data are available. In this study, the 25% relative difference is considered as the coefficient of variation for the support settlement. To fully describe the random variable, differential settlement is considered to follow a lognormal distribution. Lognormal distribution has been widely used in various engineering applications based on observed histogram shapes (Ang and Tang, 1975; Abramowitz and Stegan, 1972; Nour et al., 2002). For a COV value of 0.25, the probability distribution function of a settlement variable with various mean values generated by Monte Carlo simulations is presented in Figure 2.1(a). The corresponding standard normal variable Z, a normalized settlement by mean and standard deviation, is shown in Figure 2.1(b). The effect of support settlements on the shear and moment of girder or solid slab bridges was investigated as a function of span length, number of spans, stiffness and other parameters such as the ratio of end span length to center span length. The settlement-induced force and moment can be significant in design (Hearn and Nordheim, 1998). For example, the settlement-induced moment can not only affect the moment magnitude under gravity loads, but also change the distribution of the overall moment. The negative moment at intermediate supports under gravity loads alone could be changed to positive moment due to support settlements. Moulton et al. (1986) concluded that, for two and four span steel-girder bridges, a differential settlement of 1.0 in. for spans up to 50 ft or 3.0 in. for 100-foot spans would produce unacceptable stresses. The effect of a 3-inch support settlement was small for spans of above 200 ft.
5
(a) Probability distribution function with various mean values
(b) Standard normal variable with various mean values
Figure 2.1 Support settlement sample data with COV = 25%
2.2 Analysis Methods The moment, shear, and support reaction due to support settlements depend on bridge properties, such as the moment of inertia, number of spans, and span length. In this study, three methods were adopted for various bridge analyses under different conditions:
0 2 4 6 8 10 120
0.1
0.2
0.3
0.4
0.5
0.6
0.7
0.8
0.9
1
Cum
ulat
ive
prob
abili
ty
Settlements (in)
0 2 4 6 8 10 12-5
-4
-3
-2
-1
0
1
2
3
4
Sta
nda
rd N
orm
al V
aria
lbe Z
Settlements (in)
Mean = 0.5 in 1.0 in 1.5 in 2.0 in 2.5 in 3.0 in 4.0 in 5.0 in
Mean =0.5 in 1.0 in 1.5 in 2.0 in 2.5 in 3.0 in 4.0 in 5.0 in
6
1. A MATLAB program was developed for the maximum automation of numerical analyses for the straight girder bridges,
2. Analytical solutions were derived for special cases of straight girders to facilitate the development of design equations, and
3. An ANSYS probabilistic design software package was used to analyze both the superstructure and substructure of curved girder bridges under random support settlements.
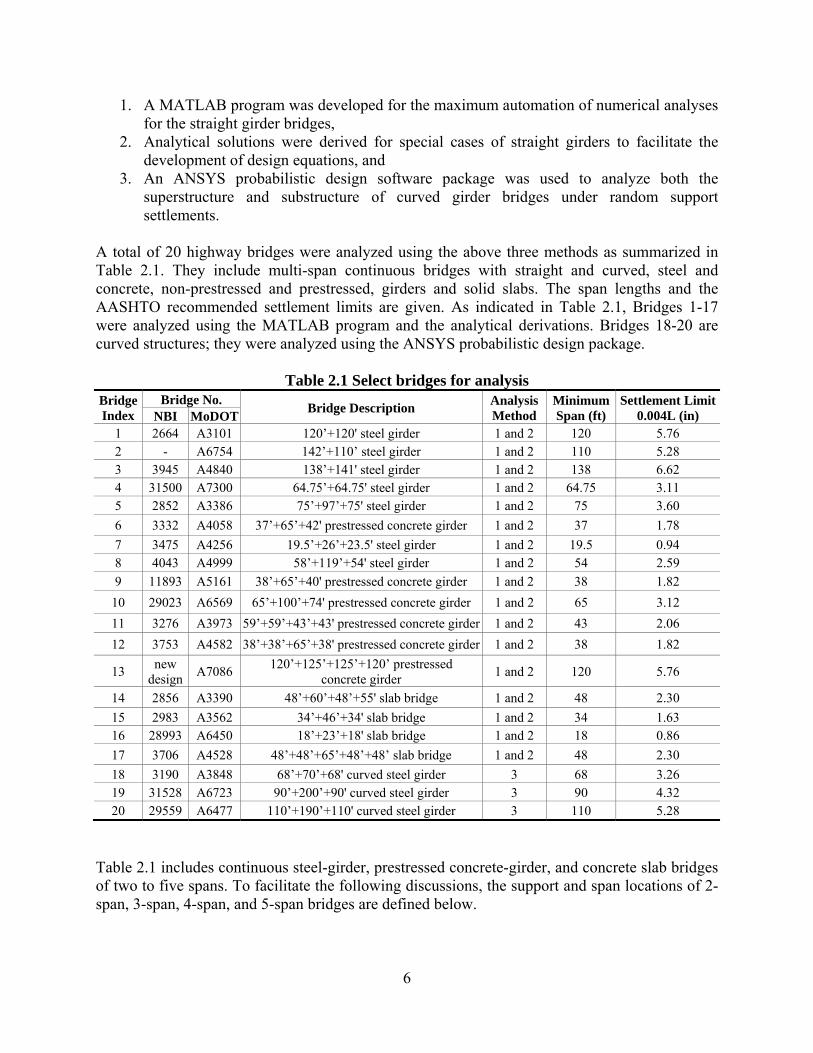
A total of 20 highway bridges were analyzed using the above three methods as summarized in Table 2.1. They include multi-span continuous bridges with straight and curved, steel and concrete, non-prestressed and prestressed, girders and solid slabs. The span lengths and the AASHTO recommended settlement limits are given. As indicated in Table 2.1, Bridges 1-17 were analyzed using the MATLAB program and the analytical derivations. Bridges 18-20 are curved structures; they were analyzed using the ANSYS probabilistic design package.
Table 2.1 Select bridges for analysis Bridge Index
Bridge No. Bridge Description Analysis Method
Minimum Span (ft)
Settlement Limit 0.004L (in) NBI MoDOT
1 2664 A3101 120’+120' steel girder 1 and 2 120 5.76 2 - A6754 142’+110’ steel girder 1 and 2 110 5.28 3 3945 A4840 138’+141' steel girder 1 and 2 138 6.62 4 31500 A7300 64.75’+64.75' steel girder 1 and 2 64.75 3.11 5 2852 A3386 75’+97’+75' steel girder 1 and 2 75 3.60
6 3332 A4058 37’+65’+42' prestressed concrete girder 1 and 2 37 1.78
7 3475 A4256 19.5’+26’+23.5' steel girder 1 and 2 19.5 0.94 8 4043 A4999 58’+119’+54' steel girder 1 and 2 54 2.59
9 11893 A5161 38’+65’+40' prestressed concrete girder 1 and 2 38 1.82
10 29023 A6569 65’+100’+74' prestressed concrete girder 1 and 2 65 3.12
11 3276 A3973 59’+59’+43’+43' prestressed concrete girder 1 and 2 43 2.06
12 3753 A4582 38’+38’+65’+38' prestressed concrete girder 1 and 2 38 1.82
13 new
design A7086
120’+125’+125’+120’ prestressed concrete girder
1 and 2 120 5.76
14 2856 A3390 48’+60’+48’+55' slab bridge 1 and 2 48 2.30
15 2983 A3562 34’+46’+34' slab bridge 1 and 2 34 1.63 16 28993 A6450 18’+23’+18' slab bridge 1 and 2 18 0.86
17 3706 A4528 48’+48’+65’+48’+48’ slab bridge 1 and 2 48 2.30
18 3190 A3848 68’+70’+68' curved steel girder 3 68 3.26 19 31528 A6723 90’+200’+90' curved steel girder 3 90 4.32 20 29559 A6477 110’+190’+110' curved steel girder 3 110 5.28
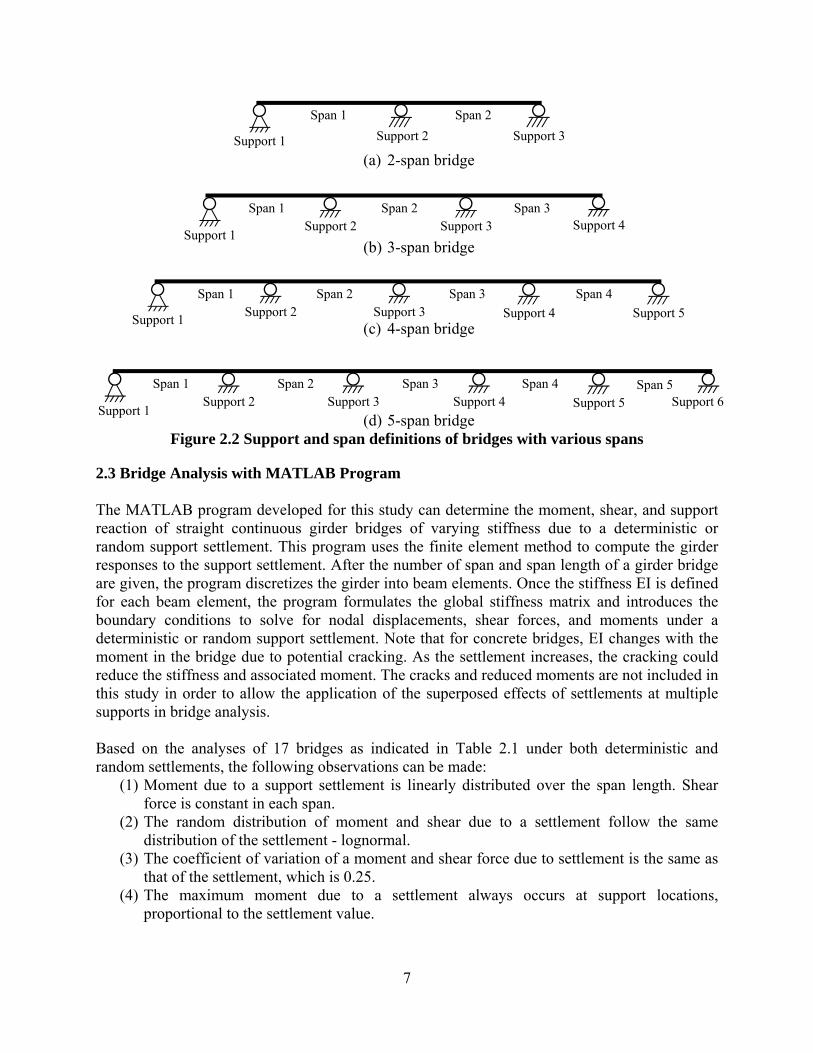
Table 2.1 includes continuous steel-girder, prestressed concrete-girder, and concrete slab bridges of two to five spans. To facilitate the following discussions, the support and span locations of 2-span, 3-span, 4-span, and 5-span bridges are defined below.
7
(a) 2-span bridge
(b) 3-span bridge
(c) 4-span bridge
(d) 5-span bridge Figure 2.2 Support and span definitions of bridges with various spans
2.3 Bridge Analysis with MATLAB Program The MATLAB program developed for this study can determine the moment, shear, and support reaction of straight continuous girder bridges of varying stiffness due to a deterministic or random support settlement. This program uses the finite element method to compute the girder responses to the support settlement. After the number of span and span length of a girder bridge are given, the program discretizes the girder into beam elements. Once the stiffness EI is defined for each beam element, the program formulates the global stiffness matrix and introduces the boundary conditions to solve for nodal displacements, shear forces, and moments under a deterministic or random support settlement. Note that for concrete bridges, EI changes with the moment in the bridge due to potential cracking. As the settlement increases, the cracking could reduce the stiffness and associated moment. The cracks and reduced moments are not included in this study in order to allow the application of the superposed effects of settlements at multiple supports in bridge analysis. Based on the analyses of 17 bridges as indicated in Table 2.1 under both deterministic and random settlements, the following observations can be made:
(1) Moment due to a support settlement is linearly distributed over the span length. Shear force is constant in each span.
(2) The random distribution of moment and shear due to a settlement follow the same distribution of the settlement - lognormal.
(3) The coefficient of variation of a moment and shear force due to settlement is the same as that of the settlement, which is 0.25.
(4) The maximum moment due to a settlement always occurs at support locations, proportional to the settlement value.
Support 1 Support 2 Support 3
Support 2
Support 4 Support 3
Support 1
Support 1
Support 2Support 1
Support 4 Support 3 Support 2
Support 5 Support 3 Support 4
Support 6Support 5
Span 1
Span 2
Span 2
Span 2 Span 1
Span 1
Span 1 Span 4
Span 4
Span 3
Span 3
Span 3
Span 5
Span 2
8
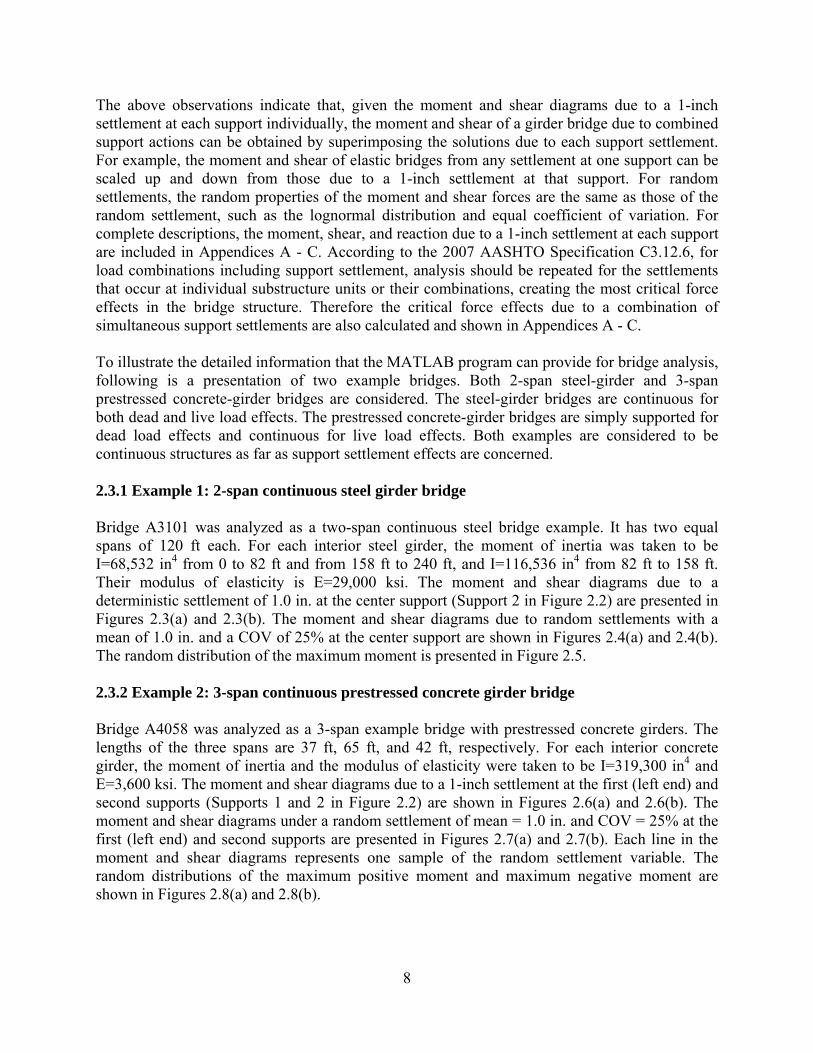
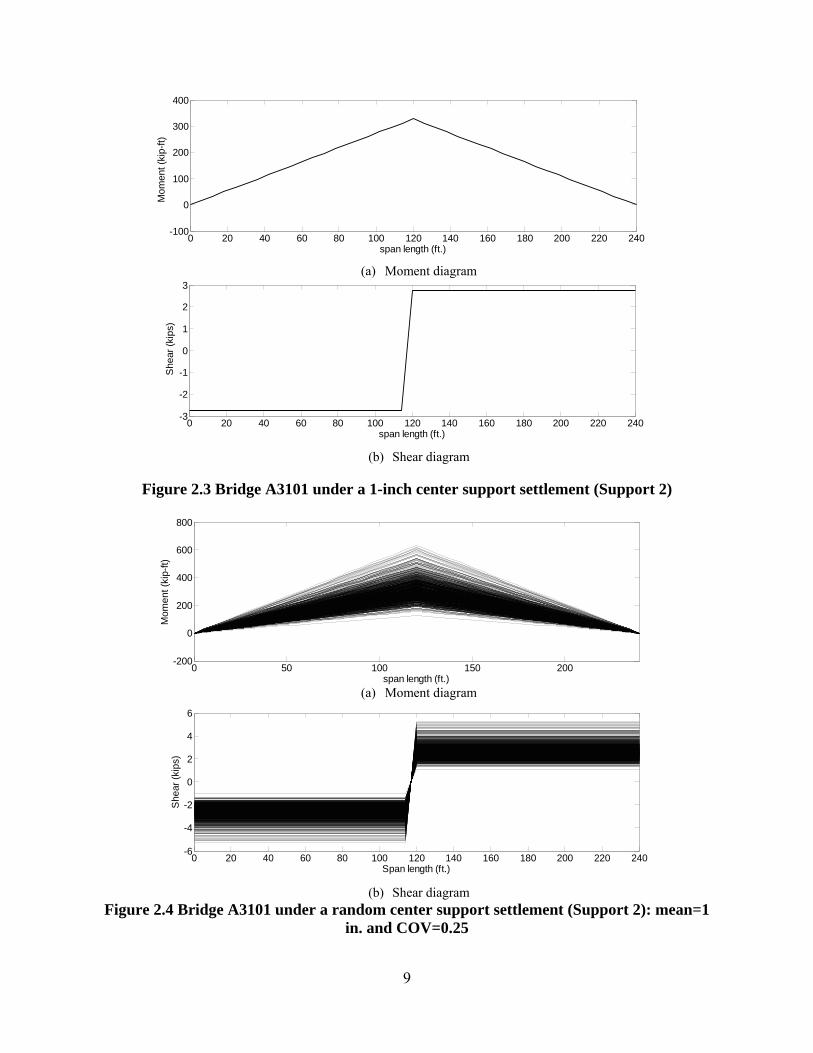
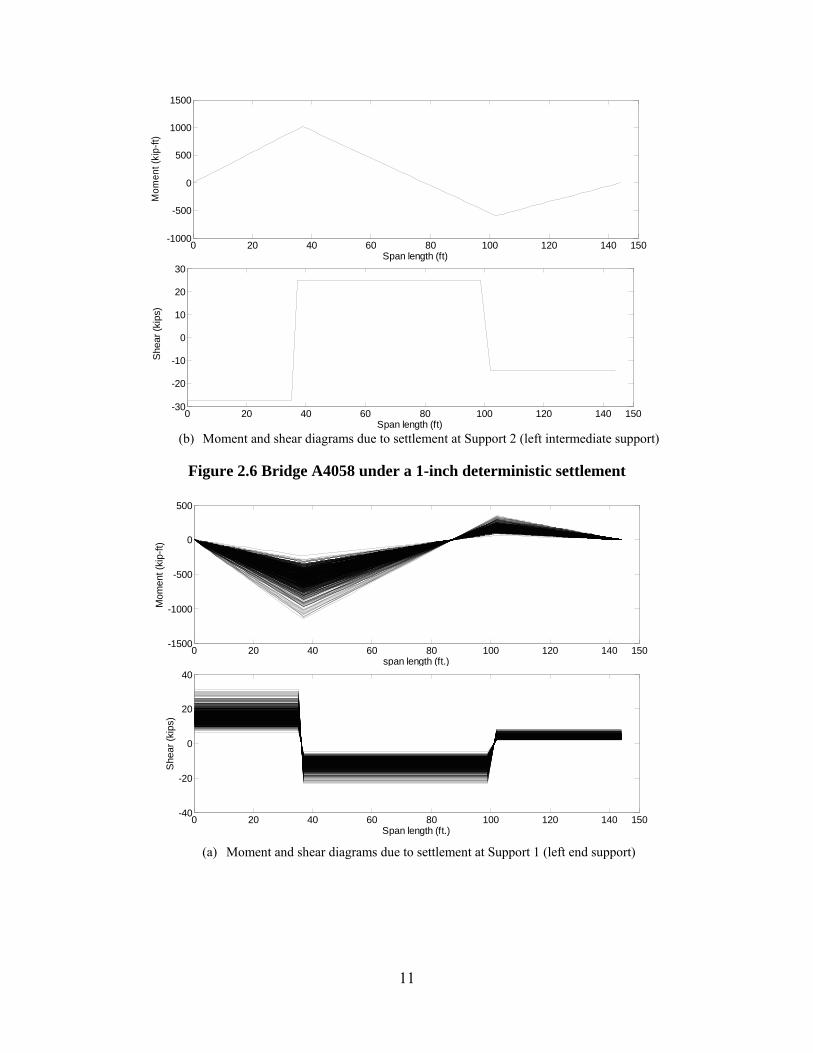
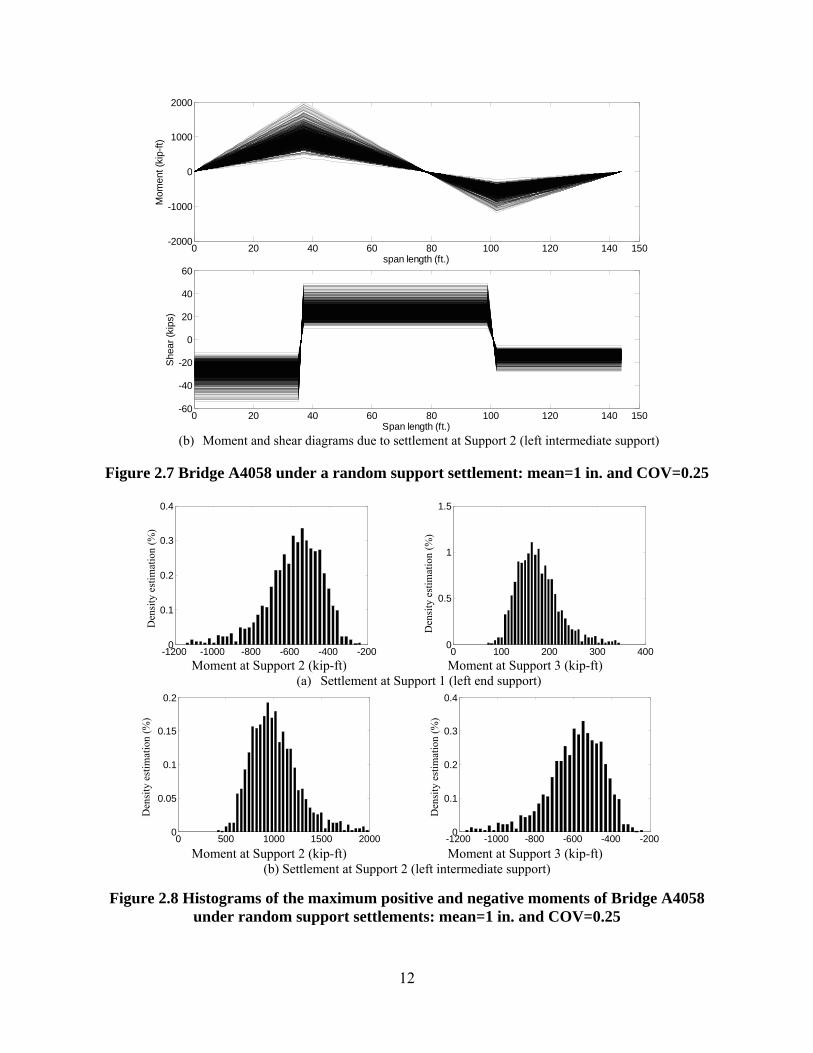
The above observations indicate that, given the moment and shear diagrams due to a 1-inch settlement at each support individually, the moment and shear of a girder bridge due to combined support actions can be obtained by superimposing the solutions due to each support settlement. For example, the moment and shear of elastic bridges from any settlement at one support can be scaled up and down from those due to a 1-inch settlement at that support. For random settlements, the random properties of the moment and shear forces are the same as those of the random settlement, such as the lognormal distribution and equal coefficient of variation. For complete descriptions, the moment, shear, and reaction due to a 1-inch settlement at each support are included in Appendices A - C. According to the 2007 AASHTO Specification C3.12.6, for load combinations including support settlement, analysis should be repeated for the settlements that occur at individual substructure units or their combinations, creating the most critical force effects in the bridge structure. Therefore the critical force effects due to a combination of simultaneous support settlements are also calculated and shown in Appendices A - C. To illustrate the detailed information that the MATLAB program can provide for bridge analysis, following is a presentation of two example bridges. Both 2-span steel-girder and 3-span prestressed concrete-girder bridges are considered. The steel-girder bridges are continuous for both dead and live load effects. The prestressed concrete-girder bridges are simply supported for dead load effects and continuous for live load effects. Both examples are considered to be continuous structures as far as support settlement effects are concerned. 2.3.1 Example 1: 2-span continuous steel girder bridge Bridge A3101 was analyzed as a two-span continuous steel bridge example. It has two equal spans of 120 ft each. For each interior steel girder, the moment of inertia was taken to be I=68,532 in4 from 0 to 82 ft and from 158 ft to 240 ft, and I=116,536 in4 from 82 ft to 158 ft. Their modulus of elasticity is E=29,000 ksi. The moment and shear diagrams due to a deterministic settlement of 1.0 in. at the center support (Support 2 in Figure 2.2) are presented in Figures 2.3(a) and 2.3(b). The moment and shear diagrams due to random settlements with a mean of 1.0 in. and a COV of 25% at the center support are shown in Figures 2.4(a) and 2.4(b). The random distribution of the maximum moment is presented in Figure 2.5. 2.3.2 Example 2: 3-span continuous prestressed concrete girder bridge Bridge A4058 was analyzed as a 3-span example bridge with prestressed concrete girders. The lengths of the three spans are 37 ft, 65 ft, and 42 ft, respectively. For each interior concrete girder, the moment of inertia and the modulus of elasticity were taken to be I=319,300 in4 and E=3,600 ksi. The moment and shear diagrams due to a 1-inch settlement at the first (left end) and second supports (Supports 1 and 2 in Figure 2.2) are shown in Figures 2.6(a) and 2.6(b). The moment and shear diagrams under a random settlement of mean = 1.0 in. and COV = 25% at the first (left end) and second supports are presented in Figures 2.7(a) and 2.7(b). Each line in the moment and shear diagrams represents one sample of the random settlement variable. The random distributions of the maximum positive moment and maximum negative moment are shown in Figures 2.8(a) and 2.8(b).
9
(a) Moment diagram
(b) Shear diagram
Figure 2.3 Bridge A3101 under a 1-inch center support settlement (Support 2)
(a) Moment diagram
(b) Shear diagram
Figure 2.4 Bridge A3101 under a random center support settlement (Support 2): mean=1 in. and COV=0.25
0 20 40 60 80 100 120 140 160 180 200 220 240-100
0
100
200
300
400
span length (ft.)
0 20 40 60 80 100 120 140 160 180 200 220 240-3
-2
-1
0
1
2
3
span length (ft.)
0 50 100 150 200-200
0
200
400
600
800
span length (ft.)
Mom
ent (
kip-
ft)
0 20 40 60 80 100 120 140 160 180 200 220 240-6
-4
-2
0
2
4
6
Span length (ft.)
She
ar (
kips
)
Mom
ent (
kip-
ft)S
hear
(ki
ps)
10
Figure 2.5 Maximum positive moment distribution of Bridge A3101 under the center
support settlement (Support 2): mean=1 in. and COV=0.25
(a) Moment and shear diagrams due to settlement at Support 1 (left end support)
100 200 300 400 500 600 7000
0.1
0.2
0.3
0.4
0.5
0.6
0.7
Moment (kip-ft)
0 20 40 60 80 100 120 140 150-600
-400
-200
0
200
Span length (ft)
0 20 40 60 80 100 120 140 150-20
-10
0
10
20
Span length (ft)
Mom
ent (
kip-
ft)S
hear
(ki
ps)
Den
sity
est
imat
ion
(%)
11
(b) Moment and shear diagrams due to settlement at Support 2 (left intermediate support)
Figure 2.6 Bridge A4058 under a 1-inch deterministic settlement
(a) Moment and shear diagrams due to settlement at Support 1 (left end support)
0 20 40 60 80 100 120 140 150-1000
-500
0
500
1000
1500
Span length (ft)
0 20 40 60 80 100 120 140 150-30
-20
-10
0
10
20
30
Span length (ft)
0 20 40 60 80 100 120 140 150-1500
-1000
-500
0
500
span length (ft.)
Mom
ent (
kip-
ft)
0 20 40 60 80 100 120 140 150-40
-20
0
20
40
Span length (ft.)
She
ar (
kips
)
Mom
ent (
kip-
ft)S
hear
(ki
ps)
12
(b) Moment and shear diagrams due to settlement at Support 2 (left intermediate support)
Figure 2.7 Bridge A4058 under a random support settlement: mean=1 in. and COV=0.25
Moment at Support 2 (kip-ft) Moment at Support 3 (kip-ft)
(a) Settlement at Support 1 (left end support)
Moment at Support 2 (kip-ft) Moment at Support 3 (kip-ft)
(b) Settlement at Support 2 (left intermediate support)
Figure 2.8 Histograms of the maximum positive and negative moments of Bridge A4058 under random support settlements: mean=1 in. and COV=0.25
0 20 40 60 80 100 120 140 150-2000
-1000
0
1000
2000
span length (ft.)
Mom
ent (
kip-
ft)
0 20 40 60 80 100 120 140 150-60
-40
-20
0
20
40
60
Span length (ft.)
She
ar (
kips
)
-1200 -1000 -800 -600 -400 -2000
0.1
0.2
0.3
0.4
0 100 200 300 4000
0.5
1
1.5
0 500 1000 1500 20000
0.05
0.1
0.15
0.2
-1200 -1000 -800 -600 -400 -2000
0.1
0.2
0.3
0.4
y(
)
Den
sity
est
imat
ion
(%)
Den
sity
est
imat
ion
(%)
Den
sity
est
imat
ion
(%)
Den
sity
est
imat
ion
(%)
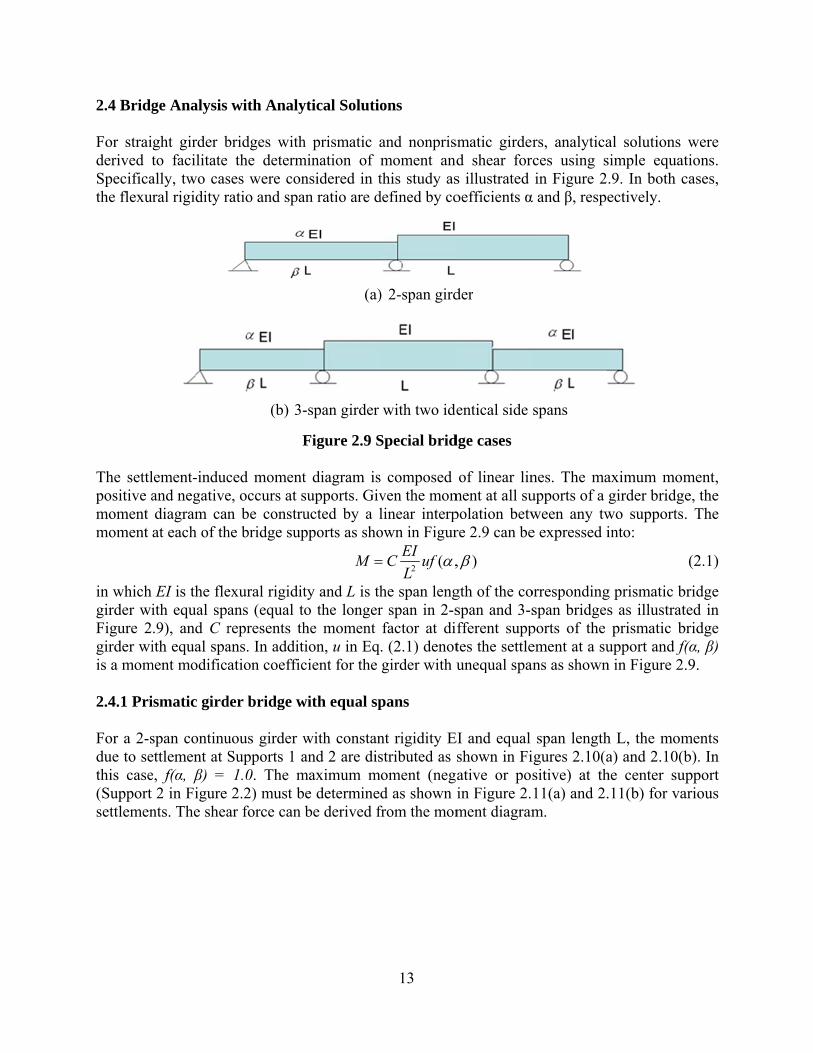
2.4 Bridg For straiderived tSpecificathe flexu
The settlpositive amoment moment
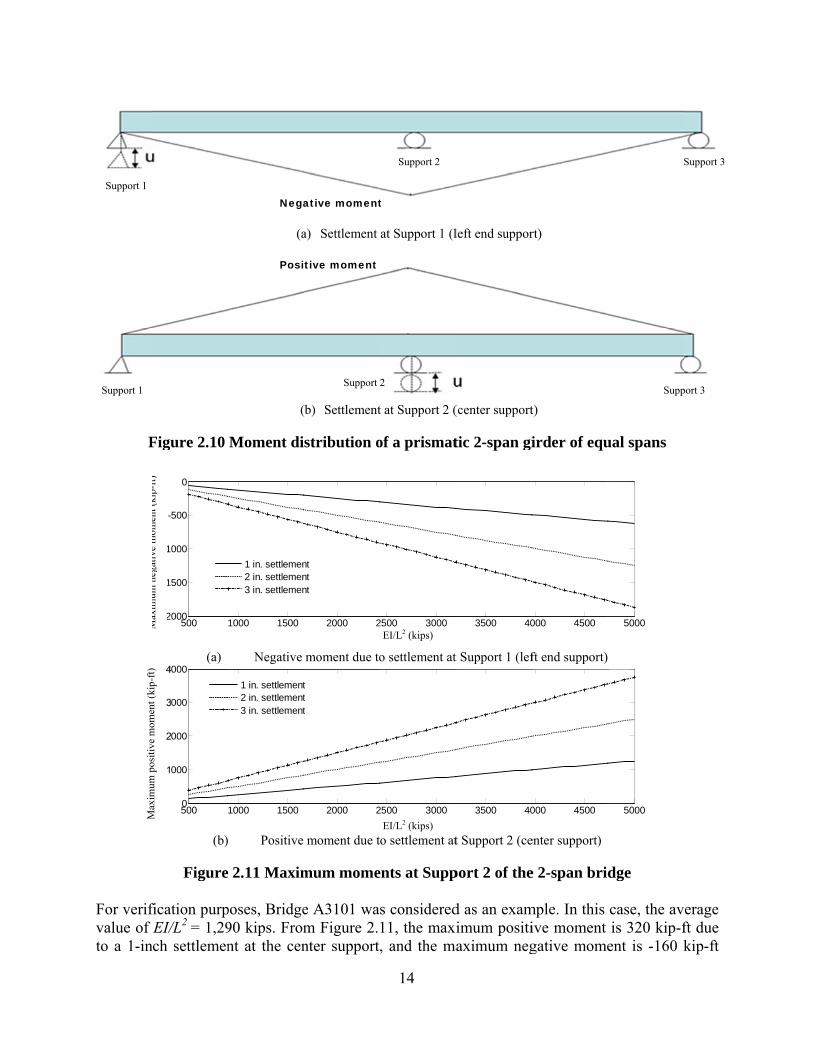
in which girder wiFigure 2girder wiis a mom 2.4.1 Pri For a 2-sdue to sethis case(Support settlemen
ge Analysis
ght girder bto facilitate ally, two casral rigidity r
lement-inducand negativediagram canat each of th
EI is the fleith equal spa.9), and C rith equal spa
ment modifica
ismatic gird
span continuettlement at Se, f(α, β) =
2 in Figure nts. The shea
with Analy
bridges withthe determ
ses were conratio and spa
(b) 3-
F
ced momente, occurs at sn be constru
he bridge sup
exural rigiditans (equal torepresents thans. In additation coeffic
der bridge w
uous girder wSupports 1 a1.0. The m2.2) must b
ar force can
ytical Solutio
h prismatic amination of nsidered in tan ratio are d
(a)
-span girder
Figure 2.9 S
t diagram issupports. Givucted by a lpports as sho
M
ty and L is tho the longerhe moment ion, u in Eqcient for the
with equal sp
with constanand 2 are dis
maximum me determinebe derived f
13
ons
and nonprismoment andthis study as
defined by co
) 2-span gird
with two ide
Special brid
s composed ven the momlinear interpown in Figur
2( ,
EIC uf
L
he span lengr span in 2-sfactor at di. (2.1) denotgirder with u
pans
nt rigidity Estributed as
moment (negd as shown
from the mom
smatic girderd shear fors illustrated oefficients α
der
entical side
dge cases
of linear linment at all supolation betwre 2.9 can be
, )
gth of the cospan and 3-sfferent supptes the settleunequal span
EI and equal shown in Fiative or posin Figure 2.ment diagram
rs, analyticaces using sin Figure 2
α and β, respe
spans
nes. The maupports of a ween any twe expressed i
orrespondingspan bridgesports of the ement at a suans as shown
span lengthigures 2.10(asitive) at th11(a) and 2.m.
al solutions simple equat.9. In both cectively.
aximum momgirder bridg
wo supportsinto:
g prismatic bs as illustratprismatic b
upport and fn in Figure 2
h L, the moma) and 2.10(bhe center su.11(b) for va
were tions. cases,
ment, e, the . The
(2.1)
bridge ted in bridge f(α, β) .9.
ments b). In
upport arious
F
For verifvalue of to a 1-in
Max
imum
posi
tive
mom
ent(
kip-
ft)
Max
imum
nega
tive
mom
ent(
kip
ft)
Support 1
Support 1
Figure 2.10
(a)
(b)
Figure
fication purpEI/L2 = 1,29
nch settlemen
500-2000
-1500
-1000
-500
0
5000
1000
2000
3000
4000
Max
imum
pos
itiv
e m
omen
t (ki
p-ft
) M
axim
um n
egat
ive
mom
ent (
kip-
ft)
(a
(
Moment di
Negative
Positive
2.11 Maxim
poses, Bridge90 kips. Fromnt at the cen
1000 1500
1 in. settlemen2 in. settlemen3 in. settlemen
1000 1500
1 in. settlement2 in. settlement3 in. settlement
Nega
Posi
a) Settlement
(b) Settlement
stribution o
moment due to
moment due t
mum mome
e A3101 wasm Figure 2.nter support,
2000 2
ntntnt
2000 2
ttt
ative moment
tive moment
Support 2
14
at Support 1 (l
t at Support 2 (
of a prismat
o settlement at
o settlement at
ents at Supp
s considered11, the maxi, and the ma
2500 3000
2500 3000
t
Support 2
2
EI/L2 (kips)
EI/L2 (kips)
left end suppor
(center support
tic 2-span gi
t Support 1 (lef
t Support 2 (ce
port 2 of the
d as an examimum positiaximum neg
3500 40
3500 40
rt)
t)
irder of equ
ft end support)
enter support)
e 2-span brid
mple. In this ive moment gative mome
000 4500
000 4500
ual spans
dge
case, the avis 320 kip-f
ent is -160 k
5000
5000
S
Supp
erage ft due kip-ft
Support 3
port 3
due to a Method 1For a 3-distributithis casedeterminthe momare prese
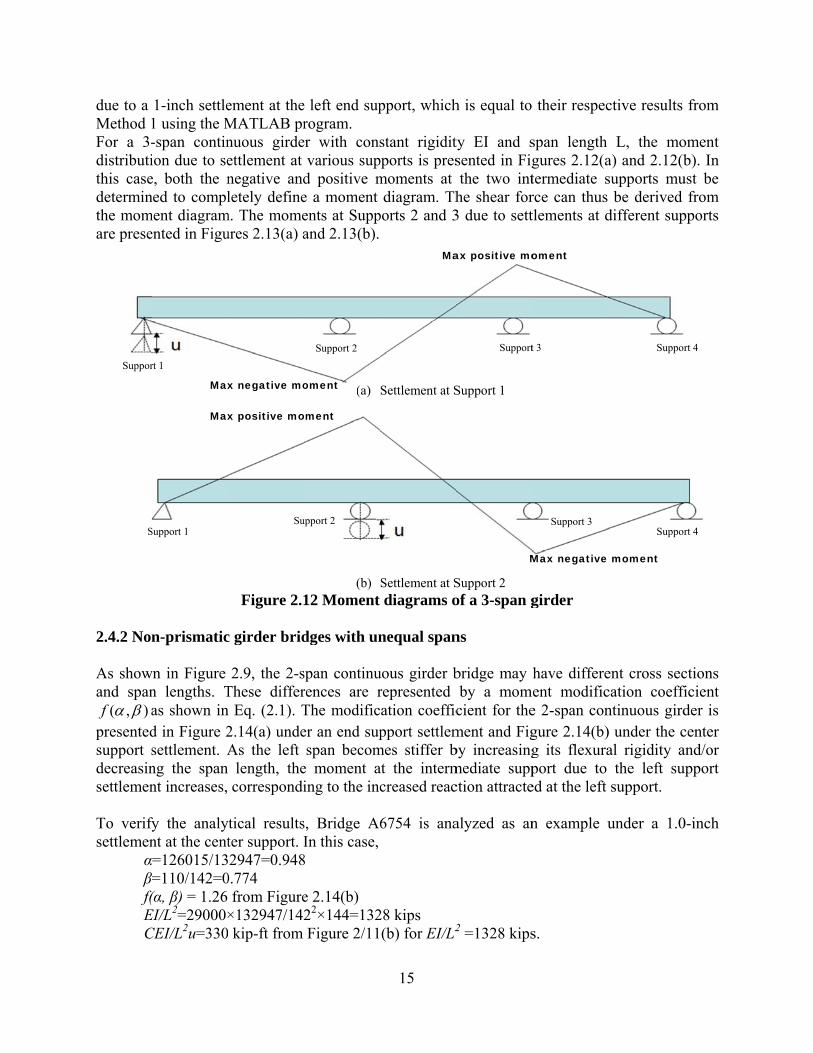
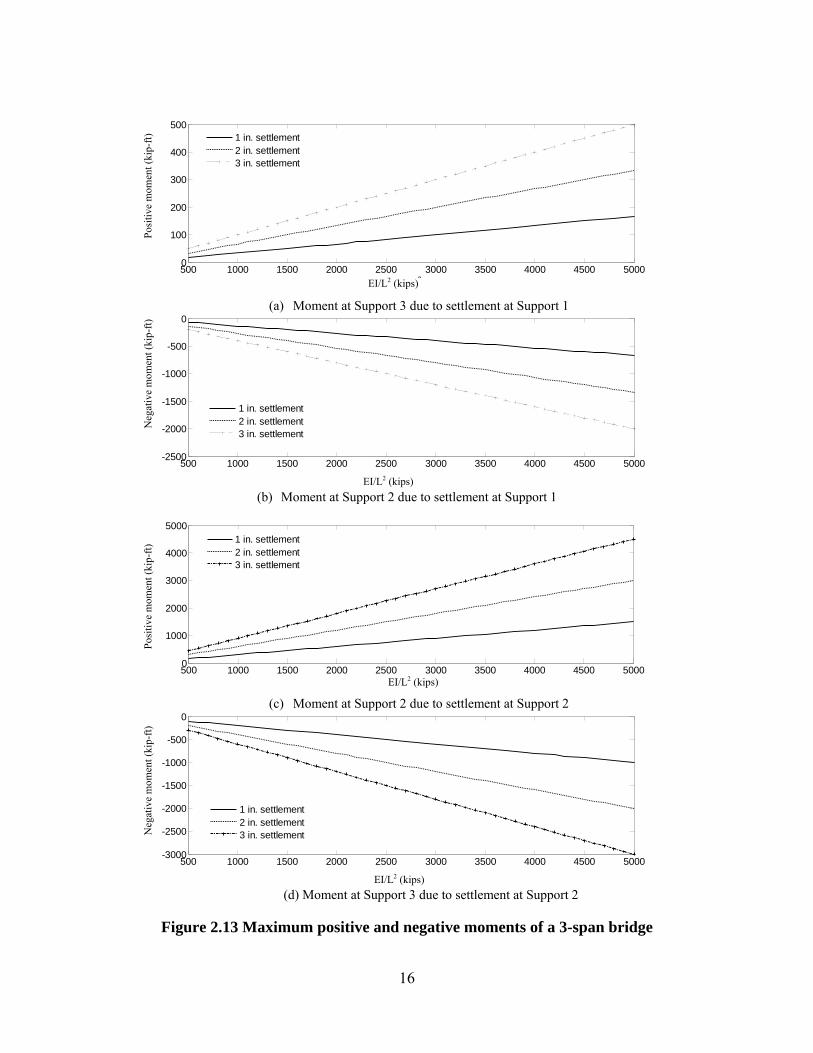
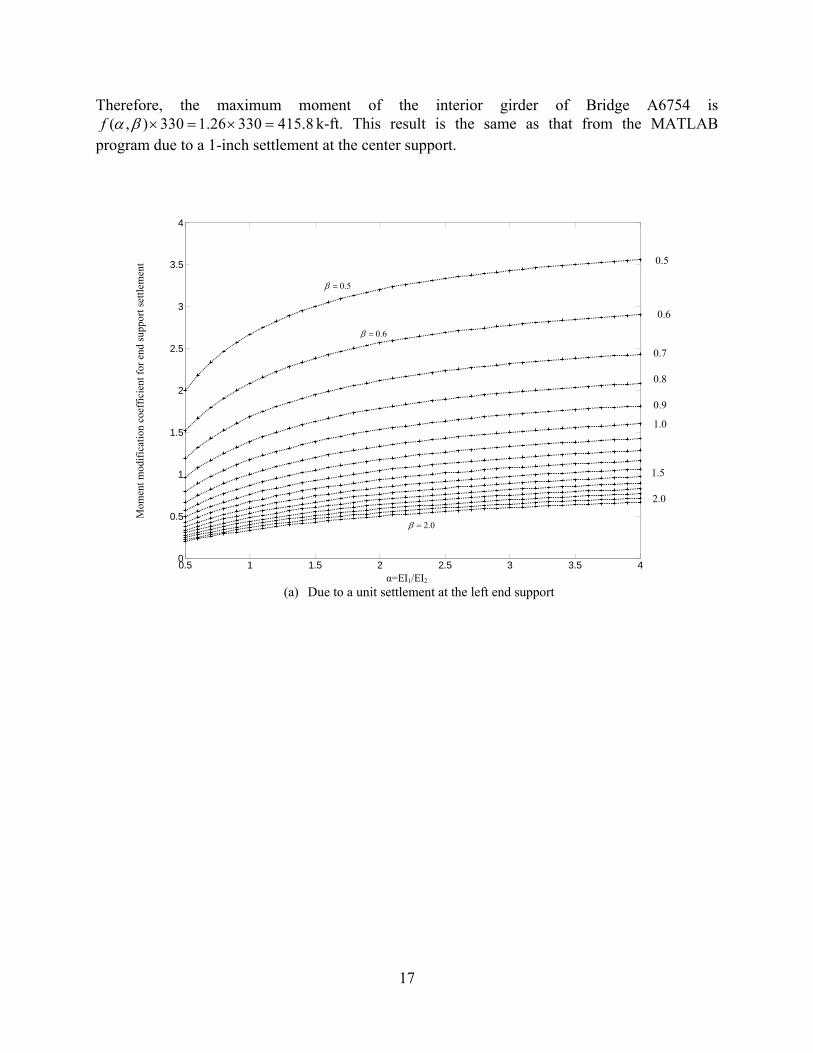
2.4.2 Non As showand span
( , )f apresentedsupport sdecreasinsettlemen To verifysettlemen
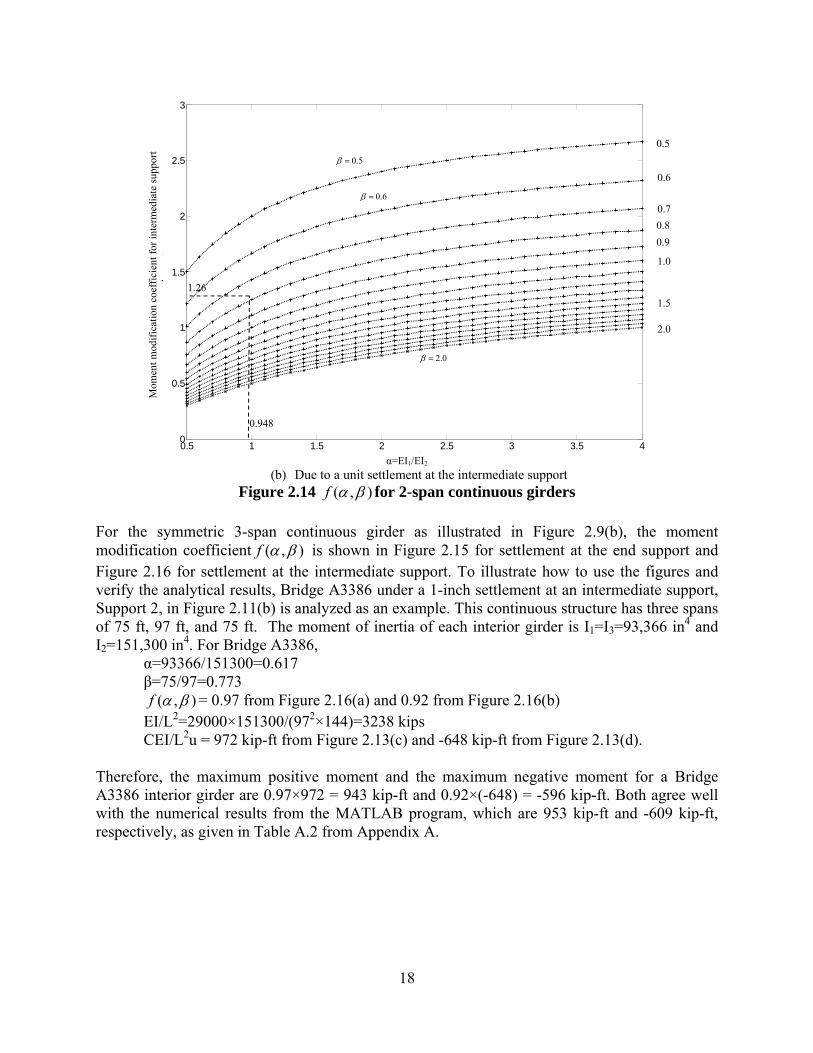
αβ=f(EC
S
Suppor
1-inch settle1 using the M-span continion due to see, both the nned to complment diagramented in Figu
n-prismatic
wn in Figure n lengths. Tas shown ind in Figure 2settlement. Ang the span nt increases,
fy the analynt at the cent=126015/13=110/142=0(α, β) = 1.26
EI/L2=29000×CEI/L2u=330
Support 1
rt 1
Max
Max
ement at theMATLAB prnuous girdeettlement at negative andletely define
m. The momeures 2.13(a) a
Figure 2.1
c girder brid
2.9, the 2-sThese differn Eq. (2.1). T2.14(a) undeAs the left
length, thecorrespondi
ytical resultster support. I2947=0.948
0.774 from Figure
×132947/142 kip-ft from
Su
x negative mo
x positive mo
e left end suprogram.
er with consvarious sup
d positive me a moment ents at Suppand 2.13(b).
(a)
(b) 12 Moment
dges with un
span continurences are rThe modificer an end supspan becom
e moment aing to the inc
s, Bridge A6In this case,
8
e 2.14(b) 22×144=132Figure 2/11
upport 2
Support 2
oment
oment
15
pport, which
stant rigiditpports is presmoments at
diagram. Thports 2 and 3
Settlement at S
Settlement at Sdiagrams o
nequal span
uous girder brepresented ation coefficpport settlem
mes stiffer bat the intermcreased reac
6754 is ana
28 kips (b) for EI/L2
Ma
h is equal to
ty EI and ssented in Figthe two int
he shear for3 due to sett
Support 1
Support 2 of a 3-span g
ns
bridge may by a momcient for the
ment and Figby increasingmediate suppction attracte
alyzed as an
2 =1328 kips
Support
ax positive mo
M
their respec
span length gures 2.12(atermediate srce can thus tlements at d
girder
have differeent modifice 2-span congure 2.14(b)g its flexuraport due to ed at the left
n example u
s.
Support 3
t 3
oment
Max negative
ctive results
L, the moa) and 2.12(bsupports mu
be derived different sup
ent cross seccation coeffintinuous gird) under the cal rigidity a
the left susupport.
under a 1.0
Suppor
Suppor
moment
from
oment b). In
ust be from
pports
ctions ficient der is center and/or upport
0-inch
rt 4
rt 4
16
(a) Moment at Support 3 due to settlement at Support 1
(b) Moment at Support 2 due to settlement at Support 1
(c) Moment at Support 2 due to settlement at Support 2
(d) Moment at Support 3 due to settlement at Support 2
Figure 2.13 Maximum positive and negative moments of a 3-span bridge
500 1000 1500 2000 2500 3000 3500 4000 4500 50000
100
200
300
400
500
2
1 in. settlement2 in. settlement3 in. settlement
500 1000 1500 2000 2500 3000 3500 4000 4500 5000-2500
-2000
-1500
-1000
-500
0
2
1 in. settlement2 in. settlement3 in. settlement
500 1000 1500 2000 2500 3000 3500 4000 4500 50000
1000
2000
3000
4000
5000
2
1 in. settlement2 in. settlement3 in. settlement
500 1000 1500 2000 2500 3000 3500 4000 4500 5000-3000
-2500
-2000
-1500
-1000
-500
0
2
1 in. settlement2 in. settlement3 in. settlement
Pos
itiv
e m
omen
t (ki
p-ft
) N
egat
ive
mom
ent (
kip-
ft)
Pos
itiv
e m
omen
t (ki
p-ft
) N
egat
ive
mom
ent (
kip-
ft)
EI/L2 (kips)
EI/L2 (kips)
EI/L2 (kips)
EI/L2 (kips)
17
Therefore, the maximum moment of the interior girder of Bridge A6754 is ( , ) 330 1.26 330 415.8f k-ft. This result is the same as that from the MATLAB
program due to a 1-inch settlement at the center support.
α=EI1/EI2
(a) Due to a unit settlement at the left end support
0.5 1 1.5 2 2.5 3 3.5 40
0.5
1
1.5
2
2.5
3
3.5
4
0.5
0.6
2.0
Mom
ent m
odif
icat
ion
coef
fici
ent f
or e
nd s
uppo
rt s
ettl
emen
t
0.7
0.8
0.9
1.0
1.5
2.0
0.5
0.6
18
α=EI1/EI2
(b) Due to a unit settlement at the intermediate support Figure 2.14 ( , )f for 2-span continuous girders
For the symmetric 3-span continuous girder as illustrated in Figure 2.9(b), the moment modification coefficient ( , )f is shown in Figure 2.15 for settlement at the end support and Figure 2.16 for settlement at the intermediate support. To illustrate how to use the figures and verify the analytical results, Bridge A3386 under a 1-inch settlement at an intermediate support, Support 2, in Figure 2.11(b) is analyzed as an example. This continuous structure has three spans of 75 ft, 97 ft, and 75 ft. The moment of inertia of each interior girder is I1=I3=93,366 in4 and I2=151,300 in4. For Bridge A3386,
α=93366/151300=0.617 β=75/97=0.773
( , )f = 0.97 from Figure 2.16(a) and 0.92 from Figure 2.16(b) EI/L2=29000×151300/(972×144)=3238 kips CEI/L2u = 972 kip-ft from Figure 2.13(c) and -648 kip-ft from Figure 2.13(d).
Therefore, the maximum positive moment and the maximum negative moment for a Bridge A3386 interior girder are 0.97×972 = 943 kip-ft and 0.92×(-648) = -596 kip-ft. Both agree well with the numerical results from the MATLAB program, which are 953 kip-ft and -609 kip-ft, respectively, as given in Table A.2 from Appendix A.
0.5 1 1.5 2 2.5 3 3.5 40
0.5
1
1.5
2
2.5
3
EI1/EI2
Mom
ent m
odif
icat
ion
coef
fici
ent f
or in
term
edia
te s
uppo
rt
ttl
t0.5
0.6
2.0
0.7
0.8
0.9
1.0
1.5
2.0
0.5
0.6
0.948
1.26
19
α=EI1/EI2
(a) For negative moment at Support 2
α=EI1/EI2
(b) For positive moment at Support 3 Figure 2.15 ( , )f for 3-span continuous interior girders under settlement at Support 1
(left end support)
α=EI1/EI2
(a) For positive moment at support 2
α=EI1/EI2
(b) For negative moment at support 3 Figure 2.16 ( , )f for 3-span continuous interior girders under settlement at Support 2
(left intermediate support)
0.1 0.2 0.3 0.4 0.5 0.6 0.7 0.8 0.9 10
1
2
3
4
5
6
ti f EI1 f EI2
0.1 0.2 0.3 0.4 0.5 0.6 0.7 0.8 0.9 10
1
2
3
4
ti f EI1 f EI2
0.1 0.2 0.3 0.4 0.5 0.6 0.7 0.8 0.9 10
0.5
1
1.5
2
2.5
3
0.1 0.2 0.3 0.4 0.5 0.6 0.7 0.8 0.9 10
0.5
1
1.5
2
2.5
0.4
1.0
0.4
1.0
0.4
1.0
1.0
0.4
f (α
, β)
f (α
, β)
0.6
0.7
0.4
0.5
1.0
0.6
0.7
0.4
0.5
1.0
f (α
, β)
f (α
, β)
0.6
0.4
0.5
1.0
0.6
0.4
0.5
1.0
0.617
0.97
0.92
0.617
2.5 Bridg ANSYS involvinggeometryThe varicharacterGaussiandefined iparametefunction either ramethods. In this stvariable bridges software.maximumthree briintermedAppendix
ge Analysis
has implemg uncertain y, material piations of trized by then and lognorn the softwa
ers. During aof the set ofndomly by .
tudy, only thand all stru(A3848, A6. The modem positive aidges under
diate (secondx D.
(a) B
Unit settleme
with ANSY
mented a prostructural property, andthese input eir distributrmal. Any iare by their ca probabilistif random inpMonte Carl
he support suctural prope6477, and Aels of these and negative
a random d) support. T
ridge A3848
Figure 2.1
ent
YS Probabil
obabilistic dproperties and boundary c
parameters tion type winterdependecorrelation cic analysis, Aput variableslo simulatio
settlement aserties were cA6723) wer
bridges aree moments osettlement
The detailed
7 Models of
Unit settlement
20
listic Design
esign procednd/or externondition are
are definewith given mencies betwecoefficients. ANSYS coms. The valuesons or as pr
s part of theconsidered ire analyzed e shown in of interior gof 1.0-inch probabilistic
(c) Bridge A6
f curved bri
Us
n Software
dure for comnal loads. The defined in ted as randomean and seen random The results a
mputes the ras for the inpurescribed sa
e external loin a determi
with the AFigure 2.1
girders are smean and
c results of
(b) Brid
6477
idges with A
Unit settlement
mponent or he input parthe ANSYS om input vastandard deinput varia
are defined aandom outpuut variables
amples by R
ads was treainistic fashioANSYS pro7. The mea
summarized a COV of these bridge
dge A6723
ANSYS
system anarameters succomputer mariables and
eviation, sucables can alsas random out parametercan be gene
Response Su
ated as a ranon. Three cuobabilistic dan values oin Table 2.0.25 at the
es are report
alyses ch as
model. d are ch as so be
output s as a
erated urface
ndom urved
design of the .2 for e left ted in
Ta
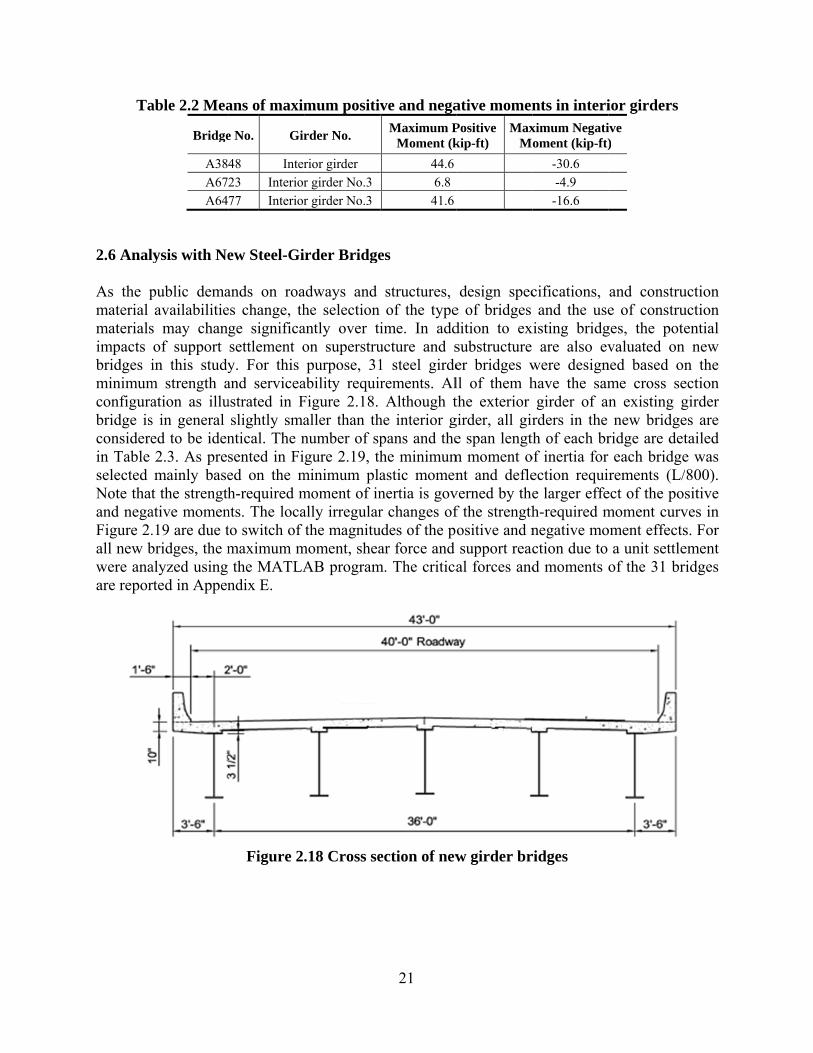
2.6 Anal As the pmaterial materialsimpacts bridges iminimumconfigurabridge isconsiderein Table selected Note thatand negaFigure 2.all new bwere anaare repor
able 2.2 Mea
Bridge
A38A67A64
lysis with Ne
public demaavailabilitie
s may chanof support in this study
m strength aation as illus in general ed to be iden2.3. As premainly baset the strength
ative momen.19 are due tbridges, the malyzed using rted in Appen
ans of maxim
e No. Gir
48 Inter23 Interior77 Interior
ew Steel-Gi
ands on roaes change, thge significasettlement oy. For this and serviceaustrated in F
slightly smantical. The nsented in Fied on the mh-required m
nts. The locato switch of maximum mthe MATLA
ndix E.
Figure 2
mum positiv
rder No.
rior girder r girder No.3 r girder No.3
irder Bridge
adways and he selection antly over tion superstrupurpose, 31
ability requirFigure 2.18. aller than thnumber of spgure 2.19, th
minimum plamoment of inally irregularthe magnitu
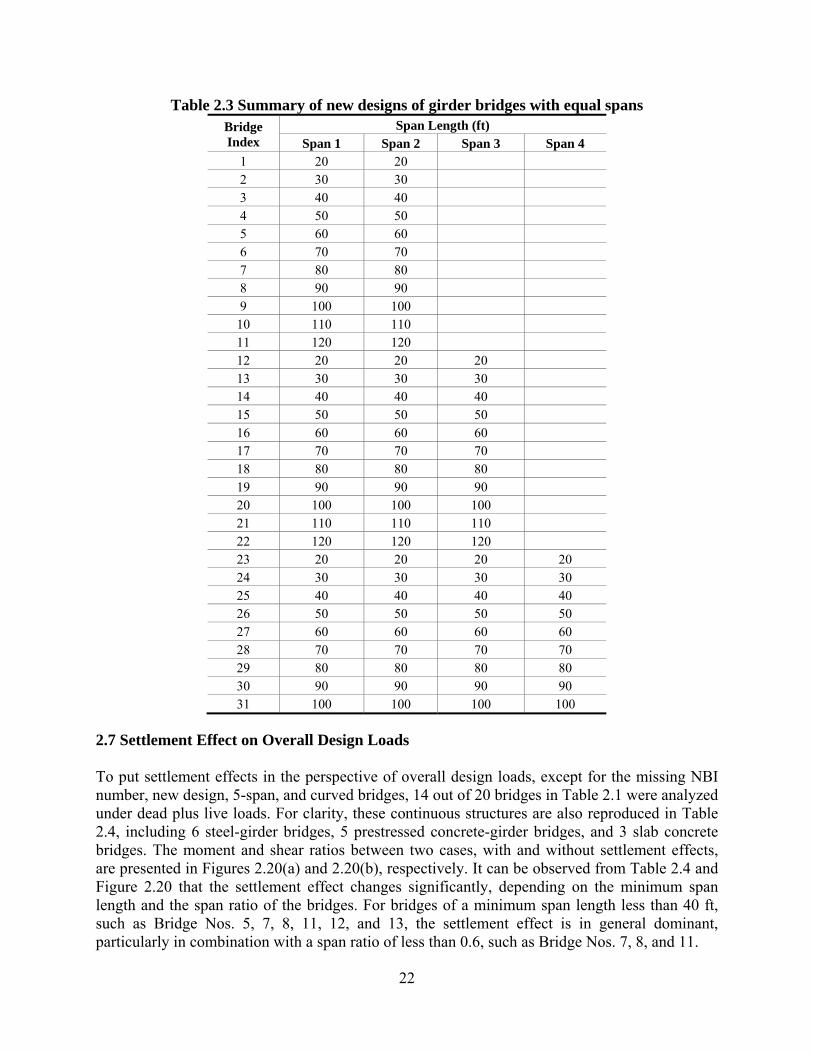
moment, sheaAB program
.18 Cross se
21
ve and negaMaximum P
Moment (k44.66.8
41.6
es
structures, of the type
ime. In adducture and s1 steel girderements. AlAlthough t
he interior gpans and thehe minimumastic momennertia is govr changes of
udes of the par force and
m. The critica
ection of new
ative momenPositive kip-ft)
MaxM
design spece of bridges dition to exsubstructure er bridges wll of them hthe exterior girder, all gire span lengt
m moment ont and defle
verned by thef the strengthositive and nsupport reacal forces and
w girder br
nts in interiximum Negatioment (kip-ft)
-30.6 -4.9 -16.6
cifications, and the use
xisting bridg are also evwere designhave the samgirder of a
rders in the th of each brof inertia for ection requie larger effeh-required mnegative moction due to d moments o
ridges
ior girdersive )
and construe of constru
ges, the potevaluated on
ned based onme cross sen existing gnew bridge
ridge are deteach bridge
rements (L/ect of the pomoment curvoment effects
a unit settleof the 31 br
uction uction ential
n new n the
ection girder es are tailed e was /800). sitive
ves in s. For ement ridges
22
Table 2.3 Summary of new designs of girder bridges with equal spans Bridge Index
Span Length (ft) Span 1 Span 2 Span 3 Span 4
1 20 20 2 30 30 3 40 40 4 50 50 5 60 60 6 70 70 7 80 80 8 90 90 9 100 100
10 110 110 11 120 120 12 20 20 20 13 30 30 30 14 40 40 40 15 50 50 50 16 60 60 60 17 70 70 70 18 80 80 80 19 90 90 90 20 100 100 100 21 110 110 110 22 120 120 120 23 20 20 20 20 24 30 30 30 30 25 40 40 40 40 26 50 50 50 50 27 60 60 60 60 28 70 70 70 70 29 80 80 80 80 30 90 90 90 90 31 100 100 100 100
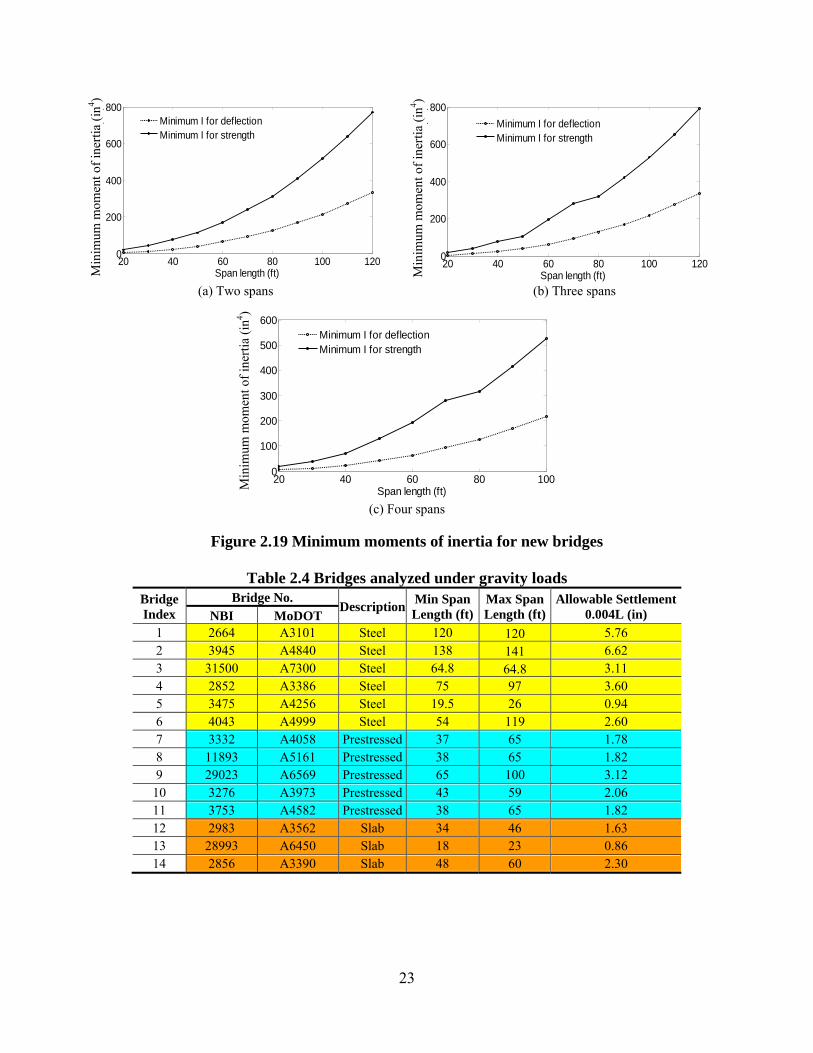
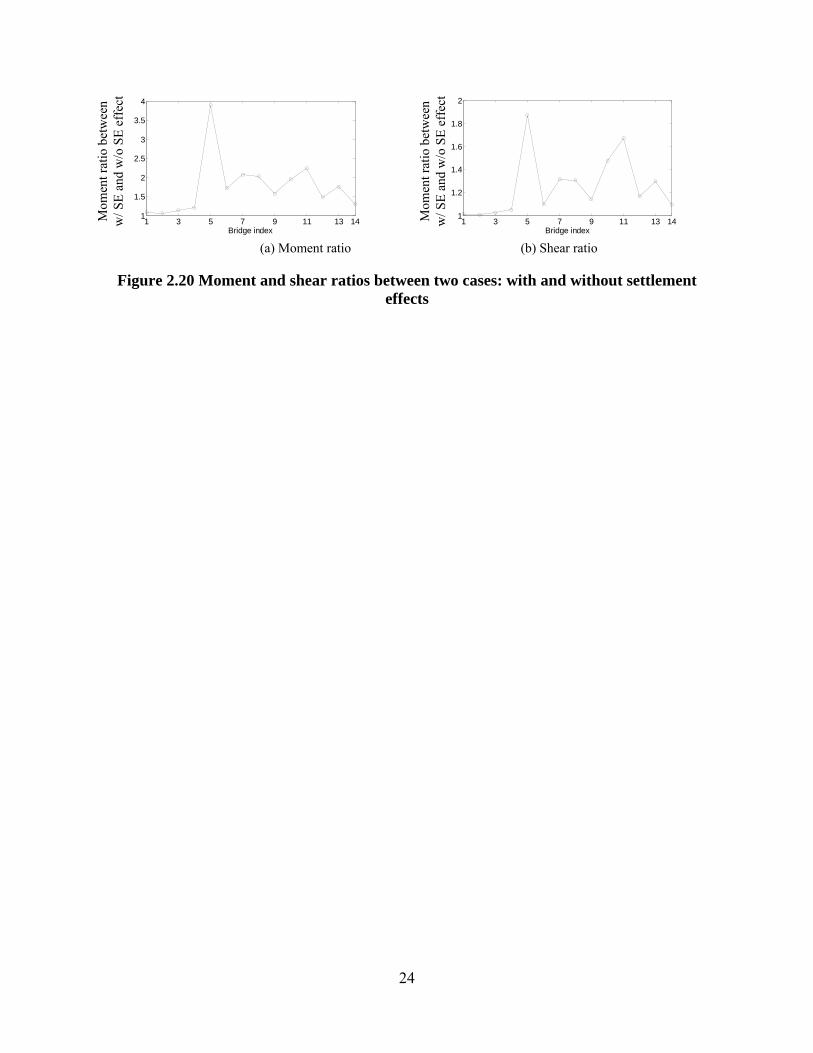
2.7 Settlement Effect on Overall Design Loads To put settlement effects in the perspective of overall design loads, except for the missing NBI number, new design, 5-span, and curved bridges, 14 out of 20 bridges in Table 2.1 were analyzed under dead plus live loads. For clarity, these continuous structures are also reproduced in Table 2.4, including 6 steel-girder bridges, 5 prestressed concrete-girder bridges, and 3 slab concrete bridges. The moment and shear ratios between two cases, with and without settlement effects, are presented in Figures 2.20(a) and 2.20(b), respectively. It can be observed from Table 2.4 and Figure 2.20 that the settlement effect changes significantly, depending on the minimum span length and the span ratio of the bridges. For bridges of a minimum span length less than 40 ft, such as Bridge Nos. 5, 7, 8, 11, 12, and 13, the settlement effect is in general dominant, particularly in combination with a span ratio of less than 0.6, such as Bridge Nos. 7, 8, and 11.
23
(a) Two spans (b) Three spans
(c) Four spans
Figure 2.19 Minimum moments of inertia for new bridges
Table 2.4 Bridges analyzed under gravity loads
Bridge Index
Bridge No. Description Min Span
Length (ft)Max Span Length (ft)
Allowable Settlement 0.004L (in) NBI MoDOT
1 2664 A3101 Steel 120 120 5.76 2 3945 A4840 Steel 138 141 6.62 3 31500 A7300 Steel 64.8 64.8 3.11 4 2852 A3386 Steel 75 97 3.60 5 3475 A4256 Steel 19.5 26 0.94 6 4043 A4999 Steel 54 119 2.60 7 3332 A4058 Prestressed 37 65 1.78 8 11893 A5161 Prestressed 38 65 1.82 9 29023 A6569 Prestressed 65 100 3.12
10 3276 A3973 Prestressed 43 59 2.06 11 3753 A4582 Prestressed 38 65 1.82 12 2983 A3562 Slab 34 46 1.63 13 28993 A6450 Slab 18 23 0.86 14 2856 A3390 Slab 48 60 2.30
20 40 60 80 100 1200
200
400
600
800
Span length (ft)
()
Minimum I for deflectionMinimum I for strength
20 40 60 80 100 1200
200
400
600
800
Span length (ft)
()
Minimum I for deflectionMinimum I for strength
20 40 60 80 1000
100
200
300
400
500
600
Span length (ft)
Minimum I for deflectionMinimum I for strength
Min
imum
mom
ent o
f in
ertia
(in
4 )
Min
imum
mom
ent o
f in
ertia
(in
4 )
Min
imum
mom
ent o
f in
ertia
(in
4 )
24
(a) Moment ratio (b) Shear ratio
Figure 2.20 Moment and shear ratios between two cases: with and without settlement
effects
1 3 5 7 9 11 13 141
1.5
2
2.5
3
3.5
4
Bridge index1 3 5 7 9 11 13 14
1
1.2
1.4
1.6
1.8
2
Bridge index
Mom
ent r
atio
bet
wee
n w
/ SE
and
w/o
SE
eff
ect
Mom
ent r
atio
bet
wee
n w
/ SE
and
w/o
SE
eff
ect
25
3 STATISTICAL PROPERTIES OF LOADS AND RESISTANCES
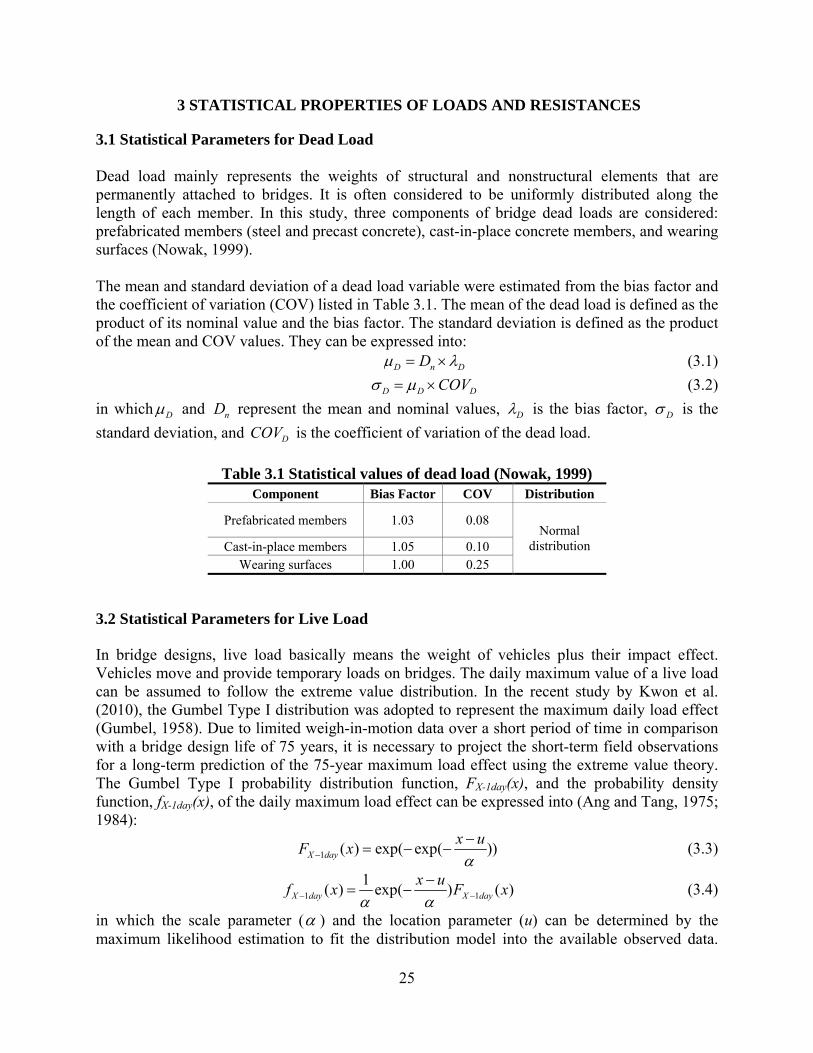
3.1 Statistical Parameters for Dead Load Dead load mainly represents the weights of structural and nonstructural elements that are permanently attached to bridges. It is often considered to be uniformly distributed along the length of each member. In this study, three components of bridge dead loads are considered: prefabricated members (steel and precast concrete), cast-in-place concrete members, and wearing surfaces (Nowak, 1999). The mean and standard deviation of a dead load variable were estimated from the bias factor and the coefficient of variation (COV) listed in Table 3.1. The mean of the dead load is defined as the product of its nominal value and the bias factor. The standard deviation is defined as the product of the mean and COV values. They can be expressed into:
D n DD (3.1)
D D DCOV (3.2)
in which D and nD represent the mean and nominal values, D is the bias factor, D is the
standard deviation, and DCOV is the coefficient of variation of the dead load.
Table 3.1 Statistical values of dead load (Nowak, 1999)
Component Bias Factor COV Distribution
Prefabricated members 1.03 0.08 Normal
distribution Cast-in-place members 1.05 0.10 Wearing surfaces 1.00 0.25
3.2 Statistical Parameters for Live Load In bridge designs, live load basically means the weight of vehicles plus their impact effect. Vehicles move and provide temporary loads on bridges. The daily maximum value of a live load can be assumed to follow the extreme value distribution. In the recent study by Kwon et al. (2010), the Gumbel Type I distribution was adopted to represent the maximum daily load effect (Gumbel, 1958). Due to limited weigh-in-motion data over a short period of time in comparison with a bridge design life of 75 years, it is necessary to project the short-term field observations for a long-term prediction of the 75-year maximum load effect using the extreme value theory. The Gumbel Type I probability distribution function, FX-1day(x), and the probability density function, fX-1day(x), of the daily maximum load effect can be expressed into (Ang and Tang, 1975; 1984):
1 ( ) exp( exp( ))X day
x uF x
(3.3)
1 1
1( ) exp( ) ( )X day X day
x uf x F x
(3.4)
in which the scale parameter ( ) and the location parameter (u) can be determined by the maximum likelihood estimation to fit the distribution model into the available observed data.
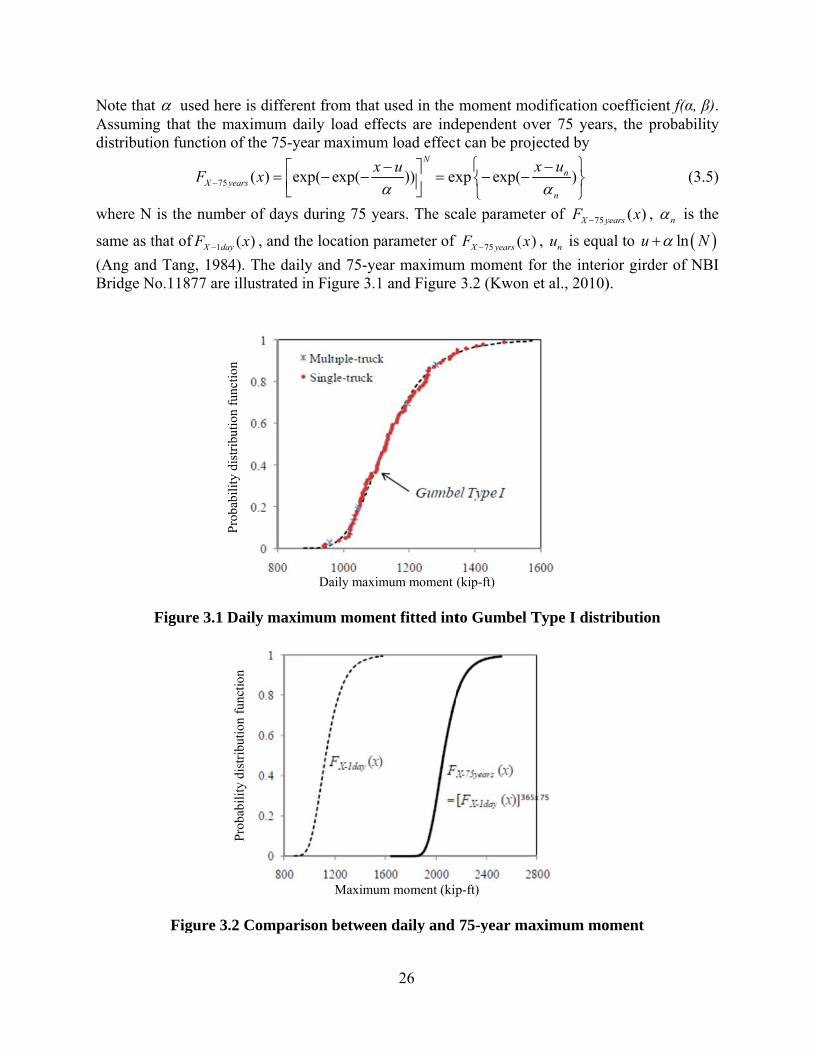
Note thatAssumindistributi
where N
same as t
(Ang andBridge N
t used heng that the mion function
75X yF
is the numb
that of 1X daF
d Tang, 198No.11877 are
Figure 3.1 D
Figure 3
bbi
lidi
ibi
fi
ere is differenmaximum da
of the 75-ye
( ) exyears x ber of days d
( )ay x , and th
4). The daile illustrated i
Daily maxim
.2 Compari
Pro
babi
lity
dist
ribu
tion
func
tion
Pro
babi
lity
dist
ribu
tion
func
tion
nt from that aily load effear maximum
xp( exp(x
during 75 ye
he location p
y and 75-yein Figure 3.1
Daily maxim
mum mome
Maximum
ison between
26
used in the fects are indm load effect
)) exN
x u
ears. The sc
parameter of
ear maximum1 and Figure
mum moment
ent fitted int
m moment (kip
n daily and
moment modependent ovt can be proj
xp exp(
cale paramet
f 75 ( )X yearsF x
m moment f 3.2 (Kwon
(kip-ft)
to Gumbel T
p-ft)
75-year ma
odification cver 75 yearsjected by
)n
n
x u
ter of 75X yF
) , nu is equa
for the interiet al., 2010)
Type I distr
aximum mo
coefficient f(s, the proba
( )years x , n i
al to lnu ior girder of).
ribution
oment
(α, β). ability
(3.5)
is the
n N
f NBI
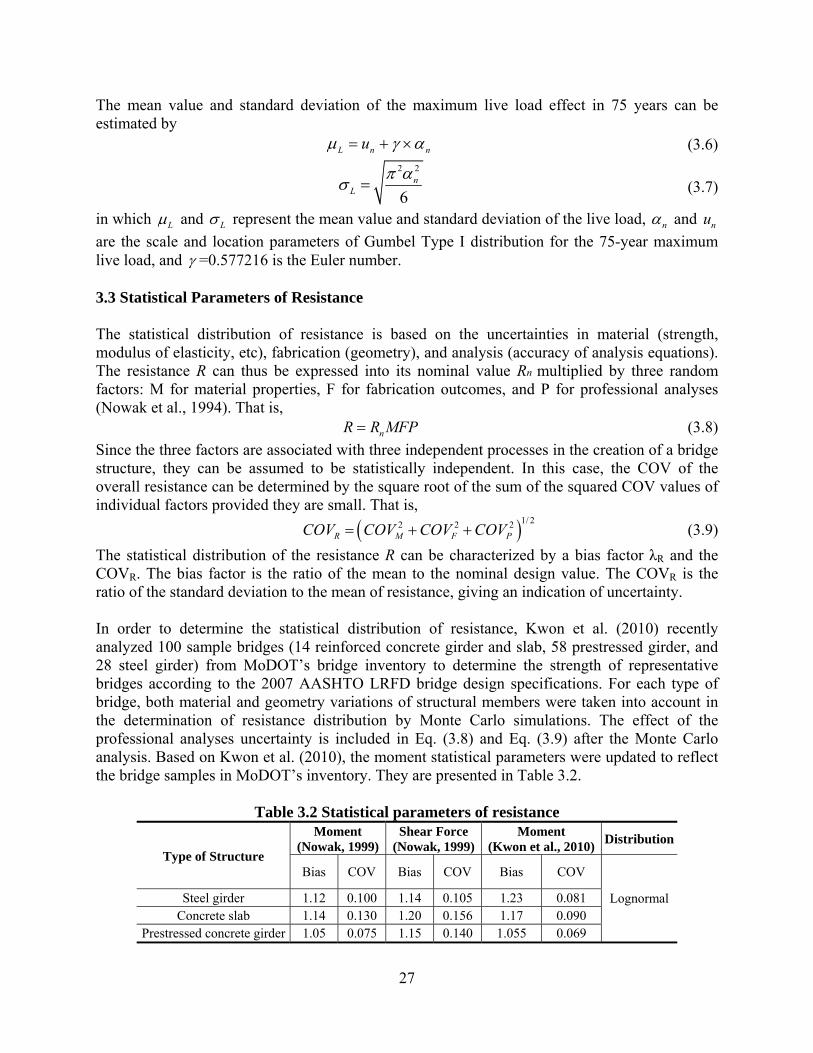
27
The mean value and standard deviation of the maximum live load effect in 75 years can be estimated by
L n nu (3.6) 2 2
6n
L
(3.7)
in which L and L represent the mean value and standard deviation of the live load, n and nu
are the scale and location parameters of Gumbel Type I distribution for the 75-year maximum live load, and =0.577216 is the Euler number.
3.3 Statistical Parameters of Resistance The statistical distribution of resistance is based on the uncertainties in material (strength, modulus of elasticity, etc), fabrication (geometry), and analysis (accuracy of analysis equations). The resistance R can thus be expressed into its nominal value Rn multiplied by three random factors: M for material properties, F for fabrication outcomes, and P for professional analyses (Nowak et al., 1994). That is,
nR R MFP (3.8)
Since the three factors are associated with three independent processes in the creation of a bridge structure, they can be assumed to be statistically independent. In this case, the COV of the overall resistance can be determined by the square root of the sum of the squared COV values of individual factors provided they are small. That is,
1/ 22 2 2R M F PCOV COV COV COV (3.9)
The statistical distribution of the resistance R can be characterized by a bias factor λR and the COVR. The bias factor is the ratio of the mean to the nominal design value. The COVR is the ratio of the standard deviation to the mean of resistance, giving an indication of uncertainty. In order to determine the statistical distribution of resistance, Kwon et al. (2010) recently analyzed 100 sample bridges (14 reinforced concrete girder and slab, 58 prestressed girder, and 28 steel girder) from MoDOT’s bridge inventory to determine the strength of representative bridges according to the 2007 AASHTO LRFD bridge design specifications. For each type of bridge, both material and geometry variations of structural members were taken into account in the determination of resistance distribution by Monte Carlo simulations. The effect of the professional analyses uncertainty is included in Eq. (3.8) and Eq. (3.9) after the Monte Carlo analysis. Based on Kwon et al. (2010), the moment statistical parameters were updated to reflect the bridge samples in MoDOT’s inventory. They are presented in Table 3.2.
Table 3.2 Statistical parameters of resistance
Type of Structure
Moment (Nowak, 1999)
Shear Force (Nowak, 1999)
Moment (Kwon et al., 2010) Distribution
Bias COV Bias COV Bias COV
Lognormal Steel girder 1.12 0.100 1.14 0.105 1.23 0.081 Concrete slab 1.14 0.130 1.20 0.156 1.17 0.090
Prestressed concrete girder 1.05 0.075 1.15 0.140 1.055 0.069
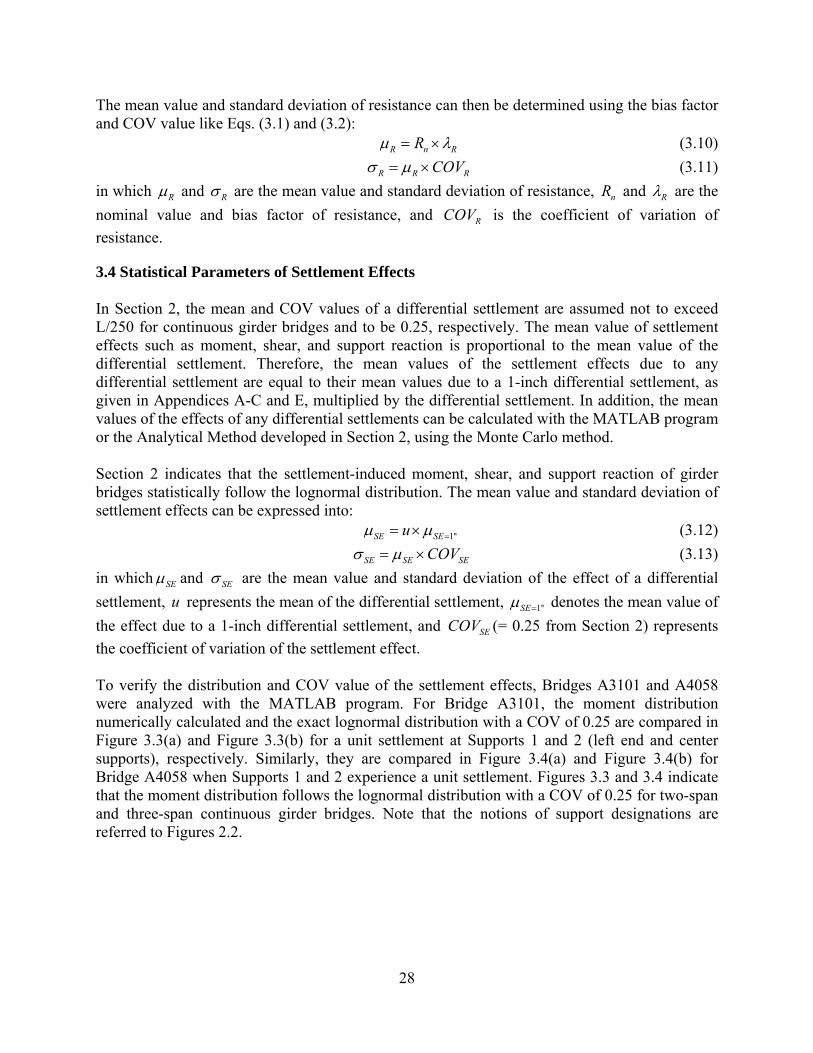
28
The mean value and standard deviation of resistance can then be determined using the bias factor and COV value like Eqs. (3.1) and (3.2):
R n RR (3.10)
R R RCOV (3.11)
in which R and R are the mean value and standard deviation of resistance, nR and R are the
nominal value and bias factor of resistance, and RCOV is the coefficient of variation of
resistance.
3.4 Statistical Parameters of Settlement Effects In Section 2, the mean and COV values of a differential settlement are assumed not to exceed L/250 for continuous girder bridges and to be 0.25, respectively. The mean value of settlement effects such as moment, shear, and support reaction is proportional to the mean value of the differential settlement. Therefore, the mean values of the settlement effects due to any differential settlement are equal to their mean values due to a 1-inch differential settlement, as given in Appendices A-C and E, multiplied by the differential settlement. In addition, the mean values of the effects of any differential settlements can be calculated with the MATLAB program or the Analytical Method developed in Section 2, using the Monte Carlo method. Section 2 indicates that the settlement-induced moment, shear, and support reaction of girder bridges statistically follow the lognormal distribution. The mean value and standard deviation of settlement effects can be expressed into:
1''SE SEu (3.12)
SE SE SECOV (3.13)
in which SE and SE are the mean value and standard deviation of the effect of a differential
settlement, u represents the mean of the differential settlement, 1''SE denotes the mean value of
the effect due to a 1-inch differential settlement, and SECOV (= 0.25 from Section 2) represents
the coefficient of variation of the settlement effect. To verify the distribution and COV value of the settlement effects, Bridges A3101 and A4058 were analyzed with the MATLAB program. For Bridge A3101, the moment distribution numerically calculated and the exact lognormal distribution with a COV of 0.25 are compared in Figure 3.3(a) and Figure 3.3(b) for a unit settlement at Supports 1 and 2 (left end and center supports), respectively. Similarly, they are compared in Figure 3.4(a) and Figure 3.4(b) for Bridge A4058 when Supports 1 and 2 experience a unit settlement. Figures 3.3 and 3.4 indicate that the moment distribution follows the lognormal distribution with a COV of 0.25 for two-span and three-span continuous girder bridges. Note that the notions of support designations are referred to Figures 2.2.
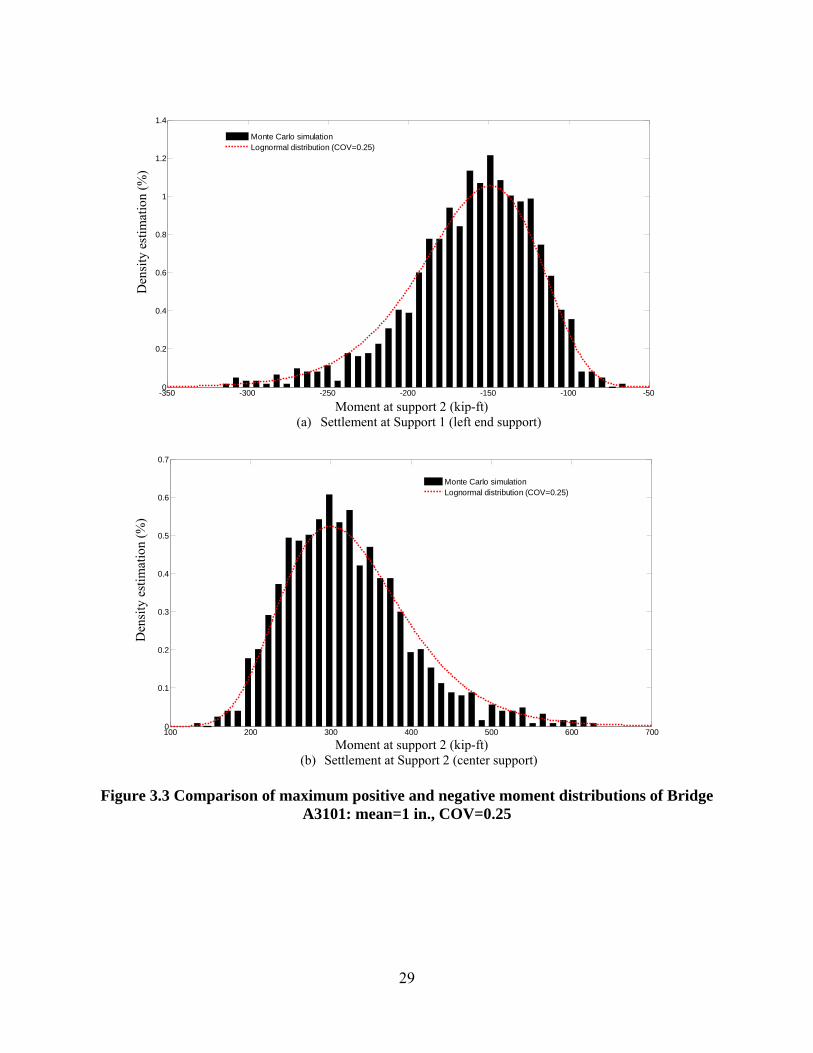
29
Moment at support 2 (kip-ft)
(a) Settlement at Support 1 (left end support)
Moment at support 2 (kip-ft)
(b) Settlement at Support 2 (center support)
Figure 3.3 Comparison of maximum positive and negative moment distributions of Bridge A3101: mean=1 in., COV=0.25
-350 -300 -250 -200 -150 -100 -500
0.2
0.4
0.6
0.8
1
1.2
1.4
( f )
Monte Carlo simulationLognormal distribution (COV=0.25)
100 200 300 400 500 600 7000
0.1
0.2
0.3
0.4
0.5
0.6
0.7
Monte Carlo simulationLognormal distribution (COV=0.25)
Den
sity
est
imat
ion
(%)
Den
sity
est
imat
ion
(%)
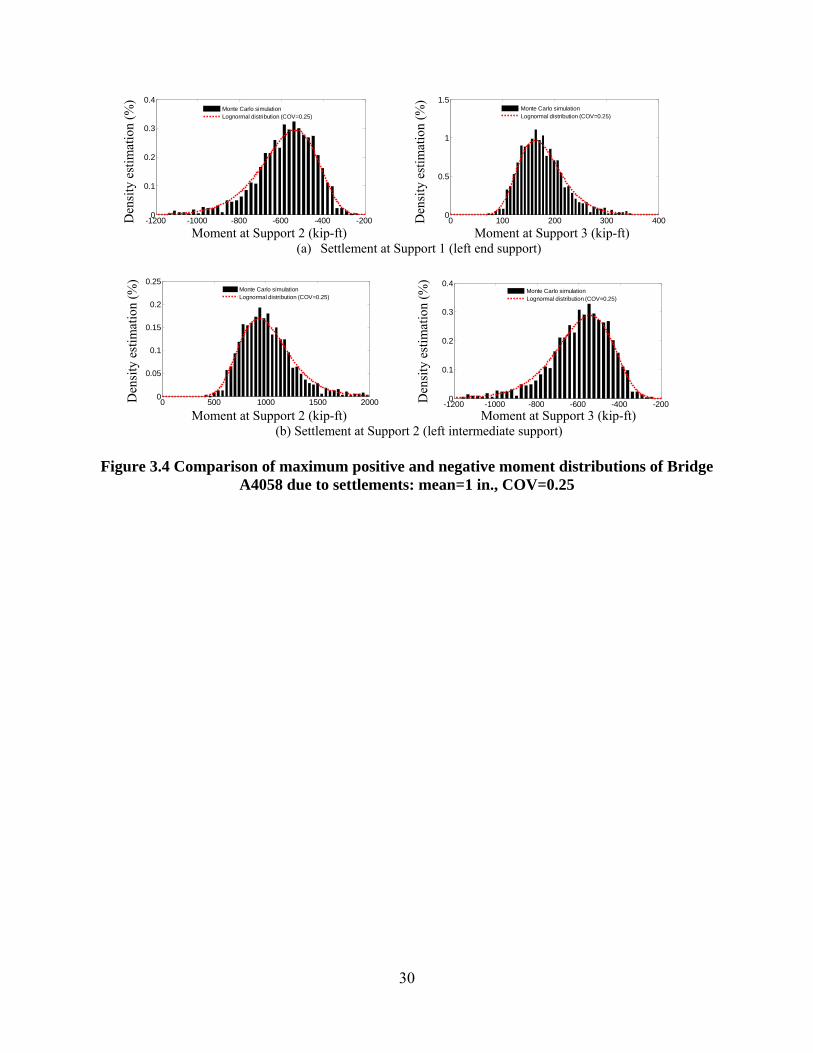
30
Moment at Support 2 (kip-ft) Moment at Support 3 (kip-ft)
(a) Settlement at Support 1 (left end support)
Moment at Support 2 (kip-ft) Moment at Support 3 (kip-ft)
(b) Settlement at Support 2 (left intermediate support)
Figure 3.4 Comparison of maximum positive and negative moment distributions of Bridge A4058 due to settlements: mean=1 in., COV=0.25
-1200 -1000 -800 -600 -400 -2000
0.1
0.2
0.3
0.4
Monte Carlo simulationLognormal distribution (COV=0.25)
0 100 200 300 4000
0.5
1
1.5
Monte Carlo simulationLognormal distribution (COV=0.25)
0 500 1000 1500 20000
0.05
0.1
0.15
0.2
0.25
Monte Carlo simulationLognormal distribution (COV=0.25)
-1200 -1000 -800 -600 -400 -2000
0.1
0.2
0.3
0.4
y(
)
Monte Carlo simulationLognormal distribution (COV=0.25)
Den
sity
est
imat
ion
(%)
Den
sity
est
imat
ion
(%)
Den
sity
est
imat
ion
(%)
Den
sity
est
imat
ion
(%)
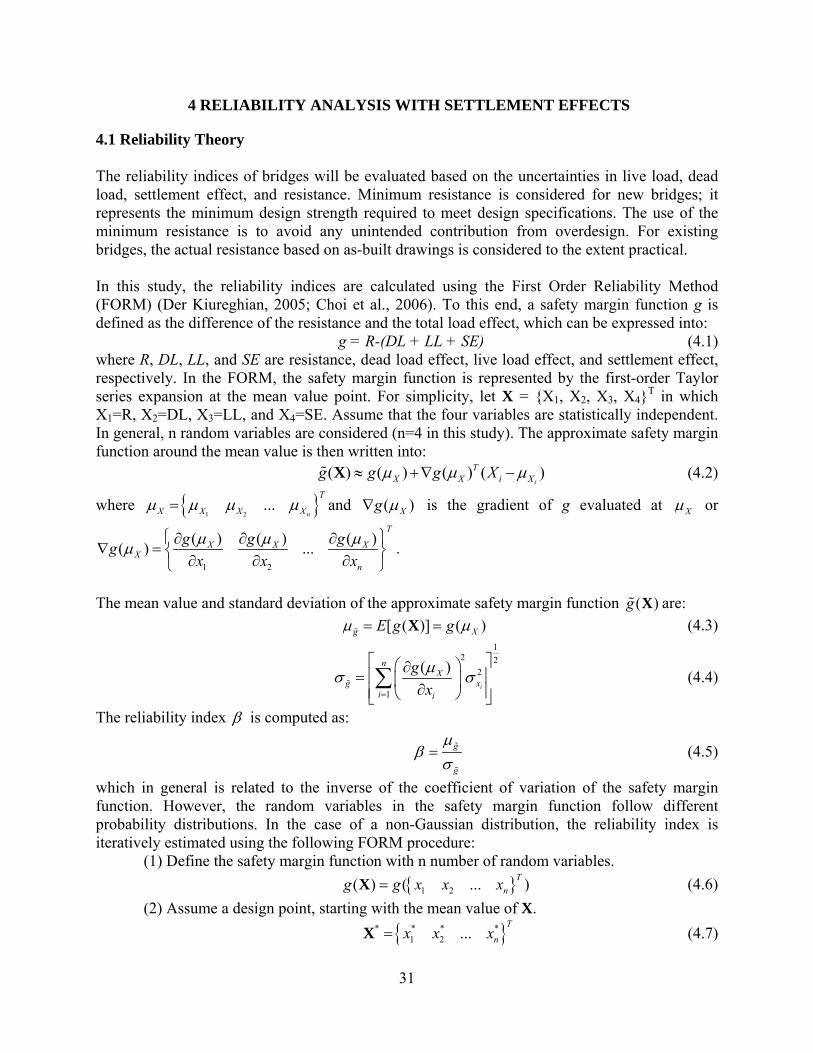
31
4 RELIABILITY ANALYSIS WITH SETTLEMENT EFFECTS
4.1 Reliability Theory The reliability indices of bridges will be evaluated based on the uncertainties in live load, dead load, settlement effect, and resistance. Minimum resistance is considered for new bridges; it represents the minimum design strength required to meet design specifications. The use of the minimum resistance is to avoid any unintended contribution from overdesign. For existing bridges, the actual resistance based on as-built drawings is considered to the extent practical. In this study, the reliability indices are calculated using the First Order Reliability Method (FORM) (Der Kiureghian, 2005; Choi et al., 2006). To this end, a safety margin function g is defined as the difference of the resistance and the total load effect, which can be expressed into:
g = R-(DL + LL + SE) (4.1) where R, DL, LL, and SE are resistance, dead load effect, live load effect, and settlement effect, respectively. In the FORM, the safety margin function is represented by the first-order Taylor series expansion at the mean value point. For simplicity, let X = {X1, X2, X3, X4}
T in which X1=R, X2=DL, X3=LL, and X4=SE. Assume that the four variables are statistically independent. In general, n random variables are considered (n=4 in this study). The approximate safety margin function around the mean value is then written into:
( ) ( ) ( ) ( )i
TX X i Xg g g X X (4.2)
where 1 2
...n
T
X X X X and ( )Xg is the gradient of g evaluated at X or
1 2
( ) ( ) ( )( ) ...
T
X X XX
n
g g gg
x x x
.
The mean value and standard deviation of the approximate safety margin function ( )g X are:
[ ( )] ( )g XE g g X (4.3) 1
2 22
1
( )i
nX
g xi i
g
x
(4.4)
The reliability index is computed as:
g
g
(4.5)
which in general is related to the inverse of the coefficient of variation of the safety margin function. However, the random variables in the safety margin function follow different probability distributions. In the case of a non-Gaussian distribution, the reliability index is iteratively estimated using the following FORM procedure:
(1) Define the safety margin function with n number of random variables.
1 2( ) ( ... )T
ng g x x xX (4.6)
(2) Assume a design point, starting with the mean value of X.
* * * *1 2 ...
T
nx x xX (4.7)
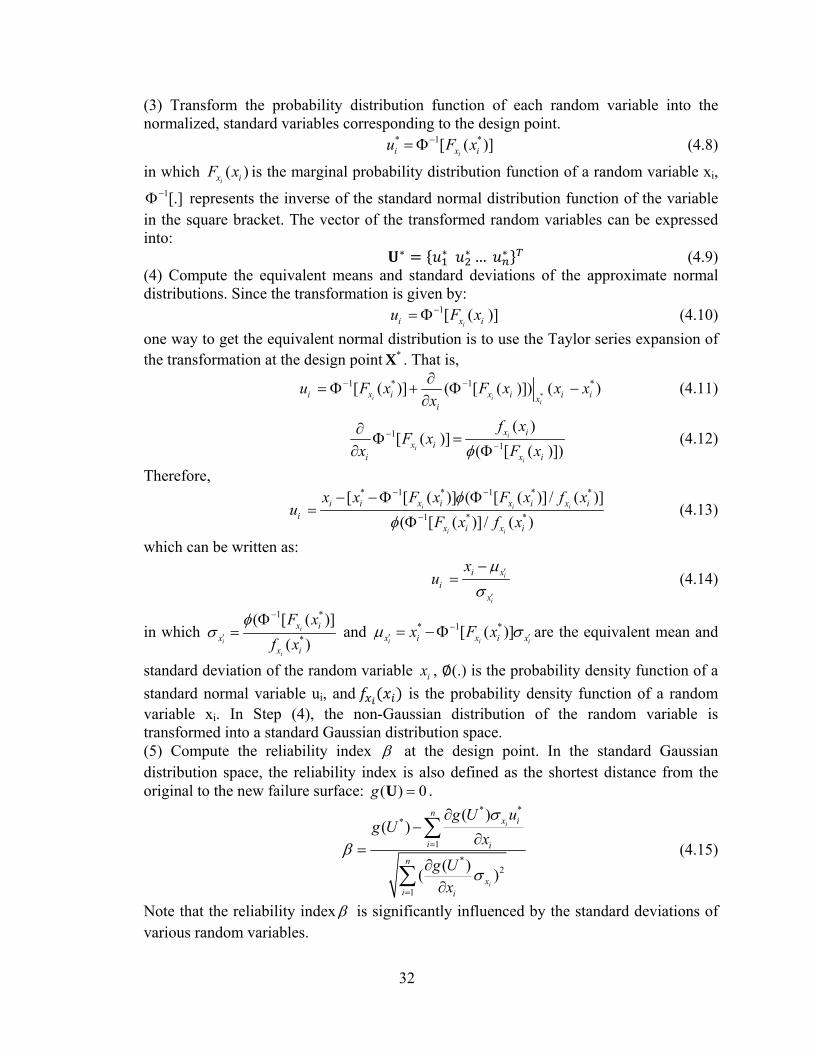
32
(3) Transform the probability distribution function of each random variable into the normalized, standard variables corresponding to the design point.
* 1 *[ ( )]ii x iu F x (4.8)
in which ( )ix iF x is the marginal probability distribution function of a random variable xi,
1[.] represents the inverse of the standard normal distribution function of the variable in the square bracket. The vector of the transformed random variables can be expressed into:
∗ ∗ ∗ … ∗ (4.9) (4) Compute the equivalent means and standard deviations of the approximate normal distributions. Since the transformation is given by:
1[ ( )]ii x iu F x (4.10)
one way to get the equivalent normal distribution is to use the Taylor series expansion of the transformation at the design point *X . That is,
*
1 * 1 *[ ( )] ( [ ( )]) ( )i i
ii x i x i i ix
i
u F x F x x xx
(4.11)
11
( )[ ( )]
( [ ( )])i
i
i
x ix i
i x i
f xF x
x F x
(4.12)
Therefore, * 1 * 1 * *
1 * *
[ [ ( )] ( [ ( )] / ( )]
( [ ( )] / ( )i i i
i i
i i x i x i x ii
x i x i
x x F x F x f xu
F x f x
(4.13)
which can be written as:
i
i
i xi
x
xu
(4.14)
in which 1 *
*
( [ ( )]
( )i
i
i
x ix
x i
F x
f x
and * 1 *[ ( )]
i i ix i x i xx F x are the equivalent mean and
standard deviation of the random variable ix , ∅(.) is the probability density function of a
standard normal variable ui, and is the probability density function of a random variable xi. In Step (4), the non-Gaussian distribution of the random variable is transformed into a standard Gaussian distribution space. (5) Compute the reliability index at the design point. In the standard Gaussian distribution space, the reliability index is also defined as the shortest distance from the original to the new failure surface: ( ) 0g U .
* **
1
*2
1
( )( )
( )( )
i
i
nx i
i i
n
xi i
g U ug U
x
g Ux
(4.15)
Note that the reliability index is significantly influenced by the standard deviations of various random variables.
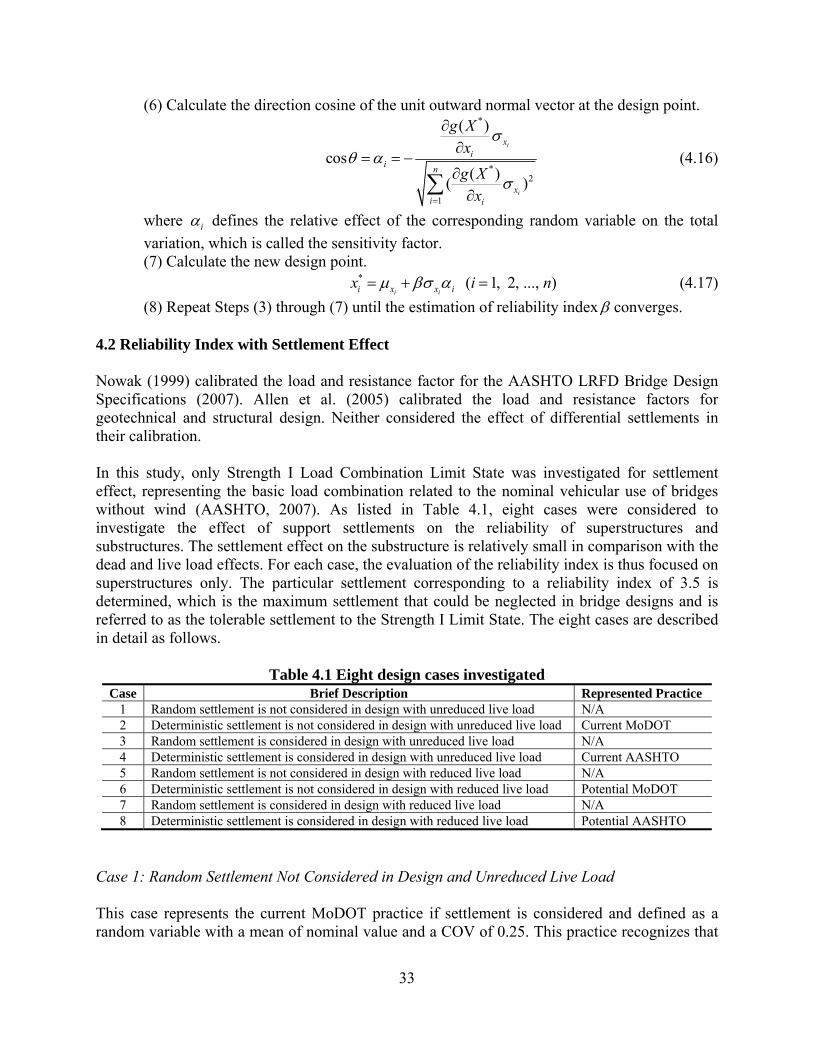
33
(6) Calculate the direction cosine of the unit outward normal vector at the design point. *
*2
1
( )
cos( )
( )
i
i
xi
in
xi i
g Xx
g Xx
(4.16)
where i defines the relative effect of the corresponding random variable on the total
variation, which is called the sensitivity factor. (7) Calculate the new design point.
* ( 1, 2, ..., )i ii x x ix i n (4.17)
(8) Repeat Steps (3) through (7) until the estimation of reliability index converges.
4.2 Reliability Index with Settlement Effect Nowak (1999) calibrated the load and resistance factor for the AASHTO LRFD Bridge Design Specifications (2007). Allen et al. (2005) calibrated the load and resistance factors for geotechnical and structural design. Neither considered the effect of differential settlements in their calibration. In this study, only Strength I Load Combination Limit State was investigated for settlement effect, representing the basic load combination related to the nominal vehicular use of bridges without wind (AASHTO, 2007). As listed in Table 4.1, eight cases were considered to investigate the effect of support settlements on the reliability of superstructures and substructures. The settlement effect on the substructure is relatively small in comparison with the dead and live load effects. For each case, the evaluation of the reliability index is thus focused on superstructures only. The particular settlement corresponding to a reliability index of 3.5 is determined, which is the maximum settlement that could be neglected in bridge designs and is referred to as the tolerable settlement to the Strength I Limit State. The eight cases are described in detail as follows.
Table 4.1 Eight design cases investigated Case Brief Description Represented Practice
1 Random settlement is not considered in design with unreduced live load N/A 2 Deterministic settlement is not considered in design with unreduced live load Current MoDOT 3 Random settlement is considered in design with unreduced live load N/A 4 Deterministic settlement is considered in design with unreduced live load Current AASHTO 5 Random settlement is not considered in design with reduced live load N/A 6 Deterministic settlement is not considered in design with reduced live load Potential MoDOT 7 Random settlement is considered in design with reduced live load N/A 8 Deterministic settlement is considered in design with reduced live load Potential AASHTO
Case 1: Random Settlement Not Considered in Design and Unreduced Live Load This case represents the current MoDOT practice if settlement is considered and defined as a random variable with a mean of nominal value and a COV of 0.25. This practice recognizes that
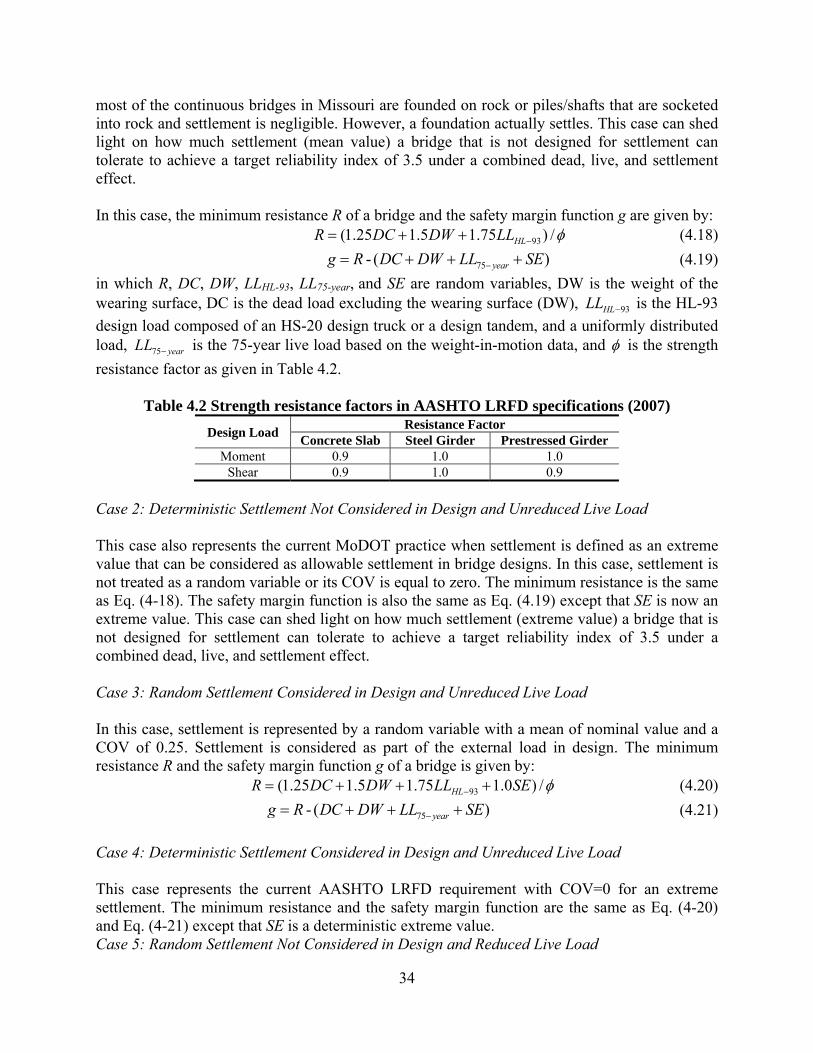
34
most of the continuous bridges in Missouri are founded on rock or piles/shafts that are socketed into rock and settlement is negligible. However, a foundation actually settles. This case can shed light on how much settlement (mean value) a bridge that is not designed for settlement can tolerate to achieve a target reliability index of 3.5 under a combined dead, live, and settlement effect. In this case, the minimum resistance R of a bridge and the safety margin function g are given by:
93(1.25 1.5 1.75 ) /HLR DC DW LL (4.18)
75- ( )yearg R DC DW LL SE (4.19)
in which R, DC, DW, LLHL-93, LL75-year, and SE are random variables, DW is the weight of the wearing surface, DC is the dead load excluding the wearing surface (DW), 93HLLL is the HL-93
design load composed of an HS-20 design truck or a design tandem, and a uniformly distributed load, 75 yearLL is the 75-year live load based on the weight-in-motion data, and is the strength
resistance factor as given in Table 4.2.
Table 4.2 Strength resistance factors in AASHTO LRFD specifications (2007) Design Load Resistance Factor
Concrete Slab Steel Girder Prestressed Girder Moment 0.9 1.0 1.0
Shear 0.9 1.0 0.9
Case 2: Deterministic Settlement Not Considered in Design and Unreduced Live Load This case also represents the current MoDOT practice when settlement is defined as an extreme value that can be considered as allowable settlement in bridge designs. In this case, settlement is not treated as a random variable or its COV is equal to zero. The minimum resistance is the same as Eq. (4-18). The safety margin function is also the same as Eq. (4.19) except that SE is now an extreme value. This case can shed light on how much settlement (extreme value) a bridge that is not designed for settlement can tolerate to achieve a target reliability index of 3.5 under a combined dead, live, and settlement effect. Case 3: Random Settlement Considered in Design and Unreduced Live Load In this case, settlement is represented by a random variable with a mean of nominal value and a COV of 0.25. Settlement is considered as part of the external load in design. The minimum resistance R and the safety margin function g of a bridge is given by:
93(1.25 1.5 1.75 1.0 ) /HLR DC DW LL SE (4.20)
75- ( )yearg R DC DW LL SE (4.21)
Case 4: Deterministic Settlement Considered in Design and Unreduced Live Load This case represents the current AASHTO LRFD requirement with COV=0 for an extreme settlement. The minimum resistance and the safety margin function are the same as Eq. (4-20) and Eq. (4-21) except that SE is a deterministic extreme value. Case 5: Random Settlement Not Considered in Design and Reduced Live Load
35
This case represents a potential MoDOT future practice with reduced live loads when settlement is defined as a random variable. Based on the recent study by Kwon et al. (2010), a live load reduction factor (RF) of 0.7 for moment and 0.85 for shear force was recommended for MoDOT’s adoption in the future. In this case, settlement is defined as a random variable with a mean of nominal value and a COV of 0.25. The minimum resistance R and the safety margin function g are given by:
93(1.25 1.5 1.75 ) /HLR DC DW RF LL (4.22)
75- ( )yearg R DC DW LL SE (4.23)
This case can shed light on how much settlement (mean value) a bridge that is not designed for settlement can tolerate to achieve a target reliability index of 3.5 under a combined dead, live, and settlement effect. Case 6: Deterministic Settlement Not Considered in Design and Reduced Live Load This case also represents a potential MoDOT future practice with reduced live loads when settlement is defined by its extreme value. In this case, SE is a deterministic extreme value. The minimum resistance is the same as Eq. (4.22) and the safety margin function is the same as Eq.(4.23) except that SE is a deterministic extreme value. This case can shed light on how much settlement (extreme value) a bridge that is not designed for settlement can tolerate to achieve a target reliability index of 3.5 under a combined dead, live, and settlement effect. Case 7: Random Settlement Considered in Design and Reduced Live Load In this case, settlement is defined as a random variable with a mean nominal value and a COV of 0.25. Live load is reduced by a live load reduction factor. The minimum resistance and the safety margin limit state function are given by:
93(1.25 1.5 1.75 1.0 ) /HLR DC DW RF LL SE (4.24)
75- ( )yearg R DC DW LL SE (4.25)
Case 8: Deterministic Settlement Considered in Design and Reduced Live Load For this case, the minimum resistance of a bridge and the safety margin function are the same as Eq.(4.24) and Eq. (4.25), except that settlement is a deterministic extreme value.
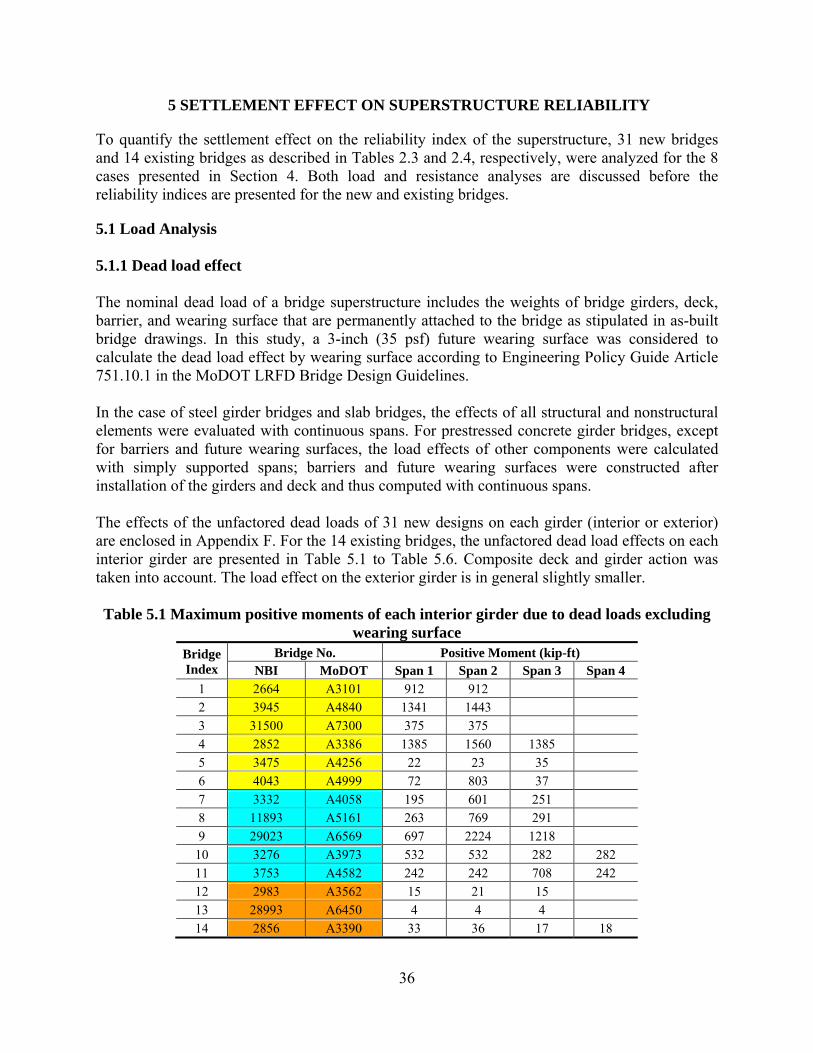
36
5 SETTLEMENT EFFECT ON SUPERSTRUCTURE RELIABILITY
To quantify the settlement effect on the reliability index of the superstructure, 31 new bridges and 14 existing bridges as described in Tables 2.3 and 2.4, respectively, were analyzed for the 8 cases presented in Section 4. Both load and resistance analyses are discussed before the reliability indices are presented for the new and existing bridges.
5.1 Load Analysis 5.1.1 Dead load effect The nominal dead load of a bridge superstructure includes the weights of bridge girders, deck, barrier, and wearing surface that are permanently attached to the bridge as stipulated in as-built bridge drawings. In this study, a 3-inch (35 psf) future wearing surface was considered to calculate the dead load effect by wearing surface according to Engineering Policy Guide Article 751.10.1 in the MoDOT LRFD Bridge Design Guidelines. In the case of steel girder bridges and slab bridges, the effects of all structural and nonstructural elements were evaluated with continuous spans. For prestressed concrete girder bridges, except for barriers and future wearing surfaces, the load effects of other components were calculated with simply supported spans; barriers and future wearing surfaces were constructed after installation of the girders and deck and thus computed with continuous spans. The effects of the unfactored dead loads of 31 new designs on each girder (interior or exterior) are enclosed in Appendix F. For the 14 existing bridges, the unfactored dead load effects on each interior girder are presented in Table 5.1 to Table 5.6. Composite deck and girder action was taken into account. The load effect on the exterior girder is in general slightly smaller. Table 5.1 Maximum positive moments of each interior girder due to dead loads excluding
wearing surface Bridge Index
Bridge No. Positive Moment (kip-ft) NBI MoDOT Span 1 Span 2 Span 3 Span 4
1 2664 A3101 912 912 2 3945 A4840 1341 1443 3 31500 A7300 375 375 4 2852 A3386 1385 1560 1385 5 3475 A4256 22 23 35 6 4043 A4999 72 803 37 7 3332 A4058 195 601 251 8 11893 A5161 263 769 291 9 29023 A6569 697 2224 1218
10 3276 A3973 532 532 282 282 11 3753 A4582 242 242 708 242 12 2983 A3562 15 21 15 13 28993 A6450 4 4 4 14 2856 A3390 33 36 17 18
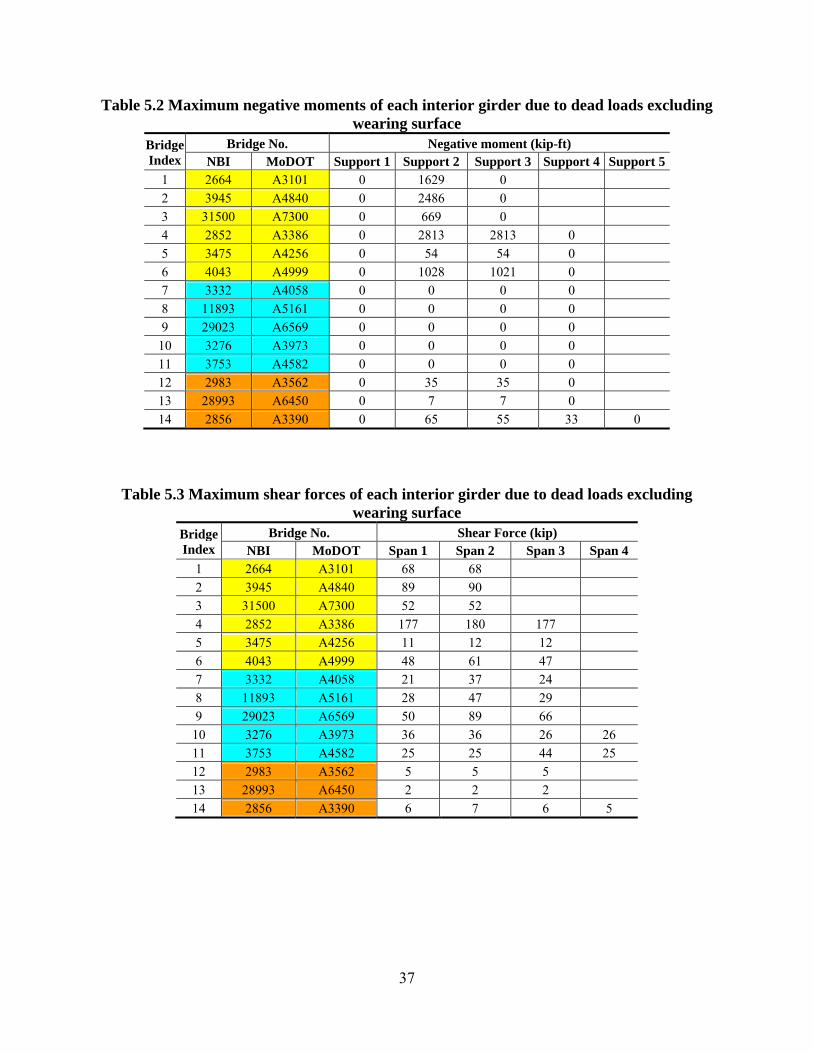
37
Table 5.2 Maximum negative moments of each interior girder due to dead loads excluding wearing surface
Bridge Index
Bridge No. Negative moment (kip-ft) NBI MoDOT Support 1 Support 2 Support 3 Support 4 Support 5
1 2664 A3101 0 1629 0 2 3945 A4840 0 2486 0 3 31500 A7300 0 669 0 4 2852 A3386 0 2813 2813 0 5 3475 A4256 0 54 54 0 6 4043 A4999 0 1028 1021 0 7 3332 A4058 0 0 0 0 8 11893 A5161 0 0 0 0 9 29023 A6569 0 0 0 0
10 3276 A3973 0 0 0 0 11 3753 A4582 0 0 0 0 12 2983 A3562 0 35 35 0 13 28993 A6450 0 7 7 0 14 2856 A3390 0 65 55 33 0
Table 5.3 Maximum shear forces of each interior girder due to dead loads excluding wearing surface
Bridge Index
Bridge No. Shear Force (kip) NBI MoDOT Span 1 Span 2 Span 3 Span 4
1 2664 A3101 68 68 2 3945 A4840 89 90 3 31500 A7300 52 52 4 2852 A3386 177 180 177 5 3475 A4256 11 12 12 6 4043 A4999 48 61 47 7 3332 A4058 21 37 24 8 11893 A5161 28 47 29 9 29023 A6569 50 89 66
10 3276 A3973 36 36 26 26 11 3753 A4582 25 25 44 25 12 2983 A3562 5 5 5 13 28993 A6450 2 2 2 14 2856 A3390 6 7 6 5
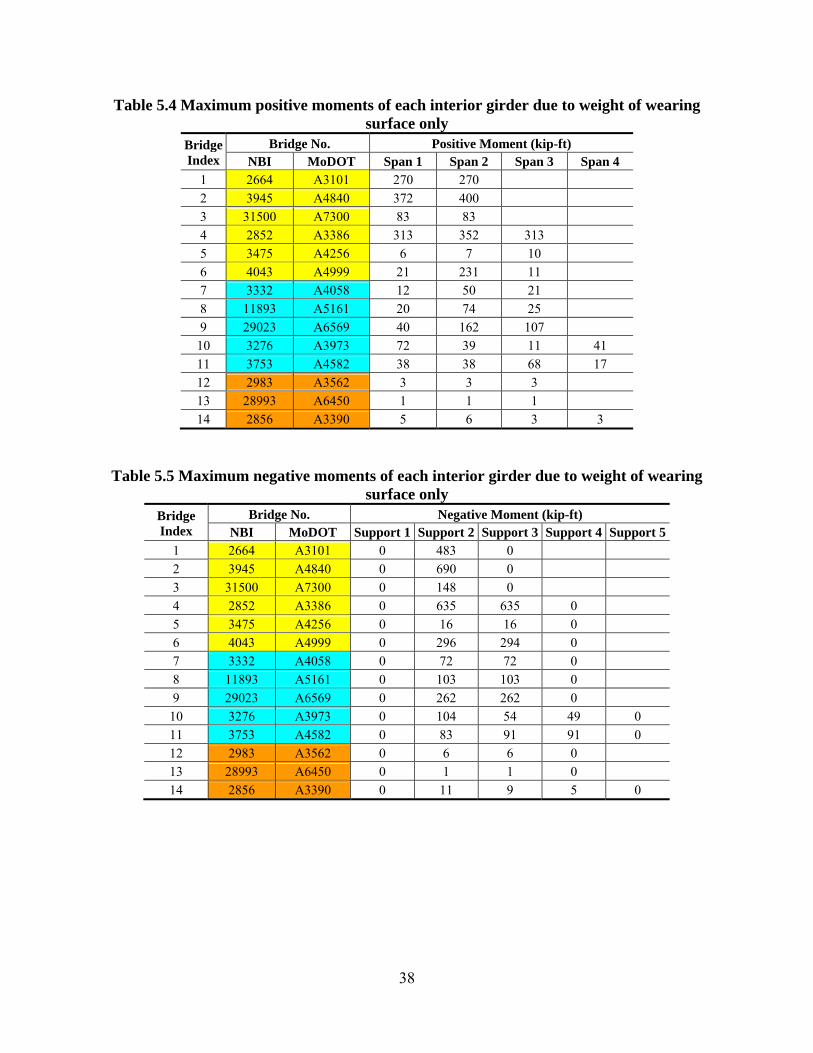
38
Table 5.4 Maximum positive moments of each interior girder due to weight of wearing surface only
Bridge Index
Bridge No. Positive Moment (kip-ft) NBI MoDOT Span 1 Span 2 Span 3 Span 4
1 2664 A3101 270 270 2 3945 A4840 372 400 3 31500 A7300 83 83 4 2852 A3386 313 352 313 5 3475 A4256 6 7 10 6 4043 A4999 21 231 11 7 3332 A4058 12 50 21 8 11893 A5161 20 74 25 9 29023 A6569 40 162 107
10 3276 A3973 72 39 11 41 11 3753 A4582 38 38 68 17 12 2983 A3562 3 3 3 13 28993 A6450 1 1 1 14 2856 A3390 5 6 3 3
Table 5.5 Maximum negative moments of each interior girder due to weight of wearing surface only
Bridge Index
Bridge No. Negative Moment (kip-ft) NBI MoDOT Support 1 Support 2 Support 3 Support 4 Support 5
1 2664 A3101 0 483 0 2 3945 A4840 0 690 0 3 31500 A7300 0 148 0 4 2852 A3386 0 635 635 0 5 3475 A4256 0 16 16 0 6 4043 A4999 0 296 294 0 7 3332 A4058 0 72 72 0 8 11893 A5161 0 103 103 0 9 29023 A6569 0 262 262 0
10 3276 A3973 0 104 54 49 0 11 3753 A4582 0 83 91 91 0 12 2983 A3562 0 6 6 0 13 28993 A6450 0 1 1 0 14 2856 A3390 0 11 9 5 0
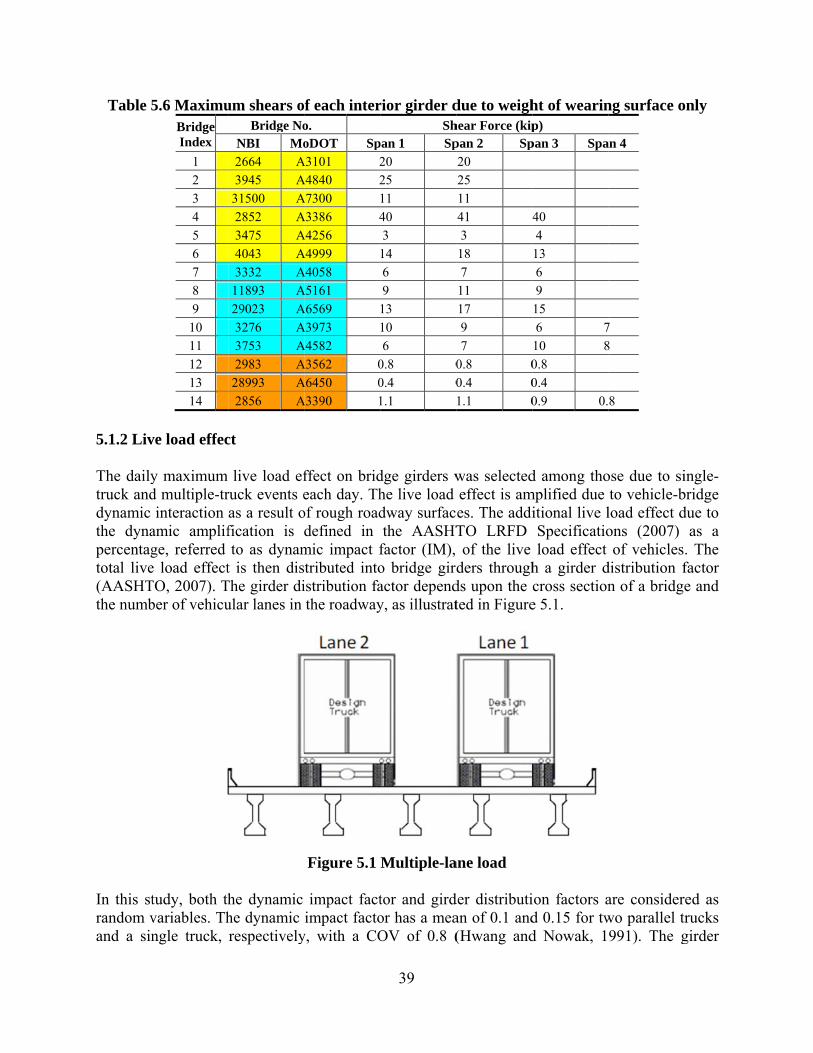
Table 5
5.1.2 Liv The dailytruck anddynamic the dynapercentagtotal live(AASHTthe numb
In this strandom vand a sin
5.6 MaximuBridge Index
1 2 3 4 5 6 7 8 9
10 11 12 13 14
ve load effec
y maximum d multiple-trinteraction
amic amplifge, referred e load effectTO, 2007). Tber of vehicu
tudy, both thvariables. Thngle truck,
um shears oBridge No
NBI Mo2664 A3945 A
31500 A2852 A3475 A4043 A3332 A
11893 A29023 A3276 A3753 A2983 A
28993 A2856 A
ct
live load efruck events eas a result ofication is to as dynam
t is then disThe girder diular lanes in
he dynamic he dynamic respectively
f each intero. oDOT Sp
A3101 2A4840 2A7300 A3386 4A4256 A4999 A4058 A5161 A6569 A3973 A4582 A3562 0A6450 0A3390 1
ffect on brideach day. Th
of rough roaddefined in
mic impact ftributed intoistribution fathe roadway
Figure 5.1
impact factimpact facto
y, with a CO
39
rior girder dSh
pan 1 Sp20 25 11 40 3
14 6 9
13 10 6
0.8 00.4 01.1
dge girders whe live load dway surfacthe AASHT
factor (IM), o bridge girdactor dependy, as illustrat
Multiple-la
tor and girdor has a meaOV of 0.8 (
due to weighhear Force (kippan 2 Sp20 25 11 41 43
18 7
11 17 9 7
0.8 00.4 01.1 0
was selectedeffect is ames. The addiTO LRFD of the live ders through
ds upon the ted in Figure
ane load
der distributian of 0.1 and(Hwang and
ht of wearinp)
pan 3 Spa
40 4
13 6 9
15 6 7
10 80.8 0.4 0.9 0.
d among thomplified due
itional live lSpecificatioload effect
h a girder dcross sectione 5.1.
ion factors ad 0.15 for twd Nowak, 1
ng surface o
an 4
7 8
8
ose due to sito vehicle-bload effect dons (2007) of vehicles
distribution fn of a bridge
are considerwo parallel tr991). The g
only
ingle-bridge due to
as a . The factor e and
red as rucks girder
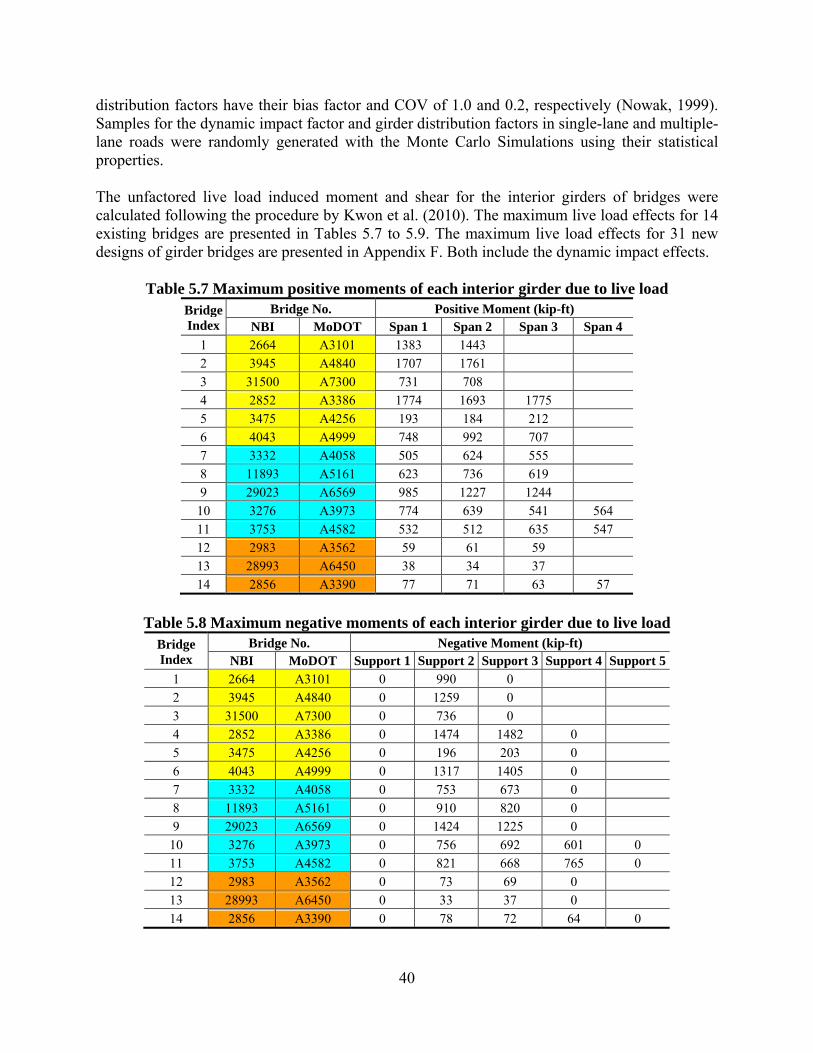
40
distribution factors have their bias factor and COV of 1.0 and 0.2, respectively (Nowak, 1999). Samples for the dynamic impact factor and girder distribution factors in single-lane and multiple-lane roads were randomly generated with the Monte Carlo Simulations using their statistical properties. The unfactored live load induced moment and shear for the interior girders of bridges were calculated following the procedure by Kwon et al. (2010). The maximum live load effects for 14 existing bridges are presented in Tables 5.7 to 5.9. The maximum live load effects for 31 new designs of girder bridges are presented in Appendix F. Both include the dynamic impact effects.
Table 5.7 Maximum positive moments of each interior girder due to live load Bridge Index
Bridge No. Positive Moment (kip-ft) NBI MoDOT Span 1 Span 2 Span 3 Span 4
1 2664 A3101 1383 1443 2 3945 A4840 1707 1761 3 31500 A7300 731 708 4 2852 A3386 1774 1693 1775 5 3475 A4256 193 184 212 6 4043 A4999 748 992 707 7 3332 A4058 505 624 555 8 11893 A5161 623 736 619 9 29023 A6569 985 1227 1244
10 3276 A3973 774 639 541 564 11 3753 A4582 532 512 635 547 12 2983 A3562 59 61 59 13 28993 A6450 38 34 37 14 2856 A3390 77 71 63 57
Table 5.8 Maximum negative moments of each interior girder due to live load
Bridge Index
Bridge No. Negative Moment (kip-ft) NBI MoDOT Support 1 Support 2 Support 3 Support 4 Support 5
1 2664 A3101 0 990 0 2 3945 A4840 0 1259 0 3 31500 A7300 0 736 0 4 2852 A3386 0 1474 1482 0 5 3475 A4256 0 196 203 0 6 4043 A4999 0 1317 1405 0 7 3332 A4058 0 753 673 0 8 11893 A5161 0 910 820 0 9 29023 A6569 0 1424 1225 0
10 3276 A3973 0 756 692 601 0 11 3753 A4582 0 821 668 765 0 12 2983 A3562 0 73 69 0 13 28993 A6450 0 33 37 0 14 2856 A3390 0 78 72 64 0
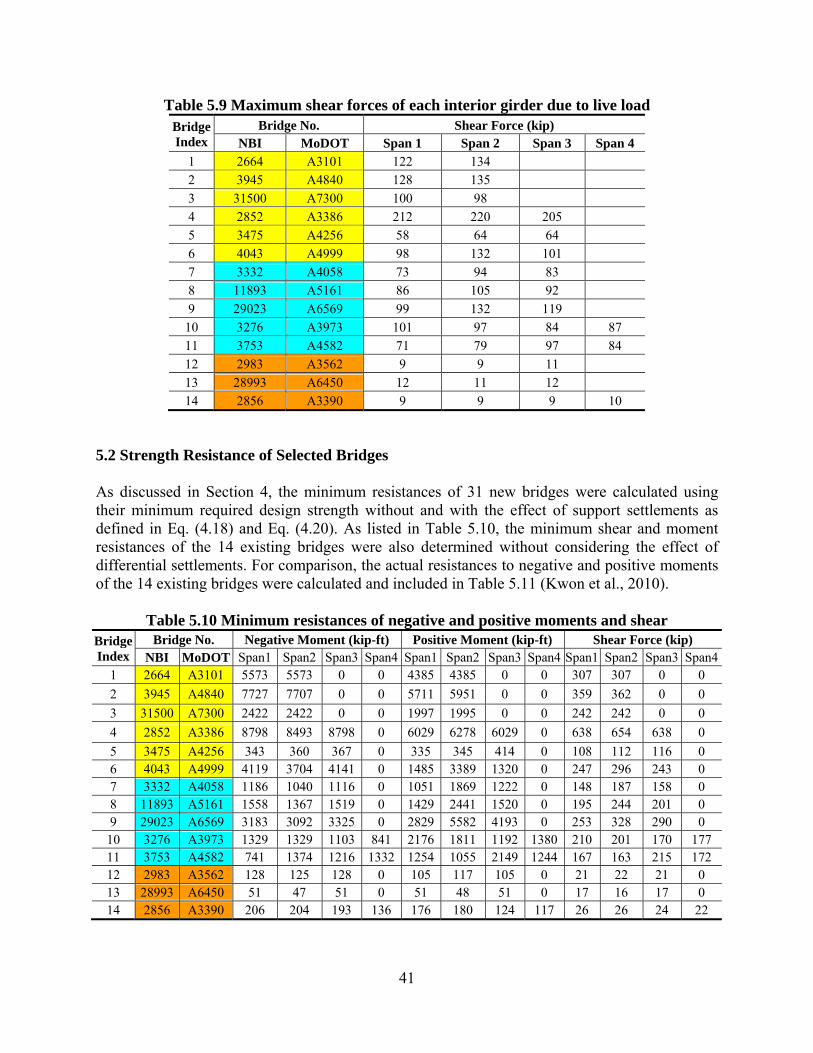
41
Table 5.9 Maximum shear forces of each interior girder due to live load Bridge Index
Bridge No. Shear Force (kip) NBI MoDOT Span 1 Span 2 Span 3 Span 4
1 2664 A3101 122 134 2 3945 A4840 128 135 3 31500 A7300 100 98 4 2852 A3386 212 220 205 5 3475 A4256 58 64 64 6 4043 A4999 98 132 101 7 3332 A4058 73 94 83 8 11893 A5161 86 105 92 9 29023 A6569 99 132 119
10 3276 A3973 101 97 84 87 11 3753 A4582 71 79 97 84 12 2983 A3562 9 9 11 13 28993 A6450 12 11 12 14 2856 A3390 9 9 9 10
5.2 Strength Resistance of Selected Bridges As discussed in Section 4, the minimum resistances of 31 new bridges were calculated using their minimum required design strength without and with the effect of support settlements as defined in Eq. (4.18) and Eq. (4.20). As listed in Table 5.10, the minimum shear and moment resistances of the 14 existing bridges were also determined without considering the effect of differential settlements. For comparison, the actual resistances to negative and positive moments of the 14 existing bridges were calculated and included in Table 5.11 (Kwon et al., 2010).
Table 5.10 Minimum resistances of negative and positive moments and shear Bridge Index
Bridge No. Negative Moment (kip-ft) Positive Moment (kip-ft) Shear Force (kip) NBI MoDOT Span1 Span2 Span3 Span4 Span1 Span2 Span3 Span4 Span1 Span2 Span3 Span4
1 2664 A3101 5573 5573 0 0 4385 4385 0 0 307 307 0 0
2 3945 A4840 7727 7707 0 0 5711 5951 0 0 359 362 0 0
3 31500 A7300 2422 2422 0 0 1997 1995 0 0 242 242 0 0
4 2852 A3386 8798 8493 8798 0 6029 6278 6029 0 638 654 638 0
5 3475 A4256 343 360 367 0 335 345 414 0 108 112 116 0 6 4043 A4999 4119 3704 4141 0 1485 3389 1320 0 247 296 243 0 7 3332 A4058 1186 1040 1116 0 1051 1869 1222 0 148 187 158 0 8 11893 A5161 1558 1367 1519 0 1429 2441 1520 0 195 244 201 0 9 29023 A6569 3183 3092 3325 0 2829 5582 4193 0 253 328 290 0
10 3276 A3973 1329 1329 1103 841 2176 1811 1192 1380 210 201 170 177 11 3753 A4582 741 1374 1216 1332 1254 1055 2149 1244 167 163 215 172 12 2983 A3562 128 125 128 0 105 117 105 0 21 22 21 0 13 28993 A6450 51 47 51 0 51 48 51 0 17 16 17 0 14 2856 A3390 206 204 193 136 176 180 124 117 26 26 24 22
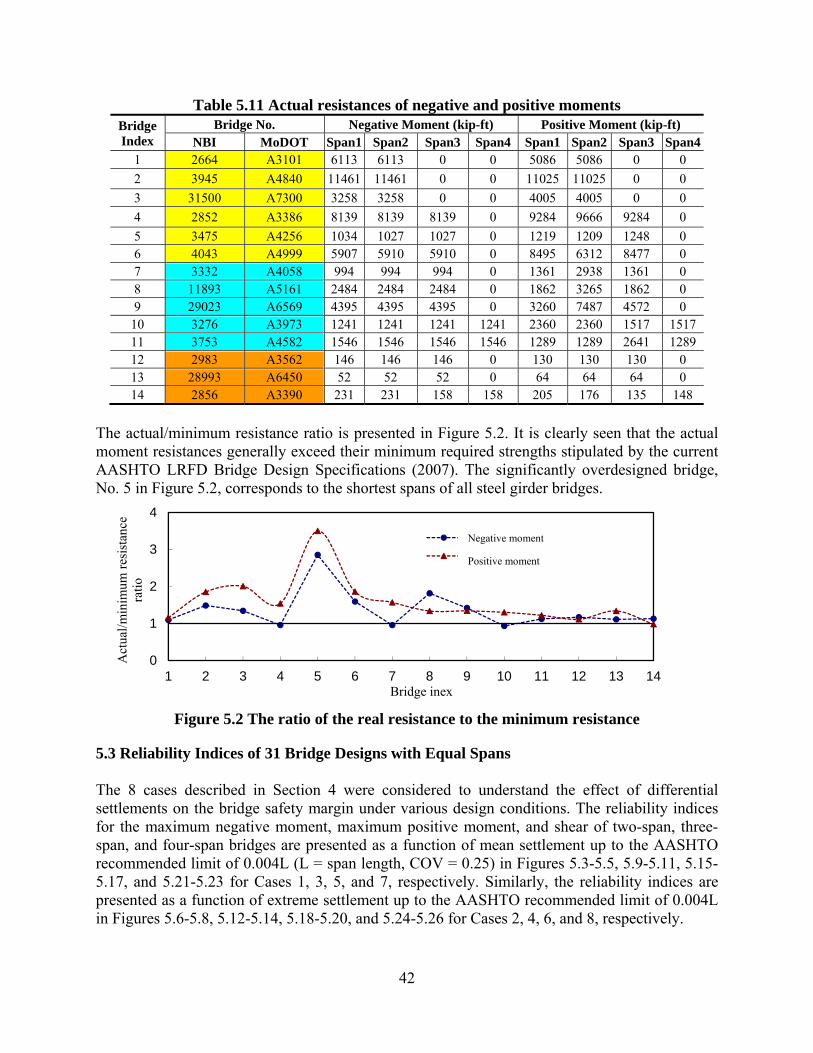
42
Table 5.11 Actual resistances of negative and positive moments Bridge Index
Bridge No. Negative Moment (kip-ft) Positive Moment (kip-ft) NBI MoDOT Span1 Span2 Span3 Span4 Span1 Span2 Span3 Span4
1 2664 A3101 6113 6113 0 0 5086 5086 0 0
2 3945 A4840 11461 11461 0 0 11025 11025 0 0
3 31500 A7300 3258 3258 0 0 4005 4005 0 0
4 2852 A3386 8139 8139 8139 0 9284 9666 9284 0
5 3475 A4256 1034 1027 1027 0 1219 1209 1248 0 6 4043 A4999 5907 5910 5910 0 8495 6312 8477 0 7 3332 A4058 994 994 994 0 1361 2938 1361 0 8 11893 A5161 2484 2484 2484 0 1862 3265 1862 0 9 29023 A6569 4395 4395 4395 0 3260 7487 4572 0
10 3276 A3973 1241 1241 1241 1241 2360 2360 1517 1517 11 3753 A4582 1546 1546 1546 1546 1289 1289 2641 1289 12 2983 A3562 146 146 146 0 130 130 130 0 13 28993 A6450 52 52 52 0 64 64 64 0 14 2856 A3390 231 231 158 158 205 176 135 148
The actual/minimum resistance ratio is presented in Figure 5.2. It is clearly seen that the actual moment resistances generally exceed their minimum required strengths stipulated by the current AASHTO LRFD Bridge Design Specifications (2007). The significantly overdesigned bridge, No. 5 in Figure 5.2, corresponds to the shortest spans of all steel girder bridges.
Figure 5.2 The ratio of the real resistance to the minimum resistance
5.3 Reliability Indices of 31 Bridge Designs with Equal Spans The 8 cases described in Section 4 were considered to understand the effect of differential settlements on the bridge safety margin under various design conditions. The reliability indices for the maximum negative moment, maximum positive moment, and shear of two-span, three-span, and four-span bridges are presented as a function of mean settlement up to the AASHTO recommended limit of 0.004L (L = span length, COV = 0.25) in Figures 5.3-5.5, 5.9-5.11, 5.15-5.17, and 5.21-5.23 for Cases 1, 3, 5, and 7, respectively. Similarly, the reliability indices are presented as a function of extreme settlement up to the AASHTO recommended limit of 0.004L in Figures 5.6-5.8, 5.12-5.14, 5.18-5.20, and 5.24-5.26 for Cases 2, 4, 6, and 8, respectively.
0
1
2
3
4
1 2 3 4 5 6 7 8 9 10 11 12 13 14
Act
ual/
min
imum
res
ista
nce
rati
o
Bridge inex
negative momentpositive moment
Negative moment
Positive moment
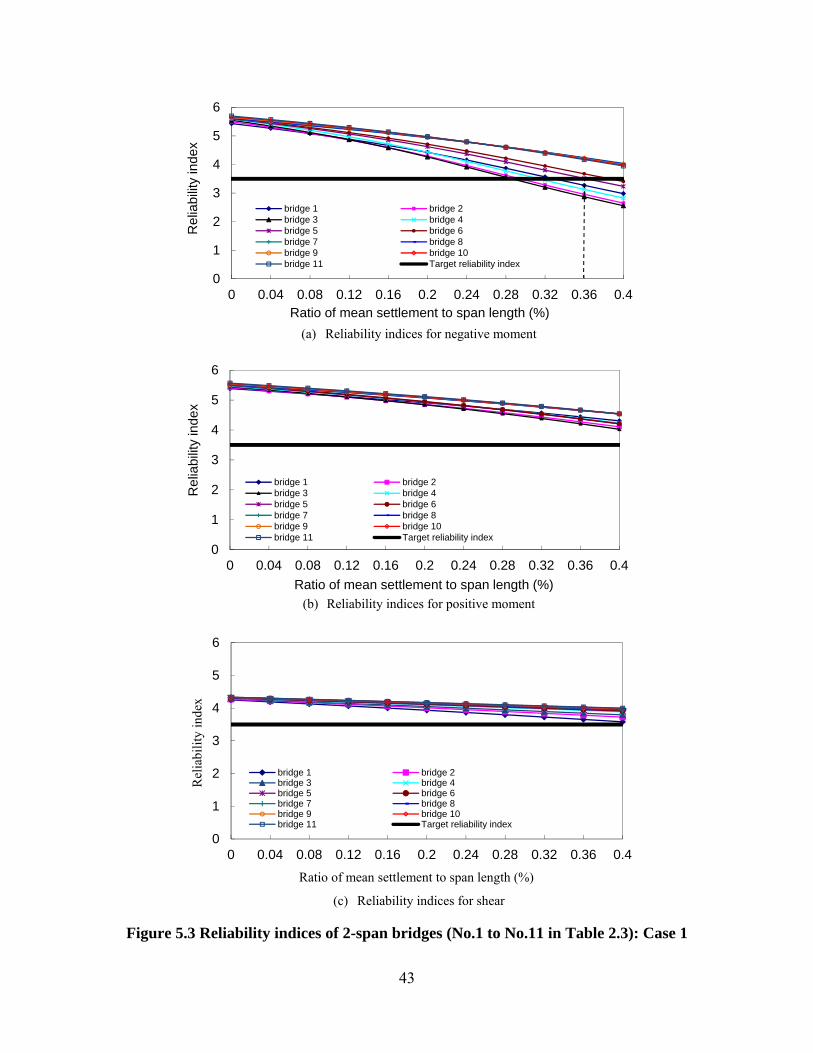
43
(a) Reliability indices for negative moment
(b) Reliability indices for positive moment
(c) Reliability indices for shear
Figure 5.3 Reliability indices of 2-span bridges (No.1 to No.11 in Table 2.3): Case 1
0
1
2
3
4
5
6
0 0.04 0.08 0.12 0.16 0.2 0.24 0.28 0.32 0.36 0.4
Rel
iabi
lity
inde
x
Ratio of mean settlement to span length (%)
bridge 1 bridge 2bridge 3 bridge 4bridge 5 bridge 6bridge 7 bridge 8bridge 9 bridge 10bridge 11 Target reliability index
0
1
2
3
4
5
6
0 0.04 0.08 0.12 0.16 0.2 0.24 0.28 0.32 0.36 0.4
Rel
iabi
lity
inde
x
Ratio of mean settlement to span length (%)
bridge 1 bridge 2bridge 3 bridge 4bridge 5 bridge 6bridge 7 bridge 8bridge 9 bridge 10bridge 11 Target reliability index
0
1
2
3
4
5
6
0 0.04 0.08 0.12 0.16 0.2 0.24 0.28 0.32 0.36 0.4
Rel
iabi
lity
inde
x
Ratio of mean settlement to span length (%)
bridge 1 bridge 2bridge 3 bridge 4bridge 5 bridge 6bridge 7 bridge 8bridge 9 bridge 10bridge 11 Target reliability index
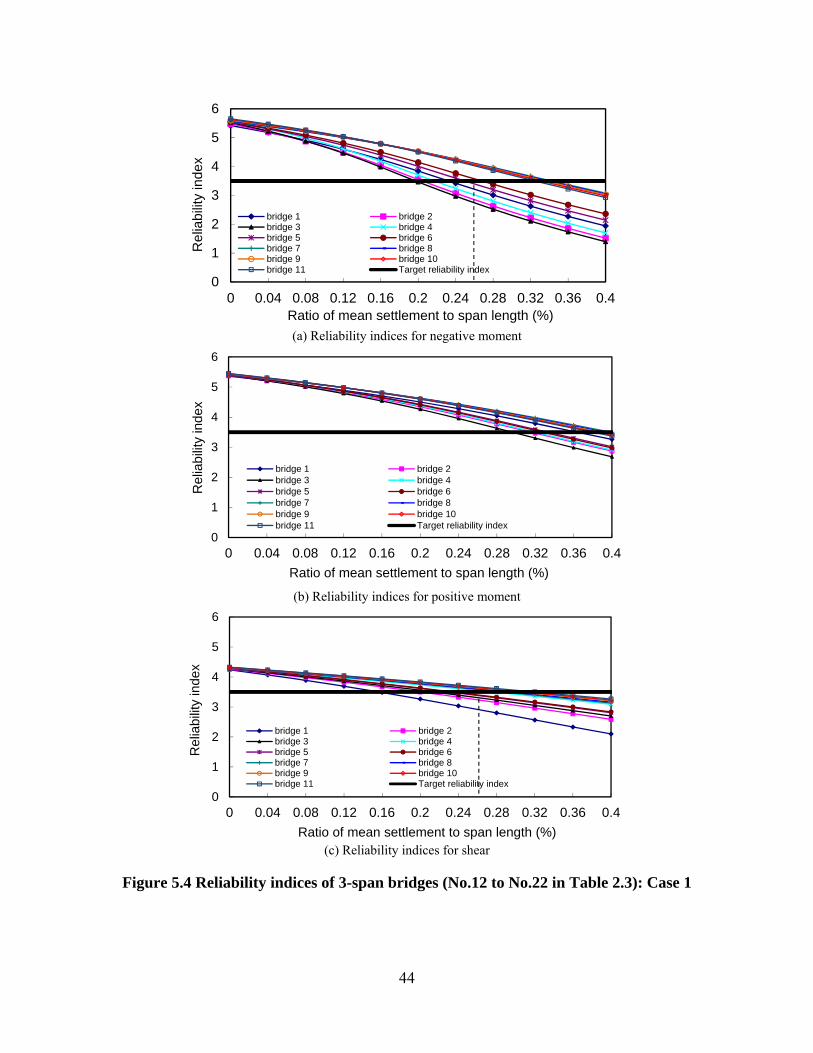
44
(a) Reliability indices for negative moment
(b) Reliability indices for positive moment
(c) Reliability indices for shear
Figure 5.4 Reliability indices of 3-span bridges (No.12 to No.22 in Table 2.3): Case 1
0
1
2
3
4
5
6
0 0.04 0.08 0.12 0.16 0.2 0.24 0.28 0.32 0.36 0.4
Rel
iabi
lity
inde
x
Ratio of mean settlement to span length (%)
bridge 1 bridge 2bridge 3 bridge 4bridge 5 bridge 6bridge 7 bridge 8bridge 9 bridge 10bridge 11 Target reliability index
0
1
2
3
4
5
6
0 0.04 0.08 0.12 0.16 0.2 0.24 0.28 0.32 0.36 0.4
Rel
iabi
lity
inde
x
Ratio of mean settlement to span length (%)
bridge 1 bridge 2bridge 3 bridge 4bridge 5 bridge 6bridge 7 bridge 8bridge 9 bridge 10bridge 11 Target reliability index
0
1
2
3
4
5
6
0 0.04 0.08 0.12 0.16 0.2 0.24 0.28 0.32 0.36 0.4
Rel
iabi
lity
inde
x
Ratio of mean settlement to span length (%)
bridge 1 bridge 2bridge 3 bridge 4bridge 5 bridge 6bridge 7 bridge 8bridge 9 bridge 10bridge 11 Target reliability index
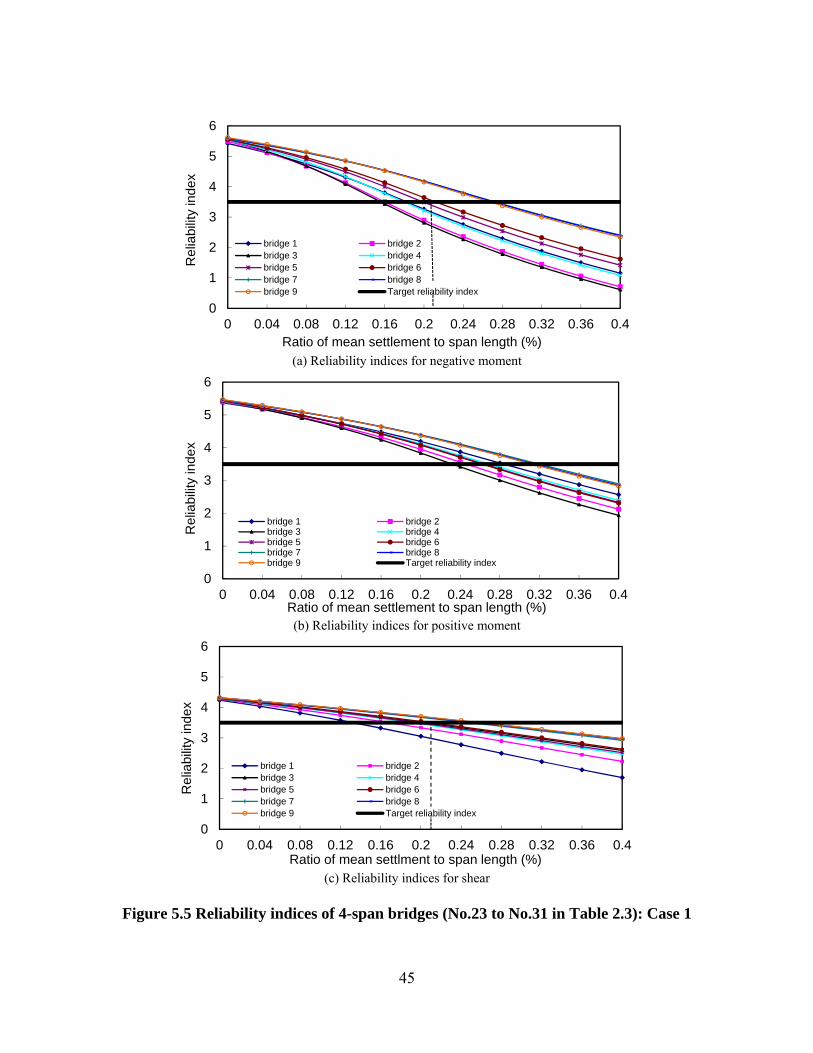
45
(a) Reliability indices for negative moment
(b) Reliability indices for positive moment
(c) Reliability indices for shear
Figure 5.5 Reliability indices of 4-span bridges (No.23 to No.31 in Table 2.3): Case 1
0
1
2
3
4
5
6
0 0.04 0.08 0.12 0.16 0.2 0.24 0.28 0.32 0.36 0.4
Rel
iabi
lity
inde
x
Ratio of mean settlement to span length (%)
bridge 1 bridge 2bridge 3 bridge 4bridge 5 bridge 6bridge 7 bridge 8bridge 9 Target reliability index
0
1
2
3
4
5
6
0 0.04 0.08 0.12 0.16 0.2 0.24 0.28 0.32 0.36 0.4
Rel
iabi
lity
inde
x
Ratio of mean settlement to span length (%)
bridge 1 bridge 2bridge 3 bridge 4bridge 5 bridge 6bridge 7 bridge 8bridge 9 Target reliability index
0
1
2
3
4
5
6
0 0.04 0.08 0.12 0.16 0.2 0.24 0.28 0.32 0.36 0.4
Rel
iabi
lity
inde
x
Ratio of mean settlment to span length (%)
bridge 1 bridge 2bridge 3 bridge 4bridge 5 bridge 6bridge 7 bridge 8bridge 9 Target reliability index
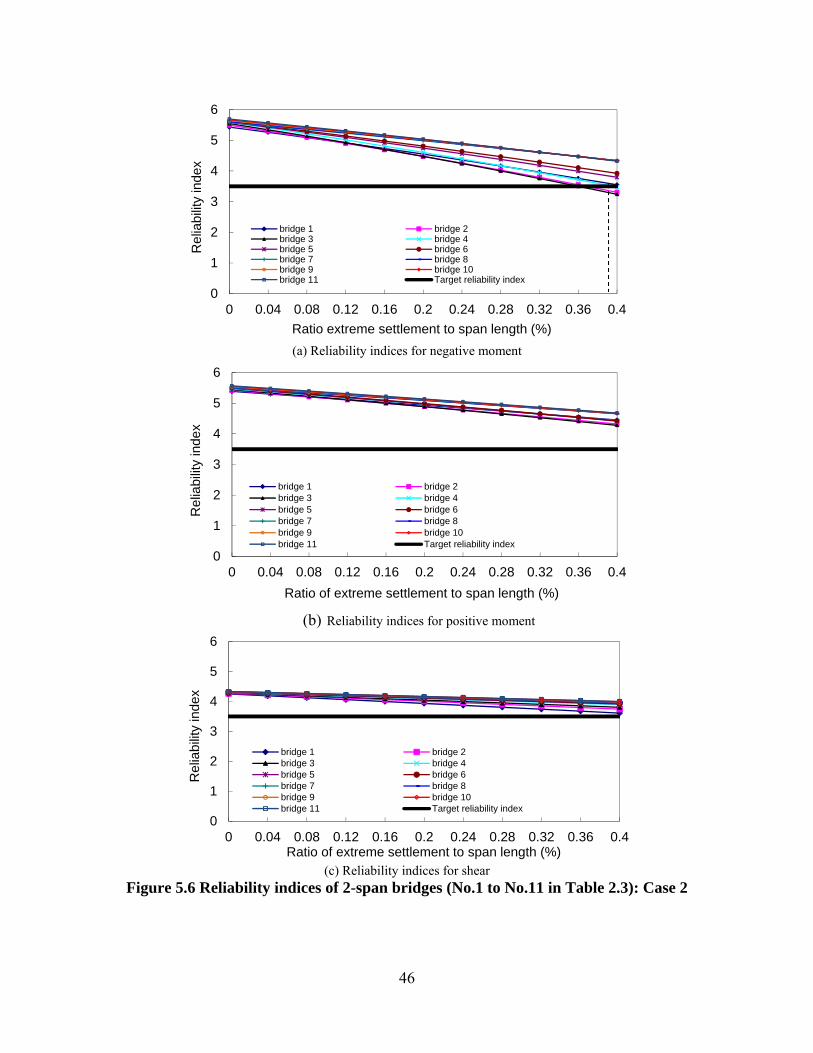
46
(a) Reliability indices for negative moment
(b) Reliability indices for positive moment
(c) Reliability indices for shear
Figure 5.6 Reliability indices of 2-span bridges (No.1 to No.11 in Table 2.3): Case 2
0
1
2
3
4
5
6
0 0.04 0.08 0.12 0.16 0.2 0.24 0.28 0.32 0.36 0.4
Rel
iabi
lity
inde
x
Ratio extreme settlement to span length (%)
bridge 1 bridge 2bridge 3 bridge 4bridge 5 bridge 6bridge 7 bridge 8bridge 9 bridge 10bridge 11 Target reliability index
0
1
2
3
4
5
6
0 0.04 0.08 0.12 0.16 0.2 0.24 0.28 0.32 0.36 0.4
Rel
iabi
lity
inde
x
Ratio of extreme settlement to span length (%)
bridge 1 bridge 2bridge 3 bridge 4bridge 5 bridge 6bridge 7 bridge 8bridge 9 bridge 10bridge 11 Target reliability index
0
1
2
3
4
5
6
0 0.04 0.08 0.12 0.16 0.2 0.24 0.28 0.32 0.36 0.4
Rel
iabi
lity
inde
x
Ratio of extreme settlement to span length (%)
bridge 1 bridge 2bridge 3 bridge 4bridge 5 bridge 6bridge 7 bridge 8bridge 9 bridge 10bridge 11 Target reliability index
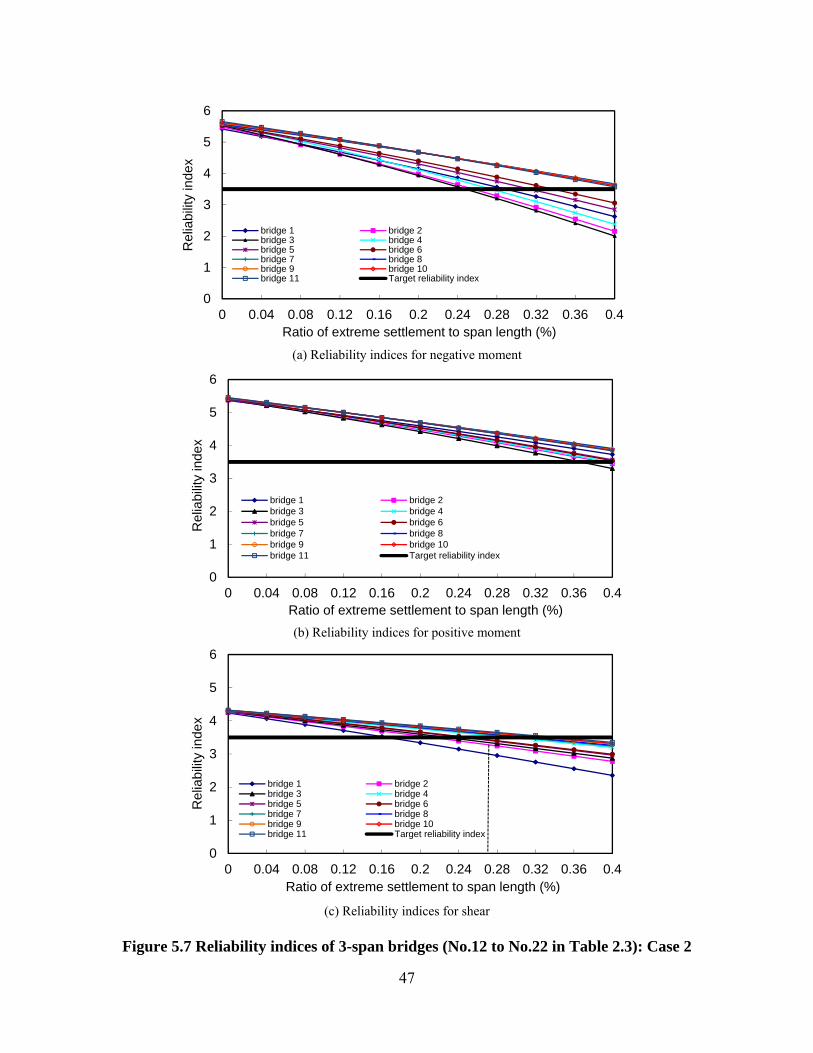
47
(a) Reliability indices for negative moment
(b) Reliability indices for positive moment
(c) Reliability indices for shear
Figure 5.7 Reliability indices of 3-span bridges (No.12 to No.22 in Table 2.3): Case 2
0
1
2
3
4
5
6
0 0.04 0.08 0.12 0.16 0.2 0.24 0.28 0.32 0.36 0.4
Rel
iabi
lity
inde
x
Ratio of extreme settlement to span length (%)
bridge 1 bridge 2bridge 3 bridge 4bridge 5 bridge 6bridge 7 bridge 8bridge 9 bridge 10bridge 11 Target reliability index
0
1
2
3
4
5
6
0 0.04 0.08 0.12 0.16 0.2 0.24 0.28 0.32 0.36 0.4
Rel
iabi
lity
inde
x
Ratio of extreme settlement to span length (%)
bridge 1 bridge 2bridge 3 bridge 4bridge 5 bridge 6bridge 7 bridge 8bridge 9 bridge 10bridge 11 Target reliability index
0
1
2
3
4
5
6
0 0.04 0.08 0.12 0.16 0.2 0.24 0.28 0.32 0.36 0.4
Rel
iabi
lity
inde
x
Ratio of extreme settlement to span length (%)
bridge 1 bridge 2bridge 3 bridge 4bridge 5 bridge 6bridge 7 bridge 8bridge 9 bridge 10bridge 11 Target reliability index
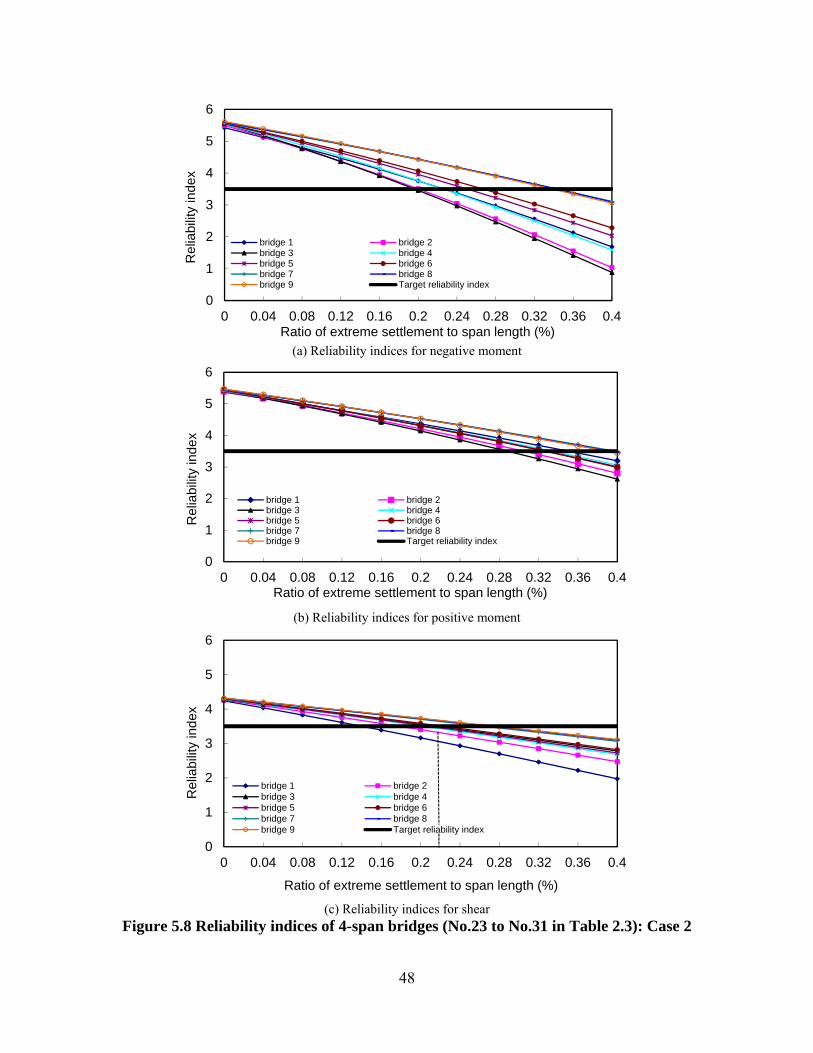
48
(a) Reliability indices for negative moment
(b) Reliability indices for positive moment
(c) Reliability indices for shear
Figure 5.8 Reliability indices of 4-span bridges (No.23 to No.31 in Table 2.3): Case 2
0
1
2
3
4
5
6
0 0.04 0.08 0.12 0.16 0.2 0.24 0.28 0.32 0.36 0.4
Rel
iabi
lity
inde
x
Ratio of extreme settlement to span length (%)
bridge 1 bridge 2bridge 3 bridge 4bridge 5 bridge 6bridge 7 bridge 8bridge 9 Target reliability index
0
1
2
3
4
5
6
0 0.04 0.08 0.12 0.16 0.2 0.24 0.28 0.32 0.36 0.4
Rel
iabi
lity
inde
x
Ratio of extreme settlement to span length (%)
bridge 1 bridge 2bridge 3 bridge 4bridge 5 bridge 6bridge 7 bridge 8bridge 9 Target reliability index
0
1
2
3
4
5
6
0 0.04 0.08 0.12 0.16 0.2 0.24 0.28 0.32 0.36 0.4
Rel
iabi
lity
inde
x
Ratio of extreme settlement to span length (%)
bridge 1 bridge 2bridge 3 bridge 4bridge 5 bridge 6bridge 7 bridge 8bridge 9 Target reliability index
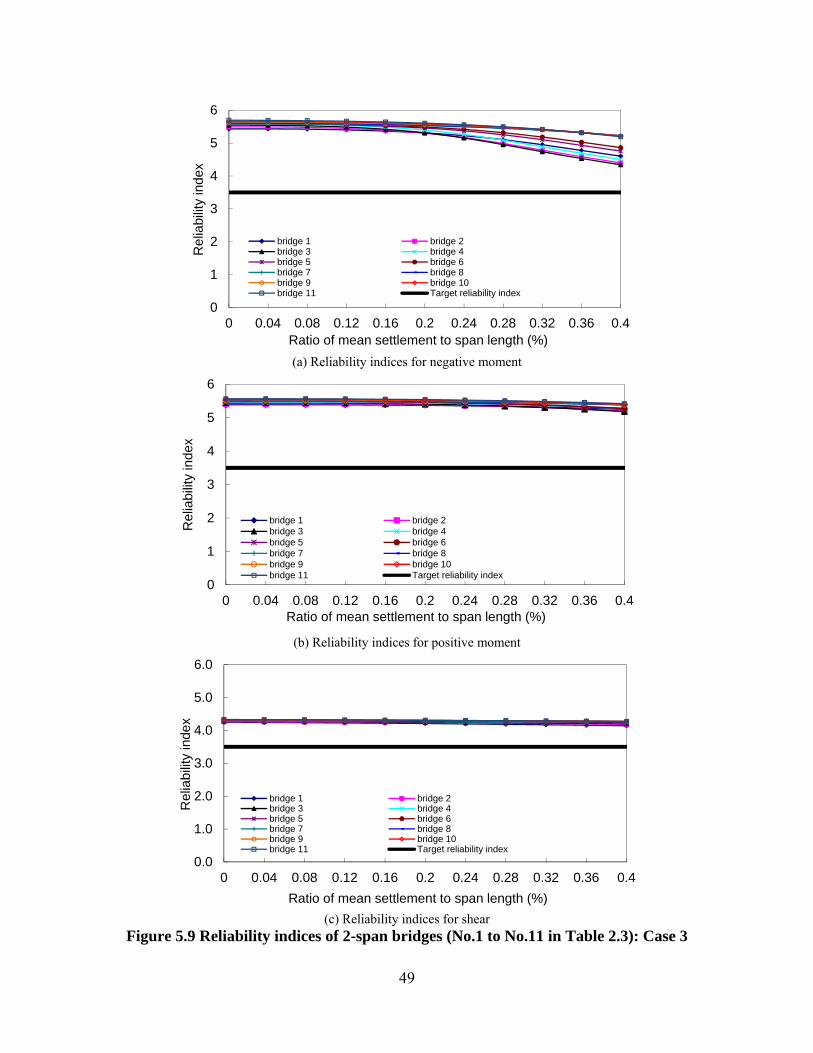
49
(a) Reliability indices for negative moment
(b) Reliability indices for positive moment
(c) Reliability indices for shear
Figure 5.9 Reliability indices of 2-span bridges (No.1 to No.11 in Table 2.3): Case 3
0
1
2
3
4
5
6
0 0.04 0.08 0.12 0.16 0.2 0.24 0.28 0.32 0.36 0.4
Rel
iabi
lity
inde
x
Ratio of mean settlement to span length (%)
bridge 1 bridge 2bridge 3 bridge 4bridge 5 bridge 6bridge 7 bridge 8bridge 9 bridge 10bridge 11 Target reliability index
0
1
2
3
4
5
6
0 0.04 0.08 0.12 0.16 0.2 0.24 0.28 0.32 0.36 0.4
Rel
iabi
lity
inde
x
Ratio of mean settlement to span length (%)
bridge 1 bridge 2bridge 3 bridge 4bridge 5 bridge 6bridge 7 bridge 8bridge 9 bridge 10bridge 11 Target reliability index
0.0
1.0
2.0
3.0
4.0
5.0
6.0
0 0.04 0.08 0.12 0.16 0.2 0.24 0.28 0.32 0.36 0.4
Rel
iabi
lity
inde
x
Ratio of mean settlement to span length (%)
bridge 1 bridge 2bridge 3 bridge 4bridge 5 bridge 6bridge 7 bridge 8bridge 9 bridge 10bridge 11 Target reliability index
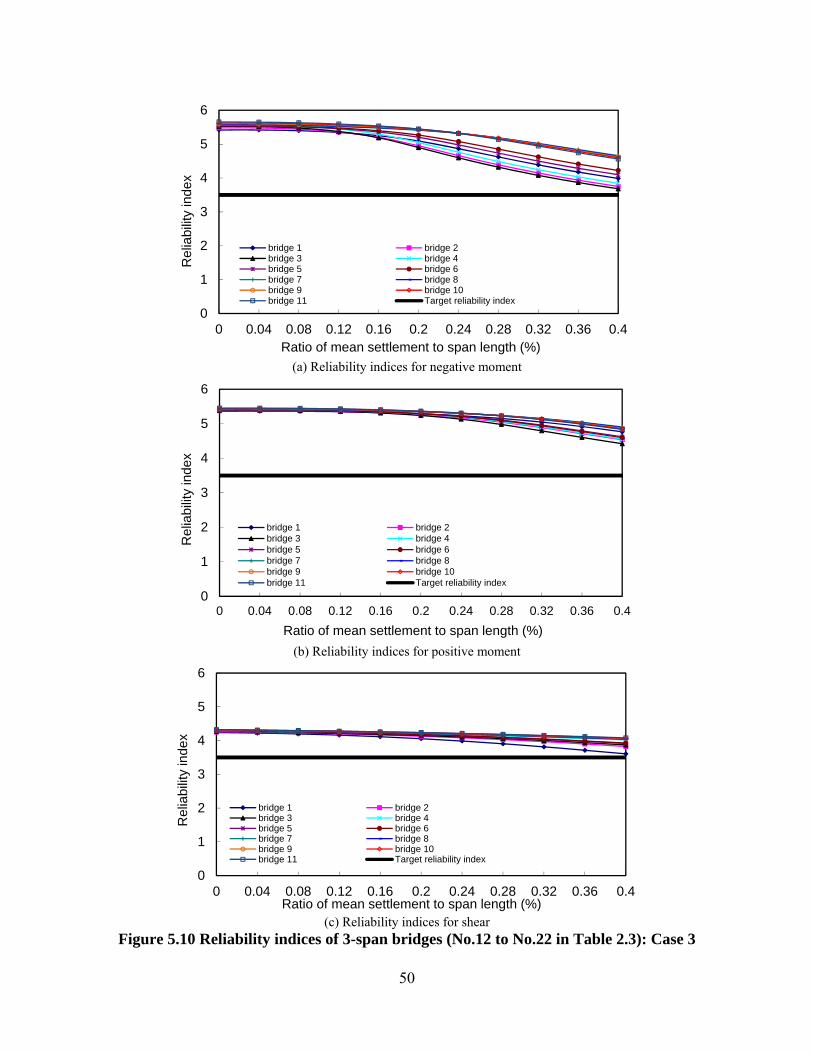
50
(a) Reliability indices for negative moment
(b) Reliability indices for positive moment
(c) Reliability indices for shear
Figure 5.10 Reliability indices of 3-span bridges (No.12 to No.22 in Table 2.3): Case 3
0
1
2
3
4
5
6
0 0.04 0.08 0.12 0.16 0.2 0.24 0.28 0.32 0.36 0.4
Rel
iabi
lity
inde
x
Ratio of mean settlement to span length (%)
bridge 1 bridge 2bridge 3 bridge 4bridge 5 bridge 6bridge 7 bridge 8bridge 9 bridge 10bridge 11 Target reliability index
0
1
2
3
4
5
6
0 0.04 0.08 0.12 0.16 0.2 0.24 0.28 0.32 0.36 0.4
Rel
iabi
lity
inde
x
Ratio of mean settlement to span length (%)
bridge 1 bridge 2bridge 3 bridge 4bridge 5 bridge 6bridge 7 bridge 8bridge 9 bridge 10bridge 11 Target reliability index
0
1
2
3
4
5
6
0 0.04 0.08 0.12 0.16 0.2 0.24 0.28 0.32 0.36 0.4
Rel
iabi
lity
inde
x
Ratio of mean settlement to span length (%)
bridge 1 bridge 2bridge 3 bridge 4bridge 5 bridge 6bridge 7 bridge 8bridge 9 bridge 10bridge 11 Target reliability index
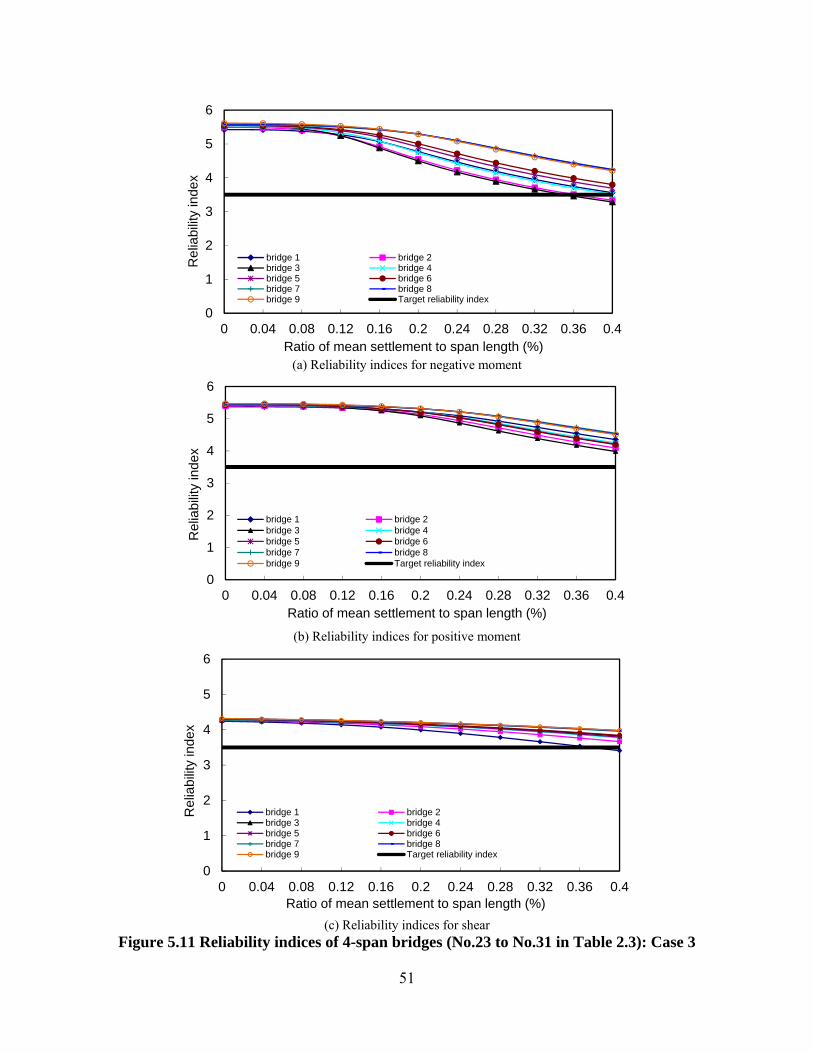
51
(a) Reliability indices for negative moment
(b) Reliability indices for positive moment
(c) Reliability indices for shear
Figure 5.11 Reliability indices of 4-span bridges (No.23 to No.31 in Table 2.3): Case 3
0
1
2
3
4
5
6
0 0.04 0.08 0.12 0.16 0.2 0.24 0.28 0.32 0.36 0.4
Rel
iabi
lity
inde
x
Ratio of mean settlement to span length (%)
bridge 1 bridge 2bridge 3 bridge 4bridge 5 bridge 6bridge 7 bridge 8bridge 9 Target reliability index
0
1
2
3
4
5
6
0 0.04 0.08 0.12 0.16 0.2 0.24 0.28 0.32 0.36 0.4
Rel
iabi
lity
inde
x
Ratio of mean settlement to span length (%)
bridge 1 bridge 2bridge 3 bridge 4bridge 5 bridge 6bridge 7 bridge 8bridge 9 Target reliability index
0
1
2
3
4
5
6
0 0.04 0.08 0.12 0.16 0.2 0.24 0.28 0.32 0.36 0.4
Rel
iabi
lity
inde
x
Ratio of mean settlement to span length (%)
bridge 1 bridge 2bridge 3 bridge 4bridge 5 bridge 6bridge 7 bridge 8bridge 9 Target reliability index
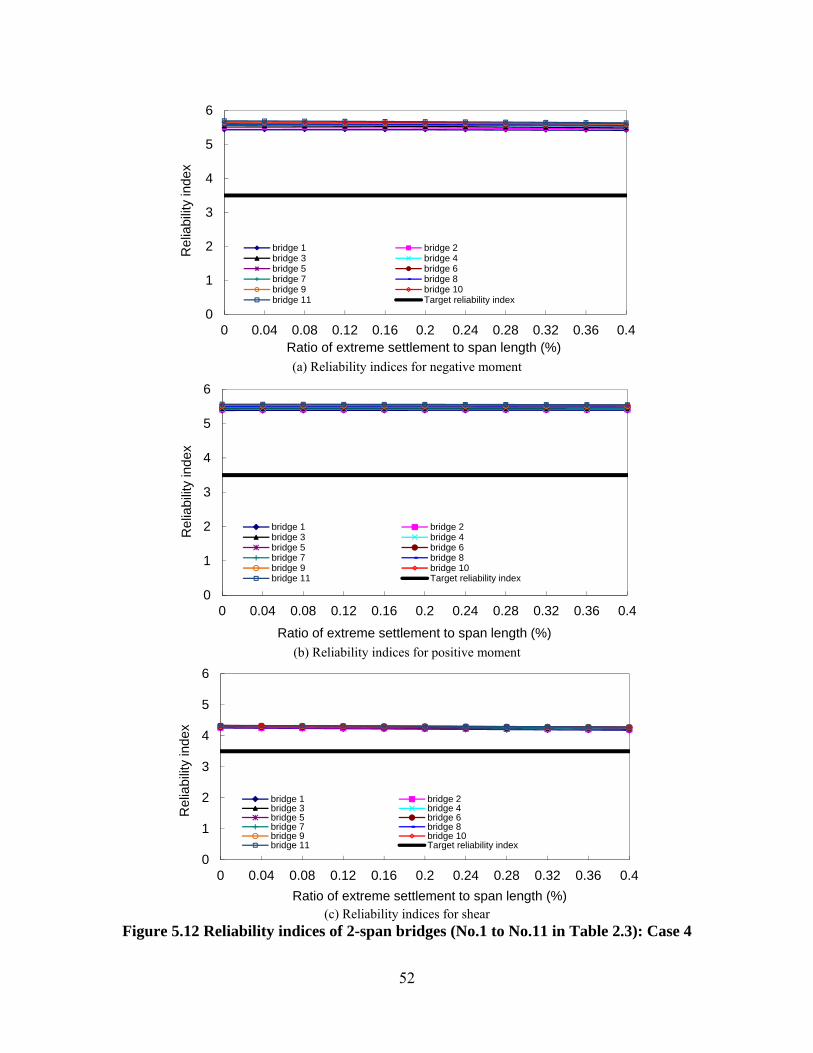
52
(a) Reliability indices for negative moment
(b) Reliability indices for positive moment
(c) Reliability indices for shear
Figure 5.12 Reliability indices of 2-span bridges (No.1 to No.11 in Table 2.3): Case 4
0
1
2
3
4
5
6
0 0.04 0.08 0.12 0.16 0.2 0.24 0.28 0.32 0.36 0.4
Rel
iabi
lity
inde
x
Ratio of extreme settlement to span length (%)
bridge 1 bridge 2bridge 3 bridge 4bridge 5 bridge 6bridge 7 bridge 8bridge 9 bridge 10bridge 11 Target reliability index
0
1
2
3
4
5
6
0 0.04 0.08 0.12 0.16 0.2 0.24 0.28 0.32 0.36 0.4
Rel
iabi
lity
inde
x
Ratio of extreme settlement to span length (%)
bridge 1 bridge 2bridge 3 bridge 4bridge 5 bridge 6bridge 7 bridge 8bridge 9 bridge 10bridge 11 Target reliability index
0
1
2
3
4
5
6
0 0.04 0.08 0.12 0.16 0.2 0.24 0.28 0.32 0.36 0.4
Rel
iabi
lity
inde
x
Ratio of extreme settlement to span length (%)
bridge 1 bridge 2bridge 3 bridge 4bridge 5 bridge 6bridge 7 bridge 8bridge 9 bridge 10bridge 11 Target reliability index
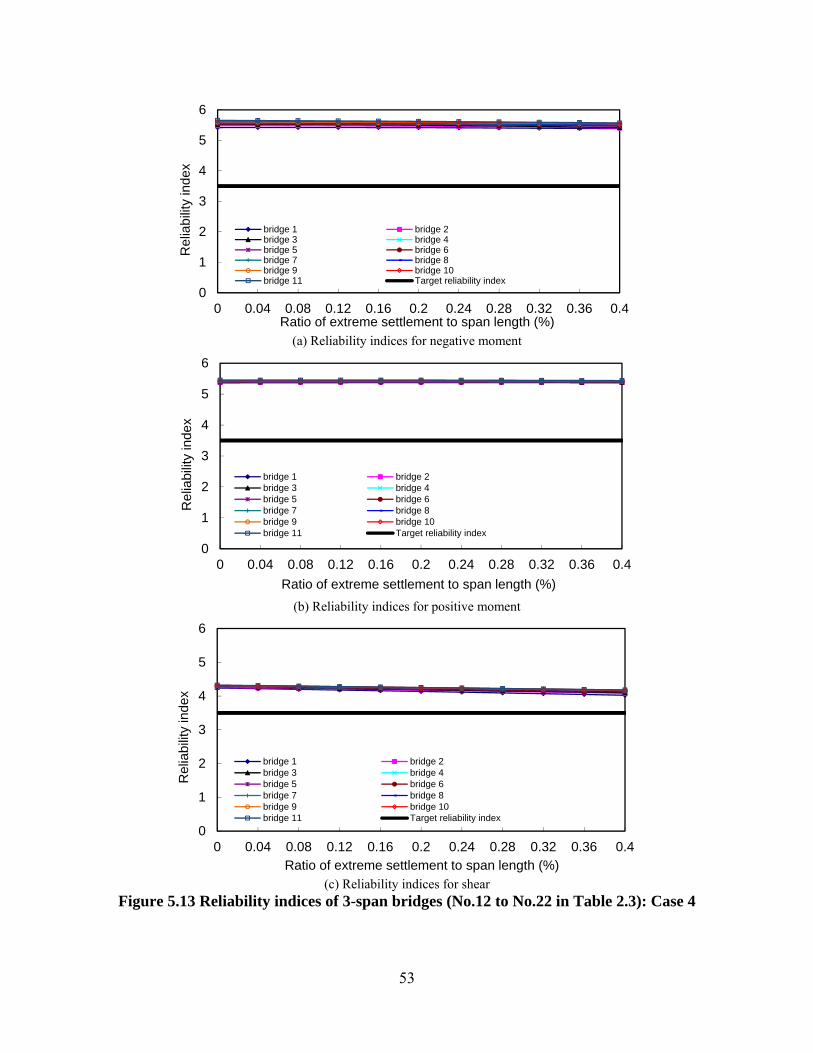
53
(a) Reliability indices for negative moment
(b) Reliability indices for positive moment
(c) Reliability indices for shear
Figure 5.13 Reliability indices of 3-span bridges (No.12 to No.22 in Table 2.3): Case 4
0
1
2
3
4
5
6
0 0.04 0.08 0.12 0.16 0.2 0.24 0.28 0.32 0.36 0.4
Rel
iabi
lity
inde
x
Ratio of extreme settlement to span length (%)
bridge 1 bridge 2bridge 3 bridge 4bridge 5 bridge 6bridge 7 bridge 8bridge 9 bridge 10bridge 11 Target reliability index
0
1
2
3
4
5
6
0 0.04 0.08 0.12 0.16 0.2 0.24 0.28 0.32 0.36 0.4
Rel
iabi
lity
inde
x
Ratio of extreme settlement to span length (%)
bridge 1 bridge 2bridge 3 bridge 4bridge 5 bridge 6bridge 7 bridge 8bridge 9 bridge 10bridge 11 Target reliability index
0
1
2
3
4
5
6
0 0.04 0.08 0.12 0.16 0.2 0.24 0.28 0.32 0.36 0.4
Rel
iabi
lity
inde
x
Ratio of extreme settlement to span length (%)
bridge 1 bridge 2bridge 3 bridge 4bridge 5 bridge 6bridge 7 bridge 8bridge 9 bridge 10bridge 11 Target reliability index
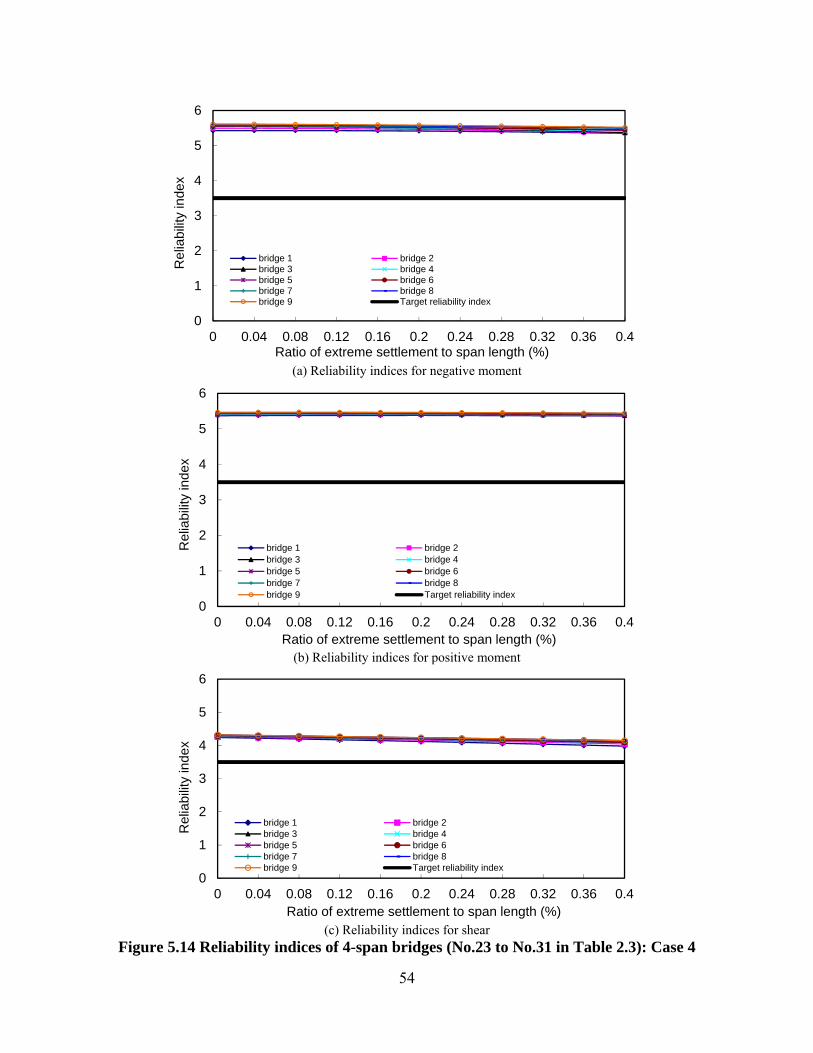
54
(a) Reliability indices for negative moment
(b) Reliability indices for positive moment
(c) Reliability indices for shear
Figure 5.14 Reliability indices of 4-span bridges (No.23 to No.31 in Table 2.3): Case 4
0
1
2
3
4
5
6
0 0.04 0.08 0.12 0.16 0.2 0.24 0.28 0.32 0.36 0.4
Rel
iabi
lity
inde
x
Ratio of extreme settlement to span length (%)
bridge 1 bridge 2bridge 3 bridge 4bridge 5 bridge 6bridge 7 bridge 8bridge 9 Target reliability index
0
1
2
3
4
5
6
0 0.04 0.08 0.12 0.16 0.2 0.24 0.28 0.32 0.36 0.4
Rel
iabi
lity
inde
x
Ratio of extreme settlement to span length (%)
bridge 1 bridge 2bridge 3 bridge 4bridge 5 bridge 6bridge 7 bridge 8bridge 9 Target reliability index
0
1
2
3
4
5
6
0 0.04 0.08 0.12 0.16 0.2 0.24 0.28 0.32 0.36 0.4
Rel
iabi
lity
inde
x
Ratio of extreme settlement to span length (%)
bridge 1 bridge 2bridge 3 bridge 4bridge 5 bridge 6bridge 7 bridge 8bridge 9 Target reliability index
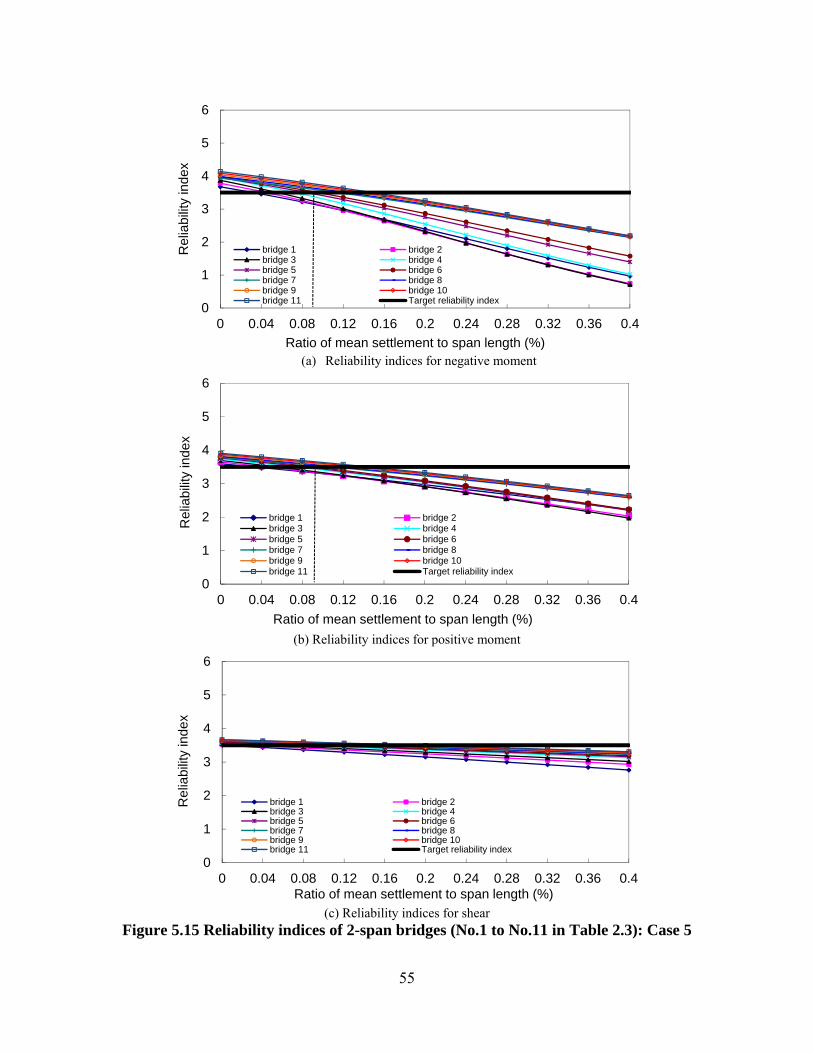
55
(a) Reliability indices for negative moment
(b) Reliability indices for positive moment
(c) Reliability indices for shear
Figure 5.15 Reliability indices of 2-span bridges (No.1 to No.11 in Table 2.3): Case 5
0
1
2
3
4
5
6
0 0.04 0.08 0.12 0.16 0.2 0.24 0.28 0.32 0.36 0.4
Rel
iabi
lity
inde
x
Ratio of mean settlement to span length (%)
bridge 1 bridge 2bridge 3 bridge 4bridge 5 bridge 6bridge 7 bridge 8bridge 9 bridge 10bridge 11 Target reliability index
0
1
2
3
4
5
6
0 0.04 0.08 0.12 0.16 0.2 0.24 0.28 0.32 0.36 0.4
Rel
iabi
lity
inde
x
Ratio of mean settlement to span length (%)
bridge 1 bridge 2bridge 3 bridge 4bridge 5 bridge 6bridge 7 bridge 8bridge 9 bridge 10bridge 11 Target reliability index
0
1
2
3
4
5
6
0 0.04 0.08 0.12 0.16 0.2 0.24 0.28 0.32 0.36 0.4
Rel
iabi
lity
inde
x
Ratio of mean settlement to span length (%)
bridge 1 bridge 2bridge 3 bridge 4bridge 5 bridge 6bridge 7 bridge 8bridge 9 bridge 10bridge 11 Target reliability index
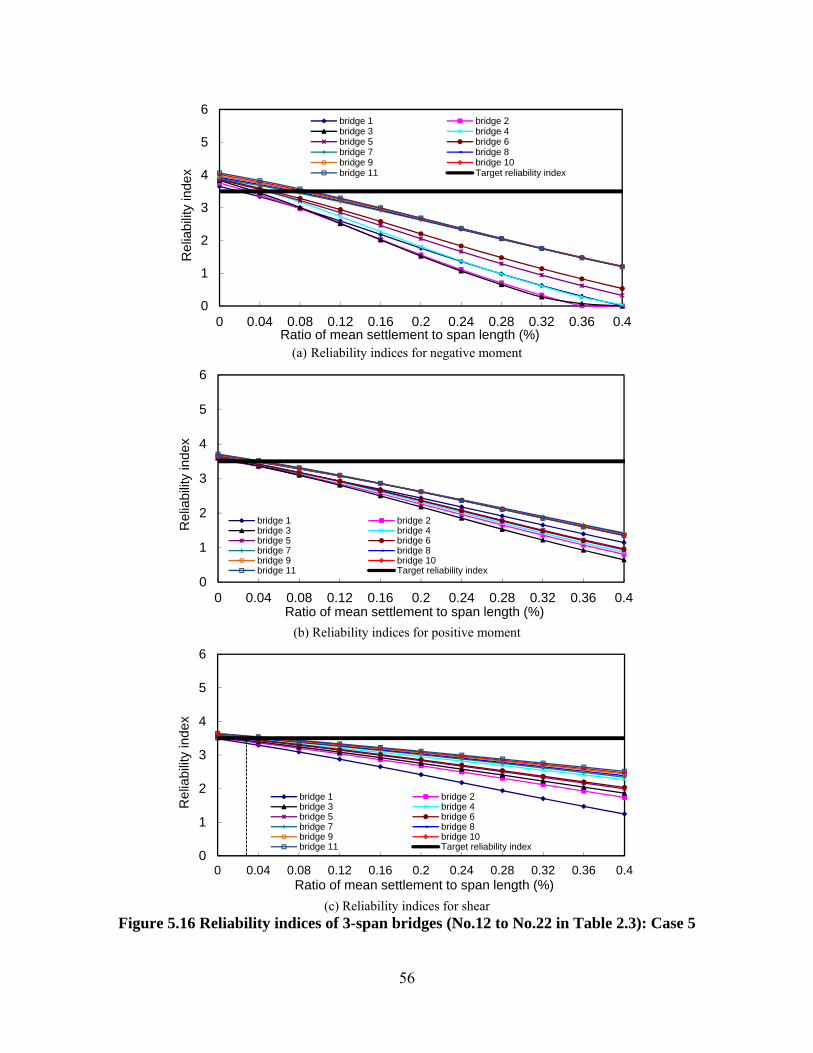
56
(a) Reliability indices for negative moment
(b) Reliability indices for positive moment
(c) Reliability indices for shear
Figure 5.16 Reliability indices of 3-span bridges (No.12 to No.22 in Table 2.3): Case 5
0
1
2
3
4
5
6
0 0.04 0.08 0.12 0.16 0.2 0.24 0.28 0.32 0.36 0.4
Rel
iabi
lity
inde
x
Ratio of mean settlement to span length (%)
bridge 1 bridge 2bridge 3 bridge 4bridge 5 bridge 6bridge 7 bridge 8bridge 9 bridge 10bridge 11 Target reliability index
0
1
2
3
4
5
6
0 0.04 0.08 0.12 0.16 0.2 0.24 0.28 0.32 0.36 0.4
Rel
iabi
lity
inde
x
Ratio of mean settlement to span length (%)
bridge 1 bridge 2bridge 3 bridge 4bridge 5 bridge 6bridge 7 bridge 8bridge 9 bridge 10bridge 11 Target reliability index
0
1
2
3
4
5
6
0 0.04 0.08 0.12 0.16 0.2 0.24 0.28 0.32 0.36 0.4
Rel
iabi
lity
inde
x
Ratio of mean settlement to span length (%)
bridge 1 bridge 2bridge 3 bridge 4bridge 5 bridge 6bridge 7 bridge 8bridge 9 bridge 10bridge 11 Target reliability index
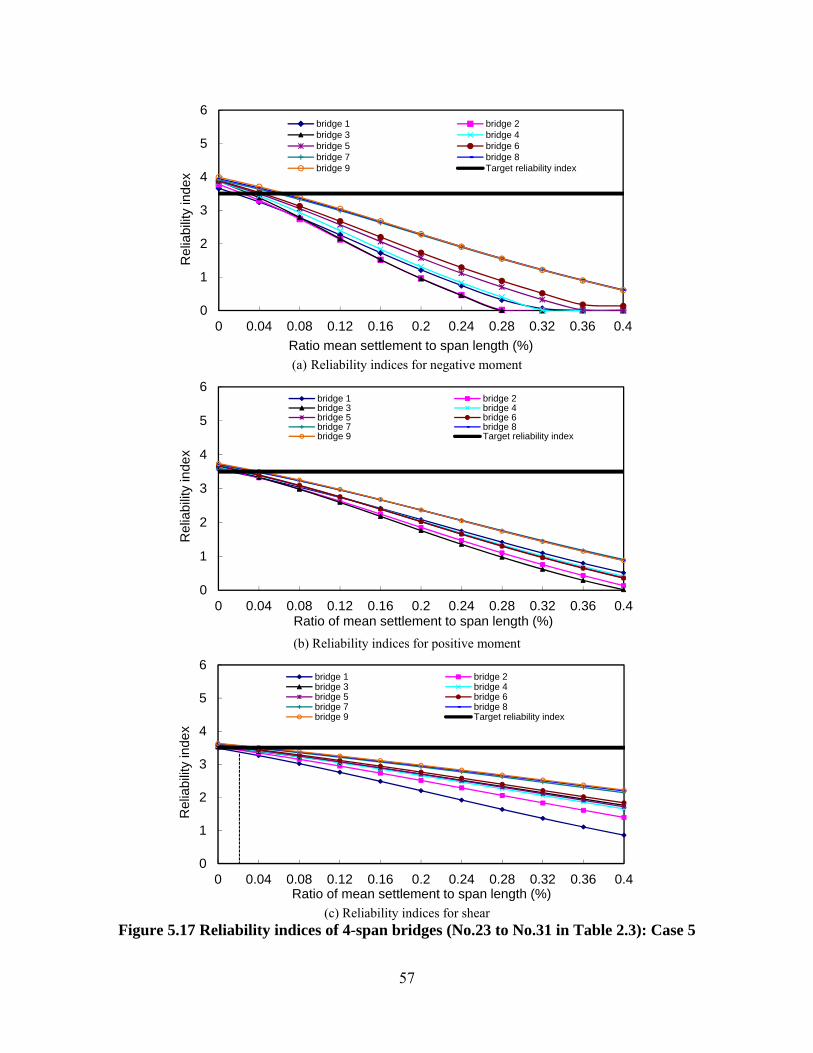
57
(a) Reliability indices for negative moment
(b) Reliability indices for positive moment
(c) Reliability indices for shear
Figure 5.17 Reliability indices of 4-span bridges (No.23 to No.31 in Table 2.3): Case 5
0
1
2
3
4
5
6
0 0.04 0.08 0.12 0.16 0.2 0.24 0.28 0.32 0.36 0.4
Rel
iabi
lity
inde
x
Ratio mean settlement to span length (%)
bridge 1 bridge 2bridge 3 bridge 4bridge 5 bridge 6bridge 7 bridge 8bridge 9 Target reliability index
0
1
2
3
4
5
6
0 0.04 0.08 0.12 0.16 0.2 0.24 0.28 0.32 0.36 0.4
Rel
iabi
lity
inde
x
Ratio of mean settlement to span length (%)
bridge 1 bridge 2bridge 3 bridge 4bridge 5 bridge 6bridge 7 bridge 8bridge 9 Target reliability index
0
1
2
3
4
5
6
0 0.04 0.08 0.12 0.16 0.2 0.24 0.28 0.32 0.36 0.4
Rel
iabi
lity
inde
x
Ratio of mean settlement to span length (%)
bridge 1 bridge 2bridge 3 bridge 4bridge 5 bridge 6bridge 7 bridge 8bridge 9 Target reliability index
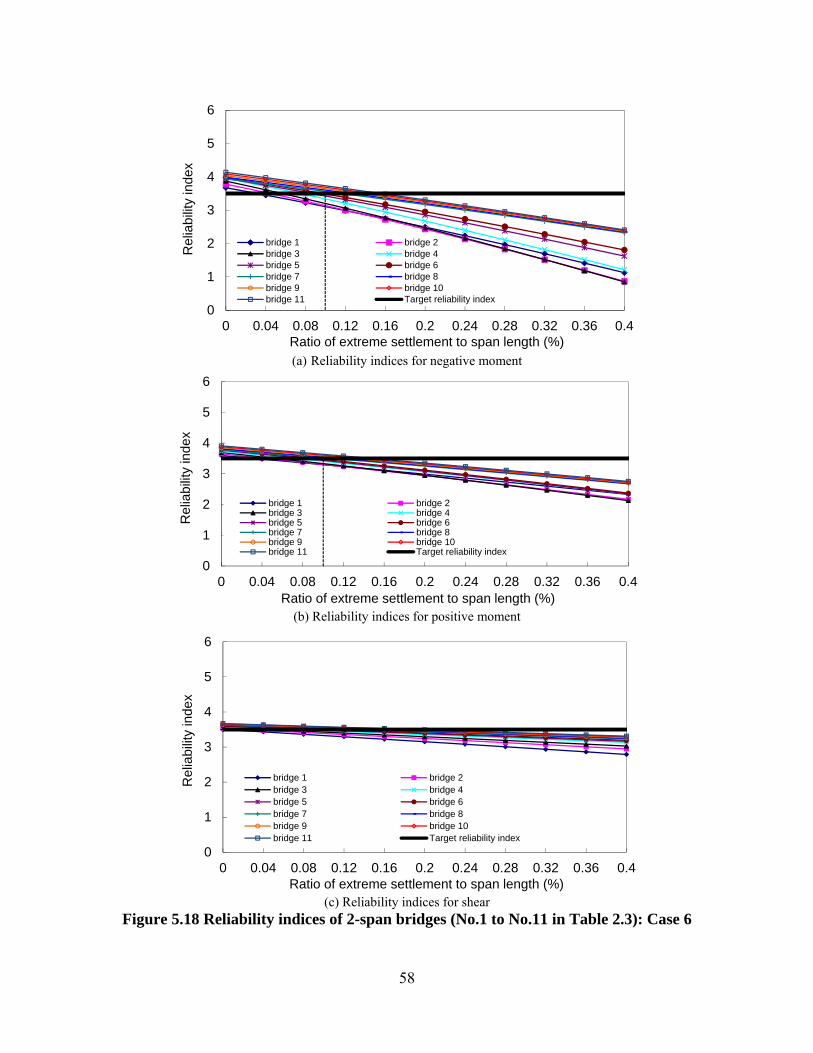
58
(a) Reliability indices for negative moment
(b) Reliability indices for positive moment
(c) Reliability indices for shear
Figure 5.18 Reliability indices of 2-span bridges (No.1 to No.11 in Table 2.3): Case 6
0
1
2
3
4
5
6
0 0.04 0.08 0.12 0.16 0.2 0.24 0.28 0.32 0.36 0.4
Rel
iabi
lity
inde
x
Ratio of extreme settlement to span length (%)
bridge 1 bridge 2bridge 3 bridge 4bridge 5 bridge 6bridge 7 bridge 8bridge 9 bridge 10bridge 11 Target reliability index
0
1
2
3
4
5
6
0 0.04 0.08 0.12 0.16 0.2 0.24 0.28 0.32 0.36 0.4
Rel
iabi
lity
inde
x
Ratio of extreme settlement to span length (%)
bridge 1 bridge 2bridge 3 bridge 4bridge 5 bridge 6bridge 7 bridge 8bridge 9 bridge 10bridge 11 Target reliability index
0
1
2
3
4
5
6
0 0.04 0.08 0.12 0.16 0.2 0.24 0.28 0.32 0.36 0.4
Rel
iabi
lity
inde
x
Ratio of extreme settlement to span length (%)
bridge 1 bridge 2bridge 3 bridge 4bridge 5 bridge 6bridge 7 bridge 8bridge 9 bridge 10bridge 11 Target reliability index
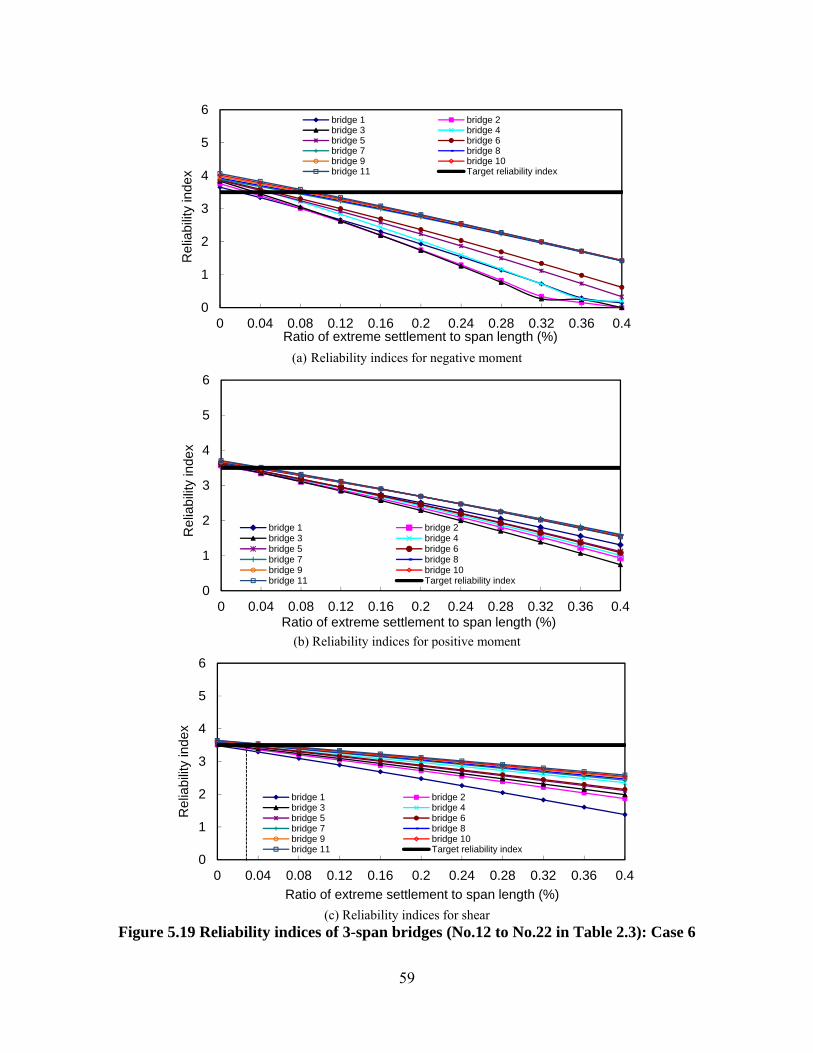
59
(a) Reliability indices for negative moment
(b) Reliability indices for positive moment
(c) Reliability indices for shear
Figure 5.19 Reliability indices of 3-span bridges (No.12 to No.22 in Table 2.3): Case 6
0
1
2
3
4
5
6
0 0.04 0.08 0.12 0.16 0.2 0.24 0.28 0.32 0.36 0.4
Rel
iabi
lity
inde
x
Ratio of extreme settlement to span length (%)
bridge 1 bridge 2bridge 3 bridge 4bridge 5 bridge 6bridge 7 bridge 8bridge 9 bridge 10bridge 11 Target reliability index
0
1
2
3
4
5
6
0 0.04 0.08 0.12 0.16 0.2 0.24 0.28 0.32 0.36 0.4
Rel
iabi
lity
inde
x
Ratio of extreme settlement to span length (%)
bridge 1 bridge 2bridge 3 bridge 4bridge 5 bridge 6bridge 7 bridge 8bridge 9 bridge 10bridge 11 Target reliability index
0
1
2
3
4
5
6
0 0.04 0.08 0.12 0.16 0.2 0.24 0.28 0.32 0.36 0.4
Rel
iabi
lity
inde
x
Ratio of extreme settlement to span length (%)
bridge 1 bridge 2bridge 3 bridge 4bridge 5 bridge 6bridge 7 bridge 8bridge 9 bridge 10bridge 11 Target reliability index
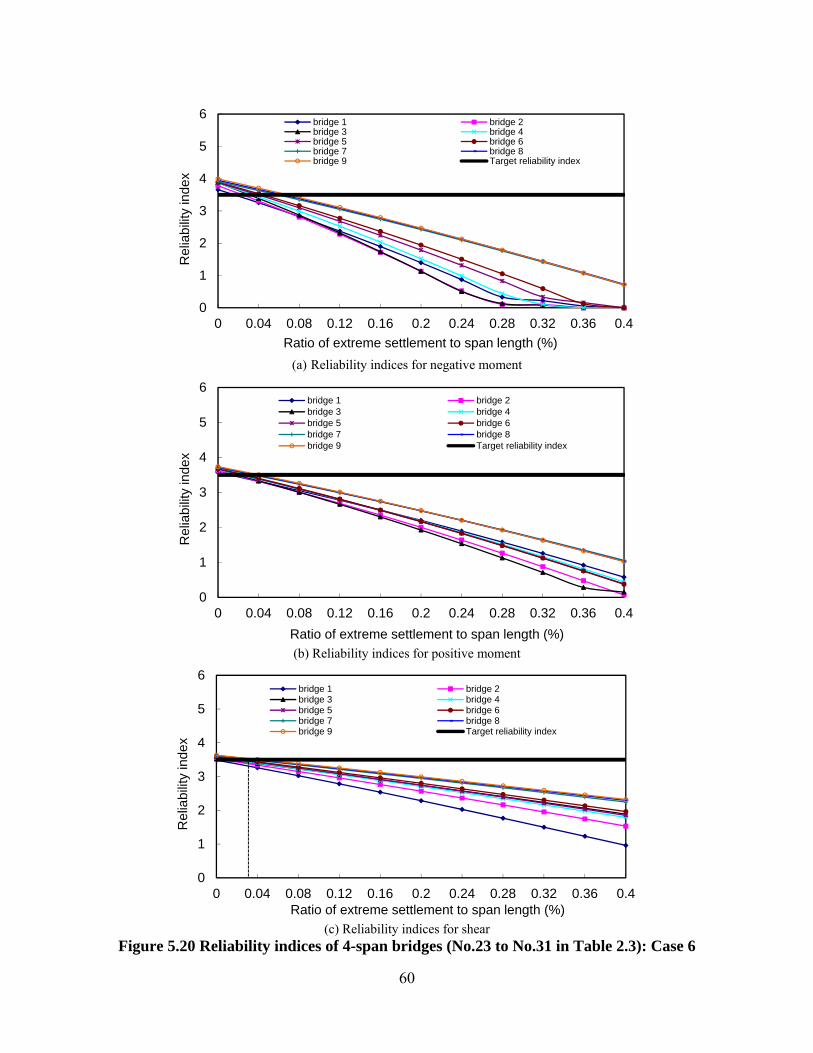
60
(a) Reliability indices for negative moment
(b) Reliability indices for positive moment
(c) Reliability indices for shear
Figure 5.20 Reliability indices of 4-span bridges (No.23 to No.31 in Table 2.3): Case 6
0
1
2
3
4
5
6
0 0.04 0.08 0.12 0.16 0.2 0.24 0.28 0.32 0.36 0.4
Rel
iabi
lity
inde
x
Ratio of extreme settlement to span length (%)
bridge 1 bridge 2bridge 3 bridge 4bridge 5 bridge 6bridge 7 bridge 8bridge 9 Target reliability index
0
1
2
3
4
5
6
0 0.04 0.08 0.12 0.16 0.2 0.24 0.28 0.32 0.36 0.4
Rel
iabi
lity
inde
x
Ratio of extreme settlement to span length (%)
bridge 1 bridge 2bridge 3 bridge 4bridge 5 bridge 6bridge 7 bridge 8bridge 9 Target reliability index
0
1
2
3
4
5
6
0 0.04 0.08 0.12 0.16 0.2 0.24 0.28 0.32 0.36 0.4
Rel
iabi
lity
inde
x
Ratio of extreme settlement to span length (%)
bridge 1 bridge 2bridge 3 bridge 4bridge 5 bridge 6bridge 7 bridge 8bridge 9 Target reliability index
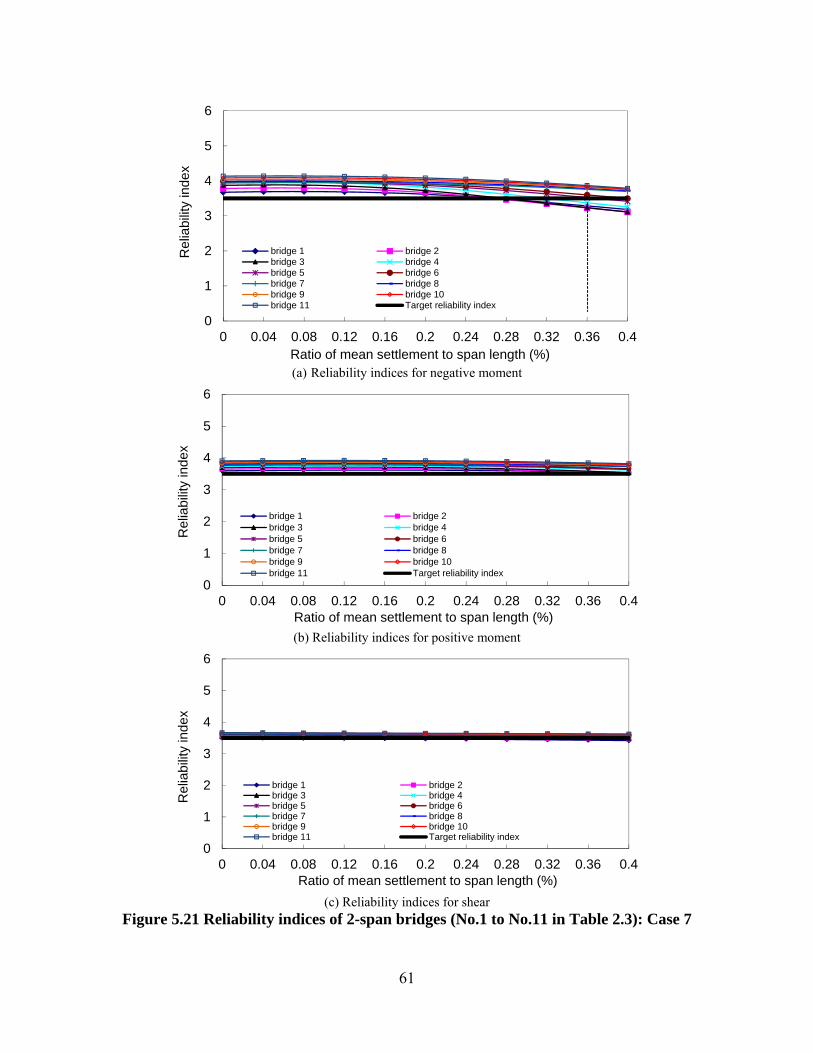
61
(a) Reliability indices for negative moment
(b) Reliability indices for positive moment
(c) Reliability indices for shear
Figure 5.21 Reliability indices of 2-span bridges (No.1 to No.11 in Table 2.3): Case 7
0
1
2
3
4
5
6
0 0.04 0.08 0.12 0.16 0.2 0.24 0.28 0.32 0.36 0.4
Rel
iabi
lity
inde
x
Ratio of mean settlement to span length (%)
bridge 1 bridge 2bridge 3 bridge 4bridge 5 bridge 6bridge 7 bridge 8bridge 9 bridge 10bridge 11 Target reliability index
0
1
2
3
4
5
6
0 0.04 0.08 0.12 0.16 0.2 0.24 0.28 0.32 0.36 0.4
Rel
iabi
lity
inde
x
Ratio of mean settlement to span length (%)
bridge 1 bridge 2bridge 3 bridge 4bridge 5 bridge 6bridge 7 bridge 8bridge 9 bridge 10bridge 11 Target reliability index
0
1
2
3
4
5
6
0 0.04 0.08 0.12 0.16 0.2 0.24 0.28 0.32 0.36 0.4
Rel
iabi
lity
inde
x
Ratio of mean settlement to span length (%)
bridge 1 bridge 2bridge 3 bridge 4bridge 5 bridge 6bridge 7 bridge 8bridge 9 bridge 10bridge 11 Target reliability index
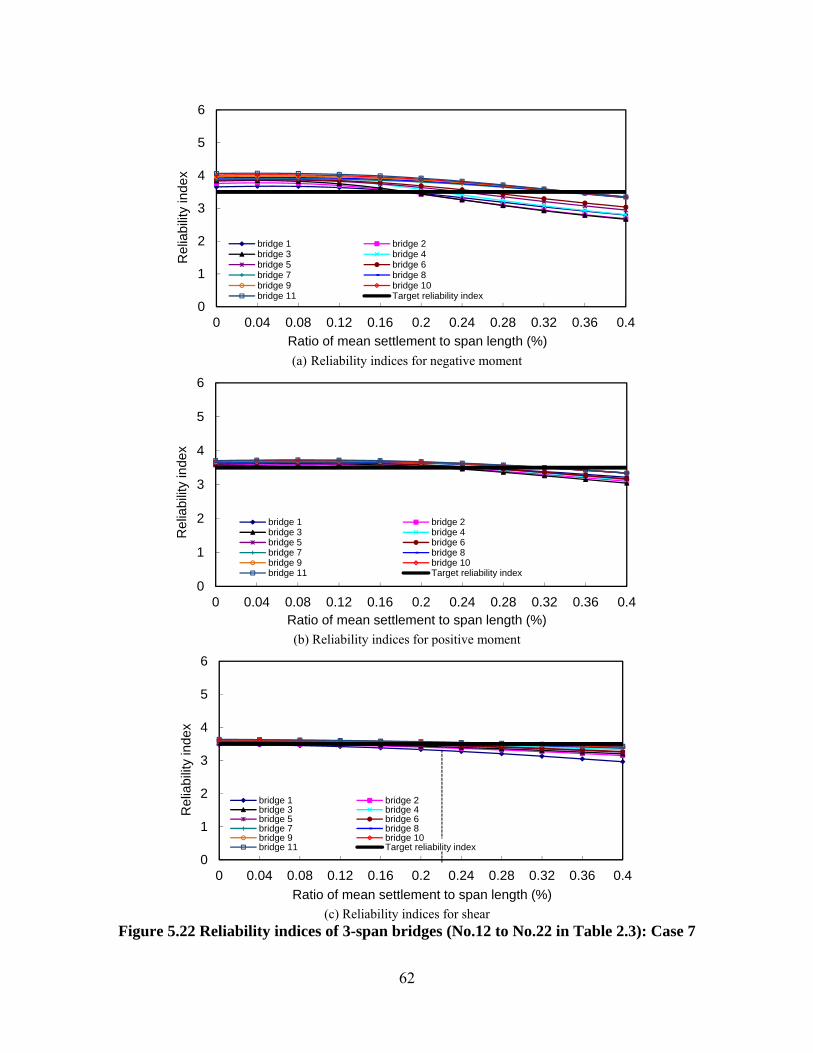
62
(a) Reliability indices for negative moment
(b) Reliability indices for positive moment
(c) Reliability indices for shear
Figure 5.22 Reliability indices of 3-span bridges (No.12 to No.22 in Table 2.3): Case 7
0
1
2
3
4
5
6
0 0.04 0.08 0.12 0.16 0.2 0.24 0.28 0.32 0.36 0.4
Rel
iabi
lity
inde
x
Ratio of mean settlement to span length (%)
bridge 1 bridge 2bridge 3 bridge 4bridge 5 bridge 6bridge 7 bridge 8bridge 9 bridge 10bridge 11 Target reliability index
0
1
2
3
4
5
6
0 0.04 0.08 0.12 0.16 0.2 0.24 0.28 0.32 0.36 0.4
Rel
iabi
lity
inde
x
Ratio of mean settlement to span length (%)
bridge 1 bridge 2bridge 3 bridge 4bridge 5 bridge 6bridge 7 bridge 8bridge 9 bridge 10bridge 11 Target reliability index
0
1
2
3
4
5
6
0 0.04 0.08 0.12 0.16 0.2 0.24 0.28 0.32 0.36 0.4
Rel
iabi
lity
inde
x
Ratio of mean settlement to span length (%)
bridge 1 bridge 2bridge 3 bridge 4bridge 5 bridge 6bridge 7 bridge 8bridge 9 bridge 10bridge 11 Target reliability index
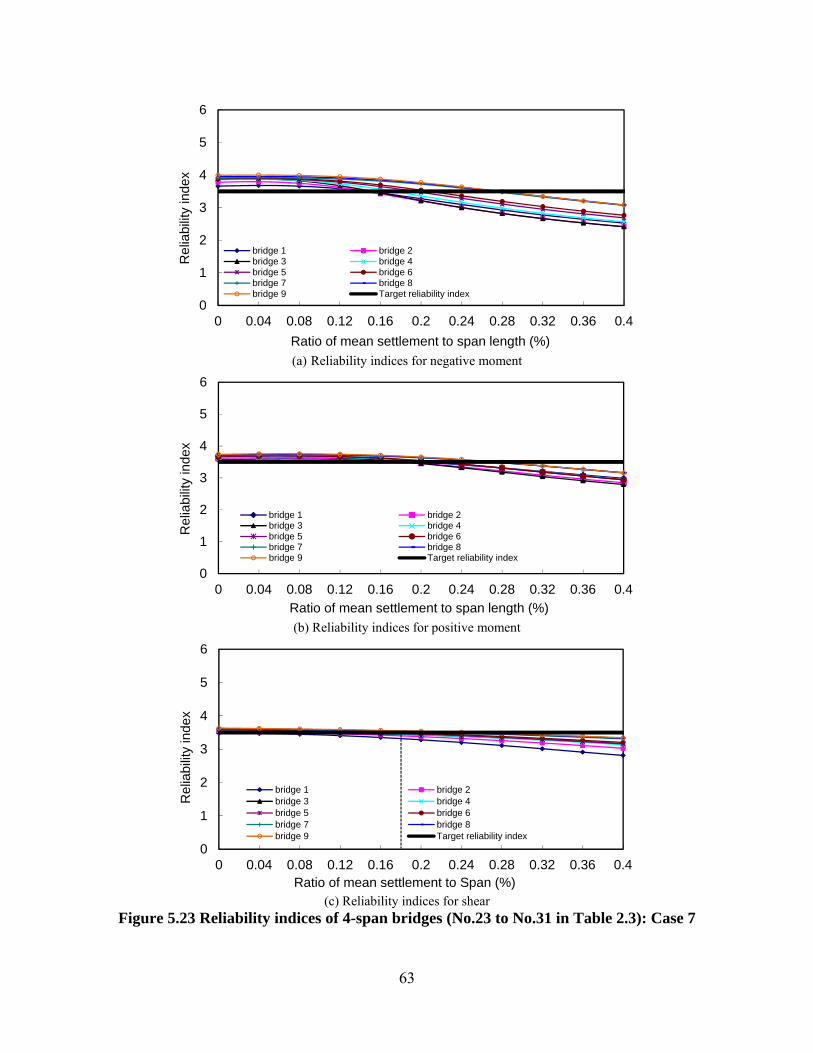
63
(a) Reliability indices for negative moment
(b) Reliability indices for positive moment
(c) Reliability indices for shear
Figure 5.23 Reliability indices of 4-span bridges (No.23 to No.31 in Table 2.3): Case 7
0
1
2
3
4
5
6
0 0.04 0.08 0.12 0.16 0.2 0.24 0.28 0.32 0.36 0.4
Rel
iabi
lity
inde
x
Ratio of mean settlement to span length (%)
bridge 1 bridge 2bridge 3 bridge 4bridge 5 bridge 6bridge 7 bridge 8bridge 9 Target reliability index
0
1
2
3
4
5
6
0 0.04 0.08 0.12 0.16 0.2 0.24 0.28 0.32 0.36 0.4
Rel
iabi
lity
inde
x
Ratio of mean settlement to span length (%)
bridge 1 bridge 2bridge 3 bridge 4bridge 5 bridge 6bridge 7 bridge 8bridge 9 Target reliability index
0
1
2
3
4
5
6
0 0.04 0.08 0.12 0.16 0.2 0.24 0.28 0.32 0.36 0.4
Rel
iabi
lity
inde
x
Ratio of mean settlement to Span (%)
bridge 1 bridge 2bridge 3 bridge 4bridge 5 bridge 6bridge 7 bridge 8bridge 9 Target reliability index
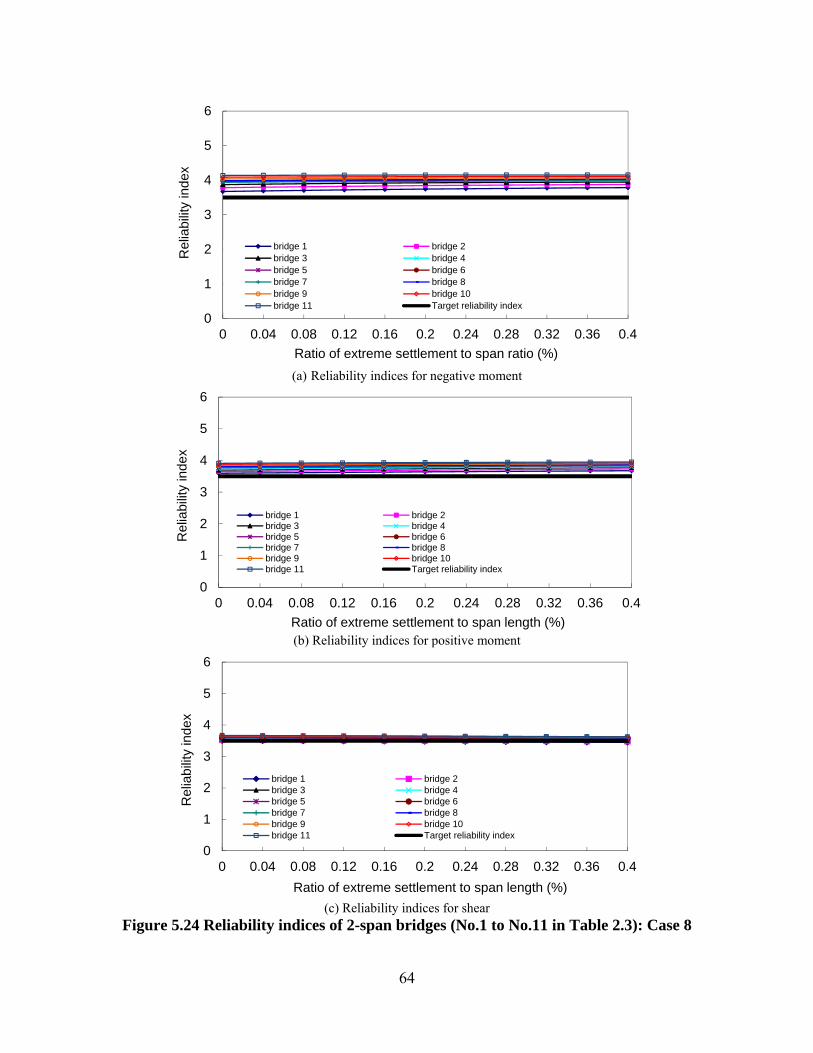
64
(a) Reliability indices for negative moment
(b) Reliability indices for positive moment
(c) Reliability indices for shear
Figure 5.24 Reliability indices of 2-span bridges (No.1 to No.11 in Table 2.3): Case 8
0
1
2
3
4
5
6
0 0.04 0.08 0.12 0.16 0.2 0.24 0.28 0.32 0.36 0.4
Rel
iabi
lity
inde
x
Ratio of extreme settlement to span ratio (%)
bridge 1 bridge 2bridge 3 bridge 4bridge 5 bridge 6bridge 7 bridge 8bridge 9 bridge 10bridge 11 Target reliability index
0
1
2
3
4
5
6
0 0.04 0.08 0.12 0.16 0.2 0.24 0.28 0.32 0.36 0.4
Rel
iabi
lity
inde
x
Ratio of extreme settlement to span length (%)
bridge 1 bridge 2bridge 3 bridge 4bridge 5 bridge 6bridge 7 bridge 8bridge 9 bridge 10bridge 11 Target reliability index
0
1
2
3
4
5
6
0 0.04 0.08 0.12 0.16 0.2 0.24 0.28 0.32 0.36 0.4
Rel
iabi
lity
inde
x
Ratio of extreme settlement to span length (%)
bridge 1 bridge 2bridge 3 bridge 4bridge 5 bridge 6bridge 7 bridge 8bridge 9 bridge 10bridge 11 Target reliability index
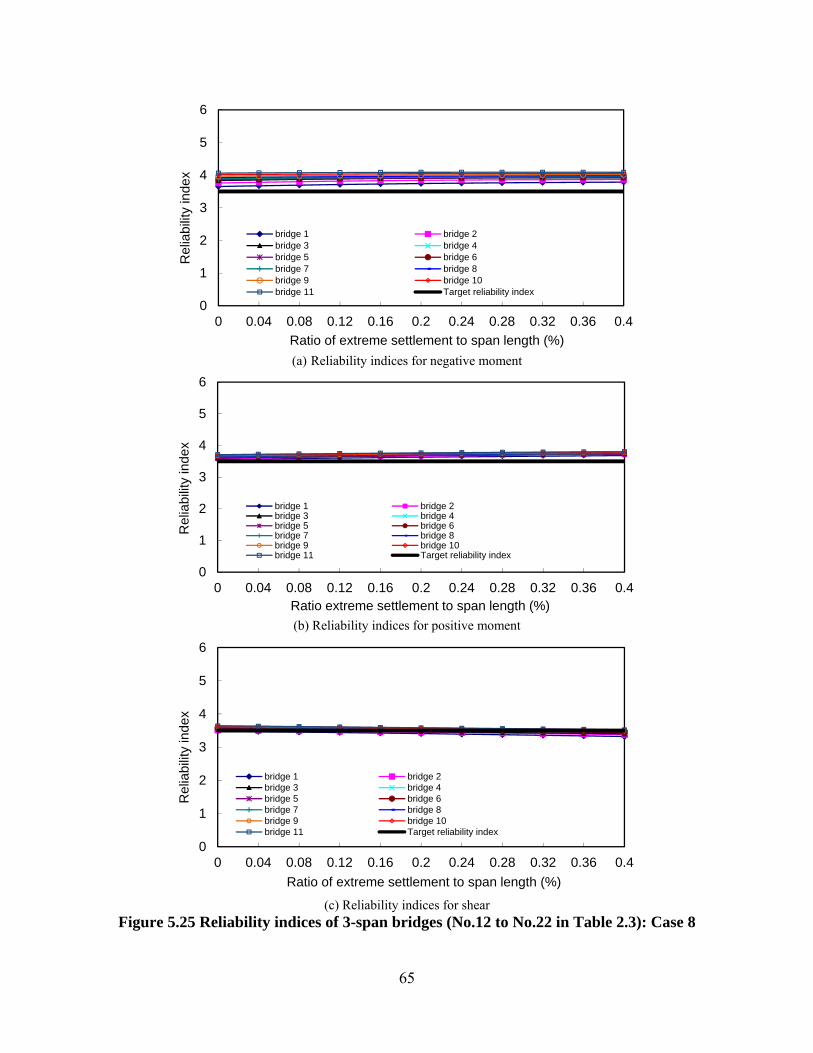
65
(a) Reliability indices for negative moment
(b) Reliability indices for positive moment
(c) Reliability indices for shear
Figure 5.25 Reliability indices of 3-span bridges (No.12 to No.22 in Table 2.3): Case 8
0
1
2
3
4
5
6
0 0.04 0.08 0.12 0.16 0.2 0.24 0.28 0.32 0.36 0.4
Rel
iabi
lity
inde
x
Ratio of extreme settlement to span length (%)
bridge 1 bridge 2bridge 3 bridge 4bridge 5 bridge 6bridge 7 bridge 8bridge 9 bridge 10bridge 11 Target reliability index
0
1
2
3
4
5
6
0 0.04 0.08 0.12 0.16 0.2 0.24 0.28 0.32 0.36 0.4
Rel
iabi
lity
inde
x
Ratio extreme settlement to span length (%)
bridge 1 bridge 2bridge 3 bridge 4bridge 5 bridge 6bridge 7 bridge 8bridge 9 bridge 10bridge 11 Target reliability index
0
1
2
3
4
5
6
0 0.04 0.08 0.12 0.16 0.2 0.24 0.28 0.32 0.36 0.4
Rel
iabi
lity
inde
x
Ratio of extreme settlement to span length (%)
bridge 1 bridge 2bridge 3 bridge 4bridge 5 bridge 6bridge 7 bridge 8bridge 9 bridge 10bridge 11 Target reliability index
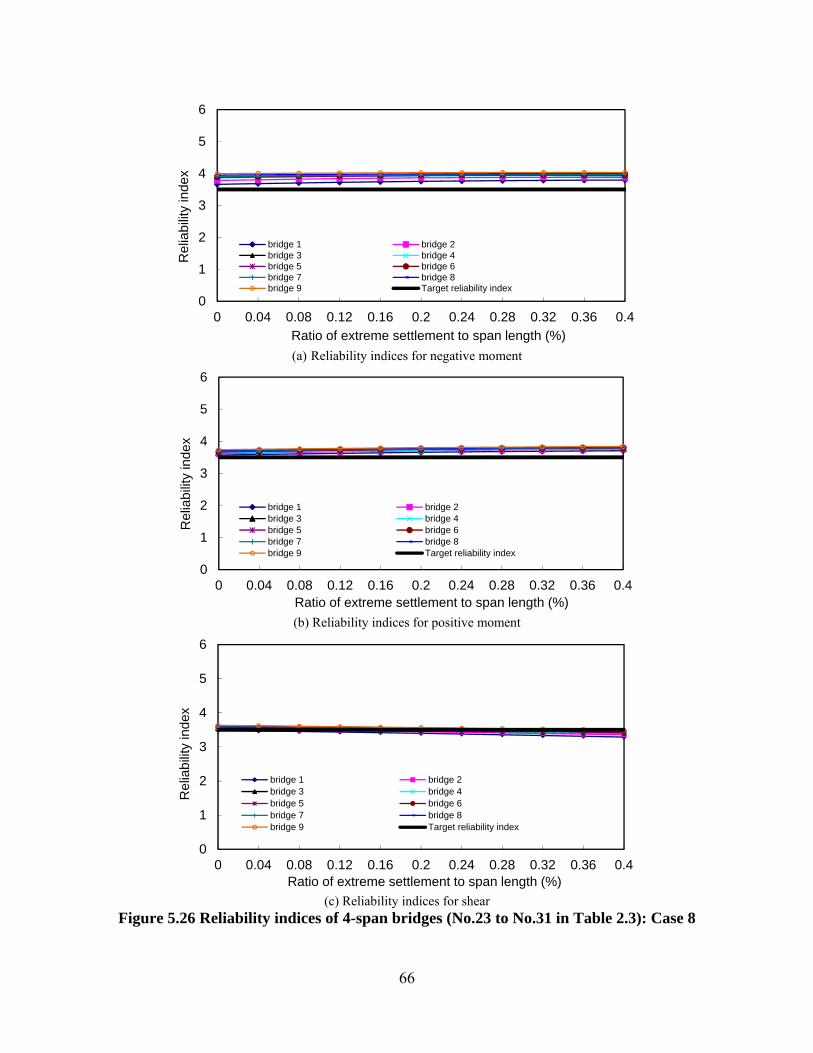
66
(a) Reliability indices for negative moment
(b) Reliability indices for positive moment
(c) Reliability indices for shear
Figure 5.26 Reliability indices of 4-span bridges (No.23 to No.31 in Table 2.3): Case 8
0
1
2
3
4
5
6
0 0.04 0.08 0.12 0.16 0.2 0.24 0.28 0.32 0.36 0.4
Rel
iabi
lity
inde
x
Ratio of extreme settlement to span length (%)
bridge 1 bridge 2bridge 3 bridge 4bridge 5 bridge 6bridge 7 bridge 8bridge 9 Target reliability index
0
1
2
3
4
5
6
0 0.04 0.08 0.12 0.16 0.2 0.24 0.28 0.32 0.36 0.4
Rel
iabi
lity
inde
x
Ratio of extreme settlement to span length (%)
bridge 1 bridge 2bridge 3 bridge 4bridge 5 bridge 6bridge 7 bridge 8bridge 9 Target reliability index
0
1
2
3
4
5
6
0 0.04 0.08 0.12 0.16 0.2 0.24 0.28 0.32 0.36 0.4
Rel
iabi
lity
inde
x
Ratio of extreme settlement to span length (%)
bridge 1 bridge 2bridge 3 bridge 4bridge 5 bridge 6bridge 7 bridge 8bridge 9 Target reliability index
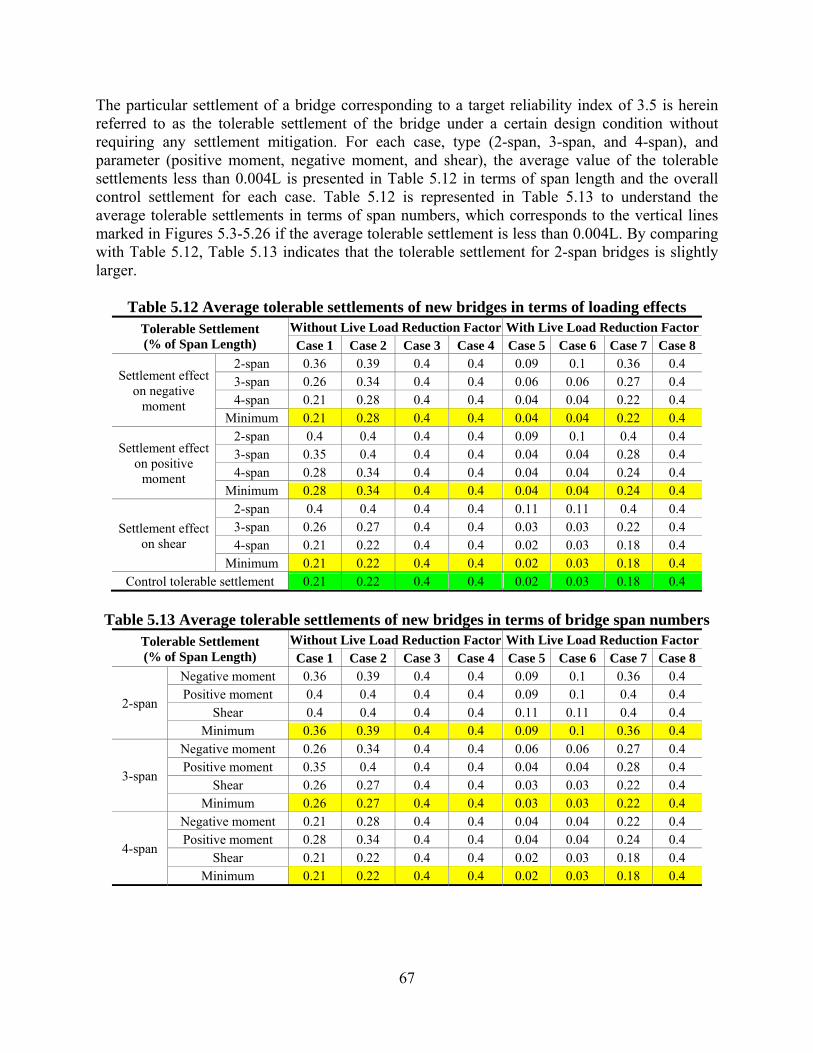
67
The particular settlement of a bridge corresponding to a target reliability index of 3.5 is herein referred to as the tolerable settlement of the bridge under a certain design condition without requiring any settlement mitigation. For each case, type (2-span, 3-span, and 4-span), and parameter (positive moment, negative moment, and shear), the average value of the tolerable settlements less than 0.004L is presented in Table 5.12 in terms of span length and the overall control settlement for each case. Table 5.12 is represented in Table 5.13 to understand the average tolerable settlements in terms of span numbers, which corresponds to the vertical lines marked in Figures 5.3-5.26 if the average tolerable settlement is less than 0.004L. By comparing with Table 5.12, Table 5.13 indicates that the tolerable settlement for 2-span bridges is slightly larger.
Table 5.12 Average tolerable settlements of new bridges in terms of loading effects Tolerable Settlement (% of Span Length)
Without Live Load Reduction Factor With Live Load Reduction FactorCase 1 Case 2 Case 3 Case 4 Case 5 Case 6 Case 7 Case 8
Settlement effect on negative
moment
2-span 0.36 0.39 0.4 0.4 0.09 0.1 0.36 0.4 3-span 0.26 0.34 0.4 0.4 0.06 0.06 0.27 0.4 4-span 0.21 0.28 0.4 0.4 0.04 0.04 0.22 0.4
Minimum 0.21 0.28 0.4 0.4 0.04 0.04 0.22 0.4
Settlement effect on positive
moment
2-span 0.4 0.4 0.4 0.4 0.09 0.1 0.4 0.4 3-span 0.35 0.4 0.4 0.4 0.04 0.04 0.28 0.4 4-span 0.28 0.34 0.4 0.4 0.04 0.04 0.24 0.4
Minimum 0.28 0.34 0.4 0.4 0.04 0.04 0.24 0.4
Settlement effect on shear
2-span 0.4 0.4 0.4 0.4 0.11 0.11 0.4 0.4 3-span 0.26 0.27 0.4 0.4 0.03 0.03 0.22 0.4 4-span 0.21 0.22 0.4 0.4 0.02 0.03 0.18 0.4
Minimum 0.21 0.22 0.4 0.4 0.02 0.03 0.18 0.4 Control tolerable settlement 0.21 0.22 0.4 0.4 0.02 0.03 0.18 0.4
Table 5.13 Average tolerable settlements of new bridges in terms of bridge span numbers
Tolerable Settlement (% of Span Length)
Without Live Load Reduction Factor With Live Load Reduction FactorCase 1 Case 2 Case 3 Case 4 Case 5 Case 6 Case 7 Case 8
2-span
Negative moment 0.36 0.39 0.4 0.4 0.09 0.1 0.36 0.4 Positive moment 0.4 0.4 0.4 0.4 0.09 0.1 0.4 0.4
Shear 0.4 0.4 0.4 0.4 0.11 0.11 0.4 0.4 Minimum 0.36 0.39 0.4 0.4 0.09 0.1 0.36 0.4
3-span
Negative moment 0.26 0.34 0.4 0.4 0.06 0.06 0.27 0.4 Positive moment 0.35 0.4 0.4 0.4 0.04 0.04 0.28 0.4
Shear 0.26 0.27 0.4 0.4 0.03 0.03 0.22 0.4 Minimum 0.26 0.27 0.4 0.4 0.03 0.03 0.22 0.4
4-span
Negative moment 0.21 0.28 0.4 0.4 0.04 0.04 0.22 0.4 Positive moment 0.28 0.34 0.4 0.4 0.04 0.04 0.24 0.4
Shear 0.21 0.22 0.4 0.4 0.02 0.03 0.18 0.4 Minimum 0.21 0.22 0.4 0.4 0.02 0.03 0.18 0.4
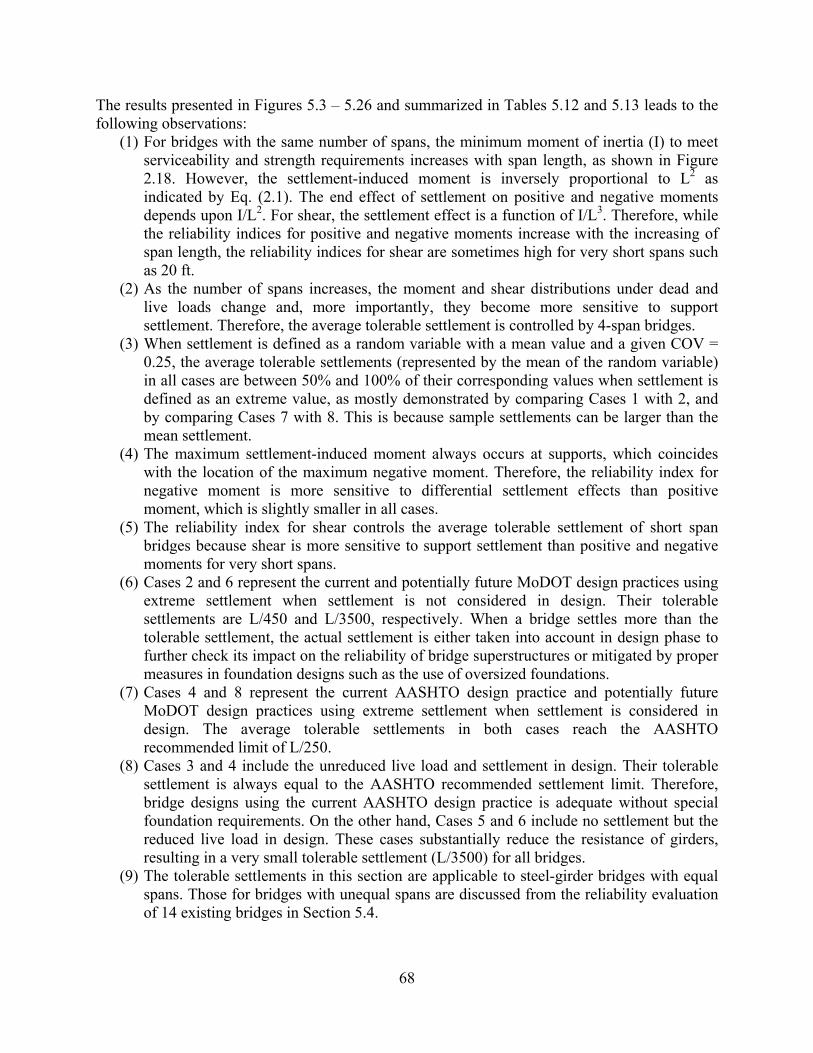
68
The results presented in Figures 5.3 – 5.26 and summarized in Tables 5.12 and 5.13 leads to the following observations:
(1) For bridges with the same number of spans, the minimum moment of inertia (I) to meet serviceability and strength requirements increases with span length, as shown in Figure 2.18. However, the settlement-induced moment is inversely proportional to L2 as indicated by Eq. (2.1). The end effect of settlement on positive and negative moments depends upon I/L2. For shear, the settlement effect is a function of I/L3. Therefore, while the reliability indices for positive and negative moments increase with the increasing of span length, the reliability indices for shear are sometimes high for very short spans such as 20 ft.
(2) As the number of spans increases, the moment and shear distributions under dead and live loads change and, more importantly, they become more sensitive to support settlement. Therefore, the average tolerable settlement is controlled by 4-span bridges.
(3) When settlement is defined as a random variable with a mean value and a given COV = 0.25, the average tolerable settlements (represented by the mean of the random variable) in all cases are between 50% and 100% of their corresponding values when settlement is defined as an extreme value, as mostly demonstrated by comparing Cases 1 with 2, and by comparing Cases 7 with 8. This is because sample settlements can be larger than the mean settlement.
(4) The maximum settlement-induced moment always occurs at supports, which coincides with the location of the maximum negative moment. Therefore, the reliability index for negative moment is more sensitive to differential settlement effects than positive moment, which is slightly smaller in all cases.
(5) The reliability index for shear controls the average tolerable settlement of short span bridges because shear is more sensitive to support settlement than positive and negative moments for very short spans.
(6) Cases 2 and 6 represent the current and potentially future MoDOT design practices using extreme settlement when settlement is not considered in design. Their tolerable settlements are L/450 and L/3500, respectively. When a bridge settles more than the tolerable settlement, the actual settlement is either taken into account in design phase to further check its impact on the reliability of bridge superstructures or mitigated by proper measures in foundation designs such as the use of oversized foundations.
(7) Cases 4 and 8 represent the current AASHTO design practice and potentially future MoDOT design practices using extreme settlement when settlement is considered in design. The average tolerable settlements in both cases reach the AASHTO recommended limit of L/250.
(8) Cases 3 and 4 include the unreduced live load and settlement in design. Their tolerable settlement is always equal to the AASHTO recommended settlement limit. Therefore, bridge designs using the current AASHTO design practice is adequate without special foundation requirements. On the other hand, Cases 5 and 6 include no settlement but the reduced live load in design. These cases substantially reduce the resistance of girders, resulting in a very small tolerable settlement (L/3500) for all bridges.
(9) The tolerable settlements in this section are applicable to steel-girder bridges with equal spans. Those for bridges with unequal spans are discussed from the reliability evaluation of 14 existing bridges in Section 5.4.
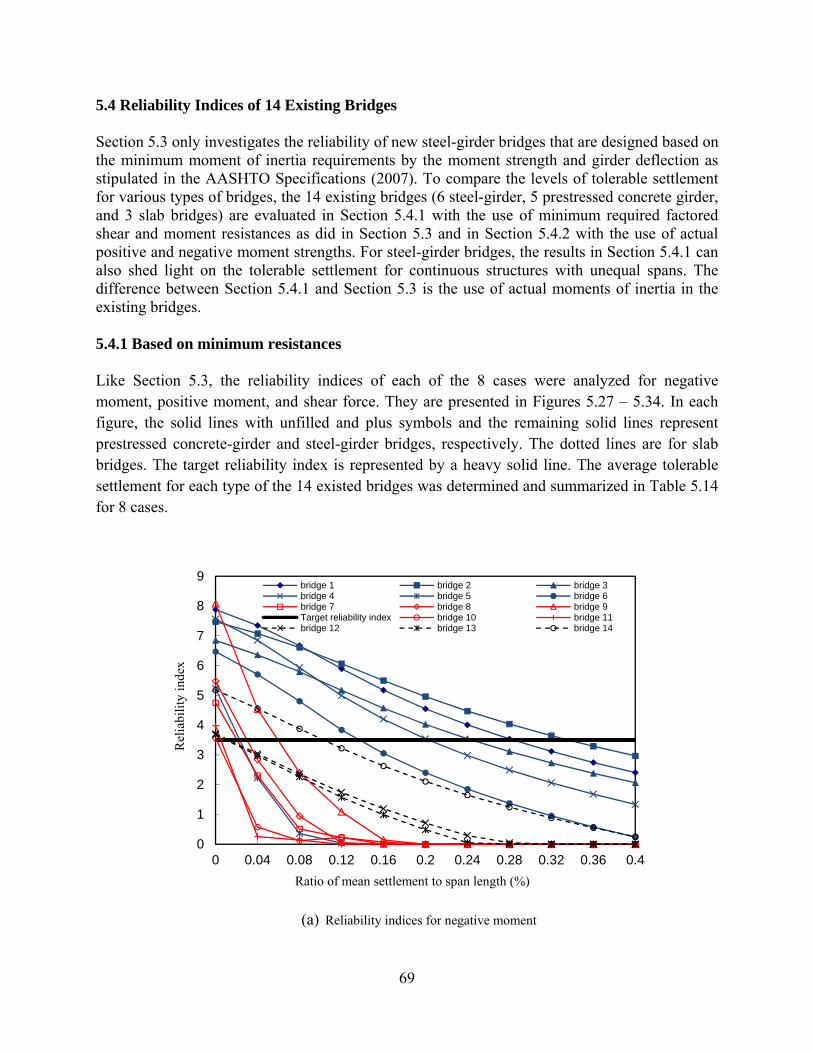
69
5.4 Reliability Indices of 14 Existing Bridges Section 5.3 only investigates the reliability of new steel-girder bridges that are designed based on the minimum moment of inertia requirements by the moment strength and girder deflection as stipulated in the AASHTO Specifications (2007). To compare the levels of tolerable settlement for various types of bridges, the 14 existing bridges (6 steel-girder, 5 prestressed concrete girder, and 3 slab bridges) are evaluated in Section 5.4.1 with the use of minimum required factored shear and moment resistances as did in Section 5.3 and in Section 5.4.2 with the use of actual positive and negative moment strengths. For steel-girder bridges, the results in Section 5.4.1 can also shed light on the tolerable settlement for continuous structures with unequal spans. The difference between Section 5.4.1 and Section 5.3 is the use of actual moments of inertia in the existing bridges. 5.4.1 Based on minimum resistances Like Section 5.3, the reliability indices of each of the 8 cases were analyzed for negative moment, positive moment, and shear force. They are presented in Figures 5.27 – 5.34. In each figure, the solid lines with unfilled and plus symbols and the remaining solid lines represent prestressed concrete-girder and steel-girder bridges, respectively. The dotted lines are for slab bridges. The target reliability index is represented by a heavy solid line. The average tolerable settlement for each type of the 14 existed bridges was determined and summarized in Table 5.14 for 8 cases.
(a) Reliability indices for negative moment
0
1
2
3
4
5
6
7
8
9
0 0.04 0.08 0.12 0.16 0.2 0.24 0.28 0.32 0.36 0.4
Rel
iabi
lity
inde
x
Ratio of mean settlement to span length (%)
bridge 1 bridge 2 bridge 3bridge 4 bridge 5 bridge 6bridge 7 bridge 8 bridge 9Target reliability index bridge 10 bridge 11bridge 12 bridge 13 bridge 14
70
(b) Reliability indices for positive moment
(c) Reliability indices for shear
Figure 5.27 Reliability indices of 14 existing bridges: Case 1
0
1
2
3
4
5
6
7
8
9
0 0.04 0.08 0.12 0.16 0.2 0.24 0.28 0.32 0.36 0.4
Rel
iabi
lity
inde
x
Ratio of mean settlement to span length (%)
bridge 1 bridge 2 bridge 3bridge 4 bridge 5 bridge 6bridge 7 bridge 8 bridge 9Target reliability index bridge 10 bridge 11bridge 12 bridge 13 bridge 14
0
1
2
3
4
5
0 0.04 0.08 0.12 0.16 0.2 0.24 0.28 0.32 0.36 0.4
Rel
iabi
lity
inde
x
Ratio of mean settlement to span length (%)
bridge 1 bridge 2bridge 3 bridge 4bridge 5 bridge 6bridge 7 bridge 8bridge 9 Target reliability indexbridge 10 bridge 11bridge 12 bridge 13bridge 14
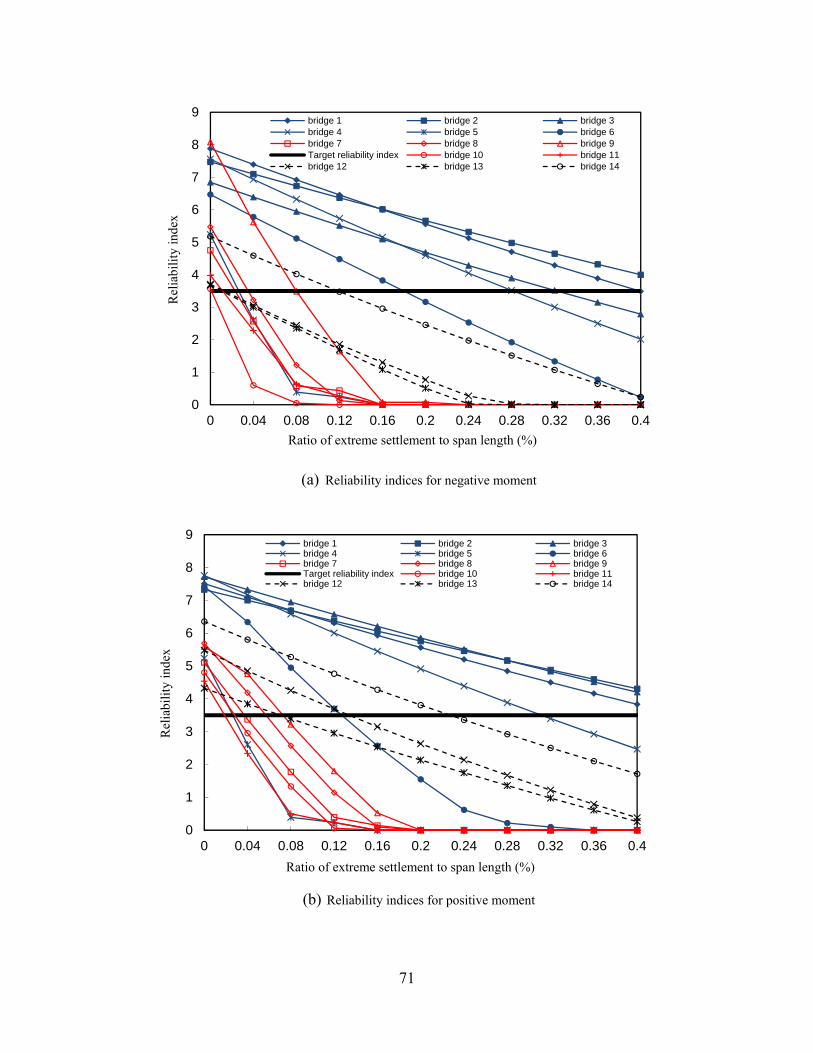
71
(a) Reliability indices for negative moment
(b) Reliability indices for positive moment
0
1
2
3
4
5
6
7
8
9
0 0.04 0.08 0.12 0.16 0.2 0.24 0.28 0.32 0.36 0.4
Rel
iabi
lity
inde
x
Ratio of extreme settlement to span length (%)
bridge 1 bridge 2 bridge 3bridge 4 bridge 5 bridge 6bridge 7 bridge 8 bridge 9Target reliability index bridge 10 bridge 11bridge 12 bridge 13 bridge 14
0
1
2
3
4
5
6
7
8
9
0 0.04 0.08 0.12 0.16 0.2 0.24 0.28 0.32 0.36 0.4
Rel
iabi
lity
inde
x
Ratio of extreme settlement to span length (%)
bridge 1 bridge 2 bridge 3bridge 4 bridge 5 bridge 6bridge 7 bridge 8 bridge 9Target reliability index bridge 10 bridge 11bridge 12 bridge 13 bridge 14
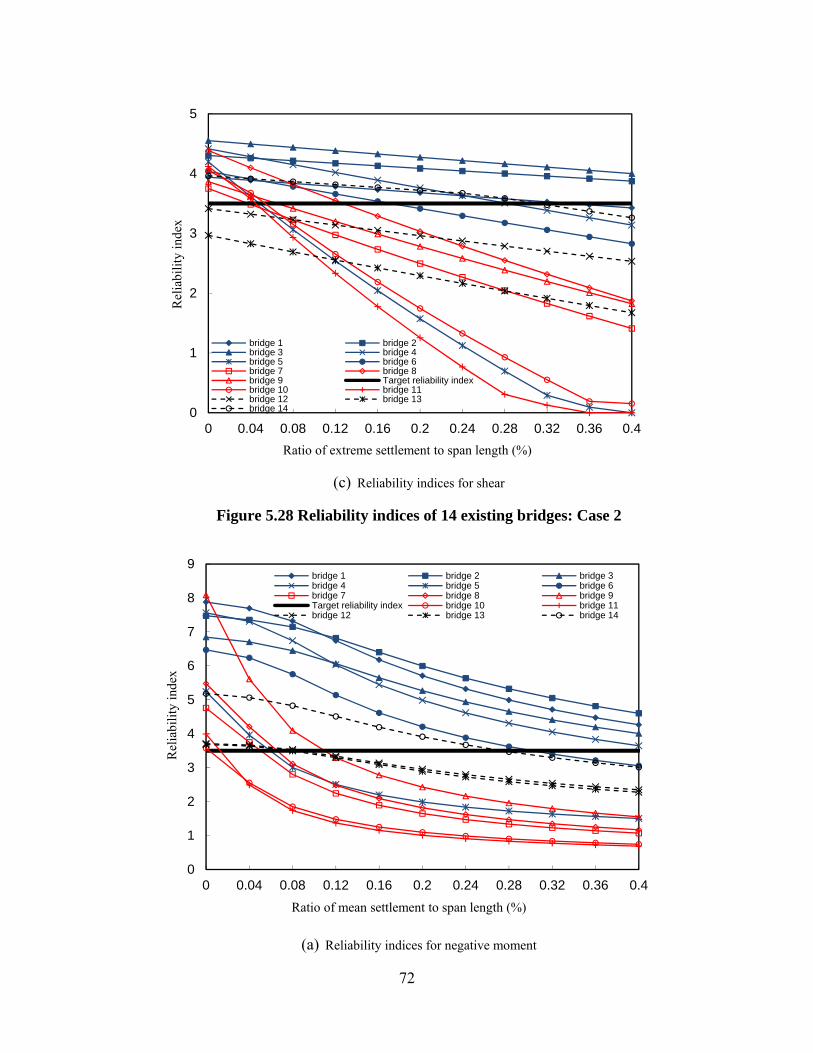
72
(c) Reliability indices for shear
Figure 5.28 Reliability indices of 14 existing bridges: Case 2
(a) Reliability indices for negative moment
0
1
2
3
4
5
0 0.04 0.08 0.12 0.16 0.2 0.24 0.28 0.32 0.36 0.4
Rel
iabi
lity
inde
x
Ratio of extreme settlement to span length (%)
bridge 1 bridge 2bridge 3 bridge 4bridge 5 bridge 6bridge 7 bridge 8bridge 9 Target reliability indexbridge 10 bridge 11bridge 12 bridge 13bridge 14
0
1
2
3
4
5
6
7
8
9
0 0.04 0.08 0.12 0.16 0.2 0.24 0.28 0.32 0.36 0.4
Rel
iabi
lity
inde
x
Ratio of mean settlement to span length (%)
bridge 1 bridge 2 bridge 3bridge 4 bridge 5 bridge 6bridge 7 bridge 8 bridge 9Target reliability index bridge 10 bridge 11bridge 12 bridge 13 bridge 14
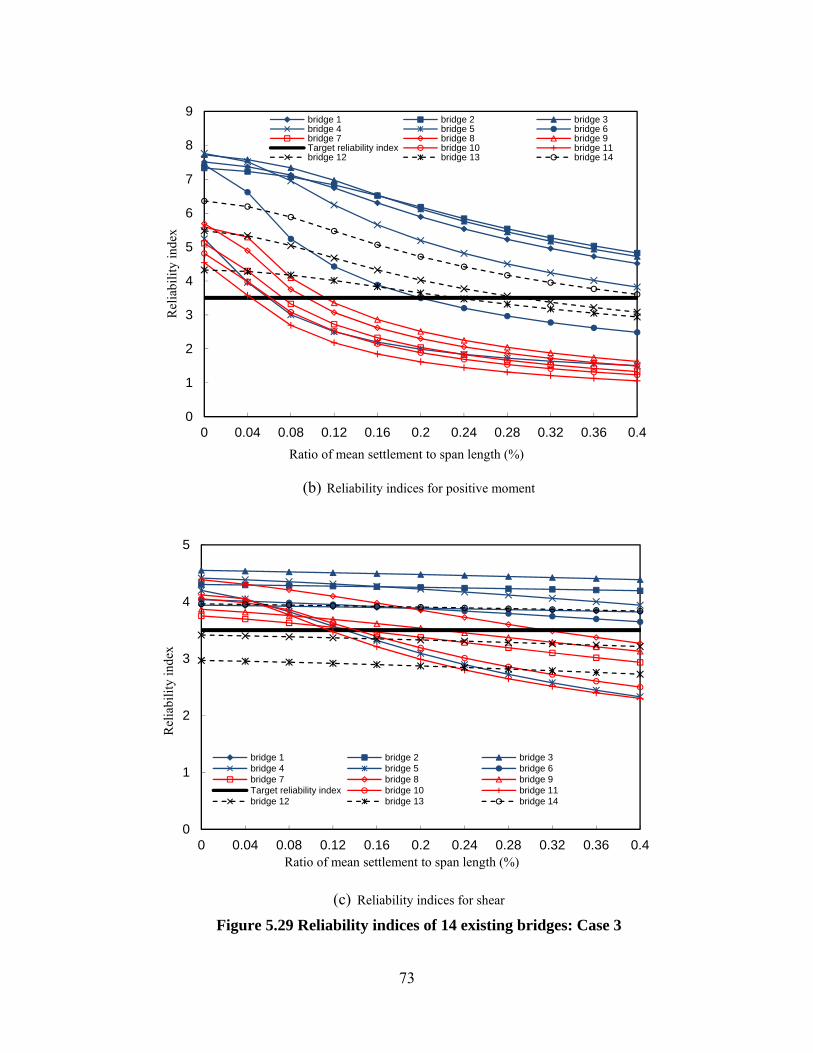
73
(b) Reliability indices for positive moment
(c) Reliability indices for shear
Figure 5.29 Reliability indices of 14 existing bridges: Case 3
0
1
2
3
4
5
6
7
8
9
0 0.04 0.08 0.12 0.16 0.2 0.24 0.28 0.32 0.36 0.4
Rel
iabi
lity
inde
x
Ratio of mean settlement to span length (%)
bridge 1 bridge 2 bridge 3bridge 4 bridge 5 bridge 6bridge 7 bridge 8 bridge 9Target reliability index bridge 10 bridge 11bridge 12 bridge 13 bridge 14
0
1
2
3
4
5
0 0.04 0.08 0.12 0.16 0.2 0.24 0.28 0.32 0.36 0.4
Rel
iabi
lity
inde
x
Ratio of mean settlement to span length (%)
bridge 1 bridge 2 bridge 3bridge 4 bridge 5 bridge 6bridge 7 bridge 8 bridge 9Target reliability index bridge 10 bridge 11bridge 12 bridge 13 bridge 14
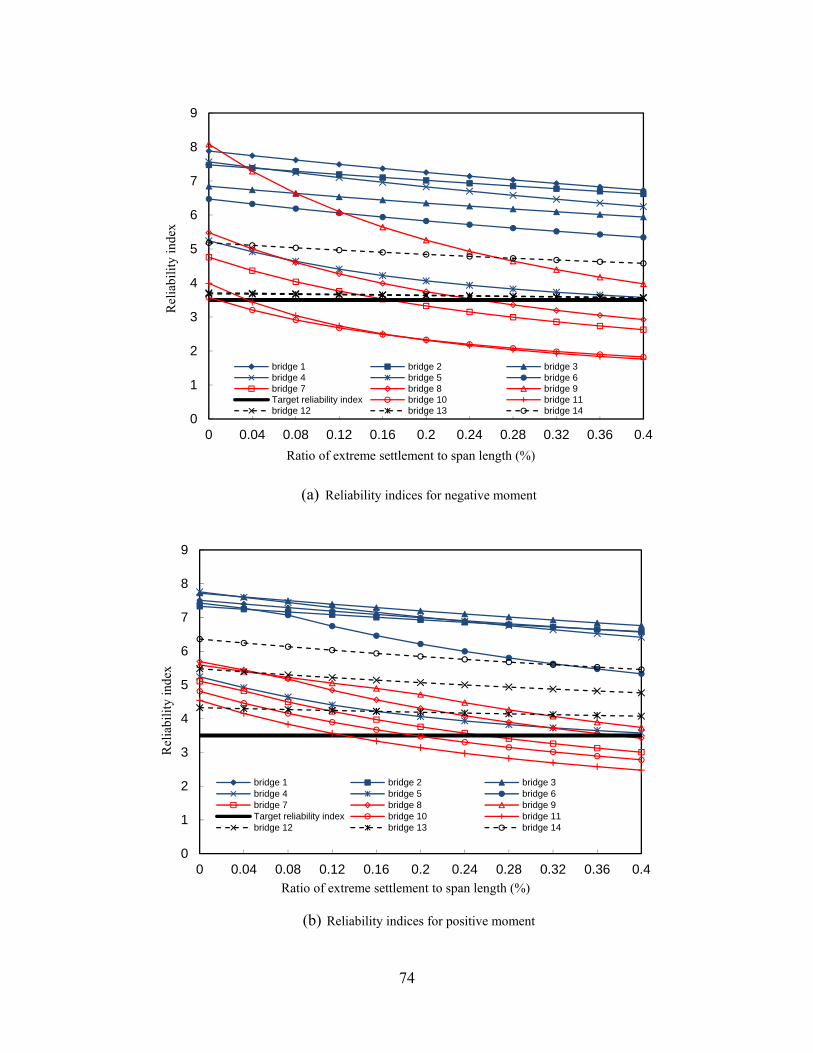
74
(a) Reliability indices for negative moment
(b) Reliability indices for positive moment
0
1
2
3
4
5
6
7
8
9
0 0.04 0.08 0.12 0.16 0.2 0.24 0.28 0.32 0.36 0.4
Rel
iabi
lity
inde
x
Ratio of extreme settlement to span length (%)
bridge 1 bridge 2 bridge 3bridge 4 bridge 5 bridge 6bridge 7 bridge 8 bridge 9Target reliability index bridge 10 bridge 11bridge 12 bridge 13 bridge 14
0
1
2
3
4
5
6
7
8
9
0 0.04 0.08 0.12 0.16 0.2 0.24 0.28 0.32 0.36 0.4
Rel
iabi
lity
inde
x
Ratio of extreme settlement to span length (%)
bridge 1 bridge 2 bridge 3bridge 4 bridge 5 bridge 6bridge 7 bridge 8 bridge 9Target reliability index bridge 10 bridge 11bridge 12 bridge 13 bridge 14
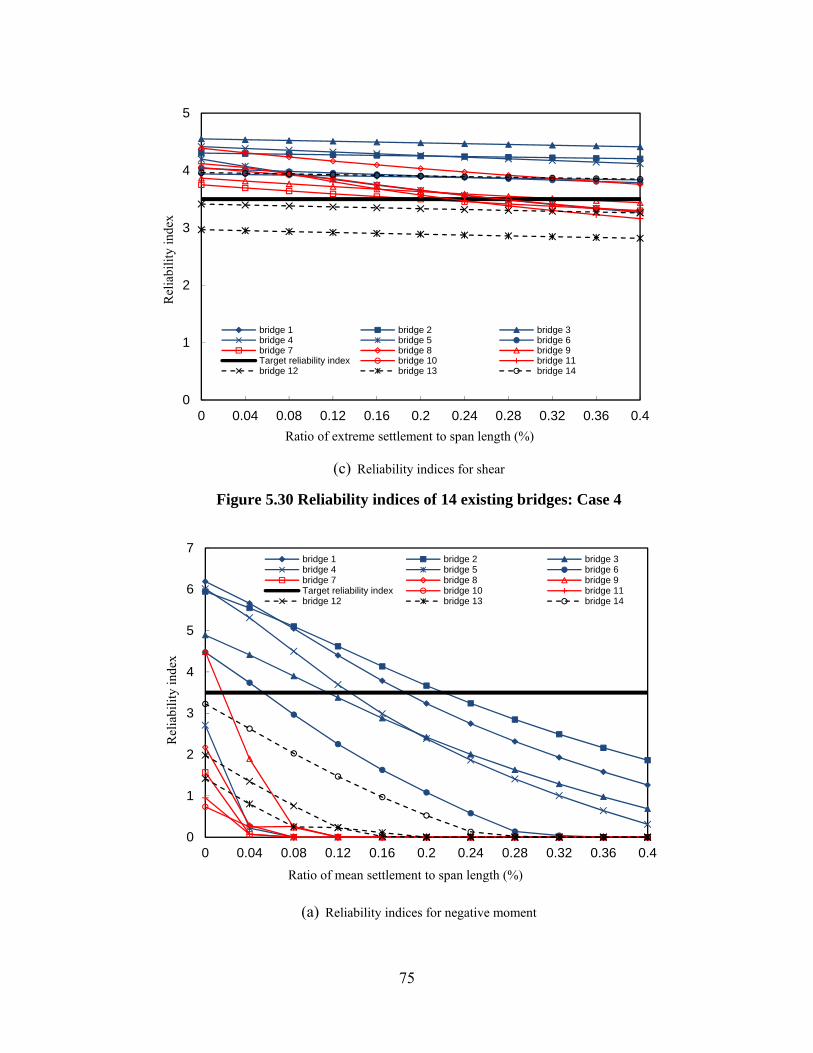
75
(c) Reliability indices for shear
Figure 5.30 Reliability indices of 14 existing bridges: Case 4
(a) Reliability indices for negative moment
0
1
2
3
4
5
0 0.04 0.08 0.12 0.16 0.2 0.24 0.28 0.32 0.36 0.4
Rel
iabi
lity
inde
x
Ratio of extreme settlement to span length (%)
bridge 1 bridge 2 bridge 3bridge 4 bridge 5 bridge 6bridge 7 bridge 8 bridge 9Target reliability index bridge 10 bridge 11bridge 12 bridge 13 bridge 14
0
1
2
3
4
5
6
7
0 0.04 0.08 0.12 0.16 0.2 0.24 0.28 0.32 0.36 0.4
Rel
iabi
lity
inde
x
Ratio of mean settlement to span length (%)
bridge 1 bridge 2 bridge 3bridge 4 bridge 5 bridge 6bridge 7 bridge 8 bridge 9Target reliability index bridge 10 bridge 11bridge 12 bridge 13 bridge 14
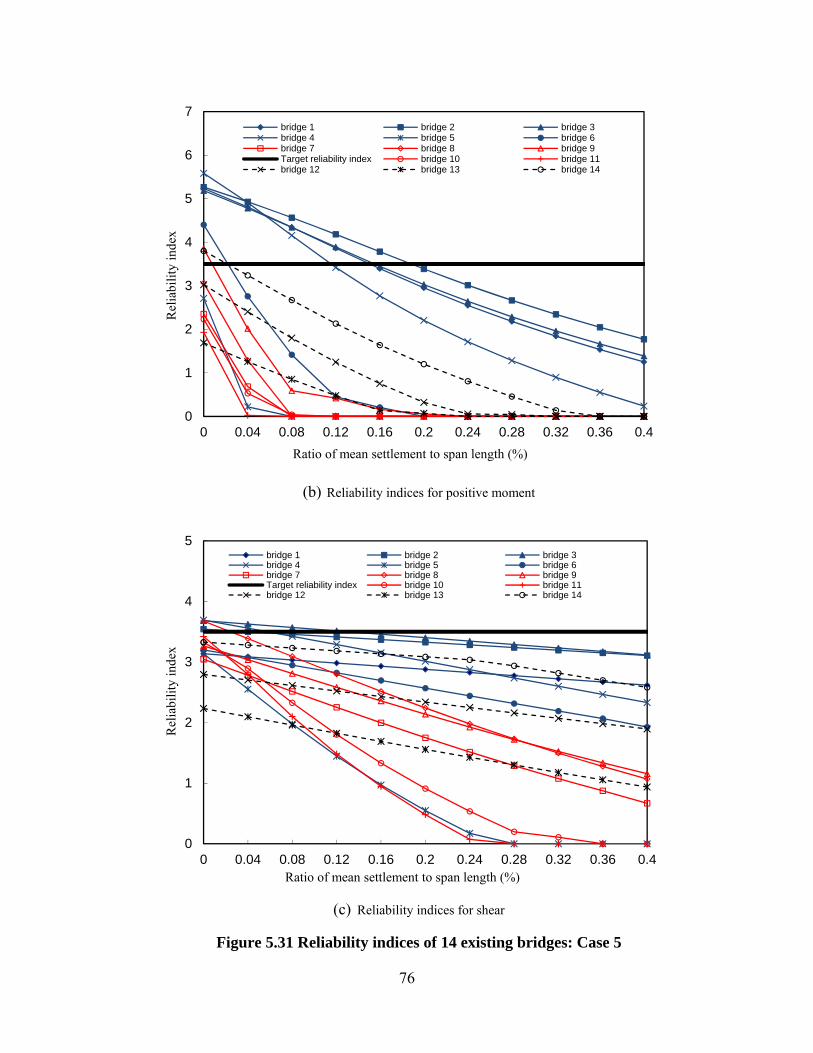
76
(b) Reliability indices for positive moment
(c) Reliability indices for shear
Figure 5.31 Reliability indices of 14 existing bridges: Case 5
0
1
2
3
4
5
6
7
0 0.04 0.08 0.12 0.16 0.2 0.24 0.28 0.32 0.36 0.4
Rel
iabi
lity
inde
x
Ratio of mean settlement to span length (%)
bridge 1 bridge 2 bridge 3bridge 4 bridge 5 bridge 6bridge 7 bridge 8 bridge 9Target reliability index bridge 10 bridge 11bridge 12 bridge 13 bridge 14
0
1
2
3
4
5
0 0.04 0.08 0.12 0.16 0.2 0.24 0.28 0.32 0.36 0.4
Rel
iabi
lity
inde
x
Ratio of mean settlement to span length (%)
bridge 1 bridge 2 bridge 3bridge 4 bridge 5 bridge 6bridge 7 bridge 8 bridge 9Target reliability index bridge 10 bridge 11bridge 12 bridge 13 bridge 14
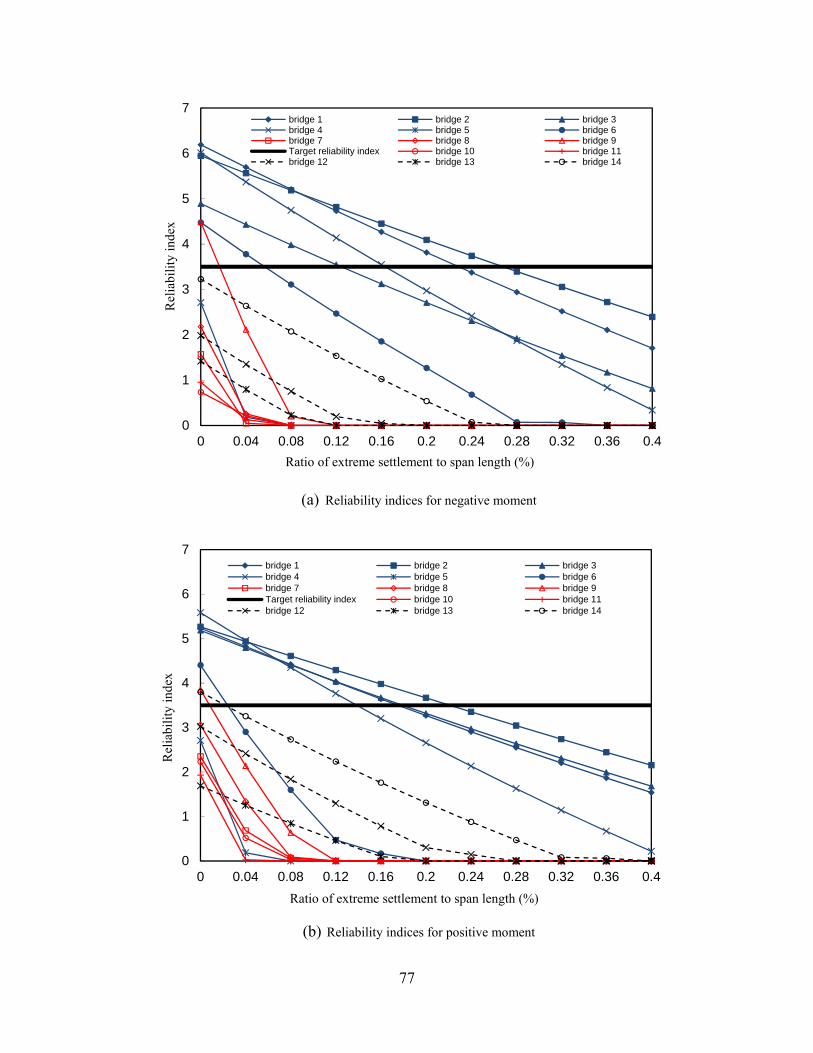
77
(a) Reliability indices for negative moment
(b) Reliability indices for positive moment
0
1
2
3
4
5
6
7
0 0.04 0.08 0.12 0.16 0.2 0.24 0.28 0.32 0.36 0.4
Rel
iabi
lity
inde
x
Ratio of extreme settlement to span length (%)
bridge 1 bridge 2 bridge 3bridge 4 bridge 5 bridge 6bridge 7 bridge 8 bridge 9Target reliability index bridge 10 bridge 11bridge 12 bridge 13 bridge 14
0
1
2
3
4
5
6
7
0 0.04 0.08 0.12 0.16 0.2 0.24 0.28 0.32 0.36 0.4
Rel
iabi
lity
inde
x
Ratio of extreme settlement to span length (%)
bridge 1 bridge 2 bridge 3bridge 4 bridge 5 bridge 6bridge 7 bridge 8 bridge 9Target reliability index bridge 10 bridge 11bridge 12 bridge 13 bridge 14
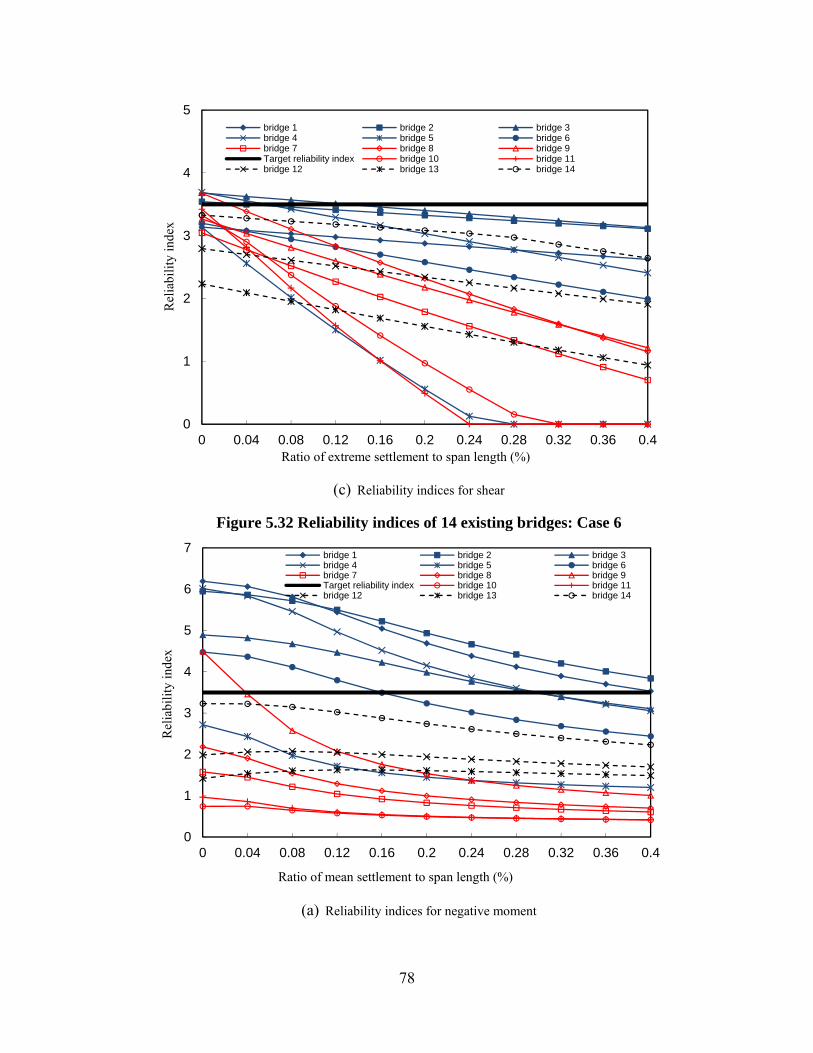
78
(c) Reliability indices for shear
Figure 5.32 Reliability indices of 14 existing bridges: Case 6
(a) Reliability indices for negative moment
0
1
2
3
4
5
0 0.04 0.08 0.12 0.16 0.2 0.24 0.28 0.32 0.36 0.4
Rel
iabi
lity
inde
x
Ratio of extreme settlement to span length (%)
bridge 1 bridge 2 bridge 3bridge 4 bridge 5 bridge 6bridge 7 bridge 8 bridge 9Target reliability index bridge 10 bridge 11bridge 12 bridge 13 bridge 14
0
1
2
3
4
5
6
7
0 0.04 0.08 0.12 0.16 0.2 0.24 0.28 0.32 0.36 0.4
Rel
iabi
lity
inde
x
Ratio of mean settlement to span length (%)
bridge 1 bridge 2 bridge 3bridge 4 bridge 5 bridge 6bridge 7 bridge 8 bridge 9Target reliability index bridge 10 bridge 11bridge 12 bridge 13 bridge 14
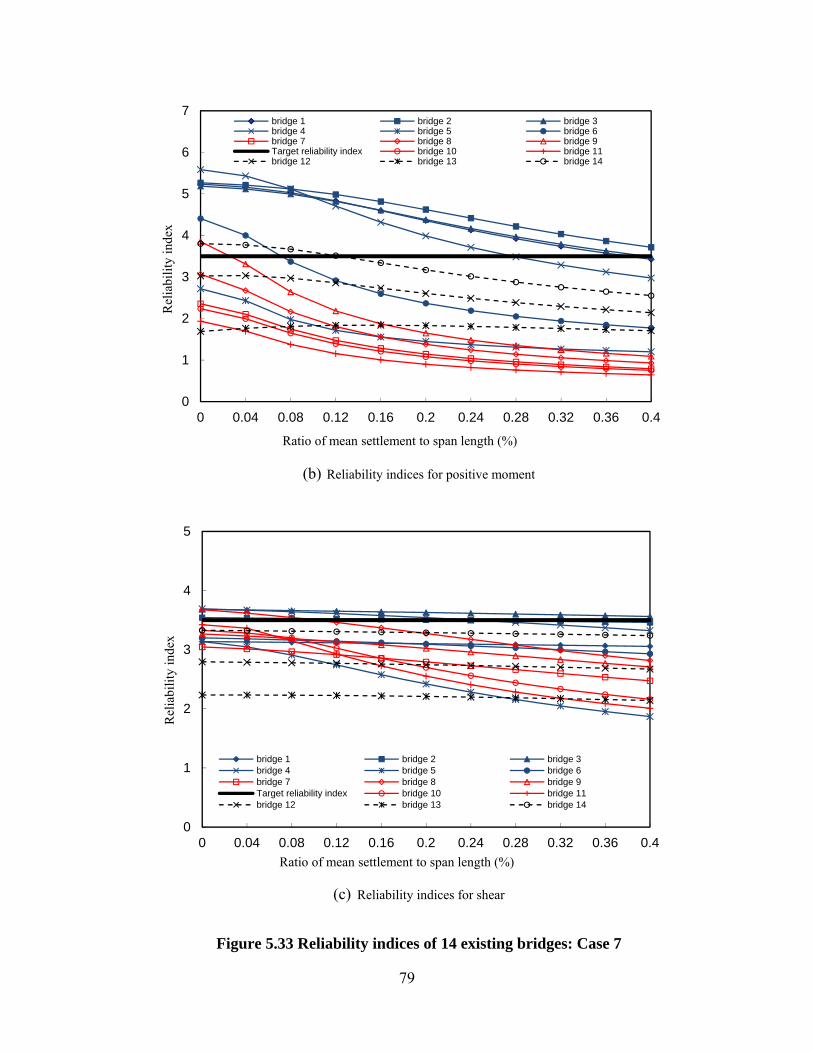
79
(b) Reliability indices for positive moment
(c) Reliability indices for shear
Figure 5.33 Reliability indices of 14 existing bridges: Case 7
0
1
2
3
4
5
6
7
0 0.04 0.08 0.12 0.16 0.2 0.24 0.28 0.32 0.36 0.4
Rel
iabi
lity
inde
x
Ratio of mean settlement to span length (%)
bridge 1 bridge 2 bridge 3bridge 4 bridge 5 bridge 6bridge 7 bridge 8 bridge 9Target reliability index bridge 10 bridge 11bridge 12 bridge 13 bridge 14
0
1
2
3
4
5
0 0.04 0.08 0.12 0.16 0.2 0.24 0.28 0.32 0.36 0.4
Rel
iabi
lity
inde
x
Ratio of mean settlement to span length (%)
bridge 1 bridge 2 bridge 3bridge 4 bridge 5 bridge 6bridge 7 bridge 8 bridge 9Target reliability index bridge 10 bridge 11bridge 12 bridge 13 bridge 14
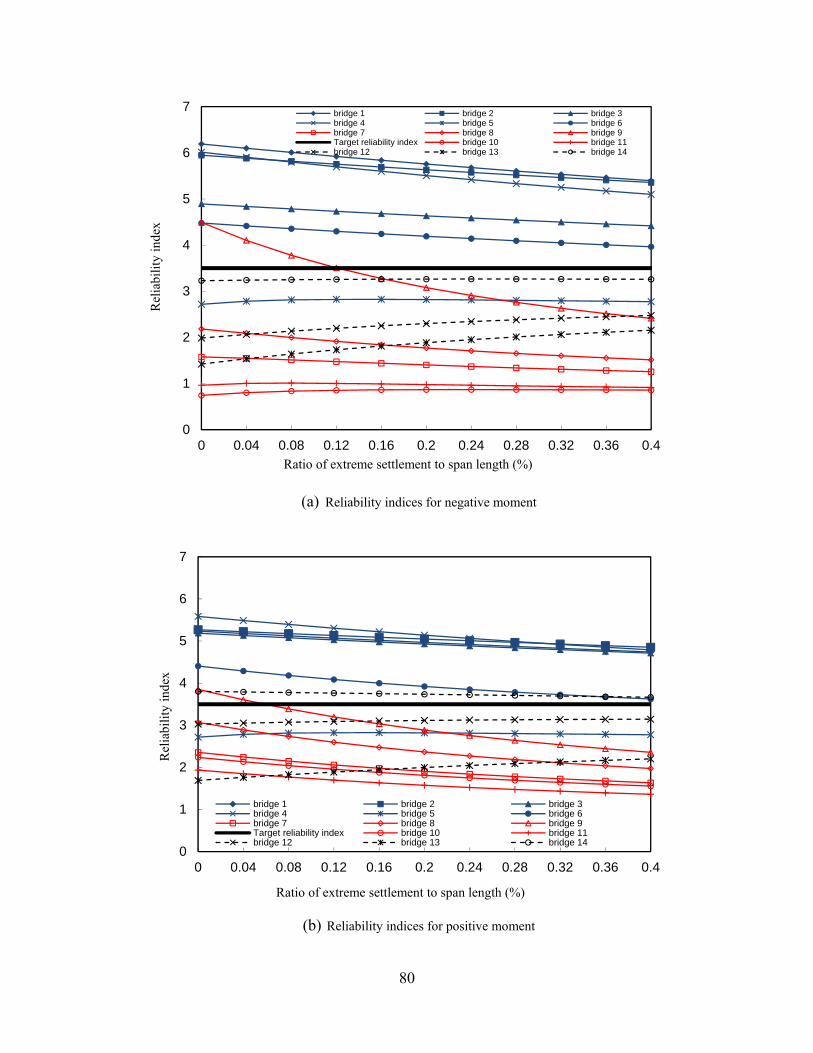
80
(a) Reliability indices for negative moment
(b) Reliability indices for positive moment
0
1
2
3
4
5
6
7
0 0.04 0.08 0.12 0.16 0.2 0.24 0.28 0.32 0.36 0.4
Rel
iabi
lity
inde
x
Ratio of extreme settlement to span length (%)
bridge 1 bridge 2 bridge 3bridge 4 bridge 5 bridge 6bridge 7 bridge 8 bridge 9Target reliability index bridge 10 bridge 11bridge 12 bridge 13 bridge 14
0
1
2
3
4
5
6
7
0 0.04 0.08 0.12 0.16 0.2 0.24 0.28 0.32 0.36 0.4
Rel
iabi
lity
inde
x
Ratio of extreme settlement to span length (%)
bridge 1 bridge 2 bridge 3bridge 4 bridge 5 bridge 6bridge 7 bridge 8 bridge 9Target reliability index bridge 10 bridge 11bridge 12 bridge 13 bridge 14
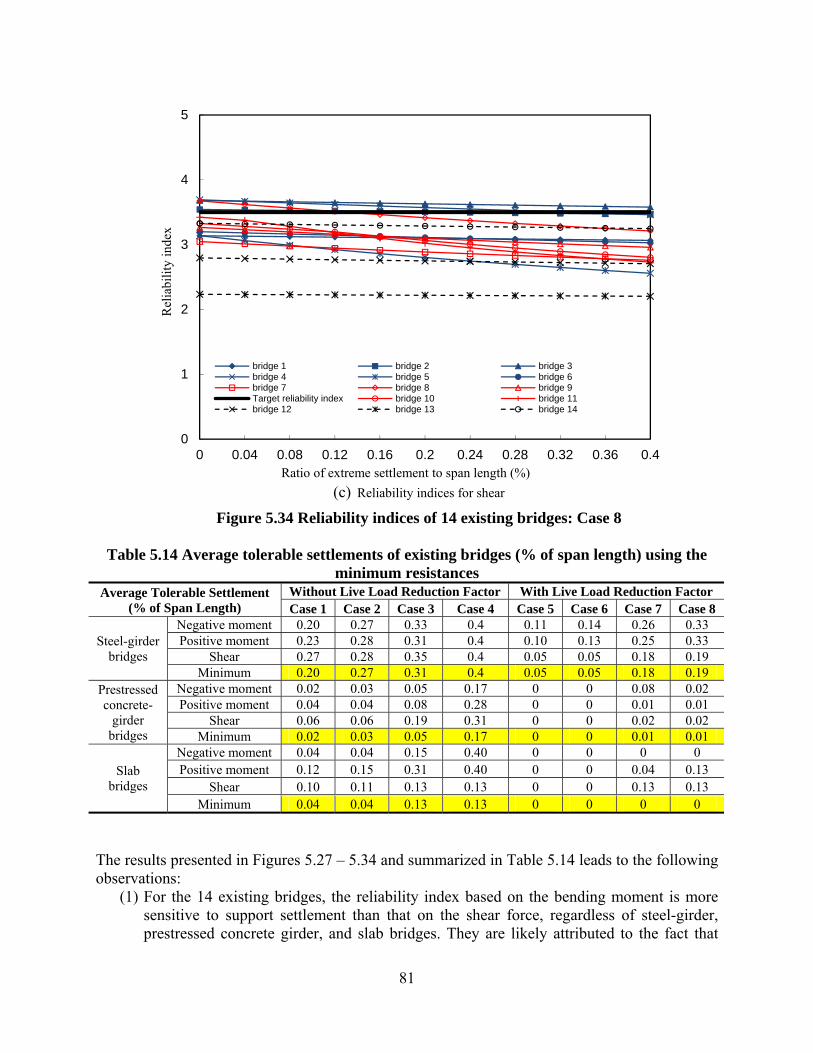
81
(c) Reliability indices for shear
Figure 5.34 Reliability indices of 14 existing bridges: Case 8
Table 5.14 Average tolerable settlements of existing bridges (% of span length) using the minimum resistances
Average Tolerable Settlement (% of Span Length)
Without Live Load Reduction Factor With Live Load Reduction Factor Case 1 Case 2 Case 3 Case 4 Case 5 Case 6 Case 7 Case 8
Steel-girder bridges
Negative moment 0.20 0.27 0.33 0.4 0.11 0.14 0.26 0.33 Positive moment 0.23 0.28 0.31 0.4 0.10 0.13 0.25 0.33
Shear 0.27 0.28 0.35 0.4 0.05 0.05 0.18 0.19 Minimum 0.20 0.27 0.31 0.4 0.05 0.05 0.18 0.19
Prestressed concrete-
girder bridges
Negative moment 0.02 0.03 0.05 0.17 0 0 0.08 0.02 Positive moment 0.04 0.04 0.08 0.28 0 0 0.01 0.01
Shear 0.06 0.06 0.19 0.31 0 0 0.02 0.02 Minimum 0.02 0.03 0.05 0.17 0 0 0.01 0.01
Slab bridges
Negative moment 0.04 0.04 0.15 0.40 0 0 0 0 Positive moment 0.12 0.15 0.31 0.40 0 0 0.04 0.13
Shear 0.10 0.11 0.13 0.13 0 0 0.13 0.13 Minimum 0.04 0.04 0.13 0.13 0 0 0 0
The results presented in Figures 5.27 – 5.34 and summarized in Table 5.14 leads to the following observations:
(1) For the 14 existing bridges, the reliability index based on the bending moment is more sensitive to support settlement than that on the shear force, regardless of steel-girder, prestressed concrete girder, and slab bridges. They are likely attributed to the fact that
0
1
2
3
4
5
0 0.04 0.08 0.12 0.16 0.2 0.24 0.28 0.32 0.36 0.4
Rel
iabi
lity
inde
x
Ratio of extreme settlement to span length (%)
bridge 1 bridge 2 bridge 3bridge 4 bridge 5 bridge 6bridge 7 bridge 8 bridge 9Target reliability index bridge 10 bridge 11bridge 12 bridge 13 bridge 14
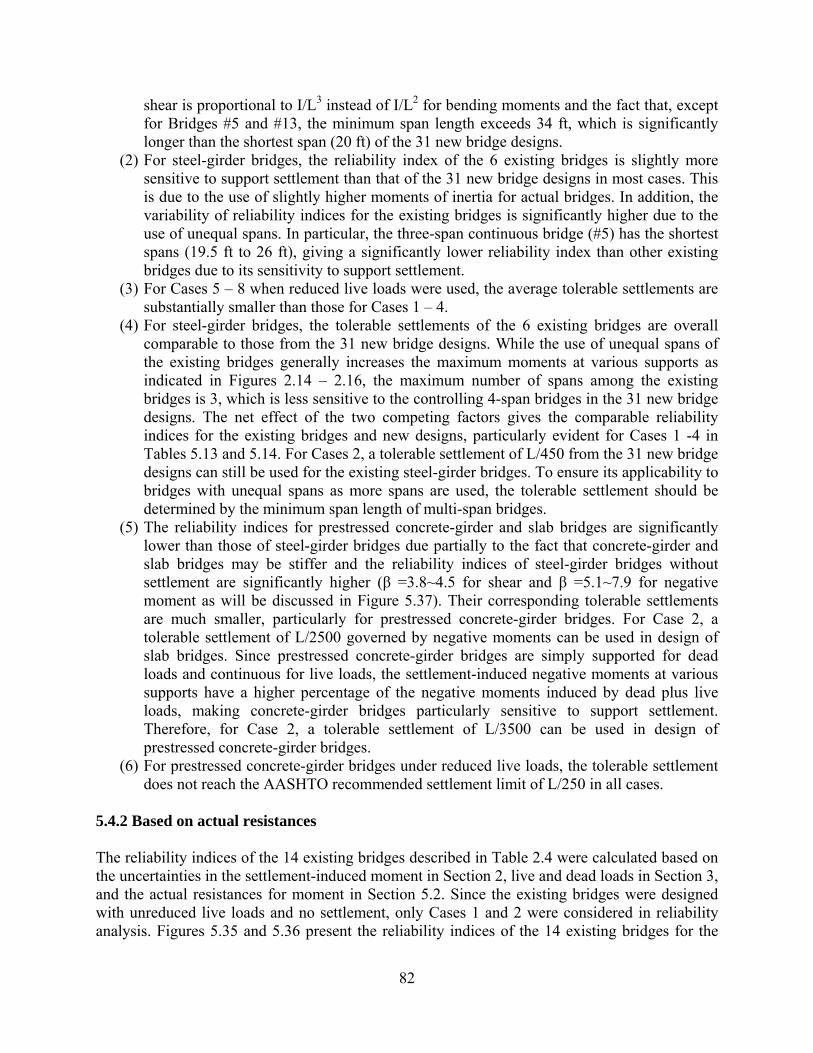
82
shear is proportional to I/L3 instead of I/L2 for bending moments and the fact that, except for Bridges #5 and #13, the minimum span length exceeds 34 ft, which is significantly longer than the shortest span (20 ft) of the 31 new bridge designs.
(2) For steel-girder bridges, the reliability index of the 6 existing bridges is slightly more sensitive to support settlement than that of the 31 new bridge designs in most cases. This is due to the use of slightly higher moments of inertia for actual bridges. In addition, the variability of reliability indices for the existing bridges is significantly higher due to the use of unequal spans. In particular, the three-span continuous bridge (#5) has the shortest spans (19.5 ft to 26 ft), giving a significantly lower reliability index than other existing bridges due to its sensitivity to support settlement.
(3) For Cases 5 – 8 when reduced live loads were used, the average tolerable settlements are substantially smaller than those for Cases 1 – 4.
(4) For steel-girder bridges, the tolerable settlements of the 6 existing bridges are overall comparable to those from the 31 new bridge designs. While the use of unequal spans of the existing bridges generally increases the maximum moments at various supports as indicated in Figures 2.14 – 2.16, the maximum number of spans among the existing bridges is 3, which is less sensitive to the controlling 4-span bridges in the 31 new bridge designs. The net effect of the two competing factors gives the comparable reliability indices for the existing bridges and new designs, particularly evident for Cases 1 -4 in Tables 5.13 and 5.14. For Cases 2, a tolerable settlement of L/450 from the 31 new bridge designs can still be used for the existing steel-girder bridges. To ensure its applicability to bridges with unequal spans as more spans are used, the tolerable settlement should be determined by the minimum span length of multi-span bridges.
(5) The reliability indices for prestressed concrete-girder and slab bridges are significantly lower than those of steel-girder bridges due partially to the fact that concrete-girder and slab bridges may be stiffer and the reliability indices of steel-girder bridges without settlement are significantly higher (β =3.8~4.5 for shear and β =5.1~7.9 for negative moment as will be discussed in Figure 5.37). Their corresponding tolerable settlements are much smaller, particularly for prestressed concrete-girder bridges. For Case 2, a tolerable settlement of L/2500 governed by negative moments can be used in design of slab bridges. Since prestressed concrete-girder bridges are simply supported for dead loads and continuous for live loads, the settlement-induced negative moments at various supports have a higher percentage of the negative moments induced by dead plus live loads, making concrete-girder bridges particularly sensitive to support settlement. Therefore, for Case 2, a tolerable settlement of L/3500 can be used in design of prestressed concrete-girder bridges.
(6) For prestressed concrete-girder bridges under reduced live loads, the tolerable settlement does not reach the AASHTO recommended settlement limit of L/250 in all cases.
5.4.2 Based on actual resistances The reliability indices of the 14 existing bridges described in Table 2.4 were calculated based on the uncertainties in the settlement-induced moment in Section 2, live and dead loads in Section 3, and the actual resistances for moment in Section 5.2. Since the existing bridges were designed with unreduced live loads and no settlement, only Cases 1 and 2 were considered in reliability analysis. Figures 5.35 and 5.36 present the reliability indices of the 14 existing bridges for the
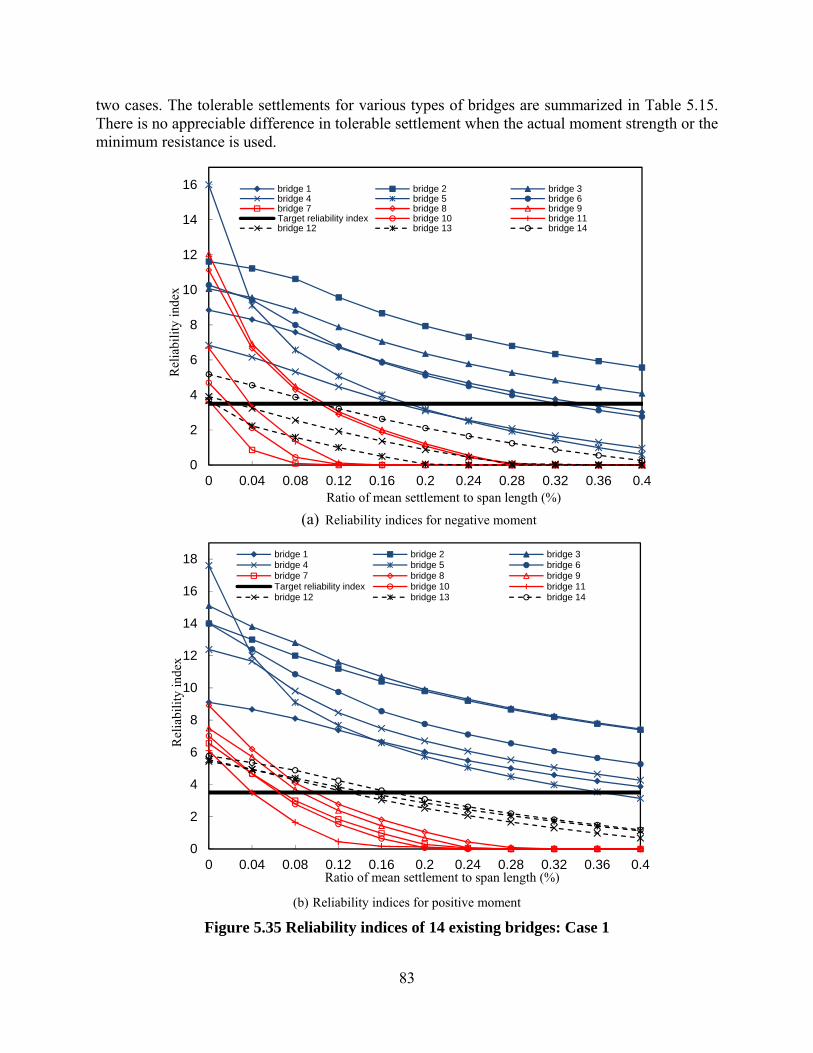
83
two cases. The tolerable settlements for various types of bridges are summarized in Table 5.15. There is no appreciable difference in tolerable settlement when the actual moment strength or the minimum resistance is used.
(a) Reliability indices for negative moment
(b) Reliability indices for positive moment
Figure 5.35 Reliability indices of 14 existing bridges: Case 1
0
2
4
6
8
10
12
14
16
0 0.04 0.08 0.12 0.16 0.2 0.24 0.28 0.32 0.36 0.4
Rel
iabi
lity
inde
x
Ratio of mean settlement to span length (%)
bridge 1 bridge 2 bridge 3bridge 4 bridge 5 bridge 6bridge 7 bridge 8 bridge 9Target reliability index bridge 10 bridge 11bridge 12 bridge 13 bridge 14
0
2
4
6
8
10
12
14
16
18
0 0.04 0.08 0.12 0.16 0.2 0.24 0.28 0.32 0.36 0.4
Rel
iabi
lity
inde
x
Ratio of mean settlement to span length (%)
bridge 1 bridge 2 bridge 3bridge 4 bridge 5 bridge 6bridge 7 bridge 8 bridge 9Target reliability index bridge 10 bridge 11bridge 12 bridge 13 bridge 14
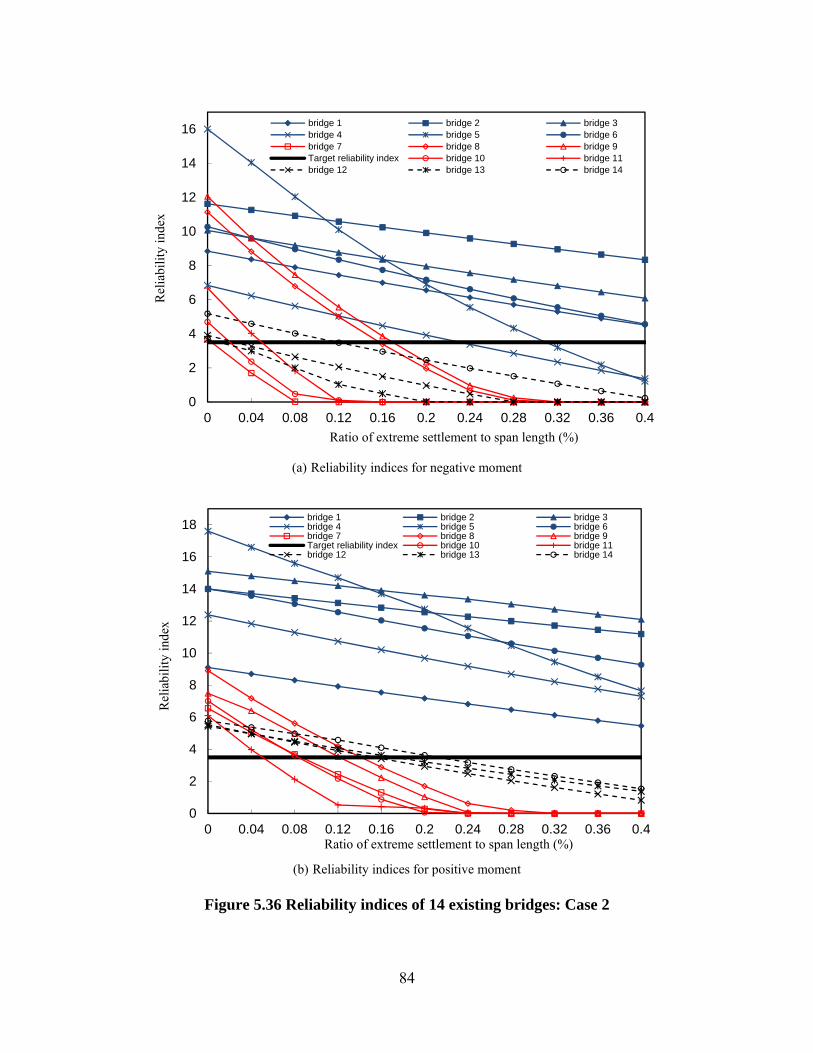
84
(a) Reliability indices for negative moment
(b) Reliability indices for positive moment
Figure 5.36 Reliability indices of 14 existing bridges: Case 2
0
2
4
6
8
10
12
14
16
0 0.04 0.08 0.12 0.16 0.2 0.24 0.28 0.32 0.36 0.4
Rel
iabi
lity
inde
x
Ratio of extreme settlement to span length (%)
bridge 1 bridge 2 bridge 3bridge 4 bridge 5 bridge 6bridge 7 bridge 8 bridge 9Target reliability index bridge 10 bridge 11bridge 12 bridge 13 bridge 14
0
2
4
6
8
10
12
14
16
18
0 0.04 0.08 0.12 0.16 0.2 0.24 0.28 0.32 0.36 0.4
Rel
iabi
lity
inde
x
Ratio of extreme settlement to span length (%)
bridge 1 bridge 2 bridge 3bridge 4 bridge 5 bridge 6bridge 7 bridge 8 bridge 9Target reliability index bridge 10 bridge 11bridge 12 bridge 13 bridge 14
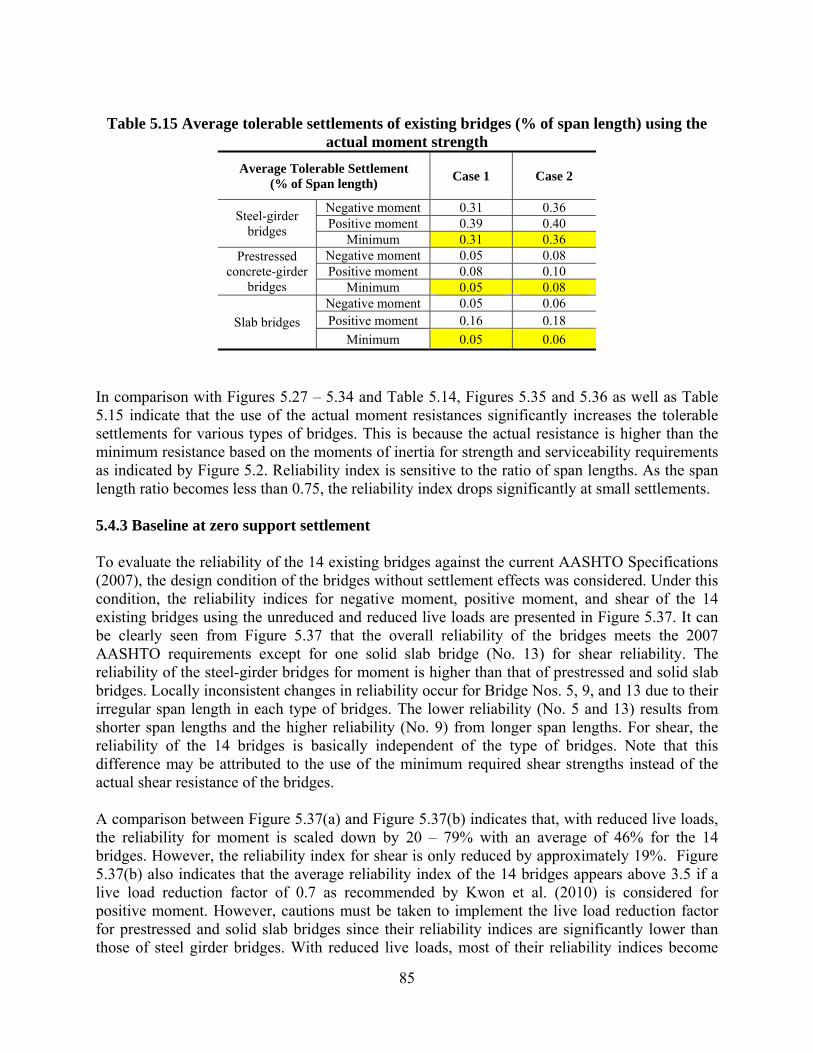
85
Table 5.15 Average tolerable settlements of existing bridges (% of span length) using the
actual moment strength Average Tolerable Settlement
(% of Span length) Case 1 Case 2
Steel-girder bridges
Negative moment 0.31 0.36 Positive moment 0.39 0.40
Minimum 0.31 0.36 Prestressed
concrete-girder bridges
Negative moment 0.05 0.08 Positive moment 0.08 0.10
Minimum 0.05 0.08
Slab bridges
Negative moment 0.05 0.06 Positive moment 0.16 0.18
Minimum 0.05 0.06
In comparison with Figures 5.27 – 5.34 and Table 5.14, Figures 5.35 and 5.36 as well as Table 5.15 indicate that the use of the actual moment resistances significantly increases the tolerable settlements for various types of bridges. This is because the actual resistance is higher than the minimum resistance based on the moments of inertia for strength and serviceability requirements as indicated by Figure 5.2. Reliability index is sensitive to the ratio of span lengths. As the span length ratio becomes less than 0.75, the reliability index drops significantly at small settlements. 5.4.3 Baseline at zero support settlement To evaluate the reliability of the 14 existing bridges against the current AASHTO Specifications (2007), the design condition of the bridges without settlement effects was considered. Under this condition, the reliability indices for negative moment, positive moment, and shear of the 14 existing bridges using the unreduced and reduced live loads are presented in Figure 5.37. It can be clearly seen from Figure 5.37 that the overall reliability of the bridges meets the 2007 AASHTO requirements except for one solid slab bridge (No. 13) for shear reliability. The reliability of the steel-girder bridges for moment is higher than that of prestressed and solid slab bridges. Locally inconsistent changes in reliability occur for Bridge Nos. 5, 9, and 13 due to their irregular span length in each type of bridges. The lower reliability (No. 5 and 13) results from shorter span lengths and the higher reliability (No. 9) from longer span lengths. For shear, the reliability of the 14 bridges is basically independent of the type of bridges. Note that this difference may be attributed to the use of the minimum required shear strengths instead of the actual shear resistance of the bridges. A comparison between Figure 5.37(a) and Figure 5.37(b) indicates that, with reduced live loads, the reliability for moment is scaled down by 20 – 79% with an average of 46% for the 14 bridges. However, the reliability index for shear is only reduced by approximately 19%. Figure 5.37(b) also indicates that the average reliability index of the 14 bridges appears above 3.5 if a live load reduction factor of 0.7 as recommended by Kwon et al. (2010) is considered for positive moment. However, cautions must be taken to implement the live load reduction factor for prestressed and solid slab bridges since their reliability indices are significantly lower than those of steel girder bridges. With reduced live loads, most of their reliability indices become
86
substantially lower than the target value of 3.5 when settlement effects are neglected. More importantly, with the 0.7 reduction factor, the average reliability index of the 14 bridges is lower than 3.5 for negative moment. With a live load reduction factor of 0.85, the average reliability index of the 14 bridges is slightly below 3.5 for shear.
Bridge index
(a) With unreduced live loads
Bridge index
(b) With reduced live loads by a factor of 0.7 for moment and 0.85 for shear
Figure 5.37 Reliability indices of 14 existing bridges without settlement effects
5.5 Uneven Settlement Effect on Diaphragm As schematically shown in Figure 5.38, a concrete diaphragm can be treated as a continuous transverse member with infinite stiffness and short spans (girder spacing). It is expected that a concrete diaphragm is subjected to significant stress under an uneven settlement between girders when a bridge bent is tilted laterally. The steel cross diaphragm as shown in Figure 5.39 can be treated as simply-supported spans transversely. It is thus less susceptible to any uneven
2.0
3.0
4.0
5.0
6.0
7.0
8.0
9.0
1 2 3 4 5 6 7 8 9 10 11 12 13 14
Rel
iab
ilit
y in
dex
0.0
1.0
2.0
3.0
4.0
5.0
6.0
7.0
1 2 3 4 5 6 7 8 9 10 11 12 13 14
Rel
iab
ilit
y in
dex
Negative moment
Positive moment
Shear
Steel Pre-stressed Slab
Negative moment
Positive moment
Shear
Steel Pre-stressed Slab
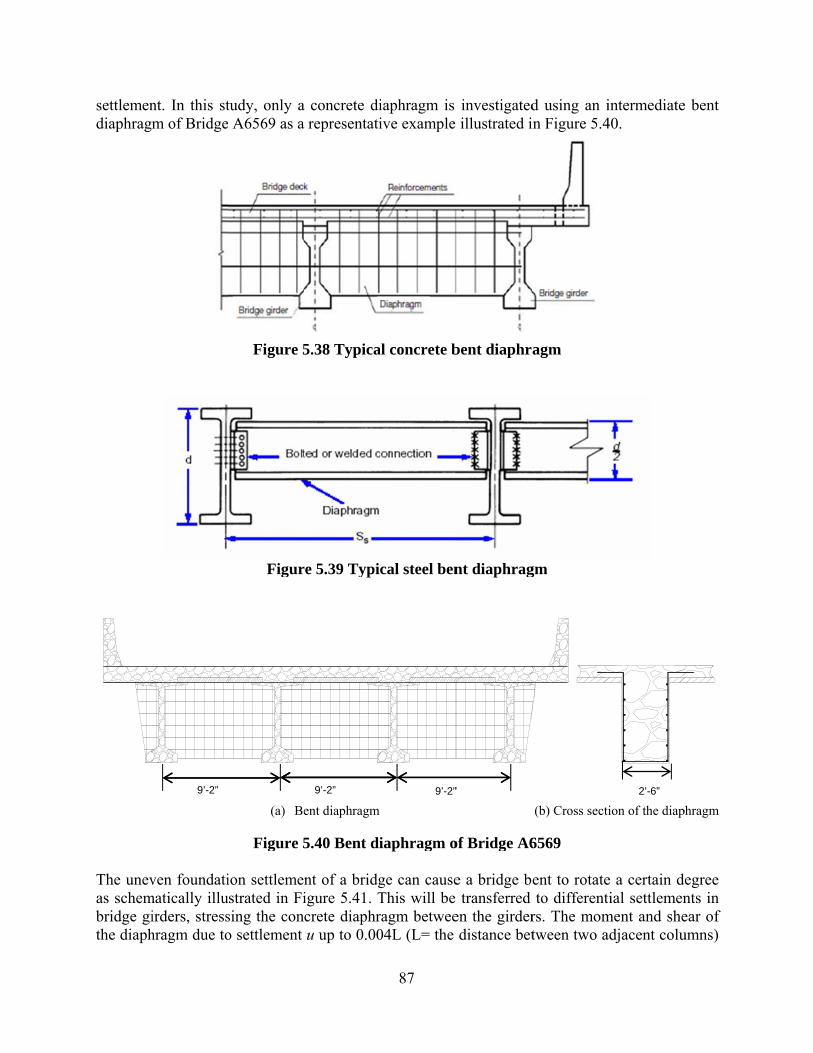
settlemendiaphragm
The unevas schembridge githe diaph
nt. In this stm of Bridge
ven foundatimatically illuirders, stresshragm due to
9’-2”
tudy, only a A6569 as a
Figure 5
Figur
(a) Be
Figure 5
ion settlemenustrated in Fising the cono settlement
a concrete dia representati
5.38 Typica
re 5.39 Typi
ent diaphragm
5.40 Bent di
nt of a bridgigure 5.41. Tcrete diaphru up to 0.00
9’-2”
87
iaphragm is ive example
al concrete b
cal steel ben
iaphragm o
ge can causeThis will be ragm betwee04L (L= the
9’-2”
investigatedillustrated i
bent diaphr
nt diaphrag
of Bridge A6
e a bridge btransferred
en the girderdistance bet
”
d using an iin Figure 5.4
agm
gm
(b) Cross secti
6569
ent to rotateto different
rs. The momtween two a
intermediate40.
ion of the diap
e a certain dial settlemen
ment and sheadjacent colu
2’-6”
e bent
phragm
egree nts in ear of umns)
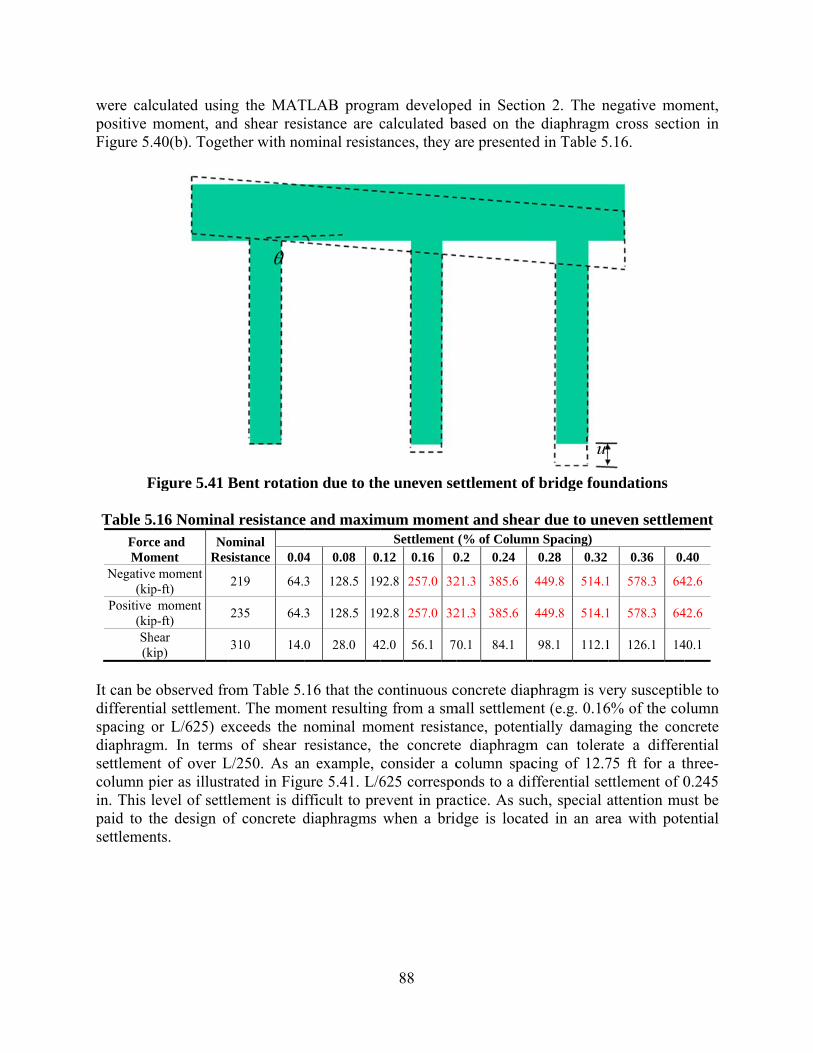
were calpositive Figure 5.
F Table 5
ForcMom
Negative(kip
Positive (kipSh(k
It can be differentispacing odiaphragmsettlemencolumn pin. This lpaid to tsettlemen
culated usinmoment, an.40(b). Toge
Figure 5.41
.16 Nominace and ment
NoRes
e moment p-ft) moment
p-ft) hear kip)
observed frial settlemenor L/625) exm. In termsnt of over Lpier as illustrlevel of settlthe design onts.
ng the MATnd shear resither with no
Bent rotatio
al resistanceominal sistance 0.0
219 64.
235 64.
310 14.
om Table 5.nt. The momxceeds the ns of shear
L/250. As anrated in Figulement is di
of concrete d
TLAB progristance are c
ominal resist
on due to th
e and maxim
4 0.08 0.
3 128.5 19
3 128.5 19
0 28.0 42
16 that the cment resulting
nominal moresistance, tn example, ure 5.41. L/6fficult to prediaphragms
88
am developcalculated bances, they a
he uneven se
mum momenSettlement
.12 0.16 0
92.8 257.0 32
92.8 257.0 32
2.0 56.1 7
continuous cg from a sm
oment resistathe concreteconsider a c625 correspoevent in prawhen a brid
ed in Sectiobased on theare presented
ettlement of
nt and shea(% of Column
0.2 0.24
21.3 385.6
21.3 385.6
0.1 84.1
concrete diapmall settleme
ance, potente diaphragmcolumn spaconds to a dif
actice. As sudge is locat
on 2. The ne diaphragmd in Table 5
f bridge fou
ar due to unn Spacing) 0.28 0.32
449.8 514.1
449.8 514.1
98.1 112.1
phragm is vent (e.g. 0.16tially damag
m can toleracing of 12.7fferential set
uch, special ated in an are
u
negative momm cross secti
.16.
undations
even settlem
0.36 0.
1 578.3 64
1 578.3 64
1 126.1 14
ery susceptib6% of the coging the conate a differe75 ft for a tttlement of 0attention muea with pote
ment, on in
ment
.40
42.6
42.6
40.1
ble to olumn ncrete ential three-0.245 ust be ential
89
6 CONCLUSIONS AND RECOMMENDATIONS
This study is focused on the effect of support settlement on the reliability of bridges under gravity loads. Dead and live loads were respectively modeled as random variables with a normal distribution and a Gumbel Type I distribution. Settlement was characterized by a random variable with lognormal distribution or a deterministic extreme value. The reliability indices for positive and negative moments as well as shear of 14 existing bridges and 31 new bridges were evaluated and compared. The tolerable settlements without requiring foundation mitigation as a result of settlement load effects on structural design were determined for various cases. The conclusions and recommendations from this study are presented as follows.
6.1 Conclusions Based on the extensive simulation results for continuous bridges, the following conclusions can be drawn:
(1) The settlement effect on the moment and shear of multi-span bridges depends upon the moment of inertia, span length, and their change among various spans. As the number of spans increases, the moment and shear of the bridges become more sensitive to support settlement. While the reliability indices for positive and negative moments increase with the increasing of span length, the reliability index can also be high for spans as short as 20 ft due to shear effect.
(2) The maximum settlement-induced moment always occurs at supports, which coincides with the location of maximum negative moment. Depending upon the span length ratio, the settlement-induced moment can be as high as 100% of the moment due to dead and live loads alone. Therefore, the reliability index for negative moment is more sensitive to differential settlement effects than positive moment. However, their difference for both negative and positive moments appears small in general.
(3) When settlement is defined as a random variable with a mean value and a given COV = 0.25, the average tolerable settlements (represented by the mean value) in all cases are between 50% and 100% of their corresponding values when settlement is defined as an extreme value. This is because some sample settlements in the random model exceed the extreme value.
(4) The reliability indices for prestressed concrete-girder and slab bridges are significantly lower than those of steel-girder bridges due partially to the fact that concrete-girder and slab bridges are often stiffer and the reliability indices (3.8~4.5 for shear and 5.1~7.9 for negative moment) of the existing steel-girder bridges without settlement are significantly higher. Their corresponding tolerable settlements are much smaller, particularly for prestressed concrete-girder bridges. Since prestressed concrete-girder bridges are simply supported for dead loads and continuous for live loads, the settlement-induced negative moments at various supports have a higher percentage of their respective negative moments induced by dead plus live loads, making concrete-girder bridges particularly sensitive to support settlement.
(5) For steel-girder bridges, the average tolerable settlements in extreme value are L/450 and L/3500 for the current MoDOT practice with unreduced live loads (Case 2) and the potential future MoDOT practice with reduced live loads (Case 6), respectively, when settlement is not considered in design. With due consideration of settlement in structural design, the tolerable settlement reaches the AASHTO recommended settlement limit of
90
0.004L with unreduced live loads (Case 4) but is limited by 0.0019L with reduced live loads (Case 8, shear governs).
(6) For prestressed concrete-girder bridges, the average tolerable settlements in extreme value are L/3500 and virtually zero for the current MoDOT practice with unreduced live loads (Case 2) and the potential future MoDOT practice with reduced live loads (Case 6), respectively, when settlement is not considered in design. With due consideration of settlement in structural design, the tolerable settlement becomes 0.0017L under unreduced live loads (Case 4, negative moment governs) and 0.0001L under reduced live loads (Case 8, positive moment governs).
(7) For slab bridges, the average tolerable settlements in extreme value are L/2500 and virtually zero for the current MoDOT practice with unreduced live loads (Case 2) and the potential future MoDOT practice with reduced live loads (Case 6), respectively, when settlement is not considered in design. With due consideration of settlement in structural design, the tolerable settlement is limited by 0.0013L with unreduced lived loads (Case 4, shear governs) but virtually zero with reduced live loads (Case 8, shear governs).
(8) When reduced live loads are used, the average tolerable settlements are substantially smaller than those when no reduction in live loads is considered. With reduced live loads, the reliability for moment is significantly scaled down while that for shear is slightly reduced when settlement is negligible.
(9) When the length ratio among any two adjacent spans is less than 0.75, the reliability index of a multi-span bridge drops significantly at small settlements.
6.2 Recommendations The extreme values of settlement depend on the confidence in the estimation of associated parameters and the roadway class. The extreme settlement used in this report is defined as a factored settlement that corresponds to a probability of being exceeded based on the target probabilities established by MoDOT for various roadway classes and bridge capital investments (MoDOT, 2010a; 2010b; 2010c; Abu El-Ela et al., 2011; Song et al., 2011; Vu and Loehr, 2011). Based on extensive simulations on the reliability of existing and new bridges under gravity loads (with no live load reduction), the settlement effect in bridge design for Strength I Limit State requirements can be addressed with one of the following two methods:
(1) Extreme settlement is considered in structural design and no special requirement is needed for foundation design unless the settlement exceeds the AASHTO recommended limit of L/250. For consistency, L represents the minimum span length of a multi-span bridge.
(2) Extreme settlement is not considered in structural design as in the current MoDOT practice but ensured below what structures can tolerate in terms of reliability index. The tolerable settlement is L/450 for steel-girder bridges, L/2500 for slab bridges, and L/3500 for prestressed concrete-girder bridges.
Both methods represent minimum efforts in structural design as far as settlement load effects are concerned. They can be implemented in design according to the flow chart in Figure 6.1. The first method is a direct approach to deal with bridge settlement and has potential to reduce the overall cost of a new bridge. Although it may lead to larger superstructure and substructure members with additional calculations on settlement load effects, the increase in associated
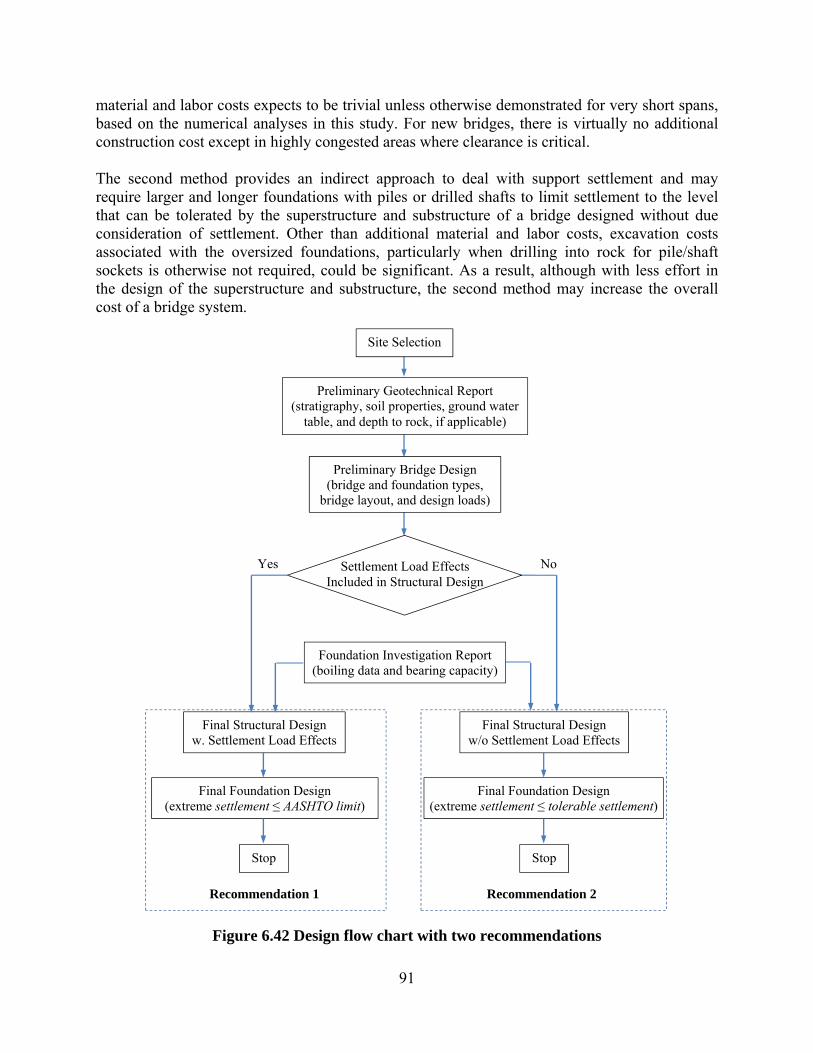
91
material and labor costs expects to be trivial unless otherwise demonstrated for very short spans, based on the numerical analyses in this study. For new bridges, there is virtually no additional construction cost except in highly congested areas where clearance is critical. The second method provides an indirect approach to deal with support settlement and may require larger and longer foundations with piles or drilled shafts to limit settlement to the level that can be tolerated by the superstructure and substructure of a bridge designed without due consideration of settlement. Other than additional material and labor costs, excavation costs associated with the oversized foundations, particularly when drilling into rock for pile/shaft sockets is otherwise not required, could be significant. As a result, although with less effort in the design of the superstructure and substructure, the second method may increase the overall cost of a bridge system.
Figure 6.42 Design flow chart with two recommendations
Final Structural Design w. Settlement Load Effects
Final Foundation Design (extreme settlement ≤ AASHTO limit)
Stop Stop
Final Structural Design w/o Settlement Load Effects
Final Foundation Design (extreme settlement ≤ tolerable settlement)
Preliminary Geotechnical Report (stratigraphy, soil properties, ground water
table, and depth to rock, if applicable)
NoSettlement Load Effects Included in Structural Design
Yes
Preliminary Bridge Design (bridge and foundation types,
bridge layout, and design loads)
Site Selection
Recommendation 1 Recommendation 2
Foundation Investigation Report (boiling data and bearing capacity)
92
REFERENCES
[1]. AASHTO (2007), LRFD bridge design specifications, 4th Edition, Washington, DC. [2]. AASHTO (1996), Standard specifications for highway bridge design, 16th Edition,
Washington, DC. [3]. Abramowitz, M. (1952), Remarks on a multivariate transformation, Anne. of
Mathematical Statistics, Vol. 23, pp. 470-472. [4]. Abu El-Ela, A.A., J.J. Bowders, and L.E. Loehr (2011), Calibration of LRFD resistance
factors for design of spread footings in hard and soft rock, MoDOT Final Report OR11-xxx, Missouri Department of Transportation, Jefferson City, MO, xxpp.
[5]. Allen, T.M., A.S. Nowak, and R.J. Bathurst (2005), Calibration to determine load and resistance factors for geotechnical and structural design, Transportation Research Board, Washington, DC.
[6]. Ang, A.H.S., and W.H. Tang (1975), Probability concepts in engineering planning and design, Volume I – Basic Principles, John Wiley & Sons, Inc., New York.
[7]. Ang, A.H.S., and W.H. Tang (1984), Probability concepts in engineering planning and design, Volume II– Decision, Risk and Reliability, John Wiley & Sons, Inc., New York.
[8]. Barker, R.M., J.M. Duncan, K.B. Rojiani, P.S.K. Ooi, C.K. Tan, and S.G. Kim (1991), Manuals for the design of bridge foundations, NCHRP Report 343, Transportation Research Board, National Research Council, Washington DC.
[9]. Choi, S.K., R.V. Grandhi, and R.A. Canfiedl (2006), Reliability-based structural design, Springer-Verlag, London.
[10]. Der Kiureghian, A. (2005), First- and second-order reliability method, Engineering Design Reliability Handbook, CRC, Boca Raton, FL.
[11]. DiMillio, A.F., and K.E. Robinson (1982), Performance of highway bridge abutments supported by spread footing on compacted fill, FHWA/RD-81/184, (NTIS PB83-201822). (FHWA Staff Study).
[12]. Gumbel, E.J. (1958), Statistics of extremes, Columbia University Press. [13]. Hearn, G., and K. Nordheim (1998), Differential settlements and inelastic response in
steel bridge beams, Transportation Research Board, Vol. 1633, No. 09, pp. 68-73. [14]. Hwang, E.S., and A.S. Nowak (1991), Simulation of dynamic load for bridges, Journal of
Structural Engineering, ASCE, Vol.117, No.5, pp.1413-1434. [15]. Kwon, O.S., S. Orton, H. Salim, E. Kim, and T. Hazlett (2010), Calibration of the live
load factor in LRFD design guidelines, MoDOT Final Report OR11-003, Missouri Department of Transportation, Jefferson City, MO, 106pp.
[16]. MoDOT (2010a), Guidelines for Design of Driven Piles (draft), EPG 751.36, Missouri Department of Transportation, Jefferson City, MO.
[17]. MoDOT (2010b), Guidelines for Design of Drilled Shafts (draft), EPG 751.37, Missouri Department of Transportation, Jefferson City, MO.
[18]. MoDOT (2010c), Guidelines for Design of Shallow Foundations (draft), EPG 751.38, Missouri Department of Transportation, Jefferson City, MO.
[19]. Moulton, L.K., H.V.S. GangaRao, and G.T. Halverson (1985), Tolerable movement criteria for highway bridges, FHWA/RD-85/107, Federal Highway Administration, U.S. Department of Transportation, Washington, DC.
[20]. Moulton, L.K. (1986), Tolerable movement criteria for highway bridges, FHWA-86/228, Federal Highway Administration, U.S. Department of Transportation, Washington, DC.
93
[21]. Nour, A., A. Slimani, and N. Laouami (2002), Foundation settlement statistics via finite element analysis, Computers and Geotechnics, Vol. 29, No. 8, pp. 641-672.
[22]. Nowak, A.S. (1999), NCHRP Report 368: Calibration of LRFD Bridge design code, Transportation Research Board, National Research Council, Washington, DC.
[23]. Nowak, A.S., A.S. Yamani, and S.W. Tabsh (1994), Probabilistic models for resistance of concrete bridge girders, ACI Structural Journal, Vol. 91, No. 3, pp.269-276.
[24]. Song, C., J.J. Bowders, A.A. Abu El-Ela, and J.E. Loehr (2011), Calibration of LRFD resistance factors for design of spread footings and embankments in cohesive soils at serviceability limit states, MoDOT Final Report OR11-xxx, Missouri Department of Transportation, Jefferson City, MO, xxxpp.
[25]. Vu, T.T., and J.E. Loehr (2011), Calibration of LRFD resistance factors for design of drilled shafts at serviceability limit states, MoDOT Final Report OR11-xxx, Missouri Department of Transportation, Jefferson City, MO, xxxpp.

94
APPENDIX A: SUPPORT MOMENTS DUE TO UNIT SETTLEMENTS AT VARIOUS SUPPORTS
Table A.1 Support moments due to unit settlements for 2-span continuous bridges Bridge
No. Bridge Description Support Locations of Unit Settlement
Moment (kip-ft) 1 2 3
A3101 120+120ft
continuous steel girder bridge
1 0.0 -164.3 0.0 2 0.0 328.5 0.0 3 0.0 -164.3 0.0
1 and 3 0.0 -328.5 0.0
A6754 142+110ft
continuous steel girder bridge
1 0.0 -181.4 0.0 2 0.0 415.6 0.0 3 0.0 -234.2 0.0
1 and 3 0.0 -415.6 0.0
A4840 128+141ft
continuous steel girder bridge
1 0.0 -159.7 0.0 2 0.0 315.9 0.0 3 0.0 -156.3 0.0
1 and 3 0.0 -315.9 0.0
A7300 64.75+64.75 ft
continuous steel girder bridge
1 0.0 -127.6 0.0 2 0.0 255.2 0.0 3 0.0 -127.6 0.0
1 and 3 0.0 -255.2 0.0
Table A.2 Support moments due to unit settlements for 3-span continuous bridges Bridge
No. Bridge
Description Support Locations of Unit Settlement
Moment (kip-ft) 1 2 3 4
A3386
75+97+75 ft continuous steel
girder bridge
1 0.0 -477.8 137.1 0.0 2 0.0 953.2 -608.5 0.0 3 0.0 -612.4 944.0 0.0 4 0.0 137.1 -472.6 0.0
1 and 3 0.0 -1090.2 1081.1 0.0 2 and 4 0.0 1090.2 -1081.1 0.0
A4058
37+65+42 ft continuous pre-stressed girder
bridge
1 0.0 -585.7 177.9 0.0 2 0.0 1020.4 -597.0 0.0 3 0.0 -591.4 910.9 0.0 4 0.0 156.7 -491.9 0.0
1 and 3 0.0 -1177.1 1088.8 0.0 2 and 4 0.0 1177.1 -1088.8 0.0
A4256
19.5+26+23.5 ft continuous steel
girder bridge
1 0.0 -440.2 115.6 0.0 2 0.0 857.0 -505.7 0.0 3 0.0 -512.7 725.9 0.0 4 0.0 95.9 -335.7 0.0
1 and 3 0.0 -952.9 841.5 0.0 2 and 4 0.0 952.9 -841.5 0.0
A4999
58+119+54 ft continuous steel
1 0.0 -393.8 144.3 0.0 2 0.0 656.1 -410.9 0.0
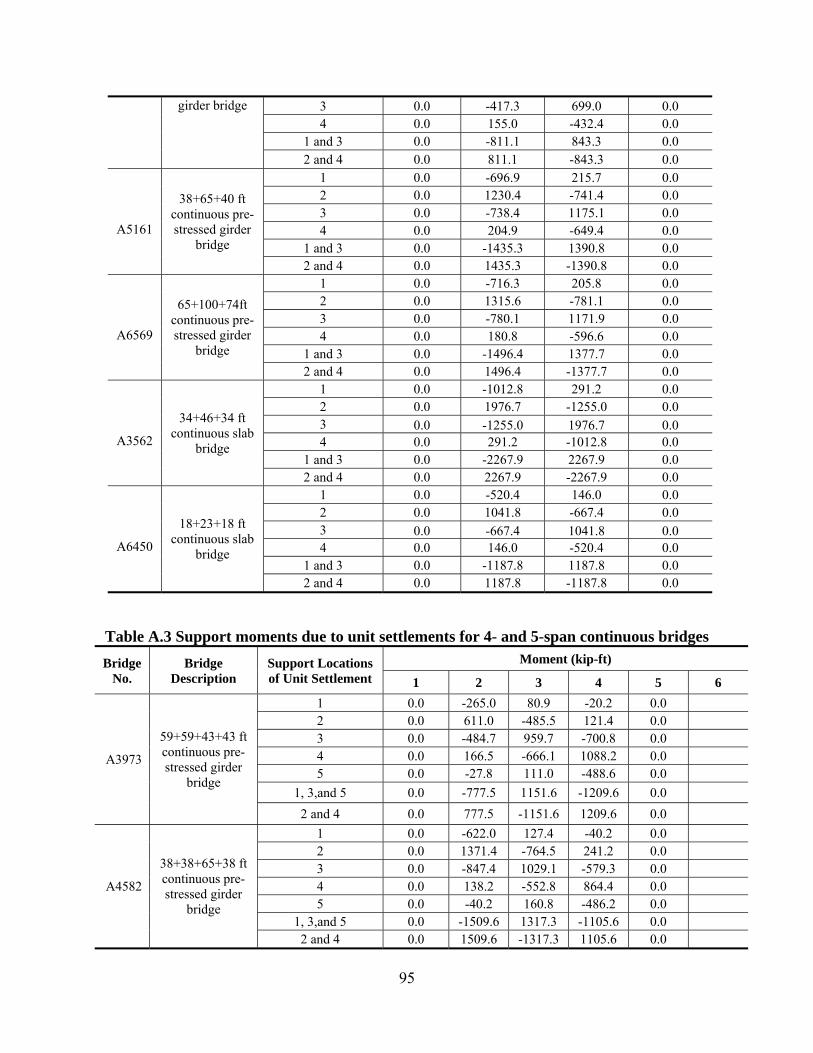
95
girder bridge 3 0.0 -417.3 699.0 0.0 4 0.0 155.0 -432.4 0.0
1 and 3 0.0 -811.1 843.3 0.0 2 and 4 0.0 811.1 -843.3 0.0
A5161
38+65+40 ft continuous pre-stressed girder
bridge
1 0.0 -696.9 215.7 0.0 2 0.0 1230.4 -741.4 0.0 3 0.0 -738.4 1175.1 0.0 4 0.0 204.9 -649.4 0.0
1 and 3 0.0 -1435.3 1390.8 0.0 2 and 4 0.0 1435.3 -1390.8 0.0
A6569
65+100+74ft continuous pre-stressed girder
bridge
1 0.0 -716.3 205.8 0.0 2 0.0 1315.6 -781.1 0.0 3 0.0 -780.1 1171.9 0.0 4 0.0 180.8 -596.6 0.0
1 and 3 0.0 -1496.4 1377.7 0.0 2 and 4 0.0 1496.4 -1377.7 0.0
A3562
34+46+34 ft continuous slab
bridge
1 0.0 -1012.8 291.2 0.0 2 0.0 1976.7 -1255.0 0.0 3 0.0 -1255.0 1976.7 0.0 4 0.0 291.2 -1012.8 0.0
1 and 3 0.0 -2267.9 2267.9 0.0 2 and 4 0.0 2267.9 -2267.9 0.0
A6450
18+23+18 ft continuous slab
bridge
1 0.0 -520.4 146.0 0.0 2 0.0 1041.8 -667.4 0.0 3 0.0 -667.4 1041.8 0.0 4 0.0 146.0 -520.4 0.0
1 and 3 0.0 -1187.8 1187.8 0.0 2 and 4 0.0 1187.8 -1187.8 0.0
Table A.3 Support moments due to unit settlements for 4- and 5-span continuous bridges Bridge
No. Bridge
Description Support Locations of Unit Settlement
Moment (kip-ft)
1 2 3 4 5 6
A3973
59+59+43+43 ft continuous pre-stressed girder
bridge
1 0.0 -265.0 80.9 -20.2 0.0 2 0.0 611.0 -485.5 121.4 0.0 3 0.0 -484.7 959.7 -700.8 0.0 4 0.0 166.5 -666.1 1088.2 0.0 5 0.0 -27.8 111.0 -488.6 0.0
1, 3,and 5 0.0 -777.5 1151.6 -1209.6 0.0
2 and 4 0.0 777.5 -1151.6 1209.6 0.0
A4582
38+38+65+38 ft continuous pre-stressed girder
bridge
1 0.0 -622.0 127.4 -40.2 0.0 2 0.0 1371.4 -764.5 241.2 0.0 3 0.0 -847.4 1029.1 -579.3 0.0 4 0.0 138.2 -552.8 864.4 0.0 5 0.0 -40.2 160.8 -486.2 0.0
1, 3,and 5 0.0 -1509.6 1317.3 -1105.6 0.0 2 and 4 0.0 1509.6 -1317.3 1105.6 0.0
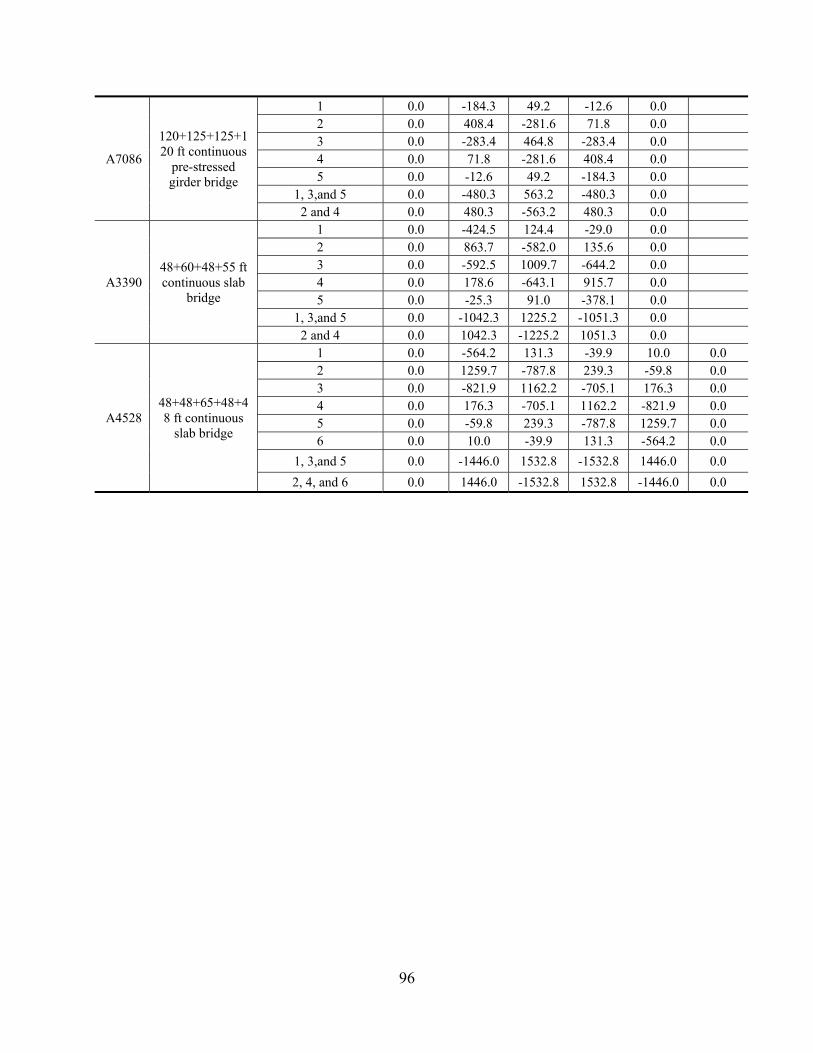
96
A7086
120+125+125+120 ft continuous
pre-stressed girder bridge
1 0.0 -184.3 49.2 -12.6 0.0 2 0.0 408.4 -281.6 71.8 0.0 3 0.0 -283.4 464.8 -283.4 0.0 4 0.0 71.8 -281.6 408.4 0.0 5 0.0 -12.6 49.2 -184.3 0.0
1, 3,and 5 0.0 -480.3 563.2 -480.3 0.0 2 and 4 0.0 480.3 -563.2 480.3 0.0
A3390 48+60+48+55 ft continuous slab
bridge
1 0.0 -424.5 124.4 -29.0 0.0 2 0.0 863.7 -582.0 135.6 0.0 3 0.0 -592.5 1009.7 -644.2 0.0 4 0.0 178.6 -643.1 915.7 0.0 5 0.0 -25.3 91.0 -378.1 0.0
1, 3,and 5 0.0 -1042.3 1225.2 -1051.3 0.0 2 and 4 0.0 1042.3 -1225.2 1051.3 0.0
A4528 48+48+65+48+48 ft continuous
slab bridge
1 0.0 -564.2 131.3 -39.9 10.0 0.0 2 0.0 1259.7 -787.8 239.3 -59.8 0.0 3 0.0 -821.9 1162.2 -705.1 176.3 0.0 4 0.0 176.3 -705.1 1162.2 -821.9 0.0 5 0.0 -59.8 239.3 -787.8 1259.7 0.0 6 0.0 10.0 -39.9 131.3 -564.2 0.0
1, 3,and 5 0.0 -1446.0 1532.8 -1532.8 1446.0 0.0
2, 4, and 6 0.0 1446.0 -1532.8 1532.8 -1446.0 0.0
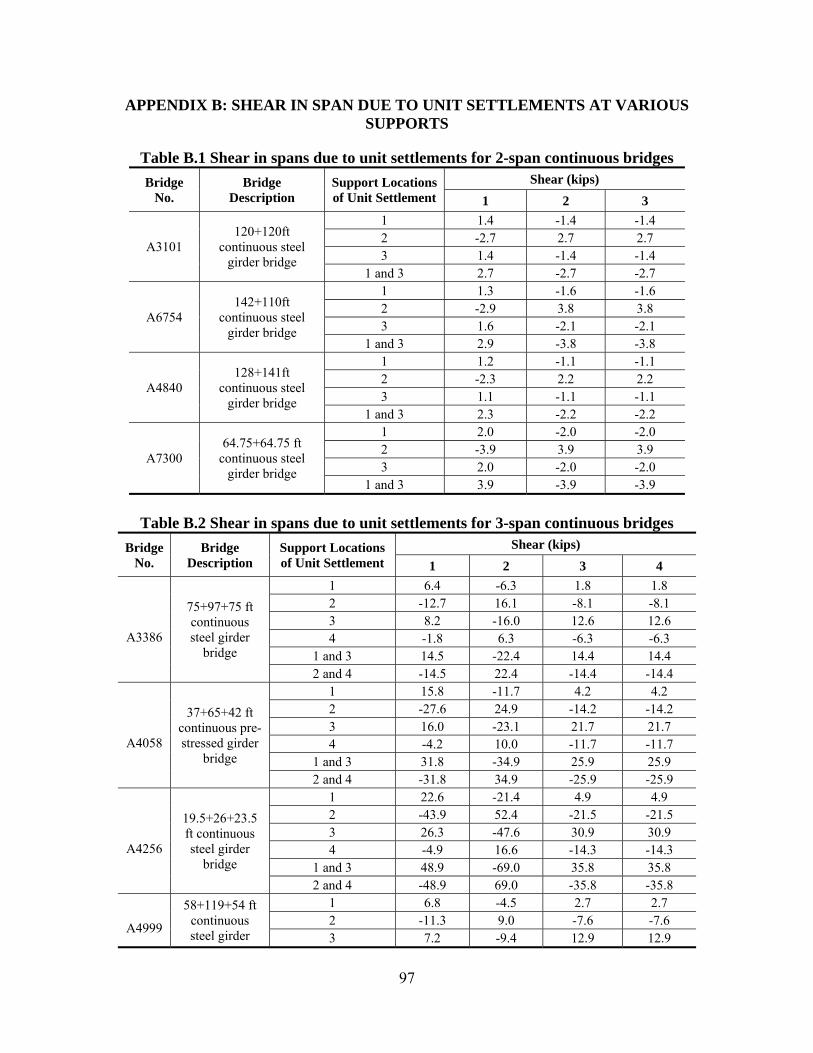
97
APPENDIX B: SHEAR IN SPAN DUE TO UNIT SETTLEMENTS AT VARIOUS SUPPORTS
Table B.1 Shear in spans due to unit settlements for 2-span continuous bridges Bridge
No. Bridge
Description Support Locations of Unit Settlement
Shear (kips) 1 2 3
A3101 120+120ft
continuous steel girder bridge
1 1.4 -1.4 -1.4 2 -2.7 2.7 2.7 3 1.4 -1.4 -1.4
1 and 3 2.7 -2.7 -2.7
A6754 142+110ft
continuous steel girder bridge
1 1.3 -1.6 -1.6 2 -2.9 3.8 3.8 3 1.6 -2.1 -2.1
1 and 3 2.9 -3.8 -3.8
A4840 128+141ft
continuous steel girder bridge
1 1.2 -1.1 -1.1 2 -2.3 2.2 2.2 3 1.1 -1.1 -1.1
1 and 3 2.3 -2.2 -2.2
A7300 64.75+64.75 ft
continuous steel girder bridge
1 2.0 -2.0 -2.0 2 -3.9 3.9 3.9 3 2.0 -2.0 -2.0
1 and 3 3.9 -3.9 -3.9
Table B.2 Shear in spans due to unit settlements for 3-span continuous bridges
Bridge No.
Bridge Description
Support Locations of Unit Settlement
Shear (kips) 1 2 3 4
A3386
75+97+75 ft continuous steel girder
bridge
1 6.4 -6.3 1.8 1.8 2 -12.7 16.1 -8.1 -8.1 3 8.2 -16.0 12.6 12.6 4 -1.8 6.3 -6.3 -6.3
1 and 3 14.5 -22.4 14.4 14.4 2 and 4 -14.5 22.4 -14.4 -14.4
A4058
37+65+42 ft continuous pre-stressed girder
bridge
1 15.8 -11.7 4.2 4.2 2 -27.6 24.9 -14.2 -14.2 3 16.0 -23.1 21.7 21.7 4 -4.2 10.0 -11.7 -11.7
1 and 3 31.8 -34.9 25.9 25.9 2 and 4 -31.8 34.9 -25.9 -25.9
A4256
19.5+26+23.5 ft continuous steel girder
bridge
1 22.6 -21.4 4.9 4.9 2 -43.9 52.4 -21.5 -21.5 3 26.3 -47.6 30.9 30.9 4 -4.9 16.6 -14.3 -14.3
1 and 3 48.9 -69.0 35.8 35.8 2 and 4 -48.9 69.0 -35.8 -35.8
A4999
58+119+54 ft continuous steel girder
1 6.8 -4.5 2.7 2.7 2 -11.3 9.0 -7.6 -7.6 3 7.2 -9.4 12.9 12.9
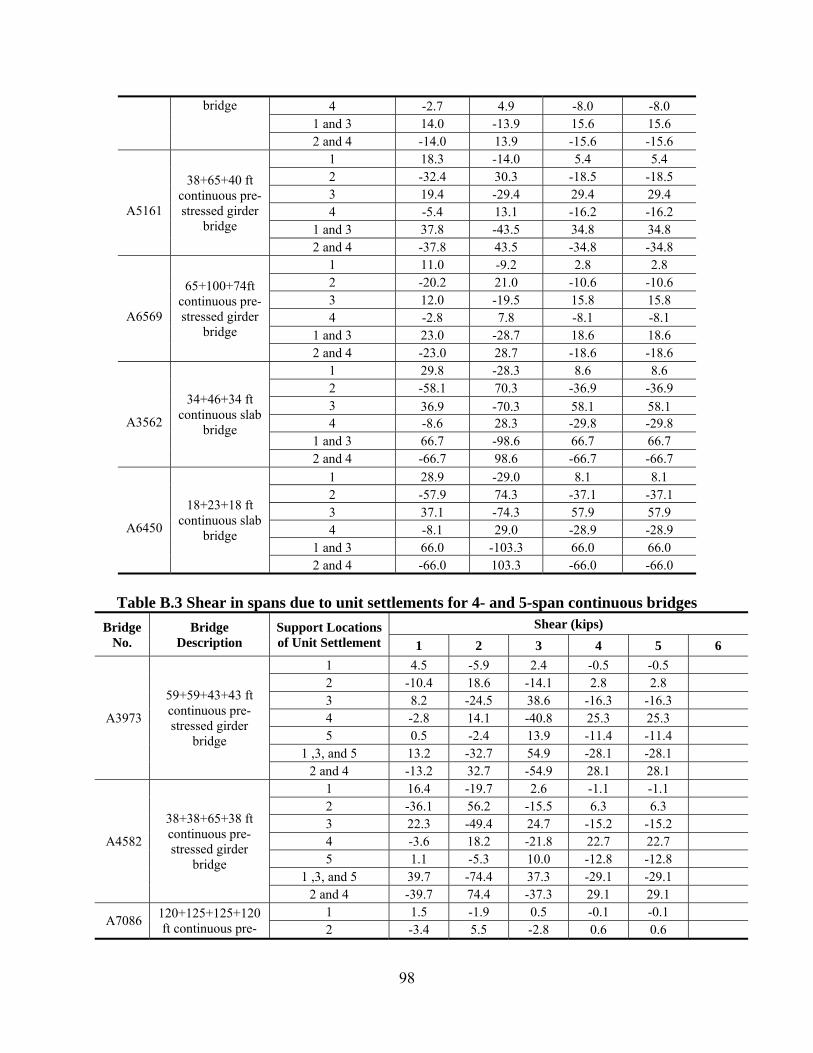
98
bridge 4 -2.7 4.9 -8.0 -8.0 1 and 3 14.0 -13.9 15.6 15.6 2 and 4 -14.0 13.9 -15.6 -15.6
A5161
38+65+40 ft continuous pre-stressed girder
bridge
1 18.3 -14.0 5.4 5.4 2 -32.4 30.3 -18.5 -18.5 3 19.4 -29.4 29.4 29.4 4 -5.4 13.1 -16.2 -16.2
1 and 3 37.8 -43.5 34.8 34.8 2 and 4 -37.8 43.5 -34.8 -34.8
A6569
65+100+74ft continuous pre-stressed girder
bridge
1 11.0 -9.2 2.8 2.8 2 -20.2 21.0 -10.6 -10.6 3 12.0 -19.5 15.8 15.8 4 -2.8 7.8 -8.1 -8.1
1 and 3 23.0 -28.7 18.6 18.6 2 and 4 -23.0 28.7 -18.6 -18.6
A3562
34+46+34 ft continuous slab
bridge
1 29.8 -28.3 8.6 8.6 2 -58.1 70.3 -36.9 -36.9 3 36.9 -70.3 58.1 58.1 4 -8.6 28.3 -29.8 -29.8
1 and 3 66.7 -98.6 66.7 66.7 2 and 4 -66.7 98.6 -66.7 -66.7
A6450
18+23+18 ft continuous slab
bridge
1 28.9 -29.0 8.1 8.1 2 -57.9 74.3 -37.1 -37.1 3 37.1 -74.3 57.9 57.9 4 -8.1 29.0 -28.9 -28.9
1 and 3 66.0 -103.3 66.0 66.0 2 and 4 -66.0 103.3 -66.0 -66.0
Table B.3 Shear in spans due to unit settlements for 4- and 5-span continuous bridges
Bridge No.
Bridge Description
Support Locations of Unit Settlement
Shear (kips) 1 2 3 4 5 6
A3973
59+59+43+43 ft continuous pre-stressed girder
bridge
1 4.5 -5.9 2.4 -0.5 -0.5 2 -10.4 18.6 -14.1 2.8 2.8 3 8.2 -24.5 38.6 -16.3 -16.3 4 -2.8 14.1 -40.8 25.3 25.3 5 0.5 -2.4 13.9 -11.4 -11.4
1 ,3, and 5 13.2 -32.7 54.9 -28.1 -28.1 2 and 4 -13.2 32.7 -54.9 28.1 28.1
A4582
38+38+65+38 ft continuous pre-stressed girder
bridge
1 16.4 -19.7 2.6 -1.1 -1.1 2 -36.1 56.2 -15.5 6.3 6.3 3 22.3 -49.4 24.7 -15.2 -15.2 4 -3.6 18.2 -21.8 22.7 22.7 5 1.1 -5.3 10.0 -12.8 -12.8
1 ,3, and 5 39.7 -74.4 37.3 -29.1 -29.1 2 and 4 -39.7 74.4 -37.3 29.1 29.1
A7086 120+125+125+120 ft continuous pre-
1 1.5 -1.9 0.5 -0.1 -0.1 2 -3.4 5.5 -2.8 0.6 0.6
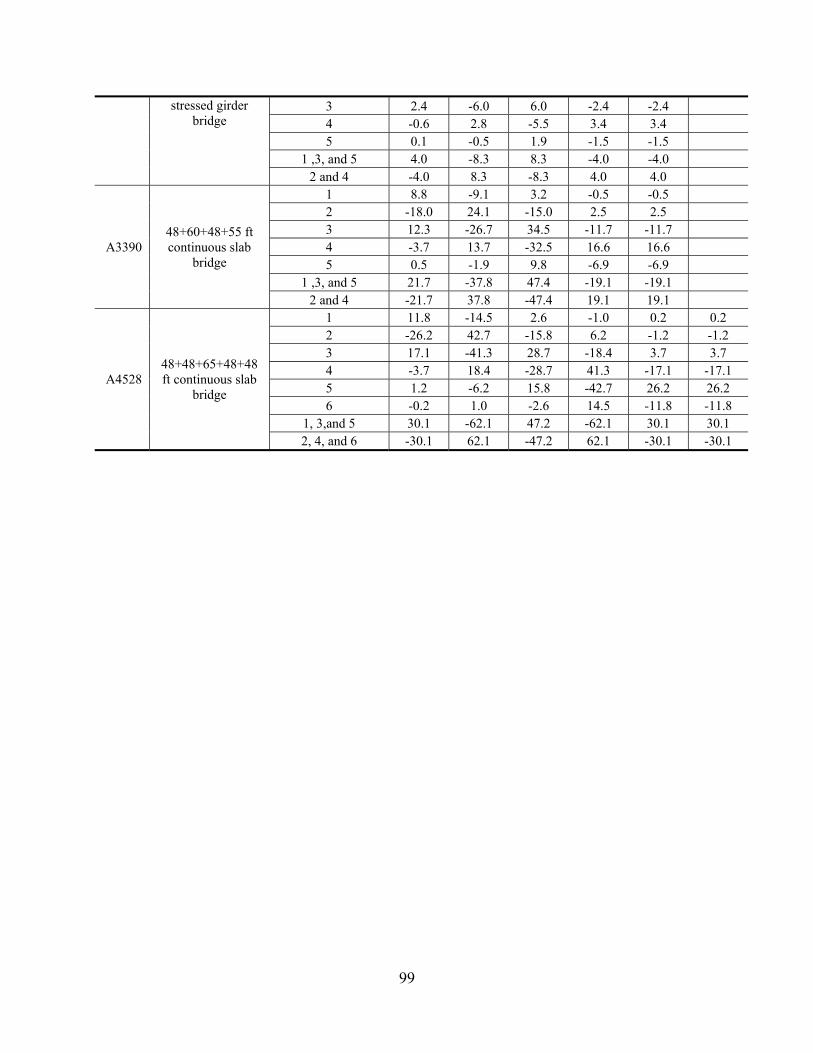
99
stressed girder bridge
3 2.4 -6.0 6.0 -2.4 -2.4 4 -0.6 2.8 -5.5 3.4 3.4 5 0.1 -0.5 1.9 -1.5 -1.5
1 ,3, and 5 4.0 -8.3 8.3 -4.0 -4.0 2 and 4 -4.0 8.3 -8.3 4.0 4.0
A3390 48+60+48+55 ft continuous slab
bridge
1 8.8 -9.1 3.2 -0.5 -0.5 2 -18.0 24.1 -15.0 2.5 2.5 3 12.3 -26.7 34.5 -11.7 -11.7 4 -3.7 13.7 -32.5 16.6 16.6 5 0.5 -1.9 9.8 -6.9 -6.9
1 ,3, and 5 21.7 -37.8 47.4 -19.1 -19.1 2 and 4 -21.7 37.8 -47.4 19.1 19.1
A4528 48+48+65+48+48 ft continuous slab
bridge
1 11.8 -14.5 2.6 -1.0 0.2 0.2 2 -26.2 42.7 -15.8 6.2 -1.2 -1.2 3 17.1 -41.3 28.7 -18.4 3.7 3.7 4 -3.7 18.4 -28.7 41.3 -17.1 -17.1 5 1.2 -6.2 15.8 -42.7 26.2 26.2 6 -0.2 1.0 -2.6 14.5 -11.8 -11.8
1, 3,and 5 30.1 -62.1 47.2 -62.1 30.1 30.1 2, 4, and 6 -30.1 62.1 -47.2 62.1 -30.1 -30.1
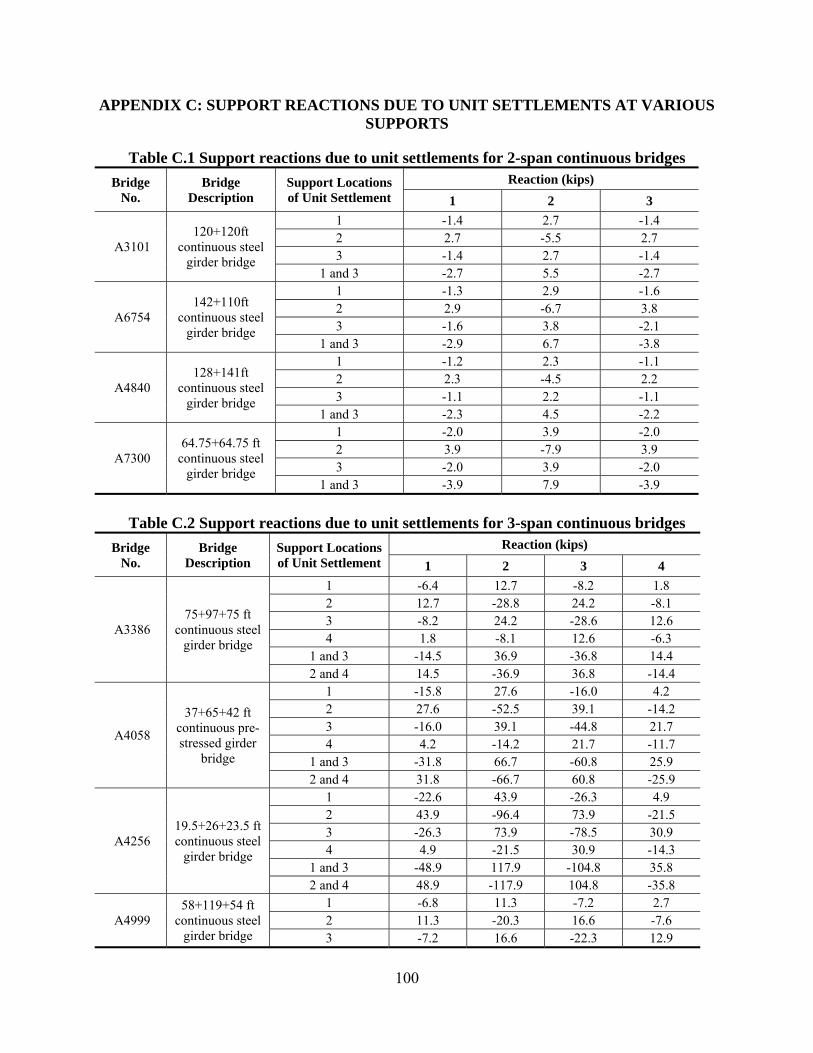
100
APPENDIX C: SUPPORT REACTIONS DUE TO UNIT SETTLEMENTS AT VARIOUS SUPPORTS
Table C.1 Support reactions due to unit settlements for 2-span continuous bridges Bridge
No. Bridge
Description Support Locations of Unit Settlement
Reaction (kips) 1 2 3
A3101 120+120ft
continuous steel girder bridge
1 -1.4 2.7 -1.4 2 2.7 -5.5 2.7 3 -1.4 2.7 -1.4
1 and 3 -2.7 5.5 -2.7
A6754 142+110ft
continuous steel girder bridge
1 -1.3 2.9 -1.6 2 2.9 -6.7 3.8 3 -1.6 3.8 -2.1
1 and 3 -2.9 6.7 -3.8
A4840 128+141ft
continuous steel girder bridge
1 -1.2 2.3 -1.1 2 2.3 -4.5 2.2 3 -1.1 2.2 -1.1
1 and 3 -2.3 4.5 -2.2
A7300 64.75+64.75 ft
continuous steel girder bridge
1 -2.0 3.9 -2.0 2 3.9 -7.9 3.9 3 -2.0 3.9 -2.0
1 and 3 -3.9 7.9 -3.9
Table C.2 Support reactions due to unit settlements for 3-span continuous bridges
Bridge No.
Bridge Description
Support Locations of Unit Settlement
Reaction (kips) 1 2 3 4
A3386 75+97+75 ft
continuous steel girder bridge
1 -6.4 12.7 -8.2 1.8 2 12.7 -28.8 24.2 -8.1 3 -8.2 24.2 -28.6 12.6 4 1.8 -8.1 12.6 -6.3
1 and 3 -14.5 36.9 -36.8 14.4 2 and 4 14.5 -36.9 36.8 -14.4
A4058
37+65+42 ft continuous pre-stressed girder
bridge
1 -15.8 27.6 -16.0 4.2 2 27.6 -52.5 39.1 -14.2 3 -16.0 39.1 -44.8 21.7 4 4.2 -14.2 21.7 -11.7
1 and 3 -31.8 66.7 -60.8 25.9 2 and 4 31.8 -66.7 60.8 -25.9
A4256 19.5+26+23.5 ft continuous steel
girder bridge
1 -22.6 43.9 -26.3 4.9 2 43.9 -96.4 73.9 -21.5 3 -26.3 73.9 -78.5 30.9 4 4.9 -21.5 30.9 -14.3
1 and 3 -48.9 117.9 -104.8 35.8 2 and 4 48.9 -117.9 104.8 -35.8
A4999 58+119+54 ft
continuous steel girder bridge
1 -6.8 11.3 -7.2 2.7 2 11.3 -20.3 16.6 -7.6 3 -7.2 16.6 -22.3 12.9
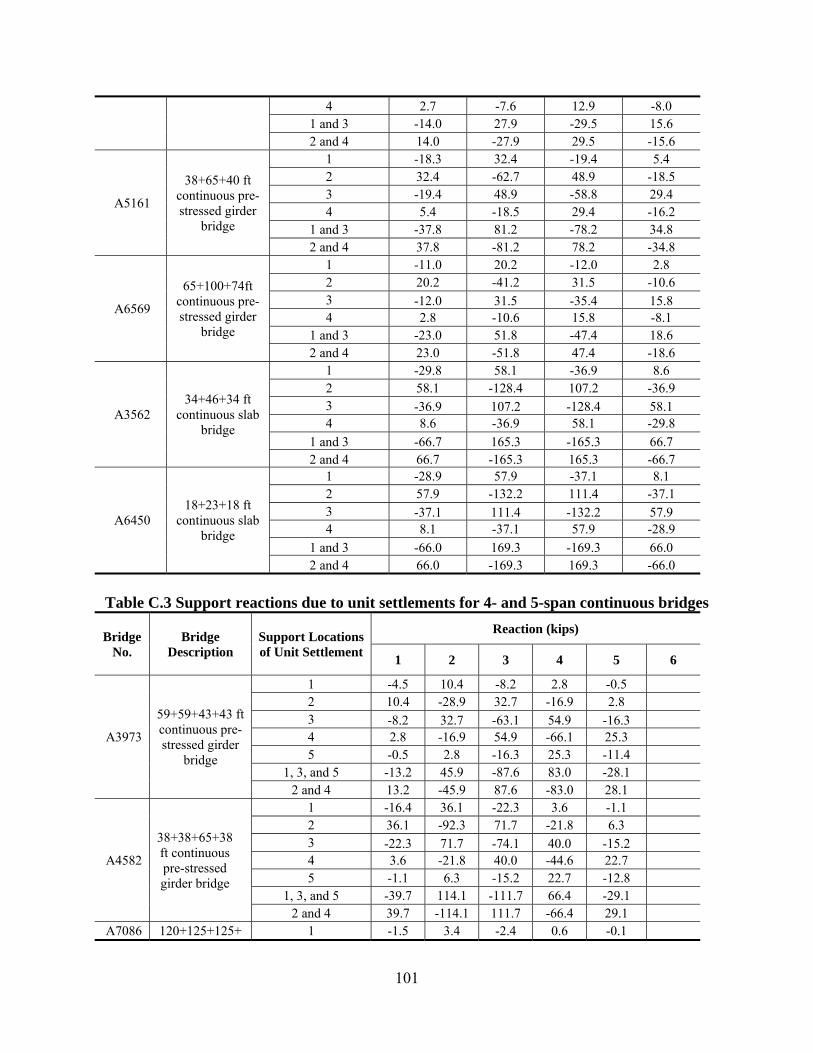
101
4 2.7 -7.6 12.9 -8.0 1 and 3 -14.0 27.9 -29.5 15.6 2 and 4 14.0 -27.9 29.5 -15.6
A5161
38+65+40 ft continuous pre-stressed girder
bridge
1 -18.3 32.4 -19.4 5.4 2 32.4 -62.7 48.9 -18.5 3 -19.4 48.9 -58.8 29.4 4 5.4 -18.5 29.4 -16.2
1 and 3 -37.8 81.2 -78.2 34.8 2 and 4 37.8 -81.2 78.2 -34.8
A6569
65+100+74ft continuous pre-stressed girder
bridge
1 -11.0 20.2 -12.0 2.8 2 20.2 -41.2 31.5 -10.6 3 -12.0 31.5 -35.4 15.8 4 2.8 -10.6 15.8 -8.1
1 and 3 -23.0 51.8 -47.4 18.6 2 and 4 23.0 -51.8 47.4 -18.6
A3562 34+46+34 ft
continuous slab bridge
1 -29.8 58.1 -36.9 8.6 2 58.1 -128.4 107.2 -36.9 3 -36.9 107.2 -128.4 58.1 4 8.6 -36.9 58.1 -29.8
1 and 3 -66.7 165.3 -165.3 66.7 2 and 4 66.7 -165.3 165.3 -66.7
A6450 18+23+18 ft
continuous slab bridge
1 -28.9 57.9 -37.1 8.1 2 57.9 -132.2 111.4 -37.1 3 -37.1 111.4 -132.2 57.9 4 8.1 -37.1 57.9 -28.9
1 and 3 -66.0 169.3 -169.3 66.0 2 and 4 66.0 -169.3 169.3 -66.0
Table C.3 Support reactions due to unit settlements for 4- and 5-span continuous bridges
Bridge No.
Bridge Description
Support Locations of Unit Settlement
Reaction (kips)
1 2 3 4 5 6
A3973
59+59+43+43 ft continuous pre-stressed girder
bridge
1 -4.5 10.4 -8.2 2.8 -0.5 2 10.4 -28.9 32.7 -16.9 2.8 3 -8.2 32.7 -63.1 54.9 -16.3 4 2.8 -16.9 54.9 -66.1 25.3 5 -0.5 2.8 -16.3 25.3 -11.4
1, 3, and 5 -13.2 45.9 -87.6 83.0 -28.1 2 and 4 13.2 -45.9 87.6 -83.0 28.1
A4582
38+38+65+38 ft continuous pre-stressed girder bridge
1 -16.4 36.1 -22.3 3.6 -1.1 2 36.1 -92.3 71.7 -21.8 6.3 3 -22.3 71.7 -74.1 40.0 -15.2 4 3.6 -21.8 40.0 -44.6 22.7 5 -1.1 6.3 -15.2 22.7 -12.8
1, 3, and 5 -39.7 114.1 -111.7 66.4 -29.1 2 and 4 39.7 -114.1 111.7 -66.4 29.1
A7086 120+125+125+ 1 -1.5 3.4 -2.4 0.6 -0.1
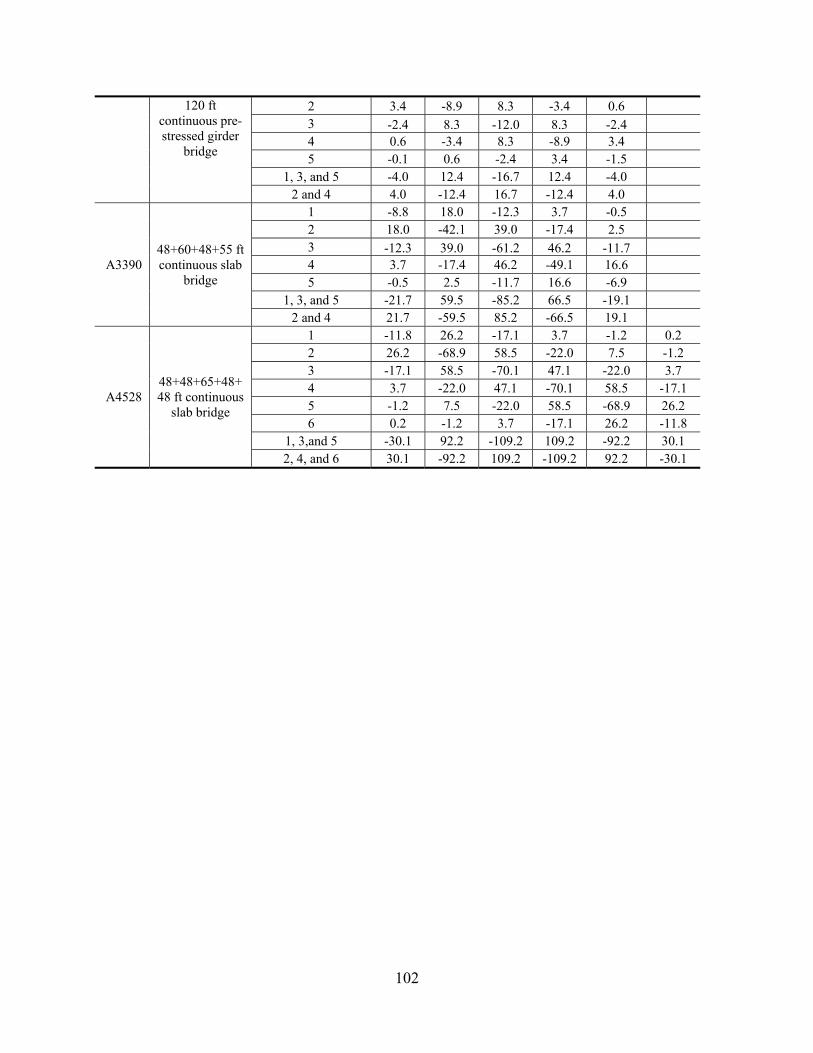
102
120 ft continuous pre-stressed girder
bridge
2 3.4 -8.9 8.3 -3.4 0.6 3 -2.4 8.3 -12.0 8.3 -2.4 4 0.6 -3.4 8.3 -8.9 3.4 5 -0.1 0.6 -2.4 3.4 -1.5
1, 3, and 5 -4.0 12.4 -16.7 12.4 -4.0 2 and 4 4.0 -12.4 16.7 -12.4 4.0
A3390 48+60+48+55 ft continuous slab
bridge
1 -8.8 18.0 -12.3 3.7 -0.5 2 18.0 -42.1 39.0 -17.4 2.5 3 -12.3 39.0 -61.2 46.2 -11.7 4 3.7 -17.4 46.2 -49.1 16.6 5 -0.5 2.5 -11.7 16.6 -6.9
1, 3, and 5 -21.7 59.5 -85.2 66.5 -19.1 2 and 4 21.7 -59.5 85.2 -66.5 19.1
A4528 48+48+65+48+48 ft continuous
slab bridge
1 -11.8 26.2 -17.1 3.7 -1.2 0.2 2 26.2 -68.9 58.5 -22.0 7.5 -1.2 3 -17.1 58.5 -70.1 47.1 -22.0 3.7 4 3.7 -22.0 47.1 -70.1 58.5 -17.1 5 -1.2 7.5 -22.0 58.5 -68.9 26.2 6 0.2 -1.2 3.7 -17.1 26.2 -11.8
1, 3,and 5 -30.1 92.2 -109.2 109.2 -92.2 30.1 2, 4, and 6 30.1 -92.2 109.2 -109.2 92.2 -30.1
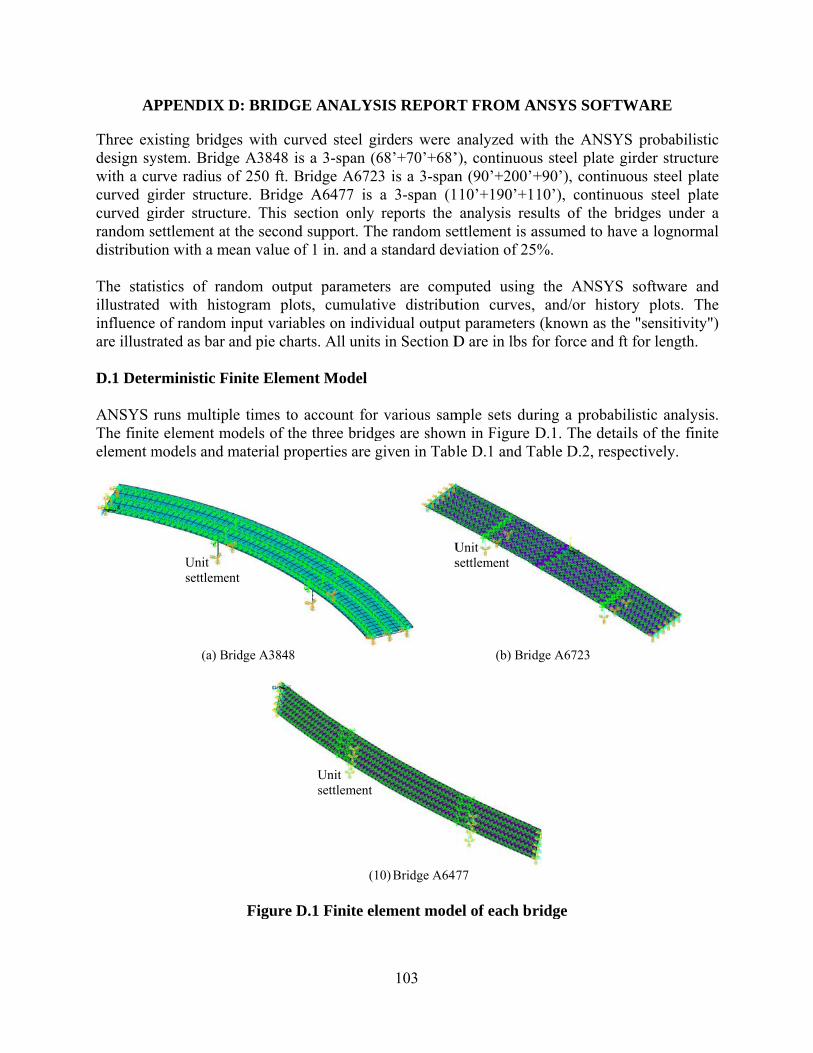
A
Three exdesign sywith a cucurved gcurved grandom sdistributi The statiillustrateinfluenceare illustr
D.1 Dete ANSYS The finitelement m
APPENDIX
xisting bridgystem. Bridgurve radius ogirder structugirder structusettlement ation with a m
istics of rand with histe of random rated as bar
erministic F
runs multipe element mmodels and m
(a) B
Unit settleme
D: BRIDGE
ges with curge A3848 isof 250 ft. Bure. Bridge ure. This set the second
mean value of
ndom outputogram plotinput variaband pie char
Finite Eleme
le times to models of the
material pro
ridge A3848
Figure D
ent
E ANALYS
ved steel gi a 3-span (6ridge A6723A6477 is
ection only support. Th
f 1 in. and a
ut parameterts, cumulatibles on indivrts. All units
ent Model
account for e three bridgoperties are g
(1
D.1 Finite ele
Unit settlement
103
SIS REPOR
irders were 68’+70’+68’3 is a 3-spana 3-span (1reports the
he random sestandard dev
rs are compive distributvidual output in Section D
various samges are showgiven in Tabl
0) Bridge A647
ement mode
Us
RT FROM A
analyzed wi’), continuoun (90’+200’
110’+190’+1analysis res
ettlement is aviation of 25
puted usingtion curves,t parametersD are in lbs f
mple sets duwn in Figure
le D.1 and T
(b) Brid
77
el of each br
Unit settlement
ANSYS SOF
ith the ANSus steel plate+90’), conti
110’), continsults of the assumed to h5%.
g the ANSY, and/or hiss (known as for force and
uring a probaD.1. The de
Table D.2, re
dge A6723
ridge
FTWARE
SYS probabie girder struinuous steel nuous steel
bridges unhave a logno
YS softwarestory plots. the "sensitiv
d ft for lengt
abilistic anaetails of the espectively.
ilistic ucture
plate plate der a ormal
e and The
vity") th.
alysis. finite
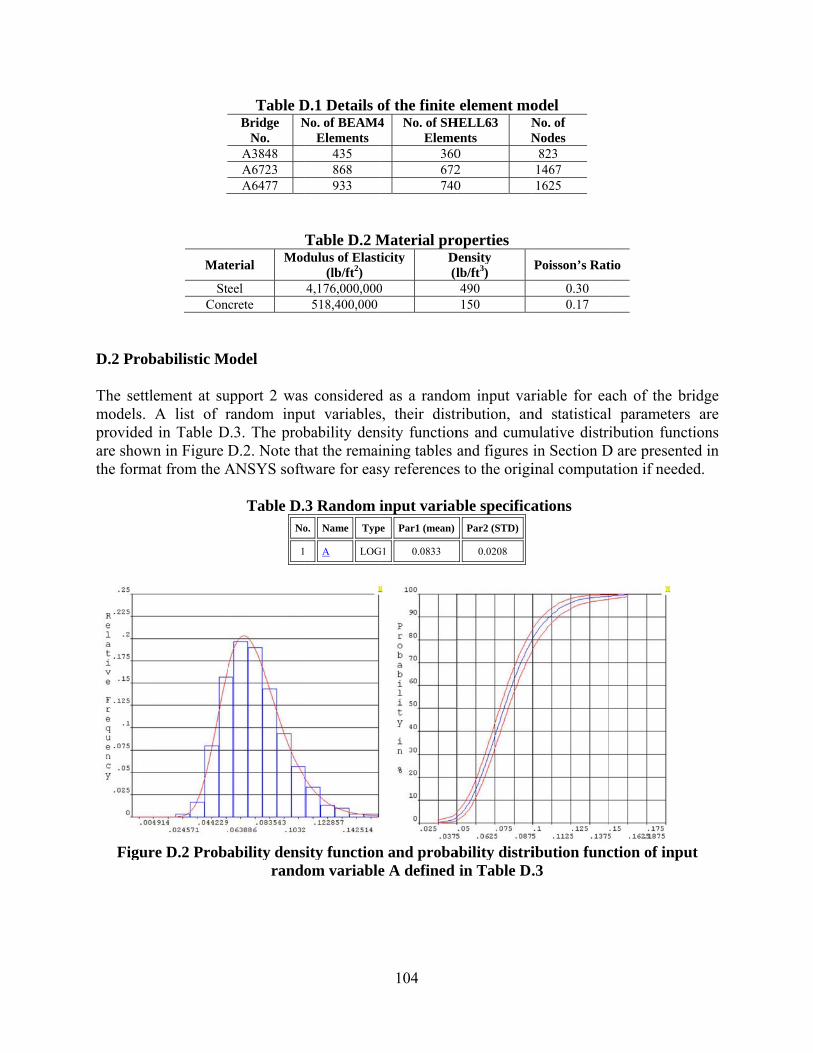
D.2 Prob The settlmodels. providedare showthe forma
Figur
Mat
SteCon
babilistic M
lement at suA list of r
d in Table Dwn in Figure D
at from the A
re D.2 Proba
Table DBridge
No. N
A3848 A6723 A6477
terial Mod
eel crete
Model
upport 2 wasrandom inpu
D.3. The probD.2. Note thANSYS soft
Table D.No
1
ability densrand
D.1 Details oNo. of BEAM4
Elements 435 868 933
Table D.2 Mdulus of Elast
(lb/ft2) 4,176,000,000518,400,000
s consideredut variablesbability den
hat the remaitware for eas
.3 Random io. Name Typ
A LOG
sity functionom variable
104
of the finite 4 No. of SH
Eleme360672740
Material proticity D
(l0
d as a randos, their distrsity functionining tables sy references
input variabe Par1 (mean)
G1 0.0833
n and probae A defined
element moHELL63 ents
NN
0 2 0
operties Density
lb/ft3) 490 150
om input varribution, anns and cumuand figures s to the origi
ble specificaPar2 (STD)
0.0208
ability distriin Table D.
odel No. of Nodes
823 1467 1625
Poisson’s Rat
0.30 0.17
riable for eand statisticalulative distrin Section Dinal computa
ations
ibution func.3
tio
ach of the bl parameter
ribution funcD are presentation if need
ction of inpu
bridge s are ctions ted in
ded.
ut
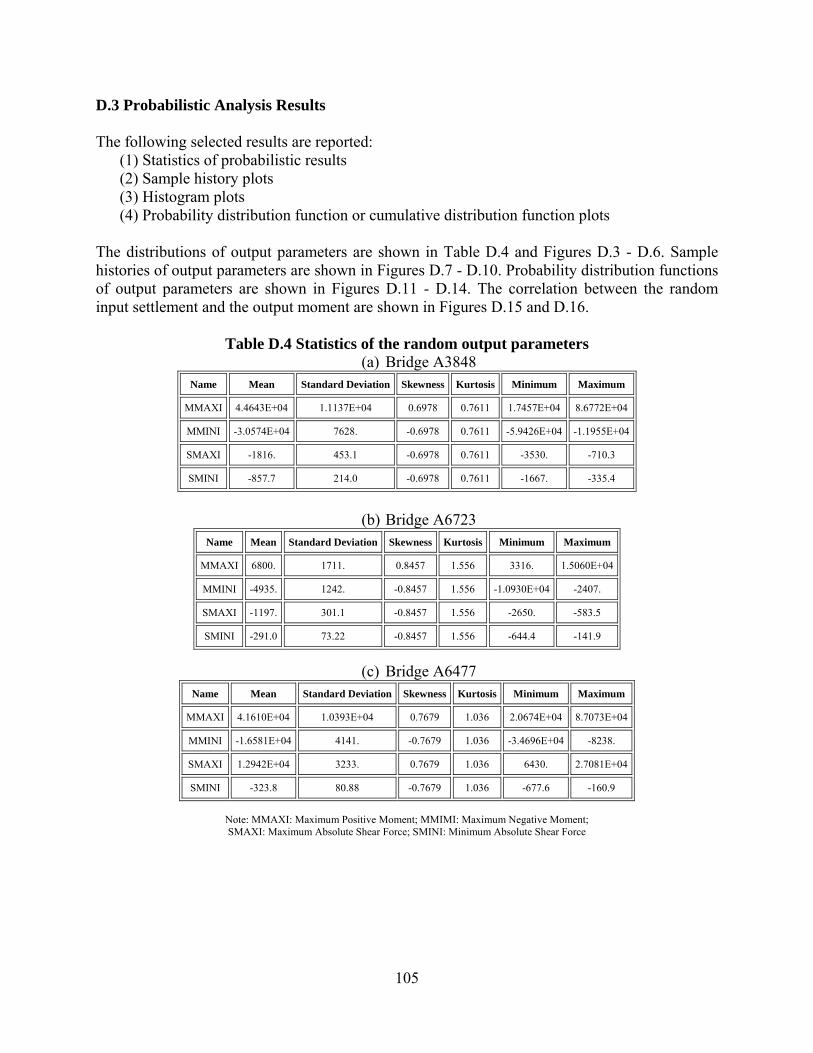
105
D.3 Probabilistic Analysis Results The following selected results are reported:
(1) Statistics of probabilistic results (2) Sample history plots (3) Histogram plots (4) Probability distribution function or cumulative distribution function plots
The distributions of output parameters are shown in Table D.4 and Figures D.3 - D.6. Sample histories of output parameters are shown in Figures D.7 - D.10. Probability distribution functions of output parameters are shown in Figures D.11 - D.14. The correlation between the random input settlement and the output moment are shown in Figures D.15 and D.16.
Table D.4 Statistics of the random output parameters (a) Bridge A3848
Name Mean Standard Deviation Skewness Kurtosis Minimum Maximum
MMAXI 4.4643E+04 1.1137E+04 0.6978 0.7611 1.7457E+04 8.6772E+04
MMINI -3.0574E+04 7628. -0.6978 0.7611 -5.9426E+04 -1.1955E+04
SMAXI -1816. 453.1 -0.6978 0.7611 -3530. -710.3
SMINI -857.7 214.0 -0.6978 0.7611 -1667. -335.4
(b) Bridge A6723
Name Mean Standard Deviation Skewness Kurtosis Minimum Maximum
MMAXI 6800. 1711. 0.8457 1.556 3316. 1.5060E+04
MMINI -4935. 1242. -0.8457 1.556 -1.0930E+04 -2407.
SMAXI -1197. 301.1 -0.8457 1.556 -2650. -583.5
SMINI -291.0 73.22 -0.8457 1.556 -644.4 -141.9
(c) Bridge A6477 Name Mean Standard Deviation Skewness Kurtosis Minimum Maximum
MMAXI 4.1610E+04 1.0393E+04 0.7679 1.036 2.0674E+04 8.7073E+04
MMINI -1.6581E+04 4141. -0.7679 1.036 -3.4696E+04 -8238.
SMAXI 1.2942E+04 3233. 0.7679 1.036 6430. 2.7081E+04
SMINI -323.8 80.88 -0.7679 1.036 -677.6 -160.9
Note: MMAXI: Maximum Positive Moment; MMIMI: Maximum Negative Moment; SMAXI: Maximum Absolute Shear Force; SMINI: Minimum Absolute Shear Force
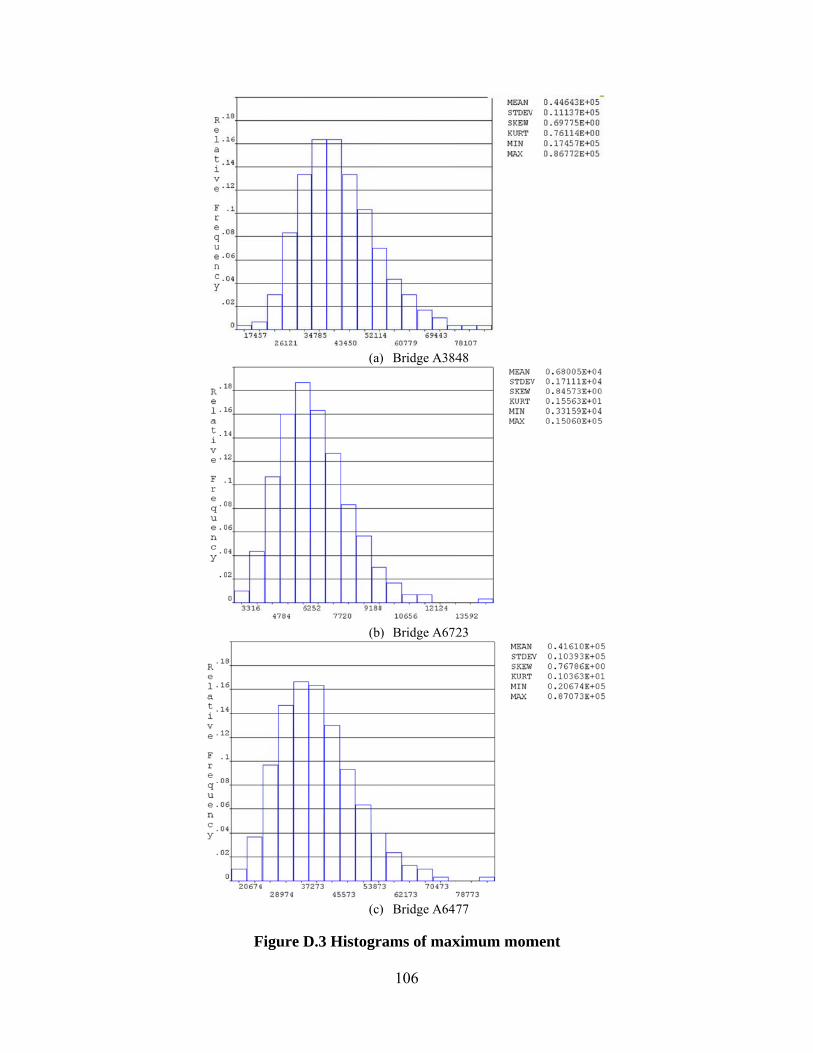
Figure D
(a)
(b)
(c)
D.3 Histogr
106
) Bridge A384
) Bridge A672
) Bridge A647
rams of max
48
23
77
ximum momment
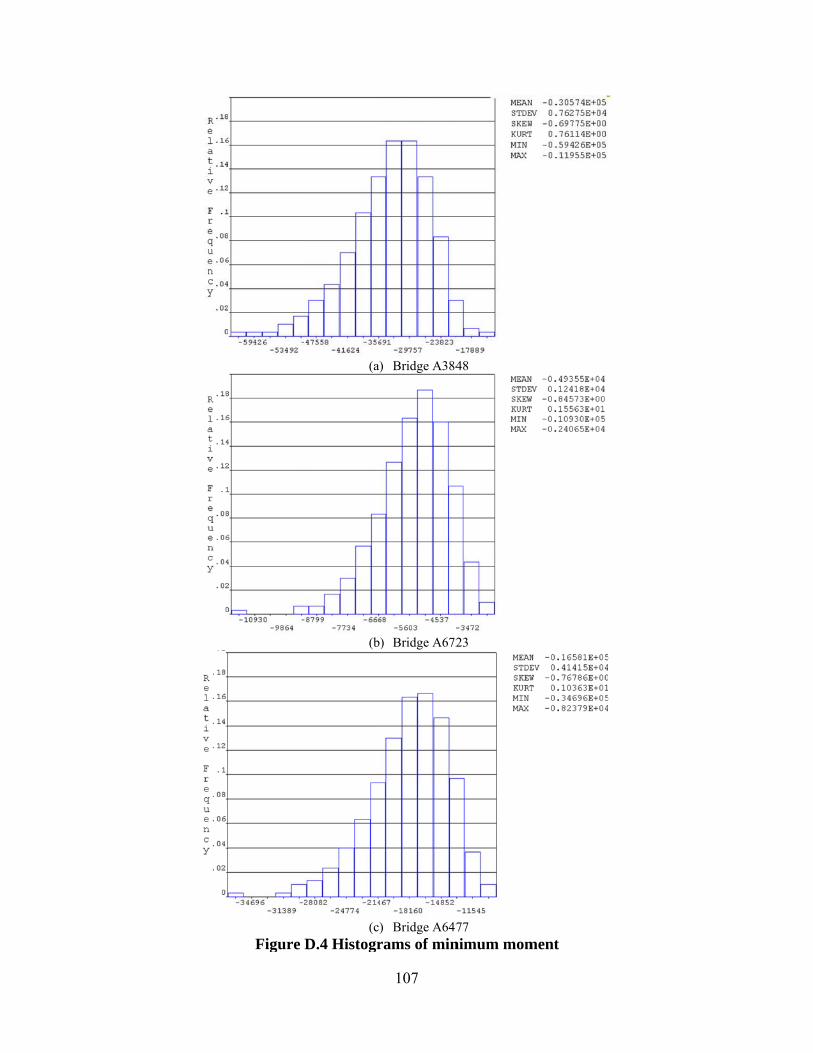
Figure
(a)
(b)
(c)D.4 Histogr
107
) Bridge A384
) Bridge A672
) Bridge A647rams of min
48
23
77 nimum momment
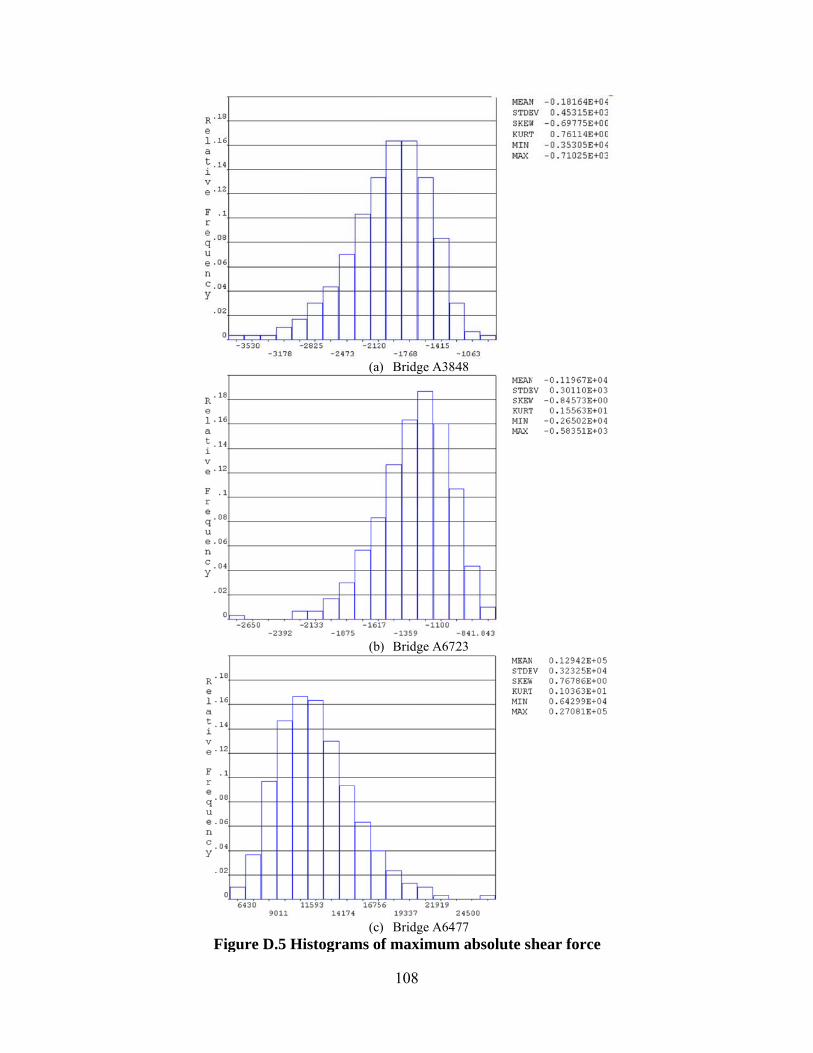
Figure D.5 Hi
(a)
(b)
(c)istograms o
108
) Bridge A384
) Bridge A672
) Bridge A647of maximum
48
23
77 m absolute shhear force
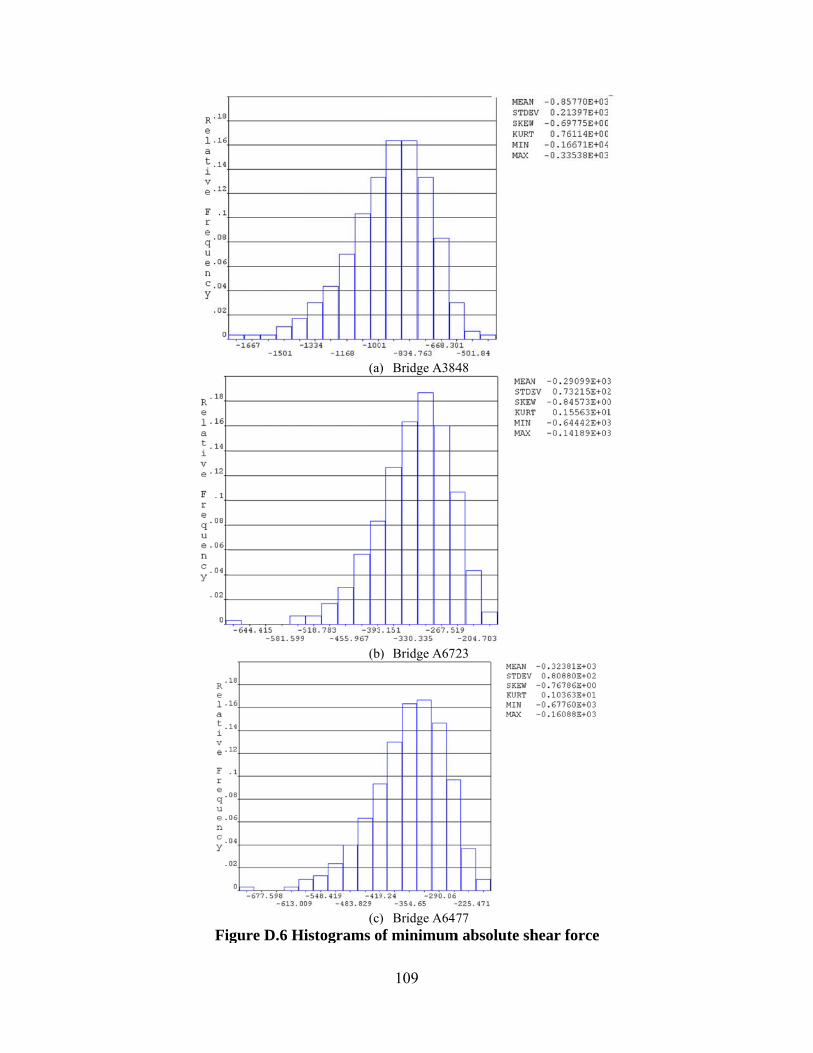
Fiigure D.6 H
(a)
(b)
(c)istograms o
109
) Bridge A384
) Bridge A672
) Bridge A647of minimum
48
23
77 m absolute shhear force
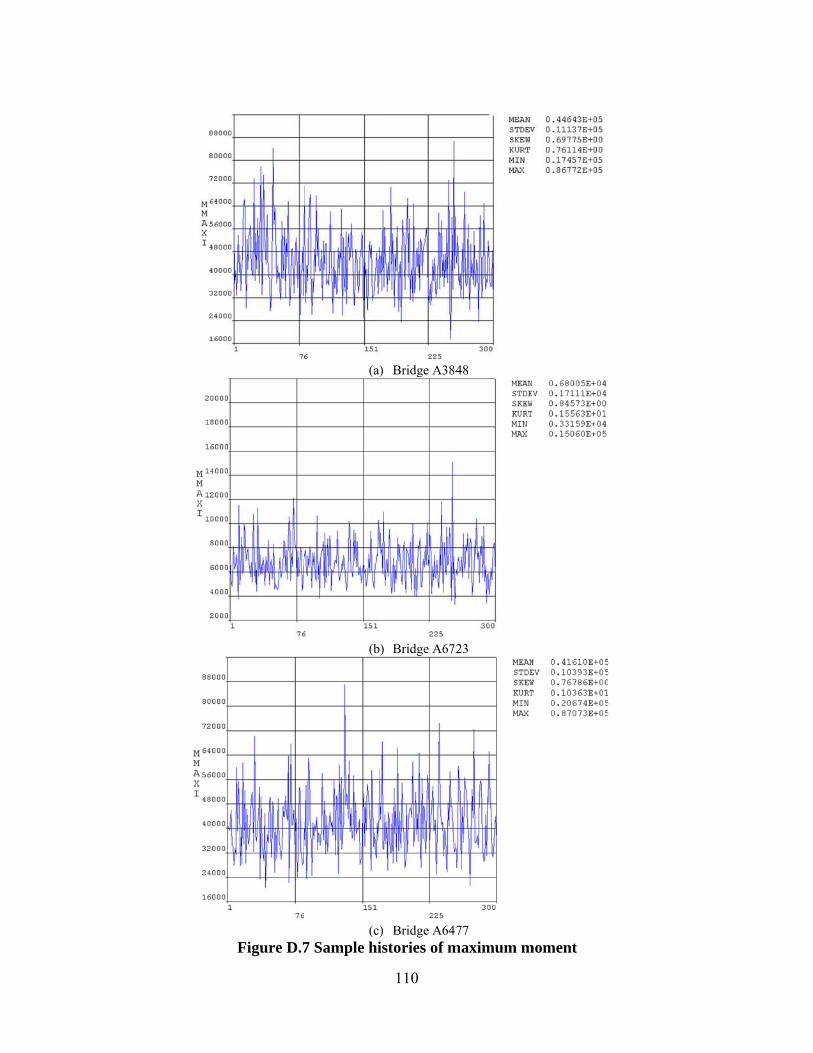
Figure D.7
(a)
(b)
(c)7 Sample hi
110
) Bridge A384
) Bridge A672
) Bridge A647istories of m
48
23
77 maximum mmoment
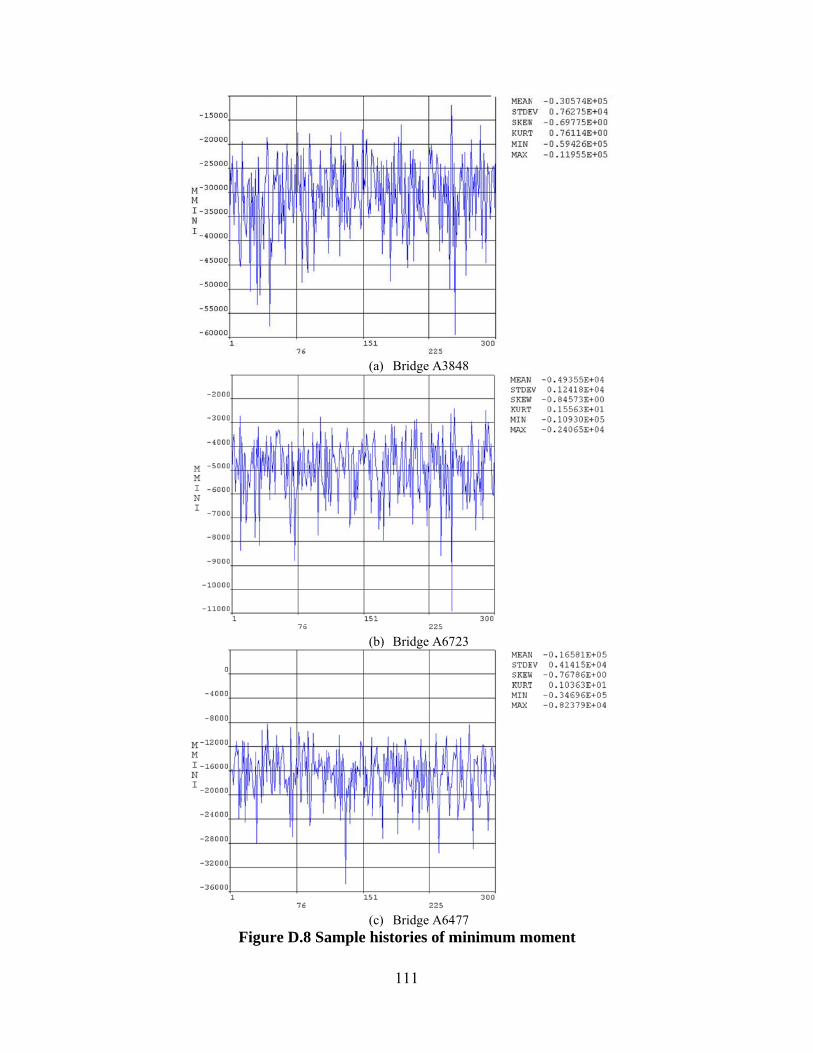
Figure D.8
(a)
(b)
(c)8 Sample hi
111
) Bridge A384
) Bridge A672
) Bridge A647istories of m
48
23
77 minimum mmoment
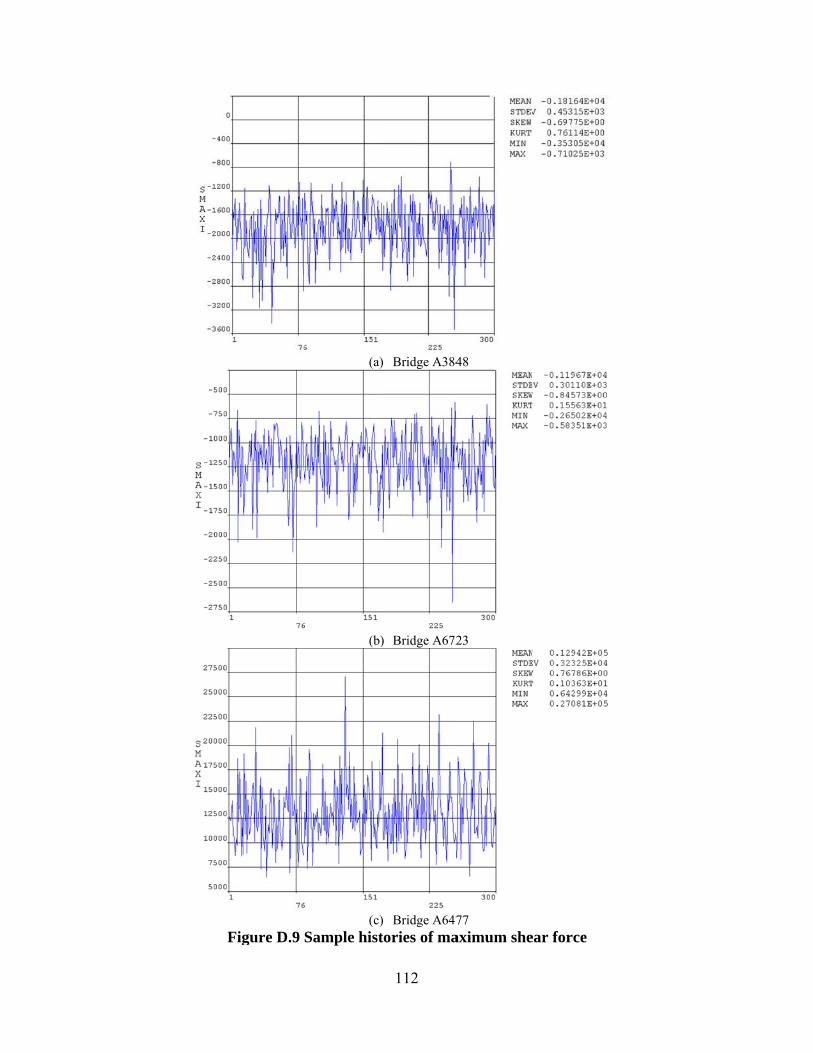
FFigure D.9
(a)
(b)
(c)Sample hist
112
) Bridge A384
) Bridge A672
) Bridge A647tories of ma
48
23
77 aximum sheear force
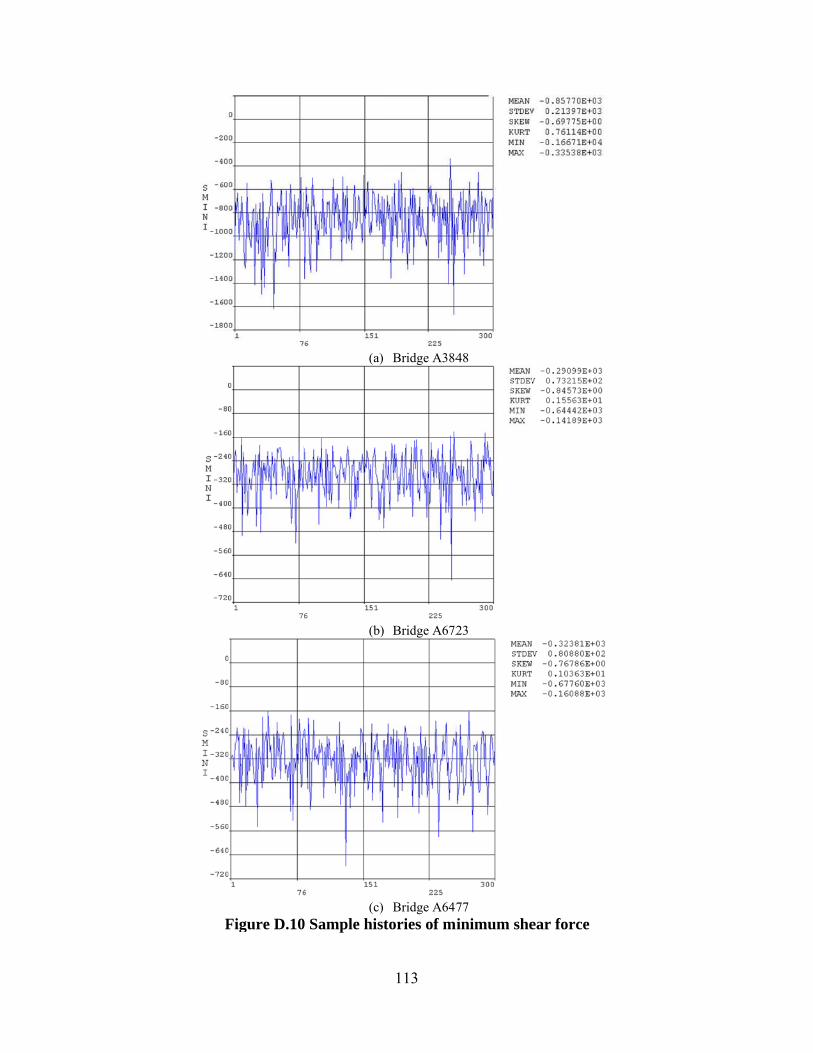
FFigure D.10
(a)
(b)
(c)0 Sample his
113
) Bridge A384
) Bridge A672
) Bridge A647stories of mi
48
23
77 inimum sheear force
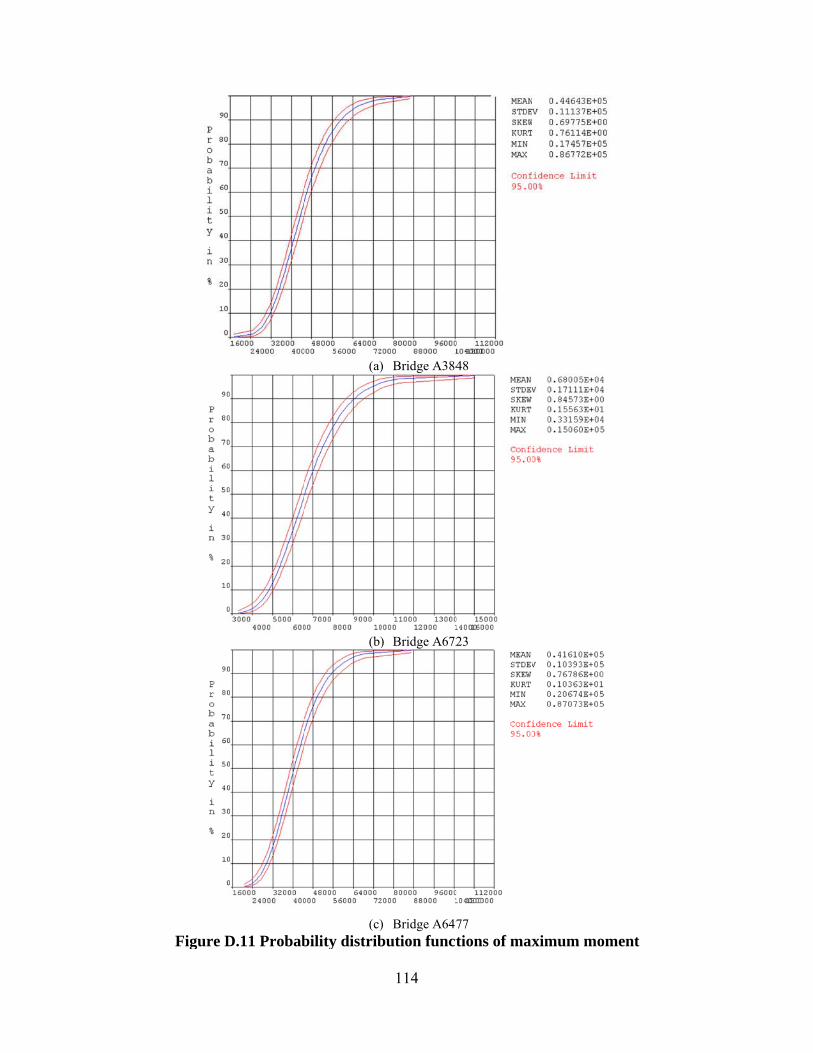
Figure DD.11 Probab
(a)
(b)
(c)bility distrib
114
) Bridge A384
) Bridge A672
) Bridge A647bution funct
48
23
77 tions of maxximum mom
ment
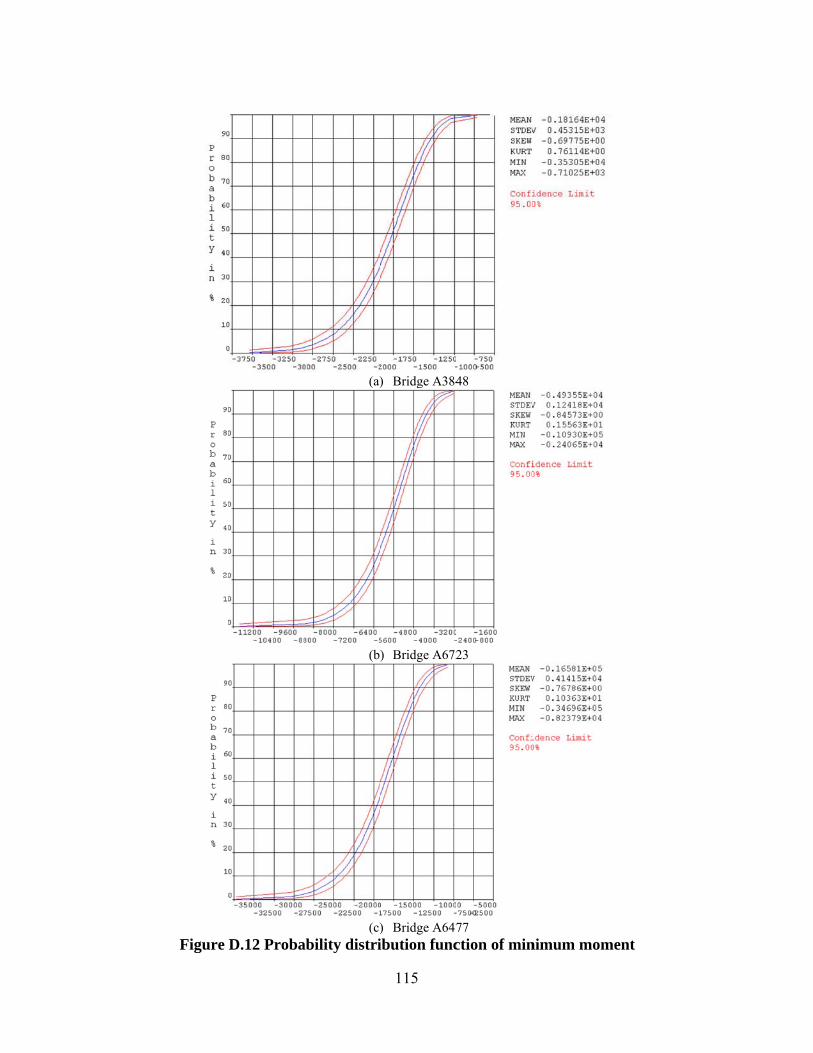
Figure D.12 Proba
(a)
(b)
(c)ability distri
115
) Bridge A384
) Bridge A672
) Bridge A647ibution func
48
23
77 ction of minnimum mom
ment
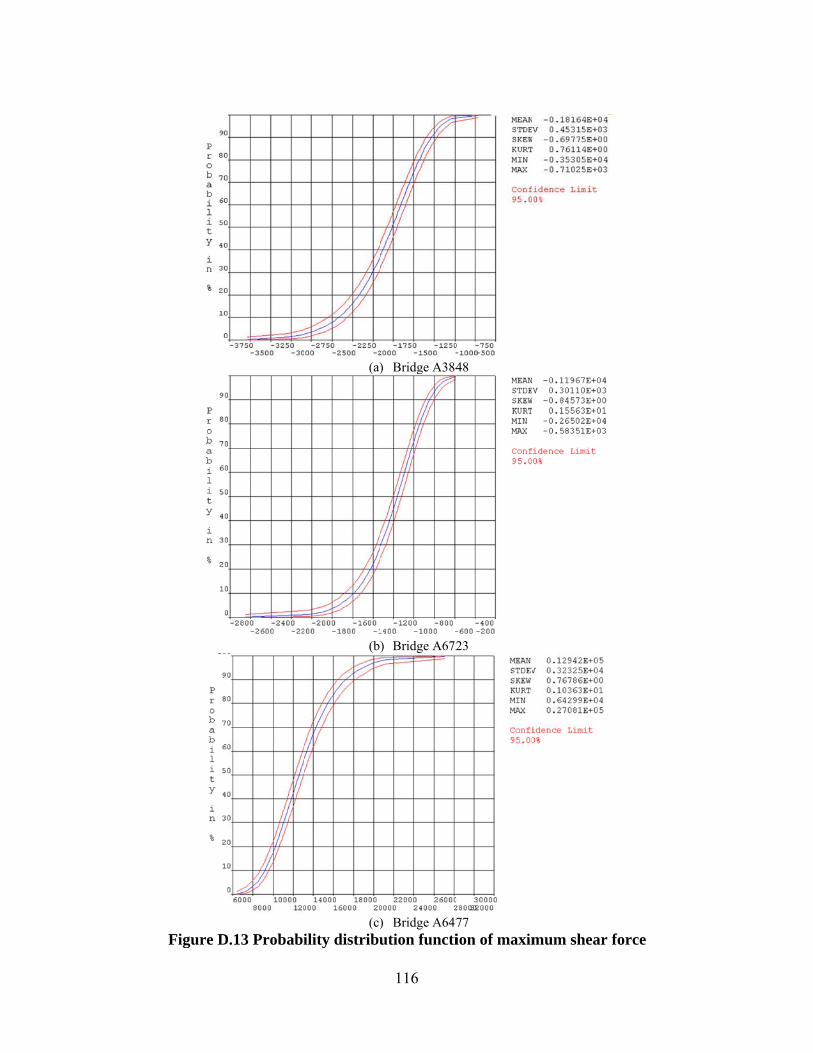
Figure D.13 Probabi
(a)
(b)
(c)ility distribu
116
) Bridge A384
) Bridge A672
) Bridge A647ution functi
48
23
77 ion of maximmum shear
force
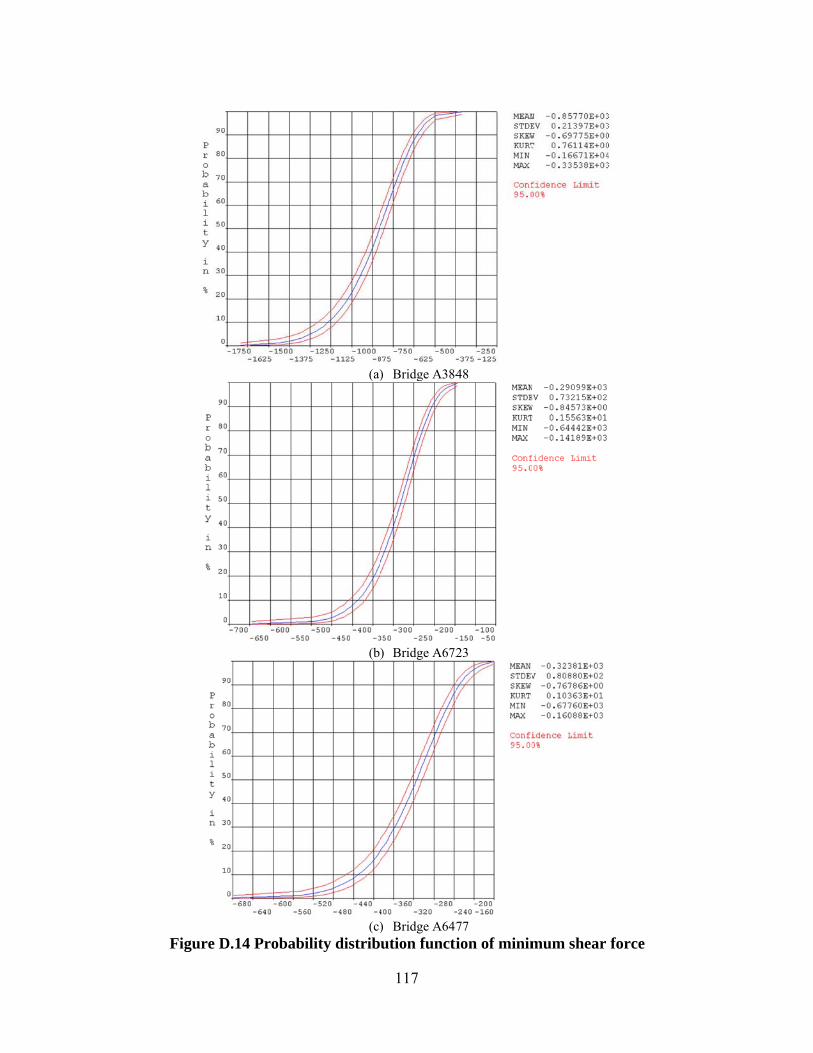
Figure DD.14 Probab
(a)
(b)
(c)ility distrib
117
) Bridge A384
) Bridge A672
) Bridge A647ution functi
48
23
77 ion of minimmum shear
force
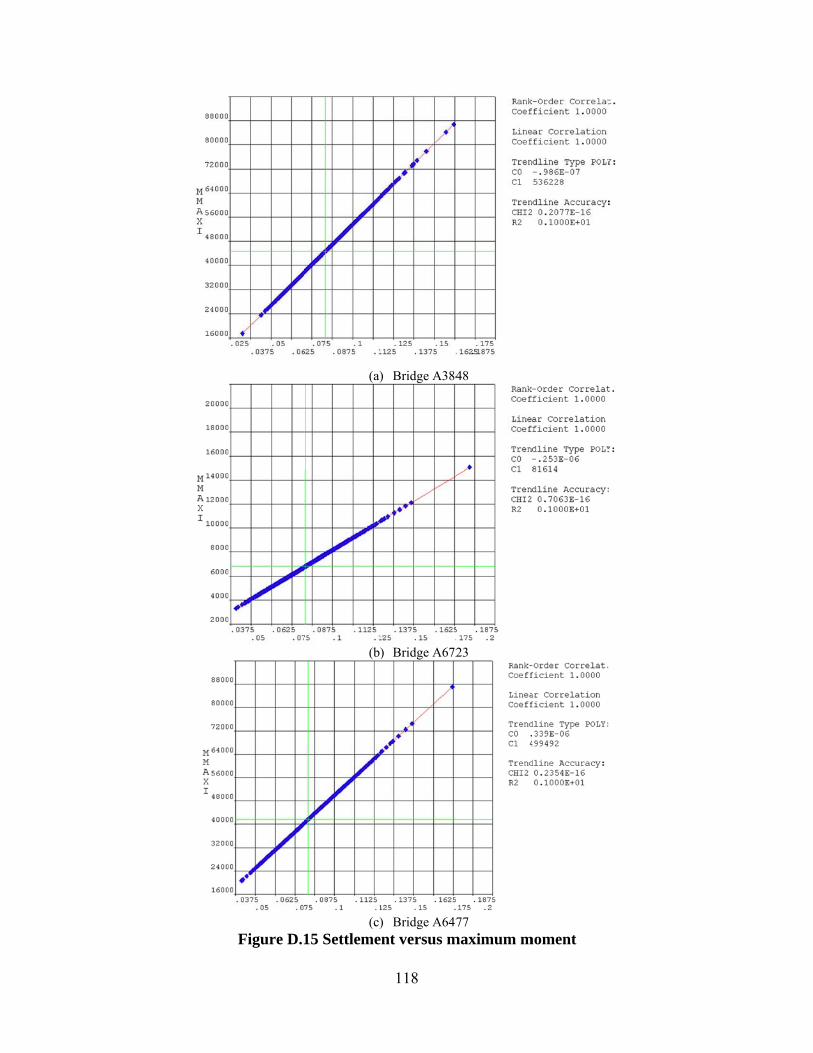
Figure D.1
(a)
(b)
(c)15 Settleme
118
) Bridge A384
) Bridge A672
) Bridge A647ent versus m
48
23
77 maximum mmoment
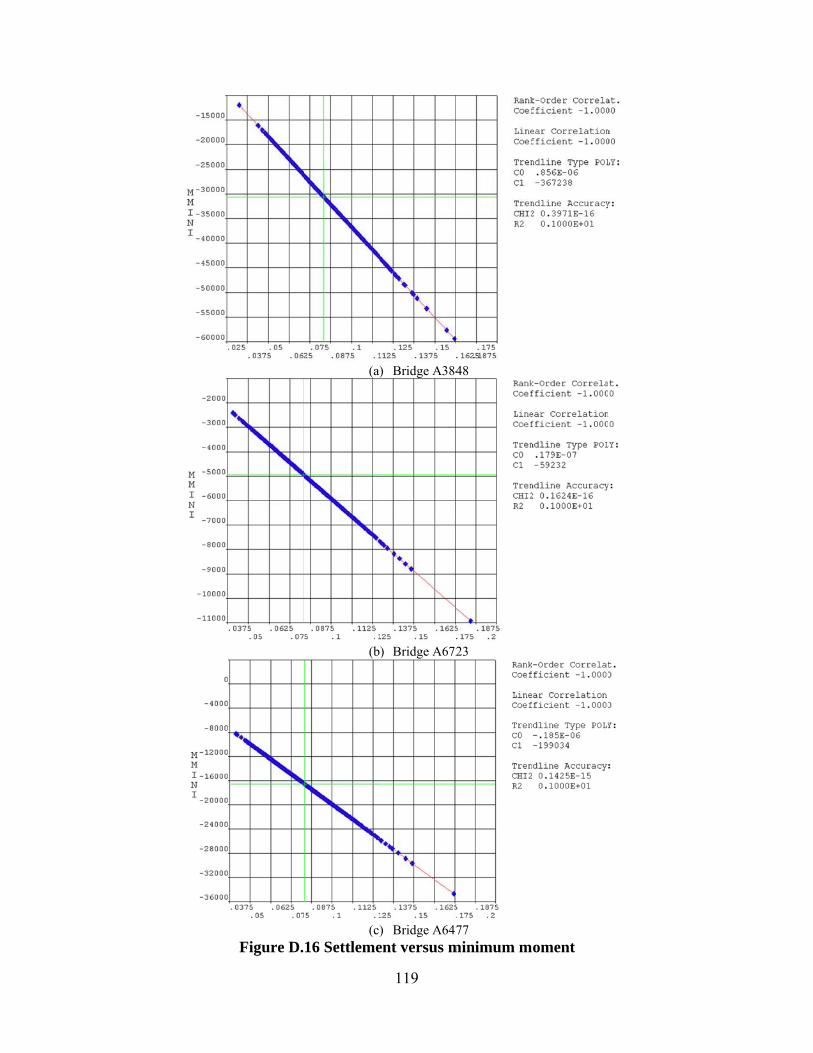
Figure D.
(a)
(b)
(c)16 Settleme
119
) Bridge A384
) Bridge A672
) Bridge A647ent versus m
48
23
77 minimum moment
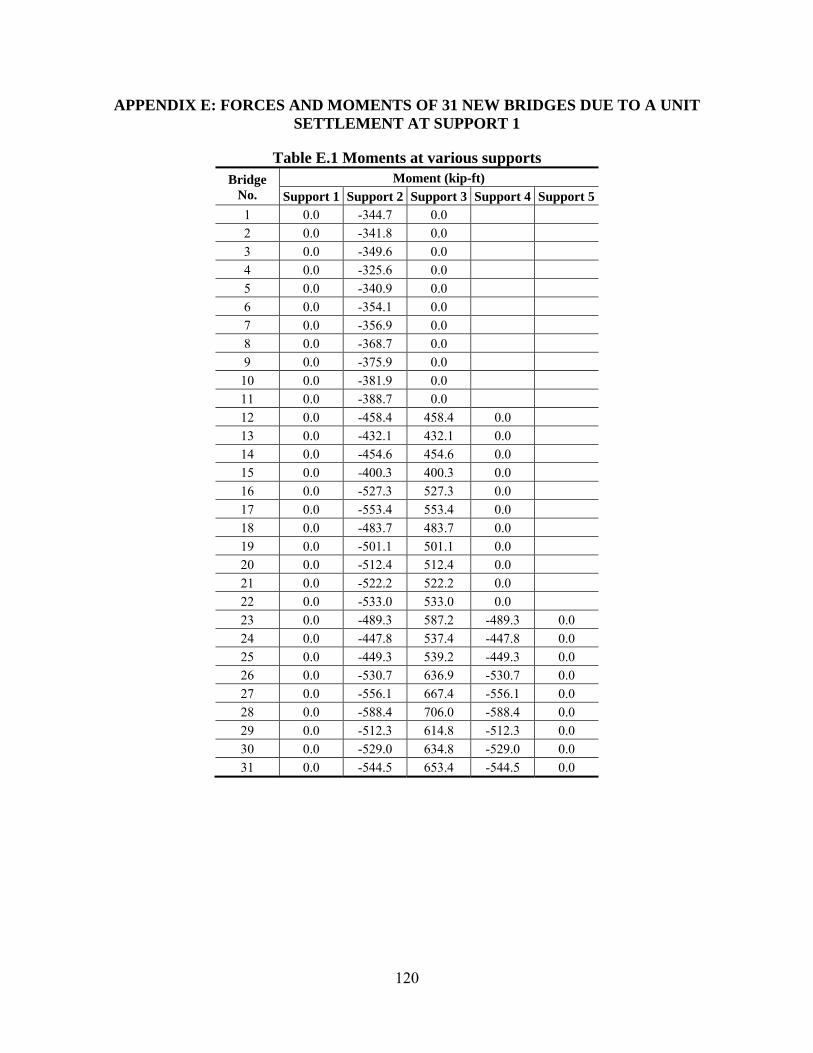
120
APPENDIX E: FORCES AND MOMENTS OF 31 NEW BRIDGES DUE TO A UNIT SETTLEMENT AT SUPPORT 1
Table E.1 Moments at various supports Bridge
No. Moment (kip-ft)
Support 1 Support 2 Support 3 Support 4 Support 5 1 0.0 -344.7 0.0 2 0.0 -341.8 0.0 3 0.0 -349.6 0.0 4 0.0 -325.6 0.0 5 0.0 -340.9 0.0 6 0.0 -354.1 0.0 7 0.0 -356.9 0.0 8 0.0 -368.7 0.0 9 0.0 -375.9 0.0
10 0.0 -381.9 0.0 11 0.0 -388.7 0.0 12 0.0 -458.4 458.4 0.0 13 0.0 -432.1 432.1 0.0 14 0.0 -454.6 454.6 0.0 15 0.0 -400.3 400.3 0.0 16 0.0 -527.3 527.3 0.0 17 0.0 -553.4 553.4 0.0 18 0.0 -483.7 483.7 0.0 19 0.0 -501.1 501.1 0.0 20 0.0 -512.4 512.4 0.0 21 0.0 -522.2 522.2 0.0 22 0.0 -533.0 533.0 0.0 23 0.0 -489.3 587.2 -489.3 0.0 24 0.0 -447.8 537.4 -447.8 0.0 25 0.0 -449.3 539.2 -449.3 0.0 26 0.0 -530.7 636.9 -530.7 0.0 27 0.0 -556.1 667.4 -556.1 0.0 28 0.0 -588.4 706.0 -588.4 0.0 29 0.0 -512.3 614.8 -512.3 0.0 30 0.0 -529.0 634.8 -529.0 0.0 31 0.0 -544.5 653.4 -544.5 0.0
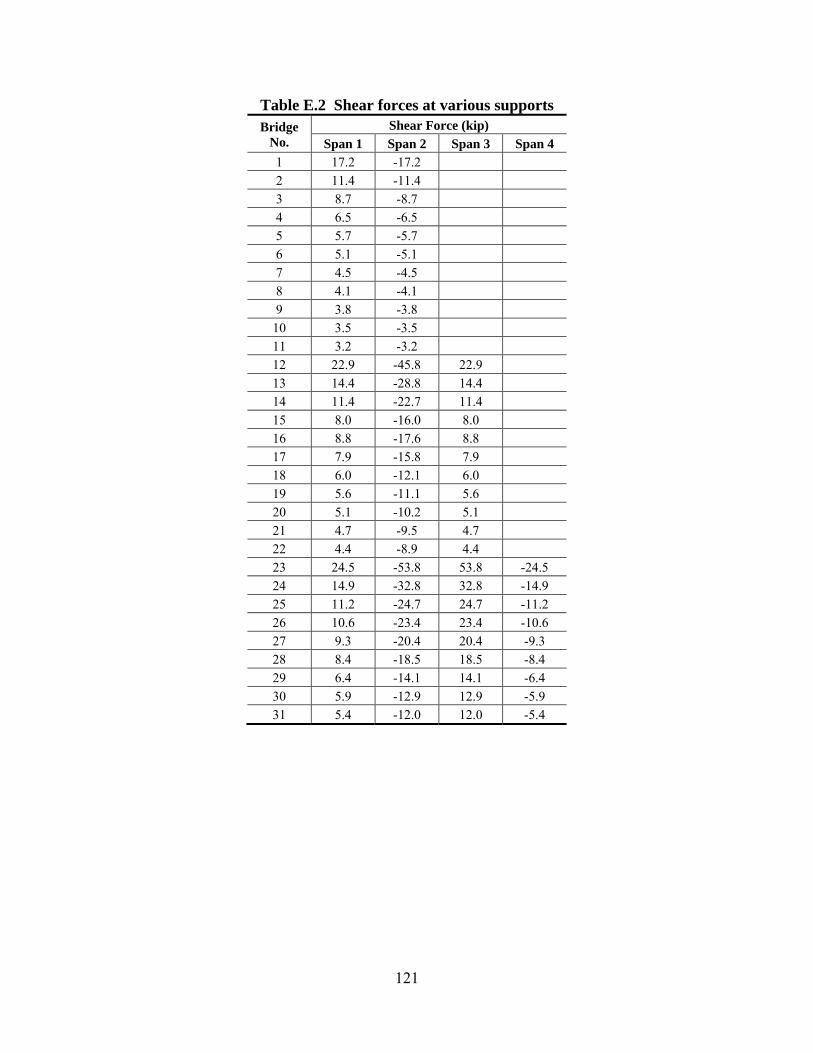
121
Table E.2 Shear forces at various supports Bridge
No. Shear Force (kip)
Span 1 Span 2 Span 3 Span 4 1 17.2 -17.2 2 11.4 -11.4 3 8.7 -8.7 4 6.5 -6.5 5 5.7 -5.7 6 5.1 -5.1 7 4.5 -4.5 8 4.1 -4.1 9 3.8 -3.8
10 3.5 -3.5 11 3.2 -3.2 12 22.9 -45.8 22.9 13 14.4 -28.8 14.4 14 11.4 -22.7 11.4 15 8.0 -16.0 8.0 16 8.8 -17.6 8.8 17 7.9 -15.8 7.9 18 6.0 -12.1 6.0 19 5.6 -11.1 5.6 20 5.1 -10.2 5.1 21 4.7 -9.5 4.7 22 4.4 -8.9 4.4 23 24.5 -53.8 53.8 -24.5 24 14.9 -32.8 32.8 -14.9 25 11.2 -24.7 24.7 -11.2 26 10.6 -23.4 23.4 -10.6 27 9.3 -20.4 20.4 -9.3 28 8.4 -18.5 18.5 -8.4 29 6.4 -14.1 14.1 -6.4 30 5.9 -12.9 12.9 -5.9 31 5.4 -12.0 12.0 -5.4
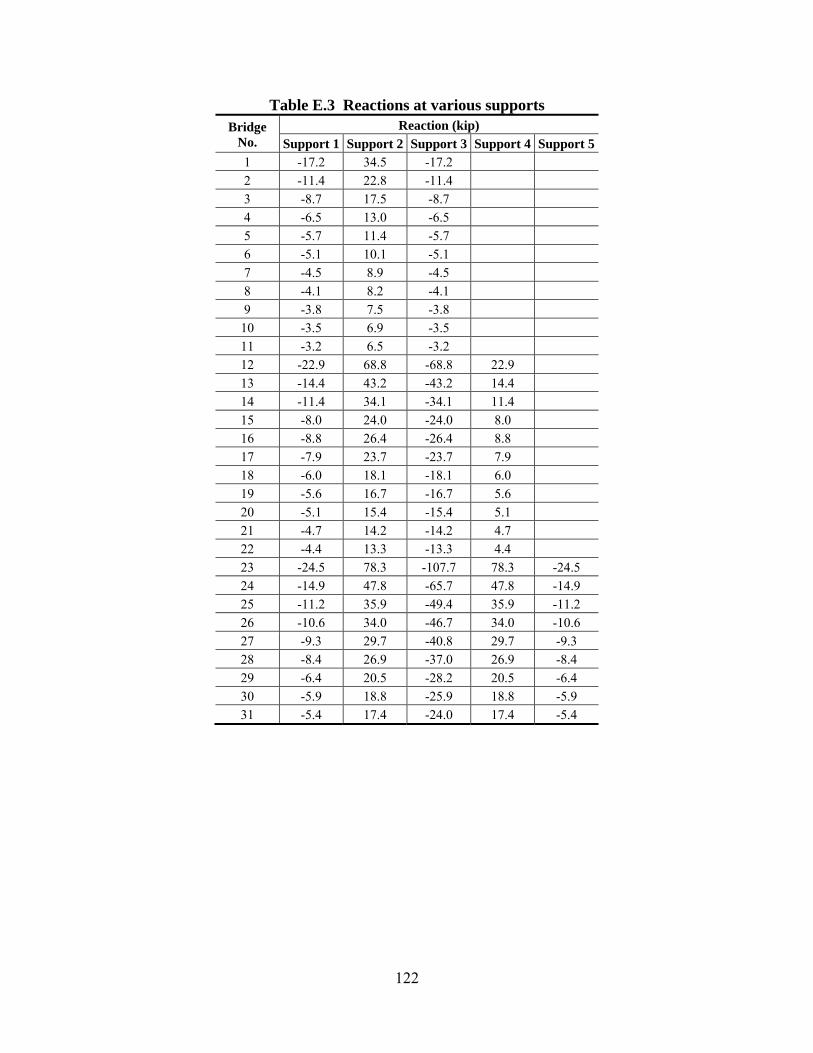
122
Table E.3 Reactions at various supports Bridge
No. Reaction (kip)
Support 1 Support 2 Support 3 Support 4 Support 5 1 -17.2 34.5 -17.2 2 -11.4 22.8 -11.4 3 -8.7 17.5 -8.7 4 -6.5 13.0 -6.5 5 -5.7 11.4 -5.7 6 -5.1 10.1 -5.1 7 -4.5 8.9 -4.5 8 -4.1 8.2 -4.1 9 -3.8 7.5 -3.8
10 -3.5 6.9 -3.5 11 -3.2 6.5 -3.2 12 -22.9 68.8 -68.8 22.9 13 -14.4 43.2 -43.2 14.4 14 -11.4 34.1 -34.1 11.4 15 -8.0 24.0 -24.0 8.0 16 -8.8 26.4 -26.4 8.8 17 -7.9 23.7 -23.7 7.9 18 -6.0 18.1 -18.1 6.0 19 -5.6 16.7 -16.7 5.6 20 -5.1 15.4 -15.4 5.1 21 -4.7 14.2 -14.2 4.7 22 -4.4 13.3 -13.3 4.4 23 -24.5 78.3 -107.7 78.3 -24.5 24 -14.9 47.8 -65.7 47.8 -14.9 25 -11.2 35.9 -49.4 35.9 -11.2 26 -10.6 34.0 -46.7 34.0 -10.6 27 -9.3 29.7 -40.8 29.7 -9.3 28 -8.4 26.9 -37.0 26.9 -8.4 29 -6.4 20.5 -28.2 20.5 -6.4 30 -5.9 18.8 -25.9 18.8 -5.9 31 -5.4 17.4 -24.0 17.4 -5.4
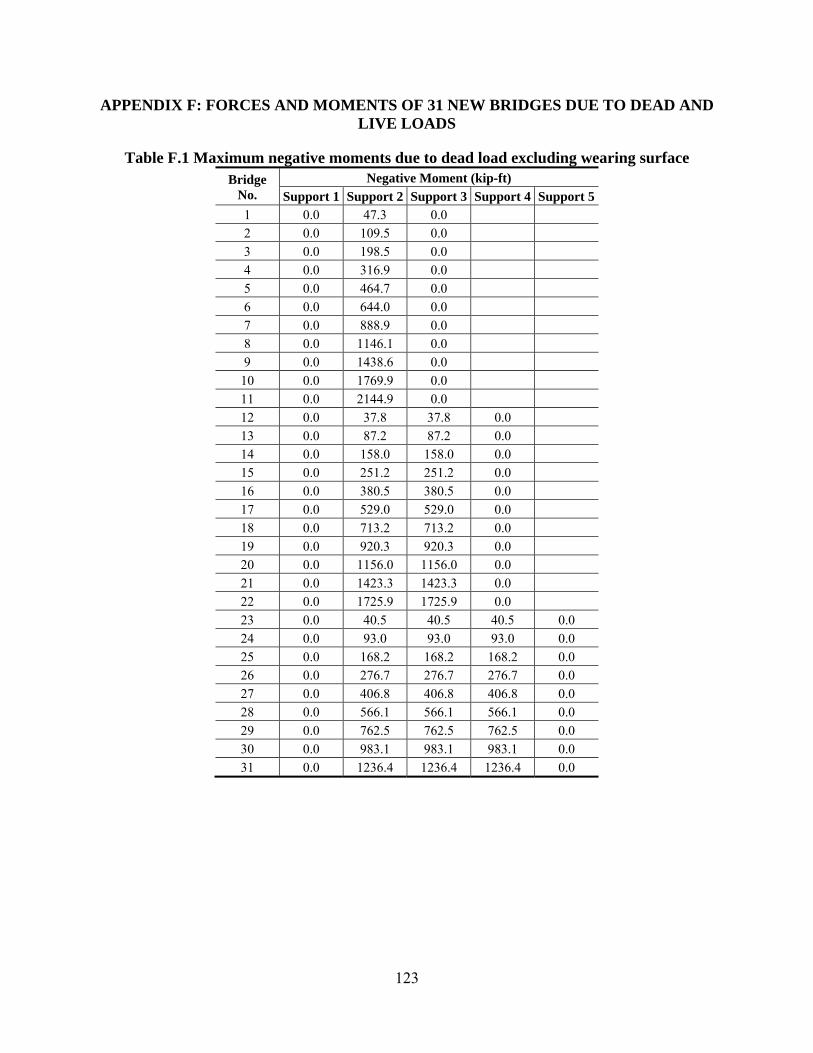
123
APPENDIX F: FORCES AND MOMENTS OF 31 NEW BRIDGES DUE TO DEAD AND LIVE LOADS
Table F.1 Maximum negative moments due to dead load excluding wearing surface Bridge
No. Negative Moment (kip-ft)
Support 1 Support 2 Support 3 Support 4 Support 5 1 0.0 47.3 0.0 2 0.0 109.5 0.0 3 0.0 198.5 0.0 4 0.0 316.9 0.0 5 0.0 464.7 0.0 6 0.0 644.0 0.0 7 0.0 888.9 0.0 8 0.0 1146.1 0.0 9 0.0 1438.6 0.0
10 0.0 1769.9 0.0 11 0.0 2144.9 0.0 12 0.0 37.8 37.8 0.0 13 0.0 87.2 87.2 0.0 14 0.0 158.0 158.0 0.0 15 0.0 251.2 251.2 0.0 16 0.0 380.5 380.5 0.0 17 0.0 529.0 529.0 0.0 18 0.0 713.2 713.2 0.0 19 0.0 920.3 920.3 0.0 20 0.0 1156.0 1156.0 0.0 21 0.0 1423.3 1423.3 0.0 22 0.0 1725.9 1725.9 0.0 23 0.0 40.5 40.5 40.5 0.0 24 0.0 93.0 93.0 93.0 0.0 25 0.0 168.2 168.2 168.2 0.0 26 0.0 276.7 276.7 276.7 0.0 27 0.0 406.8 406.8 406.8 0.0 28 0.0 566.1 566.1 566.1 0.0 29 0.0 762.5 762.5 762.5 0.0 30 0.0 983.1 983.1 983.1 0.0 31 0.0 1236.4 1236.4 1236.4 0.0
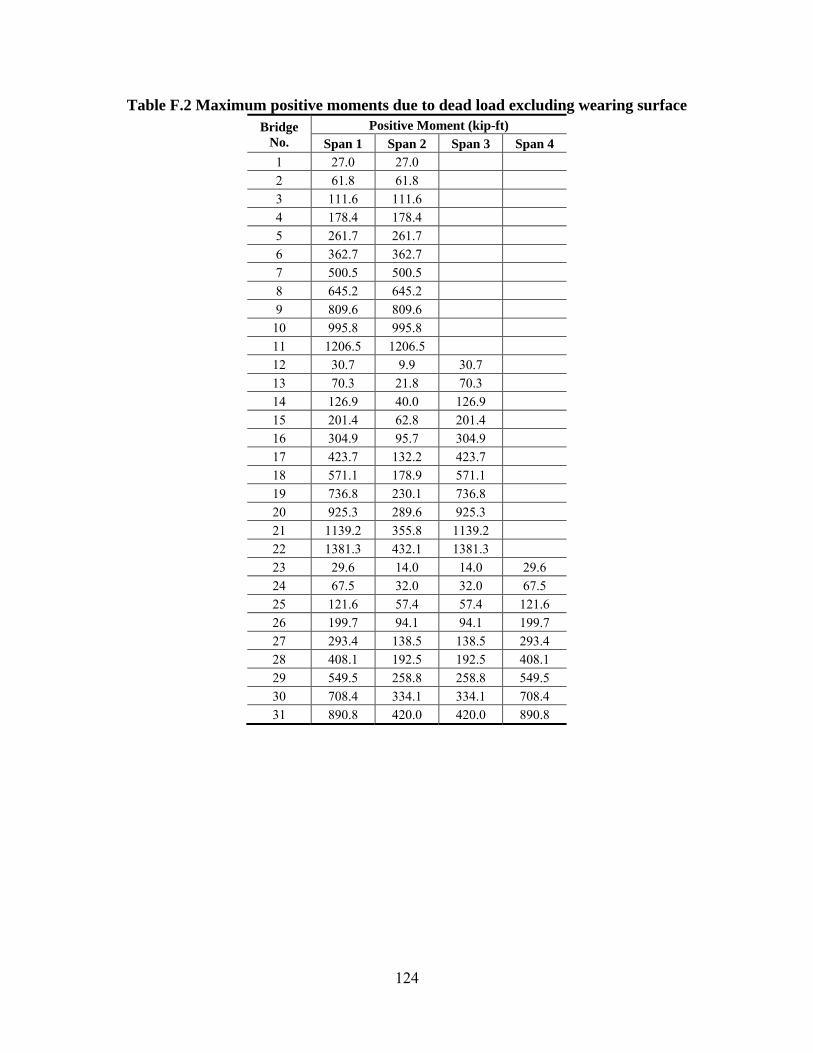
124
Table F.2 Maximum positive moments due to dead load excluding wearing surface Bridge
No. Positive Moment (kip-ft)
Span 1 Span 2 Span 3 Span 4 1 27.0 27.0 2 61.8 61.8 3 111.6 111.6 4 178.4 178.4 5 261.7 261.7 6 362.7 362.7 7 500.5 500.5 8 645.2 645.2 9 809.6 809.6
10 995.8 995.8 11 1206.5 1206.5 12 30.7 9.9 30.7 13 70.3 21.8 70.3 14 126.9 40.0 126.9 15 201.4 62.8 201.4 16 304.9 95.7 304.9 17 423.7 132.2 423.7 18 571.1 178.9 571.1 19 736.8 230.1 736.8 20 925.3 289.6 925.3 21 1139.2 355.8 1139.2 22 1381.3 432.1 1381.3 23 29.6 14.0 14.0 29.6 24 67.5 32.0 32.0 67.5 25 121.6 57.4 57.4 121.6 26 199.7 94.1 94.1 199.7 27 293.4 138.5 138.5 293.4 28 408.1 192.5 192.5 408.1 29 549.5 258.8 258.8 549.5 30 708.4 334.1 334.1 708.4 31 890.8 420.0 420.0 890.8
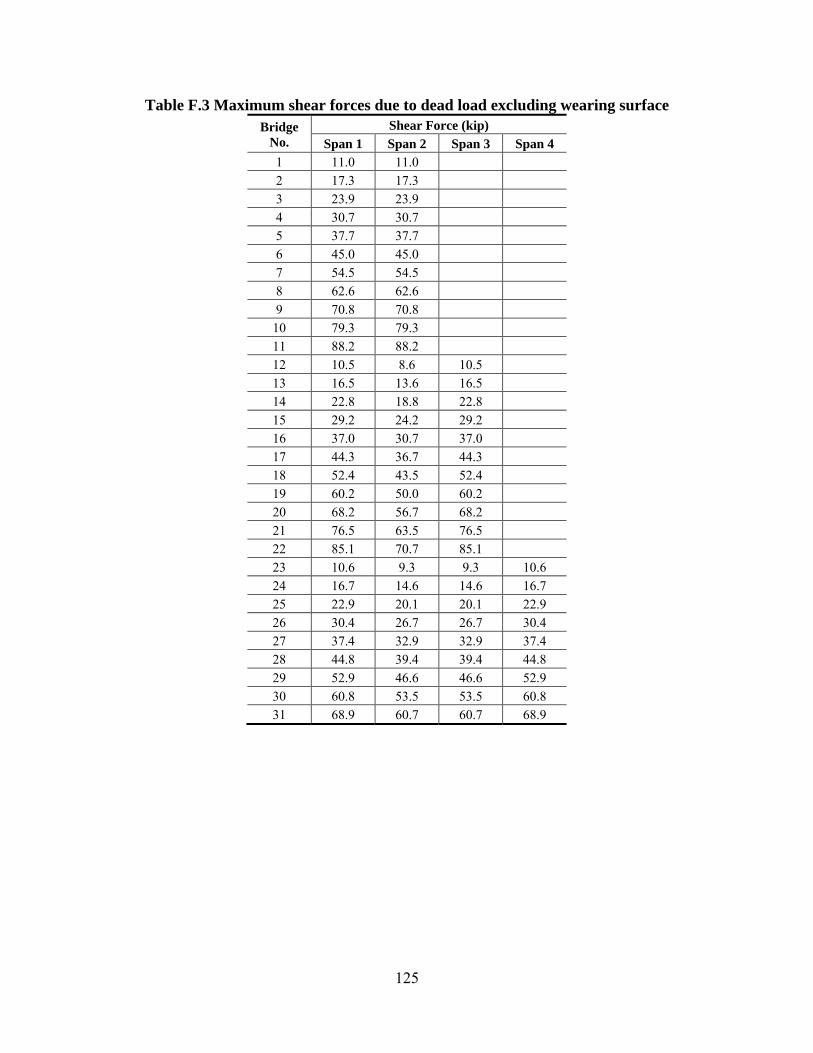
125
Table F.3 Maximum shear forces due to dead load excluding wearing surface Bridge
No. Shear Force (kip)
Span 1 Span 2 Span 3 Span 4 1 11.0 11.0 2 17.3 17.3 3 23.9 23.9 4 30.7 30.7 5 37.7 37.7 6 45.0 45.0 7 54.5 54.5 8 62.6 62.6 9 70.8 70.8
10 79.3 79.3 11 88.2 88.2 12 10.5 8.6 10.5 13 16.5 13.6 16.5 14 22.8 18.8 22.8 15 29.2 24.2 29.2 16 37.0 30.7 37.0 17 44.3 36.7 44.3 18 52.4 43.5 52.4 19 60.2 50.0 60.2 20 68.2 56.7 68.2 21 76.5 63.5 76.5 22 85.1 70.7 85.1 23 10.6 9.3 9.3 10.6 24 16.7 14.6 14.6 16.7 25 22.9 20.1 20.1 22.9 26 30.4 26.7 26.7 30.4 27 37.4 32.9 32.9 37.4 28 44.8 39.4 39.4 44.8 29 52.9 46.6 46.6 52.9 30 60.8 53.5 53.5 60.8 31 68.9 60.7 60.7 68.9
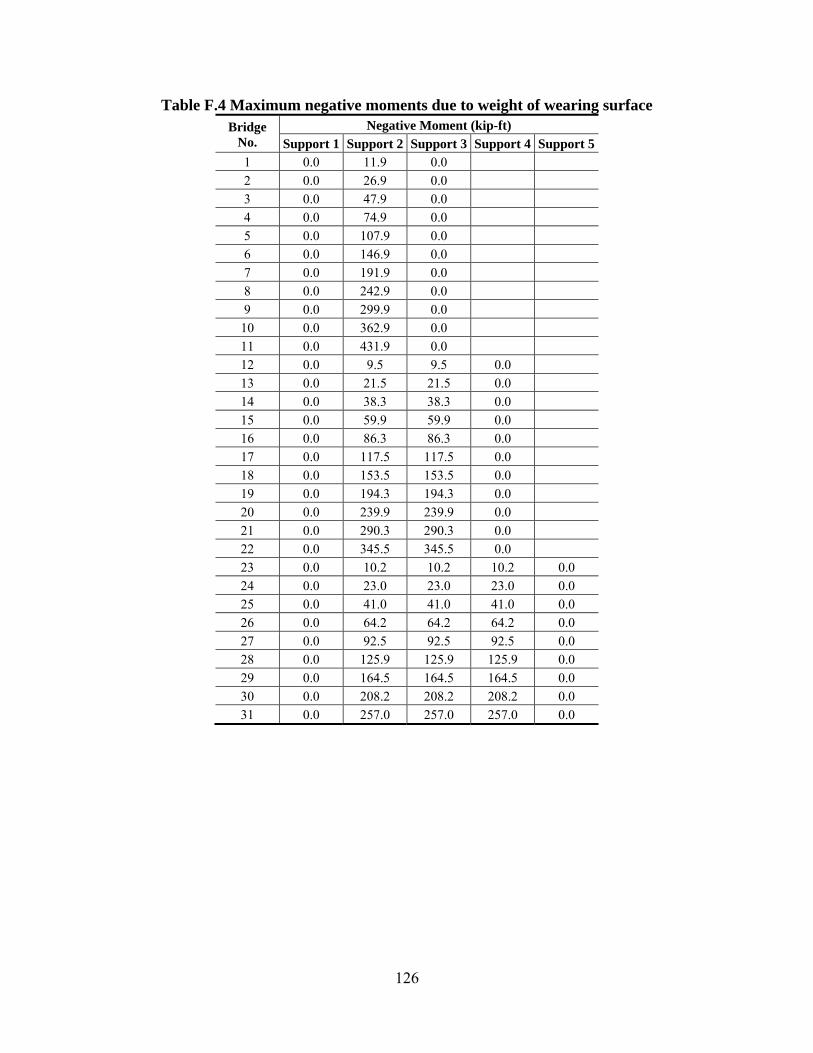
126
Table F.4 Maximum negative moments due to weight of wearing surface Bridge
No. Negative Moment (kip-ft)
Support 1 Support 2 Support 3 Support 4 Support 5 1 0.0 11.9 0.0 2 0.0 26.9 0.0 3 0.0 47.9 0.0 4 0.0 74.9 0.0 5 0.0 107.9 0.0 6 0.0 146.9 0.0 7 0.0 191.9 0.0 8 0.0 242.9 0.0 9 0.0 299.9 0.0
10 0.0 362.9 0.0 11 0.0 431.9 0.0 12 0.0 9.5 9.5 0.0 13 0.0 21.5 21.5 0.0 14 0.0 38.3 38.3 0.0 15 0.0 59.9 59.9 0.0 16 0.0 86.3 86.3 0.0 17 0.0 117.5 117.5 0.0 18 0.0 153.5 153.5 0.0 19 0.0 194.3 194.3 0.0 20 0.0 239.9 239.9 0.0 21 0.0 290.3 290.3 0.0 22 0.0 345.5 345.5 0.0 23 0.0 10.2 10.2 10.2 0.0 24 0.0 23.0 23.0 23.0 0.0 25 0.0 41.0 41.0 41.0 0.0 26 0.0 64.2 64.2 64.2 0.0 27 0.0 92.5 92.5 92.5 0.0 28 0.0 125.9 125.9 125.9 0.0 29 0.0 164.5 164.5 164.5 0.0 30 0.0 208.2 208.2 208.2 0.0 31 0.0 257.0 257.0 257.0 0.0
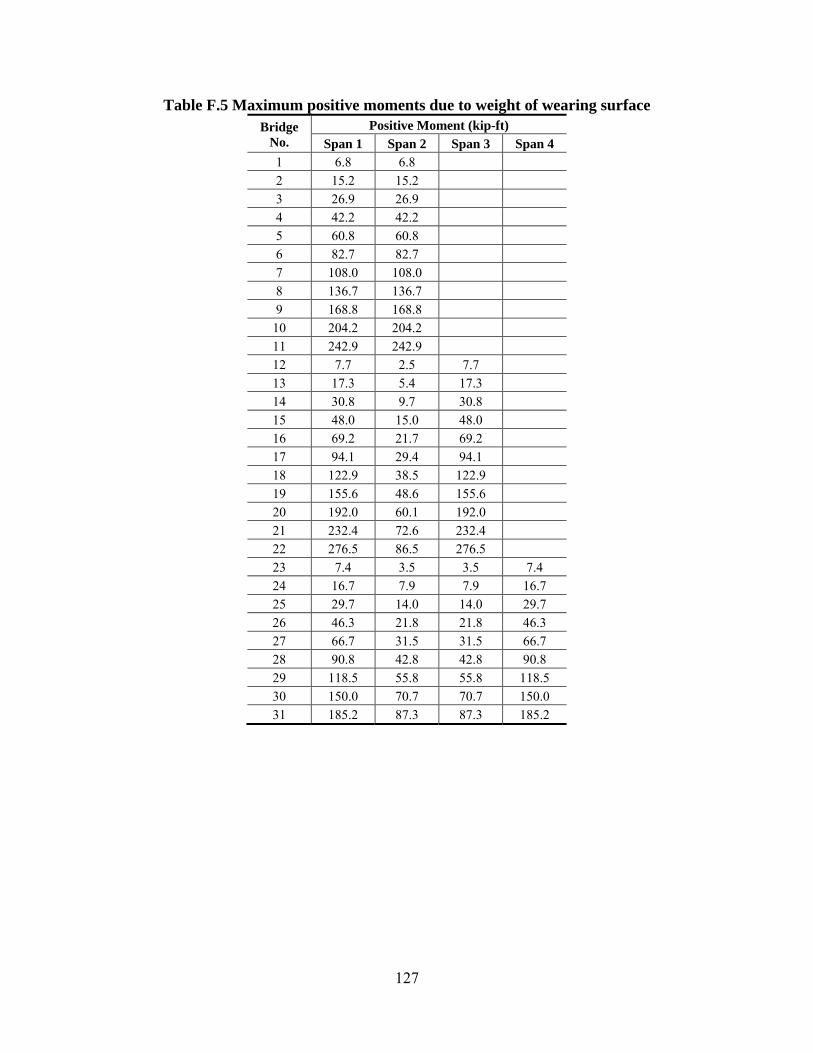
127
Table F.5 Maximum positive moments due to weight of wearing surface Bridge
No. Positive Moment (kip-ft)
Span 1 Span 2 Span 3 Span 4 1 6.8 6.8 2 15.2 15.2 3 26.9 26.9 4 42.2 42.2 5 60.8 60.8 6 82.7 82.7 7 108.0 108.0 8 136.7 136.7 9 168.8 168.8
10 204.2 204.2 11 242.9 242.9 12 7.7 2.5 7.7 13 17.3 5.4 17.3 14 30.8 9.7 30.8 15 48.0 15.0 48.0 16 69.2 21.7 69.2 17 94.1 29.4 94.1 18 122.9 38.5 122.9 19 155.6 48.6 155.6 20 192.0 60.1 192.0 21 232.4 72.6 232.4 22 276.5 86.5 276.5 23 7.4 3.5 3.5 7.4 24 16.7 7.9 7.9 16.7 25 29.7 14.0 14.0 29.7 26 46.3 21.8 21.8 46.3 27 66.7 31.5 31.5 66.7 28 90.8 42.8 42.8 90.8 29 118.5 55.8 55.8 118.5 30 150.0 70.7 70.7 150.0 31 185.2 87.3 87.3 185.2

128
Table F.6 Maximum shear forces due to weight of wearing surface Bridge
No. Shear Force (kip)
Span 1 Span 2 Span 3 Span 4 1 2.8 2.8 2 4.3 4.3 3 5.8 5.8 4 7.3 7.3 5 8.8 8.8 6 10.3 10.3 7 11.8 11.8 8 13.3 13.3 9 14.8 14.8
10 16.3 16.3 11 17.8 17.8 12 2.6 2.2 2.6 13 4.1 3.4 4.1 14 5.5 4.6 5.5 15 7.0 5.8 7.0 16 8.4 7.0 8.4 17 9.8 8.2 9.8 18 11.3 9.4 11.3 19 12.7 10.6 12.7 20 14.2 11.8 14.2 21 15.6 13.0 15.6 22 17.0 14.2 17.0 23 2.7 2.3 2.3 2.7 24 4.1 3.6 3.6 4.1 25 5.6 4.9 4.9 5.6 26 7.0 6.2 6.2 7.0 27 8.5 7.5 7.5 8.5 28 10.0 8.8 8.8 10.0 29 11.4 10.0 10.0 11.4 30 12.9 11.3 11.3 12.9 31 14.3 12.6 12.6 14.3
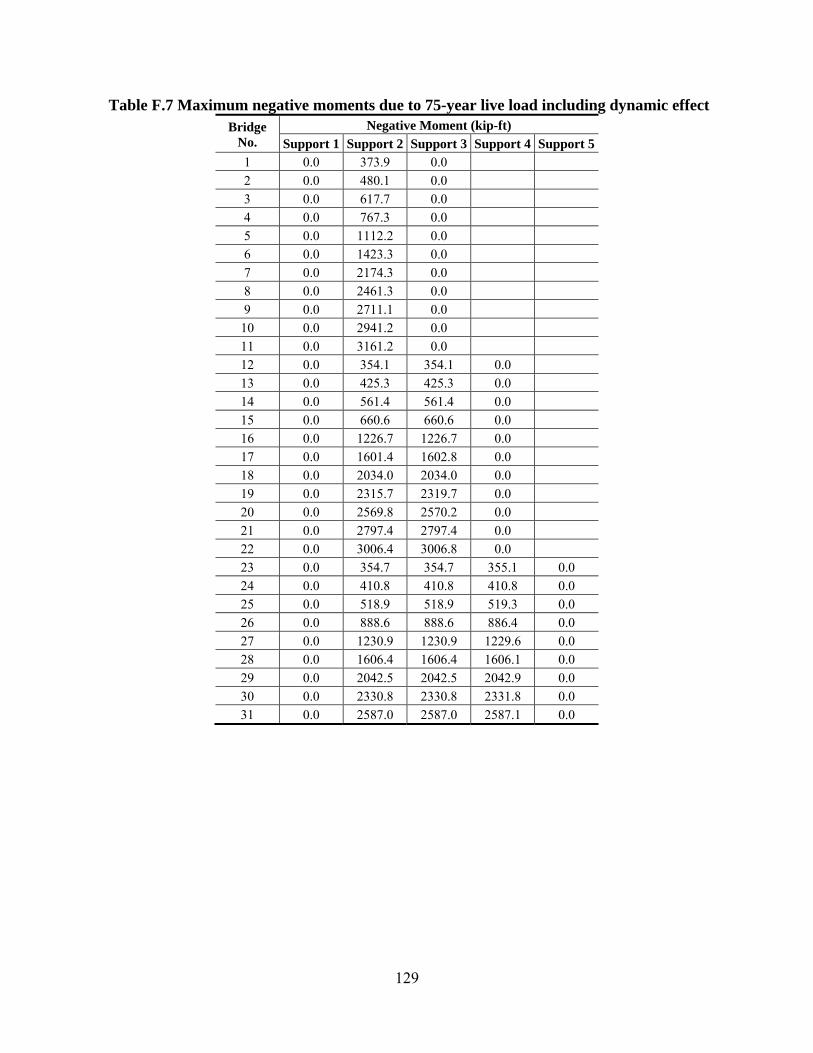
129
Table F.7 Maximum negative moments due to 75-year live load including dynamic effect Bridge
No. Negative Moment (kip-ft)
Support 1 Support 2 Support 3 Support 4 Support 5 1 0.0 373.9 0.0 2 0.0 480.1 0.0 3 0.0 617.7 0.0 4 0.0 767.3 0.0 5 0.0 1112.2 0.0 6 0.0 1423.3 0.0 7 0.0 2174.3 0.0 8 0.0 2461.3 0.0 9 0.0 2711.1 0.0
10 0.0 2941.2 0.0 11 0.0 3161.2 0.0 12 0.0 354.1 354.1 0.0 13 0.0 425.3 425.3 0.0 14 0.0 561.4 561.4 0.0 15 0.0 660.6 660.6 0.0 16 0.0 1226.7 1226.7 0.0 17 0.0 1601.4 1602.8 0.0 18 0.0 2034.0 2034.0 0.0 19 0.0 2315.7 2319.7 0.0 20 0.0 2569.8 2570.2 0.0 21 0.0 2797.4 2797.4 0.0 22 0.0 3006.4 3006.8 0.0 23 0.0 354.7 354.7 355.1 0.0 24 0.0 410.8 410.8 410.8 0.0 25 0.0 518.9 518.9 519.3 0.0 26 0.0 888.6 888.6 886.4 0.0 27 0.0 1230.9 1230.9 1229.6 0.0 28 0.0 1606.4 1606.4 1606.1 0.0 29 0.0 2042.5 2042.5 2042.9 0.0 30 0.0 2330.8 2330.8 2331.8 0.0 31 0.0 2587.0 2587.0 2587.1 0.0
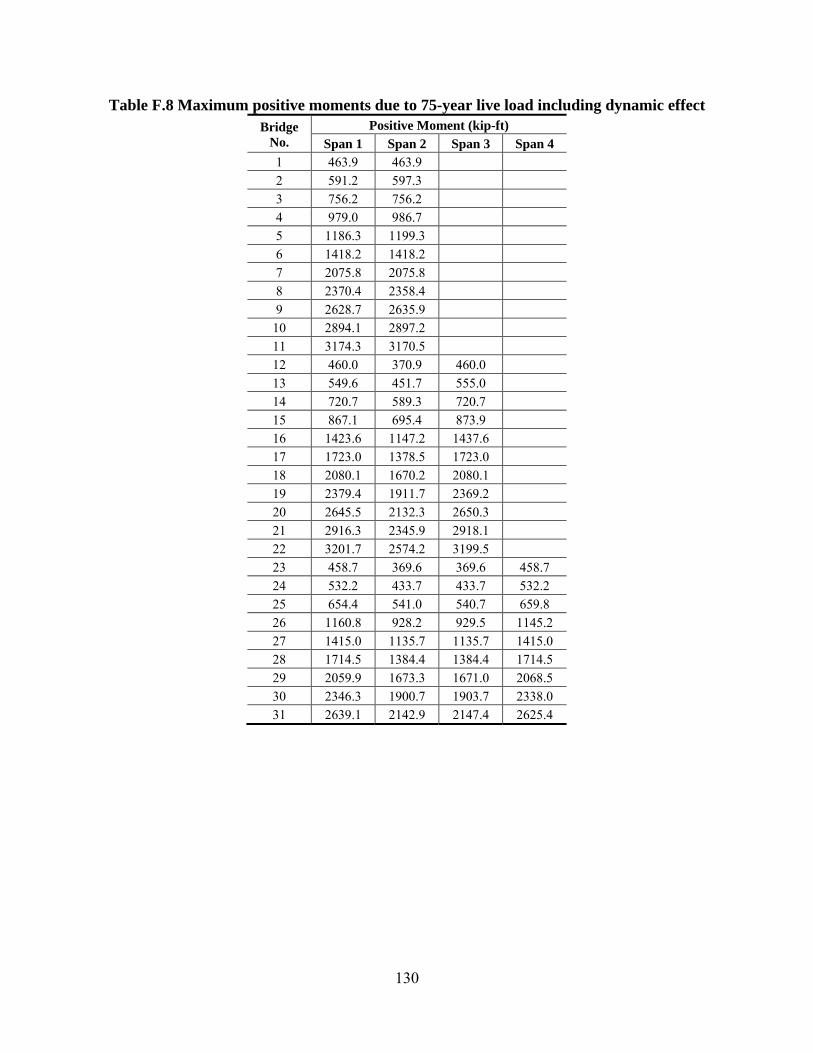
130
Table F.8 Maximum positive moments due to 75-year live load including dynamic effect Bridge
No. Positive Moment (kip-ft)
Span 1 Span 2 Span 3 Span 4 1 463.9 463.9 2 591.2 597.3 3 756.2 756.2 4 979.0 986.7 5 1186.3 1199.3 6 1418.2 1418.2 7 2075.8 2075.8 8 2370.4 2358.4 9 2628.7 2635.9
10 2894.1 2897.2 11 3174.3 3170.5 12 460.0 370.9 460.0 13 549.6 451.7 555.0 14 720.7 589.3 720.7 15 867.1 695.4 873.9 16 1423.6 1147.2 1437.6 17 1723.0 1378.5 1723.0 18 2080.1 1670.2 2080.1 19 2379.4 1911.7 2369.2 20 2645.5 2132.3 2650.3 21 2916.3 2345.9 2918.1 22 3201.7 2574.2 3199.5 23 458.7 369.6 369.6 458.7 24 532.2 433.7 433.7 532.2 25 654.4 541.0 540.7 659.8 26 1160.8 928.2 929.5 1145.2 27 1415.0 1135.7 1135.7 1415.0 28 1714.5 1384.4 1384.4 1714.5 29 2059.9 1673.3 1671.0 2068.5 30 2346.3 1900.7 1903.7 2338.0 31 2639.1 2142.9 2147.4 2625.4
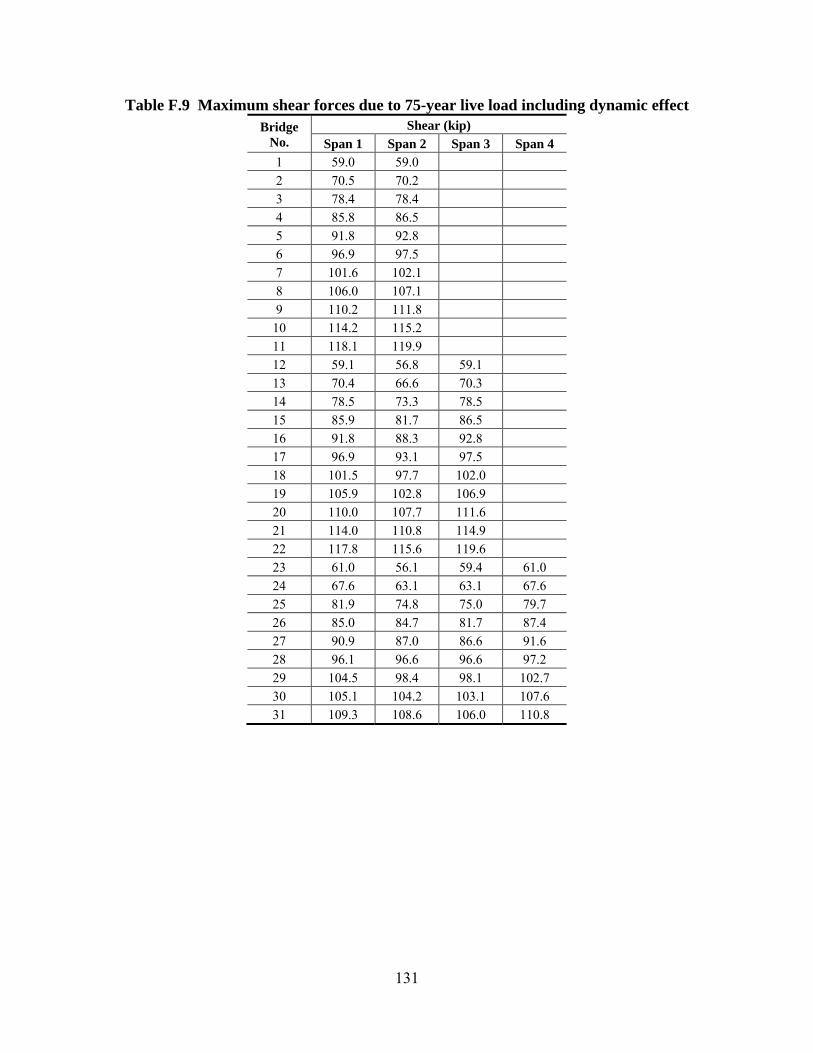
131
Table F.9 Maximum shear forces due to 75-year live load including dynamic effect Bridge
No. Shear (kip)
Span 1 Span 2 Span 3 Span 4 1 59.0 59.0 2 70.5 70.2 3 78.4 78.4 4 85.8 86.5 5 91.8 92.8 6 96.9 97.5 7 101.6 102.1 8 106.0 107.1 9 110.2 111.8
10 114.2 115.2 11 118.1 119.9 12 59.1 56.8 59.1 13 70.4 66.6 70.3 14 78.5 73.3 78.5 15 85.9 81.7 86.5 16 91.8 88.3 92.8 17 96.9 93.1 97.5 18 101.5 97.7 102.0 19 105.9 102.8 106.9 20 110.0 107.7 111.6 21 114.0 110.8 114.9 22 117.8 115.6 119.6 23 61.0 56.1 59.4 61.0 24 67.6 63.1 63.1 67.6 25 81.9 74.8 75.0 79.7 26 85.0 84.7 81.7 87.4 27 90.9 87.0 86.6 91.6 28 96.1 96.6 96.6 97.2 29 104.5 98.4 98.1 102.7 30 105.1 104.2 103.1 107.6 31 109.3 108.6 106.0 110.8
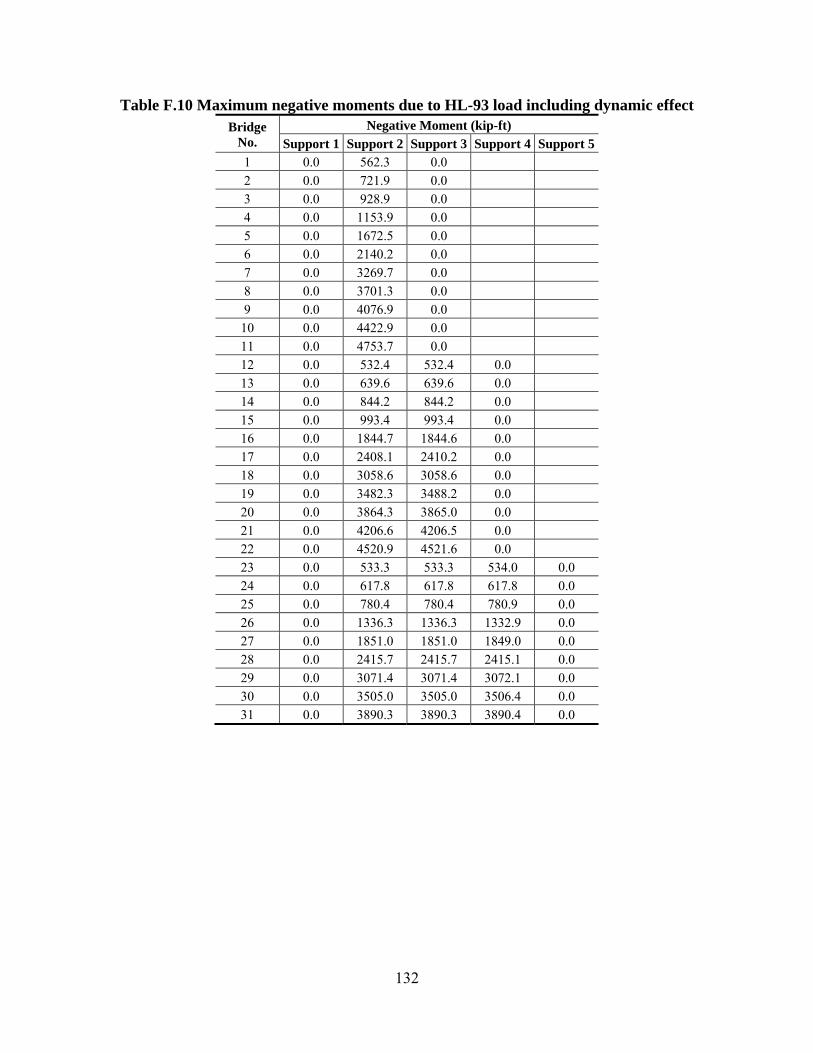
132
Table F.10 Maximum negative moments due to HL-93 load including dynamic effect Bridge
No. Negative Moment (kip-ft)
Support 1 Support 2 Support 3 Support 4 Support 5 1 0.0 562.3 0.0 2 0.0 721.9 0.0 3 0.0 928.9 0.0 4 0.0 1153.9 0.0 5 0.0 1672.5 0.0 6 0.0 2140.2 0.0 7 0.0 3269.7 0.0 8 0.0 3701.3 0.0 9 0.0 4076.9 0.0
10 0.0 4422.9 0.0 11 0.0 4753.7 0.0 12 0.0 532.4 532.4 0.0 13 0.0 639.6 639.6 0.0 14 0.0 844.2 844.2 0.0 15 0.0 993.4 993.4 0.0 16 0.0 1844.7 1844.6 0.0 17 0.0 2408.1 2410.2 0.0 18 0.0 3058.6 3058.6 0.0 19 0.0 3482.3 3488.2 0.0 20 0.0 3864.3 3865.0 0.0 21 0.0 4206.6 4206.5 0.0 22 0.0 4520.9 4521.6 0.0 23 0.0 533.3 533.3 534.0 0.0 24 0.0 617.8 617.8 617.8 0.0 25 0.0 780.4 780.4 780.9 0.0 26 0.0 1336.3 1336.3 1332.9 0.0 27 0.0 1851.0 1851.0 1849.0 0.0 28 0.0 2415.7 2415.7 2415.1 0.0 29 0.0 3071.4 3071.4 3072.1 0.0 30 0.0 3505.0 3505.0 3506.4 0.0 31 0.0 3890.3 3890.3 3890.4 0.0
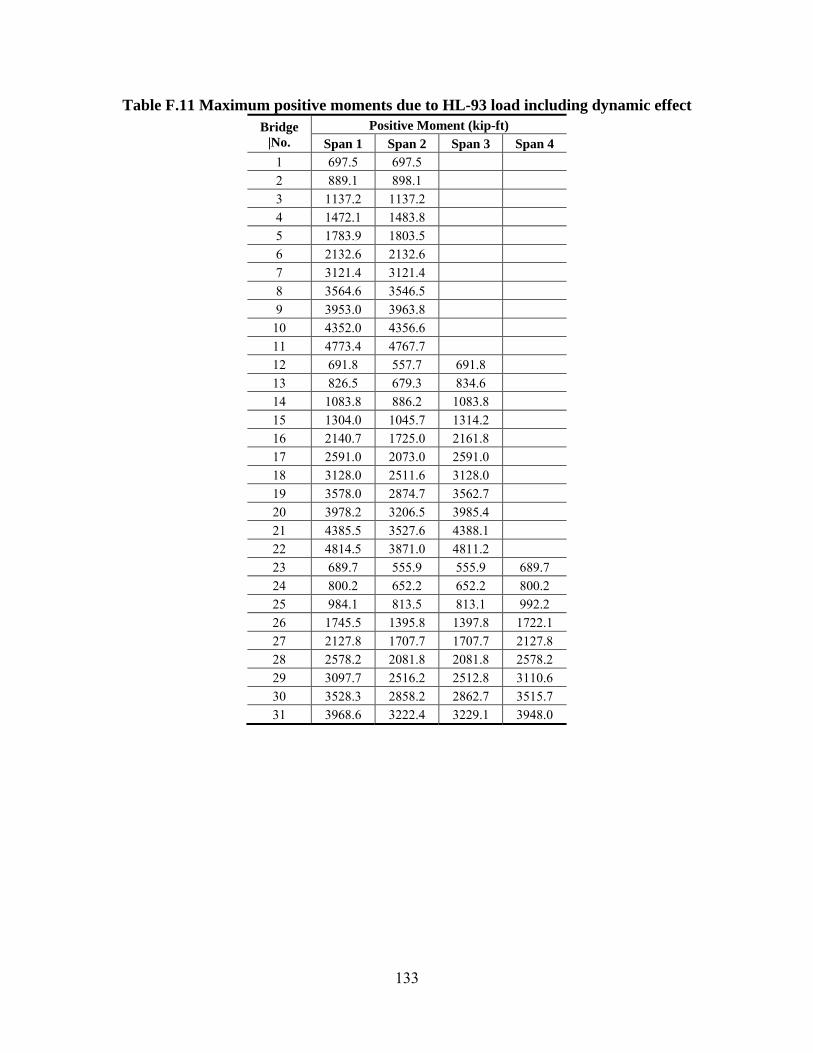
133
Table F.11 Maximum positive moments due to HL-93 load including dynamic effect Bridge
|No. Positive Moment (kip-ft)
Span 1 Span 2 Span 3 Span 4 1 697.5 697.5 2 889.1 898.1 3 1137.2 1137.2 4 1472.1 1483.8 5 1783.9 1803.5 6 2132.6 2132.6 7 3121.4 3121.4 8 3564.6 3546.5 9 3953.0 3963.8
10 4352.0 4356.6 11 4773.4 4767.7 12 691.8 557.7 691.8 13 826.5 679.3 834.6 14 1083.8 886.2 1083.8 15 1304.0 1045.7 1314.2 16 2140.7 1725.0 2161.8 17 2591.0 2073.0 2591.0 18 3128.0 2511.6 3128.0 19 3578.0 2874.7 3562.7 20 3978.2 3206.5 3985.4 21 4385.5 3527.6 4388.1 22 4814.5 3871.0 4811.2 23 689.7 555.9 555.9 689.7 24 800.2 652.2 652.2 800.2 25 984.1 813.5 813.1 992.2 26 1745.5 1395.8 1397.8 1722.1 27 2127.8 1707.7 1707.7 2127.8 28 2578.2 2081.8 2081.8 2578.2 29 3097.7 2516.2 2512.8 3110.6 30 3528.3 2858.2 2862.7 3515.7 31 3968.6 3222.4 3229.1 3948.0
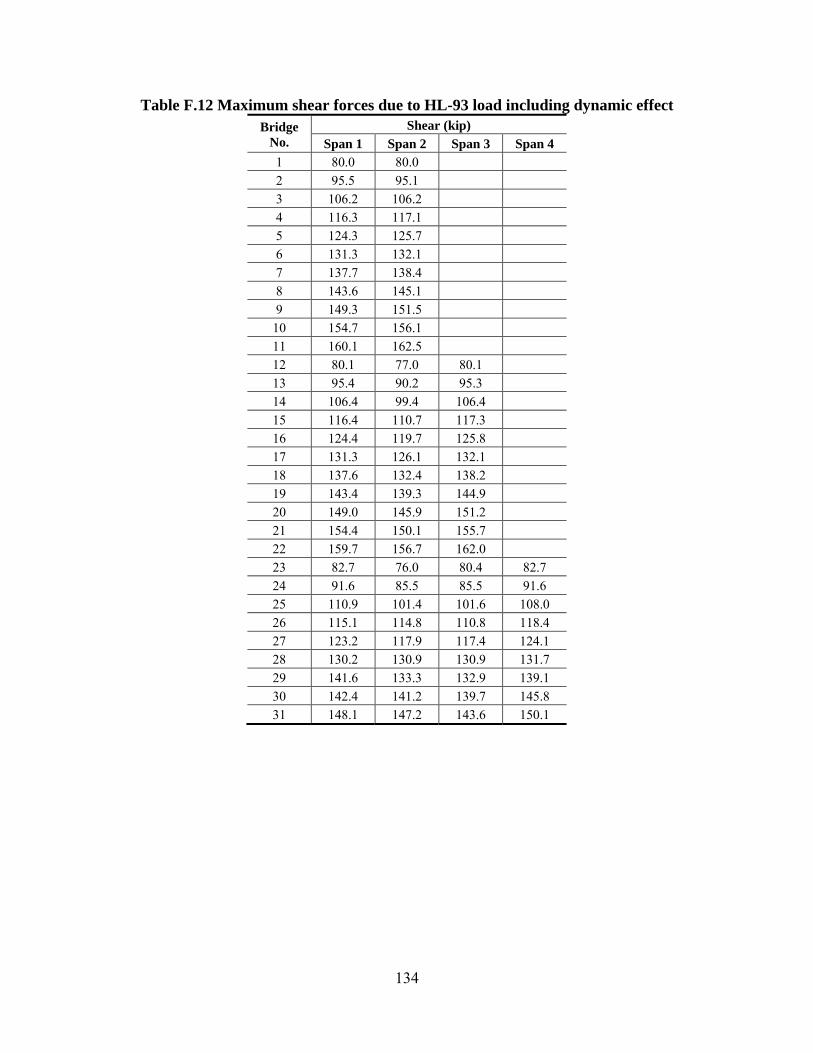
134
Table F.12 Maximum shear forces due to HL-93 load including dynamic effect Bridge
No. Shear (kip)
Span 1 Span 2 Span 3 Span 4 1 80.0 80.0 2 95.5 95.1 3 106.2 106.2 4 116.3 117.1 5 124.3 125.7 6 131.3 132.1 7 137.7 138.4 8 143.6 145.1 9 149.3 151.5
10 154.7 156.1 11 160.1 162.5 12 80.1 77.0 80.1 13 95.4 90.2 95.3 14 106.4 99.4 106.4 15 116.4 110.7 117.3 16 124.4 119.7 125.8 17 131.3 126.1 132.1 18 137.6 132.4 138.2 19 143.4 139.3 144.9 20 149.0 145.9 151.2 21 154.4 150.1 155.7 22 159.7 156.7 162.0 23 82.7 76.0 80.4 82.7 24 91.6 85.5 85.5 91.6 25 110.9 101.4 101.6 108.0 26 115.1 114.8 110.8 118.4 27 123.2 117.9 117.4 124.1 28 130.2 130.9 130.9 131.7 29 141.6 133.3 132.9 139.1 30 142.4 141.2 139.7 145.8 31 148.1 147.2 143.6 150.1
Related Documents