www.VadoseZoneJournal.org Calibraon of a Novel Impedance Sensor for Water Content Measurement in Rocks The water content ( q) of the subsoil is an important parameter affecng all the processes that occur in the vadose zone, playing a key role in the infiltraon, aquifer recharge, and flow and transport of water and substances, as well as groundwater storage. Although the vadose zone is usually considered constuted of soil, it may also be comprised of rock. In the laer case, q cannot yet be operaonally measured despite its unquesonable importance. The aim of the present work was therefore to invesgate the potenal of a novel electrical impedance sensor for q measurement in rocks and to evaluate the effects of frequency and salinity on the calibraon of this device. In this study, only the resistance (R), i.e., the real part of the measured impedance, was invesgated because of its direct correlaon with q. Calcarenite, a sedimentary porous rock, was used for the calibraon in the laboratory via the installaon of penetraon-type probes. The independence of the measured R from the different frequencies set on the device was checked using a stascal approach. The q –R calibraon funcons obtained for the different saturaon soluons have a power-law dependence with a good degree of correlaon. The results highlight both the strong reproducibility of the experimental data (by using the penetraon-type probes) and the suitability of the device for q measurement in calcarenite. The method could be advantageous for field applicaons that involve rocks. Abbreviaons: EIS, electrical impedance spectrometry. The vadose zone is known to play an important role in the hydrologic cycle by reg- ulating surface runoff, evapotranspiration, infiltration, and the transfer of solutes (i.e., contaminants). Because fluxes of water and solutes strongly depend on q , monitoring and estimation of q is therefore a key element in understanding contaminant transport processes. e traditional standard technique for direct measurement of q in soil, the gravimetric method (Gardner, 1986), involves the sampling of soil to carry out laboratory measure- ments, thus modifying natural conditions. Because the gravimetric method is destructive, labor intensive, time consuming, and costly, a wide range of alternative nondestructive methods have been developed, mainly used in the management of precision farming. Among the more well-known of these include neutron thermalization (Greacen, 1981; Evett, 2003), the capacitance method (Dean et al., 1987; Robinson and Dean, 1993; Baumhardt et al., 2000; Kizito et al., 2008), time domain reflectometry (TDR) (Topp et al., 1980; Topp and Davis, 1985; Dalton and van Genuchten, 1986; Jones and Or, 2004; Robinson et al., 2003), frequency domain reflectometry (Veldkamp and O’Brien, 2000; Bilskie, 1997), the impedance method (Gaskin and Miller, 1996; Seyfried and Murdock, 2004), and the electrical resistance method (McCann et al., 1992; Shock, 2003). Further details regarding these techniques, including their advantages and limitations, are widely available elsewhere (e.g., Dane and Topp, 2002; Evett, 2007; Evett et al., 2008). In recent years, remote sensing technologies such as passive and active radiometry have been applied to provide wide-area indications of surface soil q (Wigneron et al., 2003; Loew et al., 2006). However, the considerable influence of vegetation and surface structure on the quality of the received signal restricts the sampling depth to the uppermost (2–5-cm) soil levels (Walker et al., 2004), significantly limiting the usefulness of the technology in terms of any hydrologic application. It should be noted that none of the aforementioned methods directly measures q but rather properties known as “surrogate parameters” (e.g., neutron emission, dielectric constant, capacitance, impedance, resistance) that change as q changes. In this case, the value of q A novel sensor, based on electrical impedance spectrometry, for water content measurement in rocks was investigated. Calcarenite, a sedi- mentary porous rock, was used to determine the calibraon funcons by evaluating the effects of fre- quency and salinity of the saturaon solution. The functions obtained have a power-law dependence with a good degree of correlaon. M.C. Caputo, R. Masciale, and E. Barca, CNR Naonal Research Council, IRSA Water Research Instute, via F. De Blasio, 5-70132 Bari, Italy. *Corresponding author (maria. [email protected]). Vadose Zone J. doi:10.2136/vzj2013.01.0024 Received 2 Aug. 2013. Original Research Maria Clemenna Caputo* Rita Masciale Emanuele Barca © Soil Science Society of America 5585 Guilford Rd., Madison, WI 53711 USA. All rights reserved. No part of this periodical may be reproduced or transmied in any form or by any means, electronic or mechanical, including pho- tocopying, recording, or any informaon storage and retrieval system, without permission in wring from the publisher.

Welcome message from author
This document is posted to help you gain knowledge. Please leave a comment to let me know what you think about it! Share it to your friends and learn new things together.
Transcript

www.VadoseZoneJournal.org
Calibration of a Novel Impedance Sensor for Water Content Measurement in RocksThe water content (q) of the subsoil is an important parameter affecting all the processes that occur in the vadose zone, playing a key role in the infiltration, aquifer recharge, and flow and transport of water and substances, as well as groundwater storage. Although the vadose zone is usually considered constituted of soil, it may also be comprised of rock. In the latter case, q cannot yet be operationally measured despite its unquestionable importance. The aim of the present work was therefore to investigate the potential of a novel electrical impedance sensor for q measurement in rocks and to evaluate the effects of frequency and salinity on the calibration of this device. In this study, only the resistance (R), i.e., the real part of the measured impedance, was investigated because of its direct correlation with q. Calcarenite, a sedimentary porous rock, was used for the calibration in the laboratory via the installation of penetration-type probes. The independence of the measured R from the different frequencies set on the device was checked using a statistical approach. The q–R calibration functions obtained for the different saturation solutions have a power-law dependence with a good degree of correlation. The results highlight both the strong reproducibility of the experimental data (by using the penetration-type probes) and the suitability of the device for q measurement in calcarenite. The method could be advantageous for field applications that involve rocks.
Abbreviations: EIS, electrical impedance spectrometry.
The vadose zone is known to play an important role in the hydrologic cycle by reg-ulating surface runoff, evapotranspiration, infiltration, and the transfer of solutes (i.e., contaminants). Because fluxes of water and solutes strongly depend on q, monitoring and estimation of q is therefore a key element in understanding contaminant transport processes.
The traditional standard technique for direct measurement of q in soil, the gravimetric method (Gardner, 1986), involves the sampling of soil to carry out laboratory measure-ments, thus modifying natural conditions. Because the gravimetric method is destructive, labor intensive, time consuming, and costly, a wide range of alternative nondestructive methods have been developed, mainly used in the management of precision farming. Among the more well-known of these include neutron thermalization (Greacen, 1981; Evett, 2003), the capacitance method (Dean et al., 1987; Robinson and Dean, 1993; Baumhardt et al., 2000; Kizito et al., 2008), time domain reflectometry (TDR) (Topp et al., 1980; Topp and Davis, 1985; Dalton and van Genuchten, 1986; Jones and Or, 2004; Robinson et al., 2003), frequency domain reflectometry (Veldkamp and O’Brien, 2000; Bilskie, 1997), the impedance method (Gaskin and Miller, 1996; Seyfried and Murdock, 2004), and the electrical resistance method (McCann et al., 1992; Shock, 2003). Further details regarding these techniques, including their advantages and limitations, are widely available elsewhere (e.g., Dane and Topp, 2002; Evett, 2007; Evett et al., 2008). In recent years, remote sensing technologies such as passive and active radiometry have been applied to provide wide-area indications of surface soil q (Wigneron et al., 2003; Loew et al., 2006). However, the considerable influence of vegetation and surface structure on the quality of the received signal restricts the sampling depth to the uppermost (2–5-cm) soil levels (Walker et al., 2004), significantly limiting the usefulness of the technology in terms of any hydrologic application.
It should be noted that none of the aforementioned methods directly measures q but rather properties known as “surrogate parameters” (e.g., neutron emission, dielectric constant, capacitance, impedance, resistance) that change as q changes. In this case, the value of q
A novel sensor, based on electrical impedance spectrometry, for water content measurement in rocks was investigated. Calcarenite, a sedi-mentary porous rock, was used to determine the calibration functions by evaluating the effects of fre-quency and salinity of the saturation solution. The functions obtained have a power-law dependence with a good degree of correlation.
M.C. Caputo, R. Masciale, and E. Barca, CNR National Research Council, IRSA Water Research Institute, via F. De Blasio, 5-70132 Bari, Italy. *Corresponding author ([email protected]).
Vadose Zone J. doi:10.2136/vzj2013.01.0024Received 2 Aug. 2013.
Original Research
Maria Clementina Caputo* Rita Masciale Emanuele Barca
© Soil Science Society of America 5585 Guilford Rd., Madison, WI 53711 USA.All rights reserved. No part of this periodical may be reproduced or transmitted in any form or by any means, electronic or mechanical, including pho-tocopying, recording, or any information storage and retrieval system, without permission in writing from the publisher.
www.VadoseZoneJournal.org p. 2 of 9
is inferred from the surrogate parameter via the use of a calibra-tion curve (Evett et al., 2008). While examples of the application of all these methods in soil are widespread, in areas where the vadose zone consists of rocks the monitoring of q becomes more difficult for several reasons. The main difficulty is associated with the installation of the probes that, often being brittle, cannot be hammered or screwed into the rock, causing a gap effect (Annan, 1977; Knight et al., 1997). At present, very few examples of mea-surements on rocks have been documented, with those that have generally using the TDR method.
The first attempt was reported by Hokett et al. (1992), who used TDR for q measurement in sandstone and tuff blocks, under laboratory conditions, by means of penetration-type probes. They concluded that each rock type needed a specific calibra-tion to correlate the dielectric constant (the surrogate measure of the TDR method) to q, with an overestimation of q generally the result. In contrast, Schneebeli et al. (1995) applied the same method on granodiorite rock, both in the laboratory and in the field, and observed that, after using surface probes, the dielectric constant was linearly related to q and consequently the use of this TDR method enabled the measurement of q changes. Sakaki et al. (1998) focused on the reduction of gap effects in obtaining more accurate TDR measurements, with Sakaki and Rajaram (2006) subsequently applying TDR via penetration-type probes in seven types of rock, demonstrating that conductive silicone fillings could successfully eliminate gap effects entirely. In addition, Sakaki and Rajaram (2006) also found systematic differences by comparing the respective measurements obtained using surface and penetra-tion probes. These results highlight the strong influence of probe geometry on TDR measurements.
Attention in the current study was largely focused on a novel elec-trical impedance spectrometry (EIS) based device, the Z-meter, not yet on the market but with a history of being successfully applied in several recent experimental studies. For example, Pimentel et al. (2012) monitored snowpack properties including density, liquid water content, and grain size; Guerrero-Aspizua et al. (2012) stud-ied the water regime of a sand beach; Pařílková et al. (2011) used the Z-meter to monitor the earthen dikes of small water reservoirs. The encouraging results obtained in these studies for soils and sedi-ments, as well as the possibility of using probes composed of strong material, prompted us to test the Z-meter on rocks and hence also investigate the EIS method in more detail.
The aim of the present study was to investigate the potential of the novel EIS-based device for q measurement in rocks, never previously applied for such a purpose until now, and to evaluate the effects of frequency and salinity on its calibration.
6Materials and MethodsElectrical Impedance Spectrometry MethodThe basic principle of the EIS method is the measurement of the electrical impedance, Z , which represents the opposition of a medium to the passage of a current, Î, when a voltage, Û, is applied in an alternating current (AC) circuit (Barsoukov and Macdonald, 2005; Jackson, 1999). Impedence Z is described not only in terms of the amplitudes of Û and Î, but also by their relative phase shift:
Z R jX= + [1]
where R (W) is the resistance, the real part of Z , X (W) is the reactance, its imaginary part, and j is the imaginary unit (dimensionless). The value of Z depends on the characteristics of an AC circuit comprised of a resistor, inductor, and capacitor, either in series or parallel mode. For a real resistor–inductor (RL) circuit and resistor–capacitor (RC) circuit, Z is expressed by the following relationships, respectively:
L LZ R jX= + [2]
C CZ R jX= - [3]
where XL (W) is inductive reactance and XC (W) is capacitive reactance.
A porous medium (e.g., soil and rock) can be described by the Z of an equivalent RC circuit as in Eq. [3]. In fact, the solid frac-tion (grains) of a dry porous medium is comprised of insulating materials (dielectric) and hence has the character of a resistor. This means that the real component R of Z is always present in such porous media. Moreover, by applying an electric field, the medium is polarized and is thus charged as a capacitor. Under this assump-tion, the capacitive part of the medium is substantially larger than the inductive part, meaning that the dominant component of the imaginary part of Z is XC. If the medium is wet, it can be consid-ered a conductor because water always contains a certain quantity of mineral salts (conductive materials), resulting in lower values of R than under dry conditions. Hence R is strongly influenced by the saturation degree of the medium and can therefore be directly correlated with q.
Z-Meter DeviceDeveloped, constructed, and realized within the European International Project E!3838 of the EUREKA Program (Pařílková et al., 2009), the Z-meter was specifically designed as an EIS-based field device with which to carry out large-scale and long-term experiments (Pařílková et al., 2011), capable of connecting
www.VadoseZoneJournal.org p. 3 of 9
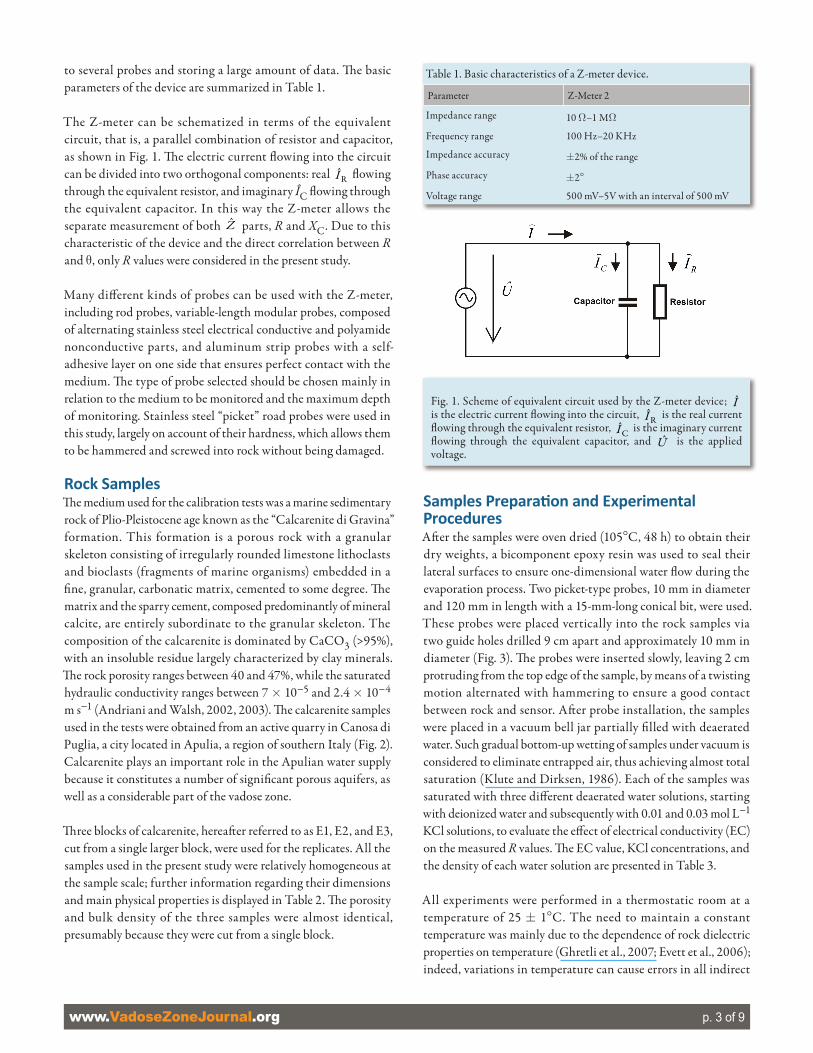
to several probes and storing a large amount of data. Th e basic parameters of the device are summarized in Table 1.
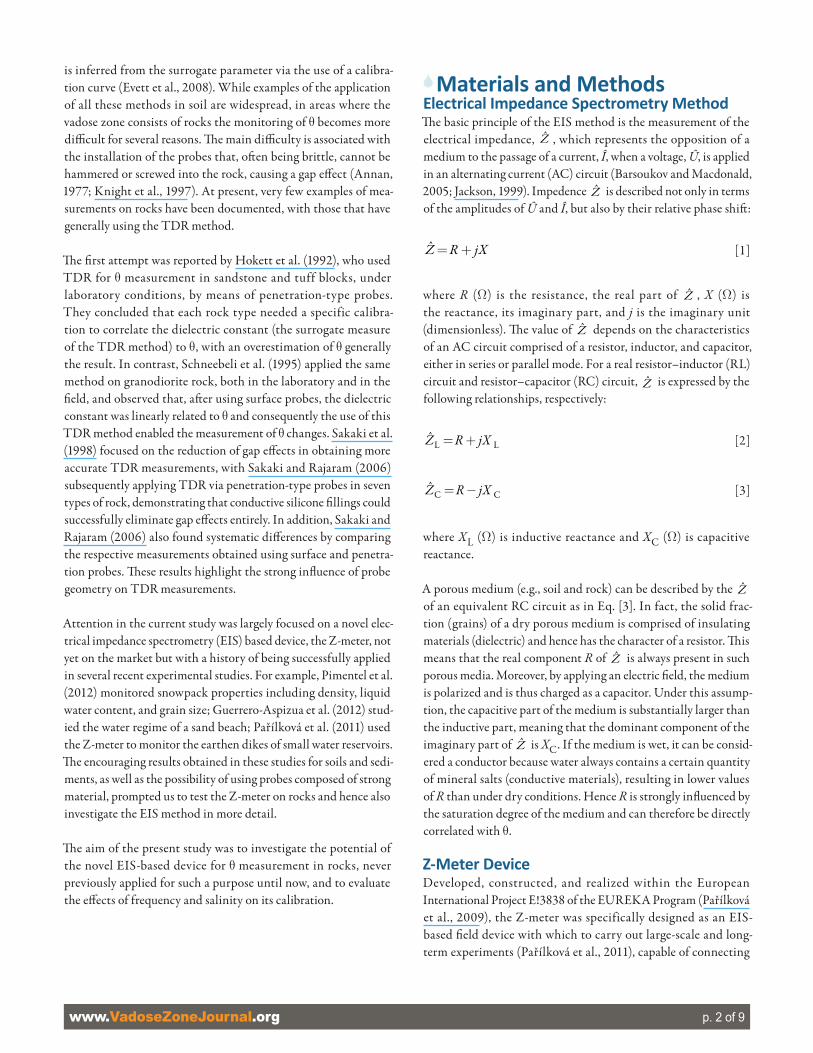
The Z-meter can be schematized in terms of the equivalent circuit, that is, a parallel combination of resistor and capacitor, as shown in Fig. 1. Th e electric current fl owing into the circuit can be divided into two orthogonal components: real RI fl owing through the equivalent resistor, and imaginary ÎC fl owing through the equivalent capacitor. In this way the Z-meter allows the separate measurement of both Z parts, R and XC. Due to this characteristic of the device and the direct correlation between Rand q, only R values were considered in the present study.
Many diff erent kinds of probes can be used with the Z-meter, including rod probes, variable-length modular probes, composed of alternating stainless steel electrical conductive and polyamide nonconductive parts, and aluminum strip probes with a self-adhesive layer on one side that ensures perfect contact with the medium. Th e type of probe selected should be chosen mainly in relation to the medium to be monitored and the maximum depth of monitoring. Stainless steel “picket” road probes were used in this study, largely on account of their hardness, which allows them to be hammered and screwed into rock without being damaged.
Rock SamplesTh e medium used for the calibration tests was a marine sedimentary rock of Plio-Pleistocene age known as the “Calcarenite di Gravina” formation. This formation is a porous rock with a granular skeleton consisting of irregularly rounded limestone lithoclasts and bioclasts (fragments of marine organisms) embedded in a fi ne, granular, carbonatic matrix, cemented to some degree. Th e matrix and the sparry cement, composed predominantly of mineral calcite, are entirely subordinate to the granular skeleton. The composition of the calcarenite is dominated by CaCO3 (>95%), with an insoluble residue largely characterized by clay minerals. Th e rock porosity ranges between 40 and 47%, while the saturated hydraulic conductivity ranges between 7 ´ 10−5 and 2.4 ´ 10−4
m s−1 (Andriani and Walsh, 2002, 2003). Th e calcarenite samples used in the tests were obtained from an active quarry in Canosa di Puglia, a city located in Apulia, a region of southern Italy (Fig. 2). Calcarenite plays an important role in the Apulian water supply because it constitutes a number of signifi cant porous aquifers, as well as a considerable part of the vadose zone.
Th ree blocks of calcarenite, hereaft er referred to as E1, E2, and E3, cut from a single larger block, were used for the replicates. All the samples used in the present study were relatively homogeneous at the sample scale; further information regarding their dimensions and main physical properties is displayed in Table 2. Th e porosity and bulk density of the three samples were almost identical, presumably because they were cut from a single block.
Samples Preparati on and Experimental ProceduresAft er the samples were oven dried (105°C, 48 h) to obtain their dry weights, a bicomponent epoxy resin was used to seal their lateral surfaces to ensure one-dimensional water fl ow during the evaporation process. Two picket-type probes, 10 mm in diameter and 120 mm in length with a 15-mm-long conical bit, were used. These probes were placed vertically into the rock samples via two guide holes drilled 9 cm apart and approximately 10 mm in diameter (Fig. 3). Th e probes were inserted slowly, leaving 2 cm protruding from the top edge of the sample, by means of a twisting motion alternated with hammering to ensure a good contact between rock and sensor. Aft er probe installation, the samples were placed in a vacuum bell jar partially fi lled with deaerated water. Such gradual bottom-up wetting of samples under vacuum is considered to eliminate entrapped air, thus achieving almost total saturation (Klute and Dirksen, 1986). Each of the samples was saturated with three diff erent deaerated water solutions, starting with deionized water and subsequently with 0.01 and 0.03 mol L−1
KCl solutions, to evaluate the eff ect of electrical conductivity (EC) on the measured R values. Th e EC value, KCl concentrations, and the density of each water solution are presented in Table 3.
All experiments were performed in a thermostatic room at a temperature of 25 ± 1°C. The need to maintain a constant temperature was mainly due to the dependence of rock dielectric properties on temperature (Ghretli et al., 2007; Evett et al., 2006); indeed, variations in temperature can cause errors in all indirect
Fig. 1. Scheme of equivalent circuit used by the Z-meter device; Iis the electric current fl owing into the circuit, RI is the real current fl owing through the equivalent resistor, CI is the imaginary current fl owing through the equivalent capacitor, and U is the applied voltage.
Table 1. Basic characteristics of a Z-meter device.
Parameter Z-Meter 2
Impedance range 10 W–1 MW
Frequency range 100 Hz–20 KHz
Impedance accuracy ±2% of the range
Phase accuracy ±2°
Voltage range 500 mV–5V with an interval of 500 mV

www.VadoseZoneJournal.org p. 4 of 9
measurements of q derived from dielectric parameters. At the same time, the relatively high temperature of the thermostatic room enabled the forcing and stabilization of the natural evaporation process.
Starting from saturated conditions, R measurements were performed using the Z-meter and recorded automatically throughout the entire evaporation process. The experiments were stopped when the sample weight approached its dry weight, with these measurements recorded automatically alongside the R values. Th e sample water content tended not to be uniformly distributed because evaporation took place from the top surface only; as a result, the samples were wetter at the bottom than at the top. Nevertheless, considering the length of the probe (Fig. 3), the
Fig. 2. Regional distribution of calcarenites and location of the quarry from which the samples were collected.
Table 2. Physical characteristics of the three samples tested.
Sample E1 E2 E3
Dimensions, cm 25 by 16 by 15 25 by 15 by 15 24.9 by 15 by 14.7
Bulk density, g cm−3 1.525 1.515 1.500
Particle density, g cm−3 2.71 2.71 2.71
Porosity, % 43.73 44.11 44.66
Fig. 3. Schematic view of rock sample E1 embedded with two picket-type probes.
Table 3. Physical properties of the deaerated water solutions used to saturate the samples.
Saturating solution Electrical conductivity Salt conc.
Water solution density at 25°C
mS cm−1 g L−1 g cm−3
Deionized water 3.4 ´ 10−3 0 0.9971
0.01 mol L−1KCl 1.75 0.745 0.9976
0.03 mol L−1KCl 4.70 2.235 0.9988

www.VadoseZoneJournal.org p. 5 of 9
measured R represents the average value for the sample portion between the two probes. Each measurement cycle was performed using a voltage of 1V and the following frequencies: 100, 500, 1000, 3000, 5000, 8000, and 10,000 Hz. Each cycle was repeated twice daily during the fi rst 15 d and once per day thereaft er, following the rate of the evaporation process. Due to technical problems in the laboratory, the measurements at 10,000 Hz were collected every half hour for Samples E2 and E3 only.
Gravimetric and Volumetric Water ContentTh e fi rst step in defi ning the correlation between R and q was to calculate the actual q of each sample corresponding to a certain measured value of R. Th e gravimetric water content, qg (kg kg−1), was obtained as the ratio of the mass of water present in the sample before and aft er drying to a constant mass at 105°C. Finally, the volumetric water content, qv (m3 m−3), that is the volume of water present in a unit volume of sample, can be expressed in terms of the bulk density of the medium, rb (kg m−3), and the density of water, rw (kg m−3) (Evett, 2003; Black, 1965):
bv g
w
æ ör ÷ç ÷q =q ç ÷ç ÷ç rè ø [4]
Stati sti cal MethodsThe experimental design, described above, produced seven Rmeasurement data sets (corresponding to the seven chosen frequencies) for each solution and each replicate. The experiment was structured so as to test the independence of the R measurements from the frequency set on the device. Th e independence was verifi ed if all the data sets were characterized by the same empirical distribution. To prove this, two conditions were checked: (i) the distribution shape is the same for all data sets; and (ii) all the parameters that uniquely individuate the distribution are statistically equal. If the distributions of the data sets were found to be Gaussian, this was considered suffi cient to verify that their mean values and variance were statistically equal.
For this purpose, the following tests were applied to all the data sets: (i) the Kolmogorov–Smirnov Gaussianity test; (ii) the Fligner–Killeen test of variance equality (homoscedasticity); and (iii) the Kruskal–Wallis ANOVA test of mean value equality (Thode, 2002; Conover et al., 1981). In contrast, if the distributions were not Gaussian, as proved to be the case, further confi rmatory tests had to be performed, including correlation analysis and multiple distribution comparison (Conover, 1999). If these confi rmatory tests were all simultaneously met, it was possible to state, with a very high degree of confi dence, that all the data sets were statistically indistinguishable. All statistical analyses were performed in the R environment (R Development Core Team, 2012).
6Results and DiscussionAnalysis of Water Content DataThe dynamics of sample weight loss during the test is shown in Fig. 4, in which the data for Sample E2, saturated with 0.01 mol L−1 KCl solution, are reported as an example. As this graph reveals, sample weight decreased with time at different rates; evaporation from the rock can therefore be modeled as a two-stages process. During the fi rst stage, characterized by high values of qv, evaporation is governed by environmental conditions; in the second, when qv decreases below a critical value, evaporation is controlled by the ability of the medium to transmit water or, in other words, by its hydraulic properties (Brutsaert, 1982; Jury et al., 1991). Th ese two stages can be mathematically expressed by two separate empirical equations: the fi rst by a linear relationship and the second by the following exponential function:
expxy a bc
æ ö÷ç= + - ÷ç ÷çè ø [5]
where y (kg) is sample weight with time, a (kg) is its dry weight, b (kg) is the weight of water required to saturate the sample, x is time (h), and c (h) is the only fi tting parameter. Th e transition
Fig. 4. Two-stage evaporation process based on weight loss and volumetric water content (qv). Th e data presented refer to Sample E2, saturated with 0.01 mol L−1 KCl solution.

www.VadoseZoneJournal.org p. 6 of 9
from the fi rst to the second stage occurs at a qv value of about 0.06 to 0.09 m3 m−3.
Stati sti cal Analysis of Resistance MeasurementsTh e results of the statistical analysis can be summarized as follows: (i) the Gaussian hypothesis was rejected for all data sets; and (ii) variance and mean values were found to be statistically equal for all data sets. To assert that the empirical distributions of all the data sets were indistinguishable, further confi rmatory tests were performed, with these tests also providing positive results. Th e produced correlation matrix (Table 4) revealed that the data sets were strongly correlated with each other, with a mean value exceeding 0.998. It is thus possible to state with a good degree of confi dence that all the distributions are equal.
The obtained data highlight both the strong reproducibility of the planned experiments and the high degree of precision, in a statistical sense, of the measuring device (Taylor, 1997). Moreover, such a result also allowed the use of the whole set of R measurements, i.e., including those recorded at all frequencies for each sample and for each water solution, to obtain the best fi t curve. In fact, aft er verifying that the data sets for each frequency had the same variance, it was then possible to use the arithmetic mean of all R values for each qv value.
Volumetric Water Content–Resistance Relati onshipsAs stated above, three replicates were tested for each water solution (deionized water and 0.01 and 0.03 mol L−1 KCl) to control random errors. Th erefore, for each solution, three independent data sets were available. Th e qv–R relationship, inferred via analysis of the data sets, is a power law following the form
vbaRq = [6]
Th e values of qv and R were then logarithmically transformed to simplify the analysis:
( ) ( ) ( )vln ln lna b Rq = + [7]
Th ree linear equations, each one characterized by its own value of slope and intercept [b and ln(a), respectively, in Eq. [7]], were estimated by means of the ordinary least squares method (Neter et al., 1996) for each water solution.
Th e aggregation of the three equations obtained for each water solution, providing a weighted mean of the three slopes, was achieved using
1
1
ni ii
nii
w bb
w=
=
=åå
[8]
Th e value attributed to the weight, wi, is equal to 1/ 2ibs , where
ibs is the uncertainty associated with each slope. In addition, the uncertainty associated with the aggregate slope was computed using the following equation derived from the general formula of error propagation (Taylor, 1997):
22
1i
n
bbii
bb=
æ ö¶ ÷ç ÷s = sç ÷ç ÷ç¶è øå [9]
Th e same procedure used for the slope was then also applied to the intercept.
Because the output of the obtained linear model is ln(qv), it was subsequently substituted with a power model, obtained from the previous model aft er simple algebraic transformations, to produce qv as output value.
All the actual values of qv and R for the three replicates and each water solution are plotted in Fig. 5. As shown in Fig. 5, the calibration functions are steep curves, with R rapidly increasing as qv decreases. For this reason, the R values were spread out via the use of a logarithmic-scale axis.
The differences in the qv–R data among the three replicates refl ect the natural heterogeneity of the investigated rock. Indeed, although the samples were cut from a single larger block, their physical properties, especially porosity, were not identical (see Table 2). Nevertheless, the variations may be considered nonsignifi cant.
Table 4. Correlation matrix for data sets of diff erent frequencies (f1 = 100 Hz, f2 = 500 Hz, f3 = 1000 Hz, f4 = 3000 Hz, f5 = 5000 Hz, f6 = 8000 Hz, f7 = 10,000 Hz).
f1 f2 f3 f4 f5 f6 f7
f1 1 0.999832 0.997121 0.999836 0.999872 0.999897 0.997665
f2 0.999832 1 0.996376 0.999976 0.999832 0.999881 0.996984
f3 0.997121 0.996376 1 0.996448 0.99769 0.997532 0.999949
f4 0.999836 0.999976 0.996448 1 0.999827 0.999877 0.997053
f5 0.999872 0.999832 0.99769 0.999827 1 0.999976 0.998165
f6 0.999897 0.999881 0.997532 0.999877 0.999976 1 0.998035
f7 0.997665 0.996984 0.999949 0.997053 0.998165 0.998035 1

www.VadoseZoneJournal.org p. 7 of 9
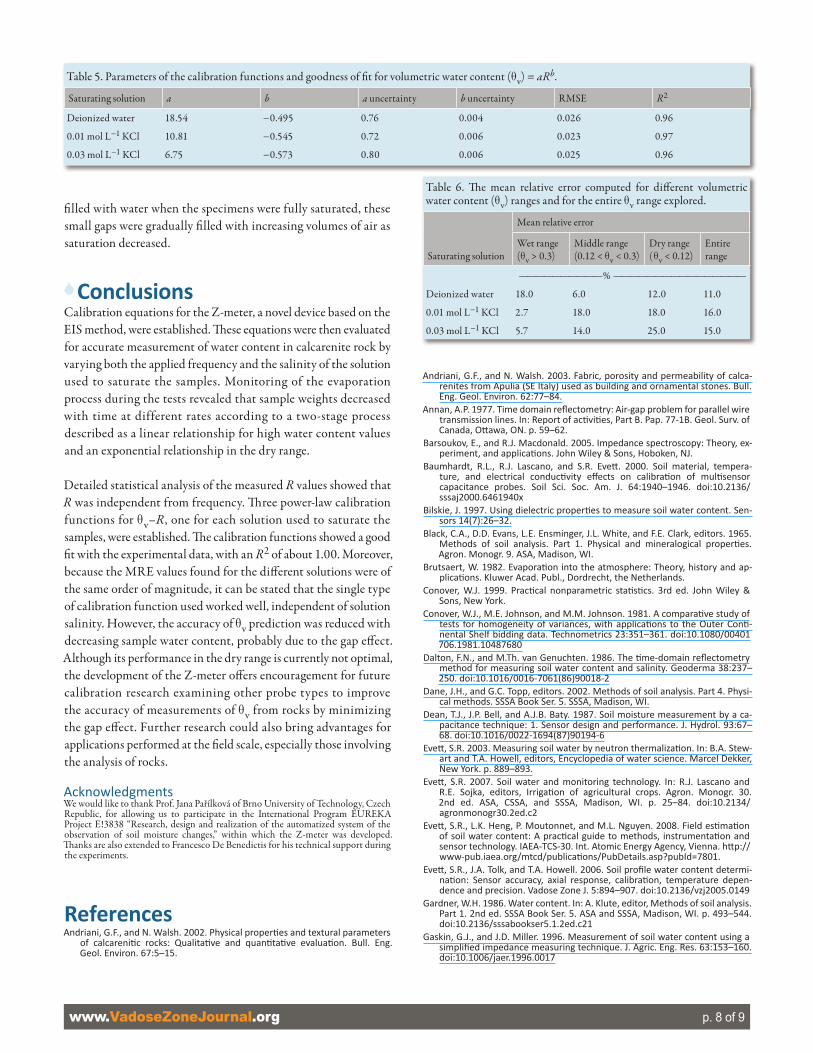
Th e calibration function parameters and their uncertainty are summarized in Table 5, together with the goodness-of-fi t data for the chosen model. As this table shows, the values of the coeffi cient of determination (R2) are 0.96 and 0.97, indicating that all functions describe the qv–R data very well. Furthermore, both the values of the root mean square error and the uncertainty for the two calibration parameters are also strong. Th e function therefore describes the correlation qv–R data for the investigated rock with reasonable accuracy on the basis of the actually measured R.
Th e discrepancies among the calibration parameters confi rm that a specifi c calibration is always required for each salinity value of the solution used to saturate the samples. In fact, Schwank and Green (2007) stated that the understanding and quantifi cation of the sensor response to variable salinity is needed to accurately determine qv from R.
The goodness of the model fit is displayed in Fig. 6, where actual vs. predicted values of qv, calculated using the calibration functions obtained for each solution, are plotted. As mentioned above, comparison of the R2 values showed that the goodness of fi t of the models for all three saturation solutions was essentially identical (Table 5). Th is is also confi rmed by the mean relative error (MRE) computed on the absolute residuals for each solution (Taylor, 1997), with MRE values obtained for the deionized, 0.01 mol L−1 KCl, and 0.03 mol L−1 KCl solutions being 11, 16, and 15%, respectively (Table 6). Th e fact that these MRE values are of the same order of magnitude suggests that solution salinity did not aff ect the structure of the calibration functions. To be more precise, the accuracy of the predicted qv value varies with water content, as confi rmed by the MRE values determined at diff erent ranges of water content (Table 6). Th e unexpectedly high MRE value for the deionized solution where qv > 0.30 m3 m−3 can be easily explained by the outliers observed in one of the three replicates (Fig. 6). However, for lower water content levels, the MRE values worsen (Table 6).
Such an increase in error level can be ascribed to the gap eff ect. Although the probes were hammered into slightly undersized guide holes, the eff ect of even slight gaps was not negligible. Initially
Fig. 5. Calibration functions for volumetric water content (qv)–resistance (R) for the three replicate samples E1, E2, and E3 saturated with (a) deionized water, (b) 0.01 mol L−1 KCl, and (c) 0.03 mol L−1 KCl.
Fig. 6. Actual vs. predicted volumetric water content (qv) values for the three replicate samples with saturation solutions of deionized water and 0.01 mol L−1 and 0.03 mol L−1 KCl. Th e solid line represents a 1:1 ratio.
www.VadoseZoneJournal.org p. 8 of 9
fi lled with water when the specimens were fully saturated, these small gaps were gradually fi lled with increasing volumes of air as saturation decreased.
6ConclusionsCalibration equations for the Z-meter, a novel device based on the EIS method, were established. Th ese equations were then evaluated for accurate measurement of water content in calcarenite rock by varying both the applied frequency and the salinity of the solution used to saturate the samples. Monitoring of the evaporation process during the tests revealed that sample weights decreased with time at different rates according to a two-stage process described as a linear relationship for high water content values and an exponential relationship in the dry range.
Detailed statistical analysis of the measured R values showed that R was independent from frequency. Th ree power-law calibration functions for qv–R, one for each solution used to saturate the samples, were established. Th e calibration functions showed a good fi t with the experimental data, with an R2 of about 1.00. Moreover, because the MRE values found for the diff erent solutions were of the same order of magnitude, it can be stated that the single type of calibration function used worked well, independent of solution salinity. However, the accuracy of qv prediction was reduced with decreasing sample water content, probably due to the gap eff ect. Although its performance in the dry range is currently not optimal, the development of the Z-meter off ers encouragement for future calibration research examining other probe types to improve the accuracy of measurements of qv from rocks by minimizing the gap eff ect. Further research could also bring advantages for applications performed at the fi eld scale, especially those involving the analysis of rocks.
AcknowledgmentsWe would like to thank Prof. Jana Pařílková of Brno University of Technology, Czech Republic, for allowing us to participate in the International Program EUREKA Project E!3838 “Research, design and realization of the automatized system of the observation of soil moisture changes,” within which the Z-meter was developed. Th anks are also extended to Francesco De Benedictis for his technical support during the experiments.
ReferencesAndriani, G.F., and N. Walsh. 2002. Physical properti es and textural parameters
of calcareniti c rocks: Qualitati ve and quanti tati ve evaluati on. Bull. Eng. Geol. Environ. 67:5–15.
Andriani, G.F., and N. Walsh. 2003. Fabric, porosity and permeability of calca-renites from Apulia (SE Italy) used as building and ornamental stones. Bull. Eng. Geol. Environ. 62:77–84.
Annan, A.P. 1977. Time domain refl ectometry: Air-gap problem for parallel wire transmission lines. In: Report of acti viti es, Part B. Pap. 77-1B. Geol. Surv. of Canada, Ott awa, ON. p. 59–62.
Barsoukov, E., and R.J. Macdonald. 2005. Impedance spectroscopy: Theory, ex-periment, and applicati ons. John Wiley & Sons, Hoboken, NJ.
Baumhardt, R.L., R.J. Lascano, and S.R. Evett . 2000. Soil material, tempera-ture, and electrical conducti vity eff ects on calibrati on of multi sensor capacitance probes. Soil Sci. Soc. Am. J. 64:1940–1946. doi:10.2136/sssaj2000.6461940x
Bilskie, J. 1997. Using dielectric properti es to measure soil water content. Sen-sors 14(7):26–32.
Black, C.A., D.D. Evans, L.E. Ensminger, J.L. White, and F.E. Clark, editors. 1965. Methods of soil analysis. Part 1. Physical and mineralogical properti es. Agron. Monogr. 9. ASA, Madison, WI.
Brutsaert, W. 1982. Evaporati on into the atmosphere: Theory, history and ap-plicati ons. Kluwer Acad. Publ., Dordrecht, the Netherlands.
Conover, W.J. 1999. Practi cal nonparametric stati sti cs. 3rd ed. John Wiley & Sons, New York.
Conover, W.J., M.E. Johnson, and M.M. Johnson. 1981. A comparati ve study of tests for homogeneity of variances, with applicati ons to the Outer Conti -nental Shelf bidding data. Technometrics 23:351–361. doi:10.1080/00401706.1981.10487680
Dalton, F.N., and M.Th. van Genuchten. 1986. The ti me-domain refl ectometry method for measuring soil water content and salinity. Geoderma 38:237–250. doi:10.1016/0016-7061(86)90018-2
Dane, J.H., and G.C. Topp, editors. 2002. Methods of soil analysis. Part 4. Physi-cal methods. SSSA Book Ser. 5. SSSA, Madison, WI.
Dean, T.J., J.P. Bell, and A.J.B. Baty. 1987. Soil moisture measurement by a ca-pacitance technique: 1. Sensor design and performance. J. Hydrol. 93:67–68. doi:10.1016/0022-1694(87)90194-6
Evett , S.R. 2003. Measuring soil water by neutron thermalizati on. In: B.A. Stew-art and T.A. Howell, editors, Encyclopedia of water science. Marcel Dekker, New York. p. 889–893.
Evett , S.R. 2007. Soil water and monitoring technology. In: R.J. Lascano and R.E. Sojka, editors, Irrigati on of agricultural crops. Agron. Monogr. 30. 2nd ed. ASA, CSSA, and SSSA, Madison, WI. p. 25–84. doi:10.2134/agronmonogr30.2ed.c2
Evett , S.R., L.K. Heng, P. Moutonnet, and M.L. Nguyen. 2008. Field esti mati on of soil water content: A practi cal guide to methods, instrumentati on and sensor technology. IAEA-TCS-30. Int. Atomic Energy Agency, Vienna. htt p://www-pub.iaea.org/mtcd/publicati ons/PubDetails.asp?pubId=7801.
Evett , S.R., J.A. Tolk, and T.A. Howell. 2006. Soil profi le water content determi-nati on: Sensor accuracy, axial response, calibrati on, temperature depen-dence and precision. Vadose Zone J. 5:894–907. doi:10.2136/vzj2005.0149
Gardner, W.H. 1986. Water content. In: A. Klute, editor, Methods of soil analysis. Part 1. 2nd ed. SSSA Book Ser. 5. ASA and SSSA, Madison, WI. p. 493–544. doi:10.2136/sssabookser5.1.2ed.c21
Gaskin, G.J., and J.D. Miller. 1996. Measurement of soil water content using a simplifi ed impedance measuring technique. J. Agric. Eng. Res. 63:153–160. doi:10.1006/jaer.1996.0017
Table 5. Parameters of the calibration functions and goodness of fi t for volumetric water content (qv) = aRb.
Saturating solution a b a uncertainty b uncertainty RMSE R2
Deionized water 18.54 −0.495 0.76 0.004 0.026 0.96
0.01 mol L−1 KCl 10.81 −0.545 0.72 0.006 0.023 0.97
0.03 mol L−1 KCl 6.75 −0.573 0.80 0.006 0.025 0.96
Table 6. Th e mean relative error computed for diff erent volumetric water content (qv) ranges and for the entire qv range explored.
Saturating solution
Mean relative error
Wet range (qv > 0.3)
Middle range (0.12 < qv < 0.3)
Dry range (qv < 0.12)
Entire range
—————————— % ————————————————
Deionized water 18.0 6.0 12.0 11.0
0.01 mol L−1 KCl 2.7 18.0 18.0 16.0
0.03 mol L−1 KCl 5.7 14.0 25.0 15.0

www.VadoseZoneJournal.org p. 9 of 9
Ghretli, M., K. Khalid, I.V. Grozescu, H. Sahri, and Z. Abbas. 2007. Dual fre-quency microstrip antenna sensor for water content measurements in-dependent of temperature variation. Meas. Sci. Technol. 18:1054–1060. doi:10.1088/0957-0233/18/4/013
Greacen, E.L., editor. 1981. Soil water assessment by the neutron method. CSIRO, Melbourne, Australia.
Guerrero-Aspizua, M., J. Pařílková, D. García-Contreras, D. Navidad, M.A. Losa-da, and J. Veselý. 2012. The EIS method in coastal areas: Application in Carc-huna Beach, Spain. In: Proceedings of the 3rd Conference and Work Session within the Frame of the International Project EUREKA E!4981. Brno, Czech Republic. 20–21 Sept. 2012. VUTUM, Brno. p. 80–90.
Hokett, S.L., J.B. Chapman, and C.E. Russell. 1992. Potential use of time domain reflectometry for measuring water content in rock. J. Hydrol. 138:89–96. doi:10.1016/0022-1694(92)90157-Q
Jones, S.B., and D. Or. 2004. Frequency domain analysis for extending time do-main reflectometry water content measurements in highly saline soils. Soil Sci. Soc. Am. J. 68:1568–1577. doi:10.2136/sssaj2004.1568
Jury, W., W.R. Gardner, and W.H. Gardner. 1991. Soil physics. 5th ed. John Wiley & Sons, New York.
Kizito, F., C.G. Campbell, D.R. Cobos, B.L. Teare, B. Carter, and J.W. Hopmans. 2008. Frequency, electrical conductivity and temperature analysis of a low-cost capacitance soil moisture sensor. J. Hydrol. 352:367–378. doi:10.1016/j.jhydrol.2008.01.021
Klute, A., and C. Dirksen. 1986. Hydraulic conductivity and diffusivity: Labora-tory methods. In: A. Klute, editor, Methods of soil analysis. Part 1. 2nd ed. SSSA Book Ser. 5. ASA and SSSA, Madison, WI. p. 687–734. doi:10.2136/sssabookser5.1.2ed.c28
Knight, J.H., P.A. Ferré, D.L. Rudolph, and R.G. Kachanoski. 1997. A numerical analysis of the effects of coatings and gaps upon relative dielectric permit-tivity measurement with time domain reflectometry. Water Resour. Res. 33:1455–1460. doi:10.1029/97WR00435
Jackson, J.D. 1999. Classical electrodynamics. 3rd ed. John Wiley & Sons, New York.
Loew, A., R. Ludwig, and W. Mauser. 2006. Derivation of surface soil mois-ture from ENVISAT ASAR wide swath and image mode data in agricul-tural areas. IEEE Trans. Geosci. Remote Sens. 44:889–899. doi:10.1109/TGRS.2005.863858
McCann, I.R., D.C. Kincaid, and D. Wang. 1992. Operational characteristics of the Watermark Model 200 soil water potential sensor for irrigation man-agement. Appl. Eng. Agric. 8:603–609.
Neter, J., M.H. Kutner, C.J. Nachtsheim, and W. Wasserman. 1996. Applied lin-ear statistical models. 4th ed. Richard D. Irwin, Burr Ridge, IL.
Pařílková, J., Z. Gardavská, M. Fejfarová, M.C. Caputo, and R. Masciale. 2011. Monitoring of the earthen dike of small water reservoir using electrical im-pedance spectrometry method. In: J.J. Fry et al., editors, Proceedings of the Conference on Internal Erosion in Embankment Dams and Their Founda-tion, Brno, Czech Republic. 26–29 Apr. 2011. Vol. 13. Akademické Naklada-telství Cerm, Brno. p. 173–180.
Pařílková, J., J. Veselý, J. Pavlík, and R. Stoklásek. 2009. Monitoring of the soil status using electrical impedance spectrometry method developed in Proj-ect E!3838 of the Europe International Program EUREKA. In: Fundamental and Applied Metrology: Proceedings of the XIX IMEKO World Congress, Lis-bon, Portugal. 6–11 Sept. 2009. IMEKO, Budapest. p. 2234–2237.
Pimentel, R., J. Herrero, J. Pařílková, A. Millares, M.J. Polo, and J. Veselý. 2012. Measurement of snow properties using EIS-monitoring method in Sierra Nevada (Spain). In: Proceedings of the 3rd Conference and Work Session within the Frame of the International Project EUREKA E!4981. Brno, Czech Republic. 20–21 Sept. 2012. VUTUM, Brno. p. 66–73.
R Development Core Team. 2012. R: A language and environment for statistical computing. R Foundation for Statistical Computing, Vienna. http://www.R-project.org/.
Robinson, D.A., S.B. Jones, J.A. Wraith, D. Or, and S.P. Firedmena. 2003. A review of advances in dielectric and electrical conductivity measurements in soils using time domain reflectometry. Vadose Zone J. 2:444–475. doi:10.2136/vzj2003.4440
Robinson, M., and T.J. Dean. 1993. Measurement of near surface soil water con-tent using a capacitance probe. Hydrol. Processes 7:77–86. doi:10.1002/hyp.3360070108
Sakaki, T., and H. Rajaram. 2006. Performance of different types of time domain reflectometry probes for water content measurement in partially saturated rocks. Water Resour. Res. 42:W07404. doi:10.1029/2005WR004643
Sakaki, T., K. Sugihara, T. Adachi, K. Nishida, and W.R. Lin. 1998. Application of time domain reflectometry to determination of volumetric water content in rock. Water Resour. Res. 34:2623–2631. doi:10.1029/98WR02038
Schneebeli, M., H. Flühler, T. Gimmi, H. Wydler, H.-P. Läser, and T. Baer. 1995. Measurements of water potential and water content in unsaturated crys-talline rock. Water Resour. Res. 31:1837–1843. doi:10.1029/95WR01487
Schwank, M., and T.R. Green. 2007. Simulated effects of soil temperature and salinity on capacitance sensor measurements. Sensors 7:548–577. doi:10.3390/s7040548
Seyfried, M.S., and M.D. Murdock. 2004. Measurement of soil water con-tent with a 50-MHz soil dielectric sensor. Soil Sci. Soc. Am. J. 68:394–403. doi:10.2136/sssaj2004.0394
Shock, C.C. 2003. Soil water potential measurement by granular matrix sensors. In: B.A. Stewart and T.A. Howell, editors, Encyclopedia of water science. Marcel Dekker, New York. p. 899–903.
Taylor, J.R. 1997. An introduction to error analysis. 2nd ed. Univ. Sci. Books, Sau-salito, CA.
Thode, H.C., Jr. 2002. Testing for normality. Marcel Dekker, New York.Topp, G.C., and J.L. Davis. 1985. Measurement of soil water content using time-
domain reflectometry in field evaluation. Soil Sci. Soc. Am. J. 49:19–24. doi:10.2136/sssaj1985.03615995004900010003x
Topp, G.C., J.L. Davis, and A.P. Annan. 1980. Electromagnetic determination of soil water content: Measurement in coaxial transmission lines. Water Re-sour. Res. 16:574–582. doi:10.1029/WR016i003p00574
Veldkamp, E., and J.J. O’Brien. 2000. Calibration of a frequency domain reflec-tometry sensor for humid tropical soils of volcanic origin. Soil Sci. Soc. Am. J. 64:1549–1553. doi:10.2136/sssaj2000.6451549x
Walker, J.P., P.R. Houser, and G.R. Willgoose. 2004. Active microwave remote sensing for soil moisture measurement: A field evaluation using ERS-2. Hy-drol. Processes 18:1975–1997. doi:10.1002/hyp.1343
Wigneron, J.-P., J.-C. Calvet, T. Pellarin, A.A. Van de Griend, M. Berger, and P. Ferrazzoli. 2003. Retrieving near-surface soil moisture from microwave radiometric observations: Current status and future plans. Remote Sens. Environ. 85:489–506. doi:10.1016/S0034-4257(03)00051-8
Related Documents