The CalEnviroScreen Model Is made up of a suite of 20 statewide indicators of pollution burden and population characteristics associated with increased vulnerability to pollution’s health effects. Uses a weighted scoring system to derive average pollution burden and population characteristics scores for each census tract. Calculates a final CalEnviroScreen score for a given census tract relative to the other tracts in the state by multiplying the pollution burden and population characteristics components together. The score measures the relative pollution burdens and vulnerabilities in one census tract compared to others and is not a measure of health risk. CalEnviroScreen 3.0 Factsheet What is CalEnviroScreen? CalEnviroScreen is a science-based mapping tool that helps identify California communities that are most affected by many sources of pollution, and that are often especially vulnerable to pollution’s effects. CalEnviroScreen uses environmental, health, and socioeconomic information to produce a numerical score for each census tract in the state. The results are depicted on maps so that different communities can be compared to one another. A census tract with a high score is one that experiences higher pollution burden and vulnerability than census tracts with low scores. CalEnviroScreen ranks census tracts based on data that are available from state and federal government sources. CalEnviroScreen 3.0 is the most current version and was released in January 2017. CalEPA California Environmental Protection Agency OEHHA Office of Environmental Health Hazard Assessment Who developed CalEnviroScreen? Office of Environmental Health Hazard Assessment (OEHHA) California Environmental Protection Agency (CalEPA) Uses of CalEnviroScreen To identify California’s most environmentally burdened and vulnerable communities. To assist CalEPA’s boards and departments with decisions, such as prioritizing resources and cleanup activities. Disadvantaged communities in California are targeted for investment of proceeds from the State’s cap-and-trade program. CalEPA designated census tracts with the highest CalEnviroScreen scores as disadvantaged communities for investing cap-and-trade proceeds. Used by CalEPA’s Environmental Justice Task Force and other state entities as guidance in allocating grants and in other decisions.

Welcome message from author
This document is posted to help you gain knowledge. Please leave a comment to let me know what you think about it! Share it to your friends and learn new things together.
Transcript

The CalEnviroScreen Model
Is made up of a suite of 20 statewide indicators of pollution
burden and population characteristics associated with increased
vulnerability to pollution’s health effects.
Uses a weighted scoring system to derive average pollution
burden and population characteristics scores for each census
tract.
Calculates a final CalEnviroScreen score for a given census tract
relative to the other tracts in the state by multiplying the pollution
burden and population characteristics components together.
The score measures the relative pollution burdens and
vulnerabilities in one census tract compared to others and is not
a measure of health risk.
CalEnviroScreen 3.0
Factsheet
What is CalEnviroScreen?
CalEnviroScreen is a science-based mapping tool
that helps identify California communities that
are most affected by many sources of pollution,
and that are often especially vulnerable to
pollution’s effects. CalEnviroScreen uses
environmental, health, and socioeconomic
information to produce a numerical score for
each census tract in the state.
The results are depicted on maps so that
different communities can be compared to one
another. A census tract with a high score is one
that experiences higher pollution burden and
vulnerability than census tracts with low scores.
CalEnviroScreen ranks census tracts based on
data that are available from state and federal
government sources. CalEnviroScreen 3.0 is the
most current version and was released in
January 2017.
CalEPA California Environmental Protection Agency
OEHHA Office of Environmental Health Hazard Assessment
Who developed CalEnviroScreen?
Office of Environmental Health Hazard
Assessment (OEHHA)
California Environmental Protection Agency
(CalEPA)
Uses of CalEnviroScreen
To identify California’s most environmentally burdened and
vulnerable communities.
To assist CalEPA’s boards and departments with decisions,
such as prioritizing resources and cleanup activities.
Disadvantaged communities in California are targeted for
investment of proceeds from the State’s cap-and-trade
program. CalEPA designated census tracts with the highest
CalEnviroScreen scores as disadvantaged communities for
investing cap-and-trade proceeds.
Used by CalEPA’s Environmental Justice Task Force and
other state entities as guidance in allocating grants and in
other decisions.
How to learn more and access the tool: Website: http://oehha.ca.gov/calenviroscreen
Email: [email protected]
The CalEnviroScreen 3.0 report (in English and Spanish), maps and
additional data:
https://oehha.ca.gov/calenviroscreen/report/calenviroscreen-30
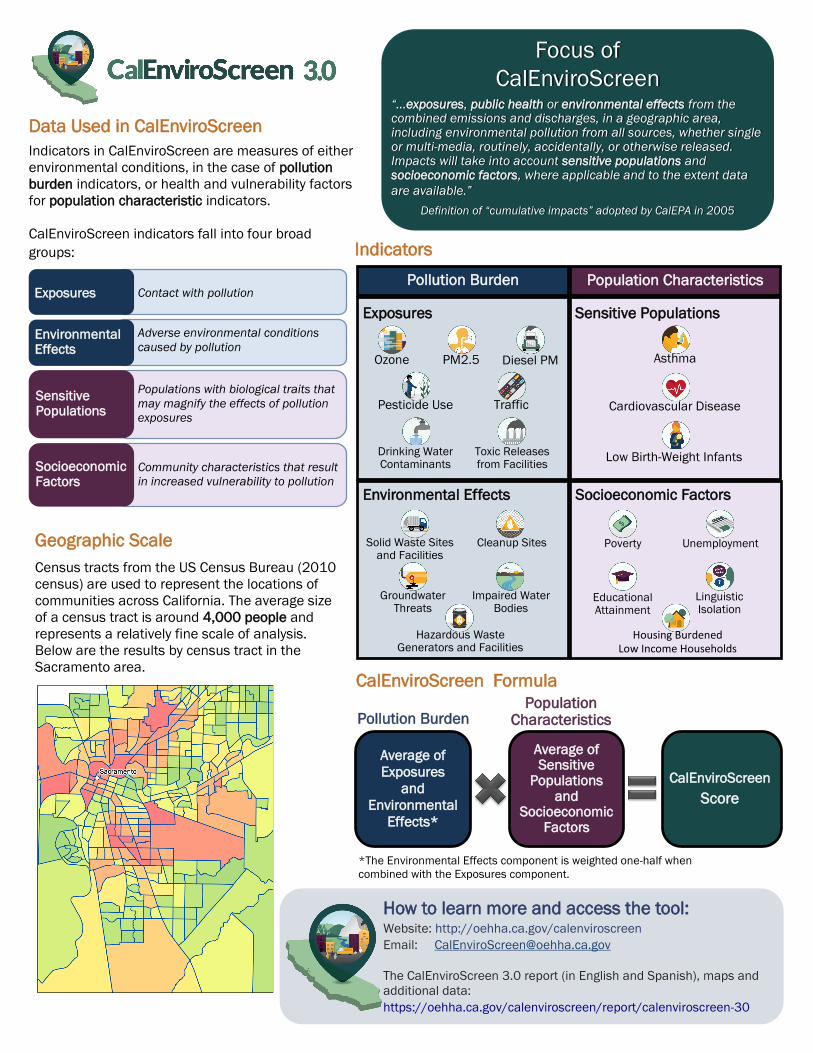
Geographic Scale
Census tracts from the US Census Bureau (2010
census) are used to represent the locations of
communities across California. The average size
of a census tract is around 4,000 people and
represents a relatively fine scale of analysis.
Below are the results by census tract in the
Sacramento area. CalEnviroScreen Formula
Population Characteristics
Average of
Exposures
and
Environmental
Effects*
CalEnviroScreen
Score
Average of Sensitive
Populations and
Socioeconomic Factors
Pollution Burden
*The Environmental Effects component is weighted one-half when
combined with the Exposures component.
Data Used in CalEnviroScreen
Indicators in CalEnviroScreen are measures of either
environmental conditions, in the case of pollution
burden indicators, or health and vulnerability factors
for population characteristic indicators.
CalEnviroScreen indicators fall into four broad
groups:
Focus of
CalEnviroScreen “...exposures, public health or environmental effects from the combined emissions and discharges, in a geographic area, including environmental pollution from all sources, whether single or multi-media, routinely, accidentally, or otherwise released. Impacts will take into account sensitive populations and socioeconomic factors, where applicable and to the extent data
are available.”
Definition of “cumulative impacts” adopted by CalEPA in 2005
Exposures
Environmental Effects
Pollution Burden
Sensitive Populations
Population Characteristics
Socioeconomic Factors
Hazardous Waste Generators and Facilities
Impaired Water Bodies
Traffic
Toxic Releases from Facilities
Drinking Water Contaminants
Pesticide Use
Ozone Diesel PM PM2.5
Solid Waste Sites and Facilities
Cleanup Sites
Groundwater Threats
Asthma
Cardiovascular Disease
Low Birth-Weight Infants
Poverty
Linguistic Isolation
Housing Burdened Low Income Households
Educational Attainment
Unemployment
Contact with pollution Exposures
Populations with biological traits that
may magnify the effects of pollution
exposures
Sensitive Populations
Adverse environmental conditions
caused by pollution Environmental Effects
Community characteristics that result
in increased vulnerability to pollution
Socioeconomic Factors
Indicators
Related Documents