Calculation of Vibrational Spectra of Linear Tetrapyrroles. 4. Methine Bridge C-H Out-of-Plane Modes Maria Andrea Mroginski,* Daniel Horacio Murgida, and Peter Hildebrandt Technische UniVersita ¨t Berlin, Institut fu ¨r Chemie, Max-Volmer-Laboratorium, Sekr. PC 14, Strasse des 17. Juni 135, D-10623 Berlin, Germany ReceiVed: May 22, 2006; In Final Form: July 14, 2006 Quantum chemical force fields obtained by density functional theory (DFT) calculations systematically overestimate the frequencies of normal modes including ethylenic C-H out-of-plane (HOOP) coordinates. Compensation of this deviation requires a specific scaling factor for this type of coordinate that is distinctly lower than those applicable to out-of-plane coordinates in general. Such a specific scaling factor (0.900) has been optimized for the DFT(B3LYP) level of theory on the basis of vibrational analyses of training molecules including the HOOP coordinate. Thus, the root-mean-square deviation for the calculated frequencies of these modes is reduced from 16 to 8 cm -1 . Although Raman intensities are yet not reproduced in a satisfactory manner, implementation of the HOOP scaling factor into the set of global scaling factors determined previously (Magdo et al. J. Phys. Chem. A 1999, 103, 289-303) allows for a substantially improved reproduction of the experimental (resonance) Raman spectra of test molecules including linear methine-bridged tetrapyrroles. A very good agreement between calculated and experimental spectra is noted for the phycocyanobilin dimethylester dimer as well as for the protein-bound phycocyanobilin in the antenna pigment R-CPC. However, for the phycocyanobilin chromophore in the P r state of the plant photoreceptor phytochrome phyA, considerable deviations remain in the spectral range between 800 and 500 cm -1 , which are attributed to the effect of specific protein-chromophore interactions. The influence of the protein environment is not considered in the present calculations that refer to the molecule in vacuo. Introduction Calculations of the vibrational frequencies by quantum chemical ab initio methods are being increasingly used for the analysis of vibrational spectra. With increasing size of the molecules, the number of modes observed in the experimental IR and Raman spectra grows strongly such that, particularly for molecules of low symmetry, an unambiguous spectra interpretation is not possible on the basis of empirical approaches and intuitive arguments. In this respect, quantum mechanically calculated spectra become an indispensable tool for the vibra- tional assignment, which is a prerequisite for the determination of structural parameters from the spectra. For molecules including more than 25 atoms, quantum mechanical calculations are usually restricted to the harmonic approximation which, together with the intrinsic deficiencies of the methods employed, leads to systematic errors of the force fields. These drawbacks can be partially overcome by applying scaling procedures. Whereas scaling of the calculated frequencies by a single factor already significantly improves the agreement with the experimental frequencies, the scaled quantum mechanics force field (SQMFF) approach developed by Pulay and co-workers provides physically sustained and thus more accurate correc- tions. 1 In this approach, global scaling factors are introduced to correct the force field itself. Within a specific level of theory, these scaling factors are optimized for a particular type of internal coordinates and, thus, are transferable between different molecules that include the same or chemically similar internal coordinates. Therefore, the scaling factors can be initially determined for molecules for which a complete vibrational assignment is straightforward, i.e., training molecules, and then transferred to the target molecules. Several sets of global scaling factors have been developed and improved in the past decade affording an agreement of the calculated frequencies with the experimentally determined data of ca. (10 cm -1 . 1-3 Extending the scaling procedures to target molecules has provided promising results even for molecules containing more than 60 atoms, and there are no indications for a principle size limit. In view of this generally very good performance, the few striking deviations that have been noted deserve specific attention. For example, it has been found that the force constants for internal coordinates involving the N-H group cannot be consistently corrected by the same scaling factors in the presence and absence of hydrogen bond interac- tions. 4 With the introduction of specific scaling factors for hydrogen-bonded N-H functions, a substantial improvement of the description of experimental spectra is achieved. This is particularly important for analyzing the spectra of protein cofactors such as linear tetrapyrroles which are usually involved in a network of hydrogen bonds with adjacent amino acid residues. Linear tetrapyrroles such as phytochromobilin, phy- cocyanobilin, and biliverdin constitute the chromophoric sites in phytochromes, a family of photoreceptors, that have been studied by resonance Raman (RR) spectroscopy. 5-8 SQMFF calculations have been shown to be indispensable for the interpreting the experimental RR spectra. On the basis of the analysis of the spectral region between 1300 and 1700 cm -1 , conclusions can be drawn about the configuration, conformation, and protonation state of the tetrapyrroles, and in this way, * E-mail: [email protected]. 10564 J. Phys. Chem. A 2006, 110, 10564-10574 10.1021/jp063128x CCC: $33.50 © 2006 American Chemical Society Published on Web 08/23/2006

Welcome message from author
This document is posted to help you gain knowledge. Please leave a comment to let me know what you think about it! Share it to your friends and learn new things together.
Transcript
Calculation of Vibrational Spectra of Linear Tetrapyrroles. 4. Methine Bridge C-HOut-of-Plane Modes
Maria Andrea Mroginski,* Daniel Horacio Murgida, and Peter HildebrandtTechnische UniVersitat Berlin, Institut fur Chemie, Max-Volmer-Laboratorium, Sekr. PC 14, Strasse des 17.Juni 135, D-10623 Berlin, Germany
ReceiVed: May 22, 2006; In Final Form: July 14, 2006
Quantum chemical force fields obtained by density functional theory (DFT) calculations systematicallyoverestimate the frequencies of normal modes including ethylenic C-H out-of-plane (HOOP) coordinates.Compensation of this deviation requires a specific scaling factor for this type of coordinate that is distinctlylower than those applicable to out-of-plane coordinates in general. Such a specific scaling factor (0.900) hasbeen optimized for the DFT(B3LYP) level of theory on the basis of vibrational analyses of training moleculesincluding the HOOP coordinate. Thus, the root-mean-square deviation for the calculated frequencies of thesemodes is reduced from 16 to 8 cm-1. Although Raman intensities are yet not reproduced in a satisfactorymanner, implementation of the HOOP scaling factor into the set of global scaling factors determined previously(Magdo et al.J. Phys. Chem. A1999, 103, 289-303) allows for a substantially improved reproduction of theexperimental (resonance) Raman spectra of test molecules including linear methine-bridged tetrapyrroles. Avery good agreement between calculated and experimental spectra is noted for the phycocyanobilindimethylester dimer as well as for the protein-bound phycocyanobilin in the antenna pigmentR-CPC. However,for the phycocyanobilin chromophore in the Pr state of the plant photoreceptor phytochrome phyA, considerabledeviations remain in the spectral range between 800 and 500 cm-1, which are attributed to the effect ofspecific protein-chromophore interactions. The influence of the protein environment is not considered in thepresent calculations that refer to the molecule in vacuo.
Introduction
Calculations of the vibrational frequencies by quantumchemical ab initio methods are being increasingly used for theanalysis of vibrational spectra. With increasing size of themolecules, the number of modes observed in the experimentalIR and Raman spectra grows strongly such that, particularlyfor molecules of low symmetry, an unambiguous spectrainterpretation is not possible on the basis of empirical approachesand intuitive arguments. In this respect, quantum mechanicallycalculated spectra become an indispensable tool for the vibra-tional assignment, which is a prerequisite for the determinationof structural parameters from the spectra. For moleculesincluding more than 25 atoms, quantum mechanical calculationsare usually restricted to the harmonic approximation which,together with the intrinsic deficiencies of the methods employed,leads to systematic errors of the force fields. These drawbackscan be partially overcome by applying scaling procedures.
Whereas scaling of the calculated frequencies by a singlefactor already significantly improves the agreement with theexperimental frequencies, the scaled quantum mechanics forcefield (SQMFF) approach developed by Pulay and co-workersprovides physically sustained and thus more accurate correc-tions.1 In this approach, global scaling factors are introducedto correct the force field itself. Within a specific level of theory,these scaling factors are optimized for a particular type ofinternal coordinates and, thus, are transferable between differentmolecules that include the same or chemically similar internalcoordinates. Therefore, the scaling factors can be initially
determined for molecules for which a complete vibrationalassignment is straightforward, i.e., training molecules, and thentransferred to the target molecules.
Several sets of global scaling factors have been developedand improved in the past decade affording an agreement of thecalculated frequencies with the experimentally determined dataof ca.(10 cm-1.1-3 Extending the scaling procedures to targetmolecules has provided promising results even for moleculescontaining more than 60 atoms, and there are no indicationsfor a principle size limit. In view of this generally very goodperformance, the few striking deviations that have been noteddeserve specific attention. For example, it has been found thatthe force constants for internal coordinates involving the N-Hgroup cannot be consistently corrected by the same scalingfactors in the presence and absence of hydrogen bond interac-tions.4 With the introduction of specific scaling factors forhydrogen-bonded N-H functions, a substantial improvementof the description of experimental spectra is achieved. This isparticularly important for analyzing the spectra of proteincofactors such as linear tetrapyrroles which are usually involvedin a network of hydrogen bonds with adjacent amino acidresidues. Linear tetrapyrroles such as phytochromobilin, phy-cocyanobilin, and biliverdin constitute the chromophoric sitesin phytochromes, a family of photoreceptors, that have beenstudied by resonance Raman (RR) spectroscopy.5-8 SQMFFcalculations have been shown to be indispensable for theinterpreting the experimental RR spectra. On the basis of theanalysis of the spectral region between 1300 and 1700 cm-1,conclusions can be drawn about the configuration, conformation,and protonation state of the tetrapyrroles, and in this way,* E-mail: [email protected].
10564 J. Phys. Chem. A2006,110,10564-10574
10.1021/jp063128x CCC: $33.50 © 2006 American Chemical SocietyPublished on Web 08/23/2006
valuable information about the molecular functioning of phy-tochrome has been obtained.
The most striking discrepancies between experimental andcalculated spectra refer to the region of the methine bridge C-Hout-of-plane (HOOP) modes with frequency deviations of upto 50 cm-1. This failure of the calculations is particularlyannoying, since HOOP modes are considered to be sensitiveindicators for dihedral distortions for the methine bridges oftetrapyrroles and, more generally, for polyene chains. Thepresent paper is dedicated to overcoming this deficiency bydeveloping an optimized scaling factor for HOOP modes whichso far is not included in the set of global scaling factors. Thestrategy is based on the vibrational analyses of a series of eighttest molecules that include the HOOP coordinate. For thesemolecules, the vibrational spectra are calculated using densityfunctional theory (DFT). By comparing the calculated andexperimental spectra, an HOOP scaling factor is optimized andincluded in the set of transferable scaling factors, which in thesubsequent step is employed for the description of the vibrationalspectra of test and target molecules that include tetrapyrrolesin different configurations and conformations.
Methods
Calculations.DFT calculations with the B3LYP functional9
and the 6-31G*10 basis set were carried out as describedpreviously.3 The force fields were scaled according to
where (Fij)σ and Fij are the respective scaled and unscaled forceconstants of the internal coordinatesi and j. A previouslydetermined set of global scaling factorsσi was used togetherwith the scaling factor for the HOOP coordinate,σHOOP, whichis introduced in this work. Optimization of the force field scalingfactor for the HOOP coordinate is performed as described byBaker et al.,11 using a least-squares merit function defined as
where νiexp are the experimental frequencies andνi
calc(σHOOP)are the frequencies calculated on the basis of the scaled forcefield using σHOOP. The summation in eq 2 runs over allexperimental vibrational frequencies of all molecules of thetraining set. Minimization of thef(σHOOP) is done using aNewton-Raphson optimization algorithm. The gradient and theHessian matrix can be obtained by differentiating eq 2 withrespect to the scaling factorσHOOP. These quantities areevaluated in each optimization step. Convergence is consideredto be achieved when the changes of theσHOOP scaling factorare smaller than 1‚10-3.
Geometry optimization, force constants, as well as dipolemoment and the polarizability derivatives calculation wereperformed using the program packageGaussian03.12 Programsdeveloped in our laboratory were employed for the normal-modeanalysis as well as for the evaluation of Raman intensities andthe optimization of the force field scaling factor.3
The matrix elements of the dipole moment and the polariz-ability derivatives which determine the IR and Raman intensitieswere evaluated using the program packageGaussian03. For off-resonance excitation, the Raman intensitiesIRa,i of a normalmodei with frequencyνi is given by eq 3
whereR′ andγ′ are the derivatives of the mean polarizabilityR and its anisotropyγ with respect to the normal modei. Thisequation refers to a setup where the incident light is in thex-direction, being linearly polarized in thez-direction, and thescattered light is observed in they-direction.
Experimental Methods. RR spectra of PCBE,R-CPC, andphytochrome were measured with 1064-nm excitation asdescribed previously.13 The preparation of the C-15 deuteratedPCB isotopomer and the vibrational analysis of its phytochromeadduct (65-kDa fragment of phyA from oat) will be describedin detail elsewhere.
Results and Discussion
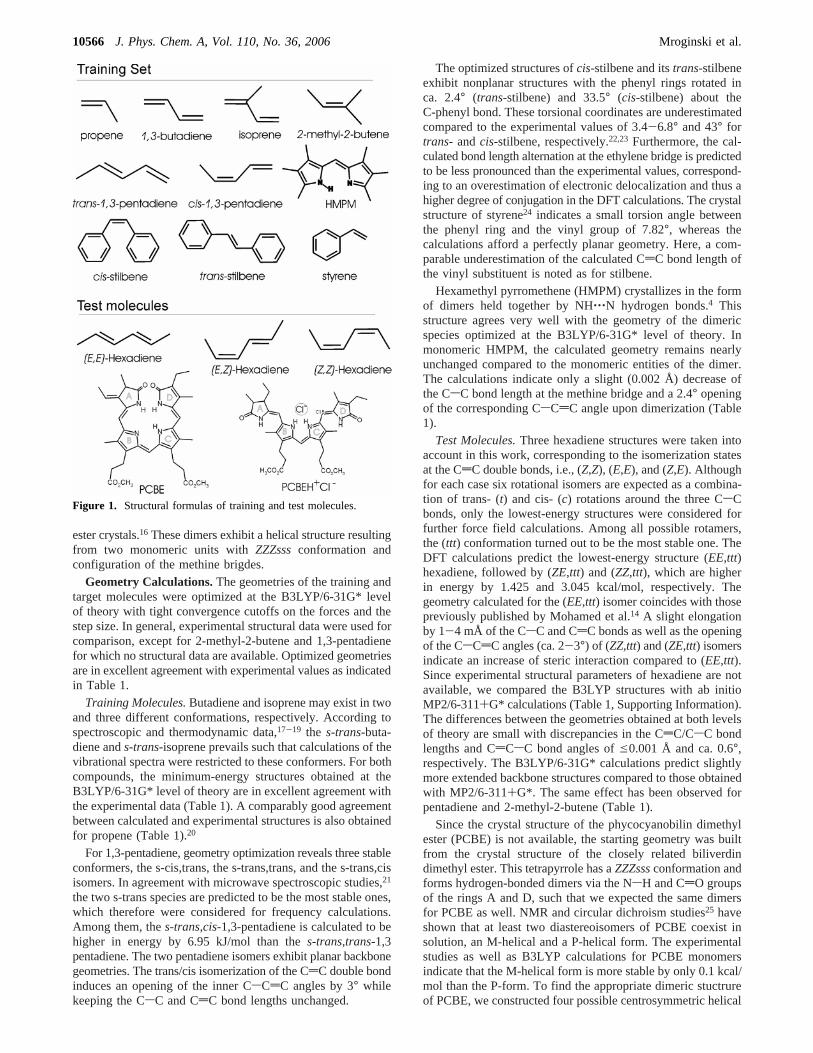
Selection of Training and Test Molecules.The hierarchyof the molecules constituting the benchmarks of the project isillustrated in Figure 1. The training molecules serve for thedetermination of a scaling factor for the ethylenic HOOP internalcoordinate,σHOOP, which then will be added to a set oftransferable scaling factors and applied to the test molecules.All the training molecules include at least one ethylenic CHgroup. In addition, the compounds had to fulfill two criteria.First, only those compounds have been chosen for whichaccurate structural data are available as a criterion for checkingthe goodness of the quantum mechanical geometry optimization.Second, the experimental infrared and Raman spectra of thecompounds must refer to well-defined states (preferentiallymonomeric states) and must possess a sufficient quality as aprerequisite for a safe vibrational assignment and thus for thedetermination of an accurate value for the scaling factor. In thisway, we have selected eight different compounds: butadiene,propene, isoprene, pentadiene, 2-methyl-2-butene, styrene, stil-bene, and hexamethylpyrromethene (HMPM). Among thembutadiene, propene, and HMPM have been used in previousscaling factor optimization procedures.3,4,11
The test molecules include 2,4-hexadiene, phycocyanobilindimethylester (PCBE), and the protein-bound phycocyanobilin(PCB) of theR-subunit of C-phycocyanin ofMastigocladuslaminosus(R-CPC).13 Hexadiene is taken as an example of linearconjugated polyenes. Polyenes constitute fundamental buildingblocks of the chromophoric groups of many relevant biologicalproteins, such as retinals in rhodopsins or carotenoids inphotosynthetic proteins. The vibrational properties of hexadienehave been extensively studied by Mohamed et al.14 PCBE andthe protein-bound PCB are linear tetrapyrroles in two differentconformations. For both tetrapyrroles, three-dimensional struc-ture data can either be derived from experimental studies onrelated compounds or have been determined directly. BothPCBE and PCB inR-CPC may be considered ideal testmolecules, since they are closely related to the target molecules,i.e., phytochrome cofactors, which includes tetrapyrrolic chro-mophores of a priori unknown configuration and conformation.
The crystal structure ofR-CPC reveals a protonated PCBchromophore (PCBH+) in an extendedZZZasaconfiguration.15
Vibrational data of the protein-bound chromophore are availableby means of RR spectroscopy.13 In contrast, PCBE in organicsolvents and in the solid state most likely forms dimers viahydrogen bond interactions involving the carbonyl functions andthe NH groups of the terminal pyrrolidone and/or pyrrolonerings, as has been previously observed in biliverdin dimethyl-
(Fij)σ ) xσi(Fij)xσj (1)
f(σHOOP) ) xΣ[νiexp - νi
calc(σHOOP)]2 (2)
IRa,i ∝ [45(R′)2 + 7(γ′)2](ν0 - νi)
4
νi[1 - exp(-hνi
kT)](3)
Vibrational Spectra of Linear Tetrapyrroles J. Phys. Chem. A, Vol. 110, No. 36, 200610565
ester crystals.16 These dimers exhibit a helical structure resultingfrom two monomeric units withZZZsssconformation andconfiguration of the methine brigdes.
Geometry Calculations.The geometries of the training andtarget molecules were optimized at the B3LYP/6-31G* levelof theory with tight convergence cutoffs on the forces and thestep size. In general, experimental structural data were used forcomparison, except for 2-methyl-2-butene and 1,3-pentadienefor which no structural data are available. Optimized geometriesare in excellent agreement with experimental values as indicatedin Table 1.
Training Molecules.Butadiene and isoprene may exist in twoand three different conformations, respectively. According tospectroscopic and thermodynamic data,17-19 the s-trans-buta-diene ands-trans-isoprene prevails such that calculations of thevibrational spectra were restricted to these conformers. For bothcompounds, the minimum-energy structures obtained at theB3LYP/6-31G* level of theory are in excellent agreement withthe experimental data (Table 1). A comparably good agreementbetween calculated and experimental structures is also obtainedfor propene (Table 1).20
For 1,3-pentadiene, geometry optimization reveals three stableconformers, the s-cis,trans, the s-trans,trans, and the s-trans,cisisomers. In agreement with microwave spectroscopic studies,21
the two s-trans species are predicted to be the most stable ones,which therefore were considered for frequency calculations.Among them, thes-trans,cis-1,3-pentadiene is calculated to behigher in energy by 6.95 kJ/mol than thes-trans,trans-1,3pentadiene. The two pentadiene isomers exhibit planar backbonegeometries. The trans/cis isomerization of the CdC double bondinduces an opening of the inner CsCdC angles by 3° whilekeeping the CsC and CdC bond lengths unchanged.
The optimized structures ofcis-stilbene and itstrans-stilbeneexhibit nonplanar structures with the phenyl rings rotated inca. 2.4° (trans-stilbene) and 33.5° (cis-stilbene) about theC-phenyl bond. These torsional coordinates are underestimatedcompared to the experimental values of 3.4-6.8° and 43° fortrans- andcis-stilbene, respectively.22,23 Furthermore, the cal-culated bond length alternation at the ethylene bridge is predictedto be less pronounced than the experimental values, correspond-ing to an overestimation of electronic delocalization and thus ahigher degree of conjugation in the DFT calculations. The crystalstructure of styrene24 indicates a small torsion angle betweenthe phenyl ring and the vinyl group of 7.82°, whereas thecalculations afford a perfectly planar geometry. Here, a com-parable underestimation of the calculated CdC bond length ofthe vinyl substituent is noted as for stilbene.
Hexamethyl pyrromethene (HMPM) crystallizes in the formof dimers held together by NH‚‚‚N hydrogen bonds.4 Thisstructure agrees very well with the geometry of the dimericspecies optimized at the B3LYP/6-31G* level of theory. Inmonomeric HMPM, the calculated geometry remains nearlyunchanged compared to the monomeric entities of the dimer.The calculations indicate only a slight (0.002 Å) decrease ofthe CsC bond length at the methine bridge and a 2.4° openingof the corresponding CsCdC angle upon dimerization (Table1).
Test Molecules.Three hexadiene structures were taken intoaccount in this work, corresponding to the isomerization statesat the CdC double bonds, i.e., (Z,Z), (E,E), and (Z,E). Althoughfor each case six rotational isomers are expected as a combina-tion of trans- (t) and cis- (c) rotations around the three CsCbonds, only the lowest-energy structures were considered forfurther force field calculations. Among all possible rotamers,the (ttt) conformation turned out to be the most stable one. TheDFT calculations predict the lowest-energy structure (EE,ttt)hexadiene, followed by (ZE,ttt) and (ZZ,ttt), which are higherin energy by 1.425 and 3.045 kcal/mol, respectively. Thegeometry calculated for the (EE,ttt) isomer coincides with thosepreviously published by Mohamed et al.14 A slight elongationby 1-4 mÅ of the CsC and CdC bonds as well as the openingof the CsCdC angles (ca. 2-3°) of (ZZ,ttt) and (ZE,ttt) isomersindicate an increase of steric interaction compared to (EE,ttt).Since experimental structural parameters of hexadiene are notavailable, we compared the B3LYP structures with ab initioMP2/6-311+G* calculations (Table 1, Supporting Information).The differences between the geometries obtained at both levelsof theory are small with discrepancies in the CdC/CsC bondlengths and CdCsC bond angles ofe0.001 Å and ca. 0.6°,respectively. The B3LYP/6-31G* calculations predict slightlymore extended backbone structures compared to those obtainedwith MP2/6-311+G*. The same effect has been observed forpentadiene and 2-methyl-2-butene (Table 1).
Since the crystal structure of the phycocyanobilin dimethylester (PCBE) is not available, the starting geometry was builtfrom the crystal structure of the closely related biliverdindimethyl ester. This tetrapyrrole has aZZZsssconformation andforms hydrogen-bonded dimers via the NsH and CdO groupsof the rings A and D, such that we expected the same dimersfor PCBE as well. NMR and circular dichroism studies25 haveshown that at least two diastereoisomers of PCBE coexist insolution, an M-helical and a P-helical form. The experimentalstudies as well as B3LYP calculations for PCBE monomersindicate that the M-helical form is more stable by only 0.1 kcal/mol than the P-form. To find the appropriate dimeric stuctrureof PCBE, we constructed four possible centrosymmetric helical
Figure 1. Structural formulas of training and test molecules.
10566 J. Phys. Chem. A, Vol. 110, No. 36, 2006 Mroginski et al.
dimers by combining the M-helical monomeric units, each withtwo possible tautomeric states, i.e., one with a pyrrolic B-ringand the other one with a pyrrolic C-ring. Geometry optimizationof these structures at the B3LYP/6-31G* level of theoryindicates that the most stable conformation corresponds to aC-pyrrolic tail-to-tail dimer (DD dimer), followed by theB-pyrrolic head-to-head dimer (AA dimer) that is higher inenergy by 3.19 kcal/mol. The two remaining conformations,the C-pyrrolic head-to-head and the B-pyrrolic tail-to-tail dimers,are predicted to exhibit energies that are higher by 7.55 and7.76 kcal/mol, respectively.
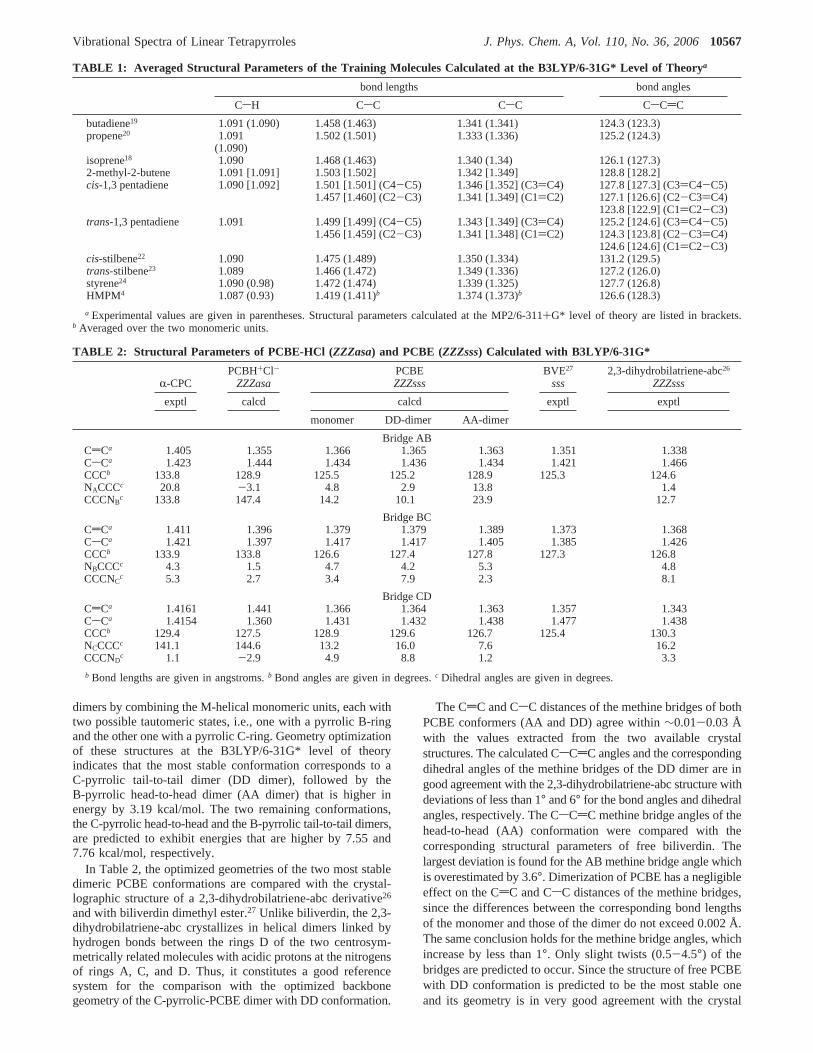
In Table 2, the optimized geometries of the two most stabledimeric PCBE conformations are compared with the crystal-lographic structure of a 2,3-dihydrobilatriene-abc derivative26
and with biliverdin dimethyl ester.27 Unlike biliverdin, the 2,3-dihydrobilatriene-abc crystallizes in helical dimers linked byhydrogen bonds between the rings D of the two centrosym-metrically related molecules with acidic protons at the nitrogensof rings A, C, and D. Thus, it constitutes a good referencesystem for the comparison with the optimized backbonegeometry of the C-pyrrolic-PCBE dimer with DD conformation.
The CdC and CsC distances of the methine bridges of bothPCBE conformers (AA and DD) agree within∼0.01-0.03 Åwith the values extracted from the two available crystalstructures. The calculated CsCdC angles and the correspondingdihedral angles of the methine bridges of the DD dimer are ingood agreement with the 2,3-dihydrobilatriene-abc structure withdeviations of less than 1° and 6° for the bond angles and dihedralangles, respectively. The CsCdC methine bridge angles of thehead-to-head (AA) conformation were compared with thecorresponding structural parameters of free biliverdin. Thelargest deviation is found for the AB methine bridge angle whichis overestimated by 3.6°. Dimerization of PCBE has a negligibleeffect on the CdC and CsC distances of the methine bridges,since the differences between the corresponding bond lengthsof the monomer and those of the dimer do not exceed 0.002 Å.The same conclusion holds for the methine bridge angles, whichincrease by less than 1°. Only slight twists (0.5-4.5°) of thebridges are predicted to occur. Since the structure of free PCBEwith DD conformation is predicted to be the most stable oneand its geometry is in very good agreement with the crystal
TABLE 1: Averaged Structural Parameters of the Training Molecules Calculated at the B3LYP/6-31G* Level of Theorya
bond lengths bond angles
CsH CsC CsC CsCdC
butadiene19 1.091 (1.090) 1.458 (1.463) 1.341 (1.341) 124.3 (123.3)propene20 1.091 1.502 (1.501) 1.333 (1.336) 125.2 (124.3)
(1.090)isoprene18 1.090 1.468 (1.463) 1.340 (1.34) 126.1 (127.3)2-methyl-2-butene 1.091 [1.091] 1.503 [1.502] 1.342 [1.349] 128.8 [128.2]cis-1,3 pentadiene 1.090 [1.092] 1.501 [1.501] (C4-C5) 1.346 [1.352] (C3)C4) 127.8 [127.3] (C3)C4-C5)
1.457 [1.460] (C2-C3) 1.341 [1.349] (C1)C2) 127.1 [126.6] (C2-C3)C4)123.8 [122.9] (C1)C2-C3)
trans-1,3 pentadiene 1.091 1.499 [1.499] (C4-C5) 1.343 [1.349] (C3)C4) 125.2 [124.6] (C3)C4-C5)1.456 [1.459] (C2-C3) 1.341 [1.348] (C1)C2) 124.3 [123.8] (C2-C3)C4)
124.6 [124.6] (C1)C2-C3)cis-stilbene22 1.090 1.475 (1.489) 1.350 (1.334) 131.2 (129.5)trans-stilbene23 1.089 1.466 (1.472) 1.349 (1.336) 127.2 (126.0)styrene24 1.090 (0.98) 1.472 (1.474) 1.339 (1.325) 127.7 (126.8)HMPM4 1.087 (0.93) 1.419 (1.411)b 1.374 (1.373)b 126.6 (128.3)
a Experimental values are given in parentheses. Structural parameters calculated at the MP2/6-311+G* level of theory are listed in brackets.b Averaged over the two monomeric units.
TABLE 2: Structural Parameters of PCBE-HCl ( ZZZasa) and PCBE (ZZZsss) Calculated with B3LYP/6-31G*
R-CPCPCBH+Cl-
ZZZasaPCBEZZZsss
BVE27
sss2,3-dihydrobilatriene-abc26
ZZZsss
exptl calcd calcd exptl exptl
monomer DD-dimer AA-dimer
Bridge ABCdCa 1.405 1.355 1.366 1.365 1.363 1.351 1.338CsCa 1.423 1.444 1.434 1.436 1.434 1.421 1.466CCCb 133.8 128.9 125.5 125.2 128.9 125.3 124.6NACCCc 20.8 -3.1 4.8 2.9 13.8 1.4CCCNB
c 133.8 147.4 14.2 10.1 23.9 12.7
Bridge BCCdCa 1.411 1.396 1.379 1.379 1.389 1.373 1.368CsCa 1.421 1.397 1.417 1.417 1.405 1.385 1.426CCCb 133.9 133.8 126.6 127.4 127.8 127.3 126.8NBCCCc 4.3 1.5 4.7 4.2 5.3 4.8CCCNC
c 5.3 2.7 3.4 7.9 2.3 8.1
Bridge CDCdCa 1.4161 1.441 1.366 1.364 1.363 1.357 1.343CsCa 1.4154 1.360 1.431 1.432 1.438 1.477 1.438CCCb 129.4 127.5 128.9 129.6 126.7 125.4 130.3NCCCCc 141.1 144.6 13.2 16.0 7.6 16.2CCCND
c 1.1 -2.9 4.9 8.8 1.2 3.3
b Bond lengths are given in angstroms.b Bond angles are given in degrees.c Dihedral angles are given in degrees.
Vibrational Spectra of Linear Tetrapyrroles J. Phys. Chem. A, Vol. 110, No. 36, 200610567
structure closely related compounds, we have chosen thisgeometry for further force field calculations.
For the geometry optimization of PCBE with the protonated(cationic)ZZZasaconformation, the starting geometry was takenfrom the crystal structure ofR-CPC,15 where the tetrapyrrole isembedded in the protein matrix with a carboxylate side chainof Asp87 located near rings B and C. In the present calculations,these interactions were mimicked by placing a chloride coun-terion between rings B and C, and the covalent linkage to theprotein was replaced by a hydrogen link atom. The propionateside chains were modeled with methyl ester groups in order toavoid intramolecular hydrogen-bonding interactions with thepyrrole nitrogens of rings A and D. Since the geometryoptimization of PCBEH+Cl- was carried out from the tetrapy-rrole in vacuo, the resulting geometry withZZZasaconfigurationis slightly distorted in comparison to the crystallographicstructure of the protein-bounded chromophore. The methinebridges of the optimized structure are less twisted than in theprotein, indicating that the apoprotein plays an important rolein sterically locking the chromophore. Furthermore, the opti-mized structure of the model compound shows a slight increaseof the single/double-bond length alternation at the AB and CDmethine bridges accompanied by a closing of the correspondingCdCsC angles, reflecting a decrease of electronic conjugation(Table 2). The optimized structural parameters of the centralBC methine bridge are in close agreement with the crystal-lographic values. Deviations are on the order of 0.01 Å for theCdC and CsC bond lengths and less than 1° for the CdCsCangle.
Optimization of a Force Field Scaling Factor for theEthylenic CH Out-of-Plane Coordinate. The vibrationalspectra of the training set molecules were initially calculatedusing the standard set of force field scaling factor optimizedby Magdo et al.3 Due to strong coupling with CH3 rocking (rock)and CH2 wagging (wag) deformations, the HOOP coordinatesare spread among several modes in a wide frequency rangebetween 200 and 1000 cm-1. Furthermore, most of thesevibrations are mixed with torsional deformation around the-CdC- anddCsC- bonds (Tables 1-8, Supporting Information).
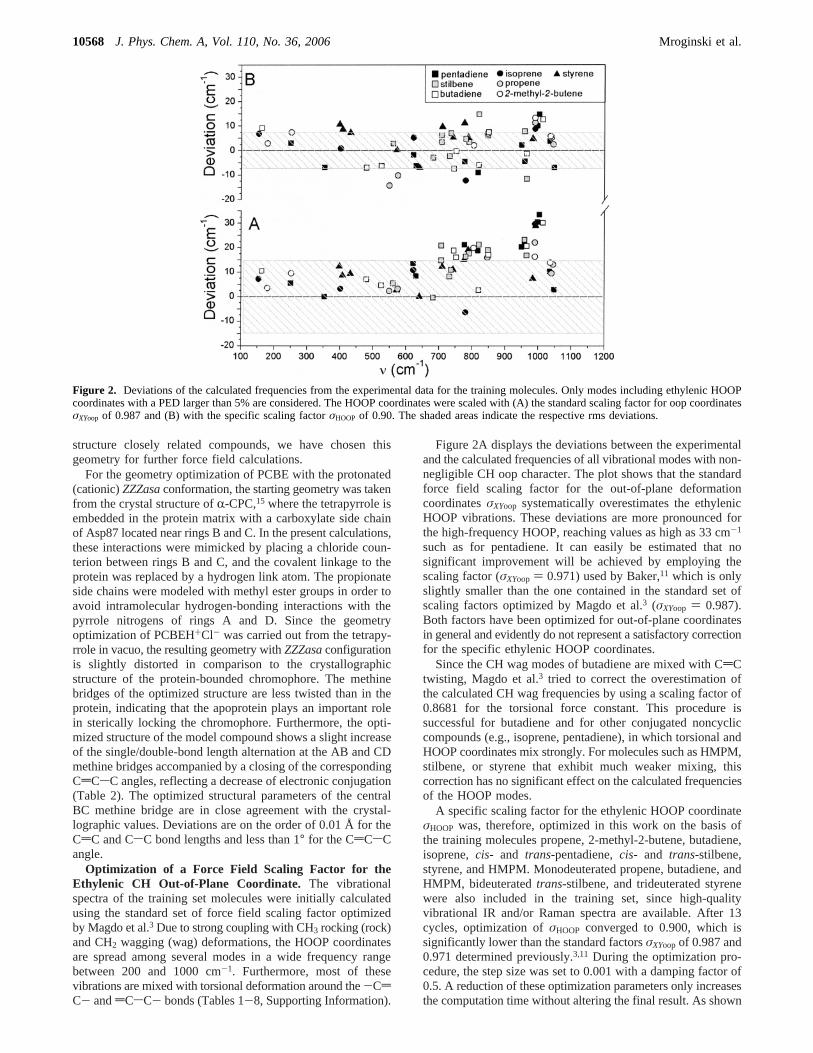
Figure 2A displays the deviations between the experimentaland the calculated frequencies of all vibrational modes with non-negligible CH oop character. The plot shows that the standardforce field scaling factor for the out-of-plane deformationcoordinatesσXYoop systematically overestimates the ethylenicHOOP vibrations. These deviations are more pronounced forthe high-frequency HOOP, reaching values as high as 33 cm-1
such as for pentadiene. It can easily be estimated that nosignificant improvement will be achieved by employing thescaling factor (σXYoop ) 0.971) used by Baker,11 which is onlyslightly smaller than the one contained in the standard set ofscaling factors optimized by Magdo et al.3 (σXYoop ) 0.987).Both factors have been optimized for out-of-plane coordinatesin general and evidently do not represent a satisfactory correctionfor the specific ethylenic HOOP coordinates.
Since the CH wag modes of butadiene are mixed with CdCtwisting, Magdo et al.3 tried to correct the overestimation ofthe calculated CH wag frequencies by using a scaling factor of0.8681 for the torsional force constant. This procedure issuccessful for butadiene and for other conjugated noncycliccompounds (e.g., isoprene, pentadiene), in which torsional andHOOP coordinates mix strongly. For molecules such as HMPM,stilbene, or styrene that exhibit much weaker mixing, thiscorrection has no significant effect on the calculated frequenciesof the HOOP modes.
A specific scaling factor for the ethylenic HOOP coordinateσHOOP was, therefore, optimized in this work on the basis ofthe training molecules propene, 2-methyl-2-butene, butadiene,isoprene,cis- and trans-pentadiene,cis- and trans-stilbene,styrene, and HMPM. Monodeuterated propene, butadiene, andHMPM, bideuteratedtrans-stilbene, and trideuterated styrenewere also included in the training set, since high-qualityvibrational IR and/or Raman spectra are available. After 13cycles, optimization ofσHOOP converged to 0.900, which issignificantly lower than the standard factorsσXYoop of 0.987 and0.971 determined previously.3,11 During the optimization pro-cedure, the step size was set to 0.001 with a damping factor of0.5. A reduction of these optimization parameters only increasesthe computation time without altering the final result. As shown
Figure 2. Deviations of the calculated frequencies from the experimental data for the training molecules. Only modes including ethylenic HOOPcoordinates with a PED larger than 5% are considered. The HOOP coordinates were scaled with (A) the standard scaling factor for oop coordinatesσXYoop of 0.987 and (B) with the specific scaling factorσHOOP of 0.90. The shaded areas indicate the respective rms deviations.
10568 J. Phys. Chem. A, Vol. 110, No. 36, 2006 Mroginski et al.
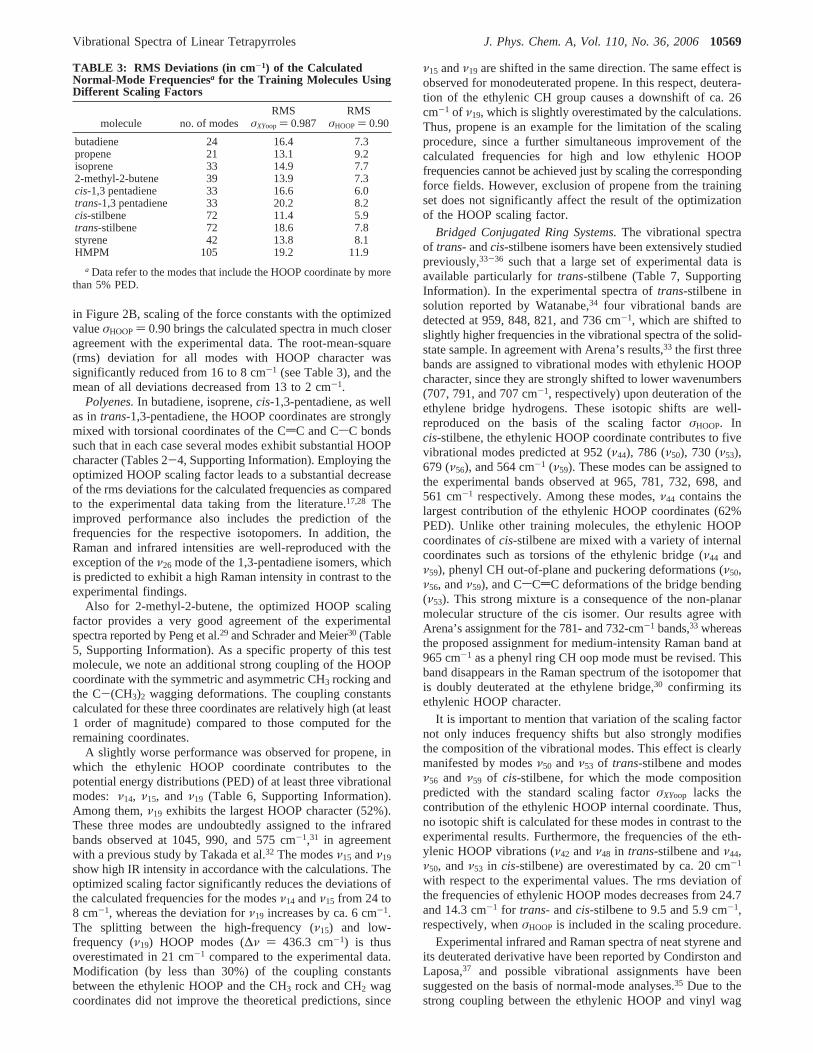
in Figure 2B, scaling of the force constants with the optimizedvalueσHOOP) 0.90 brings the calculated spectra in much closeragreement with the experimental data. The root-mean-square(rms) deviation for all modes with HOOP character wassignificantly reduced from 16 to 8 cm-1 (see Table 3), and themean of all deviations decreased from 13 to 2 cm-1.
Polyenes.In butadiene, isoprene,cis-1,3-pentadiene, as wellas intrans-1,3-pentadiene, the HOOP coordinates are stronglymixed with torsional coordinates of the CdC and CsC bondssuch that in each case several modes exhibit substantial HOOPcharacter (Tables 2-4, Supporting Information). Employing theoptimized HOOP scaling factor leads to a substantial decreaseof the rms deviations for the calculated frequencies as comparedto the experimental data taking from the literature.17,28 Theimproved performance also includes the prediction of thefrequencies for the respective isotopomers. In addition, theRaman and infrared intensities are well-reproduced with theexception of theν26 mode of the 1,3-pentadiene isomers, whichis predicted to exhibit a high Raman intensity in contrast to theexperimental findings.
Also for 2-methyl-2-butene, the optimized HOOP scalingfactor provides a very good agreement of the experimentalspectra reported by Peng et al.29 and Schrader and Meier30 (Table5, Supporting Information). As a specific property of this testmolecule, we note an additional strong coupling of the HOOPcoordinate with the symmetric and asymmetric CH3 rocking andthe C-(CH3)2 wagging deformations. The coupling constantscalculated for these three coordinates are relatively high (at least1 order of magnitude) compared to those computed for theremaining coordinates.
A slightly worse performance was observed for propene, inwhich the ethylenic HOOP coordinate contributes to thepotential energy distributions (PED) of at least three vibrationalmodes: ν14, ν15, and ν19 (Table 6, Supporting Information).Among them,ν19 exhibits the largest HOOP character (52%).These three modes are undoubtedly assigned to the infraredbands observed at 1045, 990, and 575 cm-1,31 in agreementwith a previous study by Takada et al.32 The modesν15 andν19
show high IR intensity in accordance with the calculations. Theoptimized scaling factor significantly reduces the deviations ofthe calculated frequencies for the modesν14 andν15 from 24 to8 cm-1, whereas the deviation forν19 increases by ca. 6 cm-1.The splitting between the high-frequency (ν15) and low-frequency (ν19) HOOP modes (∆ν ) 436.3 cm-1) is thusoverestimated in 21 cm-1 compared to the experimental data.Modification (by less than 30%) of the coupling constantsbetween the ethylenic HOOP and the CH3 rock and CH2 wagcoordinates did not improve the theoretical predictions, since
ν15 andν19 are shifted in the same direction. The same effect isobserved for monodeuterated propene. In this respect, deutera-tion of the ethylenic CH group causes a downshift of ca. 26cm-1 of ν19, which is slightly overestimated by the calculations.Thus, propene is an example for the limitation of the scalingprocedure, since a further simultaneous improvement of thecalculated frequencies for high and low ethylenic HOOPfrequencies cannot be achieved just by scaling the correspondingforce fields. However, exclusion of propene from the trainingset does not significantly affect the result of the optimizationof the HOOP scaling factor.
Bridged Conjugated Ring Systems.The vibrational spectraof trans- andcis-stilbene isomers have been extensively studiedpreviously,33-36 such that a large set of experimental data isavailable particularly fortrans-stilbene (Table 7, SupportingInformation). In the experimental spectra oftrans-stilbene insolution reported by Watanabe,34 four vibrational bands aredetected at 959, 848, 821, and 736 cm-1, which are shifted toslightly higher frequencies in the vibrational spectra of the solid-state sample. In agreement with Arena’s results,33 the first threebands are assigned to vibrational modes with ethylenic HOOPcharacter, since they are strongly shifted to lower wavenumbers(707, 791, and 707 cm-1, respectively) upon deuteration of theethylene bridge hydrogens. These isotopic shifts are well-reproduced on the basis of the scaling factorσHOOP. Incis-stilbene, the ethylenic HOOP coordinate contributes to fivevibrational modes predicted at 952 (ν44), 786 (ν50), 730 (ν53),679 (ν56), and 564 cm-1 (ν59). These modes can be assigned tothe experimental bands observed at 965, 781, 732, 698, and561 cm-1 respectively. Among these modes,ν44 contains thelargest contribution of the ethylenic HOOP coordinates (62%PED). Unlike other training molecules, the ethylenic HOOPcoordinates ofcis-stilbene are mixed with a variety of internalcoordinates such as torsions of the ethylenic bridge (ν44 andν59), phenyl CH out-of-plane and puckering deformations (ν50,ν56, andν59), and CsCdC deformations of the bridge bending(ν53). This strong mixture is a consequence of the non-planarmolecular structure of the cis isomer. Our results agree withArena’s assignment for the 781- and 732-cm-1 bands,33 whereasthe proposed assignment for medium-intensity Raman band at965 cm-1 as a phenyl ring CH oop mode must be revised. Thisband disappears in the Raman spectrum of the isotopomer thatis doubly deuterated at the ethylene bridge,30 confirming itsethylenic HOOP character.
It is important to mention that variation of the scaling factornot only induces frequency shifts but also strongly modifiesthe composition of the vibrational modes. This effect is clearlymanifested by modesν50 andν53 of trans-stilbene and modesν56 and ν59 of cis-stilbene, for which the mode compositionpredicted with the standard scaling factorσXYoop lacks thecontribution of the ethylenic HOOP internal coordinate. Thus,no isotopic shift is calculated for these modes in contrast to theexperimental results. Furthermore, the frequencies of the eth-ylenic HOOP vibrations (ν42 andν48 in trans-stilbene andν44,ν50, andν53 in cis-stilbene) are overestimated by ca. 20 cm-1
with respect to the experimental values. The rms deviation ofthe frequencies of ethylenic HOOP modes decreases from 24.7and 14.3 cm-1 for trans- andcis-stilbene to 9.5 and 5.9 cm-1,respectively, whenσHOOP is included in the scaling procedure.
Experimental infrared and Raman spectra of neat styrene andits deuterated derivative have been reported by Condirston andLaposa,37 and possible vibrational assignments have beensuggested on the basis of normal-mode analyses.35 Due to thestrong coupling between the ethylenic HOOP and vinyl wag
TABLE 3: RMS Deviations (in cm-1) of the CalculatedNormal-Mode Frequenciesa for the Training Molecules UsingDifferent Scaling Factors
molecule no. of modesRMS
σXYoop ) 0.987RMS
σHOOP) 0.90
butadiene 24 16.4 7.3propene 21 13.1 9.2isoprene 33 14.9 7.72-methyl-2-butene 39 13.9 7.3cis-1,3 pentadiene 33 16.6 6.0trans-1,3 pentadiene 33 20.2 8.2cis-stilbene 72 11.4 5.9trans-stilbene 72 18.6 7.8styrene 42 13.8 8.1HMPM 105 19.2 11.9
a Data refer to the modes that include the HOOP coordinate by morethan 5% PED.
Vibrational Spectra of Linear Tetrapyrroles J. Phys. Chem. A, Vol. 110, No. 36, 200610569
deformation coordinates, the present calculations predict at leastfive vibrational modes with non-negligible ethylenic HOOPdeformation nature at 1003 cm-1 (ν24), 988 cm-1 (ν25), 787 cm-1
(ν31), 633 cm-1 (ν34), and 438 cm-1 (ν38) (Table 8, SupportingInformation). On the basis of the predicted intensities,ν24 andν25 are unambiguously assigned to the strong IR band observedat 992 cm-1 and its shoulder at 983 cm-1, respectively. In asimilar way,ν31 is attributed to the very strong infrared banddetected at 776 cm-1. Becauseν34 and ν38 are predicted toexhibit moderate Raman intensity, they are assigned to theRaman bands observed at 640 and 442 cm-1, respectively. Onlyone pure vinyl wag deformation mode (ν29) is calculated at 915cm-1 with very strong IR intensity, such that it is assigned tothe intense IR band observed at 909 cm-1. Deuteration of theethyl and vinyl hydrogens causes a downshift of these fivebands. The absolute frequencies as well as these isotopic shiftsare accurately reproduced by the calculations, in which onlythe ethylenic HOOP coordinate was scaled withσHOOP, whereasfor the C-H oop coordinates of the phenyl and vinyl groups,the standard scaling factorσXYoop was employed. In this way,the rms deviation of the frequencies of ethylenic HOOP modesof styrene and its deuterated derivative is reduced by a factorof 2.
The vibrational spectra of monomeric and dimeric HMPMhave been analyzed in detail previously.4 Employing thestandard scaling factorσXYoop leads to an overestimation by ca.20 cm-1 of the HOOP mode observed at 888 cm-1. Unlike other
training molecules, the HOOP coordinate of HMPM monomeris concentrated in a single mode (ν67) with more than 70% PED.When this internal coordinate is scaled withσHOOP instead ofσXYoop, the frequency ofν67 (878 cm-1) more closely approachesthe experimental value. The same effect is observed forν69 ofHMPM-CD detected at 759 cm-1 and calculated at 751 cm-1
with 50% of CD oop character. The isotopic shift of 129 cm-1
resulting from H/D substitution at the methine bridge is wellreproduced.
From the analysis of the calculated and experimental vibra-tional spectra of all test molecules, several common featureshave been noted. First, in conjugated noncyclic systems as wellas in styrene, the HOOP coordinate appears to be stronglycoupled to wagging deformations of the terminal vinyl groupsand to rocking deformations of neighboring methyl groups. Thisis indicated by the corresponding coupling constants, which areat least 1 order of magnitude higher than other couplingconstants. Second, the Raman intensities of the HOOP modes(e.g.,ν20 of butadiene,ν30 andν33 of isoprene,ν26 of cis- andtrans-pentadiene, andν34 and ν38 of styrene) are generallyoverestimated. This effect is particularly pronounced for propenewhereν19 (52% HOOP character) is predicted to be one of themost intense Raman bands, in contrast to the experimentalfindings. The agreement between calculated and experimentalRaman intensities is not improved upon increasing the level oftheory, as previously suggested by Stirling (Table 9, SupportingInformation).38 Including diffuse and polarization functions in
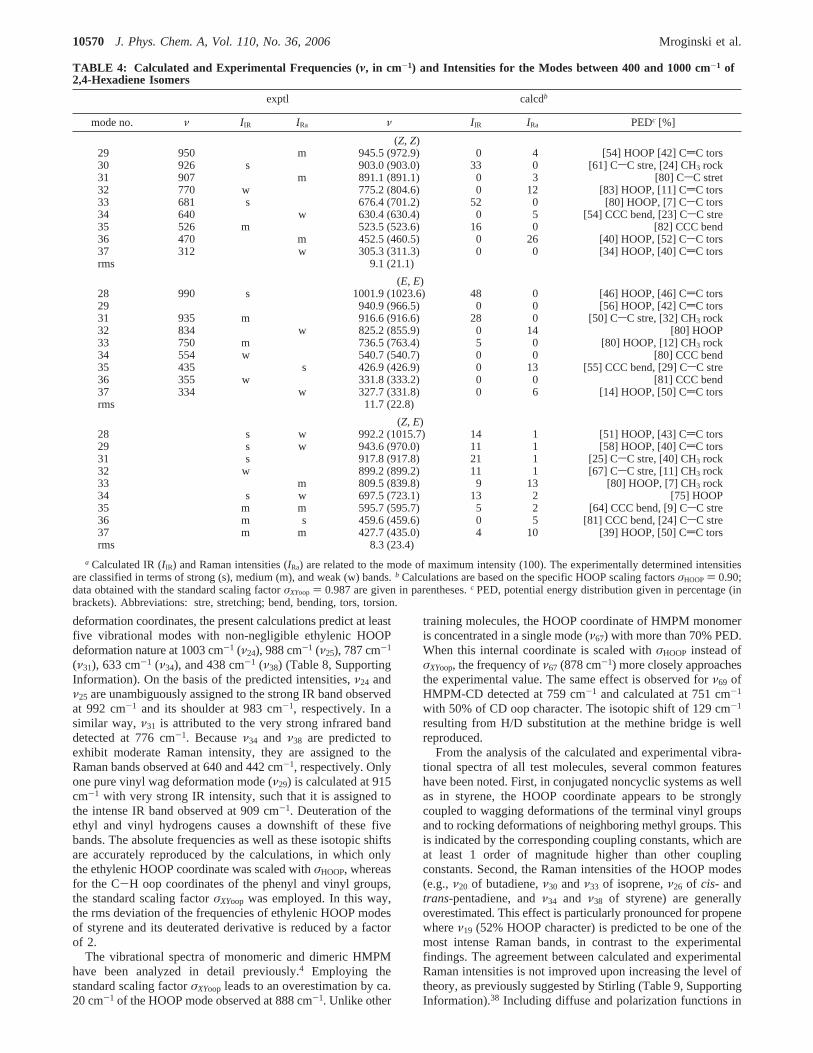
TABLE 4: Calculated and Experimental Frequencies (ν, in cm-1) and Intensities for the Modes between 400 and 1000 cm-1 of2,4-Hexadiene Isomers
exptl calcdb
mode no. ν I IR IRa ν I IR IRa PEDc [%]
(Z, Z)29 950 m 945.5 (972.9) 0 4 [54] HOOP [42] CdC tors30 926 s 903.0 (903.0) 33 0 [61] CsC stre, [24] CH3 rock31 907 m 891.1 (891.1) 0 3 [80] CsC stret32 770 w 775.2 (804.6) 0 12 [83] HOOP, [11] CdC tors33 681 s 676.4 (701.2) 52 0 [80] HOOP, [7] CsC tors34 640 w 630.4 (630.4) 0 5 [54] CCC bend, [23] CsC stre35 526 m 523.5 (523.6) 16 0 [82] CCC bend36 470 m 452.5 (460.5) 0 26 [40] HOOP, [52] CsC tors37 312 w 305.3 (311.3) 0 0 [34] HOOP, [40] CdC torsrms 9.1 (21.1)
(E, E)28 990 s 1001.9 (1023.6) 48 0 [46] HOOP, [46] CdC tors29 940.9 (966.5) 0 0 [56] HOOP, [42] CdC tors31 935 m 916.6 (916.6) 28 0 [50] CsC stre, [32] CH3 rock32 834 w 825.2 (855.9) 0 14 [80] HOOP33 750 m 736.5 (763.4) 5 0 [80] HOOP, [12] CH3 rock34 554 w 540.7 (540.7) 0 0 [80] CCC bend35 435 s 426.9 (426.9) 0 13 [55] CCC bend, [29] CsC stre36 355 w 331.8 (333.2) 0 0 [81] CCC bend37 334 w 327.7 (331.8) 0 6 [14] HOOP, [50] CdC torsrms 11.7 (22.8)
(Z, E)28 s w 992.2 (1015.7) 14 1 [51] HOOP, [43] CdC tors29 s w 943.6 (970.0) 11 1 [58] HOOP, [40] CdC tors31 s 917.8 (917.8) 21 1 [25] CsC stre, [40] CH3 rock32 w 899.2 (899.2) 11 1 [67] CsC stre, [11] CH3 rock33 m 809.5 (839.8) 9 13 [80] HOOP, [7] CH3 rock34 s w 697.5 (723.1) 13 2 [75] HOOP35 m m 595.7 (595.7) 5 2 [64] CCC bend, [9] CsC stre36 m s 459.6 (459.6) 0 5 [81] CCC bend, [24] CsC stre37 m m 427.7 (435.0) 4 10 [39] HOOP, [50] CdC torsrms 8.3 (23.4)
a Calculated IR (I IR) and Raman intensities (IRa) are related to the mode of maximum intensity (100). The experimentally determined intensitiesare classified in terms of strong (s), medium (m), and weak (w) bands.b Calculations are based on the specific HOOP scaling factorsσHOOP ) 0.90;data obtained with the standard scaling factorσXYoop ) 0.987 are given in parentheses.c PED, potential energy distribution given in percentage (inbrackets). Abbreviations: stre, stretching; bend, bending, tors, torsion.
10570 J. Phys. Chem. A, Vol. 110, No. 36, 2006 Mroginski et al.

the basis set strongly affects the Raman activities of low-frequency vibrational modes but does not lead to a uniformdecrease of the calculated Raman intensities. This failure is notrestricted to DFT but also noted for the MP2/6-31++g**calculations. Interestingly, the calculated Raman intensities ofthe HOOP modes of the remaining training molecules, stilbene,HMPM, and 2-methyl-2-butene, are consistent with the respec-tive experimental spectra.
Test and Target Molecules.Hexadiene.The HOOP coor-dinates contribute to the PEDs of five modes in a wide frequencyrange between 1000 and 300 cm-1, among which only twoinvolve more than 80% HOOP character. For the three hexa-diene conformers, the frequencies of these two modes arecalculated at between 700 and 750 cm-1 and 800-750 cm-1,which agree very well with the experimental data for the (Z,Z)(681 and 770 cm-1), (Z,E) (704 and 818 cm-1), and (E,E) (750and 834 cm-1) conformers (Table 4).39
The HOOP modes of the three isomers can be sorted intotwo main groups according to the frequencies above 600 cm-1
(group A) and below 600 cm-1 (group B). The standard scalingfactorσXYoop strongly overestimates the frequencies of group Awith deviations higher than 13 cm-1, whereas it slightlyunderestimates the frequencies of group B with a maximumdeviation of-9 cm-1 (Figure 3). Although scaling with thescaling factorσHOOP is only successful at the high-frequencyrange, there is a significant reduction of the rms deviation fromca. 22 to 9 cm-1. All hexadiene isomers studied in this workdisplay an overestimation of the calculated Raman activities ofthe HOOP modes as already discussed for noncyclic conjugatedtraining molecules (vide supra). The modesν32 of the (Z,Z) and(E,E) hexadiene isomers are calculated with considerable Ramanintensities in contradiction to the experimental spectrum. In thecase of the (Z,E) isomer, the Raman intensity pattern predictedbetween 900 and 400 cm-1 strongly deviates from the experi-mental spectra.39 Here, two relatively strong bands are predictedat 810 and 428 cm-1, and a much lower intensity is calculatedfor the mode at 460 cm-1. The experimental spectrum displaysone strong band at 465 cm-1 and two medium-intensity bandsat 818 and 438 cm-1.
Phycocyanobilin Dimethylester.The experimental RR spectraof PCBE and the PCB chromophore embedded in the proteinmatrix of R-CPC protein13,40 have been compared with the
calculated Raman spectra of PCBE withZZZsssconfigurationand the Raman spectra of PCBEH+Cl- with ZZZasaconfigu-ration, respectively. In the frequency range between 1000 and1700 cm-1, which is not affected by variation of the scalingfactor for HOOP coordinates, we note a very good agreementfor both tetrapyrroles in H2O and D2O (Figure 4). Note thatboth the frequencies and the intensities are well-reproduced eventhough the experimental spectra have been measured under pre-resonance conditions. Below 1000 cm-1, however, the properscaling of the HOOP coordinates has a pronounced effect onthe calculated spectra and provides an improved description ofthe experimental spectra (Figure 5).
DFT calculations of dimeric PCBE (ZZZsssconfiguration)using the standard set of force field scaling factors predict aprominent Raman band at 849 cm-1 which, as well as the muchweaker bands at 813 and 877 cm-1, exhibits significantcontributions of the HOOP coordinates (ca. 50%). The experi-mental Raman spectrum of PCBE shows a distinct albeit weak
Figure 3. Deviations of the calculated frequencies from the experi-mental data for hexadiene isomers considering only modes with HOOPcharacter with more than 5% PED. The HOOP coordinates were scaledwith the standard scaling factor for oop coordinatesσXYoop of 0.987(open circles) and with the specific scaling factorσHOOP of 0.90 (filledcircles). The shaded area indicates the rms deviation for the calculationsusingσHOOP.
Figure 4. Calculated Raman spectrum of (A) PCBEH+Cl- in theZZZasaconfiguration and (D) of the PCBE dimer in theZZZsssconfiguration in the frequency range from 1000 to 1700 cm-1. Traces(B) and (C) show the experimental RR ofR-CPC and solid PCBE,respectively. The gray dotted lines refer to the chromophores deuteratedat the pyrrole nitrogens.
Figure 5. Left column: calculated low-frequency Raman spectra ofPCBEH+Cl- in theZZZasaconfiguration using (C) the standard scalingfactor for oop coordinatesσXYoop of 0.987 and (A) the specific scalingfactorσHOOPof 0.90. The experimental RR spectrum ofR-CPC is shownin (B). Right column: calculated low-frequency Raman spectra of thePCBE dimer in theZZZsssconfiguration using (F) the standard scalingfactor for oop coordinatesσXYoop of 0.987 and (D) the specific scalingfactorσHOOPof 0.90. The experimental RR spectrum of PCBE is shownin (E).
Vibrational Spectra of Linear Tetrapyrroles J. Phys. Chem. A, Vol. 110, No. 36, 200610571

band at 802 cm-1, which thus is attributed to the mode at 849cm-1 despite the ca. 50-cm-1 deviation.
Upon introducing the HOOP scaling factorσHOOP, frequenciesof the modes between 900 and 780 cm-1 are substantially altered(Table 5). The 849 cm-1 mode including the HOOP mode ofthe C-D methine bridge is now calculated at 822 cm-1 (ν310)and predicted to exhibit a considerable Raman intensity suchthat the assignment to the experimental band at 802 cm-1 isstraightforward. Furthermore, in addition, the low-frequencyshoulder at 781 cm-1 in the experimental spectrum is now muchbetter matched by the calculated Raman-active modesν318 (790cm-1) andν316 (793 cm-1) that include the HOOP coordinateof the A-B methine bridge. Thus, the deviations from theexperimental frequencies are substantially reduced.
Protein-Bound Phycocyanobilin.For the protonatedZZZasaPCB in R-CPC, previous DFT calculations done using thestandard set of scaling factors have predicted several vibrationalmodes with non-negligible methine bridge HOOP character.40
Only for two of these modes has a significant Raman intensitybeen predicted, and their frequencies have been calculated tobe higher by more than 20 cm-1 than for the experimental bandat 818 cm-1 (Figure 5C). IncludingσHOOPalso causes alterationsof the PEDs for the normal modes in this region such that fourmodes instead of five possess appreciable contributions fromthe methine bridge HOOP coordinates. Now, the frequencydeviations are drastically reduced (Table 5). Specifically, themode ν162 (HOOP of C-D methine bridge) for which thehighest Raman intensity is calculated agrees very well with theprominent experimental band at 818 cm-1. The modes includingHOOP coordinates of the methine bridges A-B and B-Ccharacter (ν158, ν162, andν167) are calculated with low Ramanintensities such that an unambiguous assignment is not possible.
The Pr State of Phytochrome.The recent crystal structureanalysis of the chromophore-binding fragment of phytochrome
DrBphP from Deinococcus radioduranshas unambiguouslyrevealed aZZZssaconfiguration of the chromophore in theparent state Pr,41 which has been further shown to be protonatedin neutral aqueous solution (unpublished results). However, thereare indications that this configuration is only true for biliverdin-binding phytochromes, whereas, possibly due to the differentbinding site in the chromophore pocket, for PCB- and phyto-chromobilin-binding phytochromes such as phyA from plantsthe Pr chromophore appear to adopt a protonated (cationic)ZZZasaconfiguration.6 This conclusion has been derived fromthe analysis of the RR spectra in the spectral region between1200 and 1700 cm-1. Whereas in this region the calculationsagree very well with the experimental data, there are significantdiscrepancies in the region below 1000 cm-1. Calculations thatare based on the extended set of scaling factors includingσHOOP
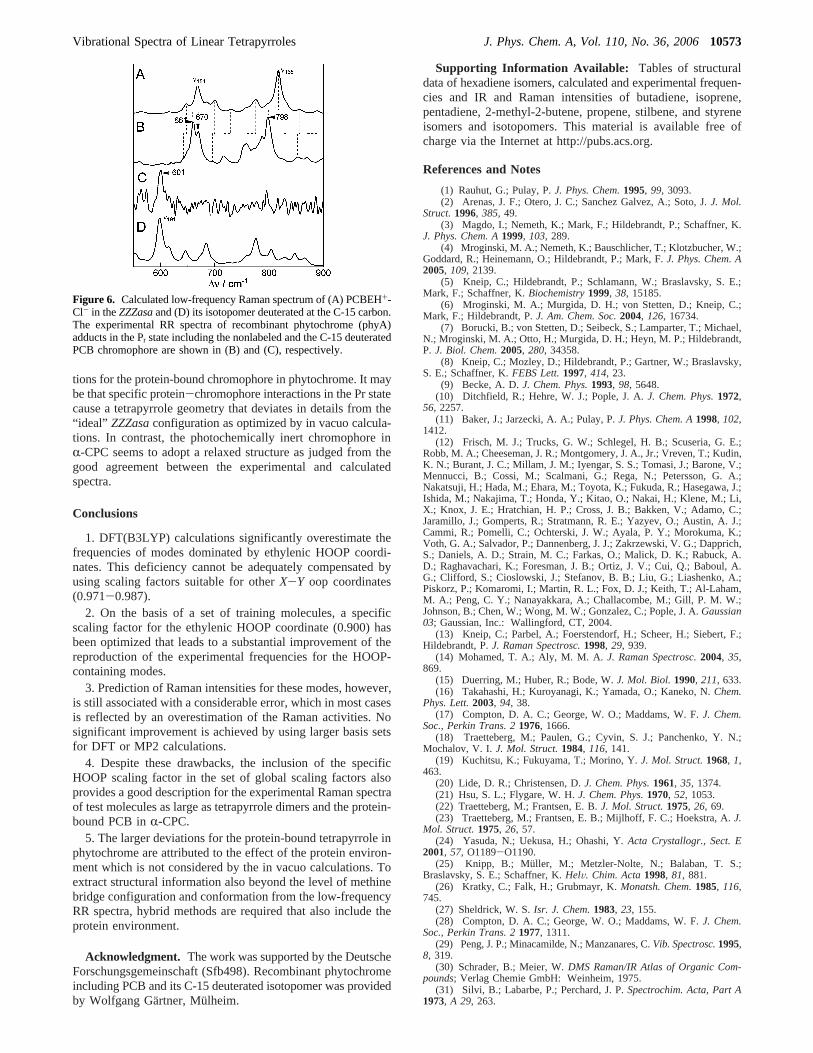
improve the description of the RR spectra between 600 and 900cm-1 (Figure 6), although the agreement is not as good as inthe case ofR-CPC. Such a discrepancy is not observed for theRR spectrum of the Pr state of the phyA adduct assembled withPCB, which is deuterated at the C-D methine bridge. For thisisotopomer, the C-D oop coordinate contributes to three closelyspaced modes of medium Raman intensity at 602, 601, and 598cm-1, which together lead to the most intense band in thecalculated spectrum below 1000 cm-1. The frequency of theresultant peak exactly coincides with the RR band observed at601 cm-1. This band is also the most intense band in theexperimental RR spectrum in this region, although, due to thepoor signal-to-noise ratio, further bands cannot be identified.This agreement as well as the good performance of thecalculations for the PCBE dimer andR-CPC rules out that aninadequate scaling factor for the HOOP coordinate is the originfor the insufficient reproduction of the experimental RRspectrum of Pr spectra below 1000 cm-1. Instead, thesedeviations evidently reflect the limitations of in vacuo calcula-
TABLE 5: Calculated and Experimental Frequencies (ν, in cm-1) and Intensities for the Selected Modes Between ca. 800 and900 cm-1 of Protonated Phycocyanobilin Dimethylester in theZZZasaConfiguration and Dimeric PhycocyanobilinDimethylester in the ZZZsssConfigurationa
exptl calcd
mode no. ν IRR ν I IR IRa PEDb [%]
CPC (ZZZasa)158 882 w 874.0 (907.1) 20 (6) 2 (0) [69] HOOP (BC), [11] CdC tors (BC), [7] CsC tors (BC)159 866.0 (866.6) 101 (128) 0 (0) [11] CsO stre, [14] CsC stre160 862 w 860.3 (863.4) 6 (10) 1 (2) [26] CsC stre, [16] ethyl rock161 855.8 (859.1) 90 (129) 2 (1) [6] CsC stre162 832.1 (843.8) 152 (118) 3 (9) [13] HOOP (AB), [5] HOOP (AB), [36] NH oop (B), [21] NH oop (C)163 825.8 (826.2) 27 (8) 2 (2) [6] HOOP (CD), [16] CH2 rock164 825 sh 823.6 (823.6) 24 (22) 0 (0) [28] CsO stre, [7] CsC stre165 818 m 817.5 (838.0) 27 (47) 29 (30) [35] HOOP (BC), [14] HOOP (AB), [7] CdC tors (BC)166 806 sh 811.7 (809.5) 16 (3) 4 (1) [22] CsC stre, [6] HOOP (CD), [6] NH oop (B)167 803.2 (814.) 27 (39) 3 (1) [24] HOOP (AB), [6] HOOP (CD), [14] NH oop (C), [14] NH oop (B)
PCBE Dimer (ZZZsss)303 851.2 (850.4) 0 2 [16] CH oop (BC), [24] ethylidene CH oop (A)304 851.1 (850.3) 27 0 [16] HOOP (BC), [29] ethylidene CH oop (A)305 848.1 (876.6) 15 0 [50] HOOP (BC)306 835 w 848.0 (876.5) 0 4 [50] HOOP (BC)307 834.8 (834.8) 26 0 [24] CC stre308 834.7 (834.2) 0 3 [24] CC stre309 822.9 (848.3) 18 0 [60] HOOP (CD)310 802 m 822.1 (848.5) 0 20 [62] HOOP (CD)316 793.1 0 2 [16] HOOP (AB)317 790.5 (813.2) 59 0 [46] HOOP (AB)318 781 m 790.3 (813.2) 0 3 [36] HOOP (AB)
a Calculations are based on the specific HOOP scaling factorsσHOOP ) 0.90; data obtained with the standard scaling factorσXYoop ) 0.987 aregiven in parentheses. Calculated IR (I IR) and Raman intensities (IRa) are related to the mode of maximum intensity (100). The experimentallydetermined RR intensities (IRR) are classified in terms of medium (m) and weak (w) bands and shoulders (sh).b PED, potential energy distributiongiven in percentage (in brackets). Abbreviations: stre, stretching; bend, bending, tors, torsion. The individual rings of the tetrapyrroles are denotedby the letters A, B, C, and D, thereby also defining the respective methine bridges (AB, BC, and CD) (Figure 1).
10572 J. Phys. Chem. A, Vol. 110, No. 36, 2006 Mroginski et al.
tions for the protein-bound chromophore in phytochrome. It maybe that specific protein-chromophore interactions in the Pr statecause a tetrapyrrole geometry that deviates in details from the“ideal” ZZZasaconfiguration as optimized by in vacuo calcula-tions. In contrast, the photochemically inert chromophore inR-CPC seems to adopt a relaxed structure as judged from thegood agreement between the experimental and calculatedspectra.
Conclusions
1. DFT(B3LYP) calculations significantly overestimate thefrequencies of modes dominated by ethylenic HOOP coordi-nates. This deficiency cannot be adequately compensated byusing scaling factors suitable for otherX-Y oop coordinates(0.971-0.987).
2. On the basis of a set of training molecules, a specificscaling factor for the ethylenic HOOP coordinate (0.900) hasbeen optimized that leads to a substantial improvement of thereproduction of the experimental frequencies for the HOOP-containing modes.
3. Prediction of Raman intensities for these modes, however,is still associated with a considerable error, which in most casesis reflected by an overestimation of the Raman activities. Nosignificant improvement is achieved by using larger basis setsfor DFT or MP2 calculations.
4. Despite these drawbacks, the inclusion of the specificHOOP scaling factor in the set of global scaling factors alsoprovides a good description for the experimental Raman spectraof test molecules as large as tetrapyrrole dimers and the protein-bound PCB inR-CPC.
5. The larger deviations for the protein-bound tetrapyrrole inphytochrome are attributed to the effect of the protein environ-ment which is not considered by the in vacuo calculations. Toextract structural information also beyond the level of methinebridge configuration and conformation from the low-frequencyRR spectra, hybrid methods are required that also include theprotein environment.
Acknowledgment. The work was supported by the DeutscheForschungsgemeinschaft (Sfb498). Recombinant phytochromeincluding PCB and its C-15 deuterated isotopomer was providedby Wolfgang Ga¨rtner, Mulheim.
Supporting Information Available: Tables of structuraldata of hexadiene isomers, calculated and experimental frequen-cies and IR and Raman intensities of butadiene, isoprene,pentadiene, 2-methyl-2-butene, propene, stilbene, and styreneisomers and isotopomers. This material is available free ofcharge via the Internet at http://pubs.acs.org.
References and Notes
(1) Rauhut, G.; Pulay, P.J. Phys. Chem.1995, 99, 3093.(2) Arenas, J. F.; Otero, J. C.; Sanchez Galvez, A.; Soto, J.J. Mol.
Struct.1996, 385, 49.(3) Magdo, I.; Nemeth, K.; Mark, F.; Hildebrandt, P.; Schaffner, K.
J. Phys. Chem. A1999, 103, 289.(4) Mroginski, M. A.; Nemeth, K.; Bauschlicher, T.; Klotzbucher, W.;
Goddard, R.; Heinemann, O.; Hildebrandt, P.; Mark, F.J. Phys. Chem. A2005, 109, 2139.
(5) Kneip, C.; Hildebrandt, P.; Schlamann, W.; Braslavsky, S. E.;Mark, F.; Schaffner, K.Biochemistry1999, 38, 15185.
(6) Mroginski, M. A.; Murgida, D. H.; von Stetten, D.; Kneip, C.;Mark, F.; Hildebrandt, P.J. Am. Chem. Soc.2004, 126, 16734.
(7) Borucki, B.; von Stetten, D.; Seibeck, S.; Lamparter, T.; Michael,N.; Mroginski, M. A.; Otto, H.; Murgida, D. H.; Heyn, M. P.; Hildebrandt,P. J. Biol. Chem.2005, 280, 34358.
(8) Kneip, C.; Mozley, D.; Hildebrandt, P.; Gartner, W.; Braslavsky,S. E.; Schaffner, K.FEBS Lett.1997, 414, 23.
(9) Becke, A. D.J. Chem. Phys.1993, 98, 5648.(10) Ditchfield, R.; Hehre, W. J.; Pople, J. A.J. Chem. Phys.1972,
56, 2257.(11) Baker, J.; Jarzecki, A. A.; Pulay, P.J. Phys. Chem. A1998, 102,
1412.(12) Frisch, M. J.; Trucks, G. W.; Schlegel, H. B.; Scuseria, G. E.;
Robb, M. A.; Cheeseman, J. R.; Montgomery, J. A., Jr.; Vreven, T.; Kudin,K. N.; Burant, J. C.; Millam, J. M.; Iyengar, S. S.; Tomasi, J.; Barone, V.;Mennucci, B.; Cossi, M.; Scalmani, G.; Rega, N.; Petersson, G. A.;Nakatsuji, H.; Hada, M.; Ehara, M.; Toyota, K.; Fukuda, R.; Hasegawa, J.;Ishida, M.; Nakajima, T.; Honda, Y.; Kitao, O.; Nakai, H.; Klene, M.; Li,X.; Knox, J. E.; Hratchian, H. P.; Cross, J. B.; Bakken, V.; Adamo, C.;Jaramillo, J.; Gomperts, R.; Stratmann, R. E.; Yazyev, O.; Austin, A. J.;Cammi, R.; Pomelli, C.; Ochterski, J. W.; Ayala, P. Y.; Morokuma, K.;Voth, G. A.; Salvador, P.; Dannenberg, J. J.; Zakrzewski, V. G.; Dapprich,S.; Daniels, A. D.; Strain, M. C.; Farkas, O.; Malick, D. K.; Rabuck, A.D.; Raghavachari, K.; Foresman, J. B.; Ortiz, J. V.; Cui, Q.; Baboul, A.G.; Clifford, S.; Cioslowski, J.; Stefanov, B. B.; Liu, G.; Liashenko, A.;Piskorz, P.; Komaromi, I.; Martin, R. L.; Fox, D. J.; Keith, T.; Al-Laham,M. A.; Peng, C. Y.; Nanayakkara, A.; Challacombe, M.; Gill, P. M. W.;Johnson, B.; Chen, W.; Wong, M. W.; Gonzalez, C.; Pople, J. A.Gaussian03; Gaussian, Inc.: Wallingford, CT, 2004.
(13) Kneip, C.; Parbel, A.; Foerstendorf, H.; Scheer, H.; Siebert, F.;Hildebrandt, P.J. Raman Spectrosc.1998, 29, 939.
(14) Mohamed, T. A.; Aly, M. M. A.J. Raman Spectrosc.2004, 35,869.
(15) Duerring, M.; Huber, R.; Bode, W.J. Mol. Biol. 1990, 211, 633.(16) Takahashi, H.; Kuroyanagi, K.; Yamada, O.; Kaneko, N.Chem.
Phys. Lett.2003, 94, 38.(17) Compton, D. A. C.; George, W. O.; Maddams, W. F.J. Chem.
Soc., Perkin Trans. 21976, 1666.(18) Traetteberg, M.; Paulen, G.; Cyvin, S. J.; Panchenko, Y. N.;
Mochalov, V. I.J. Mol. Struct.1984, 116, 141.(19) Kuchitsu, K.; Fukuyama, T.; Morino, Y.J. Mol. Struct.1968, 1,
463.(20) Lide, D. R.; Christensen, D.J. Chem. Phys.1961, 35, 1374.(21) Hsu, S. L.; Flygare, W. H.J. Chem. Phys.1970, 52, 1053.(22) Traetteberg, M.; Frantsen, E. B.J. Mol. Struct.1975, 26, 69.(23) Traetteberg, M.; Frantsen, E. B.; Mijlhoff, F. C.; Hoekstra, A.J.
Mol. Struct.1975, 26, 57.(24) Yasuda, N.; Uekusa, H.; Ohashi, Y.Acta Crystallogr., Sect. E
2001, 57, O1189-O1190.(25) Knipp, B.; Muller, M.; Metzler-Nolte, N.; Balaban, T. S.;
Braslavsky, S. E.; Schaffner, K.HelV. Chim. Acta1998, 81, 881.(26) Kratky, C.; Falk, H.; Grubmayr, K.Monatsh. Chem.1985, 116,
745.(27) Sheldrick, W. S.Isr. J. Chem.1983, 23, 155.(28) Compton, D. A. C.; George, W. O.; Maddams, W. F.J. Chem.
Soc., Perkin Trans. 21977, 1311.(29) Peng, J. P.; Minacamilde, N.; Manzanares, C.Vib. Spectrosc.1995,
8, 319.(30) Schrader, B.; Meier, W.DMS Raman/IR Atlas of Organic Com-
pounds; Verlag Chemie GmbH: Weinheim, 1975.(31) Silvi, B.; Labarbe, P.; Perchard, J. P.Spectrochim. Acta, Part A
1973, A 29, 263.
Figure 6. Calculated low-frequency Raman spectrum of (A) PCBEH+-Cl- in theZZZasaand (D) its isotopomer deuterated at the C-15 carbon.The experimental RR spectra of recombinant phytochrome (phyA)adducts in the Pr state including the nonlabeled and the C-15 deuteratedPCB chromophore are shown in (B) and (C), respectively.
Vibrational Spectra of Linear Tetrapyrroles J. Phys. Chem. A, Vol. 110, No. 36, 200610573

(32) Takada, T.; Dupuis, M.J. Am. Chem. Soc.1983, 105, 1713.(33) Arenas, J. F.; Tocon, I. L.; Otero, J. C.; Marcos, J. I.J. Phys.
Chem.1995, 99, 11392.(34) Watanabe, H.; Okamoto, Y.; Furuya, K.; Sakamoto, A.; Tasumi,
M. J. Phys. Chem. A2002, 106, 3318.(35) Choi, C. H.; Kertesz, M.J. Phys. Chem. A1997, 101, 3823.(36) Meic, Z.; Gusten, H.Spectrochim. Acta, Part A1978, 34, 101.(37) Condirston, D. A.; Laposa, J. D.J. Mol. Spectrosc.1976, 63, 466.
(38) Stirling, A. J. Chem. Phys.1996, 104, 1254.
(39) Aly, M. M. A.; Baron, M. H.; Romain, F.; Revault, M.Spectrochim.Acta 1984, 40, 1037.
(40) Kneip, C.; Hildebrandt, P.; Nemeth, K.; Mark, F.; Schaffner, K.Chem. Phys. Lett.1999, 311, 479.
(41) Wagner, J. R.; Brunzelle, J. S.; Forest, K. T.; Vierstra, R. D.Nature(London)2005, 438, 325.
10574 J. Phys. Chem. A, Vol. 110, No. 36, 2006 Mroginski et al.
Related Documents