Harper, Consolazio 1 Calculation Method for Quantifying Axial and Roll Stiffnesses for Rectangular Steel-Reinforced Elastomeric Bridge Bearing Pads By : Zachary S. Harper 1 , Gary R. Consolazio, Ph.D. 2 1. Graduate Research Assistant, University of Florida, Department of Civil & Coastal Engineering, P.O. Box 116580, Gainesville, FL 32611 (Tel: 352-392-9537 Ext. 1502, E-mail: [email protected]) 2. Corresponding author : Associate Professor, University of Florida, Department of Civil & Coastal Engineering, P.O. Box 116580, Gainesville, FL 32611 (Tel: 352-392-9537 Ext. 1510, Fax: 352-392-3394, E-mail: [email protected]) Submitted : 11 November 2012 Word count : 3711 words + 13 figures (x 250) = 6961 words ABSTRACT Accurate estimates of bearing stiffnesses are often necessary for bridge design and construction calculations. In the case of steel-reinforced elastomeric bearing pads, it is often difficult to estimate compression stiffness or roll stiffness due to the complex deformations of the elastomer. In this paper, a numerical analysis method is presented for estimating axial and roll stiffnesses of bearing pads. To validate the axial calculation method, experimental compression tests are performed on pad specimens constructed in accordance with Florida design standards. Additionally, a method for calculating roll stiffness is presented, in which the pad is modeled as a grillage of compression-only axial springs. The grillage method is partially derived from roll stiffness data experimentally measured in a separate study. It is demonstrated that the grillage method accurately captures both the non-linear moment-rotation behavior caused by liftoff of the girder from the pad and the observed sensitivity of roll stiffness to initial compressive loading caused by girder self-weight. Consideration is also given to reductions in roll stiffness that are caused by girder slope relative to the pad. INTRODUCTION TO STEEL-LAMINATED ELASTOMERIC BEARING PADS Steel-reinforced elastomeric pads have become one of the dominant types of bridge bearings employed in the U.S. due to their economy, durability, and ease of use in construction. Bridge girders rest directly on pads which are the only points of contact between the girder and the substructure. As a result, the girder support conditions in all six degrees of freedom can be represented as finite stiffnesses that correspond to the equivalent deformation modes of the pad. These deformation modes fall into four categories: shear, compression (axial), roll, and torsion. Of these, the torsional stiffness is generally not required for bridge design and the shear stiffness can be directly calculated from basic principles of mechanics. Empirical equations for calculating the compressive stiffness of a pad are available in the literature (1, 2), but they frequently produce results that differ significantly from experimental data. One proven reliable method for quantifying compressive pad stiffness is the finite element method, but most bridge engineers have limited experience in modeling incompressible materials such as elastomer. In addition to axial deformations, bearing pads are susceptible to roll rotations about two orthogonal axes; roll about the transverse centerline (bending roll) is typically the result of the end rotations of the girder as it bends about its major axis, while rotation about the longitudinal centerline (overturning roll) corresponds to overturning rotations of the girder at the supports. Estimation of these stiffnesses is often required for construction and design calculations, but methods for calculating such stiffnesses are not comprehensively addressed in the literature. For example, overturning roll stiffness at the supports is of particular importance during the construction (prior to casting of the deck) of long-span prestressed concrete girder bridges, as it can have a significant influence on the lateral stability of an unbraced girder, and is sometimes the only source of structural resistance to overturning moments generated by lateral loads (e.g., wind) or eccentric gravity loads. Recent experimental measurements of bearing pad roll stiffness (3), which extended into the non-linear range, have provided an opportunity to develop an empirical calculation method capable of approximating roll stiffness while preserving non-linear effects. TRB 2013 Annual Meeting Paper revised from original submittal.

Welcome message from author
This document is posted to help you gain knowledge. Please leave a comment to let me know what you think about it! Share it to your friends and learn new things together.
Transcript
Harper, Consolazio 1
Calculation Method for Quantifying Axial and Roll Stiffnesses for Rectangular Steel-Reinforced Elastomeric Bridge Bearing Pads By :
Zachary S. Harper 1, Gary R. Consolazio, Ph.D. 2
1. Graduate Research Assistant, University of Florida, Department of Civil & Coastal Engineering, P.O. Box 116580, Gainesville, FL 32611 (Tel: 352-392-9537 Ext. 1502, E-mail: [email protected])
2. Corresponding author : Associate Professor, University of Florida, Department of Civil & Coastal Engineering,
P.O. Box 116580, Gainesville, FL 32611 (Tel: 352-392-9537 Ext. 1510, Fax: 352-392-3394, E-mail: [email protected])
Submitted : 11 November 2012 Word count : 3711 words + 13 figures (x 250) = 6961 words
ABSTRACT
Accurate estimates of bearing stiffnesses are often necessary for bridge design and construction calculations. In the case of steel-reinforced elastomeric bearing pads, it is often difficult to estimate compression stiffness or roll stiffness due to the complex deformations of the elastomer. In this paper, a numerical analysis method is presented for estimating axial and roll stiffnesses of bearing pads. To validate the axial calculation method, experimental compression tests are performed on pad specimens constructed in accordance with Florida design standards. Additionally, a method for calculating roll stiffness is presented, in which the pad is modeled as a grillage of compression-only axial springs. The grillage method is partially derived from roll stiffness data experimentally measured in a separate study. It is demonstrated that the grillage method accurately captures both the non-linear moment-rotation behavior caused by liftoff of the girder from the pad and the observed sensitivity of roll stiffness to initial compressive loading caused by girder self-weight. Consideration is also given to reductions in roll stiffness that are caused by girder slope relative to the pad.
INTRODUCTION TO STEEL-LAMINATED ELASTOMERIC BEARING PADS
Steel-reinforced elastomeric pads have become one of the dominant types of bridge bearings employed in the U.S. due to their economy, durability, and ease of use in construction. Bridge girders rest directly on pads which are the only points of contact between the girder and the substructure. As a result, the girder support conditions in all six degrees of freedom can be represented as finite stiffnesses that correspond to the equivalent deformation modes of the pad. These deformation modes fall into four categories: shear, compression (axial), roll, and torsion. Of these, the torsional stiffness is generally not required for bridge design and the shear stiffness can be directly calculated from basic principles of mechanics.
Empirical equations for calculating the compressive stiffness of a pad are available in the literature (1, 2), but they frequently produce results that differ significantly from experimental data. One proven reliable method for quantifying compressive pad stiffness is the finite element method, but most bridge engineers have limited experience in modeling incompressible materials such as elastomer.
In addition to axial deformations, bearing pads are susceptible to roll rotations about two orthogonal axes; roll about the transverse centerline (bending roll) is typically the result of the end rotations of the girder as it bends about its major axis, while rotation about the longitudinal centerline (overturning roll) corresponds to overturning rotations of the girder at the supports. Estimation of these stiffnesses is often required for construction and design calculations, but methods for calculating such stiffnesses are not comprehensively addressed in the literature. For example, overturning roll stiffness at the supports is of particular importance during the construction (prior to casting of the deck) of long-span prestressed concrete girder bridges, as it can have a significant influence on the lateral stability of an unbraced girder, and is sometimes the only source of structural resistance to overturning moments generated by lateral loads (e.g., wind) or eccentric gravity loads. Recent experimental measurements of bearing pad roll stiffness (3), which extended into the non-linear range, have provided an opportunity to develop an empirical calculation method capable of approximating roll stiffness while preserving non-linear effects.
TRB 2013 Annual Meeting Paper revised from original submittal.
Harper, Consolazio 2
Physical Description of Pads
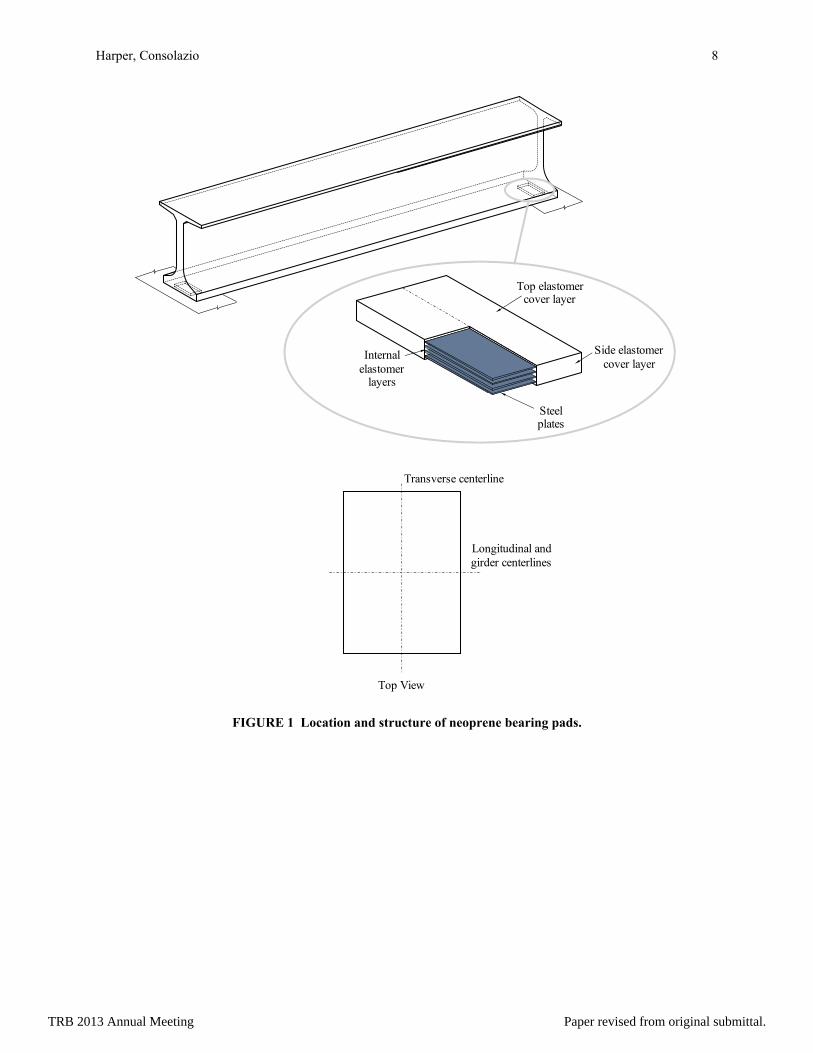
The types of bearing pads under consideration in this study consist of rectangular steel plates separated by layers of neoprene rubber (Figure 1). An external neoprene cover layer, typically thinner than the internal layers, surrounds the pad on all sides, sealing the steel reinforcement against corrosive agents in the environment. During the vulcanization process, the neoprene becomes fully bonded to the steel. Because the elastic modulus of the steel is so much greater than that of the neoprene, it can be considered to be effectively rigid.
BEHAVIOR OF PADS IN COMPRESSION
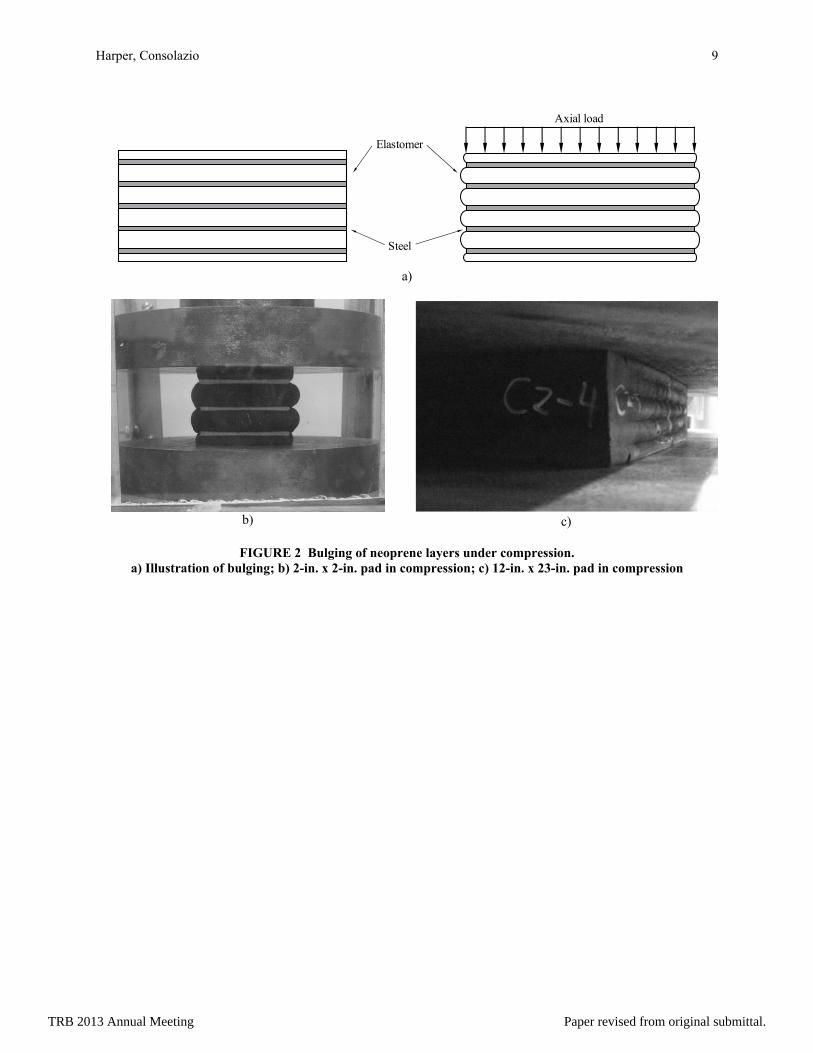
Elastomeric rubbers, such as neoprene, are almost completely incompressible (i.e., with a Poisson’s ratio ν > 0.49), and when subjected to a uniaxial compressive force, they tend to expand laterally to preserve their volume. However, in a steel-reinforced bearing pad, the steel plates are stiff enough to effectively restrain all movement of the neoprene at the steel-neoprene interfaces. As a result, when a pad is compressed, the neoprene layers respond by bulging outward at the edges (Figure 2). Restraint of this expansion by the steel plates makes the pad much stiffer in compression than an unreinforced pad with equivalent thickness and volume of elastomer. At extreme levels of compression, the stiffness becomes nonlinear as the bulging displaces a significant portion of elastomer outside of the primary load path, reducing the effective layer thickness and stiffening the pad. However, if the pad has been properly sized according to the provisions of AASHTO (4) or similar, then determining just the initial linear stiffness is sufficient for most relevant bridge engineering calculations.
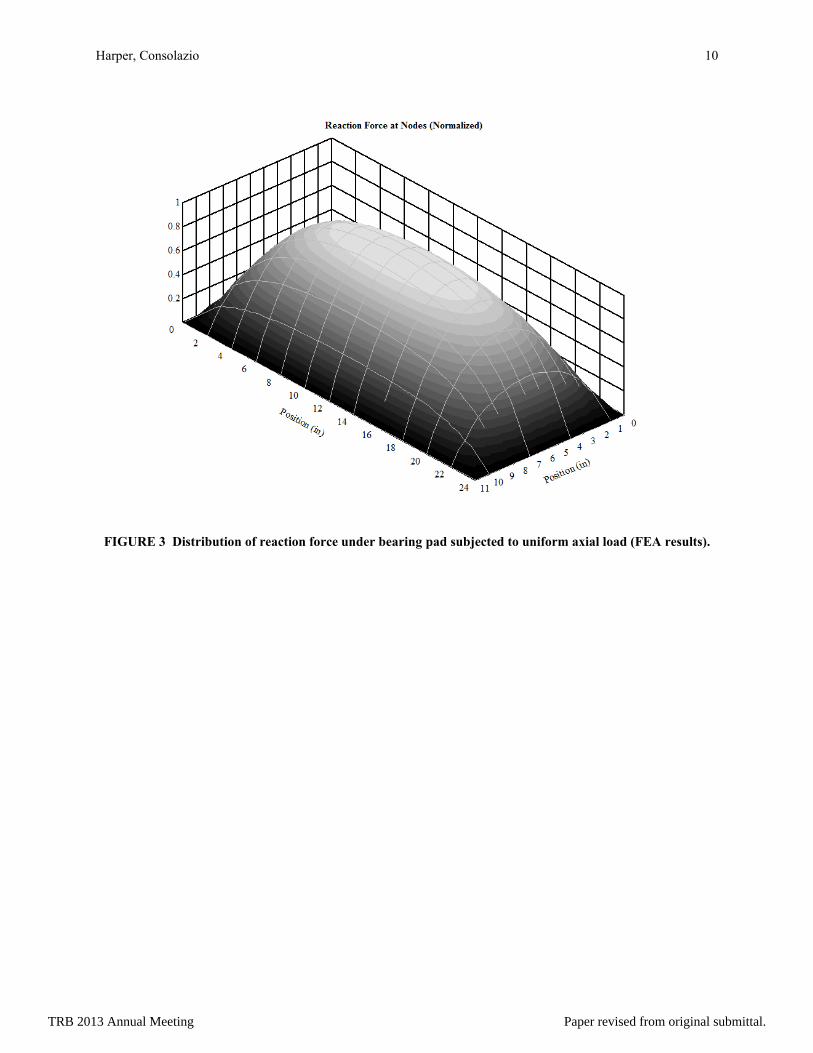
One consequence of the characteristic bulge response is an uneven distribution of compressive stiffness throughout the pad such that local compressive stiffness at any point is a function of the distance from the center of the pad. Near the center, there is a large amount of surrounding rubber that must be displaced laterally in order for the neoprene layers to bulge at the edges. In contrast, near the edges of the pad, the rubber is less confined and comparatively little force is required for the rubber to bulge. This confinement effect can be demonstrated by prescribing a uniform downward displacement on the top surface of a finite element model of a layer of neoprene and plotting the distribution of the reaction forces (Figure 3). Because every point on the pad is compressed (deformed) vertically the same amount, the reaction force distribution is proportional to the distribution of local stiffness.
Gent (1) and others have published correlations between the axial stiffness of a bearing pad and the shape factor, S, of the internal elastomer layers of the pad. The shape factor is a dimensionless ratio between the load area (i.e. plan-view area of the pad) and the bulge area (i.e. the perimeter area). Most shape factor-based methods use the same basic functional form:
( )21effE E Sα= + (1)
(where α is an empirically-determined constant) to calculate an effective elastic modulus that incorporates the additional restraint provided by the steel reinforcement. In contrast, Podolny (2) has provided an empirical formula:
2
3axial
GAak
Ct= (2)
that does not incorporate the shape factor, but does include a constant, C, that changes depending on the aspect ratio of the pad. In general, axial pad stiffnesses calculated from these formulas can only be expected to provide values within 20-25% of experimentally measured axial stiffness.
BEHAVIOR OF PADS IN ROLL ROTATION
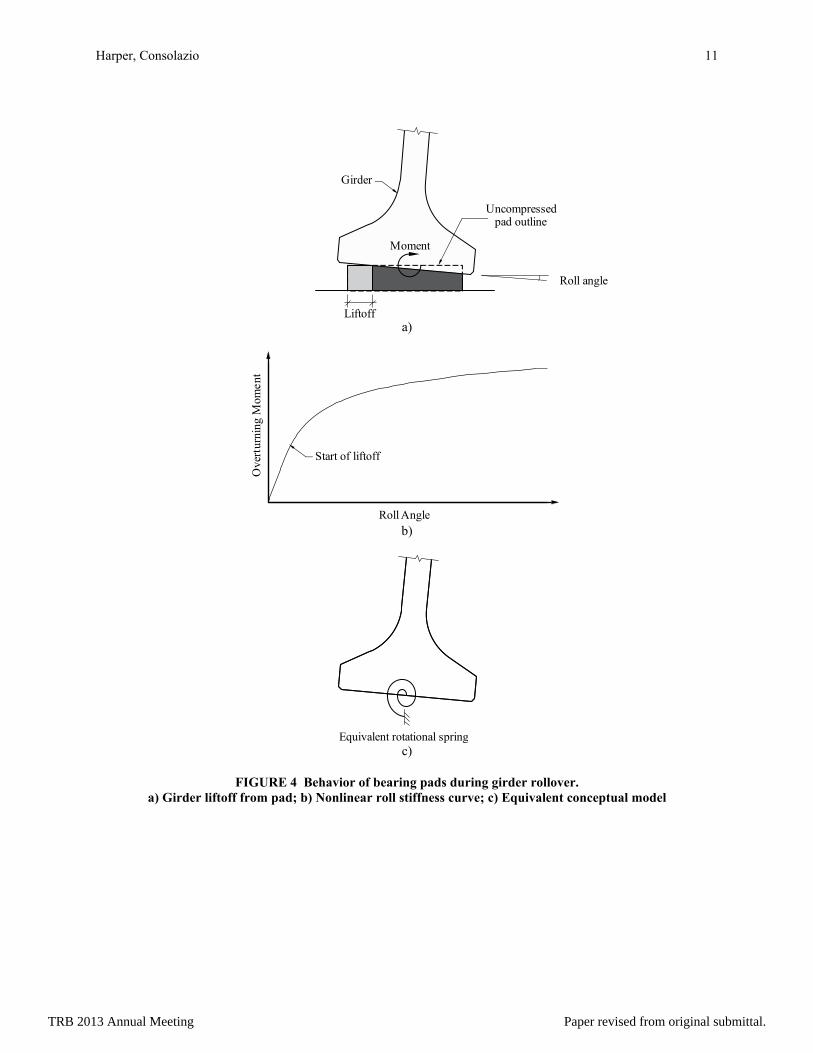
As a girder rolls, the top surface of the pad becomes angled relative to the bottom surface, lifting upward from one side of the pad and depressing the opposite side. Because the pad is already compressed by the weight of the girder it supports, the entire width of the pad initially remains in contact with the girder and the initial roll stiffness of the pad is linear. However, if the roll angle becomes large enough, the girder will begin to lift off the pad, and the roll stiffness will become nonlinear (Figure 4). The critical roll angle at which this occurs is dependent on the initial compression load. As more of the pad becomes disengaged, the roll stiffness softens until the moment vs. rotation (angle) curve becomes horizontal (plateaus) and the girder rolls off of the pad.
TRB 2013 Annual Meeting Paper revised from original submittal.
Harper, Consolazio 3
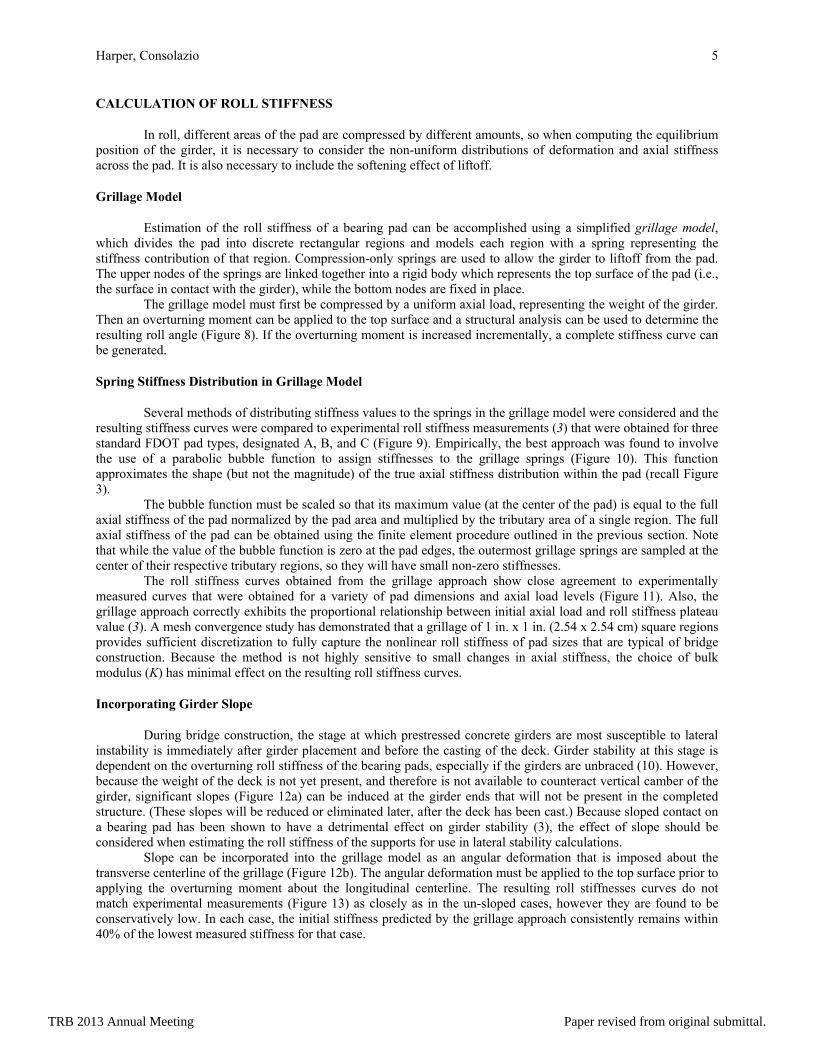
In 2012 an experimental study (3) demonstrated that an increase in the initial compression load results in an approximately proportional increase in the plateau value (while the initial roll stiffness remains essentially unaffected). Also demonstrated in the study were the effects of the geometric orientation of the girder centerline relative to the longitudinal centerline of the pad. Specifically, the two types of orientation angle considered were slope (divergence of the centerlines in elevation view) and skew (divergence in plan view). It was found that overturning roll stiffness was significantly reduced when skew was present, and that this effect was exacerbated by the simultaneous inclusion of a non-zero slope angle. These experimental findings confirmed results from an earlier study (5) in which the interaction between skew and slope was examined analytically.
The effect of slope alone (with no skew) was less conclusive in the experimental study due to scatter in the experimental data, but the majority of the test specimens exhibited at least some reduction in roll stiffness associated with an increase in slope angle. It was concluded that bearing pad skew has the potential to drastically reduce girder stability during construction and should be avoided.
CALCULATION OF AXIAL STIFFNESS
Finite element analysis can be used to determine the axial stiffness of a bearing pad but most bridge engineers have limited experience modeling rubber with three-dimensional solid elements. The following describes a simple, accurate, numerically stable, and computationally efficient modeling approach for quantifying axial stiffness, without the need for specialized material testing.
Stiffness of Neoprene Layers
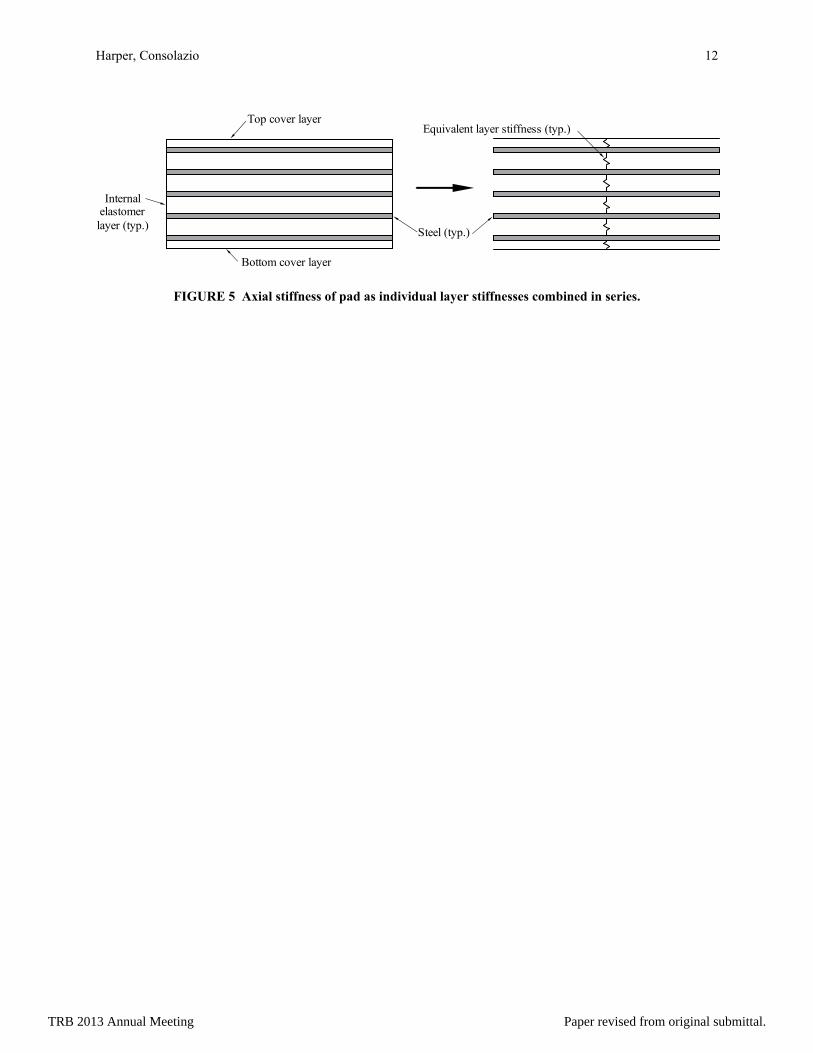
As previously mentioned, steel reinforcing plates are stiff enough, relative to neoprene, that they can be treated as effectively rigid. As a result, the overall axial stiffness of a pad is equivalent to the individual stiffnesses of the neoprene layers (including the top and bottom cover layers) combined in series (Figure 5). It is only necessary to model the individual neoprene layers and then combine the results to determine the axial stiffness of the pad. Because all internal layers typically have the same thickness, generally it will only be necessary to create two finite element layer models—an internal layer model and a cover layer model.
Model Dimensions and Meshing
While it is important to include the cover layers at the top and bottom of the pad, the side layer that surrounds the perimeter of the pad does not contribute significantly to pad stiffness and does not need to be included in the finite element models. Instead, both layer models (internal and cover) should have the same plan view dimensions as the steel reinforcing plates, differing only in thickness.
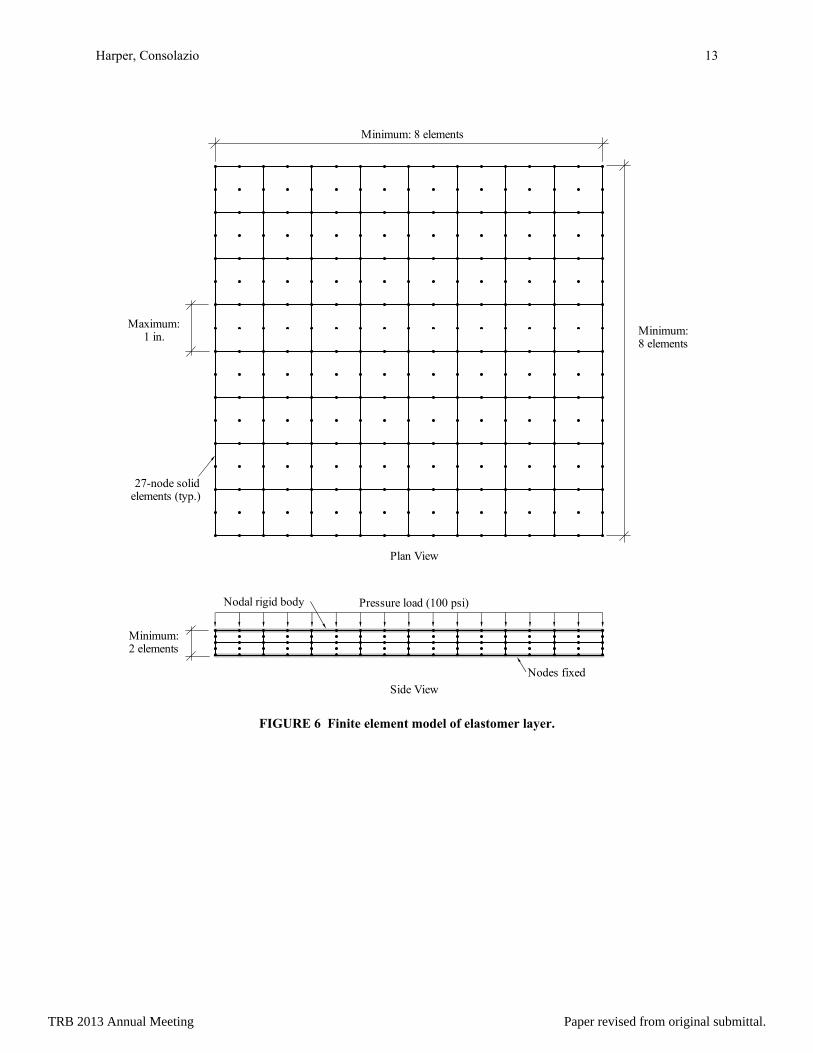
The use of tri-quadratic solid elements (e.g. 20-node or 27-node) is highly recommended to avoid shear locking, as the higher-order shape functions employed by such elements more naturally approximate the curvature of the elastomeric bulge. A much smaller quantity of solid elements is then required, significantly reducing the computational burden. A mesh convergence study has demonstrated that if 27-node solid elements are used, a layer model need only be two elements thick, and the plan view dimensions of the elements can be as large as 1-in. (2.54 cm) on either side (as long as the model has a minimum subdivision of eight elements in both directions) (Figure 6).
Loading and Boundary Conditions
All of the nodes on the bottom surface of each elastomer layer model should be fixed in place, while the nodes on the top surface are constrained together into a nodal rigid body, representing the restraint provided by the steel reinforcement (or by friction between the pad and the girder or substructure). Application of a uniform axial pressure load of 100-200 psi (700-1400 kPa) is sufficient to characterize the initial axial stiffness of typical pads.
Material Model
Rubbers and other incompressible materials are generally modeled as hyperelastic materials, meaning that the mechanical properties are defined by a strain energy density function, W(λ1, λ2, λ3), which relates the total strain energy per unit volume to the deformed state of the material. Each hyperelastic model uses a different form of W, which is nearly always written in terms of the principal stretch ratios, λ1, λ2, and λ3, which represent the material
TRB 2013 Annual Meeting Paper revised from original submittal.
Harper, Consolazio 4
deformation. Stretch is defined as the ratio of deformed length to undeformed length, so the principal stretches can be related to the principal strains as:
1i i
i i
i
L L
Lλ ε
+ Δ= = + (3)
In most hyperelastic materials, the functional form of W is selected empirically, and requires two or more
material parameters which must be determined from experimental testing of specially-prepared material specimens. Material testing is often not feasible for bridge design and, in most circumstances, the only available material data for the neoprene in a bearing pad is the shear modulus, G. In some cases, only a durometer hardness value may be available, which can be converted into an approximate shear modulus empirically (2, 4).
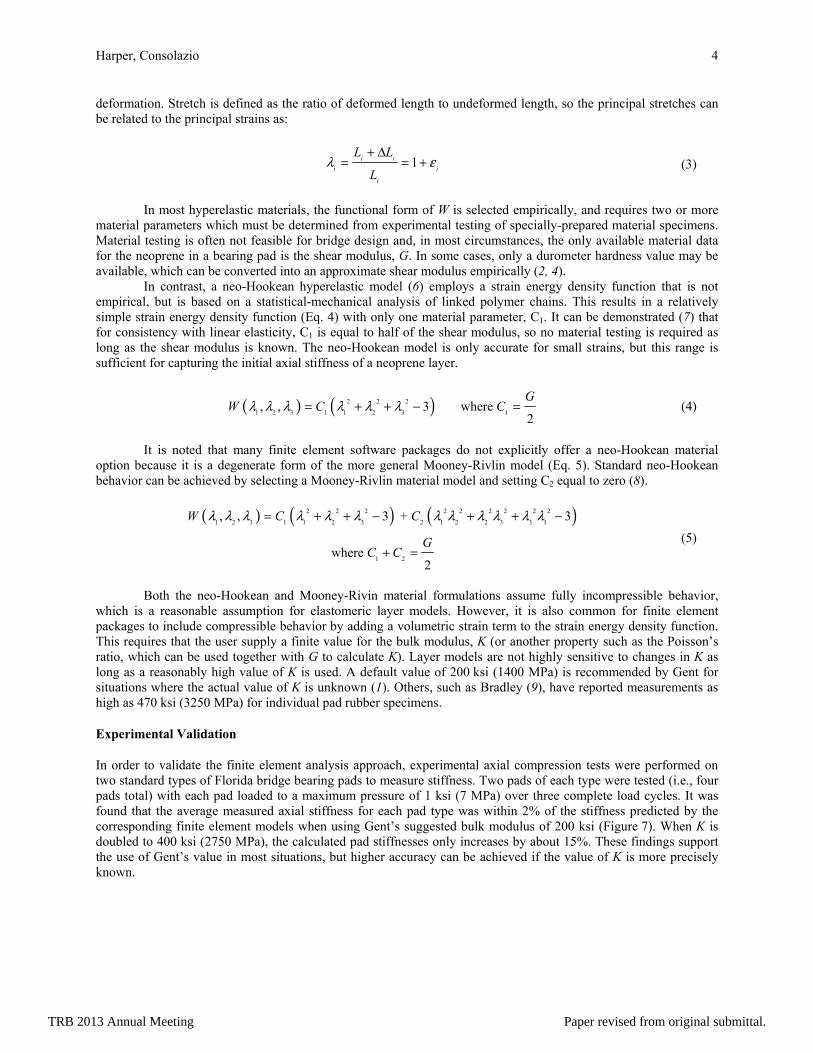
In contrast, a neo-Hookean hyperelastic model (6) employs a strain energy density function that is not empirical, but is based on a statistical-mechanical analysis of linked polymer chains. This results in a relatively simple strain energy density function (Eq. 4) with only one material parameter, C1. It can be demonstrated (7) that for consistency with linear elasticity, C1 is equal to half of the shear modulus, so no material testing is required as long as the shear modulus is known. The neo-Hookean model is only accurate for small strains, but this range is sufficient for capturing the initial axial stiffness of a neoprene layer.
( ) ( )2 2 2
1 2 3 1 1 2 3 1, , 3 where
2
GW C Cλ λ λ λ λ λ= + + − = (4)
It is noted that many finite element software packages do not explicitly offer a neo-Hookean material
option because it is a degenerate form of the more general Mooney-Rivlin model (Eq. 5). Standard neo-Hookean behavior can be achieved by selecting a Mooney-Rivlin material model and setting C2 equal to zero (8).
( ) ( ) ( )2 2 2 2 2 2 2 2 2
1 2 3 1 1 2 3 2 1 2 2 3 3 1
1 2
, , 3 + 3
where 2
W C C
GC C
λ λ λ λ λ λ λ λ λ λ λ λ= + + − + + −
+ = (5)
Both the neo-Hookean and Mooney-Rivin material formulations assume fully incompressible behavior,
which is a reasonable assumption for elastomeric layer models. However, it is also common for finite element packages to include compressible behavior by adding a volumetric strain term to the strain energy density function. This requires that the user supply a finite value for the bulk modulus, K (or another property such as the Poisson’s ratio, which can be used together with G to calculate K). Layer models are not highly sensitive to changes in K as long as a reasonably high value of K is used. A default value of 200 ksi (1400 MPa) is recommended by Gent for situations where the actual value of K is unknown (1). Others, such as Bradley (9), have reported measurements as high as 470 ksi (3250 MPa) for individual pad rubber specimens.
Experimental Validation
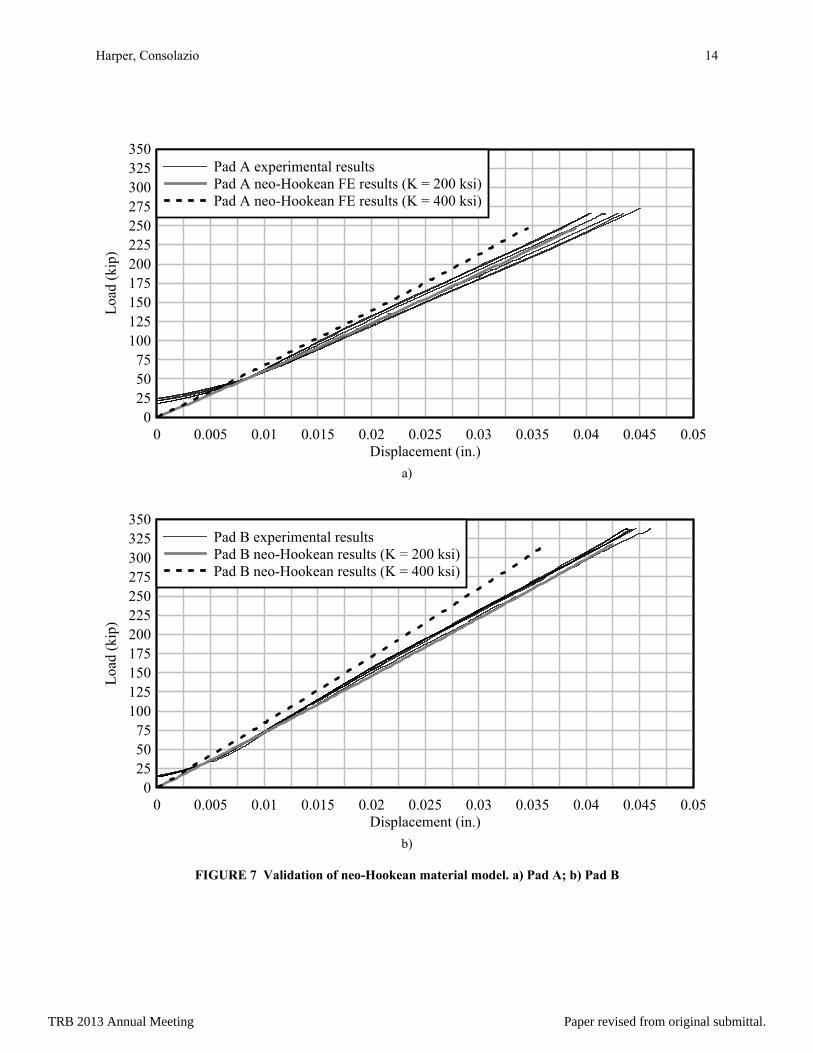
In order to validate the finite element analysis approach, experimental axial compression tests were performed on two standard types of Florida bridge bearing pads to measure stiffness. Two pads of each type were tested (i.e., four pads total) with each pad loaded to a maximum pressure of 1 ksi (7 MPa) over three complete load cycles. It was found that the average measured axial stiffness for each pad type was within 2% of the stiffness predicted by the corresponding finite element models when using Gent’s suggested bulk modulus of 200 ksi (Figure 7). When K is doubled to 400 ksi (2750 MPa), the calculated pad stiffnesses only increases by about 15%. These findings support the use of Gent’s value in most situations, but higher accuracy can be achieved if the value of K is more precisely known.
TRB 2013 Annual Meeting Paper revised from original submittal.
Harper, Consolazio 5
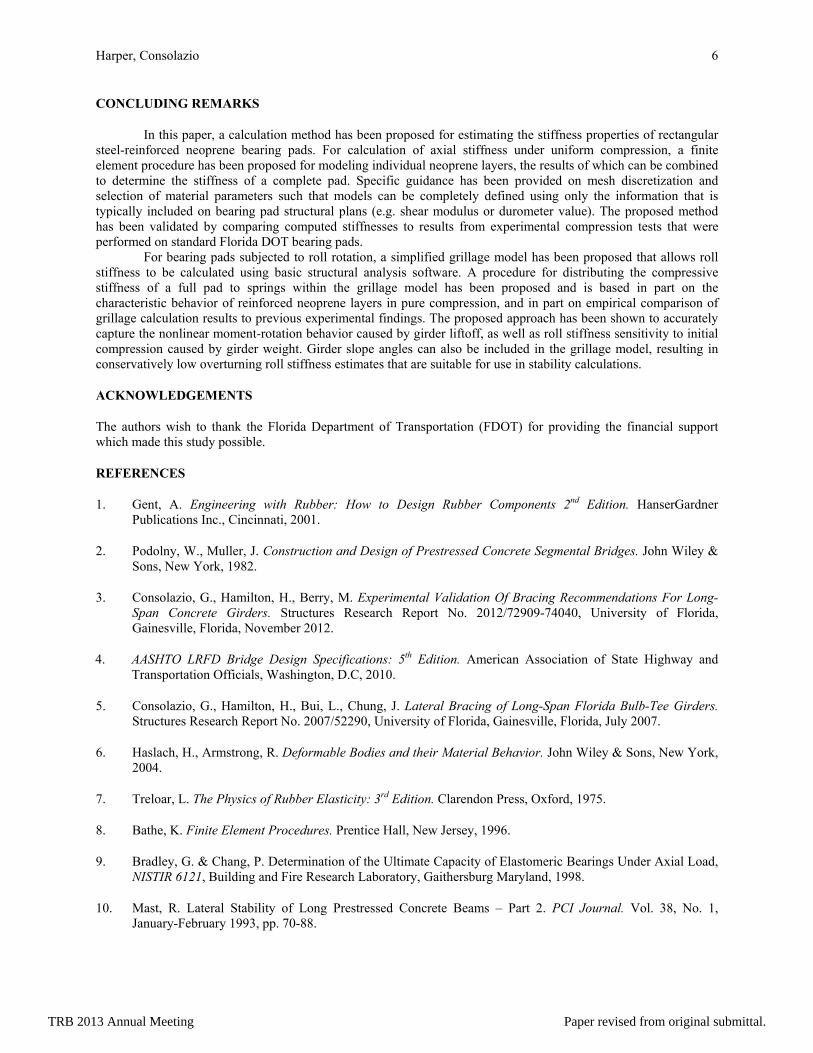
CALCULATION OF ROLL STIFFNESS
In roll, different areas of the pad are compressed by different amounts, so when computing the equilibrium position of the girder, it is necessary to consider the non-uniform distributions of deformation and axial stiffness across the pad. It is also necessary to include the softening effect of liftoff.
Grillage Model
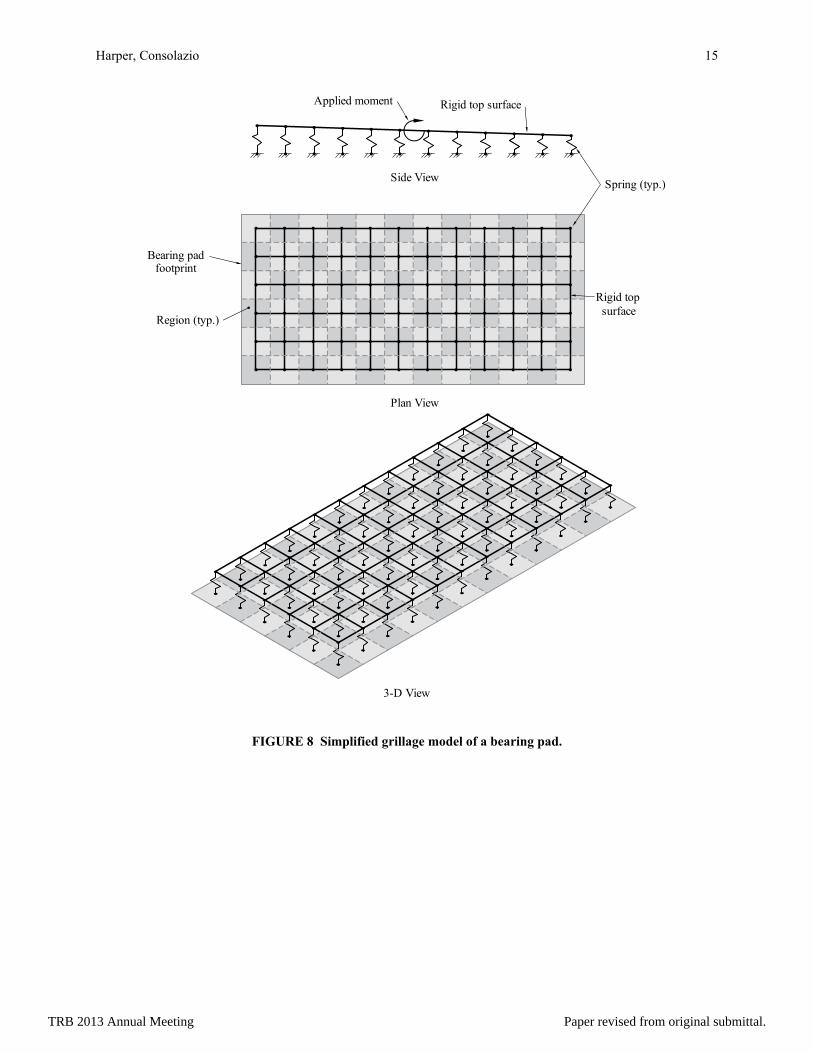
Estimation of the roll stiffness of a bearing pad can be accomplished using a simplified grillage model, which divides the pad into discrete rectangular regions and models each region with a spring representing the stiffness contribution of that region. Compression-only springs are used to allow the girder to liftoff from the pad. The upper nodes of the springs are linked together into a rigid body which represents the top surface of the pad (i.e., the surface in contact with the girder), while the bottom nodes are fixed in place.
The grillage model must first be compressed by a uniform axial load, representing the weight of the girder. Then an overturning moment can be applied to the top surface and a structural analysis can be used to determine the resulting roll angle (Figure 8). If the overturning moment is increased incrementally, a complete stiffness curve can be generated.
Spring Stiffness Distribution in Grillage Model
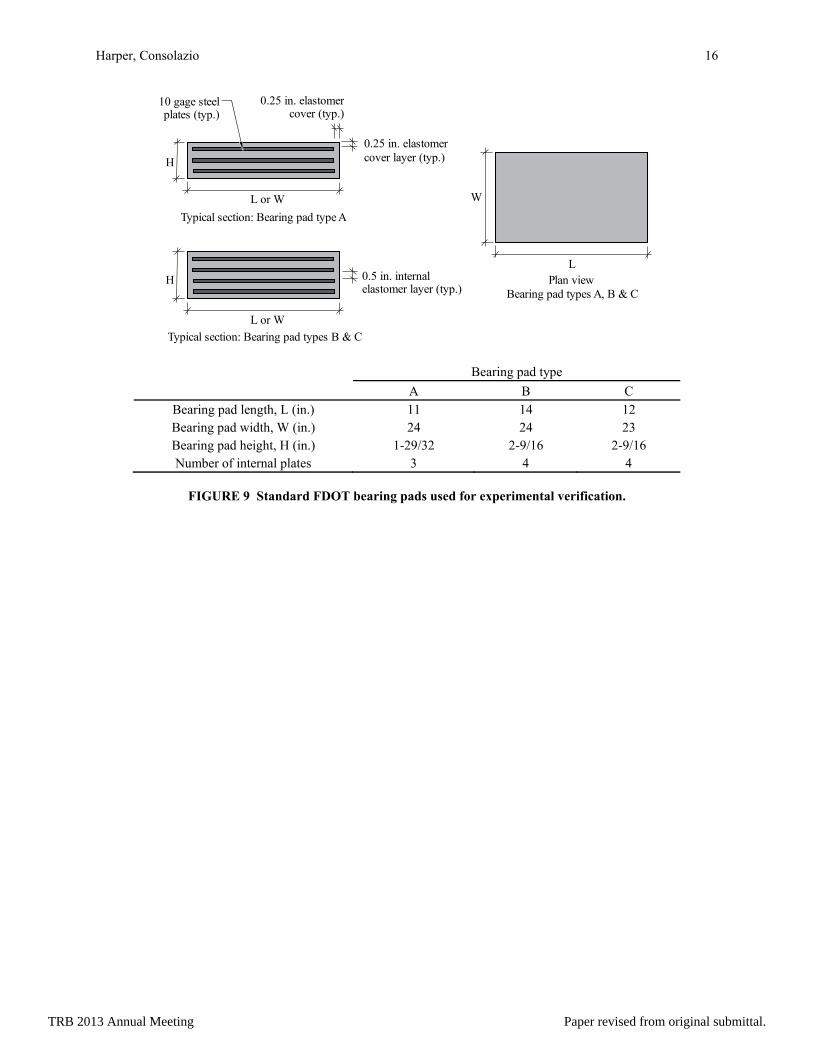
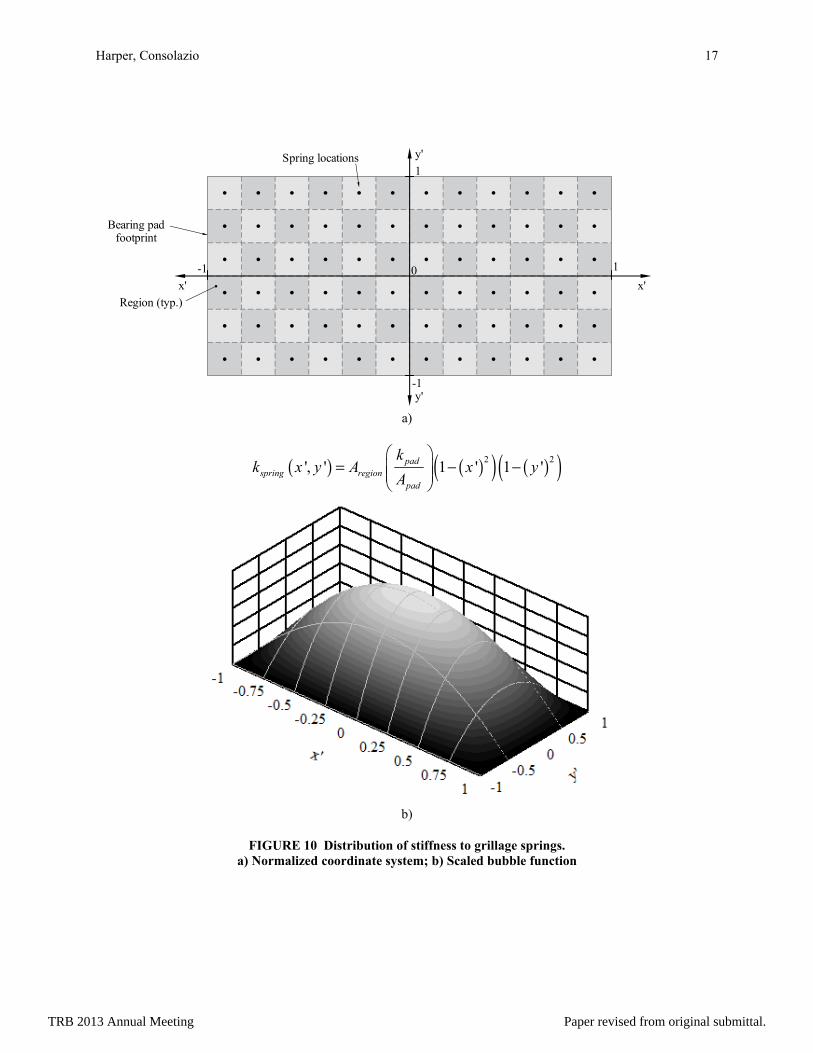
Several methods of distributing stiffness values to the springs in the grillage model were considered and the resulting stiffness curves were compared to experimental roll stiffness measurements (3) that were obtained for three standard FDOT pad types, designated A, B, and C (Figure 9). Empirically, the best approach was found to involve the use of a parabolic bubble function to assign stiffnesses to the grillage springs (Figure 10). This function approximates the shape (but not the magnitude) of the true axial stiffness distribution within the pad (recall Figure 3).
The bubble function must be scaled so that its maximum value (at the center of the pad) is equal to the full axial stiffness of the pad normalized by the pad area and multiplied by the tributary area of a single region. The full axial stiffness of the pad can be obtained using the finite element procedure outlined in the previous section. Note that while the value of the bubble function is zero at the pad edges, the outermost grillage springs are sampled at the center of their respective tributary regions, so they will have small non-zero stiffnesses.
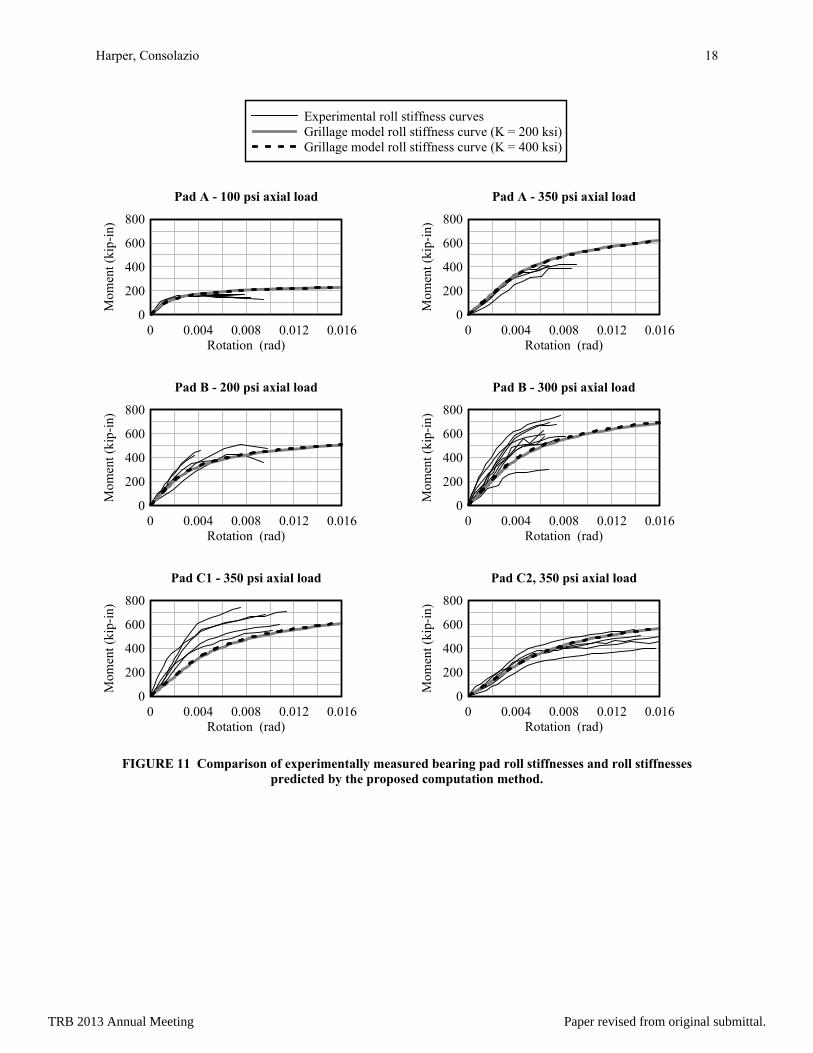
The roll stiffness curves obtained from the grillage approach show close agreement to experimentally measured curves that were obtained for a variety of pad dimensions and axial load levels (Figure 11). Also, the grillage approach correctly exhibits the proportional relationship between initial axial load and roll stiffness plateau value (3). A mesh convergence study has demonstrated that a grillage of 1 in. x 1 in. (2.54 x 2.54 cm) square regions provides sufficient discretization to fully capture the nonlinear roll stiffness of pad sizes that are typical of bridge construction. Because the method is not highly sensitive to small changes in axial stiffness, the choice of bulk modulus (K) has minimal effect on the resulting roll stiffness curves.
Incorporating Girder Slope
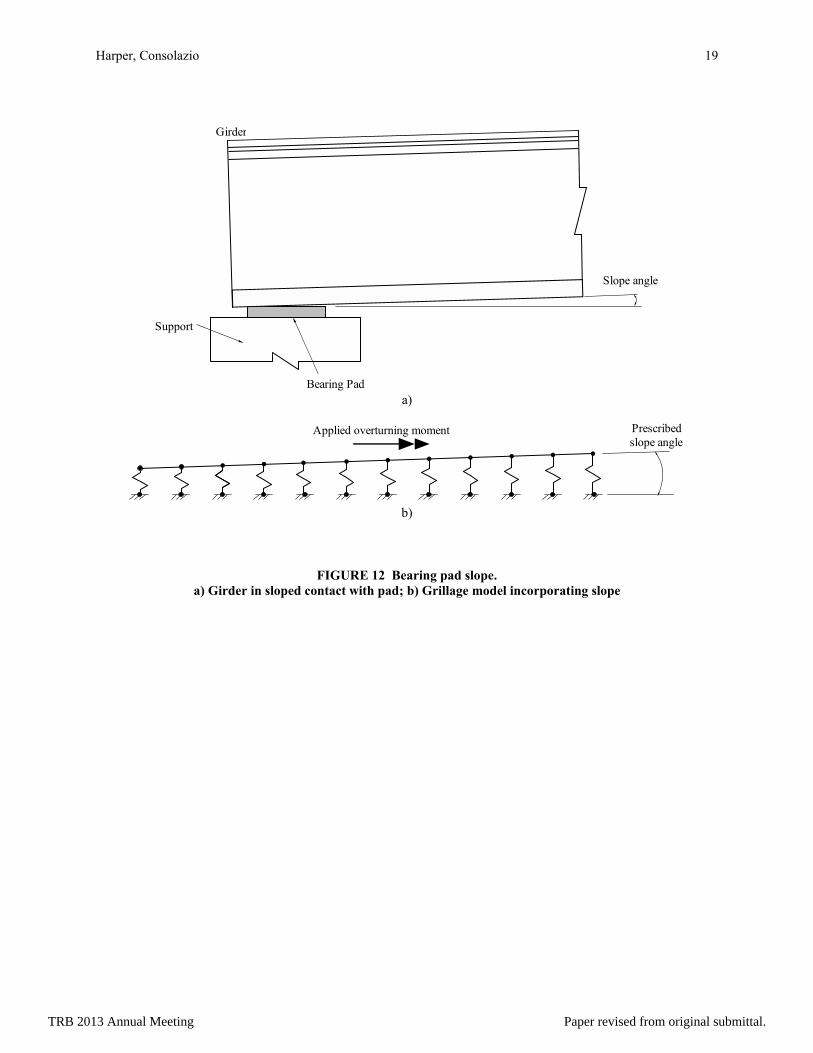
During bridge construction, the stage at which prestressed concrete girders are most susceptible to lateral instability is immediately after girder placement and before the casting of the deck. Girder stability at this stage is dependent on the overturning roll stiffness of the bearing pads, especially if the girders are unbraced (10). However, because the weight of the deck is not yet present, and therefore is not available to counteract vertical camber of the girder, significant slopes (Figure 12a) can be induced at the girder ends that will not be present in the completed structure. (These slopes will be reduced or eliminated later, after the deck has been cast.) Because sloped contact on a bearing pad has been shown to have a detrimental effect on girder stability (3), the effect of slope should be considered when estimating the roll stiffness of the supports for use in lateral stability calculations.
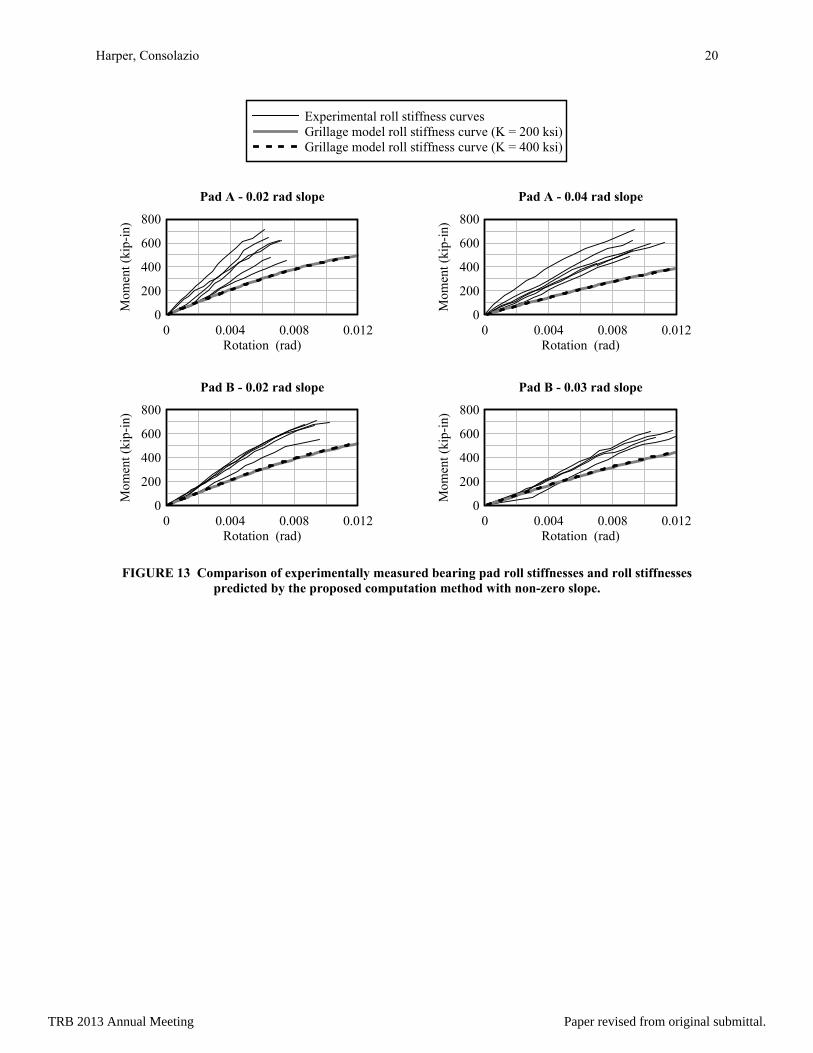
Slope can be incorporated into the grillage model as an angular deformation that is imposed about the transverse centerline of the grillage (Figure 12b). The angular deformation must be applied to the top surface prior to applying the overturning moment about the longitudinal centerline. The resulting roll stiffnesses curves do not match experimental measurements (Figure 13) as closely as in the un-sloped cases, however they are found to be conservatively low. In each case, the initial stiffness predicted by the grillage approach consistently remains within 40% of the lowest measured stiffness for that case.
TRB 2013 Annual Meeting Paper revised from original submittal.
Harper, Consolazio 6
CONCLUDING REMARKS
In this paper, a calculation method has been proposed for estimating the stiffness properties of rectangular steel-reinforced neoprene bearing pads. For calculation of axial stiffness under uniform compression, a finite element procedure has been proposed for modeling individual neoprene layers, the results of which can be combined to determine the stiffness of a complete pad. Specific guidance has been provided on mesh discretization and selection of material parameters such that models can be completely defined using only the information that is typically included on bearing pad structural plans (e.g. shear modulus or durometer value). The proposed method has been validated by comparing computed stiffnesses to results from experimental compression tests that were performed on standard Florida DOT bearing pads.
For bearing pads subjected to roll rotation, a simplified grillage model has been proposed that allows roll stiffness to be calculated using basic structural analysis software. A procedure for distributing the compressive stiffness of a full pad to springs within the grillage model has been proposed and is based in part on the characteristic behavior of reinforced neoprene layers in pure compression, and in part on empirical comparison of grillage calculation results to previous experimental findings. The proposed approach has been shown to accurately capture the nonlinear moment-rotation behavior caused by girder liftoff, as well as roll stiffness sensitivity to initial compression caused by girder weight. Girder slope angles can also be included in the grillage model, resulting in conservatively low overturning roll stiffness estimates that are suitable for use in stability calculations.
ACKNOWLEDGEMENTS
The authors wish to thank the Florida Department of Transportation (FDOT) for providing the financial support which made this study possible.
REFERENCES
1. Gent, A. Engineering with Rubber: How to Design Rubber Components 2nd Edition. HanserGardner Publications Inc., Cincinnati, 2001.
2. Podolny, W., Muller, J. Construction and Design of Prestressed Concrete Segmental Bridges. John Wiley & Sons, New York, 1982.
3. Consolazio, G., Hamilton, H., Berry, M. Experimental Validation Of Bracing Recommendations For Long-Span Concrete Girders. Structures Research Report No. 2012/72909-74040, University of Florida, Gainesville, Florida, November 2012.
4. AASHTO LRFD Bridge Design Specifications: 5th Edition. American Association of State Highway and Transportation Officials, Washington, D.C, 2010.
5. Consolazio, G., Hamilton, H., Bui, L., Chung, J. Lateral Bracing of Long-Span Florida Bulb-Tee Girders. Structures Research Report No. 2007/52290, University of Florida, Gainesville, Florida, July 2007.
6. Haslach, H., Armstrong, R. Deformable Bodies and their Material Behavior. John Wiley & Sons, New York, 2004.
7. Treloar, L. The Physics of Rubber Elasticity: 3rd Edition. Clarendon Press, Oxford, 1975.
8. Bathe, K. Finite Element Procedures. Prentice Hall, New Jersey, 1996.
9. Bradley, G. & Chang, P. Determination of the Ultimate Capacity of Elastomeric Bearings Under Axial Load, NISTIR 6121, Building and Fire Research Laboratory, Gaithersburg Maryland, 1998.
10. Mast, R. Lateral Stability of Long Prestressed Concrete Beams – Part 2. PCI Journal. Vol. 38, No. 1, January-February 1993, pp. 70-88.
TRB 2013 Annual Meeting Paper revised from original submittal.
Harper, Consolazio 7
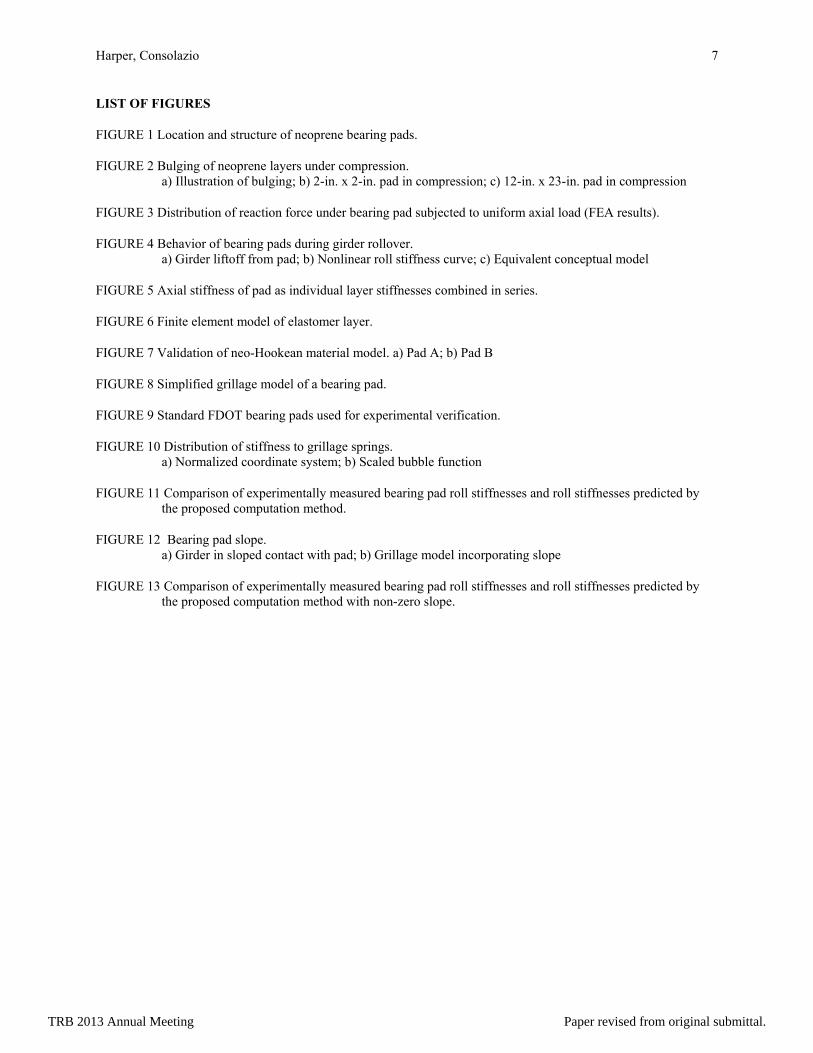
LIST OF FIGURES
FIGURE 1 Location and structure of neoprene bearing pads.
FIGURE 2 Bulging of neoprene layers under compression. a) Illustration of bulging; b) 2-in. x 2-in. pad in compression; c) 12-in. x 23-in. pad in compression
FIGURE 3 Distribution of reaction force under bearing pad subjected to uniform axial load (FEA results).
FIGURE 4 Behavior of bearing pads during girder rollover. a) Girder liftoff from pad; b) Nonlinear roll stiffness curve; c) Equivalent conceptual model
FIGURE 5 Axial stiffness of pad as individual layer stiffnesses combined in series.
FIGURE 6 Finite element model of elastomer layer.
FIGURE 7 Validation of neo-Hookean material model. a) Pad A; b) Pad B
FIGURE 8 Simplified grillage model of a bearing pad.
FIGURE 9 Standard FDOT bearing pads used for experimental verification.
FIGURE 10 Distribution of stiffness to grillage springs. a) Normalized coordinate system; b) Scaled bubble function
FIGURE 11 Comparison of experimentally measured bearing pad roll stiffnesses and roll stiffnesses predicted by the proposed computation method.
FIGURE 12 Bearing pad slope. a) Girder in sloped contact with pad; b) Grillage model incorporating slope
FIGURE 13 Comparison of experimentally measured bearing pad roll stiffnesses and roll stiffnesses predicted by the proposed computation method with non-zero slope.
TRB 2013 Annual Meeting Paper revised from original submittal.
Harper, Consolazio 8
Top elastomer cover layer
Steel plates
Internal elastomer
layers
Side elastomer cover layer
Longitudinal and girder centerlines
Transverse centerline
Top View
FIGURE 1 Location and structure of neoprene bearing pads.
TRB 2013 Annual Meeting Paper revised from original submittal.
Harper, Consolazio 9
Axial load
Steel
Elastomer
a)
b) c)
FIGURE 2 Bulging of neoprene layers under compression. a) Illustration of bulging; b) 2-in. x 2-in. pad in compression; c) 12-in. x 23-in. pad in compression
TRB 2013 Annual Meeting Paper revised from original submittal.
Harper, Consolazio 10
FIGURE 3 Distribution of reaction force under bearing pad subjected to uniform axial load (FEA results).
TRB 2013 Annual Meeting Paper revised from original submittal.
Harper, Consolazio 11
Roll angle
Girder
Liftoff
Uncompressed pad outline
Moment
a)
Roll Angle
Ove
rtur
ning
Mom
ent
Start of liftoff
b)
Equivalent rotational spring c)
FIGURE 4 Behavior of bearing pads during girder rollover. a) Girder liftoff from pad; b) Nonlinear roll stiffness curve; c) Equivalent conceptual model
TRB 2013 Annual Meeting Paper revised from original submittal.
Harper, Consolazio 12
Equivalent layer stiffness (typ.)Top cover layer
Bottom cover layer
Internal elastomer layer (typ.)
Steel (typ.)
FIGURE 5 Axial stiffness of pad as individual layer stiffnesses combined in series.
TRB 2013 Annual Meeting Paper revised from original submittal.
Harper, Consolazio 13
Minimum: 8 elements
Minimum: 8 elements
Maximum: 1 in.
Minimum: 2 elements
Pressure load (100 psi)
27-node solid elements (typ.)
Nodal rigid body
Nodes fixed
Plan View
Side View
FIGURE 6 Finite element model of elastomer layer.
TRB 2013 Annual Meeting Paper revised from original submittal.
Harper, Consolazio 14
Displacement (in.)
Loa
d (k
ip)
0 0.005 0.01 0.015 0.02 0.025 0.03 0.035 0.04 0.045 0.050
255075
100125150175200225250275300325350
Pad A experimental resultsPad A neo-Hookean FE results (K = 200 ksi)Pad A neo-Hookean FE results (K = 400 ksi)
a)
Displacement (in.)
Loa
d (k
ip)
0 0.005 0.01 0.015 0.02 0.025 0.03 0.035 0.04 0.045 0.050
255075
100125150175200225250275300325350
Pad B experimental resultsPad B neo-Hookean results (K = 200 ksi)Pad B neo-Hookean results (K = 400 ksi)
b)
FIGURE 7 Validation of neo-Hookean material model. a) Pad A; b) Pad B
TRB 2013 Annual Meeting Paper revised from original submittal.
Harper, Consolazio 15
Side View
Plan View
Bearing padfootprint
Region (typ.)
Spring (typ.)
Rigid top surfaceApplied moment
Rigid topsurface
3-D View
FIGURE 8 Simplified grillage model of a bearing pad.
TRB 2013 Annual Meeting Paper revised from original submittal.
Harper, Consolazio 16
10 gage steelplates (typ.)
H
0.25 in. elastomercover (typ.)
0.5 elastomer layer (typ.)
in. internalH
L or W
W
L
L or W
0.25 in. elastomercover layer (typ.)
Typical section: Bearing pad types B & C
Plan viewBearing pad types A, B & C
Typical section: Bearing pad type A
Bearing pad type
A B C Bearing pad length, L (in.) 11 14 12 Bearing pad width, W (in.) 24 24 23 Bearing pad height, H (in.) 1-29/32 2-9/16 2-9/16 Number of internal plates 3 4 4
FIGURE 9 Standard FDOT bearing pads used for experimental verification.
TRB 2013 Annual Meeting Paper revised from original submittal.
Harper, Consolazio 17
Bearing padfootprint
Region (typ.)
y'
0
1
1-1
-1
x'x'
y'Spring locations
a)
( ) ( )( ) ( )( )2 2', ' 1 ' 1 'pad
spring regionpad
kk x y A x y
A
= − −
b)
FIGURE 10 Distribution of stiffness to grillage springs. a) Normalized coordinate system; b) Scaled bubble function
TRB 2013 Annual Meeting Paper revised from original submittal.
Harper, Consolazio 18
Experimental roll stiffness curvesGrillage model roll stiffness curve (K = 200 ksi)Grillage model roll stiffness curve (K = 400 ksi)
Rotation (rad)
Mom
ent (
kip-
in)
Pad A - 100 psi axial load
0 0.004 0.008 0.012 0.0160
200
400
600
800
Rotation (rad)
Mom
ent (
kip-
in)
Pad A - 350 psi axial load
0 0.004 0.008 0.012 0.0160
200
400
600
800
Rotation (rad)
Mom
ent (
kip-
in)
Pad B - 200 psi axial load
0 0.004 0.008 0.012 0.0160
200
400
600
800
Rotation (rad)
Mom
ent (
kip-
in)
Pad B - 300 psi axial load
0 0.004 0.008 0.012 0.0160
200
400
600
800
Rotation (rad)
Mom
ent (
kip-
in)
Pad C1 - 350 psi axial load
0 0.004 0.008 0.012 0.0160
200
400
600
800
Rotation (rad)
Mom
ent (
kip-
in)
Pad C2, 350 psi axial load
0 0.004 0.008 0.012 0.0160
200
400
600
800
FIGURE 11 Comparison of experimentally measured bearing pad roll stiffnesses and roll stiffnesses predicted by the proposed computation method.
TRB 2013 Annual Meeting Paper revised from original submittal.
Harper, Consolazio 19
Bearing Pad
Support
Girder
Slope angle
a)
Prescribed slope angle
Applied overturning moment
b)
FIGURE 12 Bearing pad slope. a) Girder in sloped contact with pad; b) Grillage model incorporating slope
TRB 2013 Annual Meeting Paper revised from original submittal.
Harper, Consolazio 20
Experimental roll stiffness curvesGrillage model roll stiffness curve (K = 200 ksi)Grillage model roll stiffness curve (K = 400 ksi)
Rotation (rad)
Mom
ent (
kip-
in)
Pad A - 0.02 rad slope
0 0.004 0.008 0.0120
200
400
600
800
Rotation (rad)
Mom
ent (
kip-
in)
Pad A - 0.04 rad slope
0 0.004 0.008 0.0120
200
400
600
800
Rotation (rad)
Mom
ent (
kip-
in)
Pad B - 0.02 rad slope
0 0.004 0.008 0.0120
200
400
600
800
Rotation (rad)
Mom
ent (
kip-
in)
Pad B - 0.03 rad slope
0 0.004 0.008 0.0120
200
400
600
800
FIGURE 13 Comparison of experimentally measured bearing pad roll stiffnesses and roll stiffnesses predicted by the proposed computation method with non-zero slope.
TRB 2013 Annual Meeting Paper revised from original submittal.
Related Documents