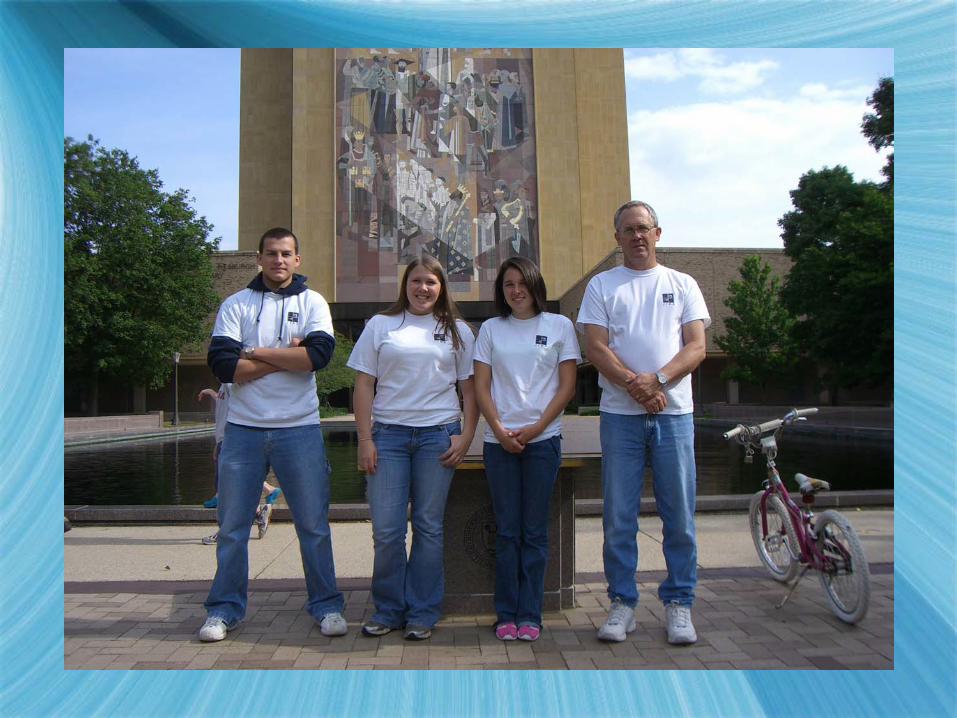
PIXE-PAN 2007: Calculating the Speed of Light PIXE-PAN 2007: Calculating the Speed of Light By: Annie Sauer, Caitlyn Koscielski, and Gary Brizendine II Advisor: Mark Mankowski By: Annie Sauer, Caitlyn Koscielski, and Gary Brizendine II Advisor: Mark Mankowski

Welcome message from author
This document is posted to help you gain knowledge. Please leave a comment to let me know what you think about it! Share it to your friends and learn new things together.
Transcript
PIXE-PAN 2007: Calculating the Speed of Light
PIXE-PAN 2007: Calculating the Speed of Light
By: Annie Sauer, Caitlyn Koscielski, and Gary Brizendine II
Advisor: Mark Mankowski
By: Annie Sauer, Caitlyn Koscielski, and Gary Brizendine II
Advisor: Mark Mankowski
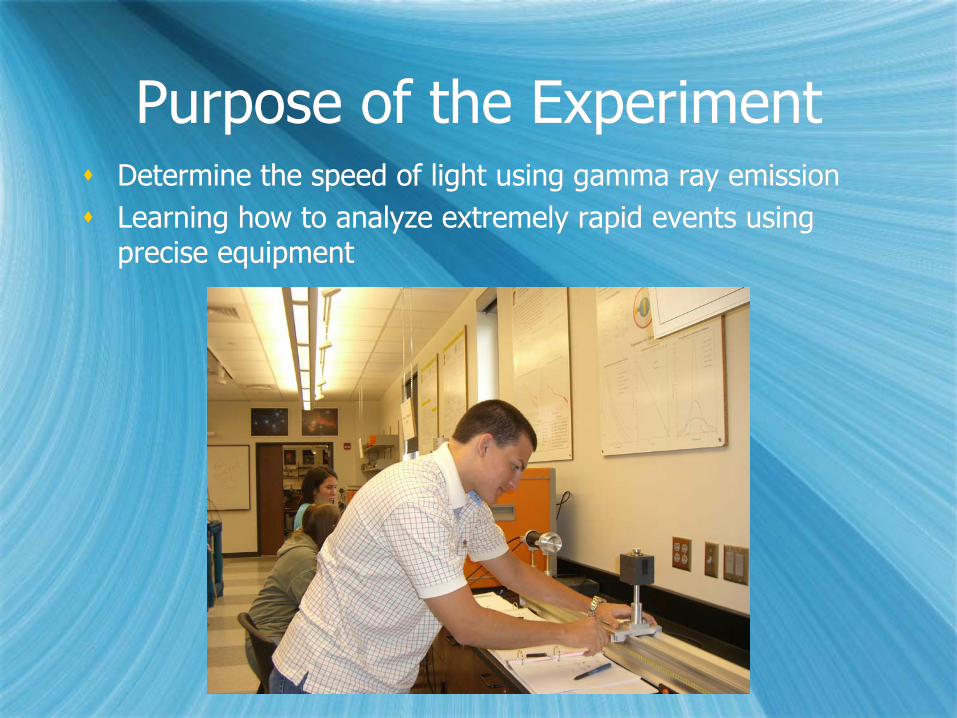
Purpose of the ExperimentPurpose of the ExperimentDetermine the speed of light using gamma ray emissionLearning how to analyze extremely rapid events using precise equipment
Determine the speed of light using gamma ray emissionLearning how to analyze extremely rapid events using precise equipment
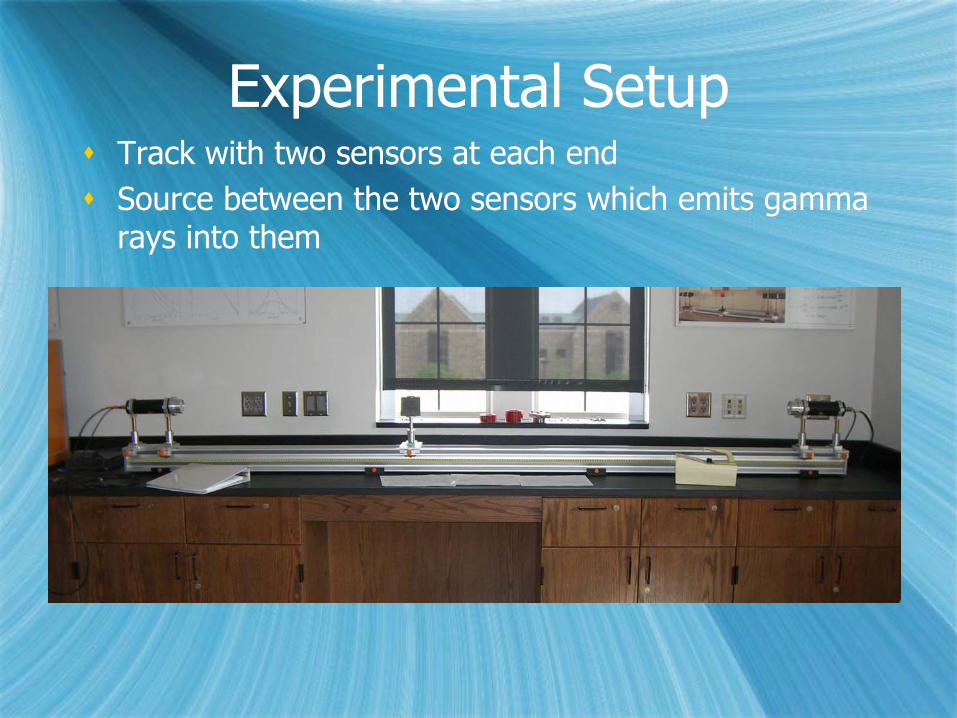
Experimental SetupExperimental SetupTrack with two sensors at each endSource between the two sensors which emits gamma rays into them
Track with two sensors at each endSource between the two sensors which emits gamma rays into them
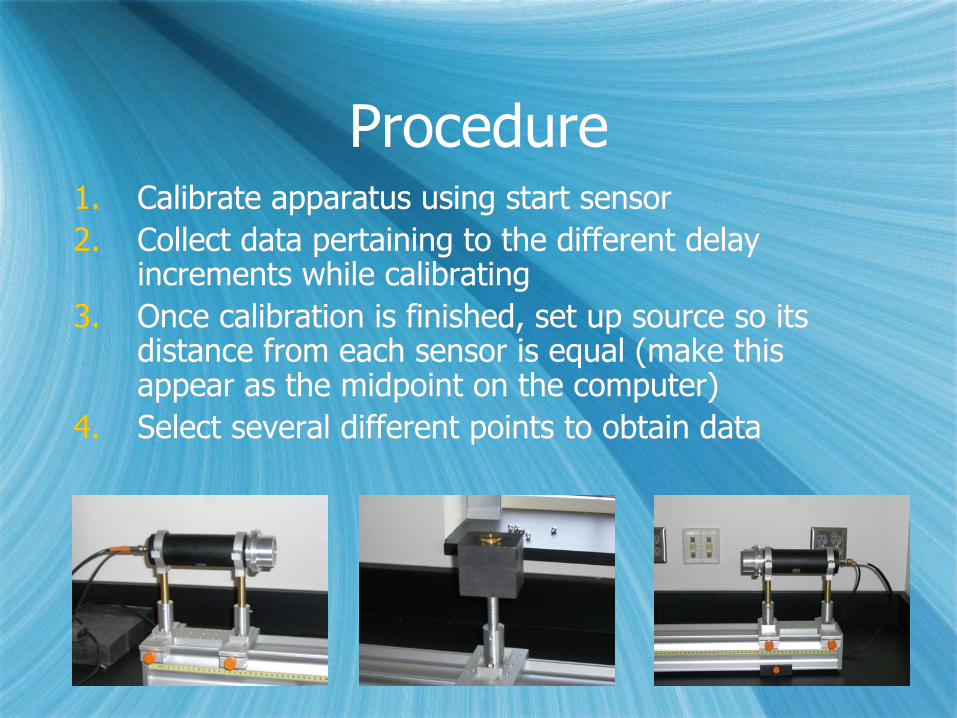
ProcedureProcedure1. Calibrate apparatus using start sensor2. Collect data pertaining to the different delay
increments while calibrating3. Once calibration is finished, set up source so its
distance from each sensor is equal (make this appear as the midpoint on the computer)
4. Select several different points to obtain data
1. Calibrate apparatus using start sensor2. Collect data pertaining to the different delay
increments while calibrating3. Once calibration is finished, set up source so its
distance from each sensor is equal (make this appear as the midpoint on the computer)
4. Select several different points to obtain data
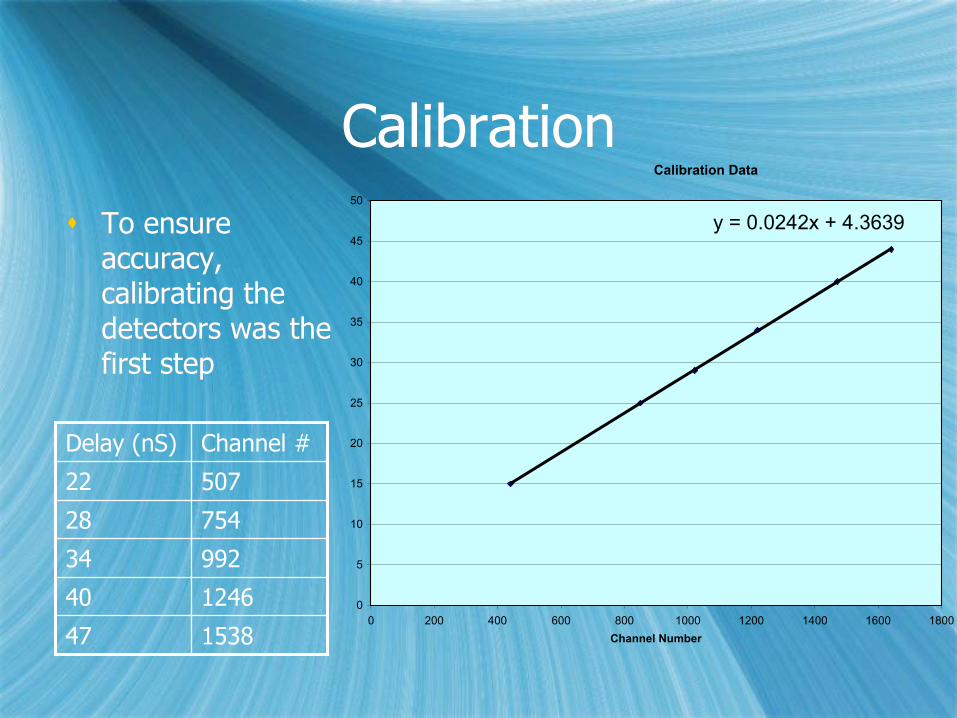
CalibrationCalibrationTo ensure accuracy, calibrating the detectors was the first step
To ensure accuracy, calibrating the detectors was the first step
153847
124640
99234
75428
50722
Channel #Delay (nS)
Calibration Data
y = 0.0242x + 4.3639
0
5
10
15
20
25
30
35
40
45
50
0 200 400 600 800 1000 1200 1400 1600 1800Channel Number
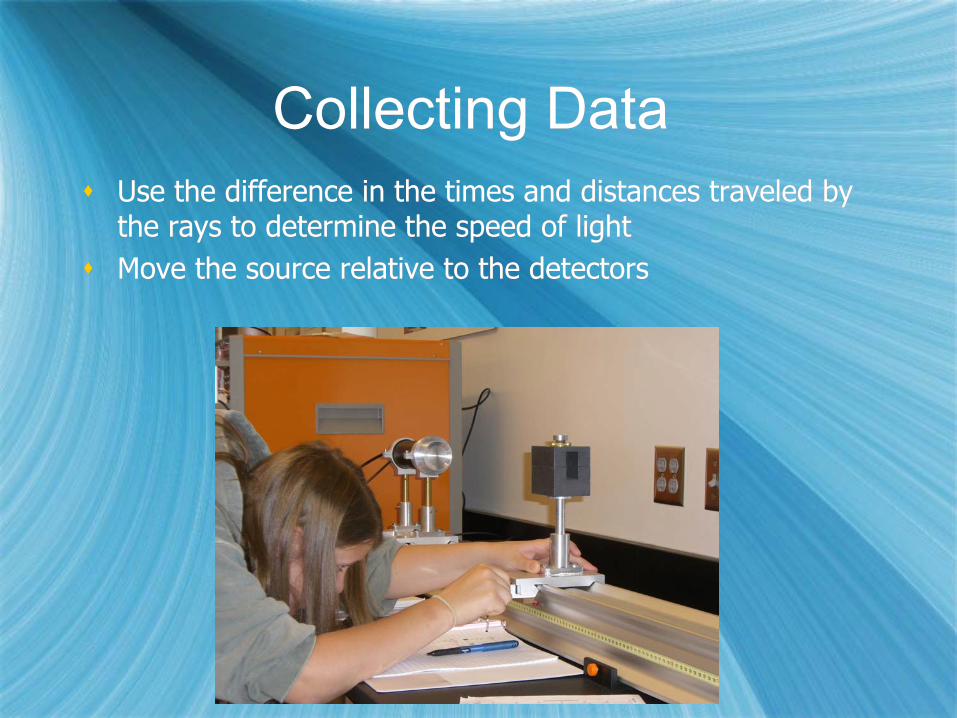
Collecting DataCollecting DataUse the difference in the times and distances traveled by the rays to determine the speed of lightMove the source relative to the detectors
Use the difference in the times and distances traveled by the rays to determine the speed of lightMove the source relative to the detectors
How It WorksHow It WorksThe source (sodium-22) emits a positron that annihilates an electron in its path, releasing two photons that have 511 keVThe detectors pick up the photons and sends an analog signal to a converterThe converter sends a digital signal to the computerThe computer records the delay from each sensor (start and stop sensors)The peak of each signal is determined and recorded as data
The source (sodium-22) emits a positron that annihilates an electron in its path, releasing two photons that have 511 keVThe detectors pick up the photons and sends an analog signal to a converterThe converter sends a digital signal to the computerThe computer records the delay from each sensor (start and stop sensors)The peak of each signal is determined and recorded as data
Analysis Analysis After recording the data, it is transferred to a table in excelUse the table to make graphs of the dataCreate the trend-line of the graphsTwo graphs: one for the calibration data and one for the experiment dataUse the slopes of the two graphs to find the speed of light
After recording the data, it is transferred to a table in excelUse the table to make graphs of the dataCreate the trend-line of the graphsTwo graphs: one for the calibration data and one for the experiment dataUse the slopes of the two graphs to find the speed of light
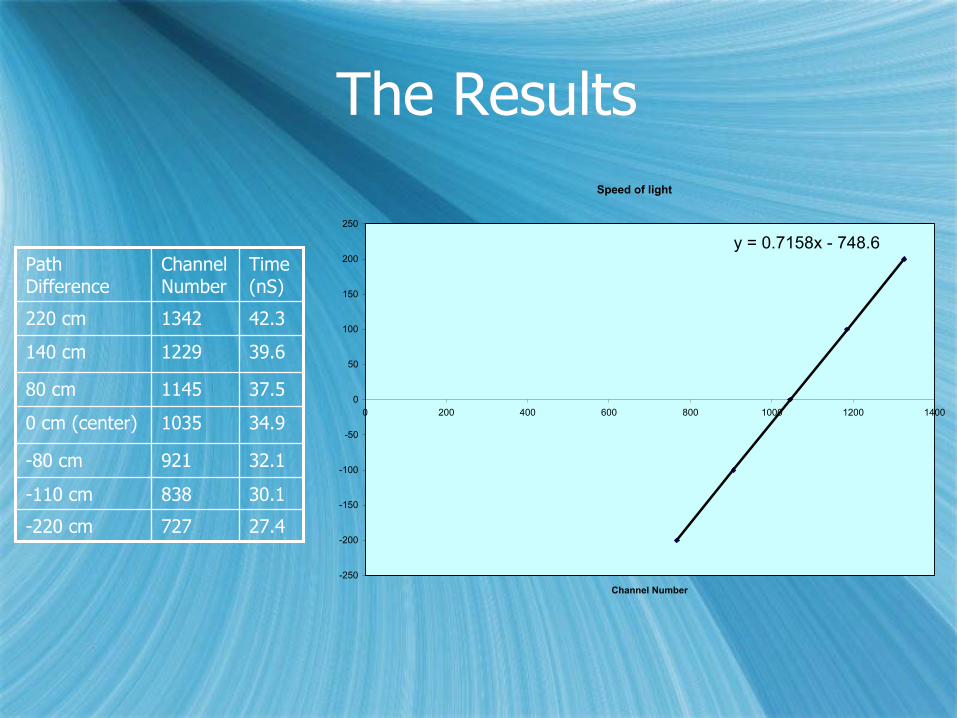
The ResultsThe Results
27.4727-220 cm
30.1838-110 cm
32.1921-80 cm
34.910350 cm (center)
37.5114580 cm
39.61229140 cm
42.31342220 cm
Time (nS)
Channel Number
Path Difference
Speed of light
y = 0.7158x - 748.6
-250
-200
-150
-100
-50
0
50
100
150
200
250
0 200 400 600 800 1000 1200 1400
Channel Number
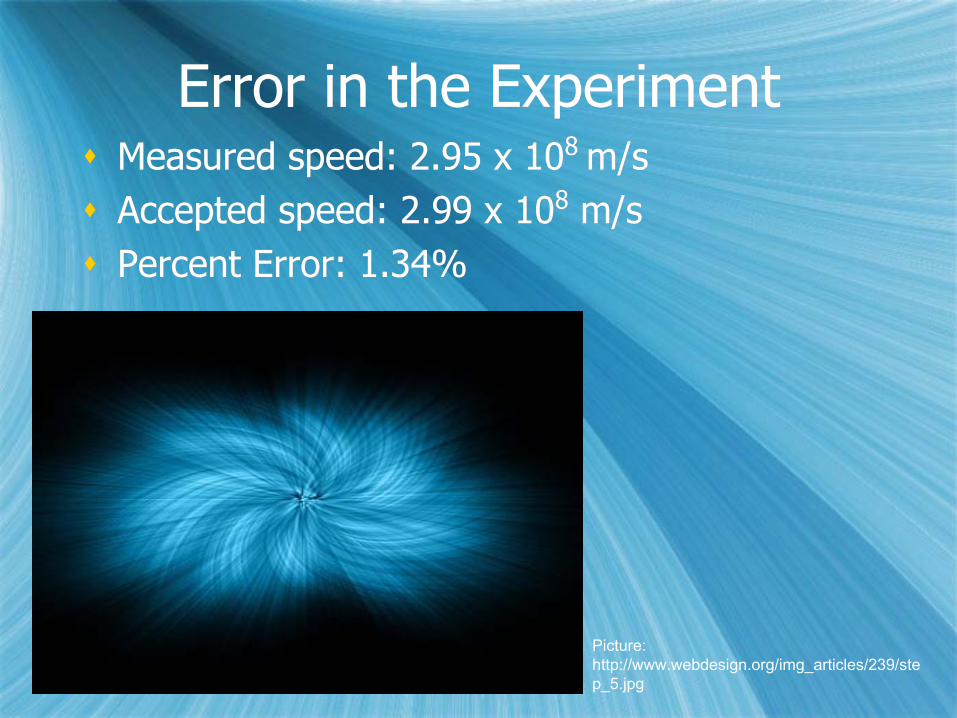
Error in the ExperimentError in the ExperimentMeasured speed: 2.95 x 10⁸ m/sAccepted speed: 2.99 x 10⁸ m/sPercent Error: 1.34%
Measured speed: 2.95 x 10⁸ m/sAccepted speed: 2.99 x 10⁸ m/sPercent Error: 1.34%
Picture: http://www.webdesign.org/img_articles/239/step_5.jpg
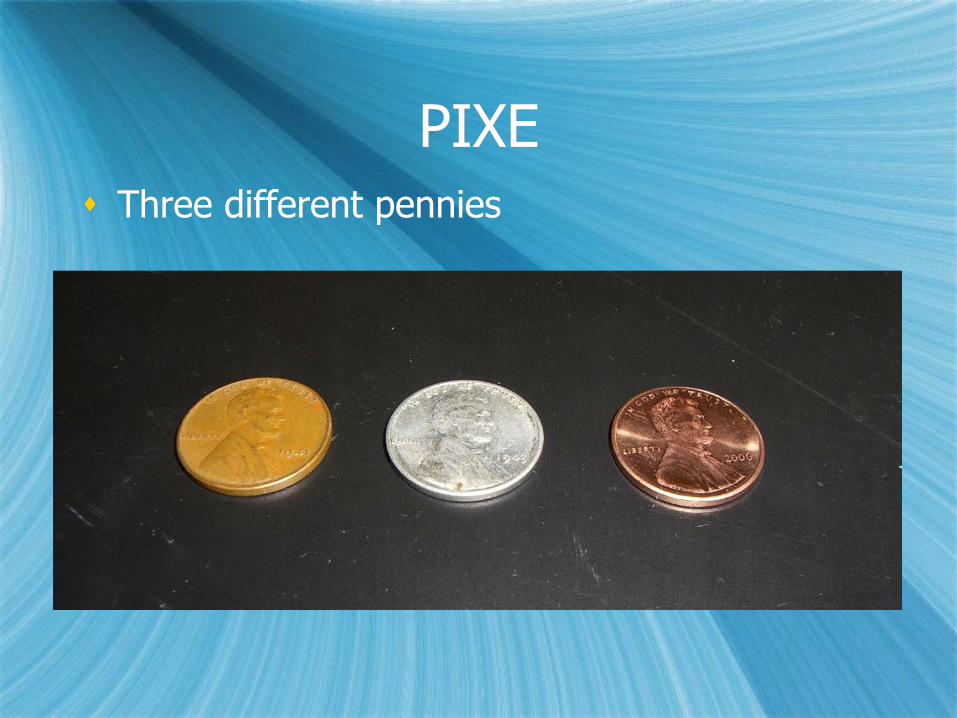
PIXEPIXEThree different penniesThree different pennies
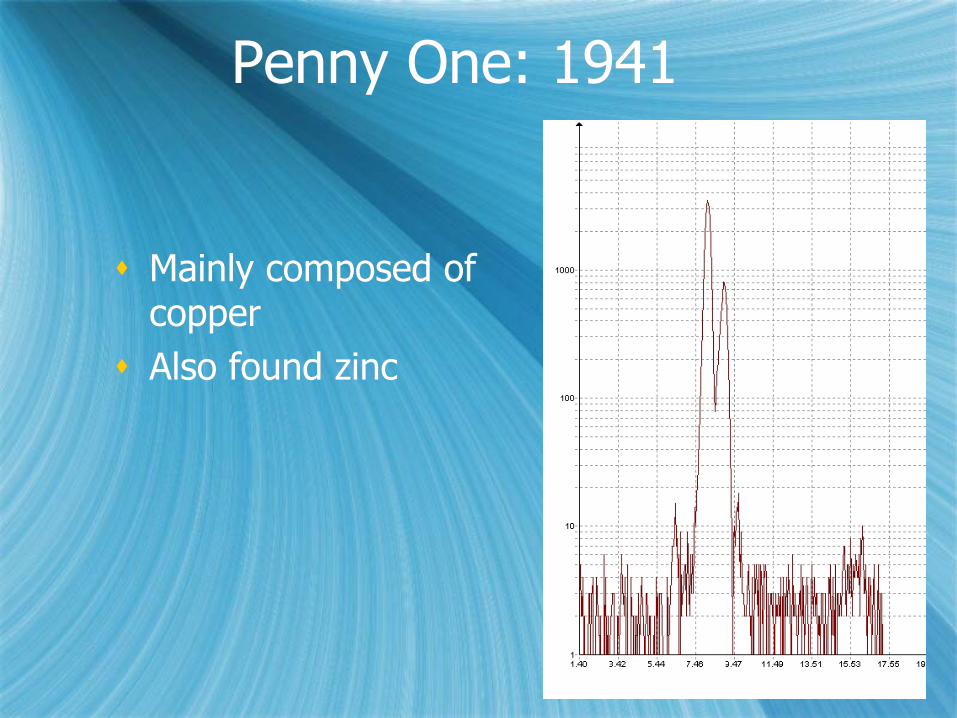
Penny One: 1941Penny One: 1941
Mainly composed of copper Also found zinc
Mainly composed of copper Also found zinc
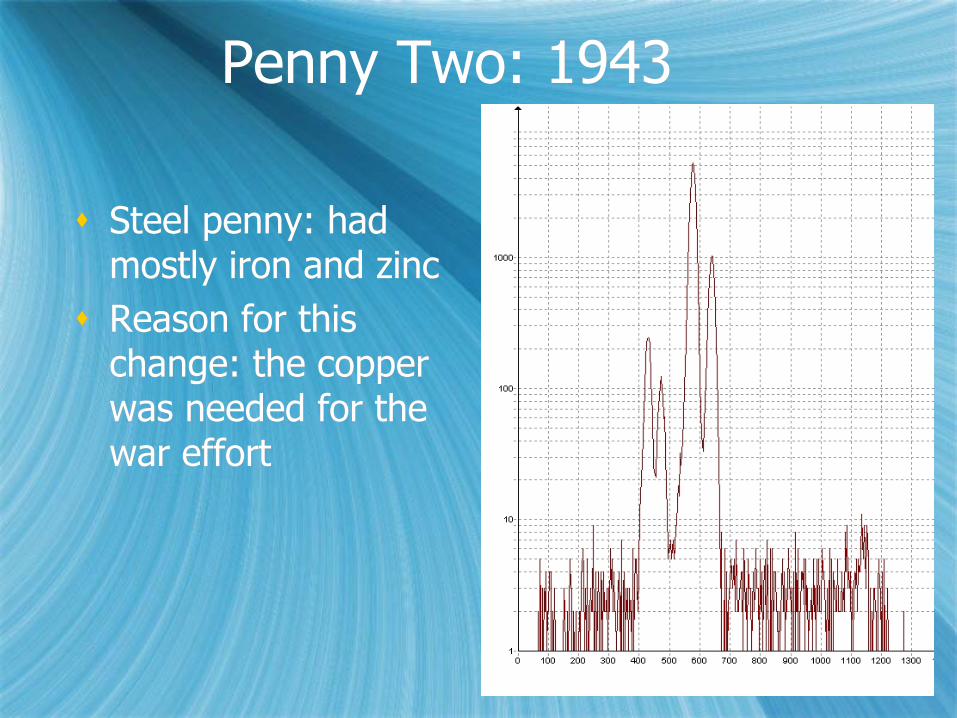
Penny Two: 1943Penny Two: 1943
Steel penny: had mostly iron and zincReason for this change: the copper was needed for the war effort
Steel penny: had mostly iron and zincReason for this change: the copper was needed for the war effort
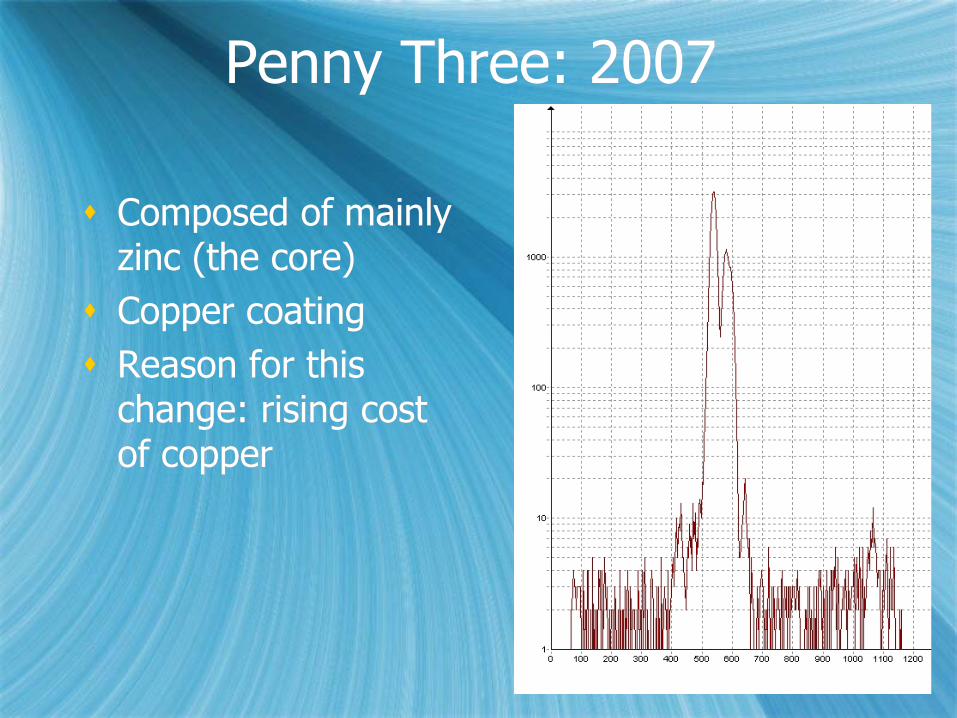
Penny Three: 2007Penny Three: 2007
Composed of mainly zinc (the core)Copper coatingReason for this change: rising cost of copper
Composed of mainly zinc (the core)Copper coatingReason for this change: rising cost of copper
Related Documents


![Speed of light [3 of 4] Light speed measured by Ole Romer](https://static.cupdf.com/doc/110x72/55d2e8bbbb61eba63c8b4695/speed-of-light-3-of-4-light-speed-measured-by-ole-romer.jpg)


