Calculate Cost of Service with Multiple Cost Pools and Drivers Intermediate Cost Analysis and Management 1

Calculate Cost of Service with Multiple Cost Pools and Drivers 1.
Dec 28, 2015
Welcome message from author
This document is posted to help you gain knowledge. Please leave a comment to let me know what you think about it! Share it to your friends and learn new things together.
Transcript
1
Calculate Cost of Service with Multiple Cost Pools and Drivers
Intermediate Cost Analysis and Management
2
Why did this cost measurement method fail?
Thank You
Fillet and Lobster 35.00Chicken Kiev 15.00Top Sirloin 20.00Caesar Salad 9.00Coffee 2 @1.00 2.00House Wine 4 @5.00 20.00Champagne 24.00Ice Cream 4.00Chocolate Cheesecake 6.00Sampler 10.00Soup/Salad 8.00Aperitif 7 .00
Total $160.00
Chez Paris
Bob
Carol
Ted
Alice
3
Terminal Learning Objective
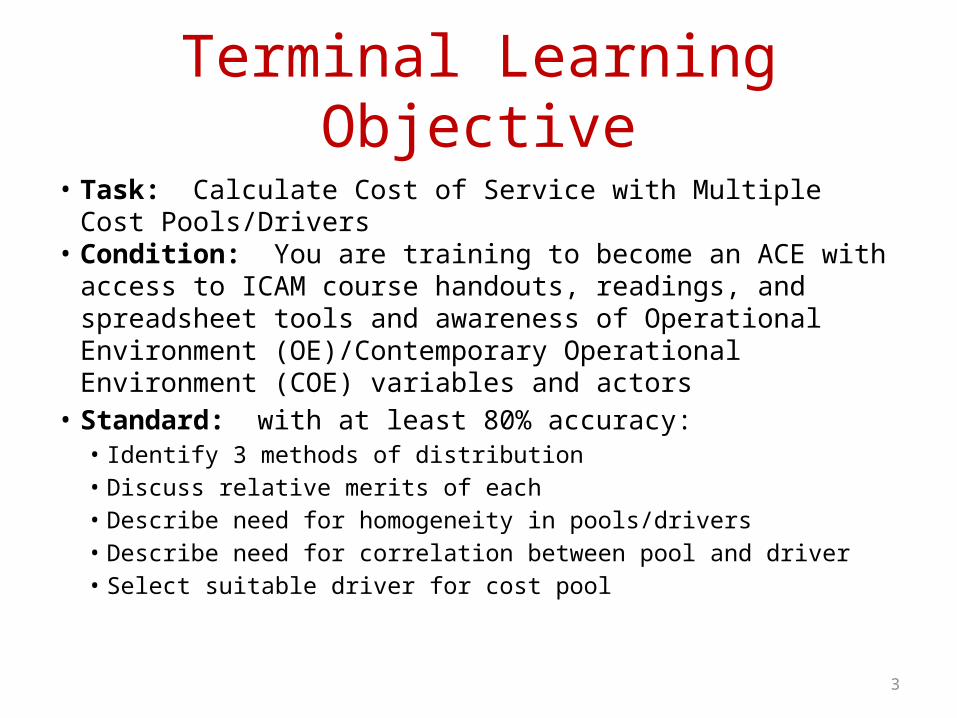
• Task: Calculate Cost of Service with Multiple Cost Pools/Drivers
• Condition: You are training to become an ACE with access to ICAM course handouts, readings, and spreadsheet tools and awareness of Operational Environment (OE)/Contemporary Operational Environment (COE) variables and actors
• Standard: with at least 80% accuracy:• Identify 3 methods of distribution• Discuss relative merits of each• Describe need for homogeneity in pools/drivers• Describe need for correlation between pool and driver• Select suitable driver for cost pool
4
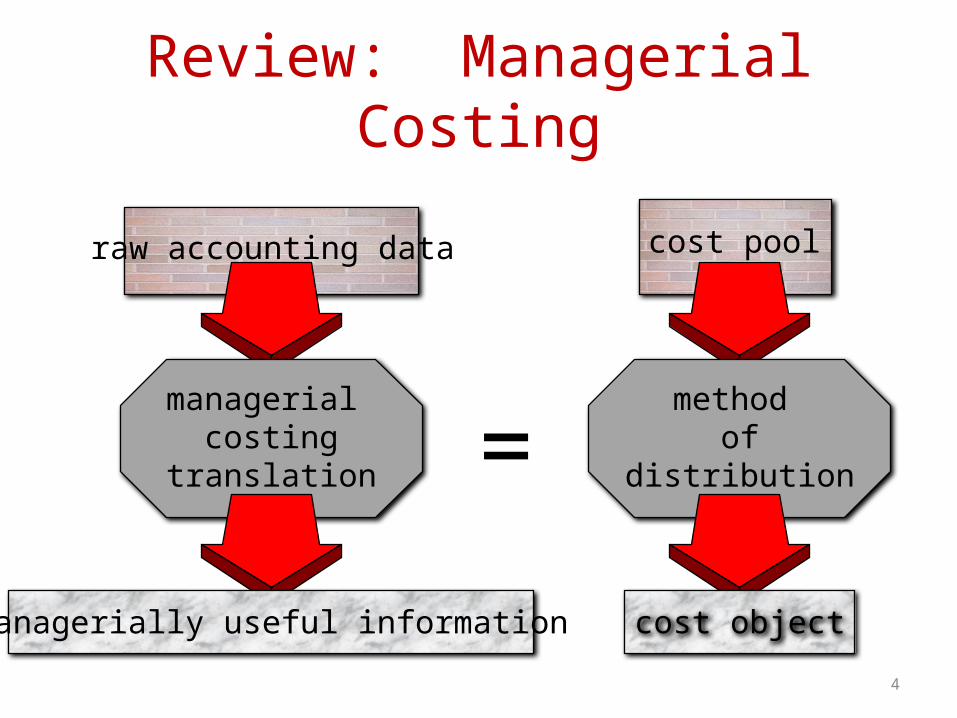
Review: Managerial Costing
raw accounting data
managerial costing
translation
managerially useful information
=
cost pool
method of
distribution
cost object
5
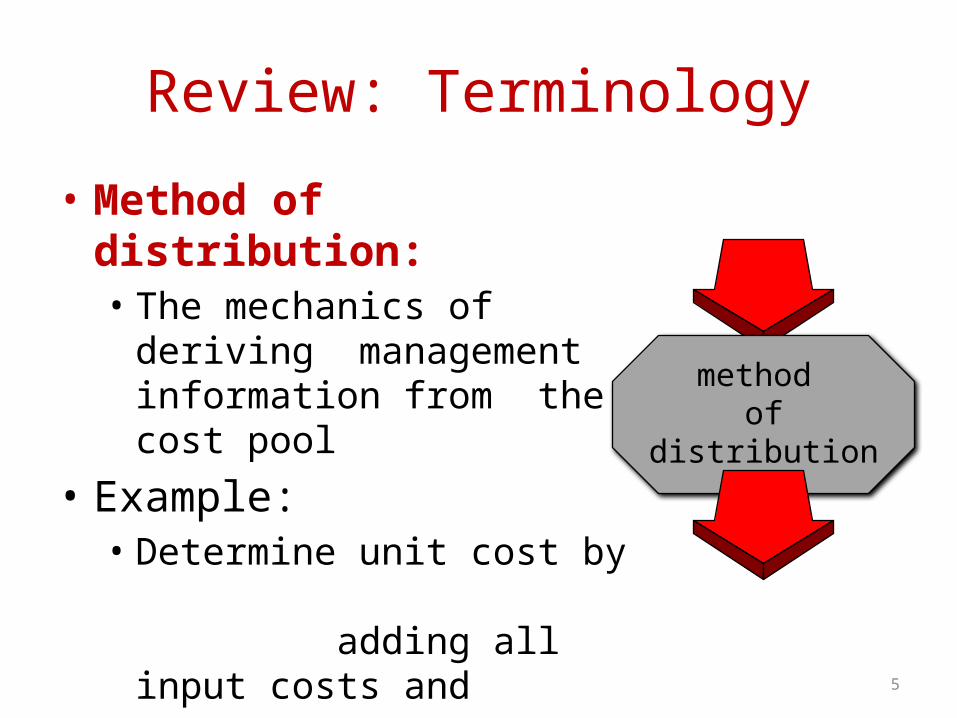
Review: Terminology
• Method of distribution:• The mechanics of deriving
management information from the cost pool
• Example:• Determine unit cost by
adding all input costs and dividing by number of units
method of
distribution
6
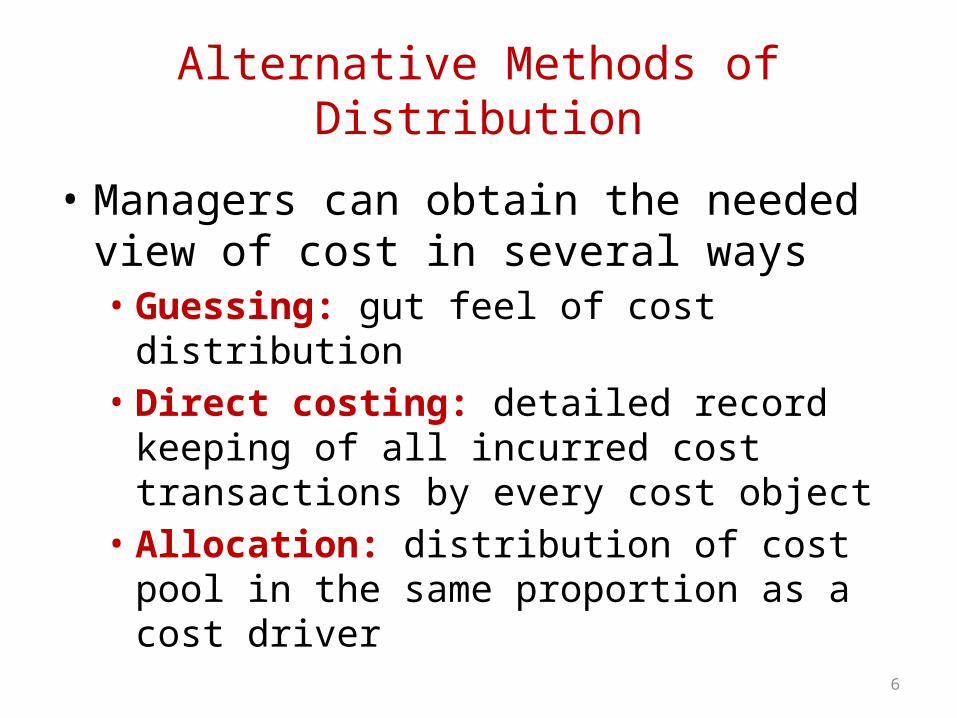
Alternative Methods of Distribution
• Managers can obtain the needed view of cost in several ways• Guessing: gut feel of cost distribution• Direct costing: detailed record keeping of all
incurred cost transactions by every cost object• Allocation: distribution of cost pool in the same
proportion as a cost driver
7
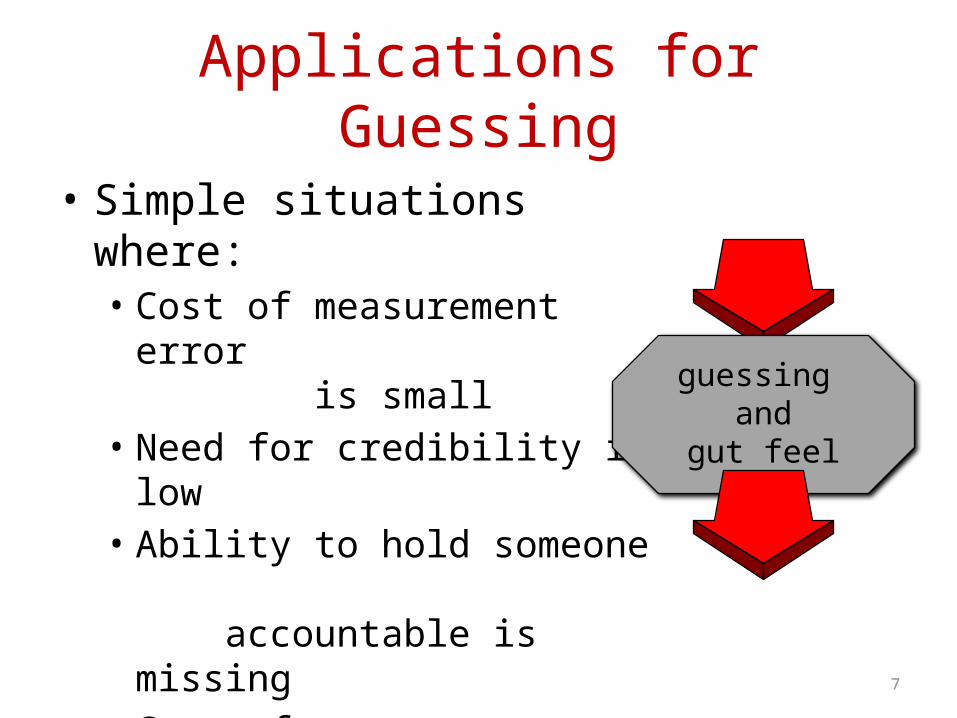
Applications for Guessing
• Simple situations where:• Cost of measurement error
is small• Need for credibility is low• Ability to hold someone
accountable is missing• Cost of cost measurement
is high
guessing and
gut feel
8
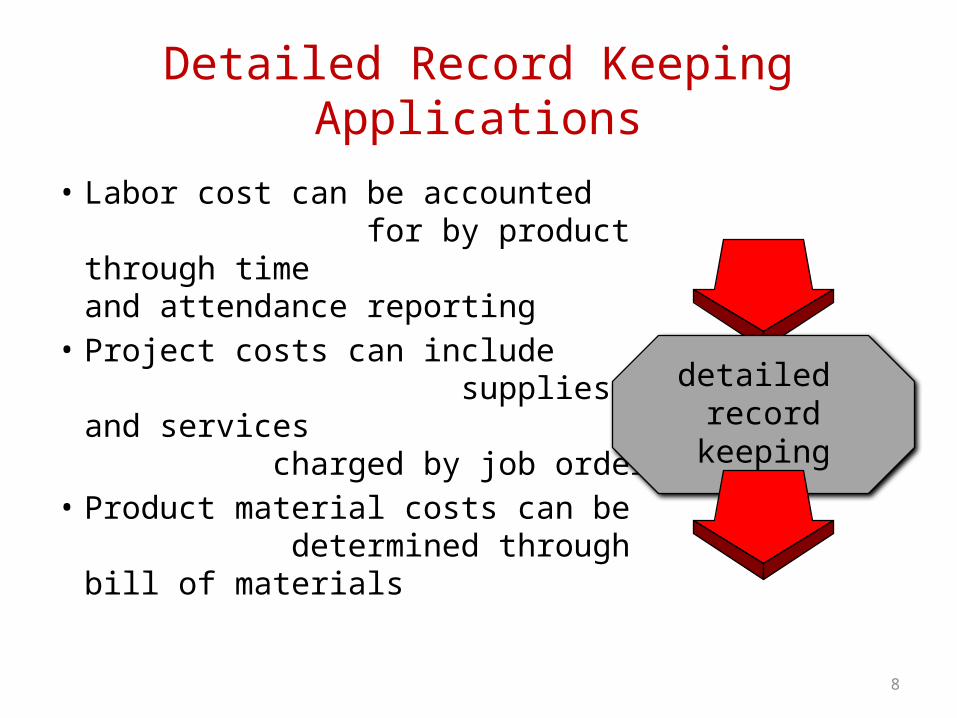
Detailed Record Keeping Applications
• Labor cost can be accounted for by product through time and attendance reporting
• Project costs can include supplies and services charged by job order
• Product material costs can be determined through bill of materials
detailed record
keeping

9
Examples of Detailed Record Keeping
• Job order charges• Bill of materials system• Time and attendance reporting
10
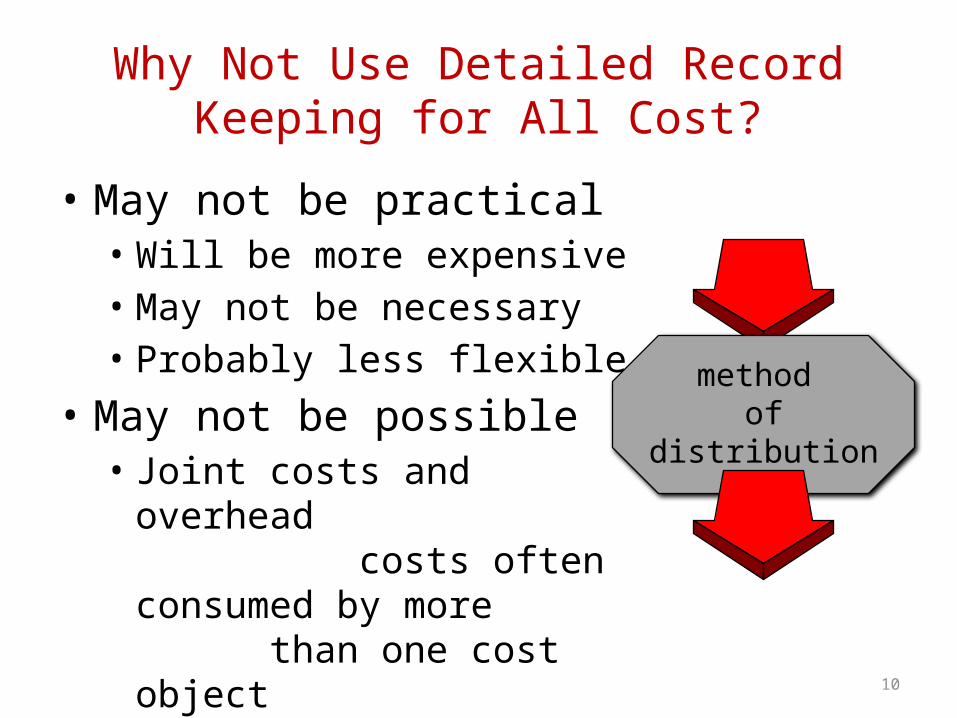
Why Not Use Detailed Record Keeping for All Cost?
• May not be practical• Will be more expensive• May not be necessary• Probably less flexible
• May not be possible• Joint costs and overhead
costs often consumed by more than one cost object
method of
distribution
11
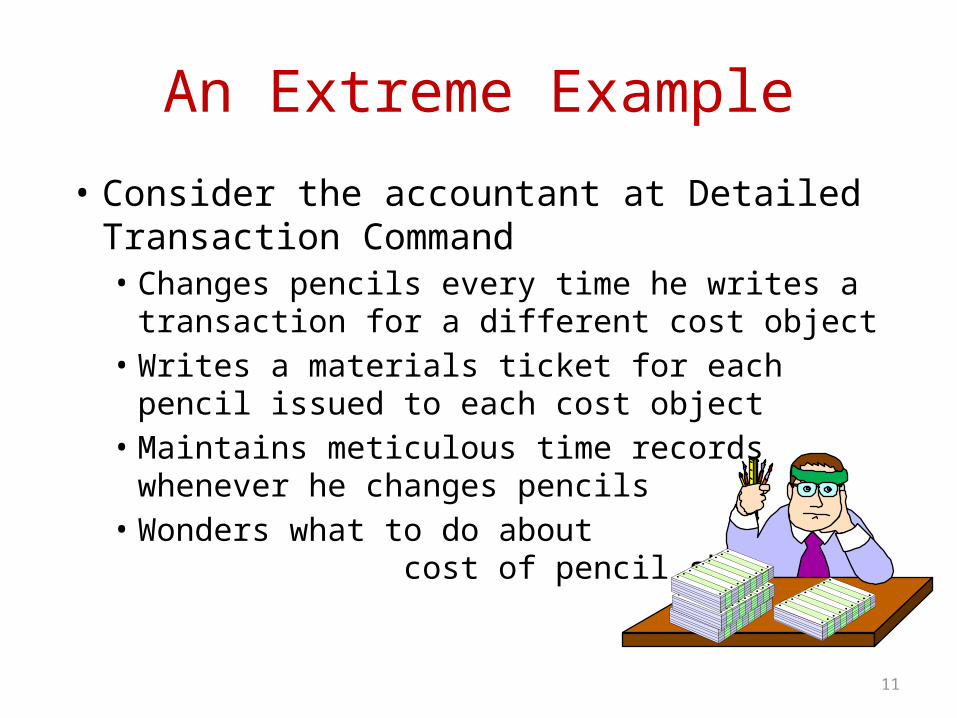
An Extreme Example
• Consider the accountant at Detailed Transaction Command• Changes pencils every time he writes a transaction for a
different cost object• Writes a materials ticket for each pencil issued to each
cost object• Maintains meticulous time records
whenever he changes pencils• Wonders what to do about cost of
pencil sharpener?

12
Method of Distribution Comparison
cost of method accuracy flexibility
guessing cheap poor good
direct very expensive good poor
allocation reasonable reasonable reasonable
13
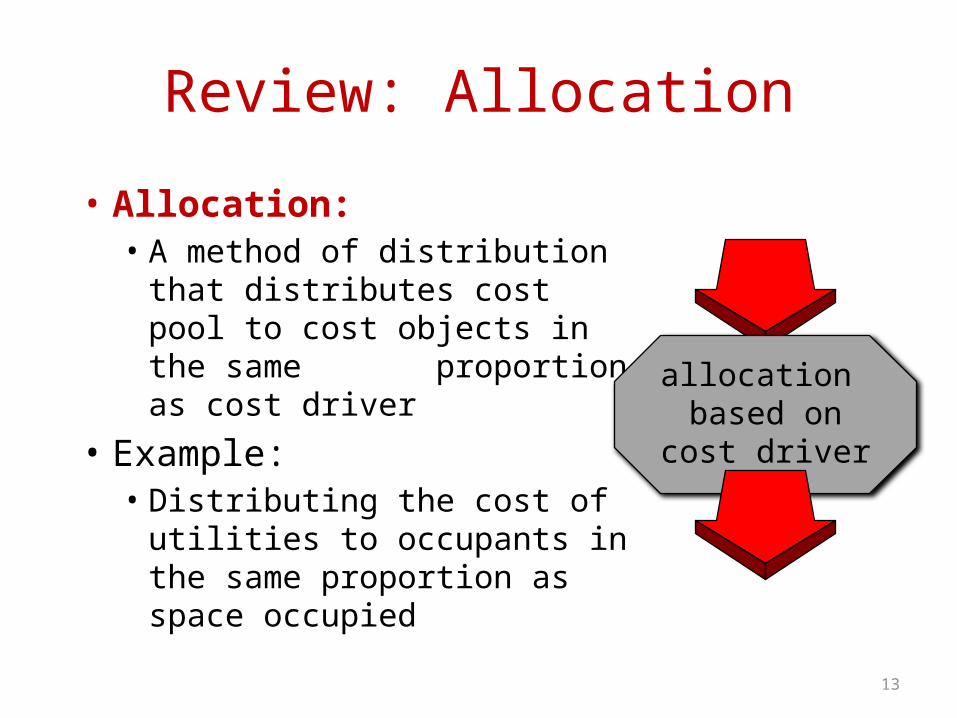
Review: Allocation
• Allocation: • A method of distribution that
distributes cost pool to cost objects in the same proportion as cost driver
• Example:• Distributing the cost of utilities
to occupants in the same proportion as space occupied
allocation based on
cost driver
14
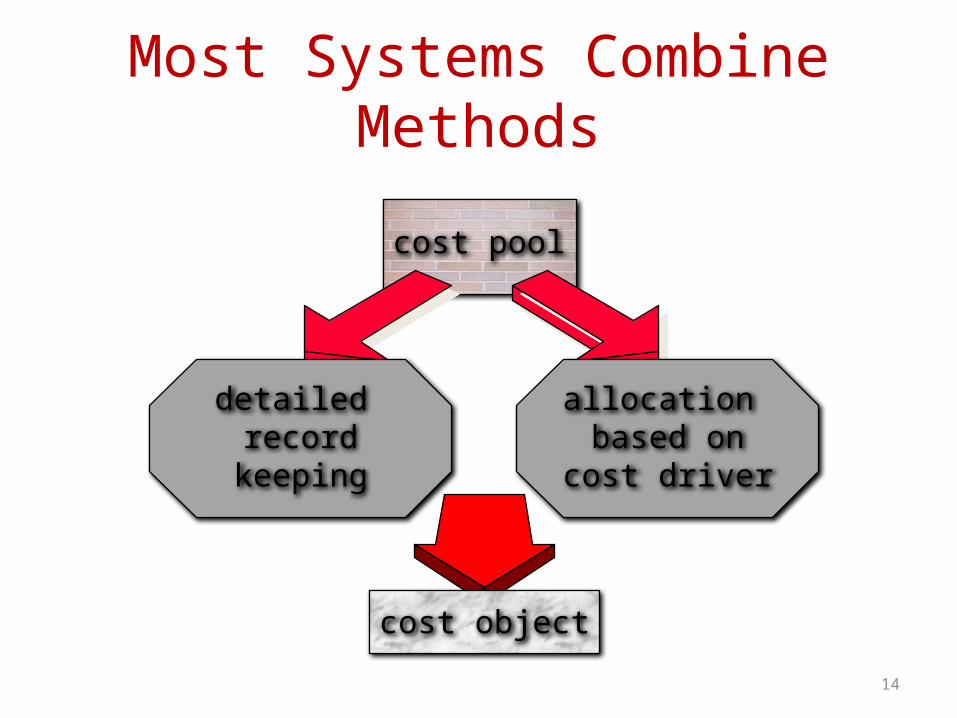
cost pool
Most Systems Combine Methods
cost object
detailed record
keeping
allocation based on
cost driver

15
Production Control
Management
Receptionist
Accounting/Payroll
Combining MethodsDetailed Record Keeping Allocation
Labor
Materials
16
Choosing a Method of Distribution
• Use guessing for simple decision making• Keep detailed records when accounting cost is
low and high accuracy useful• Allocate overhead, support, and indirect costs
when appropriate• Consider management’s needs for precision
and timeliness
17
Discussion: Telephone Charges
• Should these be allocated or charged via detailed, call-by-call records?
• Issues to consider • What does management need?• Is telephoning a core mission or support function?• Are detailed records available?
18
Learning Check
• Which method of distribution is the least expensive?
• Which method is the most accurate?
19
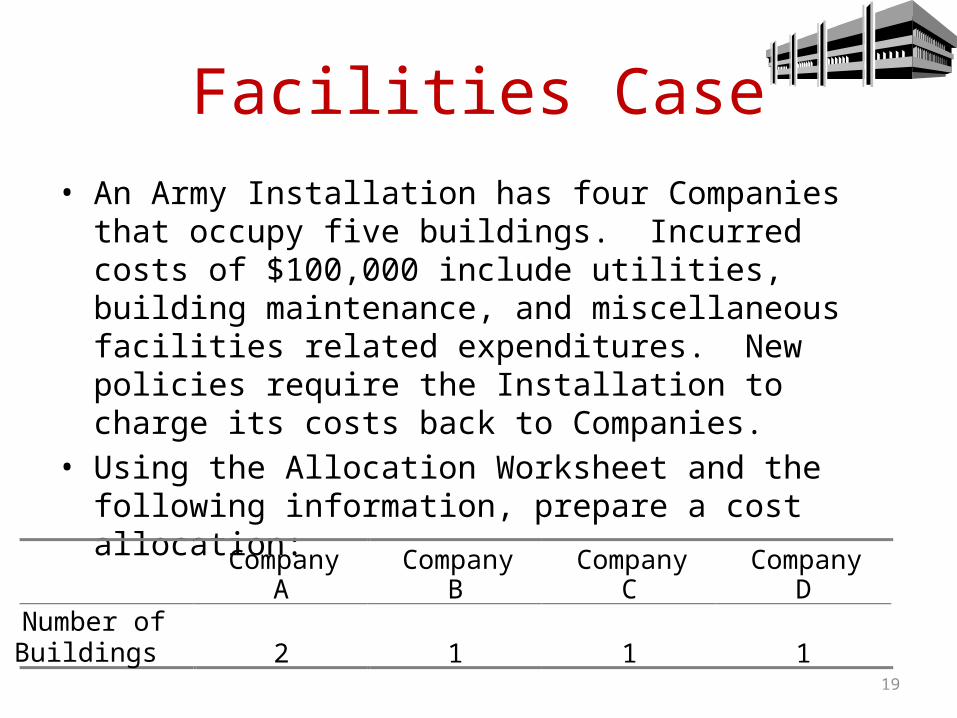
Facilities Case• An Army Installation has four Companies that occupy five
buildings. Incurred costs of $100,000 include utilities, building maintenance, and miscellaneous facilities related expenditures. New policies require the Installation to charge its costs back to Companies.
• Using the Allocation Worksheet and the following information, prepare a cost allocation:
CompanyA
CompanyB
CompanyC
CompanyD
Number ofBuildings 2 1 1 1
20
Consider:
• What are the cost objects?• What is the cost driver?• What is the rate per building?• What is each company’s proportion?• What assumptions are made in using number
of buildings as a cost driver?• Is this a good method of distribution?
21
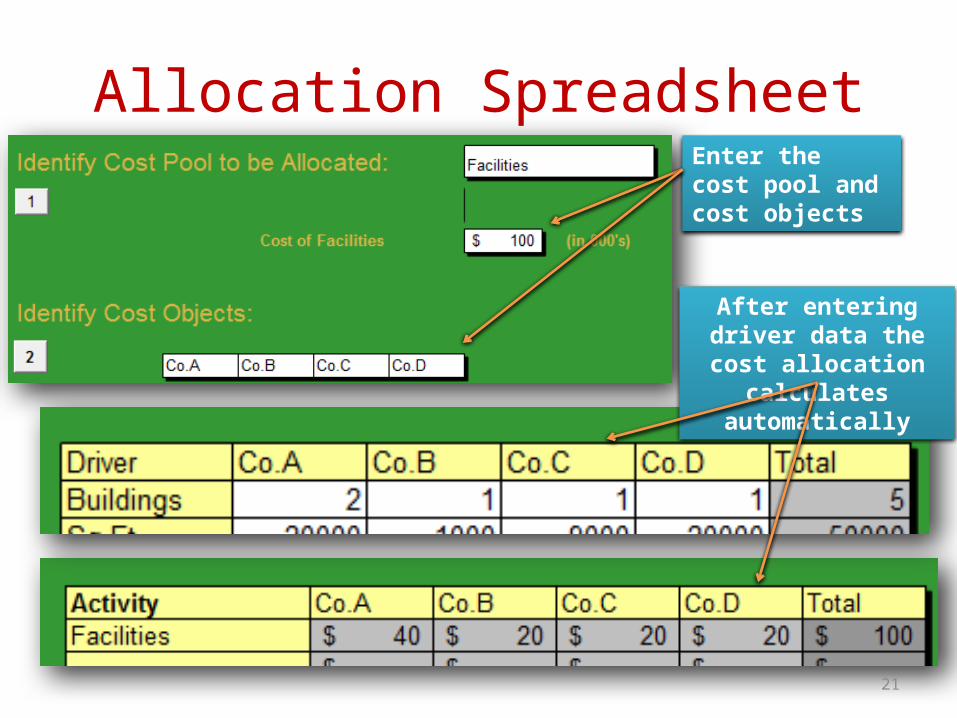
Allocation SpreadsheetEnter the cost pool and cost objects
After entering driver data the cost allocation
calculates automatically
22
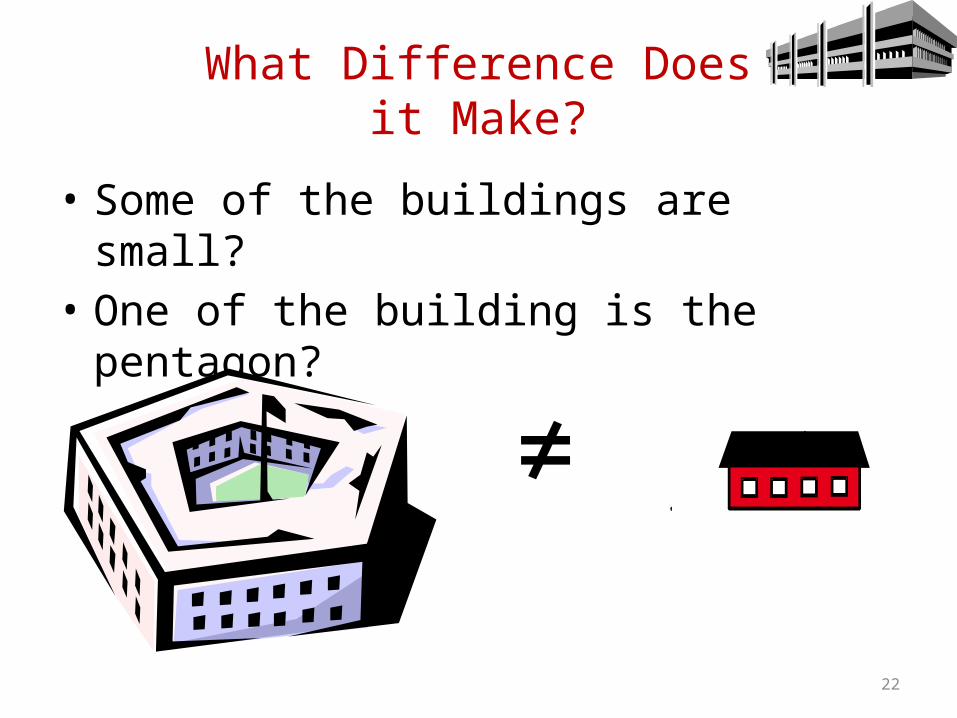
What Difference Doesit Make?
• Some of the buildings are small?• One of the building is the pentagon?
≠
23
Facilities Case B
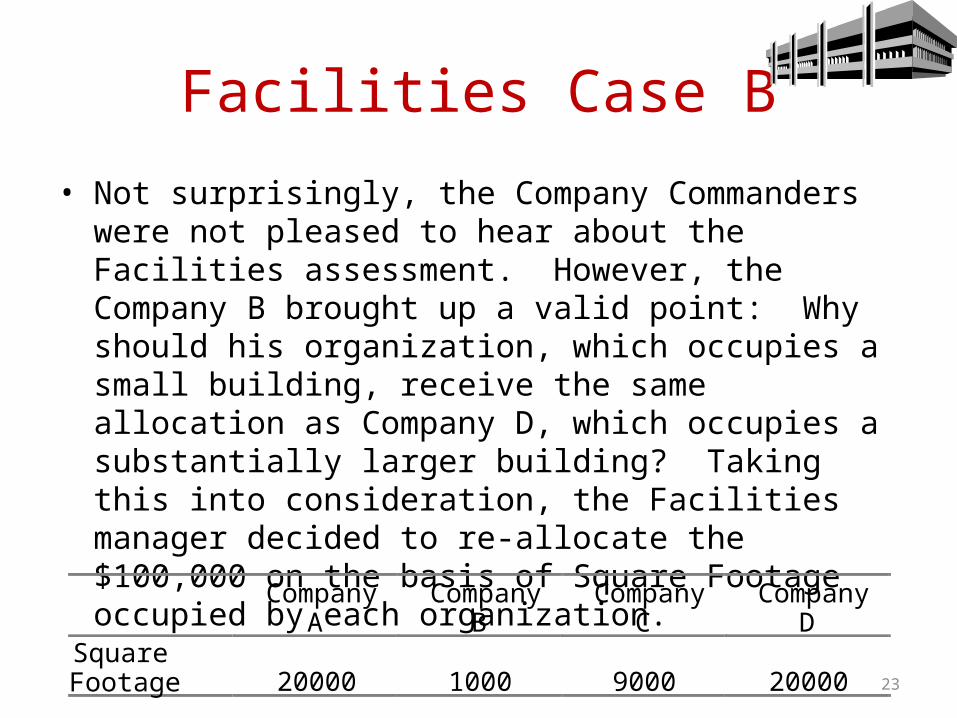
• Not surprisingly, the Company Commanders were not pleased to hear about the Facilities assessment. However, the Company B brought up a valid point: Why should his organization, which occupies a small building, receive the same allocation as Company D, which occupies a substantially larger building? Taking this into consideration, the Facilities manager decided to re-allocate the $100,000 on the basis of Square Footage occupied by each organization.
CompanyA
CompanyB
CompanyC
CompanyD
SquareFootage 20000 1000 9000 20000
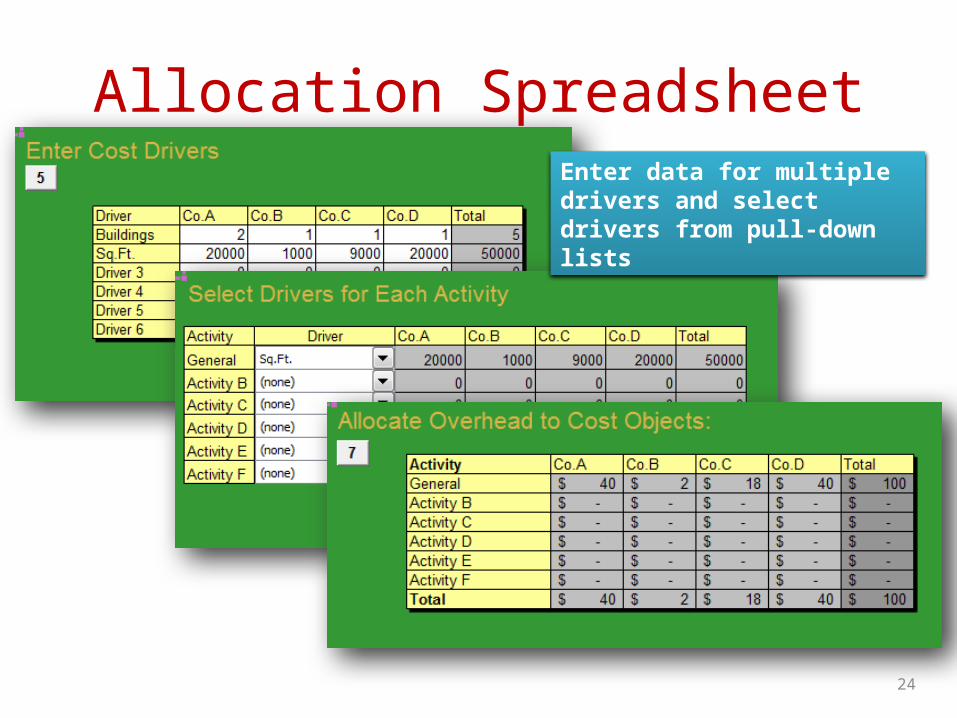
Allocation SpreadsheetEnter data for multiple drivers and select drivers from pull-down lists
24

25
Consider:
• What are the cost objects?• What is the cost driver?• What is the rate per square foot?• What is each company’s proportion?• Is this a better method of distribution? • Identify cross subsidizations and free goods
created by the Case A method
26
Facilities Case C
• At this point, the manager of Company D protested. Yes, he did have a large building, but it was not air conditioned. By his estimates, which were reasonably accurate, forty percent of the facilities expenditures were air conditioning related. These expenses included the additional electricity, maintenance and repair needed to keep the air conditioning units running.
27
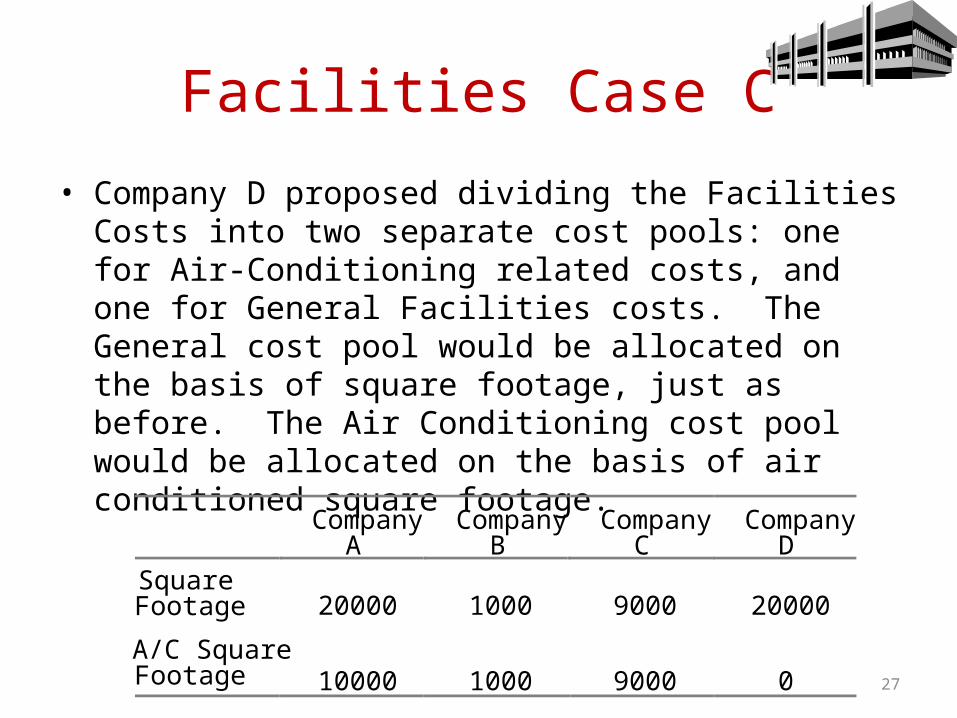
Facilities Case C
• Company D proposed dividing the Facilities Costs into two separate cost pools: one for Air-Conditioning related costs, and one for General Facilities costs. The General cost pool would be allocated on the basis of square footage, just as before. The Air Conditioning cost pool would be allocated on the basis of air conditioned square footage.
CompanyA
CompanyB
CompanyC
CompanyD
SquareFootage 20000 1000 9000 20000
A/C SquareFootage 10000 1000 9000 0
28
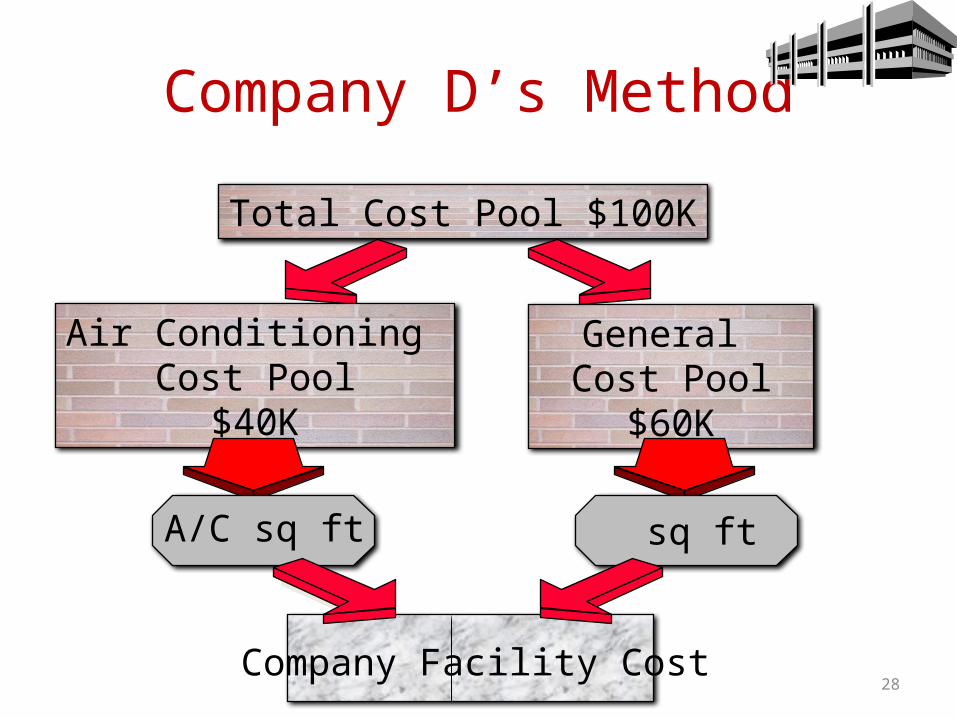
Total Cost Pool $100K
Company D’s Method
Air Conditioning Cost Pool
$40K
General Cost Pool
$60K
Company Facility Cost
A/C sq ft sq ft
29
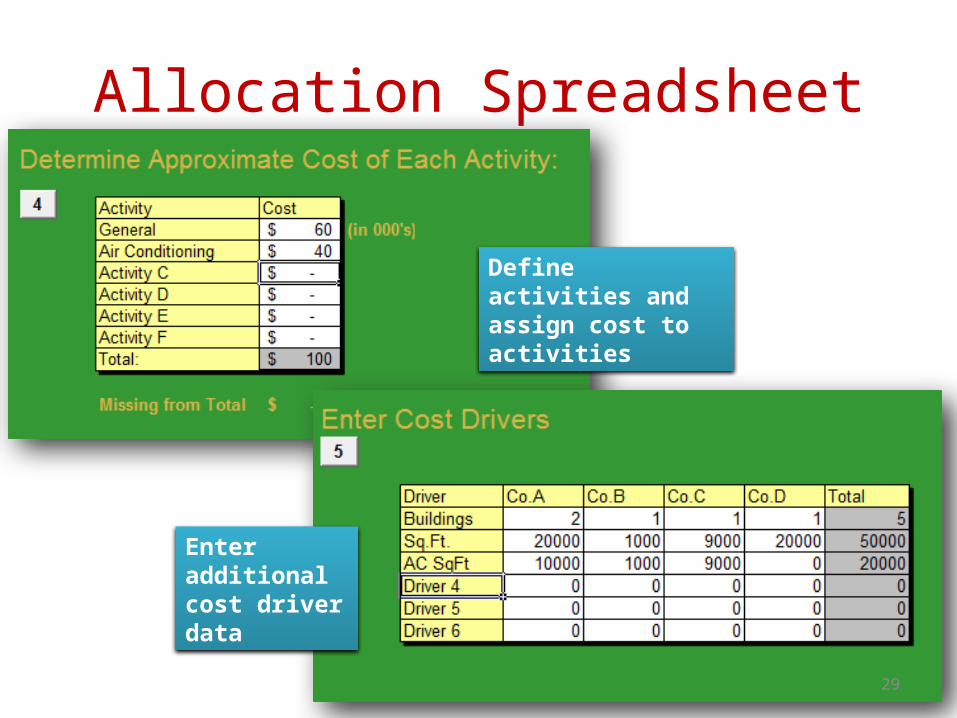
Allocation Spreadsheet
Define activities and assign cost to activities
Enter additional cost driver data
30
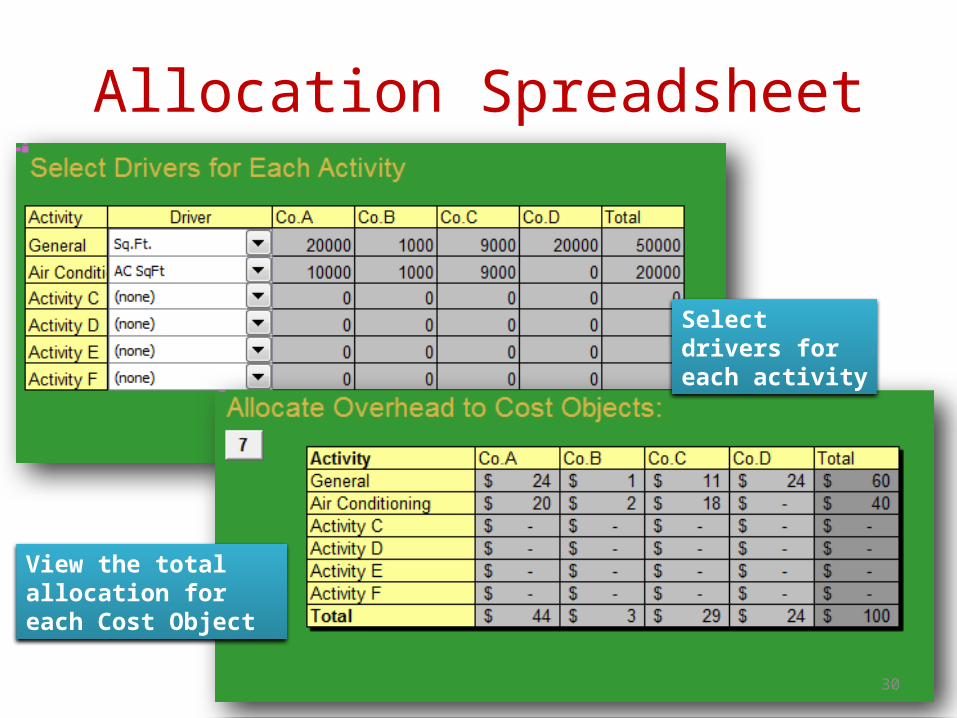
Allocation Spreadsheet
Select drivers for each activity
View the total allocation for each Cost Object
31
Consider:
• What is the new rate per square foot?• What is the rate per air conditioned square
foot?• Identify any cross subsidizations and free
goods created by Case B’s method • Is this a better method of distribution? • Why might this method not reflect true cost?
32
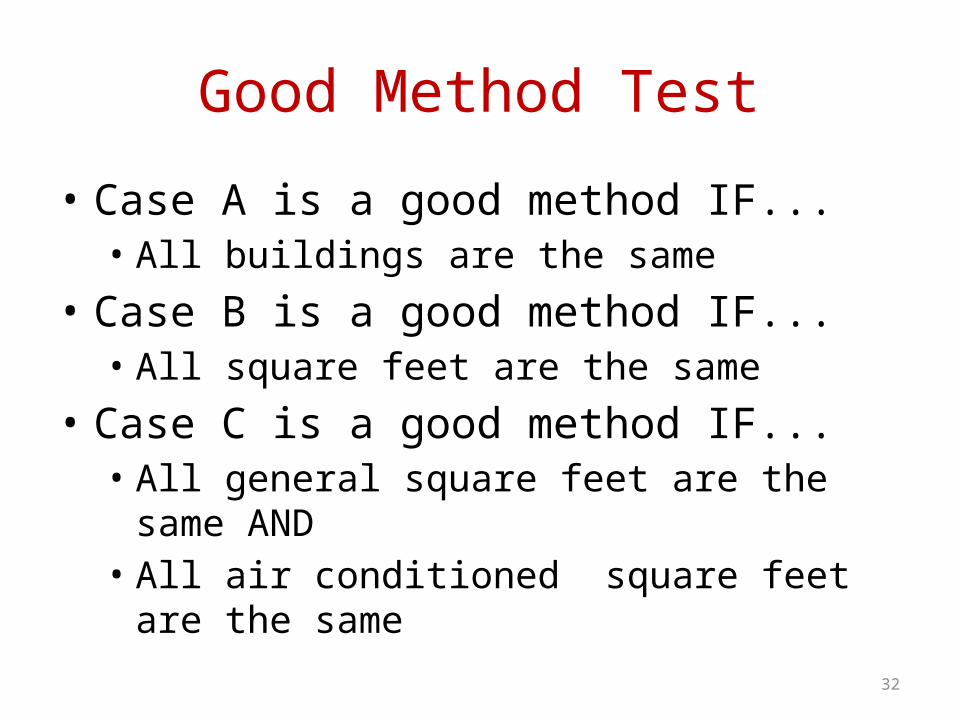
Good Method Test
• Case A is a good method IF...• All buildings are the same
• Case B is a good method IF...• All square feet are the same
• Case C is a good method IF...• All general square feet are the same AND• All air conditioned square feet are the same

33
Don’t Forget Behavioral Impacts
• What undesired behavior is encouraged with allocation by number of buildings • Combining buildings one roof• Expanding buildings when new building might
make more sense• Rejecting assignment to small building• In-fighting to occupy large air conditioned
buildings
34
Learning Check
• What happens to an object’s overhead allocation as its proportion of cost driver increases?
• If the unit of measure for the cost driver is dollars, what will be the unit of measure for the driver rate?
35
Assumptions
• Making assumptions is inescapable in managerial costing
• There is simply too much to measure and too many ways to measure it
• Reasonable assumptions simplify and facilitate the measurement process
• Bad assumptions result in poor management decision making
36
Homogeneity and Averaging
• Allocation methods implicitly assume sameness or homogeneity
• Allocating the dinner check based on number of eaters assumes that all eaters consume resources equally
• Allocating facilities costs based on number of buildings assumes that all buildings consume facilities resources equally
37
Homogeneity and Averaging
• The homogeneity assumption allows the use of average cost • To simplify the allocation process• To minimize the cost of measurement • To avoid detailed record keeping for every cost
object
38
Cause and Effect Relationships
• A cause and effect relationship means:• Increasing driver usage will cause more
consumption of resources• Decreasing driver usage will cause less resource
consumption• Allocating cost based on this driver will reflect the
underlying economics of cost consumption and approximate true cost
39
Cause and Effect Relationships
• Give the cost manager another target for managing cost• Managing the driver usage will result in managing
cost• Allow managers to make rational decisions
based on knowledge of true cost• Instead of over-consuming goods and services that
appear to be free or low-cost

40
Common Examples of Cause - Effect Cost Drivers
• Square footage Heating costs • Number of employees Personnel costs• Mileage Motor pool costs• Computer hours Computer costs• Others?

41
Learning Check
• What is the underlying assumption when choosing a cost driver?
• A cause-effect relationship means that when the driver usage is reduced, the
will also decrease.
42
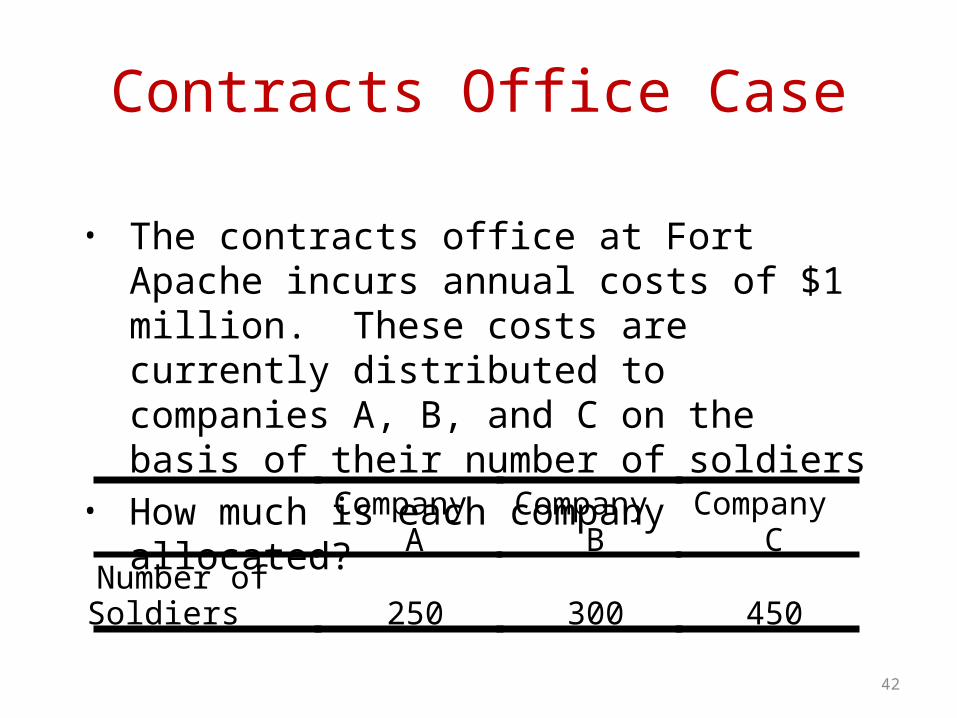
Contracts Office Case
• The contracts office at Fort Apache incurs annual costs of $1 million. These costs are currently distributed to companies A, B, and C on the basis of their number of soldiers
• How much is each company allocated?
CompanyA
CompanyB
CompanyC
Number ofSoldiers 250 300 450
43
Contracts Case: Questions
• What is the Cost Pool? • What is the Cost Object? • What is the Cost Driver?• What is the rate? • What is each Company’s proportion?
44
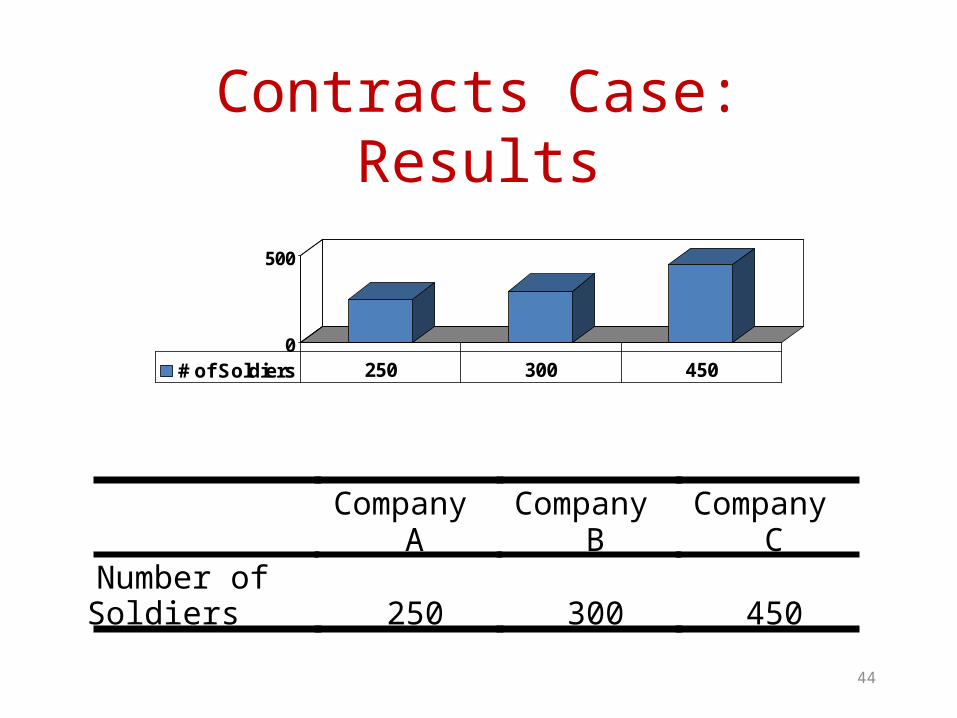
Contracts Case: Results
0
500
# of Soldiers 250 300 450
CompanyA
CompanyB
CompanyC
Number ofSoldiers 250 300 450
45
Contracts Case:Discussion Questions
• Is “number of soldiers” a good cost driver?• Will decreasing soldiers decrease consumption
of contracts resources?• What undesired behaviors might be
encouraged by this method of distribution?
46
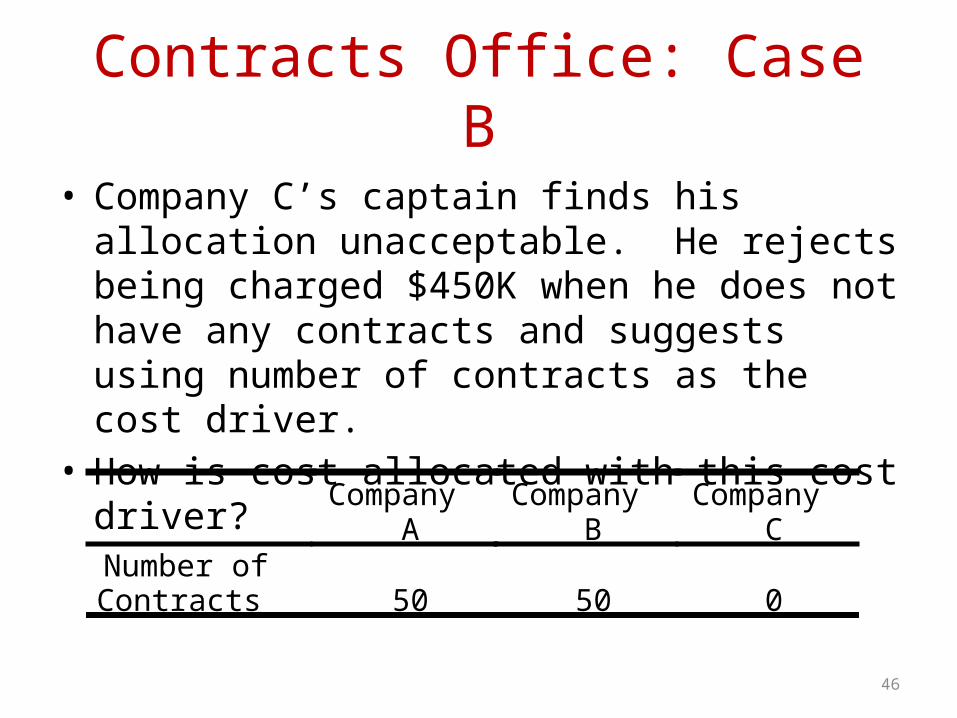
Contracts Office: Case B
• Company C’s captain finds his allocation unacceptable. He rejects being charged $450K when he does not have any contracts and suggests using number of contracts as the cost driver.
• How is cost allocated with this cost driver?
CompanyA
CompanyB
CompanyC
Number ofContracts 50 50 0

47
Contracts Case B: Questions
• What is the Cost Pool? • What is the Cost Object? • What is the Cost Driver?• What is the rate? • What is each Company’s proportion?
48
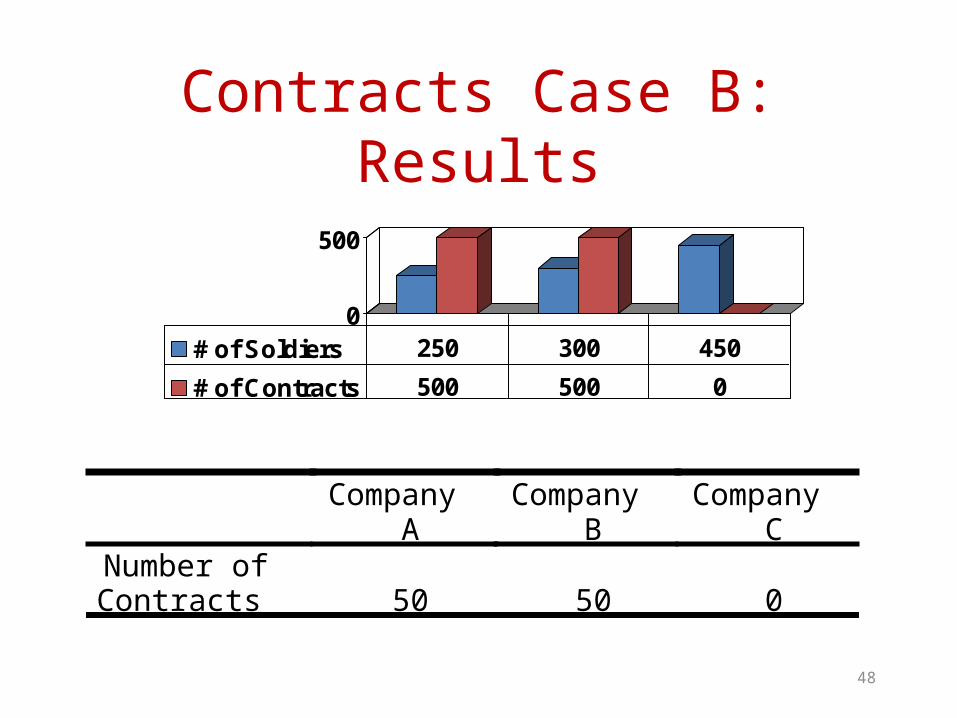
Contracts Case B: Results
0
500
# of Soldiers 250 300 450
# of Contracts 500 500 0
CompanyA
CompanyB
CompanyC
Number ofContracts 50 50 0

49
Balloon Squeezing
• Company A’s cost doubles• Company B’s cost increases 67%• Total cost remains unchanged• A change in distribution means:
• If one command’s allocation goes DOWN by $1000 Then...
• Someone else’s allocation has to go UP by $1000 • (Zero sum game requires support of top
management in order to succeed)
50
Contracts Case B: Discussion Questions
• Is “number of contracts” a good cost driver?• Will decreasing number of contracts decrease
consumption of contracts resources?• What undesired behaviors might be
encouraged by this method?
51
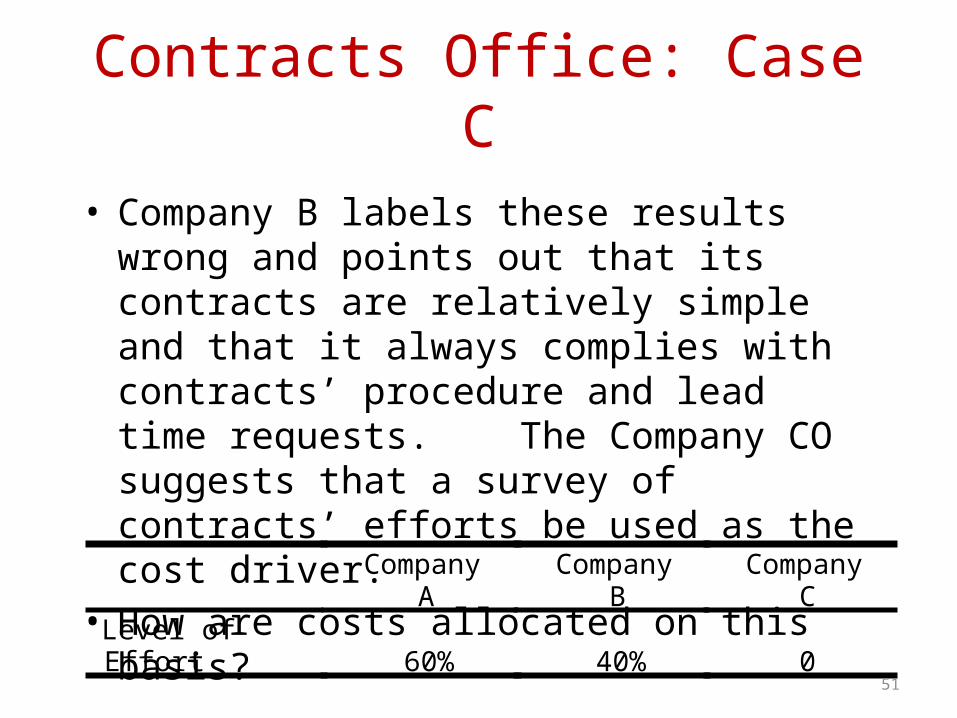
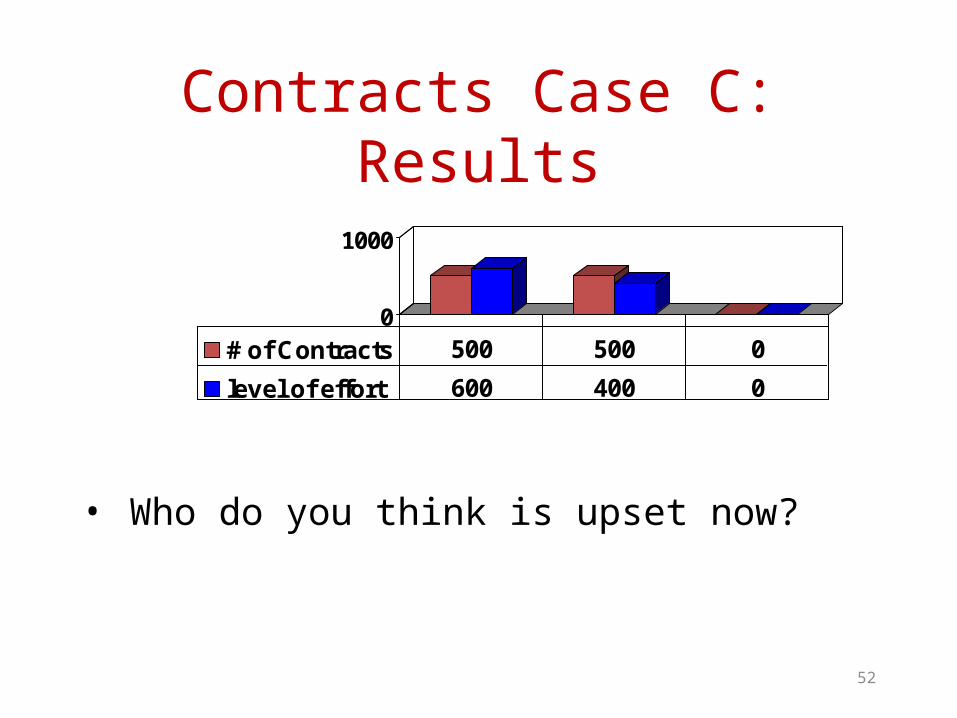
Contracts Office: Case C
• Company B labels these results wrong and points out that its contracts are relatively simple and that it always complies with contracts’ procedure and lead time requests. The Company CO suggests that a survey of contracts’ efforts be used as the cost driver.
• How are costs allocated on this basis?
CompanyA
CompanyB
CompanyC
Level ofEffort 60% 40% 0
52
Contracts Case C: Results
• Who do you think is upset now?
0
1000
# of Contracts 500 500 0
level of effort 600 400 0

53
Contracts Office: Case D
• Company A argues strongly that it cannot afford $600k for contracts without compromising its mission. The company CO, the most senior and forceful of the company CO’s, demands that “something fair, like the number of soldiers wearing glasses” be used.
• How are costs allocated on this basis?
CompanyA
CompanyB
CompanyC
Soldiers WithGlasses 15 15 15
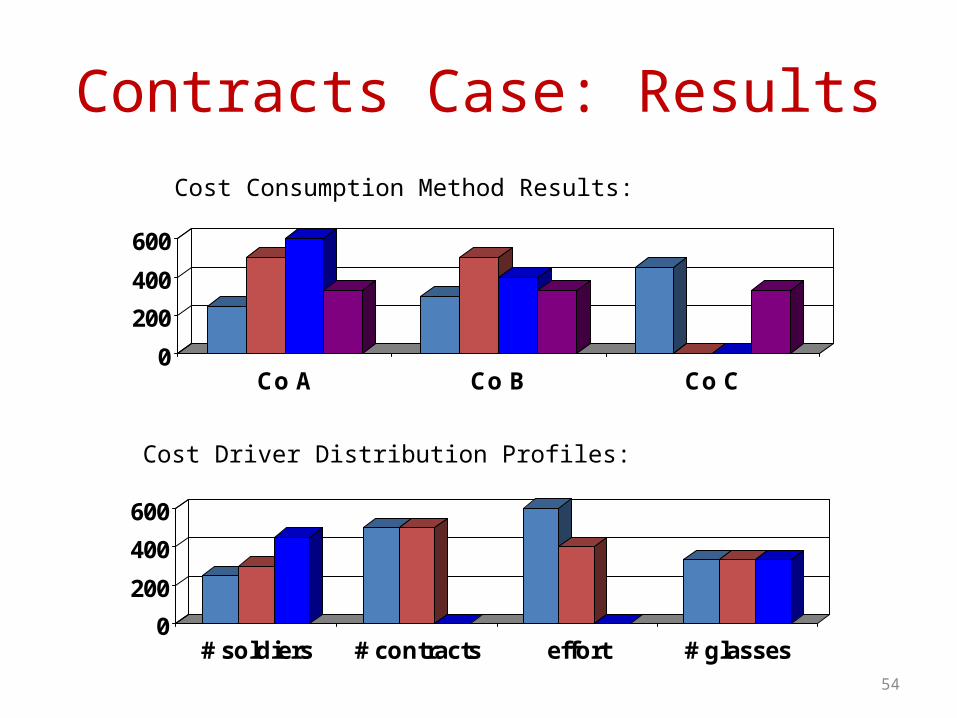
54
Contracts Case: Results
0
200
400
600
Co A Co B Co C
0
200
400
600
# soldiers # contracts effort # glasses
Cost Consumption Method Results:
Cost Driver Distribution Profiles:

55
Contracts: Discussion Questions
• Is “number of soldiers wearing glasses” a good cost driver?• (Never forget that we accountants are trained to
deal with nonsense)• Which driver would you recommend
• If you are any of the company commanders?• If you are the installation commander?
56
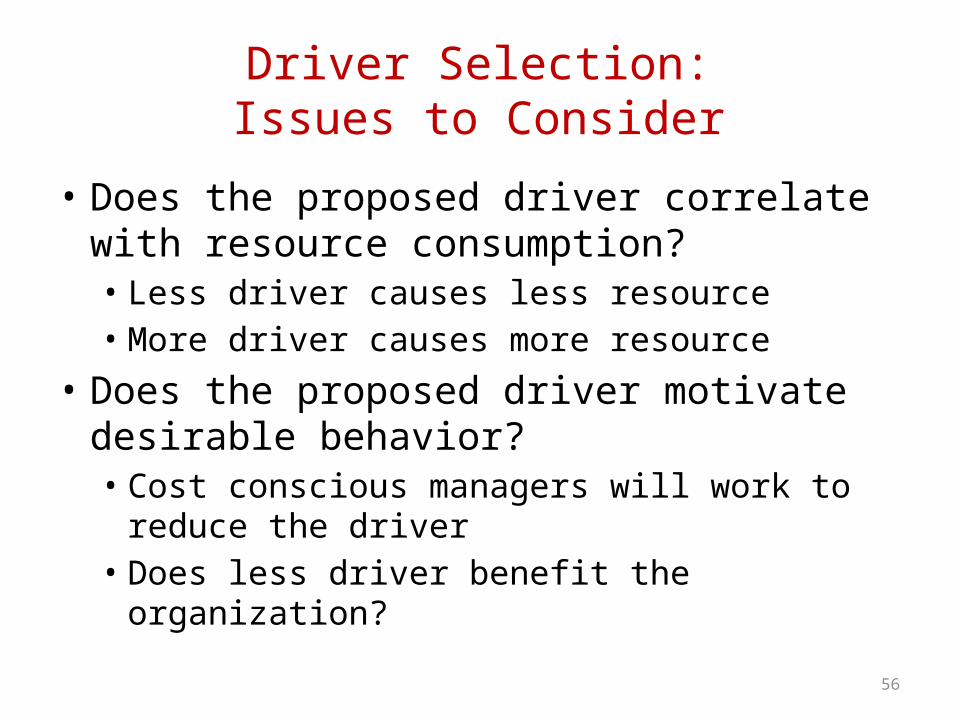
Driver Selection:Issues to Consider
• Does the proposed driver correlate with resource consumption?• Less driver causes less resource• More driver causes more resource
• Does the proposed driver motivate desirable behavior?• Cost conscious managers will work to reduce the
driver• Does less driver benefit the organization?
57
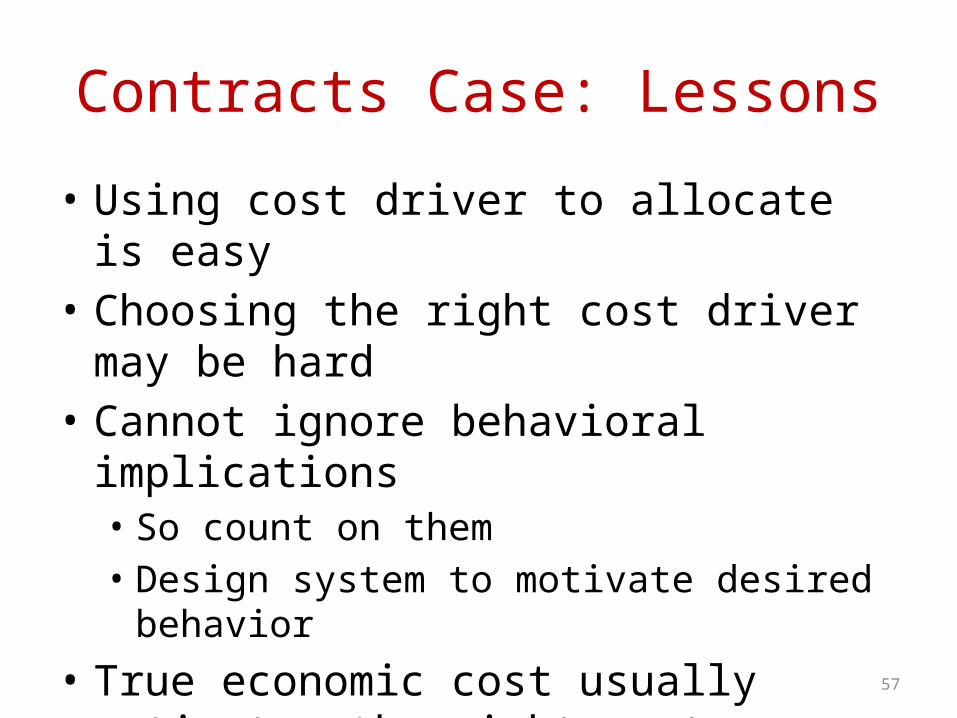
Contracts Case: Lessons
• Using cost driver to allocate is easy• Choosing the right cost driver may be hard• Cannot ignore behavioral implications
• So count on them• Design system to motivate desired behavior
• True economic cost usually motivates the right cost management behavior

58
Learning Check
• What does “balloon squeezing” mean?• What should be considered when choosing a
cost driver?
59
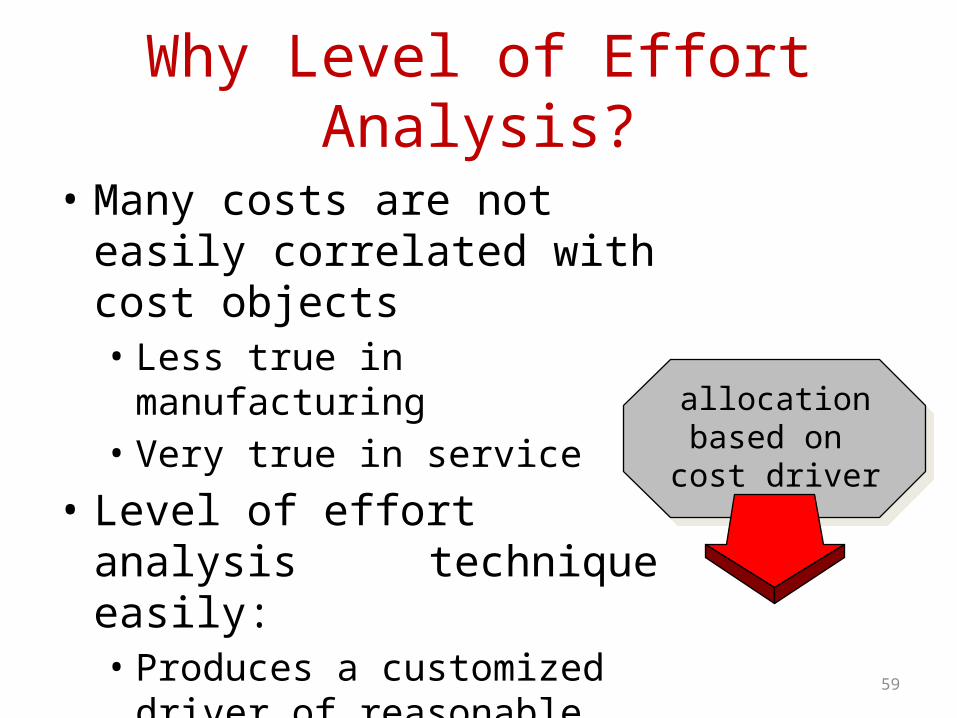
Why Level of Effort Analysis?
• Many costs are not easily correlated with cost objects• Less true in manufacturing• Very true in service
• Level of effort analysis technique easily:
• Produces a customized driver of reasonable accuracy
allocationbased on cost driver
60
Overhead: Likely Candidate for Level of Effort (LOE)
• Overhead Areas Often Use LOE Since:• Work Usually Specialized and Not Consumed
Uniformly by Line Organizations• Like the Contracts Office
• Lack of Consumption Homogeneity May Mean that Common Drivers are Poor• i.e. Square Feet, Direct Labor Hours, Mileage, etc.,
Do not Adequately Correlate to Cost Object Consumption of Overhead Resources
61
Developing LOE as a Driver
• Interview Activity Manager• Concentrate on People’s “Efforts” Supporting
Cost Objects• Find out What Proportion of Each Person’s
Time would be “Invoiced” to Each Cost Object if Activity was a Business and Cost Object was a Customer
62
Precision and LOE
• Activity Manager Will Only be Able to Make Rough Estimates
• Estimates Get Better Over Time• Random Estimate Errors Tend to Offset• Systematic Error Can Induce Bias• Saliency Can Induce Bias
63
Beneficial By-Products
• Staff/overhead organizations often misunderstand their role• It’s easy for staff to think they are line
• Often helpful to organization when staff functions are forced to think of their line customers as paying the bills
• Publicizing LOE creates a forum for cost and support issues
64
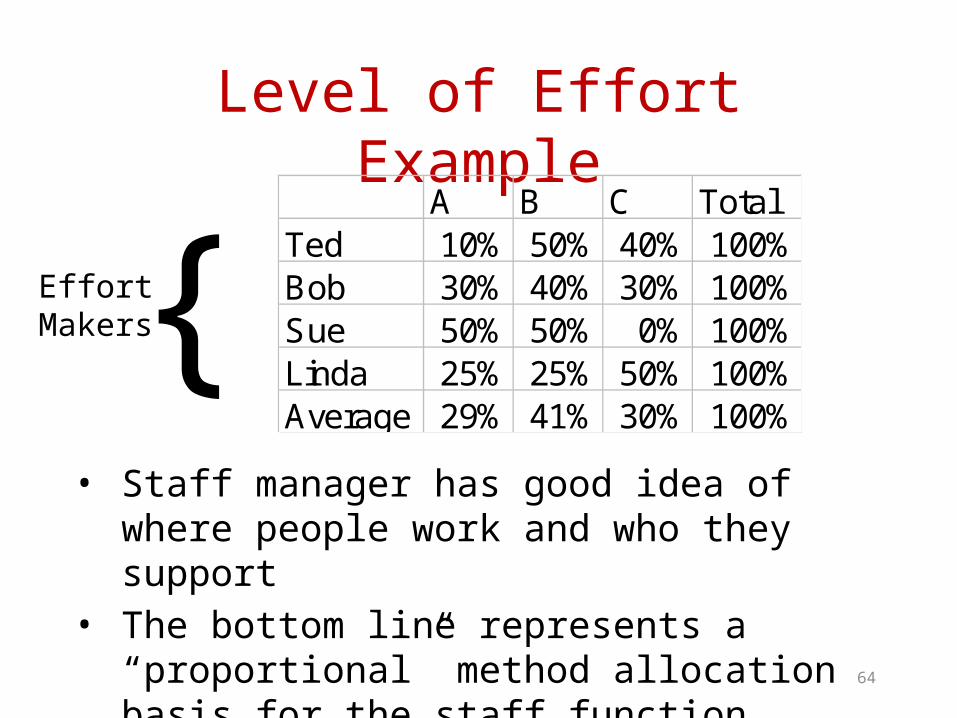
Level of Effort ExampleA B C Total
Ted 10% 50% 40% 100%Bob 30% 40% 30% 100%Sue 50% 50% 0% 100%Linda 25% 25% 50% 100%Average 29% 41% 30% 100%
• Staff manager has good idea of where people work and who they support
• The bottom line represents a “proportional” method allocation basis for the staff function
EffortMakers {
65
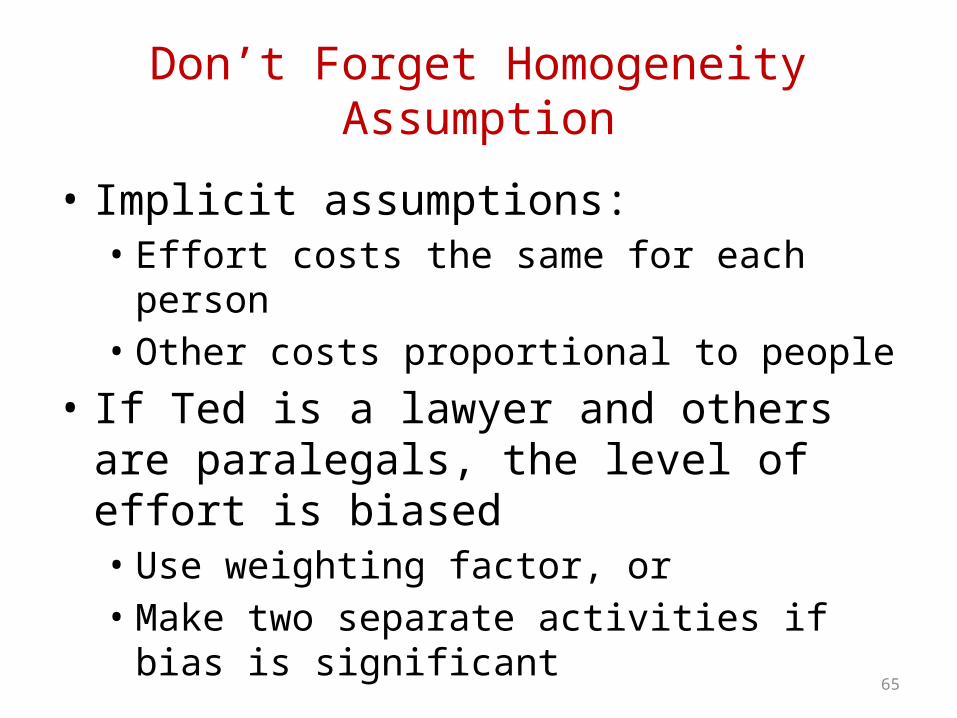
Don’t Forget Homogeneity Assumption
• Implicit assumptions: • Effort costs the same for each person• Other costs proportional to people
• If Ted is a lawyer and others are paralegals, the level of effort is biased • Use weighting factor, or• Make two separate activities if bias is significant
66
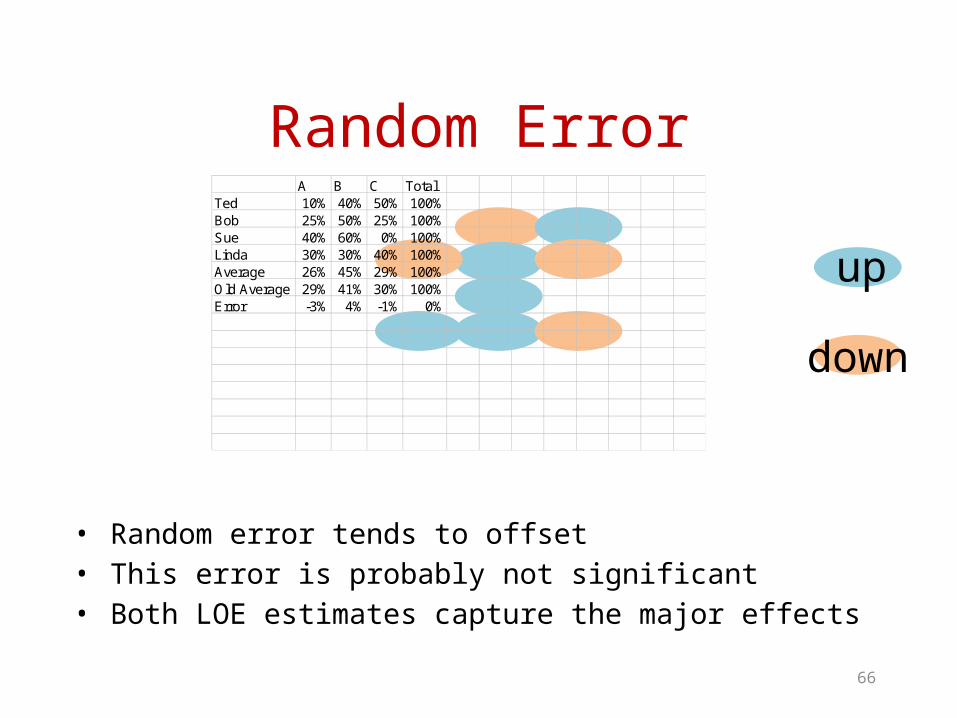
Random ErrorA B C Total
Ted 10% 40% 50% 100%Bob 25% 50% 25% 100%Sue 40% 60% 0% 100%Linda 30% 30% 40% 100%Average 26% 45% 29% 100%Old Average 29% 41% 30% 100%Error -3% 4% -1% 0%
• Random error tends to offset• This error is probably not significant• Both LOE estimates capture the major effects
up
down
67
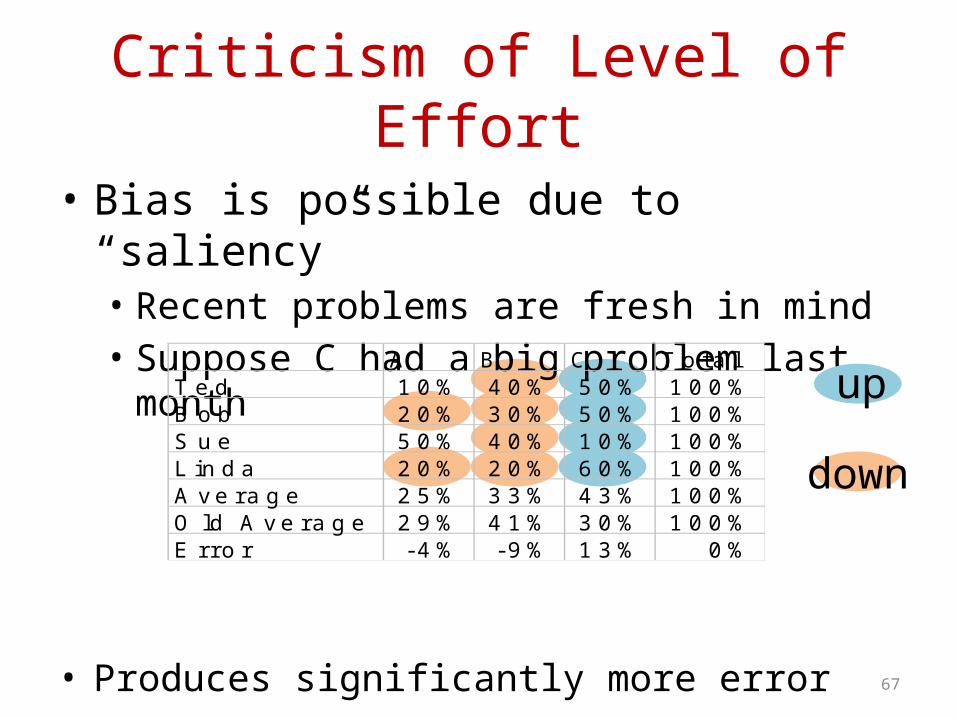
Criticism of Level of Effort
• Bias is possible due to “saliency”• Recent problems are fresh in mind• Suppose C had a big problem last month
• Produces significantly more error
A B C TotalTed 10% 40% 50% 100%Bob 20% 30% 50% 100%Sue 50% 40% 10% 100%Linda 20% 20% 60% 100%Average 25% 33% 43% 100%Old Average 29% 41% 30% 100%Error -4% -9% 13% 0%
up
down

68
Example: Returns Driver in IRS Audit Office
0
10
20
30
40 # of returns
corporate complex other simple individual individual
69
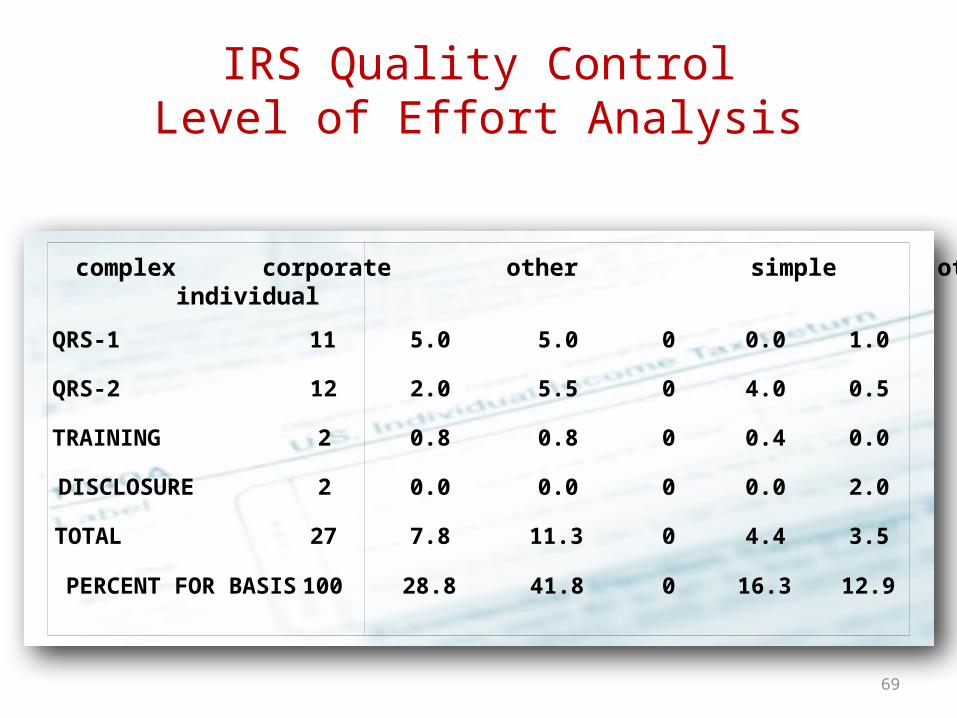
IRS Quality ControlLevel of Effort Analysis
QRS-1
QRS-2
TRAINING
DISCLOSURE
TOTAL
PERCENT FOR BASIS
11
12
2
2
27
100
5.0
2.0
0.8
0.0
7.8
28.8
5.0
5.5
0.8
0.0
11.3
41.8
0
0
0
0
0
0
0.0
4.0
0.4
0.0
4.4
16.3
1.0
0.5
0.0
2.0
3.5
12.9
people complex corporate other simple other individual individual districts
70
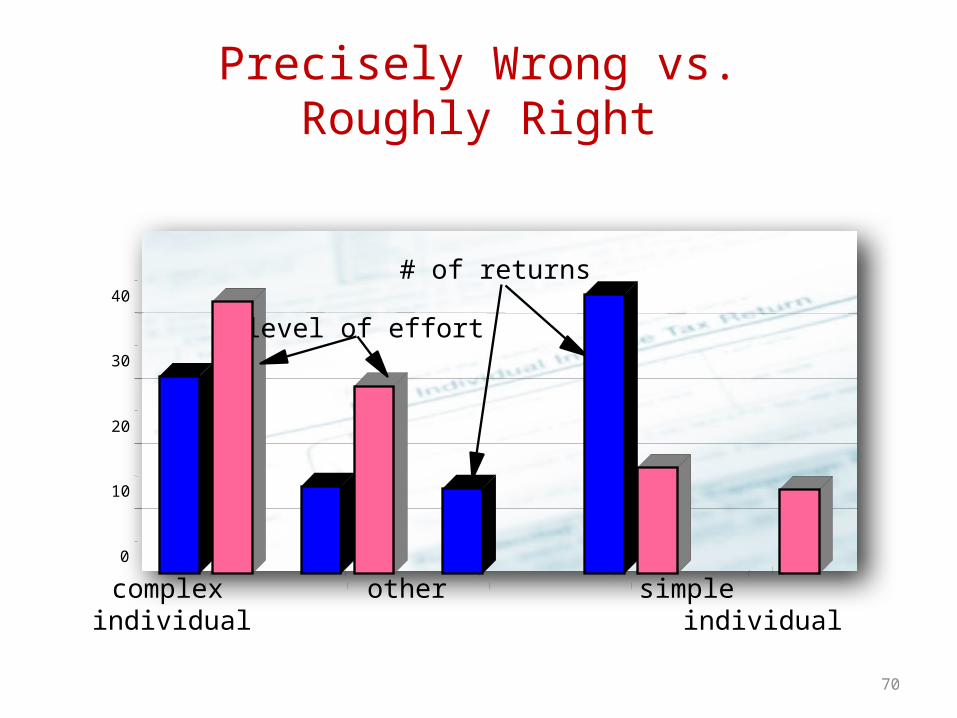
Precisely Wrong vs.Roughly Right
0
10
20
30
40# of returns
level of effort
corporate complex other simple other individual individual districts
71
Learning Check
• Why is level of effort sometimes a better driver than a unit-based driver?
• What is the primary criticism of the level of effort driver?

72
Practical Exercise
Related Documents