Calamos Convertible Opportunities and Income Fund SCHEDULE OF INVESTMENTS JULY 31, 2021 (UNAUDITED) See accompanying Notes to Schedule of Investments 1 9/2/2021 10:38 AM PRINCIPAL AMOUNT VALUE CORPORATE BONDS (33.9%) Airlines (0.9%) 1,727,872 Air Canada Pass Through Trust Series 2015-1, Class B*μ 3.875%, 09/15/24 $ 1,751,181 255,999 Air Canada Pass Through Trust Series 2015-2, Class B* 5.000%, 06/15/25 259,819 1,104,927 Alaska Airlines Pass Through Trust Series 2020-1, Class A* 4.800%, 02/15/29 1,225,883 807,342 Alaska Airlines Pass Through Trust Series 2020-1, Class B*μ 8.000%, 02/15/27 902,738 American Airlines, Inc. / AAdvantage Loyalty IP, Ltd.* 717,000 5.500%, 04/20/26 750,964 239,000 5.750%, 04/20/29 258,662 1,105,000 British Airways Pass Through Trust Series 2021-1, Class B* 3.900%, 03/15/33 1,122,426 866,317 JetBlue Pass Through Trust Series 2020-1, Class B 7.750%, 05/15/30 1,025,321 351,000 Spirit Loyalty Cayman, Ltd. / Spirit IP Cayman, Ltd.* 8.000%, 09/20/25 395,981 333,929 UAL Pass Through Trust Series 2007-1 6.636%, 01/02/24 345,791 889,155 United Airlines Pass Through Trust Series 2014-2, Class B 4.625%, 03/03/24 910,788 532,993 United Airlines Pass Through Trust Series 2019-2, Class B 3.500%, 11/01/29 528,393 9,477,947 Communication Services (4.2%) 1,490,000 Arrow Bidco, LLC* 9.500%, 03/15/24 1,529,723 980,000 Ashtead Capital, Inc.* 4.000%, 05/01/28 1,036,203 717,000 Beasley Mezzanine Holdings, LLC* 8.625%, 02/01/26 728,407 705,000 Brink's Company* 5.500%, 07/15/25 743,211 1,740,000 Cincinnati Bell, Inc.* 8.000%, 10/15/25 1,830,289 830,000 Consolidated Communications, Inc.*^ 6.500%, 10/01/28 897,288 CSC Holdings, LLC* 3,100,000 5.500%, 04/15/27^ 3,246,010 2,100,000 5.750%, 01/15/30^ 2,192,946 1,450,000 5.375%, 02/01/28^ 1,535,318 1,350,000 4.625%, 12/01/30^ 1,331,059 440,000 4.500%, 11/15/31 444,246 1,010,000 Cumulus Media New Holdings, Inc.*^ 6.750%, 07/01/26 1,064,348 PRINCIPAL AMOUNT VALUE Diamond Sports Group, LLC / Diamond Sports Finance Company* 750,000 6.625%, 08/15/27 $ 301,538 540,000 5.375%, 08/15/26 314,172 120,000 DIRECTV Holdings, LLC / DIRECTV Financing Company, Inc.* 5.875%, 08/15/27 124,177 3,346,000 Embarq Corp. 7.995%, 06/01/36 3,753,710 Entercom Media Corp.*^ 478,000 6.750%, 03/31/29 488,301 443,000 6.500%, 05/01/27 456,782 559,000 Frontier Florida, LLC^& 6.860%, 02/01/28 613,072 1,445,000 Frontier North, Inc.@ 6.730%, 02/15/28 1,572,969 Go Daddy Operating Company, LLC / GD Finance Company, Inc.* 835,000 3.500%, 03/01/29 836,603 250,000 5.250%, 12/01/27 262,780 270,000 Hughes Satellite Systems Corp. 5.250%, 08/01/26 302,535 Intelsat Jackson Holdings, SA@ 731,000 9.750%, 07/15/25* 413,651 475,000 5.500%, 08/01/23 262,172 1,350,000 LCPR Senior Secured Financing DAC* 6.750%, 10/15/27 1,443,933 532,875 Ligado Networks, LLC* 15.500%, 11/01/23 15.500% PIK rate 527,791 1,145,000 Lumen Technologies, Inc.* 4.000%, 02/15/27 1,178,812 Netflix, Inc. 725,000 4.875%, 06/15/30* 874,865 525,000 4.875%, 04/15/28^ 614,297 Scripps Escrow II, Inc.* 477,000 3.875%, 01/15/29 477,673 239,000 5.375%, 01/15/31^ 239,186 1,275,000 Scripps Escrow, Inc.* 5.875%, 07/15/27 1,320,913 477,000 Shift4 Payments, LLC / Shift4 Payments Finance Sub, Inc.* 4.625%, 11/01/26 497,416 Sirius XM Radio, Inc.* 1,250,000 5.500%, 07/01/29^ 1,371,112 1,250,000 4.625%, 07/15/24^ 1,284,363 723,000 4.000%, 07/15/28 746,136 715,000 Spanish Broadcasting System, Inc.* 9.750%, 03/01/26 729,686 1,740,000 Sprint Capital Corp.^ 6.875%, 11/15/28 2,246,653 2,430,000 Sprint Corp. 7.125%, 06/15/24 2,798,437 755,000 Telecom Italia Capital, SA 6.000%, 09/30/34 868,439 1,340,000 United States Cellular Corp. 6.700%, 12/15/33 1,669,305

Welcome message from author
This document is posted to help you gain knowledge. Please leave a comment to let me know what you think about it! Share it to your friends and learn new things together.
Transcript
Calamos Convertible Opportunities and Income Fund SCHEDULE OF INVESTMENTS JULY 31, 2021 (UNAUDITED)
See accompanying Notes to Schedule of Investments
1 9/2/2021 10:38 AM
PRINCIPAL AMOUNT VALUE
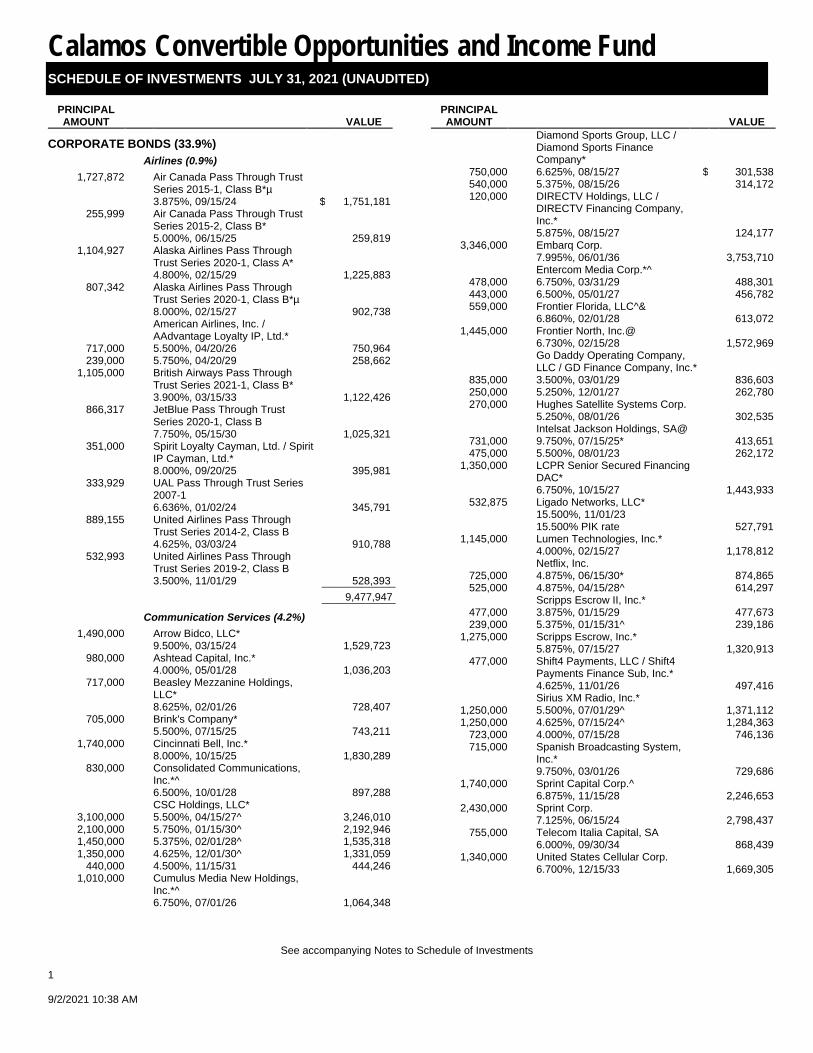
CORPORATE BONDS (33.9%) Airlines (0.9%)
1,727,872 Air Canada Pass Through Trust Series 2015-1, Class B*µ 3.875%, 09/15/24 $ 1,751,181
255,999 Air Canada Pass Through Trust Series 2015-2, Class B* 5.000%, 06/15/25 259,819
1,104,927 Alaska Airlines Pass Through Trust Series 2020-1, Class A* 4.800%, 02/15/29 1,225,883
807,342 Alaska Airlines Pass Through Trust Series 2020-1, Class B*µ 8.000%, 02/15/27 902,738
American Airlines, Inc. / AAdvantage Loyalty IP, Ltd.*
717,000 5.500%, 04/20/26 750,964 239,000 5.750%, 04/20/29 258,662
1,105,000 British Airways Pass Through Trust Series 2021-1, Class B* 3.900%, 03/15/33 1,122,426
866,317 JetBlue Pass Through Trust Series 2020-1, Class B 7.750%, 05/15/30 1,025,321
351,000 Spirit Loyalty Cayman, Ltd. / Spirit IP Cayman, Ltd.* 8.000%, 09/20/25 395,981
333,929 UAL Pass Through Trust Series 2007-1 6.636%, 01/02/24 345,791
889,155 United Airlines Pass Through Trust Series 2014-2, Class B 4.625%, 03/03/24 910,788
532,993 United Airlines Pass Through Trust Series 2019-2, Class B 3.500%, 11/01/29 528,393 ___________
9,477,947 ___________ Communication Services (4.2%)
1,490,000 Arrow Bidco, LLC* 9.500%, 03/15/24 1,529,723
980,000 Ashtead Capital, Inc.* 4.000%, 05/01/28 1,036,203
717,000 Beasley Mezzanine Holdings, LLC* 8.625%, 02/01/26 728,407
705,000 Brink's Company* 5.500%, 07/15/25 743,211
1,740,000 Cincinnati Bell, Inc.* 8.000%, 10/15/25 1,830,289
830,000 Consolidated Communications, Inc.*^ 6.500%, 10/01/28 897,288
CSC Holdings, LLC* 3,100,000 5.500%, 04/15/27^ 3,246,010 2,100,000 5.750%, 01/15/30^ 2,192,946 1,450,000 5.375%, 02/01/28^ 1,535,318 1,350,000 4.625%, 12/01/30^ 1,331,059
440,000 4.500%, 11/15/31 444,246 1,010,000 Cumulus Media New Holdings,
Inc.*^ 6.750%, 07/01/26 1,064,348
PRINCIPAL AMOUNT VALUE
Diamond Sports Group, LLC / Diamond Sports Finance Company*
750,000 6.625%, 08/15/27 $ 301,538 540,000 5.375%, 08/15/26 314,172 120,000 DIRECTV Holdings, LLC /
DIRECTV Financing Company, Inc.* 5.875%, 08/15/27 124,177
3,346,000 Embarq Corp. 7.995%, 06/01/36 3,753,710
Entercom Media Corp.*^ 478,000 6.750%, 03/31/29 488,301 443,000 6.500%, 05/01/27 456,782 559,000 Frontier Florida, LLC^&
6.860%, 02/01/28 613,072 1,445,000 Frontier North, Inc.@
6.730%, 02/15/28 1,572,969
Go Daddy Operating Company, LLC / GD Finance Company, Inc.*
835,000 3.500%, 03/01/29 836,603 250,000 5.250%, 12/01/27 262,780 270,000 Hughes Satellite Systems Corp.
5.250%, 08/01/26 302,535 Intelsat Jackson Holdings, SA@
731,000 9.750%, 07/15/25* 413,651 475,000 5.500%, 08/01/23 262,172
1,350,000 LCPR Senior Secured Financing DAC* 6.750%, 10/15/27 1,443,933
532,875 Ligado Networks, LLC* 15.500%, 11/01/23 15.500% PIK rate 527,791
1,145,000 Lumen Technologies, Inc.* 4.000%, 02/15/27 1,178,812
Netflix, Inc. 725,000 4.875%, 06/15/30* 874,865 525,000 4.875%, 04/15/28^ 614,297
Scripps Escrow II, Inc.* 477,000 3.875%, 01/15/29 477,673 239,000 5.375%, 01/15/31^ 239,186
1,275,000 Scripps Escrow, Inc.* 5.875%, 07/15/27 1,320,913
477,000 Shift4 Payments, LLC / Shift4 Payments Finance Sub, Inc.* 4.625%, 11/01/26 497,416
Sirius XM Radio, Inc.* 1,250,000 5.500%, 07/01/29^ 1,371,112 1,250,000 4.625%, 07/15/24^ 1,284,363
723,000 4.000%, 07/15/28 746,136 715,000 Spanish Broadcasting System,
Inc.* 9.750%, 03/01/26 729,686
1,740,000 Sprint Capital Corp.^ 6.875%, 11/15/28 2,246,653
2,430,000 Sprint Corp. 7.125%, 06/15/24 2,798,437
755,000 Telecom Italia Capital, SA 6.000%, 09/30/34 868,439
1,340,000 United States Cellular Corp. 6.700%, 12/15/33 1,669,305
Calamos Convertible Opportunities and Income Fund
SCHEDULE OF INVESTMENTS JULY 31, 2021 (UNAUDITED)
See accompanying Notes to Schedule of Investments
2
9/2/2021 10:38 AM
PRINCIPAL AMOUNT VALUE
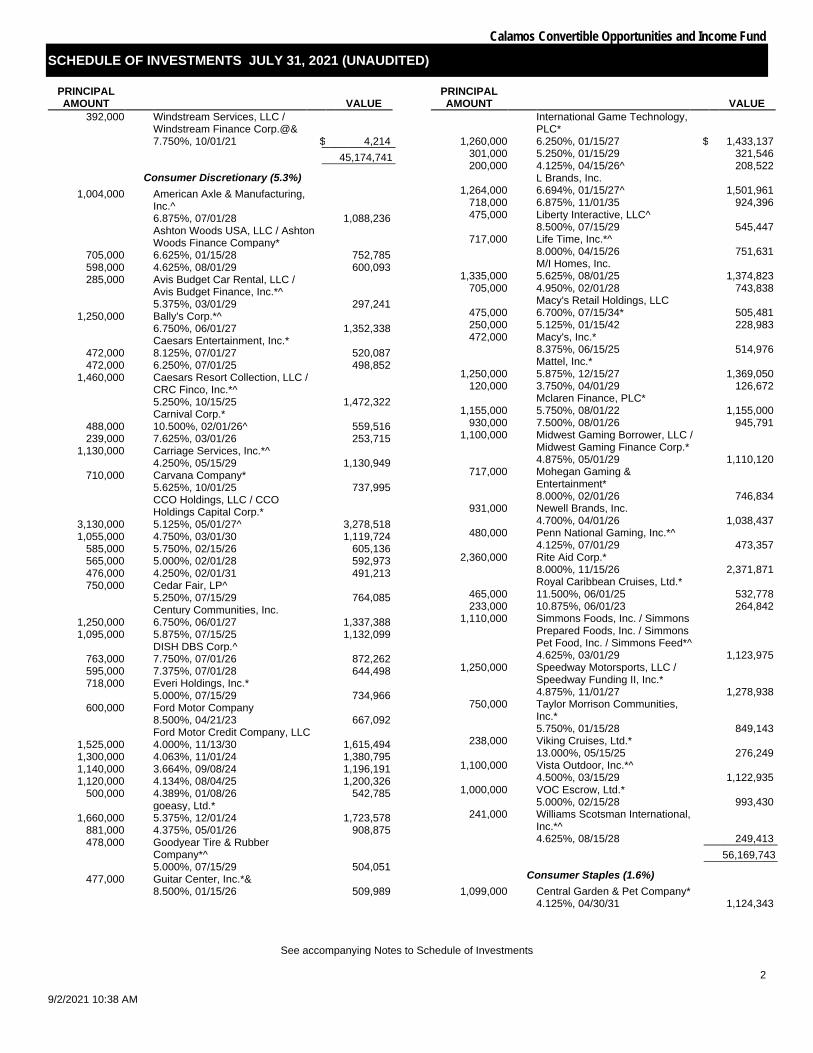
392,000 Windstream Services, LLC / Windstream Finance Corp.@& 7.750%, 10/01/21 $ 4,214 ___________
45,174,741 ___________ Consumer Discretionary (5.3%)
1,004,000 American Axle & Manufacturing, Inc.^ 6.875%, 07/01/28 1,088,236
Ashton Woods USA, LLC / Ashton Woods Finance Company*
705,000 6.625%, 01/15/28 752,785 598,000 4.625%, 08/01/29 600,093 285,000 Avis Budget Car Rental, LLC /
Avis Budget Finance, Inc.*^ 5.375%, 03/01/29 297,241
1,250,000 Bally's Corp.*^ 6.750%, 06/01/27 1,352,338
Caesars Entertainment, Inc.* 472,000 8.125%, 07/01/27 520,087 472,000 6.250%, 07/01/25 498,852
1,460,000 Caesars Resort Collection, LLC / CRC Finco, Inc.*^ 5.250%, 10/15/25 1,472,322
Carnival Corp.* 488,000 10.500%, 02/01/26^ 559,516 239,000 7.625%, 03/01/26 253,715
1,130,000 Carriage Services, Inc.*^ 4.250%, 05/15/29 1,130,949
710,000 Carvana Company* 5.625%, 10/01/25 737,995
CCO Holdings, LLC / CCO Holdings Capital Corp.*
3,130,000 5.125%, 05/01/27^ 3,278,518 1,055,000 4.750%, 03/01/30 1,119,724
585,000 5.750%, 02/15/26 605,136 565,000 5.000%, 02/01/28 592,973 476,000 4.250%, 02/01/31 491,213 750,000 Cedar Fair, LP^
5.250%, 07/15/29 764,085 Century Communities, Inc.
1,250,000 6.750%, 06/01/27 1,337,388 1,095,000 5.875%, 07/15/25 1,132,099
DISH DBS Corp.^ 763,000 7.750%, 07/01/26 872,262 595,000 7.375%, 07/01/28 644,498 718,000 Everi Holdings, Inc.*
5.000%, 07/15/29 734,966 600,000 Ford Motor Company
8.500%, 04/21/23 667,092 Ford Motor Credit Company, LLC
1,525,000 4.000%, 11/13/30 1,615,494 1,300,000 4.063%, 11/01/24 1,380,795 1,140,000 3.664%, 09/08/24 1,196,191 1,120,000 4.134%, 08/04/25 1,200,326
500,000 4.389%, 01/08/26 542,785 goeasy, Ltd.*
1,660,000 5.375%, 12/01/24 1,723,578 881,000 4.375%, 05/01/26 908,875 478,000 Goodyear Tire & Rubber
Company*^ 5.000%, 07/15/29 504,051
477,000 Guitar Center, Inc.*& 8.500%, 01/15/26 509,989
PRINCIPAL AMOUNT VALUE
International Game Technology, PLC*
1,260,000 6.250%, 01/15/27 $ 1,433,137 301,000 5.250%, 01/15/29 321,546 200,000 4.125%, 04/15/26^ 208,522
L Brands, Inc. 1,264,000 6.694%, 01/15/27^ 1,501,961
718,000 6.875%, 11/01/35 924,396 475,000 Liberty Interactive, LLC^
8.500%, 07/15/29 545,447 717,000 Life Time, Inc.*^
8.000%, 04/15/26 751,631 M/I Homes, Inc.
1,335,000 5.625%, 08/01/25 1,374,823 705,000 4.950%, 02/01/28 743,838
Macy's Retail Holdings, LLC 475,000 6.700%, 07/15/34* 505,481 250,000 5.125%, 01/15/42 228,983 472,000 Macy's, Inc.*
8.375%, 06/15/25 514,976 Mattel, Inc.*
1,250,000 5.875%, 12/15/27 1,369,050 120,000 3.750%, 04/01/29 126,672
Mclaren Finance, PLC* 1,155,000 5.750%, 08/01/22 1,155,000
930,000 7.500%, 08/01/26 945,791 1,100,000 Midwest Gaming Borrower, LLC /
Midwest Gaming Finance Corp.* 4.875%, 05/01/29 1,110,120
717,000 Mohegan Gaming & Entertainment* 8.000%, 02/01/26 746,834
931,000 Newell Brands, Inc. 4.700%, 04/01/26 1,038,437
480,000 Penn National Gaming, Inc.*^ 4.125%, 07/01/29 473,357
2,360,000 Rite Aid Corp.* 8.000%, 11/15/26 2,371,871
Royal Caribbean Cruises, Ltd.* 465,000 11.500%, 06/01/25 532,778 233,000 10.875%, 06/01/23 264,842
1,110,000 Simmons Foods, Inc. / Simmons Prepared Foods, Inc. / Simmons Pet Food, Inc. / Simmons Feed*^ 4.625%, 03/01/29 1,123,975
1,250,000 Speedway Motorsports, LLC / Speedway Funding II, Inc.* 4.875%, 11/01/27 1,278,938
750,000 Taylor Morrison Communities, Inc.* 5.750%, 01/15/28 849,143
238,000 Viking Cruises, Ltd.* 13.000%, 05/15/25 276,249
1,100,000 Vista Outdoor, Inc.*^ 4.500%, 03/15/29 1,122,935
1,000,000 VOC Escrow, Ltd.* 5.000%, 02/15/28 993,430
241,000 Williams Scotsman International, Inc.*^ 4.625%, 08/15/28 249,413 ___________
56,169,743 ___________ Consumer Staples (1.6%)
1,099,000 Central Garden & Pet Company* 4.125%, 04/30/31 1,124,343

Calamos Convertible Opportunities and Income Fund
SCHEDULE OF INVESTMENTS JULY 31, 2021 (UNAUDITED)
See accompanying Notes to Schedule of Investments
3 9/2/2021 10:38 AM
PRINCIPAL AMOUNT VALUE
Edgewell Personal Care Company*
717,000 4.125%, 04/01/29^ $ 722,084 482,000 5.500%, 06/01/28 510,828
1,091,000 Energizer Holdings, Inc.*^ 4.375%, 03/31/29 1,097,371
680,000 Fresh Market, Inc.* 9.750%, 05/01/23 700,998
1,275,000 JBS USA LUX, SA / JBS USA Finance, Inc.* 6.750%, 02/15/28 1,403,036
403,000 JBS USA LUX, SA / JBS USA Food Company / JBS USA Finance, Inc.* 6.500%, 04/15/29 454,403
Kraft Heinz Foods Company 1,470,000 4.375%, 06/01/46 1,693,117
237,000 4.250%, 03/01/31^ 273,252 237,000 3.875%, 05/15/27 262,551 621,000 New Albertsons, LP
7.750%, 06/15/26 713,436 957,000 Performance Food Group, Inc.*^
4.250%, 08/01/29 973,929 1,450,000 Pilgrim's Pride Corp.*^
5.875%, 09/30/27 1,552,428 Post Holdings, Inc.*^
1,250,000 5.750%, 03/01/27 1,303,750 696,000 4.625%, 04/15/30 709,739 909,000 Prestige Brands, Inc.*
3.750%, 04/01/31 902,482 1,050,000 United Natural Foods, Inc.*^
6.750%, 10/15/28 1,135,407 Vector Group, Ltd.*
1,500,000 5.750%, 02/01/29 1,528,590 578,000 10.500%, 11/01/26 615,084 ___________
17,676,828 ___________ Energy (3.1%)
Antero Resources Corp.* 355,000 7.625%, 02/01/29 389,151 239,000 5.375%, 03/01/30^ 243,383
Apache Corp. 958,000 5.100%, 09/01/40^ 1,028,547 538,000 4.875%, 11/15/27 579,458 478,000 4.625%, 11/15/25 514,366
45,262 Bonanza Creek Energy, Inc. 7.500%, 04/30/26 45,660
Buckeye Partners, LP 750,000 3.950%, 12/01/26 762,503 500,000 5.850%, 11/15/43 508,990 577,000 ChampionX Corp.
6.375%, 05/01/26 604,408 Cheniere Energy Partners, LP
1,000,000 5.625%, 10/01/26 1,034,260 232,000 4.000%, 03/01/31* 245,623 477,000 Cheniere Energy, Inc.
4.625%, 10/15/28 504,084 Continental Resources, Inc.^
965,000 3.800%, 06/01/24 1,013,318 725,000 4.375%, 01/15/28 810,383
1,490,000 DCP Midstream Operating, LP*‡ 5.850%, 05/21/43 3 mo. USD LIBOR + 3.85% 1,402,284
12,570 Diamond Foreign Asset Company / Diamond Finance, LLC 13.000%, 04/22/27 12,609
PRINCIPAL AMOUNT VALUE
502,000 DT Midstream, Inc.* 4.125%, 06/15/29 $ 515,253
Energy Transfer, LP‡ 1,400,000 3.143%, 11/01/66
3 mo. USD LIBOR + 3.02% 1,155,392 700,000 6.500%, 11/15/26
5 year CMT + 5.69% 716,968 EnLink Midstream Partners, LP
1,235,000 6.000%, 12/15/22‡ 3 mo. USD LIBOR + 4.11% 956,668
1,015,000 4.850%, 07/15/26^ 1,062,451 EQT Corp.
550,000 7.500%, 02/01/30 723,135 385,000 6.625%, 02/01/25 445,341 235,000 5.000%, 01/15/29 265,832 978,000 Genesis Energy, LP / Genesis
Energy Finance Corp. 6.250%, 05/15/26 966,694
Gulfport Energy Operating Corp. 940,000 6.375%, 05/15/25@ 39,950 275,051 8.000%, 05/17/26^ 294,643
Laredo Petroleum, Inc. 807,000 10.125%, 01/15/28 855,331 243,000 7.750%, 07/31/29* 235,350
1,060,000 Magnolia Oil & Gas Operating, LLC / Magnolia Oil & Gas Finance Corp.*^ 6.000%, 08/01/26 1,086,935
Moss Creek Resources Holdings, Inc.*
500,000 10.500%, 05/15/27 480,585 455,000 7.500%, 01/15/26 412,125 478,000 Murphy Oil Corp.
6.375%, 07/15/28 506,322 New Fortress Energy, Inc.*
478,000 6.500%, 09/30/26 483,683 477,000 6.750%, 09/15/25 487,217 450,000 Nine Energy Service, Inc.*
8.750%, 11/01/23 270,972 240,000 Oasis Midstream Partners, LP /
OMP Finance Corp.* 8.000%, 04/01/29 251,136
Occidental Petroleum Corp. 2,930,000 4.300%, 08/15/39 2,908,904 2,142,000 2.900%, 08/15/24 2,159,607
494,000 5.875%, 09/01/25 548,078 245,000 Ovintiv, Inc.^
6.500%, 08/15/34 327,305 464,000 Par Petroleum, LLC / Par
Petroleum Finance Corp.* 7.750%, 12/15/25 461,054
750,000 Parkland Corp. / Canada*^ 5.875%, 07/15/27 800,580
960,000 Plains All American Pipeline, LP‡ 6.125%, 11/15/22 3 mo. USD LIBOR + 4.11% 860,899
360,000 Range Resources Corp.*^ 8.250%, 01/15/29 399,053
536,000 Transocean, Inc.*^ 11.500%, 01/30/27 533,990
Venture Global Calcasieu Pass, LLC*
240,000 4.125%, 08/15/31 247,584 240,000 3.875%, 08/15/29 245,352 480,000 Vine Energy Holdings, LLC*
6.750%, 04/15/29 501,710
Calamos Convertible Opportunities and Income Fund
SCHEDULE OF INVESTMENTS JULY 31, 2021 (UNAUDITED)
See accompanying Notes to Schedule of Investments
4
9/2/2021 10:38 AM
PRINCIPAL AMOUNT VALUE
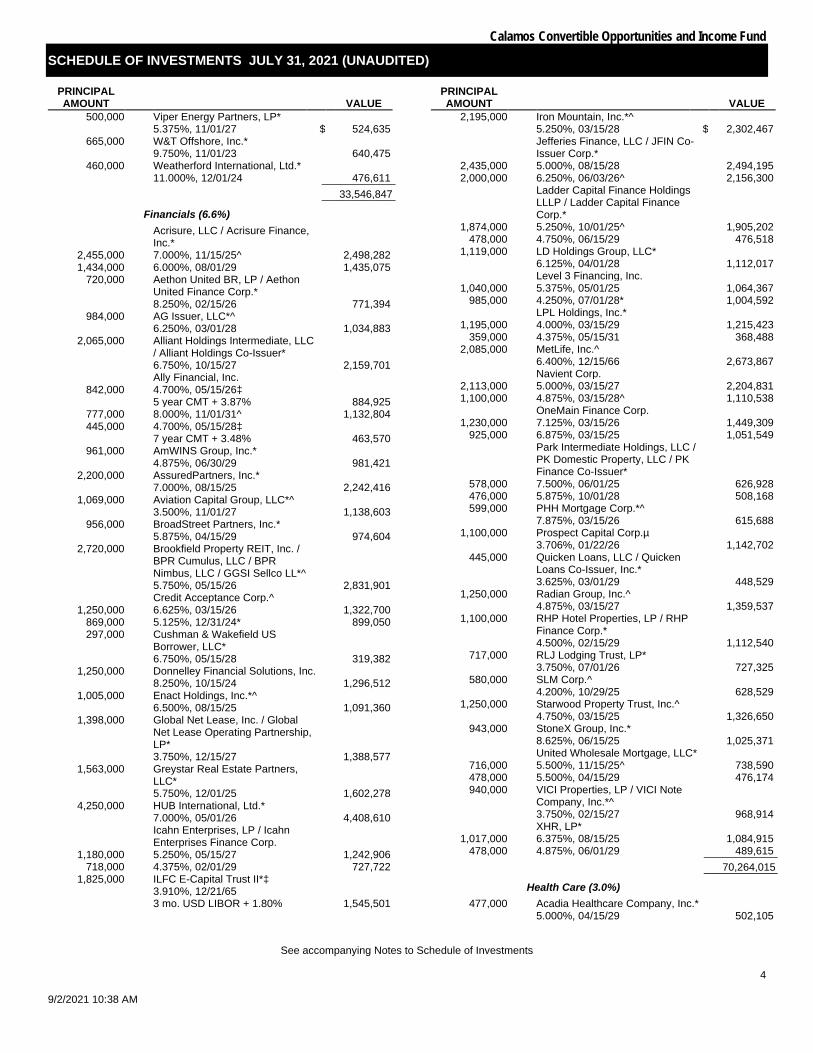
500,000 Viper Energy Partners, LP* 5.375%, 11/01/27 $ 524,635
665,000 W&T Offshore, Inc.* 9.750%, 11/01/23 640,475
460,000 Weatherford International, Ltd.* 11.000%, 12/01/24 476,611 ___________
33,546,847 ___________ Financials (6.6%)
Acrisure, LLC / Acrisure Finance, Inc.*
2,455,000 7.000%, 11/15/25^ 2,498,282 1,434,000 6.000%, 08/01/29 1,435,075
720,000 Aethon United BR, LP / Aethon United Finance Corp.* 8.250%, 02/15/26 771,394
984,000 AG Issuer, LLC*^ 6.250%, 03/01/28 1,034,883
2,065,000 Alliant Holdings Intermediate, LLC / Alliant Holdings Co-Issuer* 6.750%, 10/15/27 2,159,701
Ally Financial, Inc. 842,000 4.700%, 05/15/26‡
5 year CMT + 3.87% 884,925 777,000 8.000%, 11/01/31^ 1,132,804 445,000 4.700%, 05/15/28‡
7 year CMT + 3.48% 463,570 961,000 AmWINS Group, Inc.*
4.875%, 06/30/29 981,421 2,200,000 AssuredPartners, Inc.*
7.000%, 08/15/25 2,242,416 1,069,000 Aviation Capital Group, LLC*^
3.500%, 11/01/27 1,138,603 956,000 BroadStreet Partners, Inc.*
5.875%, 04/15/29 974,604 2,720,000 Brookfield Property REIT, Inc. /
BPR Cumulus, LLC / BPR Nimbus, LLC / GGSI Sellco LL*^ 5.750%, 05/15/26 2,831,901
Credit Acceptance Corp.^ 1,250,000 6.625%, 03/15/26 1,322,700
869,000 5.125%, 12/31/24* 899,050 297,000 Cushman & Wakefield US
Borrower, LLC* 6.750%, 05/15/28 319,382
1,250,000 Donnelley Financial Solutions, Inc. 8.250%, 10/15/24 1,296,512
1,005,000 Enact Holdings, Inc.*^ 6.500%, 08/15/25 1,091,360
1,398,000 Global Net Lease, Inc. / Global Net Lease Operating Partnership, LP* 3.750%, 12/15/27 1,388,577
1,563,000 Greystar Real Estate Partners, LLC* 5.750%, 12/01/25 1,602,278
4,250,000 HUB International, Ltd.* 7.000%, 05/01/26 4,408,610
Icahn Enterprises, LP / Icahn Enterprises Finance Corp.
1,180,000 5.250%, 05/15/27 1,242,906 718,000 4.375%, 02/01/29 727,722
1,825,000 ILFC E-Capital Trust II*‡ 3.910%, 12/21/65 3 mo. USD LIBOR + 1.80% 1,545,501
PRINCIPAL AMOUNT VALUE
2,195,000 Iron Mountain, Inc.*^ 5.250%, 03/15/28 $ 2,302,467
Jefferies Finance, LLC / JFIN Co-Issuer Corp.*
2,435,000 5.000%, 08/15/28 2,494,195 2,000,000 6.250%, 06/03/26^ 2,156,300
Ladder Capital Finance Holdings LLLP / Ladder Capital Finance Corp.*
1,874,000 5.250%, 10/01/25^ 1,905,202 478,000 4.750%, 06/15/29 476,518
1,119,000 LD Holdings Group, LLC* 6.125%, 04/01/28 1,112,017
Level 3 Financing, Inc. 1,040,000 5.375%, 05/01/25 1,064,367
985,000 4.250%, 07/01/28* 1,004,592 LPL Holdings, Inc.*
1,195,000 4.000%, 03/15/29 1,215,423 359,000 4.375%, 05/15/31 368,488
2,085,000 MetLife, Inc.^ 6.400%, 12/15/66 2,673,867
Navient Corp. 2,113,000 5.000%, 03/15/27 2,204,831 1,100,000 4.875%, 03/15/28^ 1,110,538
OneMain Finance Corp. 1,230,000 7.125%, 03/15/26 1,449,309
925,000 6.875%, 03/15/25 1,051,549
Park Intermediate Holdings, LLC / PK Domestic Property, LLC / PK Finance Co-Issuer*
578,000 7.500%, 06/01/25 626,928 476,000 5.875%, 10/01/28 508,168 599,000 PHH Mortgage Corp.*^
7.875%, 03/15/26 615,688 1,100,000 Prospect Capital Corp.µ
3.706%, 01/22/26 1,142,702 445,000 Quicken Loans, LLC / Quicken
Loans Co-Issuer, Inc.* 3.625%, 03/01/29 448,529
1,250,000 Radian Group, Inc.^ 4.875%, 03/15/27 1,359,537
1,100,000 RHP Hotel Properties, LP / RHP Finance Corp.* 4.500%, 02/15/29 1,112,540
717,000 RLJ Lodging Trust, LP* 3.750%, 07/01/26 727,325
580,000 SLM Corp.^ 4.200%, 10/29/25 628,529
1,250,000 Starwood Property Trust, Inc.^ 4.750%, 03/15/25 1,326,650
943,000 StoneX Group, Inc.* 8.625%, 06/15/25 1,025,371
United Wholesale Mortgage, LLC* 716,000 5.500%, 11/15/25^ 738,590 478,000 5.500%, 04/15/29 476,174 940,000 VICI Properties, LP / VICI Note
Company, Inc.*^ 3.750%, 02/15/27 968,914
XHR, LP* 1,017,000 6.375%, 08/15/25 1,084,915
478,000 4.875%, 06/01/29 489,615 ___________ 70,264,015 ___________
Health Care (3.0%) 477,000 Acadia Healthcare Company, Inc.*
5.000%, 04/15/29 502,105
Calamos Convertible Opportunities and Income Fund
SCHEDULE OF INVESTMENTS JULY 31, 2021 (UNAUDITED)
See accompanying Notes to Schedule of Investments
5 9/2/2021 10:38 AM
PRINCIPAL AMOUNT VALUE
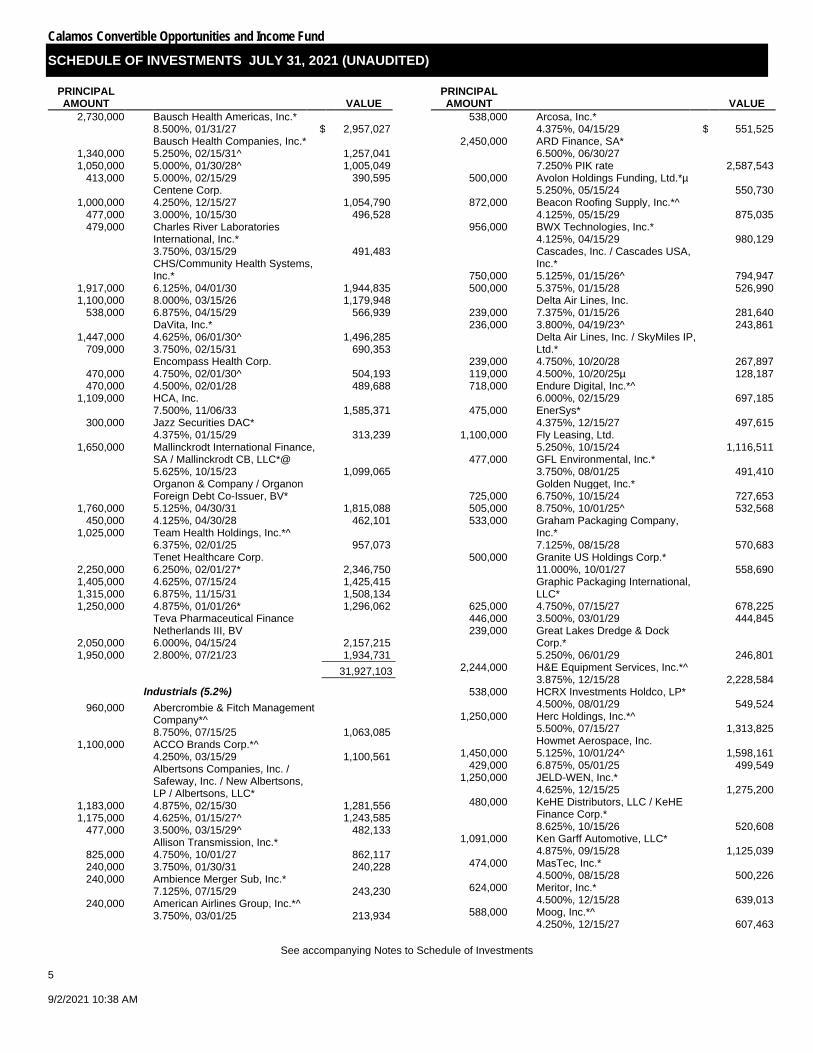
2,730,000 Bausch Health Americas, Inc.* 8.500%, 01/31/27 $ 2,957,027
Bausch Health Companies, Inc.* 1,340,000 5.250%, 02/15/31^ 1,257,041 1,050,000 5.000%, 01/30/28^ 1,005,049
413,000 5.000%, 02/15/29 390,595 Centene Corp.
1,000,000 4.250%, 12/15/27 1,054,790 477,000 3.000%, 10/15/30 496,528 479,000 Charles River Laboratories
International, Inc.* 3.750%, 03/15/29 491,483
CHS/Community Health Systems, Inc.*
1,917,000 6.125%, 04/01/30 1,944,835 1,100,000 8.000%, 03/15/26 1,179,948
538,000 6.875%, 04/15/29 566,939 DaVita, Inc.*
1,447,000 4.625%, 06/01/30^ 1,496,285 709,000 3.750%, 02/15/31 690,353
Encompass Health Corp. 470,000 4.750%, 02/01/30^ 504,193 470,000 4.500%, 02/01/28 489,688
1,109,000 HCA, Inc. 7.500%, 11/06/33 1,585,371
300,000 Jazz Securities DAC* 4.375%, 01/15/29 313,239
1,650,000 Mallinckrodt International Finance, SA / Mallinckrodt CB, LLC*@ 5.625%, 10/15/23 1,099,065
Organon & Company / Organon Foreign Debt Co-Issuer, BV*
1,760,000 5.125%, 04/30/31 1,815,088 450,000 4.125%, 04/30/28 462,101
1,025,000 Team Health Holdings, Inc.*^ 6.375%, 02/01/25 957,073
Tenet Healthcare Corp. 2,250,000 6.250%, 02/01/27* 2,346,750 1,405,000 4.625%, 07/15/24 1,425,415 1,315,000 6.875%, 11/15/31 1,508,134 1,250,000 4.875%, 01/01/26* 1,296,062
Teva Pharmaceutical Finance Netherlands III, BV
2,050,000 6.000%, 04/15/24 2,157,215 1,950,000 2.800%, 07/21/23 1,934,731 ___________
31,927,103 ___________ Industrials (5.2%)
960,000 Abercrombie & Fitch Management Company*^ 8.750%, 07/15/25 1,063,085
1,100,000 ACCO Brands Corp.*^ 4.250%, 03/15/29 1,100,561
Albertsons Companies, Inc. / Safeway, Inc. / New Albertsons, LP / Albertsons, LLC*
1,183,000 4.875%, 02/15/30 1,281,556 1,175,000 4.625%, 01/15/27^ 1,243,585
477,000 3.500%, 03/15/29^ 482,133 Allison Transmission, Inc.*
825,000 4.750%, 10/01/27 862,117 240,000 3.750%, 01/30/31 240,228 240,000 Ambience Merger Sub, Inc.*
7.125%, 07/15/29 243,230 240,000 American Airlines Group, Inc.*^
3.750%, 03/01/25 213,934
PRINCIPAL AMOUNT VALUE
538,000 Arcosa, Inc.* 4.375%, 04/15/29 $ 551,525
2,450,000 ARD Finance, SA* 6.500%, 06/30/27 7.250% PIK rate 2,587,543
500,000 Avolon Holdings Funding, Ltd.*µ 5.250%, 05/15/24 550,730
872,000 Beacon Roofing Supply, Inc.*^ 4.125%, 05/15/29 875,035
956,000 BWX Technologies, Inc.* 4.125%, 04/15/29 980,129
Cascades, Inc. / Cascades USA, Inc.*
750,000 5.125%, 01/15/26^ 794,947 500,000 5.375%, 01/15/28 526,990
Delta Air Lines, Inc. 239,000 7.375%, 01/15/26 281,640 236,000 3.800%, 04/19/23^ 243,861
Delta Air Lines, Inc. / SkyMiles IP, Ltd.*
239,000 4.750%, 10/20/28 267,897 119,000 4.500%, 10/20/25µ 128,187 718,000 Endure Digital, Inc.*^
6.000%, 02/15/29 697,185 475,000 EnerSys*
4.375%, 12/15/27 497,615 1,100,000 Fly Leasing, Ltd.
5.250%, 10/15/24 1,116,511 477,000 GFL Environmental, Inc.*
3.750%, 08/01/25 491,410 Golden Nugget, Inc.*
725,000 6.750%, 10/15/24 727,653 505,000 8.750%, 10/01/25^ 532,568 533,000 Graham Packaging Company,
Inc.* 7.125%, 08/15/28 570,683
500,000 Granite US Holdings Corp.* 11.000%, 10/01/27 558,690
Graphic Packaging International, LLC*
625,000 4.750%, 07/15/27 678,225 446,000 3.500%, 03/01/29 444,845 239,000 Great Lakes Dredge & Dock
Corp.* 5.250%, 06/01/29 246,801
2,244,000 H&E Equipment Services, Inc.*^ 3.875%, 12/15/28 2,228,584
538,000 HCRX Investments Holdco, LP* 4.500%, 08/01/29 549,524
1,250,000 Herc Holdings, Inc.*^ 5.500%, 07/15/27 1,313,825
Howmet Aerospace, Inc. 1,450,000 5.125%, 10/01/24^ 1,598,161
429,000 6.875%, 05/01/25 499,549 1,250,000 JELD-WEN, Inc.*
4.625%, 12/15/25 1,275,200 480,000 KeHE Distributors, LLC / KeHE
Finance Corp.* 8.625%, 10/15/26 520,608
1,091,000 Ken Garff Automotive, LLC* 4.875%, 09/15/28 1,125,039
474,000 MasTec, Inc.* 4.500%, 08/15/28 500,226
624,000 Meritor, Inc.* 4.500%, 12/15/28 639,013
588,000 Moog, Inc.*^ 4.250%, 12/15/27 607,463

Calamos Convertible Opportunities and Income Fund
SCHEDULE OF INVESTMENTS JULY 31, 2021 (UNAUDITED)
See accompanying Notes to Schedule of Investments
6
9/2/2021 10:38 AM
PRINCIPAL AMOUNT VALUE
1,300,000 Nationstar Mortgage Holdings, Inc.* 5.500%, 08/15/28 $ 1,323,218
940,000 Novelis Corp.* 4.750%, 01/30/30 1,002,378
1,120,000 Park-Ohio Industries, Inc. 6.625%, 04/15/27 1,139,802
Patrick Industries, Inc.* 505,000 7.500%, 10/15/27 549,536 478,000 4.750%, 05/01/29 488,157
1,170,000 Peninsula Pacific Entertainment, LLC / Peninsula Pacific Entertainment Finance In* 8.500%, 11/15/27 1,270,456
213,000 Picasso Finance Sub, Inc.*^ 6.125%, 06/15/25 225,976
935,000 QVC, Inc. 4.375%, 09/01/28 961,376
1,100,000 Reynolds Group Issuer, Inc. / Reynolds Group Issuer, LLC / Reynolds Group Issuer Lu* 4.000%, 10/15/27 1,100,242
790,000 Scientific Games International, Inc.* 5.000%, 10/15/25 812,641
463,000 SEG Holding, LLC / SEG Finance Corp.*^ 5.625%, 10/15/28 488,683
450,000 Sensata Technologies, BV* 4.000%, 04/15/29 463,208
479,000 Sensata Technologies, Inc.* 3.750%, 02/15/31 483,795
Sinclair Television Group, Inc.* 477,000 4.125%, 12/01/30 463,067 475,000 5.500%, 03/01/30^ 477,142
Standard Industries, Inc.* 955,000 5.000%, 02/15/27 989,447 236,000 4.375%, 07/15/30^ 242,894
Station Casinos, LLC* 1,965,000 4.500%, 02/15/28^ 1,983,766
647,000 5.000%, 10/01/25 656,013 477,000 Stericycle, Inc.*
3.875%, 01/15/29 484,169 717,000 STL Holding Company, LLC*
7.500%, 02/15/26 756,643 1,000,000 TransDigm UK Holdings, PLC^
6.875%, 05/15/26 1,056,730 TransDigm, Inc.
1,260,000 6.250%, 03/15/26* 1,323,970 700,000 7.500%, 03/15/27 742,672 478,000 Tronox, Inc.*^
4.625%, 03/15/29 486,963
United Rentals North America, Inc.
480,000 3.750%, 01/15/32 480,000 450,000 5.875%, 09/15/26 465,431 239,000 3.875%, 02/15/31^ 246,263 615,000 Waste Pro USA, Inc.*
5.500%, 02/15/26 628,186 WESCO Distribution, Inc.*
470,000 7.125%, 06/15/25^ 506,970 235,000 7.250%, 06/15/28 262,004
1,250,000 XPO Logistics, Inc.* 6.750%, 08/15/24 1,297,787 ___________
55,797,876 ___________
PRINCIPAL AMOUNT VALUE
Information Technology (1.4%) 478,000 Booz Allen Hamilton, Inc.*
4.000%, 07/01/29 $ 493,043 500,000 CDK Global, Inc.*
5.250%, 05/15/29 545,190 1,114,000 CommScope Technologies, LLC*
6.000%, 06/15/25 1,132,047
Dell International, LLC / EMC Corp.
1,155,000 6.020%, 06/15/26µ 1,390,551 750,000 6.100%, 07/15/27 927,893 425,000 5.850%, 07/15/25µ 499,664 480,000 Fair Isaac Corp.*
4.000%, 06/15/28 502,262 1,050,000 KBR, Inc.*
4.750%, 09/30/28 1,068,805 1,050,000 MPH Acquisition Holdings, LLC*^
5.750%, 11/01/28 1,021,335 478,000 NCR Corp.*
5.125%, 04/15/29 498,176 1,102,000 Nielsen Finance, LLC / Nielsen
Finance Company* 4.500%, 07/15/29 1,113,075
723,000 ON Semiconductor Corp.* 3.875%, 09/01/28 753,330
705,000 Open Text Corp.* 3.875%, 02/15/28 729,760
479,000 Playtika Holding Corp.* 4.250%, 03/15/29 478,253
646,000 PTC, Inc.* 4.000%, 02/15/28 669,430
1,100,000 TTM Technologies, Inc.*^ 4.000%, 03/01/29 1,108,239
Twilio, Inc. 680,000 3.625%, 03/15/29 699,448 236,000 3.875%, 03/15/31^ 246,957
1,100,000 ZoomInfo Technologies, LLC / ZoomInfo Finance Corp.* 3.875%, 02/01/29 1,102,134 ___________
14,979,592 ___________ Materials (1.7%)
Alcoa Nederland Holding, BV* 1,625,000 7.000%, 09/30/26 1,697,052
600,000 4.125%, 03/31/29^ 631,566 534,000 Allegheny Technologies, Inc.^
5.875%, 12/01/27 561,501 725,000 ArcelorMittal, SA
7.250%, 10/15/39 1,059,508 412,000 Ardagh Packaging Finance, PLC /
Ardagh Holdings USA, Inc.* 6.000%, 02/15/25 425,048
1,530,000 Clearwater Paper Corp.*^ 4.750%, 08/15/28 1,548,161
650,000 First Quantum Minerals, Ltd.*^ 7.250%, 04/01/23 662,558
Freeport-McMoRan, Inc. 645,000 5.000%, 09/01/27 681,591 475,000 5.450%, 03/15/43 610,698 425,000 5.400%, 11/14/34^ 540,311 716,000 HB Fuller Company
4.250%, 10/15/28 733,513 957,000 Intertape Polymer Group, Inc.*
4.375%, 06/15/29 980,265

Calamos Convertible Opportunities and Income Fund
SCHEDULE OF INVESTMENTS JULY 31, 2021 (UNAUDITED)
See accompanying Notes to Schedule of Investments
7 9/2/2021 10:38 AM
PRINCIPAL AMOUNT VALUE
725,000 JW Aluminum Continuous Cast Company* 10.250%, 06/01/26 $ 764,744
Kaiser Aluminum Corp.* 505,000 4.625%, 03/01/28^ 528,003 120,000 4.500%, 06/01/31 124,933 777,000 Mercer International, Inc.^
5.125%, 02/01/29 793,457 New Gold, Inc.*
628,000 6.375%, 05/15/25 648,266 237,000 7.500%, 07/15/27 256,173 936,000 OCI, NV*
4.625%, 10/15/25 972,130 475,000 Owens-Brockway Glass
Container, Inc.*^ 6.625%, 05/13/27 515,223
481,000 PBF Holding Company, LLC / PBF Finance Corp. 7.250%, 06/15/25 290,659
1,105,000 Silgan Holdings, Inc.^ 4.125%, 02/01/28 1,148,272
478,000 Trinseo Materials Operating SCA / Trinseo Materials Finance, Inc.* 5.125%, 04/01/29 487,871
750,000 Univar Solutions USA, Inc.* 5.125%, 12/01/27 786,757
480,000 Valvoline, Inc.*^ 3.625%, 06/15/31 478,502 ___________
17,926,762 ___________ Real Estate (0.4%)
764,000 EPR Properties^ 3.750%, 08/15/29 775,926
Forestar Group, Inc.* 750,000 5.000%, 03/01/28 781,792 242,000 3.850%, 05/15/26 245,688 719,000 iStar, Inc.
5.500%, 02/15/26 754,864 Service Properties Trust
1,250,000 4.350%, 10/01/24 1,261,687 465,000 5.250%, 02/15/26 470,692 ___________
4,290,649 ___________ Utilities (0.5%)
705,000 Calpine Corp.*^ 4.500%, 02/15/28 727,708
755,000 NRG Energy, Inc. 6.625%, 01/15/27 782,459
1,449,000 PPL Capital Funding, Inc.^‡ 2.812%, 03/30/67 3 mo. USD LIBOR + 2.67% 1,420,788
Talen Energy Supply, LLC* 500,000 10.500%, 01/15/26 345,155 250,000 7.250%, 05/15/27^ 228,243
1,250,000 TerraForm Power Operating, LLC* 5.000%, 01/31/28 1,353,525 ___________
4,857,878 ___________
TOTAL CORPORATE BONDS (Cost $346,620,153) 362,089,981 ___________ ___________
CONVERTIBLE BONDS (88.5%) Communication Services (10.3%)
3,696,000 Eventbrite, Inc.*µ 0.750%, 09/15/26 3,495,307
PRINCIPAL AMOUNT VALUE
Liberty Media Corp. 9,000,000 0.500%, 12/01/50* $ 9,966,780 8,550,000 1.375%, 10/15/23µ 11,368,850 4,500,000 Liberty Media Corp. / Liberty
Formula Oneµ 1.000%, 01/30/23 5,960,070
5,250,000 Match Group Financeco 3, Inc.* 2.000%, 01/15/30 10,595,078
4,500,000 Sea, Ltd. 2.375%, 12/01/25 13,988,520
Snap, Inc. 11,750,000 0.000%, 05/01/27* 13,526,600
5,750,000 0.750%, 08/01/26 18,824,637 9,250,000 Twitter, Inc.^
0.250%, 06/15/24 12,827,252 7,400,000 Zynga, Inc.
0.250%, 06/01/24 9,889,138 ___________ 110,442,232 ___________
Consumer Discretionary (25.4%) 5,750,000 Airbnb, Inc.*µ
0.000%, 03/15/26 5,389,360 9,000,000 Booking Holdings, Inc.^
0.750%, 05/01/25 12,704,400 6,250,000 Burlington Stores, Inc.^
2.250%, 04/15/25 10,226,687 5,500,000 Cheesecake Factory, Inc.
0.375%, 06/15/26 5,159,550 8,500,000 Chegg, Inc.*
0.000%, 09/01/26 9,217,145 2,500,000 Dick's Sporting Goods, Inc.
3.250%, 04/15/25 7,692,400 DISH Network Corp.
5,250,000 0.000%, 12/15/25* 6,144,600 1,832,000 2.375%, 03/15/24^~ 1,775,263
11,500,000 DraftKings, Inc.*µ 0.000%, 03/15/28 10,095,160
12,750,000 Etsy, Inc.*µ^ 0.125%, 09/01/27 15,367,575
4,312,000 Expedia Group, Inc.*µ^ 0.000%, 02/15/26 4,636,349
11,500,000 Ford Motor Company*µ 0.000%, 03/15/26 12,322,825
5,500,000 LCI Industries*µ 1.125%, 05/15/26 5,931,420
Liberty Interactive, LLCµ 970,000 4.000%, 11/15/29 747,511 615,000 3.750%, 02/15/30 474,436
4,229,000 MakeMyTrip, Ltd.* 0.000%, 02/15/28 4,275,012
11,250,000 Marriott Vacations Worldwide Corp.* 0.000%, 01/15/26 12,028,837
3,000,000 NCL Corp. Ltd. 6.000%, 05/15/24 5,885,190
4,255,000 NCL Corp., Ltd.* 5.375%, 08/01/25 6,733,708
440,000 Peloton Interactive, Inc.* 0.000%, 02/15/26 416,359
4,500,000 RH 0.000%, 09/15/24 14,075,595
15,250,000 Royal Caribbean Cruises, Ltd.^ 4.250%, 06/15/23 19,649,625
5,750,000 Shake Shack, Inc.* 0.000%, 03/01/28 5,388,382
Calamos Convertible Opportunities and Income Fund
SCHEDULE OF INVESTMENTS JULY 31, 2021 (UNAUDITED)
See accompanying Notes to Schedule of Investments
8
9/2/2021 10:38 AM
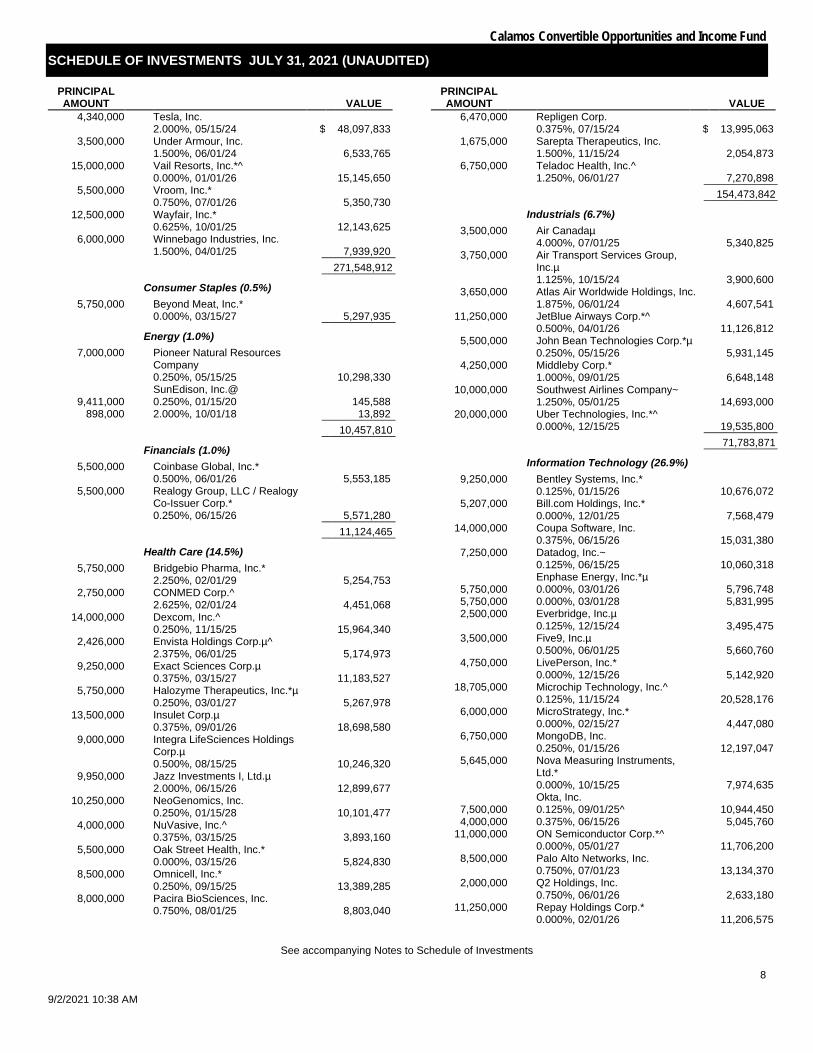
PRINCIPAL AMOUNT VALUE
4,340,000 Tesla, Inc. 2.000%, 05/15/24 $ 48,097,833
3,500,000 Under Armour, Inc. 1.500%, 06/01/24 6,533,765
15,000,000 Vail Resorts, Inc.*^ 0.000%, 01/01/26 15,145,650
5,500,000 Vroom, Inc.* 0.750%, 07/01/26 5,350,730
12,500,000 Wayfair, Inc.* 0.625%, 10/01/25 12,143,625
6,000,000 Winnebago Industries, Inc. 1.500%, 04/01/25 7,939,920 ___________
271,548,912 ___________ Consumer Staples (0.5%)
5,750,000 Beyond Meat, Inc.* 0.000%, 03/15/27 5,297,935 ___________
Energy (1.0%) 7,000,000 Pioneer Natural Resources
Company 0.250%, 05/15/25 10,298,330
SunEdison, Inc.@ 9,411,000 0.250%, 01/15/20 145,588
898,000 2.000%, 10/01/18 13,892 ___________ 10,457,810 ___________
Financials (1.0%) 5,500,000 Coinbase Global, Inc.*
0.500%, 06/01/26 5,553,185 5,500,000 Realogy Group, LLC / Realogy
Co-Issuer Corp.* 0.250%, 06/15/26 5,571,280 ___________
11,124,465 ___________ Health Care (14.5%)
5,750,000 Bridgebio Pharma, Inc.* 2.250%, 02/01/29 5,254,753
2,750,000 CONMED Corp.^ 2.625%, 02/01/24 4,451,068
14,000,000 Dexcom, Inc.^ 0.250%, 11/15/25 15,964,340
2,426,000 Envista Holdings Corp.µ^ 2.375%, 06/01/25 5,174,973
9,250,000 Exact Sciences Corp.µ 0.375%, 03/15/27 11,183,527
5,750,000 Halozyme Therapeutics, Inc.*µ 0.250%, 03/01/27 5,267,978
13,500,000 Insulet Corp.µ 0.375%, 09/01/26 18,698,580
9,000,000 Integra LifeSciences Holdings Corp.µ 0.500%, 08/15/25 10,246,320
9,950,000 Jazz Investments I, Ltd.µ 2.000%, 06/15/26 12,899,677
10,250,000 NeoGenomics, Inc. 0.250%, 01/15/28 10,101,477
4,000,000 NuVasive, Inc.^ 0.375%, 03/15/25 3,893,160
5,500,000 Oak Street Health, Inc.* 0.000%, 03/15/26 5,824,830
8,500,000 Omnicell, Inc.* 0.250%, 09/15/25 13,389,285
8,000,000 Pacira BioSciences, Inc. 0.750%, 08/01/25 8,803,040
PRINCIPAL AMOUNT VALUE
6,470,000 Repligen Corp. 0.375%, 07/15/24 $ 13,995,063
1,675,000 Sarepta Therapeutics, Inc. 1.500%, 11/15/24 2,054,873
6,750,000 Teladoc Health, Inc.^ 1.250%, 06/01/27 7,270,898 ___________
154,473,842 ___________ Industrials (6.7%)
3,500,000 Air Canadaµ 4.000%, 07/01/25 5,340,825
3,750,000 Air Transport Services Group, Inc.µ 1.125%, 10/15/24 3,900,600
3,650,000 Atlas Air Worldwide Holdings, Inc. 1.875%, 06/01/24 4,607,541
11,250,000 JetBlue Airways Corp.*^ 0.500%, 04/01/26 11,126,812
5,500,000 John Bean Technologies Corp.*µ 0.250%, 05/15/26 5,931,145
4,250,000 Middleby Corp.* 1.000%, 09/01/25 6,648,148
10,000,000 Southwest Airlines Company~ 1.250%, 05/01/25 14,693,000
20,000,000 Uber Technologies, Inc.*^ 0.000%, 12/15/25 19,535,800 ___________
71,783,871 ___________ Information Technology (26.9%)
9,250,000 Bentley Systems, Inc.* 0.125%, 01/15/26 10,676,072
5,207,000 Bill.com Holdings, Inc.* 0.000%, 12/01/25 7,568,479
14,000,000 Coupa Software, Inc. 0.375%, 06/15/26 15,031,380
7,250,000 Datadog, Inc.~ 0.125%, 06/15/25 10,060,318
Enphase Energy, Inc.*µ 5,750,000 0.000%, 03/01/26 5,796,748 5,750,000 0.000%, 03/01/28 5,831,995 2,500,000 Everbridge, Inc.µ
0.125%, 12/15/24 3,495,475 3,500,000 Five9, Inc.µ
0.500%, 06/01/25 5,660,760 4,750,000 LivePerson, Inc.*
0.000%, 12/15/26 5,142,920 18,705,000 Microchip Technology, Inc.^
0.125%, 11/15/24 20,528,176 6,000,000 MicroStrategy, Inc.*
0.000%, 02/15/27 4,447,080 6,750,000 MongoDB, Inc.
0.250%, 01/15/26 12,197,047 5,645,000 Nova Measuring Instruments,
Ltd.* 0.000%, 10/15/25 7,974,635
Okta, Inc. 7,500,000 0.125%, 09/01/25^ 10,944,450 4,000,000 0.375%, 06/15/26 5,045,760
11,000,000 ON Semiconductor Corp.*^ 0.000%, 05/01/27 11,706,200
8,500,000 Palo Alto Networks, Inc. 0.750%, 07/01/23 13,134,370
2,000,000 Q2 Holdings, Inc. 0.750%, 06/01/26 2,633,180
11,250,000 Repay Holdings Corp.* 0.000%, 02/01/26 11,206,575
Calamos Convertible Opportunities and Income Fund
SCHEDULE OF INVESTMENTS JULY 31, 2021 (UNAUDITED)
See accompanying Notes to Schedule of Investments
9 9/2/2021 10:38 AM
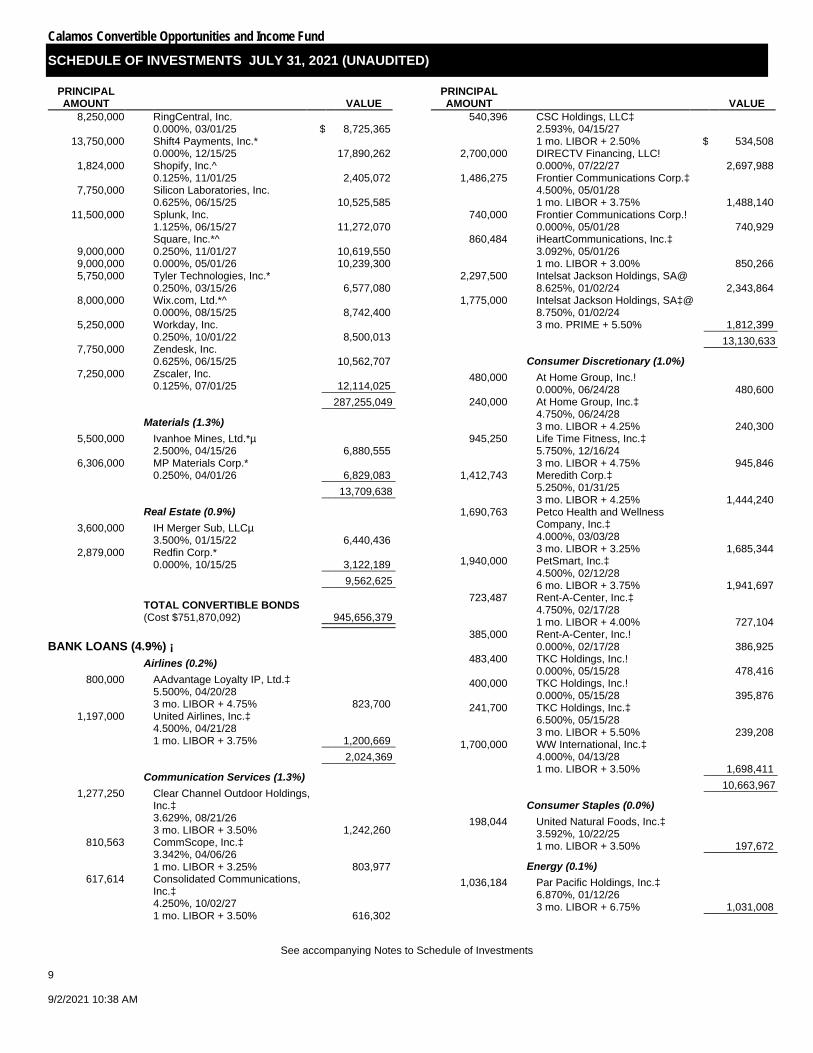
PRINCIPAL AMOUNT VALUE
8,250,000 RingCentral, Inc. 0.000%, 03/01/25 $ 8,725,365
13,750,000 Shift4 Payments, Inc.* 0.000%, 12/15/25 17,890,262
1,824,000 Shopify, Inc.^ 0.125%, 11/01/25 2,405,072
7,750,000 Silicon Laboratories, Inc. 0.625%, 06/15/25 10,525,585
11,500,000 Splunk, Inc. 1.125%, 06/15/27 11,272,070
Square, Inc.*^ 9,000,000 0.250%, 11/01/27 10,619,550 9,000,000 0.000%, 05/01/26 10,239,300 5,750,000 Tyler Technologies, Inc.*
0.250%, 03/15/26 6,577,080 8,000,000 Wix.com, Ltd.*^
0.000%, 08/15/25 8,742,400 5,250,000 Workday, Inc.
0.250%, 10/01/22 8,500,013 7,750,000 Zendesk, Inc.
0.625%, 06/15/25 10,562,707 7,250,000 Zscaler, Inc.
0.125%, 07/01/25 12,114,025 ___________ 287,255,049 ___________
Materials (1.3%) 5,500,000 Ivanhoe Mines, Ltd.*µ
2.500%, 04/15/26 6,880,555 6,306,000 MP Materials Corp.*
0.250%, 04/01/26 6,829,083 ___________ 13,709,638 ___________
Real Estate (0.9%) 3,600,000 IH Merger Sub, LLCµ
3.500%, 01/15/22 6,440,436 2,879,000 Redfin Corp.*
0.000%, 10/15/25 3,122,189 ___________ 9,562,625 ___________
TOTAL CONVERTIBLE BONDS (Cost $751,870,092) 945,656,379 ___________ ___________
BANK LOANS (4.9%) ¡ Airlines (0.2%)
800,000 AAdvantage Loyalty IP, Ltd.‡ 5.500%, 04/20/28 3 mo. LIBOR + 4.75% 823,700
1,197,000 United Airlines, Inc.‡ 4.500%, 04/21/28 1 mo. LIBOR + 3.75% 1,200,669 ___________
2,024,369 ___________ Communication Services (1.3%)
1,277,250 Clear Channel Outdoor Holdings, Inc.‡ 3.629%, 08/21/26 3 mo. LIBOR + 3.50% 1,242,260
810,563 CommScope, Inc.‡ 3.342%, 04/06/26 1 mo. LIBOR + 3.25% 803,977
617,614 Consolidated Communications, Inc.‡ 4.250%, 10/02/27 1 mo. LIBOR + 3.50% 616,302
PRINCIPAL AMOUNT VALUE
540,396 CSC Holdings, LLC‡ 2.593%, 04/15/27 1 mo. LIBOR + 2.50% $ 534,508
2,700,000 DIRECTV Financing, LLC! 0.000%, 07/22/27 2,697,988
1,486,275 Frontier Communications Corp.‡ 4.500%, 05/01/28 1 mo. LIBOR + 3.75% 1,488,140
740,000 Frontier Communications Corp.! 0.000%, 05/01/28 740,929
860,484 iHeartCommunications, Inc.‡ 3.092%, 05/01/26 1 mo. LIBOR + 3.00% 850,266
2,297,500 Intelsat Jackson Holdings, SA@ 8.625%, 01/02/24 2,343,864
1,775,000 Intelsat Jackson Holdings, SA‡@ 8.750%, 01/02/24 3 mo. PRIME + 5.50% 1,812,399 ___________
13,130,633 ___________ Consumer Discretionary (1.0%)
480,000 At Home Group, Inc.! 0.000%, 06/24/28 480,600
240,000 At Home Group, Inc.‡ 4.750%, 06/24/28 3 mo. LIBOR + 4.25% 240,300
945,250 Life Time Fitness, Inc.‡ 5.750%, 12/16/24 3 mo. LIBOR + 4.75% 945,846
1,412,743 Meredith Corp.‡ 5.250%, 01/31/25 3 mo. LIBOR + 4.25% 1,444,240
1,690,763 Petco Health and Wellness Company, Inc.‡ 4.000%, 03/03/28 3 mo. LIBOR + 3.25% 1,685,344
1,940,000 PetSmart, Inc.‡ 4.500%, 02/12/28 6 mo. LIBOR + 3.75% 1,941,697
723,487 Rent-A-Center, Inc.‡ 4.750%, 02/17/28 1 mo. LIBOR + 4.00% 727,104
385,000 Rent-A-Center, Inc.! 0.000%, 02/17/28 386,925
483,400 TKC Holdings, Inc.! 0.000%, 05/15/28 478,416
400,000 TKC Holdings, Inc.! 0.000%, 05/15/28 395,876
241,700 TKC Holdings, Inc.‡ 6.500%, 05/15/28 3 mo. LIBOR + 5.50% 239,208
1,700,000 WW International, Inc.‡ 4.000%, 04/13/28 1 mo. LIBOR + 3.50% 1,698,411 ___________
10,663,967 ___________ Consumer Staples (0.0%)
198,044 United Natural Foods, Inc.‡ 3.592%, 10/22/25 1 mo. LIBOR + 3.50% 197,672 ___________
Energy (0.1%) 1,036,184 Par Pacific Holdings, Inc.‡
6.870%, 01/12/26 3 mo. LIBOR + 6.75% 1,031,008 ___________
Calamos Convertible Opportunities and Income Fund
SCHEDULE OF INVESTMENTS JULY 31, 2021 (UNAUDITED)
See accompanying Notes to Schedule of Investments
10
9/2/2021 10:38 AM
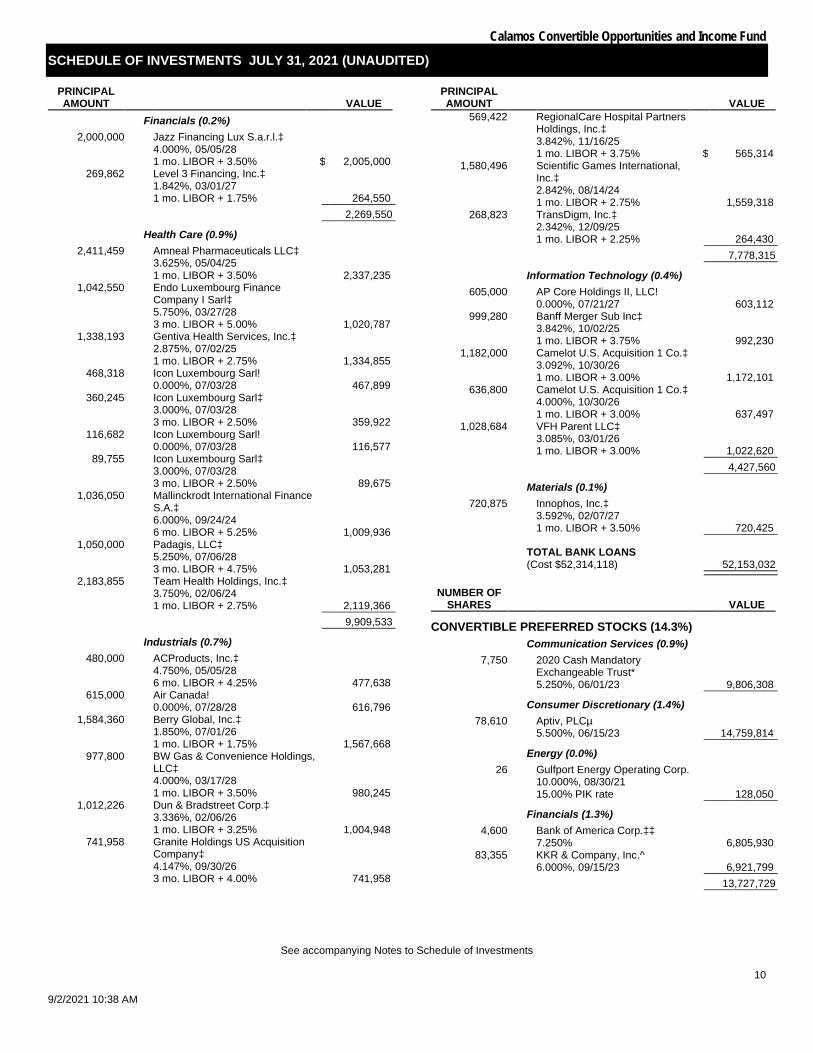
PRINCIPAL AMOUNT VALUE
Financials (0.2%) 2,000,000 Jazz Financing Lux S.a.r.l.‡
4.000%, 05/05/28 1 mo. LIBOR + 3.50% $ 2,005,000
269,862 Level 3 Financing, Inc.‡ 1.842%, 03/01/27 1 mo. LIBOR + 1.75% 264,550 ___________
2,269,550 ___________ Health Care (0.9%)
2,411,459 Amneal Pharmaceuticals LLC‡ 3.625%, 05/04/25 1 mo. LIBOR + 3.50% 2,337,235
1,042,550 Endo Luxembourg Finance Company I Sarl‡ 5.750%, 03/27/28 3 mo. LIBOR + 5.00% 1,020,787
1,338,193 Gentiva Health Services, Inc.‡ 2.875%, 07/02/25 1 mo. LIBOR + 2.75% 1,334,855
468,318 Icon Luxembourg Sarl! 0.000%, 07/03/28 467,899
360,245 Icon Luxembourg Sarl‡ 3.000%, 07/03/28 3 mo. LIBOR + 2.50% 359,922
116,682 Icon Luxembourg Sarl! 0.000%, 07/03/28 116,577
89,755 Icon Luxembourg Sarl‡ 3.000%, 07/03/28 3 mo. LIBOR + 2.50% 89,675
1,036,050 Mallinckrodt International Finance S.A.‡ 6.000%, 09/24/24 6 mo. LIBOR + 5.25% 1,009,936
1,050,000 Padagis, LLC‡ 5.250%, 07/06/28 3 mo. LIBOR + 4.75% 1,053,281
2,183,855 Team Health Holdings, Inc.‡ 3.750%, 02/06/24 1 mo. LIBOR + 2.75% 2,119,366 ___________
9,909,533 ___________ Industrials (0.7%)
480,000 ACProducts, Inc.‡ 4.750%, 05/05/28 6 mo. LIBOR + 4.25% 477,638
615,000 Air Canada! 0.000%, 07/28/28 616,796
1,584,360 Berry Global, Inc.‡ 1.850%, 07/01/26 1 mo. LIBOR + 1.75% 1,567,668
977,800 BW Gas & Convenience Holdings, LLC‡ 4.000%, 03/17/28 1 mo. LIBOR + 3.50% 980,245
1,012,226 Dun & Bradstreet Corp.‡ 3.336%, 02/06/26 1 mo. LIBOR + 3.25% 1,004,948
741,958 Granite Holdings US Acquisition Company‡ 4.147%, 09/30/26 3 mo. LIBOR + 4.00% 741,958
PRINCIPAL AMOUNT VALUE
569,422 RegionalCare Hospital Partners Holdings, Inc.‡ 3.842%, 11/16/25 1 mo. LIBOR + 3.75% $ 565,314
1,580,496 Scientific Games International, Inc.‡ 2.842%, 08/14/24 1 mo. LIBOR + 2.75% 1,559,318
268,823 TransDigm, Inc.‡ 2.342%, 12/09/25 1 mo. LIBOR + 2.25% 264,430 ___________
7,778,315 ___________ Information Technology (0.4%)
605,000 AP Core Holdings II, LLC! 0.000%, 07/21/27 603,112
999,280 Banff Merger Sub Inc‡ 3.842%, 10/02/25 1 mo. LIBOR + 3.75% 992,230
1,182,000 Camelot U.S. Acquisition 1 Co.‡ 3.092%, 10/30/26 1 mo. LIBOR + 3.00% 1,172,101
636,800 Camelot U.S. Acquisition 1 Co.‡ 4.000%, 10/30/26 1 mo. LIBOR + 3.00% 637,497
1,028,684 VFH Parent LLC‡ 3.085%, 03/01/26 1 mo. LIBOR + 3.00% 1,022,620 ___________
4,427,560 ___________ Materials (0.1%)
720,875 Innophos, Inc.‡ 3.592%, 02/07/27 1 mo. LIBOR + 3.50% 720,425 ___________
TOTAL BANK LOANS (Cost $52,314,118) 52,153,032 ___________ ___________
NUMBER OF SHARES VALUE
CONVERTIBLE PREFERRED STOCKS (14.3%) Communication Services (0.9%)
7,750 2020 Cash Mandatory Exchangeable Trust* 5.250%, 06/01/23 9,806,308 ___________
Consumer Discretionary (1.4%) 78,610 Aptiv, PLCµ
5.500%, 06/15/23 14,759,814 ___________ Energy (0.0%)
26 Gulfport Energy Operating Corp. 10.000%, 08/30/21 15.00% PIK rate 128,050 ___________
Financials (1.3%) 4,600 Bank of America Corp.‡‡
7.250% 6,805,930 83,355 KKR & Company, Inc.^
6.000%, 09/15/23 6,921,799 ___________ 13,727,729 ___________
Calamos Convertible Opportunities and Income Fund
SCHEDULE OF INVESTMENTS JULY 31, 2021 (UNAUDITED)
See accompanying Notes to Schedule of Investments
11 9/2/2021 10:38 AM
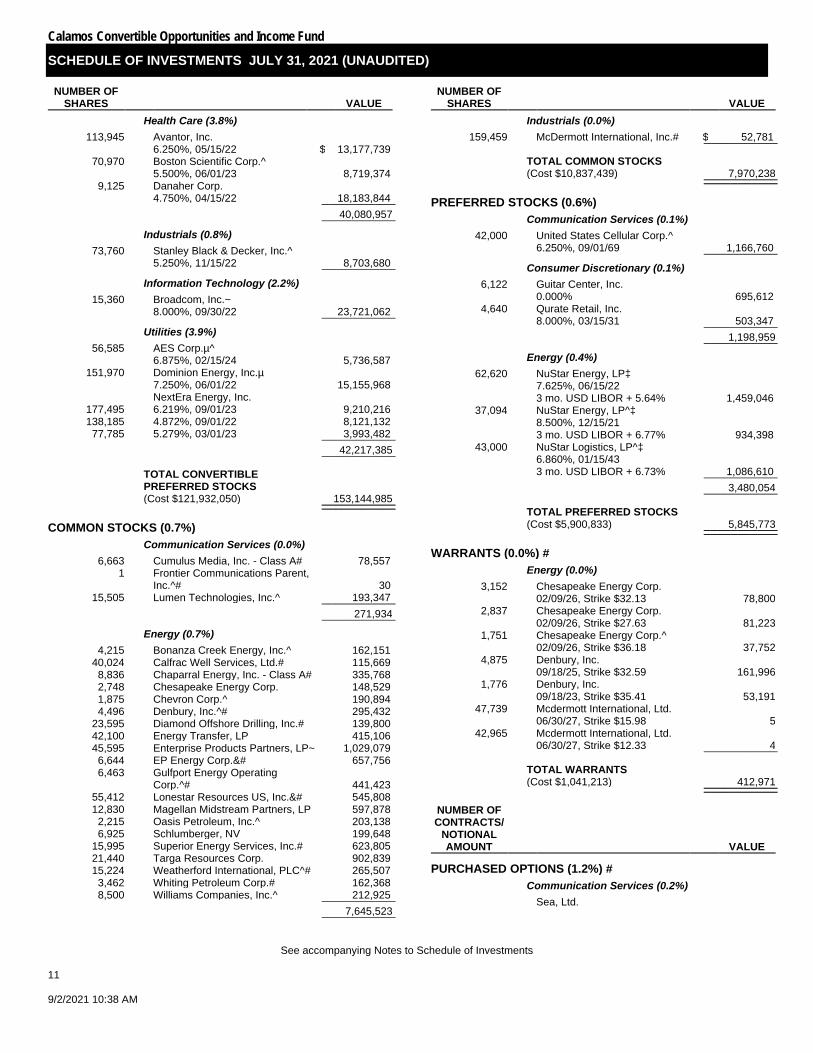
NUMBER OF SHARES VALUE
Health Care (3.8%) 113,945 Avantor, Inc.
6.250%, 05/15/22 $ 13,177,739 70,970 Boston Scientific Corp.^
5.500%, 06/01/23 8,719,374 9,125 Danaher Corp.
4.750%, 04/15/22 18,183,844 ___________ 40,080,957 ___________
Industrials (0.8%) 73,760 Stanley Black & Decker, Inc.^
5.250%, 11/15/22 8,703,680 ___________ Information Technology (2.2%)
15,360 Broadcom, Inc.~ 8.000%, 09/30/22 23,721,062 ___________
Utilities (3.9%) 56,585 AES Corp.µ^
6.875%, 02/15/24 5,736,587 151,970 Dominion Energy, Inc.µ
7.250%, 06/01/22 15,155,968 NextEra Energy, Inc.
177,495 6.219%, 09/01/23 9,210,216 138,185 4.872%, 09/01/22 8,121,132
77,785 5.279%, 03/01/23 3,993,482 ___________ 42,217,385 ___________
TOTAL CONVERTIBLE PREFERRED STOCKS (Cost $121,932,050) 153,144,985 ___________ ___________
COMMON STOCKS (0.7%) Communication Services (0.0%)
6,663 Cumulus Media, Inc. - Class A# 78,557 1 Frontier Communications Parent,
Inc.^# 30 15,505 Lumen Technologies, Inc.^ 193,347 ___________
271,934 ___________ Energy (0.7%)
4,215 Bonanza Creek Energy, Inc.^ 162,151 40,024 Calfrac Well Services, Ltd.# 115,669
8,836 Chaparral Energy, Inc. - Class A# 335,768 2,748 Chesapeake Energy Corp. 148,529 1,875 Chevron Corp.^ 190,894 4,496 Denbury, Inc.^# 295,432
23,595 Diamond Offshore Drilling, Inc.# 139,800 42,100 Energy Transfer, LP 415,106 45,595 Enterprise Products Partners, LP~ 1,029,079
6,644 EP Energy Corp.&# 657,756 6,463 Gulfport Energy Operating
Corp.^# 441,423 55,412 Lonestar Resources US, Inc.&# 545,808 12,830 Magellan Midstream Partners, LP 597,878
2,215 Oasis Petroleum, Inc.^ 203,138 6,925 Schlumberger, NV 199,648
15,995 Superior Energy Services, Inc.# 623,805 21,440 Targa Resources Corp. 902,839 15,224 Weatherford International, PLC^# 265,507
3,462 Whiting Petroleum Corp.# 162,368 8,500 Williams Companies, Inc.^ 212,925 ___________
7,645,523 ___________
NUMBER OF SHARES VALUE
Industrials (0.0%) 159,459 McDermott International, Inc.# $ 52,781 ___________
TOTAL COMMON STOCKS (Cost $10,837,439) 7,970,238 ___________ ___________
PREFERRED STOCKS (0.6%) Communication Services (0.1%)
42,000 United States Cellular Corp.^ 6.250%, 09/01/69 1,166,760 ___________
Consumer Discretionary (0.1%) 6,122 Guitar Center, Inc.
0.000% 695,612 4,640 Qurate Retail, Inc.
8.000%, 03/15/31 503,347 ___________ 1,198,959 ___________
Energy (0.4%) 62,620 NuStar Energy, LP‡
7.625%, 06/15/22 3 mo. USD LIBOR + 5.64% 1,459,046
37,094 NuStar Energy, LP^‡ 8.500%, 12/15/21 3 mo. USD LIBOR + 6.77% 934,398
43,000 NuStar Logistics, LP^‡ 6.860%, 01/15/43 3 mo. USD LIBOR + 6.73% 1,086,610 ___________
3,480,054 ___________
TOTAL PREFERRED STOCKS (Cost $5,900,833) 5,845,773 ___________ ___________
WARRANTS (0.0%) # Energy (0.0%)
3,152
Chesapeake Energy Corp. 02/09/26, Strike $32.13 78,800
2,837
Chesapeake Energy Corp. 02/09/26, Strike $27.63 81,223
1,751
Chesapeake Energy Corp.^ 02/09/26, Strike $36.18 37,752
4,875
Denbury, Inc. 09/18/25, Strike $32.59 161,996
1,776
Denbury, Inc. 09/18/23, Strike $35.41 53,191
47,739
Mcdermott International, Ltd. 06/30/27, Strike $15.98 5
42,965
Mcdermott International, Ltd. 06/30/27, Strike $12.33 4 ___________
TOTAL WARRANTS (Cost $1,041,213) 412,971 ___________ ___________
NUMBER OF CONTRACTS/
NOTIONAL AMOUNT VALUE
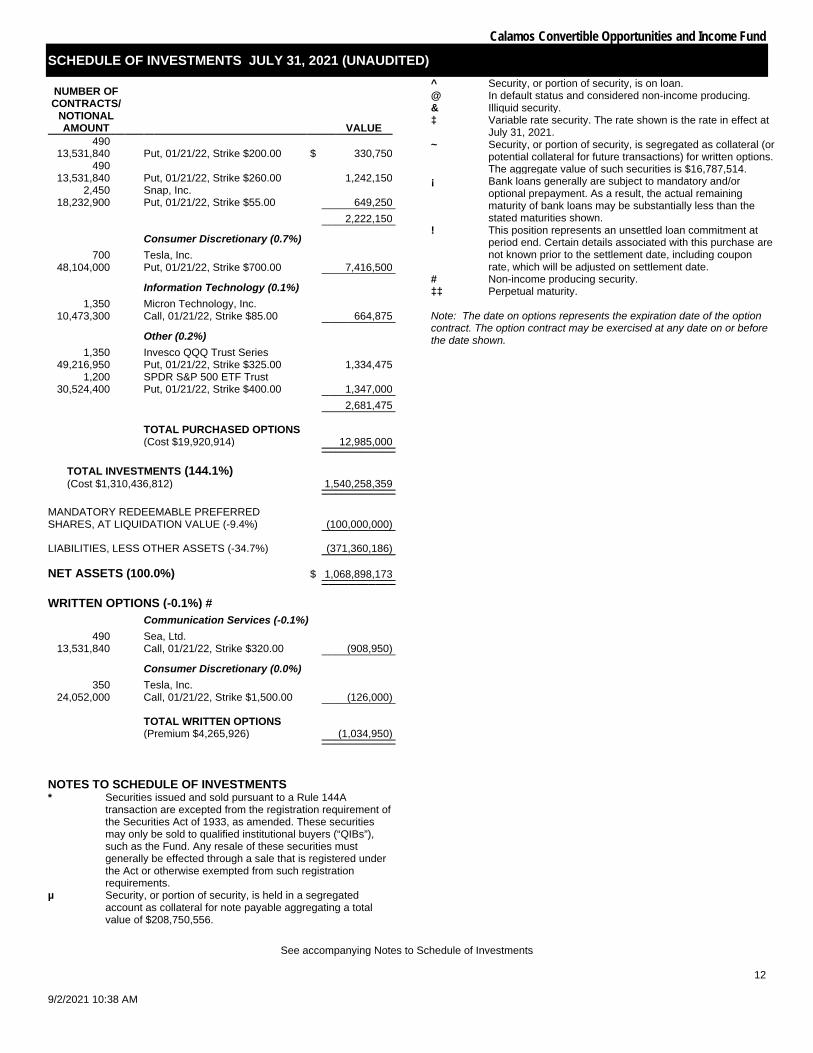
PURCHASED OPTIONS (1.2%) # Communication Services (0.2%)
Sea, Ltd.
Calamos Convertible Opportunities and Income Fund
SCHEDULE OF INVESTMENTS JULY 31, 2021 (UNAUDITED)
See accompanying Notes to Schedule of Investments
12
9/2/2021 10:38 AM
NUMBER OF CONTRACTS/
NOTIONAL AMOUNT VALUE
490 13,531,840
Put, 01/21/22, Strike $200.00 $ 330,750
490 13,531,840
Put, 01/21/22, Strike $260.00 1,242,150
2,450 18,232,900
Snap, Inc. Put, 01/21/22, Strike $55.00 649,250 ___________
2,222,150 ___________ Consumer Discretionary (0.7%)
700 48,104,000
Tesla, Inc. Put, 01/21/22, Strike $700.00 7,416,500 ___________ Information Technology (0.1%)
1,350 10,473,300
Micron Technology, Inc. Call, 01/21/22, Strike $85.00 664,875 ___________ Other (0.2%)
1,350 49,216,950
Invesco QQQ Trust Series Put, 01/21/22, Strike $325.00 1,334,475
1,200 30,524,400
SPDR S&P 500 ETF Trust Put, 01/21/22, Strike $400.00 1,347,000 ___________
2,681,475 ___________
TOTAL PURCHASED OPTIONS (Cost $19,920,914) 12,985,000 ___________ ___________
TOTAL INVESTMENTS (144.1%) (Cost $1,310,436,812) 1,540,258,359 ___________ ___________
MANDATORY REDEEMABLE PREFERRED SHARES, AT LIQUIDATION VALUE (-9.4%) (100,000,000) ___________
LIABILITIES, LESS OTHER ASSETS (-34.7%) (371,360,186) ___________
NET ASSETS (100.0%) $ 1,068,898,173 ___________ ___________
WRITTEN OPTIONS (-0.1%) # Communication Services (-0.1%)
490 13,531,840
Sea, Ltd. Call, 01/21/22, Strike $320.00 (908,950) ___________ Consumer Discretionary (0.0%)
350 24,052,000
Tesla, Inc. Call, 01/21/22, Strike $1,500.00 (126,000) ___________
TOTAL WRITTEN OPTIONS (Premium $4,265,926) (1,034,950) ___________ ___________
NOTES TO SCHEDULE OF INVESTMENTS *
Securities issued and sold pursuant to a Rule 144A transaction are excepted from the registration requirement of the Securities Act of 1933, as amended. These securities may only be sold to qualified institutional buyers (“QIBs”), such as the Fund. Any resale of these securities must generally be effected through a sale that is registered under the Act or otherwise exempted from such registration requirements.
µ
Security, or portion of security, is held in a segregated account as collateral for note payable aggregating a total value of $208,750,556.
^ Security, or portion of security, is on loan. @ In default status and considered non-income producing. & Illiquid security. ‡
Variable rate security. The rate shown is the rate in effect at July 31, 2021.
~
Security, or portion of security, is segregated as collateral (or potential collateral for future transactions) for written options. The aggregate value of such securities is $16,787,514.
¡
Bank loans generally are subject to mandatory and/or optional prepayment. As a result, the actual remaining maturity of bank loans may be substantially less than the stated maturities shown.
!
This position represents an unsettled loan commitment at period end. Certain details associated with this purchase are not known prior to the settlement date, including coupon rate, which will be adjusted on settlement date.
# Non-income producing security. ‡‡ Perpetual maturity. Note: The date on options represents the expiration date of the option contract. The option contract may be exercised at any date on or before the date shown.
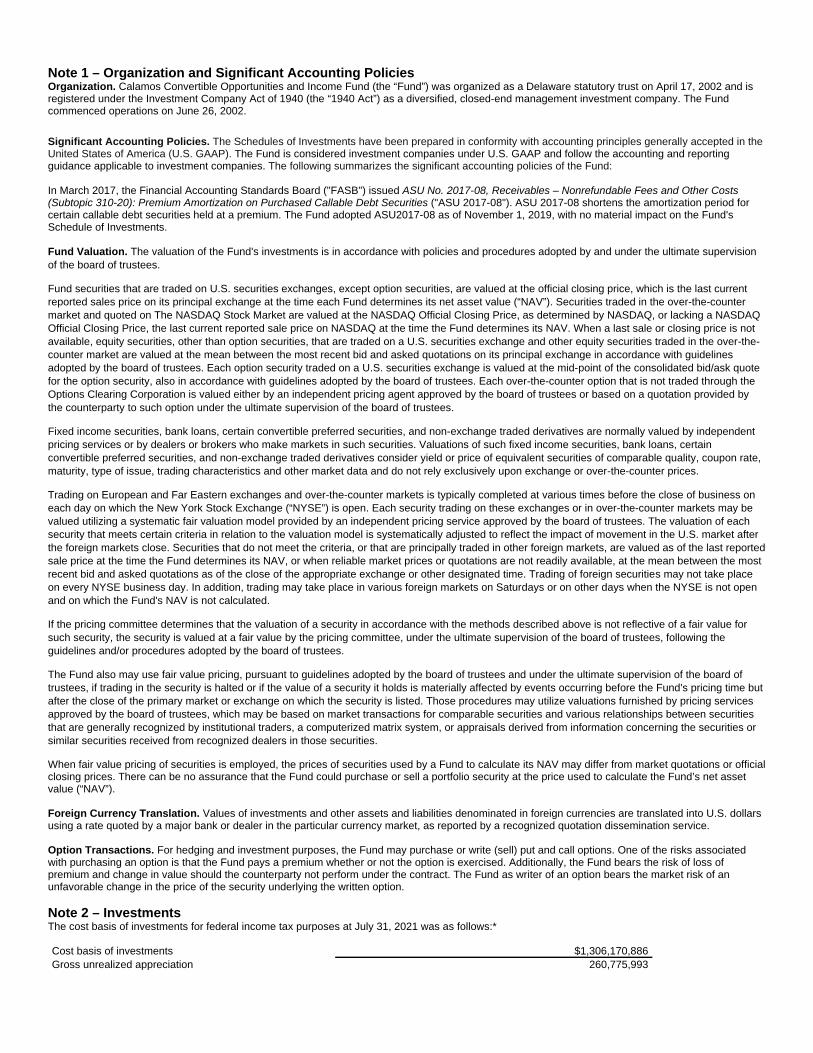
Note 1 – Organization and Significant Accounting Policies Organization. Calamos Convertible Opportunities and Income Fund (the “Fund”) was organized as a Delaware statutory trust on April 17, 2002 and is registered under the Investment Company Act of 1940 (the “1940 Act”) as a diversified, closed-end management investment company. The Fund commenced operations on June 26, 2002. Significant Accounting Policies. The Schedules of Investments have been prepared in conformity with accounting principles generally accepted in the United States of America (U.S. GAAP). The Fund is considered investment companies under U.S. GAAP and follow the accounting and reporting guidance applicable to investment companies. The following summarizes the significant accounting policies of the Fund: In March 2017, the Financial Accounting Standards Board ("FASB") issued ASU No. 2017-08, Receivables – Nonrefundable Fees and Other Costs (Subtopic 310-20): Premium Amortization on Purchased Callable Debt Securities ("ASU 2017-08"). ASU 2017-08 shortens the amortization period for certain callable debt securities held at a premium. The Fund adopted ASU2017-08 as of November 1, 2019, with no material impact on the Fund's Schedule of Investments. Fund Valuation. The valuation of the Fund's investments is in accordance with policies and procedures adopted by and under the ultimate supervision of the board of trustees.
Fund securities that are traded on U.S. securities exchanges, except option securities, are valued at the official closing price, which is the last current reported sales price on its principal exchange at the time each Fund determines its net asset value (“NAV”). Securities traded in the over-the-counter market and quoted on The NASDAQ Stock Market are valued at the NASDAQ Official Closing Price, as determined by NASDAQ, or lacking a NASDAQ Official Closing Price, the last current reported sale price on NASDAQ at the time the Fund determines its NAV. When a last sale or closing price is not available, equity securities, other than option securities, that are traded on a U.S. securities exchange and other equity securities traded in the over-the-counter market are valued at the mean between the most recent bid and asked quotations on its principal exchange in accordance with guidelines adopted by the board of trustees. Each option security traded on a U.S. securities exchange is valued at the mid-point of the consolidated bid/ask quote for the option security, also in accordance with guidelines adopted by the board of trustees. Each over-the-counter option that is not traded through the Options Clearing Corporation is valued either by an independent pricing agent approved by the board of trustees or based on a quotation provided by the counterparty to such option under the ultimate supervision of the board of trustees.
Fixed income securities, bank loans, certain convertible preferred securities, and non-exchange traded derivatives are normally valued by independent pricing services or by dealers or brokers who make markets in such securities. Valuations of such fixed income securities, bank loans, certain convertible preferred securities, and non-exchange traded derivatives consider yield or price of equivalent securities of comparable quality, coupon rate, maturity, type of issue, trading characteristics and other market data and do not rely exclusively upon exchange or over-the-counter prices.
Trading on European and Far Eastern exchanges and over-the-counter markets is typically completed at various times before the close of business on each day on which the New York Stock Exchange (“NYSE”) is open. Each security trading on these exchanges or in over-the-counter markets may be valued utilizing a systematic fair valuation model provided by an independent pricing service approved by the board of trustees. The valuation of each security that meets certain criteria in relation to the valuation model is systematically adjusted to reflect the impact of movement in the U.S. market after the foreign markets close. Securities that do not meet the criteria, or that are principally traded in other foreign markets, are valued as of the last reported sale price at the time the Fund determines its NAV, or when reliable market prices or quotations are not readily available, at the mean between the most recent bid and asked quotations as of the close of the appropriate exchange or other designated time. Trading of foreign securities may not take place on every NYSE business day. In addition, trading may take place in various foreign markets on Saturdays or on other days when the NYSE is not open and on which the Fund's NAV is not calculated.
If the pricing committee determines that the valuation of a security in accordance with the methods described above is not reflective of a fair value for such security, the security is valued at a fair value by the pricing committee, under the ultimate supervision of the board of trustees, following the guidelines and/or procedures adopted by the board of trustees.
The Fund also may use fair value pricing, pursuant to guidelines adopted by the board of trustees and under the ultimate supervision of the board of trustees, if trading in the security is halted or if the value of a security it holds is materially affected by events occurring before the Fund's pricing time but after the close of the primary market or exchange on which the security is listed. Those procedures may utilize valuations furnished by pricing services approved by the board of trustees, which may be based on market transactions for comparable securities and various relationships between securities that are generally recognized by institutional traders, a computerized matrix system, or appraisals derived from information concerning the securities or similar securities received from recognized dealers in those securities.
When fair value pricing of securities is employed, the prices of securities used by a Fund to calculate its NAV may differ from market quotations or official closing prices. There can be no assurance that the Fund could purchase or sell a portfolio security at the price used to calculate the Fund’s net asset value (“NAV”). Foreign Currency Translation. Values of investments and other assets and liabilities denominated in foreign currencies are translated into U.S. dollars using a rate quoted by a major bank or dealer in the particular currency market, as reported by a recognized quotation dissemination service. Option Transactions. For hedging and investment purposes, the Fund may purchase or write (sell) put and call options. One of the risks associated with purchasing an option is that the Fund pays a premium whether or not the option is exercised. Additionally, the Fund bears the risk of loss of premium and change in value should the counterparty not perform under the contract. The Fund as writer of an option bears the market risk of an unfavorable change in the price of the security underlying the written option. Note 2 – Investments The cost basis of investments for federal income tax purposes at July 31, 2021 was as follows:* Cost basis of investments $1,306,170,886 Gross unrealized appreciation 260,775,993
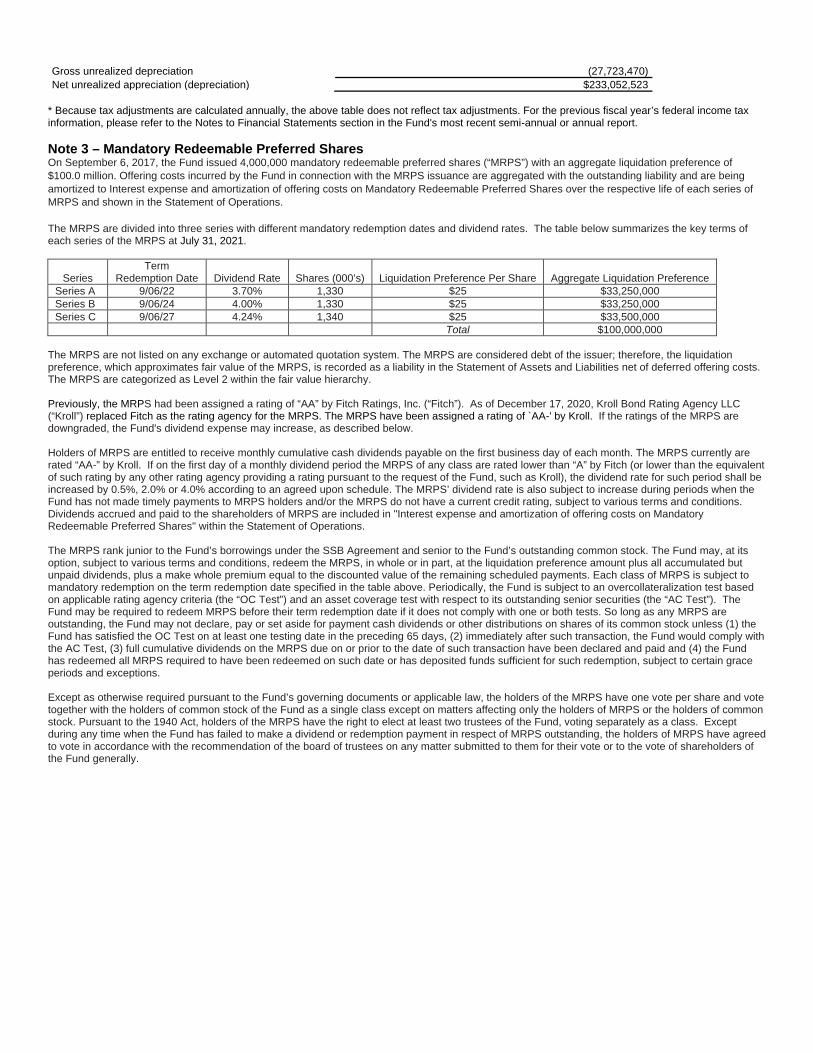
Gross unrealized depreciation (27,723,470) Net unrealized appreciation (depreciation) $233,052,523
* Because tax adjustments are calculated annually, the above table does not reflect tax adjustments. For the previous fiscal year’s federal income tax information, please refer to the Notes to Financial Statements section in the Fund's most recent semi-annual or annual report. Note 3 – Mandatory Redeemable Preferred Shares On September 6, 2017, the Fund issued 4,000,000 mandatory redeemable preferred shares (“MRPS”) with an aggregate liquidation preference of $100.0 million. Offering costs incurred by the Fund in connection with the MRPS issuance are aggregated with the outstanding liability and are being amortized to Interest expense and amortization of offering costs on Mandatory Redeemable Preferred Shares over the respective life of each series of MRPS and shown in the Statement of Operations. The MRPS are divided into three series with different mandatory redemption dates and dividend rates. The table below summarizes the key terms of each series of the MRPS at July 31, 2021.
Series Term
Redemption Date Dividend Rate Shares (000’s) Liquidation Preference Per Share Aggregate Liquidation Preference Series A 9/06/22 3.70% 1,330 $25 $33,250,000 Series B 9/06/24 4.00% 1,330 $25 $33,250,000 Series C 9/06/27 4.24% 1,340 $25 $33,500,000
Total $100,000,000 The MRPS are not listed on any exchange or automated quotation system. The MRPS are considered debt of the issuer; therefore, the liquidation preference, which approximates fair value of the MRPS, is recorded as a liability in the Statement of Assets and Liabilities net of deferred offering costs. The MRPS are categorized as Level 2 within the fair value hierarchy. Previously, the MRPS had been assigned a rating of “AA” by Fitch Ratings, Inc. (“Fitch”). As of December 17, 2020, Kroll Bond Rating Agency LLC (“Kroll”) replaced Fitch as the rating agency for the MRPS. The MRPS have been assigned a rating of `AA-' by Kroll. If the ratings of the MRPS are downgraded, the Fund's dividend expense may increase, as described below. Holders of MRPS are entitled to receive monthly cumulative cash dividends payable on the first business day of each month. The MRPS currently are rated “AA-” by Kroll. If on the first day of a monthly dividend period the MRPS of any class are rated lower than “A” by Fitch (or lower than the equivalent of such rating by any other rating agency providing a rating pursuant to the request of the Fund, such as Kroll), the dividend rate for such period shall be increased by 0.5%, 2.0% or 4.0% according to an agreed upon schedule. The MRPS’ dividend rate is also subject to increase during periods when the Fund has not made timely payments to MRPS holders and/or the MRPS do not have a current credit rating, subject to various terms and conditions. Dividends accrued and paid to the shareholders of MRPS are included in "Interest expense and amortization of offering costs on Mandatory Redeemable Preferred Shares" within the Statement of Operations. The MRPS rank junior to the Fund’s borrowings under the SSB Agreement and senior to the Fund’s outstanding common stock. The Fund may, at its option, subject to various terms and conditions, redeem the MRPS, in whole or in part, at the liquidation preference amount plus all accumulated but unpaid dividends, plus a make whole premium equal to the discounted value of the remaining scheduled payments. Each class of MRPS is subject to mandatory redemption on the term redemption date specified in the table above. Periodically, the Fund is subject to an overcollateralization test based on applicable rating agency criteria (the “OC Test”) and an asset coverage test with respect to its outstanding senior securities (the “AC Test”). The Fund may be required to redeem MRPS before their term redemption date if it does not comply with one or both tests. So long as any MRPS are outstanding, the Fund may not declare, pay or set aside for payment cash dividends or other distributions on shares of its common stock unless (1) the Fund has satisfied the OC Test on at least one testing date in the preceding 65 days, (2) immediately after such transaction, the Fund would comply with the AC Test, (3) full cumulative dividends on the MRPS due on or prior to the date of such transaction have been declared and paid and (4) the Fund has redeemed all MRPS required to have been redeemed on such date or has deposited funds sufficient for such redemption, subject to certain grace periods and exceptions. Except as otherwise required pursuant to the Fund’s governing documents or applicable law, the holders of the MRPS have one vote per share and vote together with the holders of common stock of the Fund as a single class except on matters affecting only the holders of MRPS or the holders of common stock. Pursuant to the 1940 Act, holders of the MRPS have the right to elect at least two trustees of the Fund, voting separately as a class. Except during any time when the Fund has failed to make a dividend or redemption payment in respect of MRPS outstanding, the holders of MRPS have agreed to vote in accordance with the recommendation of the board of trustees on any matter submitted to them for their vote or to the vote of shareholders of the Fund generally.
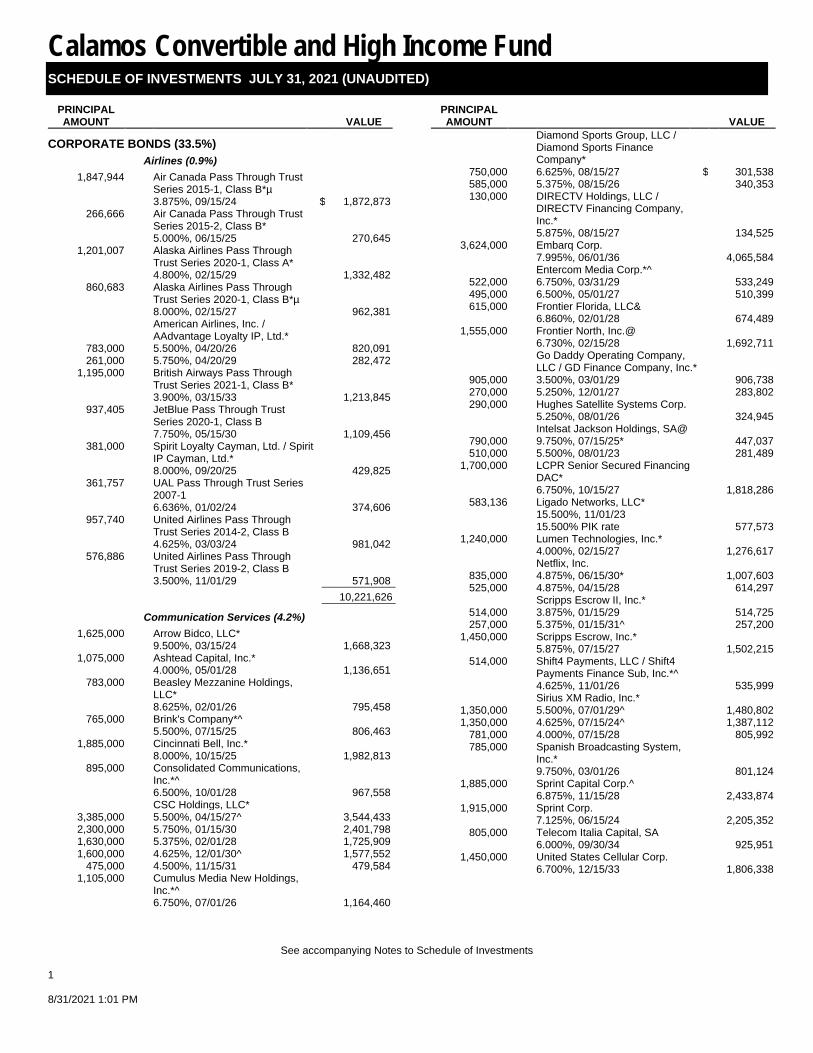
Calamos Convertible and High Income Fund SCHEDULE OF INVESTMENTS JULY 31, 2021 (UNAUDITED)
See accompanying Notes to Schedule of Investments
1 8/31/2021 1:01 PM
PRINCIPAL AMOUNT VALUE
CORPORATE BONDS (33.5%) Airlines (0.9%)
1,847,944 Air Canada Pass Through Trust Series 2015-1, Class B*µ 3.875%, 09/15/24 $ 1,872,873
266,666 Air Canada Pass Through Trust Series 2015-2, Class B* 5.000%, 06/15/25 270,645
1,201,007 Alaska Airlines Pass Through Trust Series 2020-1, Class A* 4.800%, 02/15/29 1,332,482
860,683 Alaska Airlines Pass Through Trust Series 2020-1, Class B*µ 8.000%, 02/15/27 962,381
American Airlines, Inc. / AAdvantage Loyalty IP, Ltd.*
783,000 5.500%, 04/20/26 820,091 261,000 5.750%, 04/20/29 282,472
1,195,000 British Airways Pass Through Trust Series 2021-1, Class B* 3.900%, 03/15/33 1,213,845
937,405 JetBlue Pass Through Trust Series 2020-1, Class B 7.750%, 05/15/30 1,109,456
381,000 Spirit Loyalty Cayman, Ltd. / Spirit IP Cayman, Ltd.* 8.000%, 09/20/25 429,825
361,757 UAL Pass Through Trust Series 2007-1 6.636%, 01/02/24 374,606
957,740 United Airlines Pass Through Trust Series 2014-2, Class B 4.625%, 03/03/24 981,042
576,886 United Airlines Pass Through Trust Series 2019-2, Class B 3.500%, 11/01/29 571,908 ___________
10,221,626 ___________ Communication Services (4.2%)
1,625,000 Arrow Bidco, LLC* 9.500%, 03/15/24 1,668,323
1,075,000 Ashtead Capital, Inc.* 4.000%, 05/01/28 1,136,651
783,000 Beasley Mezzanine Holdings, LLC* 8.625%, 02/01/26 795,458
765,000 Brink's Company*^ 5.500%, 07/15/25 806,463
1,885,000 Cincinnati Bell, Inc.* 8.000%, 10/15/25 1,982,813
895,000 Consolidated Communications, Inc.*^ 6.500%, 10/01/28 967,558
CSC Holdings, LLC* 3,385,000 5.500%, 04/15/27^ 3,544,433 2,300,000 5.750%, 01/15/30 2,401,798 1,630,000 5.375%, 02/01/28 1,725,909 1,600,000 4.625%, 12/01/30^ 1,577,552
475,000 4.500%, 11/15/31 479,584 1,105,000 Cumulus Media New Holdings,
Inc.*^ 6.750%, 07/01/26 1,164,460
PRINCIPAL AMOUNT VALUE
Diamond Sports Group, LLC / Diamond Sports Finance Company*
750,000 6.625%, 08/15/27 $ 301,538 585,000 5.375%, 08/15/26 340,353 130,000 DIRECTV Holdings, LLC /
DIRECTV Financing Company, Inc.* 5.875%, 08/15/27 134,525
3,624,000 Embarq Corp. 7.995%, 06/01/36 4,065,584
Entercom Media Corp.*^ 522,000 6.750%, 03/31/29 533,249 495,000 6.500%, 05/01/27 510,399 615,000 Frontier Florida, LLC&
6.860%, 02/01/28 674,489 1,555,000 Frontier North, Inc.@
6.730%, 02/15/28 1,692,711
Go Daddy Operating Company, LLC / GD Finance Company, Inc.*
905,000 3.500%, 03/01/29 906,738 270,000 5.250%, 12/01/27 283,802 290,000 Hughes Satellite Systems Corp.
5.250%, 08/01/26 324,945 Intelsat Jackson Holdings, SA@
790,000 9.750%, 07/15/25* 447,037 510,000 5.500%, 08/01/23 281,489
1,700,000 LCPR Senior Secured Financing DAC* 6.750%, 10/15/27 1,818,286
583,136 Ligado Networks, LLC* 15.500%, 11/01/23 15.500% PIK rate 577,573
1,240,000 Lumen Technologies, Inc.* 4.000%, 02/15/27 1,276,617
Netflix, Inc. 835,000 4.875%, 06/15/30* 1,007,603 525,000 4.875%, 04/15/28 614,297
Scripps Escrow II, Inc.* 514,000 3.875%, 01/15/29 514,725 257,000 5.375%, 01/15/31^ 257,200
1,450,000 Scripps Escrow, Inc.* 5.875%, 07/15/27 1,502,215
514,000 Shift4 Payments, LLC / Shift4 Payments Finance Sub, Inc.*^ 4.625%, 11/01/26 535,999
Sirius XM Radio, Inc.* 1,350,000 5.500%, 07/01/29^ 1,480,802 1,350,000 4.625%, 07/15/24^ 1,387,112
781,000 4.000%, 07/15/28 805,992 785,000 Spanish Broadcasting System,
Inc.* 9.750%, 03/01/26 801,124
1,885,000 Sprint Capital Corp.^ 6.875%, 11/15/28 2,433,874
1,915,000 Sprint Corp. 7.125%, 06/15/24 2,205,352
805,000 Telecom Italia Capital, SA 6.000%, 09/30/34 925,951
1,450,000 United States Cellular Corp. 6.700%, 12/15/33 1,806,338

Calamos Convertible and High Income Fund
SCHEDULE OF INVESTMENTS JULY 31, 2021 (UNAUDITED)
See accompanying Notes to Schedule of Investments
2
8/31/2021 1:01 PM
PRINCIPAL AMOUNT VALUE
427,000 Windstream Services, LLC / Windstream Finance Corp.@& 7.750%, 10/01/21 $ 4,590 ___________
48,703,511 ___________ Consumer Discretionary (5.2%)
1,090,000 American Axle & Manufacturing, Inc.^ 6.875%, 07/01/28 1,181,451
Ashton Woods USA, LLC / Ashton Woods Finance Company*
780,000 6.625%, 01/15/28 832,868 652,000 4.625%, 08/01/29 654,282 307,000 Avis Budget Car Rental, LLC /
Avis Budget Finance, Inc.*^ 5.375%, 03/01/29 320,186
1,350,000 Bally's Corp.*^ 6.750%, 06/01/27 1,460,524
Caesars Entertainment, Inc.* 512,000 8.125%, 07/01/27 564,163 512,000 6.250%, 07/01/25 541,128
1,610,000 Caesars Resort Collection, LLC / CRC Finco, Inc.*^ 5.250%, 10/15/25 1,623,588
Carnival Corp.* 512,000 10.500%, 02/01/26^ 587,034 257,000 7.625%, 03/01/26 272,823
1,219,000 Carriage Services, Inc.*^ 4.250%, 05/15/29 1,220,024
775,000 Carvana Company* 5.625%, 10/01/25 805,558
CCO Holdings, LLC / CCO Holdings Capital Corp.*
3,350,000 5.125%, 05/01/27 3,508,957 1,150,000 4.750%, 03/01/30 1,220,553
955,000 5.750%, 02/15/26 987,871 540,000 5.000%, 02/01/28 566,735 515,000 4.250%, 02/01/31 531,459 810,000 Cedar Fair, LP^
5.250%, 07/15/29 825,212 Century Communities, Inc.
1,350,000 6.750%, 06/01/27 1,444,378 800,000 5.875%, 07/15/25^ 827,104
DISH DBS Corp.^ 828,000 7.750%, 07/01/26 946,570 650,000 7.375%, 07/01/28 704,074 782,000 Everi Holdings, Inc.*
5.000%, 07/15/29 800,479 645,000 Ford Motor Company
8.500%, 04/21/23 717,124 Ford Motor Credit Company, LLC
1,650,000 4.000%, 11/13/30 1,747,911 1,400,000 4.063%, 11/01/24 1,487,010 1,250,000 4.134%, 08/04/25 1,339,650 1,225,000 3.664%, 09/08/24 1,285,380
500,000 4.389%, 01/08/26 542,785 goeasy, Ltd.*
1,795,000 5.375%, 12/01/24 1,863,748 962,000 4.375%, 05/01/26 992,438 522,000 Goodyear Tire & Rubber
Company*^ 5.000%, 07/15/29 550,449
513,000 Guitar Center, Inc.*& 8.500%, 01/15/26 548,479
PRINCIPAL AMOUNT VALUE
International Game Technology, PLC*
1,350,000 6.250%, 01/15/27 $ 1,535,503 325,000 5.250%, 01/15/29 347,185 200,000 4.125%, 04/15/26^ 208,522
L Brands, Inc. 1,369,000 6.694%, 01/15/27^ 1,626,728
765,000 6.875%, 11/01/35 984,907 525,000 Liberty Interactive, LLC
8.500%, 07/15/29 602,863 783,000 Life Time, Inc.*^
8.000%, 04/15/26 820,819 M/I Homes, Inc.
1,415,000 5.625%, 08/01/25 1,457,209 780,000 4.950%, 02/01/28 822,970
Macy's Retail Holdings, LLC 520,000 6.700%, 07/15/34* 553,368 265,000 5.125%, 01/15/42^ 242,721 512,000 Macy's, Inc.*
8.375%, 06/15/25 558,618 Mattel, Inc.*
1,350,000 5.875%, 12/15/27 1,478,574 128,000 3.750%, 04/01/29^ 135,117
Mclaren Finance, PLC* 1,255,000 5.750%, 08/01/22 1,255,000
800,000 7.500%, 08/01/26 813,584 1,200,000 Midwest Gaming Borrower, LLC /
Midwest Gaming Finance Corp.* 4.875%, 05/01/29 1,211,040
783,000 Mohegan Gaming & Entertainment* 8.000%, 02/01/26 815,581
1,004,000 Newell Brands, Inc. 4.700%, 04/01/26 1,119,862
519,000 Penn National Gaming, Inc.*^ 4.125%, 07/01/29 511,817
2,564,000 Rite Aid Corp.* 8.000%, 11/15/26 2,576,897
Royal Caribbean Cruises, Ltd.* 515,000 11.500%, 06/01/25 590,066 257,000 10.875%, 06/01/23 292,122
1,215,000 Simmons Foods, Inc. / Simmons Prepared Foods, Inc. / Simmons Pet Food, Inc. / Simmons Feed*^ 4.625%, 03/01/29 1,230,297
1,350,000 Speedway Motorsports, LLC / Speedway Funding II, Inc.* 4.875%, 11/01/27 1,381,253
810,000 Taylor Morrison Communities, Inc.* 5.750%, 01/15/28 917,074
262,000 Viking Cruises, Ltd.* 13.000%, 05/15/25 304,106
1,215,000 Vista Outdoor, Inc.*^ 4.500%, 03/15/29 1,240,333
1,045,000 VOC Escrow, Ltd.* 5.000%, 02/15/28 1,038,134
258,000 Williams Scotsman International, Inc.*^ 4.625%, 08/15/28 267,007 ___________
60,441,272 ___________ Consumer Staples (1.6%)
1,191,000 Central Garden & Pet Company* 4.125%, 04/30/31 1,218,464
Calamos Convertible and High Income Fund
SCHEDULE OF INVESTMENTS JULY 31, 2021 (UNAUDITED)
See accompanying Notes to Schedule of Investments
3 8/31/2021 1:01 PM
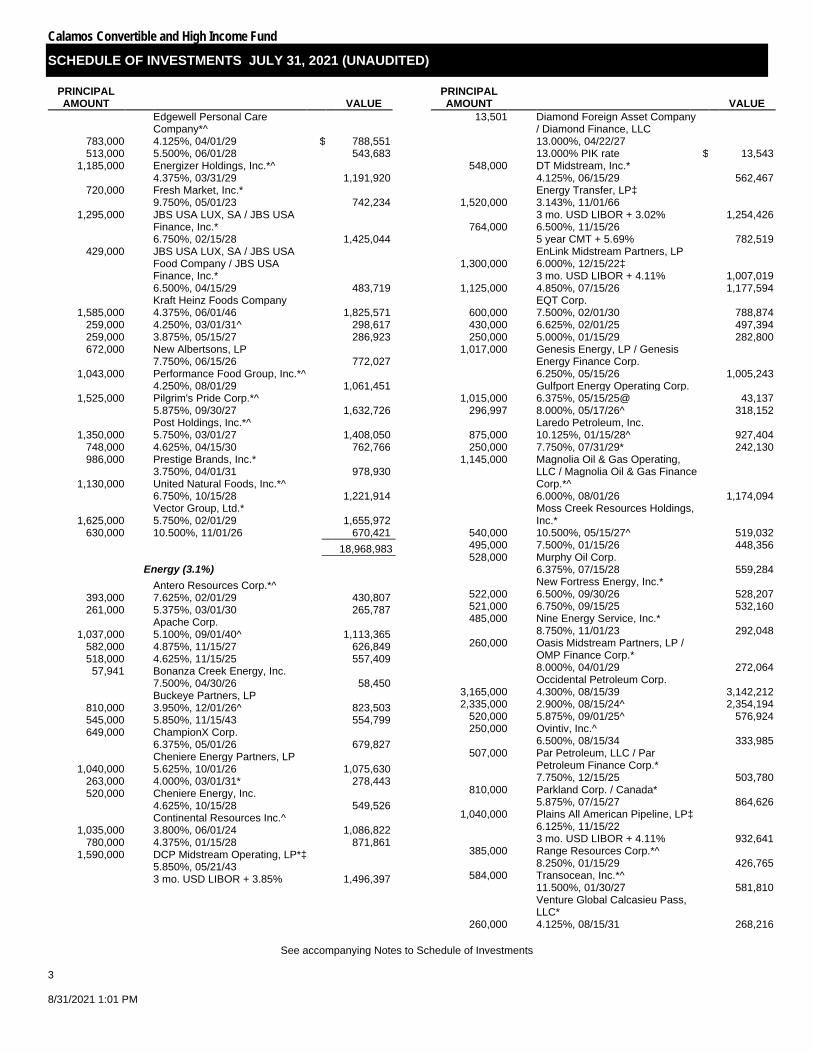
PRINCIPAL AMOUNT VALUE
Edgewell Personal Care Company*^
783,000 4.125%, 04/01/29 $ 788,551 513,000 5.500%, 06/01/28 543,683
1,185,000 Energizer Holdings, Inc.*^ 4.375%, 03/31/29 1,191,920
720,000 Fresh Market, Inc.* 9.750%, 05/01/23 742,234
1,295,000 JBS USA LUX, SA / JBS USA Finance, Inc.* 6.750%, 02/15/28 1,425,044
429,000 JBS USA LUX, SA / JBS USA Food Company / JBS USA Finance, Inc.* 6.500%, 04/15/29 483,719
Kraft Heinz Foods Company 1,585,000 4.375%, 06/01/46 1,825,571
259,000 4.250%, 03/01/31^ 298,617 259,000 3.875%, 05/15/27 286,923 672,000 New Albertsons, LP
7.750%, 06/15/26 772,027 1,043,000 Performance Food Group, Inc.*^
4.250%, 08/01/29 1,061,451 1,525,000 Pilgrim's Pride Corp.*^
5.875%, 09/30/27 1,632,726 Post Holdings, Inc.*^
1,350,000 5.750%, 03/01/27 1,408,050 748,000 4.625%, 04/15/30 762,766 986,000 Prestige Brands, Inc.*
3.750%, 04/01/31 978,930 1,130,000 United Natural Foods, Inc.*^
6.750%, 10/15/28 1,221,914 Vector Group, Ltd.*
1,625,000 5.750%, 02/01/29 1,655,972 630,000 10.500%, 11/01/26 670,421 ___________
18,968,983 ___________ Energy (3.1%)
Antero Resources Corp.*^ 393,000 7.625%, 02/01/29 430,807 261,000 5.375%, 03/01/30 265,787
Apache Corp. 1,037,000 5.100%, 09/01/40^ 1,113,365
582,000 4.875%, 11/15/27 626,849 518,000 4.625%, 11/15/25 557,409
57,941 Bonanza Creek Energy, Inc. 7.500%, 04/30/26 58,450
Buckeye Partners, LP 810,000 3.950%, 12/01/26^ 823,503 545,000 5.850%, 11/15/43 554,799 649,000 ChampionX Corp.
6.375%, 05/01/26 679,827 Cheniere Energy Partners, LP
1,040,000 5.625%, 10/01/26 1,075,630 263,000 4.000%, 03/01/31* 278,443 520,000 Cheniere Energy, Inc.
4.625%, 10/15/28 549,526 Continental Resources Inc.^
1,035,000 3.800%, 06/01/24 1,086,822 780,000 4.375%, 01/15/28 871,861
1,590,000 DCP Midstream Operating, LP*‡ 5.850%, 05/21/43 3 mo. USD LIBOR + 3.85% 1,496,397
PRINCIPAL AMOUNT VALUE
13,501 Diamond Foreign Asset Company / Diamond Finance, LLC 13.000%, 04/22/27 13.000% PIK rate $ 13,543
548,000 DT Midstream, Inc.* 4.125%, 06/15/29 562,467
Energy Transfer, LP‡ 1,520,000 3.143%, 11/01/66
3 mo. USD LIBOR + 3.02% 1,254,426 764,000 6.500%, 11/15/26
5 year CMT + 5.69% 782,519 EnLink Midstream Partners, LP
1,300,000 6.000%, 12/15/22‡ 3 mo. USD LIBOR + 4.11% 1,007,019
1,125,000 4.850%, 07/15/26 1,177,594 EQT Corp.
600,000 7.500%, 02/01/30 788,874 430,000 6.625%, 02/01/25 497,394 250,000 5.000%, 01/15/29 282,800
1,017,000 Genesis Energy, LP / Genesis Energy Finance Corp. 6.250%, 05/15/26 1,005,243
Gulfport Energy Operating Corp. 1,015,000 6.375%, 05/15/25@ 43,137
296,997 8.000%, 05/17/26^ 318,152 Laredo Petroleum, Inc.
875,000 10.125%, 01/15/28^ 927,404 250,000 7.750%, 07/31/29* 242,130
1,145,000 Magnolia Oil & Gas Operating, LLC / Magnolia Oil & Gas Finance Corp.*^ 6.000%, 08/01/26 1,174,094
Moss Creek Resources Holdings, Inc.*
540,000 10.500%, 05/15/27^ 519,032 495,000 7.500%, 01/15/26 448,356 528,000 Murphy Oil Corp.
6.375%, 07/15/28 559,284 New Fortress Energy, Inc.*
522,000 6.500%, 09/30/26 528,207 521,000 6.750%, 09/15/25 532,160 485,000 Nine Energy Service, Inc.*
8.750%, 11/01/23 292,048 260,000 Oasis Midstream Partners, LP /
OMP Finance Corp.* 8.000%, 04/01/29 272,064
Occidental Petroleum Corp. 3,165,000 4.300%, 08/15/39 3,142,212 2,335,000 2.900%, 08/15/24^ 2,354,194
520,000 5.875%, 09/01/25^ 576,924 250,000 Ovintiv, Inc.^
6.500%, 08/15/34 333,985 507,000 Par Petroleum, LLC / Par
Petroleum Finance Corp.* 7.750%, 12/15/25 503,780
810,000 Parkland Corp. / Canada* 5.875%, 07/15/27 864,626
1,040,000 Plains All American Pipeline, LP‡ 6.125%, 11/15/22 3 mo. USD LIBOR + 4.11% 932,641
385,000 Range Resources Corp.*^ 8.250%, 01/15/29 426,765
584,000 Transocean, Inc.*^ 11.500%, 01/30/27 581,810
Venture Global Calcasieu Pass, LLC*
260,000 4.125%, 08/15/31 268,216
Calamos Convertible and High Income Fund
SCHEDULE OF INVESTMENTS JULY 31, 2021 (UNAUDITED)
See accompanying Notes to Schedule of Investments
4
8/31/2021 1:01 PM
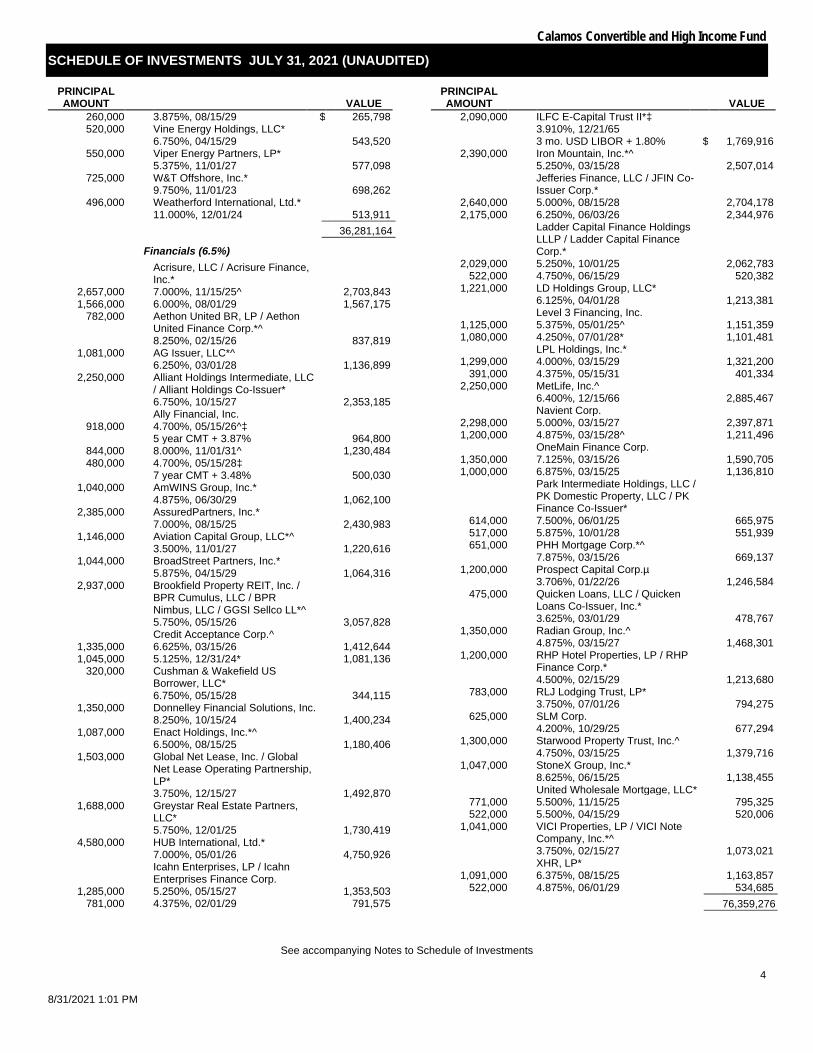
PRINCIPAL AMOUNT VALUE
260,000 3.875%, 08/15/29 $ 265,798 520,000 Vine Energy Holdings, LLC*
6.750%, 04/15/29 543,520 550,000 Viper Energy Partners, LP*
5.375%, 11/01/27 577,098 725,000 W&T Offshore, Inc.*
9.750%, 11/01/23 698,262 496,000 Weatherford International, Ltd.*
11.000%, 12/01/24 513,911 ___________ 36,281,164 ___________
Financials (6.5%)
Acrisure, LLC / Acrisure Finance, Inc.*
2,657,000 7.000%, 11/15/25^ 2,703,843 1,566,000 6.000%, 08/01/29 1,567,175
782,000 Aethon United BR, LP / Aethon United Finance Corp.*^ 8.250%, 02/15/26 837,819
1,081,000 AG Issuer, LLC*^ 6.250%, 03/01/28 1,136,899
2,250,000 Alliant Holdings Intermediate, LLC / Alliant Holdings Co-Issuer* 6.750%, 10/15/27 2,353,185
Ally Financial, Inc. 918,000 4.700%, 05/15/26^‡
5 year CMT + 3.87% 964,800 844,000 8.000%, 11/01/31^ 1,230,484 480,000 4.700%, 05/15/28‡
7 year CMT + 3.48% 500,030 1,040,000 AmWINS Group, Inc.*
4.875%, 06/30/29 1,062,100 2,385,000 AssuredPartners, Inc.*
7.000%, 08/15/25 2,430,983 1,146,000 Aviation Capital Group, LLC*^
3.500%, 11/01/27 1,220,616 1,044,000 BroadStreet Partners, Inc.*
5.875%, 04/15/29 1,064,316 2,937,000 Brookfield Property REIT, Inc. /
BPR Cumulus, LLC / BPR Nimbus, LLC / GGSI Sellco LL*^ 5.750%, 05/15/26 3,057,828
Credit Acceptance Corp.^ 1,335,000 6.625%, 03/15/26 1,412,644 1,045,000 5.125%, 12/31/24* 1,081,136
320,000 Cushman & Wakefield US Borrower, LLC* 6.750%, 05/15/28 344,115
1,350,000 Donnelley Financial Solutions, Inc. 8.250%, 10/15/24 1,400,234
1,087,000 Enact Holdings, Inc.*^ 6.500%, 08/15/25 1,180,406
1,503,000 Global Net Lease, Inc. / Global Net Lease Operating Partnership, LP* 3.750%, 12/15/27 1,492,870
1,688,000 Greystar Real Estate Partners, LLC* 5.750%, 12/01/25 1,730,419
4,580,000 HUB International, Ltd.* 7.000%, 05/01/26 4,750,926
Icahn Enterprises, LP / Icahn Enterprises Finance Corp.
1,285,000 5.250%, 05/15/27 1,353,503 781,000 4.375%, 02/01/29 791,575
PRINCIPAL AMOUNT VALUE
2,090,000 ILFC E-Capital Trust II*‡ 3.910%, 12/21/65 3 mo. USD LIBOR + 1.80% $ 1,769,916
2,390,000 Iron Mountain, Inc.*^ 5.250%, 03/15/28 2,507,014
Jefferies Finance, LLC / JFIN Co-Issuer Corp.*
2,640,000 5.000%, 08/15/28 2,704,178 2,175,000 6.250%, 06/03/26 2,344,976
Ladder Capital Finance Holdings LLLP / Ladder Capital Finance Corp.*
2,029,000 5.250%, 10/01/25 2,062,783 522,000 4.750%, 06/15/29 520,382
1,221,000 LD Holdings Group, LLC* 6.125%, 04/01/28 1,213,381
Level 3 Financing, Inc. 1,125,000 5.375%, 05/01/25^ 1,151,359 1,080,000 4.250%, 07/01/28* 1,101,481
LPL Holdings, Inc.* 1,299,000 4.000%, 03/15/29 1,321,200
391,000 4.375%, 05/15/31 401,334 2,250,000 MetLife, Inc.^
6.400%, 12/15/66 2,885,467 Navient Corp.
2,298,000 5.000%, 03/15/27 2,397,871 1,200,000 4.875%, 03/15/28^ 1,211,496
OneMain Finance Corp. 1,350,000 7.125%, 03/15/26 1,590,705 1,000,000 6.875%, 03/15/25 1,136,810
Park Intermediate Holdings, LLC / PK Domestic Property, LLC / PK Finance Co-Issuer*
614,000 7.500%, 06/01/25 665,975 517,000 5.875%, 10/01/28 551,939 651,000 PHH Mortgage Corp.*^
7.875%, 03/15/26 669,137 1,200,000 Prospect Capital Corp.µ
3.706%, 01/22/26 1,246,584 475,000 Quicken Loans, LLC / Quicken
Loans Co-Issuer, Inc.* 3.625%, 03/01/29 478,767
1,350,000 Radian Group, Inc.^ 4.875%, 03/15/27 1,468,301
1,200,000 RHP Hotel Properties, LP / RHP Finance Corp.* 4.500%, 02/15/29 1,213,680
783,000 RLJ Lodging Trust, LP* 3.750%, 07/01/26 794,275
625,000 SLM Corp. 4.200%, 10/29/25 677,294
1,300,000 Starwood Property Trust, Inc.^ 4.750%, 03/15/25 1,379,716
1,047,000 StoneX Group, Inc.* 8.625%, 06/15/25 1,138,455
United Wholesale Mortgage, LLC* 771,000 5.500%, 11/15/25 795,325 522,000 5.500%, 04/15/29 520,006
1,041,000 VICI Properties, LP / VICI Note Company, Inc.*^ 3.750%, 02/15/27 1,073,021
XHR, LP* 1,091,000 6.375%, 08/15/25 1,163,857
522,000 4.875%, 06/01/29 534,685 ___________ 76,359,276 ___________
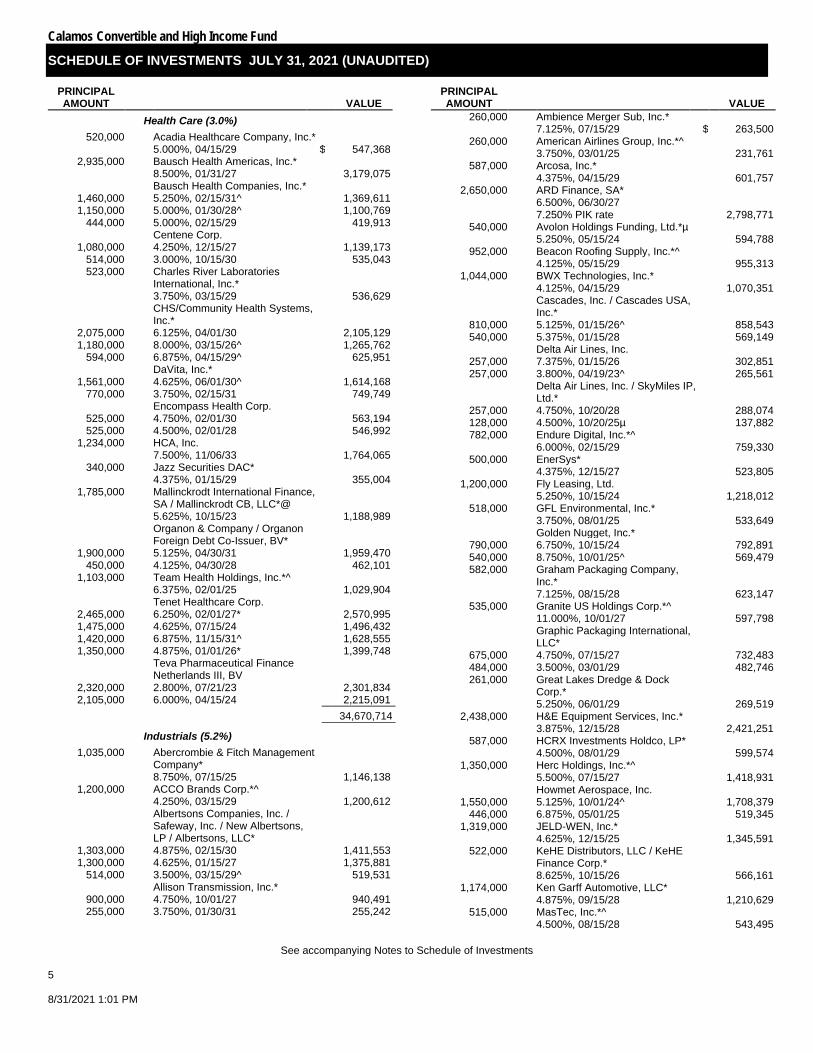
Calamos Convertible and High Income Fund
SCHEDULE OF INVESTMENTS JULY 31, 2021 (UNAUDITED)
See accompanying Notes to Schedule of Investments
5 8/31/2021 1:01 PM
PRINCIPAL AMOUNT VALUE
Health Care (3.0%) 520,000 Acadia Healthcare Company, Inc.*
5.000%, 04/15/29 $ 547,368 2,935,000 Bausch Health Americas, Inc.*
8.500%, 01/31/27 3,179,075 Bausch Health Companies, Inc.*
1,460,000 5.250%, 02/15/31^ 1,369,611 1,150,000 5.000%, 01/30/28^ 1,100,769
444,000 5.000%, 02/15/29 419,913 Centene Corp.
1,080,000 4.250%, 12/15/27 1,139,173 514,000 3.000%, 10/15/30 535,043 523,000 Charles River Laboratories
International, Inc.* 3.750%, 03/15/29 536,629
CHS/Community Health Systems, Inc.*
2,075,000 6.125%, 04/01/30 2,105,129 1,180,000 8.000%, 03/15/26^ 1,265,762
594,000 6.875%, 04/15/29^ 625,951 DaVita, Inc.*
1,561,000 4.625%, 06/01/30^ 1,614,168 770,000 3.750%, 02/15/31 749,749
Encompass Health Corp. 525,000 4.750%, 02/01/30 563,194 525,000 4.500%, 02/01/28 546,992
1,234,000 HCA, Inc. 7.500%, 11/06/33 1,764,065
340,000 Jazz Securities DAC* 4.375%, 01/15/29 355,004
1,785,000 Mallinckrodt International Finance, SA / Mallinckrodt CB, LLC*@ 5.625%, 10/15/23 1,188,989
Organon & Company / Organon Foreign Debt Co-Issuer, BV*
1,900,000 5.125%, 04/30/31 1,959,470 450,000 4.125%, 04/30/28 462,101
1,103,000 Team Health Holdings, Inc.*^ 6.375%, 02/01/25 1,029,904
Tenet Healthcare Corp. 2,465,000 6.250%, 02/01/27* 2,570,995 1,475,000 4.625%, 07/15/24 1,496,432 1,420,000 6.875%, 11/15/31^ 1,628,555 1,350,000 4.875%, 01/01/26* 1,399,748
Teva Pharmaceutical Finance Netherlands III, BV
2,320,000 2.800%, 07/21/23 2,301,834 2,105,000 6.000%, 04/15/24 2,215,091 ___________
34,670,714 ___________ Industrials (5.2%)
1,035,000 Abercrombie & Fitch Management Company* 8.750%, 07/15/25 1,146,138
1,200,000 ACCO Brands Corp.*^ 4.250%, 03/15/29 1,200,612
Albertsons Companies, Inc. / Safeway, Inc. / New Albertsons, LP / Albertsons, LLC*
1,303,000 4.875%, 02/15/30 1,411,553 1,300,000 4.625%, 01/15/27 1,375,881
514,000 3.500%, 03/15/29^ 519,531 Allison Transmission, Inc.*
900,000 4.750%, 10/01/27 940,491 255,000 3.750%, 01/30/31 255,242
PRINCIPAL AMOUNT VALUE
260,000 Ambience Merger Sub, Inc.* 7.125%, 07/15/29 $ 263,500
260,000 American Airlines Group, Inc.*^ 3.750%, 03/01/25 231,761
587,000 Arcosa, Inc.* 4.375%, 04/15/29 601,757
2,650,000 ARD Finance, SA* 6.500%, 06/30/27 7.250% PIK rate 2,798,771
540,000 Avolon Holdings Funding, Ltd.*µ 5.250%, 05/15/24 594,788
952,000 Beacon Roofing Supply, Inc.*^ 4.125%, 05/15/29 955,313
1,044,000 BWX Technologies, Inc.* 4.125%, 04/15/29 1,070,351
Cascades, Inc. / Cascades USA, Inc.*
810,000 5.125%, 01/15/26^ 858,543 540,000 5.375%, 01/15/28 569,149
Delta Air Lines, Inc. 257,000 7.375%, 01/15/26 302,851 257,000 3.800%, 04/19/23^ 265,561
Delta Air Lines, Inc. / SkyMiles IP, Ltd.*
257,000 4.750%, 10/20/28 288,074 128,000 4.500%, 10/20/25µ 137,882 782,000 Endure Digital, Inc.*^
6.000%, 02/15/29 759,330 500,000 EnerSys*
4.375%, 12/15/27 523,805 1,200,000 Fly Leasing, Ltd.
5.250%, 10/15/24 1,218,012 518,000 GFL Environmental, Inc.*
3.750%, 08/01/25 533,649 Golden Nugget, Inc.*
790,000 6.750%, 10/15/24 792,891 540,000 8.750%, 10/01/25^ 569,479 582,000 Graham Packaging Company,
Inc.* 7.125%, 08/15/28 623,147
535,000 Granite US Holdings Corp.*^ 11.000%, 10/01/27 597,798
Graphic Packaging International, LLC*
675,000 4.750%, 07/15/27 732,483 484,000 3.500%, 03/01/29 482,746 261,000 Great Lakes Dredge & Dock
Corp.* 5.250%, 06/01/29 269,519
2,438,000 H&E Equipment Services, Inc.* 3.875%, 12/15/28 2,421,251
587,000 HCRX Investments Holdco, LP* 4.500%, 08/01/29 599,574
1,350,000 Herc Holdings, Inc.*^ 5.500%, 07/15/27 1,418,931
Howmet Aerospace, Inc. 1,550,000 5.125%, 10/01/24^ 1,708,379
446,000 6.875%, 05/01/25 519,345 1,319,000 JELD-WEN, Inc.*
4.625%, 12/15/25 1,345,591 522,000 KeHE Distributors, LLC / KeHE
Finance Corp.* 8.625%, 10/15/26 566,161
1,174,000 Ken Garff Automotive, LLC* 4.875%, 09/15/28 1,210,629
515,000 MasTec, Inc.*^ 4.500%, 08/15/28 543,495
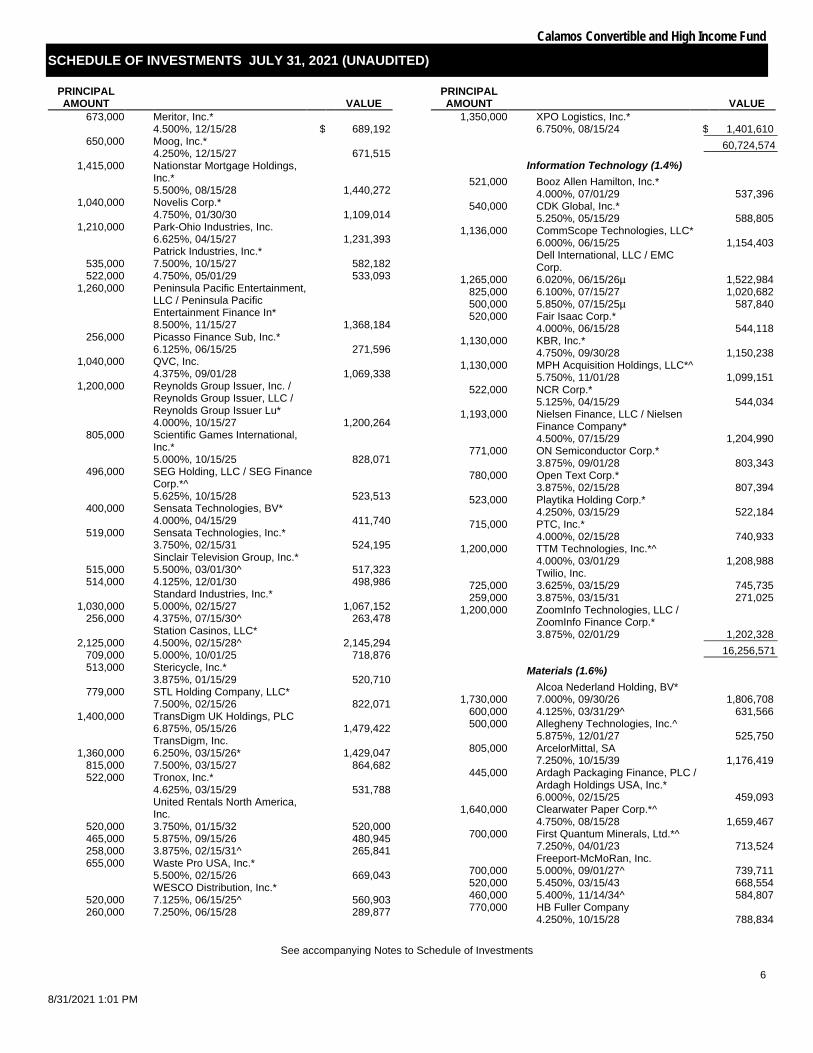
Calamos Convertible and High Income Fund
SCHEDULE OF INVESTMENTS JULY 31, 2021 (UNAUDITED)
See accompanying Notes to Schedule of Investments
6
8/31/2021 1:01 PM
PRINCIPAL AMOUNT VALUE
673,000 Meritor, Inc.* 4.500%, 12/15/28 $ 689,192
650,000 Moog, Inc.* 4.250%, 12/15/27 671,515
1,415,000 Nationstar Mortgage Holdings, Inc.* 5.500%, 08/15/28 1,440,272
1,040,000 Novelis Corp.* 4.750%, 01/30/30 1,109,014
1,210,000 Park-Ohio Industries, Inc. 6.625%, 04/15/27 1,231,393
Patrick Industries, Inc.* 535,000 7.500%, 10/15/27 582,182 522,000 4.750%, 05/01/29 533,093
1,260,000 Peninsula Pacific Entertainment, LLC / Peninsula Pacific Entertainment Finance In* 8.500%, 11/15/27 1,368,184
256,000 Picasso Finance Sub, Inc.* 6.125%, 06/15/25 271,596
1,040,000 QVC, Inc. 4.375%, 09/01/28 1,069,338
1,200,000 Reynolds Group Issuer, Inc. / Reynolds Group Issuer, LLC / Reynolds Group Issuer Lu* 4.000%, 10/15/27 1,200,264
805,000 Scientific Games International, Inc.* 5.000%, 10/15/25 828,071
496,000 SEG Holding, LLC / SEG Finance Corp.*^ 5.625%, 10/15/28 523,513
400,000 Sensata Technologies, BV* 4.000%, 04/15/29 411,740
519,000 Sensata Technologies, Inc.* 3.750%, 02/15/31 524,195
Sinclair Television Group, Inc.* 515,000 5.500%, 03/01/30^ 517,323 514,000 4.125%, 12/01/30 498,986
Standard Industries, Inc.* 1,030,000 5.000%, 02/15/27 1,067,152
256,000 4.375%, 07/15/30^ 263,478 Station Casinos, LLC*
2,125,000 4.500%, 02/15/28^ 2,145,294 709,000 5.000%, 10/01/25 718,876 513,000 Stericycle, Inc.*
3.875%, 01/15/29 520,710 779,000 STL Holding Company, LLC*
7.500%, 02/15/26 822,071 1,400,000 TransDigm UK Holdings, PLC
6.875%, 05/15/26 1,479,422 TransDigm, Inc.
1,360,000 6.250%, 03/15/26* 1,429,047 815,000 7.500%, 03/15/27 864,682 522,000 Tronox, Inc.*
4.625%, 03/15/29 531,788
United Rentals North America, Inc.
520,000 3.750%, 01/15/32 520,000 465,000 5.875%, 09/15/26 480,945 258,000 3.875%, 02/15/31^ 265,841 655,000 Waste Pro USA, Inc.*
5.500%, 02/15/26 669,043 WESCO Distribution, Inc.*
520,000 7.125%, 06/15/25^ 560,903 260,000 7.250%, 06/15/28 289,877
PRINCIPAL AMOUNT VALUE
1,350,000 XPO Logistics, Inc.* 6.750%, 08/15/24 $ 1,401,610 ___________
60,724,574 ___________ Information Technology (1.4%)
521,000 Booz Allen Hamilton, Inc.* 4.000%, 07/01/29 537,396
540,000 CDK Global, Inc.* 5.250%, 05/15/29 588,805
1,136,000 CommScope Technologies, LLC* 6.000%, 06/15/25 1,154,403
Dell International, LLC / EMC Corp.
1,265,000 6.020%, 06/15/26µ 1,522,984 825,000 6.100%, 07/15/27 1,020,682 500,000 5.850%, 07/15/25µ 587,840 520,000 Fair Isaac Corp.*
4.000%, 06/15/28 544,118 1,130,000 KBR, Inc.*
4.750%, 09/30/28 1,150,238 1,130,000 MPH Acquisition Holdings, LLC*^
5.750%, 11/01/28 1,099,151 522,000 NCR Corp.*
5.125%, 04/15/29 544,034 1,193,000 Nielsen Finance, LLC / Nielsen
Finance Company* 4.500%, 07/15/29 1,204,990
771,000 ON Semiconductor Corp.* 3.875%, 09/01/28 803,343
780,000 Open Text Corp.* 3.875%, 02/15/28 807,394
523,000 Playtika Holding Corp.* 4.250%, 03/15/29 522,184
715,000 PTC, Inc.* 4.000%, 02/15/28 740,933
1,200,000 TTM Technologies, Inc.*^ 4.000%, 03/01/29 1,208,988
Twilio, Inc. 725,000 3.625%, 03/15/29 745,735 259,000 3.875%, 03/15/31 271,025
1,200,000 ZoomInfo Technologies, LLC / ZoomInfo Finance Corp.* 3.875%, 02/01/29 1,202,328 ___________
16,256,571 ___________ Materials (1.6%)
Alcoa Nederland Holding, BV* 1,730,000 7.000%, 09/30/26 1,806,708
600,000 4.125%, 03/31/29^ 631,566 500,000 Allegheny Technologies, Inc.^
5.875%, 12/01/27 525,750 805,000 ArcelorMittal, SA
7.250%, 10/15/39 1,176,419 445,000 Ardagh Packaging Finance, PLC /
Ardagh Holdings USA, Inc.* 6.000%, 02/15/25 459,093
1,640,000 Clearwater Paper Corp.*^ 4.750%, 08/15/28 1,659,467
700,000 First Quantum Minerals, Ltd.*^ 7.250%, 04/01/23 713,524
Freeport-McMoRan, Inc. 700,000 5.000%, 09/01/27^ 739,711 520,000 5.450%, 03/15/43 668,554 460,000 5.400%, 11/14/34^ 584,807 770,000 HB Fuller Company
4.250%, 10/15/28 788,834

Calamos Convertible and High Income Fund
SCHEDULE OF INVESTMENTS JULY 31, 2021 (UNAUDITED)
See accompanying Notes to Schedule of Investments
7 8/31/2021 1:01 PM
PRINCIPAL AMOUNT VALUE
1,043,000 Intertape Polymer Group, Inc.* 4.375%, 06/15/29 $ 1,068,356
800,000 JW Aluminum Continuous Cast Company* 10.250%, 06/01/26 843,856
Kaiser Aluminum Corp.* 555,000 4.625%, 03/01/28^ 580,280 130,000 4.500%, 06/01/31 135,344 848,000 Mercer International, Inc.^
5.125%, 02/01/29 865,961 New Gold, Inc.*
323,000 6.375%, 05/15/25 333,423 250,000 7.500%, 07/15/27^ 270,225
1,120,000 OCI, NV* 4.625%, 10/15/25 1,163,232
517,000 Owens-Brockway Glass Container, Inc.*^ 6.625%, 05/13/27 560,780
519,000 PBF Holding Company, LLC / PBF Finance Corp. 7.250%, 06/15/25 313,621
1,194,000 Silgan Holdings, Inc. 4.125%, 02/01/28 1,240,757
521,000 Trinseo Materials Operating SCA / Trinseo Materials Finance, Inc.* 5.125%, 04/01/29 531,759
807,000 Univar Solutions USA, Inc.*^ 5.125%, 12/01/27 846,551
516,000 Valvoline, Inc.* 3.625%, 06/15/31 514,390 ___________
19,022,968 ___________ Real Estate (0.4%)
834,000 EPR Properties^ 3.750%, 08/15/29 847,019
Forestar Group, Inc.* 750,000 5.000%, 03/01/28 781,793 256,000 3.850%, 05/15/26 259,901 776,000 iStar, Inc.
5.500%, 02/15/26 814,707 Service Properties Trust
1,350,000 4.350%, 10/01/24 1,362,622 485,000 5.250%, 02/15/26 490,936 ___________
4,556,978 ___________ Utilities (0.4%)
780,000 Calpine Corp.* 4.500%, 02/15/28 805,124
520,000 NRG Energy, Inc. 6.625%, 01/15/27 538,912
1,569,000 PPL Capital Funding, Inc.^‡ 2.812%, 03/30/67 3 mo. USD LIBOR + 2.67% 1,538,452
Talen Energy Supply, LLC* 540,000 10.500%, 01/15/26 372,767 270,000 7.250%, 05/15/27^ 246,502
1,300,000 TerraForm Power Operating, LLC* 5.000%, 01/31/28 1,407,666 ___________
4,909,423 ___________
TOTAL CORPORATE BONDS (Cost $374,533,793) 391,117,060 ___________ ___________
PRINCIPAL AMOUNT VALUE
CONVERTIBLE BONDS (89.1%) Communication Services (10.3%)
4,032,000 Eventbrite, Inc.*µ 0.750%, 09/15/26 $ 3,813,062
Liberty Media Corp. 10,000,000 0.500%, 12/01/50* 11,074,200
9,499,000 1.375%, 10/15/23 12,630,725 4,750,000 Liberty Media Corp. / Liberty
Formula Oneµ 1.000%, 01/30/23 6,291,185
5,750,000 Match Group Financeco 3, Inc.*~ 2.000%, 01/15/30 11,604,133
5,000,000 Sea, Ltd. 2.375%, 12/01/25 15,542,800
Snap, Inc. 12,750,000 0.000%, 05/01/27* 14,677,800
6,000,000 0.750%, 08/01/26 19,643,100 10,000,000 Twitter, Inc.^
0.250%, 06/15/24 13,867,300 8,100,000 Zynga, Inc.
0.250%, 06/01/24 10,824,597 ___________ 119,968,902 ___________
Consumer Discretionary (25.6%) 6,250,000 Airbnb, Inc.*µ
0.000%, 03/15/26 5,858,000 10,000,000 Booking Holdings, Inc.^
0.750%, 05/01/25 14,116,000 7,000,000 Burlington Stores, Inc.^
2.250%, 04/15/25 11,453,890 6,000,000 Cheesecake Factory, Inc.
0.375%, 06/15/26 5,628,600 9,250,000 Chegg, Inc.*
0.000%, 09/01/26 10,030,423 2,750,000 Dick's Sporting Goods, Inc.
3.250%, 04/15/25 8,461,640 DISH Network Corp.µ
5,750,000 0.000%, 12/15/25* 6,729,800 1,968,000 2.375%, 03/15/24 1,907,051
12,500,000 DraftKings, Inc.*µ 0.000%, 03/15/28 10,973,000
14,000,000 Etsy, Inc.*^~ 0.125%, 09/01/27 16,874,200
4,672,000 Expedia Group, Inc.*^ 0.000%, 02/15/26 5,023,428
12,500,000 Ford Motor Company*µ 0.000%, 03/15/26 13,394,375
6,000,000 LCI Industries*µ 1.125%, 05/15/26 6,470,640
Liberty Interactive, LLC 1,010,000 4.000%, 11/15/29µ 778,336
675,000 3.750%, 02/15/30~ 520,722 4,598,000 MakeMyTrip, Ltd.*
0.000%, 02/15/28 4,648,026 12,250,000 Marriott Vacations Worldwide
Corp.* 0.000%, 01/15/26 13,098,068
NCL Corp., Ltd. 4,642,000 5.375%, 08/01/25* 7,346,151 3,500,000 6.000%, 05/15/24 6,866,055
480,000 Peloton Interactive, Inc.* 0.000%, 02/15/26 454,210
5,000,000 RH^~ 0.000%, 09/15/24 15,639,550

Calamos Convertible and High Income Fund
SCHEDULE OF INVESTMENTS JULY 31, 2021 (UNAUDITED)
See accompanying Notes to Schedule of Investments
8
8/31/2021 1:01 PM
PRINCIPAL AMOUNT VALUE
16,750,000 Royal Caribbean Cruises, Ltd.^ 4.250%, 06/15/23 $ 21,582,375
6,250,000 Shake Shack, Inc.* 0.000%, 03/01/28 5,856,938
4,790,000 Tesla, Inc.~ 2.000%, 05/15/24 53,084,935
4,000,000 Under Armour, Inc. 1.500%, 06/01/24 7,467,160
16,250,000 Vail Resorts, Inc.*^ 0.000%, 01/01/26 16,407,787
6,000,000 Vroom, Inc.* 0.750%, 07/01/26 5,837,160
13,750,000 Wayfair, Inc.* 0.625%, 10/01/25 13,357,987
6,500,000 Winnebago Industries, Inc. 1.500%, 04/01/25 8,601,580 ___________
298,468,087 ___________ Consumer Staples (0.5%)
6,500,000 Beyond Meat, Inc.* 0.000%, 03/15/27 5,988,970 ___________
Energy (1.0%) 7,750,000 Pioneer Natural Resources
Company 0.250%, 05/15/25 11,401,722
SunEdison, Inc.@ 10,545,000 0.250%, 01/15/20 163,131
1,027,000 2.000%, 10/01/18 15,888 ___________ 11,580,741 ___________
Financials (1.0%) 6,000,000 Coinbase Global, Inc.*
0.500%, 06/01/26 6,058,020 6,000,000 Realogy Group, LLC / Realogy
Co-Issuer Corp.* 0.250%, 06/15/26 6,077,760 ___________
12,135,780 ___________ Health Care (14.6%)
6,250,000 Bridgebio Pharma, Inc.* 2.250%, 02/01/29 5,711,687
3,000,000 CONMED Corp.^ 2.625%, 02/01/24 4,855,710
15,500,000 Dexcom, Inc. 0.250%, 11/15/25 17,674,805
2,599,000 Envista Holdings Corp.µ 2.375%, 06/01/25 5,544,005
10,000,000 Exact Sciences Corp.µ 0.375%, 03/15/27 12,090,300
6,500,000 Halozyme Therapeutics, Inc.*µ 0.250%, 03/01/27 5,955,105
15,000,000 Insulet Corp.µ^ 0.375%, 09/01/26 20,776,200
9,750,000 Integra LifeSciences Holdings Corp.µ 0.500%, 08/15/25 11,100,180
10,905,000 Jazz Investments I, Ltd.µ 2.000%, 06/15/26 14,137,787
11,250,000 NeoGenomics, Inc. 0.250%, 01/15/28 11,086,987
4,250,000 NuVasive, Inc. 0.375%, 03/15/25 4,136,483
6,000,000 Oak Street Health, Inc.* 0.000%, 03/15/26 6,354,360
PRINCIPAL AMOUNT VALUE
9,500,000 Omnicell, Inc.* 0.250%, 09/15/25 $ 14,964,495
8,750,000 Pacira BioSciences, Inc. 0.750%, 08/01/25 9,628,325
7,085,000 Repligen Corp. 0.375%, 07/15/24 15,325,351
1,840,000 Sarepta Therapeutics, Inc. 1.500%, 11/15/24 2,257,294
7,500,000 Teladoc Health, Inc.^ 1.250%, 06/01/27 8,078,775 ___________
169,677,849 ___________ Industrials (6.7%)
3,750,000 Air Canadaµ 4.000%, 07/01/25 5,722,313
4,250,000 Air Transport Services Group, Inc.µ 1.125%, 10/15/24 4,420,680
4,150,000 Atlas Air Worldwide Holdings, Inc.µ 1.875%, 06/01/24 5,238,711
12,500,000 JetBlue Airways Corp.*^ 0.500%, 04/01/26 12,363,125
6,000,000 John Bean Technologies Corp.*µ 0.250%, 05/15/26 6,470,340
4,750,000 Middleby Corp.* 1.000%, 09/01/25 7,430,282
10,750,000 Southwest Airlines Company~ 1.250%, 05/01/25 15,794,975
21,750,000 Uber Technologies, Inc.*^ 0.000%, 12/15/25 21,245,182 ___________
78,685,608 ___________ Information Technology (27.2%)
10,000,000 Bentley Systems, Inc.* 0.125%, 01/15/26 11,541,700
5,755,000 Bill.com Holdings, Inc.* 0.000%, 12/01/25 8,365,008
15,500,000 Coupa Software, Inc. 0.375%, 06/15/26 16,641,885
8,000,000 Datadog, Inc. 0.125%, 06/15/25 11,101,040
Enphase Energy, Inc.*µ 6,500,000 0.000%, 03/01/26 6,552,845 6,500,000 0.000%, 03/01/28 6,592,690 2,750,000 Everbridge, Inc.µ
0.125%, 12/15/24 3,845,023 4,000,000 Five9, Inc.µ^
0.500%, 06/01/25 6,469,440 5,250,000 LivePerson, Inc.*
0.000%, 12/15/26 5,684,280 21,511,000 Microchip Technology, Inc.^
0.125%, 11/15/24 23,607,677 6,500,000 MicroStrategy, Inc.*
0.000%, 02/15/27 4,817,670 7,500,000 MongoDB, Inc.
0.250%, 01/15/26 13,552,275 6,250,000 Nova, Ltd.*
0.000%, 10/15/25 8,829,312 Okta, Inc.
8,000,000 0.125%, 09/01/25^ 11,674,080 4,250,000 0.375%, 06/15/26 5,361,120
12,000,000 ON Semiconductor Corp.*^ 0.000%, 05/01/27 12,770,400
9,500,000 Palo Alto Networks, Inc. 0.750%, 07/01/23 14,679,590

Calamos Convertible and High Income Fund
SCHEDULE OF INVESTMENTS JULY 31, 2021 (UNAUDITED)
See accompanying Notes to Schedule of Investments
9 8/31/2021 1:01 PM
PRINCIPAL AMOUNT VALUE
2,250,000 Q2 Holdings, Inc. 0.750%, 06/01/26 $ 2,962,328
12,250,000 Repay Holdings Corp.* 0.000%, 02/01/26 12,202,715
9,000,000 RingCentral, Inc. 0.000%, 03/01/25 9,518,580
15,000,000 Shift4 Payments, Inc.* 0.000%, 12/15/25 19,516,650
1,981,000 Shopify, Inc.^ 0.125%, 11/01/25 2,612,087
8,500,000 Silicon Laboratories, Inc. 0.625%, 06/15/25 11,544,190
12,750,000 Splunk, Inc. 1.125%, 06/15/27 12,497,295
Square, Inc.*^ 10,000,000 0.250%, 11/01/27 11,799,500 10,000,000 0.000%, 05/01/26 11,377,000
6,250,000 Tyler Technologies, Inc.* 0.250%, 03/15/26 7,149,000
8,750,000 Wix.com, Ltd.*^ 0.000%, 08/15/25 9,562,000
5,750,000 Workday, Inc. 0.250%, 10/01/22 9,309,537
8,500,000 Zendesk, Inc. 0.625%, 06/15/25 11,584,905
7,952,000 Zscaler, Inc. 0.125%, 07/01/25 13,286,997 ___________
317,008,819 ___________ Materials (1.3%)
6,000,000 Ivanhoe Mines, Ltd.*µ 2.500%, 04/15/26 7,506,060
6,858,000 MP Materials Corp.* 0.250%, 04/01/26 7,426,871 ___________
14,932,931 ___________ Real Estate (0.9%)
4,000,000 IH Merger Sub, LLCµ 3.500%, 01/15/22 7,156,040
3,199,000 Redfin Corp.* 0.000%, 10/15/25 3,469,220 ___________
10,625,260 ___________
TOTAL CONVERTIBLE BONDS (Cost $825,708,250) 1,039,072,947 ___________ ___________
BANK LOANS (4.8%) ¡ Airlines (0.2%)
880,000 AAdvantage Loyalty IP, Ltd.‡ 5.500%, 04/20/28 3 mo. LIBOR + 4.75% 906,070
1,296,750 United Airlines, Inc.‡ 4.500%, 04/21/28 1 mo. LIBOR + 3.75% 1,300,725 ___________
2,206,795 ___________ Communication Services (1.2%)
1,277,250 Clear Channel Outdoor Holdings, Inc.‡ 3.629%, 08/21/26 3 mo. LIBOR + 3.50% 1,242,260
810,563 CommScope, Inc.‡ 3.342%, 04/06/26 1 mo. LIBOR + 3.25% 803,977
PRINCIPAL AMOUNT VALUE
671,164 Consolidated Communications, Inc.‡ 4.250%, 10/02/27 1 mo. LIBOR + 3.50% $ 669,738
540,396 CSC Holdings, LLC‡ 2.593%, 04/15/27 1 mo. LIBOR + 2.50% 534,508
2,930,000 DIRECTV Financing, LLC! 0.000%, 07/21/27 2,927,817
1,620,938 Frontier Communications Corp.‡ 4.500%, 05/01/28 3 mo. LIBOR + 3.75% 1,622,972
800,000 Frontier Communications Corp.! 0.000%, 05/01/28 801,004
931,452 iHeartCommunications, Inc.‡ 3.092%, 05/01/26 1 mo. LIBOR + 3.00% 920,391
2,444,090 Intelsat Jackson Holdings, SA@ 8.625%, 01/02/24 2,493,411
2,000,000 Intelsat Jackson Holdings, SA‡@ 8.750%, 01/02/24 3 mo. PRIME + 5.50% 2,042,140 ___________
14,058,218 ___________ Consumer Discretionary (1.0%)
520,000 At Home Group, Inc.! 0.000%, 06/24/28 520,650
260,000 At Home Group, Inc.‡ 4.750%, 06/24/28 3 mo. LIBOR + 4.25% 260,325
995,000 Life Time Fitness, Inc.‡ 5.750%, 12/16/24 3 mo. LIBOR + 4.75% 995,627
1,562,040 Meredith Corp.‡ 5.250%, 01/31/25 3 mo. LIBOR + 4.25% 1,596,865
1,830,413 Petco Health and Wellness Company, Inc.‡ 4.000%, 03/03/28 3 mo. LIBOR + 3.25% 1,824,546
2,110,000 PetSmart, Inc.‡ 4.500%, 02/12/28 6 mo. LIBOR + 3.75% 2,111,846
789,222 Rent-A-Center, Inc.‡ 4.750%, 02/17/28 1 mo. LIBOR + 4.00% 793,168
430,000 Rent-A-Center, Inc.! 0.000%, 02/17/28 432,150
956,300 TKC Holdings, Inc.‡ 6.500%, 05/15/28 3 mo. LIBOR + 5.50% 946,441
263,200 TKC Holdings, Inc.! 0.000%, 05/15/28 260,486
1,855,000 WW International, Inc.‡ 4.000%, 04/13/28 1 mo. LIBOR + 3.50% 1,853,266 ___________
11,595,370 ___________ Consumer Staples (0.0%)
198,044 United Natural Foods, Inc.‡ 3.592%, 10/22/25 1 mo. LIBOR + 3.50% 197,673 ___________
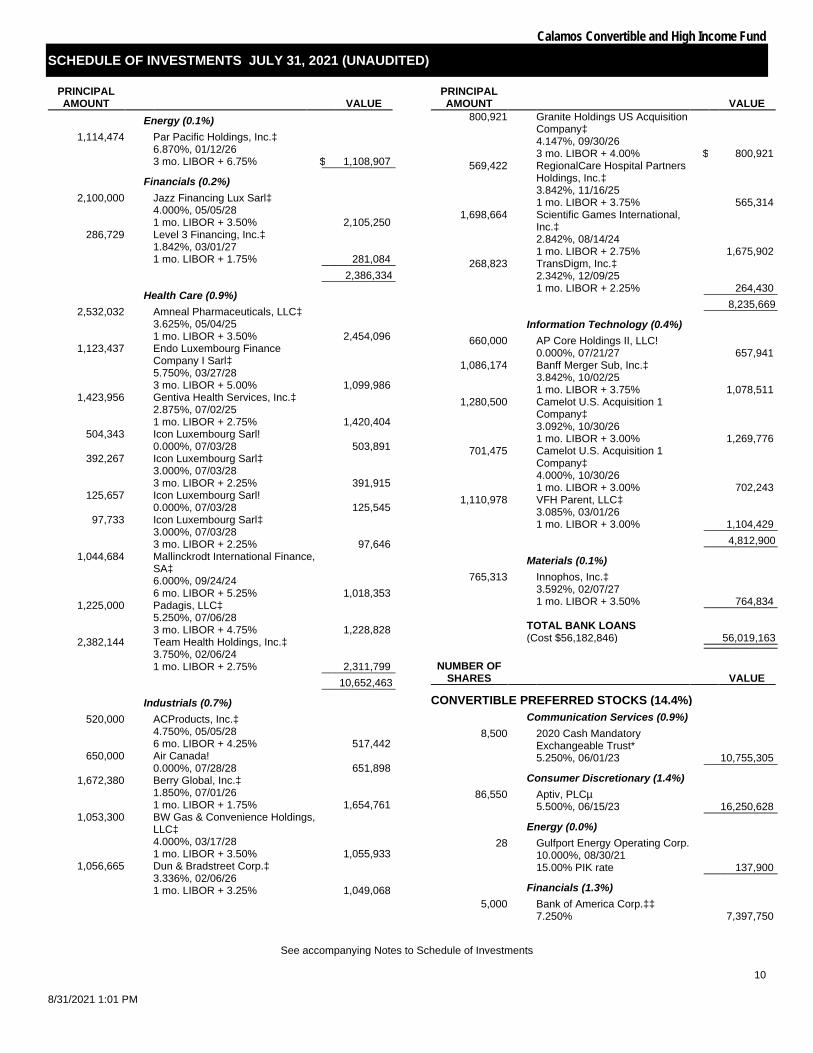
Calamos Convertible and High Income Fund
SCHEDULE OF INVESTMENTS JULY 31, 2021 (UNAUDITED)
See accompanying Notes to Schedule of Investments
10
8/31/2021 1:01 PM
PRINCIPAL AMOUNT VALUE
Energy (0.1%) 1,114,474 Par Pacific Holdings, Inc.‡
6.870%, 01/12/26 3 mo. LIBOR + 6.75% $ 1,108,907 ___________
Financials (0.2%) 2,100,000 Jazz Financing Lux Sarl‡
4.000%, 05/05/28 1 mo. LIBOR + 3.50% 2,105,250
286,729 Level 3 Financing, Inc.‡ 1.842%, 03/01/27 1 mo. LIBOR + 1.75% 281,084 ___________
2,386,334 ___________ Health Care (0.9%)
2,532,032 Amneal Pharmaceuticals, LLC‡ 3.625%, 05/04/25 1 mo. LIBOR + 3.50% 2,454,096
1,123,437 Endo Luxembourg Finance Company I Sarl‡ 5.750%, 03/27/28 3 mo. LIBOR + 5.00% 1,099,986
1,423,956 Gentiva Health Services, Inc.‡ 2.875%, 07/02/25 1 mo. LIBOR + 2.75% 1,420,404
504,343 Icon Luxembourg Sarl! 0.000%, 07/03/28 503,891
392,267 Icon Luxembourg Sarl‡ 3.000%, 07/03/28 3 mo. LIBOR + 2.25% 391,915
125,657 Icon Luxembourg Sarl! 0.000%, 07/03/28 125,545
97,733 Icon Luxembourg Sarl‡ 3.000%, 07/03/28 3 mo. LIBOR + 2.25% 97,646
1,044,684 Mallinckrodt International Finance, SA‡ 6.000%, 09/24/24 6 mo. LIBOR + 5.25% 1,018,353
1,225,000 Padagis, LLC‡ 5.250%, 07/06/28 3 mo. LIBOR + 4.75% 1,228,828
2,382,144 Team Health Holdings, Inc.‡ 3.750%, 02/06/24 1 mo. LIBOR + 2.75% 2,311,799 ___________
10,652,463 ___________ Industrials (0.7%)
520,000 ACProducts, Inc.‡ 4.750%, 05/05/28 6 mo. LIBOR + 4.25% 517,442
650,000 Air Canada! 0.000%, 07/28/28 651,898
1,672,380 Berry Global, Inc.‡ 1.850%, 07/01/26 1 mo. LIBOR + 1.75% 1,654,761
1,053,300 BW Gas & Convenience Holdings, LLC‡ 4.000%, 03/17/28 1 mo. LIBOR + 3.50% 1,055,933
1,056,665 Dun & Bradstreet Corp.‡ 3.336%, 02/06/26 1 mo. LIBOR + 3.25% 1,049,068
PRINCIPAL AMOUNT VALUE
800,921 Granite Holdings US Acquisition Company‡ 4.147%, 09/30/26 3 mo. LIBOR + 4.00% $ 800,921
569,422 RegionalCare Hospital Partners Holdings, Inc.‡ 3.842%, 11/16/25 1 mo. LIBOR + 3.75% 565,314
1,698,664 Scientific Games International, Inc.‡ 2.842%, 08/14/24 1 mo. LIBOR + 2.75% 1,675,902
268,823 TransDigm, Inc.‡ 2.342%, 12/09/25 1 mo. LIBOR + 2.25% 264,430 ___________
8,235,669 ___________ Information Technology (0.4%)
660,000 AP Core Holdings II, LLC! 0.000%, 07/21/27 657,941
1,086,174 Banff Merger Sub, Inc.‡ 3.842%, 10/02/25 1 mo. LIBOR + 3.75% 1,078,511
1,280,500 Camelot U.S. Acquisition 1 Company‡ 3.092%, 10/30/26 1 mo. LIBOR + 3.00% 1,269,776
701,475 Camelot U.S. Acquisition 1 Company‡ 4.000%, 10/30/26 1 mo. LIBOR + 3.00% 702,243
1,110,978 VFH Parent, LLC‡ 3.085%, 03/01/26 1 mo. LIBOR + 3.00% 1,104,429 ___________
4,812,900 ___________ Materials (0.1%)
765,313 Innophos, Inc.‡ 3.592%, 02/07/27 1 mo. LIBOR + 3.50% 764,834 ___________
TOTAL BANK LOANS (Cost $56,182,846) 56,019,163 ___________ ___________
NUMBER OF SHARES VALUE
CONVERTIBLE PREFERRED STOCKS (14.4%) Communication Services (0.9%)
8,500 2020 Cash Mandatory Exchangeable Trust* 5.250%, 06/01/23 10,755,305 ___________
Consumer Discretionary (1.4%) 86,550 Aptiv, PLCµ
5.500%, 06/15/23 16,250,628 ___________ Energy (0.0%)
28 Gulfport Energy Operating Corp. 10.000%, 08/30/21 15.00% PIK rate 137,900 ___________
Financials (1.3%) 5,000 Bank of America Corp.‡‡
7.250% 7,397,750
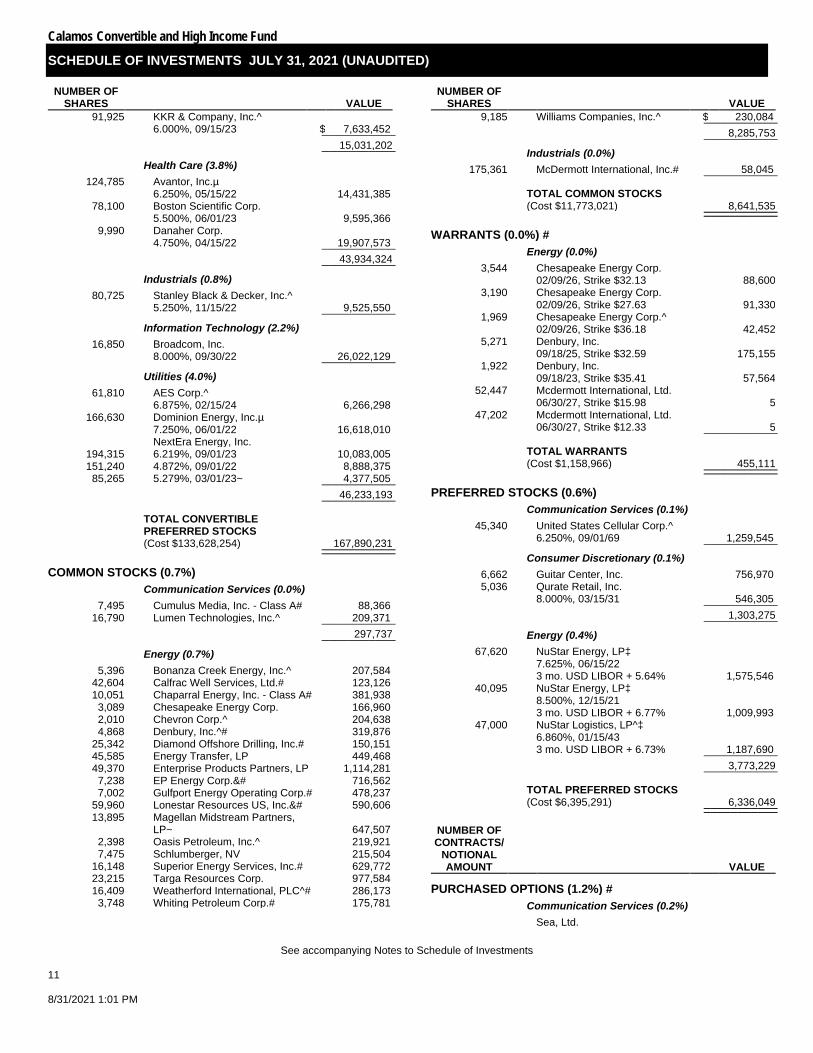
Calamos Convertible and High Income Fund
SCHEDULE OF INVESTMENTS JULY 31, 2021 (UNAUDITED)
See accompanying Notes to Schedule of Investments
11 8/31/2021 1:01 PM
NUMBER OF SHARES VALUE
91,925 KKR & Company, Inc.^ 6.000%, 09/15/23 $ 7,633,452 ___________
15,031,202 ___________ Health Care (3.8%)
124,785 Avantor, Inc.µ 6.250%, 05/15/22 14,431,385
78,100 Boston Scientific Corp. 5.500%, 06/01/23 9,595,366
9,990 Danaher Corp. 4.750%, 04/15/22 19,907,573 ___________
43,934,324 ___________ Industrials (0.8%)
80,725 Stanley Black & Decker, Inc.^ 5.250%, 11/15/22 9,525,550 ___________
Information Technology (2.2%) 16,850 Broadcom, Inc.
8.000%, 09/30/22 26,022,129 ___________ Utilities (4.0%)
61,810 AES Corp.^ 6.875%, 02/15/24 6,266,298
166,630 Dominion Energy, Inc.µ 7.250%, 06/01/22 16,618,010
NextEra Energy, Inc. 194,315 6.219%, 09/01/23 10,083,005 151,240 4.872%, 09/01/22 8,888,375
85,265 5.279%, 03/01/23~ 4,377,505 ___________ 46,233,193 ___________
TOTAL CONVERTIBLE PREFERRED STOCKS (Cost $133,628,254) 167,890,231 ___________ ___________
COMMON STOCKS (0.7%) Communication Services (0.0%)
7,495 Cumulus Media, Inc. - Class A# 88,366 16,790 Lumen Technologies, Inc.^ 209,371 ___________
297,737 ___________ Energy (0.7%)
5,396 Bonanza Creek Energy, Inc.^ 207,584 42,604 Calfrac Well Services, Ltd.# 123,126 10,051 Chaparral Energy, Inc. - Class A# 381,938
3,089 Chesapeake Energy Corp. 166,960 2,010 Chevron Corp.^ 204,638 4,868 Denbury, Inc.^# 319,876
25,342 Diamond Offshore Drilling, Inc.# 150,151 45,585 Energy Transfer, LP 449,468 49,370 Enterprise Products Partners, LP 1,114,281
7,238 EP Energy Corp.&# 716,562 7,002 Gulfport Energy Operating Corp.# 478,237
59,960 Lonestar Resources US, Inc.&# 590,606 13,895 Magellan Midstream Partners,
LP~ 647,507 2,398 Oasis Petroleum, Inc.^ 219,921 7,475 Schlumberger, NV 215,504
16,148 Superior Energy Services, Inc.# 629,772 23,215 Targa Resources Corp. 977,584 16,409 Weatherford International, PLC^# 286,173
3,748 Whiting Petroleum Corp.# 175,781
NUMBER OF SHARES VALUE
9,185 Williams Companies, Inc.^ $ 230,084 ___________ 8,285,753 ___________
Industrials (0.0%) 175,361 McDermott International, Inc.# 58,045 ___________
TOTAL COMMON STOCKS (Cost $11,773,021) 8,641,535 ___________ ___________
WARRANTS (0.0%) # Energy (0.0%)
3,544
Chesapeake Energy Corp. 02/09/26, Strike $32.13 88,600
3,190
Chesapeake Energy Corp. 02/09/26, Strike $27.63 91,330
1,969
Chesapeake Energy Corp.^ 02/09/26, Strike $36.18 42,452
5,271
Denbury, Inc. 09/18/25, Strike $32.59 175,155
1,922
Denbury, Inc. 09/18/23, Strike $35.41 57,564
52,447
Mcdermott International, Ltd. 06/30/27, Strike $15.98 5
47,202
Mcdermott International, Ltd. 06/30/27, Strike $12.33 5 ___________
TOTAL WARRANTS (Cost $1,158,966) 455,111 ___________ ___________
PREFERRED STOCKS (0.6%) Communication Services (0.1%)
45,340 United States Cellular Corp.^ 6.250%, 09/01/69 1,259,545 ___________
Consumer Discretionary (0.1%) 6,662 Guitar Center, Inc. 756,970 5,036 Qurate Retail, Inc.
8.000%, 03/15/31 546,305 ___________ 1,303,275 ___________
Energy (0.4%) 67,620 NuStar Energy, LP‡
7.625%, 06/15/22 3 mo. USD LIBOR + 5.64% 1,575,546
40,095 NuStar Energy, LP‡ 8.500%, 12/15/21 3 mo. USD LIBOR + 6.77% 1,009,993
47,000 NuStar Logistics, LP^‡ 6.860%, 01/15/43 3 mo. USD LIBOR + 6.73% 1,187,690 ___________
3,773,229 ___________
TOTAL PREFERRED STOCKS (Cost $6,395,291) 6,336,049 ___________ ___________
NUMBER OF CONTRACTS/
NOTIONAL AMOUNT VALUE
PURCHASED OPTIONS (1.2%) # Communication Services (0.2%)
Sea, Ltd.

Calamos Convertible and High Income Fund
SCHEDULE OF INVESTMENTS JULY 31, 2021 (UNAUDITED)
See accompanying Notes to Schedule of Investments
12
8/31/2021 1:01 PM
NUMBER OF CONTRACTS/
NOTIONAL AMOUNT VALUE
545 15,050,720
Put, 01/21/22, Strike $260.00 $ 1,381,575
545 15,050,720
Put, 01/21/22, Strike $200.00 367,875
2,550 18,977,100
Snap, Inc. Put, 01/21/22, Strike $55.00 675,750 ___________
2,425,200 ___________ Consumer Discretionary (0.7%)
770 52,914,400
Tesla, Inc. Put, 01/21/22, Strike $700.00 8,158,150 ___________ Information Technology (0.1%)
1,500 11,637,000
Micron Technology, Inc. Call, 01/21/22, Strike $85.00 738,750 ___________ Other (0.2%)
1,500 54,685,500
Invesco QQQ Trust Series Put, 01/21/22, Strike $325.00 1,482,750
1,300 57,006,300
SPDR S&P 500 ETF Trust Put, 01/21/22, Strike $400.00 1,459,250 ___________
2,942,000 ___________
TOTAL PURCHASED OPTIONS (Cost $21,847,859) 14,264,100 ___________ ___________
TOTAL INVESTMENTS (144.3%) (Cost $1,431,228,280) 1,683,796,196 ___________ ___________
MANDATORY REDEEMABLE PREFERRED SHARES, AT LIQUIDATION VALUE (-9.4%) (110,000,000) ___________
LIABILITIES, LESS OTHER ASSETS (-34.9%) (407,469,594) ___________
NET ASSETS (100.0%) $ 1,166,326,602 ___________ ___________
WRITTEN OPTIONS (-0.1%) # Communication Services (-0.1%)
545 15,050,720
Sea, Ltd. Call, 01/21/22, Strike $320.00 (1,010,975) ___________ Consumer Discretionary (0.0%)
385 26,457,200
Tesla, Inc. Call, 01/21/22, Strike $1,500.00 (138,600) ___________
TOTAL WRITTEN OPTIONS (Premium $4,707,685) (1,149,575) ___________ ___________
NOTES TO SCHEDULE OF INVESTMENTS *
Securities issued and sold pursuant to a Rule 144A transaction are excepted from the registration requirement of the Securities Act of 1933, as amended. These securities may only be sold to qualified institutional buyers (“QIBs”), such as the Fund. Any resale of these securities must generally be effected through a sale that is registered under the Act or otherwise exempted from such registration requirements.
µ
Security, or portion of security, is held in a segregated account as collateral for note payable aggregating a total value of $224,701,677.
^ Security, or portion of security, is on loan. @ In default status and considered non-income producing. & Illiquid security. ‡
Variable rate security. The rate shown is the rate in effect at July 31, 2021.
~
Security, or portion of security, is segregated as collateral (or collateral for potential future transactions) for written options. The aggregate value of such securities is $27,306,164.
# Non-income producing security. ¡
Bank loans generally are subject to mandatory and/or optional prepayment. As a result, the actual remaining maturity of bank loans may be substantially less than the stated maturities shown.
!
This position represents an unsettled loan commitment at period end. Certain details associated with this purchase are not known prior to the settlement date, including coupon rate, which will be adjusted on settlement date.
‡‡ Perpetual maturity. Note: The date on options represents the expiration date of the option contract. The option contract may be exercised at any date on or before the date shown.
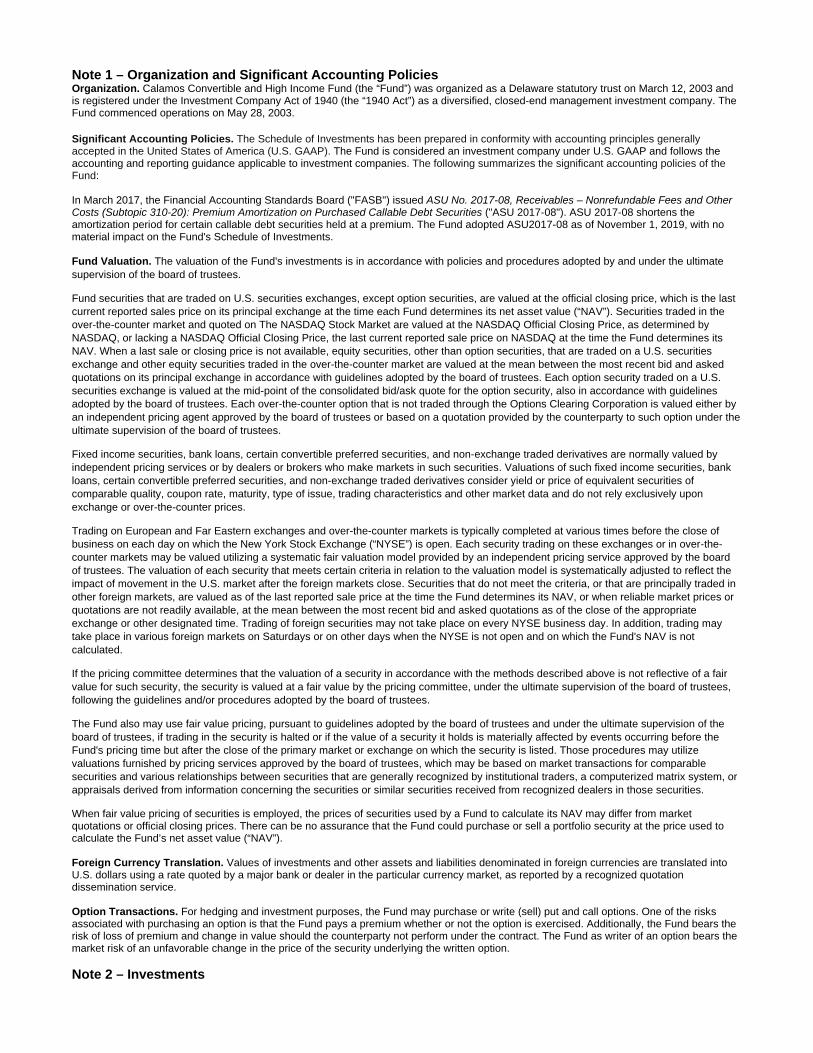
Note 1 – Organization and Significant Accounting Policies Organization. Calamos Convertible and High Income Fund (the “Fund”) was organized as a Delaware statutory trust on March 12, 2003 and is registered under the Investment Company Act of 1940 (the “1940 Act”) as a diversified, closed-end management investment company. The Fund commenced operations on May 28, 2003. Significant Accounting Policies. The Schedule of Investments has been prepared in conformity with accounting principles generally accepted in the United States of America (U.S. GAAP). The Fund is considered an investment company under U.S. GAAP and follows the accounting and reporting guidance applicable to investment companies. The following summarizes the significant accounting policies of the Fund: In March 2017, the Financial Accounting Standards Board ("FASB") issued ASU No. 2017-08, Receivables – Nonrefundable Fees and Other Costs (Subtopic 310-20): Premium Amortization on Purchased Callable Debt Securities ("ASU 2017-08"). ASU 2017-08 shortens the amortization period for certain callable debt securities held at a premium. The Fund adopted ASU2017-08 as of November 1, 2019, with no material impact on the Fund's Schedule of Investments. Fund Valuation. The valuation of the Fund's investments is in accordance with policies and procedures adopted by and under the ultimate supervision of the board of trustees.
Fund securities that are traded on U.S. securities exchanges, except option securities, are valued at the official closing price, which is the last current reported sales price on its principal exchange at the time each Fund determines its net asset value (“NAV”). Securities traded in the over-the-counter market and quoted on The NASDAQ Stock Market are valued at the NASDAQ Official Closing Price, as determined by NASDAQ, or lacking a NASDAQ Official Closing Price, the last current reported sale price on NASDAQ at the time the Fund determines its NAV. When a last sale or closing price is not available, equity securities, other than option securities, that are traded on a U.S. securities exchange and other equity securities traded in the over-the-counter market are valued at the mean between the most recent bid and asked quotations on its principal exchange in accordance with guidelines adopted by the board of trustees. Each option security traded on a U.S. securities exchange is valued at the mid-point of the consolidated bid/ask quote for the option security, also in accordance with guidelines adopted by the board of trustees. Each over-the-counter option that is not traded through the Options Clearing Corporation is valued either by an independent pricing agent approved by the board of trustees or based on a quotation provided by the counterparty to such option under the ultimate supervision of the board of trustees.
Fixed income securities, bank loans, certain convertible preferred securities, and non-exchange traded derivatives are normally valued by independent pricing services or by dealers or brokers who make markets in such securities. Valuations of such fixed income securities, bank loans, certain convertible preferred securities, and non-exchange traded derivatives consider yield or price of equivalent securities of comparable quality, coupon rate, maturity, type of issue, trading characteristics and other market data and do not rely exclusively upon exchange or over-the-counter prices.
Trading on European and Far Eastern exchanges and over-the-counter markets is typically completed at various times before the close of business on each day on which the New York Stock Exchange (“NYSE”) is open. Each security trading on these exchanges or in over-the-counter markets may be valued utilizing a systematic fair valuation model provided by an independent pricing service approved by the board of trustees. The valuation of each security that meets certain criteria in relation to the valuation model is systematically adjusted to reflect the impact of movement in the U.S. market after the foreign markets close. Securities that do not meet the criteria, or that are principally traded in other foreign markets, are valued as of the last reported sale price at the time the Fund determines its NAV, or when reliable market prices or quotations are not readily available, at the mean between the most recent bid and asked quotations as of the close of the appropriate exchange or other designated time. Trading of foreign securities may not take place on every NYSE business day. In addition, trading may take place in various foreign markets on Saturdays or on other days when the NYSE is not open and on which the Fund's NAV is not calculated.
If the pricing committee determines that the valuation of a security in accordance with the methods described above is not reflective of a fair value for such security, the security is valued at a fair value by the pricing committee, under the ultimate supervision of the board of trustees, following the guidelines and/or procedures adopted by the board of trustees.
The Fund also may use fair value pricing, pursuant to guidelines adopted by the board of trustees and under the ultimate supervision of the board of trustees, if trading in the security is halted or if the value of a security it holds is materially affected by events occurring before the Fund's pricing time but after the close of the primary market or exchange on which the security is listed. Those procedures may utilize valuations furnished by pricing services approved by the board of trustees, which may be based on market transactions for comparable securities and various relationships between securities that are generally recognized by institutional traders, a computerized matrix system, or appraisals derived from information concerning the securities or similar securities received from recognized dealers in those securities.
When fair value pricing of securities is employed, the prices of securities used by a Fund to calculate its NAV may differ from market quotations or official closing prices. There can be no assurance that the Fund could purchase or sell a portfolio security at the price used to calculate the Fund’s net asset value (“NAV”). Foreign Currency Translation. Values of investments and other assets and liabilities denominated in foreign currencies are translated into U.S. dollars using a rate quoted by a major bank or dealer in the particular currency market, as reported by a recognized quotation dissemination service. Option Transactions. For hedging and investment purposes, the Fund may purchase or write (sell) put and call options. One of the risks associated with purchasing an option is that the Fund pays a premium whether or not the option is exercised. Additionally, the Fund bears the risk of loss of premium and change in value should the counterparty not perform under the contract. The Fund as writer of an option bears the market risk of an unfavorable change in the price of the security underlying the written option. Note 2 – Investments
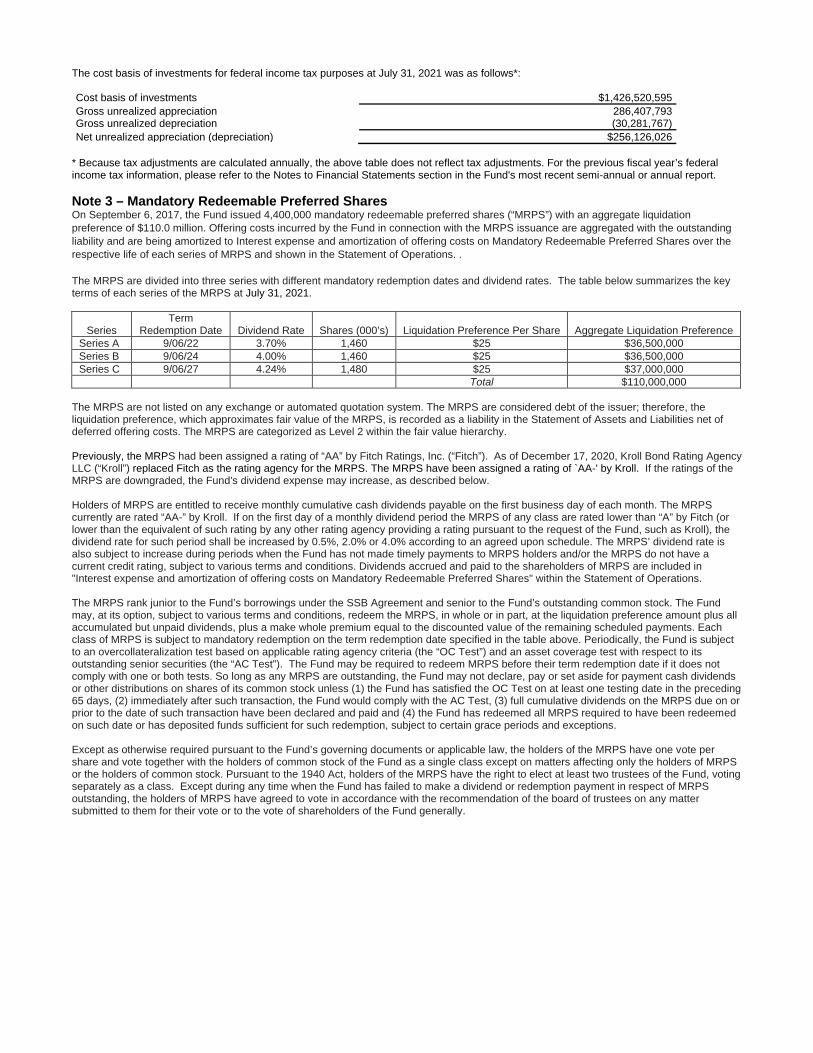
The cost basis of investments for federal income tax purposes at July 31, 2021 was as follows*: Cost basis of investments $1,426,520,595 Gross unrealized appreciation 286,407,793 Gross unrealized depreciation (30,281,767) Net unrealized appreciation (depreciation) $256,126,026
* Because tax adjustments are calculated annually, the above table does not reflect tax adjustments. For the previous fiscal year’s federal income tax information, please refer to the Notes to Financial Statements section in the Fund's most recent semi-annual or annual report. Note 3 – Mandatory Redeemable Preferred Shares On September 6, 2017, the Fund issued 4,400,000 mandatory redeemable preferred shares (“MRPS”) with an aggregate liquidation preference of $110.0 million. Offering costs incurred by the Fund in connection with the MRPS issuance are aggregated with the outstanding liability and are being amortized to Interest expense and amortization of offering costs on Mandatory Redeemable Preferred Shares over the respective life of each series of MRPS and shown in the Statement of Operations. . The MRPS are divided into three series with different mandatory redemption dates and dividend rates. The table below summarizes the key terms of each series of the MRPS at July 31, 2021.
Series Term
Redemption Date Dividend Rate Shares (000’s) Liquidation Preference Per Share Aggregate Liquidation Preference Series A 9/06/22 3.70% 1,460 $25 $36,500,000 Series B 9/06/24 4.00% 1,460 $25 $36,500,000 Series C 9/06/27 4.24% 1,480 $25 $37,000,000
Total $110,000,000 The MRPS are not listed on any exchange or automated quotation system. The MRPS are considered debt of the issuer; therefore, the liquidation preference, which approximates fair value of the MRPS, is recorded as a liability in the Statement of Assets and Liabilities net of deferred offering costs. The MRPS are categorized as Level 2 within the fair value hierarchy. Previously, the MRPS had been assigned a rating of “AA” by Fitch Ratings, Inc. (“Fitch”). As of December 17, 2020, Kroll Bond Rating Agency LLC (“Kroll”) replaced Fitch as the rating agency for the MRPS. The MRPS have been assigned a rating of `AA-' by Kroll. If the ratings of the MRPS are downgraded, the Fund's dividend expense may increase, as described below. Holders of MRPS are entitled to receive monthly cumulative cash dividends payable on the first business day of each month. The MRPS currently are rated “AA-” by Kroll. If on the first day of a monthly dividend period the MRPS of any class are rated lower than “A” by Fitch (or lower than the equivalent of such rating by any other rating agency providing a rating pursuant to the request of the Fund, such as Kroll), the dividend rate for such period shall be increased by 0.5%, 2.0% or 4.0% according to an agreed upon schedule. The MRPS’ dividend rate is also subject to increase during periods when the Fund has not made timely payments to MRPS holders and/or the MRPS do not have a current credit rating, subject to various terms and conditions. Dividends accrued and paid to the shareholders of MRPS are included in "Interest expense and amortization of offering costs on Mandatory Redeemable Preferred Shares" within the Statement of Operations. The MRPS rank junior to the Fund’s borrowings under the SSB Agreement and senior to the Fund’s outstanding common stock. The Fund may, at its option, subject to various terms and conditions, redeem the MRPS, in whole or in part, at the liquidation preference amount plus all accumulated but unpaid dividends, plus a make whole premium equal to the discounted value of the remaining scheduled payments. Each class of MRPS is subject to mandatory redemption on the term redemption date specified in the table above. Periodically, the Fund is subject to an overcollateralization test based on applicable rating agency criteria (the “OC Test”) and an asset coverage test with respect to its outstanding senior securities (the “AC Test”). The Fund may be required to redeem MRPS before their term redemption date if it does not comply with one or both tests. So long as any MRPS are outstanding, the Fund may not declare, pay or set aside for payment cash dividends or other distributions on shares of its common stock unless (1) the Fund has satisfied the OC Test on at least one testing date in the preceding 65 days, (2) immediately after such transaction, the Fund would comply with the AC Test, (3) full cumulative dividends on the MRPS due on or prior to the date of such transaction have been declared and paid and (4) the Fund has redeemed all MRPS required to have been redeemed on such date or has deposited funds sufficient for such redemption, subject to certain grace periods and exceptions. Except as otherwise required pursuant to the Fund’s governing documents or applicable law, the holders of the MRPS have one vote per share and vote together with the holders of common stock of the Fund as a single class except on matters affecting only the holders of MRPS or the holders of common stock. Pursuant to the 1940 Act, holders of the MRPS have the right to elect at least two trustees of the Fund, voting separately as a class. Except during any time when the Fund has failed to make a dividend or redemption payment in respect of MRPS outstanding, the holders of MRPS have agreed to vote in accordance with the recommendation of the board of trustees on any matter submitted to them for their vote or to the vote of shareholders of the Fund generally.

Calamos Strategic Total Return Fund SCHEDULE OF INVESTMENTS JULY 31, 2021 (UNAUDITED)
See accompanying Notes to Schedule of Investments
1 8/31/2021 11:32 AM
PRINCIPAL AMOUNT VALUE
CORPORATE BONDS (16.5%) Airlines (0.4%)
2,167,161 Air Canada Pass Through Trust Series 2015-1, Class B*µ 3.875%, 09/15/24 $ 2,196,397
306,666 Air Canada Pass Through Trust Series 2015-2, Class B* 5.000%, 06/15/25 311,241
1,345,128 Alaska Airlines Pass Through Trust Series 2020-1, Class A* 4.800%, 02/15/29 1,492,379
999,007 Alaska Airlines Pass Through Trust Series 2020-1, Class B*µ 8.000%, 02/15/27 1,117,049
American Airlines, Inc. / AAdvantage Loyalty IP, Ltd.*
884,000 5.500%, 04/20/26 925,875 295,000 5.750%, 04/20/29 319,270
1,370,000 British Airways Pass Through Trust Series 2021-1, Class B* 3.900%, 03/15/33 1,391,605
1,074,840 JetBlue Pass Through Trust Series 2020-1, Class B 7.750%, 05/15/30 1,272,116
435,000 Spirit Loyalty Cayman, Ltd. / Spirit IP Cayman, Ltd.* 8.000%, 09/20/25 490,745
361,757 UAL 2007-1 Pass Through Trust 6.636%, 01/02/24 374,607
1,107,157 United Airlines Pass Through Trust Series 2014-2, Class B 4.625%, 03/03/24 1,134,095
661,986 United Airlines Pass Through Trust Series 2019-2, Class B 3.500%, 11/01/29 656,273 ___________
11,681,652 ___________ Communication Services (2.0%)
1,795,000 Arrow Bidco, LLC* 9.500%, 03/15/24 1,842,855
1,205,000 Ashtead Capital, Inc.* 4.000%, 05/01/28 1,274,107
884,000 Beasley Mezzanine Holdings, LLC* 8.625%, 02/01/26 898,064
910,000 Brink's Company* 5.500%, 07/15/25 959,322
2,135,000 Cincinnati Bell, Inc.* 8.000%, 10/15/25 2,245,785
1,015,000 Consolidated Communications, Inc.* 6.500%, 10/01/28 1,097,286
CSC Holdings, LLC* 4,240,000 5.500%, 04/15/27 4,439,704 2,600,000 5.750%, 01/15/30 2,715,076 1,800,000 5.375%, 02/01/28 1,905,912 1,800,000 4.625%, 12/01/30 1,774,746
540,000 4.500%, 11/15/31 545,211 1,245,000 Cumulus Media New Holdings,
Inc.* 6.750%, 07/01/26 1,311,993
PRINCIPAL AMOUNT VALUE
Diamond Sports Group, LLC / Diamond Sports Finance Company*
825,000 6.625%, 08/15/27 $ 331,691 656,000 5.375%, 08/15/26 381,661 150,000 DIRECTV Holdings, LLC /
DIRECTV Financing Company, Inc.* 5.875%, 08/15/27 155,221
3,976,000 Embarq Corp. 7.995%, 06/01/36 4,460,476
Entercom Media Corp.*^ 589,000 6.750%, 03/31/29 601,693 523,000 6.500%, 05/01/27 539,271 702,000 Frontier Florida, LLC&
6.860%, 02/01/28 769,904 1,785,000 Frontier North, Inc.@
6.730%, 02/15/28 1,943,080
Go Daddy Operating Company, LLC / GD Finance Company, Inc.*
1,030,000 3.500%, 03/01/29 1,031,978 301,000 5.250%, 12/01/27 316,387 345,000 Hughes Satellite Systems Corp.
5.250%, 08/01/26 386,572 Intelsat Jackson Holdings, SA@
900,000 9.750%, 07/15/25* 509,283 585,000 5.500%, 08/01/23 322,885
1,850,000 LCPR Senior Secured Financing DAC* 6.750%, 10/15/27 1,978,723
645,421 Ligado Networks, LLC* 15.500%, 11/01/23 639,264
1,400,000 Lumen Technologies, Inc.* 4.000%, 02/15/27 1,441,342
Netflix, Inc. 910,000 4.875%, 06/15/30* 1,098,106 610,000 4.875%, 04/15/28 713,755
Scripps Escrow II, Inc.* 591,000 3.875%, 01/15/29 591,833 295,000 5.375%, 01/15/31 295,230
1,595,000 Scripps Escrow, Inc.* 5.875%, 07/15/27 1,652,436
591,000 Shift4 Payments, LLC / Shift4 Payments Finance Sub, Inc.* 4.625%, 11/01/26 616,295
Sirius XM Radio, Inc.* 1,500,000 5.500%, 07/01/29^ 1,645,335 1,500,000 4.625%, 07/15/24 1,541,235
885,000 4.000%, 07/15/28 913,320 885,000 Spanish Broadcasting System,
Inc.* 9.750%, 03/01/26 903,178
2,150,000 Sprint Capital Corp. 6.875%, 11/15/28 2,776,037
3,045,000 Sprint Corp. 7.125%, 06/15/24 3,506,683
880,000 Telecom Italia Capital, SA 6.000%, 09/30/34 1,012,220
1,660,000 United States Cellular Corp. 6.700%, 12/15/33 2,067,945
125,000 Vodafone Group, PLC‡ 7.000%, 04/04/79 USD 5 year swap rate + 4.87% 154,861
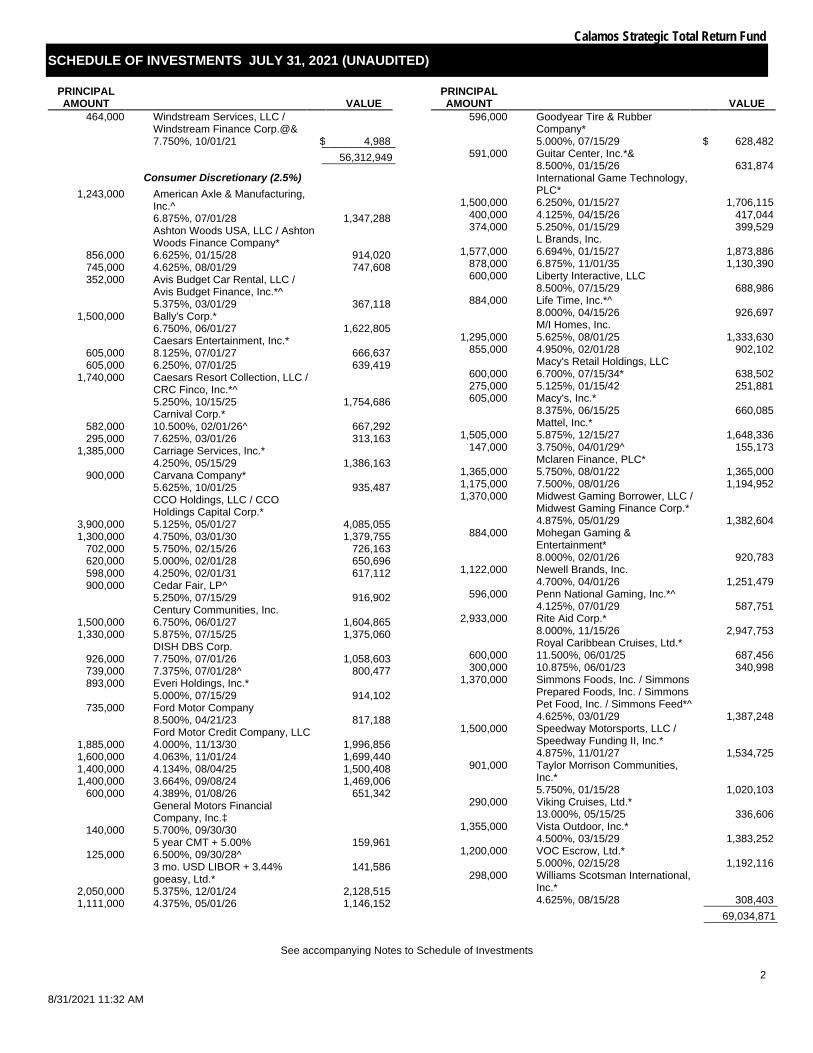
Calamos Strategic Total Return Fund
SCHEDULE OF INVESTMENTS JULY 31, 2021 (UNAUDITED)
See accompanying Notes to Schedule of Investments
2
8/31/2021 11:32 AM
PRINCIPAL AMOUNT VALUE
464,000 Windstream Services, LLC / Windstream Finance Corp.@& 7.750%, 10/01/21 $ 4,988 ___________
56,312,949 ___________ Consumer Discretionary (2.5%)
1,243,000 American Axle & Manufacturing, Inc.^ 6.875%, 07/01/28 1,347,288
Ashton Woods USA, LLC / Ashton Woods Finance Company*
856,000 6.625%, 01/15/28 914,020 745,000 4.625%, 08/01/29 747,608 352,000 Avis Budget Car Rental, LLC /
Avis Budget Finance, Inc.*^ 5.375%, 03/01/29 367,118
1,500,000 Bally's Corp.* 6.750%, 06/01/27 1,622,805
Caesars Entertainment, Inc.* 605,000 8.125%, 07/01/27 666,637 605,000 6.250%, 07/01/25 639,419
1,740,000 Caesars Resort Collection, LLC / CRC Finco, Inc.*^ 5.250%, 10/15/25 1,754,686
Carnival Corp.* 582,000 10.500%, 02/01/26^ 667,292 295,000 7.625%, 03/01/26 313,163
1,385,000 Carriage Services, Inc.* 4.250%, 05/15/29 1,386,163
900,000 Carvana Company* 5.625%, 10/01/25 935,487
CCO Holdings, LLC / CCO Holdings Capital Corp.*
3,900,000 5.125%, 05/01/27 4,085,055 1,300,000 4.750%, 03/01/30 1,379,755
702,000 5.750%, 02/15/26 726,163 620,000 5.000%, 02/01/28 650,696 598,000 4.250%, 02/01/31 617,112 900,000 Cedar Fair, LP^
5.250%, 07/15/29 916,902 Century Communities, Inc.
1,500,000 6.750%, 06/01/27 1,604,865 1,330,000 5.875%, 07/15/25 1,375,060
DISH DBS Corp. 926,000 7.750%, 07/01/26 1,058,603 739,000 7.375%, 07/01/28^ 800,477 893,000 Everi Holdings, Inc.*
5.000%, 07/15/29 914,102 735,000 Ford Motor Company
8.500%, 04/21/23 817,188 Ford Motor Credit Company, LLC
1,885,000 4.000%, 11/13/30 1,996,856 1,600,000 4.063%, 11/01/24 1,699,440 1,400,000 4.134%, 08/04/25 1,500,408 1,400,000 3.664%, 09/08/24 1,469,006
600,000 4.389%, 01/08/26 651,342
General Motors Financial Company, Inc.‡
140,000 5.700%, 09/30/30 5 year CMT + 5.00% 159,961
125,000 6.500%, 09/30/28^ 3 mo. USD LIBOR + 3.44% 141,586
goeasy, Ltd.* 2,050,000 5.375%, 12/01/24 2,128,515 1,111,000 4.375%, 05/01/26 1,146,152
PRINCIPAL AMOUNT VALUE
596,000 Goodyear Tire & Rubber Company* 5.000%, 07/15/29 $ 628,482
591,000 Guitar Center, Inc.*& 8.500%, 01/15/26 631,874
International Game Technology, PLC*
1,500,000 6.250%, 01/15/27 1,706,115 400,000 4.125%, 04/15/26 417,044 374,000 5.250%, 01/15/29 399,529
L Brands, Inc. 1,577,000 6.694%, 01/15/27 1,873,886
878,000 6.875%, 11/01/35 1,130,390 600,000 Liberty Interactive, LLC
8.500%, 07/15/29 688,986 884,000 Life Time, Inc.*^
8.000%, 04/15/26 926,697 M/I Homes, Inc.
1,295,000 5.625%, 08/01/25 1,333,630 855,000 4.950%, 02/01/28 902,102
Macy's Retail Holdings, LLC 600,000 6.700%, 07/15/34* 638,502 275,000 5.125%, 01/15/42 251,881 605,000 Macy's, Inc.*
8.375%, 06/15/25 660,085 Mattel, Inc.*
1,505,000 5.875%, 12/15/27 1,648,336 147,000 3.750%, 04/01/29^ 155,173
Mclaren Finance, PLC* 1,365,000 5.750%, 08/01/22 1,365,000 1,175,000 7.500%, 08/01/26 1,194,952 1,370,000 Midwest Gaming Borrower, LLC /
Midwest Gaming Finance Corp.* 4.875%, 05/01/29 1,382,604
884,000 Mohegan Gaming & Entertainment* 8.000%, 02/01/26 920,783
1,122,000 Newell Brands, Inc. 4.700%, 04/01/26 1,251,479
596,000 Penn National Gaming, Inc.*^ 4.125%, 07/01/29 587,751
2,933,000 Rite Aid Corp.* 8.000%, 11/15/26 2,947,753
Royal Caribbean Cruises, Ltd.* 600,000 11.500%, 06/01/25 687,456 300,000 10.875%, 06/01/23 340,998
1,370,000 Simmons Foods, Inc. / Simmons Prepared Foods, Inc. / Simmons Pet Food, Inc. / Simmons Feed*^ 4.625%, 03/01/29 1,387,248
1,500,000 Speedway Motorsports, LLC / Speedway Funding II, Inc.* 4.875%, 11/01/27 1,534,725
901,000 Taylor Morrison Communities, Inc.* 5.750%, 01/15/28 1,020,103
290,000 Viking Cruises, Ltd.* 13.000%, 05/15/25 336,606
1,355,000 Vista Outdoor, Inc.* 4.500%, 03/15/29 1,383,252
1,200,000 VOC Escrow, Ltd.* 5.000%, 02/15/28 1,192,116
298,000 Williams Scotsman International, Inc.* 4.625%, 08/15/28 308,403 ___________
69,034,871 ___________
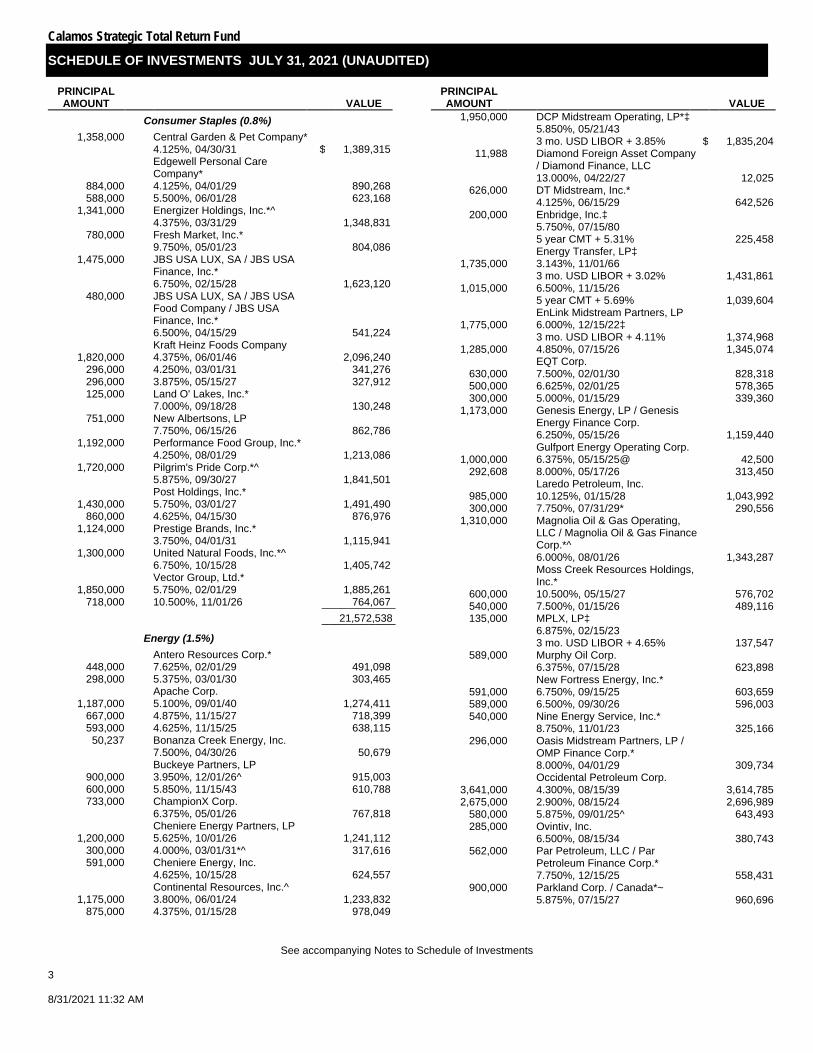
Calamos Strategic Total Return Fund
SCHEDULE OF INVESTMENTS JULY 31, 2021 (UNAUDITED)
See accompanying Notes to Schedule of Investments
3 8/31/2021 11:32 AM
PRINCIPAL AMOUNT VALUE
Consumer Staples (0.8%) 1,358,000 Central Garden & Pet Company*
4.125%, 04/30/31 $ 1,389,315
Edgewell Personal Care Company*
884,000 4.125%, 04/01/29 890,268 588,000 5.500%, 06/01/28 623,168
1,341,000 Energizer Holdings, Inc.*^ 4.375%, 03/31/29 1,348,831
780,000 Fresh Market, Inc.* 9.750%, 05/01/23 804,086
1,475,000 JBS USA LUX, SA / JBS USA Finance, Inc.* 6.750%, 02/15/28 1,623,120
480,000 JBS USA LUX, SA / JBS USA Food Company / JBS USA Finance, Inc.* 6.500%, 04/15/29 541,224
Kraft Heinz Foods Company 1,820,000 4.375%, 06/01/46 2,096,240
296,000 4.250%, 03/01/31 341,276 296,000 3.875%, 05/15/27 327,912 125,000 Land O' Lakes, Inc.*
7.000%, 09/18/28 130,248 751,000 New Albertsons, LP
7.750%, 06/15/26 862,786 1,192,000 Performance Food Group, Inc.*
4.250%, 08/01/29 1,213,086 1,720,000 Pilgrim's Pride Corp.*^
5.875%, 09/30/27 1,841,501 Post Holdings, Inc.*
1,430,000 5.750%, 03/01/27 1,491,490 860,000 4.625%, 04/15/30 876,976
1,124,000 Prestige Brands, Inc.* 3.750%, 04/01/31 1,115,941
1,300,000 United Natural Foods, Inc.*^ 6.750%, 10/15/28 1,405,742
Vector Group, Ltd.* 1,850,000 5.750%, 02/01/29 1,885,261
718,000 10.500%, 11/01/26 764,067 ___________ 21,572,538 ___________
Energy (1.5%) Antero Resources Corp.*
448,000 7.625%, 02/01/29 491,098 298,000 5.375%, 03/01/30 303,465
Apache Corp. 1,187,000 5.100%, 09/01/40 1,274,411
667,000 4.875%, 11/15/27 718,399 593,000 4.625%, 11/15/25 638,115
50,237 Bonanza Creek Energy, Inc. 7.500%, 04/30/26 50,679
Buckeye Partners, LP 900,000 3.950%, 12/01/26^ 915,003 600,000 5.850%, 11/15/43 610,788 733,000 ChampionX Corp.
6.375%, 05/01/26 767,818 Cheniere Energy Partners, LP
1,200,000 5.625%, 10/01/26 1,241,112 300,000 4.000%, 03/01/31*^ 317,616 591,000 Cheniere Energy, Inc.
4.625%, 10/15/28 624,557 Continental Resources, Inc.^
1,175,000 3.800%, 06/01/24 1,233,832 875,000 4.375%, 01/15/28 978,049
PRINCIPAL AMOUNT VALUE
1,950,000 DCP Midstream Operating, LP*‡ 5.850%, 05/21/43 3 mo. USD LIBOR + 3.85% $ 1,835,204
11,988 Diamond Foreign Asset Company / Diamond Finance, LLC 13.000%, 04/22/27 12,025
626,000 DT Midstream, Inc.* 4.125%, 06/15/29 642,526
200,000 Enbridge, Inc.‡ 5.750%, 07/15/80 5 year CMT + 5.31% 225,458
Energy Transfer, LP‡ 1,735,000 3.143%, 11/01/66
3 mo. USD LIBOR + 3.02% 1,431,861 1,015,000 6.500%, 11/15/26
5 year CMT + 5.69% 1,039,604 EnLink Midstream Partners, LP
1,775,000 6.000%, 12/15/22‡ 3 mo. USD LIBOR + 4.11% 1,374,968
1,285,000 4.850%, 07/15/26 1,345,074 EQT Corp.
630,000 7.500%, 02/01/30 828,318 500,000 6.625%, 02/01/25 578,365 300,000 5.000%, 01/15/29 339,360
1,173,000 Genesis Energy, LP / Genesis Energy Finance Corp. 6.250%, 05/15/26 1,159,440
Gulfport Energy Operating Corp. 1,000,000 6.375%, 05/15/25@ 42,500
292,608 8.000%, 05/17/26 313,450 Laredo Petroleum, Inc.
985,000 10.125%, 01/15/28 1,043,992 300,000 7.750%, 07/31/29* 290,556
1,310,000 Magnolia Oil & Gas Operating, LLC / Magnolia Oil & Gas Finance Corp.*^ 6.000%, 08/01/26 1,343,287
Moss Creek Resources Holdings, Inc.*
600,000 10.500%, 05/15/27 576,702 540,000 7.500%, 01/15/26 489,116 135,000 MPLX, LP‡
6.875%, 02/15/23 3 mo. USD LIBOR + 4.65% 137,547
589,000 Murphy Oil Corp. 6.375%, 07/15/28 623,898
New Fortress Energy, Inc.* 591,000 6.750%, 09/15/25 603,659 589,000 6.500%, 09/30/26 596,003 540,000 Nine Energy Service, Inc.*
8.750%, 11/01/23 325,166 296,000 Oasis Midstream Partners, LP /
OMP Finance Corp.* 8.000%, 04/01/29 309,734
Occidental Petroleum Corp. 3,641,000 4.300%, 08/15/39 3,614,785 2,675,000 2.900%, 08/15/24 2,696,989
580,000 5.875%, 09/01/25^ 643,493 285,000 Ovintiv, Inc.
6.500%, 08/15/34 380,743 562,000 Par Petroleum, LLC / Par
Petroleum Finance Corp.* 7.750%, 12/15/25 558,431
900,000 Parkland Corp. / Canada*~ 5.875%, 07/15/27 960,696
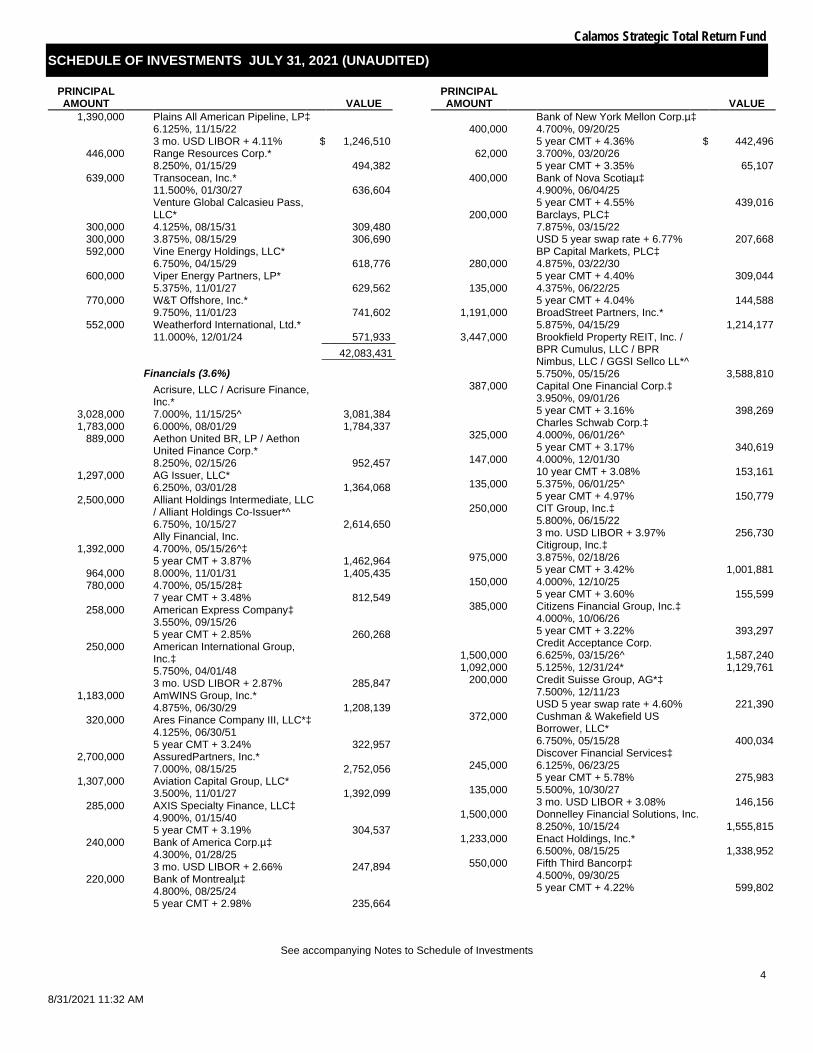
Calamos Strategic Total Return Fund
SCHEDULE OF INVESTMENTS JULY 31, 2021 (UNAUDITED)
See accompanying Notes to Schedule of Investments
4
8/31/2021 11:32 AM
PRINCIPAL AMOUNT VALUE
1,390,000 Plains All American Pipeline, LP‡ 6.125%, 11/15/22 3 mo. USD LIBOR + 4.11% $ 1,246,510
446,000 Range Resources Corp.* 8.250%, 01/15/29 494,382
639,000 Transocean, Inc.* 11.500%, 01/30/27 636,604
Venture Global Calcasieu Pass, LLC*
300,000 4.125%, 08/15/31 309,480 300,000 3.875%, 08/15/29 306,690 592,000 Vine Energy Holdings, LLC*
6.750%, 04/15/29 618,776 600,000 Viper Energy Partners, LP*
5.375%, 11/01/27 629,562 770,000 W&T Offshore, Inc.*
9.750%, 11/01/23 741,602 552,000 Weatherford International, Ltd.*
11.000%, 12/01/24 571,933 ___________ 42,083,431 ___________
Financials (3.6%)
Acrisure, LLC / Acrisure Finance, Inc.*
3,028,000 7.000%, 11/15/25^ 3,081,384 1,783,000 6.000%, 08/01/29 1,784,337
889,000 Aethon United BR, LP / Aethon United Finance Corp.* 8.250%, 02/15/26 952,457
1,297,000 AG Issuer, LLC* 6.250%, 03/01/28 1,364,068
2,500,000 Alliant Holdings Intermediate, LLC / Alliant Holdings Co-Issuer*^ 6.750%, 10/15/27 2,614,650
Ally Financial, Inc. 1,392,000 4.700%, 05/15/26^‡
5 year CMT + 3.87% 1,462,964 964,000 8.000%, 11/01/31 1,405,435 780,000 4.700%, 05/15/28‡
7 year CMT + 3.48% 812,549 258,000 American Express Company‡
3.550%, 09/15/26 5 year CMT + 2.85% 260,268
250,000 American International Group, Inc.‡ 5.750%, 04/01/48 3 mo. USD LIBOR + 2.87% 285,847
1,183,000 AmWINS Group, Inc.* 4.875%, 06/30/29 1,208,139
320,000 Ares Finance Company III, LLC*‡ 4.125%, 06/30/51 5 year CMT + 3.24% 322,957
2,700,000 AssuredPartners, Inc.* 7.000%, 08/15/25 2,752,056
1,307,000 Aviation Capital Group, LLC* 3.500%, 11/01/27 1,392,099
285,000 AXIS Specialty Finance, LLC‡ 4.900%, 01/15/40 5 year CMT + 3.19% 304,537
240,000 Bank of America Corp.µ‡ 4.300%, 01/28/25 3 mo. USD LIBOR + 2.66% 247,894
220,000 Bank of Montrealµ‡ 4.800%, 08/25/24 5 year CMT + 2.98% 235,664
PRINCIPAL AMOUNT VALUE
Bank of New York Mellon Corp.µ‡ 400,000 4.700%, 09/20/25
5 year CMT + 4.36% $ 442,496 62,000 3.700%, 03/20/26
5 year CMT + 3.35% 65,107 400,000 Bank of Nova Scotiaµ‡
4.900%, 06/04/25 5 year CMT + 4.55% 439,016
200,000 Barclays, PLC‡ 7.875%, 03/15/22 USD 5 year swap rate + 6.77% 207,668
BP Capital Markets, PLC‡ 280,000 4.875%, 03/22/30
5 year CMT + 4.40% 309,044 135,000 4.375%, 06/22/25
5 year CMT + 4.04% 144,588 1,191,000 BroadStreet Partners, Inc.*
5.875%, 04/15/29 1,214,177 3,447,000 Brookfield Property REIT, Inc. /
BPR Cumulus, LLC / BPR Nimbus, LLC / GGSI Sellco LL*^ 5.750%, 05/15/26 3,588,810
387,000 Capital One Financial Corp.‡ 3.950%, 09/01/26 5 year CMT + 3.16% 398,269
Charles Schwab Corp.‡ 325,000 4.000%, 06/01/26^
5 year CMT + 3.17% 340,619 147,000 4.000%, 12/01/30
10 year CMT + 3.08% 153,161 135,000 5.375%, 06/01/25^
5 year CMT + 4.97% 150,779 250,000 CIT Group, Inc.‡
5.800%, 06/15/22 3 mo. USD LIBOR + 3.97% 256,730
Citigroup, Inc.‡ 975,000 3.875%, 02/18/26
5 year CMT + 3.42% 1,001,881 150,000 4.000%, 12/10/25
5 year CMT + 3.60% 155,599 385,000 Citizens Financial Group, Inc.‡
4.000%, 10/06/26 5 year CMT + 3.22% 393,297
Credit Acceptance Corp. 1,500,000 6.625%, 03/15/26^ 1,587,240 1,092,000 5.125%, 12/31/24* 1,129,761
200,000 Credit Suisse Group, AG*‡ 7.500%, 12/11/23 USD 5 year swap rate + 4.60% 221,390
372,000 Cushman & Wakefield US Borrower, LLC* 6.750%, 05/15/28 400,034
Discover Financial Services‡ 245,000 6.125%, 06/23/25
5 year CMT + 5.78% 275,983 135,000 5.500%, 10/30/27
3 mo. USD LIBOR + 3.08% 146,156 1,500,000 Donnelley Financial Solutions, Inc.
8.250%, 10/15/24 1,555,815 1,233,000 Enact Holdings, Inc.*
6.500%, 08/15/25 1,338,952 550,000 Fifth Third Bancorp‡
4.500%, 09/30/25 5 year CMT + 4.22% 599,802
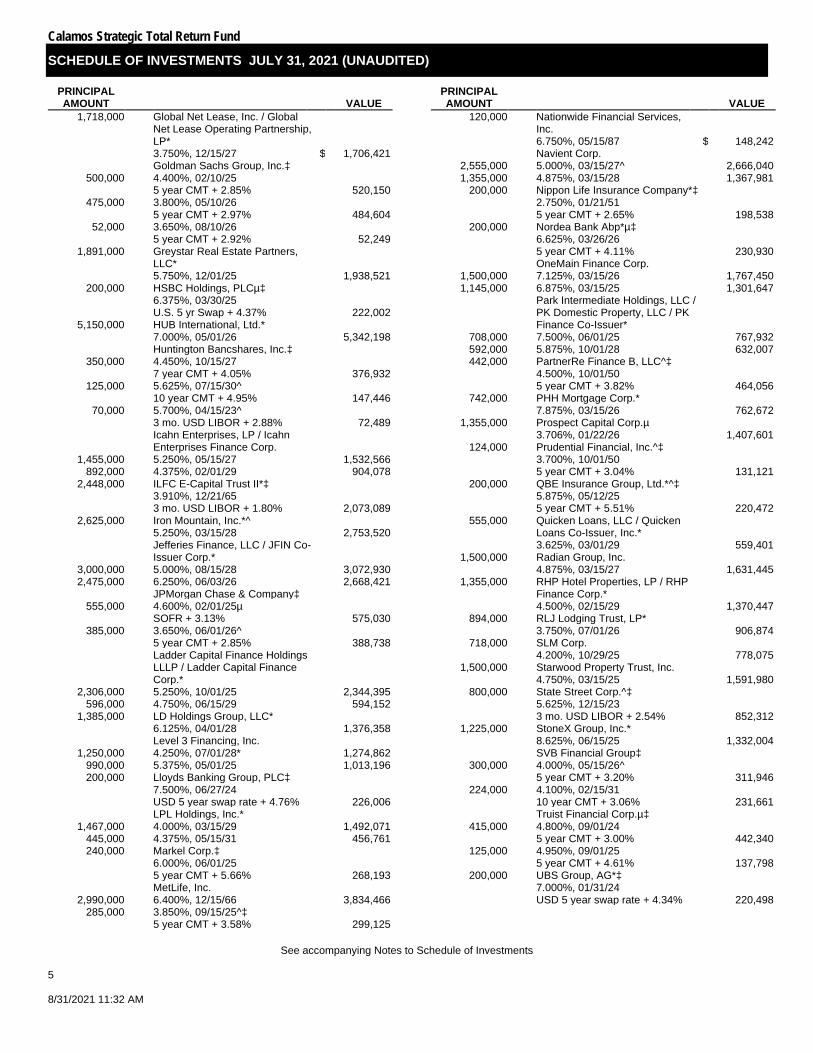
Calamos Strategic Total Return Fund
SCHEDULE OF INVESTMENTS JULY 31, 2021 (UNAUDITED)
See accompanying Notes to Schedule of Investments
5 8/31/2021 11:32 AM
PRINCIPAL AMOUNT VALUE
1,718,000 Global Net Lease, Inc. / Global Net Lease Operating Partnership, LP* 3.750%, 12/15/27 $ 1,706,421
Goldman Sachs Group, Inc.‡ 500,000 4.400%, 02/10/25
5 year CMT + 2.85% 520,150 475,000 3.800%, 05/10/26
5 year CMT + 2.97% 484,604 52,000 3.650%, 08/10/26
5 year CMT + 2.92% 52,249 1,891,000 Greystar Real Estate Partners,
LLC* 5.750%, 12/01/25 1,938,521
200,000 HSBC Holdings, PLCµ‡ 6.375%, 03/30/25 U.S. 5 yr Swap + 4.37% 222,002
5,150,000 HUB International, Ltd.* 7.000%, 05/01/26 5,342,198
Huntington Bancshares, Inc.‡ 350,000 4.450%, 10/15/27
7 year CMT + 4.05% 376,932 125,000 5.625%, 07/15/30^
10 year CMT + 4.95% 147,446 70,000 5.700%, 04/15/23^
3 mo. USD LIBOR + 2.88% 72,489
Icahn Enterprises, LP / Icahn Enterprises Finance Corp.
1,455,000 5.250%, 05/15/27 1,532,566 892,000 4.375%, 02/01/29 904,078
2,448,000 ILFC E-Capital Trust II*‡ 3.910%, 12/21/65 3 mo. USD LIBOR + 1.80% 2,073,089
2,625,000 Iron Mountain, Inc.*^ 5.250%, 03/15/28 2,753,520
Jefferies Finance, LLC / JFIN Co-Issuer Corp.*
3,000,000 5.000%, 08/15/28 3,072,930 2,475,000 6.250%, 06/03/26 2,668,421
JPMorgan Chase & Company‡ 555,000 4.600%, 02/01/25µ
SOFR + 3.13% 575,030 385,000 3.650%, 06/01/26^
5 year CMT + 2.85% 388,738
Ladder Capital Finance Holdings LLLP / Ladder Capital Finance Corp.*
2,306,000 5.250%, 10/01/25 2,344,395 596,000 4.750%, 06/15/29 594,152
1,385,000 LD Holdings Group, LLC* 6.125%, 04/01/28 1,376,358
Level 3 Financing, Inc. 1,250,000 4.250%, 07/01/28* 1,274,862
990,000 5.375%, 05/01/25 1,013,196 200,000 Lloyds Banking Group, PLC‡
7.500%, 06/27/24 USD 5 year swap rate + 4.76% 226,006
LPL Holdings, Inc.* 1,467,000 4.000%, 03/15/29 1,492,071
445,000 4.375%, 05/15/31 456,761 240,000 Markel Corp.‡
6.000%, 06/01/25 5 year CMT + 5.66% 268,193
MetLife, Inc. 2,990,000 6.400%, 12/15/66 3,834,466
285,000 3.850%, 09/15/25^‡ 5 year CMT + 3.58% 299,125
PRINCIPAL AMOUNT VALUE
120,000 Nationwide Financial Services, Inc. 6.750%, 05/15/87 $ 148,242
Navient Corp. 2,555,000 5.000%, 03/15/27^ 2,666,040 1,355,000 4.875%, 03/15/28 1,367,981
200,000 Nippon Life Insurance Company*‡ 2.750%, 01/21/51 5 year CMT + 2.65% 198,538
200,000 Nordea Bank Abp*µ‡ 6.625%, 03/26/26 5 year CMT + 4.11% 230,930
OneMain Finance Corp. 1,500,000 7.125%, 03/15/26 1,767,450 1,145,000 6.875%, 03/15/25 1,301,647
Park Intermediate Holdings, LLC / PK Domestic Property, LLC / PK Finance Co-Issuer*
708,000 7.500%, 06/01/25 767,932 592,000 5.875%, 10/01/28 632,007 442,000 PartnerRe Finance B, LLC^‡
4.500%, 10/01/50 5 year CMT + 3.82% 464,056
742,000 PHH Mortgage Corp.* 7.875%, 03/15/26 762,672
1,355,000 Prospect Capital Corp.µ 3.706%, 01/22/26 1,407,601
124,000 Prudential Financial, Inc.^‡ 3.700%, 10/01/50 5 year CMT + 3.04% 131,121
200,000 QBE Insurance Group, Ltd.*^‡ 5.875%, 05/12/25 5 year CMT + 5.51% 220,472
555,000 Quicken Loans, LLC / Quicken Loans Co-Issuer, Inc.* 3.625%, 03/01/29 559,401
1,500,000 Radian Group, Inc. 4.875%, 03/15/27 1,631,445
1,355,000 RHP Hotel Properties, LP / RHP Finance Corp.* 4.500%, 02/15/29 1,370,447
894,000 RLJ Lodging Trust, LP* 3.750%, 07/01/26 906,874
718,000 SLM Corp. 4.200%, 10/29/25 778,075
1,500,000 Starwood Property Trust, Inc. 4.750%, 03/15/25 1,591,980
800,000 State Street Corp.^‡ 5.625%, 12/15/23 3 mo. USD LIBOR + 2.54% 852,312
1,225,000 StoneX Group, Inc.* 8.625%, 06/15/25 1,332,004
SVB Financial Group‡ 300,000 4.000%, 05/15/26^
5 year CMT + 3.20% 311,946 224,000 4.100%, 02/15/31
10 year CMT + 3.06% 231,661 Truist Financial Corp.µ‡
415,000 4.800%, 09/01/24 5 year CMT + 3.00% 442,340
125,000 4.950%, 09/01/25 5 year CMT + 4.61% 137,798
200,000 UBS Group, AG*‡ 7.000%, 01/31/24 USD 5 year swap rate + 4.34% 220,498
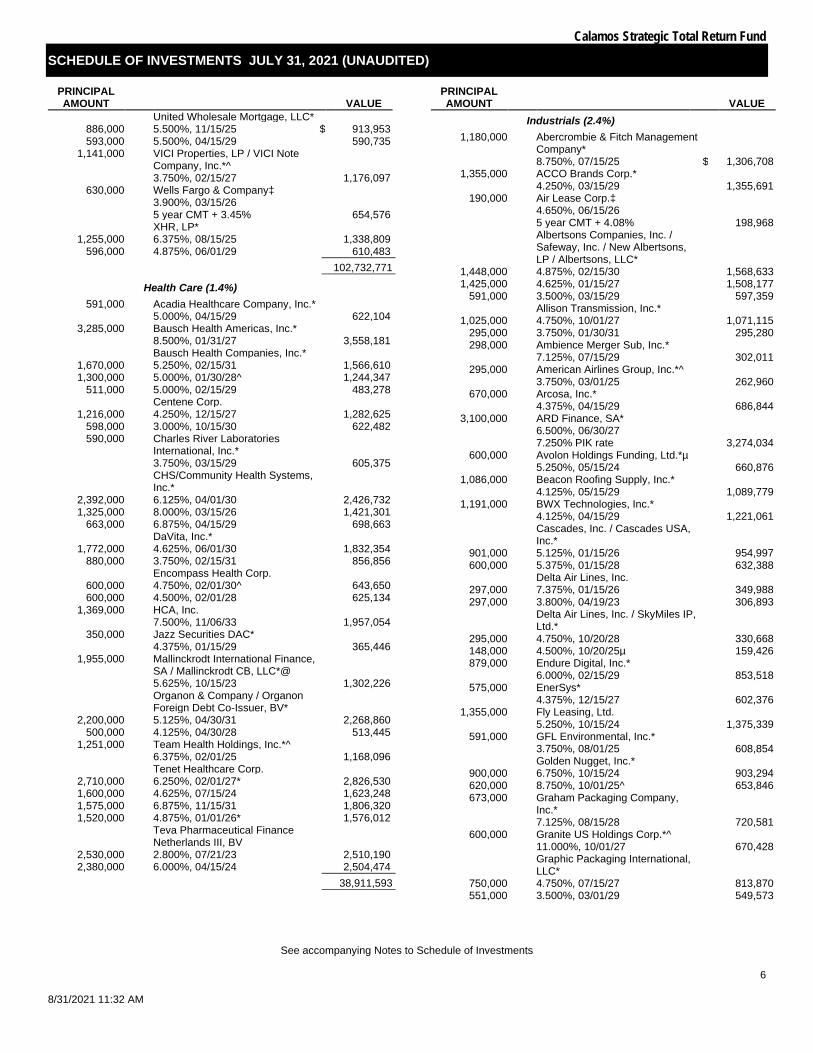
Calamos Strategic Total Return Fund
SCHEDULE OF INVESTMENTS JULY 31, 2021 (UNAUDITED)
See accompanying Notes to Schedule of Investments
6
8/31/2021 11:32 AM
PRINCIPAL AMOUNT VALUE
United Wholesale Mortgage, LLC* 886,000 5.500%, 11/15/25 $ 913,953 593,000 5.500%, 04/15/29 590,735
1,141,000 VICI Properties, LP / VICI Note Company, Inc.*^ 3.750%, 02/15/27 1,176,097
630,000 Wells Fargo & Company‡ 3.900%, 03/15/26 5 year CMT + 3.45% 654,576
XHR, LP* 1,255,000 6.375%, 08/15/25 1,338,809
596,000 4.875%, 06/01/29 610,483 ___________ 102,732,771 ___________
Health Care (1.4%) 591,000 Acadia Healthcare Company, Inc.*
5.000%, 04/15/29 622,104 3,285,000 Bausch Health Americas, Inc.*
8.500%, 01/31/27 3,558,181 Bausch Health Companies, Inc.*
1,670,000 5.250%, 02/15/31 1,566,610 1,300,000 5.000%, 01/30/28^ 1,244,347
511,000 5.000%, 02/15/29 483,278 Centene Corp.
1,216,000 4.250%, 12/15/27 1,282,625 598,000 3.000%, 10/15/30 622,482 590,000 Charles River Laboratories
International, Inc.* 3.750%, 03/15/29 605,375
CHS/Community Health Systems, Inc.*
2,392,000 6.125%, 04/01/30 2,426,732 1,325,000 8.000%, 03/15/26 1,421,301
663,000 6.875%, 04/15/29 698,663 DaVita, Inc.*
1,772,000 4.625%, 06/01/30 1,832,354 880,000 3.750%, 02/15/31 856,856
Encompass Health Corp. 600,000 4.750%, 02/01/30^ 643,650 600,000 4.500%, 02/01/28 625,134
1,369,000 HCA, Inc. 7.500%, 11/06/33 1,957,054
350,000 Jazz Securities DAC* 4.375%, 01/15/29 365,446
1,955,000 Mallinckrodt International Finance, SA / Mallinckrodt CB, LLC*@ 5.625%, 10/15/23 1,302,226
Organon & Company / Organon Foreign Debt Co-Issuer, BV*
2,200,000 5.125%, 04/30/31 2,268,860 500,000 4.125%, 04/30/28 513,445
1,251,000 Team Health Holdings, Inc.*^ 6.375%, 02/01/25 1,168,096
Tenet Healthcare Corp. 2,710,000 6.250%, 02/01/27* 2,826,530 1,600,000 4.625%, 07/15/24 1,623,248 1,575,000 6.875%, 11/15/31 1,806,320 1,520,000 4.875%, 01/01/26* 1,576,012
Teva Pharmaceutical Finance Netherlands III, BV
2,530,000 2.800%, 07/21/23 2,510,190 2,380,000 6.000%, 04/15/24 2,504,474 ___________
38,911,593 ___________
PRINCIPAL AMOUNT VALUE
Industrials (2.4%) 1,180,000 Abercrombie & Fitch Management
Company* 8.750%, 07/15/25 $ 1,306,708
1,355,000 ACCO Brands Corp.* 4.250%, 03/15/29 1,355,691
190,000 Air Lease Corp.‡ 4.650%, 06/15/26 5 year CMT + 4.08% 198,968
Albertsons Companies, Inc. / Safeway, Inc. / New Albertsons, LP / Albertsons, LLC*
1,448,000 4.875%, 02/15/30 1,568,633 1,425,000 4.625%, 01/15/27 1,508,177
591,000 3.500%, 03/15/29 597,359 Allison Transmission, Inc.*
1,025,000 4.750%, 10/01/27 1,071,115 295,000 3.750%, 01/30/31 295,280 298,000 Ambience Merger Sub, Inc.*
7.125%, 07/15/29 302,011 295,000 American Airlines Group, Inc.*^
3.750%, 03/01/25 262,960 670,000 Arcosa, Inc.*
4.375%, 04/15/29 686,844 3,100,000 ARD Finance, SA*
6.500%, 06/30/27 7.250% PIK rate 3,274,034
600,000 Avolon Holdings Funding, Ltd.*µ 5.250%, 05/15/24 660,876
1,086,000 Beacon Roofing Supply, Inc.* 4.125%, 05/15/29 1,089,779
1,191,000 BWX Technologies, Inc.* 4.125%, 04/15/29 1,221,061
Cascades, Inc. / Cascades USA, Inc.*
901,000 5.125%, 01/15/26 954,997 600,000 5.375%, 01/15/28 632,388
Delta Air Lines, Inc. 297,000 7.375%, 01/15/26 349,988 297,000 3.800%, 04/19/23 306,893
Delta Air Lines, Inc. / SkyMiles IP, Ltd.*
295,000 4.750%, 10/20/28 330,668 148,000 4.500%, 10/20/25µ 159,426 879,000 Endure Digital, Inc.*
6.000%, 02/15/29 853,518 575,000 EnerSys*
4.375%, 12/15/27 602,376 1,355,000 Fly Leasing, Ltd.
5.250%, 10/15/24 1,375,339 591,000 GFL Environmental, Inc.*
3.750%, 08/01/25 608,854 Golden Nugget, Inc.*
900,000 6.750%, 10/15/24 903,294 620,000 8.750%, 10/01/25^ 653,846 673,000 Graham Packaging Company,
Inc.* 7.125%, 08/15/28 720,581
600,000 Granite US Holdings Corp.*^ 11.000%, 10/01/27 670,428
Graphic Packaging International, LLC*
750,000 4.750%, 07/15/27 813,870 551,000 3.500%, 03/01/29 549,573

Calamos Strategic Total Return Fund
SCHEDULE OF INVESTMENTS JULY 31, 2021 (UNAUDITED)
See accompanying Notes to Schedule of Investments
7 8/31/2021 11:32 AM
PRINCIPAL AMOUNT VALUE
298,000 Great Lakes Dredge & Dock Corp.* 5.250%, 06/01/29 $ 307,727
2,775,000 H&E Equipment Services, Inc.* 3.875%, 12/15/28 2,755,936
670,000 HCRX Investments Holdco, LP* 4.500%, 08/01/29 684,351
1,500,000 Herc Holdings, Inc.* 5.500%, 07/15/27 1,576,590
Howmet Aerospace, Inc. 1,375,000 5.125%, 10/01/24^ 1,515,497
511,000 6.875%, 05/01/25 595,034 1,450,000 JELD-WEN, Inc.*
4.625%, 12/15/25 1,479,232 594,000 KeHE Distributors, LLC / KeHE
Finance Corp.* 8.625%, 10/15/26 644,252
1,346,000 Ken Garff Automotive, LLC* 4.875%, 09/15/28 1,387,995
598,000 MasTec, Inc.* 4.500%, 08/15/28 631,087
770,000 Meritor, Inc.* 4.500%, 12/15/28 788,526
722,000 Moog, Inc.* 4.250%, 12/15/27 745,898
1,615,000 Nationstar Mortgage Holdings, Inc.* 5.500%, 08/15/28 1,643,844
1,140,000 Novelis Corp.* 4.750%, 01/30/30 1,215,650
1,370,000 Park-Ohio Industries, Inc. 6.625%, 04/15/27 1,394,222
Patrick Industries, Inc.* 600,000 7.500%, 10/15/27 652,914 596,000 4.750%, 05/01/29 608,665
1,445,000 Peninsula Pacific Entertainment, LLC / Peninsula Pacific Entertainment Finance In* 8.500%, 11/15/27 1,569,068
302,000 Picasso Finance Sub, Inc.* 6.125%, 06/15/25 320,398
1,155,000 QVC, Inc. 4.375%, 09/01/28 1,187,583
1,375,000 Reynolds Group Issuer, Inc. / Reynolds Group Issuer, LLC / Reynolds Group Issuer Lu* 4.000%, 10/15/27 1,375,302
885,000 Scientific Games International, Inc.* 5.000%, 10/15/25 910,364
574,000 SEG Holding, LLC / SEG Finance Corp.*^ 5.625%, 10/15/28 605,840
650,000 Sensata Technologies, BV* 4.000%, 04/15/29 669,077
593,000 Sensata Technologies, Inc.* 3.750%, 02/15/31 598,936
Sinclair Television Group, Inc.* 600,000 5.500%, 03/01/30 602,706 591,000 4.125%, 12/01/30 573,737
Standard Industries, Inc.* 1,165,000 5.000%, 02/15/27 1,207,022
302,000 4.375%, 07/15/30^ 310,821 100,000 Stanley Black & Decker, Inc.^‡
4.000%, 03/15/60 5 year CMT + 2.66% 107,301
PRINCIPAL AMOUNT VALUE
Station Casinos, LLC* 2,430,000 4.500%, 02/15/28 $ 2,453,206
788,000 5.000%, 10/01/25 798,977 591,000 Stericycle, Inc.*
3.875%, 01/15/29 599,883 879,000 STL Holding Company, LLC*
7.500%, 02/15/26 927,600 1,200,000 TransDigm UK Holdings, PLC
6.875%, 05/15/26 1,268,076 TransDigm, Inc.
1,490,000 6.250%, 03/15/26* 1,565,647 875,000 7.500%, 03/15/27 928,340 589,000 Tronox, Inc.*
4.625%, 03/15/29 600,044
United Rentals North America, Inc.
640,000 5.875%, 09/15/26 661,946 595,000 3.750%, 01/15/32 595,000 297,000 3.875%, 02/15/31 306,026 750,000 Waste Pro USA, Inc.*
5.500%, 02/15/26 766,080 WESCO Distribution, Inc.*
563,000 7.125%, 06/15/25^ 607,286 283,000 7.250%, 06/15/28 315,519
1,500,000 XPO Logistics, Inc.* 6.750%, 08/15/24 1,557,345 ___________
68,502,085 ___________ Information Technology (0.6%)
596,000 Booz Allen Hamilton, Inc.* 4.000%, 07/01/29 614,756
600,000 CDK Global, Inc.* 5.250%, 05/15/29 654,228
1,201,000 CommScope Technologies, LLC* 6.000%, 06/15/25 1,220,456
Dell International, LLC / EMC Corp.
1,405,000 6.020%, 06/15/26µ 1,691,536 925,000 6.100%, 07/15/27 1,144,401 545,000 5.850%, 07/15/25µ 640,745 586,000 Fair Isaac Corp.*
4.000%, 06/15/28 613,179 1,315,000 KBR, Inc.*
4.750%, 09/30/28 1,338,552 1,300,000 MPH Acquisition Holdings, LLC*^
5.750%, 11/01/28 1,264,510 589,000 NCR Corp.*
5.125%, 04/15/29 613,862 1,364,000 Nielsen Finance, LLC / Nielsen
Finance Company* 4.500%, 07/15/29 1,377,708
886,000 ON Semiconductor Corp.* 3.875%, 09/01/28 923,168
855,000 Open Text Corp.* 3.875%, 02/15/28 885,027
590,000 Playtika Holding Corp.* 4.250%, 03/15/29 589,079
784,000 PTC, Inc.* 4.000%, 02/15/28 812,436
1,355,000 TTM Technologies, Inc.* 4.000%, 03/01/29 1,365,149
Twilio, Inc. 830,000 3.625%, 03/15/29 853,738 298,000 3.875%, 03/15/31^ 311,836

Calamos Strategic Total Return Fund
SCHEDULE OF INVESTMENTS JULY 31, 2021 (UNAUDITED)
See accompanying Notes to Schedule of Investments
8
8/31/2021 11:32 AM
PRINCIPAL AMOUNT VALUE
1,355,000 ZoomInfo Technologies, LLC / ZoomInfo Finance Corp.* 3.875%, 02/01/29 $ 1,357,629 ___________
18,271,995 ___________ Materials (0.8%)
Alcoa Nederland Holding, BV* 1,835,000 7.000%, 09/30/26 1,916,364
800,000 4.125%, 03/31/29^ 842,088 600,000 Allegheny Technologies, Inc.^
5.875%, 12/01/27 630,900 900,000 ArcelorMittal, SA
7.250%, 10/15/39 1,315,251 507,000 Ardagh Packaging Finance, PLC /
Ardagh Holdings USA, Inc.* 6.000%, 02/15/25 523,057
1,880,000 Clearwater Paper Corp.* 4.750%, 08/15/28 1,902,316
800,000 First Quantum Minerals, Ltd.* 7.250%, 04/01/23 815,456
Freeport-McMoRan, Inc. 780,000 5.000%, 09/01/27 824,249 570,000 5.450%, 03/15/43 732,838 515,000 5.400%, 11/14/34 654,730 886,000 HB Fuller Company
4.250%, 10/15/28 907,672 1,192,000 Intertape Polymer Group, Inc.*
4.375%, 06/15/29 1,220,978 900,000 JW Aluminum Continuous Cast
Company* 10.250%, 06/01/26 949,338
Kaiser Aluminum Corp.* 615,000 4.625%, 03/01/28^ 643,013 149,000 4.500%, 06/01/31 155,125 957,000 Mercer International, Inc.
5.125%, 02/01/29 977,269 New Gold, Inc.*
364,000 6.375%, 05/15/25 375,746 300,000 7.500%, 07/15/27 324,270
1,170,000 OCI, NV* 4.625%, 10/15/25 1,215,162
593,000 Owens-Brockway Glass Container, Inc.* 6.625%, 05/13/27 643,215
594,000 PBF Holding Company, LLC / PBF Finance Corp.~ 7.250%, 06/15/25 358,942
1,328,000 Silgan Holdings, Inc. 4.125%, 02/01/28 1,380,004
589,000 Trinseo Materials Operating SCA / Trinseo Materials Finance, Inc.* 5.125%, 04/01/29 601,163
906,000 Univar Solutions USA, Inc.* 5.125%, 12/01/27 950,403
593,000 Valvoline, Inc.* 3.625%, 06/15/31 591,150 ___________
21,450,699 ___________ Real Estate (0.2%)
953,000 EPR Properties 3.750%, 08/15/29 967,877
Forestar Group, Inc.* 862,000 5.000%, 03/01/28 898,540 299,000 3.850%, 05/15/26 303,557 881,000 iStar, Inc.
5.500%, 02/15/26 924,944
PRINCIPAL AMOUNT VALUE
Service Properties Trust 1,500,000 4.350%, 10/01/24 $ 1,514,025
550,000 5.250%, 02/15/26 556,732 ___________ 5,165,675 ___________
Utilities (0.3%) 856,000 Calpine Corp.*
4.500%, 02/15/28 883,572 65,000 CenterPoint Energy, Inc.‡
6.125%, 09/01/23 3 mo. USD LIBOR + 3.27% 68,858
175,000 CMS Energy Corp.‡ 4.750%, 06/01/50 5 year CMT + 4.12% 196,745
250,000 Dominion Energy, Inc.‡ 4.650%, 12/15/24 5 year CMT + 2.99% 267,647
330,000 Duke Energy Corp.‡ 4.875%, 09/16/24 5 year CMT + 3.39% 353,097
265,000 NextEra Energy Capital Holdings, Inc.^‡ 4.800%, 12/01/77 3 mo. USD LIBOR + 2.41% 298,803
810,000 NRG Energy, Inc. 6.625%, 01/15/27 839,460
1,896,000 PPL Capital Funding, Inc.‡ 2.812%, 03/30/67 3 mo. USD LIBOR + 2.67% 1,859,085
125,000 Sempra Energy‡ 4.875%, 10/15/25 5 year CMT + 4.55% 136,713
Southern Company‡ 247,000 4.000%, 01/15/51
5 year CMT + 3.73% 262,270 95,000 3.750%, 09/15/51
5 year CMT + 2.92% 97,236 Talen Energy Supply, LLC*
600,000 10.500%, 01/15/26 414,186 300,000 7.250%, 05/15/27 273,891
1,500,000 TerraForm Power Operating, LLC* 5.000%, 01/31/28 1,624,230 ___________
7,575,793 ___________
TOTAL CORPORATE BONDS (Cost $443,536,093) 463,296,052 ___________ ___________
CONVERTIBLE BONDS (21.0%) Communication Services (2.4%)
3,394,000 Eventbrite, Inc.* 0.750%, 09/15/26 3,209,706
Liberty Media Corp. 7,750,000 1.375%, 10/15/23 10,305,097 2,680,000 0.500%, 12/01/50* 2,967,886 7,150,000 Liberty Media Corp. / Liberty
Formula One 1.000%, 01/30/23 9,469,889
1,883,000 Live Nation Entertainment, Inc. 2.500%, 03/15/23 2,454,886
3,669,000 Magnite, Inc.* 0.250%, 03/15/26 3,163,705
3,000,000 Match Group Financeco 2, Inc.*~ 0.875%, 06/15/26 5,706,720
2,500,000 Match Group Financeco 3, Inc.* 2.000%, 01/15/30 5,045,275

Calamos Strategic Total Return Fund
SCHEDULE OF INVESTMENTS JULY 31, 2021 (UNAUDITED)
See accompanying Notes to Schedule of Investments
9 8/31/2021 11:32 AM
PRINCIPAL AMOUNT VALUE
11,350,000 Snap, Inc.* 0.000%, 05/01/27 $ 13,066,120
4,330,000 Twitter, Inc. 0.250%, 06/15/24 6,004,541
4,935,000 Zynga, Inc. 0.250%, 06/01/24 6,594,986 ___________
67,988,811 ___________ Consumer Discretionary (5.0%)
1,187,000 Bloomin' Brands, Inc.µ 5.000%, 05/01/25 2,677,943
15,201,000 Booking Holdings, Inc.µ^ 0.750%, 05/01/25 21,457,732
7,785,000 Burlington Stores, Inc. 2.250%, 04/15/25 12,738,362
6,435,000 Chegg, Inc.*µ 0.000%, 09/01/26 6,977,921
1,895,000 Dick's Sporting Goods, Inc.µ 3.250%, 04/15/25 5,830,839
2,164,000 DISH Network Corp.µ 2.375%, 03/15/24 2,096,981
6,685,000 DraftKings, Inc.* 0.000%, 03/15/28 5,868,360
4,415,000 Etsy, Inc.*^ 0.125%, 09/01/27 5,321,399
4,598,000 Expedia Group, Inc.*^ 0.000%, 02/15/26 4,943,862
5,635,000 Ford Motor Company* 0.000%, 03/15/26 6,038,184
Liberty Interactive, LLC 1,160,000 4.000%, 11/15/29 893,931
790,000 3.750%, 02/15/30 609,438 2,970,000 MakeMyTrip, Ltd.*
0.000%, 02/15/28 3,002,314 7,670,000 Marriott Vacations Worldwide
Corp.* 0.000%, 01/15/26 8,200,994
550,000 Peloton Interactive, Inc.* 0.000%, 02/15/26 520,449
11,345,000 Royal Caribbean Cruises, Ltd. 4.250%, 06/15/23 14,618,032
5,730,000 Shake Shack, Inc.* 0.000%, 03/01/28 5,369,640
400,000 Tesla, Inc. 2.000%, 05/15/24 4,432,980
4,160,000 Under Armour, Inc. 1.500%, 06/01/24 7,765,846
7,865,000 Vail Resorts, Inc.* 0.000%, 01/01/26 7,941,369
4,630,000 Vroom, Inc.* 0.750%, 07/01/26 4,504,342
4,225,000 Wayfair, Inc.* 0.625%, 10/01/25 4,104,545
2,930,000 Winnebago Industries, Inc. 1.500%, 04/01/25 3,877,328 ___________
139,792,791 ___________ Consumer Staples (0.2%)
5,700,000 Beyond Meat, Inc.*µ 0.000%, 03/15/27 5,251,866 ___________
Energy (0.5%) 3,190,000 EQT Corp.^
1.750%, 05/01/26 4,682,697
PRINCIPAL AMOUNT VALUE
6,515,000 Pioneer Natural Resources Company 0.250%, 05/15/25 $ 9,584,803 ___________
14,267,500 ___________ Financials (0.7%)
Ares Capital Corp. 7,500,000 3.750%, 02/01/22^ 7,950,300 3,000,000 4.625%, 03/01/24 3,290,280 4,700,000 JPMorgan Chase Bank NA*^
0.125%, 01/01/23 5,012,362 4,675,000 Realogy Group, LLC / Realogy
Co-Issuer Corp.* 0.250%, 06/15/26 4,735,588 ___________
20,988,530 ___________ Health Care (3.1%)
1,850,000 CONMED Corp.^ 2.625%, 02/01/24 2,994,355
9,218,000 Dexcom, Inc.µ 0.250%, 11/15/25 10,511,378
3,673,000 Envista Holdings Corp.^ 2.375%, 06/01/25 7,834,986
11,015,000 Exact Sciences Corp. 0.375%, 03/15/27 13,317,465
3,702,000 Halozyme Therapeutics, Inc.* 0.250%, 03/01/27 3,391,661
5,015,000 Insulet Corp. 0.375%, 09/01/26 6,946,176
3,960,000 Integra LifeSciences Holdings Corp. 0.500%, 08/15/25 4,508,381
8,035,000 Jazz Investments I, Ltd. 2.000%, 06/15/26 10,416,976
6,925,000 NeoGenomics, Inc. 0.250%, 01/15/28 6,824,657
4,220,000 Oak Street Health, Inc.* 0.000%, 03/15/26 4,469,233
4,680,000 Omnicell, Inc.* 0.250%, 09/15/25 7,371,983
7,755,000 Pacira BioSciences, Inc. 0.750%, 08/01/25 8,533,447 ___________
87,120,698 ___________ Industrials (3.7%)
6,350,000 Air Canadaµ 4.000%, 07/01/25 9,689,783
4,600,000 Air Transport Services Group, Inc. 1.125%, 10/15/24 4,784,736
1,015,000 Chart Industries, Inc.*µ 1.000%, 11/15/24 2,713,958
7,440,000 JetBlue Airways Corp.* 0.500%, 04/01/26 7,358,532
10,395,000 John Bean Technologies Corp.* 0.250%, 05/15/26 11,209,864
8,240,000 Middleby Corp.* 1.000%, 09/01/25 12,889,585
3,763,000 Parsons Corp.* 0.250%, 08/15/25 3,971,056
21,015,000 Southwest Airlines Company 1.250%, 05/01/25 30,877,339
5,805,000 Sunrun, Inc.*^ 0.000%, 02/01/26 5,183,691
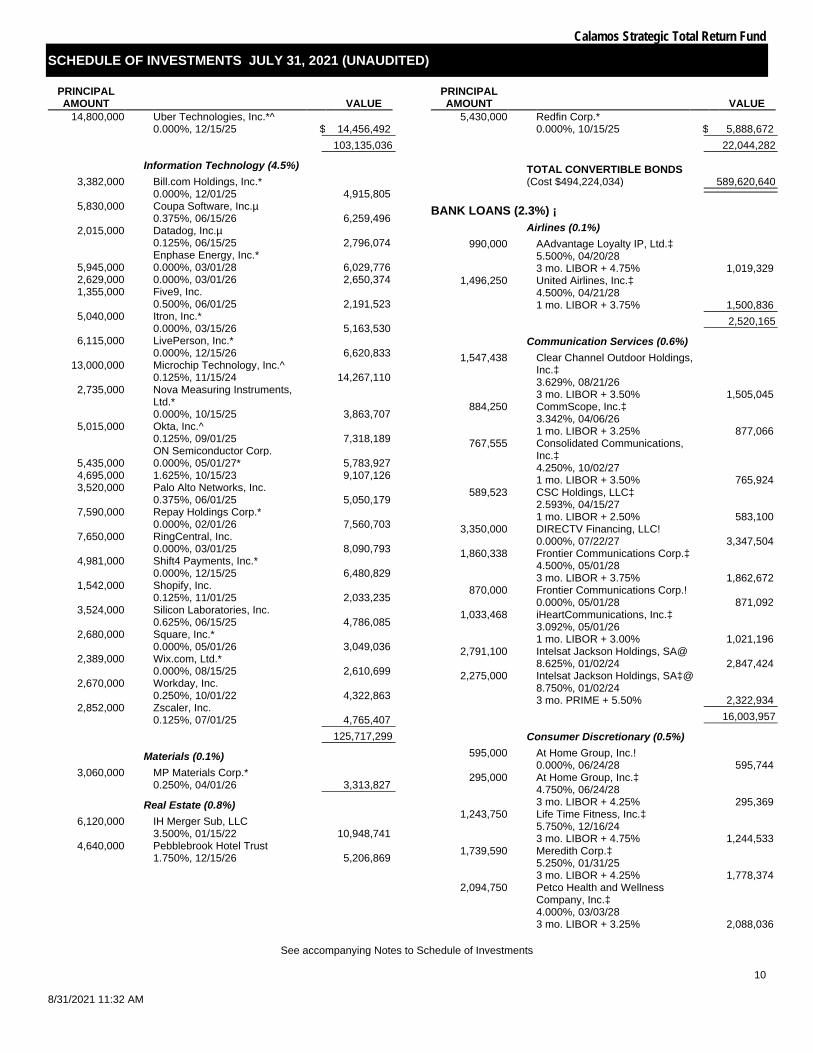
Calamos Strategic Total Return Fund
SCHEDULE OF INVESTMENTS JULY 31, 2021 (UNAUDITED)
See accompanying Notes to Schedule of Investments
10
8/31/2021 11:32 AM
PRINCIPAL AMOUNT VALUE
14,800,000 Uber Technologies, Inc.*^ 0.000%, 12/15/25 $ 14,456,492 ___________
103,135,036 ___________ Information Technology (4.5%)
3,382,000 Bill.com Holdings, Inc.* 0.000%, 12/01/25 4,915,805
5,830,000 Coupa Software, Inc.µ 0.375%, 06/15/26 6,259,496
2,015,000 Datadog, Inc.µ 0.125%, 06/15/25 2,796,074
Enphase Energy, Inc.* 5,945,000 0.000%, 03/01/28 6,029,776 2,629,000 0.000%, 03/01/26 2,650,374 1,355,000 Five9, Inc.
0.500%, 06/01/25 2,191,523 5,040,000 Itron, Inc.*
0.000%, 03/15/26 5,163,530 6,115,000 LivePerson, Inc.*
0.000%, 12/15/26 6,620,833 13,000,000 Microchip Technology, Inc.^
0.125%, 11/15/24 14,267,110 2,735,000 Nova Measuring Instruments,
Ltd.* 0.000%, 10/15/25 3,863,707
5,015,000 Okta, Inc.^ 0.125%, 09/01/25 7,318,189
ON Semiconductor Corp. 5,435,000 0.000%, 05/01/27* 5,783,927 4,695,000 1.625%, 10/15/23 9,107,126 3,520,000 Palo Alto Networks, Inc.
0.375%, 06/01/25 5,050,179 7,590,000 Repay Holdings Corp.*
0.000%, 02/01/26 7,560,703 7,650,000 RingCentral, Inc.
0.000%, 03/01/25 8,090,793 4,981,000 Shift4 Payments, Inc.*
0.000%, 12/15/25 6,480,829 1,542,000 Shopify, Inc.
0.125%, 11/01/25 2,033,235 3,524,000 Silicon Laboratories, Inc.
0.625%, 06/15/25 4,786,085 2,680,000 Square, Inc.*
0.000%, 05/01/26 3,049,036 2,389,000 Wix.com, Ltd.*
0.000%, 08/15/25 2,610,699 2,670,000 Workday, Inc.
0.250%, 10/01/22 4,322,863 2,852,000 Zscaler, Inc.
0.125%, 07/01/25 4,765,407 ___________ 125,717,299 ___________
Materials (0.1%) 3,060,000 MP Materials Corp.*
0.250%, 04/01/26 3,313,827 ___________ Real Estate (0.8%)
6,120,000 IH Merger Sub, LLC 3.500%, 01/15/22 10,948,741
4,640,000 Pebblebrook Hotel Trust 1.750%, 12/15/26 5,206,869
PRINCIPAL AMOUNT VALUE
5,430,000 Redfin Corp.* 0.000%, 10/15/25 $ 5,888,672 ___________
22,044,282 ___________
TOTAL CONVERTIBLE BONDS (Cost $494,224,034) 589,620,640 ___________ ___________
BANK LOANS (2.3%) ¡ Airlines (0.1%)
990,000 AAdvantage Loyalty IP, Ltd.‡ 5.500%, 04/20/28 3 mo. LIBOR + 4.75% 1,019,329
1,496,250 United Airlines, Inc.‡ 4.500%, 04/21/28 1 mo. LIBOR + 3.75% 1,500,836 ___________
2,520,165 ___________ Communication Services (0.6%)
1,547,438 Clear Channel Outdoor Holdings, Inc.‡ 3.629%, 08/21/26 3 mo. LIBOR + 3.50% 1,505,045
884,250 CommScope, Inc.‡ 3.342%, 04/06/26 1 mo. LIBOR + 3.25% 877,066
767,555 Consolidated Communications, Inc.‡ 4.250%, 10/02/27 1 mo. LIBOR + 3.50% 765,924
589,523 CSC Holdings, LLC‡ 2.593%, 04/15/27 1 mo. LIBOR + 2.50% 583,100
3,350,000 DIRECTV Financing, LLC! 0.000%, 07/22/27 3,347,504
1,860,338 Frontier Communications Corp.‡ 4.500%, 05/01/28 3 mo. LIBOR + 3.75% 1,862,672
870,000 Frontier Communications Corp.! 0.000%, 05/01/28 871,092
1,033,468 iHeartCommunications, Inc.‡ 3.092%, 05/01/26 1 mo. LIBOR + 3.00% 1,021,196
2,791,100 Intelsat Jackson Holdings, SA@ 8.625%, 01/02/24 2,847,424
2,275,000 Intelsat Jackson Holdings, SA‡@ 8.750%, 01/02/24 3 mo. PRIME + 5.50% 2,322,934 ___________
16,003,957 ___________ Consumer Discretionary (0.5%)
595,000 At Home Group, Inc.! 0.000%, 06/24/28 595,744
295,000 At Home Group, Inc.‡ 4.750%, 06/24/28 3 mo. LIBOR + 4.25% 295,369
1,243,750 Life Time Fitness, Inc.‡ 5.750%, 12/16/24 3 mo. LIBOR + 4.75% 1,244,533
1,739,590 Meredith Corp.‡ 5.250%, 01/31/25 3 mo. LIBOR + 4.25% 1,778,374
2,094,750 Petco Health and Wellness Company, Inc.‡ 4.000%, 03/03/28 3 mo. LIBOR + 3.25% 2,088,036
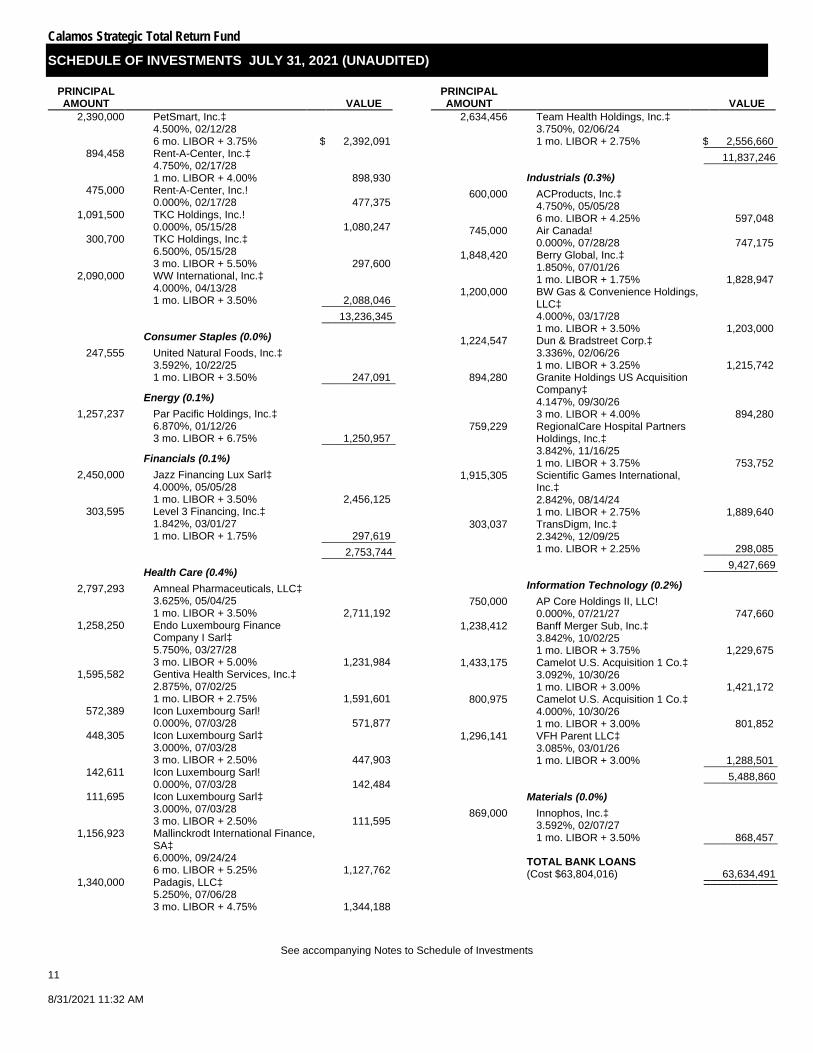
Calamos Strategic Total Return Fund
SCHEDULE OF INVESTMENTS JULY 31, 2021 (UNAUDITED)
See accompanying Notes to Schedule of Investments
11 8/31/2021 11:32 AM
PRINCIPAL AMOUNT VALUE
2,390,000 PetSmart, Inc.‡ 4.500%, 02/12/28 6 mo. LIBOR + 3.75% $ 2,392,091
894,458 Rent-A-Center, Inc.‡ 4.750%, 02/17/28 1 mo. LIBOR + 4.00% 898,930
475,000 Rent-A-Center, Inc.! 0.000%, 02/17/28 477,375
1,091,500 TKC Holdings, Inc.! 0.000%, 05/15/28 1,080,247
300,700 TKC Holdings, Inc.‡ 6.500%, 05/15/28 3 mo. LIBOR + 5.50% 297,600
2,090,000 WW International, Inc.‡ 4.000%, 04/13/28 1 mo. LIBOR + 3.50% 2,088,046 ___________
13,236,345 ___________ Consumer Staples (0.0%)
247,555 United Natural Foods, Inc.‡ 3.592%, 10/22/25 1 mo. LIBOR + 3.50% 247,091 ___________
Energy (0.1%) 1,257,237 Par Pacific Holdings, Inc.‡
6.870%, 01/12/26 3 mo. LIBOR + 6.75% 1,250,957 ___________
Financials (0.1%) 2,450,000 Jazz Financing Lux Sarl‡
4.000%, 05/05/28 1 mo. LIBOR + 3.50% 2,456,125
303,595 Level 3 Financing, Inc.‡ 1.842%, 03/01/27 1 mo. LIBOR + 1.75% 297,619 ___________
2,753,744 ___________ Health Care (0.4%)
2,797,293 Amneal Pharmaceuticals, LLC‡ 3.625%, 05/04/25 1 mo. LIBOR + 3.50% 2,711,192
1,258,250 Endo Luxembourg Finance Company I Sarl‡ 5.750%, 03/27/28 3 mo. LIBOR + 5.00% 1,231,984
1,595,582 Gentiva Health Services, Inc.‡ 2.875%, 07/02/25 1 mo. LIBOR + 2.75% 1,591,601
572,389 Icon Luxembourg Sarl! 0.000%, 07/03/28 571,877
448,305 Icon Luxembourg Sarl‡ 3.000%, 07/03/28 3 mo. LIBOR + 2.50% 447,903
142,611 Icon Luxembourg Sarl! 0.000%, 07/03/28 142,484
111,695 Icon Luxembourg Sarl‡ 3.000%, 07/03/28 3 mo. LIBOR + 2.50% 111,595
1,156,923 Mallinckrodt International Finance, SA‡ 6.000%, 09/24/24 6 mo. LIBOR + 5.25% 1,127,762
1,340,000 Padagis, LLC‡ 5.250%, 07/06/28 3 mo. LIBOR + 4.75% 1,344,188
PRINCIPAL AMOUNT VALUE
2,634,456 Team Health Holdings, Inc.‡ 3.750%, 02/06/24 1 mo. LIBOR + 2.75% $ 2,556,660 ___________
11,837,246 ___________ Industrials (0.3%)
600,000 ACProducts, Inc.‡ 4.750%, 05/05/28 6 mo. LIBOR + 4.25% 597,048
745,000 Air Canada! 0.000%, 07/28/28 747,175
1,848,420 Berry Global, Inc.‡ 1.850%, 07/01/26 1 mo. LIBOR + 1.75% 1,828,947
1,200,000 BW Gas & Convenience Holdings, LLC‡ 4.000%, 03/17/28 1 mo. LIBOR + 3.50% 1,203,000
1,224,547 Dun & Bradstreet Corp.‡ 3.336%, 02/06/26 1 mo. LIBOR + 3.25% 1,215,742
894,280 Granite Holdings US Acquisition Company‡ 4.147%, 09/30/26 3 mo. LIBOR + 4.00% 894,280
759,229 RegionalCare Hospital Partners Holdings, Inc.‡ 3.842%, 11/16/25 1 mo. LIBOR + 3.75% 753,752
1,915,305 Scientific Games International, Inc.‡ 2.842%, 08/14/24 1 mo. LIBOR + 2.75% 1,889,640
303,037 TransDigm, Inc.‡ 2.342%, 12/09/25 1 mo. LIBOR + 2.25% 298,085 ___________
9,427,669 ___________ Information Technology (0.2%)
750,000 AP Core Holdings II, LLC! 0.000%, 07/21/27 747,660
1,238,412 Banff Merger Sub, Inc.‡ 3.842%, 10/02/25 1 mo. LIBOR + 3.75% 1,229,675
1,433,175 Camelot U.S. Acquisition 1 Co.‡ 3.092%, 10/30/26 1 mo. LIBOR + 3.00% 1,421,172
800,975 Camelot U.S. Acquisition 1 Co.‡ 4.000%, 10/30/26 1 mo. LIBOR + 3.00% 801,852
1,296,141 VFH Parent LLC‡ 3.085%, 03/01/26 1 mo. LIBOR + 3.00% 1,288,501 ___________
5,488,860 ___________ Materials (0.0%)
869,000 Innophos, Inc.‡ 3.592%, 02/07/27 1 mo. LIBOR + 3.50% 868,457 ___________
TOTAL BANK LOANS (Cost $63,804,016) 63,634,491 ___________ ___________

Calamos Strategic Total Return Fund
SCHEDULE OF INVESTMENTS JULY 31, 2021 (UNAUDITED)
See accompanying Notes to Schedule of Investments
12
8/31/2021 11:32 AM
NUMBER OF SHARES VALUE
CONVERTIBLE PREFERRED STOCKS (9.2%) Communication Services (0.8%)
18,160 2020 Cash Mandatory Exchangeable Trust* 5.250%, 06/01/23 $ 22,978,393 ___________
Consumer Discretionary (0.7%) 100,805 Aptiv, PLC
5.500%, 06/15/23 18,927,147 ___________ Energy (0.0%)
27 Gulfport Energy Operating Corp. 10.000%, 08/30/21 15.00% PIK rate 132,975 ___________
Financials (0.8%) 80,250 AMG Capital Trust II
5.150%, 10/15/37 4,720,064 430 Bank of America Corp.µ‡‡
7.250% 636,207 222,280 KKR & Company, Inc.^
6.000%, 09/15/23 18,458,131 2,083 Prospect Capital Corp.
5.350%, 07/01/26 51,304 ___________ 23,865,706 ___________
Health Care (1.5%) 96,145 Avantor, Inc.
6.250%, 05/15/22 11,119,169 90,115 Boston Scientific Corp.µ
5.500%, 06/01/23 11,071,529 9,980 Danaher Corp.µ
4.750%, 04/15/22 19,887,645 ___________ 42,078,343 ___________
Industrials (1.2%) 62,970 Colfax Corp.µ
5.750%, 01/15/22 11,673,379 180,605 Stanley Black & Decker, Inc.^
5.250%, 11/15/22 21,311,390 ___________ 32,984,769 ___________
Information Technology (1.1%) 19,390 Broadcom, Inc.µ
8.000%, 09/30/22 29,944,753 ___________ Utilities (3.1%)
91,020 AES Corp.µ 6.875%, 02/15/24 9,227,608
84,885 CenterPoint Energy, Inc. (Warner Media, LLC, Charter Communications Time, Inc.)µ§**** 4.566%, 09/15/29 5,634,836
170,935 Dominion Energy, Inc. 7.250%, 06/01/22 17,047,348
391,410 DTE Energy Company 6.250%, 11/01/22 20,079,333
142,970 Essential Utilities, Inc. 6.000%, 04/30/22 8,671,130
NextEra Energy, Inc. 382,660 4.872%, 09/01/22 22,488,928
NUMBER OF SHARES VALUE
94,060 6.219%, 09/01/23 $ 4,880,773 ___________ 88,029,956 ___________
TOTAL CONVERTIBLE PREFERRED STOCKS (Cost $202,229,395) 258,942,042 ___________ ___________
COMMON STOCKS (84.6%) Communication Services (9.3%)
34,670 Alphabet, Inc. - Class A^# 93,419,355 10,635 Alphabet, Inc. - Class C^# 28,761,507
264,885 AT&T, Inc.^~ 7,430,024 411,425 Comcast Corp. - Class A^ 24,204,133
8,050 Cumulus Media, Inc. - Class A# 94,909 176,235 Facebook, Inc. - Class A^# 62,792,530
2 Frontier Communications Parent, Inc.# 60
19,165 Lumen Technologies, Inc.^ 238,988 32,360 Netflix, Inc.# 16,748,565
205,085 EUR Orange, SA 2,282,418 149,335 Walt Disney Company# 26,285,947 ___________
262,258,436 ___________ Consumer Discretionary (10.1%)
32,615 Amazon.com, Inc.^# 108,529,348 59,260 Carnival Corp.# 1,282,979
825,570 Ford Motor Company# 11,516,701 243,463 General Motors Company# 13,838,437
94,175 Home Depot, Inc.^ 30,907,293 38,550 Lennar Corp. - Class A 4,053,533 69,245 Lowe's Companies, Inc.^ 13,342,819 62,500 McDonald's Corp. 15,169,375
245,080 MGM Resorts International^ 9,197,852 162,800 NIKE, Inc. - Class B^ 27,270,628
44,300 Royal Caribbean Cruises, Ltd.^# 3,405,341 77,770 Starbucks Corp. 9,443,611 56,455 Target Corp. 14,737,578 14,925 Tesla, Inc.^# 10,256,460
143,900 TJX Companies, Inc.^ 9,901,759 ___________ 282,853,714 ___________
Consumer Staples (5.5%) 58,750 Altria Group, Inc. 2,822,350
459,960 Coca-Cola Company^ 26,231,519 41,820 Costco Wholesale Corp. 17,970,890
250,885 Mondelez International, Inc. - Class A 15,870,985
112,795 PepsiCo, Inc. 17,703,175 147,500 Philip Morris International, Inc.^ 14,763,275 203,745 Procter & Gamble Company^ 28,978,651
86,605 Sysco Corp. 6,426,091 52,650 Walgreens Boots Alliance, Inc. 2,482,448
154,510 Walmart, Inc.^ 22,025,401 ___________ 155,274,785 ___________
Energy (3.5%) 4,679 Bonanza Creek Energy, Inc.^ 180,001
475,000 BP, PLC^ 11,485,500 47,998 Calfrac Well Services, Ltd.# 138,714 11,045 Chaparral Energy, Inc. - Class A# 419,710
3,547 Chesapeake Energy Corp. 191,715 237,650 Chevron Corp.^ 24,195,147
5,556 Denbury, Inc.# 365,085 22,502 Diamond Offshore Drilling, Inc.# 133,324

Calamos Strategic Total Return Fund
SCHEDULE OF INVESTMENTS JULY 31, 2021 (UNAUDITED)
See accompanying Notes to Schedule of Investments
13 8/31/2021 11:32 AM
NUMBER OF SHARES VALUE
52,035 Energy Transfer, LP $ 513,065 56,355 Enterprise Products Partners, LP 1,271,932
7,920 EP Energy Corp.&# 784,080 431,180 Exxon Mobil Corp. 24,823,033
7,987 Gulfport Energy Operating Corp.# 545,512 126,365 Hess Corp. 9,659,341 232,940 Kinder Morgan, Inc. 4,048,497
67,538 Lonestar Resources US, Inc.# 665,249 15,860 Magellan Midstream Partners, LP 739,076
100,220 Marathon Petroleum Corp. 5,534,149 2,737 Oasis Petroleum, Inc. 251,010
26,500 Pioneer Natural Resources Company 3,852,305
156,200 Schlumberger, NV 4,503,246 17,747 Superior Energy Services, Inc.# 692,133 26,500 Targa Resources Corp. 1,115,915 33,540 Valero Energy Corp. 2,246,174 18,259 Weatherford International, PLC# 318,437
4,278 Whiting Petroleum Corp.# 200,638 10,000 Williams Companies, Inc.^ 250,500 ___________
99,123,488 ___________ Financials (10.4%)
35,430 Affiliated Managers Group, Inc.^ 5,613,529 65,730 American Express Company 11,208,937
346,890 American International Group, Inc. 16,425,241 29,983 Assurant, Inc. 4,731,617
1,019,405 Bank of America Corp.~ 39,104,376 71,870 Bank of New York Mellon Corp. 3,689,087 10,715 BlackRock, Inc. 9,291,727
132,485 Charles Schwab Corp.^ 9,002,356 46,700 Chubb, Ltd.^~ 7,880,158
344,010 Citigroup, Inc.^ 23,261,956 125,000 Discover Financial Services^ 15,540,000
51,500 Goldman Sachs Group, Inc.^ 19,306,320 33,700 Intercontinental Exchange, Inc. 4,038,271
273,910 JPMorgan Chase & Company 41,574,060 226,225 KeyCorp^ 4,447,584 132,475 Marsh & McLennan Companies,
Inc. 19,502,969 290,930 Morgan Stanley 27,923,461
43,760 Northern Trust Corp. 4,938,316 157,631 Starwood Property Trust, Inc. 4,103,135 150,870 US Bancorp 8,379,320 288,350 Wells Fargo & Company 13,246,799 ___________
293,209,219 ___________ Health Care (10.0%)
139,700 Abbott Laboratories~ 16,900,906 124,675 AbbVie, Inc. 14,499,702
55,690 Agilent Technologies, Inc.^ 8,533,379 18,870 Anthem, Inc. 7,246,269
149,780 Baxter International, Inc. 11,585,483 151,745 Bristol-Myers Squibb Company 10,298,933
26,830 CVS Health Corp. 2,209,719 82,050 Edwards Lifesciences Corp.# 9,211,754
109,850 Eli Lilly & Company 26,748,475 48,980 Gilead Sciences, Inc. 3,344,844 26,400 Humana, Inc.^ 11,242,704 10,420 Intuitive Surgical, Inc.# 10,331,013
176,230 Johnson & Johnson^ 30,346,806 156,340 Medtronic, PLC 20,529,005 251,550 Merck & Company, Inc. 19,336,648 288,990 Pfizer, Inc. 12,371,662
20,295 Stryker Corp. 5,498,727 21,460 Thermo Fisher Scientific, Inc. 11,588,615
NUMBER OF SHARES VALUE
105,000 UnitedHealth Group, Inc.^ $ 43,283,100 26,610 Vertex Pharmaceuticals, Inc.# 5,364,044 ___________
280,471,788 ___________ Industrials (6.1%)
546,335 Carrier Global Corp. 30,185,009 967,920 CSX Corp.^ 31,283,174
14,820 FedEx Corp. 4,148,859 836,550 General Electric Company 10,833,323 104,790 Honeywell International, Inc.^ 24,498,854
92,435 JB Hunt Transport Services, Inc. 15,570,676 191,469 McDermott International, Inc.# 63,376
37,050 Northrop Grumman Corp. 13,449,891 334,130 Raytheon Technologies Corp.^ 29,052,603
49,810 Union Pacific Corp. 10,896,436 ___________ 169,982,201 ___________
Information Technology (25.8%) 56,335 Accenture, PLC - Class A 17,896,503 35,170 Adobe, Inc.# 21,862,727 44,250 Advanced Micro Devices, Inc.^# 4,698,907
1,235,330 Apple, Inc.^~ 180,185,234 322,615 Applied Materials, Inc. 45,143,517 247,515 Cisco Systems, Inc.^ 13,704,906 117,815 Fidelity National Information
Services, Inc. 17,560,326 43,165 Global Payments, Inc. 8,348,543 49,985 Lam Research Corp. 31,860,939
125,850 Marvell Technology, Inc. 7,615,183 72,315 Mastercard, Inc. - Class A 27,909,251
158,425 Micron Technology, Inc.# 12,290,611 593,615 Microsoft Corp.^~ 169,126,850
1,520,000 Nokia Oyj^# 9,241,600 221,780 NVIDIA Corp. 43,244,882
27,590 PayPal Holdings, Inc.# 7,601,873 66,010 QUALCOMM, Inc. 9,888,298 86,580 salesforce.com, Inc.# 20,946,299 21,845 ServiceNow, Inc.# 12,842,457 44,000 Skyworks Solutions, Inc. 8,118,440 85,550 Taiwan Semiconductor
Manufacturing Company, Ltd. (ADR) 9,978,552
178,525 Visa, Inc. - Class A^ 43,986,775 ___________ 724,052,673 ___________
Materials (2.7%) 41,160 Celanese Corp. - Class A~ 6,411,493
410,755 Freeport-McMoRan, Inc. 15,649,766 80,575 Linde, PLC 24,767,949 82,000 Nucor Corp. 8,529,640 96,625 PPG Industries, Inc. 15,800,120 20,585 Vulcan Materials Company^ 3,705,094 ___________
74,864,062 ___________ Real Estate (1.2%)
70,930 American Tower Corp. 20,059,004 76,060 Crown Castle International Corp.^ 14,686,426 ___________
34,745,430 ___________
TOTAL COMMON STOCKS (Cost $1,494,956,320) 2,376,835,796 ___________ ___________
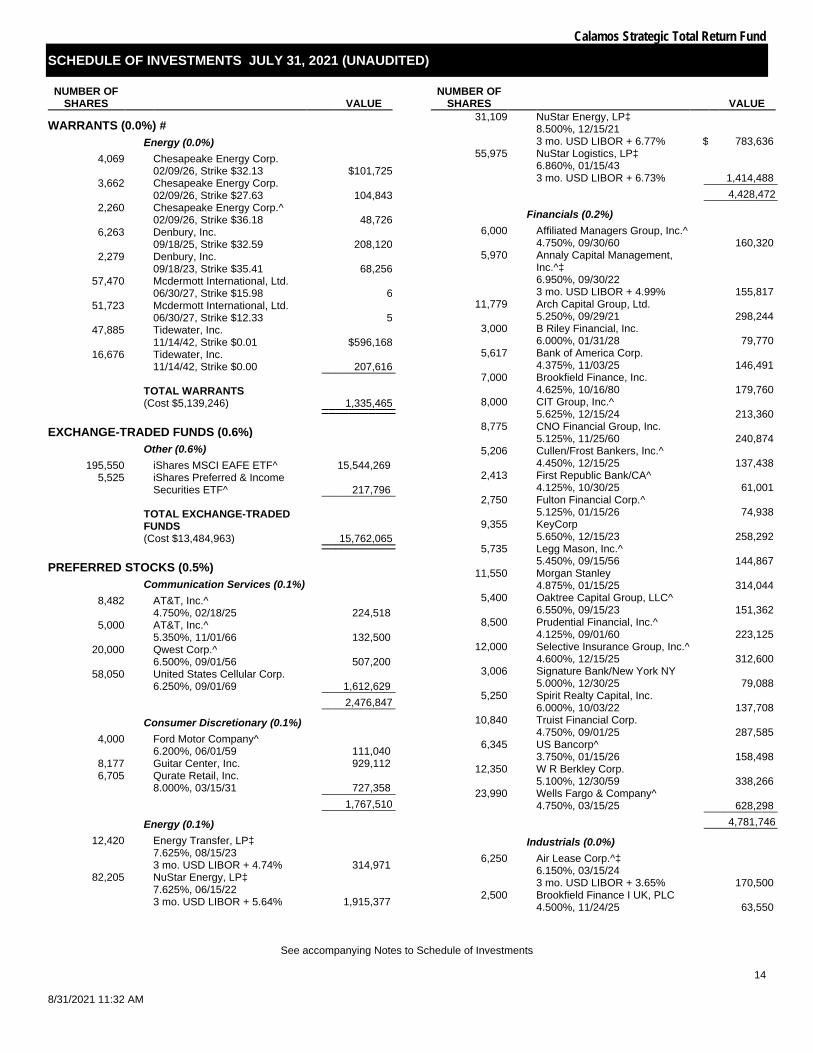
Calamos Strategic Total Return Fund
SCHEDULE OF INVESTMENTS JULY 31, 2021 (UNAUDITED)
See accompanying Notes to Schedule of Investments
14
8/31/2021 11:32 AM
NUMBER OF SHARES VALUE
WARRANTS (0.0%) # Energy (0.0%)
4,069
Chesapeake Energy Corp. 02/09/26, Strike $32.13 $101,725
3,662
Chesapeake Energy Corp. 02/09/26, Strike $27.63 104,843
2,260
Chesapeake Energy Corp.^ 02/09/26, Strike $36.18 48,726
6,263
Denbury, Inc. 09/18/25, Strike $32.59 208,120
2,279
Denbury, Inc. 09/18/23, Strike $35.41 68,256
57,470
Mcdermott International, Ltd. 06/30/27, Strike $15.98 6
51,723
Mcdermott International, Ltd. 06/30/27, Strike $12.33 5
47,885
Tidewater, Inc. 11/14/42, Strike $0.01 $596,168
16,676
Tidewater, Inc. 11/14/42, Strike $0.00 207,616 ___________
TOTAL WARRANTS (Cost $5,139,246) 1,335,465 ___________ ___________
EXCHANGE-TRADED FUNDS (0.6%) Other (0.6%)
195,550 iShares MSCI EAFE ETF^ 15,544,269 5,525 iShares Preferred & Income
Securities ETF^ 217,796 ___________
TOTAL EXCHANGE-TRADED FUNDS (Cost $13,484,963) 15,762,065 ___________ ___________
PREFERRED STOCKS (0.5%) Communication Services (0.1%)
8,482 AT&T, Inc.^ 4.750%, 02/18/25 224,518
5,000 AT&T, Inc.^ 5.350%, 11/01/66 132,500
20,000 Qwest Corp.^ 6.500%, 09/01/56 507,200
58,050 United States Cellular Corp. 6.250%, 09/01/69 1,612,629 ___________
2,476,847 ___________ Consumer Discretionary (0.1%)
4,000 Ford Motor Company^ 6.200%, 06/01/59 111,040
8,177 Guitar Center, Inc. 929,112 6,705 Qurate Retail, Inc.
8.000%, 03/15/31 727,358 ___________ 1,767,510 ___________
Energy (0.1%) 12,420 Energy Transfer, LP‡
7.625%, 08/15/23 3 mo. USD LIBOR + 4.74% 314,971
82,205 NuStar Energy, LP‡ 7.625%, 06/15/22 3 mo. USD LIBOR + 5.64% 1,915,377
NUMBER OF SHARES VALUE
31,109 NuStar Energy, LP‡ 8.500%, 12/15/21 3 mo. USD LIBOR + 6.77% $ 783,636
55,975 NuStar Logistics, LP‡ 6.860%, 01/15/43 3 mo. USD LIBOR + 6.73% 1,414,488 ___________
4,428,472 ___________ Financials (0.2%)
6,000 Affiliated Managers Group, Inc.^ 4.750%, 09/30/60 160,320
5,970 Annaly Capital Management, Inc.^‡ 6.950%, 09/30/22 3 mo. USD LIBOR + 4.99% 155,817
11,779 Arch Capital Group, Ltd. 5.250%, 09/29/21 298,244
3,000 B Riley Financial, Inc. 6.000%, 01/31/28 79,770
5,617 Bank of America Corp. 4.375%, 11/03/25 146,491
7,000 Brookfield Finance, Inc. 4.625%, 10/16/80 179,760
8,000 CIT Group, Inc.^ 5.625%, 12/15/24 213,360
8,775 CNO Financial Group, Inc. 5.125%, 11/25/60 240,874
5,206 Cullen/Frost Bankers, Inc.^ 4.450%, 12/15/25 137,438
2,413 First Republic Bank/CA^ 4.125%, 10/30/25 61,001
2,750 Fulton Financial Corp.^ 5.125%, 01/15/26 74,938
9,355 KeyCorp 5.650%, 12/15/23 258,292
5,735 Legg Mason, Inc.^ 5.450%, 09/15/56 144,867
11,550 Morgan Stanley 4.875%, 01/15/25 314,044
5,400 Oaktree Capital Group, LLC^ 6.550%, 09/15/23 151,362
8,500 Prudential Financial, Inc.^ 4.125%, 09/01/60 223,125
12,000 Selective Insurance Group, Inc.^ 4.600%, 12/15/25 312,600
3,006 Signature Bank/New York NY 5.000%, 12/30/25 79,088
5,250 Spirit Realty Capital, Inc. 6.000%, 10/03/22 137,708
10,840 Truist Financial Corp. 4.750%, 09/01/25 287,585
6,345 US Bancorp^ 3.750%, 01/15/26 158,498
12,350 W R Berkley Corp. 5.100%, 12/30/59 338,266
23,990 Wells Fargo & Company^ 4.750%, 03/15/25 628,298 ___________
4,781,746 ___________ Industrials (0.0%)
6,250 Air Lease Corp.^‡ 6.150%, 03/15/24 3 mo. USD LIBOR + 3.65% 170,500
2,500 Brookfield Finance I UK, PLC 4.500%, 11/24/25 63,550

Calamos Strategic Total Return Fund
SCHEDULE OF INVESTMENTS JULY 31, 2021 (UNAUDITED)
See accompanying Notes to Schedule of Investments
15 8/31/2021 11:32 AM
NUMBER OF SHARES VALUE
3,750 QVC, Inc. 6.250%, 11/26/68 $ 98,400
2,555 WESCO International, Inc.‡ 10.625%, 06/22/25 5 year CMT + 10.33% 79,333 ___________
411,783 ___________ Real Estate (0.0%)
5,180 American Homes 4 Rent^ 6.250%, 09/19/23 143,745
7,275 Brookfield Property Partners, LP 5.750%, 03/31/25 178,165
5,000 Brookfield Property Partners, LP 6.375%, 09/30/24 127,150
5,400 EPR Properties 5.750%, 11/30/22 138,024
5,710 Global Net Lease, Inc. 6.875%, 11/26/24 153,256
11,000 Kimco Realty Corp.^ 5.250%, 12/20/22 295,790
3,880 Public Storage^ 4.625%, 06/17/25 108,019 ___________
1,144,149 ___________ Utilities (0.0%)
5,000 Algonquin Power & Utilities Corp.‡ 6.875%, 10/17/78 3 mo. USD LIBOR + 3.68% 139,000
6,000 Brookfield Renewable Partners, LP 5.250%, 03/31/25 157,020
5,100 DTE Energy Company 5.250%, 12/01/77 134,946 ___________
430,966 ___________
TOTAL PREFERRED STOCKS (Cost $14,933,760) 15,441,473 ___________ ___________
NUMBER OF CONTRACTS/
NOTIONAL AMOUNT VALUE
PURCHASED OPTIONS (0.2%) # Consumer Discretionary (0.0%)
Tesla, Inc. 160
10,995,200
Call, 01/21/22, Strike $750.00 1,197,200 150
10,308,000
Call, 09/17/21, Strike $850.00 102,375 ___________ 1,299,575 ___________
Other (0.2%) 155
68,126,530 S&P 500 Index
Put, 09/30/21, Strike $4,000.00 561,100 S&P 500 Index
150 65,928,900
Put, 12/31/21, Strike $4,050.00 1,615,500
135 59,336,010
Put, 12/31/21, Strike $4,300.00 2,224,800 ___________
4,401,400 ___________
TOTAL PURCHASED OPTIONS (Cost $9,027,269) 5,700,975 ___________ ___________
VALUE
TOTAL INVESTMENTS (134.9%) (Cost $2,741,335,096) $ 3,790,568,999 ___________ ___________
MANDATORY REDEEMABLE PREFERRED SHARES, AT LIQUIDATION VALUE (-8.6%) (242,000,000) ___________
LIABILITIES, LESS OTHER ASSETS (-26.3%) (738,193,007) ___________
NET ASSETS (100.0%) $ 2,810,375,992 ___________ ___________
NUMBER OF CONTRACTS/
NOTIONAL AMOUNT VALUE
WRITTEN OPTIONS (0.0%) # Consumer Discretionary (0.0%)
Tesla, Inc. 160
10,995,200 Put, 01/21/22, Strike $500.00 (452,400) 150
10,308,000 Put, 09/17/21, Strike $600.00 (252,750) ___________ (705,150) ___________
Information Technology (0.0%) 450
12,398,850 Paypal Holdings, Inc.
Put, 09/17/21, Strike $270.00 (402,750) ___________
TOTAL WRITTEN OPTIONS (Premium $1,483,905) (1,107,900) ___________ ___________
NOTES TO SCHEDULE OF INVESTMENTS *
Securities issued and sold pursuant to a Rule 144A transaction are excepted from the registration requirement of the Securities Act of 1933, as amended. These securities may only be sold to qualified institutional buyers (“QIBs”), such as the Fund. Any resale of these securities must generally be effected through a sale that is registered under the Act or otherwise exempted from such registration requirements.
µ
Security, or portion of security, is held in a segregated account as collateral for note payable aggregating a total value of $148,436,821.
^ Security, or portion of security, is on loan. @ In default status and considered non-income producing. ‡
Variable rate security. The rate shown is the rate in effect at July 31, 2021.
& Illiquid security. ~
Security, or portion of security, is segregated as collateral (or potential collateral for future transactions) for written options. The aggregate value of such securities is $11,537,794.
¡
Bank loans generally are subject to mandatory and/or optional prepayment. As a result, the actual remaining maturity of bank loans may be substantially less than the stated maturities shown.
!
This position represents an unsettled loan commitment at period end. Certain details associated with this purchase are not known prior to the settlement date, including coupon rate, which will be adjusted on settlement date.
‡‡ Perpetual maturity. §
Securities exchangeable or convertible into securities of one or more entities that are different than the issuer. Each entity is identified in the parenthetical.

Calamos Strategic Total Return Fund
SCHEDULE OF INVESTMENTS JULY 31, 2021 (UNAUDITED)
See accompanying Notes to Schedule of Investments
16
8/31/2021 11:32 AM
**
Step coupon security. Coupon changes periodically based upon a predetermined schedule. The rate shown is the rate in effect at July 31, 2021.
# Non-income producing security.
FOREIGN CURRENCY ABBREVIATION EUR European Monetary Unit Note: The date on options represents the expiration date of the option contract. The option contract may be exercised at any date on or before the date shown.

Note 1 – Organization and Significant Accounting Policies Organization. Calamos Strategic Total Return Fund (the “Fund”) was organized as a Delaware statutory trust on December 31, 2003 and is registered under the Investment Company Act of 1940 (the “1940 Act”) as a diversified, closed-end management investment company. The Fund commenced operations on March 26, 2004. Significant Accounting Policies. The Schedule of Investments has been prepared in conformity with accounting principles generally accepted in the United States of America (U.S. GAAP). The Fund is considered an investment company under U.S. GAAP and follows the accounting and reporting guidance applicable to investment companies. The following summarizes the significant accounting policies of the Fund: In March 2017, the Financial Accounting Standards Board ("FASB") issued ASU No. 2017-08, Receivables – Nonrefundable Fees and Other Costs (Subtopic 310-20): Premium Amortization on Purchased Callable Debt Securities ("ASU 2017-08"). ASU 2017-08 shortens the amortization period for certain callable debt securities held at a premium. The Fund adopted ASU2017-08 as of November 1, 2019, with no material impact on the Fund's Schedule of Investments. Fund Valuation. The valuation of the Fund's investments is in accordance with policies and procedures adopted by and under the ultimate supervision of the board of trustees.
Fund securities that are traded on U.S. securities exchanges, except option securities, are valued at the official closing price, which is the last current reported sales price on its principal exchange at the time each Fund determines its net asset value (“NAV”). Securities traded in the over-the-counter market and quoted on The NASDAQ Stock Market are valued at the NASDAQ Official Closing Price, as determined by NASDAQ, or lacking a NASDAQ Official Closing Price, the last current reported sale price on NASDAQ at the time the Fund determines its NAV. When a last sale or closing price is not available, equity securities, other than option securities, that are traded on a U.S. securities exchange and other equity securities traded in the over-the-counter market are valued at the mean between the most recent bid and asked quotations on its principal exchange in accordance with guidelines adopted by the board of trustees. Each option security traded on a U.S. securities exchange is valued at the mid-point of the consolidated bid/ask quote for the option security, also in accordance with guidelines adopted by the board of trustees. Each over-the-counter option that is not traded through the Options Clearing Corporation is valued either by an independent pricing agent approved by the board of trustees or based on a quotation provided by the counterparty to such option under the ultimate supervision of the board of trustees.
Fixed income securities, bank loans, certain convertible preferred securities, and non-exchange traded derivatives are normally valued by independent pricing services or by dealers or brokers who make markets in such securities. Valuations of such fixed income securities, bank loans, certain convertible preferred securities, and non-exchange traded derivatives consider yield or price of equivalent securities of comparable quality, coupon rate, maturity, type of issue, trading characteristics and other market data and do not rely exclusively upon exchange or over-the-counter prices.
Trading on European and Far Eastern exchanges and over-the-counter markets is typically completed at various times before the close of business on each day on which the New York Stock Exchange (“NYSE”) is open. Each security trading on these exchanges or in over-the-counter markets may be valued utilizing a systematic fair valuation model provided by an independent pricing service approved by the board of trustees. The valuation of each security that meets certain criteria in relation to the valuation model is systematically adjusted to reflect the impact of movement in the U.S. market after the foreign markets close. Securities that do not meet the criteria, or that are principally traded in other foreign markets, are valued as of the last reported sale price at the time the Fund determines its NAV, or when reliable market prices or quotations are not readily available, at the mean between the most recent bid and asked quotations as of the close of the appropriate exchange or other designated time. Trading of foreign securities may not take place on every NYSE business day. In addition, trading may take place in various foreign markets on Saturdays or on other days when the NYSE is not open and on which the Fund's NAV is not calculated.
If the pricing committee determines that the valuation of a security in accordance with the methods described above is not reflective of a fair value for such security, the security is valued at a fair value by the pricing committee, under the ultimate supervision of the board of trustees, following the guidelines and/or procedures adopted by the board of trustees.
The Fund also may use fair value pricing, pursuant to guidelines adopted by the board of trustees and under the ultimate supervision of the board of trustees, if trading in the security is halted or if the value of a security it holds is materially affected by events occurring before the Fund's pricing time but after the close of the primary market or exchange on which the security is listed. Those procedures may utilize valuations furnished by pricing services approved by the board of trustees, which may be based on market transactions for comparable securities and various relationships between securities that are generally recognized by institutional traders, a computerized matrix system, or appraisals derived from information concerning the securities or similar securities received from recognized dealers in those securities.
When fair value pricing of securities is employed, the prices of securities used by a Fund to calculate its NAV may differ from market quotations or official closing prices. There can be no assurance that the Fund could purchase or sell a portfolio security at the price used to calculate the Fund’s net asset value (“NAV”). Foreign Currency Translation. Values of investments and other assets and liabilities denominated in foreign currencies are translated into U.S. dollars using a rate quoted by a major bank or dealer in the particular currency market, as reported by a recognized quotation dissemination service. Option Transactions. For hedging and investment purposes, the Fund may purchase or write (sell) put and call options. One of the risks associated with purchasing an option is that the Fund pays a premium whether or not the option is exercised. Additionally, the Fund bears the risk of loss of premium and change in value should the counterparty not perform under the contract. The Fund as writer of an option bears the market risk of an unfavorable change in the price of the security underlying the written option. Note 2 – Investments The cost basis of investments for federal income tax purposes at July 31, 2021 was as follows*: Cost basis of investments $2,739,851,191 Gross unrealized appreciation 1,197,021,779
Gross unrealized depreciation (147,411,871) Net unrealized appreciation (depreciation) $1,049,609,908
* Because tax adjustments are calculated annually, the above table does not reflect tax adjustments. For the previous fiscal year’s federal income tax information, please refer to the Notes to Financial Statements section in the Fund's most recent semi-annual or annual report. Note 3 – Mandatory Redeemable Preferred Shares On September 6, 2017, the Fund issued 9,680,000 mandatory redeemable preferred shares (“MRPS”) with an aggregate liquidation preference of $242.0 million. Offering costs incurred by the Fund in connection with the MRPS issuance are aggregated with the outstanding liability and are being amortized to Interest expense and amortization of offering costs on Mandatory Redeemable Preferred Shares over the respective life of each series of MRPS and shown in the Statement of Operations. The MRPS are divided into three series with different mandatory redemption dates and dividend rates. The table below summarizes the key terms of each series of the MRPS at July 31, 2021.
Series Term
Redemption Date Dividend Rate Shares (000’s) Liquidation Preference Per Share Aggregate Liquidation Preference Series A 9/06/22 3.70% 3,220 $25 $80,500,000 Series B 9/06/24 4.00% 3,220 $25 $80,500,000 Series C 9/06/27 4.24% 3,240 $25 $81,000,000
Total $242,000,000 The MRPS are not listed on any exchange or automated quotation system. The MRPS are considered debt of the issuer; therefore, the liquidation preference, which approximates fair value of the MRPS, is recorded as a liability in the Statement of Assets and Liabilities net of deferred offering costs. The MRPS are categorized as Level 2 within the fair value hierarchy. Previously, the MRPS had been assigned a rating of “AA” by Fitch Ratings, Inc. (“Fitch”). As of December 17, 2020, Kroll Bond Rating Agency LLC (“Kroll”) replaced Fitch as the rating agency for the MRPS. The MRPS have been assigned a rating of `AA-' by Kroll. If the ratings of the MRPS are downgraded, the Fund's dividend expense may increase, as described below. Holders of MRPS are entitled to receive monthly cumulative cash dividends payable on the first business day of each month. The MRPS currently are rated “AA-” by Kroll. If on the first day of a monthly dividend period the MRPS of any class are rated lower than “A” by Fitch (or lower than the equivalent of such rating by any other rating agency providing a rating pursuant to the request of the Fund, such as Kroll), the dividend rate for such period shall be increased by 0.5%, 2.0% or 4.0% according to an agreed upon schedule. The MRPS’ dividend rate is also subject to increase during periods when the Fund has not made timely payments to MRPS holders and/or the MRPS do not have a current credit rating, subject to various terms and conditions. Dividends accrued and paid to the shareholders of MRPS are included in "Interest expense and amortization of offering costs on Mandatory Redeemable Preferred Shares" within the Statement of Operations. The MRPS rank junior to the Fund’s borrowings under the SSB Agreement and senior to the Fund’s outstanding common stock. The Fund may, at its option, subject to various terms and conditions, redeem the MRPS, in whole or in part, at the liquidation preference amount plus all accumulated but unpaid dividends, plus a make whole premium equal to the discounted value of the remaining scheduled payments. Each class of MRPS is subject to mandatory redemption on the term redemption date specified in the table above. Periodically, the Fund is subject to an overcollateralization test based on applicable rating agency criteria (the “OC Test”) and an asset coverage test with respect to its outstanding senior securities (the “AC Test”). The Fund may be required to redeem MRPS before their term redemption date if it does not comply with one or both tests. So long as any MRPS are outstanding, the Fund may not declare, pay or set aside for payment cash dividends or other distributions on shares of its common stock unless (1) the Fund has satisfied the OC Test on at least one testing date in the preceding 65 days, (2) immediately after such transaction, the Fund would comply with the AC Test, (3) full cumulative dividends on the MRPS due on or prior to the date of such transaction have been declared and paid and (4) the Fund has redeemed all MRPS required to have been redeemed on such date or has deposited funds sufficient for such redemption, subject to certain grace periods and exceptions. Except as otherwise required pursuant to the Fund’s governing documents or applicable law, the holders of the MRPS have one vote per share and vote together with the holders of common stock of the Fund as a single class except on matters affecting only the holders of MRPS or the holders of common stock. Pursuant to the 1940 Act, holders of the MRPS have the right to elect at least two trustees of the Fund, voting separately as a class. Except during any time when the Fund has failed to make a dividend or redemption payment in respect of MRPS outstanding, the holders of MRPS have agreed to vote in accordance with the recommendation of the board of trustees on any matter submitted to them for their vote or to the vote of shareholders of the Fund generally.
Calamos Global Total Return Fund SCHEDULE OF INVESTMENTS JULY 31, 2021 (UNAUDITED)
See accompanying Notes to Schedule of Investments
1 8/31/2021 2:09 PM
PRINCIPAL AMOUNT VALUE
CORPORATE BONDS (12.4%) Airlines (0.3%)
82,001 Air Canada Pass Through Trust Series 2015-1, Class B*µ 3.875%, 09/15/24 $ 83,107
13,333 Air Canada Pass Through Trust Series 2015-2, Class B* 5.000%, 06/15/25 13,532
52,844 Alaska Airlines Pass Through Trust Series 2020-1, Class A* 4.800%, 02/15/29 58,629
42,492 Alaska Airlines Pass Through Trust Series 2020-1, Class B*µ 8.000%, 02/15/27 47,513
American Airlines, Inc. / AAdvantage Loyalty IP, Ltd.*
33,000 5.500%, 04/20/26 34,563 11,000 5.750%, 04/20/29 11,905 50,000 British Airways Pass Through
Trust Series 2021-1, Class B* 3.900%, 03/15/33 50,788
37,913 JetBlue Pass Through Trust Series 2020-1, Class B 7.750%, 05/15/30 44,872
23,800 Spirit Loyalty Cayman, Ltd. / Spirit IP Cayman, Ltd.* 8.000%, 09/20/25 26,850
18,088 UAL Pass Through Trust Series 2007-1 6.636%, 01/02/24 18,730
39,191 United Airlines Pass Through Trust Series 2014-2, Class B 4.625%, 03/03/24 40,145
25,978 United Airlines Pass Through Trust Series 2019-2, Class B 3.500%, 11/01/29 25,754 ___________
456,388 ___________ Communication Services (1.4%)
75,000 Arrow Bidco, LLC* 9.500%, 03/15/24 76,999
33,000 Beasley Mezzanine Holdings, LLC* 8.625%, 02/01/26 33,525
30,000 Brink's Company* 5.500%, 07/15/25 31,626
95,000 Cincinnati Bell, Inc.* 8.000%, 10/15/25 99,930
60,000 CommScope, Inc.* 5.500%, 03/01/24 61,818
50,000 Consolidated Communications, Inc.* 6.500%, 10/01/28 54,054
200,000 CSC Holdings, LLC* 5.500%, 04/15/27 209,420
46,000 Cumulus Media New Holdings, Inc.*^ 6.750%, 07/01/26 48,475
Diamond Sports Group, LLC / Diamond Sports Finance Company*
45,000 6.625%, 08/15/27 18,092 27,000 5.375%, 08/15/26 15,709
PRINCIPAL AMOUNT VALUE
5,000 DIRECTV Holdings, LLC / DIRECTV Financing Company, Inc.* 5.875%, 08/15/27 $ 5,174
150,000 Embarq Corp. 7.995%, 06/01/36 168,277
Entercom Media Corp.*^ 32,000 6.500%, 05/01/27 32,996 22,000 6.750%, 03/31/29 22,474 25,000 Frontier Florida, LLC&
6.860%, 02/01/28 27,418 65,000 Frontier North, Inc.@
6.730%, 02/15/28 70,756
Go Daddy Operating Company, LLC / GD Finance Company, Inc.*
40,000 3.500%, 03/01/29 40,077 13,000 5.250%, 12/01/27 13,665 15,000 Hughes Satellite Systems Corp.
5.250%, 08/01/26 16,808 60,000 iHeartCommunications, Inc.*
5.250%, 08/15/27 62,605 Intelsat Jackson Holdings, SA@
30,000 9.750%, 07/15/25* 16,976 25,000 5.500%, 08/01/23 13,799 27,833 Ligado Networks, LLC*
15.500%, 11/01/23 15.500% PIK rate 27,567
60,000 Lumen Technologies, Inc.* 4.000%, 02/15/27 61,772
Netflix, Inc. 40,000 4.875%, 06/15/30* 48,268 25,000 4.875%, 04/15/28^ 29,252
Scripps Escrow II, Inc.* 23,000 3.875%, 01/15/29 23,032 11,000 5.375%, 01/15/31^ 11,009 61,000 Scripps Escrow, Inc.*
5.875%, 07/15/27 63,197 23,000 Shift4 Payments, LLC / Shift4
Payments Finance Sub, Inc.*^ 4.625%, 11/01/26 23,984
Sirius XM Radio, Inc.* 65,000 5.500%, 07/01/29^ 71,298 65,000 4.625%, 07/15/24^ 66,787 33,000 4.000%, 07/15/28 34,056 30,000 Spanish Broadcasting System,
Inc.* 9.750%, 03/01/26 30,616
80,000 Sprint Capital Corp.^ 6.875%, 11/15/28 103,294
110,000 Sprint Corp. 7.125%, 06/15/24 126,678
35,000 Telecom Italia Capital, SA 6.000%, 09/30/34 40,259
60,000 United States Cellular Corp. 6.700%, 12/15/33 74,745
19,000 Windstream Services, LLC / Windstream Finance Corp.@& 7.750%, 10/01/21 204 ___________
1,976,691 ___________ Consumer Discretionary (1.8%)
46,000 American Axle & Manufacturing, Inc.^ 6.875%, 07/01/28 49,859

Calamos Global Total Return Fund
SCHEDULE OF INVESTMENTS JULY 31, 2021 (UNAUDITED)
See accompanying Notes to Schedule of Investments
2
8/31/2021 2:09 PM
PRINCIPAL AMOUNT VALUE
Ashton Woods USA, LLC / Ashton Woods Finance Company*
39,000 6.625%, 01/15/28 $ 41,643 27,000 4.625%, 08/01/29 27,095 13,000 Avis Budget Car Rental, LLC /
Avis Budget Finance, Inc.*^ 5.375%, 03/01/29 13,558
65,000 Bally's Corp.* 6.750%, 06/01/27 70,322
Caesars Entertainment, Inc.* 21,000 8.125%, 07/01/27 23,139 21,000 6.250%, 07/01/25 22,195 80,000 Caesars Resort Collection, LLC /
CRC Finco, Inc.*^ 5.250%, 10/15/25 80,675
Carnival Corp.* 21,000 10.500%, 02/01/26^ 24,078 11,000 7.625%, 03/01/26 11,677 50,000 Carriage Services, Inc.*
4.250%, 05/15/29 50,042 30,000 Carvana Company*
5.625%, 10/01/25 31,183
CCO Holdings, LLC / CCO Holdings Capital Corp.*
155,000 5.125%, 05/01/27 162,355 50,000 4.750%, 03/01/30 53,067 32,000 5.750%, 02/15/26 33,101 21,000 4.250%, 02/01/31 21,671 20,000 5.000%, 02/01/28^ 20,990 39,000 Cedar Fair, LP^
5.250%, 07/15/29 39,732 Century Communities, Inc.
65,000 6.750%, 06/01/27 69,544 58,000 5.875%, 07/15/25 59,965
DISH DBS Corp. 41,000 7.750%, 07/01/26 46,871 30,000 7.375%, 07/01/28^ 32,496 32,000 Everi Holdings, Inc.*
5.000%, 07/15/29 32,756 30,000 Ford Motor Company
8.500%, 04/21/23 33,355 200,000 Ford Motor Credit Company, LLC
2.900%, 02/16/28 200,750 goeasy, Ltd.*
75,000 5.375%, 12/01/24 77,872 40,000 4.375%, 05/01/26 41,266 22,000 Goodyear Tire & Rubber
Company*^ 5.000%, 07/15/29 23,199
23,000 Guitar Center, Inc.*& 8.500%, 01/15/26 24,591
L Brands, Inc. 57,000 6.694%, 01/15/27 67,731 34,000 6.875%, 11/01/35 43,774 25,000 Liberty Interactive, LLC
8.500%, 07/15/29 28,708 Life Time, Inc.*
50,000 5.750%, 01/15/26 50,894 33,000 8.000%, 04/15/26^ 34,594
M/I Homes, Inc. 60,000 5.625%, 08/01/25 61,790 40,000 4.950%, 02/01/28 42,204
Macy's Retail Holdings, LLC 20,000 6.700%, 07/15/34* 21,283 10,000 5.125%, 01/15/42 9,159 21,000 Macy's, Inc.*
8.375%, 06/15/25 22,912
PRINCIPAL AMOUNT VALUE
Mattel, Inc.* 65,000 5.875%, 12/15/27 $ 71,191
6,000 3.750%, 04/01/29^ 6,334 75,000 Meritage Homes Corp.
6.000%, 06/01/25 85,366 50,000 Midwest Gaming Borrower, LLC /
Midwest Gaming Finance Corp.* 4.875%, 05/01/29 50,460
33,000 Mohegan Gaming & Entertainment* 8.000%, 02/01/26 34,373
49,000 Newell Brands, Inc.^ 4.700%, 04/01/26 54,655
22,000 Penn National Gaming, Inc.*^ 4.125%, 07/01/29 21,696
111,000 Rite Aid Corp.* 8.000%, 11/15/26 111,558
Royal Caribbean Cruises, Ltd.* 25,000 11.500%, 06/01/25 28,644 13,000 10.875%, 06/01/23 14,777 53,000 Simmons Foods, Inc. / Simmons
Prepared Foods, Inc. / Simmons Pet Food, Inc. / Simmons Feed*^ 4.625%, 03/01/29 53,667
65,000 Speedway Motorsports, LLC / Speedway Funding II, Inc.* 4.875%, 11/01/27 66,505
39,000 Taylor Morrison Communities, Inc.* 5.750%, 01/15/28 44,155
13,000 Viking Cruises, Ltd.* 13.000%, 05/15/25 15,089
50,000 Vista Outdoor, Inc.* 4.500%, 03/15/29 51,043
45,000 VOC Escrow, Ltd.* 5.000%, 02/15/28 44,704
11,000 Williams Scotsman International, Inc.* 4.625%, 08/15/28 11,384 ___________
2,567,697 ___________ Consumer Staples (0.6%)
51,000 Central Garden & Pet Company* 4.125%, 04/30/31 52,176
Edgewell Personal Care Company*
33,000 4.125%, 04/01/29 33,234 23,000 5.500%, 06/01/28 24,376 49,000 Energizer Holdings, Inc.*
4.375%, 03/31/29 49,286 25,000 Fresh Market, Inc.*
9.750%, 05/01/23 25,772 50,000 JBS USA LUX, SA / JBS USA
Finance, Inc.* 6.750%, 02/15/28 55,021
19,000 JBS USA LUX, SA / JBS USA Food Company / JBS USA Finance, Inc.* 6.500%, 04/15/29 21,423
Kraft Heinz Foods Company 65,000 4.375%, 06/01/46 74,866 12,000 4.250%, 03/01/31^ 13,835 12,000 3.875%, 05/15/27 13,294 33,000 New Albertsons, LP
7.750%, 06/15/26 37,912
Calamos Global Total Return Fund
SCHEDULE OF INVESTMENTS JULY 31, 2021 (UNAUDITED)
See accompanying Notes to Schedule of Investments
3 8/31/2021 2:09 PM
PRINCIPAL AMOUNT VALUE
43,000 Performance Food Group, Inc.* 4.250%, 08/01/29 $ 43,761
75,000 Pilgrim's Pride Corp.* 5.875%, 09/30/27 80,298
Post Holdings, Inc.* 60,000 5.750%, 03/01/27 62,580 32,000 4.625%, 04/15/30^ 32,632 42,000 Prestige Brands, Inc.*
3.750%, 04/01/31 41,699 50,000 United Natural Foods, Inc.*^
6.750%, 10/15/28 54,067 Vector Group, Ltd.*
70,000 5.750%, 02/01/29 71,334 28,000 10.500%, 11/01/26 29,796 ___________
817,362 ___________ Energy (1.2%)
Antero Resources Corp.* 16,000 7.625%, 02/01/29 17,539 11,000 5.375%, 03/01/30^ 11,202
Apache Corp. 45,000 5.100%, 09/01/40^ 48,314 26,000 4.875%, 11/15/27 28,004 23,000 4.625%, 11/15/25 24,750
Buckeye Partners, LP 40,000 3.950%, 12/01/26 40,667 25,000 5.850%, 11/15/43 25,449 32,000 ChampionX Corp.
6.375%, 05/01/26 33,520 Cheniere Energy Partners, LP
50,000 5.625%, 10/01/26 51,713 10,000 4.000%, 03/01/31* 10,587 23,000 Cheniere Energy, Inc.
4.625%, 10/15/28 24,306 Continental Resources, Inc.^
45,000 3.800%, 06/01/24 47,253 35,000 4.375%, 01/15/28 39,122 80,000 DCP Midstream Operating, LP*‡
5.850%, 05/21/43 3 mo. USD LIBOR + 3.85% 75,290
349 Diamond Foreign Asset Company / Diamond Finance, LLC 13.000%, 04/22/27 13.000% PIK rate 350
22,000 DT Midstream, Inc.* 4.125%, 06/15/29 22,581
Energy Transfer, LP‡ 65,000 3.143%, 11/01/66
3 mo. USD LIBOR + 3.02% 53,643 32,000 6.500%, 11/15/26
5 year CMT + 5.69% 32,776 EnLink Midstream Partners, LP
60,000 6.000%, 12/15/22‡ 3 mo. USD LIBOR + 4.11% 46,478
50,000 4.850%, 07/15/26 52,337 EQT Corp.
28,000 7.500%, 02/01/30 36,814 20,000 6.625%, 02/01/25 23,135 12,000 5.000%, 01/15/29 13,574 43,000 Genesis Energy, LP / Genesis
Energy Finance Corp. 6.250%, 05/15/26 42,503
Gulfport Energy Operating Corp. 45,000 6.375%, 05/15/25@ 1,913 13,167 8.000%, 05/17/26^ 14,105
PRINCIPAL AMOUNT VALUE
Laredo Petroleum, Inc. 42,000 10.125%, 01/15/28 $ 44,515 10,000 7.750%, 07/31/29* 9,685 50,000 Magnolia Oil & Gas Operating,
LLC / Magnolia Oil & Gas Finance Corp.*^ 6.000%, 08/01/26 51,270
Moss Creek Resources Holdings, Inc.*
25,000 10.500%, 05/15/27 24,029 25,000 7.500%, 01/15/26 22,644 22,000 Murphy Oil Corp.
6.375%, 07/15/28 23,304 New Fortress Energy, Inc.*
22,000 6.500%, 09/30/26 22,262 20,000 6.750%, 09/15/25 20,428 25,000 Nine Energy Service, Inc.*
8.750%, 11/01/23 15,054 10,000 Oasis Midstream Partners, LP /
OMP Finance Corp.* 8.000%, 04/01/29 10,464
Occidental Petroleum Corp. 135,000 4.300%, 08/15/39 134,028
98,000 2.900%, 08/15/24 98,806 22,000 5.875%, 09/01/25^ 24,408 15,000 Ovintiv, Inc.^
6.500%, 08/15/34 20,039 69,000 Par Petroleum, LLC / Par
Petroleum Finance Corp.* 7.750%, 12/15/25 68,562
40,000 Parkland Corp. / Canada* 5.875%, 07/15/27 42,698
50,000 Plains All American Pipeline, LP‡ 6.125%, 11/15/22 3 mo. USD LIBOR + 4.11% 44,838
16,000 Range Resources Corp.* 8.250%, 01/15/29 17,736
27,000 Transocean, Inc.*^ 11.500%, 01/30/27 26,899
Venture Global Calcasieu Pass, LLC*
10,000 4.125%, 08/15/31 10,316 10,000 3.875%, 08/15/29 10,223 22,000 Vine Energy Holdings, LLC*
6.750%, 04/15/29 22,995 25,000 Viper Energy Partners, LP*
5.375%, 11/01/27 26,232 40,000 W&T Offshore, Inc.*
9.750%, 11/01/23 38,525 23,000 Weatherford International, Ltd.*
11.000%, 12/01/24 23,831 ___________ 1,671,716 ___________
Financials (2.3%)
Acrisure, LLC / Acrisure Finance, Inc.*
131,000 7.000%, 11/15/25^ 133,309 64,000 6.000%, 08/01/29 64,048 32,000 Aethon United BR, LP / Aethon
United Finance Corp.* 8.250%, 02/15/26 34,284
48,000 AG Issuer, LLC* 6.250%, 03/01/28 50,482
110,000 Alliant Holdings Intermediate, LLC / Alliant Holdings Co-Issuer* 6.750%, 10/15/27 115,045
Calamos Global Total Return Fund
SCHEDULE OF INVESTMENTS JULY 31, 2021 (UNAUDITED)
See accompanying Notes to Schedule of Investments
4
8/31/2021 2:09 PM
PRINCIPAL AMOUNT VALUE
Ally Financial, Inc. 39,000 4.700%, 05/15/26‡
5 year CMT + 3.87% $ 40,988 35,000 8.000%, 11/01/31 51,027 20,000 4.700%, 05/15/28‡
7 year CMT + 3.48% 20,835 43,000 AmWINS Group, Inc.*
4.875%, 06/30/29 43,914 120,000 AssuredPartners, Inc.*
7.000%, 08/15/25 122,314 48,000 Aviation Capital Group, LLC*
3.500%, 11/01/27 51,125 44,000 BroadStreet Partners, Inc.*
5.875%, 04/15/29 44,856 141,000 Brookfield Property REIT, Inc. /
BPR Cumulus, LLC / BPR Nimbus, LLC / GGSI Sellco LL*^ 5.750%, 05/15/26 146,801
Credit Acceptance Corp.^ 65,000 6.625%, 03/15/26 68,780 52,000 5.125%, 12/31/24* 53,798 15,000 Cushman & Wakefield US
Borrower, LLC* 6.750%, 05/15/28 16,130
65,000 Donnelley Financial Solutions, Inc. 8.250%, 10/15/24 67,419
48,000 Enact Holdings, Inc.*^ 6.500%, 08/15/25 52,125
64,000 Global Net Lease, Inc. / Global Net Lease Operating Partnership, LP* 3.750%, 12/15/27 63,569
84,000 Greystar Real Estate Partners, LLC* 5.750%, 12/01/25 86,111
225,000 HUB International, Ltd.* 7.000%, 05/01/26 233,397
Icahn Enterprises, LP / Icahn Enterprises Finance Corp.
65,000 5.250%, 05/15/27 68,465 31,000 4.375%, 02/01/29 31,420
100,000 ILFC E-Capital Trust II*‡ 3.910%, 12/21/65 3 mo. USD LIBOR + 1.80% 84,685
120,000 Iron Mountain, Inc.* 5.250%, 03/15/28 125,875
Ladder Capital Finance Holdings LLLP / Ladder Capital Finance Corp.*
88,000 5.250%, 10/01/25 89,465 22,000 4.750%, 06/15/29 21,932 51,000 LD Holdings Group, LLC*
6.125%, 04/01/28 50,682 Level 3 Financing, Inc.
45,000 4.250%, 07/01/28* 45,895 35,000 5.375%, 05/01/25 35,820
LPL Holdings, Inc.* 55,000 4.000%, 03/15/29 55,940 16,000 4.375%, 05/15/31 16,423
100,000 MetLife, Inc.^ 6.400%, 12/15/66 128,243
Navient Corp. 95,000 5.000%, 03/15/27 99,129 50,000 4.875%, 03/15/28 50,479
OneMain Finance Corp. 65,000 7.125%, 03/15/26 76,589 41,000 6.875%, 03/15/25 46,609
PRINCIPAL AMOUNT VALUE
Park Intermediate Holdings, LLC / PK Domestic Property, LLC / PK Finance Co-Issuer*
27,000 7.500%, 06/01/25 $ 29,285 23,000 5.875%, 10/01/28 24,554 26,000 PHH Mortgage Corp.*
7.875%, 03/15/26 26,724 50,000 Prospect Capital Corp.µ
3.706%, 01/22/26 51,941 20,000 Quicken Loans, LLC / Quicken
Loans Co-Issuer, Inc.* 3.625%, 03/01/29 20,159
65,000 Radian Group, Inc. 4.875%, 03/15/27 70,696
50,000 RHP Hotel Properties, LP / RHP Finance Corp.* 4.500%, 02/15/29 50,570
33,000 RLJ Lodging Trust, LP* 3.750%, 07/01/26 33,475
28,000 SLM Corp. 4.200%, 10/29/25 30,343
65,000 Starwood Property Trust, Inc.^ 4.750%, 03/15/25 68,986
43,000 StoneX Group, Inc.* 8.625%, 06/15/25 46,756
United Wholesale Mortgage, LLC* 34,000 5.500%, 11/15/25 35,073 22,000 5.500%, 04/15/29 21,916 52,000 VICI Properties, LP / VICI Note
Company, Inc.*^ 3.750%, 02/15/27 53,599
XHR, LP* 47,000 6.375%, 08/15/25 50,139 22,000 4.875%, 06/01/29 22,535 ___________
3,224,759 ___________ Health Care (1.3%)
22,000 Acadia Healthcare Company, Inc.* 5.000%, 04/15/29 23,158
145,000 Bausch Health Americas, Inc.* 8.500%, 01/31/27 157,058
Bausch Health Companies, Inc.* 60,000 5.250%, 02/15/31^ 56,285 50,000 5.000%, 01/30/28 47,860 20,000 5.000%, 02/15/29 18,915
Centene Corp. 52,000 4.250%, 12/15/27 54,849 23,000 3.000%, 10/15/30 23,942 22,000 Charles River Laboratories
International, Inc.* 3.750%, 03/15/29 22,573
CHS/Community Health Systems, Inc.*
88,000 6.125%, 04/01/30 89,278 60,000 8.000%, 03/15/26 64,361 25,000 6.875%, 04/15/29 26,345
DaVita, Inc.* 68,000 4.625%, 06/01/30 70,316 32,000 3.750%, 02/15/31 31,158
Encompass Health Corp. 20,000 4.750%, 02/01/30^ 21,455 20,000 4.500%, 02/01/28 20,838 52,000 HCA, Inc.
7.500%, 11/06/33 74,337 200,000 Jazz Securities DAC*
4.375%, 01/15/29 208,826
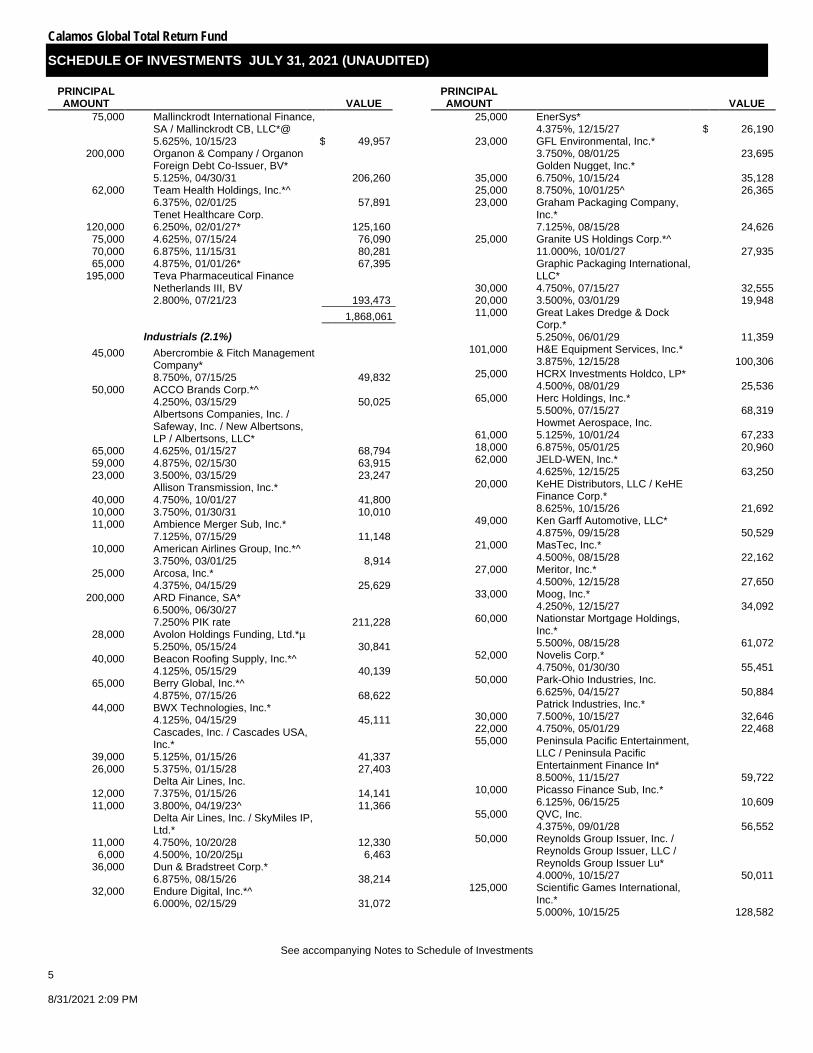
Calamos Global Total Return Fund
SCHEDULE OF INVESTMENTS JULY 31, 2021 (UNAUDITED)
See accompanying Notes to Schedule of Investments
5 8/31/2021 2:09 PM
PRINCIPAL AMOUNT VALUE
75,000 Mallinckrodt International Finance, SA / Mallinckrodt CB, LLC*@ 5.625%, 10/15/23 $ 49,957
200,000 Organon & Company / Organon Foreign Debt Co-Issuer, BV* 5.125%, 04/30/31 206,260
62,000 Team Health Holdings, Inc.*^ 6.375%, 02/01/25 57,891
Tenet Healthcare Corp. 120,000 6.250%, 02/01/27* 125,160
75,000 4.625%, 07/15/24 76,090 70,000 6.875%, 11/15/31 80,281 65,000 4.875%, 01/01/26* 67,395
195,000 Teva Pharmaceutical Finance Netherlands III, BV 2.800%, 07/21/23 193,473 ___________
1,868,061 ___________ Industrials (2.1%)
45,000 Abercrombie & Fitch Management Company* 8.750%, 07/15/25 49,832
50,000 ACCO Brands Corp.*^ 4.250%, 03/15/29 50,025
Albertsons Companies, Inc. / Safeway, Inc. / New Albertsons, LP / Albertsons, LLC*
65,000 4.625%, 01/15/27 68,794 59,000 4.875%, 02/15/30 63,915 23,000 3.500%, 03/15/29 23,247
Allison Transmission, Inc.* 40,000 4.750%, 10/01/27 41,800 10,000 3.750%, 01/30/31 10,010 11,000 Ambience Merger Sub, Inc.*
7.125%, 07/15/29 11,148 10,000 American Airlines Group, Inc.*^
3.750%, 03/01/25 8,914 25,000 Arcosa, Inc.*
4.375%, 04/15/29 25,629 200,000 ARD Finance, SA*
6.500%, 06/30/27 7.250% PIK rate 211,228
28,000 Avolon Holdings Funding, Ltd.*µ 5.250%, 05/15/24 30,841
40,000 Beacon Roofing Supply, Inc.*^ 4.125%, 05/15/29 40,139
65,000 Berry Global, Inc.*^ 4.875%, 07/15/26 68,622
44,000 BWX Technologies, Inc.* 4.125%, 04/15/29 45,111
Cascades, Inc. / Cascades USA, Inc.*
39,000 5.125%, 01/15/26 41,337 26,000 5.375%, 01/15/28 27,403
Delta Air Lines, Inc. 12,000 7.375%, 01/15/26 14,141 11,000 3.800%, 04/19/23^ 11,366
Delta Air Lines, Inc. / SkyMiles IP, Ltd.*
11,000 4.750%, 10/20/28 12,330 6,000 4.500%, 10/20/25µ 6,463
36,000 Dun & Bradstreet Corp.* 6.875%, 08/15/26 38,214
32,000 Endure Digital, Inc.*^ 6.000%, 02/15/29 31,072
PRINCIPAL AMOUNT VALUE
25,000 EnerSys* 4.375%, 12/15/27 $ 26,190
23,000 GFL Environmental, Inc.* 3.750%, 08/01/25 23,695
Golden Nugget, Inc.* 35,000 6.750%, 10/15/24 35,128 25,000 8.750%, 10/01/25^ 26,365 23,000 Graham Packaging Company,
Inc.* 7.125%, 08/15/28 24,626
25,000 Granite US Holdings Corp.*^ 11.000%, 10/01/27 27,935
Graphic Packaging International, LLC*
30,000 4.750%, 07/15/27 32,555 20,000 3.500%, 03/01/29 19,948 11,000 Great Lakes Dredge & Dock
Corp.* 5.250%, 06/01/29 11,359
101,000 H&E Equipment Services, Inc.* 3.875%, 12/15/28 100,306
25,000 HCRX Investments Holdco, LP* 4.500%, 08/01/29 25,536
65,000 Herc Holdings, Inc.* 5.500%, 07/15/27 68,319
Howmet Aerospace, Inc. 61,000 5.125%, 10/01/24 67,233 18,000 6.875%, 05/01/25 20,960 62,000 JELD-WEN, Inc.*
4.625%, 12/15/25 63,250 20,000 KeHE Distributors, LLC / KeHE
Finance Corp.* 8.625%, 10/15/26 21,692
49,000 Ken Garff Automotive, LLC* 4.875%, 09/15/28 50,529
21,000 MasTec, Inc.* 4.500%, 08/15/28 22,162
27,000 Meritor, Inc.* 4.500%, 12/15/28 27,650
33,000 Moog, Inc.* 4.250%, 12/15/27 34,092
60,000 Nationstar Mortgage Holdings, Inc.* 5.500%, 08/15/28 61,072
52,000 Novelis Corp.* 4.750%, 01/30/30 55,451
50,000 Park-Ohio Industries, Inc. 6.625%, 04/15/27 50,884
Patrick Industries, Inc.* 30,000 7.500%, 10/15/27 32,646 22,000 4.750%, 05/01/29 22,468 55,000 Peninsula Pacific Entertainment,
LLC / Peninsula Pacific Entertainment Finance In* 8.500%, 11/15/27 59,722
10,000 Picasso Finance Sub, Inc.* 6.125%, 06/15/25 10,609
55,000 QVC, Inc. 4.375%, 09/01/28 56,552
50,000 Reynolds Group Issuer, Inc. / Reynolds Group Issuer, LLC / Reynolds Group Issuer Lu* 4.000%, 10/15/27 50,011
125,000 Scientific Games International, Inc.* 5.000%, 10/15/25 128,582
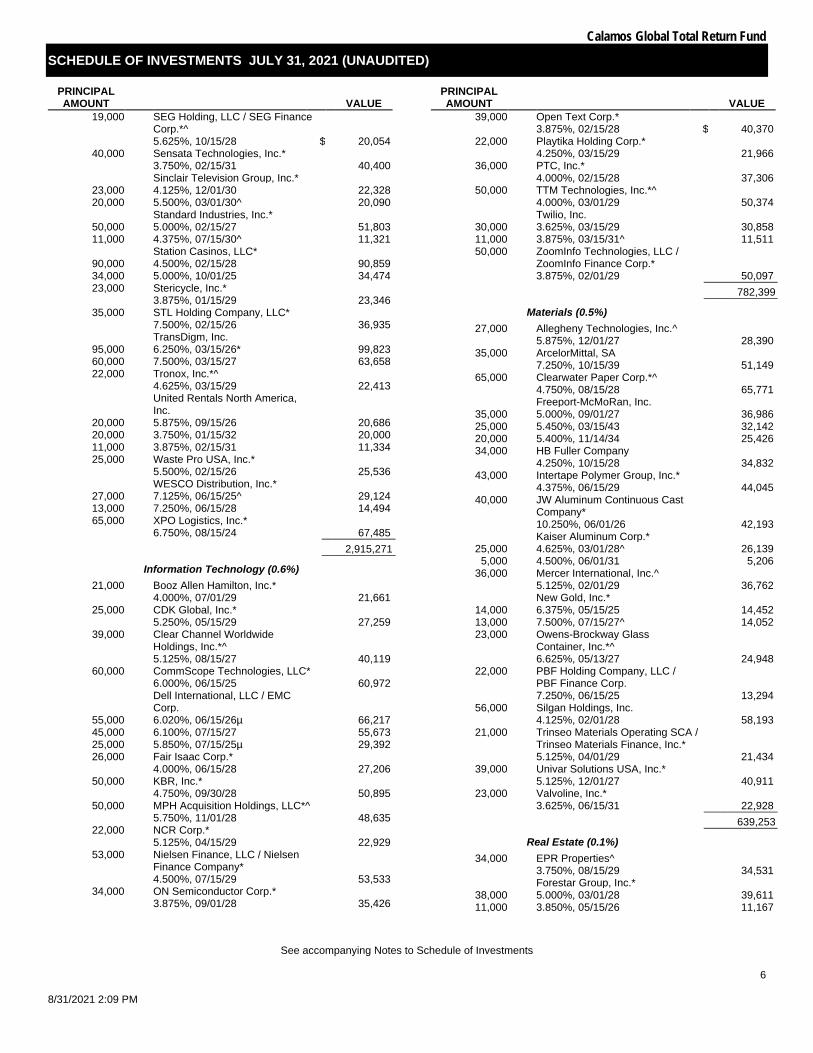
Calamos Global Total Return Fund
SCHEDULE OF INVESTMENTS JULY 31, 2021 (UNAUDITED)
See accompanying Notes to Schedule of Investments
6
8/31/2021 2:09 PM
PRINCIPAL AMOUNT VALUE
19,000 SEG Holding, LLC / SEG Finance Corp.*^ 5.625%, 10/15/28 $ 20,054
40,000 Sensata Technologies, Inc.* 3.750%, 02/15/31 40,400
Sinclair Television Group, Inc.* 23,000 4.125%, 12/01/30 22,328 20,000 5.500%, 03/01/30^ 20,090
Standard Industries, Inc.* 50,000 5.000%, 02/15/27 51,803 11,000 4.375%, 07/15/30^ 11,321
Station Casinos, LLC* 90,000 4.500%, 02/15/28 90,859 34,000 5.000%, 10/01/25 34,474 23,000 Stericycle, Inc.*
3.875%, 01/15/29 23,346 35,000 STL Holding Company, LLC*
7.500%, 02/15/26 36,935 TransDigm, Inc.
95,000 6.250%, 03/15/26* 99,823 60,000 7.500%, 03/15/27 63,658 22,000 Tronox, Inc.*^
4.625%, 03/15/29 22,413
United Rentals North America, Inc.
20,000 5.875%, 09/15/26 20,686 20,000 3.750%, 01/15/32 20,000 11,000 3.875%, 02/15/31 11,334 25,000 Waste Pro USA, Inc.*
5.500%, 02/15/26 25,536 WESCO Distribution, Inc.*
27,000 7.125%, 06/15/25^ 29,124 13,000 7.250%, 06/15/28 14,494 65,000 XPO Logistics, Inc.*
6.750%, 08/15/24 67,485 ___________ 2,915,271 ___________
Information Technology (0.6%) 21,000 Booz Allen Hamilton, Inc.*
4.000%, 07/01/29 21,661 25,000 CDK Global, Inc.*
5.250%, 05/15/29 27,259 39,000 Clear Channel Worldwide
Holdings, Inc.*^ 5.125%, 08/15/27 40,119
60,000 CommScope Technologies, LLC* 6.000%, 06/15/25 60,972
Dell International, LLC / EMC Corp.
55,000 6.020%, 06/15/26µ 66,217 45,000 6.100%, 07/15/27 55,673 25,000 5.850%, 07/15/25µ 29,392 26,000 Fair Isaac Corp.*
4.000%, 06/15/28 27,206 50,000 KBR, Inc.*
4.750%, 09/30/28 50,895 50,000 MPH Acquisition Holdings, LLC*^
5.750%, 11/01/28 48,635 22,000 NCR Corp.*
5.125%, 04/15/29 22,929 53,000 Nielsen Finance, LLC / Nielsen
Finance Company* 4.500%, 07/15/29 53,533
34,000 ON Semiconductor Corp.* 3.875%, 09/01/28 35,426
PRINCIPAL AMOUNT VALUE
39,000 Open Text Corp.* 3.875%, 02/15/28 $ 40,370
22,000 Playtika Holding Corp.* 4.250%, 03/15/29 21,966
36,000 PTC, Inc.* 4.000%, 02/15/28 37,306
50,000 TTM Technologies, Inc.*^ 4.000%, 03/01/29 50,374
Twilio, Inc. 30,000 3.625%, 03/15/29 30,858 11,000 3.875%, 03/15/31^ 11,511 50,000 ZoomInfo Technologies, LLC /
ZoomInfo Finance Corp.* 3.875%, 02/01/29 50,097 ___________
782,399 ___________ Materials (0.5%)
27,000 Allegheny Technologies, Inc.^ 5.875%, 12/01/27 28,390
35,000 ArcelorMittal, SA 7.250%, 10/15/39 51,149
65,000 Clearwater Paper Corp.*^ 4.750%, 08/15/28 65,771
Freeport-McMoRan, Inc. 35,000 5.000%, 09/01/27 36,986 25,000 5.450%, 03/15/43 32,142 20,000 5.400%, 11/14/34 25,426 34,000 HB Fuller Company
4.250%, 10/15/28 34,832 43,000 Intertape Polymer Group, Inc.*
4.375%, 06/15/29 44,045 40,000 JW Aluminum Continuous Cast
Company* 10.250%, 06/01/26 42,193
Kaiser Aluminum Corp.* 25,000 4.625%, 03/01/28^ 26,139
5,000 4.500%, 06/01/31 5,206 36,000 Mercer International, Inc.^
5.125%, 02/01/29 36,762 New Gold, Inc.*
14,000 6.375%, 05/15/25 14,452 13,000 7.500%, 07/15/27^ 14,052 23,000 Owens-Brockway Glass
Container, Inc.*^ 6.625%, 05/13/27 24,948
22,000 PBF Holding Company, LLC / PBF Finance Corp. 7.250%, 06/15/25 13,294
56,000 Silgan Holdings, Inc. 4.125%, 02/01/28 58,193
21,000 Trinseo Materials Operating SCA / Trinseo Materials Finance, Inc.* 5.125%, 04/01/29 21,434
39,000 Univar Solutions USA, Inc.* 5.125%, 12/01/27 40,911
23,000 Valvoline, Inc.* 3.625%, 06/15/31 22,928 ___________
639,253 ___________ Real Estate (0.1%)
34,000 EPR Properties^ 3.750%, 08/15/29 34,531
Forestar Group, Inc.* 38,000 5.000%, 03/01/28 39,611 11,000 3.850%, 05/15/26 11,167

Calamos Global Total Return Fund
SCHEDULE OF INVESTMENTS JULY 31, 2021 (UNAUDITED)
See accompanying Notes to Schedule of Investments
7 8/31/2021 2:09 PM
PRINCIPAL AMOUNT VALUE
34,000 iStar, Inc. 5.500%, 02/15/26 $ 35,696
Service Properties Trust 65,000 4.350%, 10/01/24 65,608 20,000 5.250%, 02/15/26 20,245 ___________
206,858 ___________ Utilities (0.2%)
39,000 Calpine Corp.* 4.500%, 02/15/28 40,256
20,000 NRG Energy, Inc. 6.625%, 01/15/27 20,727
68,000 PPL Capital Funding, Inc.^‡ 2.812%, 03/30/67 3 mo. USD LIBOR + 2.67% 66,676
Talen Energy Supply, LLC* 25,000 10.500%, 01/15/26 17,258 10,000 7.250%, 05/15/27 9,130 65,000 TerraForm Power Operating, LLC*
5.000%, 01/31/28 70,383 ___________ 224,430 ___________
TOTAL CORPORATE BONDS (Cost $16,621,757) 17,350,885 ___________ ___________
CONVERTIBLE BONDS (26.1%) Airlines (0.2%)
2,000,000 HKD Cathay Pacific Finance III, Ltd. 2.750%, 02/05/26 257,373 ___________
Communication Services (3.3%) 813,000 Eventbrite, Inc.*
0.750%, 09/15/26 768,854 200,000 Kakao Corp.
0.000%, 04/28/23 303,504 1,190,000 Liberty Media Corp.*
0.500%, 12/01/50 1,317,830 515,000 Live Nation Entertainment, Inc.
2.500%, 03/15/23 671,411 436,000 Sea, Ltd.
2.375%, 12/01/25 1,355,332 200,000 Xiaomi Best Time International,
Ltd. 0.000%, 12/17/27 207,988 ___________
4,624,919 ___________ Consumer Discretionary (9.9%)
781,000 Booking Holdings, Inc.^ 0.750%, 05/01/25 1,102,460
1,525,000 Cheesecake Factory, Inc. 0.375%, 06/15/26 1,430,603
106,000 DISH Network Corp. 2.375%, 03/15/24 102,717
152,000 Expedia Group, Inc.*^ 0.000%, 02/15/26 163,433
2,775,000 Ford Motor Company* 0.000%, 03/15/26 2,973,551
1,200,000 EUR Global Fashion Group, SA 1.250%, 03/15/28 1,419,414
170,000 Liberty Broadband Corp.* 2.750%, 09/30/50 182,509
Liberty Interactive, LLC 56,000 4.000%, 11/15/29 43,155 35,000 3.750%, 02/15/30 27,000
PRINCIPAL AMOUNT VALUE
1,930,000 Marriott Vacations Worldwide Corp.* 0.000%, 01/15/26 $ 2,063,614
400,000 Meituan 0.000%, 04/27/28 371,832
20,000 Peloton Interactive, Inc.* 0.000%, 02/15/26 18,925
730,000 Shake Shack, Inc.* 0.000%, 03/01/28 684,090
2,505,000 Vail Resorts, Inc.*^ 0.000%, 01/01/26 2,529,324
500,000 GBP WH Smith, PLC 1.625%, 05/07/26 682,046 ___________
13,794,673 ___________ Consumer Staples (0.9%)
1,415,000 CAD Premium Brands Holdings Corp. 4.200%, 09/30/27 1,268,090 ___________
Financials (2.7%) 13,000,000 HKD Citigroup Global Markets Funding
Luxembourg SCA 0.000%, 05/28/24 1,861,903
165,000 JPMorgan Chase Bank NA*^ 0.125%, 01/01/23 175,966
745,000 Realogy Group, LLC / Realogy Co-Issuer Corp.* 0.250%, 06/15/26 754,655
70,000,000 JPY SBI Holdings, Inc. 0.000%, 07/25/25 694,659
200,000 EUR SGX Treasury I Pte, Ltd. 0.000%, 03/01/24 248,712 ___________
3,735,895 ___________ Health Care (1.5%)
700,000 Jazz Investments I, Ltd. 2.000%, 06/15/26 907,515
765,000 LivaNova USA, Inc. 3.000%, 12/15/25 1,210,046 ___________
2,117,561 ___________ Industrials (3.3%)
700,000 EUR Duerr, AG 0.750%, 01/15/26 1,087,566
1,635,000 JetBlue Airways Corp.*^ 0.500%, 04/01/26 1,617,097
740,000 John Bean Technologies Corp.* 0.250%, 05/15/26 798,009
696,000 Southwest Airlines Company 1.250%, 05/01/25 1,022,633 ___________
4,525,305 ___________ Information Technology (2.7%)
400,000 Globalwafers Company, Ltd. 0.000%, 06/01/26 420,316
730,000 ON Semiconductor Corp.*^ 0.000%, 05/01/27 776,866
900,000 Shift4 Payments, Inc.* 0.000%, 12/15/25 1,170,999
1,195,000 Square, Inc.*^ 0.250%, 11/01/27 1,410,040 ___________
3,778,221 ___________

Calamos Global Total Return Fund
SCHEDULE OF INVESTMENTS JULY 31, 2021 (UNAUDITED)
See accompanying Notes to Schedule of Investments
8
8/31/2021 2:09 PM
PRINCIPAL AMOUNT VALUE
Materials (0.8%) 250,000 BASF, SE
0.925%, 03/09/23 $ 250,905 725,000 Ivanhoe Mines, Ltd.*
2.500%, 04/15/26 906,982 ___________ 1,157,887 ___________
Real Estate (0.7%) 800,000 Redfin Corp.*
0.500%, 04/01/27 770,392 200,000 Vingroup, JSC
3.000%, 04/20/26 215,012 ___________ 985,404 ___________
Utilities (0.1%) 470,000 EUR Voltalia, SA
1.000%, 01/13/25 178,752 ___________
TOTAL CONVERTIBLE BONDS (Cost $34,451,389) 36,424,080 ___________ ___________
BANK LOANS (0.2%) ¡ Communication Services (0.1%)
157,119 Intelsat Jackson Holdings, SA 8.625%, 01/02/24 160,290 ___________
Consumer Discretionary (0.0%) 20,000 At Home Group, Inc.!
0.000%, 06/24/28 20,025 10,000 At Home Group, Inc.‡
4.750%, 06/24/28 3 mo. LIBOR + 4.25% 10,012 ___________
30,037 ___________ Information Technology (0.1%)
52,136 Banff Merger Sub, Inc.‡ 3.842%, 10/02/25 1 mo. LIBOR + 3.75% 51,769 ___________
TOTAL BANK LOANS (Cost $240,428) 242,096 ___________ ___________
NUMBER OF SHARES VALUE
CONVERTIBLE PREFERRED STOCKS (10.8%) Communication Services (1.5%)
1,620 2020 Cash Mandatory Exchangeable Trust* 5.250%, 06/01/23 2,049,835 ___________
Consumer Discretionary (2.0%) 14,975 Aptiv, PLCµ
5.500%, 06/15/23 2,811,706 ___________ Energy (0.0%)
1 Gulfport Energy Operating Corp. 10.000%, 08/30/21 15.000% PIK rate 4,925 ___________
Financials (1.1%) 29,750 BRL Banco Bradesco, SA
0.000% 138,518
NUMBER OF SHARES VALUE
16,140 KKR & Company, Inc.^ 6.000%, 09/15/23 $ 1,340,266 ___________
1,478,784 ___________ Health Care (2.1%)
1,475 Danaher Corp. 4.750%, 04/15/22 2,939,306 ___________
Industrials (2.0%) 7,700 Clarivate, PLC
5.250%, 06/01/24 699,930 17,741 Stanley Black & Decker, Inc.^
5.250%, 11/15/22 2,093,438 ___________ 2,793,368 ___________
Information Technology (0.8%) 765 Broadcom, Inc.
8.000%, 09/30/22 1,181,420 ___________ Utilities (1.3%)
7,200 AES Corp.µ 6.875%, 02/15/24 729,936
19,761 NextEra Energy, Inc. 4.872%, 09/01/22 1,161,354 ___________
1,891,290 ___________
TOTAL CONVERTIBLE PREFERRED STOCKS (Cost $12,307,338) 15,150,634 ___________ ___________
COMMON STOCKS (88.6%) Communication Services (6.2%)
7,500 Facebook, Inc. - Class A^# 2,672,250 710 Lumen Technologies, Inc.^ 8,854 650 KRW NAVER Corp. 244,986 970 Sea, Ltd.# 267,875 580 KRW SK Telecom Company, Ltd. 151,922
43,210 Tencent Holdings, Ltd.^ 2,644,452 2,500 HKD Tencent Holdings, Ltd. 150,770
14,000 Walt Disney Company#~ 2,464,280 ___________ 8,605,389 ___________
Consumer Discretionary (11.6%) 12,100 HKD Alibaba Group Holding, Ltd.# 295,515
7,725 Alibaba Group Holding, Ltd.# 1,507,843 78,400 MXN Alsea, SAB de CV# 158,169
1,260 Amazon.com, Inc.^# 4,192,763 1 Arcos Dorados Holdings, Inc. -
Class A^# 5 2,600 CNY China Tourism Group Duty Free
Corp., Ltd. - Class A 97,244 710 Chipotle Mexican Grill, Inc. - Class
A^# 1,323,042 29,300 BRL CVC Brasil Operadora e Agencia
de Viagens, SA# 125,453 4,450 INR Dixon Technologies India, Ltd.# 257,786
13,000 DR Horton, Inc.^ 1,240,590 7,000 TWD Eclat Textile Company, Ltd. 152,831
25,800 General Motors Company# 1,466,472 1,135 KRW Hyundai Motor Company 216,007
54,800 INR Indian Hotels Company, Ltd. 106,397 3,550 INR Jubilant Foodworks, Ltd.# 180,431
32,500 HKD Li Ning Company, Ltd. 343,243

Calamos Global Total Return Fund
SCHEDULE OF INVESTMENTS JULY 31, 2021 (UNAUDITED)
See accompanying Notes to Schedule of Investments
9 8/31/2021 2:09 PM
NUMBER OF SHARES VALUE
3,160 EUR LVMH Moet Hennessy Louis Vuitton, SE $ 2,530,108
4,275 MakeMyTrip, Ltd.^# 121,667 117 MercadoLibre, Inc.# 183,538
10,200 ZAR Mr Price Group, Ltd. 151,692 95,400 HKD Samsonite International, SA*# 177,568
6,700 HKD Shenzhou International Group Holdings, Ltd. 148,695
1,245 Tesla, Inc.^# 855,564 6,000 Trip.com Group, Ltd.# 155,580 2,800 HKD Yum China Holdings, Inc.µ 171,581 ___________
16,159,784 ___________ Consumer Staples (4.6%)
12,300 Celsius Holdings, Inc.# 844,149 33,699 Coca-Cola Company^~ 1,921,854
3,670 Costco Wholesale Corp. 1,577,073 500 CNY Kweichow Moutai Company, Ltd. -
Class A 130,230 12,799 HKD L'Occitane International, SA 44,495 23,200 Mondelez International, Inc. -
Class A 1,467,632 19,500 BRL Raia Drogasil, SA 94,500 17,550 INR Varun Beverages, Ltd. 178,837 54,700 MXN Wal-Mart de Mexico, SAB de CV 180,206 ___________
6,438,976 ___________ Energy (2.9%)
2,110 Calfrac Well Services, Ltd.# 6,098 20,100 CAD Canadian Natural Resources, Ltd. 663,287
479 Chaparral Energy, Inc. - Class A# 18,202 142 Chesapeake Energy Corp. 7,675
8,250 Chevron Corp.^ 839,932 205 Denbury, Inc.# 13,471 654 Diamond Offshore Drilling, Inc.# 3,875
1,920 Energy Transfer, LP 18,931 2,075 Enterprise Products Partners, LP 46,833
341 EP Energy Corp.&# 33,759 16,215 Exxon Mobil Corp. 933,498
294 Gulfport Energy Operating Corp.# 20,080 2,598 Lonestar Resources US, Inc.&# 25,590
585 Magellan Midstream Partners, LP 27,261 101 Oasis Petroleum, Inc.^ 9,263
4,474 Occidental Petroleum Corp. 116,771 6,100 INR Reliance Industries, Ltd. 167,353
47,265 EUR Royal Dutch Shell, PLC - Class A 960,109 776 Superior Energy Services, Inc.# 30,264 975 Targa Resources Corp. 41,057 787 Weatherford International, PLC^# 13,725 158 Whiting Petroleum Corp.# 7,410 450 Williams Companies, Inc.^ 11,273 ___________ 4,015,717 ___________
Financials (15.2%) 16,000 HKD AIA Group, Ltd. 191,452 73,600 IDR Bank Central Asia, Tbk PT 151,937
142,300 IDR Bank Jago, Tbk PT# 176,596 71,825 Bank of America Corp.~ 2,755,207
113,000 TWD Cathay Financial Holding Company, Ltd. 219,933
13,300 TWD Chailease Holding Company, Ltd. 110,372 42,500 HKD China Merchants Bank Company,
Ltd. - Class H 323,321 60,500 ZAR FirstRand, Ltd. 224,427 24,500 MXN Grupo Financiero Banorte, SAB
de CV - Class O 158,498
NUMBER OF SHARES VALUE
4,550 KRW Hana Financial Group, Inc. $ 171,665 139,900 INR HDFC Bank, Ltd. 2,689,525
2,800 HKD Hong Kong Exchanges & Clearing, Ltd. 178,947
5,985 INR Housing Development Finance Corp., Ltd. 197,137
22,240 ICICI Bank, Ltd.^ 413,442 161,800 EUR ING Groep, NV 2,076,006 375,000 EUR Intesa Sanpaolo, S.p.A 1,035,955
39,625 Itau Unibanco Holding, SA^ 228,636 18,800 JPMorgan Chase & Company~ 2,853,464 40,100 THB Kasikornbank PCL 124,790 20,700 Morgan Stanley 1,986,786 23,700 EUR NN Group, NV 1,178,278
2,975 HUF OTP Bank Nyrt# 160,430 9,700 Sberbank of Russia, PJSC 161,311
11,150 INR SBI Cards & Payment Services, Ltd.# 154,653
6,700 KRW Shinhan Financial Group Company, Ltd. 227,084
82,950 UBS Group, AG^# 1,367,016 36,525 Wells Fargo & Companyµ^ 1,677,958 ___________
21,194,826 ___________ Health Care (7.6%)
16,985 CNY Aier Eye Hospital Group Company, Ltd. - Class A 155,092
60,698 Alcon, Inc.^ 4,418,814 5,960 Eli Lilly & Company 1,451,260 1,500 CHF Lonza Group, AG 1,167,938
23,200 Novo Nordisk, A/S 2,148,320 1,400 CNY Shenzhen Mindray Bio-Medical
Electronics Company, Ltd. - Class A 84,938
2,150 UnitedHealth Group, Inc.^ 886,273 24,500 HKD Wuxi Biologics Cayman, Inc.*# 374,219 ___________
10,686,854 ___________ Industrials (7.6%)
12,250 ZAR Barloworld, Ltd. 90,366 475 Boeing Company# 107,578
25,100 CAE, Inc.# 766,303 5,275 Caterpillar, Inc. 1,090,606 2,000 CNY Contemporary Amperex
Technology Company, Ltd. - Class A 171,640
23,750 EUR Deutsche Post, AG 1,609,565 5,800 JPY FANUC Corp. 1,299,012
51,200 PHP International Container Terminal Services, Inc. 159,270
1,694 McDermott International, Inc.# 561 13,600 EUR Schneider Electric, SE 2,277,841 13,000 HKD Techtronic Industries Company,
Ltd. 231,820 4,915 Union Pacific Corp. 1,075,205
13,450 INR Voltas, Ltd. 191,894 10,400 Waste Management, Inc.µ 1,541,904 ___________
10,613,565 ___________ Information Technology (26.7%)
5,785 Accenture, PLC - Class Aµ 1,837,779 780 EUR Adyen, NV*# 2,113,838
24,145 Apple, Inc.^ 3,521,790 7,040 ASML Holding, NV^ 5,397,849 2,000 TWD eMemory Technology, Inc. 94,069 9,100 JPY Fujitsu, Ltd. 1,548,187
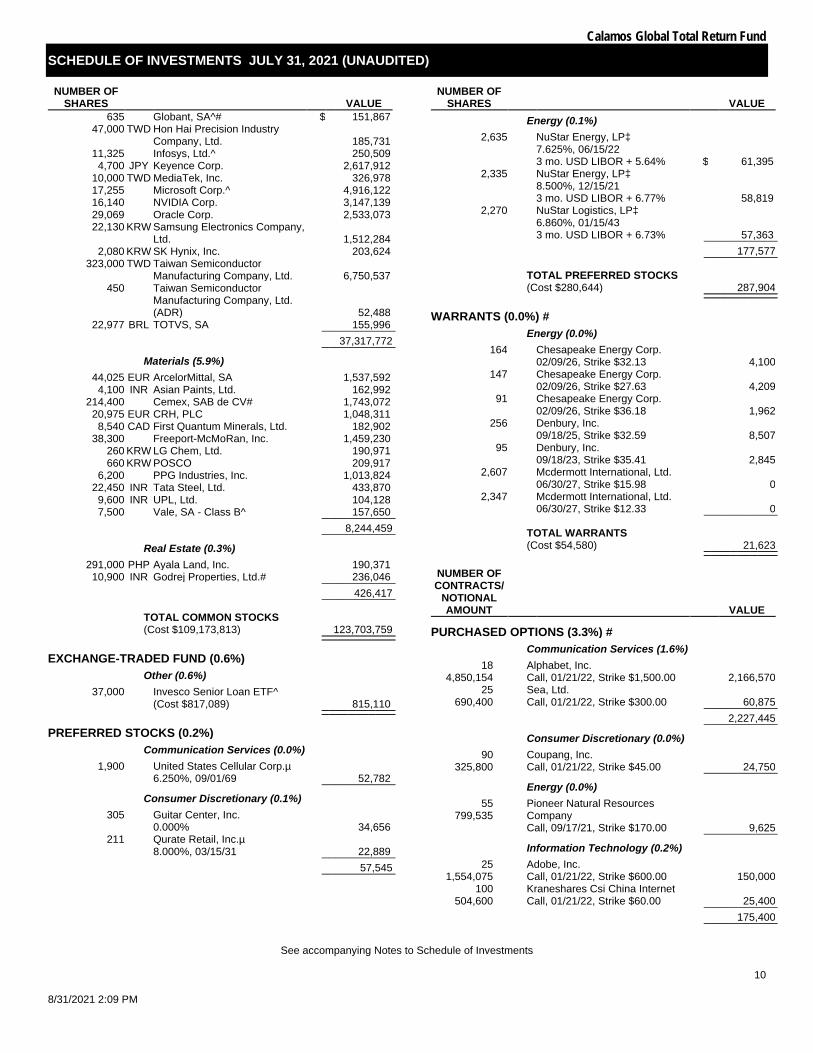
Calamos Global Total Return Fund
SCHEDULE OF INVESTMENTS JULY 31, 2021 (UNAUDITED)
See accompanying Notes to Schedule of Investments
10
8/31/2021 2:09 PM
NUMBER OF SHARES VALUE
635 Globant, SA^# $ 151,867 47,000 TWD Hon Hai Precision Industry
Company, Ltd. 185,731 11,325 Infosys, Ltd.^ 250,509
4,700 JPY Keyence Corp. 2,617,912 10,000 TWD MediaTek, Inc. 326,978 17,255 Microsoft Corp.^ 4,916,122 16,140 NVIDIA Corp. 3,147,139 29,069 Oracle Corp. 2,533,073 22,130 KRW Samsung Electronics Company,
Ltd. 1,512,284 2,080 KRW SK Hynix, Inc. 203,624
323,000 TWD Taiwan Semiconductor Manufacturing Company, Ltd. 6,750,537
450 Taiwan Semiconductor Manufacturing Company, Ltd. (ADR) 52,488
22,977 BRL TOTVS, SA 155,996 ___________ 37,317,772 ___________
Materials (5.9%) 44,025 EUR ArcelorMittal, SA 1,537,592
4,100 INR Asian Paints, Ltd. 162,992 214,400 Cemex, SAB de CV# 1,743,072
20,975 EUR CRH, PLC 1,048,311 8,540 CAD First Quantum Minerals, Ltd. 182,902
38,300 Freeport-McMoRan, Inc. 1,459,230 260 KRW LG Chem, Ltd. 190,971 660 KRW POSCO 209,917
6,200 PPG Industries, Inc. 1,013,824 22,450 INR Tata Steel, Ltd. 433,870
9,600 INR UPL, Ltd. 104,128 7,500 Vale, SA - Class B^ 157,650 ___________
8,244,459 ___________ Real Estate (0.3%)
291,000 PHP Ayala Land, Inc. 190,371 10,900 INR Godrej Properties, Ltd.# 236,046 ___________
426,417 ___________
TOTAL COMMON STOCKS (Cost $109,173,813) 123,703,759 ___________ ___________
EXCHANGE-TRADED FUND (0.6%) Other (0.6%)
37,000 Invesco Senior Loan ETF^ (Cost $817,089) 815,110 ___________ ___________
PREFERRED STOCKS (0.2%) Communication Services (0.0%)
1,900 United States Cellular Corp.µ 6.250%, 09/01/69 52,782 ___________
Consumer Discretionary (0.1%) 305 Guitar Center, Inc.
0.000% 34,656 211 Qurate Retail, Inc.µ
8.000%, 03/15/31 22,889 ___________ 57,545 ___________
NUMBER OF SHARES VALUE
Energy (0.1%) 2,635 NuStar Energy, LP‡
7.625%, 06/15/22 3 mo. USD LIBOR + 5.64% $ 61,395
2,335 NuStar Energy, LP‡ 8.500%, 12/15/21 3 mo. USD LIBOR + 6.77% 58,819
2,270 NuStar Logistics, LP‡ 6.860%, 01/15/43 3 mo. USD LIBOR + 6.73% 57,363 ___________
177,577 ___________
TOTAL PREFERRED STOCKS (Cost $280,644) 287,904 ___________ ___________
WARRANTS (0.0%) # Energy (0.0%)
164
Chesapeake Energy Corp. 02/09/26, Strike $32.13 4,100
147
Chesapeake Energy Corp. 02/09/26, Strike $27.63 4,209
91
Chesapeake Energy Corp. 02/09/26, Strike $36.18 1,962
256
Denbury, Inc. 09/18/25, Strike $32.59 8,507
95
Denbury, Inc. 09/18/23, Strike $35.41 2,845
2,607
Mcdermott International, Ltd. 06/30/27, Strike $15.98 0
2,347
Mcdermott International, Ltd. 06/30/27, Strike $12.33 0 ___________
TOTAL WARRANTS (Cost $54,580) 21,623 ___________ ___________
NUMBER OF CONTRACTS/
NOTIONAL AMOUNT VALUE
PURCHASED OPTIONS (3.3%) # Communication Services (1.6%)
18 4,850,154
Alphabet, Inc. Call, 01/21/22, Strike $1,500.00 2,166,570
25 690,400
Sea, Ltd. Call, 01/21/22, Strike $300.00 60,875 ___________
2,227,445 ___________ Consumer Discretionary (0.0%)
90 325,800
Coupang, Inc. Call, 01/21/22, Strike $45.00 24,750 ___________ Energy (0.0%)
55 799,535
Pioneer Natural Resources Company Call, 09/17/21, Strike $170.00 9,625 ___________ Information Technology (0.2%)
25 1,554,075
Adobe, Inc. Call, 01/21/22, Strike $600.00 150,000
100 504,600
Kraneshares Csi China Internet Call, 01/21/22, Strike $60.00 25,400 ___________
175,400 ___________
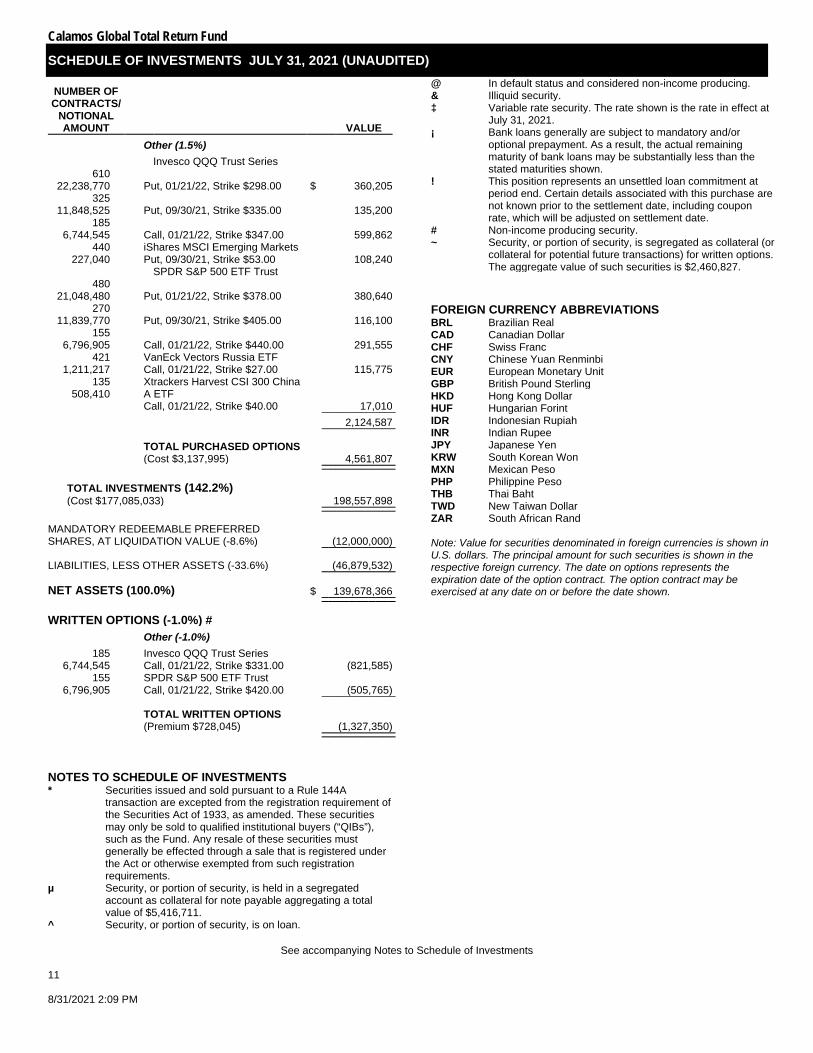
Calamos Global Total Return Fund
SCHEDULE OF INVESTMENTS JULY 31, 2021 (UNAUDITED)
See accompanying Notes to Schedule of Investments
11 8/31/2021 2:09 PM
NUMBER OF CONTRACTS/
NOTIONAL AMOUNT VALUE
Other (1.5%) Invesco QQQ Trust Series
610 22,238,770
Put, 01/21/22, Strike $298.00 $ 360,205
325 11,848,525
Put, 09/30/21, Strike $335.00 135,200
185 6,744,545
Call, 01/21/22, Strike $347.00 599,862
440 227,040
iShares MSCI Emerging Markets Put, 09/30/21, Strike $53.00 108,240
SPDR S&P 500 ETF Trust 480
21,048,480
Put, 01/21/22, Strike $378.00 380,640 270
11,839,770
Put, 09/30/21, Strike $405.00 116,100 155
6,796,905
Call, 01/21/22, Strike $440.00 291,555 421
1,211,217 VanEck Vectors Russia ETF
Call, 01/21/22, Strike $27.00 115,775 135
508,410
Xtrackers Harvest CSI 300 China A ETF Call, 01/21/22, Strike $40.00 17,010 ___________
2,124,587 ___________
TOTAL PURCHASED OPTIONS (Cost $3,137,995) 4,561,807 ___________ ___________
TOTAL INVESTMENTS (142.2%) (Cost $177,085,033) 198,557,898 ___________ ___________
MANDATORY REDEEMABLE PREFERRED SHARES, AT LIQUIDATION VALUE (-8.6%) (12,000,000) ___________
LIABILITIES, LESS OTHER ASSETS (-33.6%) (46,879,532) ___________
NET ASSETS (100.0%) $ 139,678,366 ___________ ___________
WRITTEN OPTIONS (-1.0%) # Other (-1.0%)
185 6,744,545
Invesco QQQ Trust Series Call, 01/21/22, Strike $331.00 (821,585)
155 6,796,905
SPDR S&P 500 ETF Trust Call, 01/21/22, Strike $420.00 (505,765) ___________
TOTAL WRITTEN OPTIONS (Premium $728,045) (1,327,350) ___________ ___________
NOTES TO SCHEDULE OF INVESTMENTS *
Securities issued and sold pursuant to a Rule 144A transaction are excepted from the registration requirement of the Securities Act of 1933, as amended. These securities may only be sold to qualified institutional buyers (“QIBs”), such as the Fund. Any resale of these securities must generally be effected through a sale that is registered under the Act or otherwise exempted from such registration requirements.
µ
Security, or portion of security, is held in a segregated account as collateral for note payable aggregating a total value of $5,416,711.
^ Security, or portion of security, is on loan.
@ In default status and considered non-income producing. & Illiquid security. ‡
Variable rate security. The rate shown is the rate in effect at July 31, 2021.
¡
Bank loans generally are subject to mandatory and/or optional prepayment. As a result, the actual remaining maturity of bank loans may be substantially less than the stated maturities shown.
!
This position represents an unsettled loan commitment at period end. Certain details associated with this purchase are not known prior to the settlement date, including coupon rate, which will be adjusted on settlement date.
# Non-income producing security. ~
Security, or portion of security, is segregated as collateral (or collateral for potential future transactions) for written options. The aggregate value of such securities is $2,460,827.
FOREIGN CURRENCY ABBREVIATIONS BRL Brazilian Real CAD Canadian Dollar CHF Swiss Franc CNY Chinese Yuan Renminbi EUR European Monetary Unit GBP British Pound Sterling HKD Hong Kong Dollar HUF Hungarian Forint IDR Indonesian Rupiah INR Indian Rupee JPY Japanese Yen KRW South Korean Won MXN Mexican Peso PHP Philippine Peso THB Thai Baht TWD New Taiwan Dollar ZAR South African Rand Note: Value for securities denominated in foreign currencies is shown in U.S. dollars. The principal amount for such securities is shown in the respective foreign currency. The date on options represents the expiration date of the option contract. The option contract may be exercised at any date on or before the date shown.
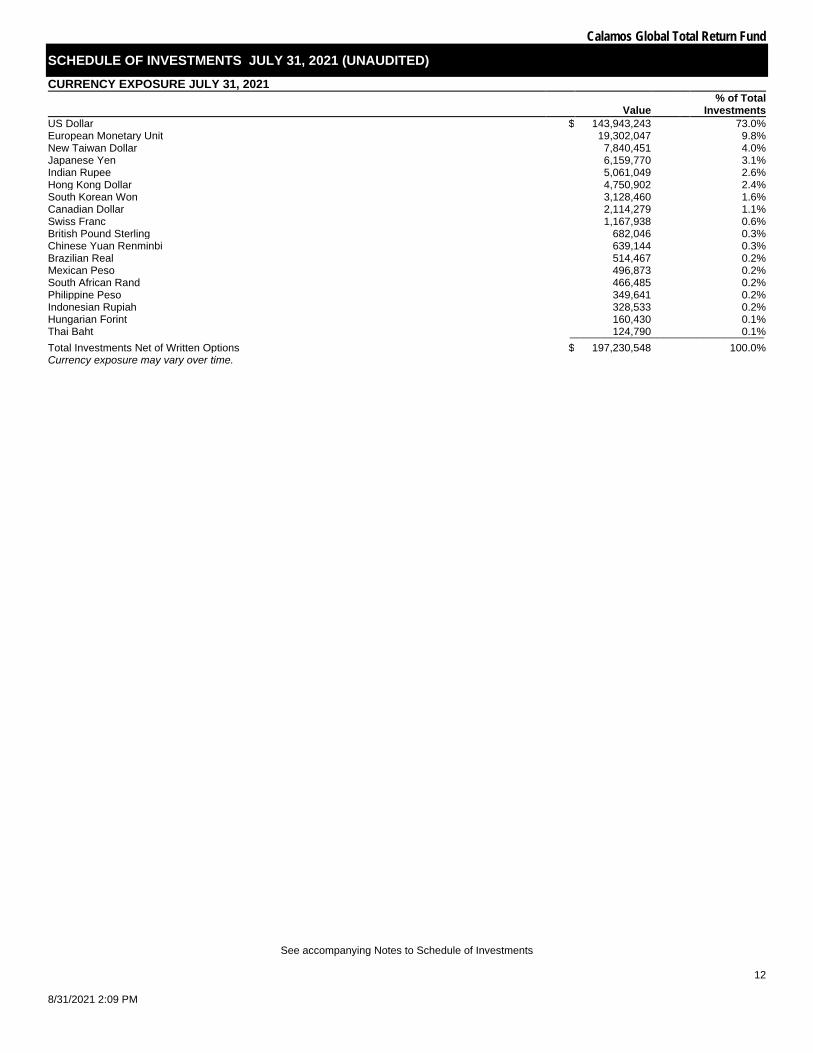
Calamos Global Total Return Fund
SCHEDULE OF INVESTMENTS JULY 31, 2021 (UNAUDITED)
See accompanying Notes to Schedule of Investments
12
8/31/2021 2:09 PM
CURRENCY EXPOSURE JULY 31, 2021
Value % of Total
Investments US Dollar $ 143,943,243 73.0 % European Monetary Unit 19,302,047 9.8 % New Taiwan Dollar 7,840,451 4.0 % Japanese Yen 6,159,770 3.1 % Indian Rupee 5,061,049 2.6 % Hong Kong Dollar 4,750,902 2.4 % South Korean Won 3,128,460 1.6 % Canadian Dollar 2,114,279 1.1 % Swiss Franc 1,167,938 0.6 % British Pound Sterling 682,046 0.3 % Chinese Yuan Renminbi 639,144 0.3 % Brazilian Real 514,467 0.2 % Mexican Peso 496,873 0.2 % South African Rand 466,485 0.2 % Philippine Peso 349,641 0.2 % Indonesian Rupiah 328,533 0.2 % Hungarian Forint 160,430 0.1 % Thai Baht 124,790 0.1 % _____________________________ Total Investments Net of Written Options $ 197,230,548 100.0 % Currency exposure may vary over time.

Note 1 – Organization and Significant Accounting Policies Organization. Calamos Global Total Return (the “Fund”) was organized as a Delaware statutory trust on March 30, 2004 and is registered under the Investment Company Act of 1940 (the “1940 Act”) as a diversified, closed-end management investment company. The Fund commenced operations on October 27, 2005. Significant Accounting Policies. The Schedule of Investments has been prepared in conformity with accounting principles generally accepted in the United States of America (U.S. GAAP). The Fund is considered an investment company under U.S. GAAP and follows the accounting and reporting guidance applicable to investment companies. The following summarizes the significant accounting policies of the Fund: In March 2017, the Financial Accounting Standards Board ("FASB") issued ASU No. 2017-08, Receivables – Nonrefundable Fees and Other Costs (Subtopic 310-20): Premium Amortization on Purchased Callable Debt Securities ("ASU 2017-08"). ASU 2017-08 shortens the amortization period for certain callable debt securities held at a premium. The Fund adopted ASU2017-08 as of November 1, 2019, with no material impact on the Fund's Schedule of Investments. Fund Valuation. The valuation of the Fund's investments is in accordance with policies and procedures adopted by and under the ultimate supervision of the board of trustees.
Fund securities that are traded on U.S. securities exchanges, except option securities, are valued at the official closing price, which is the last current reported sales price on its principal exchange at the time each Fund determines its net asset value (“NAV”). Securities traded in the over-the-counter market and quoted on The NASDAQ Stock Market are valued at the NASDAQ Official Closing Price, as determined by NASDAQ, or lacking a NASDAQ Official Closing Price, the last current reported sale price on NASDAQ at the time the Fund determines its NAV. When a last sale or closing price is not available, equity securities, other than option securities, that are traded on a U.S. securities exchange and other equity securities traded in the over-the-counter market are valued at the mean between the most recent bid and asked quotations on its principal exchange in accordance with guidelines adopted by the board of trustees. Each option security traded on a U.S. securities exchange is valued at the mid-point of the consolidated bid/ask quote for the option security, also in accordance with guidelines adopted by the board of trustees. Each over-the-counter option that is not traded through the Options Clearing Corporation is valued either by an independent pricing agent approved by the board of trustees or based on a quotation provided by the counterparty to such option under the ultimate supervision of the board of trustees.
Fixed income securities, bank loans, certain convertible preferred securities, and non-exchange traded derivatives are normally valued by independent pricing services or by dealers or brokers who make markets in such securities. Valuations of such fixed income securities, bank loans, certain convertible preferred securities, and non-exchange traded derivatives consider yield or price of equivalent securities of comparable quality, coupon rate, maturity, type of issue, trading characteristics and other market data and do not rely exclusively upon exchange or over-the-counter prices.
Trading on European and Far Eastern exchanges and over-the-counter markets is typically completed at various times before the close of business on each day on which the New York Stock Exchange (“NYSE”) is open. Each security trading on these exchanges or in over-the-counter markets may be valued utilizing a systematic fair valuation model provided by an independent pricing service approved by the board of trustees. The valuation of each security that meets certain criteria in relation to the valuation model is systematically adjusted to reflect the impact of movement in the U.S. market after the foreign markets close. Securities that do not meet the criteria, or that are principally traded in other foreign markets, are valued as of the last reported sale price at the time the Fund determines its NAV, or when reliable market prices or quotations are not readily available, at the mean between the most recent bid and asked quotations as of the close of the appropriate exchange or other designated time. Trading of foreign securities may not take place on every NYSE business day. In addition, trading may take place in various foreign markets on Saturdays or on other days when the NYSE is not open and on which the Fund's NAV is not calculated.
If the pricing committee determines that the valuation of a security in accordance with the methods described above is not reflective of a fair value for such security, the security is valued at a fair value by the pricing committee, under the ultimate supervision of the board of trustees, following the guidelines and/or procedures adopted by the board of trustees.
The Fund also may use fair value pricing, pursuant to guidelines adopted by the board of trustees and under the ultimate supervision of the board of trustees, if trading in the security is halted or if the value of a security it holds is materially affected by events occurring before the Fund's pricing time but after the close of the primary market or exchange on which the security is listed. Those procedures may utilize valuations furnished by pricing services approved by the board of trustees, which may be based on market transactions for comparable securities and various relationships between securities that are generally recognized by institutional traders, a computerized matrix system, or appraisals derived from information concerning the securities or similar securities received from recognized dealers in those securities.
When fair value pricing of securities is employed, the prices of securities used by a Fund to calculate its NAV may differ from market quotations or official closing prices. There can be no assurance that the Fund could purchase or sell a portfolio security at the price used to calculate the Fund’s net asset value (“NAV”). Foreign Currency Translation. Values of investments and other assets and liabilities denominated in foreign currencies are translated into U.S. dollars using a rate quoted by a major bank or dealer in the particular currency market, as reported by a recognized quotation dissemination service. Option Transactions. For hedging and investment purposes, the Fund may purchase or write (sell) put and call options. One of the risks associated with purchasing an option is that the Fund pays a premium whether or not the option is exercised. Additionally, the Fund bears the risk of loss of premium and change in value should the counterparty not perform under the contract. The Fund as writer of an option bears the market risk of an unfavorable change in the price of the security underlying the written option. Note 2 – Investments The cost basis of investments for federal income tax purposes at July 31, 2021 was as follows*: Cost basis of investments $176,356,988 Gross unrealized appreciation 27,420,064

Gross unrealized depreciation (6,546,504) Net unrealized appreciation (depreciation) $20,873,560
* Because tax adjustments are calculated annually, the above table does not reflect tax adjustments. For the previous fiscal year’s federal income tax information, please refer to the Notes to Financial Statements section in the Fund's most recent semi-annual or annual report. Note 3 – Mandatory Redeemable Preferred Shares On September 6, 2017, the Fund issued 480,000 mandatory redeemable preferred shares (“MRPS”) with an aggregate liquidation preference of $12.0 million. Offering costs incurred by the Fund in connection with the MRPS issuance are aggregated with the outstanding liability and are being amortized to Interest expense and amortization of offering costs on Mandatory Redeemable Preferred Shares over the respective life of each series of MRPS and shown in the Statement of Operations. The MRPS are divided into three series with different mandatory redemption dates and dividend rates. The table below summarizes the key terms of each series of the MRPS at July 31, 2021.
Series Term
Redemption Date Dividend Rate Shares (000’s) Liquidation Preference Per Share Aggregate Liquidation Preference Series A 9/06/22 3.70% 160 $25 $4,000,000 Series B 9/06/24 4.00% 160 $25 $4,000,000 Series C 9/06/27 4.24% 160 $25 $4,000,000
Total $12,000,000 The MRPS are not listed on any exchange or automated quotation system. The MRPS are considered debt of the issuer; therefore, the liquidation preference, which approximates fair value of the MRPS, is recorded as a liability in the Statement of Assets and Liabilities net of deferred offering costs. The MRPS are categorized as Level 2 within the fair value hierarchy. Previously, the MRPS had been assigned a rating of “AA” by Fitch Ratings, Inc. (“Fitch”). As of December 17, 2020, Kroll Bond Rating Agency LLC (“Kroll”) replaced Fitch as the rating agency for the MRPS. The MRPS have been assigned a rating of `AA-' by Kroll. If the ratings of the MRPS are downgraded, the Fund's dividend expense may increase, as described below. Holders of MRPS are entitled to receive monthly cumulative cash dividends payable on the first business day of each month. The MRPS currently are rated “AA-” by Kroll. If on the first day of a monthly dividend period the MRPS of any class are rated lower than “A” by Fitch (or lower than the equivalent of such rating by any other rating agency providing a rating pursuant to the request of the Fund, such as Kroll), the dividend rate for such period shall be increased by 0.5%, 2.0% or 4.0% according to an agreed upon schedule. The MRPS’ dividend rate is also subject to increase during periods when the Fund has not made timely payments to MRPS holders and/or the MRPS do not have a current credit rating, subject to various terms and conditions. Dividends accrued and paid to the shareholders of MRPS are included in "Interest expense and amortization of offering costs on Mandatory Redeemable Preferred Shares" within the Statement of Operations. The MRPS rank junior to the Fund’s borrowings under the SSB Agreement and senior to the Fund’s outstanding common stock. The Fund may, at its option, subject to various terms and conditions, redeem the MRPS, in whole or in part, at the liquidation preference amount plus all accumulated but unpaid dividends, plus a make whole premium equal to the discounted value of the remaining scheduled payments. Each class of MRPS is subject to mandatory redemption on the term redemption date specified in the table above. Periodically, the Fund is subject to an overcollateralization test based on applicable rating agency criteria (the “OC Test”) and an asset coverage test with respect to its outstanding senior securities (the “AC Test”). The Fund may be required to redeem MRPS before their term redemption date if it does not comply with one or both tests. So long as any MRPS are outstanding, the Fund may not declare, pay or set aside for payment cash dividends or other distributions on shares of its common stock unless (1) the Fund has satisfied the OC Test on at least one testing date in the preceding 65 days, (2) immediately after such transaction, the Fund would comply with the AC Test, (3) full cumulative dividends on the MRPS due on or prior to the date of such transaction have been declared and paid and (4) the Fund has redeemed all MRPS required to have been redeemed on such date or has deposited funds sufficient for such redemption, subject to certain grace periods and exceptions. Except as otherwise required pursuant to the Fund’s governing documents or applicable law, the holders of the MRPS have one vote per share and vote together with the holders of common stock of the Fund as a single class except on matters affecting only the holders of MRPS or the holders of common stock. Pursuant to the 1940 Act, holders of the MRPS have the right to elect at least two trustees of the Fund, voting separately as a class. Except during any time when the Fund has failed to make a dividend or redemption payment in respect of MRPS outstanding, the holders of MRPS have agreed to vote in accordance with the recommendation of the board of trustees on any matter submitted to them for their vote or to the vote of shareholders of the Fund generally.
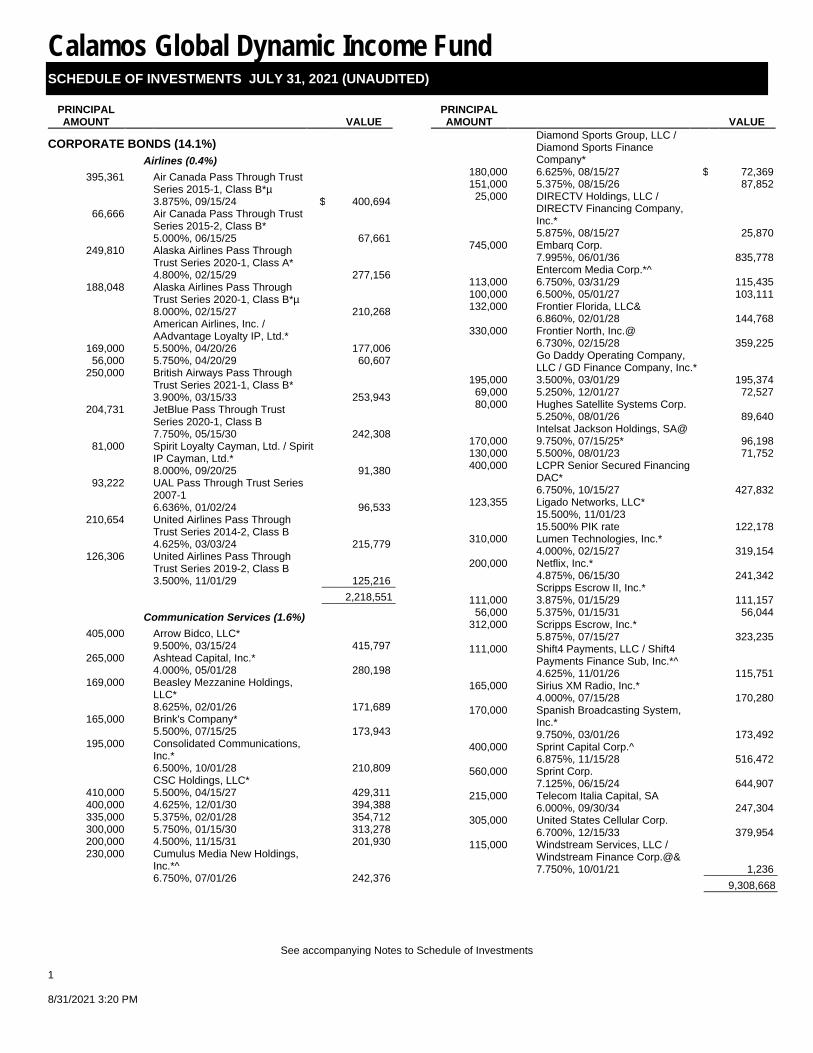
Calamos Global Dynamic Income Fund SCHEDULE OF INVESTMENTS JULY 31, 2021 (UNAUDITED)
See accompanying Notes to Schedule of Investments
1 8/31/2021 3:20 PM
PRINCIPAL AMOUNT VALUE
CORPORATE BONDS (14.1%) Airlines (0.4%)
395,361 Air Canada Pass Through Trust Series 2015-1, Class B*µ 3.875%, 09/15/24 $ 400,694
66,666 Air Canada Pass Through Trust Series 2015-2, Class B* 5.000%, 06/15/25 67,661
249,810 Alaska Airlines Pass Through Trust Series 2020-1, Class A* 4.800%, 02/15/29 277,156
188,048 Alaska Airlines Pass Through Trust Series 2020-1, Class B*µ 8.000%, 02/15/27 210,268
American Airlines, Inc. / AAdvantage Loyalty IP, Ltd.*
169,000 5.500%, 04/20/26 177,006 56,000 5.750%, 04/20/29 60,607
250,000 British Airways Pass Through Trust Series 2021-1, Class B* 3.900%, 03/15/33 253,943
204,731 JetBlue Pass Through Trust Series 2020-1, Class B 7.750%, 05/15/30 242,308
81,000 Spirit Loyalty Cayman, Ltd. / Spirit IP Cayman, Ltd.* 8.000%, 09/20/25 91,380
93,222 UAL Pass Through Trust Series 2007-1 6.636%, 01/02/24 96,533
210,654 United Airlines Pass Through Trust Series 2014-2, Class B 4.625%, 03/03/24 215,779
126,306 United Airlines Pass Through Trust Series 2019-2, Class B 3.500%, 11/01/29 125,216 ___________
2,218,551 ___________ Communication Services (1.6%)
405,000 Arrow Bidco, LLC* 9.500%, 03/15/24 415,797
265,000 Ashtead Capital, Inc.* 4.000%, 05/01/28 280,198
169,000 Beasley Mezzanine Holdings, LLC* 8.625%, 02/01/26 171,689
165,000 Brink's Company* 5.500%, 07/15/25 173,943
195,000 Consolidated Communications, Inc.* 6.500%, 10/01/28 210,809
CSC Holdings, LLC* 410,000 5.500%, 04/15/27 429,311 400,000 4.625%, 12/01/30 394,388 335,000 5.375%, 02/01/28 354,712 300,000 5.750%, 01/15/30 313,278 200,000 4.500%, 11/15/31 201,930 230,000 Cumulus Media New Holdings,
Inc.*^ 6.750%, 07/01/26 242,376
PRINCIPAL AMOUNT VALUE
Diamond Sports Group, LLC / Diamond Sports Finance Company*
180,000 6.625%, 08/15/27 $ 72,369 151,000 5.375%, 08/15/26 87,852
25,000 DIRECTV Holdings, LLC / DIRECTV Financing Company, Inc.* 5.875%, 08/15/27 25,870
745,000 Embarq Corp. 7.995%, 06/01/36 835,778
Entercom Media Corp.*^ 113,000 6.750%, 03/31/29 115,435 100,000 6.500%, 05/01/27 103,111 132,000 Frontier Florida, LLC&
6.860%, 02/01/28 144,768 330,000 Frontier North, Inc.@
6.730%, 02/15/28 359,225
Go Daddy Operating Company, LLC / GD Finance Company, Inc.*
195,000 3.500%, 03/01/29 195,374 69,000 5.250%, 12/01/27 72,527 80,000 Hughes Satellite Systems Corp.
5.250%, 08/01/26 89,640 Intelsat Jackson Holdings, SA@
170,000 9.750%, 07/15/25* 96,198 130,000 5.500%, 08/01/23 71,752 400,000 LCPR Senior Secured Financing
DAC* 6.750%, 10/15/27 427,832
123,355 Ligado Networks, LLC* 15.500%, 11/01/23 15.500% PIK rate 122,178
310,000 Lumen Technologies, Inc.* 4.000%, 02/15/27 319,154
200,000 Netflix, Inc.* 4.875%, 06/15/30 241,342
Scripps Escrow II, Inc.* 111,000 3.875%, 01/15/29 111,157
56,000 5.375%, 01/15/31 56,044 312,000 Scripps Escrow, Inc.*
5.875%, 07/15/27 323,235 111,000 Shift4 Payments, LLC / Shift4
Payments Finance Sub, Inc.*^ 4.625%, 11/01/26 115,751
165,000 Sirius XM Radio, Inc.* 4.000%, 07/15/28 170,280
170,000 Spanish Broadcasting System, Inc.* 9.750%, 03/01/26 173,492
400,000 Sprint Capital Corp.^ 6.875%, 11/15/28 516,472
560,000 Sprint Corp. 7.125%, 06/15/24 644,907
215,000 Telecom Italia Capital, SA 6.000%, 09/30/34 247,304
305,000 United States Cellular Corp. 6.700%, 12/15/33 379,954
115,000 Windstream Services, LLC / Windstream Finance Corp.@& 7.750%, 10/01/21 1,236 ___________
9,308,668 ___________
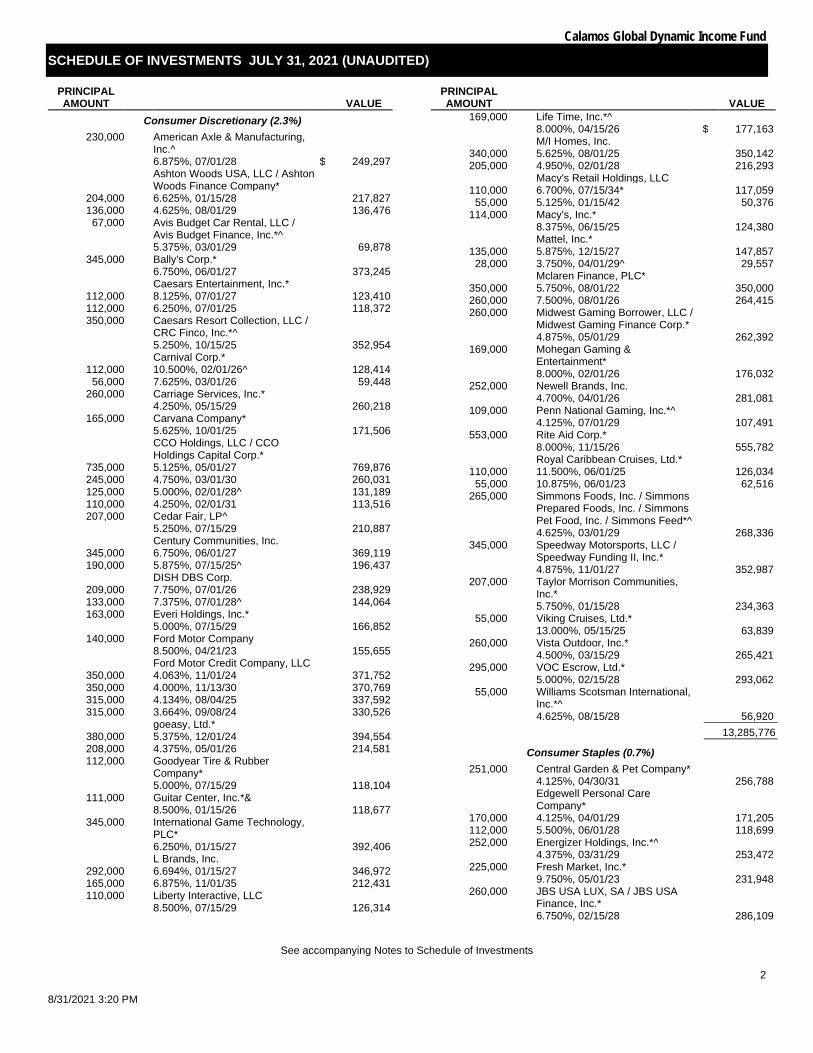
Calamos Global Dynamic Income Fund
SCHEDULE OF INVESTMENTS JULY 31, 2021 (UNAUDITED)
See accompanying Notes to Schedule of Investments
2
8/31/2021 3:20 PM
PRINCIPAL AMOUNT VALUE
Consumer Discretionary (2.3%) 230,000 American Axle & Manufacturing,
Inc.^ 6.875%, 07/01/28 $ 249,297
Ashton Woods USA, LLC / Ashton Woods Finance Company*
204,000 6.625%, 01/15/28 217,827 136,000 4.625%, 08/01/29 136,476
67,000 Avis Budget Car Rental, LLC / Avis Budget Finance, Inc.*^ 5.375%, 03/01/29 69,878
345,000 Bally's Corp.* 6.750%, 06/01/27 373,245
Caesars Entertainment, Inc.* 112,000 8.125%, 07/01/27 123,410 112,000 6.250%, 07/01/25 118,372 350,000 Caesars Resort Collection, LLC /
CRC Finco, Inc.*^ 5.250%, 10/15/25 352,954
Carnival Corp.* 112,000 10.500%, 02/01/26^ 128,414
56,000 7.625%, 03/01/26 59,448 260,000 Carriage Services, Inc.*
4.250%, 05/15/29 260,218 165,000 Carvana Company*
5.625%, 10/01/25 171,506
CCO Holdings, LLC / CCO Holdings Capital Corp.*
735,000 5.125%, 05/01/27 769,876 245,000 4.750%, 03/01/30 260,031 125,000 5.000%, 02/01/28^ 131,189 110,000 4.250%, 02/01/31 113,516 207,000 Cedar Fair, LP^
5.250%, 07/15/29 210,887 Century Communities, Inc.
345,000 6.750%, 06/01/27 369,119 190,000 5.875%, 07/15/25^ 196,437
DISH DBS Corp. 209,000 7.750%, 07/01/26 238,929 133,000 7.375%, 07/01/28^ 144,064 163,000 Everi Holdings, Inc.*
5.000%, 07/15/29 166,852 140,000 Ford Motor Company
8.500%, 04/21/23 155,655 Ford Motor Credit Company, LLC
350,000 4.063%, 11/01/24 371,752 350,000 4.000%, 11/13/30 370,769 315,000 4.134%, 08/04/25 337,592 315,000 3.664%, 09/08/24 330,526
goeasy, Ltd.* 380,000 5.375%, 12/01/24 394,554 208,000 4.375%, 05/01/26 214,581 112,000 Goodyear Tire & Rubber
Company* 5.000%, 07/15/29 118,104
111,000 Guitar Center, Inc.*& 8.500%, 01/15/26 118,677
345,000 International Game Technology, PLC* 6.250%, 01/15/27 392,406
L Brands, Inc. 292,000 6.694%, 01/15/27 346,972 165,000 6.875%, 11/01/35 212,431 110,000 Liberty Interactive, LLC
8.500%, 07/15/29 126,314
PRINCIPAL AMOUNT VALUE
169,000 Life Time, Inc.*^ 8.000%, 04/15/26 $ 177,163
M/I Homes, Inc. 340,000 5.625%, 08/01/25 350,142 205,000 4.950%, 02/01/28 216,293
Macy's Retail Holdings, LLC 110,000 6.700%, 07/15/34* 117,059
55,000 5.125%, 01/15/42 50,376 114,000 Macy's, Inc.*
8.375%, 06/15/25 124,380 Mattel, Inc.*
135,000 5.875%, 12/15/27 147,857 28,000 3.750%, 04/01/29^ 29,557
Mclaren Finance, PLC* 350,000 5.750%, 08/01/22 350,000 260,000 7.500%, 08/01/26 264,415 260,000 Midwest Gaming Borrower, LLC /
Midwest Gaming Finance Corp.* 4.875%, 05/01/29 262,392
169,000 Mohegan Gaming & Entertainment* 8.000%, 02/01/26 176,032
252,000 Newell Brands, Inc. 4.700%, 04/01/26 281,081
109,000 Penn National Gaming, Inc.*^ 4.125%, 07/01/29 107,491
553,000 Rite Aid Corp.* 8.000%, 11/15/26 555,782
Royal Caribbean Cruises, Ltd.* 110,000 11.500%, 06/01/25 126,034
55,000 10.875%, 06/01/23 62,516 265,000 Simmons Foods, Inc. / Simmons
Prepared Foods, Inc. / Simmons Pet Food, Inc. / Simmons Feed*^ 4.625%, 03/01/29 268,336
345,000 Speedway Motorsports, LLC / Speedway Funding II, Inc.* 4.875%, 11/01/27 352,987
207,000 Taylor Morrison Communities, Inc.* 5.750%, 01/15/28 234,363
55,000 Viking Cruises, Ltd.* 13.000%, 05/15/25 63,839
260,000 Vista Outdoor, Inc.* 4.500%, 03/15/29 265,421
295,000 VOC Escrow, Ltd.* 5.000%, 02/15/28 293,062
55,000 Williams Scotsman International, Inc.*^ 4.625%, 08/15/28 56,920 ___________
13,285,776 ___________ Consumer Staples (0.7%)
251,000 Central Garden & Pet Company* 4.125%, 04/30/31 256,788
Edgewell Personal Care Company*
170,000 4.125%, 04/01/29 171,205 112,000 5.500%, 06/01/28 118,699 252,000 Energizer Holdings, Inc.*^
4.375%, 03/31/29 253,472 225,000 Fresh Market, Inc.*
9.750%, 05/01/23 231,948 260,000 JBS USA LUX, SA / JBS USA
Finance, Inc.* 6.750%, 02/15/28 286,109

Calamos Global Dynamic Income Fund
SCHEDULE OF INVESTMENTS JULY 31, 2021 (UNAUDITED)
See accompanying Notes to Schedule of Investments
3 8/31/2021 3:20 PM
PRINCIPAL AMOUNT VALUE
109,000 JBS USA LUX, SA / JBS USA Food Company / JBS USA Finance, Inc.* 6.500%, 04/15/29 $ 122,903
Kraft Heinz Foods Company 335,000 4.375%, 06/01/46 385,846
56,000 4.250%, 03/01/31 64,566 56,000 3.875%, 05/15/27^ 62,037
174,000 New Albertsons, LP 7.750%, 06/15/26 199,900
217,000 Performance Food Group, Inc.* 4.250%, 08/01/29 220,839
405,000 Pilgrim's Pride Corp.* 5.875%, 09/30/27 433,609
Post Holdings, Inc.* 310,000 5.750%, 03/01/27 323,330 160,000 4.625%, 04/15/30^ 163,158 209,000 Prestige Brands, Inc.*
3.750%, 04/01/31 207,502 245,000 United Natural Foods, Inc.*^
6.750%, 10/15/28 264,928 Vector Group, Ltd.*
345,000 5.750%, 02/01/29 351,576 136,000 10.500%, 11/01/26 144,726 ___________
4,263,141 ___________ Energy (1.4%)
Antero Resources Corp.* 81,000 7.625%, 02/01/29 88,792 56,000 5.375%, 03/01/30^ 57,027
Apache Corp. 223,000 5.100%, 09/01/40 239,422 127,000 4.875%, 11/15/27 136,787 112,000 4.625%, 11/15/25 120,521
15,087 Bonanza Creek Energy, Inc. 7.500%, 04/30/26 15,220
Buckeye Partners, LP 205,000 3.950%, 12/01/26 208,417 135,000 5.850%, 11/15/43 137,427 168,000 ChampionX Corp.
6.375%, 05/01/26 175,980 Cheniere Energy Partners, LP
295,000 5.625%, 10/01/26 305,107 55,000 4.000%, 03/01/31*^ 58,230
112,000 Cheniere Energy, Inc. 4.625%, 10/15/28 118,359
Continental Resources, Inc.^ 230,000 3.800%, 06/01/24 241,516 170,000 4.375%, 01/15/28 190,021 410,000 DCP Midstream Operating, LP*‡
5.850%, 05/21/43 3 mo. USD LIBOR + 3.85% 385,863
3,142 Diamond Foreign Asset Company / Diamond Finance, LLC 13.000%, 04/22/27 13.000% PIK rate 3,152
114,000 DT Midstream, Inc.* 4.125%, 06/15/29 117,010
Energy Transfer, LP‡ 320,000 3.143%, 11/01/66
3 mo. USD LIBOR + 3.02% 264,090 162,000 6.500%, 11/15/26
5 year CMT + 5.69% 165,927 EnLink Midstream Partners, LP
330,000 6.000%, 12/15/22‡ 3 mo. USD LIBOR + 4.11% 255,628
PRINCIPAL AMOUNT VALUE
224,000 4.850%, 07/15/26 $ 234,472 EQT Corp.
145,000 7.500%, 02/01/30 190,644 90,000 6.625%, 02/01/25 104,106 65,000 5.000%, 01/15/29 73,528
293,000 Genesis Energy, LP / Genesis Energy Finance Corp. 6.250%, 05/15/26 289,613
Gulfport Energy Operating Corp. 215,000 6.375%, 05/15/25@ 9,137
62,910 8.000%, 05/17/26^ 67,391 Laredo Petroleum, Inc.
229,000 10.125%, 01/15/28 242,715 57,000 7.750%, 07/31/29* 55,206
245,000 Magnolia Oil & Gas Operating, LLC / Magnolia Oil & Gas Finance Corp.*^ 6.000%, 08/01/26 251,225
Moss Creek Resources Holdings, Inc.*
135,000 10.500%, 05/15/27 129,758 135,000 7.500%, 01/15/26 122,279 113,000 Murphy Oil Corp.
6.375%, 07/15/28 119,695 New Fortress Energy, Inc.*
113,000 6.500%, 09/30/26 114,344 111,000 6.750%, 09/15/25 113,378 125,000 Nine Energy Service, Inc.*
8.750%, 11/01/23 75,270 56,000 Oasis Midstream Partners, LP /
OMP Finance Corp.* 8.000%, 04/01/29 58,598
Occidental Petroleum Corp. 690,000 4.300%, 08/15/39 685,032 510,000 2.900%, 08/15/24 514,192 114,000 5.875%, 09/01/25^ 126,480
60,000 Ovintiv, Inc.^ 6.500%, 08/15/34 80,156
130,000 Par Petroleum, LLC / Par Petroleum Finance Corp.* 7.750%, 12/15/25 129,174
205,000 Parkland Corp. / Canada* 5.875%, 07/15/27 218,825
270,000 Plains All American Pipeline, LP‡ 6.125%, 11/15/22 3 mo. USD LIBOR + 4.11% 242,128
83,000 Range Resources Corp.* 8.250%, 01/15/29 92,004
147,000 Transocean, Inc.*^ 11.500%, 01/30/27 146,449
Venture Global Calcasieu Pass, LLC*
55,000 4.125%, 08/15/31 56,738 55,000 3.875%, 08/15/29 56,226
112,000 Vine Energy Holdings, LLC* 6.750%, 04/15/29 117,066
135,000 Viper Energy Partners, LP* 5.375%, 11/01/27 141,651
220,000 W&T Offshore, Inc.* 9.750%, 11/01/23 211,886
128,000 Weatherford International, Ltd.* 11.000%, 12/01/24 132,622 ___________
8,486,484 ___________

Calamos Global Dynamic Income Fund
SCHEDULE OF INVESTMENTS JULY 31, 2021 (UNAUDITED)
See accompanying Notes to Schedule of Investments
4
8/31/2021 3:20 PM
PRINCIPAL AMOUNT VALUE
Financials (2.7%)
Acrisure, LLC / Acrisure Finance, Inc.*
552,000 7.000%, 11/15/25^ $ 561,732 333,000 6.000%, 08/01/29 333,250 168,000 Aethon United BR, LP / Aethon
United Finance Corp.* 8.250%, 02/15/26 179,992
253,000 AG Issuer, LLC* 6.250%, 03/01/28 266,083
400,000 Alliant Holdings Intermediate, LLC / Alliant Holdings Co-Issuer* 6.750%, 10/15/27 418,344
Ally Financial, Inc. 195,000 4.700%, 05/15/26‡
5 year CMT + 3.87 204,941 175,000 8.000%, 11/01/31 255,136 100,000 4.700%, 05/15/28‡
7 year CMT + 3.48% 104,173 220,000 AmWINS Group, Inc.*
4.875%, 06/30/29 224,675 470,000 AssuredPartners, Inc.*
7.000%, 08/15/25 479,062 248,000 Aviation Capital Group, LLC*
3.500%, 11/01/27 264,147 226,000 BroadStreet Partners, Inc.*
5.875%, 04/15/29 230,398 709,000 Brookfield Property REIT, Inc. /
BPR Cumulus, LLC / BPR Nimbus, LLC / GGSI Sellco LL*^ 5.750%, 05/15/26 738,168
Credit Acceptance Corp. 237,000 5.125%, 12/31/24*^ 245,195 230,000 6.625%, 03/15/26 243,377
70,000 Cushman & Wakefield US Borrower, LLC* 6.750%, 05/15/28 75,275
345,000 Donnelley Financial Solutions, Inc. 8.250%, 10/15/24 357,837
235,000 Enact Holdings, Inc.*^ 6.500%, 08/15/25 255,194
321,000 Global Net Lease, Inc. / Global Net Lease Operating Partnership, LP* 3.750%, 12/15/27 318,837
417,000 Greystar Real Estate Partners, LLC* 5.750%, 12/01/25 427,479
485,000 HUB International, Ltd.* 7.000%, 05/01/26 503,100
Icahn Enterprises, LP / Icahn Enterprises Finance Corp.
325,000 5.250%, 05/15/27 342,326 164,000 4.375%, 02/01/29 166,221 500,000 ILFC E-Capital Trust II*‡
3.910%, 12/21/65 3 mo. USD LIBOR + 1.80% 423,425
465,000 Iron Mountain, Inc.*^ 5.250%, 03/15/28 487,766
Jefferies Finance, LLC / JFIN Co-Issuer Corp.*
600,000 5.000%, 08/15/28 614,586 350,000 6.250%, 06/03/26 377,353
PRINCIPAL AMOUNT VALUE
Ladder Capital Finance Holdings LLLP / Ladder Capital Finance Corp.*
447,000 5.250%, 10/01/25 $ 454,443 109,000 4.750%, 06/15/29 108,662 256,000 LD Holdings Group, LLC*
6.125%, 04/01/28 254,403 Level 3 Financing, Inc.
260,000 5.375%, 05/01/25 266,092 235,000 4.250%, 07/01/28* 239,674
LPL Holdings, Inc.* 277,000 4.000%, 03/15/29 281,734
82,000 4.375%, 05/15/31 84,167 487,000 MetLife, Inc.^
6.400%, 12/15/66 624,543 Navient Corp.
493,000 5.000%, 03/15/27^ 514,426 260,000 4.875%, 03/15/28 262,491
OneMain Finance Corp. 350,000 7.125%, 03/15/26 412,405 210,000 6.875%, 03/15/25 238,730
Park Intermediate Holdings, LLC / PK Domestic Property, LLC / PK Finance Co-Issuer*
134,000 7.500%, 06/01/25 145,343 110,000 5.875%, 10/01/28 117,434 140,000 PHH Mortgage Corp.*
7.875%, 03/15/26 143,900 260,000 Prospect Capital Corp.µ
3.706%, 01/22/26 270,093 100,000 Quicken Loans, LLC / Quicken
Loans Co-Issuer, Inc.* 3.625%, 03/01/29 100,793
345,000 Radian Group, Inc. 4.875%, 03/15/27 375,232
260,000 RHP Hotel Properties, LP / RHP Finance Corp.* 4.500%, 02/15/29 262,964
162,000 RLJ Lodging Trust, LP* 3.750%, 07/01/26 164,333
135,000 SLM Corp. 4.200%, 10/29/25 146,295
365,000 Starwood Property Trust, Inc.^ 4.750%, 03/15/25 387,382
227,000 StoneX Group, Inc.* 8.625%, 06/15/25 246,828
United Wholesale Mortgage, LLC* 167,000 5.500%, 11/15/25 172,269 113,000 5.500%, 04/15/29 112,568 272,000 VICI Properties, LP / VICI Note
Company, Inc.*^ 3.750%, 02/15/27 280,367
XHR, LP* 237,000 6.375%, 08/15/25 252,827 108,000 4.875%, 06/01/29 110,624 ___________
16,129,094 ___________ Health Care (1.3%)
112,000 Acadia Healthcare Company, Inc.* 5.000%, 04/15/29 117,895
500,000 Bausch Health Americas, Inc.* 8.500%, 01/31/27 541,580
Bausch Health Companies, Inc.* 315,000 5.250%, 02/15/31^ 295,498 245,000 5.000%, 01/30/28 234,512
96,000 5.000%, 02/15/29 90,792
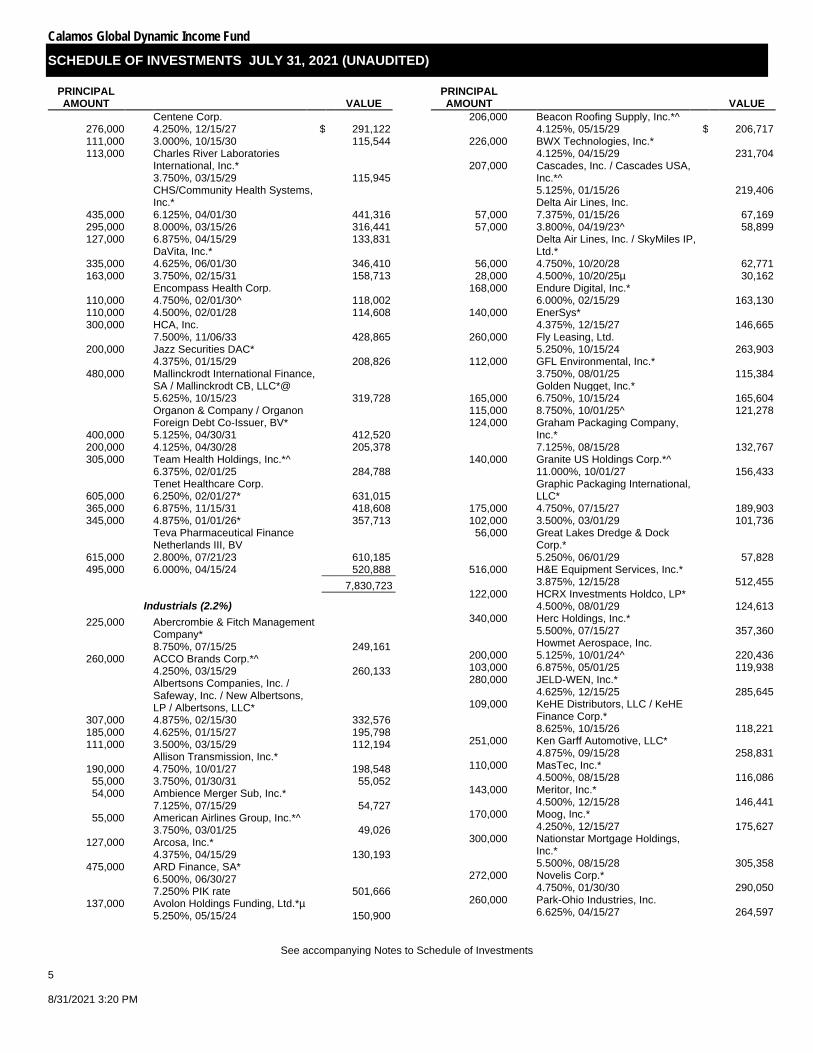
Calamos Global Dynamic Income Fund
SCHEDULE OF INVESTMENTS JULY 31, 2021 (UNAUDITED)
See accompanying Notes to Schedule of Investments
5 8/31/2021 3:20 PM
PRINCIPAL AMOUNT VALUE
Centene Corp. 276,000 4.250%, 12/15/27 $ 291,122 111,000 3.000%, 10/15/30 115,544 113,000 Charles River Laboratories
International, Inc.* 3.750%, 03/15/29 115,945
CHS/Community Health Systems, Inc.*
435,000 6.125%, 04/01/30 441,316 295,000 8.000%, 03/15/26 316,441 127,000 6.875%, 04/15/29 133,831
DaVita, Inc.* 335,000 4.625%, 06/01/30 346,410 163,000 3.750%, 02/15/31 158,713
Encompass Health Corp. 110,000 4.750%, 02/01/30^ 118,002 110,000 4.500%, 02/01/28 114,608 300,000 HCA, Inc.
7.500%, 11/06/33 428,865 200,000 Jazz Securities DAC*
4.375%, 01/15/29 208,826 480,000 Mallinckrodt International Finance,
SA / Mallinckrodt CB, LLC*@ 5.625%, 10/15/23 319,728
Organon & Company / Organon Foreign Debt Co-Issuer, BV*
400,000 5.125%, 04/30/31 412,520 200,000 4.125%, 04/30/28 205,378 305,000 Team Health Holdings, Inc.*^
6.375%, 02/01/25 284,788 Tenet Healthcare Corp.
605,000 6.250%, 02/01/27* 631,015 365,000 6.875%, 11/15/31 418,608 345,000 4.875%, 01/01/26* 357,713
Teva Pharmaceutical Finance Netherlands III, BV
615,000 2.800%, 07/21/23 610,185 495,000 6.000%, 04/15/24 520,888 ___________
7,830,723 ___________ Industrials (2.2%)
225,000 Abercrombie & Fitch Management Company* 8.750%, 07/15/25 249,161
260,000 ACCO Brands Corp.*^ 4.250%, 03/15/29 260,133
Albertsons Companies, Inc. / Safeway, Inc. / New Albertsons, LP / Albertsons, LLC*
307,000 4.875%, 02/15/30 332,576 185,000 4.625%, 01/15/27 195,798 111,000 3.500%, 03/15/29 112,194
Allison Transmission, Inc.* 190,000 4.750%, 10/01/27 198,548
55,000 3.750%, 01/30/31 55,052 54,000 Ambience Merger Sub, Inc.*
7.125%, 07/15/29 54,727 55,000 American Airlines Group, Inc.*^
3.750%, 03/01/25 49,026 127,000 Arcosa, Inc.*
4.375%, 04/15/29 130,193 475,000 ARD Finance, SA*
6.500%, 06/30/27 7.250% PIK rate 501,666
137,000 Avolon Holdings Funding, Ltd.*µ 5.250%, 05/15/24 150,900
PRINCIPAL AMOUNT VALUE
206,000 Beacon Roofing Supply, Inc.*^ 4.125%, 05/15/29 $ 206,717
226,000 BWX Technologies, Inc.* 4.125%, 04/15/29 231,704
207,000 Cascades, Inc. / Cascades USA, Inc.*^ 5.125%, 01/15/26 219,406
Delta Air Lines, Inc. 57,000 7.375%, 01/15/26 67,169 57,000 3.800%, 04/19/23^ 58,899
Delta Air Lines, Inc. / SkyMiles IP, Ltd.*
56,000 4.750%, 10/20/28 62,771 28,000 4.500%, 10/20/25µ 30,162
168,000 Endure Digital, Inc.* 6.000%, 02/15/29 163,130
140,000 EnerSys* 4.375%, 12/15/27 146,665
260,000 Fly Leasing, Ltd. 5.250%, 10/15/24 263,903
112,000 GFL Environmental, Inc.* 3.750%, 08/01/25 115,384
Golden Nugget, Inc.* 165,000 6.750%, 10/15/24 165,604 115,000 8.750%, 10/01/25^ 121,278 124,000 Graham Packaging Company,
Inc.* 7.125%, 08/15/28 132,767
140,000 Granite US Holdings Corp.*^ 11.000%, 10/01/27 156,433
Graphic Packaging International, LLC*
175,000 4.750%, 07/15/27 189,903 102,000 3.500%, 03/01/29 101,736
56,000 Great Lakes Dredge & Dock Corp.* 5.250%, 06/01/29 57,828
516,000 H&E Equipment Services, Inc.* 3.875%, 12/15/28 512,455
122,000 HCRX Investments Holdco, LP* 4.500%, 08/01/29 124,613
340,000 Herc Holdings, Inc.* 5.500%, 07/15/27 357,360
Howmet Aerospace, Inc. 200,000 5.125%, 10/01/24^ 220,436 103,000 6.875%, 05/01/25 119,938 280,000 JELD-WEN, Inc.*
4.625%, 12/15/25 285,645 109,000 KeHE Distributors, LLC / KeHE
Finance Corp.* 8.625%, 10/15/26 118,221
251,000 Ken Garff Automotive, LLC* 4.875%, 09/15/28 258,831
110,000 MasTec, Inc.* 4.500%, 08/15/28 116,086
143,000 Meritor, Inc.* 4.500%, 12/15/28 146,441
170,000 Moog, Inc.* 4.250%, 12/15/27 175,627
300,000 Nationstar Mortgage Holdings, Inc.* 5.500%, 08/15/28 305,358
272,000 Novelis Corp.* 4.750%, 01/30/30 290,050
260,000 Park-Ohio Industries, Inc. 6.625%, 04/15/27 264,597
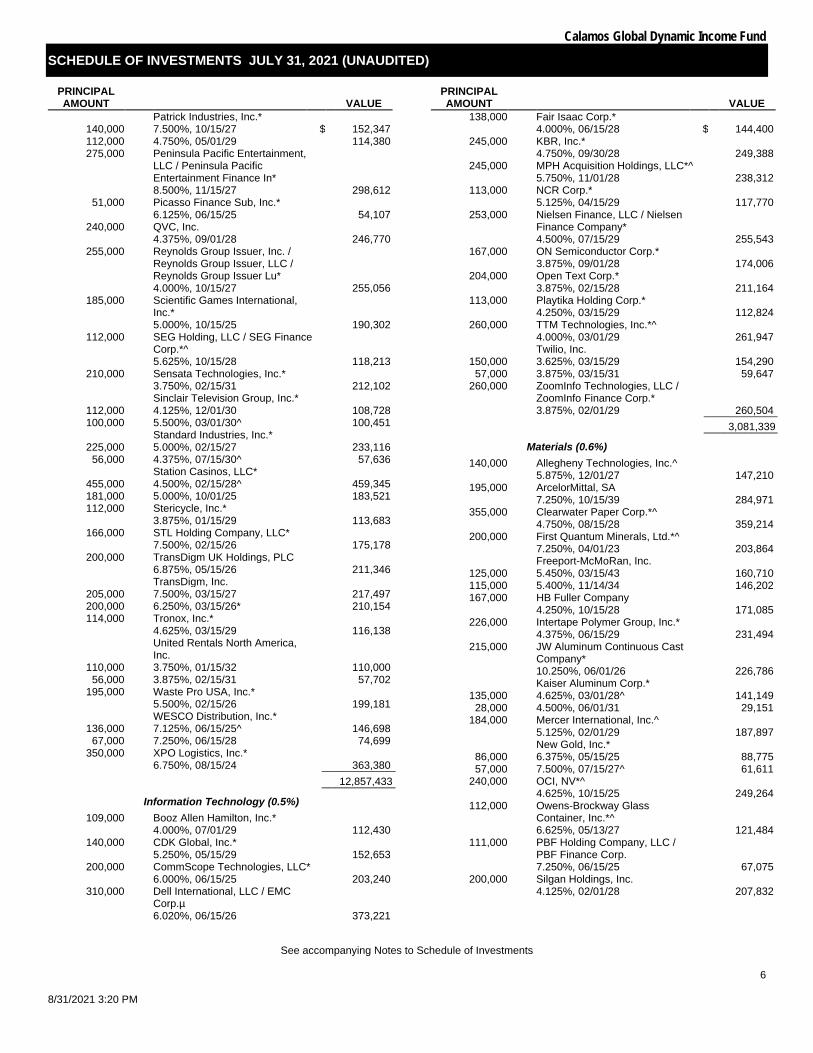
Calamos Global Dynamic Income Fund
SCHEDULE OF INVESTMENTS JULY 31, 2021 (UNAUDITED)
See accompanying Notes to Schedule of Investments
6
8/31/2021 3:20 PM
PRINCIPAL AMOUNT VALUE
Patrick Industries, Inc.* 140,000 7.500%, 10/15/27 $ 152,347 112,000 4.750%, 05/01/29 114,380 275,000 Peninsula Pacific Entertainment,
LLC / Peninsula Pacific Entertainment Finance In* 8.500%, 11/15/27 298,612
51,000 Picasso Finance Sub, Inc.* 6.125%, 06/15/25 54,107
240,000 QVC, Inc. 4.375%, 09/01/28 246,770
255,000 Reynolds Group Issuer, Inc. / Reynolds Group Issuer, LLC / Reynolds Group Issuer Lu* 4.000%, 10/15/27 255,056
185,000 Scientific Games International, Inc.* 5.000%, 10/15/25 190,302
112,000 SEG Holding, LLC / SEG Finance Corp.*^ 5.625%, 10/15/28 118,213
210,000 Sensata Technologies, Inc.* 3.750%, 02/15/31 212,102
Sinclair Television Group, Inc.* 112,000 4.125%, 12/01/30 108,728 100,000 5.500%, 03/01/30^ 100,451
Standard Industries, Inc.* 225,000 5.000%, 02/15/27 233,116
56,000 4.375%, 07/15/30^ 57,636 Station Casinos, LLC*
455,000 4.500%, 02/15/28^ 459,345 181,000 5.000%, 10/01/25 183,521 112,000 Stericycle, Inc.*
3.875%, 01/15/29 113,683 166,000 STL Holding Company, LLC*
7.500%, 02/15/26 175,178 200,000 TransDigm UK Holdings, PLC
6.875%, 05/15/26 211,346 TransDigm, Inc.
205,000 7.500%, 03/15/27 217,497 200,000 6.250%, 03/15/26* 210,154 114,000 Tronox, Inc.*
4.625%, 03/15/29 116,138
United Rentals North America, Inc.
110,000 3.750%, 01/15/32 110,000 56,000 3.875%, 02/15/31 57,702
195,000 Waste Pro USA, Inc.* 5.500%, 02/15/26 199,181
WESCO Distribution, Inc.* 136,000 7.125%, 06/15/25^ 146,698
67,000 7.250%, 06/15/28 74,699 350,000 XPO Logistics, Inc.*
6.750%, 08/15/24 363,380 ___________ 12,857,433 ___________
Information Technology (0.5%) 109,000 Booz Allen Hamilton, Inc.*
4.000%, 07/01/29 112,430 140,000 CDK Global, Inc.*
5.250%, 05/15/29 152,653 200,000 CommScope Technologies, LLC*
6.000%, 06/15/25 203,240 310,000 Dell International, LLC / EMC
Corp.µ 6.020%, 06/15/26 373,221
PRINCIPAL AMOUNT VALUE
138,000 Fair Isaac Corp.* 4.000%, 06/15/28 $ 144,400
245,000 KBR, Inc.* 4.750%, 09/30/28 249,388
245,000 MPH Acquisition Holdings, LLC*^ 5.750%, 11/01/28 238,312
113,000 NCR Corp.* 5.125%, 04/15/29 117,770
253,000 Nielsen Finance, LLC / Nielsen Finance Company* 4.500%, 07/15/29 255,543
167,000 ON Semiconductor Corp.* 3.875%, 09/01/28 174,006
204,000 Open Text Corp.* 3.875%, 02/15/28 211,164
113,000 Playtika Holding Corp.* 4.250%, 03/15/29 112,824
260,000 TTM Technologies, Inc.*^ 4.000%, 03/01/29 261,947
Twilio, Inc. 150,000 3.625%, 03/15/29 154,290
57,000 3.875%, 03/15/31 59,647 260,000 ZoomInfo Technologies, LLC /
ZoomInfo Finance Corp.* 3.875%, 02/01/29 260,504 ___________
3,081,339 ___________ Materials (0.6%)
140,000 Allegheny Technologies, Inc.^ 5.875%, 12/01/27 147,210
195,000 ArcelorMittal, SA 7.250%, 10/15/39 284,971
355,000 Clearwater Paper Corp.*^ 4.750%, 08/15/28 359,214
200,000 First Quantum Minerals, Ltd.*^ 7.250%, 04/01/23 203,864
Freeport-McMoRan, Inc. 125,000 5.450%, 03/15/43 160,710 115,000 5.400%, 11/14/34 146,202 167,000 HB Fuller Company
4.250%, 10/15/28 171,085 226,000 Intertape Polymer Group, Inc.*
4.375%, 06/15/29 231,494 215,000 JW Aluminum Continuous Cast
Company* 10.250%, 06/01/26 226,786
Kaiser Aluminum Corp.* 135,000 4.625%, 03/01/28^ 141,149
28,000 4.500%, 06/01/31 29,151 184,000 Mercer International, Inc.^
5.125%, 02/01/29 187,897 New Gold, Inc.*
86,000 6.375%, 05/15/25 88,775 57,000 7.500%, 07/15/27^ 61,611
240,000 OCI, NV*^ 4.625%, 10/15/25 249,264
112,000 Owens-Brockway Glass Container, Inc.*^ 6.625%, 05/13/27 121,484
111,000 PBF Holding Company, LLC / PBF Finance Corp. 7.250%, 06/15/25 67,075
200,000 Silgan Holdings, Inc. 4.125%, 02/01/28 207,832
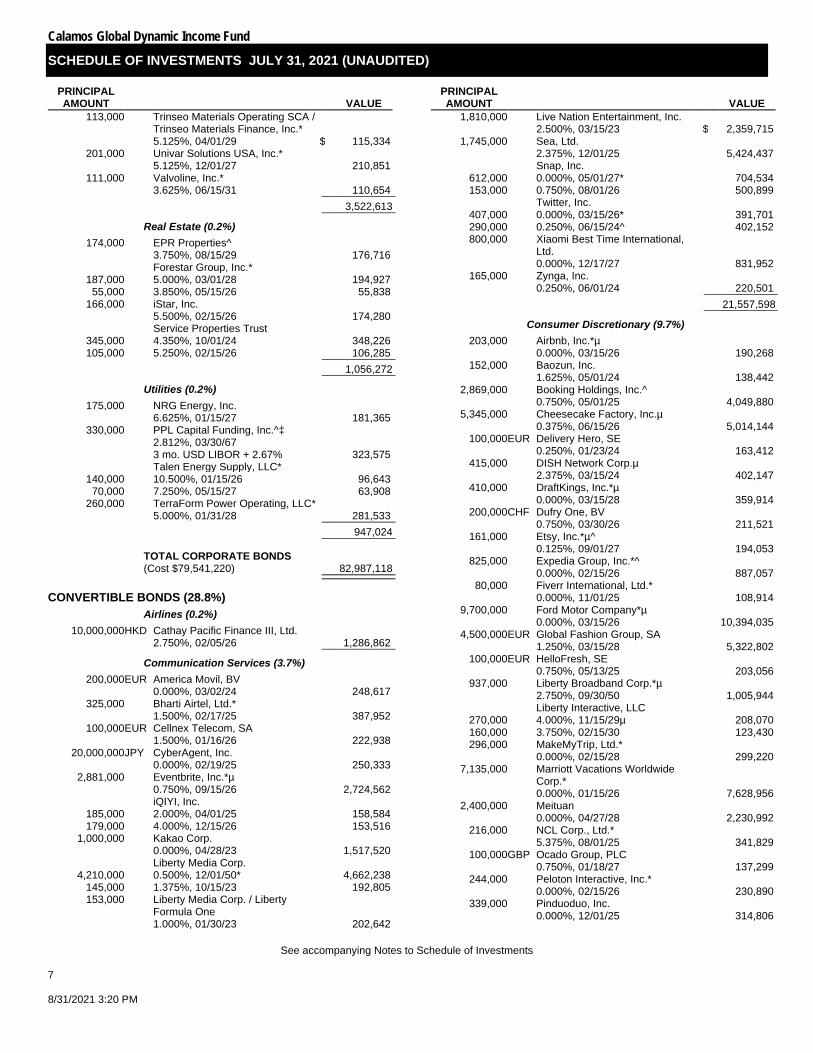
Calamos Global Dynamic Income Fund
SCHEDULE OF INVESTMENTS JULY 31, 2021 (UNAUDITED)
See accompanying Notes to Schedule of Investments
7 8/31/2021 3:20 PM
PRINCIPAL AMOUNT VALUE
113,000 Trinseo Materials Operating SCA / Trinseo Materials Finance, Inc.* 5.125%, 04/01/29 $ 115,334
201,000 Univar Solutions USA, Inc.* 5.125%, 12/01/27 210,851
111,000 Valvoline, Inc.* 3.625%, 06/15/31 110,654 ___________
3,522,613 ___________ Real Estate (0.2%)
174,000 EPR Properties^ 3.750%, 08/15/29 176,716
Forestar Group, Inc.* 187,000 5.000%, 03/01/28 194,927
55,000 3.850%, 05/15/26 55,838 166,000 iStar, Inc.
5.500%, 02/15/26 174,280 Service Properties Trust
345,000 4.350%, 10/01/24 348,226 105,000 5.250%, 02/15/26 106,285 ___________
1,056,272 ___________ Utilities (0.2%)
175,000 NRG Energy, Inc. 6.625%, 01/15/27 181,365
330,000 PPL Capital Funding, Inc.^‡ 2.812%, 03/30/67 3 mo. USD LIBOR + 2.67% 323,575
Talen Energy Supply, LLC* 140,000 10.500%, 01/15/26 96,643
70,000 7.250%, 05/15/27 63,908 260,000 TerraForm Power Operating, LLC*
5.000%, 01/31/28 281,533 ___________ 947,024 ___________
TOTAL CORPORATE BONDS (Cost $79,541,220) 82,987,118 ___________ ___________
CONVERTIBLE BONDS (28.8%) Airlines (0.2%)
10,000,000 HKD Cathay Pacific Finance III, Ltd. 2.750%, 02/05/26 1,286,862 ___________
Communication Services (3.7%) 200,000 EUR America Movil, BV
0.000%, 03/02/24 248,617 325,000 Bharti Airtel, Ltd.*
1.500%, 02/17/25 387,952 100,000 EUR Cellnex Telecom, SA
1.500%, 01/16/26 222,938 20,000,000 JPY CyberAgent, Inc.
0.000%, 02/19/25 250,333 2,881,000 Eventbrite, Inc.*µ
0.750%, 09/15/26 2,724,562 iQIYI, Inc.
185,000 2.000%, 04/01/25 158,584 179,000 4.000%, 12/15/26 153,516
1,000,000 Kakao Corp. 0.000%, 04/28/23 1,517,520
Liberty Media Corp. 4,210,000 0.500%, 12/01/50* 4,662,238
145,000 1.375%, 10/15/23 192,805 153,000 Liberty Media Corp. / Liberty
Formula One 1.000%, 01/30/23 202,642
PRINCIPAL AMOUNT VALUE
1,810,000 Live Nation Entertainment, Inc. 2.500%, 03/15/23 $ 2,359,715
1,745,000 Sea, Ltd. 2.375%, 12/01/25 5,424,437
Snap, Inc. 612,000 0.000%, 05/01/27* 704,534 153,000 0.750%, 08/01/26 500,899
Twitter, Inc. 407,000 0.000%, 03/15/26* 391,701 290,000 0.250%, 06/15/24^ 402,152 800,000 Xiaomi Best Time International,
Ltd. 0.000%, 12/17/27 831,952
165,000 Zynga, Inc. 0.250%, 06/01/24 220,501 ___________
21,557,598 ___________ Consumer Discretionary (9.7%)
203,000 Airbnb, Inc.*µ 0.000%, 03/15/26 190,268
152,000 Baozun, Inc. 1.625%, 05/01/24 138,442
2,869,000 Booking Holdings, Inc.^ 0.750%, 05/01/25 4,049,880
5,345,000 Cheesecake Factory, Inc.µ 0.375%, 06/15/26 5,014,144
100,000 EUR Delivery Hero, SE 0.250%, 01/23/24 163,412
415,000 DISH Network Corp.µ 2.375%, 03/15/24 402,147
410,000 DraftKings, Inc.*µ 0.000%, 03/15/28 359,914
200,000 CHF Dufry One, BV 0.750%, 03/30/26 211,521
161,000 Etsy, Inc.*µ^ 0.125%, 09/01/27 194,053
825,000 Expedia Group, Inc.*^ 0.000%, 02/15/26 887,057
80,000 Fiverr International, Ltd.* 0.000%, 11/01/25 108,914
9,700,000 Ford Motor Company*µ 0.000%, 03/15/26 10,394,035
4,500,000 EUR Global Fashion Group, SA 1.250%, 03/15/28 5,322,802
100,000 EUR HelloFresh, SE 0.750%, 05/13/25 203,056
937,000 Liberty Broadband Corp.*µ 2.750%, 09/30/50 1,005,944
Liberty Interactive, LLC 270,000 4.000%, 11/15/29µ 208,070 160,000 3.750%, 02/15/30 123,430 296,000 MakeMyTrip, Ltd.*
0.000%, 02/15/28 299,220 7,135,000 Marriott Vacations Worldwide
Corp.* 0.000%, 01/15/26 7,628,956
2,400,000 Meituan 0.000%, 04/27/28 2,230,992
216,000 NCL Corp., Ltd.* 5.375%, 08/01/25 341,829
100,000 GBP Ocado Group, PLC 0.750%, 01/18/27 137,299
244,000 Peloton Interactive, Inc.* 0.000%, 02/15/26 230,890
339,000 Pinduoduo, Inc. 0.000%, 12/01/25 314,806
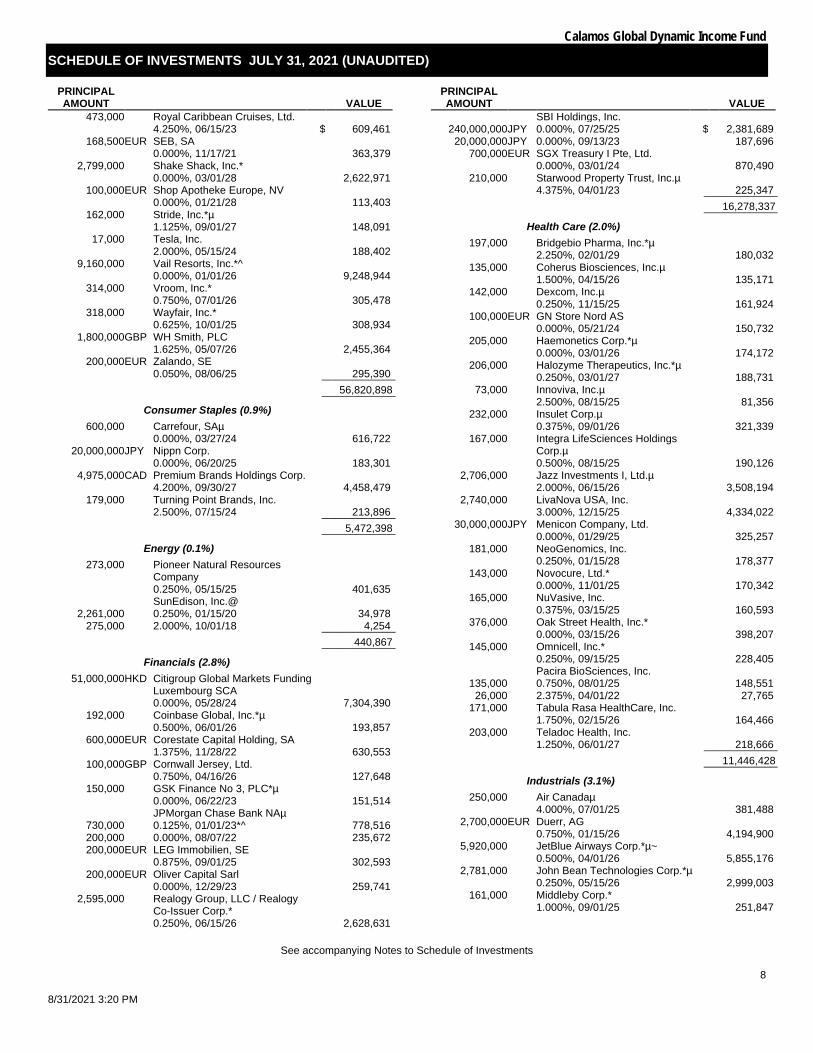
Calamos Global Dynamic Income Fund
SCHEDULE OF INVESTMENTS JULY 31, 2021 (UNAUDITED)
See accompanying Notes to Schedule of Investments
8
8/31/2021 3:20 PM
PRINCIPAL AMOUNT VALUE
473,000 Royal Caribbean Cruises, Ltd. 4.250%, 06/15/23 $ 609,461
168,500 EUR SEB, SA 0.000%, 11/17/21 363,379
2,799,000 Shake Shack, Inc.* 0.000%, 03/01/28 2,622,971
100,000 EUR Shop Apotheke Europe, NV 0.000%, 01/21/28 113,403
162,000 Stride, Inc.*µ 1.125%, 09/01/27 148,091
17,000 Tesla, Inc. 2.000%, 05/15/24 188,402
9,160,000 Vail Resorts, Inc.*^ 0.000%, 01/01/26 9,248,944
314,000 Vroom, Inc.* 0.750%, 07/01/26 305,478
318,000 Wayfair, Inc.* 0.625%, 10/01/25 308,934
1,800,000 GBP WH Smith, PLC 1.625%, 05/07/26 2,455,364
200,000 EUR Zalando, SE 0.050%, 08/06/25 295,390 ___________
56,820,898 ___________ Consumer Staples (0.9%)
600,000 Carrefour, SAµ 0.000%, 03/27/24 616,722
20,000,000 JPY Nippn Corp. 0.000%, 06/20/25 183,301
4,975,000 CAD Premium Brands Holdings Corp. 4.200%, 09/30/27 4,458,479
179,000 Turning Point Brands, Inc. 2.500%, 07/15/24 213,896 ___________
5,472,398 ___________ Energy (0.1%)
273,000 Pioneer Natural Resources Company 0.250%, 05/15/25 401,635
SunEdison, Inc.@ 2,261,000 0.250%, 01/15/20 34,978
275,000 2.000%, 10/01/18 4,254 ___________ 440,867 ___________
Financials (2.8%) 51,000,000 HKD Citigroup Global Markets Funding
Luxembourg SCA 0.000%, 05/28/24 7,304,390
192,000 Coinbase Global, Inc.*µ 0.500%, 06/01/26 193,857
600,000 EUR Corestate Capital Holding, SA 1.375%, 11/28/22 630,553
100,000 GBP Cornwall Jersey, Ltd. 0.750%, 04/16/26 127,648
150,000 GSK Finance No 3, PLC*µ 0.000%, 06/22/23 151,514
JPMorgan Chase Bank NAµ 730,000 0.125%, 01/01/23*^ 778,516 200,000 0.000%, 08/07/22 235,672 200,000 EUR LEG Immobilien, SE
0.875%, 09/01/25 302,593 200,000 EUR Oliver Capital Sarl
0.000%, 12/29/23 259,741 2,595,000 Realogy Group, LLC / Realogy
Co-Issuer Corp.* 0.250%, 06/15/26 2,628,631
PRINCIPAL AMOUNT VALUE
SBI Holdings, Inc. 240,000,000 JPY 0.000%, 07/25/25 $ 2,381,689
20,000,000 JPY 0.000%, 09/13/23 187,696 700,000 EUR SGX Treasury I Pte, Ltd.
0.000%, 03/01/24 870,490 210,000 Starwood Property Trust, Inc.µ
4.375%, 04/01/23 225,347 ___________ 16,278,337 ___________
Health Care (2.0%) 197,000 Bridgebio Pharma, Inc.*µ
2.250%, 02/01/29 180,032 135,000 Coherus Biosciences, Inc.µ
1.500%, 04/15/26 135,171 142,000 Dexcom, Inc.µ
0.250%, 11/15/25 161,924 100,000 EUR GN Store Nord AS
0.000%, 05/21/24 150,732 205,000 Haemonetics Corp.*µ
0.000%, 03/01/26 174,172 206,000 Halozyme Therapeutics, Inc.*µ
0.250%, 03/01/27 188,731 73,000 Innoviva, Inc.µ
2.500%, 08/15/25 81,356 232,000 Insulet Corp.µ
0.375%, 09/01/26 321,339 167,000 Integra LifeSciences Holdings
Corp.µ 0.500%, 08/15/25 190,126
2,706,000 Jazz Investments I, Ltd.µ 2.000%, 06/15/26 3,508,194
2,740,000 LivaNova USA, Inc. 3.000%, 12/15/25 4,334,022
30,000,000 JPY Menicon Company, Ltd. 0.000%, 01/29/25 325,257
181,000 NeoGenomics, Inc. 0.250%, 01/15/28 178,377
143,000 Novocure, Ltd.* 0.000%, 11/01/25 170,342
165,000 NuVasive, Inc. 0.375%, 03/15/25 160,593
376,000 Oak Street Health, Inc.* 0.000%, 03/15/26 398,207
145,000 Omnicell, Inc.* 0.250%, 09/15/25 228,405
Pacira BioSciences, Inc. 135,000 0.750%, 08/01/25 148,551
26,000 2.375%, 04/01/22 27,765 171,000 Tabula Rasa HealthCare, Inc.
1.750%, 02/15/26 164,466 203,000 Teladoc Health, Inc.
1.250%, 06/01/27 218,666 ___________ 11,446,428 ___________
Industrials (3.1%) 250,000 Air Canadaµ
4.000%, 07/01/25 381,488 2,700,000 EUR Duerr, AG
0.750%, 01/15/26 4,194,900 5,920,000 JetBlue Airways Corp.*µ~
0.500%, 04/01/26 5,855,176 2,781,000 John Bean Technologies Corp.*µ
0.250%, 05/15/26 2,999,003 161,000 Middleby Corp.*
1.000%, 09/01/25 251,847
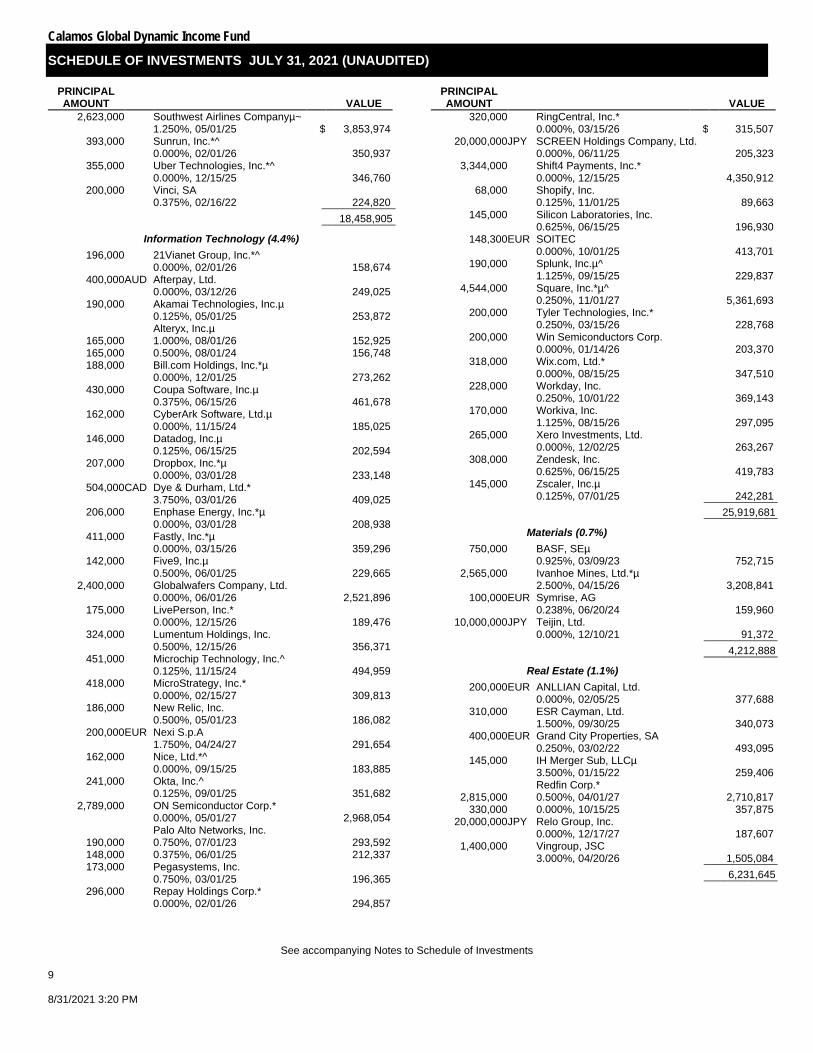
Calamos Global Dynamic Income Fund
SCHEDULE OF INVESTMENTS JULY 31, 2021 (UNAUDITED)
See accompanying Notes to Schedule of Investments
9 8/31/2021 3:20 PM
PRINCIPAL AMOUNT VALUE
2,623,000 Southwest Airlines Companyµ~ 1.250%, 05/01/25 $ 3,853,974
393,000 Sunrun, Inc.*^ 0.000%, 02/01/26 350,937
355,000 Uber Technologies, Inc.*^ 0.000%, 12/15/25 346,760
200,000 Vinci, SA 0.375%, 02/16/22 224,820 ___________
18,458,905 ___________ Information Technology (4.4%)
196,000 21Vianet Group, Inc.*^ 0.000%, 02/01/26 158,674
400,000 AUD Afterpay, Ltd. 0.000%, 03/12/26 249,025
190,000 Akamai Technologies, Inc.µ 0.125%, 05/01/25 253,872
Alteryx, Inc.µ 165,000 1.000%, 08/01/26 152,925 165,000 0.500%, 08/01/24 156,748 188,000 Bill.com Holdings, Inc.*µ
0.000%, 12/01/25 273,262 430,000 Coupa Software, Inc.µ
0.375%, 06/15/26 461,678 162,000 CyberArk Software, Ltd.µ
0.000%, 11/15/24 185,025 146,000 Datadog, Inc.µ
0.125%, 06/15/25 202,594 207,000 Dropbox, Inc.*µ
0.000%, 03/01/28 233,148 504,000 CAD Dye & Durham, Ltd.*
3.750%, 03/01/26 409,025 206,000 Enphase Energy, Inc.*µ
0.000%, 03/01/28 208,938 411,000 Fastly, Inc.*µ
0.000%, 03/15/26 359,296 142,000 Five9, Inc.µ
0.500%, 06/01/25 229,665 2,400,000 Globalwafers Company, Ltd.
0.000%, 06/01/26 2,521,896 175,000 LivePerson, Inc.*
0.000%, 12/15/26 189,476 324,000 Lumentum Holdings, Inc.
0.500%, 12/15/26 356,371 451,000 Microchip Technology, Inc.^
0.125%, 11/15/24 494,959 418,000 MicroStrategy, Inc.*
0.000%, 02/15/27 309,813 186,000 New Relic, Inc.
0.500%, 05/01/23 186,082 200,000 EUR Nexi S.p.A
1.750%, 04/24/27 291,654 162,000 Nice, Ltd.*^
0.000%, 09/15/25 183,885 241,000 Okta, Inc.^
0.125%, 09/01/25 351,682 2,789,000 ON Semiconductor Corp.*
0.000%, 05/01/27 2,968,054 Palo Alto Networks, Inc.
190,000 0.750%, 07/01/23 293,592 148,000 0.375%, 06/01/25 212,337 173,000 Pegasystems, Inc.
0.750%, 03/01/25 196,365 296,000 Repay Holdings Corp.*
0.000%, 02/01/26 294,857
PRINCIPAL AMOUNT VALUE
320,000 RingCentral, Inc.* 0.000%, 03/15/26 $ 315,507
20,000,000 JPY SCREEN Holdings Company, Ltd. 0.000%, 06/11/25 205,323
3,344,000 Shift4 Payments, Inc.* 0.000%, 12/15/25 4,350,912
68,000 Shopify, Inc. 0.125%, 11/01/25 89,663
145,000 Silicon Laboratories, Inc. 0.625%, 06/15/25 196,930
148,300 EUR SOITEC 0.000%, 10/01/25 413,701
190,000 Splunk, Inc.µ^ 1.125%, 09/15/25 229,837
4,544,000 Square, Inc.*µ^ 0.250%, 11/01/27 5,361,693
200,000 Tyler Technologies, Inc.* 0.250%, 03/15/26 228,768
200,000 Win Semiconductors Corp. 0.000%, 01/14/26 203,370
318,000 Wix.com, Ltd.* 0.000%, 08/15/25 347,510
228,000 Workday, Inc. 0.250%, 10/01/22 369,143
170,000 Workiva, Inc. 1.125%, 08/15/26 297,095
265,000 Xero Investments, Ltd. 0.000%, 12/02/25 263,267
308,000 Zendesk, Inc. 0.625%, 06/15/25 419,783
145,000 Zscaler, Inc.µ 0.125%, 07/01/25 242,281 ___________
25,919,681 ___________ Materials (0.7%)
750,000 BASF, SEµ 0.925%, 03/09/23 752,715
2,565,000 Ivanhoe Mines, Ltd.*µ 2.500%, 04/15/26 3,208,841
100,000 EUR Symrise, AG 0.238%, 06/20/24 159,960
10,000,000 JPY Teijin, Ltd. 0.000%, 12/10/21 91,372 ___________
4,212,888 ___________ Real Estate (1.1%)
200,000 EUR ANLLIAN Capital, Ltd. 0.000%, 02/05/25 377,688
310,000 ESR Cayman, Ltd. 1.500%, 09/30/25 340,073
400,000 EUR Grand City Properties, SA 0.250%, 03/02/22 493,095
145,000 IH Merger Sub, LLCµ 3.500%, 01/15/22 259,406
Redfin Corp.* 2,815,000 0.500%, 04/01/27 2,710,817
330,000 0.000%, 10/15/25 357,875 20,000,000 JPY Relo Group, Inc.
0.000%, 12/17/27 187,607 1,400,000 Vingroup, JSC
3.000%, 04/20/26 1,505,084 ___________ 6,231,645 ___________
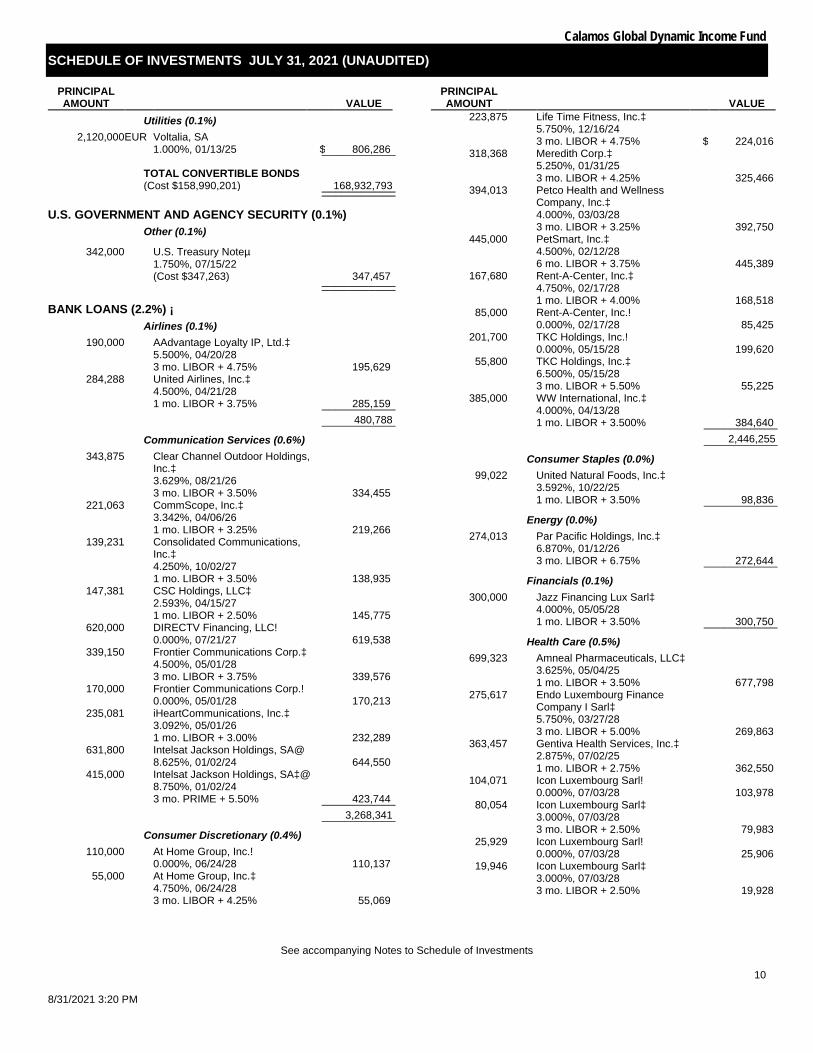
Calamos Global Dynamic Income Fund
SCHEDULE OF INVESTMENTS JULY 31, 2021 (UNAUDITED)
See accompanying Notes to Schedule of Investments
10
8/31/2021 3:20 PM
PRINCIPAL AMOUNT VALUE
Utilities (0.1%) 2,120,000 EUR Voltalia, SA
1.000%, 01/13/25 $ 806,286 ___________
TOTAL CONVERTIBLE BONDS (Cost $158,990,201) 168,932,793 ___________ ___________
U.S. GOVERNMENT AND AGENCY SECURITY (0.1%) Other (0.1%)
342,000 U.S. Treasury Noteµ 1.750%, 07/15/22 (Cost $347,263) 347,457 ___________ ___________
BANK LOANS (2.2%) ¡ Airlines (0.1%)
190,000 AAdvantage Loyalty IP, Ltd.‡ 5.500%, 04/20/28 3 mo. LIBOR + 4.75% 195,629
284,288 United Airlines, Inc.‡ 4.500%, 04/21/28 1 mo. LIBOR + 3.75% 285,159 ___________
480,788 ___________ Communication Services (0.6%)
343,875 Clear Channel Outdoor Holdings, Inc.‡ 3.629%, 08/21/26 3 mo. LIBOR + 3.50% 334,455
221,063 CommScope, Inc.‡ 3.342%, 04/06/26 1 mo. LIBOR + 3.25% 219,266
139,231 Consolidated Communications, Inc.‡ 4.250%, 10/02/27 1 mo. LIBOR + 3.50% 138,935
147,381 CSC Holdings, LLC‡ 2.593%, 04/15/27 1 mo. LIBOR + 2.50% 145,775
620,000 DIRECTV Financing, LLC! 0.000%, 07/21/27 619,538
339,150 Frontier Communications Corp.‡ 4.500%, 05/01/28 3 mo. LIBOR + 3.75% 339,576
170,000 Frontier Communications Corp.! 0.000%, 05/01/28 170,213
235,081 iHeartCommunications, Inc.‡ 3.092%, 05/01/26 1 mo. LIBOR + 3.00% 232,289
631,800 Intelsat Jackson Holdings, SA@ 8.625%, 01/02/24 644,550
415,000 Intelsat Jackson Holdings, SA‡@ 8.750%, 01/02/24 3 mo. PRIME + 5.50% 423,744 ___________
3,268,341 ___________ Consumer Discretionary (0.4%)
110,000 At Home Group, Inc.! 0.000%, 06/24/28 110,137
55,000 At Home Group, Inc.‡ 4.750%, 06/24/28 3 mo. LIBOR + 4.25% 55,069
PRINCIPAL AMOUNT VALUE
223,875 Life Time Fitness, Inc.‡ 5.750%, 12/16/24 3 mo. LIBOR + 4.75% $ 224,016
318,368 Meredith Corp.‡ 5.250%, 01/31/25 3 mo. LIBOR + 4.25% 325,466
394,013 Petco Health and Wellness Company, Inc.‡ 4.000%, 03/03/28 3 mo. LIBOR + 3.25% 392,750
445,000 PetSmart, Inc.‡ 4.500%, 02/12/28 6 mo. LIBOR + 3.75% 445,389
167,680 Rent-A-Center, Inc.‡ 4.750%, 02/17/28 1 mo. LIBOR + 4.00% 168,518
85,000 Rent-A-Center, Inc.! 0.000%, 02/17/28 85,425
201,700 TKC Holdings, Inc.! 0.000%, 05/15/28 199,620
55,800 TKC Holdings, Inc.‡ 6.500%, 05/15/28 3 mo. LIBOR + 5.50% 55,225
385,000 WW International, Inc.‡ 4.000%, 04/13/28 1 mo. LIBOR + 3.500% 384,640 ___________
2,446,255 ___________ Consumer Staples (0.0%)
99,022 United Natural Foods, Inc.‡ 3.592%, 10/22/25 1 mo. LIBOR + 3.50% 98,836 ___________
Energy (0.0%) 274,013 Par Pacific Holdings, Inc.‡
6.870%, 01/12/26 3 mo. LIBOR + 6.75% 272,644 ___________
Financials (0.1%) 300,000 Jazz Financing Lux Sarl‡
4.000%, 05/05/28 1 mo. LIBOR + 3.50% 300,750 ___________
Health Care (0.5%) 699,323 Amneal Pharmaceuticals, LLC‡
3.625%, 05/04/25 1 mo. LIBOR + 3.50% 677,798
275,617 Endo Luxembourg Finance Company I Sarl‡ 5.750%, 03/27/28 3 mo. LIBOR + 5.00% 269,863
363,457 Gentiva Health Services, Inc.‡ 2.875%, 07/02/25 1 mo. LIBOR + 2.75% 362,550
104,071 Icon Luxembourg Sarl! 0.000%, 07/03/28 103,978
80,054 Icon Luxembourg Sarl‡ 3.000%, 07/03/28 3 mo. LIBOR + 2.50% 79,983
25,929 Icon Luxembourg Sarl! 0.000%, 07/03/28 25,906
19,946 Icon Luxembourg Sarl‡ 3.000%, 07/03/28 3 mo. LIBOR + 2.50% 19,928

Calamos Global Dynamic Income Fund
SCHEDULE OF INVESTMENTS JULY 31, 2021 (UNAUDITED)
See accompanying Notes to Schedule of Investments
11 8/31/2021 3:20 PM
PRINCIPAL AMOUNT VALUE
302,181 Mallinckrodt International Finance, SA‡ 6.000%, 09/24/24 6 mo. LIBOR + 5.25% $ 294,565
250,000 Padagis, LLC‡ 5.250%, 07/06/28 3 mo. LIBOR + 4.75% 250,781
603,330 Team Health Holdings, Inc.‡ 3.750%, 02/06/24 1 mo. LIBOR + 2.75% 585,513 ___________
2,670,865 ___________ Industrials (0.3%)
110,000 ACProducts, Inc.‡ 4.750%, 05/05/28 6 mo. LIBOR + 4.25% 109,459
140,000 Air Canada! 0.000%, 07/28/28 140,409
440,100 Berry Global, Inc.‡ 1.850%, 07/01/26 1 mo. LIBOR + 1.75% 435,463
217,800 BW Gas & Convenience Holdings, LLC‡ 4.000%, 03/17/28 1 mo. LIBOR + 3.50% 218,344
281,448 Dun & Bradstreet Corp.‡ 3.336%, 02/06/26 1 mo. LIBOR + 3.25% 279,425
206,372 Granite Holdings US Acquisition Company‡ 4.147%, 09/30/26 3 mo. LIBOR + 4.00% 206,372
189,807 RegionalCare Hospital Partners Holdings, Inc.‡ 3.842%, 11/16/25 1 mo. LIBOR + 3.75% 188,438
423,435 Scientific Games International, Inc.‡ 2.842%, 08/14/24 1 mo. LIBOR + 2.75% 417,761
68,428 TransDigm, Inc.‡ 2.342%, 12/09/25 1 mo. LIBOR + 2.25% 67,310 ___________
2,062,981 ___________ Information Technology (0.2%)
140,000 AP Core Holdings II, LLC! 0.000%, 07/21/27 139,563
304,129 Banff Merger Sub, Inc.‡ 3.842%, 10/02/25 1 mo. LIBOR + 3.75% 301,983
329,975 Camelot U.S. Acquisition 1 Company‡ 3.092%, 10/30/26 1 mo. LIBOR + 3.00% 327,211
154,225 Camelot U.S. Acquisition 1 Company‡ 4.000%, 10/30/26 1 mo. LIBOR + 3.00% 154,394
288,031 VFH Parent, LLC‡ 3.085%, 03/01/26 1 mo. LIBOR + 3.00% 286,334 ___________
1,209,485 ___________
PRINCIPAL AMOUNT VALUE
Materials (0.0%) 197,500 Innophos, Inc.‡
3.592%, 02/07/27 1 mo. LIBOR + 3.50% $ 197,377 ___________
TOTAL BANK LOANS (Cost $13,055,223) 13,008,322 ___________ ___________
NUMBER OF SHARES VALUE
CONVERTIBLE PREFERRED STOCKS (9.9%) Communication Services (1.3%)
5,907 2020 Cash Mandatory Exchangeable Trust* 5.250%, 06/01/23 7,474,305 ___________
Consumer Discretionary (1.8%) 55,100 Aptiv, PLCµ
5.500%, 06/15/23 10,345,576 ___________ Energy (0.0%)
5 Gulfport Energy Operating Corp. 10.000%, 08/30/21 15.000% PIK rate 24,625 ___________
Financials (1.2%) 162,700 BRL Banco Bradesco, SA
0.000% 757,543 417 Bank of America Corp.µ‡‡
7.250% 616,972 60,618 KKR & Company, Inc.µ^
6.000%, 09/15/23 5,033,719 413 Wells Fargo & Company‡ ‡‡
7.500% 624,667 ___________ 7,032,901 ___________
Health Care (1.8%) 2,030 Avantor, Inc.µ
6.250%, 05/15/22 234,769 5,293 Danaher Corp.µ
4.750%, 04/15/22 10,547,626 ___________ 10,782,395 ___________
Industrials (1.7%) 27,200 Clarivate, PLC
5.250%, 06/01/24 2,472,480 62,608 Stanley Black & Decker, Inc.µ^
5.250%, 11/15/22 7,387,744 ___________ 9,860,224 ___________
Information Technology (0.8%) 2,971 Broadcom, Inc.µ~
8.000%, 09/30/22 4,588,234 ___________ Utilities (1.3%)
27,395 AES Corp.µ 6.875%, 02/15/24 2,777,305
3,391 American Electric Power Company, Inc.µ 6.125%, 03/15/22 170,466
3,250 DTE Energy Companyµ 6.250%, 11/01/22 166,725
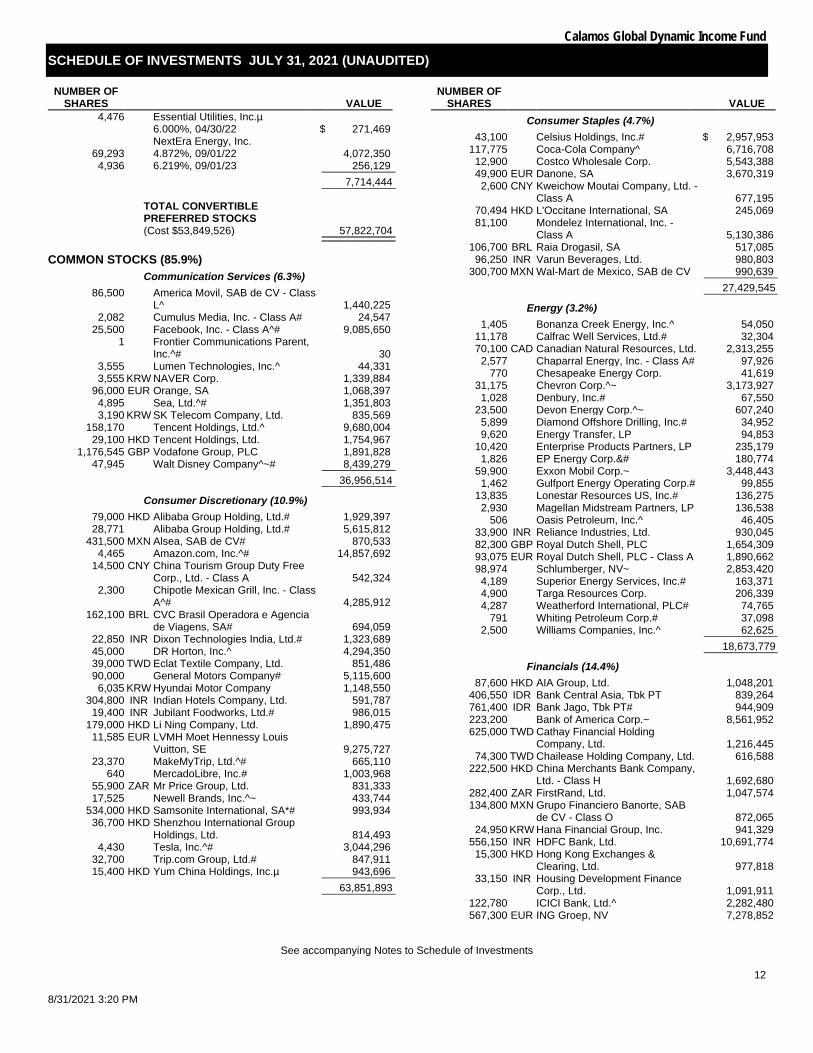
Calamos Global Dynamic Income Fund
SCHEDULE OF INVESTMENTS JULY 31, 2021 (UNAUDITED)
See accompanying Notes to Schedule of Investments
12
8/31/2021 3:20 PM
NUMBER OF SHARES VALUE
4,476 Essential Utilities, Inc.µ 6.000%, 04/30/22 $ 271,469
NextEra Energy, Inc. 69,293 4.872%, 09/01/22 4,072,350
4,936 6.219%, 09/01/23 256,129 ___________ 7,714,444 ___________
TOTAL CONVERTIBLE PREFERRED STOCKS (Cost $53,849,526) 57,822,704 ___________ ___________
COMMON STOCKS (85.9%) Communication Services (6.3%)
86,500 America Movil, SAB de CV - Class L^ 1,440,225
2,082 Cumulus Media, Inc. - Class A# 24,547 25,500 Facebook, Inc. - Class A^# 9,085,650
1 Frontier Communications Parent, Inc.^# 30
3,555 Lumen Technologies, Inc.^ 44,331 3,555 KRW NAVER Corp. 1,339,884
96,000 EUR Orange, SA 1,068,397 4,895 Sea, Ltd.^# 1,351,803 3,190 KRW SK Telecom Company, Ltd. 835,569
158,170 Tencent Holdings, Ltd.^ 9,680,004 29,100 HKD Tencent Holdings, Ltd. 1,754,967
1,176,545 GBP Vodafone Group, PLC 1,891,828 47,945 Walt Disney Company^~# 8,439,279 ___________
36,956,514 ___________ Consumer Discretionary (10.9%)
79,000 HKD Alibaba Group Holding, Ltd.# 1,929,397 28,771 Alibaba Group Holding, Ltd.# 5,615,812
431,500 MXN Alsea, SAB de CV# 870,533 4,465 Amazon.com, Inc.^# 14,857,692
14,500 CNY China Tourism Group Duty Free Corp., Ltd. - Class A 542,324
2,300 Chipotle Mexican Grill, Inc. - Class A^# 4,285,912
162,100 BRL CVC Brasil Operadora e Agencia de Viagens, SA# 694,059
22,850 INR Dixon Technologies India, Ltd.# 1,323,689 45,000 DR Horton, Inc.^ 4,294,350 39,000 TWD Eclat Textile Company, Ltd. 851,486 90,000 General Motors Company# 5,115,600
6,035 KRW Hyundai Motor Company 1,148,550 304,800 INR Indian Hotels Company, Ltd. 591,787
19,400 INR Jubilant Foodworks, Ltd.# 986,015 179,000 HKD Li Ning Company, Ltd. 1,890,475
11,585 EUR LVMH Moet Hennessy Louis Vuitton, SE 9,275,727
23,370 MakeMyTrip, Ltd.^# 665,110 640 MercadoLibre, Inc.# 1,003,968
55,900 ZAR Mr Price Group, Ltd. 831,333 17,525 Newell Brands, Inc.^~ 433,744
534,000 HKD Samsonite International, SA*# 993,934 36,700 HKD Shenzhou International Group
Holdings, Ltd. 814,493 4,430 Tesla, Inc.^# 3,044,296
32,700 Trip.com Group, Ltd.# 847,911 15,400 HKD Yum China Holdings, Inc.µ 943,696 ___________
63,851,893 ___________
NUMBER OF SHARES VALUE
Consumer Staples (4.7%) 43,100 Celsius Holdings, Inc.# $ 2,957,953
117,775 Coca-Cola Company^ 6,716,708 12,900 Costco Wholesale Corp. 5,543,388 49,900 EUR Danone, SA 3,670,319
2,600 CNY Kweichow Moutai Company, Ltd. - Class A 677,195
70,494 HKD L'Occitane International, SA 245,069 81,100 Mondelez International, Inc. -
Class A 5,130,386 106,700 BRL Raia Drogasil, SA 517,085
96,250 INR Varun Beverages, Ltd. 980,803 300,700 MXN Wal-Mart de Mexico, SAB de CV 990,639 ___________
27,429,545 ___________ Energy (3.2%)
1,405 Bonanza Creek Energy, Inc.^ 54,050 11,178 Calfrac Well Services, Ltd.# 32,304 70,100 CAD Canadian Natural Resources, Ltd. 2,313,255
2,577 Chaparral Energy, Inc. - Class A# 97,926 770 Chesapeake Energy Corp. 41,619
31,175 Chevron Corp.^~ 3,173,927 1,028 Denbury, Inc.# 67,550
23,500 Devon Energy Corp.^~ 607,240 5,899 Diamond Offshore Drilling, Inc.# 34,952 9,620 Energy Transfer, LP 94,853
10,420 Enterprise Products Partners, LP 235,179 1,826 EP Energy Corp.&# 180,774
59,900 Exxon Mobil Corp.~ 3,448,443 1,462 Gulfport Energy Operating Corp.# 99,855
13,835 Lonestar Resources US, Inc.# 136,275 2,930 Magellan Midstream Partners, LP 136,538
506 Oasis Petroleum, Inc.^ 46,405 33,900 INR Reliance Industries, Ltd. 930,045 82,300 GBP Royal Dutch Shell, PLC 1,654,309 93,075 EUR Royal Dutch Shell, PLC - Class A 1,890,662 98,974 Schlumberger, NV~ 2,853,420
4,189 Superior Energy Services, Inc.# 163,371 4,900 Targa Resources Corp. 206,339 4,287 Weatherford International, PLC# 74,765
791 Whiting Petroleum Corp.# 37,098 2,500 Williams Companies, Inc.^ 62,625 ___________
18,673,779 ___________ Financials (14.4%)
87,600 HKD AIA Group, Ltd. 1,048,201 406,550 IDR Bank Central Asia, Tbk PT 839,264 761,400 IDR Bank Jago, Tbk PT# 944,909 223,200 Bank of America Corp.~ 8,561,952 625,000 TWD Cathay Financial Holding
Company, Ltd. 1,216,445 74,300 TWD Chailease Holding Company, Ltd. 616,588
222,500 HKD China Merchants Bank Company, Ltd. - Class H 1,692,680
282,400 ZAR FirstRand, Ltd. 1,047,574 134,800 MXN Grupo Financiero Banorte, SAB
de CV - Class O 872,065 24,950 KRW Hana Financial Group, Inc. 941,329
556,150 INR HDFC Bank, Ltd. 10,691,774 15,300 HKD Hong Kong Exchanges &
Clearing, Ltd. 977,818 33,150 INR Housing Development Finance
Corp., Ltd. 1,091,911 122,780 ICICI Bank, Ltd.^ 2,282,480 567,300 EUR ING Groep, NV 7,278,852
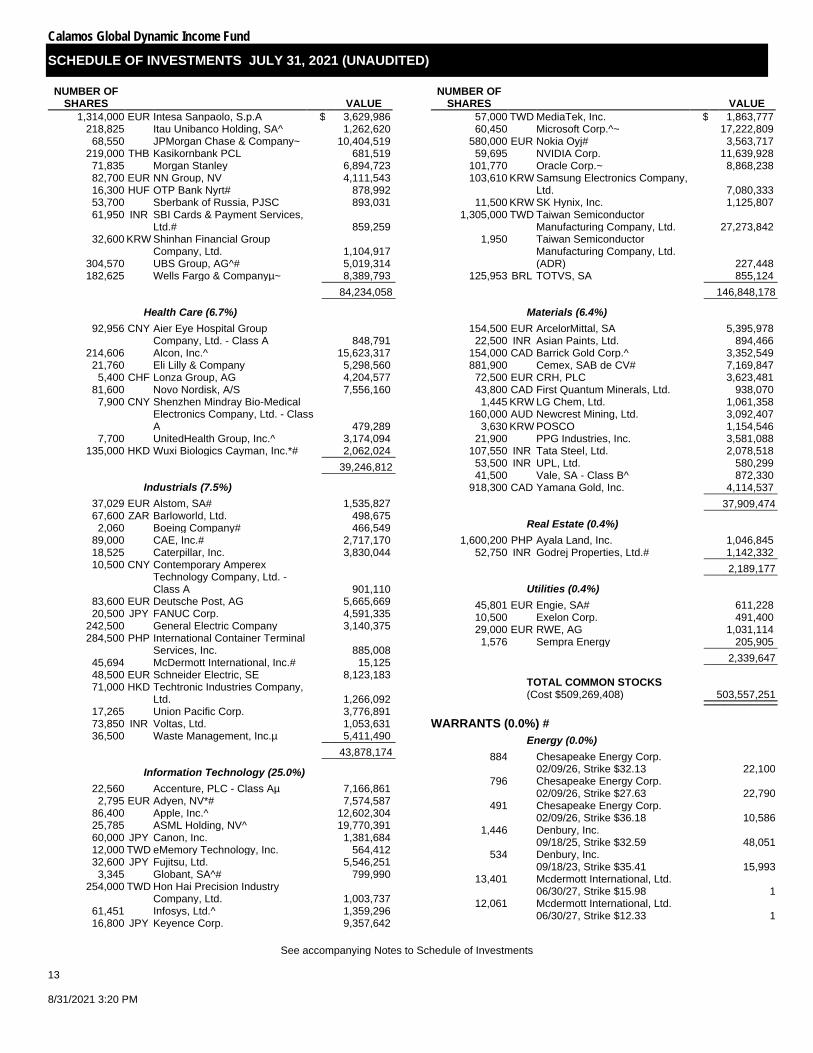
Calamos Global Dynamic Income Fund
SCHEDULE OF INVESTMENTS JULY 31, 2021 (UNAUDITED)
See accompanying Notes to Schedule of Investments
13 8/31/2021 3:20 PM
NUMBER OF SHARES VALUE
1,314,000 EUR Intesa Sanpaolo, S.p.A $ 3,629,986 218,825 Itau Unibanco Holding, SA^ 1,262,620
68,550 JPMorgan Chase & Company~ 10,404,519 219,000 THB Kasikornbank PCL 681,519
71,835 Morgan Stanley 6,894,723 82,700 EUR NN Group, NV 4,111,543 16,300 HUF OTP Bank Nyrt# 878,992 53,700 Sberbank of Russia, PJSC 893,031 61,950 INR SBI Cards & Payment Services,
Ltd.# 859,259 32,600 KRW Shinhan Financial Group
Company, Ltd. 1,104,917 304,570 UBS Group, AG^# 5,019,314 182,625 Wells Fargo & Companyµ~ 8,389,793 ___________
84,234,058 ___________ Health Care (6.7%)
92,956 CNY Aier Eye Hospital Group Company, Ltd. - Class A 848,791
214,606 Alcon, Inc.^ 15,623,317 21,760 Eli Lilly & Company 5,298,560
5,400 CHF Lonza Group, AG 4,204,577 81,600 Novo Nordisk, A/S 7,556,160
7,900 CNY Shenzhen Mindray Bio-Medical Electronics Company, Ltd. - Class A 479,289
7,700 UnitedHealth Group, Inc.^ 3,174,094 135,000 HKD Wuxi Biologics Cayman, Inc.*# 2,062,024 ___________
39,246,812 ___________ Industrials (7.5%)
37,029 EUR Alstom, SA# 1,535,827 67,600 ZAR Barloworld, Ltd. 498,675
2,060 Boeing Company# 466,549 89,000 CAE, Inc.# 2,717,170 18,525 Caterpillar, Inc. 3,830,044 10,500 CNY Contemporary Amperex
Technology Company, Ltd. - Class A 901,110
83,600 EUR Deutsche Post, AG 5,665,669 20,500 JPY FANUC Corp. 4,591,335
242,500 General Electric Company 3,140,375 284,500 PHP International Container Terminal
Services, Inc. 885,008 45,694 McDermott International, Inc.# 15,125 48,500 EUR Schneider Electric, SE 8,123,183 71,000 HKD Techtronic Industries Company,
Ltd. 1,266,092 17,265 Union Pacific Corp. 3,776,891 73,850 INR Voltas, Ltd. 1,053,631 36,500 Waste Management, Inc.µ 5,411,490 ___________
43,878,174 ___________ Information Technology (25.0%)
22,560 Accenture, PLC - Class Aµ 7,166,861 2,795 EUR Adyen, NV*# 7,574,587
86,400 Apple, Inc.^ 12,602,304 25,785 ASML Holding, NV^ 19,770,391 60,000 JPY Canon, Inc. 1,381,684 12,000 TWD eMemory Technology, Inc. 564,412 32,600 JPY Fujitsu, Ltd. 5,546,251
3,345 Globant, SA^# 799,990 254,000 TWD Hon Hai Precision Industry
Company, Ltd. 1,003,737 61,451 Infosys, Ltd.^ 1,359,296 16,800 JPY Keyence Corp. 9,357,642
NUMBER OF SHARES VALUE
57,000 TWD MediaTek, Inc. $ 1,863,777 60,450 Microsoft Corp.^~ 17,222,809
580,000 EUR Nokia Oyj# 3,563,717 59,695 NVIDIA Corp. 11,639,928
101,770 Oracle Corp.~ 8,868,238 103,610 KRW Samsung Electronics Company,
Ltd. 7,080,333 11,500 KRW SK Hynix, Inc. 1,125,807
1,305,000 TWD Taiwan Semiconductor Manufacturing Company, Ltd. 27,273,842
1,950 Taiwan Semiconductor Manufacturing Company, Ltd. (ADR) 227,448
125,953 BRL TOTVS, SA 855,124 ___________ 146,848,178 ___________
Materials (6.4%) 154,500 EUR ArcelorMittal, SA 5,395,978
22,500 INR Asian Paints, Ltd. 894,466 154,000 CAD Barrick Gold Corp.^ 3,352,549 881,900 Cemex, SAB de CV# 7,169,847
72,500 EUR CRH, PLC 3,623,481 43,800 CAD First Quantum Minerals, Ltd. 938,070
1,445 KRW LG Chem, Ltd. 1,061,358 160,000 AUD Newcrest Mining, Ltd. 3,092,407
3,630 KRW POSCO 1,154,546 21,900 PPG Industries, Inc. 3,581,088
107,550 INR Tata Steel, Ltd. 2,078,518 53,500 INR UPL, Ltd. 580,299 41,500 Vale, SA - Class B^ 872,330
918,300 CAD Yamana Gold, Inc. 4,114,537 ___________ 37,909,474 ___________
Real Estate (0.4%) 1,600,200 PHP Ayala Land, Inc. 1,046,845
52,750 INR Godrej Properties, Ltd.# 1,142,332 ___________ 2,189,177 ___________
Utilities (0.4%) 45,801 EUR Engie, SA# 611,228 10,500 Exelon Corp. 491,400 29,000 EUR RWE, AG 1,031,114
1,576 Sempra Energy 205,905 ___________ 2,339,647 ___________
TOTAL COMMON STOCKS (Cost $509,269,408) 503,557,251 ___________ ___________
WARRANTS (0.0%) # Energy (0.0%)
884
Chesapeake Energy Corp. 02/09/26, Strike $32.13 22,100
796
Chesapeake Energy Corp. 02/09/26, Strike $27.63 22,790
491
Chesapeake Energy Corp. 02/09/26, Strike $36.18 10,586
1,446
Denbury, Inc. 09/18/25, Strike $32.59 48,051
534
Denbury, Inc. 09/18/23, Strike $35.41 15,993
13,401
Mcdermott International, Ltd. 06/30/27, Strike $15.98 1
12,061
Mcdermott International, Ltd. 06/30/27, Strike $12.33 1
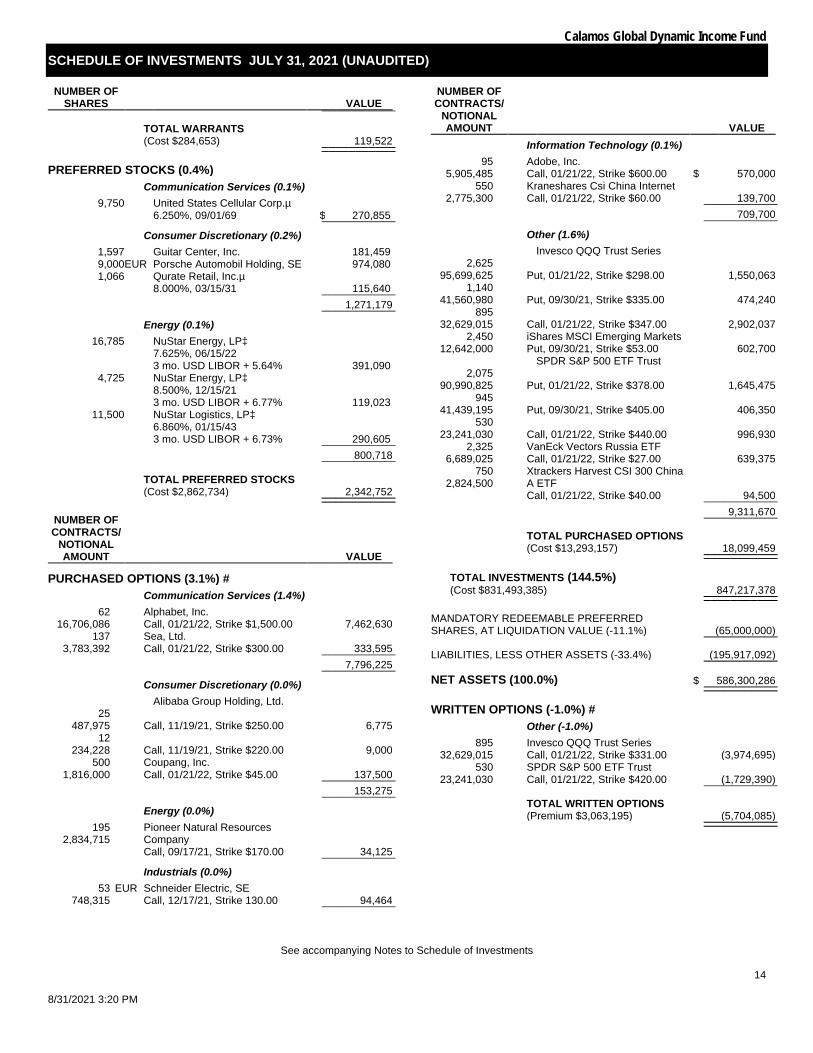
Calamos Global Dynamic Income Fund
SCHEDULE OF INVESTMENTS JULY 31, 2021 (UNAUDITED)
See accompanying Notes to Schedule of Investments
14
8/31/2021 3:20 PM
NUMBER OF SHARES VALUE ___________
TOTAL WARRANTS (Cost $284,653) 119,522 ___________ ___________
PREFERRED STOCKS (0.4%) Communication Services (0.1%)
9,750 United States Cellular Corp.µ 6.250%, 09/01/69 $ 270,855 ___________
Consumer Discretionary (0.2%) 1,597 Guitar Center, Inc. 181,459 9,000 EUR Porsche Automobil Holding, SE 974,080 1,066 Qurate Retail, Inc.µ
8.000%, 03/15/31 115,640 ___________ 1,271,179 ___________
Energy (0.1%) 16,785 NuStar Energy, LP‡
7.625%, 06/15/22 3 mo. USD LIBOR + 5.64% 391,090
4,725 NuStar Energy, LP‡ 8.500%, 12/15/21 3 mo. USD LIBOR + 6.77% 119,023
11,500 NuStar Logistics, LP‡ 6.860%, 01/15/43 3 mo. USD LIBOR + 6.73% 290,605 ___________
800,718 ___________
TOTAL PREFERRED STOCKS (Cost $2,862,734) 2,342,752 ___________ ___________
NUMBER OF CONTRACTS/
NOTIONAL AMOUNT VALUE
PURCHASED OPTIONS (3.1%) # Communication Services (1.4%)
62 16,706,086
Alphabet, Inc. Call, 01/21/22, Strike $1,500.00 7,462,630
137 3,783,392
Sea, Ltd. Call, 01/21/22, Strike $300.00 333,595 ___________
7,796,225 ___________ Consumer Discretionary (0.0%)
Alibaba Group Holding, Ltd. 25
487,975
Call, 11/19/21, Strike $250.00 6,775 12
234,228
Call, 11/19/21, Strike $220.00 9,000 500
1,816,000 Coupang, Inc.
Call, 01/21/22, Strike $45.00 137,500 ___________ 153,275 ___________
Energy (0.0%) 195
2,834,715
Pioneer Natural Resources Company Call, 09/17/21, Strike $170.00 34,125 ___________ Industrials (0.0%)
53 748,315
EUR Schneider Electric, SE Call, 12/17/21, Strike 130.00 94,464 ___________
NUMBER OF CONTRACTS/
NOTIONAL AMOUNT VALUE
Information Technology (0.1%) 95
5,905,485 Adobe, Inc.
Call, 01/21/22, Strike $600.00 $ 570,000 550
2,775,300 Kraneshares Csi China Internet
Call, 01/21/22, Strike $60.00 139,700 ___________ 709,700 ___________
Other (1.6%) Invesco QQQ Trust Series
2,625 95,699,625
Put, 01/21/22, Strike $298.00 1,550,063
1,140 41,560,980
Put, 09/30/21, Strike $335.00 474,240
895 32,629,015
Call, 01/21/22, Strike $347.00 2,902,037
2,450 12,642,000
iShares MSCI Emerging Markets Put, 09/30/21, Strike $53.00 602,700
SPDR S&P 500 ETF Trust 2,075
90,990,825
Put, 01/21/22, Strike $378.00 1,645,475 945
41,439,195
Put, 09/30/21, Strike $405.00 406,350 530
23,241,030
Call, 01/21/22, Strike $440.00 996,930 2,325
6,689,025 VanEck Vectors Russia ETF
Call, 01/21/22, Strike $27.00 639,375 750
2,824,500
Xtrackers Harvest CSI 300 China A ETF Call, 01/21/22, Strike $40.00 94,500 ___________
9,311,670 ___________
TOTAL PURCHASED OPTIONS (Cost $13,293,157) 18,099,459 ___________ ___________
TOTAL INVESTMENTS (144.5%) (Cost $831,493,385) 847,217,378 ___________ ___________
MANDATORY REDEEMABLE PREFERRED SHARES, AT LIQUIDATION VALUE (-11.1%) (65,000,000) ___________
LIABILITIES, LESS OTHER ASSETS (-33.4%) (195,917,092) ___________
NET ASSETS (100.0%) $ 586,300,286 ___________ ___________
WRITTEN OPTIONS (-1.0%) # Other (-1.0%)
895 32,629,015
Invesco QQQ Trust Series Call, 01/21/22, Strike $331.00 (3,974,695)
530 23,241,030
SPDR S&P 500 ETF Trust Call, 01/21/22, Strike $420.00 (1,729,390) ___________
TOTAL WRITTEN OPTIONS (Premium $3,063,195) (5,704,085) ___________ ___________
Calamos Global Dynamic Income Fund
SCHEDULE OF INVESTMENTS JULY 31, 2021 (UNAUDITED)
See accompanying Notes to Schedule of Investments
15 8/31/2021 3:20 PM
NOTES TO SCHEDULE OF INVESTMENTS *
Securities issued and sold pursuant to a Rule 144A transaction are excepted from the registration requirement of the Securities Act of 1933, as amended. These securities may only be sold to qualified institutional buyers (“QIBs”), such as the Fund. Any resale of these securities must generally be effected through a sale that is registered under the Act or otherwise exempted from such registration requirements.
µ
Security, or portion of security, is held in a segregated account as collateral for note payable aggregating a total value of $91,887,324.
^ Security, or portion of security, is on loan. @ In default status and considered non-income producing. & Illiquid security. ‡
Variable rate security. The rate shown is the rate in effect at July 31, 2021.
~
Security, or portion of security, is segregated as collateral (or collateral for potential future transactions) for written options and securities sold short. The aggregate value of such securities is $26,353,594.
¡
Bank loans generally are subject to mandatory and/or optional prepayment. As a result, the actual remaining maturity of bank loans may be substantially less than the stated maturities shown.
!
This position represents an unsettled loan commitment at period end. Certain details associated with this purchase are not known prior to the settlement date, including coupon rate, which will be adjusted on settlement date.
‡‡ Perpetual maturity. # Non-income producing security.
FOREIGN CURRENCY ABBREVIATIONS AUD Australian Dollar BRL Brazilian Real CAD Canadian Dollar CHF Swiss Franc CNY Chinese Yuan Renminbi EUR European Monetary Unit GBP British Pound Sterling HKD Hong Kong Dollar HUF Hungarian Forint IDR Indonesian Rupiah INR Indian Rupee JPY Japanese Yen KRW South Korean Won MXN Mexican Peso PHP Philippine Peso THB Thai Baht TWD New Taiwan Dollar ZAR South African Rand Note: Value for securities denominated in foreign currencies is shown in U.S. dollars. The principal amount for such securities is shown in the respective foreign currency. The date on options represents the expiration date of the option contract. The option contract may be exercised at any date on or before the date shown.

Calamos Global Dynamic Income Fund
SCHEDULE OF INVESTMENTS JULY 31, 2021 (UNAUDITED)
See accompanying Notes to Schedule of Investments
16
8/31/2021 3:20 PM
CURRENCY EXPOSURE JULY 31, 2021
Value % of Total
Investments US Dollar $ 588,953,623 70.0 % European Monetary Unit 85,003,204 10.1 % New Taiwan Dollar 33,390,287 4.0 % Japanese Yen 24,689,490 2.9 % Hong Kong Dollar 24,210,098 2.9 % Indian Rupee 23,204,529 2.8 % South Korean Won 15,792,293 1.9 % Canadian Dollar 15,585,915 1.9 % British Pound Sterling 6,266,448 0.7 % Swiss Franc 4,416,098 0.5 % Chinese Yuan Renminbi 3,448,709 0.4 % Australian Dollar 3,341,432 0.4 % Brazilian Real 2,823,811 0.3 % Mexican Peso 2,733,237 0.3 % South African Rand 2,377,582 0.3 % Philippine Peso 1,931,853 0.2 % Indonesian Rupiah 1,784,173 0.2 % Hungarian Forint 878,992 0.1 % Thai Baht 681,519 0.1 % _____________________________ Total Investments Net of Written Options $ 841,513,293 100.0 % Currency exposure may vary over time.

Note 1 – Organization and Significant Accounting Policies Organization. Calamos Global Dynamic Income Fund (the “Fund”) was organized as a Delaware statutory trust on April 10, 2007 and is registered under the Investment Company Act of 1940 (the “1940 Act”) as a diversified, closed-end management investment company. The Fund commenced operations on June 27, 2007. Significant Accounting Policies. The Schedule of Investments has been prepared in conformity with accounting principles generally accepted in the United States of America (U.S. GAAP). The Fund is considered an investment company under U.S. GAAP and follows the accounting and reporting guidance applicable to investment companies. The following summarizes the significant accounting policies of the Fund: In March 2017, the Financial Accounting Standards Board ("FASB") issued ASU No. 2017-08, Receivables – Nonrefundable Fees and Other Costs (Subtopic 310-20): Premium Amortization on Purchased Callable Debt Securities ("ASU 2017-08"). ASU 2017-08 shortens the amortization period for certain callable debt securities held at a premium. The Fund adopted ASU2017-08 as of November 1, 2019, with no material impact on the Fund's Schedule of Investments. Fund Valuation. The valuation of the Fund's investments is in accordance with policies and procedures adopted by and under the ultimate supervision of the board of trustees.
Fund securities that are traded on U.S. securities exchanges, except option securities, are valued at the official closing price, which is the last current reported sales price on its principal exchange at the time each Fund determines its net asset value (“NAV”). Securities traded in the over-the-counter market and quoted on The NASDAQ Stock Market are valued at the NASDAQ Official Closing Price, as determined by NASDAQ, or lacking a NASDAQ Official Closing Price, the last current reported sale price on NASDAQ at the time the Fund determines its NAV. When a last sale or closing price is not available, equity securities, other than option securities, that are traded on a U.S. securities exchange and other equity securities traded in the over-the-counter market are valued at the mean between the most recent bid and asked quotations on its principal exchange in accordance with guidelines adopted by the board of trustees. Each option security traded on a U.S. securities exchange is valued at the mid-point of the consolidated bid/ask quote for the option security, also in accordance with guidelines adopted by the board of trustees. Each over-the-counter option that is not traded through the Options Clearing Corporation is valued either by an independent pricing agent approved by the board of trustees or based on a quotation provided by the counterparty to such option under the ultimate supervision of the board of trustees.
Fixed income securities, bank loans, certain convertible preferred securities, and non-exchange traded derivatives are normally valued by independent pricing services or by dealers or brokers who make markets in such securities. Valuations of such fixed income securities, bank loans, certain convertible preferred securities, and non-exchange traded derivatives consider yield or price of equivalent securities of comparable quality, coupon rate, maturity, type of issue, trading characteristics and other market data and do not rely exclusively upon exchange or over-the-counter prices.
Trading on European and Far Eastern exchanges and over-the-counter markets is typically completed at various times before the close of business on each day on which the New York Stock Exchange (“NYSE”) is open. Each security trading on these exchanges or in over-the-counter markets may be valued utilizing a systematic fair valuation model provided by an independent pricing service approved by the board of trustees. The valuation of each security that meets certain criteria in relation to the valuation model is systematically adjusted to reflect the impact of movement in the U.S. market after the foreign markets close. Securities that do not meet the criteria, or that are principally traded in other foreign markets, are valued as of the last reported sale price at the time the Fund determines its NAV, or when reliable market prices or quotations are not readily available, at the mean between the most recent bid and asked quotations as of the close of the appropriate exchange or other designated time. Trading of foreign securities may not take place on every NYSE business day. In addition, trading may take place in various foreign markets on Saturdays or on other days when the NYSE is not open and on which the Fund's NAV is not calculated.
If the pricing committee determines that the valuation of a security in accordance with the methods described above is not reflective of a fair value for such security, the security is valued at a fair value by the pricing committee, under the ultimate supervision of the board of trustees, following the guidelines and/or procedures adopted by the board of trustees.
The Fund also may use fair value pricing, pursuant to guidelines adopted by the board of trustees and under the ultimate supervision of the board of trustees, if trading in the security is halted or if the value of a security it holds is materially affected by events occurring before the Fund's pricing time but after the close of the primary market or exchange on which the security is listed. Those procedures may utilize valuations furnished by pricing services approved by the board of trustees, which may be based on market transactions for comparable securities and various relationships between securities that are generally recognized by institutional traders, a computerized matrix system, or appraisals derived from information concerning the securities or similar securities received from recognized dealers in those securities.
When fair value pricing of securities is employed, the prices of securities used by a Fund to calculate its NAV may differ from market quotations or official closing prices. There can be no assurance that the Fund could purchase or sell a portfolio security at the price used to calculate the Fund’s net asset value (“NAV”). Foreign Currency Translation. Values of investments and other assets and liabilities denominated in foreign currencies are translated into U.S. dollars using a rate quoted by a major bank or dealer in the particular currency market, as reported by a recognized quotation dissemination service. Option Transactions. For hedging and investment purposes, the Fund may purchase or write (sell) put and call options. One of the risks associated with purchasing an option is that the Fund pays a premium whether or not the option is exercised. Additionally, the Fund bears the risk of loss of premium and change in value should the counterparty not perform under the contract. The Fund as writer of an option bears the market risk of an unfavorable change in the price of the security underlying the written option. Note 2 – Investments The cost basis of investments for federal income tax purposes at July 31, 2021 was as follows*: Cost basis of investments $828,430,190 Gross unrealized appreciation 97,871,209
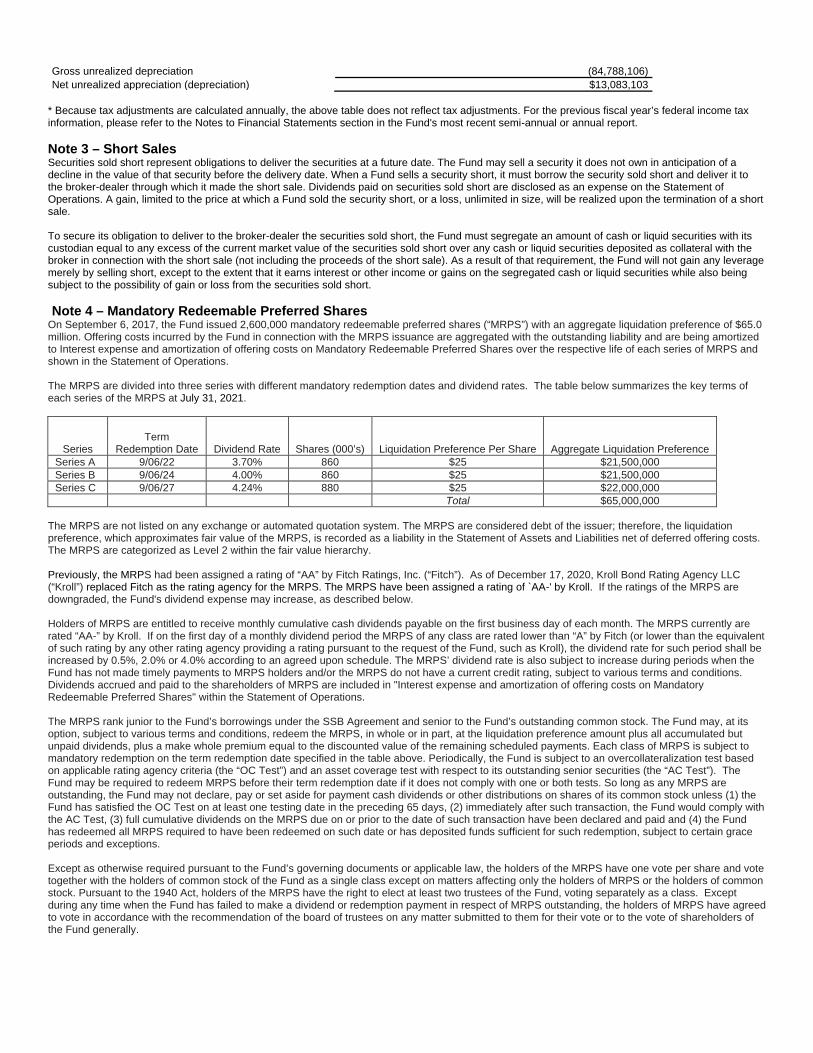
Gross unrealized depreciation (84,788,106) Net unrealized appreciation (depreciation) $13,083,103
* Because tax adjustments are calculated annually, the above table does not reflect tax adjustments. For the previous fiscal year’s federal income tax information, please refer to the Notes to Financial Statements section in the Fund's most recent semi-annual or annual report. Note 3 – Short Sales Securities sold short represent obligations to deliver the securities at a future date. The Fund may sell a security it does not own in anticipation of a decline in the value of that security before the delivery date. When a Fund sells a security short, it must borrow the security sold short and deliver it to the broker-dealer through which it made the short sale. Dividends paid on securities sold short are disclosed as an expense on the Statement of Operations. A gain, limited to the price at which a Fund sold the security short, or a loss, unlimited in size, will be realized upon the termination of a short sale. To secure its obligation to deliver to the broker-dealer the securities sold short, the Fund must segregate an amount of cash or liquid securities with its custodian equal to any excess of the current market value of the securities sold short over any cash or liquid securities deposited as collateral with the broker in connection with the short sale (not including the proceeds of the short sale). As a result of that requirement, the Fund will not gain any leverage merely by selling short, except to the extent that it earns interest or other income or gains on the segregated cash or liquid securities while also being subject to the possibility of gain or loss from the securities sold short. Note 4 – Mandatory Redeemable Preferred Shares On September 6, 2017, the Fund issued 2,600,000 mandatory redeemable preferred shares (“MRPS”) with an aggregate liquidation preference of $65.0 million. Offering costs incurred by the Fund in connection with the MRPS issuance are aggregated with the outstanding liability and are being amortized to Interest expense and amortization of offering costs on Mandatory Redeemable Preferred Shares over the respective life of each series of MRPS and shown in the Statement of Operations. The MRPS are divided into three series with different mandatory redemption dates and dividend rates. The table below summarizes the key terms of each series of the MRPS at July 31, 2021.
Series Term
Redemption Date Dividend Rate Shares (000’s) Liquidation Preference Per Share Aggregate Liquidation Preference Series A 9/06/22 3.70% 860 $25 $21,500,000 Series B 9/06/24 4.00% 860 $25 $21,500,000 Series C 9/06/27 4.24% 880 $25 $22,000,000
Total $65,000,000 The MRPS are not listed on any exchange or automated quotation system. The MRPS are considered debt of the issuer; therefore, the liquidation preference, which approximates fair value of the MRPS, is recorded as a liability in the Statement of Assets and Liabilities net of deferred offering costs. The MRPS are categorized as Level 2 within the fair value hierarchy. Previously, the MRPS had been assigned a rating of “AA” by Fitch Ratings, Inc. (“Fitch”). As of December 17, 2020, Kroll Bond Rating Agency LLC (“Kroll”) replaced Fitch as the rating agency for the MRPS. The MRPS have been assigned a rating of `AA-' by Kroll. If the ratings of the MRPS are downgraded, the Fund's dividend expense may increase, as described below. Holders of MRPS are entitled to receive monthly cumulative cash dividends payable on the first business day of each month. The MRPS currently are rated “AA-” by Kroll. If on the first day of a monthly dividend period the MRPS of any class are rated lower than “A” by Fitch (or lower than the equivalent of such rating by any other rating agency providing a rating pursuant to the request of the Fund, such as Kroll), the dividend rate for such period shall be increased by 0.5%, 2.0% or 4.0% according to an agreed upon schedule. The MRPS’ dividend rate is also subject to increase during periods when the Fund has not made timely payments to MRPS holders and/or the MRPS do not have a current credit rating, subject to various terms and conditions. Dividends accrued and paid to the shareholders of MRPS are included in "Interest expense and amortization of offering costs on Mandatory Redeemable Preferred Shares" within the Statement of Operations. The MRPS rank junior to the Fund’s borrowings under the SSB Agreement and senior to the Fund’s outstanding common stock. The Fund may, at its option, subject to various terms and conditions, redeem the MRPS, in whole or in part, at the liquidation preference amount plus all accumulated but unpaid dividends, plus a make whole premium equal to the discounted value of the remaining scheduled payments. Each class of MRPS is subject to mandatory redemption on the term redemption date specified in the table above. Periodically, the Fund is subject to an overcollateralization test based on applicable rating agency criteria (the “OC Test”) and an asset coverage test with respect to its outstanding senior securities (the “AC Test”). The Fund may be required to redeem MRPS before their term redemption date if it does not comply with one or both tests. So long as any MRPS are outstanding, the Fund may not declare, pay or set aside for payment cash dividends or other distributions on shares of its common stock unless (1) the Fund has satisfied the OC Test on at least one testing date in the preceding 65 days, (2) immediately after such transaction, the Fund would comply with the AC Test, (3) full cumulative dividends on the MRPS due on or prior to the date of such transaction have been declared and paid and (4) the Fund has redeemed all MRPS required to have been redeemed on such date or has deposited funds sufficient for such redemption, subject to certain grace periods and exceptions. Except as otherwise required pursuant to the Fund’s governing documents or applicable law, the holders of the MRPS have one vote per share and vote together with the holders of common stock of the Fund as a single class except on matters affecting only the holders of MRPS or the holders of common stock. Pursuant to the 1940 Act, holders of the MRPS have the right to elect at least two trustees of the Fund, voting separately as a class. Except during any time when the Fund has failed to make a dividend or redemption payment in respect of MRPS outstanding, the holders of MRPS have agreed to vote in accordance with the recommendation of the board of trustees on any matter submitted to them for their vote or to the vote of shareholders of the Fund generally.
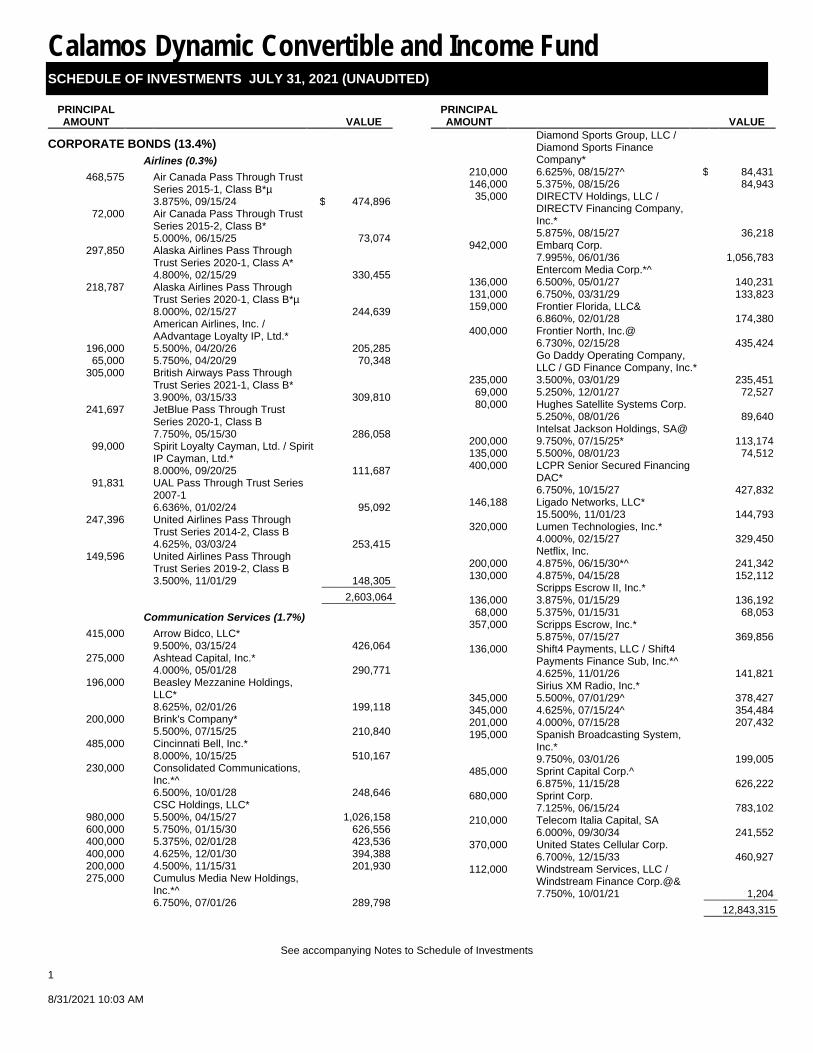
Calamos Dynamic Convertible and Income Fund SCHEDULE OF INVESTMENTS JULY 31, 2021 (UNAUDITED)
See accompanying Notes to Schedule of Investments
1 8/31/2021 10:03 AM
PRINCIPAL AMOUNT VALUE
CORPORATE BONDS (13.4%) Airlines (0.3%)
468,575 Air Canada Pass Through Trust Series 2015-1, Class B*µ 3.875%, 09/15/24 $ 474,896
72,000 Air Canada Pass Through Trust Series 2015-2, Class B* 5.000%, 06/15/25 73,074
297,850 Alaska Airlines Pass Through Trust Series 2020-1, Class A* 4.800%, 02/15/29 330,455
218,787 Alaska Airlines Pass Through Trust Series 2020-1, Class B*µ 8.000%, 02/15/27 244,639
American Airlines, Inc. / AAdvantage Loyalty IP, Ltd.*
196,000 5.500%, 04/20/26 205,285 65,000 5.750%, 04/20/29 70,348
305,000 British Airways Pass Through Trust Series 2021-1, Class B* 3.900%, 03/15/33 309,810
241,697 JetBlue Pass Through Trust Series 2020-1, Class B 7.750%, 05/15/30 286,058
99,000 Spirit Loyalty Cayman, Ltd. / Spirit IP Cayman, Ltd.* 8.000%, 09/20/25 111,687
91,831 UAL Pass Through Trust Series 2007-1 6.636%, 01/02/24 95,092
247,396 United Airlines Pass Through Trust Series 2014-2, Class B 4.625%, 03/03/24 253,415
149,596 United Airlines Pass Through Trust Series 2019-2, Class B 3.500%, 11/01/29 148,305 ___________
2,603,064 ___________ Communication Services (1.7%)
415,000 Arrow Bidco, LLC* 9.500%, 03/15/24 426,064
275,000 Ashtead Capital, Inc.* 4.000%, 05/01/28 290,771
196,000 Beasley Mezzanine Holdings, LLC* 8.625%, 02/01/26 199,118
200,000 Brink's Company* 5.500%, 07/15/25 210,840
485,000 Cincinnati Bell, Inc.* 8.000%, 10/15/25 510,167
230,000 Consolidated Communications, Inc.*^ 6.500%, 10/01/28 248,646
CSC Holdings, LLC* 980,000 5.500%, 04/15/27 1,026,158 600,000 5.750%, 01/15/30 626,556 400,000 5.375%, 02/01/28 423,536 400,000 4.625%, 12/01/30 394,388 200,000 4.500%, 11/15/31 201,930 275,000 Cumulus Media New Holdings,
Inc.*^ 6.750%, 07/01/26 289,798
PRINCIPAL AMOUNT VALUE
Diamond Sports Group, LLC / Diamond Sports Finance Company*
210,000 6.625%, 08/15/27^ $ 84,431 146,000 5.375%, 08/15/26 84,943
35,000 DIRECTV Holdings, LLC / DIRECTV Financing Company, Inc.* 5.875%, 08/15/27 36,218
942,000 Embarq Corp. 7.995%, 06/01/36 1,056,783
Entercom Media Corp.*^ 136,000 6.500%, 05/01/27 140,231 131,000 6.750%, 03/31/29 133,823 159,000 Frontier Florida, LLC&
6.860%, 02/01/28 174,380 400,000 Frontier North, Inc.@
6.730%, 02/15/28 435,424
Go Daddy Operating Company, LLC / GD Finance Company, Inc.*
235,000 3.500%, 03/01/29 235,451 69,000 5.250%, 12/01/27 72,527 80,000 Hughes Satellite Systems Corp.
5.250%, 08/01/26 89,640 Intelsat Jackson Holdings, SA@
200,000 9.750%, 07/15/25* 113,174 135,000 5.500%, 08/01/23 74,512 400,000 LCPR Senior Secured Financing
DAC* 6.750%, 10/15/27 427,832
146,188 Ligado Networks, LLC* 15.500%, 11/01/23 144,793
320,000 Lumen Technologies, Inc.* 4.000%, 02/15/27 329,450
Netflix, Inc. 200,000 4.875%, 06/15/30*^ 241,342 130,000 4.875%, 04/15/28 152,112
Scripps Escrow II, Inc.* 136,000 3.875%, 01/15/29 136,192
68,000 5.375%, 01/15/31 68,053 357,000 Scripps Escrow, Inc.*
5.875%, 07/15/27 369,856 136,000 Shift4 Payments, LLC / Shift4
Payments Finance Sub, Inc.*^ 4.625%, 11/01/26 141,821
Sirius XM Radio, Inc.* 345,000 5.500%, 07/01/29^ 378,427 345,000 4.625%, 07/15/24^ 354,484 201,000 4.000%, 07/15/28 207,432 195,000 Spanish Broadcasting System,
Inc.* 9.750%, 03/01/26 199,005
485,000 Sprint Capital Corp.^ 6.875%, 11/15/28 626,222
680,000 Sprint Corp. 7.125%, 06/15/24 783,102
210,000 Telecom Italia Capital, SA 6.000%, 09/30/34 241,552
370,000 United States Cellular Corp. 6.700%, 12/15/33 460,927
112,000 Windstream Services, LLC / Windstream Finance Corp.@& 7.750%, 10/01/21 1,204 ___________
12,843,315 ___________
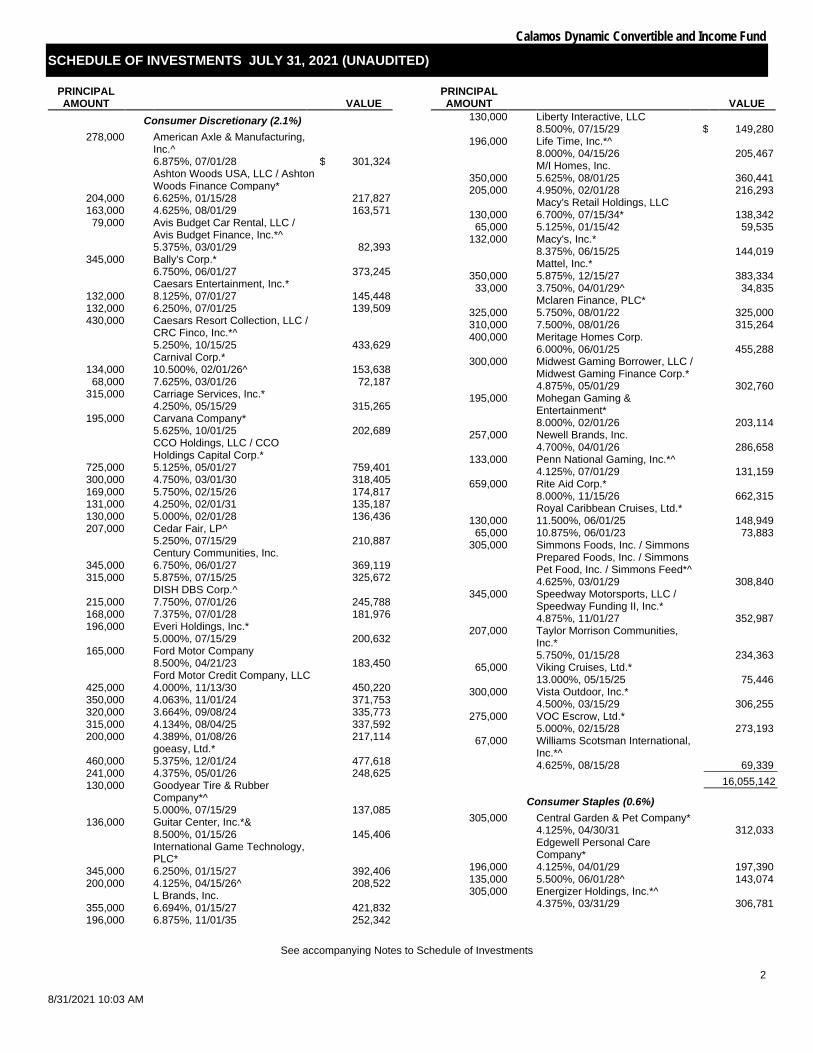
Calamos Dynamic Convertible and Income Fund
SCHEDULE OF INVESTMENTS JULY 31, 2021 (UNAUDITED)
See accompanying Notes to Schedule of Investments
2
8/31/2021 10:03 AM
PRINCIPAL AMOUNT VALUE
Consumer Discretionary (2.1%) 278,000 American Axle & Manufacturing,
Inc.^ 6.875%, 07/01/28 $ 301,324
Ashton Woods USA, LLC / Ashton Woods Finance Company*
204,000 6.625%, 01/15/28 217,827 163,000 4.625%, 08/01/29 163,571
79,000 Avis Budget Car Rental, LLC / Avis Budget Finance, Inc.*^ 5.375%, 03/01/29 82,393
345,000 Bally's Corp.* 6.750%, 06/01/27 373,245
Caesars Entertainment, Inc.* 132,000 8.125%, 07/01/27 145,448 132,000 6.250%, 07/01/25 139,509 430,000 Caesars Resort Collection, LLC /
CRC Finco, Inc.*^ 5.250%, 10/15/25 433,629
Carnival Corp.* 134,000 10.500%, 02/01/26^ 153,638
68,000 7.625%, 03/01/26 72,187 315,000 Carriage Services, Inc.*
4.250%, 05/15/29 315,265 195,000 Carvana Company*
5.625%, 10/01/25 202,689
CCO Holdings, LLC / CCO Holdings Capital Corp.*
725,000 5.125%, 05/01/27 759,401 300,000 4.750%, 03/01/30 318,405 169,000 5.750%, 02/15/26 174,817 131,000 4.250%, 02/01/31 135,187 130,000 5.000%, 02/01/28 136,436 207,000 Cedar Fair, LP^
5.250%, 07/15/29 210,887 Century Communities, Inc.
345,000 6.750%, 06/01/27 369,119 315,000 5.875%, 07/15/25 325,672
DISH DBS Corp.^ 215,000 7.750%, 07/01/26 245,788 168,000 7.375%, 07/01/28 181,976 196,000 Everi Holdings, Inc.*
5.000%, 07/15/29 200,632 165,000 Ford Motor Company
8.500%, 04/21/23 183,450 Ford Motor Credit Company, LLC
425,000 4.000%, 11/13/30 450,220 350,000 4.063%, 11/01/24 371,753 320,000 3.664%, 09/08/24 335,773 315,000 4.134%, 08/04/25 337,592 200,000 4.389%, 01/08/26 217,114
goeasy, Ltd.* 460,000 5.375%, 12/01/24 477,618 241,000 4.375%, 05/01/26 248,625 130,000 Goodyear Tire & Rubber
Company*^ 5.000%, 07/15/29 137,085
136,000 Guitar Center, Inc.*& 8.500%, 01/15/26 145,406
International Game Technology, PLC*
345,000 6.250%, 01/15/27 392,406 200,000 4.125%, 04/15/26^ 208,522
L Brands, Inc. 355,000 6.694%, 01/15/27 421,832 196,000 6.875%, 11/01/35 252,342
PRINCIPAL AMOUNT VALUE
130,000 Liberty Interactive, LLC 8.500%, 07/15/29 $ 149,280
196,000 Life Time, Inc.*^ 8.000%, 04/15/26 205,467
M/I Homes, Inc. 350,000 5.625%, 08/01/25 360,441 205,000 4.950%, 02/01/28 216,293
Macy's Retail Holdings, LLC 130,000 6.700%, 07/15/34* 138,342
65,000 5.125%, 01/15/42 59,535 132,000 Macy's, Inc.*
8.375%, 06/15/25 144,019 Mattel, Inc.*
350,000 5.875%, 12/15/27 383,334 33,000 3.750%, 04/01/29^ 34,835
Mclaren Finance, PLC* 325,000 5.750%, 08/01/22 325,000 310,000 7.500%, 08/01/26 315,264 400,000 Meritage Homes Corp.
6.000%, 06/01/25 455,288 300,000 Midwest Gaming Borrower, LLC /
Midwest Gaming Finance Corp.* 4.875%, 05/01/29 302,760
195,000 Mohegan Gaming & Entertainment* 8.000%, 02/01/26 203,114
257,000 Newell Brands, Inc. 4.700%, 04/01/26 286,658
133,000 Penn National Gaming, Inc.*^ 4.125%, 07/01/29 131,159
659,000 Rite Aid Corp.* 8.000%, 11/15/26 662,315
Royal Caribbean Cruises, Ltd.* 130,000 11.500%, 06/01/25 148,949
65,000 10.875%, 06/01/23 73,883 305,000 Simmons Foods, Inc. / Simmons
Prepared Foods, Inc. / Simmons Pet Food, Inc. / Simmons Feed*^ 4.625%, 03/01/29 308,840
345,000 Speedway Motorsports, LLC / Speedway Funding II, Inc.* 4.875%, 11/01/27 352,987
207,000 Taylor Morrison Communities, Inc.* 5.750%, 01/15/28 234,363
65,000 Viking Cruises, Ltd.* 13.000%, 05/15/25 75,446
300,000 Vista Outdoor, Inc.* 4.500%, 03/15/29 306,255
275,000 VOC Escrow, Ltd.* 5.000%, 02/15/28 273,193
67,000 Williams Scotsman International, Inc.*^ 4.625%, 08/15/28 69,339 ___________
16,055,142 ___________ Consumer Staples (0.6%)
305,000 Central Garden & Pet Company* 4.125%, 04/30/31 312,033
Edgewell Personal Care Company*
196,000 4.125%, 04/01/29 197,390 135,000 5.500%, 06/01/28^ 143,074 305,000 Energizer Holdings, Inc.*^
4.375%, 03/31/29 306,781
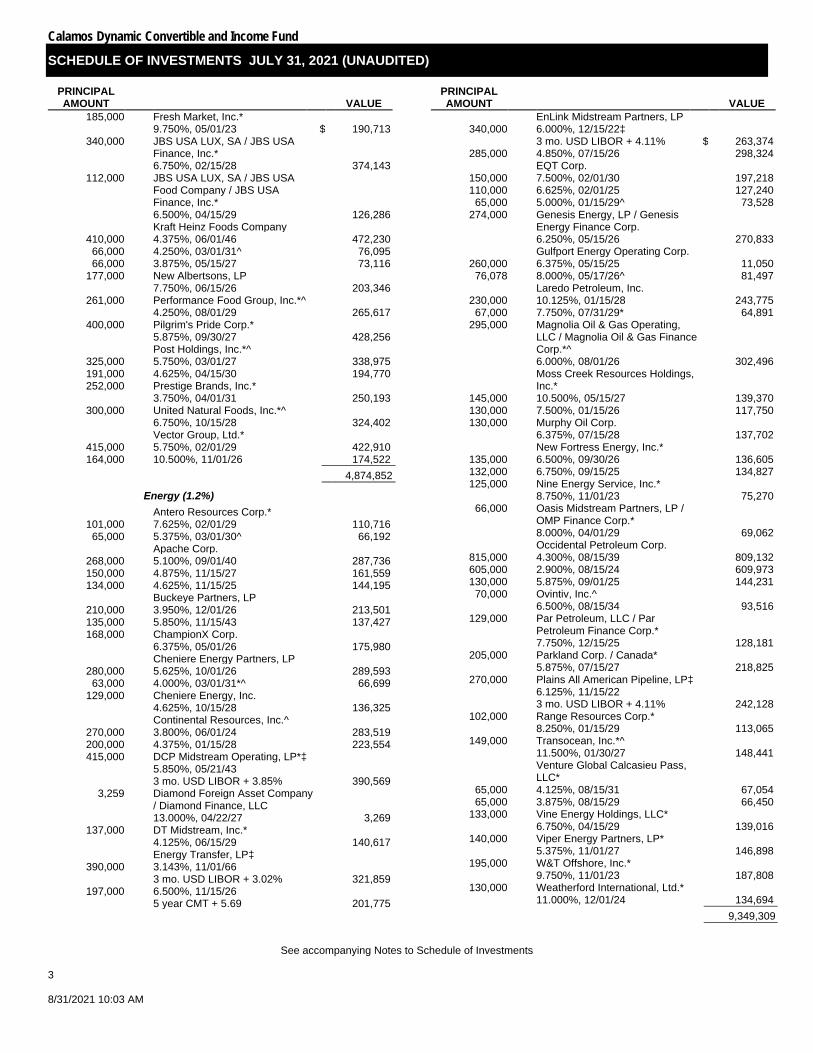
Calamos Dynamic Convertible and Income Fund
SCHEDULE OF INVESTMENTS JULY 31, 2021 (UNAUDITED)
See accompanying Notes to Schedule of Investments
3 8/31/2021 10:03 AM
PRINCIPAL AMOUNT VALUE
185,000 Fresh Market, Inc.* 9.750%, 05/01/23 $ 190,713
340,000 JBS USA LUX, SA / JBS USA Finance, Inc.* 6.750%, 02/15/28 374,143
112,000 JBS USA LUX, SA / JBS USA Food Company / JBS USA Finance, Inc.* 6.500%, 04/15/29 126,286
Kraft Heinz Foods Company 410,000 4.375%, 06/01/46 472,230
66,000 4.250%, 03/01/31^ 76,095 66,000 3.875%, 05/15/27 73,116
177,000 New Albertsons, LP 7.750%, 06/15/26 203,346
261,000 Performance Food Group, Inc.*^ 4.250%, 08/01/29 265,617
400,000 Pilgrim's Pride Corp.* 5.875%, 09/30/27 428,256
Post Holdings, Inc.*^ 325,000 5.750%, 03/01/27 338,975 191,000 4.625%, 04/15/30 194,770 252,000 Prestige Brands, Inc.*
3.750%, 04/01/31 250,193 300,000 United Natural Foods, Inc.*^
6.750%, 10/15/28 324,402 Vector Group, Ltd.*
415,000 5.750%, 02/01/29 422,910 164,000 10.500%, 11/01/26 174,522 ___________
4,874,852 ___________ Energy (1.2%)
Antero Resources Corp.* 101,000 7.625%, 02/01/29 110,716
65,000 5.375%, 03/01/30^ 66,192 Apache Corp.
268,000 5.100%, 09/01/40 287,736 150,000 4.875%, 11/15/27 161,559 134,000 4.625%, 11/15/25 144,195
Buckeye Partners, LP 210,000 3.950%, 12/01/26 213,501 135,000 5.850%, 11/15/43 137,427 168,000 ChampionX Corp.
6.375%, 05/01/26 175,980 Cheniere Energy Partners, LP
280,000 5.625%, 10/01/26 289,593 63,000 4.000%, 03/01/31*^ 66,699
129,000 Cheniere Energy, Inc. 4.625%, 10/15/28 136,325
Continental Resources, Inc.^ 270,000 3.800%, 06/01/24 283,519 200,000 4.375%, 01/15/28 223,554 415,000 DCP Midstream Operating, LP*‡
5.850%, 05/21/43 3 mo. USD LIBOR + 3.85% 390,569
3,259 Diamond Foreign Asset Company / Diamond Finance, LLC 13.000%, 04/22/27 3,269
137,000 DT Midstream, Inc.* 4.125%, 06/15/29 140,617
Energy Transfer, LP‡ 390,000 3.143%, 11/01/66
3 mo. USD LIBOR + 3.02% 321,859 197,000 6.500%, 11/15/26
5 year CMT + 5.69 201,775
PRINCIPAL AMOUNT VALUE
EnLink Midstream Partners, LP 340,000 6.000%, 12/15/22‡
3 mo. USD LIBOR + 4.11% $ 263,374 285,000 4.850%, 07/15/26 298,324
EQT Corp. 150,000 7.500%, 02/01/30 197,218 110,000 6.625%, 02/01/25 127,240
65,000 5.000%, 01/15/29^ 73,528 274,000 Genesis Energy, LP / Genesis
Energy Finance Corp. 6.250%, 05/15/26 270,833
Gulfport Energy Operating Corp. 260,000 6.375%, 05/15/25 11,050
76,078 8.000%, 05/17/26^ 81,497 Laredo Petroleum, Inc.
230,000 10.125%, 01/15/28 243,775 67,000 7.750%, 07/31/29* 64,891
295,000 Magnolia Oil & Gas Operating, LLC / Magnolia Oil & Gas Finance Corp.*^ 6.000%, 08/01/26 302,496
Moss Creek Resources Holdings, Inc.*
145,000 10.500%, 05/15/27 139,370 130,000 7.500%, 01/15/26 117,750 130,000 Murphy Oil Corp.
6.375%, 07/15/28 137,702 New Fortress Energy, Inc.*
135,000 6.500%, 09/30/26 136,605 132,000 6.750%, 09/15/25 134,827 125,000 Nine Energy Service, Inc.*
8.750%, 11/01/23 75,270 66,000 Oasis Midstream Partners, LP /
OMP Finance Corp.* 8.000%, 04/01/29 69,062
Occidental Petroleum Corp. 815,000 4.300%, 08/15/39 809,132 605,000 2.900%, 08/15/24 609,973 130,000 5.875%, 09/01/25 144,231
70,000 Ovintiv, Inc.^ 6.500%, 08/15/34 93,516
129,000 Par Petroleum, LLC / Par Petroleum Finance Corp.* 7.750%, 12/15/25 128,181
205,000 Parkland Corp. / Canada* 5.875%, 07/15/27 218,825
270,000 Plains All American Pipeline, LP‡ 6.125%, 11/15/22 3 mo. USD LIBOR + 4.11% 242,128
102,000 Range Resources Corp.* 8.250%, 01/15/29 113,065
149,000 Transocean, Inc.*^ 11.500%, 01/30/27 148,441
Venture Global Calcasieu Pass, LLC*
65,000 4.125%, 08/15/31 67,054 65,000 3.875%, 08/15/29 66,450
133,000 Vine Energy Holdings, LLC* 6.750%, 04/15/29 139,016
140,000 Viper Energy Partners, LP* 5.375%, 11/01/27 146,898
195,000 W&T Offshore, Inc.* 9.750%, 11/01/23 187,808
130,000 Weatherford International, Ltd.* 11.000%, 12/01/24 134,694 ___________
9,349,309 ___________
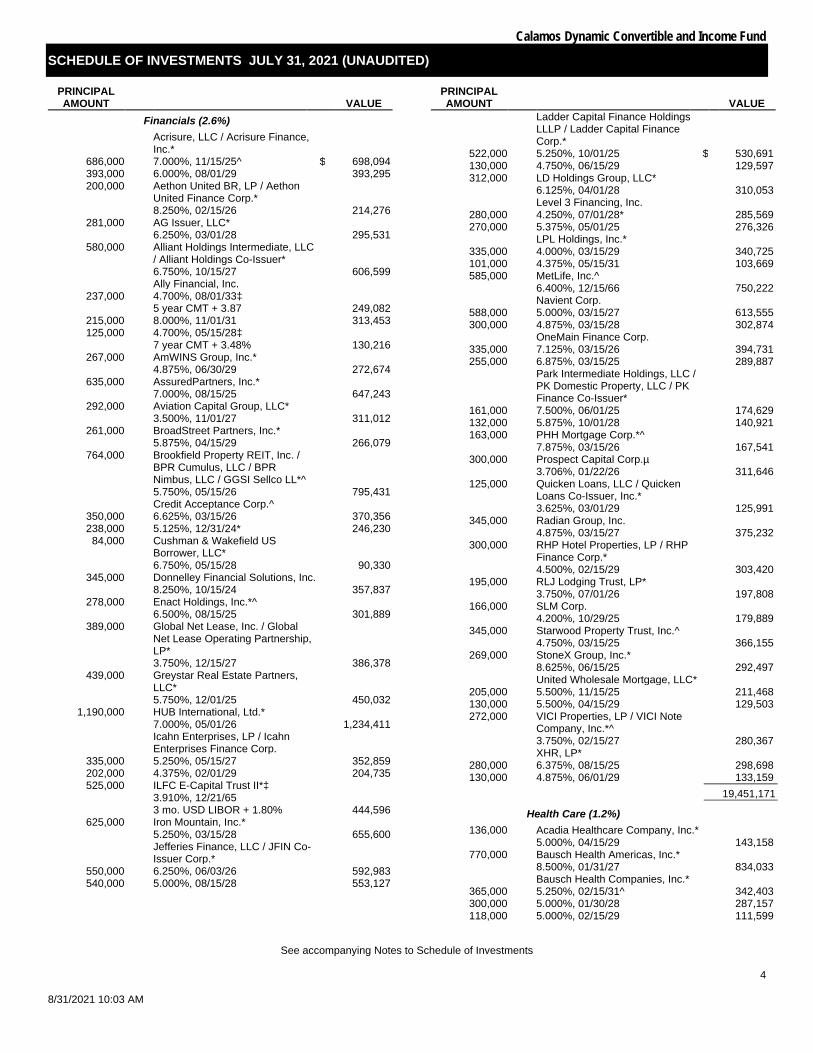
Calamos Dynamic Convertible and Income Fund
SCHEDULE OF INVESTMENTS JULY 31, 2021 (UNAUDITED)
See accompanying Notes to Schedule of Investments
4
8/31/2021 10:03 AM
PRINCIPAL AMOUNT VALUE
Financials (2.6%)
Acrisure, LLC / Acrisure Finance, Inc.*
686,000 7.000%, 11/15/25^ $ 698,094 393,000 6.000%, 08/01/29 393,295 200,000 Aethon United BR, LP / Aethon
United Finance Corp.* 8.250%, 02/15/26 214,276
281,000 AG Issuer, LLC* 6.250%, 03/01/28 295,531
580,000 Alliant Holdings Intermediate, LLC / Alliant Holdings Co-Issuer* 6.750%, 10/15/27 606,599
Ally Financial, Inc. 237,000 4.700%, 08/01/33‡
5 year CMT + 3.87 249,082 215,000 8.000%, 11/01/31 313,453 125,000 4.700%, 05/15/28‡
7 year CMT + 3.48% 130,216 267,000 AmWINS Group, Inc.*
4.875%, 06/30/29 272,674 635,000 AssuredPartners, Inc.*
7.000%, 08/15/25 647,243 292,000 Aviation Capital Group, LLC*
3.500%, 11/01/27 311,012 261,000 BroadStreet Partners, Inc.*
5.875%, 04/15/29 266,079 764,000 Brookfield Property REIT, Inc. /
BPR Cumulus, LLC / BPR Nimbus, LLC / GGSI Sellco LL*^ 5.750%, 05/15/26 795,431
Credit Acceptance Corp.^ 350,000 6.625%, 03/15/26 370,356 238,000 5.125%, 12/31/24* 246,230
84,000 Cushman & Wakefield US Borrower, LLC* 6.750%, 05/15/28 90,330
345,000 Donnelley Financial Solutions, Inc. 8.250%, 10/15/24 357,837
278,000 Enact Holdings, Inc.*^ 6.500%, 08/15/25 301,889
389,000 Global Net Lease, Inc. / Global Net Lease Operating Partnership, LP* 3.750%, 12/15/27 386,378
439,000 Greystar Real Estate Partners, LLC* 5.750%, 12/01/25 450,032
1,190,000 HUB International, Ltd.* 7.000%, 05/01/26 1,234,411
Icahn Enterprises, LP / Icahn Enterprises Finance Corp.
335,000 5.250%, 05/15/27 352,859 202,000 4.375%, 02/01/29 204,735 525,000 ILFC E-Capital Trust II*‡
3.910%, 12/21/65 3 mo. USD LIBOR + 1.80% 444,596
625,000 Iron Mountain, Inc.* 5.250%, 03/15/28 655,600
Jefferies Finance, LLC / JFIN Co-Issuer Corp.*
550,000 6.250%, 06/03/26 592,983 540,000 5.000%, 08/15/28 553,127
PRINCIPAL AMOUNT VALUE
Ladder Capital Finance Holdings LLLP / Ladder Capital Finance Corp.*
522,000 5.250%, 10/01/25 $ 530,691 130,000 4.750%, 06/15/29 129,597 312,000 LD Holdings Group, LLC*
6.125%, 04/01/28 310,053 Level 3 Financing, Inc.
280,000 4.250%, 07/01/28* 285,569 270,000 5.375%, 05/01/25 276,326
LPL Holdings, Inc.* 335,000 4.000%, 03/15/29 340,725 101,000 4.375%, 05/15/31 103,669 585,000 MetLife, Inc.^
6.400%, 12/15/66 750,222 Navient Corp.
588,000 5.000%, 03/15/27 613,555 300,000 4.875%, 03/15/28 302,874
OneMain Finance Corp. 335,000 7.125%, 03/15/26 394,731 255,000 6.875%, 03/15/25 289,887
Park Intermediate Holdings, LLC / PK Domestic Property, LLC / PK Finance Co-Issuer*
161,000 7.500%, 06/01/25 174,629 132,000 5.875%, 10/01/28 140,921 163,000 PHH Mortgage Corp.*^
7.875%, 03/15/26 167,541 300,000 Prospect Capital Corp.µ
3.706%, 01/22/26 311,646 125,000 Quicken Loans, LLC / Quicken
Loans Co-Issuer, Inc.* 3.625%, 03/01/29 125,991
345,000 Radian Group, Inc. 4.875%, 03/15/27 375,232
300,000 RHP Hotel Properties, LP / RHP Finance Corp.* 4.500%, 02/15/29 303,420
195,000 RLJ Lodging Trust, LP* 3.750%, 07/01/26 197,808
166,000 SLM Corp. 4.200%, 10/29/25 179,889
345,000 Starwood Property Trust, Inc.^ 4.750%, 03/15/25 366,155
269,000 StoneX Group, Inc.* 8.625%, 06/15/25 292,497
United Wholesale Mortgage, LLC* 205,000 5.500%, 11/15/25 211,468 130,000 5.500%, 04/15/29 129,503 272,000 VICI Properties, LP / VICI Note
Company, Inc.*^ 3.750%, 02/15/27 280,367
XHR, LP* 280,000 6.375%, 08/15/25 298,698 130,000 4.875%, 06/01/29 133,159 ___________
19,451,171 ___________ Health Care (1.2%)
136,000 Acadia Healthcare Company, Inc.* 5.000%, 04/15/29 143,158
770,000 Bausch Health Americas, Inc.* 8.500%, 01/31/27 834,033
Bausch Health Companies, Inc.* 365,000 5.250%, 02/15/31^ 342,403 300,000 5.000%, 01/30/28 287,157 118,000 5.000%, 02/15/29 111,599

Calamos Dynamic Convertible and Income Fund
SCHEDULE OF INVESTMENTS JULY 31, 2021 (UNAUDITED)
See accompanying Notes to Schedule of Investments
5 8/31/2021 10:03 AM
PRINCIPAL AMOUNT VALUE
Centene Corp. 276,000 4.250%, 12/15/27 $ 291,122 136,000 3.000%, 10/15/30 141,568 130,000 Charles River Laboratories
International, Inc.* 3.750%, 03/15/29 133,388
CHS/Community Health Systems, Inc.*
533,000 6.125%, 04/01/30 540,739 305,000 8.000%, 03/15/26 327,167 146,000 6.875%, 04/15/29 153,853
DaVita, Inc.* 396,000 4.625%, 06/01/30 409,488 198,000 3.750%, 02/15/31 192,793
Encompass Health Corp. 130,000 4.750%, 02/01/30^ 139,458 130,000 4.500%, 02/01/28 135,446 282,000 HCA, Inc.
7.500%, 11/06/33 403,133 200,000 Jazz Securities DAC*
4.375%, 01/15/29 208,826 465,000 Mallinckrodt International Finance,
SA / Mallinckrodt CB, LLC*@ 5.625%, 10/15/23 309,736
Organon & Company / Organon Foreign Debt Co-Issuer, BV*
490,000 5.125%, 04/30/31 505,337 200,000 4.125%, 04/30/28 205,378 302,000 Team Health Holdings, Inc.*^
6.375%, 02/01/25 281,986 Tenet Healthcare Corp.
625,000 6.250%, 02/01/27* 651,875 390,000 4.625%, 07/15/24 395,667 375,000 6.875%, 11/15/31 430,076 345,000 4.875%, 01/01/26* 357,713
Teva Pharmaceutical Finance Netherlands III, BV
590,000 2.800%, 07/21/23 585,380 520,000 6.000%, 04/15/24 547,196 ___________
9,065,675 ___________ Industrials (2.1%)
265,000 Abercrombie & Fitch Management Company* 8.750%, 07/15/25 293,456
300,000 ACCO Brands Corp.*^ 4.250%, 03/15/29 300,153
Albertsons Companies, Inc. / Safeway, Inc. / New Albertsons, LP / Albertsons, LLC*
340,000 4.625%, 01/15/27 359,846 337,000 4.875%, 02/15/30 365,075 136,000 3.500%, 03/15/29^ 137,463
Allison Transmission, Inc.* 230,000 4.750%, 10/01/27 240,348
70,000 3.750%, 01/30/31 70,067 66,000 Ambience Merger Sub, Inc.*
7.125%, 07/15/29 66,888 65,000 American Airlines Group, Inc.*^
3.750%, 03/01/25 57,940 146,000 Arcosa, Inc.*
4.375%, 04/15/29 149,670 700,000 ARD Finance, SA*
6.500%, 06/30/27 7.250% PIK rate 739,298
PRINCIPAL AMOUNT VALUE
137,000 Avolon Holdings Funding, Ltd.*µ 5.250%, 05/15/24 $ 150,900
238,000 Beacon Roofing Supply, Inc.*^ 4.125%, 05/15/29 238,828
261,000 BWX Technologies, Inc.* 4.125%, 04/15/29 267,588
Cascades, Inc. / Cascades USA, Inc.*
207,000 5.125%, 01/15/26 219,406 138,000 5.375%, 01/15/28 145,449
Delta Air Lines, Inc. 67,000 3.800%, 04/19/23^ 69,232 66,000 7.375%, 01/15/26 77,775
Delta Air Lines, Inc. / SkyMiles IP, Ltd.*
68,000 4.750%, 10/20/28 76,222 34,000 4.500%, 10/20/25µ 36,625
196,000 Endure Digital, Inc.*^ 6.000%, 02/15/29 190,318
145,000 EnerSys* 4.375%, 12/15/27 151,903
300,000 Fly Leasing, Ltd. 5.250%, 10/15/24 304,503
132,000 GFL Environmental, Inc.* 3.750%, 08/01/25 135,988
Golden Nugget, Inc.* 200,000 6.750%, 10/15/24 200,732 140,000 8.750%, 10/01/25^ 147,643 148,000 Graham Packaging Company,
Inc.* 7.125%, 08/15/28 158,464
140,000 Granite US Holdings Corp.* 11.000%, 10/01/27 156,433
Graphic Packaging International, LLC*
175,000 4.750%, 07/15/27 189,903 125,000 3.500%, 03/01/29 124,676
65,000 Great Lakes Dredge & Dock Corp.* 5.250%, 06/01/29 67,122
623,000 H&E Equipment Services, Inc.* 3.875%, 12/15/28 618,720
146,000 HCRX Investments Holdco, LP* 4.500%, 08/01/29 149,127
350,000 Herc Holdings, Inc.* 5.500%, 07/15/27 367,871
Howmet Aerospace, Inc. 326,000 5.125%, 10/01/24 359,311 114,000 6.875%, 05/01/25 132,747 350,000 JELD-WEN, Inc.*
4.625%, 12/15/25 357,056 136,000 KeHE Distributors, LLC / KeHE
Finance Corp.* 8.625%, 10/15/26 147,506
308,000 Ken Garff Automotive, LLC* 4.875%, 09/15/28 317,610
134,000 MasTec, Inc.* 4.500%, 08/15/28 141,414
174,000 Meritor, Inc.* 4.500%, 12/15/28 178,186
170,000 Moog, Inc.* 4.250%, 12/15/27 175,627
365,000 Nationstar Mortgage Holdings, Inc.* 5.500%, 08/15/28 371,519
272,000 Novelis Corp.* 4.750%, 01/30/30 290,050
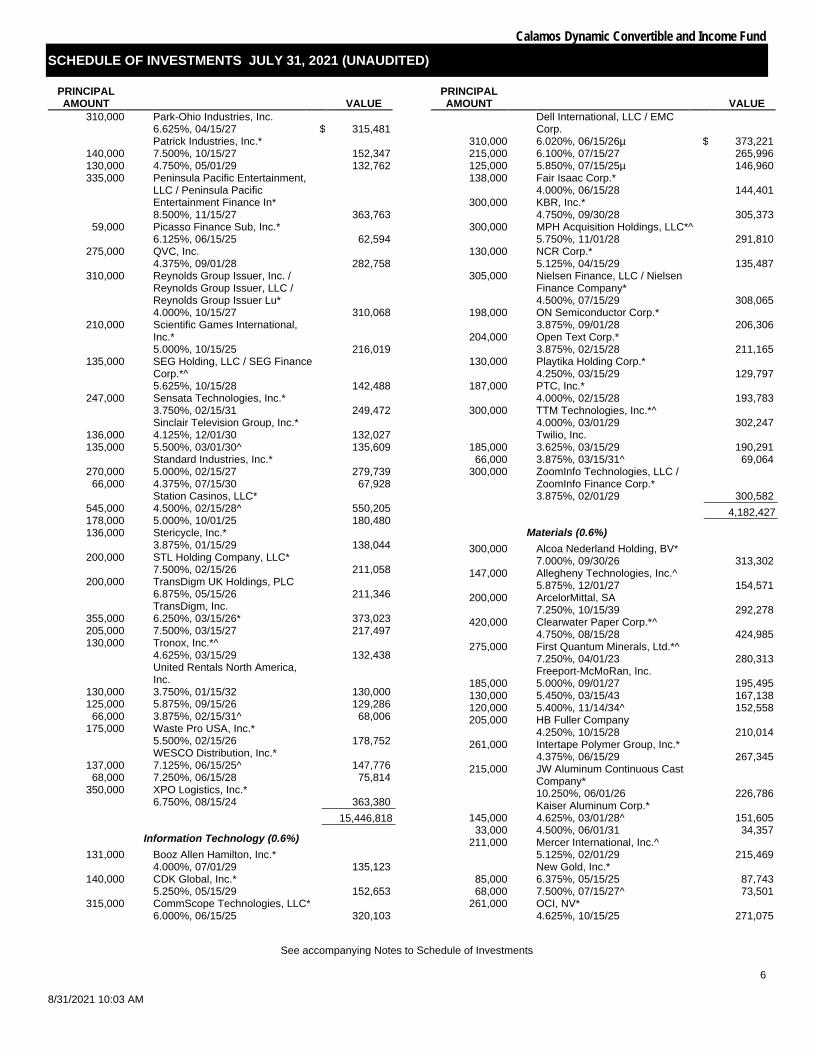
Calamos Dynamic Convertible and Income Fund
SCHEDULE OF INVESTMENTS JULY 31, 2021 (UNAUDITED)
See accompanying Notes to Schedule of Investments
6
8/31/2021 10:03 AM
PRINCIPAL AMOUNT VALUE
310,000 Park-Ohio Industries, Inc. 6.625%, 04/15/27 $ 315,481
Patrick Industries, Inc.* 140,000 7.500%, 10/15/27 152,347 130,000 4.750%, 05/01/29 132,762 335,000 Peninsula Pacific Entertainment,
LLC / Peninsula Pacific Entertainment Finance In* 8.500%, 11/15/27 363,763
59,000 Picasso Finance Sub, Inc.* 6.125%, 06/15/25 62,594
275,000 QVC, Inc. 4.375%, 09/01/28 282,758
310,000 Reynolds Group Issuer, Inc. / Reynolds Group Issuer, LLC / Reynolds Group Issuer Lu* 4.000%, 10/15/27 310,068
210,000 Scientific Games International, Inc.* 5.000%, 10/15/25 216,019
135,000 SEG Holding, LLC / SEG Finance Corp.*^ 5.625%, 10/15/28 142,488
247,000 Sensata Technologies, Inc.* 3.750%, 02/15/31 249,472
Sinclair Television Group, Inc.* 136,000 4.125%, 12/01/30 132,027 135,000 5.500%, 03/01/30^ 135,609
Standard Industries, Inc.* 270,000 5.000%, 02/15/27 279,739
66,000 4.375%, 07/15/30 67,928 Station Casinos, LLC*
545,000 4.500%, 02/15/28^ 550,205 178,000 5.000%, 10/01/25 180,480 136,000 Stericycle, Inc.*
3.875%, 01/15/29 138,044 200,000 STL Holding Company, LLC*
7.500%, 02/15/26 211,058 200,000 TransDigm UK Holdings, PLC
6.875%, 05/15/26 211,346 TransDigm, Inc.
355,000 6.250%, 03/15/26* 373,023 205,000 7.500%, 03/15/27 217,497 130,000 Tronox, Inc.*^
4.625%, 03/15/29 132,438
United Rentals North America, Inc.
130,000 3.750%, 01/15/32 130,000 125,000 5.875%, 09/15/26 129,286
66,000 3.875%, 02/15/31^ 68,006 175,000 Waste Pro USA, Inc.*
5.500%, 02/15/26 178,752 WESCO Distribution, Inc.*
137,000 7.125%, 06/15/25^ 147,776 68,000 7.250%, 06/15/28 75,814
350,000 XPO Logistics, Inc.* 6.750%, 08/15/24 363,380 ___________
15,446,818 ___________ Information Technology (0.6%)
131,000 Booz Allen Hamilton, Inc.* 4.000%, 07/01/29 135,123
140,000 CDK Global, Inc.* 5.250%, 05/15/29 152,653
315,000 CommScope Technologies, LLC* 6.000%, 06/15/25 320,103
PRINCIPAL AMOUNT VALUE
Dell International, LLC / EMC Corp.
310,000 6.020%, 06/15/26µ $ 373,221 215,000 6.100%, 07/15/27 265,996 125,000 5.850%, 07/15/25µ 146,960 138,000 Fair Isaac Corp.*
4.000%, 06/15/28 144,401 300,000 KBR, Inc.*
4.750%, 09/30/28 305,373 300,000 MPH Acquisition Holdings, LLC*^
5.750%, 11/01/28 291,810 130,000 NCR Corp.*
5.125%, 04/15/29 135,487 305,000 Nielsen Finance, LLC / Nielsen
Finance Company* 4.500%, 07/15/29 308,065
198,000 ON Semiconductor Corp.* 3.875%, 09/01/28 206,306
204,000 Open Text Corp.* 3.875%, 02/15/28 211,165
130,000 Playtika Holding Corp.* 4.250%, 03/15/29 129,797
187,000 PTC, Inc.* 4.000%, 02/15/28 193,783
300,000 TTM Technologies, Inc.*^ 4.000%, 03/01/29 302,247
Twilio, Inc. 185,000 3.625%, 03/15/29 190,291
66,000 3.875%, 03/15/31^ 69,064 300,000 ZoomInfo Technologies, LLC /
ZoomInfo Finance Corp.* 3.875%, 02/01/29 300,582 ___________
4,182,427 ___________ Materials (0.6%)
300,000 Alcoa Nederland Holding, BV* 7.000%, 09/30/26 313,302
147,000 Allegheny Technologies, Inc.^ 5.875%, 12/01/27 154,571
200,000 ArcelorMittal, SA 7.250%, 10/15/39 292,278
420,000 Clearwater Paper Corp.*^ 4.750%, 08/15/28 424,985
275,000 First Quantum Minerals, Ltd.*^ 7.250%, 04/01/23 280,313
Freeport-McMoRan, Inc. 185,000 5.000%, 09/01/27 195,495 130,000 5.450%, 03/15/43 167,138 120,000 5.400%, 11/14/34^ 152,558 205,000 HB Fuller Company
4.250%, 10/15/28 210,014 261,000 Intertape Polymer Group, Inc.*
4.375%, 06/15/29 267,345 215,000 JW Aluminum Continuous Cast
Company* 10.250%, 06/01/26 226,786
Kaiser Aluminum Corp.* 145,000 4.625%, 03/01/28^ 151,605
33,000 4.500%, 06/01/31 34,357 211,000 Mercer International, Inc.^
5.125%, 02/01/29 215,469 New Gold, Inc.*
85,000 6.375%, 05/15/25 87,743 68,000 7.500%, 07/15/27^ 73,501
261,000 OCI, NV* 4.625%, 10/15/25 271,075

Calamos Dynamic Convertible and Income Fund
SCHEDULE OF INVESTMENTS JULY 31, 2021 (UNAUDITED)
See accompanying Notes to Schedule of Investments
7 8/31/2021 10:03 AM
PRINCIPAL AMOUNT VALUE
132,000 Owens-Brockway Glass Container, Inc.*^ 6.625%, 05/13/27 $ 143,178
133,000 PBF Holding Company, LLC / PBF Finance Corp. 7.250%, 06/15/25 80,369
305,000 Silgan Holdings, Inc. 4.125%, 02/01/28 316,944
131,000 Trinseo Materials Operating SCA / Trinseo Materials Finance, Inc.* 5.125%, 04/01/29 133,705
210,000 Univar Solutions USA, Inc.* 5.125%, 12/01/27 220,292
134,000 Valvoline, Inc.* 3.625%, 06/15/31 133,582 ___________
4,546,605 ___________ Real Estate (0.2%)
210,000 EPR Properties^ 3.750%, 08/15/29 213,278
Forestar Group, Inc.* 195,000 5.000%, 03/01/28 203,266
67,000 3.850%, 05/15/26 68,021 204,000 iStar, Inc.^
5.500%, 02/15/26 214,176 Service Properties Trust
345,000 4.350%, 10/01/24 348,226 125,000 5.250%, 02/15/26 126,530 ___________
1,173,497 ___________ Utilities (0.2%)
204,000 Calpine Corp.* 4.500%, 02/15/28 210,571
95,000 NRG Energy, Inc. 6.625%, 01/15/27 98,455
401,000 PPL Capital Funding, Inc.^‡ 2.812%, 03/30/67 3 mo. USD LIBOR + 2.67% 393,192
Talen Energy Supply, LLC* 135,000 10.500%, 01/15/26 93,192
70,000 7.250%, 05/15/27 63,908 350,000 TerraForm Power Operating, LLC*
5.000%, 01/31/28 378,987 ___________ 1,238,305 ___________
TOTAL CORPORATE BONDS (Cost $96,568,382) 100,830,180 ___________ ___________
CONVERTIBLE BONDS (107.5%) Communication Services (12.7%)
3,193,000 Eventbrite, Inc.*µ 0.750%, 09/15/26 3,019,620
Liberty Media Corp. 8,000,000 0.500%, 12/01/50* 8,859,360 5,825,000 1.375%, 10/15/23µ 7,745,444 5,000,000 Liberty Media Corp. / Liberty
Formula One 1.000%, 01/30/23 6,622,300
4,500,000 Match Group Financeco 3, Inc.*µ 2.000%, 01/15/30 9,081,495
4,000,000 Sea, Ltd. 2.375%, 12/01/25 12,434,240
Snap, Inc. 10,000,000 0.000%, 05/01/27* 11,512,000
5,000,000 0.750%, 08/01/26 16,369,250
PRINCIPAL AMOUNT VALUE
7,750,000 Twitter, Inc.^ 0.250%, 06/15/24 $ 10,747,158
6,600,000 Zynga, Inc.µ 0.250%, 06/01/24 8,820,042 ___________
95,210,909 ___________ Consumer Discretionary (31.6%)
5,000,000 Airbnb, Inc.* 0.000%, 03/15/26 4,686,400
8,000,000 Booking Holdings, Inc.^ 0.750%, 05/01/25 11,292,800
5,500,000 Burlington Stores, Inc.^ 2.250%, 04/15/25 8,999,485
4,750,000 Cheesecake Factory, Inc. 0.375%, 06/15/26 4,455,975
7,500,000 Chegg, Inc.* 0.000%, 09/01/26 8,132,775
2,250,000 Dick's Sporting Goods, Inc. 3.250%, 04/15/25 6,923,160
DISH Network Corp. 4,500,000 0.000%, 12/15/25* 5,266,800
515,000 2.375%, 03/15/24 499,050 9,750,000 DraftKings, Inc.*
0.000%, 03/15/28 8,558,940 11,250,000 Etsy, Inc.*µ^
0.125%, 09/01/27 13,559,625 3,683,000 Expedia Group, Inc.*µ^
0.000%, 02/15/26 3,960,035 10,000,000 Ford Motor Company*µ
0.000%, 03/15/26 10,715,500 4,750,000 LCI Industries*µ
1.125%, 05/15/26 5,122,590 Liberty Interactive, LLC
280,000 4.000%, 11/15/29 215,776 170,000 3.750%, 02/15/30 131,145
3,677,000 MakeMyTrip, Ltd.* 0.000%, 02/15/28 3,717,006
10,000,000 Marriott Vacations Worldwide Corp.*µ 0.000%, 01/15/26 10,692,300
2,750,000 NCL Corp. Ltd. 6.000%, 05/15/24 5,394,758
3,739,000 NCL Corp., Ltd.* 5.375%, 08/01/25 5,917,117
125,000 Peloton Interactive, Inc.* 0.000%, 02/15/26 118,284
4,000,000 RH 0.000%, 09/15/24 12,511,640
13,500,000 Royal Caribbean Cruises, Ltd. 4.250%, 06/15/23 17,394,750
5,000,000 Shake Shack, Inc.* 0.000%, 03/01/28 4,685,550
3,875,000 Tesla, Inc.~ 2.000%, 05/15/24 42,944,494
3,250,000 Under Armour, Inc.^ 1.500%, 06/01/24 6,067,068
13,250,000 Vail Resorts, Inc.*^ 0.000%, 01/01/26 13,378,657
4,750,000 Vroom, Inc.* 0.750%, 07/01/26 4,621,085
11,000,000 Wayfair, Inc.* 0.625%, 10/01/25 10,686,390
5,250,000 Winnebago Industries, Inc. 1.500%, 04/01/25 6,947,430 ___________
237,596,585 ___________
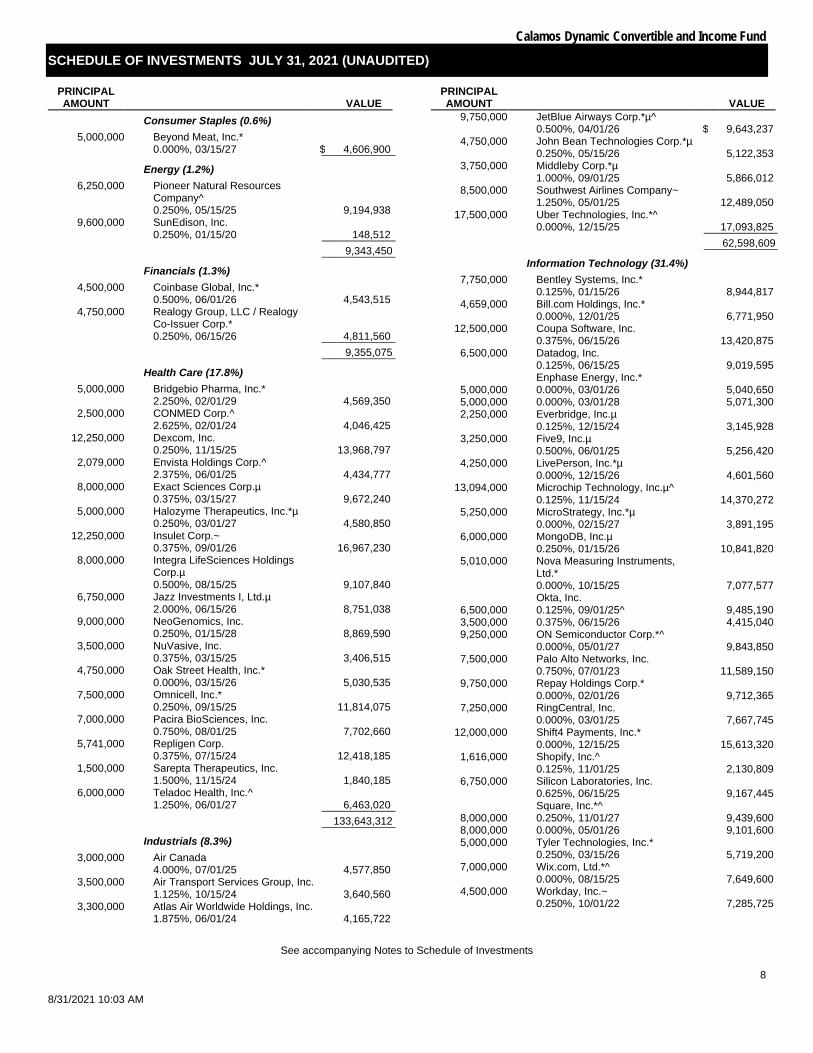
Calamos Dynamic Convertible and Income Fund
SCHEDULE OF INVESTMENTS JULY 31, 2021 (UNAUDITED)
See accompanying Notes to Schedule of Investments
8
8/31/2021 10:03 AM
PRINCIPAL AMOUNT VALUE
Consumer Staples (0.6%) 5,000,000 Beyond Meat, Inc.*
0.000%, 03/15/27 $ 4,606,900 ___________ Energy (1.2%)
6,250,000 Pioneer Natural Resources Company^ 0.250%, 05/15/25 9,194,938
9,600,000 SunEdison, Inc. 0.250%, 01/15/20 148,512 ___________
9,343,450 ___________ Financials (1.3%)
4,500,000 Coinbase Global, Inc.* 0.500%, 06/01/26 4,543,515
4,750,000 Realogy Group, LLC / Realogy Co-Issuer Corp.* 0.250%, 06/15/26 4,811,560 ___________
9,355,075 ___________ Health Care (17.8%)
5,000,000 Bridgebio Pharma, Inc.* 2.250%, 02/01/29 4,569,350
2,500,000 CONMED Corp.^ 2.625%, 02/01/24 4,046,425
12,250,000 Dexcom, Inc. 0.250%, 11/15/25 13,968,797
2,079,000 Envista Holdings Corp.^ 2.375%, 06/01/25 4,434,777
8,000,000 Exact Sciences Corp.µ 0.375%, 03/15/27 9,672,240
5,000,000 Halozyme Therapeutics, Inc.*µ 0.250%, 03/01/27 4,580,850
12,250,000 Insulet Corp.~ 0.375%, 09/01/26 16,967,230
8,000,000 Integra LifeSciences Holdings Corp.µ 0.500%, 08/15/25 9,107,840
6,750,000 Jazz Investments I, Ltd.µ 2.000%, 06/15/26 8,751,038
9,000,000 NeoGenomics, Inc. 0.250%, 01/15/28 8,869,590
3,500,000 NuVasive, Inc. 0.375%, 03/15/25 3,406,515
4,750,000 Oak Street Health, Inc.* 0.000%, 03/15/26 5,030,535
7,500,000 Omnicell, Inc.* 0.250%, 09/15/25 11,814,075
7,000,000 Pacira BioSciences, Inc. 0.750%, 08/01/25 7,702,660
5,741,000 Repligen Corp. 0.375%, 07/15/24 12,418,185
1,500,000 Sarepta Therapeutics, Inc. 1.500%, 11/15/24 1,840,185
6,000,000 Teladoc Health, Inc.^ 1.250%, 06/01/27 6,463,020 ___________
133,643,312 ___________ Industrials (8.3%)
3,000,000 Air Canada 4.000%, 07/01/25 4,577,850
3,500,000 Air Transport Services Group, Inc. 1.125%, 10/15/24 3,640,560
3,300,000 Atlas Air Worldwide Holdings, Inc. 1.875%, 06/01/24 4,165,722
PRINCIPAL AMOUNT VALUE
9,750,000 JetBlue Airways Corp.*µ^ 0.500%, 04/01/26 $ 9,643,237
4,750,000 John Bean Technologies Corp.*µ 0.250%, 05/15/26 5,122,353
3,750,000 Middleby Corp.*µ 1.000%, 09/01/25 5,866,012
8,500,000 Southwest Airlines Company~ 1.250%, 05/01/25 12,489,050
17,500,000 Uber Technologies, Inc.*^ 0.000%, 12/15/25 17,093,825 ___________
62,598,609 ___________ Information Technology (31.4%)
7,750,000 Bentley Systems, Inc.* 0.125%, 01/15/26 8,944,817
4,659,000 Bill.com Holdings, Inc.* 0.000%, 12/01/25 6,771,950
12,500,000 Coupa Software, Inc. 0.375%, 06/15/26 13,420,875
6,500,000 Datadog, Inc. 0.125%, 06/15/25 9,019,595
Enphase Energy, Inc.* 5,000,000 0.000%, 03/01/26 5,040,650 5,000,000 0.000%, 03/01/28 5,071,300 2,250,000 Everbridge, Inc.µ
0.125%, 12/15/24 3,145,928 3,250,000 Five9, Inc.µ
0.500%, 06/01/25 5,256,420 4,250,000 LivePerson, Inc.*µ
0.000%, 12/15/26 4,601,560 13,094,000 Microchip Technology, Inc.µ^
0.125%, 11/15/24 14,370,272 5,250,000 MicroStrategy, Inc.*µ
0.000%, 02/15/27 3,891,195 6,000,000 MongoDB, Inc.µ
0.250%, 01/15/26 10,841,820 5,010,000 Nova Measuring Instruments,
Ltd.* 0.000%, 10/15/25 7,077,577
Okta, Inc. 6,500,000 0.125%, 09/01/25^ 9,485,190 3,500,000 0.375%, 06/15/26 4,415,040 9,250,000 ON Semiconductor Corp.*^
0.000%, 05/01/27 9,843,850 7,500,000 Palo Alto Networks, Inc.
0.750%, 07/01/23 11,589,150 9,750,000 Repay Holdings Corp.*
0.000%, 02/01/26 9,712,365 7,250,000 RingCentral, Inc.
0.000%, 03/01/25 7,667,745 12,000,000 Shift4 Payments, Inc.*
0.000%, 12/15/25 15,613,320 1,616,000 Shopify, Inc.^
0.125%, 11/01/25 2,130,809 6,750,000 Silicon Laboratories, Inc.
0.625%, 06/15/25 9,167,445 Square, Inc.*^
8,000,000 0.250%, 11/01/27 9,439,600 8,000,000 0.000%, 05/01/26 9,101,600 5,000,000 Tyler Technologies, Inc.*
0.250%, 03/15/26 5,719,200 7,000,000 Wix.com, Ltd.*^
0.000%, 08/15/25 7,649,600 4,500,000 Workday, Inc.~
0.250%, 10/01/22 7,285,725
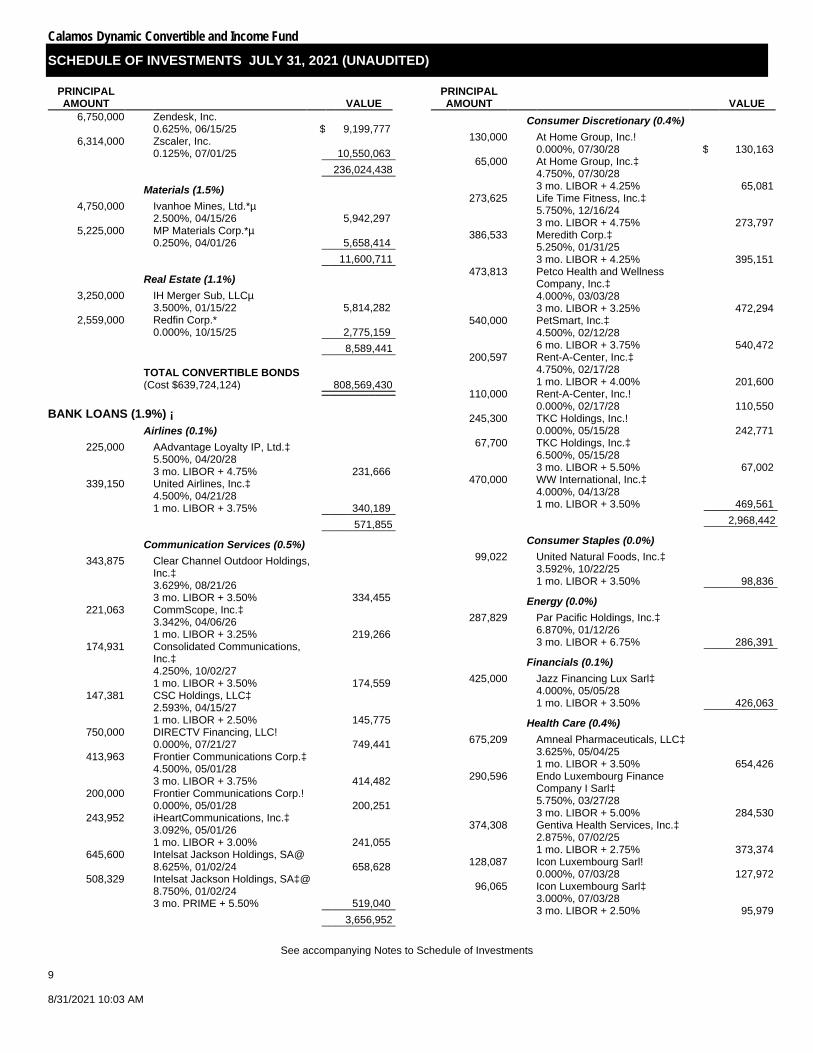
Calamos Dynamic Convertible and Income Fund
SCHEDULE OF INVESTMENTS JULY 31, 2021 (UNAUDITED)
See accompanying Notes to Schedule of Investments
9 8/31/2021 10:03 AM
PRINCIPAL AMOUNT VALUE
6,750,000 Zendesk, Inc. 0.625%, 06/15/25 $ 9,199,777
6,314,000 Zscaler, Inc. 0.125%, 07/01/25 10,550,063 ___________
236,024,438 ___________ Materials (1.5%)
4,750,000 Ivanhoe Mines, Ltd.*µ 2.500%, 04/15/26 5,942,297
5,225,000 MP Materials Corp.*µ 0.250%, 04/01/26 5,658,414 ___________
11,600,711 ___________ Real Estate (1.1%)
3,250,000 IH Merger Sub, LLCµ 3.500%, 01/15/22 5,814,282
2,559,000 Redfin Corp.* 0.000%, 10/15/25 2,775,159 ___________
8,589,441 ___________
TOTAL CONVERTIBLE BONDS (Cost $639,724,124) 808,569,430 ___________ ___________
BANK LOANS (1.9%) ¡ Airlines (0.1%)
225,000 AAdvantage Loyalty IP, Ltd.‡ 5.500%, 04/20/28 3 mo. LIBOR + 4.75% 231,666
339,150 United Airlines, Inc.‡ 4.500%, 04/21/28 1 mo. LIBOR + 3.75% 340,189 ___________
571,855 ___________ Communication Services (0.5%)
343,875 Clear Channel Outdoor Holdings, Inc.‡ 3.629%, 08/21/26 3 mo. LIBOR + 3.50% 334,455
221,063 CommScope, Inc.‡ 3.342%, 04/06/26 1 mo. LIBOR + 3.25% 219,266
174,931 Consolidated Communications, Inc.‡ 4.250%, 10/02/27 1 mo. LIBOR + 3.50% 174,559
147,381 CSC Holdings, LLC‡ 2.593%, 04/15/27 1 mo. LIBOR + 2.50% 145,775
750,000 DIRECTV Financing, LLC! 0.000%, 07/21/27 749,441
413,963 Frontier Communications Corp.‡ 4.500%, 05/01/28 3 mo. LIBOR + 3.75% 414,482
200,000 Frontier Communications Corp.! 0.000%, 05/01/28 200,251
243,952 iHeartCommunications, Inc.‡ 3.092%, 05/01/26 1 mo. LIBOR + 3.00% 241,055
645,600 Intelsat Jackson Holdings, SA@ 8.625%, 01/02/24 658,628
508,329 Intelsat Jackson Holdings, SA‡@ 8.750%, 01/02/24 3 mo. PRIME + 5.50% 519,040 ___________
3,656,952 ___________
PRINCIPAL AMOUNT VALUE
Consumer Discretionary (0.4%) 130,000 At Home Group, Inc.!
0.000%, 07/30/28 $ 130,163 65,000 At Home Group, Inc.‡
4.750%, 07/30/28 3 mo. LIBOR + 4.25% 65,081
273,625 Life Time Fitness, Inc.‡ 5.750%, 12/16/24 3 mo. LIBOR + 4.75% 273,797
386,533 Meredith Corp.‡ 5.250%, 01/31/25 3 mo. LIBOR + 4.25% 395,151
473,813 Petco Health and Wellness Company, Inc.‡ 4.000%, 03/03/28 3 mo. LIBOR + 3.25% 472,294
540,000 PetSmart, Inc.‡ 4.500%, 02/12/28 6 mo. LIBOR + 3.75% 540,472
200,597 Rent-A-Center, Inc.‡ 4.750%, 02/17/28 1 mo. LIBOR + 4.00% 201,600
110,000 Rent-A-Center, Inc.! 0.000%, 02/17/28 110,550
245,300 TKC Holdings, Inc.! 0.000%, 05/15/28 242,771
67,700 TKC Holdings, Inc.‡ 6.500%, 05/15/28 3 mo. LIBOR + 5.50% 67,002
470,000 WW International, Inc.‡ 4.000%, 04/13/28 1 mo. LIBOR + 3.50% 469,561 ___________
2,968,442 ___________ Consumer Staples (0.0%)
99,022 United Natural Foods, Inc.‡ 3.592%, 10/22/25 1 mo. LIBOR + 3.50% 98,836 ___________
Energy (0.0%) 287,829 Par Pacific Holdings, Inc.‡
6.870%, 01/12/26 3 mo. LIBOR + 6.75% 286,391 ___________
Financials (0.1%) 425,000 Jazz Financing Lux Sarl‡
4.000%, 05/05/28 1 mo. LIBOR + 3.50% 426,063 ___________
Health Care (0.4%) 675,209 Amneal Pharmaceuticals, LLC‡
3.625%, 05/04/25 1 mo. LIBOR + 3.50% 654,426
290,596 Endo Luxembourg Finance Company I Sarl‡ 5.750%, 03/27/28 3 mo. LIBOR + 5.00% 284,530
374,308 Gentiva Health Services, Inc.‡ 2.875%, 07/02/25 1 mo. LIBOR + 2.75% 373,374
128,087 Icon Luxembourg Sarl! 0.000%, 07/03/28 127,972
96,065 Icon Luxembourg Sarl‡ 3.000%, 07/03/28 3 mo. LIBOR + 2.50% 95,979
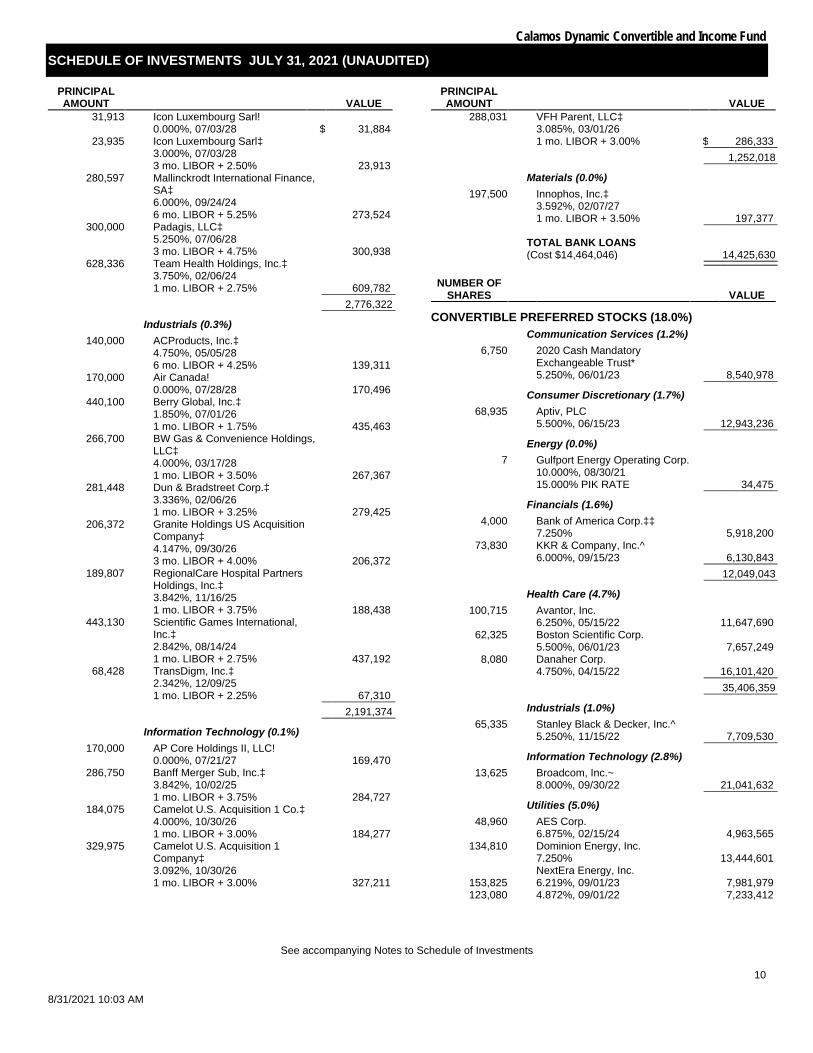
Calamos Dynamic Convertible and Income Fund
SCHEDULE OF INVESTMENTS JULY 31, 2021 (UNAUDITED)
See accompanying Notes to Schedule of Investments
10
8/31/2021 10:03 AM
PRINCIPAL AMOUNT VALUE
31,913 Icon Luxembourg Sarl! 0.000%, 07/03/28 $ 31,884
23,935 Icon Luxembourg Sarl‡ 3.000%, 07/03/28 3 mo. LIBOR + 2.50% 23,913
280,597 Mallinckrodt International Finance, SA‡ 6.000%, 09/24/24 6 mo. LIBOR + 5.25% 273,524
300,000 Padagis, LLC‡ 5.250%, 07/06/28 3 mo. LIBOR + 4.75% 300,938
628,336 Team Health Holdings, Inc.‡ 3.750%, 02/06/24 1 mo. LIBOR + 2.75% 609,782 ___________
2,776,322 ___________ Industrials (0.3%)
140,000 ACProducts, Inc.‡ 4.750%, 05/05/28 6 mo. LIBOR + 4.25% 139,311
170,000 Air Canada! 0.000%, 07/28/28 170,496
440,100 Berry Global, Inc.‡ 1.850%, 07/01/26 1 mo. LIBOR + 1.75% 435,463
266,700 BW Gas & Convenience Holdings, LLC‡ 4.000%, 03/17/28 1 mo. LIBOR + 3.50% 267,367
281,448 Dun & Bradstreet Corp.‡ 3.336%, 02/06/26 1 mo. LIBOR + 3.25% 279,425
206,372 Granite Holdings US Acquisition Company‡ 4.147%, 09/30/26 3 mo. LIBOR + 4.00% 206,372
189,807 RegionalCare Hospital Partners Holdings, Inc.‡ 3.842%, 11/16/25 1 mo. LIBOR + 3.75% 188,438
443,130 Scientific Games International, Inc.‡ 2.842%, 08/14/24 1 mo. LIBOR + 2.75% 437,192
68,428 TransDigm, Inc.‡ 2.342%, 12/09/25 1 mo. LIBOR + 2.25% 67,310 ___________
2,191,374 ___________ Information Technology (0.1%)
170,000 AP Core Holdings II, LLC! 0.000%, 07/21/27 169,470
286,750 Banff Merger Sub, Inc.‡ 3.842%, 10/02/25 1 mo. LIBOR + 3.75% 284,727
184,075 Camelot U.S. Acquisition 1 Co.‡ 4.000%, 10/30/26 1 mo. LIBOR + 3.00% 184,277
329,975 Camelot U.S. Acquisition 1 Company‡ 3.092%, 10/30/26 1 mo. LIBOR + 3.00% 327,211
PRINCIPAL AMOUNT VALUE
288,031 VFH Parent, LLC‡ 3.085%, 03/01/26 1 mo. LIBOR + 3.00% $ 286,333 ___________
1,252,018 ___________ Materials (0.0%)
197,500 Innophos, Inc.‡ 3.592%, 02/07/27 1 mo. LIBOR + 3.50% 197,377 ___________
TOTAL BANK LOANS (Cost $14,464,046) 14,425,630 ___________ ___________
NUMBER OF SHARES VALUE
CONVERTIBLE PREFERRED STOCKS (18.0%) Communication Services (1.2%)
6,750 2020 Cash Mandatory Exchangeable Trust* 5.250%, 06/01/23 8,540,978 ___________
Consumer Discretionary (1.7%) 68,935 Aptiv, PLC
5.500%, 06/15/23 12,943,236 ___________ Energy (0.0%)
7 Gulfport Energy Operating Corp. 10.000%, 08/30/21 15.000% PIK RATE 34,475 ___________
Financials (1.6%) 4,000 Bank of America Corp.‡‡
7.250% 5,918,200 73,830 KKR & Company, Inc.^
6.000%, 09/15/23 6,130,843 ___________ 12,049,043 ___________
Health Care (4.7%) 100,715 Avantor, Inc.
6.250%, 05/15/22 11,647,690 62,325 Boston Scientific Corp.
5.500%, 06/01/23 7,657,249 8,080 Danaher Corp.
4.750%, 04/15/22 16,101,420 ___________ 35,406,359 ___________
Industrials (1.0%) 65,335 Stanley Black & Decker, Inc.^
5.250%, 11/15/22 7,709,530 ___________ Information Technology (2.8%)
13,625 Broadcom, Inc.~ 8.000%, 09/30/22 21,041,632 ___________
Utilities (5.0%) 48,960 AES Corp.
6.875%, 02/15/24 4,963,565 134,810 Dominion Energy, Inc.
7.250% 13,444,601 NextEra Energy, Inc.
153,825 6.219%, 09/01/23 7,981,979 123,080 4.872%, 09/01/22 7,233,412
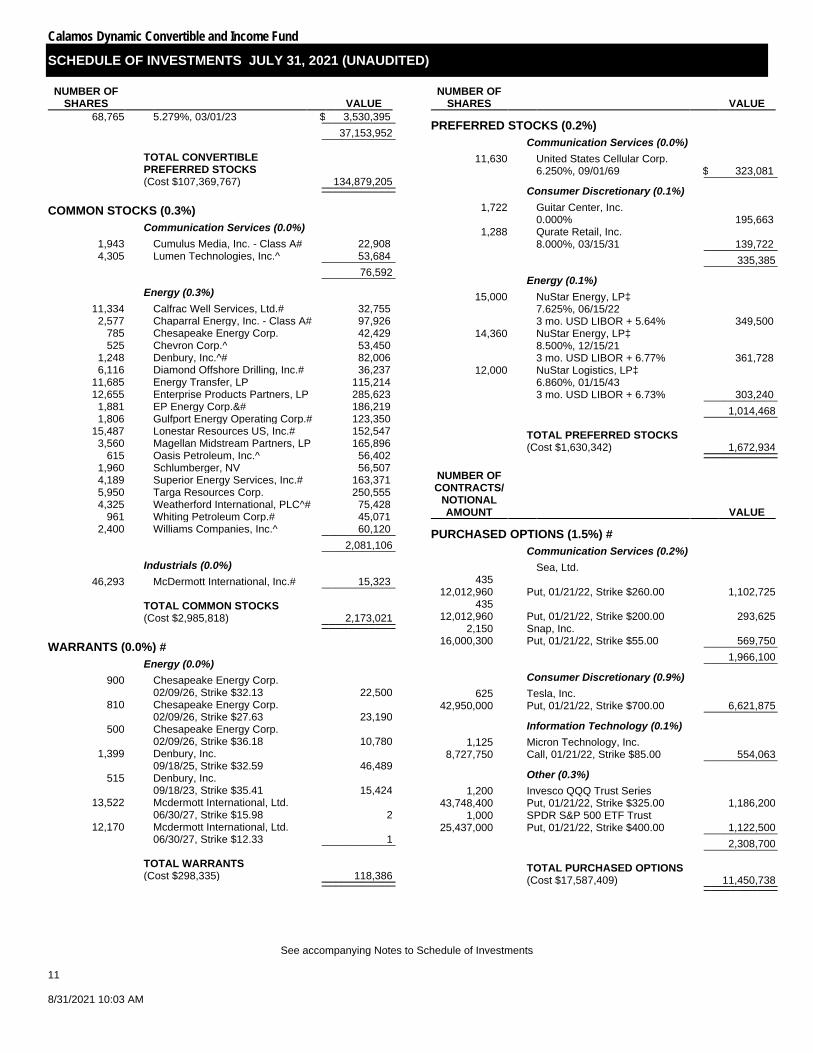
Calamos Dynamic Convertible and Income Fund
SCHEDULE OF INVESTMENTS JULY 31, 2021 (UNAUDITED)
See accompanying Notes to Schedule of Investments
11 8/31/2021 10:03 AM
NUMBER OF SHARES VALUE
68,765 5.279%, 03/01/23 $ 3,530,395 ___________ 37,153,952 ___________
TOTAL CONVERTIBLE PREFERRED STOCKS (Cost $107,369,767) 134,879,205 ___________ ___________
COMMON STOCKS (0.3%) Communication Services (0.0%)
1,943 Cumulus Media, Inc. - Class A# 22,908 4,305 Lumen Technologies, Inc.^ 53,684 ___________
76,592 ___________ Energy (0.3%)
11,334 Calfrac Well Services, Ltd.# 32,755 2,577 Chaparral Energy, Inc. - Class A# 97,926
785 Chesapeake Energy Corp. 42,429 525 Chevron Corp.^ 53,450
1,248 Denbury, Inc.^# 82,006 6,116 Diamond Offshore Drilling, Inc.# 36,237
11,685 Energy Transfer, LP 115,214 12,655 Enterprise Products Partners, LP 285,623
1,881 EP Energy Corp.&# 186,219 1,806 Gulfport Energy Operating Corp.# 123,350
15,487 Lonestar Resources US, Inc.# 152,547 3,560 Magellan Midstream Partners, LP 165,896
615 Oasis Petroleum, Inc.^ 56,402 1,960 Schlumberger, NV 56,507 4,189 Superior Energy Services, Inc.# 163,371 5,950 Targa Resources Corp. 250,555 4,325 Weatherford International, PLC^# 75,428
961 Whiting Petroleum Corp.# 45,071 2,400 Williams Companies, Inc.^ 60,120 ___________
2,081,106 ___________ Industrials (0.0%)
46,293 McDermott International, Inc.# 15,323 ___________
TOTAL COMMON STOCKS (Cost $2,985,818) 2,173,021 ___________ ___________
WARRANTS (0.0%) # Energy (0.0%)
900
Chesapeake Energy Corp. 02/09/26, Strike $32.13 22,500
810
Chesapeake Energy Corp. 02/09/26, Strike $27.63 23,190
500
Chesapeake Energy Corp. 02/09/26, Strike $36.18 10,780
1,399
Denbury, Inc. 09/18/25, Strike $32.59 46,489
515
Denbury, Inc. 09/18/23, Strike $35.41 15,424
13,522
Mcdermott International, Ltd. 06/30/27, Strike $15.98 2
12,170
Mcdermott International, Ltd. 06/30/27, Strike $12.33 1 ___________
TOTAL WARRANTS (Cost $298,335) 118,386 ___________ ___________
NUMBER OF SHARES VALUE
PREFERRED STOCKS (0.2%) Communication Services (0.0%)
11,630 United States Cellular Corp. 6.250%, 09/01/69 $ 323,081 ___________
Consumer Discretionary (0.1%) 1,722 Guitar Center, Inc.
0.000% 195,663 1,288 Qurate Retail, Inc.
8.000%, 03/15/31 139,722 ___________ 335,385 ___________
Energy (0.1%) 15,000 NuStar Energy, LP‡
7.625%, 06/15/22 3 mo. USD LIBOR + 5.64% 349,500
14,360 NuStar Energy, LP‡ 8.500%, 12/15/21 3 mo. USD LIBOR + 6.77% 361,728
12,000 NuStar Logistics, LP‡ 6.860%, 01/15/43 3 mo. USD LIBOR + 6.73% 303,240 ___________
1,014,468 ___________
TOTAL PREFERRED STOCKS (Cost $1,630,342) 1,672,934 ___________ ___________
NUMBER OF CONTRACTS/
NOTIONAL AMOUNT VALUE
PURCHASED OPTIONS (1.5%) # Communication Services (0.2%)
Sea, Ltd. 435
12,012,960
Put, 01/21/22, Strike $260.00 1,102,725 435
12,012,960
Put, 01/21/22, Strike $200.00 293,625 2,150
16,000,300 Snap, Inc.
Put, 01/21/22, Strike $55.00 569,750 ___________ 1,966,100 ___________
Consumer Discretionary (0.9%) 625
42,950,000 Tesla, Inc.
Put, 01/21/22, Strike $700.00 6,621,875 ___________ Information Technology (0.1%)
1,125 8,727,750
Micron Technology, Inc. Call, 01/21/22, Strike $85.00 554,063 ___________ Other (0.3%)
1,200 43,748,400
Invesco QQQ Trust Series Put, 01/21/22, Strike $325.00 1,186,200
1,000 25,437,000
SPDR S&P 500 ETF Trust Put, 01/21/22, Strike $400.00 1,122,500 ___________
2,308,700 ___________
TOTAL PURCHASED OPTIONS (Cost $17,587,409) 11,450,738 ___________ ___________
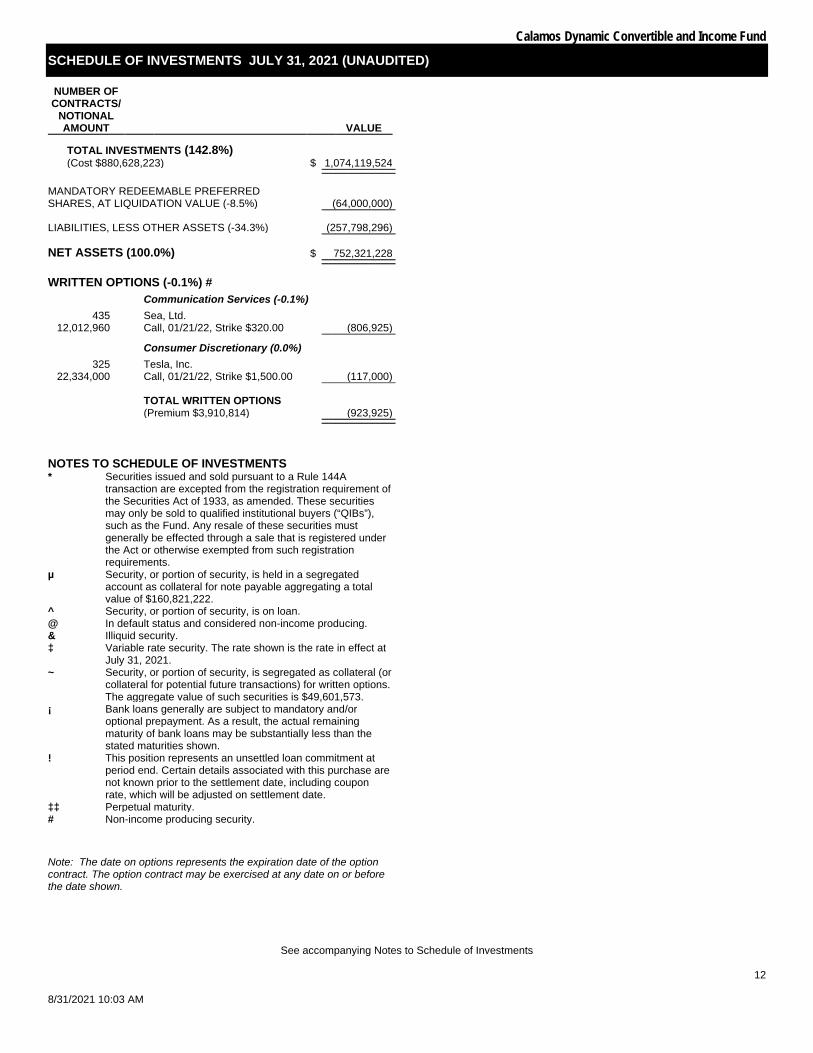
Calamos Dynamic Convertible and Income Fund
SCHEDULE OF INVESTMENTS JULY 31, 2021 (UNAUDITED)
See accompanying Notes to Schedule of Investments
12
8/31/2021 10:03 AM
NUMBER OF CONTRACTS/
NOTIONAL AMOUNT VALUE
TOTAL INVESTMENTS (142.8%) (Cost $880,628,223) $ 1,074,119,524 ___________ ___________
MANDATORY REDEEMABLE PREFERRED SHARES, AT LIQUIDATION VALUE (-8.5%) (64,000,000) ___________
LIABILITIES, LESS OTHER ASSETS (-34.3%) (257,798,296) ___________
NET ASSETS (100.0%) $ 752,321,228 ___________ ___________
WRITTEN OPTIONS (-0.1%) # Communication Services (-0.1%)
435 12,012,960
Sea, Ltd. Call, 01/21/22, Strike $320.00 (806,925) ___________ Consumer Discretionary (0.0%)
325 22,334,000
Tesla, Inc. Call, 01/21/22, Strike $1,500.00 (117,000) ___________
TOTAL WRITTEN OPTIONS (Premium $3,910,814) (923,925) ___________ ___________
NOTES TO SCHEDULE OF INVESTMENTS *
Securities issued and sold pursuant to a Rule 144A transaction are excepted from the registration requirement of the Securities Act of 1933, as amended. These securities may only be sold to qualified institutional buyers (“QIBs”), such as the Fund. Any resale of these securities must generally be effected through a sale that is registered under the Act or otherwise exempted from such registration requirements.
µ
Security, or portion of security, is held in a segregated account as collateral for note payable aggregating a total value of $160,821,222.
^ Security, or portion of security, is on loan. @ In default status and considered non-income producing. & Illiquid security. ‡
Variable rate security. The rate shown is the rate in effect at July 31, 2021.
~
Security, or portion of security, is segregated as collateral (or collateral for potential future transactions) for written options. The aggregate value of such securities is $49,601,573.
¡
Bank loans generally are subject to mandatory and/or optional prepayment. As a result, the actual remaining maturity of bank loans may be substantially less than the stated maturities shown.
!
This position represents an unsettled loan commitment at period end. Certain details associated with this purchase are not known prior to the settlement date, including coupon rate, which will be adjusted on settlement date.
‡‡ Perpetual maturity. # Non-income producing security. Note: The date on options represents the expiration date of the option contract. The option contract may be exercised at any date on or before the date shown.
Note 1 – Organization and Significant Accounting Policies Organization. Calamos Dynamic Convertible and Income Fund (the “Fund”) was organized as a Delaware statutory trust on March 11, 2014 and is registered under the Investment Company Act of 1940 (the “1940 Act”) as a diversified, closed-end management investment company. The Fund commenced operations on March 27, 2015. Significant Accounting Policies. The Schedule of Investments has been prepared in conformity with accounting principles generally accepted in the United States of America (U.S. GAAP). The Fund is considered an investment company under U.S. GAAP and follows the accounting and reporting guidance applicable to investment companies. The following summarizes the significant accounting policies of the Fund: In March 2017, the Financial Accounting Standards Board ("FASB") issued ASU No. 2017-08, Receivables – Nonrefundable Fees and Other Costs (Subtopic 310-20): Premium Amortization on Purchased Callable Debt Securities ("ASU 2017-08"). ASU 2017-08 shortens the amortization period for certain callable debt securities held at a premium. The Fund adopted ASU2017-08 as of November 1, 2019, with no material impact on the Fund's Schedule of Investments. Fund Valuation. The valuation of the Fund's investments is in accordance with policies and procedures adopted by and under the ultimate supervision of the board of trustees.
Fund securities that are traded on U.S. securities exchanges, except option securities, are valued at the official closing price, which is the last current reported sales price on its principal exchange at the time each Fund determines its net asset value (“NAV”). Securities traded in the over-the-counter market and quoted on The NASDAQ Stock Market are valued at the NASDAQ Official Closing Price, as determined by NASDAQ, or lacking a NASDAQ Official Closing Price, the last current reported sale price on NASDAQ at the time the Fund determines its NAV. When a last sale or closing price is not available, equity securities, other than option securities, that are traded on a U.S. securities exchange and other equity securities traded in the over-the-counter market are valued at the mean between the most recent bid and asked quotations on its principal exchange in accordance with guidelines adopted by the board of trustees. Each option security traded on a U.S. securities exchange is valued at the mid-point of the consolidated bid/ask quote for the option security, also in accordance with guidelines adopted by the board of trustees. Each over-the-counter option that is not traded through the Options Clearing Corporation is valued either by an independent pricing agent approved by the board of trustees or based on a quotation provided by the counterparty to such option under the ultimate supervision of the board of trustees.
Fixed income securities, bank loans, certain convertible preferred securities, and non-exchange traded derivatives are normally valued by independent pricing services or by dealers or brokers who make markets in such securities. Valuations of such fixed income securities, bank loans, certain convertible preferred securities, and non-exchange traded derivatives consider yield or price of equivalent securities of comparable quality, coupon rate, maturity, type of issue, trading characteristics and other market data and do not rely exclusively upon exchange or over-the-counter prices.
Trading on European and Far Eastern exchanges and over-the-counter markets is typically completed at various times before the close of business on each day on which the New York Stock Exchange (“NYSE”) is open. Each security trading on these exchanges or in over-the-counter markets may be valued utilizing a systematic fair valuation model provided by an independent pricing service approved by the board of trustees. The valuation of each security that meets certain criteria in relation to the valuation model is systematically adjusted to reflect the impact of movement in the U.S. market after the foreign markets close. Securities that do not meet the criteria, or that are principally traded in other foreign markets, are valued as of the last reported sale price at the time the Fund determines its NAV, or when reliable market prices or quotations are not readily available, at the mean between the most recent bid and asked quotations as of the close of the appropriate exchange or other designated time. Trading of foreign securities may not take place on every NYSE business day. In addition, trading may take place in various foreign markets on Saturdays or on other days when the NYSE is not open and on which the Fund's NAV is not calculated.
If the pricing committee determines that the valuation of a security in accordance with the methods described above is not reflective of a fair value for such security, the security is valued at a fair value by the pricing committee, under the ultimate supervision of the board of trustees, following the guidelines and/or procedures adopted by the board of trustees.
The Fund also may use fair value pricing, pursuant to guidelines adopted by the board of trustees and under the ultimate supervision of the board of trustees, if trading in the security is halted or if the value of a security it holds is materially affected by events occurring before the Fund's pricing time but after the close of the primary market or exchange on which the security is listed. Those procedures may utilize valuations furnished by pricing services approved by the board of trustees, which may be based on market transactions for comparable securities and various relationships between securities that are generally recognized by institutional traders, a computerized matrix system, or appraisals derived from information concerning the securities or similar securities received from recognized dealers in those securities.
When fair value pricing of securities is employed, the prices of securities used by a Fund to calculate its NAV may differ from market quotations or official closing prices. There can be no assurance that the Fund could purchase or sell a portfolio security at the price used to calculate the Fund’s net asset value (“NAV”). Foreign Currency Translation. Values of investments and other assets and liabilities denominated in foreign currencies are translated into U.S. dollars using a rate quoted by a major bank or dealer in the particular currency market, as reported by a recognized quotation dissemination service. Option Transactions. For hedging and investment purposes, the Fund may purchase or write (sell) put and call options. One of the risks associated with purchasing an option is that the Fund pays a premium whether or not the option is exercised. Additionally, the Fund bears the risk of loss of premium and change in value should the counterparty not perform under the contract. The Fund as writer of an option bears the market risk of an unfavorable change in the price of the security underlying the written option. Note 2 – Investments The cost basis of investments for federal income tax purposes at July 31, 2021 was as follows*: Cost basis of investments $876,717,409 Gross unrealized appreciation 216,242,823
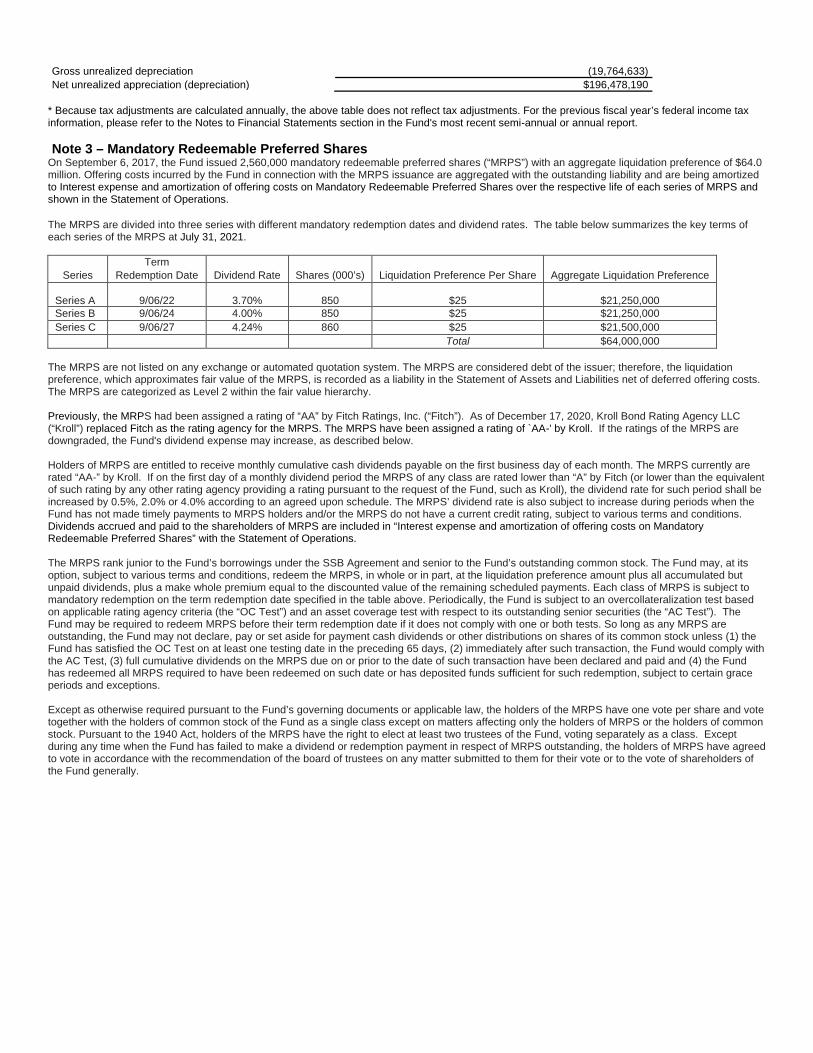
Gross unrealized depreciation (19,764,633) Net unrealized appreciation (depreciation) $196,478,190
* Because tax adjustments are calculated annually, the above table does not reflect tax adjustments. For the previous fiscal year’s federal income tax information, please refer to the Notes to Financial Statements section in the Fund's most recent semi-annual or annual report. Note 3 – Mandatory Redeemable Preferred Shares On September 6, 2017, the Fund issued 2,560,000 mandatory redeemable preferred shares (“MRPS”) with an aggregate liquidation preference of $64.0 million. Offering costs incurred by the Fund in connection with the MRPS issuance are aggregated with the outstanding liability and are being amortized to Interest expense and amortization of offering costs on Mandatory Redeemable Preferred Shares over the respective life of each series of MRPS and shown in the Statement of Operations. The MRPS are divided into three series with different mandatory redemption dates and dividend rates. The table below summarizes the key terms of each series of the MRPS at July 31, 2021.
Series Term
Redemption Date Dividend Rate Shares (000’s) Liquidation Preference Per Share Aggregate Liquidation Preference
Series A 9/06/22 3.70% 850 $25 $21,250,000 Series B 9/06/24 4.00% 850 $25 $21,250,000 Series C 9/06/27 4.24% 860 $25 $21,500,000
Total $64,000,000 The MRPS are not listed on any exchange or automated quotation system. The MRPS are considered debt of the issuer; therefore, the liquidation preference, which approximates fair value of the MRPS, is recorded as a liability in the Statement of Assets and Liabilities net of deferred offering costs. The MRPS are categorized as Level 2 within the fair value hierarchy. Previously, the MRPS had been assigned a rating of “AA” by Fitch Ratings, Inc. (“Fitch”). As of December 17, 2020, Kroll Bond Rating Agency LLC (“Kroll”) replaced Fitch as the rating agency for the MRPS. The MRPS have been assigned a rating of `AA-' by Kroll. If the ratings of the MRPS are downgraded, the Fund's dividend expense may increase, as described below. Holders of MRPS are entitled to receive monthly cumulative cash dividends payable on the first business day of each month. The MRPS currently are rated “AA-” by Kroll. If on the first day of a monthly dividend period the MRPS of any class are rated lower than “A” by Fitch (or lower than the equivalent of such rating by any other rating agency providing a rating pursuant to the request of the Fund, such as Kroll), the dividend rate for such period shall be increased by 0.5%, 2.0% or 4.0% according to an agreed upon schedule. The MRPS’ dividend rate is also subject to increase during periods when the Fund has not made timely payments to MRPS holders and/or the MRPS do not have a current credit rating, subject to various terms and conditions. Dividends accrued and paid to the shareholders of MRPS are included in “Interest expense and amortization of offering costs on Mandatory Redeemable Preferred Shares” with the Statement of Operations. The MRPS rank junior to the Fund’s borrowings under the SSB Agreement and senior to the Fund’s outstanding common stock. The Fund may, at its option, subject to various terms and conditions, redeem the MRPS, in whole or in part, at the liquidation preference amount plus all accumulated but unpaid dividends, plus a make whole premium equal to the discounted value of the remaining scheduled payments. Each class of MRPS is subject to mandatory redemption on the term redemption date specified in the table above. Periodically, the Fund is subject to an overcollateralization test based on applicable rating agency criteria (the “OC Test”) and an asset coverage test with respect to its outstanding senior securities (the “AC Test”). The Fund may be required to redeem MRPS before their term redemption date if it does not comply with one or both tests. So long as any MRPS are outstanding, the Fund may not declare, pay or set aside for payment cash dividends or other distributions on shares of its common stock unless (1) the Fund has satisfied the OC Test on at least one testing date in the preceding 65 days, (2) immediately after such transaction, the Fund would comply with the AC Test, (3) full cumulative dividends on the MRPS due on or prior to the date of such transaction have been declared and paid and (4) the Fund has redeemed all MRPS required to have been redeemed on such date or has deposited funds sufficient for such redemption, subject to certain grace periods and exceptions. Except as otherwise required pursuant to the Fund’s governing documents or applicable law, the holders of the MRPS have one vote per share and vote together with the holders of common stock of the Fund as a single class except on matters affecting only the holders of MRPS or the holders of common stock. Pursuant to the 1940 Act, holders of the MRPS have the right to elect at least two trustees of the Fund, voting separately as a class. Except during any time when the Fund has failed to make a dividend or redemption payment in respect of MRPS outstanding, the holders of MRPS have agreed to vote in accordance with the recommendation of the board of trustees on any matter submitted to them for their vote or to the vote of shareholders of the Fund generally.
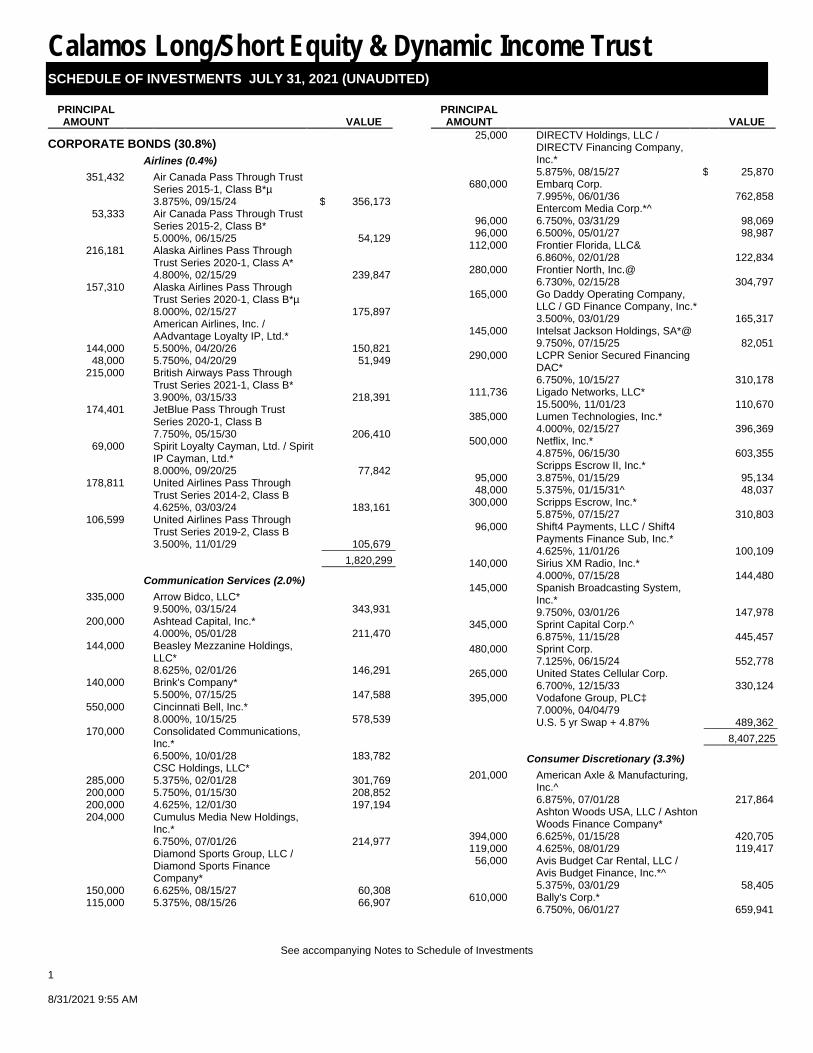
Calamos Long/Short Equity & Dynamic Income Trust SCHEDULE OF INVESTMENTS JULY 31, 2021 (UNAUDITED)
See accompanying Notes to Schedule of Investments
1 8/31/2021 9:55 AM
PRINCIPAL AMOUNT VALUE
CORPORATE BONDS (30.8%) Airlines (0.4%)
351,432 Air Canada Pass Through Trust Series 2015-1, Class B*µ 3.875%, 09/15/24 $ 356,173
53,333 Air Canada Pass Through Trust Series 2015-2, Class B* 5.000%, 06/15/25 54,129
216,181 Alaska Airlines Pass Through Trust Series 2020-1, Class A* 4.800%, 02/15/29 239,847
157,310 Alaska Airlines Pass Through Trust Series 2020-1, Class B*µ 8.000%, 02/15/27 175,897
American Airlines, Inc. / AAdvantage Loyalty IP, Ltd.*
144,000 5.500%, 04/20/26 150,821 48,000 5.750%, 04/20/29 51,949
215,000 British Airways Pass Through Trust Series 2021-1, Class B* 3.900%, 03/15/33 218,391
174,401 JetBlue Pass Through Trust Series 2020-1, Class B 7.750%, 05/15/30 206,410
69,000 Spirit Loyalty Cayman, Ltd. / Spirit IP Cayman, Ltd.* 8.000%, 09/20/25 77,842
178,811 United Airlines Pass Through Trust Series 2014-2, Class B 4.625%, 03/03/24 183,161
106,599 United Airlines Pass Through Trust Series 2019-2, Class B 3.500%, 11/01/29 105,679 ___________
1,820,299 ___________ Communication Services (2.0%)
335,000 Arrow Bidco, LLC* 9.500%, 03/15/24 343,931
200,000 Ashtead Capital, Inc.* 4.000%, 05/01/28 211,470
144,000 Beasley Mezzanine Holdings, LLC* 8.625%, 02/01/26 146,291
140,000 Brink's Company* 5.500%, 07/15/25 147,588
550,000 Cincinnati Bell, Inc.* 8.000%, 10/15/25 578,539
170,000 Consolidated Communications, Inc.* 6.500%, 10/01/28 183,782
CSC Holdings, LLC* 285,000 5.375%, 02/01/28 301,769 200,000 5.750%, 01/15/30 208,852 200,000 4.625%, 12/01/30 197,194 204,000 Cumulus Media New Holdings,
Inc.* 6.750%, 07/01/26 214,977
Diamond Sports Group, LLC / Diamond Sports Finance Company*
150,000 6.625%, 08/15/27 60,308 115,000 5.375%, 08/15/26 66,907
PRINCIPAL AMOUNT VALUE
25,000 DIRECTV Holdings, LLC / DIRECTV Financing Company, Inc.* 5.875%, 08/15/27 $ 25,870
680,000 Embarq Corp. 7.995%, 06/01/36 762,858
Entercom Media Corp.*^ 96,000 6.750%, 03/31/29 98,069 96,000 6.500%, 05/01/27 98,987
112,000 Frontier Florida, LLC& 6.860%, 02/01/28 122,834
280,000 Frontier North, Inc.@ 6.730%, 02/15/28 304,797
165,000 Go Daddy Operating Company, LLC / GD Finance Company, Inc.* 3.500%, 03/01/29 165,317
145,000 Intelsat Jackson Holdings, SA*@ 9.750%, 07/15/25 82,051
290,000 LCPR Senior Secured Financing DAC* 6.750%, 10/15/27 310,178
111,736 Ligado Networks, LLC* 15.500%, 11/01/23 110,670
385,000 Lumen Technologies, Inc.* 4.000%, 02/15/27 396,369
500,000 Netflix, Inc.* 4.875%, 06/15/30 603,355
Scripps Escrow II, Inc.* 95,000 3.875%, 01/15/29 95,134 48,000 5.375%, 01/15/31^ 48,037
300,000 Scripps Escrow, Inc.* 5.875%, 07/15/27 310,803
96,000 Shift4 Payments, LLC / Shift4 Payments Finance Sub, Inc.* 4.625%, 11/01/26 100,109
140,000 Sirius XM Radio, Inc.* 4.000%, 07/15/28 144,480
145,000 Spanish Broadcasting System, Inc.* 9.750%, 03/01/26 147,978
345,000 Sprint Capital Corp.^ 6.875%, 11/15/28 445,457
480,000 Sprint Corp. 7.125%, 06/15/24 552,778
265,000 United States Cellular Corp. 6.700%, 12/15/33 330,124
395,000 Vodafone Group, PLC‡ 7.000%, 04/04/79 U.S. 5 yr Swap + 4.87% 489,362 ___________
8,407,225 ___________ Consumer Discretionary (3.3%)
201,000 American Axle & Manufacturing, Inc.^ 6.875%, 07/01/28 217,864
Ashton Woods USA, LLC / Ashton Woods Finance Company*
394,000 6.625%, 01/15/28 420,705 119,000 4.625%, 08/01/29 119,417
56,000 Avis Budget Car Rental, LLC / Avis Budget Finance, Inc.*^ 5.375%, 03/01/29 58,405
610,000 Bally's Corp.* 6.750%, 06/01/27 659,941
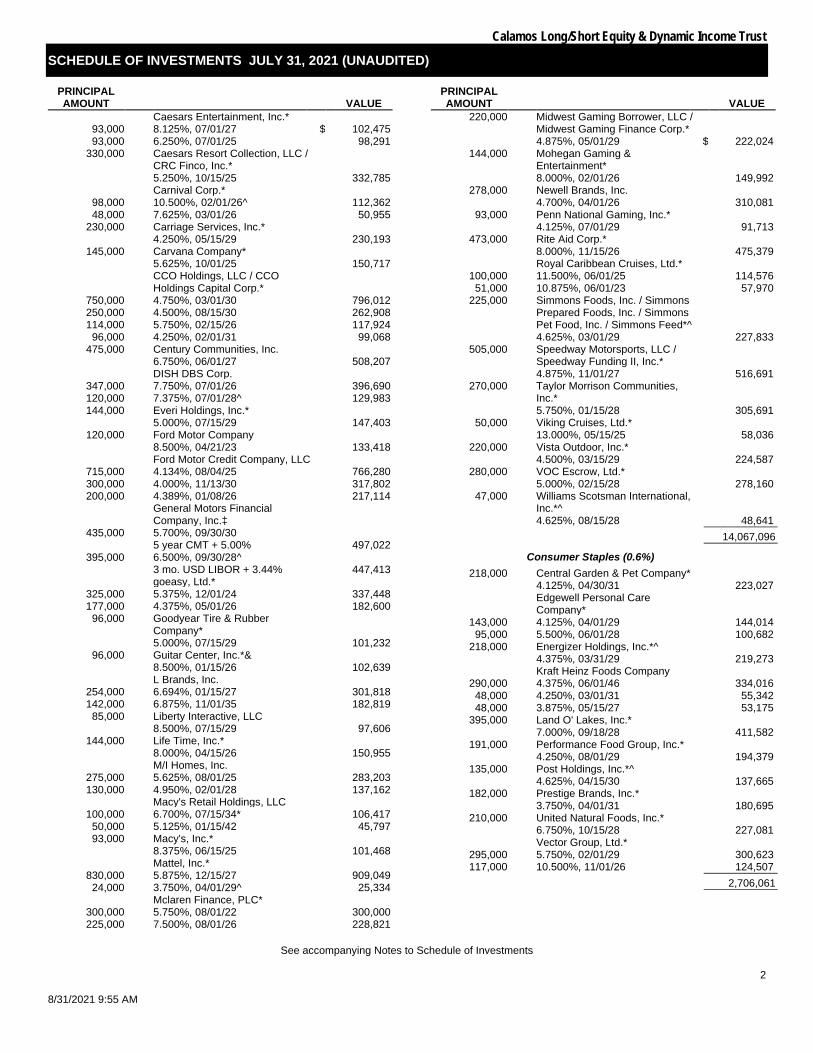
Calamos Long/Short Equity & Dynamic Income Trust
SCHEDULE OF INVESTMENTS JULY 31, 2021 (UNAUDITED)
See accompanying Notes to Schedule of Investments
2
8/31/2021 9:55 AM
PRINCIPAL AMOUNT VALUE
Caesars Entertainment, Inc.* 93,000 8.125%, 07/01/27 $ 102,475 93,000 6.250%, 07/01/25 98,291
330,000 Caesars Resort Collection, LLC / CRC Finco, Inc.* 5.250%, 10/15/25 332,785
Carnival Corp.* 98,000 10.500%, 02/01/26^ 112,362 48,000 7.625%, 03/01/26 50,955
230,000 Carriage Services, Inc.* 4.250%, 05/15/29 230,193
145,000 Carvana Company* 5.625%, 10/01/25 150,717
CCO Holdings, LLC / CCO Holdings Capital Corp.*
750,000 4.750%, 03/01/30 796,012 250,000 4.500%, 08/15/30 262,908 114,000 5.750%, 02/15/26 117,924
96,000 4.250%, 02/01/31 99,068 475,000 Century Communities, Inc.
6.750%, 06/01/27 508,207 DISH DBS Corp.
347,000 7.750%, 07/01/26 396,690 120,000 7.375%, 07/01/28^ 129,983 144,000 Everi Holdings, Inc.*
5.000%, 07/15/29 147,403 120,000 Ford Motor Company
8.500%, 04/21/23 133,418 Ford Motor Credit Company, LLC
715,000 4.134%, 08/04/25 766,280 300,000 4.000%, 11/13/30 317,802 200,000 4.389%, 01/08/26 217,114
General Motors Financial Company, Inc.‡
435,000 5.700%, 09/30/30 5 year CMT + 5.00% 497,022
395,000 6.500%, 09/30/28^ 3 mo. USD LIBOR + 3.44% 447,413
goeasy, Ltd.* 325,000 5.375%, 12/01/24 337,448 177,000 4.375%, 05/01/26 182,600
96,000 Goodyear Tire & Rubber Company* 5.000%, 07/15/29 101,232
96,000 Guitar Center, Inc.*& 8.500%, 01/15/26 102,639
L Brands, Inc. 254,000 6.694%, 01/15/27 301,818 142,000 6.875%, 11/01/35 182,819
85,000 Liberty Interactive, LLC 8.500%, 07/15/29 97,606
144,000 Life Time, Inc.* 8.000%, 04/15/26 150,955
M/I Homes, Inc. 275,000 5.625%, 08/01/25 283,203 130,000 4.950%, 02/01/28 137,162
Macy's Retail Holdings, LLC 100,000 6.700%, 07/15/34* 106,417
50,000 5.125%, 01/15/42 45,797 93,000 Macy's, Inc.*
8.375%, 06/15/25 101,468 Mattel, Inc.*
830,000 5.875%, 12/15/27 909,049 24,000 3.750%, 04/01/29^ 25,334
Mclaren Finance, PLC* 300,000 5.750%, 08/01/22 300,000 225,000 7.500%, 08/01/26 228,821
PRINCIPAL AMOUNT VALUE
220,000 Midwest Gaming Borrower, LLC / Midwest Gaming Finance Corp.* 4.875%, 05/01/29 $ 222,024
144,000 Mohegan Gaming & Entertainment* 8.000%, 02/01/26 149,992
278,000 Newell Brands, Inc. 4.700%, 04/01/26 310,081
93,000 Penn National Gaming, Inc.* 4.125%, 07/01/29 91,713
473,000 Rite Aid Corp.* 8.000%, 11/15/26 475,379
Royal Caribbean Cruises, Ltd.* 100,000 11.500%, 06/01/25 114,576
51,000 10.875%, 06/01/23 57,970 225,000 Simmons Foods, Inc. / Simmons
Prepared Foods, Inc. / Simmons Pet Food, Inc. / Simmons Feed*^ 4.625%, 03/01/29 227,833
505,000 Speedway Motorsports, LLC / Speedway Funding II, Inc.* 4.875%, 11/01/27 516,691
270,000 Taylor Morrison Communities, Inc.* 5.750%, 01/15/28 305,691
50,000 Viking Cruises, Ltd.* 13.000%, 05/15/25 58,036
220,000 Vista Outdoor, Inc.* 4.500%, 03/15/29 224,587
280,000 VOC Escrow, Ltd.* 5.000%, 02/15/28 278,160
47,000 Williams Scotsman International, Inc.*^ 4.625%, 08/15/28 48,641 ___________
14,067,096 ___________ Consumer Staples (0.6%)
218,000 Central Garden & Pet Company* 4.125%, 04/30/31 223,027
Edgewell Personal Care Company*
143,000 4.125%, 04/01/29 144,014 95,000 5.500%, 06/01/28 100,682
218,000 Energizer Holdings, Inc.*^ 4.375%, 03/31/29 219,273
Kraft Heinz Foods Company 290,000 4.375%, 06/01/46 334,016
48,000 4.250%, 03/01/31 55,342 48,000 3.875%, 05/15/27 53,175
395,000 Land O' Lakes, Inc.* 7.000%, 09/18/28 411,582
191,000 Performance Food Group, Inc.* 4.250%, 08/01/29 194,379
135,000 Post Holdings, Inc.*^ 4.625%, 04/15/30 137,665
182,000 Prestige Brands, Inc.* 3.750%, 04/01/31 180,695
210,000 United Natural Foods, Inc.* 6.750%, 10/15/28 227,081
Vector Group, Ltd.* 295,000 5.750%, 02/01/29 300,623 117,000 10.500%, 11/01/26 124,507 ___________
2,706,061 ___________
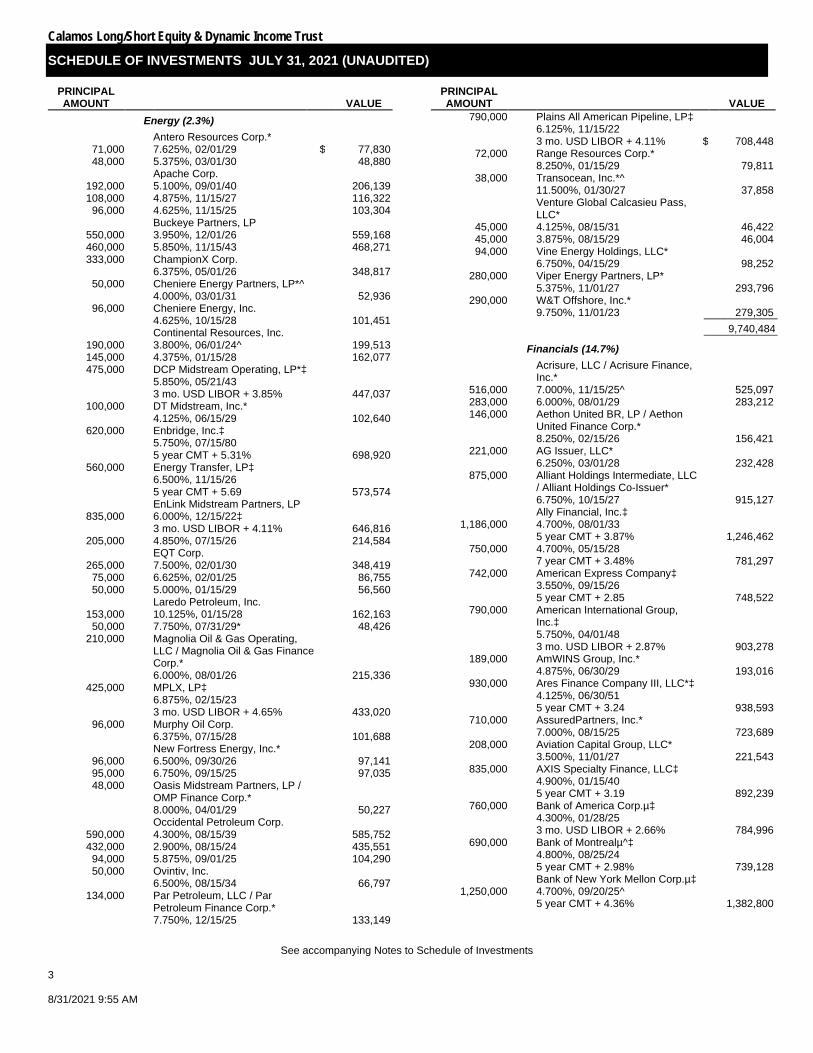
Calamos Long/Short Equity & Dynamic Income Trust
SCHEDULE OF INVESTMENTS JULY 31, 2021 (UNAUDITED)
See accompanying Notes to Schedule of Investments
3 8/31/2021 9:55 AM
PRINCIPAL AMOUNT VALUE
Energy (2.3%) Antero Resources Corp.*
71,000 7.625%, 02/01/29 $ 77,830 48,000 5.375%, 03/01/30 48,880
Apache Corp. 192,000 5.100%, 09/01/40 206,139 108,000 4.875%, 11/15/27 116,322
96,000 4.625%, 11/15/25 103,304 Buckeye Partners, LP
550,000 3.950%, 12/01/26 559,168 460,000 5.850%, 11/15/43 468,271 333,000 ChampionX Corp.
6.375%, 05/01/26 348,817 50,000 Cheniere Energy Partners, LP*^
4.000%, 03/01/31 52,936 96,000 Cheniere Energy, Inc.
4.625%, 10/15/28 101,451 Continental Resources, Inc.
190,000 3.800%, 06/01/24^ 199,513 145,000 4.375%, 01/15/28 162,077 475,000 DCP Midstream Operating, LP*‡
5.850%, 05/21/43 3 mo. USD LIBOR + 3.85% 447,037
100,000 DT Midstream, Inc.* 4.125%, 06/15/29 102,640
620,000 Enbridge, Inc.‡ 5.750%, 07/15/80 5 year CMT + 5.31% 698,920
560,000 Energy Transfer, LP‡ 6.500%, 11/15/26 5 year CMT + 5.69 573,574
EnLink Midstream Partners, LP 835,000 6.000%, 12/15/22‡
3 mo. USD LIBOR + 4.11% 646,816 205,000 4.850%, 07/15/26 214,584
EQT Corp. 265,000 7.500%, 02/01/30 348,419
75,000 6.625%, 02/01/25 86,755 50,000 5.000%, 01/15/29 56,560
Laredo Petroleum, Inc. 153,000 10.125%, 01/15/28 162,163
50,000 7.750%, 07/31/29* 48,426 210,000 Magnolia Oil & Gas Operating,
LLC / Magnolia Oil & Gas Finance Corp.* 6.000%, 08/01/26 215,336
425,000 MPLX, LP‡ 6.875%, 02/15/23 3 mo. USD LIBOR + 4.65% 433,020
96,000 Murphy Oil Corp. 6.375%, 07/15/28 101,688
New Fortress Energy, Inc.* 96,000 6.500%, 09/30/26 97,141 95,000 6.750%, 09/15/25 97,035 48,000 Oasis Midstream Partners, LP /
OMP Finance Corp.* 8.000%, 04/01/29 50,227
Occidental Petroleum Corp. 590,000 4.300%, 08/15/39 585,752 432,000 2.900%, 08/15/24 435,551
94,000 5.875%, 09/01/25 104,290 50,000 Ovintiv, Inc.
6.500%, 08/15/34 66,797 134,000 Par Petroleum, LLC / Par
Petroleum Finance Corp.* 7.750%, 12/15/25 133,149
PRINCIPAL AMOUNT VALUE
790,000 Plains All American Pipeline, LP‡ 6.125%, 11/15/22 3 mo. USD LIBOR + 4.11% $ 708,448
72,000 Range Resources Corp.* 8.250%, 01/15/29 79,811
38,000 Transocean, Inc.*^ 11.500%, 01/30/27 37,858
Venture Global Calcasieu Pass, LLC*
45,000 4.125%, 08/15/31 46,422 45,000 3.875%, 08/15/29 46,004 94,000 Vine Energy Holdings, LLC*
6.750%, 04/15/29 98,252 280,000 Viper Energy Partners, LP*
5.375%, 11/01/27 293,796 290,000 W&T Offshore, Inc.*
9.750%, 11/01/23 279,305 ___________ 9,740,484 ___________
Financials (14.7%)
Acrisure, LLC / Acrisure Finance, Inc.*
516,000 7.000%, 11/15/25^ 525,097 283,000 6.000%, 08/01/29 283,212 146,000 Aethon United BR, LP / Aethon
United Finance Corp.* 8.250%, 02/15/26 156,421
221,000 AG Issuer, LLC* 6.250%, 03/01/28 232,428
875,000 Alliant Holdings Intermediate, LLC / Alliant Holdings Co-Issuer* 6.750%, 10/15/27 915,127
Ally Financial, Inc.‡ 1,186,000 4.700%, 08/01/33
5 year CMT + 3.87% 1,246,462 750,000 4.700%, 05/15/28
7 year CMT + 3.48% 781,297 742,000 American Express Company‡
3.550%, 09/15/26 5 year CMT + 2.85 748,522
790,000 American International Group, Inc.‡ 5.750%, 04/01/48 3 mo. USD LIBOR + 2.87% 903,278
189,000 AmWINS Group, Inc.* 4.875%, 06/30/29 193,016
930,000 Ares Finance Company III, LLC*‡ 4.125%, 06/30/51 5 year CMT + 3.24 938,593
710,000 AssuredPartners, Inc.* 7.000%, 08/15/25 723,689
208,000 Aviation Capital Group, LLC* 3.500%, 11/01/27 221,543
835,000 AXIS Specialty Finance, LLC‡ 4.900%, 01/15/40 5 year CMT + 3.19 892,239
760,000 Bank of America Corp.µ‡ 4.300%, 01/28/25 3 mo. USD LIBOR + 2.66% 784,996
690,000 Bank of Montrealµ^‡ 4.800%, 08/25/24 5 year CMT + 2.98% 739,128
Bank of New York Mellon Corp.µ‡ 1,250,000 4.700%, 09/20/25^
5 year CMT + 4.36% 1,382,800
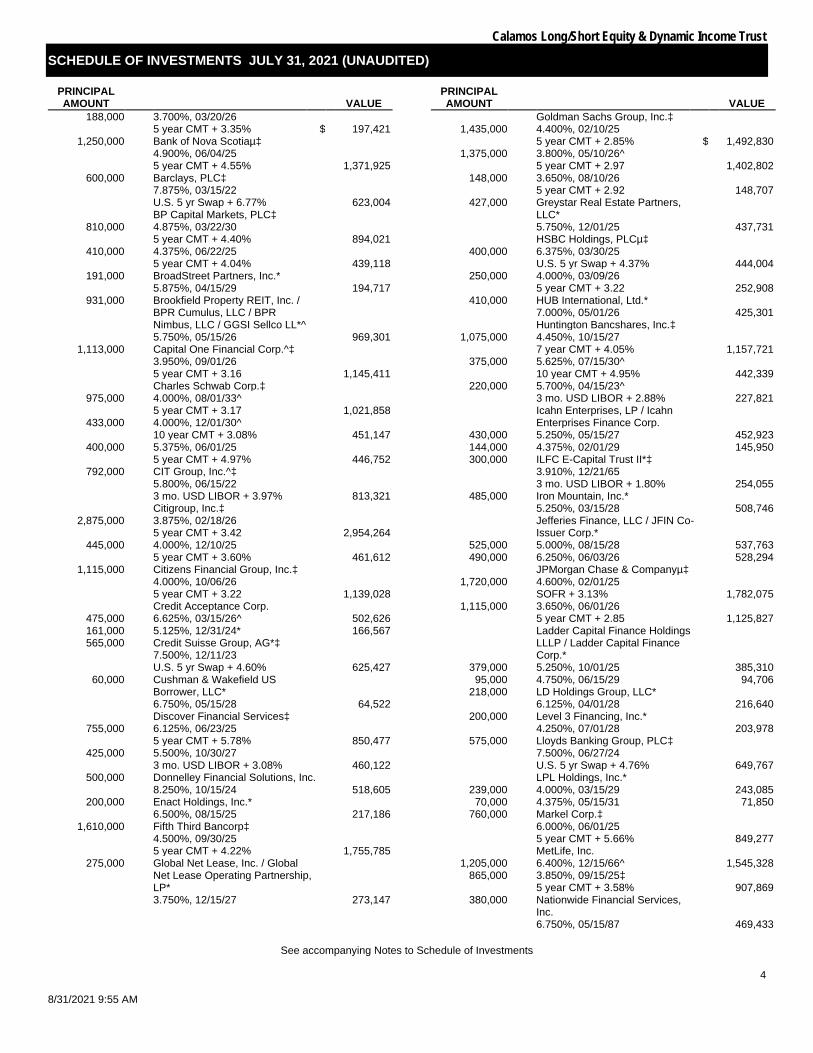
Calamos Long/Short Equity & Dynamic Income Trust
SCHEDULE OF INVESTMENTS JULY 31, 2021 (UNAUDITED)
See accompanying Notes to Schedule of Investments
4
8/31/2021 9:55 AM
PRINCIPAL AMOUNT VALUE
188,000 3.700%, 03/20/26 5 year CMT + 3.35% $ 197,421
1,250,000 Bank of Nova Scotiaµ‡ 4.900%, 06/04/25 5 year CMT + 4.55% 1,371,925
600,000 Barclays, PLC‡ 7.875%, 03/15/22 U.S. 5 yr Swap + 6.77% 623,004
BP Capital Markets, PLC‡ 810,000 4.875%, 03/22/30
5 year CMT + 4.40% 894,021 410,000 4.375%, 06/22/25
5 year CMT + 4.04% 439,118 191,000 BroadStreet Partners, Inc.*
5.875%, 04/15/29 194,717 931,000 Brookfield Property REIT, Inc. /
BPR Cumulus, LLC / BPR Nimbus, LLC / GGSI Sellco LL*^ 5.750%, 05/15/26 969,301
1,113,000 Capital One Financial Corp.^‡ 3.950%, 09/01/26 5 year CMT + 3.16 1,145,411
Charles Schwab Corp.‡ 975,000 4.000%, 08/01/33^
5 year CMT + 3.17 1,021,858 433,000 4.000%, 12/01/30^
10 year CMT + 3.08% 451,147 400,000 5.375%, 06/01/25
5 year CMT + 4.97% 446,752 792,000 CIT Group, Inc.^‡
5.800%, 06/15/22 3 mo. USD LIBOR + 3.97% 813,321
Citigroup, Inc.‡ 2,875,000 3.875%, 02/18/26
5 year CMT + 3.42 2,954,264 445,000 4.000%, 12/10/25
5 year CMT + 3.60% 461,612 1,115,000 Citizens Financial Group, Inc.‡
4.000%, 10/06/26 5 year CMT + 3.22 1,139,028
Credit Acceptance Corp. 475,000 6.625%, 03/15/26^ 502,626 161,000 5.125%, 12/31/24* 166,567 565,000 Credit Suisse Group, AG*‡
7.500%, 12/11/23 U.S. 5 yr Swap + 4.60% 625,427
60,000 Cushman & Wakefield US Borrower, LLC* 6.750%, 05/15/28 64,522
Discover Financial Services‡ 755,000 6.125%, 06/23/25
5 year CMT + 5.78% 850,477 425,000 5.500%, 10/30/27
3 mo. USD LIBOR + 3.08% 460,122 500,000 Donnelley Financial Solutions, Inc.
8.250%, 10/15/24 518,605 200,000 Enact Holdings, Inc.*
6.500%, 08/15/25 217,186 1,610,000 Fifth Third Bancorp‡
4.500%, 09/30/25 5 year CMT + 4.22% 1,755,785
275,000 Global Net Lease, Inc. / Global Net Lease Operating Partnership, LP* 3.750%, 12/15/27 273,147
PRINCIPAL AMOUNT VALUE
Goldman Sachs Group, Inc.‡ 1,435,000 4.400%, 02/10/25
5 year CMT + 2.85% $ 1,492,830 1,375,000 3.800%, 05/10/26^
5 year CMT + 2.97 1,402,802 148,000 3.650%, 08/10/26
5 year CMT + 2.92 148,707 427,000 Greystar Real Estate Partners,
LLC* 5.750%, 12/01/25 437,731
HSBC Holdings, PLCµ‡ 400,000 6.375%, 03/30/25
U.S. 5 yr Swap + 4.37% 444,004 250,000 4.000%, 03/09/26
5 year CMT + 3.22 252,908 410,000 HUB International, Ltd.*
7.000%, 05/01/26 425,301 Huntington Bancshares, Inc.‡
1,075,000 4.450%, 10/15/27 7 year CMT + 4.05% 1,157,721
375,000 5.625%, 07/15/30^ 10 year CMT + 4.95% 442,339
220,000 5.700%, 04/15/23^ 3 mo. USD LIBOR + 2.88% 227,821
Icahn Enterprises, LP / Icahn Enterprises Finance Corp.
430,000 5.250%, 05/15/27 452,923 144,000 4.375%, 02/01/29 145,950 300,000 ILFC E-Capital Trust II*‡
3.910%, 12/21/65 3 mo. USD LIBOR + 1.80% 254,055
485,000 Iron Mountain, Inc.* 5.250%, 03/15/28 508,746
Jefferies Finance, LLC / JFIN Co-Issuer Corp.*
525,000 5.000%, 08/15/28 537,763 490,000 6.250%, 06/03/26 528,294
JPMorgan Chase & Companyµ‡ 1,720,000 4.600%, 02/01/25
SOFR + 3.13% 1,782,075 1,115,000 3.650%, 06/01/26
5 year CMT + 2.85 1,125,827
Ladder Capital Finance Holdings LLLP / Ladder Capital Finance Corp.*
379,000 5.250%, 10/01/25 385,310 95,000 4.750%, 06/15/29 94,706
218,000 LD Holdings Group, LLC* 6.125%, 04/01/28 216,640
200,000 Level 3 Financing, Inc.* 4.250%, 07/01/28 203,978
575,000 Lloyds Banking Group, PLC‡ 7.500%, 06/27/24 U.S. 5 yr Swap + 4.76% 649,767
LPL Holdings, Inc.* 239,000 4.000%, 03/15/29 243,085
70,000 4.375%, 05/15/31 71,850 760,000 Markel Corp.‡
6.000%, 06/01/25 5 year CMT + 5.66% 849,277
MetLife, Inc. 1,205,000 6.400%, 12/15/66^ 1,545,328
865,000 3.850%, 09/15/25‡ 5 year CMT + 3.58% 907,869
380,000 Nationwide Financial Services, Inc. 6.750%, 05/15/87 469,433
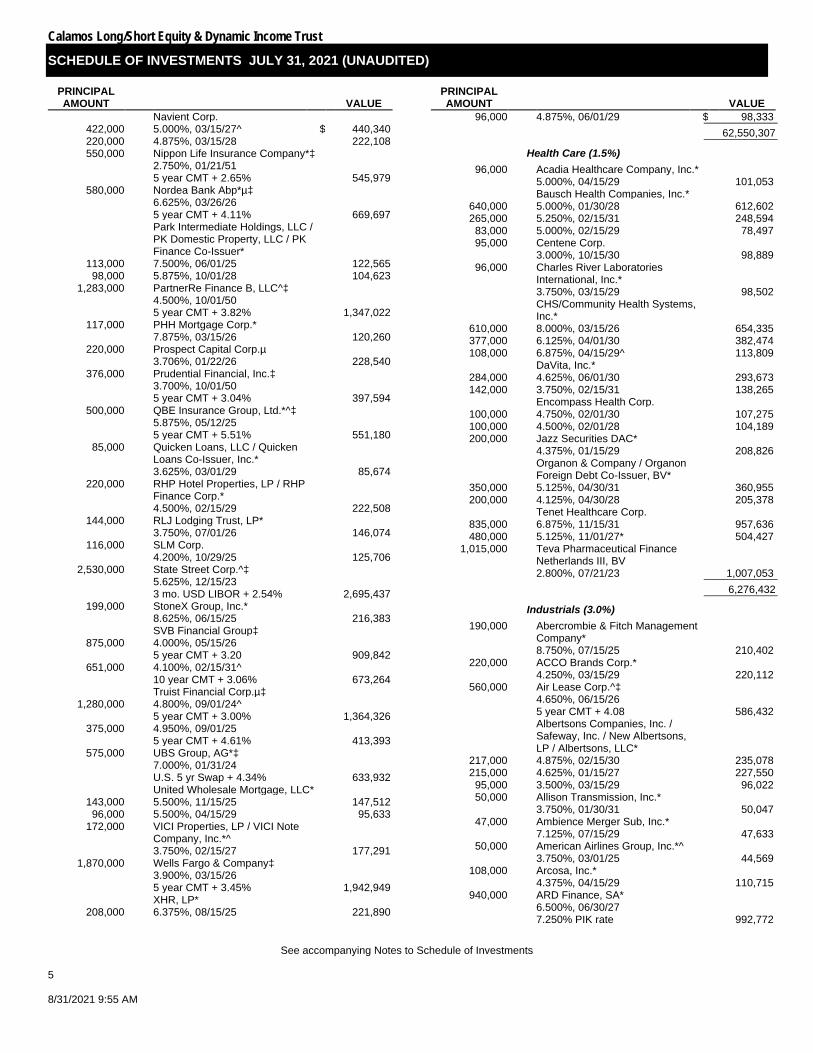
Calamos Long/Short Equity & Dynamic Income Trust
SCHEDULE OF INVESTMENTS JULY 31, 2021 (UNAUDITED)
See accompanying Notes to Schedule of Investments
5 8/31/2021 9:55 AM
PRINCIPAL AMOUNT VALUE
Navient Corp. 422,000 5.000%, 03/15/27^ $ 440,340 220,000 4.875%, 03/15/28 222,108 550,000 Nippon Life Insurance Company*‡
2.750%, 01/21/51 5 year CMT + 2.65% 545,979
580,000 Nordea Bank Abp*µ‡ 6.625%, 03/26/26 5 year CMT + 4.11% 669,697
Park Intermediate Holdings, LLC / PK Domestic Property, LLC / PK Finance Co-Issuer*
113,000 7.500%, 06/01/25 122,565 98,000 5.875%, 10/01/28 104,623
1,283,000 PartnerRe Finance B, LLC^‡ 4.500%, 10/01/50 5 year CMT + 3.82% 1,347,022
117,000 PHH Mortgage Corp.* 7.875%, 03/15/26 120,260
220,000 Prospect Capital Corp.µ 3.706%, 01/22/26 228,540
376,000 Prudential Financial, Inc.‡ 3.700%, 10/01/50 5 year CMT + 3.04% 397,594
500,000 QBE Insurance Group, Ltd.*^‡ 5.875%, 05/12/25 5 year CMT + 5.51% 551,180
85,000 Quicken Loans, LLC / Quicken Loans Co-Issuer, Inc.* 3.625%, 03/01/29 85,674
220,000 RHP Hotel Properties, LP / RHP Finance Corp.* 4.500%, 02/15/29 222,508
144,000 RLJ Lodging Trust, LP* 3.750%, 07/01/26 146,074
116,000 SLM Corp. 4.200%, 10/29/25 125,706
2,530,000 State Street Corp.^‡ 5.625%, 12/15/23 3 mo. USD LIBOR + 2.54% 2,695,437
199,000 StoneX Group, Inc.* 8.625%, 06/15/25 216,383
SVB Financial Group‡ 875,000 4.000%, 05/15/26
5 year CMT + 3.20 909,842 651,000 4.100%, 02/15/31^
10 year CMT + 3.06% 673,264 Truist Financial Corp.µ‡
1,280,000 4.800%, 09/01/24^ 5 year CMT + 3.00% 1,364,326
375,000 4.950%, 09/01/25 5 year CMT + 4.61% 413,393
575,000 UBS Group, AG*‡ 7.000%, 01/31/24 U.S. 5 yr Swap + 4.34% 633,932
United Wholesale Mortgage, LLC* 143,000 5.500%, 11/15/25 147,512
96,000 5.500%, 04/15/29 95,633 172,000 VICI Properties, LP / VICI Note
Company, Inc.*^ 3.750%, 02/15/27 177,291
1,870,000 Wells Fargo & Company‡ 3.900%, 03/15/26 5 year CMT + 3.45% 1,942,949
XHR, LP* 208,000 6.375%, 08/15/25 221,890
PRINCIPAL AMOUNT VALUE
96,000 4.875%, 06/01/29 $ 98,333 ___________ 62,550,307 ___________
Health Care (1.5%) 96,000 Acadia Healthcare Company, Inc.*
5.000%, 04/15/29 101,053 Bausch Health Companies, Inc.*
640,000 5.000%, 01/30/28 612,602 265,000 5.250%, 02/15/31 248,594
83,000 5.000%, 02/15/29 78,497 95,000 Centene Corp.
3.000%, 10/15/30 98,889 96,000 Charles River Laboratories
International, Inc.* 3.750%, 03/15/29 98,502
CHS/Community Health Systems, Inc.*
610,000 8.000%, 03/15/26 654,335 377,000 6.125%, 04/01/30 382,474 108,000 6.875%, 04/15/29^ 113,809
DaVita, Inc.* 284,000 4.625%, 06/01/30 293,673 142,000 3.750%, 02/15/31 138,265
Encompass Health Corp. 100,000 4.750%, 02/01/30 107,275 100,000 4.500%, 02/01/28 104,189 200,000 Jazz Securities DAC*
4.375%, 01/15/29 208,826
Organon & Company / Organon Foreign Debt Co-Issuer, BV*
350,000 5.125%, 04/30/31 360,955 200,000 4.125%, 04/30/28 205,378
Tenet Healthcare Corp. 835,000 6.875%, 11/15/31 957,636 480,000 5.125%, 11/01/27* 504,427
1,015,000 Teva Pharmaceutical Finance Netherlands III, BV 2.800%, 07/21/23 1,007,053 ___________
6,276,432 ___________ Industrials (3.0%)
190,000 Abercrombie & Fitch Management Company* 8.750%, 07/15/25 210,402
220,000 ACCO Brands Corp.* 4.250%, 03/15/29 220,112
560,000 Air Lease Corp.^‡ 4.650%, 06/15/26 5 year CMT + 4.08 586,432
Albertsons Companies, Inc. / Safeway, Inc. / New Albertsons, LP / Albertsons, LLC*
217,000 4.875%, 02/15/30 235,078 215,000 4.625%, 01/15/27 227,550
95,000 3.500%, 03/15/29 96,022 50,000 Allison Transmission, Inc.*
3.750%, 01/30/31 50,047 47,000 Ambience Merger Sub, Inc.*
7.125%, 07/15/29 47,633 50,000 American Airlines Group, Inc.*^
3.750%, 03/01/25 44,569 108,000 Arcosa, Inc.*
4.375%, 04/15/29 110,715 940,000 ARD Finance, SA*
6.500%, 06/30/27 7.250% PIK rate 992,772
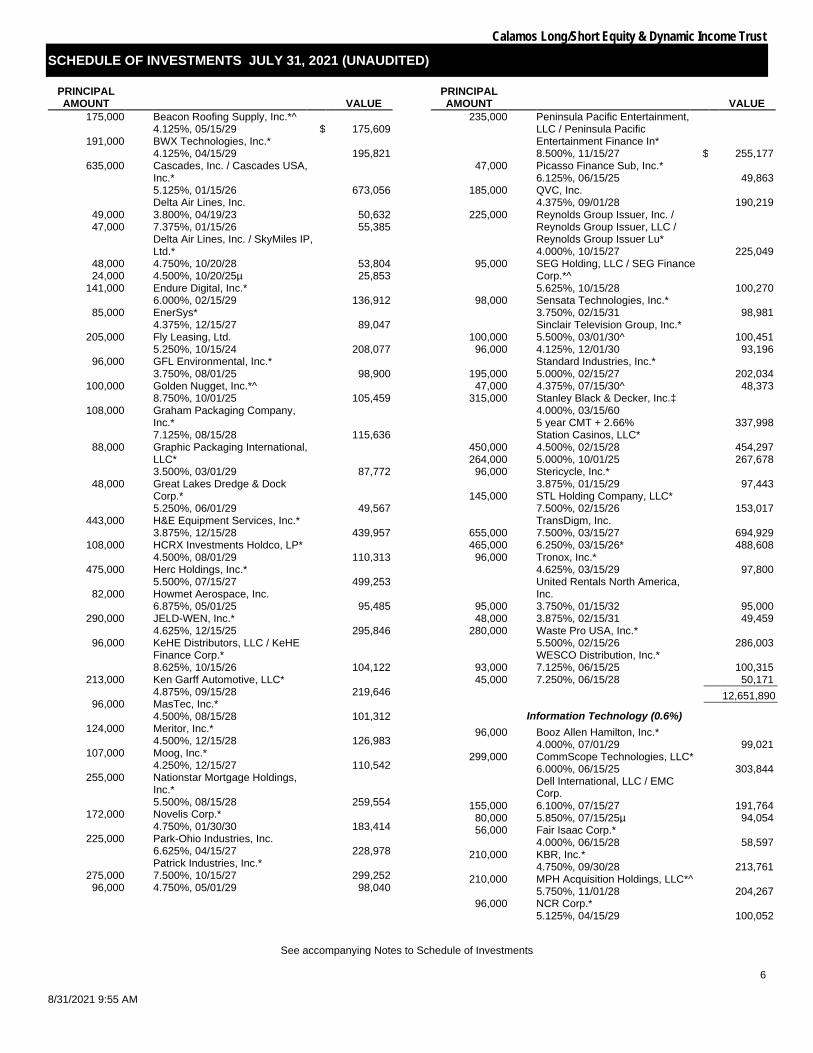
Calamos Long/Short Equity & Dynamic Income Trust
SCHEDULE OF INVESTMENTS JULY 31, 2021 (UNAUDITED)
See accompanying Notes to Schedule of Investments
6
8/31/2021 9:55 AM
PRINCIPAL AMOUNT VALUE
175,000 Beacon Roofing Supply, Inc.*^ 4.125%, 05/15/29 $ 175,609
191,000 BWX Technologies, Inc.* 4.125%, 04/15/29 195,821
635,000 Cascades, Inc. / Cascades USA, Inc.* 5.125%, 01/15/26 673,056
Delta Air Lines, Inc. 49,000 3.800%, 04/19/23 50,632 47,000 7.375%, 01/15/26 55,385
Delta Air Lines, Inc. / SkyMiles IP, Ltd.*
48,000 4.750%, 10/20/28 53,804 24,000 4.500%, 10/20/25µ 25,853
141,000 Endure Digital, Inc.* 6.000%, 02/15/29 136,912
85,000 EnerSys* 4.375%, 12/15/27 89,047
205,000 Fly Leasing, Ltd. 5.250%, 10/15/24 208,077
96,000 GFL Environmental, Inc.* 3.750%, 08/01/25 98,900
100,000 Golden Nugget, Inc.*^ 8.750%, 10/01/25 105,459
108,000 Graham Packaging Company, Inc.* 7.125%, 08/15/28 115,636
88,000 Graphic Packaging International, LLC* 3.500%, 03/01/29 87,772
48,000 Great Lakes Dredge & Dock Corp.* 5.250%, 06/01/29 49,567
443,000 H&E Equipment Services, Inc.* 3.875%, 12/15/28 439,957
108,000 HCRX Investments Holdco, LP* 4.500%, 08/01/29 110,313
475,000 Herc Holdings, Inc.* 5.500%, 07/15/27 499,253
82,000 Howmet Aerospace, Inc. 6.875%, 05/01/25 95,485
290,000 JELD-WEN, Inc.* 4.625%, 12/15/25 295,846
96,000 KeHE Distributors, LLC / KeHE Finance Corp.* 8.625%, 10/15/26 104,122
213,000 Ken Garff Automotive, LLC* 4.875%, 09/15/28 219,646
96,000 MasTec, Inc.* 4.500%, 08/15/28 101,312
124,000 Meritor, Inc.* 4.500%, 12/15/28 126,983
107,000 Moog, Inc.* 4.250%, 12/15/27 110,542
255,000 Nationstar Mortgage Holdings, Inc.* 5.500%, 08/15/28 259,554
172,000 Novelis Corp.* 4.750%, 01/30/30 183,414
225,000 Park-Ohio Industries, Inc. 6.625%, 04/15/27 228,978
Patrick Industries, Inc.* 275,000 7.500%, 10/15/27 299,252
96,000 4.750%, 05/01/29 98,040
PRINCIPAL AMOUNT VALUE
235,000 Peninsula Pacific Entertainment, LLC / Peninsula Pacific Entertainment Finance In* 8.500%, 11/15/27 $ 255,177
47,000 Picasso Finance Sub, Inc.* 6.125%, 06/15/25 49,863
185,000 QVC, Inc. 4.375%, 09/01/28 190,219
225,000 Reynolds Group Issuer, Inc. / Reynolds Group Issuer, LLC / Reynolds Group Issuer Lu* 4.000%, 10/15/27 225,049
95,000 SEG Holding, LLC / SEG Finance Corp.*^ 5.625%, 10/15/28 100,270
98,000 Sensata Technologies, Inc.* 3.750%, 02/15/31 98,981
Sinclair Television Group, Inc.* 100,000 5.500%, 03/01/30^ 100,451
96,000 4.125%, 12/01/30 93,196 Standard Industries, Inc.*
195,000 5.000%, 02/15/27 202,034 47,000 4.375%, 07/15/30^ 48,373
315,000 Stanley Black & Decker, Inc.‡ 4.000%, 03/15/60 5 year CMT + 2.66% 337,998
Station Casinos, LLC* 450,000 4.500%, 02/15/28 454,297 264,000 5.000%, 10/01/25 267,678
96,000 Stericycle, Inc.* 3.875%, 01/15/29 97,443
145,000 STL Holding Company, LLC* 7.500%, 02/15/26 153,017
TransDigm, Inc. 655,000 7.500%, 03/15/27 694,929 465,000 6.250%, 03/15/26* 488,608
96,000 Tronox, Inc.* 4.625%, 03/15/29 97,800
United Rentals North America, Inc.
95,000 3.750%, 01/15/32 95,000 48,000 3.875%, 02/15/31 49,459
280,000 Waste Pro USA, Inc.* 5.500%, 02/15/26 286,003
WESCO Distribution, Inc.* 93,000 7.125%, 06/15/25 100,315 45,000 7.250%, 06/15/28 50,171 ___________
12,651,890 ___________ Information Technology (0.6%)
96,000 Booz Allen Hamilton, Inc.* 4.000%, 07/01/29 99,021
299,000 CommScope Technologies, LLC* 6.000%, 06/15/25 303,844
Dell International, LLC / EMC Corp.
155,000 6.100%, 07/15/27 191,764 80,000 5.850%, 07/15/25µ 94,054 56,000 Fair Isaac Corp.*
4.000%, 06/15/28 58,597 210,000 KBR, Inc.*
4.750%, 09/30/28 213,761 210,000 MPH Acquisition Holdings, LLC*^
5.750%, 11/01/28 204,267 96,000 NCR Corp.*
5.125%, 04/15/29 100,052
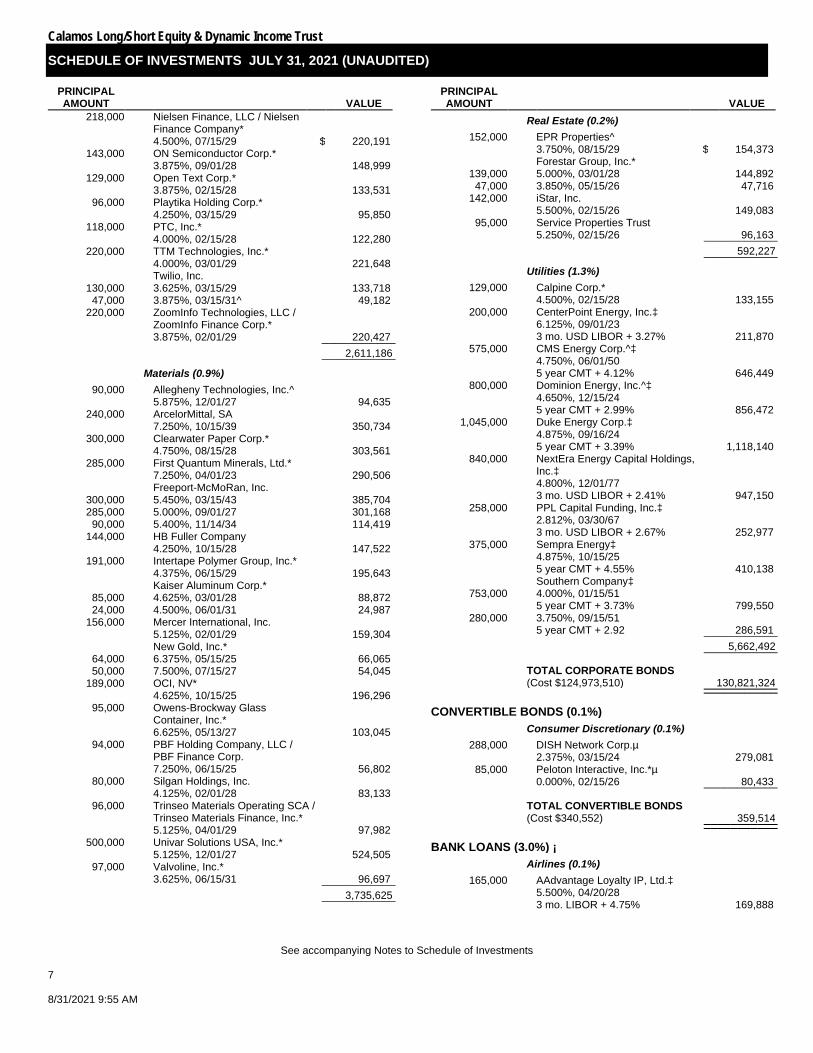
Calamos Long/Short Equity & Dynamic Income Trust
SCHEDULE OF INVESTMENTS JULY 31, 2021 (UNAUDITED)
See accompanying Notes to Schedule of Investments
7 8/31/2021 9:55 AM
PRINCIPAL AMOUNT VALUE
218,000 Nielsen Finance, LLC / Nielsen Finance Company* 4.500%, 07/15/29 $ 220,191
143,000 ON Semiconductor Corp.* 3.875%, 09/01/28 148,999
129,000 Open Text Corp.* 3.875%, 02/15/28 133,531
96,000 Playtika Holding Corp.* 4.250%, 03/15/29 95,850
118,000 PTC, Inc.* 4.000%, 02/15/28 122,280
220,000 TTM Technologies, Inc.* 4.000%, 03/01/29 221,648
Twilio, Inc. 130,000 3.625%, 03/15/29 133,718
47,000 3.875%, 03/15/31^ 49,182 220,000 ZoomInfo Technologies, LLC /
ZoomInfo Finance Corp.* 3.875%, 02/01/29 220,427 ___________
2,611,186 ___________ Materials (0.9%)
90,000 Allegheny Technologies, Inc.^ 5.875%, 12/01/27 94,635
240,000 ArcelorMittal, SA 7.250%, 10/15/39 350,734
300,000 Clearwater Paper Corp.* 4.750%, 08/15/28 303,561
285,000 First Quantum Minerals, Ltd.* 7.250%, 04/01/23 290,506
Freeport-McMoRan, Inc. 300,000 5.450%, 03/15/43 385,704 285,000 5.000%, 09/01/27 301,168
90,000 5.400%, 11/14/34 114,419 144,000 HB Fuller Company
4.250%, 10/15/28 147,522 191,000 Intertape Polymer Group, Inc.*
4.375%, 06/15/29 195,643 Kaiser Aluminum Corp.*
85,000 4.625%, 03/01/28 88,872 24,000 4.500%, 06/01/31 24,987
156,000 Mercer International, Inc. 5.125%, 02/01/29 159,304
New Gold, Inc.* 64,000 6.375%, 05/15/25 66,065 50,000 7.500%, 07/15/27 54,045
189,000 OCI, NV* 4.625%, 10/15/25 196,296
95,000 Owens-Brockway Glass Container, Inc.* 6.625%, 05/13/27 103,045
94,000 PBF Holding Company, LLC / PBF Finance Corp. 7.250%, 06/15/25 56,802
80,000 Silgan Holdings, Inc. 4.125%, 02/01/28 83,133
96,000 Trinseo Materials Operating SCA / Trinseo Materials Finance, Inc.* 5.125%, 04/01/29 97,982
500,000 Univar Solutions USA, Inc.* 5.125%, 12/01/27 524,505
97,000 Valvoline, Inc.* 3.625%, 06/15/31 96,697 ___________
3,735,625 ___________
PRINCIPAL AMOUNT VALUE
Real Estate (0.2%) 152,000 EPR Properties^
3.750%, 08/15/29 $ 154,373 Forestar Group, Inc.*
139,000 5.000%, 03/01/28 144,892 47,000 3.850%, 05/15/26 47,716
142,000 iStar, Inc. 5.500%, 02/15/26 149,083
95,000 Service Properties Trust 5.250%, 02/15/26 96,163 ___________
592,227 ___________ Utilities (1.3%)
129,000 Calpine Corp.* 4.500%, 02/15/28 133,155
200,000 CenterPoint Energy, Inc.‡ 6.125%, 09/01/23 3 mo. USD LIBOR + 3.27% 211,870
575,000 CMS Energy Corp.^‡ 4.750%, 06/01/50 5 year CMT + 4.12% 646,449
800,000 Dominion Energy, Inc.^‡ 4.650%, 12/15/24 5 year CMT + 2.99% 856,472
1,045,000 Duke Energy Corp.‡ 4.875%, 09/16/24 5 year CMT + 3.39% 1,118,140
840,000 NextEra Energy Capital Holdings, Inc.‡ 4.800%, 12/01/77 3 mo. USD LIBOR + 2.41% 947,150
258,000 PPL Capital Funding, Inc.‡ 2.812%, 03/30/67 3 mo. USD LIBOR + 2.67% 252,977
375,000 Sempra Energy‡ 4.875%, 10/15/25 5 year CMT + 4.55% 410,138
Southern Company‡ 753,000 4.000%, 01/15/51
5 year CMT + 3.73% 799,550 280,000 3.750%, 09/15/51
5 year CMT + 2.92 286,591 ___________ 5,662,492 ___________
TOTAL CORPORATE BONDS (Cost $124,973,510) 130,821,324 ___________ ___________
CONVERTIBLE BONDS (0.1%) Consumer Discretionary (0.1%)
288,000 DISH Network Corp.µ 2.375%, 03/15/24 279,081
85,000 Peloton Interactive, Inc.*µ 0.000%, 02/15/26 80,433 ___________
TOTAL CONVERTIBLE BONDS (Cost $340,552) 359,514 ___________ ___________
BANK LOANS (3.0%) ¡ Airlines (0.1%)
165,000 AAdvantage Loyalty IP, Ltd.‡ 5.500%, 04/20/28 3 mo. LIBOR + 4.75% 169,888
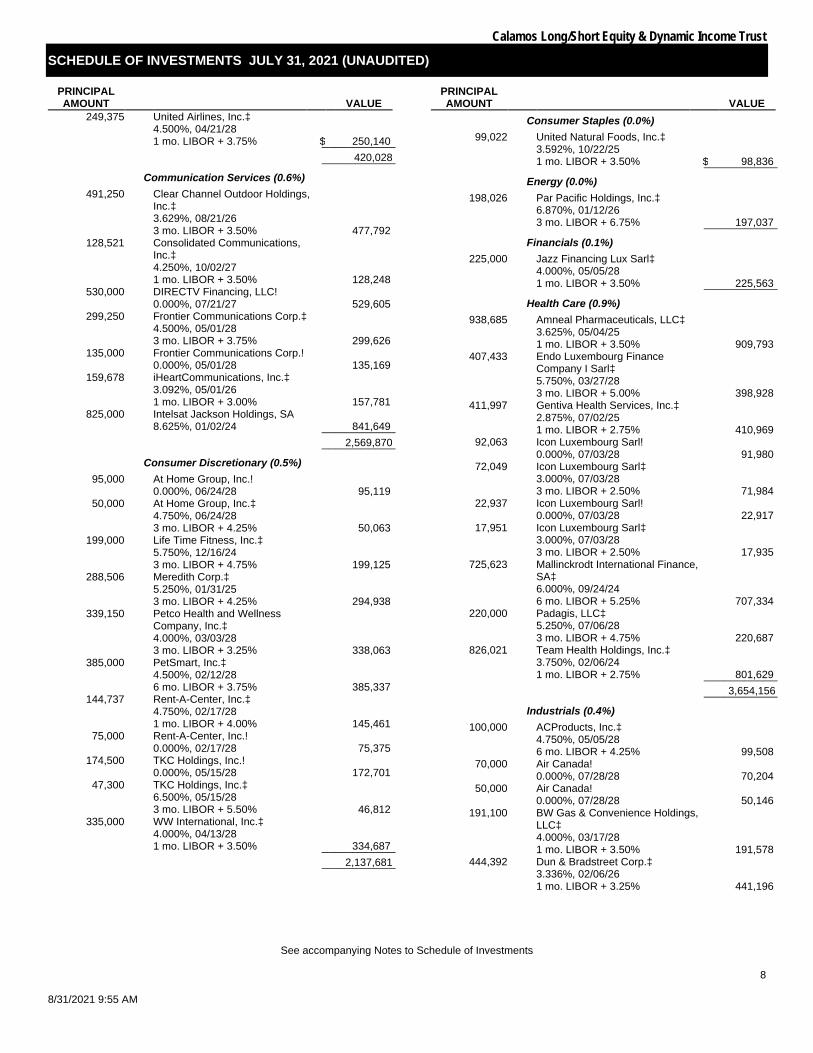
Calamos Long/Short Equity & Dynamic Income Trust
SCHEDULE OF INVESTMENTS JULY 31, 2021 (UNAUDITED)
See accompanying Notes to Schedule of Investments
8
8/31/2021 9:55 AM
PRINCIPAL AMOUNT VALUE
249,375 United Airlines, Inc.‡ 4.500%, 04/21/28 1 mo. LIBOR + 3.75% $ 250,140 ___________
420,028 ___________ Communication Services (0.6%)
491,250 Clear Channel Outdoor Holdings, Inc.‡ 3.629%, 08/21/26 3 mo. LIBOR + 3.50% 477,792
128,521 Consolidated Communications, Inc.‡ 4.250%, 10/02/27 1 mo. LIBOR + 3.50% 128,248
530,000 DIRECTV Financing, LLC! 0.000%, 07/21/27 529,605
299,250 Frontier Communications Corp.‡ 4.500%, 05/01/28 3 mo. LIBOR + 3.75% 299,626
135,000 Frontier Communications Corp.! 0.000%, 05/01/28 135,169
159,678 iHeartCommunications, Inc.‡ 3.092%, 05/01/26 1 mo. LIBOR + 3.00% 157,781
825,000 Intelsat Jackson Holdings, SA 8.625%, 01/02/24 841,649 ___________
2,569,870 ___________ Consumer Discretionary (0.5%)
95,000 At Home Group, Inc.! 0.000%, 06/24/28 95,119
50,000 At Home Group, Inc.‡ 4.750%, 06/24/28 3 mo. LIBOR + 4.25% 50,063
199,000 Life Time Fitness, Inc.‡ 5.750%, 12/16/24 3 mo. LIBOR + 4.75% 199,125
288,506 Meredith Corp.‡ 5.250%, 01/31/25 3 mo. LIBOR + 4.25% 294,938
339,150 Petco Health and Wellness Company, Inc.‡ 4.000%, 03/03/28 3 mo. LIBOR + 3.25% 338,063
385,000 PetSmart, Inc.‡ 4.500%, 02/12/28 6 mo. LIBOR + 3.75% 385,337
144,737 Rent-A-Center, Inc.‡ 4.750%, 02/17/28 1 mo. LIBOR + 4.00% 145,461
75,000 Rent-A-Center, Inc.! 0.000%, 02/17/28 75,375
174,500 TKC Holdings, Inc.! 0.000%, 05/15/28 172,701
47,300 TKC Holdings, Inc.‡ 6.500%, 05/15/28 3 mo. LIBOR + 5.50% 46,812
335,000 WW International, Inc.‡ 4.000%, 04/13/28 1 mo. LIBOR + 3.50% 334,687 ___________
2,137,681 ___________
PRINCIPAL AMOUNT VALUE
Consumer Staples (0.0%) 99,022 United Natural Foods, Inc.‡
3.592%, 10/22/25 1 mo. LIBOR + 3.50% $ 98,836 ___________
Energy (0.0%) 198,026 Par Pacific Holdings, Inc.‡
6.870%, 01/12/26 3 mo. LIBOR + 6.75% 197,037 ___________
Financials (0.1%) 225,000 Jazz Financing Lux Sarl‡
4.000%, 05/05/28 1 mo. LIBOR + 3.50% 225,563 ___________
Health Care (0.9%) 938,685 Amneal Pharmaceuticals, LLC‡
3.625%, 05/04/25 1 mo. LIBOR + 3.50% 909,793
407,433 Endo Luxembourg Finance Company I Sarl‡ 5.750%, 03/27/28 3 mo. LIBOR + 5.00% 398,928
411,997 Gentiva Health Services, Inc.‡ 2.875%, 07/02/25 1 mo. LIBOR + 2.75% 410,969
92,063 Icon Luxembourg Sarl! 0.000%, 07/03/28 91,980
72,049 Icon Luxembourg Sarl‡ 3.000%, 07/03/28 3 mo. LIBOR + 2.50% 71,984
22,937 Icon Luxembourg Sarl! 0.000%, 07/03/28 22,917
17,951 Icon Luxembourg Sarl‡ 3.000%, 07/03/28 3 mo. LIBOR + 2.50% 17,935
725,623 Mallinckrodt International Finance, SA‡ 6.000%, 09/24/24 6 mo. LIBOR + 5.25% 707,334
220,000 Padagis, LLC‡ 5.250%, 07/06/28 3 mo. LIBOR + 4.75% 220,687
826,021 Team Health Holdings, Inc.‡ 3.750%, 02/06/24 1 mo. LIBOR + 2.75% 801,629 ___________
3,654,156 ___________ Industrials (0.4%)
100,000 ACProducts, Inc.‡ 4.750%, 05/05/28 6 mo. LIBOR + 4.25% 99,508
70,000 Air Canada! 0.000%, 07/28/28 70,204
50,000 Air Canada! 0.000%, 07/28/28 50,146
191,100 BW Gas & Convenience Holdings, LLC‡ 4.000%, 03/17/28 1 mo. LIBOR + 3.50% 191,578
444,392 Dun & Bradstreet Corp.‡ 3.336%, 02/06/26 1 mo. LIBOR + 3.25% 441,196
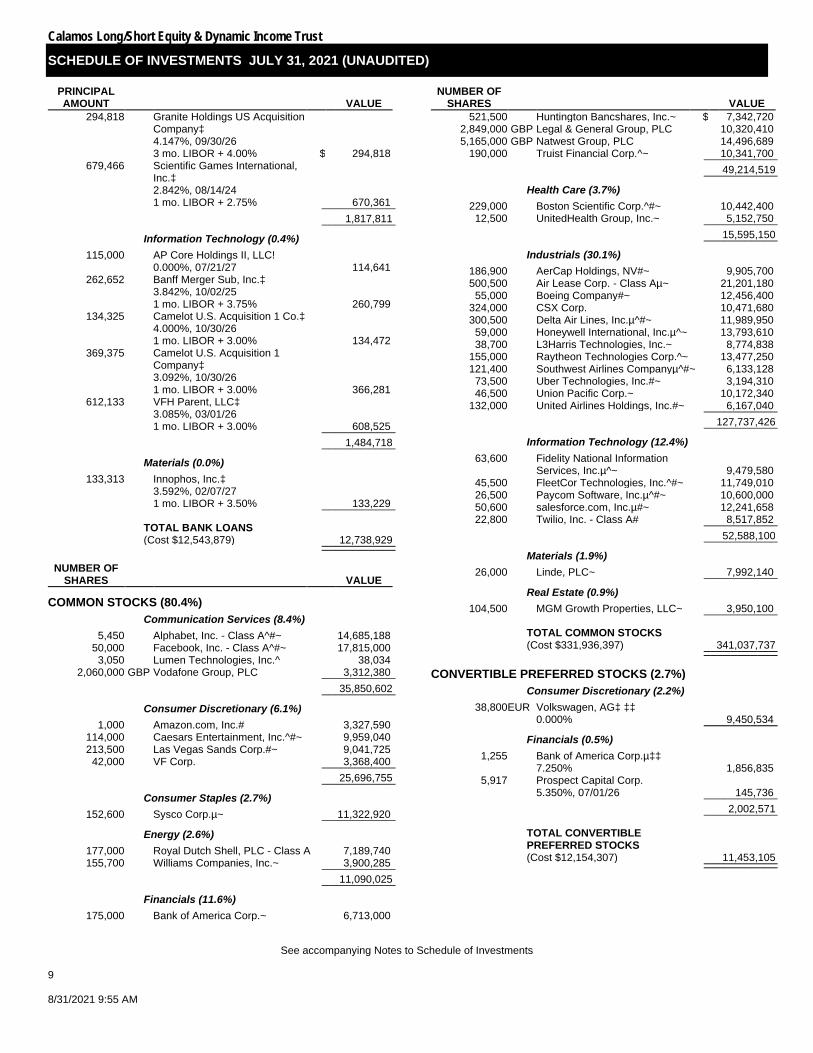
Calamos Long/Short Equity & Dynamic Income Trust
SCHEDULE OF INVESTMENTS JULY 31, 2021 (UNAUDITED)
See accompanying Notes to Schedule of Investments
9 8/31/2021 9:55 AM
PRINCIPAL AMOUNT VALUE
294,818 Granite Holdings US Acquisition Company‡ 4.147%, 09/30/26 3 mo. LIBOR + 4.00% $ 294,818
679,466 Scientific Games International, Inc.‡ 2.842%, 08/14/24 1 mo. LIBOR + 2.75% 670,361 ___________
1,817,811 ___________ Information Technology (0.4%)
115,000 AP Core Holdings II, LLC! 0.000%, 07/21/27 114,641
262,652 Banff Merger Sub, Inc.‡ 3.842%, 10/02/25 1 mo. LIBOR + 3.75% 260,799
134,325 Camelot U.S. Acquisition 1 Co.‡ 4.000%, 10/30/26 1 mo. LIBOR + 3.00% 134,472
369,375 Camelot U.S. Acquisition 1 Company‡ 3.092%, 10/30/26 1 mo. LIBOR + 3.00% 366,281
612,133 VFH Parent, LLC‡ 3.085%, 03/01/26 1 mo. LIBOR + 3.00% 608,525 ___________
1,484,718 ___________ Materials (0.0%)
133,313 Innophos, Inc.‡ 3.592%, 02/07/27 1 mo. LIBOR + 3.50% 133,229 ___________
TOTAL BANK LOANS (Cost $12,543,879) 12,738,929 ___________ ___________
NUMBER OF SHARES VALUE
COMMON STOCKS (80.4%) Communication Services (8.4%)
5,450 Alphabet, Inc. - Class A^#~ 14,685,188 50,000 Facebook, Inc. - Class A^#~ 17,815,000
3,050 Lumen Technologies, Inc.^ 38,034 2,060,000 GBP Vodafone Group, PLC 3,312,380 ___________
35,850,602 ___________ Consumer Discretionary (6.1%)
1,000 Amazon.com, Inc.# 3,327,590 114,000 Caesars Entertainment, Inc.^#~ 9,959,040 213,500 Las Vegas Sands Corp.#~ 9,041,725
42,000 VF Corp. 3,368,400 ___________ 25,696,755 ___________
Consumer Staples (2.7%) 152,600 Sysco Corp.µ~ 11,322,920 ___________
Energy (2.6%) 177,000 Royal Dutch Shell, PLC - Class A 7,189,740 155,700 Williams Companies, Inc.~ 3,900,285 ___________
11,090,025 ___________ Financials (11.6%)
175,000 Bank of America Corp.~ 6,713,000
NUMBER OF SHARES VALUE
521,500 Huntington Bancshares, Inc.~ $ 7,342,720 2,849,000 GBP Legal & General Group, PLC 10,320,410 5,165,000 GBP Natwest Group, PLC 14,496,689
190,000 Truist Financial Corp.^~ 10,341,700 ___________ 49,214,519 ___________
Health Care (3.7%) 229,000 Boston Scientific Corp.^#~ 10,442,400
12,500 UnitedHealth Group, Inc.~ 5,152,750 ___________ 15,595,150 ___________
Industrials (30.1%) 186,900 AerCap Holdings, NV#~ 9,905,700 500,500 Air Lease Corp. - Class Aµ~ 21,201,180
55,000 Boeing Company#~ 12,456,400 324,000 CSX Corp. 10,471,680 300,500 Delta Air Lines, Inc.µ^#~ 11,989,950
59,000 Honeywell International, Inc.µ^~ 13,793,610 38,700 L3Harris Technologies, Inc.~ 8,774,838
155,000 Raytheon Technologies Corp.^~ 13,477,250 121,400 Southwest Airlines Companyµ^#~ 6,133,128
73,500 Uber Technologies, Inc.#~ 3,194,310 46,500 Union Pacific Corp.~ 10,172,340
132,000 United Airlines Holdings, Inc.#~ 6,167,040 ___________ 127,737,426 ___________
Information Technology (12.4%) 63,600 Fidelity National Information
Services, Inc.µ^~ 9,479,580 45,500 FleetCor Technologies, Inc.^#~ 11,749,010 26,500 Paycom Software, Inc.µ^#~ 10,600,000 50,600 salesforce.com, Inc.µ#~ 12,241,658 22,800 Twilio, Inc. - Class A# 8,517,852 ___________
52,588,100 ___________ Materials (1.9%)
26,000 Linde, PLC~ 7,992,140 ___________ Real Estate (0.9%)
104,500 MGM Growth Properties, LLC~ 3,950,100 ___________
TOTAL COMMON STOCKS (Cost $331,936,397) 341,037,737 ___________ ___________
CONVERTIBLE PREFERRED STOCKS (2.7%) Consumer Discretionary (2.2%)
38,800 EUR Volkswagen, AG‡ ‡‡ 0.000% 9,450,534 ___________
Financials (0.5%) 1,255 Bank of America Corp.µ‡‡
7.250% 1,856,835 5,917 Prospect Capital Corp.
5.350%, 07/01/26 145,736 ___________ 2,002,571 ___________
TOTAL CONVERTIBLE PREFERRED STOCKS (Cost $12,154,307) 11,453,105 ___________ ___________

Calamos Long/Short Equity & Dynamic Income Trust
SCHEDULE OF INVESTMENTS JULY 31, 2021 (UNAUDITED)
See accompanying Notes to Schedule of Investments
10
8/31/2021 9:55 AM
NUMBER OF SHARES VALUE
PREFERRED STOCKS (6.3%) Communication Services (0.8%)
25,330 AT&T, Inc.^ 4.750%, 02/18/25 $ 670,485
15,800 AT&T, Inc.^~ 5.350%, 11/01/66 418,700
58,930 Qwest Corp.µ^ 6.500%, 09/01/56 1,494,465
25,585 United States Cellular Corp.µ 6.250%, 09/01/69 710,751 ___________
3,294,401 ___________ Consumer Discretionary (0.3%)
12,200 Ford Motor Companyµ^~ 6.200%, 06/01/59 338,672
3,615 Guitar Center, Inc. 0.000% 410,755
3,688 Qurate Retail, Inc.µ 8.000%, 03/15/31 400,074 ___________
1,149,501 ___________ Energy (0.5%)
35,935 Energy Transfer, LP‡ 7.625%, 08/15/23 3 mo. USD LIBOR + 4.74 911,312
29,900 NuStar Energy, LP‡ 7.625%, 06/15/22 3 mo. USD LIBOR + 5.64% 696,670
28,750 NuStar Logistics, LP‡ 6.860%, 01/15/43 3 mo. USD LIBOR + 6.73% 726,512 ___________
2,334,494 ___________ Financials (3.3%)
18,000 Affiliated Managers Group, Inc.^ 4.750%, 09/30/60 480,960
17,285 Annaly Capital Management, Inc.^‡ 6.950%, 09/30/22 3 mo. USD LIBOR + 4.99% 451,138
34,494 Arch Capital Group, Ltd.^ 5.250%, 09/29/21 873,388
9,000 B Riley Financial, Inc. 6.000%, 01/31/28 239,310
16,383 Bank of America Corp.^ 4.375%, 11/03/25 427,269
21,000 Brookfield Finance, Inc. 4.625%, 10/16/80 539,280
23,370 CIT Group, Inc.µ 5.625%, 12/15/24 623,278
26,025 CNO Financial Group, Inc.µ^ 5.125%, 11/25/60 714,386
15,419 Cullen/Frost Bankers, Inc.µ^ 4.450%, 12/15/25 407,061
7,063 First Republic Bank/CAµ^ 4.125%, 10/30/25 178,553
8,250 Fulton Financial Corp.µ^ 5.125%, 01/15/26 224,812
27,185 KeyCorpµ 5.650%, 12/15/23 750,578
17,135 Legg Mason, Inc.µ 5.450%, 09/15/56 432,832
33,420 Morgan Stanleyµ 4.875%, 01/15/25 908,690
NUMBER OF SHARES VALUE
16,115 Oaktree Capital Group, LLCµ^ 6.550%, 09/15/23 $ 451,703
24,075 Prudential Financial, Inc.^ 4.125%, 09/01/60 631,969
35,500 Selective Insurance Group, Inc.µ^ 4.600%, 12/15/25 924,775
8,994 Signature Bank/New York NYµ^ 5.000%, 12/30/25 236,632
16,600 Spirit Realty Capital, Inc.µ 6.000%, 10/03/22 435,418
31,375 Truist Financial Corp.µ^ 4.750%, 09/01/25 832,379
18,395 US Bancorp^ 3.750%, 01/15/26 459,507
35,915 W R Berkley Corp.^ 5.100%, 12/30/59 983,712
69,435 Wells Fargo & Company^ 4.750%, 03/15/25 1,818,503 ___________
14,026,133 ___________ Industrials (0.3%)
18,200 Air Lease Corp.‡ 6.150%, 03/15/24 3 mo. USD LIBOR + 3.65% 496,496
7,500 Brookfield Finance I UK, PLC^ 4.500%, 11/24/25 190,650
11,400 QVC, Inc.µ 6.250%, 11/26/68 299,136
7,275 WESCO International, Inc.µ‡ 10.625%, 06/22/25 5 year CMT + 10.33 225,889 ___________
1,212,171 ___________ Real Estate (0.8%)
16,375 American Homes 4 Rent^~ 6.250%, 09/19/23 454,406
22,900 Brookfield Property Partners, LPµ~ 5.750%, 03/31/25 560,821
15,300 Brookfield Property Partners, LPµ~ 6.375%, 09/30/24 389,079
17,100 EPR Propertiesµ^~ 5.750%, 11/30/22 437,076
16,515 Global Net Lease, Inc.µ 6.875%, 11/26/24 443,263
31,680 Kimco Realty Corp.µ^ 5.250%, 12/20/22 851,875
11,330 Public Storage^ 4.625%, 06/17/25 315,427 ___________
3,451,947 ___________ Utilities (0.3%)
15,800 Algonquin Power & Utilities Corp.‡ 6.875%, 10/17/78 3 mo. USD LIBOR + 3.68% 439,240
16,750 Brookfield Renewable Partners, LP^ 5.250%, 03/31/25 438,348
16,150 DTE Energy Companyµ~ 5.250%, 12/01/77 427,329 ___________
1,304,917 ___________
TOTAL PREFERRED STOCKS (Cost $25,640,916) 26,773,564 ___________ ___________
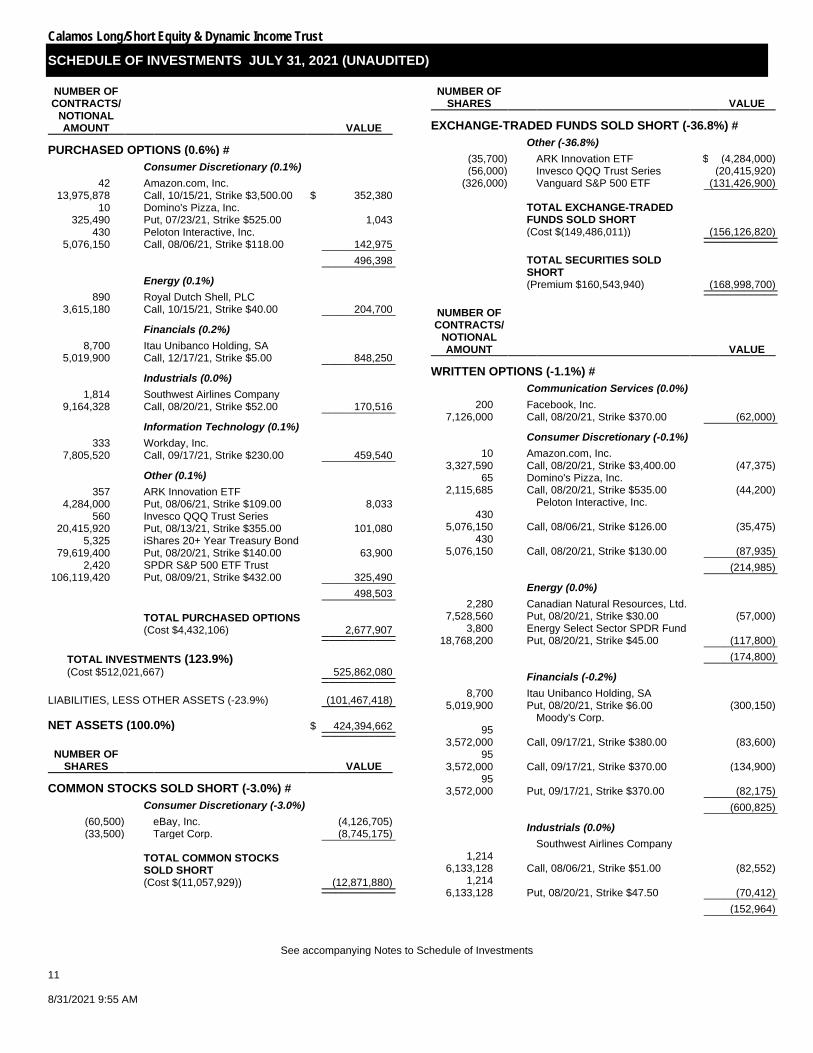
Calamos Long/Short Equity & Dynamic Income Trust
SCHEDULE OF INVESTMENTS JULY 31, 2021 (UNAUDITED)
See accompanying Notes to Schedule of Investments
11 8/31/2021 9:55 AM
NUMBER OF CONTRACTS/
NOTIONAL AMOUNT VALUE
PURCHASED OPTIONS (0.6%) # Consumer Discretionary (0.1%)
42 13,975,878
Amazon.com, Inc. Call, 10/15/21, Strike $3,500.00 $ 352,380
10 325,490
Domino's Pizza, Inc. Put, 07/23/21, Strike $525.00 1,043
430 5,076,150
Peloton Interactive, Inc. Call, 08/06/21, Strike $118.00 142,975 ___________
496,398 ___________ Energy (0.1%)
890 3,615,180
Royal Dutch Shell, PLC Call, 10/15/21, Strike $40.00 204,700 ___________ Financials (0.2%)
8,700 5,019,900
Itau Unibanco Holding, SA Call, 12/17/21, Strike $5.00 848,250 ___________ Industrials (0.0%)
1,814 9,164,328
Southwest Airlines Company Call, 08/20/21, Strike $52.00 170,516 ___________ Information Technology (0.1%)
333 7,805,520
Workday, Inc. Call, 09/17/21, Strike $230.00 459,540 ___________ Other (0.1%)
357 4,284,000
ARK Innovation ETF Put, 08/06/21, Strike $109.00 8,033
560 20,415,920
Invesco QQQ Trust Series Put, 08/13/21, Strike $355.00 101,080
5,325 79,619,400
iShares 20+ Year Treasury Bond Put, 08/20/21, Strike $140.00 63,900
2,420 106,119,420
SPDR S&P 500 ETF Trust Put, 08/09/21, Strike $432.00 325,490 ___________
498,503 ___________
TOTAL PURCHASED OPTIONS (Cost $4,432,106) 2,677,907 ___________ ___________
TOTAL INVESTMENTS (123.9%) (Cost $512,021,667) 525,862,080 ___________ ___________
LIABILITIES, LESS OTHER ASSETS (-23.9%) (101,467,418) ___________
NET ASSETS (100.0%) $ 424,394,662 ___________ ___________
NUMBER OF SHARES VALUE
COMMON STOCKS SOLD SHORT (-3.0%) # Consumer Discretionary (-3.0%)
(60,500) eBay, Inc. (4,126,705) (33,500) Target Corp. (8,745,175) ___________
TOTAL COMMON STOCKS SOLD SHORT (Cost $(11,057,929)) (12,871,880) ___________ ___________
NUMBER OF SHARES VALUE
EXCHANGE-TRADED FUNDS SOLD SHORT (-36.8%) # Other (-36.8%)
(35,700) ARK Innovation ETF $ (4,284,000) (56,000) Invesco QQQ Trust Series (20,415,920)
(326,000) Vanguard S&P 500 ETF (131,426,900) ___________
TOTAL EXCHANGE-TRADED FUNDS SOLD SHORT (Cost $(149,486,011)) (156,126,820) ___________ ___________
TOTAL SECURITIES SOLD SHORT (Premium $160,543,940) (168,998,700) ___________ ___________
NUMBER OF CONTRACTS/
NOTIONAL AMOUNT VALUE
WRITTEN OPTIONS (-1.1%) # Communication Services (0.0%)
200 7,126,000
Facebook, Inc. Call, 08/20/21, Strike $370.00 (62,000) ___________ Consumer Discretionary (-0.1%)
10 3,327,590
Amazon.com, Inc. Call, 08/20/21, Strike $3,400.00 (47,375)
65 2,115,685
Domino's Pizza, Inc. Call, 08/20/21, Strike $535.00 (44,200)
Peloton Interactive, Inc. 430
5,076,150 Call, 08/06/21, Strike $126.00 (35,475) 430
5,076,150 Call, 08/20/21, Strike $130.00 (87,935) ___________ (214,985) ___________
Energy (0.0%) 2,280
7,528,560 Canadian Natural Resources, Ltd.
Put, 08/20/21, Strike $30.00 (57,000) 3,800
18,768,200 Energy Select Sector SPDR Fund
Put, 08/20/21, Strike $45.00 (117,800) ___________ (174,800) ___________
Financials (-0.2%) 8,700
5,019,900 Itau Unibanco Holding, SA
Put, 08/20/21, Strike $6.00 (300,150) Moody's Corp.
95 3,572,000 Call, 09/17/21, Strike $380.00 (83,600)
95 3,572,000 Call, 09/17/21, Strike $370.00 (134,900)
95 3,572,000 Put, 09/17/21, Strike $370.00 (82,175) ___________
(600,825) ___________ Industrials (0.0%)
Southwest Airlines Company 1,214
6,133,128 Call, 08/06/21, Strike $51.00 (82,552) 1,214
6,133,128 Put, 08/20/21, Strike $47.50 (70,412) ___________ (152,964) ___________

Calamos Long/Short Equity & Dynamic Income Trust
SCHEDULE OF INVESTMENTS JULY 31, 2021 (UNAUDITED)
See accompanying Notes to Schedule of Investments
12
8/31/2021 9:55 AM
NUMBER OF CONTRACTS/
NOTIONAL AMOUNT VALUE
Other (-0.8%) ARK Innovation ETF
357 4,284,000 Put, 08/06/21, Strike $100.00 $ (1,785)
357 4,284,000 Put, 08/20/21, Strike $100.00 (14,994)
Invesco QQQ Trust Series 560
20,415,920 Put, 08/13/21, Strike $345.00 (44,520) 560
20,415,920 Put, 08/20/21, Strike $340.00 (61,600) iShares 20+ Year Treasury Bond
5,325 79,619,400 Call, 09/17/21, Strike $150.00 (1,605,488)
2,665 39,847,080 Put, 09/17/21, Strike $130.00 (61,295)
Vanguard S&P 500 ETF 3,650
147,149,750 Put, 08/20/21, Strike $350.00 (146,000) 3,260
131,426,900 Put, 08/20/21, Strike $380.00 (415,650) 465
18,746,475 Call, 08/20/21, Strike $385.00 (920,700) ___________ (3,272,032) ___________
TOTAL WRITTEN OPTIONS (Premium $3,693,174) (4,477,606) ___________ ___________
NOTES TO SCHEDULE OF INVESTMENTS *
Securities issued and sold pursuant to a Rule 144A transaction are excepted from the registration requirement of the Securities Act of 1933, as amended. These securities may only be sold to qualified institutional buyers (“QIBs”), such as the Fund. Any resale of these securities must generally be effected through a sale that is registered under the Act or otherwise exempted from such registration requirements.
µ
Security, or portion of security, is held in a segregated account as collateral for note payable aggregating a total value of $36,843,987.
^ Security, or portion of security, is on loan. @ In default status and considered non-income producing. ‡
Variable rate security. The rate shown is the rate in effect at July 31, 2021.
& Illiquid security. ¡
Bank loans generally are subject to mandatory and/or optional prepayment. As a result, the actual remaining maturity of bank loans may be substantially less than the stated maturities shown.
!
This position represents an unsettled loan commitment at period end. Certain details associated with this purchase are not known prior to the settlement date, including coupon rate, which will be adjusted on settlement date.
# Non-income producing security. ~
Security, or portion of security, is segregated as collateral (or potential collateral for future transactions) for written options. The aggregate value of such securities is $142,496,168.
‡‡ Perpetual maturity.
FOREIGN CURRENCY ABBREVIATIONS EUR European Monetary Unit GBP British Pound Sterling USD U.S. Dollar Note: Value for securities denominated in foreign currencies is shown in U.S. dollars. The date on options represents the expiration date of the option contract. The option contract may be exercised at any date on or before the date shown.

Note 1 – Organization and Significant Accounting Policies Organization. Calamos Long/Short Equity & Dynamic Income Trust (the “Fund”) was organized as a Delaware statutory trust on September 21, 2017 and is registered under the Investment Company Act of 1940 (the “1940 Act”) as a diversified, closed-end management investment company. The Fund commenced operations on November 29, 2019. Significant Accounting Policies. The Schedule of Investments has been prepared in conformity with accounting principles generally accepted in the United States of America (U.S. GAAP). The Fund is considered an investment company under U.S. GAAP and follows the accounting and reporting guidance applicable to investment companies. The following summarizes the significant accounting policies of the Fund: In March 2017, the Financial Accounting Standards Board ("FASB") issued ASU No. 2017-08, Receivables – Nonrefundable Fees and Other Costs (Subtopic 310-20): Premium Amortization on Purchased Callable Debt Securities ("ASU 2017-08"). ASU 2017-08 shortens the amortization period for certain callable debt securities held at a premium. The Fund adopted ASU2017-08 as of November 29, 2019, with no material impact on the Fund's Schedule of Investments. Fund Valuation. The valuation of the Fund's investments is in accordance with policies and procedures adopted by and under the ultimate supervision of the board of trustees.
Fund securities that are traded on U.S. securities exchanges, except option securities, are valued at the official closing price, which is the last current reported sales price on its principal exchange at the time each Fund determines its net asset value (“NAV”). Securities traded in the over-the-counter market and quoted on The NASDAQ Stock Market are valued at the NASDAQ Official Closing Price, as determined by NASDAQ, or lacking a NASDAQ Official Closing Price, the last current reported sale price on NASDAQ at the time the Fund determines its NAV. When a last sale or closing price is not available, equity securities, other than option securities, that are traded on a U.S. securities exchange and other equity securities traded in the over-the-counter market are valued at the mean between the most recent bid and asked quotations on its principal exchange in accordance with guidelines adopted by the board of trustees. Each option security traded on a U.S. securities exchange is valued at the mid-point of the consolidated bid/ask quote for the option security, also in accordance with guidelines adopted by the board of trustees. Each over-the-counter option that is not traded through the Options Clearing Corporation is valued either by an independent pricing agent approved by the board of trustees or based on a quotation provided by the counterparty to such option under the ultimate supervision of the board of trustees.
Fixed income securities, bank loans, certain convertible preferred securities, and non-exchange traded derivatives are normally valued by independent pricing services or by dealers or brokers who make markets in such securities. Valuations of such fixed income securities, bank loans, certain convertible preferred securities, and non-exchange traded derivatives consider yield or price of equivalent securities of comparable quality, coupon rate, maturity, type of issue, trading characteristics and other market data and do not rely exclusively upon exchange or over-the-counter prices.
Trading on European and Far Eastern exchanges and over-the-counter markets is typically completed at various times before the close of business on each day on which the New York Stock Exchange (“NYSE”) is open. Each security trading on these exchanges or in over-the-counter markets may be valued utilizing a systematic fair valuation model provided by an independent pricing service approved by the board of trustees. The valuation of each security that meets certain criteria in relation to the valuation model is systematically adjusted to reflect the impact of movement in the U.S. market after the foreign markets close. Securities that do not meet the criteria, or that are principally traded in other foreign markets, are valued as of the last reported sale price at the time the Fund determines its NAV, or when reliable market prices or quotations are not readily available, at the mean between the most recent bid and asked quotations as of the close of the appropriate exchange or other designated time. Trading of foreign securities may not take place on every NYSE business day. In addition, trading may take place in various foreign markets on Saturdays or on other days when the NYSE is not open and on which the Fund's NAV is not calculated.
If the pricing committee determines that the valuation of a security in accordance with the methods described above is not reflective of a fair value for such security, the security is valued at a fair value by the pricing committee, under the ultimate supervision of the board of trustees, following the guidelines and/or procedures adopted by the board of trustees.
The Fund also may use fair value pricing, pursuant to guidelines adopted by the board of trustees and under the ultimate supervision of the board of trustees, if trading in the security is halted or if the value of a security it holds is materially affected by events occurring before the Fund's pricing time but after the close of the primary market or exchange on which the security is listed. Those procedures may utilize valuations furnished by pricing services approved by the board of trustees, which may be based on market transactions for comparable securities and various relationships between securities that are generally recognized by institutional traders, a computerized matrix system, or appraisals derived from information concerning the securities or similar securities received from recognized dealers in those securities.
When fair value pricing of securities is employed, the prices of securities used by a Fund to calculate its NAV may differ from market quotations or official closing prices. There can be no assurance that the Fund could purchase or sell a portfolio security at the price used to calculate the Fund’s net asset value (“NAV”). Foreign Currency Translation. Values of investments and other assets and liabilities denominated in foreign currencies are translated into U.S. dollars using a rate quoted by a major bank or dealer in the particular currency market, as reported by a recognized quotation dissemination service. Option Transactions. For hedging and investment purposes, the Fund may purchase or write (sell) put and call options. One of the risks associated with purchasing an option is that the Fund pays a premium whether or not the option is exercised. Additionally, the Fund bears the risk of loss of premium and change in value should the counterparty not perform under the contract. The Fund as writer of an option bears the market risk of an unfavorable change in the price of the security underlying the written option. Note 2 – Investments The cost basis of investments for federal income tax purposes at July 31, 2021 was as follows*: Cost basis of investments $347,784,553 Gross unrealized appreciation 31,894,727
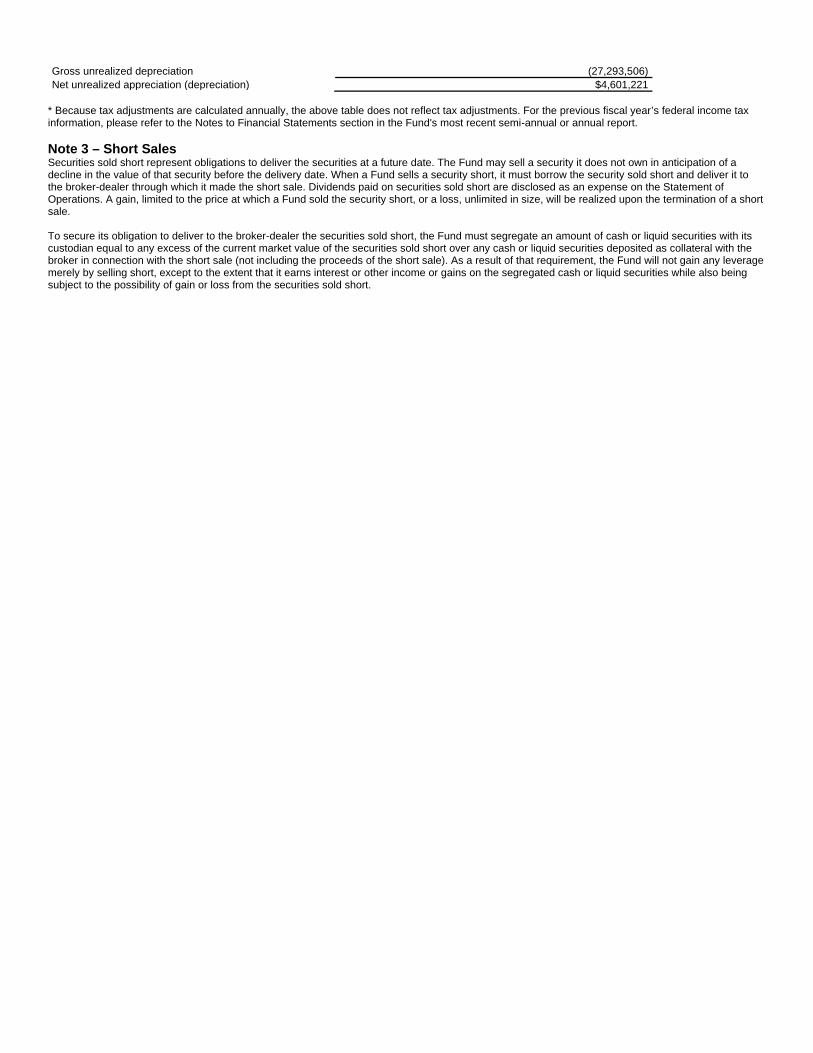
Gross unrealized depreciation (27,293,506) Net unrealized appreciation (depreciation) $4,601,221
* Because tax adjustments are calculated annually, the above table does not reflect tax adjustments. For the previous fiscal year’s federal income tax information, please refer to the Notes to Financial Statements section in the Fund's most recent semi-annual or annual report. Note 3 – Short Sales Securities sold short represent obligations to deliver the securities at a future date. The Fund may sell a security it does not own in anticipation of a decline in the value of that security before the delivery date. When a Fund sells a security short, it must borrow the security sold short and deliver it to the broker-dealer through which it made the short sale. Dividends paid on securities sold short are disclosed as an expense on the Statement of Operations. A gain, limited to the price at which a Fund sold the security short, or a loss, unlimited in size, will be realized upon the termination of a short sale. To secure its obligation to deliver to the broker-dealer the securities sold short, the Fund must segregate an amount of cash or liquid securities with its custodian equal to any excess of the current market value of the securities sold short over any cash or liquid securities deposited as collateral with the broker in connection with the short sale (not including the proceeds of the short sale). As a result of that requirement, the Fund will not gain any leverage merely by selling short, except to the extent that it earns interest or other income or gains on the segregated cash or liquid securities while also being subject to the possibility of gain or loss from the securities sold short.
Related Documents


![03.31.20- Calamos Domestic Portfolio Holdings Report · 2020-05-01 · ì ï l ï í l î ì o u } D l E µ o / v } u & µ v s ] Ì } v } u u µ v ] ] } v U / v Xs h^ } u u } v ^](https://static.cupdf.com/doc/110x72/5f10b1c17e708231d44a5d8d/033120-calamos-domestic-portfolio-holdings-report-2020-05-01-l-.jpg)


