Page 1 of 1 CAL POLY POMONA FOUNDATION, INC. CALIFORNIA STATE POLYTECHNIC UNIVERSITY, POMONA Meeting of the Board of Directors, Number 369 November 29, 2016 at 2 pm Kellogg West Conference Center and Hotel-Garden Vista Room AGENDA ANNUAL MEETING Roll Call Page I. PRESIDENT’S REPORT Soraya Coley, President II ACKNOWLEDGEMENT OF MEMBERS OF THE PUBLIC who may or may not be commenting on a specific item or making a general comment. III. CONSENSUS ACTION ITEMS Consensus Items: Items in this section are considered to be routine and acted on by the committee in one motion. Each item of the Consent agenda approved by the committee shall be deemed to have been considered in full and adopted as recommended. Any committee member may request that a consent item be removed from the consent agenda to be considered as a separate action item. If no additional information is requested, the approval vote will be taken without discussion. An “A” distinguishes items requiring approval. A. Reading of Minutes 368 (10/04/16) Soraya Coley 1 - 4 (ATTACHMENT 369-III-A) A Board Chair IV. ACTION ITEMS A. Capital Project Requests G. Paul Storey -Facilities Vehicle Replacement Executive Director 5 -CTTi Brew Works HVAC Upgrade 6 - 7 -Starbucks Kiosk at SCE 8 (ATTACHMENT 369-IV-A) B. Investment Report 1st h Quarter 2016-17 David Prenovost 9 - 94 (ATTACHMENT 369-IV-B) Senior Manager/CFO C. 2015-2016 Tax Return Review David Prenovost 95 (ATTACHMENT 369-IV-C) Senior Manager/CFO V. DISCUSSION ITEMS VI. INFORMATION ITEMS The following items provide information and reports by management staff to the committee. Staff and committee may engage in discussion on any item if requested by committee member or staff member. A. Financial Highlights 1 st Q - FY 2016-17 David Prenovost 96 - 107 B. Annual Risk Management/Insurance Report David Prenovost / 108 - 140 Dennis Miller C. Capital Projects Update G. Paul Storey 141 - 150 D. P-Card Review David Prenovost 151 - 172 E. Best Practices-Shared Services with other AOAs G. Paul Storey 173 F. Executive Director’s Report G. Paul Storey (ATTACHMENT 368-VII-D) Executive Director VII. DIRECTORS OPEN FORUM

Welcome message from author
This document is posted to help you gain knowledge. Please leave a comment to let me know what you think about it! Share it to your friends and learn new things together.
Transcript

Page 1 of 1
CAL POLY POMONA FOUNDATION, INC. CALIFORNIA STATE POLYTECHNIC UNIVERSITY, POMONA
Meeting of the Board of Directors, Number 369
November 29, 2016 at 2 pm Kellogg West Conference Center and Hotel-Garden Vista Room
AGENDA
ANNUAL MEETING Roll Call Page
I. PRESIDENT’S REPORT Soraya Coley, President
II ACKNOWLEDGEMENT OF MEMBERS OF THE PUBLIC who may or may not be commenting on a specific item or making a general comment. III. CONSENSUS ACTION ITEMS
Consensus Items: Items in this section are considered to be routine and acted on by the committee in one motion. Each item of the Consent agenda approved by the committee shall be deemed to have been considered in full and adopted as recommended. Any committee member may request that a consent item be removed from the consent agenda to be considered as a separate action item. If no additional information is requested, the approval vote will be taken without discussion. An “A” distinguishes items requiring approval.
A. Reading of Minutes 368 (10/04/16) Soraya Coley 1 - 4 (ATTACHMENT 369-III-A) A Board Chair
IV. ACTION ITEMS
A. Capital Project Requests G. Paul Storey -Facilities Vehicle Replacement Executive Director 5 -CTTi Brew Works HVAC Upgrade 6 - 7 -Starbucks Kiosk at SCE 8 (ATTACHMENT 369-IV-A)
B. Investment Report 1sth Quarter 2016-17 David Prenovost 9 - 94
(ATTACHMENT 369-IV-B) Senior Manager/CFO
C. 2015-2016 Tax Return Review David Prenovost 95 (ATTACHMENT 369-IV-C) Senior Manager/CFO V. DISCUSSION ITEMS VI. INFORMATION ITEMS
The following items provide information and reports by management staff to the committee. Staff and committee may engage in discussion on any item if requested by committee member or staff member.
A. Financial Highlights 1st Q - FY 2016-17 David Prenovost 96 - 107
B. Annual Risk Management/Insurance Report David Prenovost / 108 - 140
Dennis Miller
C. Capital Projects Update G. Paul Storey 141 - 150
D. P-Card Review David Prenovost 151 - 172
E. Best Practices-Shared Services with other AOAs G. Paul Storey 173 F. Executive Director’s Report G. Paul Storey (ATTACHMENT 368-VII-D) Executive Director VII. DIRECTORS OPEN FORUM

1

2
3

4

,dMemorandum
Date
To
November 17 . 2016
Board of DirectorsCal Poly Pomona Foundation, lnc
CdhlyPmmrFoundation
c. eaut sto&y
The Cal Poly Pomona Foundation's Central Facilities is requesting a capital budget amount of$20,000 to replace a vehicle. Unfortunately, one of the vehicles planned for replacement in2017-1 8 has reached the very end of its service life and has been scrapped.
the 2016-2017 capital improvement budget approved by the Board included $1,797,990 fornew capital improvement requests, and 9314,750 in capital improvement carry forward fromprior years. lf approved, the capital improvement budget will be amended to include thisrequested amount.
The following resolution is recommended for approval by the program and FinanceCommittees:
RESOLVED, the Cal Poly Pomona Foundation Board of Directors approves a capital budgetrequest of $20,000 for the purchase of one vehicle for the Central Facilities function.
Now, THEREFoRE, the Board of Directors approves the capital budget request for g2o,ooo for thepurchase of one vehicle for the Central Facilities funcation.
FromExecutive Director
Subject: 2016-2017 Budget Amendment Request for Central Facilities
PASSED AND ADOPTED THIS 29th DAY OF NOVEMBER 2016.
By:Mr cGuthry, Secretary
of Directors
5

dMemorandum
Date November 17 ,2016
To Board of DirectorsCal Poly Pomona Foundation, lnc
By:Mr. J ry ecretary
CdhUPlmrtoundation
FromExecutive Director
S u bject 2016-20'17 Budget Amendment Foundation Real Estate- HVAC WorkBuilding 220A @ CTTI
The cal Poly Pomona Foundation's Real Estate Division is requesting an additional capital
budget amount of $200,800 at the center for Training, Technology, and lnnovation (cTTl). -
We-have found that the capacity of the current system is insufficient to ensure the comfort of our
staff, guests, faculty, and students and reconfiguration will assist in compliance with regulations
regarding indoor air quality and temperature.
A complete HVAC Assessment for Building A at CTT| (3650 W. Temple Avenue) was done by
consuliing engineers, C&J Technical Solutions and Services, lnc., in August of 2016'
c.Pautstod
The following resolution is recommended for approval by the Finance and Program
Committees:
RESOLVED, the Cal Poly Pomona Foundation Board of Directors approves a capital budget
amendment request of gi00,800 for the reconfiguration of the HVAC system in building 2204 at
CTTI.
U
of Directors
6
PASSED AND ADOPTED THIS 29th DAY OF NOVEMBER 2O'I6.

7

dMemorandum
Date
To
CdP$PmmtFoundation
a.eautxofrFrom
Subject
Executive Director
2015-2017 Budget Amendment Foundation Dining Services -SCE Coffee Shop
PASSED AND ADOPTED THIS 29' DAY OF NOVEMBER 2016.
By:
Mr. Jo ry ec ry
. Starbuck's Branded - Hot Beverage/Espresso service
. Starbuck's Branded - Blended/chilled beverage serviceo "Grab and Go" pre-packaged food, snack, and beverage serviceo Catering services including coffee/food service delivery
Foundation desires to provide this service, and would like to partner with SCE by investing up to
$zs,ooo towaro equipment and startup costs for this venture. SCE is would provide build-out
and infrastructure for Foundation-provided equipment.
Southern california Edison would like an approximately 530 square foot starbuck's beverage
coffee/food service venue for their employees on the first floor at the Southern California Edison
building located at 2 lnnovation Way.
The proiect is intended to meet the following programmatic functions:
The following resolution is recommended for approval by the Finance and Program
Committees:
RESOLVED, the cal Poly Pomona Foundation Board of Directors approves a capital budget
amendment request of $75,000 for the SCE Coffee Shop project.
U
B Directors
8
November 1 7, 2016
Board of DirectorsCal Poly Pomona Foundation, lnc.
,AMemorandum
Date November 17 .2016 Gf hilPrrtFounilrtlon
Board of DirectorsCal Poly Pomona Fougflation, lnc
David F. ,6dr?/,*ASenior Managing Director/CFO
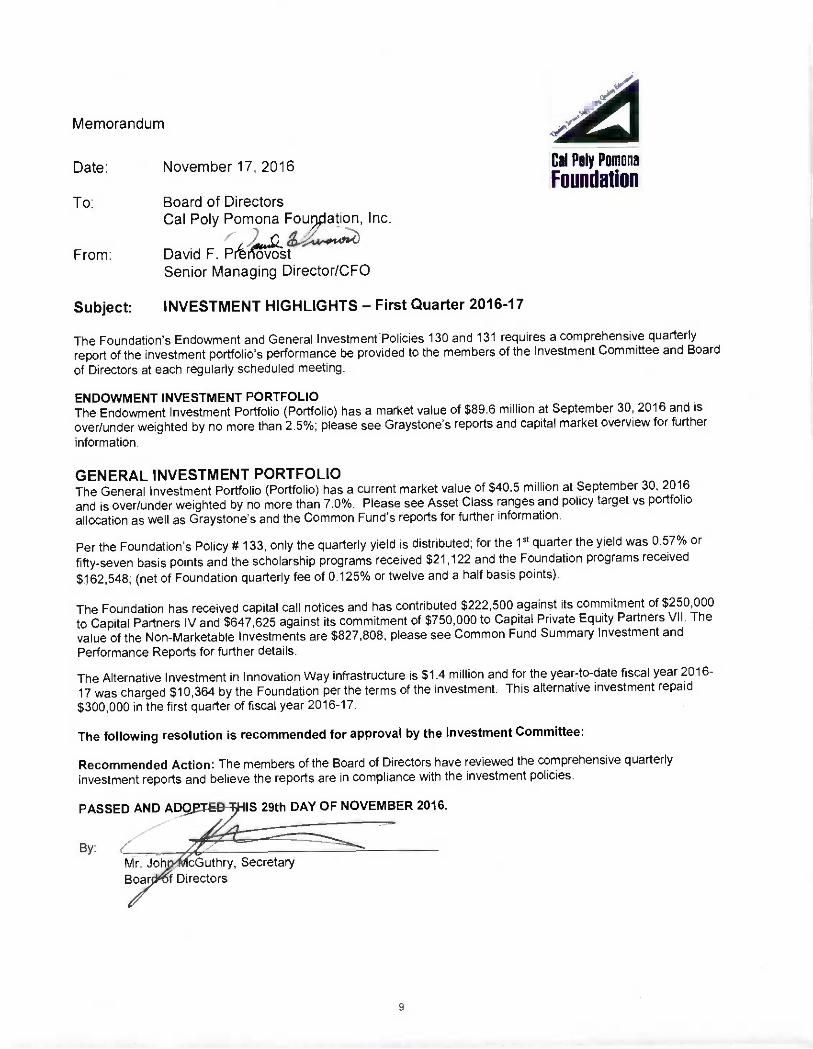
subject: INVESTMENT HIGHLIGHTS - First Quarter 2016-17
The Foundation's Endowment and General lnvestment Policies 't30 and 131 requires a comprehensive quarterly
|."port oi tt "
inr""tment portfolio's performance be provided to the members of the lnvestment committee and Board
of Directors at each regularly scheduled meeting.
ENDOWMENT INVESTMENT PORTFOLIOThe Endowment lnvestment Portfolio (Portfolio) has a market value of $89.6 million at september 30, 2016 and is
over/under weighted by no more than ).5%; please see Graystone's reports and capital market overview for further
information.
GENERAL INVESTMENT PORTFOLIOThe General lnvestment Portfolio (Portfolio) has a current market value of $40.5 million at september 30, 2016
anJ is over/under weighted by no more than 7.ool0. Please see Asset Class ranges and policy target vs portfolio
illocation as well as G'raystone's and the Common Fund's reports for further information.
Per the Foundation's Policy # 133, only the quarterly yield is distributedi for the 1"r quarter the yield was 0 57% or
flfty-seven basis points and the scholaiship programs received $21322 and lhe Foundation programs received
$1-62,548, (net of Foundation quarterly fee of 0.125olo or twelve and a half basis points)'
The Foundation has received capital calt notices and has contributed $222,500 against its commitment of $250'000
to C"pir"iF"rt*r. iV and $647,b25 against its commitment of $750,000 to Capital Private Equity Partners Vll' The
value of the Non-Marketable lnvestmeits are $827,808, please see Common Fund Summary lnvestment and
Performance Reports for further details.
The Alternative lnvestment in lnnovation Way infrastructure is 91.4 million and for the year-to-date fiscal yeat 2016-
17 was charged $10,364 by the Foundation per the terms of the investment. This alternative investment repaid
$3OO,OOO in the flrst quarter of fiscal yeat 2016-17.
The following resolution is recommended for approval by the lnvestment committee:
Recommended Action: The members ofthe Board of Directors have reviewed the comprehensive quarterly
investment reports and believe the reports are in compliance with the investment polacies
PASSEO AND AOOPT IS 29th DAY OF NOVEMBER 2016
Mr. J bGuthry, Secretary
9
Boa Directors
To:
From:
By:
Capital Markets CommentaryGLOBAL INVESTMENT COMMITTEE
Quarterly Review 3Q 2016
10

WEALTH MANAGEMENT INVESTMENT RESOURCES | CHARTBOOK | QUARTERLY REVIEW
Past performance is no guarantee of future results. Estimates of future performance are based on assumptions that may not be realized. This material is not a solicitation of any offer to buy or sell any security or other financial instrument or to participate in any trading strategy. Please refer to important information, disclosures and qualifications at the end of this material.
Capital Markets Overview: 3Q 2016
• Risk markets emerged from June’s historic Brexit vote with a vengeance, surging to new highs in the beginning of July and holding those gains throughthe end of the third quarter. Japanese and emerging market equities were the top performers across asset classes, registering returns more thandouble that of the S&P 500. The laggards for the quarter included commodities and managed futures. For the one-year period ended September 30,2016, global REITs and emerging market debt and equities generated the strongest returns.
• With a relatively quiet third quarter, the market is now gearing up for the uncertainty that the US Presidential election and the US Federal Reservemeeting may bring. While there may be some short-term market volatility surrounding these events, the GIC does not believe they will derail the gainsrisk markets have made year to date. The GIC puts a December Fed rate hike on the table, as they continue to monitor inflation expectations and labormarket conditions.
The Dow Jones Industrial Average increased 2.8% in the third quarter. The NASDAQ Composite Index was up 10.0% for the quarter. The S&P 500Index increased 3.9% for the quarter.
Seven of the 11 sectors within the S&P 500 generated positive returns in the third quarter of 2016. The top-performing sector was Technology, whichwas up 12.9%. Financials rose 4.6% and was also among the top-performing sectors. The biggest laggards were Utilities, which decreased 5.9%, andTelecom, which fell 5.6%.
The bond market registered positive returns during the third quarter. The Barclays U.S. Aggregate Bond Index, a general measure of the bond market,increased 0.5% for the quarter.
Morgan Stanley & Co. economists expect U.S. real GDP will be 1.7% in 2016 and 1.5% in 2017. They forecast global GDP growth to be 2.9% in 2016 and3.2% in 2017.
After posting strong second quarter returns, Commodities registered negative returns in the third quarter; the Bloomberg Commodity Indexdecreased 3.9%.
For the third quarter of 2016, global mergers and acquisitions (M&A) deal volume was $813 billion, compared to $835 billion for the second quarter of2016. Global M&A activity increased to $4.3 trillion in 2015 from $3.3 trillion in 2014.
Introduction As of 3Q 2016
Source: FactSet, Bloomberg, Morgan Stanley & Co. Research, Morgan Stanley Wealth Management GIC
11
Presenter
Presentation Notes
{title}:QuarterlyReview003:

WEALTH MANAGEMENT INVESTMENT RESOURCES | CHARTBOOK | QUARTERLY REVIEW
Past performance is no guarantee of future results. Estimates of future performance are based on assumptions that may not be realized. This material is not a solicitation of any offer to buy or sell any security or other financial instrument or to participate in any trading strategy. Please refer to important information, disclosures and qualifications at the end of this material.
Citi US Economic Surprise Index
Conference Board Leading Economic Indicator Index
85
95
105
115
125
135
2000 2002 2004 2006 2008 2010 2012 2014 2016
LEI Index
-5
-120-100
-80-60-40-20
020406080
100
2010 2011 2012 2013 2014 2015 2016
Econ
omic
Rel
ease
s vs
. Co
nsen
sus
2.5%
$18.5
$6
$10
$14
$18
$22
-4%
-2%
0%
2%
4%
6%
8%
1995 1997 1999 2001 2003 2005 2007 2009 2011 2013 2015Year-over-Year Growth (left axis) US Nominal GDP (right axis)
Trillions of US Dollars as of 2Q 2016
104.191.2
20
50
80
110
140
170
1978 1983 1988 1993 1998 2003 2008 2013
Conference Board University of Michigan
As of August 31, 2016.
US Economy Slowly Improving
Source: Bloomberg, Citigroup, FactSet, University of Michigan, Conference Board. (1) Nominal GDP does not account for the effects of inflation.
Consumer Confidence
US Nominal GDP1
Data is better than expected
Data is worse than expected
As of September 30, 2016
One month lag in data availability. As of September 30, 2016
12
Presenter
Presentation Notes
{title}:QuarterlyReview005:
WEALTH MANAGEMENT INVESTMENT RESOURCES | CHARTBOOK | QUARTERLY REVIEW
Past performance is no guarantee of future results. Estimates of future performance are based on assumptions that may not be realized. This material is not a solicitation of any offer to buy or sell any security or other financial instrument or to participate in any trading strategy. Please refer to important information, disclosures and qualifications at the end of this material.
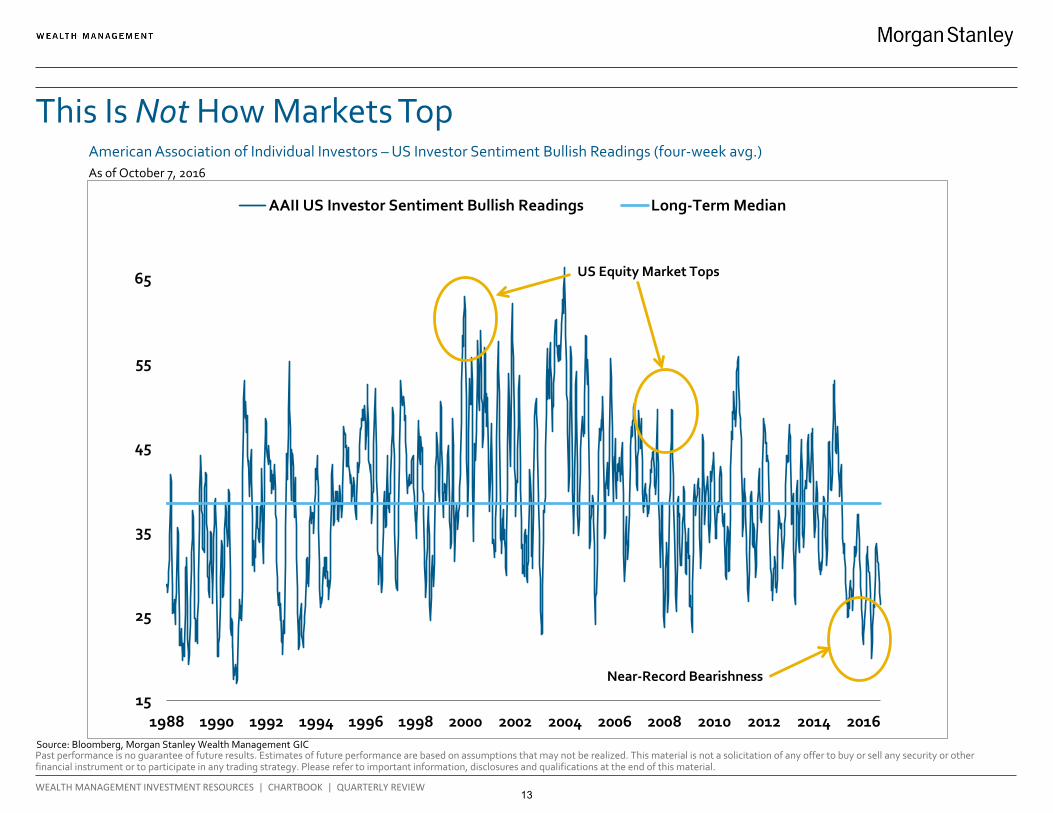
This Is Not How Markets Top
Source: Bloomberg, Morgan Stanley Wealth Management GIC
American Association of Individual Investors – US Investor Sentiment Bullish Readings (four-week avg.) As of October 7, 2016
15
25
35
45
55
65
1988 1990 1992 1994 1996 1998 2000 2002 2004 2006 2008 2010 2012 2014 2016
AAII US Investor Sentiment Bullish Readings Long-Term Median
US Equity Market Tops
Near-Record Bearishness
13
Presenter
Presentation Notes
{title}:QuarterlyReview010:

WEALTH MANAGEMENT INVESTMENT RESOURCES | CHARTBOOK | QUARTERLY REVIEW
Past performance is no guarantee of future results. Estimates of future performance are based on assumptions that may not be realized. This material is not a solicitation of any offer to buy or sell any security or other financial instrument or to participate in any trading strategy. Please refer to important information, disclosures and qualifications at the end of this material.
Region and US Sector Year-to-Date Equity Performance
S&P 500 Sectors – YTD Total Returns
YTD Total Return
Source: Bloomberg, Morgan Stanley Wealth Management GIC
18.7%17.9%
16.1%
12.5%11.4%10.9%
7.6%8.2%
3.6%
1.4%1.4%
0%
2%
4%
6%
8%
10%
12%
14%
16%
18%
20%
Energy
Telecom
Utilities
Technology
Materials
Industrials
Staples
Real Estate
Discretionary
Financials
Health Care
63.3%
32.8%
22.7%
13.4%12.2%7.8%7.6% 7.5% 5.7%
3.6%
-0.4%-1.4%-8%-4%0%4%8%
12%16%20%24%28%32%36%40%44%48%52%56%60%64%68%
MSCI B
razil IMI
MSCI R
ussia IMI
MSCI Canada IM
I
MSCI A
ustralia IMI
MSCI P
acific ex Japan IMI
S&P
500
MSCI India IM
I
MSCI China IM
I
MSCI Europe IM
I
MSCI Japan IM
I
MSCI U
K IM
I
MSCI M
exico IMI
As of September 30, 2016 As of September 30, 2016
14
Presenter
Presentation Notes
{title}:QuarterlyReview018:

WEALTH MANAGEMENT INVESTMENT RESOURCES | CHARTBOOK | QUARTERLY REVIEW
Past performance is no guarantee of future results. Estimates of future performance are based on assumptions that may not be realized. This material is not a solicitation of any offer to buy or sell any security or other financial instrument or to participate in any trading strategy. Please refer to important information, disclosures and qualifications at the end of this material.
12.9%
4.6%
4.1%
3.7%
2.9%
2.3%
0.9%
-2.1%
-2.6%
-5.6%
-5.9%
-10% -5% 0% 5% 10% 15%
Technology
Financials
Industrials
Materials
Discretionary
Energy
Health Care
Real Estate
Staples
Telecom
Utilities
As of September 30, 2016
S&P 500 Sectors
Source: Bloomberg
3Q 2016 Total Return
15
Presenter
Presentation Notes
{title}:QuarterlyReview019:
WEALTH MANAGEMENT INVESTMENT RESOURCES | CHARTBOOK | QUARTERLY REVIEW
Past performance is no guarantee of future results. Estimates of future performance are based on assumptions that may not be realized. This material is not a solicitation of any offer to buy or sell any security or other financial instrument or to participate in any trading strategy. Please refer to important information, disclosures and qualifications at the end of this material.
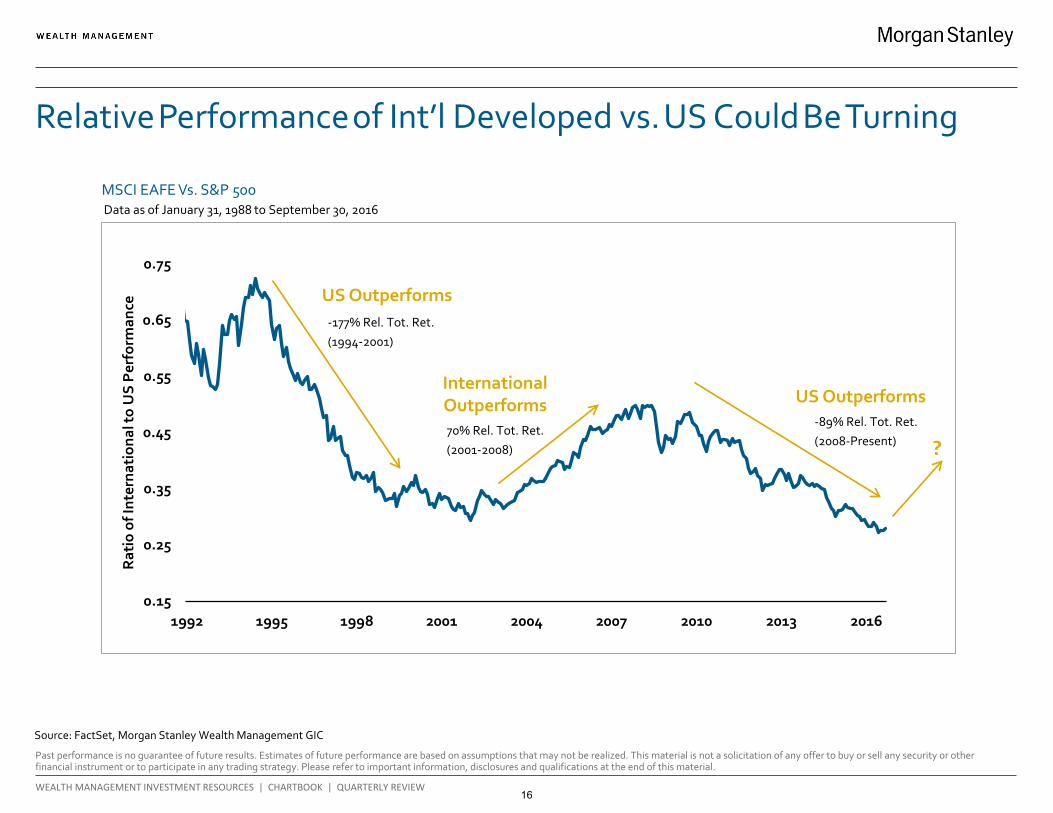
MSCI EAFE Vs. S&P 500
0.15
0.25
0.35
0.45
0.55
0.65
0.75
1992 1995 1998 2001 2004 2007 2010 2013 2016
Rat
io o
f Int
erna
tion
al to
US
Per
form
ance
Relative Performance of Int’l Developed vs. US Could Be Turning
Source: FactSet, Morgan Stanley Wealth Management GIC
US Outperforms
International Outperforms US Outperforms
?
-177% Rel. Tot. Ret.(1994-2001)
70% Rel. Tot. Ret.(2001-2008)
-89% Rel. Tot. Ret.(2008-Present)
Data as of January 31, 1988 to September 30, 2016
16
Presenter
Presentation Notes
{title}:QuarterlyReview027:

WEALTH MANAGEMENT INVESTMENT RESOURCES | CHARTBOOK | QUARTERLY REVIEW
Past performance is no guarantee of future results. Estimates of future performance are based on assumptions that may not be realized. This material is not a solicitation of any offer to buy or sell any security or other financial instrument or to participate in any trading strategy. Please refer to important information, disclosures and qualifications at the end of this material.
0.5
1.0
1.5
2.0
2.5
3.0
3.5
4.0
1988 1991 1994 1997 2000 2003 2006 2009 2012 2015
MSCI EM Vs. MSCI ACWI Total Return Index Level
MSCI Emerging Market Equities Relative Performance As of September 30, 2016
Emerging Markets Have Underperformed Dramatically, but Have Started to Turn the Corner
81 Months +454%
52 Months -135%
140 Months +351%
63 Months -66%
Source: FactSet, Morgan Stanley Wealth Management GIC
11 Months +9%
17
Presenter
Presentation Notes
{title}:QuarterlyReview028:
WEALTH MANAGEMENT INVESTMENT RESOURCES | CHARTBOOK | QUARTERLY REVIEW
Past performance is no guarantee of future results. Estimates of future performance are based on assumptions that may not be realized. This material is not a solicitation of any offer to buy or sell any security or other financial instrument or to participate in any trading strategy. Please refer to important information, disclosures and qualifications at the end of this material.
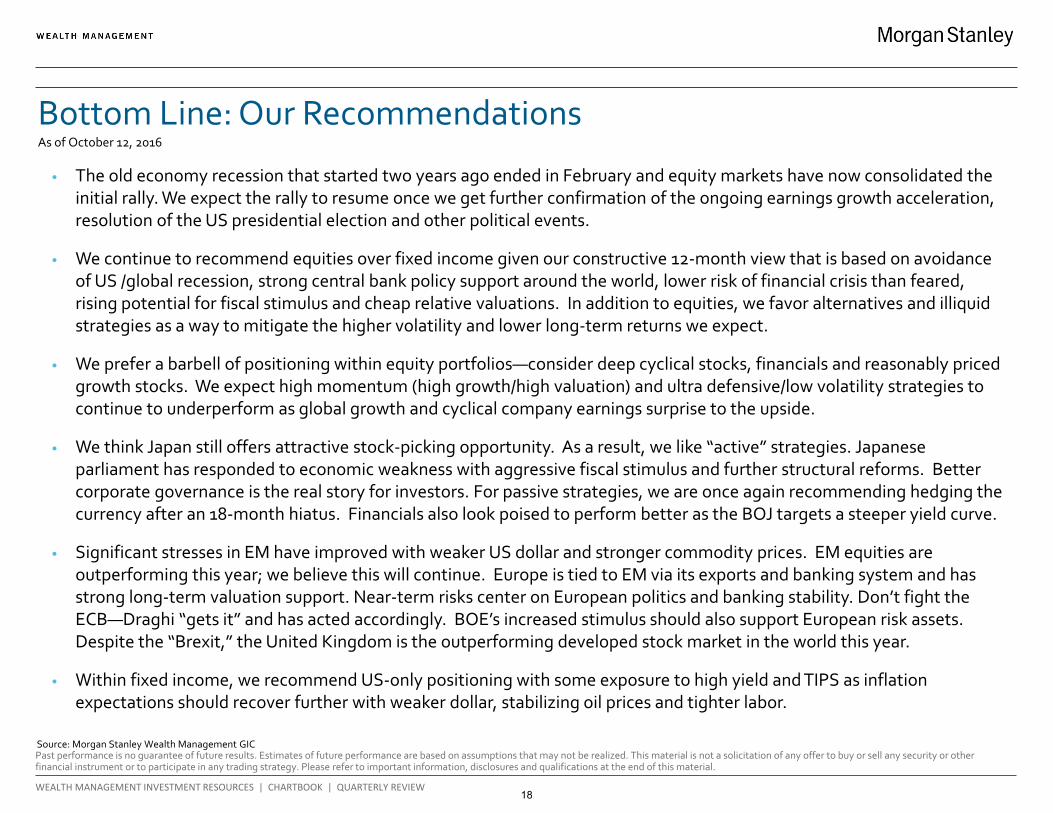
Bottom Line: Our Recommendations As of October 12, 2016
Source: Morgan Stanley Wealth Management GIC
• The old economy recession that started two years ago ended in February and equity markets have now consolidated theinitial rally. We expect the rally to resume once we get further confirmation of the ongoing earnings growth acceleration,resolution of the US presidential election and other political events.
• We continue to recommend equities over fixed income given our constructive 12-month view that is based on avoidanceof US /global recession, strong central bank policy support around the world, lower risk of financial crisis than feared,rising potential for fiscal stimulus and cheap relative valuations. In addition to equities, we favor alternatives and illiquidstrategies as a way to mitigate the higher volatility and lower long-term returns we expect.
• We prefer a barbell of positioning within equity portfolios—consider deep cyclical stocks, financials and reasonably pricedgrowth stocks. We expect high momentum (high growth/high valuation) and ultra defensive/low volatility strategies tocontinue to underperform as global growth and cyclical company earnings surprise to the upside.
• We think Japan still offers attractive stock-picking opportunity. As a result, we like “active” strategies. Japaneseparliament has responded to economic weakness with aggressive fiscal stimulus and further structural reforms. Bettercorporate governance is the real story for investors. For passive strategies, we are once again recommending hedging thecurrency after an 18-month hiatus. Financials also look poised to perform better as the BOJ targets a steeper yield curve.
• Significant stresses in EM have improved with weaker US dollar and stronger commodity prices. EM equities areoutperforming this year; we believe this will continue. Europe is tied to EM via its exports and banking system and hasstrong long-term valuation support. Near-term risks center on European politics and banking stability. Don’t fight theECB—Draghi “gets it” and has acted accordingly. BOE’s increased stimulus should also support European risk assets.Despite the “Brexit,” the United Kingdom is the outperforming developed stock market in the world this year.
• Within fixed income, we recommend US-only positioning with some exposure to high yield and TIPS as inflationexpectations should recover further with weaker dollar, stabilizing oil prices and tighter labor.
18
Presenter
Presentation Notes
{title}:QuarterlyReview057:
Morgan Stanley Wealth Management is the trade name of Morgan Stanley Smith Barney LLC, a registered broker-dealer in the United States. The sole purpose of this material is to inform, and it in no way is intended to be an offer or solicitation to purchase or sell any security, other investment or service, or to attract any funds or deposits . Investments mentioned may not be suitable for all clients. Any product discussed herein may be purchased only after a client has carefully reviewed the offering memorandum and executed the subscription documents. Morgan Stanley Wealth Management has not considered the actual or desired investment objectives, goals, strategies, guidelines, or factual circumstances of any investor in any fund(s). Before making any investment, each investor should carefully consider the risks associated with the investment, as discussed in the applicable offering memorandum, and make a determination based upon their own particular circumstances, that the investment is consistent with their investment objectives and risk tolerance . Morgan Stanley Smith Barney LLC offers investment program services through a variety of investment programs, which are opened pursuant to written client agreements. Each program offers investment managers, funds and features that are not available in other programs; conversely, some investment managers, funds or investment strategies may be available in more than one program.Morgan Stanley’s investment advisory programs may require a minimum asset level and, depending on your specific investment objectives and financial position, may not be suitable for you . Please see the Morgan Stanley Smith Barney LLC program disclosure brochure (the “Morgan Stanley ADV”) for more information in the investment advisory programs available. The Morgan Stanley ADV is available at www.morganstanley.com/ADV. Sources of Data. Information in this material in this report has been obtained from sources that we believe to be reliable, but we do not guarantee its accuracy, completeness or timeliness. Third-party data providers make no warranties or representations relating to the accuracy, completeness or timeliness of the data they provide and are not liable for any damages relating to this data. All opinions included in this material constitute the Firm’s judgment as of the date of this material and are subject to change without notice . This material was not prepared by the research departments of Morgan Stanley & Co. LLC or Morgan Stanley Smith Barney LLC. Some historical figures may be revised due to newly identified programs, firm restatements, etc.Global Investment Manager Analysis (GIMA) Focus List, Approved List and Tactical Opportunities List; Watch Policy. GIMA uses two methods to evaluate investment products in applicable advisory programs: Focus (and investment products meeting this standard are described as being on the Focus List) and Approved (and investment products meeting this standard are described as being on the Approved List). In general, Focus entails a more thorough evaluation of an investment product than Approved. Sometimes an investment product may be evaluated using the Focus List process but then placed on the Approved List instead of the Focus List. Investment products may move from the Focus List to the Approved List, or vice versa. GIMA may also determine that an investment product no longer meets the criteria under either process and will no longer be recommended in investment advisory programs (in which case the investment product is given a “Not Approved” status). GIMA has a ‘Watch” policy and may describe a Focus List or Approved List investment product as being on “Watch” if GIMA identifies specific areas that (a) merit further evaluation by GIMA and (b) may, but are not certain to, result in the investment product becoming “Not Approved.” The Watch period depends on the length of time needed for GIMA to conduct its evaluation and for the investment manager or fund to address any concerns. Certain investment products on either the Focus List or Approved List may also be recommended for the Tactical Opportunities List based in part on tactical opportunities existing at a given time. The investment products on the Tactical Opportunities List change over time. For more information on the Focus List, Approved List, Tactical Opportunities List and Watch processes, please see the applicable Form ADV Disclosure Document for Morgan Stanley Wealth Management . Your Financial Advisor or Private Wealth Advisor can also provide upon request a copy of a publication entitled “Manager Selection Process”.The Global Investment Committee is a group of seasoned investment professionals who meet regularly to discuss the global economy and markets. The committee determines the investment outlook that guides our advice to clients. They continually monitor developing economic and market conditions, review tactical outlooks and recommend model portfolio weightings, as well as produce a suite of strategy, analysis, commentary, portfolio positioning suggestions and other reports and broadcasts.The Global Investment Manager Analysis (GIMA) Services Only Apply to Certain Investment Advisory Programs GIMA evaluates certain investment products for the purposes of some – but not all – of Morgan Stanley Smith Barney LLC’s investment advisory programs (as described in more detail in the applicable Form ADV Disclosure Document for Morgan Stanley Wealth Management). If you do not invest through one of these investment advisory programs, Morgan Stanley Wealth Management is not obligated to provide you notice of any GIMA Status changes even though it may give notice to clients in other programs.Strategy May Be Available as a Separately Managed Account or Mutual Fund Strategies are sometimes available in Morgan Stanley Wealth Management investment advisory programs both in the form of a separately managed account (“SMA”) and a mutual fund. These may have different expenses and investment minimums. Your Financial Advisor or Private Wealth Advisor can provide more information on whether any particular strategy is available in more than one form in a particular investment advisory program. In most Morgan Stanley Wealth Management investment advisory accounts, fees are deducted quarterly and have a compounding effect on performance. For example, on an advisory account with a 3% annual fee, if the gross annual performance is 6.00%, the compounding effect of the fees will result in a net performance of approximately 3.93% after one year, 1 after three years, and 21.23% after five years. Conflicts of Interest: GIMA’s goal is to provide professional, objective evaluations in support of the Morgan Stanley Wealth Management investment advisory programs. We have policies and procedures to help us meet this goal. However, our business is subject to various conflicts of interest. For example, ideas and suggestions for which investment products should be evaluated by GIMA come from a variety of sources, including our Morgan Stanley Wealth Management Financial Advisors and their direct or indirect managers, and other business persons within Morgan Stanley Wealth Management or its affiliates. Such persons may have an ongoing business relationship with certain investment managers or mutual fund companies whereby they, Morgan Stanley Wealth Management or its affiliates receive compensation from, or otherwise related to, those investment managers or mutual funds. For example, a Financial Advisor may suggest that GIMA evaluates an investment manager or fund in which a portion of his or her clients’ assets are already invested. While such a recommendation is permissible, GIMA is responsible for the opinions expressed by GIMA. See the conflicts of interest section in the applicable Form ADV Disclosure Document for Morgan Stanley Wealth Management for a discussion of other types of conflicts that may be relevant to GIMA’s evaluation of managers and funds. In addition, Morgan Stanley Wealth Management, MS & Co., managers and their affiliates provide a variety of services (including research, brokerage, asset management, trading, lending and investment banking services) for each other and for various clients, including issuers of securities that may be recommended for purchase or sale by clients or are otherwise held in client accounts, and managers in various advisory programs. Morgan Stanley Wealth Management, managers, MS & Co., and their affiliates receive compensation and fees in
DISCLOSURES
19

connection with these services. Morgan Stanley Wealth Management believes that the nature and range of clients to which such services are rendered is such that it would be inadvisable to exclude categorically all of these companies from an account.Consider Your Own Investment Needs: The model portfolios and strategies discussed in the material are formulated based on general client characteristics including risk tolerance . This material is not intended to be a client-specific suitability analysis or recommendation, or offer to participate in any investment. Therefore, clients should not use this profile as the sole basis for investment decisions. They should consider all relevant information, including their existing portfolio, investment objectives, risk tolerance, liquidity needs and investment time horizon . Such a suitability determination may lead to asset allocation results that are materially different from the asset allocation shown in this profile. Talk to your Financial Advisor about what would be a suitable asset allocation for you, whether CGCM is a suitable program for you.No obligation to notify – Morgan Stanley Wealth Management has no obligation to notify you when the model portfolios, strategies, or any other information, in this material changes.Please consider the investment objectives, risks, fees, and charges and expenses of mutual funds, ETFs, closed end funds, unit investment trusts, and variable insurance products carefully before investing. The prospectus contains this and other information about each fund. To obtain a prospectus, contact your Financial Advisor or Private Wealth Advisor or visit the Morgan Stanley website at www.morganstanley.com. Please read it carefully before investing.KEY ASSET CLASS CONSIDERATIONS AND OTHER RISKSInvesting in the markets entails the risk of market volatility. The value of all types of investments, including stocks, mutual funds, exchange-traded funds (“ETFs”), closed-end funds, and unit investment trusts, may increase or decrease over varying time periods. To the extent the investments depicted herein represent international securities, you should be aware that there may be additional risks associated with international investing, including foreign economic, political, monetary and/or legal factors, changing currency exchange rates, foreign taxes, and differences in financial and accounting standards. These risks may be magnified in emerging markets and frontier markets. Small- and mid-capitalization companies may lack the financial resources, product diversification and competitive strengths of larger companies. In addition, the securities of small- and mid-capitalization companies may not trade as readily as, and be subject to higher volatility than, those of larger, more established companies. The value of fixed income securities will fluctuate and, upon a sale, may be worth more or less than their original cost or maturity value. Bonds are subject to interest rate risk, call risk, reinvestment risk, liquidity risk, and credit risk of the issuer. High yield bonds are subject to additional risks such as increased risk of default and greater volatility because of the lower credit quality of the issues. In the case of municipal bonds, income is generally exempt from federal income taxes. Some income may be subject to state and local taxes and to the federal alternative minimum tax. Capital gains, if any, are subject to tax. Treasury Inflation Protection Securities’ (TIPS) coupon payments and underlying principal are automatically increased to compensate for inflation by tracking the consumer price index (CPI). While the real rate of return is guaranteed, TIPS tend to offer a low return . Because the return of TIPS is linked to inflation, TIPS may significantly underperform versus conventional U.S. Treasuries in times of low inflation. There is no guarantee that investors will receive par if TIPS are sold prior to maturity. The returns on a portfolio consisting primarily of environmental, social, and governance-aware investments (“ESG”) may be lower or higher than a portfolio that is more diversified or where decisions are based solely on investment considerations. Because ESG criteria exclude some investments, investors may not be able to take advantage of the same opportunities or market trends as investors that do not use such criteria. The companies identified and investment examples are for illustrative purposes only and should not be deemed a recommendation to purchase, hold or sell any securities or investment products. They are intended to demonstrate the approaches taken by managers who focus on ESG criteria in their investment strategy. There can be no guarantee that a client's account will be managed as described herein. As regards Securities Based Lending, you need to understand that: (1) Sufficient collateral must be maintained to support your loan(s) and to take future advances; (2) You may have to deposit additional cash or eligible securities on short notice; (3) Some or all of your securities may be sold without prior notice in order to maintain account equity at required maintenance levels. You will not be entitled to choose the securities that will be sold. These actions may interrupt your long-term investment strategy and may result in adverse tax consequences or in additional fees being assessed; (4) Morgan Stanley Bank, N.A., Morgan Stanley Private Bank, National Association or Morgan Stanley Smith Barney LLC (collectively referred to as “Morgan Stanley”) reserves the right not to fund any advance request due to insufficient collateral or for any other reason except for any portion of a securities based loan that is identified as a committed facility; (5) Morgan Stanley reserves the right to increase your collateral maintenance requirements at any time without notice; and (6) Morgan Stanley reserves the right to call securities based loans at any time and for any reason. Options and margin trading involve substantial risk and are not suitable for all investors. Besides the general investment risk of holding securities that may decline in value and the possible loss of principal invested, closed-end funds may have additional risks related to declining market prices relative to net asset values (NAVs), active manager underperformance and potential leverage. Closed-end funds, unlike open-end funds, are not continuously offered. There is a one-time public offering and once issued, shares of closed-end funds are sold in the open market through a stock exchange. NAV is total assets less total liabilities divided by the number of shares outstanding. At the time an investor purchases shares of a closed-end fund, shares may have a market price that is above or below NAV. Alternative investments often are speculative and include a high degree of risk. Investors could lose all or a substantial amount of their investment. Alternative investments are suitable only for eligible, long-term investors who are willing to forgo liquidity and put capital at risk for an indefinite period of time. They may be highly illiquid and can engage in leverage and other speculative practices that may increase the volatility and risk of loss. Alternative Investments typically have higher fees than traditional investments. Investors should carefully review and consider potential risks before investing. Certain of these risks may include but are not limited to: Loss of all or a substantial portion of the investment due to leveraging, short-selling, or other speculative practices; Lack of liquidity in that there may be no secondary market for a fund; Volatility of returns; Restrictions on transferring interests in a fund; Potential lack of diversification and resulting higher risk due to concentration of trading authority when a single advisor is utilized; Absence of information regarding valuations and pricing; Complex tax structures and delays in tax reporting; Less regulation and higher fees than mutual funds; and Risks associated with the operations, personnel, and processes of the manager . Interests in alternative investment products are offered pursuant to the terms of the applicable offering memorandum, are distributed by Morgan Stanley Smith Barney LLC and certain of its affiliates. In Consulting Group’s advisory
DISCLOSURES
20
programs, alternative investments are limited to US-registered mutual funds, separate account strategies and exchange-traded funds (ETFs) that seek to pursue alternative investment strategies or returns utilizing publicly traded securities. Investment products in this category may employ various investment strategies and techniques for both hedging and more speculative purposes such as short-selling, leverage, derivatives and options, which can increase volatility and the risk of investment loss. Alternative investments are not suitable for all investors. Hedge Funds of Funds and many funds of funds are private investment vehicles restricted to certain qualified private and institutional investors. They are often speculative and include a high degree of risk. Investors can lose all or a substantial amount of their investment. They may be highly illiquid, can engage in leverage and other speculative practices that may increase volatility and the risk of loss, and may be subject to large investment minimums and initial lockups. They involve complex tax structures, tax-inefficient investing and delays in distributing important tax information. Categorically, hedge funds and funds of funds have higher fees and expenses than traditional investments, and such fees and expenses can lower the returns achieved by investors . Funds of funds have an additional layer of fees over and above hedge fund fees that will offset returns. An investment in a target date portfolio is subject to the risks attendant to the underlying funds in which it invests, in these portfolios the funds are the Consulting Group Capital Market funds. A target date portfolio is geared to investors who will retire and/or require income at an approximate year. The portfolio is managed to meet the investor’s goals by the pre-established year or “target date.” A target date portfolio will transition its invested assets from a more aggressive portfolio to a more conservative portfolio as the target date draws closer . An investment in the target date portfolio is not guaranteed at any time, including, before or after the target date is reached .Managed futures investments are speculative, involve a high degree of risk, use significant leverage, are generally illiquid, have substantial charges, subject investors to conflicts of interest, and are suitable only for the risk capital portion of an investor’s portfolio . Managed futures investments do not replace equities or bonds but rather may act as a complement in a well diversified portfolio. Managed Futures are complex and not appropriate for all investors. Rebalancing does not protect against a loss in declining financial markets. There may be a potential tax implication with a rebalancing strategy. Asset allocation and diversification do not assure a profit or protect against loss in declining financial markets.Tax laws are complex and subject to change. Morgan Stanley Smith Barney LLC (“Morgan Stanley”), its affiliates and Morgan Stanley Financial Advisors and private Wealth Advisors do not provide tax or legal advice and are not “fiduciaries” (under ERISA, the Internal Revenue Code or otherwise) with respect to the services or activities described herein except as otherwise provided in writing by Morgan Stanley. Individuals are encouraged to consult their tax and legal advisors (a) before establishing a retirement plan or account, and (b) regarding any potential tax, ERISA and related consequences of any investments made under such plan or account.Insurance products are offered in conjunction with Morgan Stanley Smith Barney LLC’s licensed insurance agency affiliates.Indices are unmanaged. An investor cannot invest directly in an index. They are shown for illustration purposes only and do not show the performance of any specific investment. Reference to an index does not imply that the portfolio will achieve return, volatility or other results similar to the index. The composition of an index may not reflect the manner in which a portfolio is constructed in relation to expected or achieved returns, portfolio guidelines, restrictions, sectors, correlations, concentrations, volatility, or tracking error target, all of which are subject to change over time .This material is not a financial plan and does not create an investment advisory relationship between you and your Morgan Stanley Financial Advisor. We are not your fiduciary either under the Employee Retirement Income Security Act of 1974 (ERISA) or the Internal Revenue Code of 1986, and any information in this report is not intended to form the primary basis for any investment decision by you, or an investment advice or recommendation for either ERISA or Internal Revenue Code purposes. Morgan Stanley Private Wealth Management will only prepare a financial plan at your specific request using Private Wealth Management approved financial planning signature.We may act in the capacity of a broker or that of an advisor. As your broker, we are not your fiduciary and our interests may not always be identical to yours. Please consult with your Private Wealth Advisor to discuss our obligations to disclose to you any conflicts we may from time to time have and our duty to act in your best interest. We may be paid both by you and by others who compensate us based on what you buy. Our compensation, including that of your Private Wealth Advisor, may vary by product and over time.Investment and services offered through Morgan Stanley Private Wealth Management, a division of Morgan Stanley Smith Barney LLC, Member SIPC.Investment, insurance and annuity products offered through Morgan Stanley Smith Barney LLC are: NOT FDIC INSURED | MAY LOSE VALUE | NOT BANK GUARANTEED | NOT A BANK DEPOSIT | NOT INSURED BY ANY FEDERAL GOVERNMENT AGENCY
GLOBAL INVESTMENT COMMITTEE (GIC) ASSET ALLOCATION MODELS: The Asset Allocation Models are created by Morgan Stanley Wealth Management’s GIC. HYPOTHETICAL MODEL PERFORMANCE (GROSS): Hypothetical model performance results do not reflect the investment or performance of an actual portfolio following a GIC Strategy, but simply reflect actual historical performance of selected indices on a real-time basis over the specified period of time representing the GIC’s strategic and tactical allocations as of the date of this report . The past performance shown here is simulated performance based on benchmark indices, not investment results from an actual portfolio or actual trading. There can be large differences between hypothetical and actual performance results achieved by a particular asset allocation or trading strategy. Hypothetical performance results do not represent actual trading and are generally designed with the benefit of hindsight. Actual performance results of accounts vary due to, for example, market factors (such as liquidity) and client-specific factors (such as investment vehicle selection, timing of contributions and withdrawals, restrictions and rebalancing schedules). Clients would not necessarily have obtained the performance results shown here if they had invested in accordance with any GIC Asset Allocation Model for the periods indicated. Despite the limitations of hypothetical performance, these hypothetical performance results allow clients and Financial Advisors to obtain a sense of the risk/return trade-off of different asset allocation constructs. The hypothetical performance results in this report are calculated using the returns of benchmark indices for the asset classes, and not the returns of securities, fund or other investment products. Models may contain allocations to Hedge Funds, Private Equity and Private Real Estate. The benchmark indices for these asset classes are not issued on a daily basis. When calculating model performance on a day for which no benchmark index data is issued, we have assumed straight line growth between the index levels issued before and
DISCLOSURES
21
after that date. FEES REDUCE THE PERFORMANCE OF ACTUAL ACCOUNTS: None of the fees or other expenses (e.g. commissions, mark-ups, mark-downs, fees) associated with actual trading or accounts are reflected in the GIC Asset Allocation Models. The GIC Asset Allocation Models and any model performance included in this presentation are intended as educational materials . Were a client to use these models in connection with investing, any investment decisions made would be subject to transaction and other costs which, when compounded over a period of years, would decrease returns. Information regarding Morgan Stanley’s standard advisory fees is available in the Form ADV Part 2, which is available at www.morganstanley.com/adv. The following hypothetical illustrates the compound effect fees have on investment returns: For example, if a portfolio’s annual rate of return is 15% for 5 years and the account pays 50 basis points in fees per annum, the gross cumulative five-year return would be 101.1% and the five-year return net of fees would be 96.8%. Fees and/or expenses would apply to clients who invest in investments in an account based on these asset allocations, and would reduce clients’ returns. The impact of fees and/or expenses can be material. INSURANCE PRODUCTS AND ETF DISCLOSURES: An investment in an exchange-traded fund involves risks similar to those of investing in a broadly based portfolio of equity securities traded on an exchange in the relevant securities market, such as market fluctuations caused by such factors as economic and political developments, changes in interest rates and perceived trends in stock and bond prices . Variable annuities, mutual funds and ETFs are sold by prospectus only. The prospectus contains the investment objectives, risks, fees, charges and expenses, and other information regarding the variable annuity contract and the underlying investments, or the ETF, which should be considered carefully before investing. Prospectuses for both the variable annuity contract and the underlying investments, or the ETF, are available from your Financial Advisor. Please read the prospectus carefully before you invest. Variable annuities are long-term investments designed for retirement purposes and may be subject to market fluctuations, investment risk, and possible loss of principal. All guarantees, including optional benefits, are based on the financial strength and claims-paying ability of the issuing insurance company and do not apply to the underlying investment options. Optional riders may not be able to be purchased in combination and are available at an additional cost. Some optional riders must be elected at time of purchase. Optional riders may be subject to specific limitations, restrictions, holding periods, costs, and expenses as specified by the insurance company in the annuity contract . If you are investing in a variable annuity through a tax-advantaged retirement plan such as an IRA, you will get no additional tax advantage from the variable annuity. Under these circumstances, you should only consider buying a variable annuity because of its other features, such as lifetime income payments and death benefits protection. Taxable distributions (and certain deemed distributions) are subject to ordinary income tax and, if taken prior to age 59½, may be subject to a 10% federal income tax penalty. Early withdrawals will reduce the death benefit and cash surrender value. Equity securities may fluctuate in response to news on companies, industries, market conditions and general economic environment. Ultrashort-term fixed income asset class is comprised of fixed income securities with high quality, very short maturities. They are therefore subject to the risks associated with debt securities such as credit and interest rate risk . Master Limited Partnerships (MLPs): Individual MLPs are publicly traded partnerships that have unique risks related to their structure. These include, but are not limited to, their reliance on the capital markets to fund growth, adverse ruling on the current tax treatment of distributions (typically mostly tax deferred), and commodity volume risk. The potential tax benefits from investing in MLPs depend on their being treated as partnerships for federal income tax purposes and, if the MLP is deemed to be a corporation, then its income would be subject to federal taxation at the entity level, reducing the amount of cash available for distribution to the fund which could result in a reduction of the fund’s value. MLPs carry interest rate risk and may underperform in a rising interest rate environment. Investing in commodities entails significant risks. Commodity prices may be affected by a variety of factors at any time, including but not limited to, (i) changes in supply and demand relationships, (ii) governmental programs and policies, (iii) national and international political and economic events, war and terrorist events, (iv) changes in interest and exchange rates, (v) trading activities in commodities and related contracts, (vi) pestilence, technological change and weather, and (vii) the price volatility of a commodity. In addition, the commodities markets are subject to temporary distortions or other disruptions due to various factors, including lack of liquidity, participation of speculators and government intervention. Physical precious metals are non-regulated products. Precious metals are speculative investments, which may experience short-term and long term price volatility. The value of precious metals investments may fluctuate and may appreciate or decline, depending on market conditions. Unlike bonds and stocks, precious metals do not make interest or dividend payments. Therefore, precious metals may not be suitable for investors who require current income. Precious metals are commodities that should be safely stored, which may impose additional costs on the investor. REITs investing risks are similar to those associated with direct investments in real estate: property value fluctuations, lack of liquidity, limited diversification and sensitivity to economic factors such as interest rate changes and market recessions. Risks of private real estate include: illiquidity; a long-term investment horizon with a limited or nonexistent secondary market; lack of transparency; volatility (risk of loss); and leverage. Principal is returned on a monthly basis over the life of a mortgage-backed security. Principal prepayment can significantly affect the monthly income stream and the maturity of any type of MBS, including standard MBS, CMOs and Lottery Bonds. For index definitions to the indices referenced in this report please visit the following: http://www.morganstanleyfa.com/public/projectfiles/id.pdfAsset-backed securities generally decrease in value as a result of interest rate increases, but may benefit less than other fixed-income securities from declining interest rates, principally because of prepayments. Yields are subject to change with economic conditions. Yield is only one factor that should be considered when making an investment decision. Credit ratings are subject to change.Floating-rate securities. The initial interest rate on a floating-rate security may be lower than that of a fixed-rate security of the same maturity because investors expect to receive additional income due to future increases in the floating security’s underlying reference rate. The reference rate could be an index or an interest rate. However, there can be no assurance that the reference rate will increase. Some floating-rate securities may be subject to call risk. Companies paying dividends can reduce or cut payouts at any time. Nondiversification: For a portfolio that holds a concentrated or limited number of securities, a decline in the value of these investments would cause the portfolio’s overall value to decline to a greater degree than a less concentrated portfolio . Portfolios that invest a large percentage of assets in only one industry sector (or in only a few sectors) are more vulnerable to price fluctuation than those that diversify among a broad range of sectors . The indices selected by Morgan Stanley Wealth Management to measure performance are representative of broad asset classes. Morgan Stanley Wealth Management retains the right to change representative indices at any time. Because of their narrow focus, sector investments tend to be more volatile than investments that diversify across many sectors and companies. Growth investing does not guarantee a profit or eliminate risk. The stocks of these companies can have relatively high valuations. Because of these high valuations, an investment in a growth stock can be more risky than an investment in a
DISCLOSURES
22

company with more modest growth expectations. Value investing does not guarantee a profit or eliminate risk. Not all companies whose stocks are considered to be value stocks are able to turn their business around or successfully employ corrective strategies which would result in stock prices that do not rise as initially expected . Any type of continuous or periodic investment plan does not assure a profit and does not protect against loss in declining markets. Since such a plan involves continuous investment in securities regardless of fluctuating price levels of such securities, the investor should consider his financial ability to continue his purchases through periods of low price levels. Duration, the most commonly used measure of bond risk, quantifies the effect of changes in interest rates on the price of a bond or bond portfolio. The longer the duration, the more sensitive the bond or portfolio would be to changes in interest rates . This material is disseminated in the United States of America by Morgan Stanley Smith Barney LLC. Morgan Stanley Wealth Management is not acting as a municipal advisor to any municipal entity or obligated person within the meaning of Section 15B of the Securities Exchange Act (the “Municipal Advisor Rule”) and the opinions or views contained herein are not intended to be, and do not constitute, advice within the meaning of the Municipal Advisor Rule. This material, or any portion thereof, may not be reprinted, sold or redistributed without the written consent of Morgan Stanley Smith Barney LLC .© 2016 Morgan Stanley Smith Barney LLC. Member SIPC.
DISCLOSURES
23

Cal Poly Pomona Foundation
Endowment Portfolio Portfolio ReviewAs of September 30, 2016
Graystone Consulting
Andrew Price, CIMA® (310) 788-2043
Institutional Consulting Director [email protected]
Karin Longhurst, CTFA (310) 788-2156 Institutional Consultant [email protected]
Todd Au, CIMA® (707) 571-5704
Senior Investment Management Consultant [email protected]
1999 Avenue of the Stars, Suite 2400 Los Angeles, CA 90067
A Business of Morgan Stanley
24

Cal Poly Pomona FoundationExecutive Summary
Type of Fund
Time Horizon
Investment Horizon
Target Return
Normal Policy Allocation
Endowment
Perpetuity
Over 10 Years
Greater Los Angeles Area CPI + 5%
41.5% Russell 3000 / 26.0% MSCI AC World ex US Net27.5% Barclays Aggregate / 5.0% HFRI FoF Diversified
Asset Allocation Guidelines
TargetAsset Class Allocation
Total Equities 67.5%Domestic Equity 41.5%International Equity 26.0%
Fixed Income includes MBS 27.5%Domestic and International 27.5%
5.0%Hedge Funds Cash Equivalents 0.0%
25

September 30, 2016 : $89,655,857
Market Value($)
Allocation(%)
Domestic Equities 31,300,001 34.91Global Equities 11,203,456 12.50International and EM Equities 18,443,318 20.57Fixed Income 24,281,865 27.08Hedge Funds 4,363,454 4.87Cash & Equivalents 63,761 0.07
Total Fund($) %
All/Large Cap Equities 23,232,993 25.91iShares Russell 1000 Growth ETF 11,552,893 12.89Aristotle Large Cap Value 11,680,100 13.03Small/Mid Cap Equities 8,067,008 9.00Apex SMID Cap Growth 4,041,023 4.51Vaughan Nelson SMID Cap Value 4,025,985 4.49Global Equities 11,203,456 12.50Delaware Focus Global Growth 5,690,237 6.35First Eagle Global 5,513,219 6.15International and EM Equities 18,443,318 20.57William Blair International Growth 6,890,157 7.69Harbor International 6,912,798 7.71iShares MSCI EM Index 4,640,364 5.18
Total Public Equities 60,946,776 67.98
Domestic Fixed Income 18,212,809 20.31Met West Total Return 7,067,974 7.88PIMCO Income 7,156,186 7.98Eaton Vance Income 3,988,649 4.45Global Fixed Income 6,069,056 6.77Brandywine Global Opportunities 3,041,104 3.39Templeton Global Bond 3,027,952 3.38
Total Fixed Income 24,281,865 27.08
Hedge Funds 4,363,454 4.87Blackstone Alt Multi-Strategy 1,093,361 1.22Ironwood International 1,095,086 1.22Balyasny Atlas Enhanced 1,106,526 1.23Graham Absolute Return 1,068,482 1.19
Cash & Equivalents 63,761 0.07Cash Holding Account 63,761 0.07
Cal Poly Pomona Foundation Total Fund 89,655,857 100.00
Allocation Differences
0.00% 2.00%-2.00 %-3.19 %
Cash & EquivalentsHedge FundsFixed Income
International and EM EquitiesGlobal Equities
Domestic Equities
0.07%-0.13 %
-0.42 %2.07%
-2.50 %0.91%
Market Value($)
Allocation(%)
Target(%)
Domestic Equities 31,300,001 34.91 34.00Global Equities 11,203,456 12.50 15.00International and EM Equities 18,443,318 20.57 18.50Fixed Income 24,281,865 27.08 27.50Hedge Funds 4,363,454 4.87 5.00Cash & Equivalents 63,761 0.07 0.00Total Fund 89,655,857 100.00 100.00
Cal Poly Pomona FoundationBalances and Asset Allocation
As of September 30, 2016
*Please see important disclosures at the end of the presentation.
26

Allocation
MarketValue
($)%
Performance(%)
QTDFiscalYTD
1 Yeara/o 06/16
3 Yearsa/o 06/16
5 Yearsa/o 06/16
Fiscal Year2016
Fiscal Year2015
SinceInception
InceptionDate
Cal Poly Pomona Foundation Total Fund 89,655,857 100.00 4.80 4.80 -5.01 2.66 3.43 -5.01 -1.64 5.89 10/01/2008Cal Poly Pomona Custom Benchmark* 3.83 3.83 -0.61 5.26 5.68 -0.61 -1.12 6.73
Public Equities 60,946,776 67.98 6.07 6.07 -5.24 5.11 4.88 -5.24 0.93 6.95 10/01/2008MSCI AC World Net 5.30 5.30 -3.72 6.04 5.38 -3.72 0.72 6.76
Domestic Equities 31,300,001 34.91 5.41 5.41 -4.32 9.70 9.77 -4.32 7.63 9.61 10/01/2008Russell 3000 4.40 4.40 2.14 11.13 11.60 2.14 7.30 10.53
iShares Russell 1000 Growth ETF 11,552,893 12.89 N/A N/A N/A N/A N/A N/A N/A -0.50 08/02/2016Russell 3000 Growth N/A N/A N/A N/A N/A N/A N/A 0.09
Aristotle Large Cap Value 11,680,100 13.03 5.18 5.18 3.48 12.38 N/A 3.48 7.07 12.05 06/01/2013Russell 1000 Value 3.48 3.48 2.86 9.87 N/A 2.86 4.14 9.67
Apex SMID Cap Growth 4,041,023 4.51 6.80 6.80 -12.90 7.72 N/A -12.90 9.98 10.97 08/01/2011Russell 2500 Growth 6.99 6.99 -7.70 9.05 N/A -7.70 11.28 11.23
Vaughan Nelson SMID Cap Value 4,025,985 4.49 5.41 5.41 N/A N/A N/A N/A N/A 18.39 02/01/2016Russell 2500 Value 6.18 6.18 N/A N/A N/A N/A N/A 21.98
Global Equities 11,203,456 12.50 7.06 7.06 -0.85 4.86 N/A -0.85 0.00 6.52 08/01/2011MSCI AC World Net 5.30 5.30 -3.72 6.04 N/A -3.72 0.72 6.60
Delaware Focus Global Growth 5,690,237 6.35 10.34 10.34 -5.58 N/A N/A -5.58 1.39 5.34 10/01/2013MSCI AC World Net 5.30 5.30 -3.72 N/A N/A -3.72 0.72 5.18
First Eagle Global 5,513,219 6.15 3.78 3.78 4.10 6.53 N/A 4.10 -1.43 6.86 08/01/2011MSCI AC World Net 5.30 5.30 -3.72 6.04 N/A -3.72 0.72 6.60
International and EM Equities 18,443,318 20.57 6.56 6.56 -10.25 0.12 -0.83 -10.25 -5.19 3.97 10/01/2008MSCI AC World xUS Net 6.91 6.91 -10.24 1.16 0.10 -10.24 -5.27 3.94
William Blair International Growth 6,890,157 7.69 5.58 5.58 -9.25 2.76 2.93 -9.25 -0.34 5.89 10/01/2008MSCI AC World xUS Net 6.91 6.91 -10.24 1.16 0.10 -10.24 -5.27 3.94
Harbor International 6,912,798 7.71 5.96 5.96 -10.84 1.09 0.80 -10.84 -4.62 4.58 10/01/2008MSCI AC World xUS Net 6.91 6.91 -10.24 1.16 0.10 -10.24 -5.27 3.94
Cal Poly Pomona FoundationAsset Allocation & Performance
As of September 30, 2016
*The custom benchmark is an evolving benchmark that is currently comprised of 41.5% Russell 3000, 26.0% MSCI AC World ex US Net, 27.5% BarclaysAggregate, and 5% HFRI FoF Diversified. Please see important disclosures at the end of the presentation.
27

Cal Poly Pomona FoundationAsset Allocation & Performance
As of September 30, 2016Allocation
MarketValue
($)%
Performance(%)
QTDFiscalYTD
1 Yeara/o 06/16
3 Yearsa/o 06/16
5 Yearsa/o 06/16
Fiscal Year2016
Fiscal Year2015
SinceInception
InceptionDate
iShares MSCI EM Index 4,640,364 5.18 8.86 8.86 -11.00 N/A N/A -11.00 N/A -1.44 01/01/2015MSCI Emerging Markets Net 9.03 9.03 -12.05 N/A N/A -12.05 N/A -0.73
Fixed Income 24,281,865 27.08 1.79 1.79 0.54 1.68 2.80 0.54 -0.97 5.56 10/01/2008Barclays Aggregate 0.46 0.46 6.00 4.06 3.76 6.00 1.85 4.89Citi WGBI Unhedged 0.30 0.30 11.26 2.52 1.11 11.26 -9.36 3.27
Met West Total Return 7,067,974 7.88 0.71 0.71 4.70 4.16 N/A 4.70 1.91 4.64 08/01/2011Barclays Aggregate 0.46 0.46 6.00 4.06 N/A 6.00 1.85 3.41
PIMCO Income 7,156,186 7.98 2.84 2.84 N/A N/A N/A N/A N/A 6.95 02/01/2016Barclays Aggregate 0.46 0.46 N/A N/A N/A N/A N/A 4.36
Eaton Vance Income 3,988,649 4.45 4.23 4.23 N/A N/A N/A N/A N/A 11.94 02/01/2016Barclays Aggregate 0.46 0.46 N/A N/A N/A N/A N/A 4.36
Brandywine Global Opportunities 3,041,104 3.39 1.43 1.43 5.66 2.00 N/A 5.66 -6.72 3.27 08/01/2011Citi WGBI Unhedged 0.30 0.30 11.26 2.52 N/A 11.26 -9.36 0.68
Templeton Global Bond 3,027,952 3.38 -1.28 -1.28 -4.40 0.19 N/A -4.40 -1.72 0.97 08/01/2011Citi WGBI Unhedged 0.30 0.30 11.26 2.52 N/A 11.26 -9.36 0.68
Hedge Funds 4,363,454 4.87 1.47 1.47 N/A N/A N/A N/A N/A 1.47 07/15/2016HFRI FOF Diversified 1.98 1.98 N/A N/A N/A N/A N/A 1.27
Blackstone Alt Multi-Strategy 1,093,361 1.22 1.47 1.47 N/A N/A N/A N/A N/A 1.47 07/15/2016HFRI FOF Diversified 1.98 1.98 N/A N/A N/A N/A N/A 1.27
Ironwood International 1,095,086 1.22 1.85 1.85 N/A N/A N/A N/A N/A 1.85 07/26/2016HFRI FOF Conservative 1.91 1.91 N/A N/A N/A N/A N/A 1.14
Balyasny Atlas Enhanced 1,106,526 1.23 2.92 2.92 N/A N/A N/A N/A N/A 2.92 07/26/2016S&P 500 Total Return 3.85 3.85 N/A N/A N/A N/A N/A 0.75
Graham Absolute Return 1,068,482 1.19 -0.62 -0.62 N/A N/A N/A N/A N/A -0.62 07/22/2016HFRX Global Hedge Fund 2.18 2.18 N/A N/A N/A N/A N/A 1.14
*The custom benchmark is an evolving benchmark that is currently comprised of 41.5% Russell 3000, 26.0% MSCI AC World ex US Net, 27.5% BarclaysAggregate, and 5% HFRI FoF Diversified. Please see important disclosures at the end of the presentation.
28

Asset Allocation Over Time
QTDFiscalYTD
1 Yeara/o 06/16
3 Yearsa/o 06/16
5 Yearsa/o 06/16
SinceInception
InceptionDate
Cal Poly Pomona Foundation Total Fund 10/01/2008 Beginning Market Value 85,625,356 85,625,356 90,234,110 69,290,107 49,983,520 31,161,294 Net Contributions -74,920 -74,920 -165,719 10,836,142 24,129,885 32,712,601 Gain/Loss 4,105,421 4,105,421 -4,443,035 5,499,108 11,511,951 25,781,962 Ending Market Value 89,655,857 89,655,857 85,625,356 85,625,356 85,625,356 89,655,857
QTDFiscalYTD
1 Yeara/o 06/16
3 Yearsa/o 06/16
5 Yearsa/o 06/16
SinceInception
InceptionDate
Cal Poly Pomona Foundation Total Fund 4.80 4.80 -5.01 2.66 3.43 5.89 10/01/2008Cal Poly Pomona Custom Benchmark* 3.83 3.83 -0.61 5.26 5.68 6.73
US Equity International Equity Global Equity International-Emerging Equity
US Fixed Income Global Fixed Income US REIT (Real-Estate Funds) US Real Return
Global Real Return US Mixed Assets Global Mixed Assets Cash
Hedge Fund
0.0
30.0
60.0
90.0
All
oc
ati
on
(%)
9/08 3/09 9/09 3/10 9/10 3/11 9/11 3/12 9/12 3/13 9/13 3/14 9/14 3/15 9/15 3/16 9/16
Cal Poly Pomona FoundationPerformance and Asset Allocation History
As of September 30, 2016
*The custom benchmark is an evolving benchmark that is currently comprised of 41.5% Russell 3000, 26.0% MSCI AC World ex US Net, 27.5% Barclays Aggregate, and 5% HFRI FoF Diversified. Please
see important disclosures at the end of the presentation.
29

Rolling 36 Month Standard Deviation Rolling 36 Month Beta vs. Risk Benchmark
Rolling 36 Month Alpha vs. Risk BenchmarkAlpha
CSU Cal Poly Pomona Total Fund
Cal Poly Pomona Custom Benchmark*
-3.5
-2.5
-1.5
-0.5
0.5
1.5
2.5
9/11 6/12 3/13 12/13 9/14 6/15 3/16 9/16
QTDFiscalYTD
SinceInception
InceptionDate
Return 4.80 4.80 5.89 10/01/2008Standard Deviation 1.43 1.43 12.64
vs. Cal Poly Pomona Custom Benchmark*Alpha 0.24 0.24 -0.94Beta 1.05 1.05 1.03R-Squared 1.00 1.00 0.97
Standard Deviation
CSU Cal Poly Pomona Total Fund
Cal Poly Pomona Custom Benchmark*
5.0
8.0
11.0
14.0
17.0
20.0
23.0
9/11 6/12 3/13 12/13 9/14 6/15 3/16 9/16
Beta
CSU Cal Poly Pomona Total Fund
Cal Poly Pomona Custom Benchmark*
0.80
0.85
0.90
0.95
1.00
1.05
1.10
9/11 6/12 3/13 12/13 9/14 6/15 3/16 9/16
Cal Poly Pomona FoundationRisk Analytics
As of September 30, 2016
*The custom benchmark is an evolving benchmark that is currently comprised of 41.5% Russell 3000, 26.0% MSCI AC World ex US Net, 27.5% Barclays Aggregate, and 5% HFRI FoF Diversified. Please
see important disclosures at the end of the presentation. 30
I M P O R T A N T D I S C L O S U R E S
To the extent the investments depicted herein represent international securities, you should be aware that there may be additional risks associated with international investing, including foreign economic, political, monetary and/or legal factors, changing currency exchange rates, foreign taxes, and differences in financial and accounting standards. These risks may be magnified in emerging markets. International investing may not be for everyone. Small capitalization companies may lack the financial resources, product diversification and competitive strengths of larger companies. In addition, the securities of small capitalization companies may not trade as readily as, and be subject to higher volatility than, those of larger, more established companies.
Bonds are subject to interest rate risk. When interest rates rise bond prices fall; generally the longer a bond's maturity, the more sensitive it is to this risk. Bonds may also be subject to call risk, which allows the issuer to retain the right to redeem the debt, fully or partially, before the scheduled maturity date. Proceeds from sales prior to maturity may be more or less than originally invested due to changes in market conditions or changes in the credit quality of the issuer.
Investing in alternative investments is speculative, not suitable for all clients, and intended for experienced and sophisticated investors who are willing to bear the high economic risks of the investment, which can include:
• loss of all or a substantial portion of the investment due to leveraging, short‐selling or other speculative investment practices;• lack of liquidity in that there may be no secondary market for the fund and none expected to develop;• volatility of returns; • restrictions on transferring interests in the fund;• potential lack of diversification and resulting higher risk due to concentration of trading authority with a single advisor;• absence of information regarding valuations and pricing;• delays in tax reporting;• less regulation and higher fees than mutual funds; • and advisor risk.
Although the statements and data in this report have been obtained from, and are based upon, sources that the Firm believes to be reliable, we do not guarantee their accuracy, and any such information may be incomplete or condensed. All opinions included in this report constitute the presenters judgment as of the date of this report and are subject to change without notice. This report is for informational purposes only and is not intended as an offer or solicitation with respect to the purchase or sale of any security. Past performance is not a guarantee of future results.
Actual returns would be reduced by expenses that may include management fees and costs of transactions. Expected return and risk (standard deviation) calculations are based on historical data for periods indicated.
The views expressed herein are those of the authors (Graystone Austin, Graystone Columbus/Grand Rapids/Wilkes Barre, Graystone Santa Rosa) and do not necessarily reflect the views of Morgan Stanley Wealth Management or its affiliates. All opinions are subject to change without notice. Neither the information provided nor any opinion expressed constitutes a solicitation for the purchase or sale of any security. Past performance is no guarantee of future results.
© 2016 Graystone Consulting is a business of Morgan Stanley.
31

Cal Poly Pomona Foundation Endowment Portfolio Proposed Portfolio Changes
Graystone Consulting
Andrew B. Price, CIMA® (310) 788-2043 Institutional Consulting Director [email protected]
Karin Longhurst, CTFA (310) 788-2156 Institutional Consultant [email protected]
Todd Au, CIMA® (707) 571-5704 Senior Investment Management Consultant [email protected]
1999 Avenue of the Stars, Suite 2400 Los Angeles, CA 90067
32

Current Portfolio Proposed
Investment Grade Bonds 23.0% 22.5%
High Yield Bonds 4.5% 5.0%
Total Bonds 27.5% 27.5%
US Large Cap Equity 30.3% 30.5%
US Mid Cap Equity 5.5% 5.5%
US Small Cap Equity 5.5% 5.5%
International Equity 21.3% 20.0%
Emerging Markets Equity 5.0% 6.0%
Total Equities 67.5% 67.5%
Absolute Return Assets 1.3% 1.3%
Equity Hedge Assets 3.8% 3.8%
Total Alternatives 5.0% 5.0%
TOTAL 100.0% 100.0%
FORECASTED STATISTICS
Current Portfolio Proposed
Return 6.0% 6.1%
Volatility 12.3% 12.5%
Sharpe Ratio 0.34 0.34
Probability < 0% 30.6% 30.6%
Yield 2.3% 2.4%
STRATEGIC ASSET ALLOCATION - SUMMARY Report Prepared for CPP Foundation Endowment
ASSET ALLOCATION SUMMARY
Please see important disclosures at the end of the presentation.
33
3 Graystone Consulting
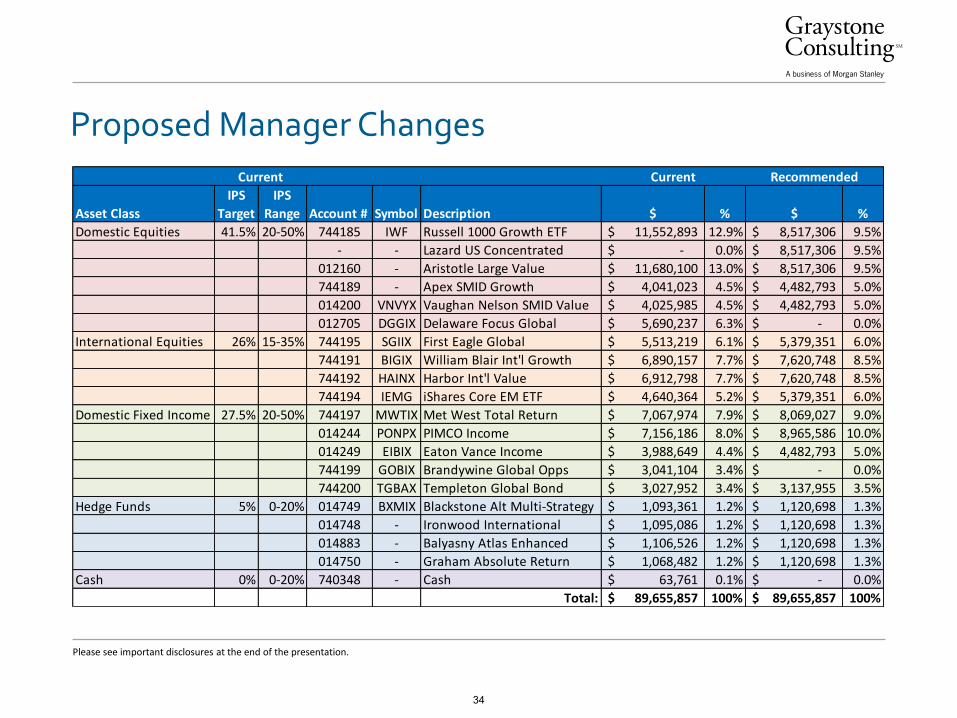
Proposed Manager Changes
Please see important disclosures at the end of the presentation.
Asset Class
IPS
Target
IPS
Range Account # Symbol Description $ % $ %
Domestic Equities 41.5% 20-50% 744185 IWF Russell 1000 Growth ETF 11,552,893$ 12.9% 8,517,306$ 9.5%
- - Lazard US Concentrated -$ 0.0% 8,517,306$ 9.5%
012160 - Aristotle Large Value 11,680,100$ 13.0% 8,517,306$ 9.5%
744189 - Apex SMID Growth 4,041,023$ 4.5% 4,482,793$ 5.0%
014200 VNVYX Vaughan Nelson SMID Value 4,025,985$ 4.5% 4,482,793$ 5.0%
012705 DGGIX Delaware Focus Global 5,690,237$ 6.3% -$ 0.0%
International Equities 26% 15-35% 744195 SGIIX First Eagle Global 5,513,219$ 6.1% 5,379,351$ 6.0%
744191 BIGIX William Blair Int'l Growth 6,890,157$ 7.7% 7,620,748$ 8.5%
744192 HAINX Harbor Int'l Value 6,912,798$ 7.7% 7,620,748$ 8.5%
744194 IEMG iShares Core EM ETF 4,640,364$ 5.2% 5,379,351$ 6.0%
Domestic Fixed Income 27.5% 20-50% 744197 MWTIX Met West Total Return 7,067,974$ 7.9% 8,069,027$ 9.0%
014244 PONPX PIMCO Income 7,156,186$ 8.0% 8,965,586$ 10.0%
014249 EIBIX Eaton Vance Income 3,988,649$ 4.4% 4,482,793$ 5.0%
744199 GOBIX Brandywine Global Opps 3,041,104$ 3.4% -$ 0.0%
744200 TGBAX Templeton Global Bond 3,027,952$ 3.4% 3,137,955$ 3.5%
Hedge Funds 5% 0-20% 014749 BXMIX Blackstone Alt Multi-Strategy 1,093,361$ 1.2% 1,120,698$ 1.3%
014748 - Ironwood International 1,095,086$ 1.2% 1,120,698$ 1.3%
014883 - Balyasny Atlas Enhanced 1,106,526$ 1.2% 1,120,698$ 1.3%
014750 - Graham Absolute Return 1,068,482$ 1.2% 1,120,698$ 1.3%
Cash 0% 0-20% 740348 - Cash 63,761$ 0.1% -$ 0.0%
Total: 89,655,857$ 100% 89,655,857$ 100%
Current Current Recommended
34
4 Graystone Consulting
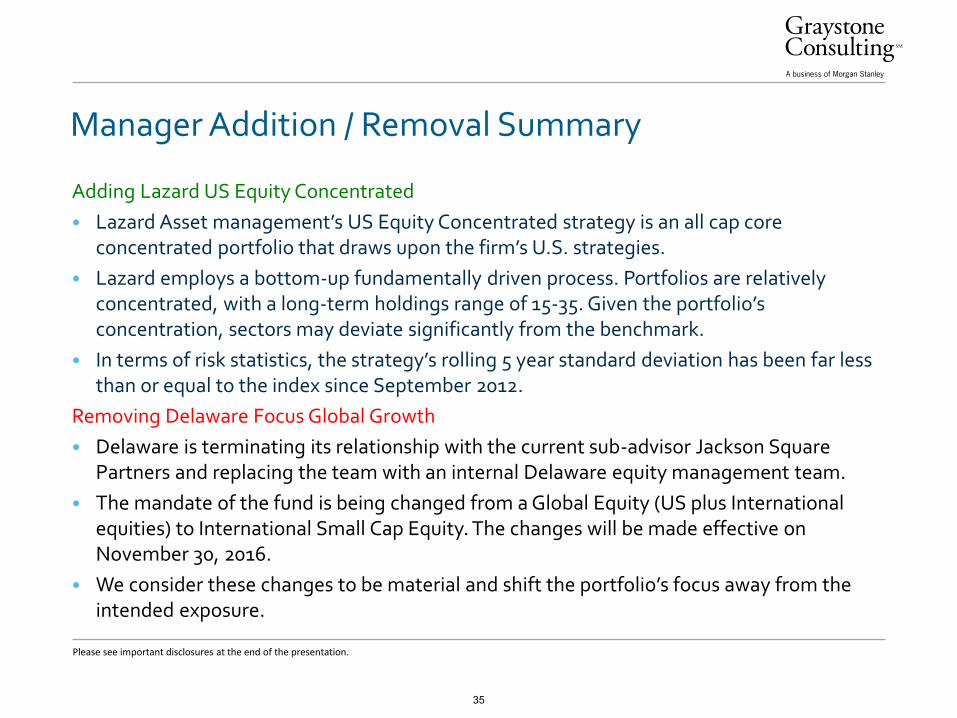
Adding Lazard US Equity Concentrated
• Lazard Asset management’s US Equity Concentrated strategy is an all cap core concentrated portfolio that draws upon the firm’s U.S. strategies.
• Lazard employs a bottom-up fundamentally driven process. Portfolios are relatively concentrated, with a long-term holdings range of 15-35. Given the portfolio’s concentration, sectors may deviate significantly from the benchmark.
• In terms of risk statistics, the strategy’s rolling 5 year standard deviation has been far less than or equal to the index since September 2012.
Removing Delaware Focus Global Growth
• Delaware is terminating its relationship with the current sub-advisor Jackson Square Partners and replacing the team with an internal Delaware equity management team.
• The mandate of the fund is being changed from a Global Equity (US plus International equities) to International Small Cap Equity. The changes will be made effective on November 30, 2016.
• We consider these changes to be material and shift the portfolio’s focus away from the intended exposure.
Manager Addition / Removal Summary
Please see important disclosures at the end of the presentation.
35
5 Graystone Consulting
Removing Brandywine Global Opportunities
• Per Morgan Stanley’s November 2016 “On the Markets,” the International Investment Grade asset class has been marked underweight.
• Yields are lower outside the US, leaving very little value in international fixed income, particularly as the global economy begins to recover more broadly.
• While interest rates are likely to stay low, the offsetting diversification benefits do not warrant much, if any, position, in our view.
Manager Addition / Removal Summary
Please see important disclosures at the end of the presentation.
36

Large Cap Growth - iShares ETFManager vs Benchmark: ReturnOctober 2006 - September 2016 (not annualized if less than 1 year)
Ret
urn
0
2
4
6
8
10
12
14
16
18
YTD 1 year 3 years 5 years 7 years 10 years
iShares Russell 1000 Growth ETF Russell 1000 Growth
Growth of $100October 2006 - September 2016 (Single Computation)
60
80
100
120
140
160
180
200
220
240
iShares Russell 1000 Growth ETF Russell 1000 Growth
-4%
-2%
0%
Q3 2006 Q4 2007 Q4 2008 Q4 2009 Q4 2010 Q4 2011 Q4 2012 Q4 2013 Q4 2014 Q3 2016
10-Year StatisticsOctober 2006 - September 2016: Summary Statistics
iShares Russell 1000 Growth ETF
Russell 1000 Growth
Return ExcessReturn
StandardDeviation
SharpeRatio
TrackingError
InformationRatio Alpha Beta Maximum
DrawdownUp
CaptureDown
Capture
8.66% -0.19% 16.53% 0.47 0.04% -4.83 -0.16% 1.00 -41.50% 99.04% 100.21%
8.85% 0.00% 16.56% 0.48 0.00% 0.00 0.00% 1.00 -41.42% 100.00% 100.00%
iShares Russell 1000 Growth ETF
Russell 1000 Growth
YTD 2015 2014 2013 2012 2011 2010 2009 2008 2007
5.88% 5.48% 12.84% 33.19% 15.03% 2.47% 16.47% 36.94% -38.48% 11.63%
6.00% 5.67% 13.05% 33.48% 15.26% 2.64% 16.71% 37.21% -38.44% 11.81%
Calendar Year Return Manager vs Benchmark: Return
YTD 1 year 3 years 5 years 7 years 10 years
5.88% 13.57% 11.62% 16.37% 13.90% 8.66%
6.00% 13.76% 11.83% 16.60% 14.11% 8.85%
Please see important disclosures at the end of the presentation. 37
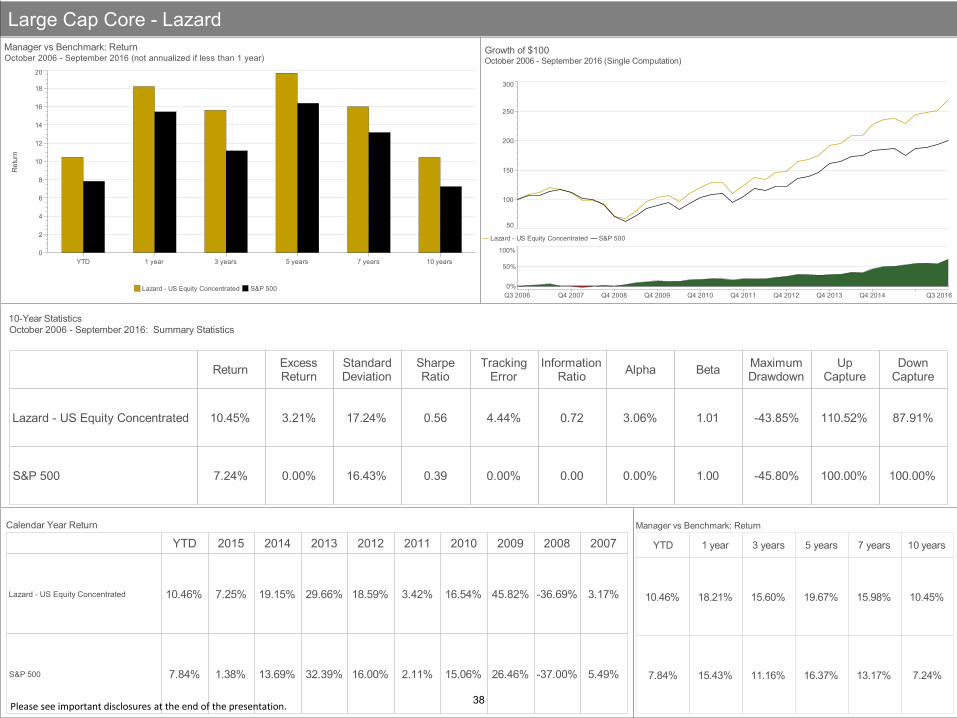
Large Cap Core - LazardManager vs Benchmark: ReturnOctober 2006 - September 2016 (not annualized if less than 1 year)
Ret
urn
0
2
4
6
8
10
12
14
16
18
20
YTD 1 year 3 years 5 years 7 years 10 years
Lazard - US Equity Concentrated S&P 500
Growth of $100October 2006 - September 2016 (Single Computation)
50
100
150
200
250
300
Lazard - US Equity Concentrated S&P 500
0%
50%
100%
Q3 2006 Q4 2007 Q4 2008 Q4 2009 Q4 2010 Q4 2011 Q4 2012 Q4 2013 Q4 2014 Q3 2016
10-Year StatisticsOctober 2006 - September 2016: Summary Statistics
Lazard - US Equity Concentrated
S&P 500
Return ExcessReturn
StandardDeviation
SharpeRatio
TrackingError
InformationRatio Alpha Beta Maximum
DrawdownUp
CaptureDown
Capture
10.45% 3.21% 17.24% 0.56 4.44% 0.72 3.06% 1.01 -43.85% 110.52% 87.91%
7.24% 0.00% 16.43% 0.39 0.00% 0.00 0.00% 1.00 -45.80% 100.00% 100.00%
Lazard - US Equity Concentrated
S&P 500
YTD 2015 2014 2013 2012 2011 2010 2009 2008 2007
10.46% 7.25% 19.15% 29.66% 18.59% 3.42% 16.54% 45.82% -36.69% 3.17%
7.84% 1.38% 13.69% 32.39% 16.00% 2.11% 15.06% 26.46% -37.00% 5.49%
Calendar Year Return Manager vs Benchmark: Return
YTD 1 year 3 years 5 years 7 years 10 years
10.46% 18.21% 15.60% 19.67% 15.98% 10.45%
7.84% 15.43% 11.16% 16.37% 13.17% 7.24%
Please see important disclosures at the end of the presentation. 38

Large Cap Value - AristotleManager vs Benchmark: ReturnOctober 2006 - September 2016 (not annualized if less than 1 year)
Ret
urn
0
2
4
6
8
10
12
14
16
18
YTD 1 year 3 years 5 years 7 years 10 years
Aristotle - Large Cap Value Russell 1000 Value
Growth of $100October 2006 - September 2016 (Single Computation)
4060
80
100
120
140
160
180
200
220
240
Aristotle - Large Cap Value Russell 1000 Value
0%
20%
40%60%
Q3 2006 Q4 2007 Q4 2008 Q4 2009 Q4 2010 Q4 2011 Q4 2012 Q4 2013 Q4 2014 Q3 2016
10-Year StatisticsOctober 2006 - September 2016: Summary Statistics
Aristotle - Large Cap Value
Russell 1000 Value
Return ExcessReturn
StandardDeviation
SharpeRatio
TrackingError
InformationRatio Alpha Beta Maximum
DrawdownUp
CaptureDown
Capture
8.52% 2.67% 16.51% 0.46 4.89% 0.55 3.10% 0.90 -42.33% 101.73% 82.63%
5.85% 0.00% 17.67% 0.28 0.00% 0.00 0.00% 1.00 -50.60% 100.00% 100.00%
Aristotle - Large Cap Value
Russell 1000 Value
YTD 2015 2014 2013 2012 2011 2010 2009 2008 2007
11.21% 3.27% 11.27% 30.40% 21.48% -3.60% 18.86% 32.13% -36.53% 10.67%
10.00% -3.83% 13.45% 32.53% 17.51% 0.39% 15.51% 19.69% -36.85% -0.17%
Calendar Year Return Manager vs Benchmark: Return
YTD 1 year 3 years 5 years 7 years 10 years
11.21% 17.63% 11.55% 17.36% 13.70% 8.52%
10.00% 16.19% 9.70% 16.15% 12.34% 5.85%
Please see important disclosures at the end of the presentation. 39

SMID Cap Growth - ApexManager vs Benchmark: ReturnOctober 2006 - September 2016 (not annualized if less than 1 year)
Ret
urn
0
2
4
6
8
10
12
14
16
18
YTD 1 year 3 years 5 years 7 years 10 years
Apex - SMID Cap Growth Russell 2500 Growth
Growth of $100October 2006 - September 2016 (Single Computation)
50
100
150
200
250
300
Apex - SMID Cap Growth Russell 2500 Growth
0%
50%
100%
Q3 2006 Q4 2007 Q4 2008 Q4 2009 Q4 2010 Q4 2011 Q4 2012 Q4 2013 Q4 2014 Q3 2016
10-Year StatisticsOctober 2006 - September 2016: Summary Statistics
Apex - SMID Cap Growth
Russell 2500 Growth
Return ExcessReturn
StandardDeviation
SharpeRatio
TrackingError
InformationRatio Alpha Beta Maximum
DrawdownUp
CaptureDown
Capture
10.66% 1.84% 21.53% 0.46 6.61% 0.28 1.91% 1.00 -45.75% 109.27% 99.93%
8.82% 0.00% 20.42% 0.39 0.00% 0.00 0.00% 1.00 -46.15% 100.00% 100.00%
Apex - SMID Cap Growth
Russell 2500 Growth
YTD 2015 2014 2013 2012 2011 2010 2009 2008 2007
2.55% -2.22% 8.17% 38.60% 21.31% -2.41% 32.17% 48.84% -44.70% 33.62%
6.95% -0.19% 7.05% 40.65% 16.13% -1.57% 28.86% 41.66% -41.50% 9.69%
Calendar Year Return Manager vs Benchmark: Return
YTD 1 year 3 years 5 years 7 years 10 years
2.55% 5.28% 6.08% 15.51% 13.93% 10.66%
6.95% 11.02% 7.43% 16.20% 13.98% 8.82%
Please see important disclosures at the end of the presentation. 40

SMID Cap Value - Vaughan NelsonManager vs Benchmark: ReturnOctober 2009 - September 2016 (not annualized if less than 1 year)
Ret
urn
0
2
4
6
8
10
12
14
16
18
YTD 1 year 3 years 5 years 7 years
Vaughan Nelson - SMID Cap Value Russell 2500 Value
Growth of $100October 2009 - September 2016 (Single Computation)
80
100
120
140
160
180
200
220
240
Vaughan Nelson - SMID Cap Value Russell 2500 Value
-10%
0%
10%20%
Q3 2009 Q4 2010 Q4 2011 Q4 2012 Q4 2013 Q4 2014 Q4 2015 Q3 2016
7-Year StatisticsOctober 2009 - September 2016: Summary Statistics
Vaughan Nelson - SMID Cap Value
Russell 2500 Value
Return ExcessReturn
StandardDeviation
SharpeRatio
TrackingError
InformationRatio Alpha Beta Maximum
DrawdownUp
CaptureDown
Capture
11.81% -1.00% 16.85% 0.70 5.42% -0.19 -0.70% 0.99 -22.16% 95.16% 100.32%
12.81% 0.00% 16.07% 0.79 0.00% 0.00 0.00% 1.00 -22.26% 100.00% 100.00%
Vaughan Nelson - SMID Cap Value
Russell 2500 Value
YTD 2015 2014 2013 2012 2011 2010
3.41% -3.46% 11.23% 41.52% 16.28% -2.53% 19.96%
14.51% -5.49% 7.11% 33.32% 19.21% -3.36% 24.82%
Calendar Year Return Manager vs Benchmark: Return
YTD 1 year 3 years 5 years 7 years
3.41% 3.39% 6.65% 15.18% 11.81%
14.51% 17.68% 8.05% 16.29% 12.81%
Please see important disclosures at the end of the presentation. 41

Global Equities - DelawareManager vs Benchmark: ReturnOctober 2009 - September 2016 (not annualized if less than 1 year)
Ret
urn
0
2
4
6
8
10
12
14
16
18
YTD 1 year 3 years 5 years 7 years
Delaware - Focus Global Growth MSCI ACWI (Net)
Growth of $100October 2009 - September 2016 (Single Computation)
80
100
120
140
160
180
200
220
Delaware - Focus Global Growth MSCI ACWI (Net)
0%
20%
40%
Q3 2009 Q4 2010 Q4 2011 Q4 2012 Q4 2013 Q4 2014 Q4 2015 Q3 2016
7-Year StatisticsOctober 2009 - September 2016: Summary Statistics
Delaware - Focus Global Growth
MSCI ACWI (Net)
Return ExcessReturn
StandardDeviation
SharpeRatio
TrackingError
InformationRatio Alpha Beta Maximum
DrawdownUp
CaptureDown
Capture
10.87% 3.10% 15.16% 0.71 4.70% 0.66 2.66% 1.05 -15.32% 119.20% 96.47%
7.77% 0.00% 13.74% 0.56 0.00% 0.00 0.00% 1.00 -17.42% 100.00% 100.00%
Delaware - Focus Global Growth
MSCI ACWI (Net)
YTD 2015 2014 2013 2012 2011 2010
6.97% -0.45% 2.21% 23.67% 17.90% -2.20% 22.53%
6.60% -2.36% 4.16% 22.80% 16.13% -7.35% 12.67%
Calendar Year Return Manager vs Benchmark: Return
YTD 1 year 3 years 5 years 7 years
6.97% 16.08% 5.43% 11.21% 10.87%
6.60% 11.96% 5.17% 10.63% 7.77%
Please see important disclosures at the end of the presentation. 42

Global Equities - First EagleManager vs Benchmark: ReturnOctober 2006 - September 2016 (not annualized if less than 1 year)
Ret
urn
0
2
4
6
8
10
12
14
16
18
YTD 1 year 3 years 5 years 7 years 10 years
First Eagle Global MSCI ACWI (Net)
Growth of $100October 2006 - September 2016 (Single Computation)
60
80
100
120
140
160
180
200
220
First Eagle Global MSCI ACWI (Net)
0%
20%
40%60%
Q3 2006 Q4 2007 Q4 2008 Q4 2009 Q4 2010 Q4 2011 Q4 2012 Q4 2013 Q4 2014 Q3 2016
10-Year StatisticsOctober 2006 - September 2016: Summary Statistics
First Eagle Global
MSCI ACWI (Net)
Return ExcessReturn
StandardDeviation
SharpeRatio
TrackingError
InformationRatio Alpha Beta Maximum
DrawdownUp
CaptureDown
Capture
7.33% 2.99% 11.68% 0.56 7.57% 0.40 4.19% 0.62 -27.38% 80.03% 56.27%
4.34% 0.00% 18.29% 0.19 0.00% 0.00 0.00% 1.00 -49.31% 100.00% 100.00%
First Eagle Global
MSCI ACWI (Net)
YTD 2015 2014 2013 2012 2011 2010 2009 2008 2007
11.21% -0.66% 3.19% 15.79% 12.73% 0.06% 17.87% 23.22% -20.87% 10.19%
6.60% -2.36% 4.16% 22.80% 16.13% -7.35% 12.67% 34.63% -42.20% 11.66%
Calendar Year Return Manager vs Benchmark: Return
YTD 1 year 3 years 5 years 7 years 10 years
11.21% 16.26% 6.16% 9.42% 8.71% 7.33%
6.60% 11.96% 5.17% 10.63% 7.77% 4.34%
Please see important disclosures at the end of the presentation. 43

International Equities - William BlairManager vs Benchmark: ReturnOctober 2006 - September 2016 (not annualized if less than 1 year)
Ret
urn
0
2
4
6
8
10
YTD 1 year 3 years 5 years 7 years 10 years
William Blair - International Growth MSCI ACWI ex USA (Net)
Growth of $100October 2006 - September 2016 (Single Computation)
40
60
80
100
120
140
160
William Blair - International Growth MSCI ACWI ex USA (Net)
-10%
0%
10%20%
Q3 2006 Q4 2007 Q4 2008 Q4 2009 Q4 2010 Q4 2011 Q4 2012 Q4 2013 Q4 2014 Q3 2016
10-Year StatisticsOctober 2006 - September 2016: Summary Statistics
William Blair - International Growth
MSCI ACWI ex USA (Net)
Return ExcessReturn
StandardDeviation
SharpeRatio
TrackingError
InformationRatio Alpha Beta Maximum
DrawdownUp
CaptureDown
Capture
3.09% 0.93% 21.26% 0.11 4.04% 0.23 1.05% 1.01 -56.67% 105.52% 99.34%
2.16% 0.00% 20.59% 0.06 0.00% 0.00 0.00% 1.00 -51.68% 100.00% 100.00%
William Blair - International Growth
MSCI ACWI ex USA (Net)
YTD 2015 2014 2013 2012 2011 2010 2009 2008 2007
1.72% -0.03% -2.86% 18.96% 23.96% -14.23% 20.47% 42.63% -52.17% 18.53%
5.82% -5.66% -3.87% 15.29% 16.83% -13.71% 11.15% 41.45% -45.53% 16.65%
Calendar Year Return Manager vs Benchmark: Return
YTD 1 year 3 years 5 years 7 years 10 years
1.72% 6.52% 1.97% 8.83% 6.70% 3.09%
5.82% 9.26% 0.18% 6.04% 3.66% 2.16%
Please see important disclosures at the end of the presentation. 44

International Equities - HarborManager vs Benchmark: ReturnOctober 2006 - September 2016 (not annualized if less than 1 year)
Ret
urn
0
2
4
6
8
10
YTD 1 year 3 years 5 years 7 years 10 years
Harbor International MSCI ACWI ex USA (Net)
Growth of $100October 2006 - September 2016 (Single Computation)
60
80
100
120
140
160
180
Harbor International MSCI ACWI ex USA (Net)
0%
10%
20%30%
Q3 2006 Q4 2007 Q4 2008 Q4 2009 Q4 2010 Q4 2011 Q4 2012 Q4 2013 Q4 2014 Q3 2016
10-Year StatisticsOctober 2006 - September 2016: Summary Statistics
Harbor International
MSCI ACWI ex USA (Net)
Return ExcessReturn
StandardDeviation
SharpeRatio
TrackingError
InformationRatio Alpha Beta Maximum
DrawdownUp
CaptureDown
Capture
3.81% 1.65% 21.72% 0.14 3.39% 0.49 1.68% 1.04 -51.29% 113.19% 101.58%
2.16% 0.00% 20.59% 0.06 0.00% 0.00 0.00% 1.00 -51.68% 100.00% 100.00%
Harbor International
MSCI ACWI ex USA (Net)
YTD 2015 2014 2013 2012 2011 2010 2009 2008 2007
4.75% -3.82% -6.81% 16.84% 20.87% -11.13% 11.98% 38.57% -42.66% 21.82%
5.82% -5.66% -3.87% 15.29% 16.83% -13.71% 11.15% 41.45% -45.53% 16.65%
Calendar Year Return Manager vs Benchmark: Return
YTD 1 year 3 years 5 years 7 years 10 years
4.75% 7.75% -0.55% 7.31% 4.86% 3.81%
5.82% 9.26% 0.18% 6.04% 3.66% 2.16%
Please see important disclosures at the end of the presentation. 45

Emerging Markets Index - iShares ETFManager vs Benchmark: ReturnOctober 2013 - September 2016 (not annualized if less than 1 year)
Ret
urn
0
5
10
15
20
YTD 1 year 3 years
iShares - MSCI Emerging Markets ETF MSCI Emerging Markets (Net)
Growth of $100October 2013 - September 2016 (Single Computation)
80
85
90
95
100
105
110
iShares - MSCI Emerging Markets ETF MSCI Emerging Markets (Net)
0%
0.5%
1%1.5%
Q3 2013 Q4 2013 Q2 2014 Q4 2014 Q2 2015 Q4 2015 Q2 2016 Q3 2016
3-Year StatisticsOctober 2013 - September 2016: Summary Statistics
iShares - MSCI Emerging Markets ETF
MSCI Emerging Markets (Net)
Return ExcessReturn
StandardDeviation
SharpeRatio
TrackingError
InformationRatio Alpha Beta Maximum
DrawdownUp
CaptureDown
Capture
-0.34% 0.23% 13.52% -0.03 0.58% 0.39 0.20% 0.98 -21.48% 100.40% 98.22%
-0.56% 0.00% 13.75% -0.05 0.00% 0.00 0.00% 1.00 -22.10% 100.00% 100.00%
iShares - MSCI Emerging Markets ETF
MSCI Emerging Markets (Net)
YTD 2015 2014
15.14% -13.86% -2.04%
16.02% -14.92% -2.19%
Calendar Year Return Manager vs Benchmark: Return
YTD 1 year 3 years
15.14% 16.47% -0.34%
16.02% 16.78% -0.56%
Please see important disclosures at the end of the presentation. 46

Fixed Income - Met WestManager vs Benchmark: ReturnOctober 2006 - September 2016 (not annualized if less than 1 year)
Ret
urn
0
1
2
3
4
5
6
7
YTD 1 year 3 years 5 years 7 years 10 years
Met West - Total Return Barclays U.S. Aggregate
Growth of $100October 2006 - September 2016 (Single Computation)
100
110
120
130
140
150
160
170
180
190
Met West - Total Return Barclays U.S. Aggregate
0%
20%
40%
Q3 2006 Q4 2007 Q4 2008 Q4 2009 Q4 2010 Q4 2011 Q4 2012 Q4 2013 Q4 2014 Q3 2016
10-Year StatisticsOctober 2006 - September 2016: Summary Statistics
Met West - Total Return
Barclays U.S. Aggregate
Return ExcessReturn
StandardDeviation
SharpeRatio
TrackingError
InformationRatio Alpha Beta Maximum
DrawdownUp
CaptureDown
Capture
6.48% 1.69% 3.95% 1.43 2.93% 0.58 2.40% 0.85 -3.51% 127.68% 82.77%
4.79% 0.00% 3.18% 1.24 0.00% 0.00 0.00% 1.00 -2.44% 100.00% 100.00%
Met West - Total Return
Barclays U.S. Aggregate
YTD 2015 2014 2013 2012 2011 2010 2009 2008 2007
5.24% 0.29% 5.99% 0.50% 11.54% 5.52% 11.65% 17.30% -1.28% 6.48%
5.80% 0.55% 5.97% -2.02% 4.21% 7.84% 6.54% 5.93% 5.24% 6.97%
Calendar Year Return Manager vs Benchmark: Return
YTD 1 year 3 years 5 years 7 years 10 years
5.24% 4.82% 4.01% 4.83% 6.18% 6.48%
5.80% 5.19% 4.03% 3.08% 4.10% 4.79%
Please see important disclosures at the end of the presentation. 47

Fixed Income - PIMCOManager vs Benchmark: ReturnOctober 2009 - September 2016 (not annualized if less than 1 year)
Ret
urn
0
2
4
6
8
10
12
YTD 1 year 3 years 5 years 7 years
PIMCO Income Fund Barclays U.S. Aggregate
Growth of $100October 2009 - September 2016 (Single Computation)
100
120
140
160
180
200
PIMCO Income Fund Barclays U.S. Aggregate
0%
50%
100%
Q3 2009 Q4 2010 Q4 2011 Q4 2012 Q4 2013 Q4 2014 Q4 2015 Q3 2016
7-Year StatisticsOctober 2009 - September 2016: Summary Statistics
PIMCO Income Fund
Barclays U.S. Aggregate
Return ExcessReturn
StandardDeviation
SharpeRatio
TrackingError
InformationRatio Alpha Beta Maximum
DrawdownUp
CaptureDown
Capture
10.35% 6.25% 4.63% 2.22 4.75% 1.32 8.55% 0.44 -1.35% 189.36% -95.27%
4.10% 0.00% 2.99% 1.34 0.00% 0.00 0.00% 1.00 -2.44% 100.00% 100.00%
PIMCO Income Fund
Barclays U.S. Aggregate
YTD 2015 2014 2013 2012 2011 2010
7.14% 2.53% 7.09% 4.72% 22.07% 6.28% 20.35%
5.80% 0.55% 5.97% -2.02% 4.21% 7.84% 6.54%
Calendar Year Return Manager vs Benchmark: Return
YTD 1 year 3 years 5 years 7 years
7.14% 7.69% 6.09% 8.77% 10.35%
5.80% 5.19% 4.03% 3.08% 4.10%
Please see important disclosures at the end of the presentation. 48
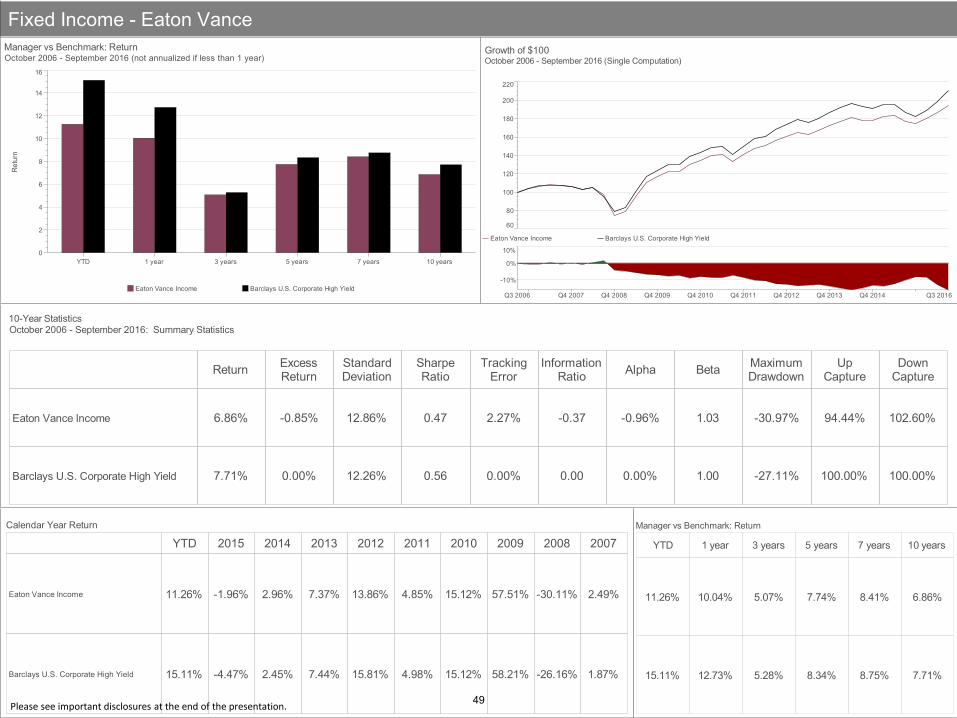
Fixed Income - Eaton VanceManager vs Benchmark: ReturnOctober 2006 - September 2016 (not annualized if less than 1 year)
Ret
urn
0
2
4
6
8
10
12
14
16
YTD 1 year 3 years 5 years 7 years 10 years
Eaton Vance Income Barclays U.S. Corporate High Yield
Growth of $100October 2006 - September 2016 (Single Computation)
60
80
100
120
140
160
180
200
220
Eaton Vance Income Barclays U.S. Corporate High Yield
-10%
0%
10%
Q3 2006 Q4 2007 Q4 2008 Q4 2009 Q4 2010 Q4 2011 Q4 2012 Q4 2013 Q4 2014 Q3 2016
10-Year StatisticsOctober 2006 - September 2016: Summary Statistics
Eaton Vance Income
Barclays U.S. Corporate High Yield
Return ExcessReturn
StandardDeviation
SharpeRatio
TrackingError
InformationRatio Alpha Beta Maximum
DrawdownUp
CaptureDown
Capture
6.86% -0.85% 12.86% 0.47 2.27% -0.37 -0.96% 1.03 -30.97% 94.44% 102.60%
7.71% 0.00% 12.26% 0.56 0.00% 0.00 0.00% 1.00 -27.11% 100.00% 100.00%
Eaton Vance Income
Barclays U.S. Corporate High Yield
YTD 2015 2014 2013 2012 2011 2010 2009 2008 2007
11.26% -1.96% 2.96% 7.37% 13.86% 4.85% 15.12% 57.51% -30.11% 2.49%
15.11% -4.47% 2.45% 7.44% 15.81% 4.98% 15.12% 58.21% -26.16% 1.87%
Calendar Year Return Manager vs Benchmark: Return
YTD 1 year 3 years 5 years 7 years 10 years
11.26% 10.04% 5.07% 7.74% 8.41% 6.86%
15.11% 12.73% 5.28% 8.34% 8.75% 7.71%
Please see important disclosures at the end of the presentation. 49
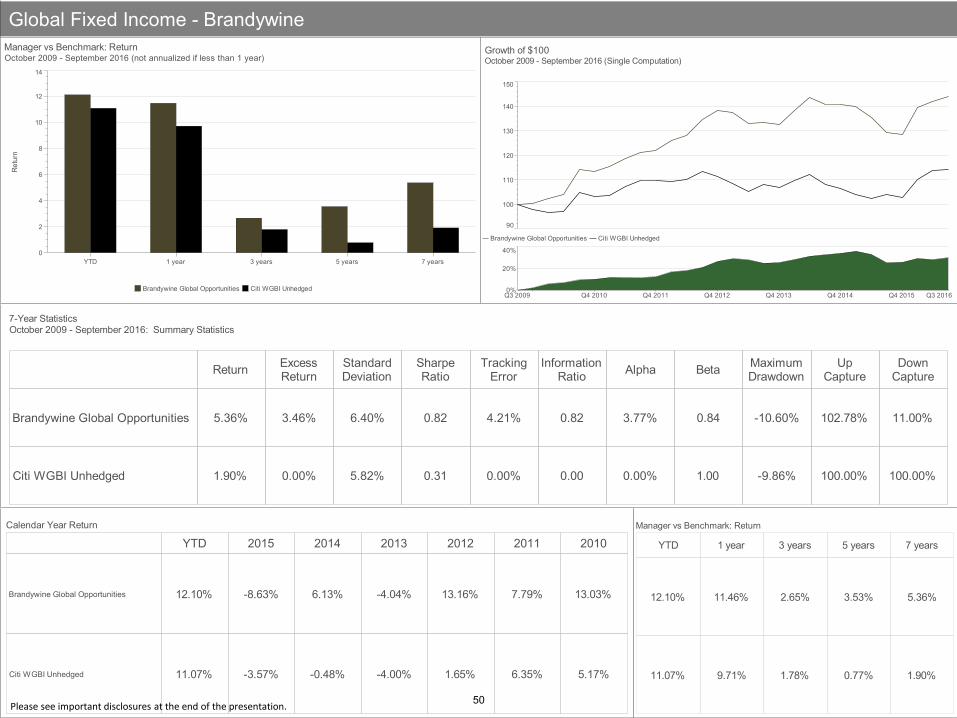
Global Fixed Income - BrandywineManager vs Benchmark: ReturnOctober 2009 - September 2016 (not annualized if less than 1 year)
Ret
urn
0
2
4
6
8
10
12
14
YTD 1 year 3 years 5 years 7 years
Brandywine Global Opportunities Citi WGBI Unhedged
Growth of $100October 2009 - September 2016 (Single Computation)
90
100
110
120
130
140
150
Brandywine Global Opportunities Citi WGBI Unhedged
0%
20%
40%
Q3 2009 Q4 2010 Q4 2011 Q4 2012 Q4 2013 Q4 2014 Q4 2015 Q3 2016
7-Year StatisticsOctober 2009 - September 2016: Summary Statistics
Brandywine Global Opportunities
Citi WGBI Unhedged
Return ExcessReturn
StandardDeviation
SharpeRatio
TrackingError
InformationRatio Alpha Beta Maximum
DrawdownUp
CaptureDown
Capture
5.36% 3.46% 6.40% 0.82 4.21% 0.82 3.77% 0.84 -10.60% 102.78% 11.00%
1.90% 0.00% 5.82% 0.31 0.00% 0.00 0.00% 1.00 -9.86% 100.00% 100.00%
Brandywine Global Opportunities
Citi WGBI Unhedged
YTD 2015 2014 2013 2012 2011 2010
12.10% -8.63% 6.13% -4.04% 13.16% 7.79% 13.03%
11.07% -3.57% -0.48% -4.00% 1.65% 6.35% 5.17%
Calendar Year Return Manager vs Benchmark: Return
YTD 1 year 3 years 5 years 7 years
12.10% 11.46% 2.65% 3.53% 5.36%
11.07% 9.71% 1.78% 0.77% 1.90%
Please see important disclosures at the end of the presentation. 50
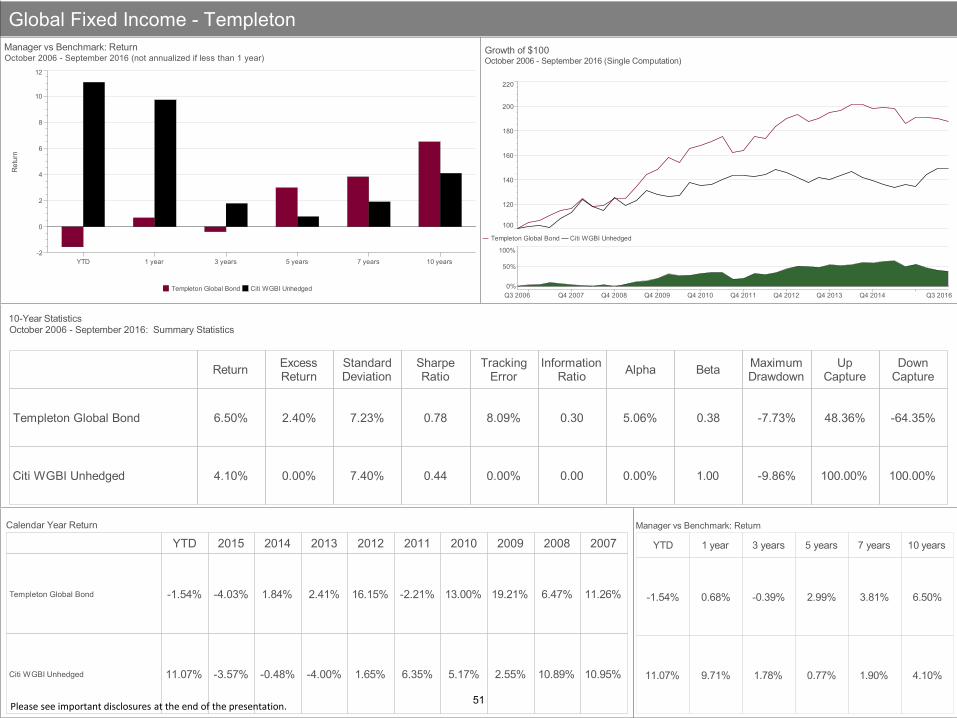
Global Fixed Income - TempletonManager vs Benchmark: ReturnOctober 2006 - September 2016 (not annualized if less than 1 year)
Ret
urn
-2
0
2
4
6
8
10
12
YTD 1 year 3 years 5 years 7 years 10 years
Templeton Global Bond Citi WGBI Unhedged
Growth of $100October 2006 - September 2016 (Single Computation)
100
120
140
160
180
200
220
Templeton Global Bond Citi WGBI Unhedged
0%
50%
100%
Q3 2006 Q4 2007 Q4 2008 Q4 2009 Q4 2010 Q4 2011 Q4 2012 Q4 2013 Q4 2014 Q3 2016
10-Year StatisticsOctober 2006 - September 2016: Summary Statistics
Templeton Global Bond
Citi WGBI Unhedged
Return ExcessReturn
StandardDeviation
SharpeRatio
TrackingError
InformationRatio Alpha Beta Maximum
DrawdownUp
CaptureDown
Capture
6.50% 2.40% 7.23% 0.78 8.09% 0.30 5.06% 0.38 -7.73% 48.36% -64.35%
4.10% 0.00% 7.40% 0.44 0.00% 0.00 0.00% 1.00 -9.86% 100.00% 100.00%
Templeton Global Bond
Citi WGBI Unhedged
YTD 2015 2014 2013 2012 2011 2010 2009 2008 2007
-1.54% -4.03% 1.84% 2.41% 16.15% -2.21% 13.00% 19.21% 6.47% 11.26%
11.07% -3.57% -0.48% -4.00% 1.65% 6.35% 5.17% 2.55% 10.89% 10.95%
Calendar Year Return Manager vs Benchmark: Return
YTD 1 year 3 years 5 years 7 years 10 years
-1.54% 0.68% -0.39% 2.99% 3.81% 6.50%
11.07% 9.71% 1.78% 0.77% 1.90% 4.10%
Please see important disclosures at the end of the presentation. 51

Alternative Investments - BlackstoneManager vs Benchmark: ReturnJuly 2006 - June 2016 (not annualized if less than 1 year)
Ret
urn
-6
-4
-2
0
2
4
6
YTD 1 year 3 years 5 years 7 years 10 years
Blackstone Alt Multi-Strategy HFRI FoF Diversified Index
Growth of $100July 2006 - June 2016 (Single Computation)
90
100
110
120
130
140
150
160
Blackstone Alt Multi-Strategy HFRI FoF Diversified Index
0%
20%
40%
Q2 2006 Q4 2007 Q4 2008 Q4 2009 Q4 2010 Q4 2011 Q4 2012 Q4 2013 Q4 2014 Q2 2016
10-Year StatisticsJuly 2006 - June 2016: Summary Statistics
Blackstone Alt Multi-Strategy
HFRI FoF Diversified Index
Return ExcessReturn
StandardDeviation
SharpeRatio
TrackingError
InformationRatio Alpha Beta Maximum
DrawdownUp
CaptureDown
Capture
4.56% 2.86% 5.80% 0.62 1.76% 1.63 3.08% 0.84 -15.55% 118.59% 60.67%
1.70% 0.00% 6.73% 0.11 0.00% 0.00 0.00% 1.00 -20.85% 100.00% 100.00%
Blackstone Alt Multi-Strategy
HFRI FoF Diversified Index
YTD 2015 2014 2013 2012 2011 2010 2009 2008 2007
-1.28% 2.68% 4.65% 10.11% 7.88% -1.20% 7.38% 15.62% -15.55% 12.60%
-2.40% -0.17% 3.42% 9.04% 4.81% -5.01% 5.48% 11.46% -20.85% 9.72%
Calendar Year Return Manager vs Benchmark: Return
YTD 1 year 3 years 5 years 7 years 10 years
-1.28% -1.04% 3.64% 4.16% 5.36% 4.56%
-2.40% -4.87% 2.04% 1.84% 2.92% 1.70%
Please see important disclosures at the end of the presentation. 52
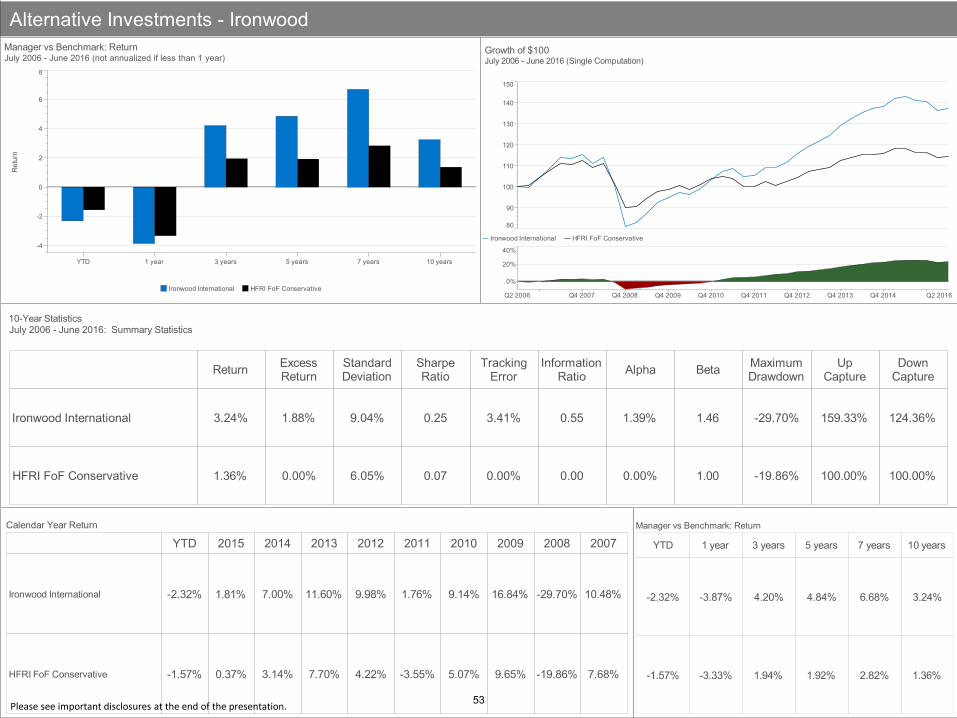
Alternative Investments - IronwoodManager vs Benchmark: ReturnJuly 2006 - June 2016 (not annualized if less than 1 year)
Ret
urn
-4
-2
0
2
4
6
8
YTD 1 year 3 years 5 years 7 years 10 years
Ironwood International HFRI FoF Conservative
Growth of $100July 2006 - June 2016 (Single Computation)
80
90
100
110
120
130
140
150
Ironwood International HFRI FoF Conservative
0%
20%
40%
Q2 2006 Q4 2007 Q4 2008 Q4 2009 Q4 2010 Q4 2011 Q4 2012 Q4 2013 Q4 2014 Q2 2016
10-Year StatisticsJuly 2006 - June 2016: Summary Statistics
Ironwood International
HFRI FoF Conservative
Return ExcessReturn
StandardDeviation
SharpeRatio
TrackingError
InformationRatio Alpha Beta Maximum
DrawdownUp
CaptureDown
Capture
3.24% 1.88% 9.04% 0.25 3.41% 0.55 1.39% 1.46 -29.70% 159.33% 124.36%
1.36% 0.00% 6.05% 0.07 0.00% 0.00 0.00% 1.00 -19.86% 100.00% 100.00%
Ironwood International
HFRI FoF Conservative
YTD 2015 2014 2013 2012 2011 2010 2009 2008 2007
-2.32% 1.81% 7.00% 11.60% 9.98% 1.76% 9.14% 16.84% -29.70% 10.48%
-1.57% 0.37% 3.14% 7.70% 4.22% -3.55% 5.07% 9.65% -19.86% 7.68%
Calendar Year Return Manager vs Benchmark: Return
YTD 1 year 3 years 5 years 7 years 10 years
-2.32% -3.87% 4.20% 4.84% 6.68% 3.24%
-1.57% -3.33% 1.94% 1.92% 2.82% 1.36%
Please see important disclosures at the end of the presentation. 53

Alternative Investments - BalyasnyManager vs Benchmark: ReturnJuly 2006 - June 2016 (not annualized if less than 1 year)
Ret
urn
-5
0
5
10
15
YTD 1 year 3 years 5 years 7 years 10 years
Balyasny Atlas Enhanced S&P 500
Growth of $100July 2006 - June 2016 (Single Computation)
50
100
150
200
250
300
Balyasny Atlas Enhanced S&P 500
0%
50%
100%150%
Q2 2006 Q4 2007 Q4 2008 Q4 2009 Q4 2010 Q4 2011 Q4 2012 Q4 2013 Q4 2014 Q2 2016
10-Year StatisticsJuly 2006 - June 2016: Summary Statistics
Balyasny Atlas Enhanced
S&P 500
Return ExcessReturn
StandardDeviation
SharpeRatio
TrackingError
InformationRatio Alpha Beta Maximum
DrawdownUp
CaptureDown
Capture
10.90% 3.48% 9.17% 1.08 16.42% 0.21 9.87% 0.16 -12.57% 48.14% -20.99%
7.42% 0.00% 16.46% 0.39 0.00% 0.00 0.00% 1.00 -45.80% 100.00% 100.00%
Balyasny Atlas Enhanced
S&P 500
YTD 2015 2014 2013 2012 2011 2010 2009 2008 2007
-3.89% 6.25% 13.91% 21.07% 12.67% -0.27% 21.59% 11.25% -1.41% 27.47%
3.84% 1.38% 13.69% 32.39% 16.00% 2.11% 15.06% 26.46% -37.00% 5.49%
Calendar Year Return Manager vs Benchmark: Return
YTD 1 year 3 years 5 years 7 years 10 years
-3.89% -3.38% 10.93% 7.82% 10.74% 10.90%
3.84% 3.99% 11.66% 12.10% 14.92% 7.42%
Please see important disclosures at the end of the presentation. 54

Alternative Investments - GrahamManager vs Benchmark: ReturnJuly 2006 - June 2016 (not annualized if less than 1 year)
Ret
urn
-6
-4
-2
0
2
4
6
8
10
12
YTD 1 year 3 years 5 years 7 years 10 years
Graham - Absolute Return HFRX Global Hedge Fund Index
Growth of $100July 2006 - June 2016 (Single Computation)
50
100
150
200
250
300
350
Graham - Absolute Return HFRX Global Hedge Fund Index
0%
100%
200%300%
Q2 2006 Q4 2007 Q4 2008 Q4 2009 Q4 2010 Q4 2011 Q4 2012 Q4 2013 Q4 2014 Q2 2016
10-Year StatisticsJuly 2006 - June 2016: Summary Statistics
Graham - Absolute Return
HFRX Global Hedge Fund Index
Return ExcessReturn
StandardDeviation
SharpeRatio
TrackingError
InformationRatio Alpha Beta Maximum
DrawdownUp
CaptureDown
Capture
11.70% 12.04% 13.06% 0.82 15.86% 0.76 12.54% -0.21 -11.66% 173.97% -47.78%
-0.33% 0.00% 7.55% -0.17 0.00% 0.00 0.00% 1.00 -24.81% 100.00% 100.00%
Graham - Absolute Return
HFRX Global Hedge Fund Index
YTD 2015 2014 2013 2012 2011 2010 2009 2008 2007
0.06% 0.46% 9.37% 9.45% 8.26% 3.64% 23.36% 32.72% 25.48% 0.08%
-0.83% -3.64% -0.58% 6.72% 3.51% -8.87% 5.19% 13.40% -23.25% 4.23%
Calendar Year Return Manager vs Benchmark: Return
YTD 1 year 3 years 5 years 7 years 10 years
0.06% -1.11% 4.44% 5.61% 10.12% 11.70%
-0.83% -5.64% -0.57% -0.46% 1.12% -0.33%
Please see important disclosures at the end of the presentation. 55

I M P O R T A N T D I S C L O S U R E S
To the extent the investments depicted herein represent international securities, you should be aware that there may be additional risks associated with international investing, including foreign economic, political, monetary and/or legal factors, changing currency exchange rates, foreign taxes, and differences in financial and accounting standards. These risks may be magnified in emerging markets. International investing may not be for everyone. Small capitalization companies may lack the financial resources, product diversification and competitive strengths of larger companies. In addition, the securities of small capitalization companies may not trade as readily as, and be subject to higher volatility than, those of larger, more established companies.
Bonds are subject to interest rate risk. When interest rates rise bond prices fall; generally the longer a bond's maturity, the more sensitive it is to this risk. Bonds may also be subject to call risk, which allows the issuer to retain the right to redeem the debt, fully or partially, before the scheduled maturity date. Proceeds from sales prior to maturity may be more or less than originally invested due to changes in market conditions or changes in the credit quality of the issuer.
Investing in alternative investments is speculative, not suitable for all clients, and intended for experienced and sophisticated investors who are willing to bear the high economic risks of the investment, which can include:
• loss of all or a substantial portion of the investment due to leveraging, short‐selling or other speculative investment practices;• lack of liquidity in that there may be no secondary market for the fund and none expected to develop;• volatility of returns; • restrictions on transferring interests in the fund;• potential lack of diversification and resulting higher risk due to concentration of trading authority with a single advisor;• absence of information regarding valuations and pricing;• delays in tax reporting;• less regulation and higher fees than mutual funds; • and advisor risk.
Although the statements and data in this report have been obtained from, and are based upon, sources that the Firm believes to be reliable, we do not guarantee their accuracy, and any such information may be incomplete or condensed. All opinions included in this report constitute the presenters judgment as of the date of this report and are subject to change without notice. This report is for informational purposes only and is not intended as an offer or solicitation with respect to the purchase or sale of any security. Past performance is not a guarantee of future results.
Actual returns would be reduced by expenses that may include management fees and costs of transactions. Expected return and risk (standard deviation) calculations are based on historical data for periods indicated.
The views expressed herein are those of the authors (Graystone Austin, Graystone Columbus/Grand Rapids/Wilkes Barre, Graystone Santa Rosa) and do not necessarily reflect the views of Morgan Stanley Wealth Management or its affiliates. All opinions are subject to change without notice. Neither the information provided nor any opinion expressed constitutes a solicitation for the purchase or sale of any security. Past performance is no guarantee of future results.
© 2016 Graystone Consulting is a business of Morgan Stanley.
56

Cal Poly Pomona Foundation
General Investment Portfolio Portfolio Review As of September 30, 2016
Graystone Consulting
Andrew Price, CIMA® (310) 788-2043
Institutional Consulting Director [email protected]
Karin Longhurst, CTFA (310) 788-2156 Institutional Consultant [email protected]
Todd Au, CIMA® (707) 571-5704
Senior Investment Management Consultant [email protected]
1999 Avenue of the Stars, Suite 2400 Los Angeles, CA 90067
A Business of Morgan Stanley
57

Total Fund ($) (%)
Domestic Equities $5,905,191 15.41%
iShares Russell 1000 Growth ETF $2,109,223 5.51%Aristotle Large Cap Value $2,116,459 5.52%
Apex SMID Cap Growth $845,397 2.21%
Vaughan Nelson SMID Cap Value $834,112 2.18%
Global Equities $2,605,073 6.80%
Delaware Focused Global Growth $1,346,814 3.52%
First Eagle Global $1,258,259 3.28%
International and EM Equities $3,446,360 9.00% Market Value Allocation
William Blair International Growth $1,405,608 3.67% ($) (%)
Harbor International $1,418,586 3.70% Domestic Equities $5,905,191 15.41%iShares MSCI EM Index $622,166 1.62% Global Equities $2,605,073 6.80%
International and EM Equities $3,446,360 9.00%Public Equities $11,956,624 31.21% Fixed Income $26,263,214 68.55%
Cash & Equivalents $90,156 0.24%
Fixed Income $26,263,214 68.55%
Doubleline Total Return $2,427,098 6.34% As of September 30, 2016
Guggenheim Limited Duration $6,776,024 17.69%
Eaton Vance Income $622,419 1.62%
Brandywine Global Opportunistic $1,021,671 2.67%
PIMCO Income $2,067,964 5.40%
PIMCO Low Duration $6,695,422 17.48%
MetWest Low Duration $6,652,616 17.37%
Cash and Equivalents $90,156 0.24%
Cash and Equivalents $90,156 0.24%
General Investment Portfolio $38,309,994 0.00% As of September 30, 2016
Market Value Allocation Target($) (%) (%)
Domestic Equities $5,905,191 15.41% 14.00%
Global Equities $2,605,073 6.80% 6.00%
International and EM Equities $3,446,360 9.00% 8.00%
Fixed Income $26,263,214 68.55% 72.00%Cash & Equivalents $90,156 0.24% 0.00%
*The Fixed Income composite includes equity accruals. Please see important disclosures at the end of the presentation.
Cal Poly Pomona Foundation - General Investment PortfolioBalances and Asset Allocation
As of September 30, 2016
0.24%
-3.45%
1.00%
0.80%
1.41%
-4.00% -3.00% -2.00% -1.00% 0.00% 1.00% 2.00%
1
2
3
4
5
Cash & Equivalents
Fixed Income
Domestic Equities
Global Equities
International and EM Equities
58
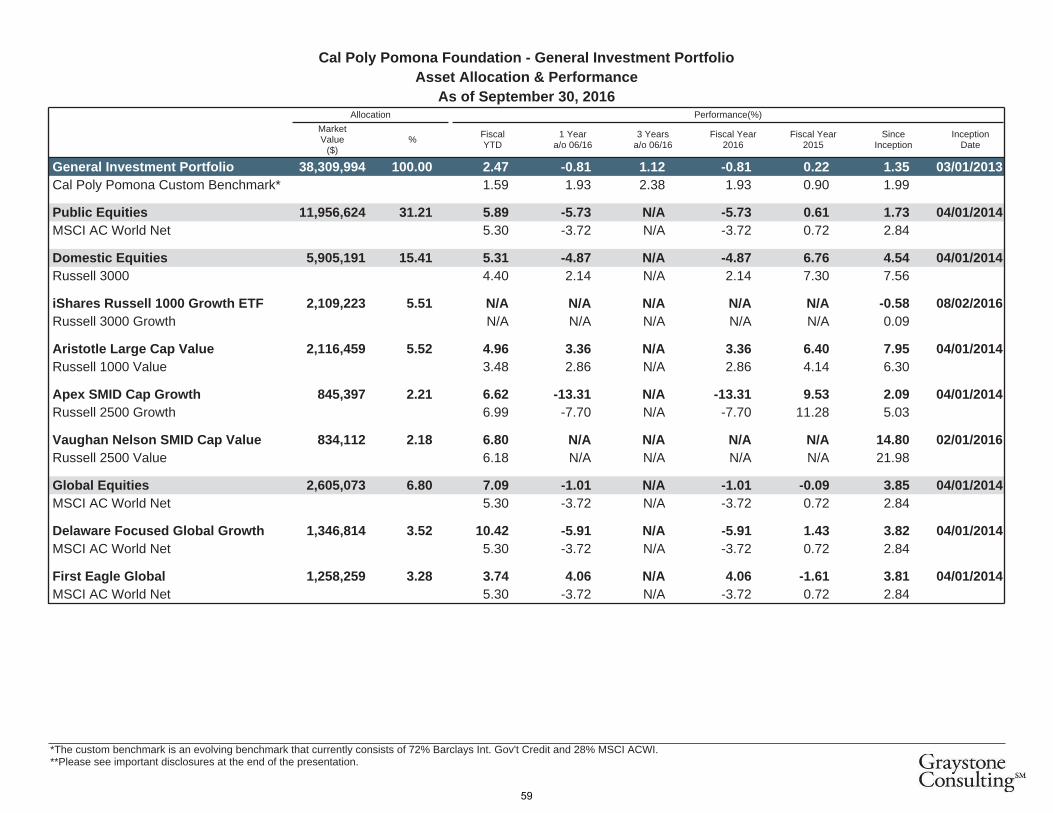
Allocation
MarketValue
($)%
Performance(%)
FiscalYTD
1 Yeara/o 06/16
3 Yearsa/o 06/16
Fiscal Year2016
Fiscal Year2015
SinceInception
InceptionDate
General Investment Portfolio 38,309,994 100.00 2.47 -0.81 1.12 -0.81 0.22 1.35 03/01/2013Cal Poly Pomona Custom Benchmark* 1.59 1.93 2.38 1.93 0.90 1.99
Public Equities 11,956,624 31.21 5.89 -5.73 N/A -5.73 0.61 1.73 04/01/2014MSCI AC World Net 5.30 -3.72 N/A -3.72 0.72 2.84
Domestic Equities 5,905,191 15.41 5.31 -4.87 N/A -4.87 6.76 4.54 04/01/2014Russell 3000 4.40 2.14 N/A 2.14 7.30 7.56
iShares Russell 1000 Growth ETF 2,109,223 5.51 N/A N/A N/A N/A N/A -0.58 08/02/2016Russell 3000 Growth N/A N/A N/A N/A N/A 0.09
Aristotle Large Cap Value 2,116,459 5.52 4.96 3.36 N/A 3.36 6.40 7.95 04/01/2014Russell 1000 Value 3.48 2.86 N/A 2.86 4.14 6.30
Apex SMID Cap Growth 845,397 2.21 6.62 -13.31 N/A -13.31 9.53 2.09 04/01/2014Russell 2500 Growth 6.99 -7.70 N/A -7.70 11.28 5.03
Vaughan Nelson SMID Cap Value 834,112 2.18 6.80 N/A N/A N/A N/A 14.80 02/01/2016Russell 2500 Value 6.18 N/A N/A N/A N/A 21.98
Global Equities 2,605,073 6.80 7.09 -1.01 N/A -1.01 -0.09 3.85 04/01/2014MSCI AC World Net 5.30 -3.72 N/A -3.72 0.72 2.84
Delaware Focused Global Growth 1,346,814 3.52 10.42 -5.91 N/A -5.91 1.43 3.82 04/01/2014MSCI AC World Net 5.30 -3.72 N/A -3.72 0.72 2.84
First Eagle Global 1,258,259 3.28 3.74 4.06 N/A 4.06 -1.61 3.81 04/01/2014MSCI AC World Net 5.30 -3.72 N/A -3.72 0.72 2.84
Cal Poly Pomona Foundation - General Investment PortfolioAsset Allocation & Performance
As of September 30, 2016
*The custom benchmark is an evolving benchmark that currently consists of 72% Barclays Int. Gov't Credit and 28% MSCI ACWI.**Please see important disclosures at the end of the presentation.
59
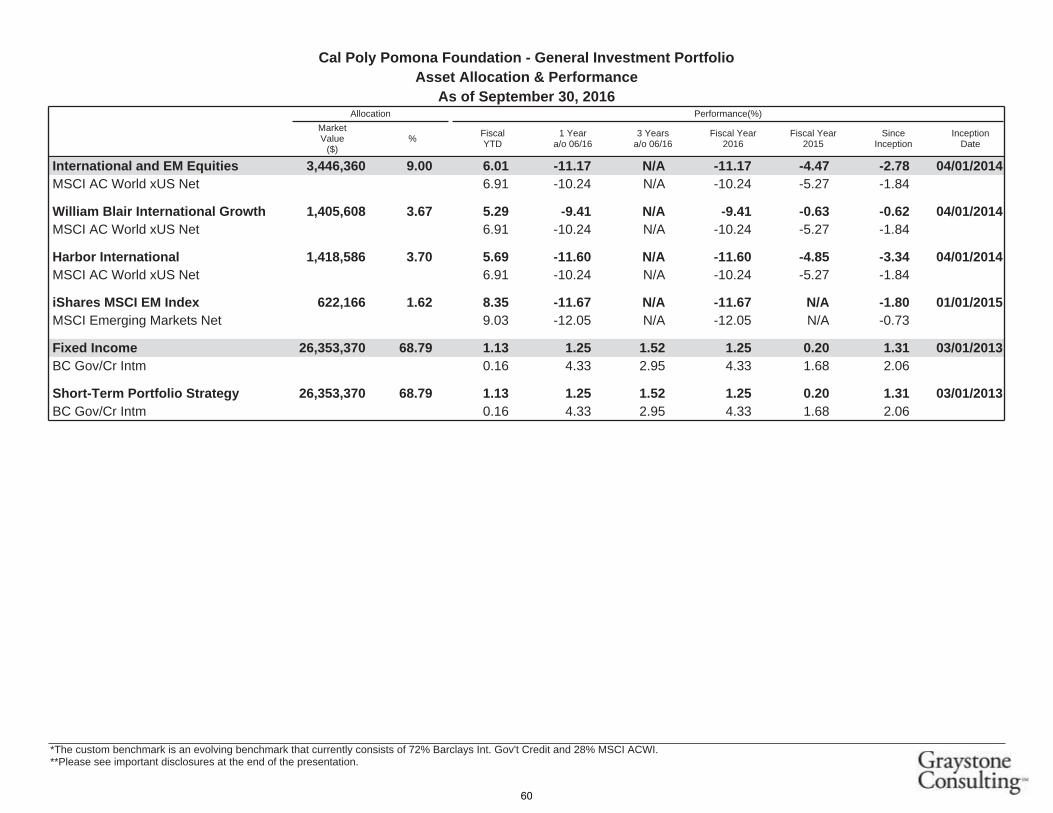
Cal Poly Pomona Foundation - General Investment PortfolioAsset Allocation & Performance
As of September 30, 2016Allocation
MarketValue
($)%
Performance(%)
FiscalYTD
1 Yeara/o 06/16
3 Yearsa/o 06/16
Fiscal Year2016
Fiscal Year2015
SinceInception
InceptionDate
International and EM Equities 3,446,360 9.00 6.01 -11.17 N/A -11.17 -4.47 -2.78 04/01/2014MSCI AC World xUS Net 6.91 -10.24 N/A -10.24 -5.27 -1.84
William Blair International Growth 1,405,608 3.67 5.29 -9.41 N/A -9.41 -0.63 -0.62 04/01/2014MSCI AC World xUS Net 6.91 -10.24 N/A -10.24 -5.27 -1.84
Harbor International 1,418,586 3.70 5.69 -11.60 N/A -11.60 -4.85 -3.34 04/01/2014MSCI AC World xUS Net 6.91 -10.24 N/A -10.24 -5.27 -1.84
iShares MSCI EM Index 622,166 1.62 8.35 -11.67 N/A -11.67 N/A -1.80 01/01/2015MSCI Emerging Markets Net 9.03 -12.05 N/A -12.05 N/A -0.73
Fixed Income 26,353,370 68.79 1.13 1.25 1.52 1.25 0.20 1.31 03/01/2013BC Gov/Cr Intm 0.16 4.33 2.95 4.33 1.68 2.06
Short-Term Portfolio Strategy 26,353,370 68.79 1.13 1.25 1.52 1.25 0.20 1.31 03/01/2013BC Gov/Cr Intm 0.16 4.33 2.95 4.33 1.68 2.06
*The custom benchmark is an evolving benchmark that currently consists of 72% Barclays Int. Gov't Credit and 28% MSCI ACWI.**Please see important disclosures at the end of the presentation.
60

Asset Allocation Over Time
QTDFiscalYTD
1 Yeara/o 06/16
3 Yearsa/o 06/16
Fiscal Year2016
Fiscal Year2015
SinceInception
InceptionDate
General Investment Portfolio 03/01/2013 Beginning Market Value 43,243,289 43,243,289 45,138,316 26,122,666 45,138,316 39,178,257 24,301,287 Net Contributions -6,001,199 -6,001,199 -1,533,642 16,117,492 -1,533,642 5,834,028 12,271,832 Gain/Loss 1,067,904 1,067,904 -361,385 1,003,131 -361,385 126,031 1,736,874 Ending Market Value 38,309,994 38,309,994 43,243,289 43,243,289 43,243,289 45,138,316 38,309,994
QTDFiscalYTD
1 Yeara/o 06/16
3 Yearsa/o 06/16
Fiscal Year2016
Fiscal Year2015
SinceInception
InceptionDate
General Investment Portfolio 2.47 2.47 -0.81 1.12 -0.81 0.22 1.35 03/01/2013Cal Poly Pomona Custom Benchmark 1.59 1.59 1.93 2.38 1.93 0.90 1.99 03/01/2013
US Equity International Equity Global Equity
International-Emerging Equity US Fixed Income Global Mixed Assets
0.0
20.0
40.0
60.0
80.0
100.0
All
oc
ati
on
(%)
2/13 5/13 8/13 11/13 2/14 5/14 8/14 11/14 2/15 5/15 8/15 11/15 2/16 5/16 9/16
Cal Poly Pomona Foundation - General Investment PortfolioPerformance and Asset Allocation History
As of September 30, 2016
*The custom benchmark is an evolving benchmark that currently consists of 72% Barclays Int. Gov't Credit and 28% MSCI ACWI.
**Please see important disclosures at the end of the presentation.
61

I M P O R T A N T D I S C L O S U R E S
To the extent the investments depicted herein represent international securities, you should be aware that there may be additional risks associated with international investing, including foreign economic, political, monetary and/or legal factors, changing currency exchange rates, foreign taxes, and differences in financial and accounting standards. These risks may be magnified in emerging markets. International investing may not be for everyone. Small capitalization companies may lack the financial resources, product diversification and competitive strengths of larger companies. In addition, the securities of small capitalization companies may not trade as readily as, and be subject to higher volatility than, those of larger, more established companies.
Bonds are subject to interest rate risk. When interest rates rise bond prices fall; generally the longer a bond's maturity, the more sensitive it is to this risk. Bonds may also be subject to call risk, which allows the issuer to retain the right to redeem the debt, fully or partially, before the scheduled maturity date. Proceeds from sales prior to maturity may be more or less than originally invested due to changes in market conditions or changes in the credit quality of the issuer.
Investing in alternative investments is speculative, not suitable for all clients, and intended for experienced and sophisticated investors who are willing to bear the high economic risks of the investment, which can include:
• loss of all or a substantial portion of the investment due to leveraging, short‐selling or other speculative investment practices;• lack of liquidity in that there may be no secondary market for the fund and none expected to develop;• volatility of returns; • restrictions on transferring interests in the fund;• potential lack of diversification and resulting higher risk due to concentration of trading authority with a single advisor;• absence of information regarding valuations and pricing;• delays in tax reporting;• less regulation and higher fees than mutual funds; • and advisor risk.
Although the statements and data in this report have been obtained from, and are based upon, sources that the Firm believes to be reliable, we do not guarantee their accuracy, and any such information may be incomplete or condensed. All opinions included in this report constitute the presenters judgment as of the date of this report and are subject to change without notice. This report is for informational purposes only and is not intended as an offer or solicitation with respect to the purchase or sale of any security. Past performance is not a guarantee of future results.
Actual returns would be reduced by expenses that may include management fees and costs of transactions. Expected return and risk (standard deviation) calculations are based on historical data for periods indicated.
The views expressed herein are those of the authors (Graystone Austin, Graystone Columbus/Grand Rapids/Wilkes Barre, Graystone Santa Rosa) and do not necessarily reflect the views of Morgan Stanley Wealth Management or its affiliates. All opinions are subject to change without notice. Neither the information provided nor any opinion expressed constitutes a solicitation for the purchase or sale of any security. Past performance is no guarantee of future results.
© 2016 Graystone Consulting is a business of Morgan Stanley.
62

Cal Poly Pomona Foundation General Investment Portfolio Proposed Portfolio Changes
Graystone Consulting Andrew B. Price, CIMA® (310) 788-2043 Institutional Consulting Director [email protected] Karin Longhurst, CTFA (310) 788-2156 Institutional Consultant [email protected] Todd Au, CIMA® (707) 571-5704 Senior Investment Management Consultant [email protected]
1999 Avenue of the Stars, Suite 2400 Los Angeles, CA 90067
63

Current Portfolio Proposed
Short Term Fixed Income 57.0% 57.0%
Investment Grade Bonds 13.5% 13.5%
High Yield Bonds 1.5% 1.5%
Total Bonds 72.0% 72.0%
US Large Cap Equity 12.0% 13.0%
US Mid Cap Equity 2.5% 2.3%
US Small Cap Equity 2.5% 2.3%
International Equity 9.5% 9.0%
Emerging Markets Equity 1.5% 1.5%
Total Equities 28.0% 28.0%
TOTAL 100.0% 100.0%
FORECASTED STATISTICS
Current Portfolio Proposed
Return 3.5% 3.5%
Volatility 5.6% 5.6%
Sharpe Ratio 0.30 0.30
Probability < 0% 25.8% 25.8%
Yield 1.9% 1.9%
STRATEGIC ASSET ALLOCATION - SUMMARY Report Prepared for CPP Foundation GIP
ASSET ALLOCATION SUMMARY
Please see important disclosures at the end of the presentation.
64

3 Graystone Consulting
Proposed Manager Changes
Please see important disclosures at the end of the presentation.
Asset Class
IPS
Target
IPS
Range Account # Symbol Description $ % $ %
Equities 23% 10-65% 010710 IWF Russell 1000 Growth ETF 2,109,223$ 5.5% 1,532,400$ 4.0%
- - Lazard US Concentrated -$ 0.0% 1,532,400$ 4.0%
010711 - Aristotle Large Value 2,116,459$ 5.5% 1,532,400$ 4.0%
010712 - Apex SMID Growth 845,397$ 2.2% 766,200$ 2.0%
014203 VNVYX Vaughan Nelson SMID Value 834,112$ 2.2% 766,200$ 2.0%
010720 DGGIX Delaware Focus Global 1,346,814$ 3.5% -$ 0.0%
010719 SGIIX First Eagle Global 1,258,259$ 3.3% 1,149,300$ 3.0%
010715 BIGIX William Blair Int'l Growth 1,405,608$ 3.7% 1,436,625$ 3.8%
010714 HAINX Harbor Int'l Value 1,418,586$ 3.7% 1,436,625$ 3.8%
010718 IEMG iShares Core EM ETF 622,166$ 1.6% 574,650$ 1.5%
Fixed Income 65% 40-85% 011546 PLDPX PIMCO Low Duration 6,695,422$ 17.5% 7,278,899$ 19.0%
011546 MWLIX Met West Low Duration 6,652,616$ 17.4% 7,278,899$ 19.0%
011546 GILHX Guggenheim Limited Duration 6,776,024$ 17.7% 7,278,899$ 19.0%
011546 DBLTX DoubleLine Total Return 2,427,098$ 6.3% 2,298,600$ 6.0%
011546 PONPX PIMCO Income 2,067,964$ 5.4% 1,915,500$ 5.0%
011546 EIBIX Eaton Vance Income 622,419$ 1.6% 574,650$ 1.5%
011546 GOBIX Brandywine Global Opps 1,021,671$ 2.7% -$ 0.0%
011546 TGBAX Templeton Global Bond -$ 0.0% 957,750$ 2.5%
Cash 0% 0-20% 011546 - Cash 90,156$ 0.2% -$ 0.0%
Total: 38,309,994$ 100% 38,309,994$ 100%
Current Current Recommended
65

4 Graystone Consulting
Adding Lazard US Equity Concentrated
• Lazard Asset management’s US Equity Concentrated strategy is an all cap core concentrated portfolio that draws upon the firm’s U.S. strategies.
• Lazard employs a bottom-up fundamentally driven process. Portfolios are relatively concentrated, with a long-term holdings range of 15-35. Given the portfolio’s concentration, sectors may deviate significantly from the benchmark.
• In terms of risk statistics, the strategy’s rolling 5 year standard deviation has been far less than or equal to the index since September 2012.
Removing Delaware Focus Global Growth
• Delaware is terminating its relationship with the current sub-advisor Jackson Square Partners and replacing the team with an internal Delaware equity management team.
• The mandate of the fund is being changed from a Global Equity (US plus International equities) to International Small Cap Equity. The changes will be made effective on November 30, 2016.
• We consider these changes to be material and shift the portfolio’s focus away from the intended exposure.
Manager Addition / Removal Summary
Please see important disclosures at the end of the presentation.
66

Large Cap Growth - iShares ETFManager vs Benchmark: ReturnOctober 2006 - September 2016 (not annualized if less than 1 year)
Ret
urn
0
2
4
6
8
10
12
14
16
18
YTD 1 year 3 years 5 years 7 years 10 years
iShares Russell 1000 Growth ETF Russell 1000 Growth
Growth of $100October 2006 - September 2016 (Single Computation)
60
80
100
120
140
160
180
200
220
240
iShares Russell 1000 Growth ETF Russell 1000 Growth
-4%
-2%
0%
Q3 2006 Q4 2007 Q4 2008 Q4 2009 Q4 2010 Q4 2011 Q4 2012 Q4 2013 Q4 2014 Q3 2016
10-Year StatisticsOctober 2006 - September 2016: Summary Statistics
iShares Russell 1000 Growth ETF
Russell 1000 Growth
Return ExcessReturn
StandardDeviation
SharpeRatio
TrackingError
InformationRatio Alpha Beta Maximum
DrawdownUp
CaptureDown
Capture
8.66% -0.19% 16.53% 0.47 0.04% -4.83 -0.16% 1.00 -41.50% 99.04% 100.21%
8.85% 0.00% 16.56% 0.48 0.00% 0.00 0.00% 1.00 -41.42% 100.00% 100.00%
iShares Russell 1000 Growth ETF
Russell 1000 Growth
YTD 2015 2014 2013 2012 2011 2010 2009 2008 2007
5.88% 5.48% 12.84% 33.19% 15.03% 2.47% 16.47% 36.94% -38.48% 11.63%
6.00% 5.67% 13.05% 33.48% 15.26% 2.64% 16.71% 37.21% -38.44% 11.81%
Calendar Year Return Manager vs Benchmark: Return
YTD 1 year 3 years 5 years 7 years 10 years
5.88% 13.57% 11.62% 16.37% 13.90% 8.66%
6.00% 13.76% 11.83% 16.60% 14.11% 8.85%
*Please see important disclosures at the end of the presentation. 67

Large Cap Core - LazardManager vs Benchmark: ReturnOctober 2006 - September 2016 (not annualized if less than 1 year)
Ret
urn
0
2
4
6
8
10
12
14
16
18
20
YTD 1 year 3 years 5 years 7 years 10 years
Lazard - US Equity Concentrated S&P 500
Growth of $100October 2006 - September 2016 (Single Computation)
50
100
150
200
250
300
Lazard - US Equity Concentrated S&P 500
0%
50%
100%
Q3 2006 Q4 2007 Q4 2008 Q4 2009 Q4 2010 Q4 2011 Q4 2012 Q4 2013 Q4 2014 Q3 2016
10-Year StatisticsOctober 2006 - September 2016: Summary Statistics
Lazard - US Equity Concentrated
S&P 500
Return ExcessReturn
StandardDeviation
SharpeRatio
TrackingError
InformationRatio Alpha Beta Maximum
DrawdownUp
CaptureDown
Capture
10.45% 3.21% 17.24% 0.56 4.44% 0.72 3.06% 1.01 -43.85% 110.52% 87.91%
7.24% 0.00% 16.43% 0.39 0.00% 0.00 0.00% 1.00 -45.80% 100.00% 100.00%
Lazard - US Equity Concentrated
S&P 500
YTD 2015 2014 2013 2012 2011 2010 2009 2008 2007
10.46% 7.25% 19.15% 29.66% 18.59% 3.42% 16.54% 45.82% -36.69% 3.17%
7.84% 1.38% 13.69% 32.39% 16.00% 2.11% 15.06% 26.46% -37.00% 5.49%
Calendar Year Return Manager vs Benchmark: Return
YTD 1 year 3 years 5 years 7 years 10 years
10.46% 18.21% 15.60% 19.67% 15.98% 10.45%
7.84% 15.43% 11.16% 16.37% 13.17% 7.24%
*Please see important disclosures at the end of the presentation. 68

Large Cap Value - AristotleManager vs Benchmark: ReturnOctober 2006 - September 2016 (not annualized if less than 1 year)
Ret
urn
0
2
4
6
8
10
12
14
16
18
YTD 1 year 3 years 5 years 7 years 10 years
Aristotle - Large Cap Value Russell 1000 Value
Growth of $100October 2006 - September 2016 (Single Computation)
4060
80
100
120
140
160
180
200
220
240
Aristotle - Large Cap Value Russell 1000 Value
0%
20%
40%60%
Q3 2006 Q4 2007 Q4 2008 Q4 2009 Q4 2010 Q4 2011 Q4 2012 Q4 2013 Q4 2014 Q3 2016
10-Year StatisticsOctober 2006 - September 2016: Summary Statistics
Aristotle - Large Cap Value
Russell 1000 Value
Return ExcessReturn
StandardDeviation
SharpeRatio
TrackingError
InformationRatio Alpha Beta Maximum
DrawdownUp
CaptureDown
Capture
8.52% 2.67% 16.51% 0.46 4.89% 0.55 3.10% 0.90 -42.33% 101.73% 82.63%
5.85% 0.00% 17.67% 0.28 0.00% 0.00 0.00% 1.00 -50.60% 100.00% 100.00%
Aristotle - Large Cap Value
Russell 1000 Value
YTD 2015 2014 2013 2012 2011 2010 2009 2008 2007
11.21% 3.27% 11.27% 30.40% 21.48% -3.60% 18.86% 32.13% -36.53% 10.67%
10.00% -3.83% 13.45% 32.53% 17.51% 0.39% 15.51% 19.69% -36.85% -0.17%
Calendar Year Return Manager vs Benchmark: Return
YTD 1 year 3 years 5 years 7 years 10 years
11.21% 17.63% 11.55% 17.36% 13.70% 8.52%
10.00% 16.19% 9.70% 16.15% 12.34% 5.85%
*Please see important disclosures at the end of the presentation. 69
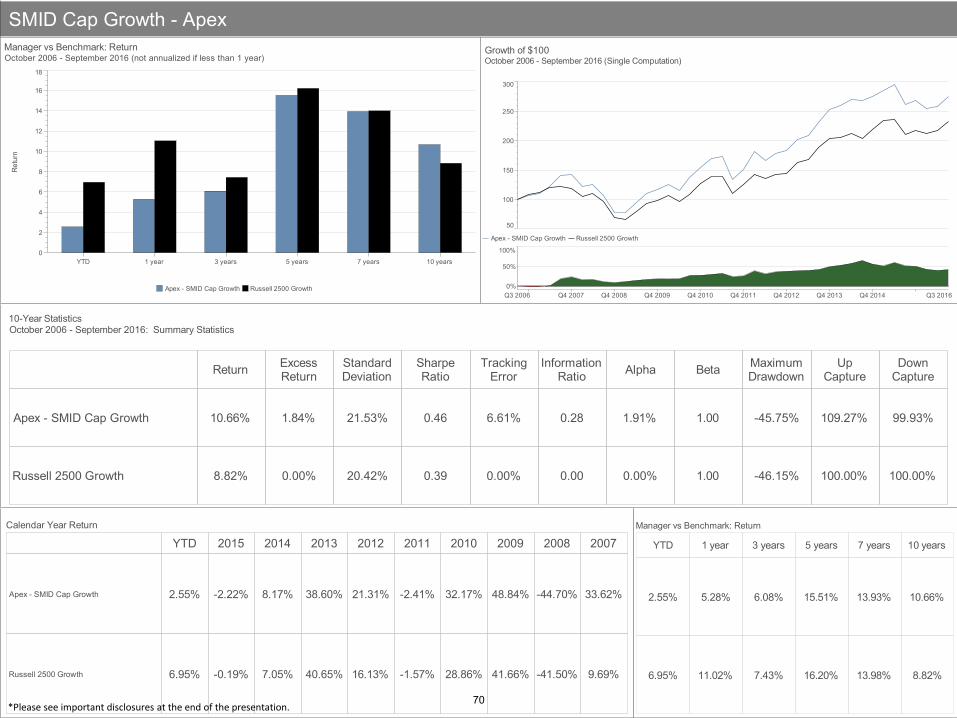
SMID Cap Growth - ApexManager vs Benchmark: ReturnOctober 2006 - September 2016 (not annualized if less than 1 year)
Ret
urn
0
2
4
6
8
10
12
14
16
18
YTD 1 year 3 years 5 years 7 years 10 years
Apex - SMID Cap Growth Russell 2500 Growth
Growth of $100October 2006 - September 2016 (Single Computation)
50
100
150
200
250
300
Apex - SMID Cap Growth Russell 2500 Growth
0%
50%
100%
Q3 2006 Q4 2007 Q4 2008 Q4 2009 Q4 2010 Q4 2011 Q4 2012 Q4 2013 Q4 2014 Q3 2016
10-Year StatisticsOctober 2006 - September 2016: Summary Statistics
Apex - SMID Cap Growth
Russell 2500 Growth
Return ExcessReturn
StandardDeviation
SharpeRatio
TrackingError
InformationRatio Alpha Beta Maximum
DrawdownUp
CaptureDown
Capture
10.66% 1.84% 21.53% 0.46 6.61% 0.28 1.91% 1.00 -45.75% 109.27% 99.93%
8.82% 0.00% 20.42% 0.39 0.00% 0.00 0.00% 1.00 -46.15% 100.00% 100.00%
Apex - SMID Cap Growth
Russell 2500 Growth
YTD 2015 2014 2013 2012 2011 2010 2009 2008 2007
2.55% -2.22% 8.17% 38.60% 21.31% -2.41% 32.17% 48.84% -44.70% 33.62%
6.95% -0.19% 7.05% 40.65% 16.13% -1.57% 28.86% 41.66% -41.50% 9.69%
Calendar Year Return Manager vs Benchmark: Return
YTD 1 year 3 years 5 years 7 years 10 years
2.55% 5.28% 6.08% 15.51% 13.93% 10.66%
6.95% 11.02% 7.43% 16.20% 13.98% 8.82%
*Please see important disclosures at the end of the presentation. 70

SMID Cap Value - Vaughan NelsonManager vs Benchmark: ReturnOctober 2009 - September 2016 (not annualized if less than 1 year)
Ret
urn
0
2
4
6
8
10
12
14
16
18
YTD 1 year 3 years 5 years 7 years
Vaughan Nelson - SMID Cap Value Russell 2500 Value
Growth of $100October 2009 - September 2016 (Single Computation)
80
100
120
140
160
180
200
220
240
Vaughan Nelson - SMID Cap Value Russell 2500 Value
-10%
0%
10%20%
Q3 2009 Q4 2010 Q4 2011 Q4 2012 Q4 2013 Q4 2014 Q4 2015 Q3 2016
7-Year StatisticsOctober 2009 - September 2016: Summary Statistics
Vaughan Nelson - SMID Cap Value
Russell 2500 Value
Return ExcessReturn
StandardDeviation
SharpeRatio
TrackingError
InformationRatio Alpha Beta Maximum
DrawdownUp
CaptureDown
Capture
11.81% -1.00% 16.85% 0.70 5.42% -0.19 -0.70% 0.99 -22.16% 95.16% 100.32%
12.81% 0.00% 16.07% 0.79 0.00% 0.00 0.00% 1.00 -22.26% 100.00% 100.00%
Vaughan Nelson - SMID Cap Value
Russell 2500 Value
YTD 2015 2014 2013 2012 2011 2010
3.41% -3.46% 11.23% 41.52% 16.28% -2.53% 19.96%
14.51% -5.49% 7.11% 33.32% 19.21% -3.36% 24.82%
Calendar Year Return Manager vs Benchmark: Return
YTD 1 year 3 years 5 years 7 years
3.41% 3.39% 6.65% 15.18% 11.81%
14.51% 17.68% 8.05% 16.29% 12.81%
*Please see important disclosures at the end of the presentation. 71

Global Equities - DelawareManager vs Benchmark: ReturnOctober 2009 - September 2016 (not annualized if less than 1 year)
Ret
urn
0
2
4
6
8
10
12
14
16
18
YTD 1 year 3 years 5 years 7 years
Delaware - Focus Global Growth MSCI ACWI (Net)
Growth of $100October 2009 - September 2016 (Single Computation)
80
100
120
140
160
180
200
220
Delaware - Focus Global Growth MSCI ACWI (Net)
0%
20%
40%
Q3 2009 Q4 2010 Q4 2011 Q4 2012 Q4 2013 Q4 2014 Q4 2015 Q3 2016
7-Year StatisticsOctober 2009 - September 2016: Summary Statistics
Delaware - Focus Global Growth
MSCI ACWI (Net)
Return ExcessReturn
StandardDeviation
SharpeRatio
TrackingError
InformationRatio Alpha Beta Maximum
DrawdownUp
CaptureDown
Capture
10.87% 3.10% 15.16% 0.71 4.70% 0.66 2.66% 1.05 -15.32% 119.20% 96.47%
7.77% 0.00% 13.74% 0.56 0.00% 0.00 0.00% 1.00 -17.42% 100.00% 100.00%
Delaware - Focus Global Growth
MSCI ACWI (Net)
YTD 2015 2014 2013 2012 2011 2010
6.97% -0.45% 2.21% 23.67% 17.90% -2.20% 22.53%
6.60% -2.36% 4.16% 22.80% 16.13% -7.35% 12.67%
Calendar Year Return Manager vs Benchmark: Return
YTD 1 year 3 years 5 years 7 years
6.97% 16.08% 5.43% 11.21% 10.87%
6.60% 11.96% 5.17% 10.63% 7.77%
*Please see important disclosures at the end of the presentation. 72

Global Equities - First EagleManager vs Benchmark: ReturnOctober 2006 - September 2016 (not annualized if less than 1 year)
Ret
urn
0
2
4
6
8
10
12
14
16
18
YTD 1 year 3 years 5 years 7 years 10 years
First Eagle Global MSCI ACWI (Net)
Growth of $100October 2006 - September 2016 (Single Computation)
60
80
100
120
140
160
180
200
220
First Eagle Global MSCI ACWI (Net)
0%
20%
40%60%
Q3 2006 Q4 2007 Q4 2008 Q4 2009 Q4 2010 Q4 2011 Q4 2012 Q4 2013 Q4 2014 Q3 2016
10-Year StatisticsOctober 2006 - September 2016: Summary Statistics
First Eagle Global
MSCI ACWI (Net)
Return ExcessReturn
StandardDeviation
SharpeRatio
TrackingError
InformationRatio Alpha Beta Maximum
DrawdownUp
CaptureDown
Capture
7.33% 2.99% 11.68% 0.56 7.57% 0.40 4.19% 0.62 -27.38% 80.03% 56.27%
4.34% 0.00% 18.29% 0.19 0.00% 0.00 0.00% 1.00 -49.31% 100.00% 100.00%
First Eagle Global
MSCI ACWI (Net)
YTD 2015 2014 2013 2012 2011 2010 2009 2008 2007
11.21% -0.66% 3.19% 15.79% 12.73% 0.06% 17.87% 23.22% -20.87% 10.19%
6.60% -2.36% 4.16% 22.80% 16.13% -7.35% 12.67% 34.63% -42.20% 11.66%
Calendar Year Return Manager vs Benchmark: Return
YTD 1 year 3 years 5 years 7 years 10 years
11.21% 16.26% 6.16% 9.42% 8.71% 7.33%
6.60% 11.96% 5.17% 10.63% 7.77% 4.34%
*Please see important disclosures at the end of the presentation. 73

International Equities - William BlairManager vs Benchmark: ReturnOctober 2006 - September 2016 (not annualized if less than 1 year)
Ret
urn
0
2
4
6
8
10
YTD 1 year 3 years 5 years 7 years 10 years
William Blair - International Growth MSCI ACWI ex USA (Net)
Growth of $100October 2006 - September 2016 (Single Computation)
40
60
80
100
120
140
160
William Blair - International Growth MSCI ACWI ex USA (Net)
-10%
0%
10%20%
Q3 2006 Q4 2007 Q4 2008 Q4 2009 Q4 2010 Q4 2011 Q4 2012 Q4 2013 Q4 2014 Q3 2016
10-Year StatisticsOctober 2006 - September 2016: Summary Statistics
William Blair - International Growth
MSCI ACWI ex USA (Net)
Return ExcessReturn
StandardDeviation
SharpeRatio
TrackingError
InformationRatio Alpha Beta Maximum
DrawdownUp
CaptureDown
Capture
3.09% 0.93% 21.26% 0.11 4.04% 0.23 1.05% 1.01 -56.67% 105.52% 99.34%
2.16% 0.00% 20.59% 0.06 0.00% 0.00 0.00% 1.00 -51.68% 100.00% 100.00%
William Blair - International Growth
MSCI ACWI ex USA (Net)
YTD 2015 2014 2013 2012 2011 2010 2009 2008 2007
1.72% -0.03% -2.86% 18.96% 23.96% -14.23% 20.47% 42.63% -52.17% 18.53%
5.82% -5.66% -3.87% 15.29% 16.83% -13.71% 11.15% 41.45% -45.53% 16.65%
Calendar Year Return Manager vs Benchmark: Return
YTD 1 year 3 years 5 years 7 years 10 years
1.72% 6.52% 1.97% 8.83% 6.70% 3.09%
5.82% 9.26% 0.18% 6.04% 3.66% 2.16%
*Please see important disclosures at the end of the presentation. 74
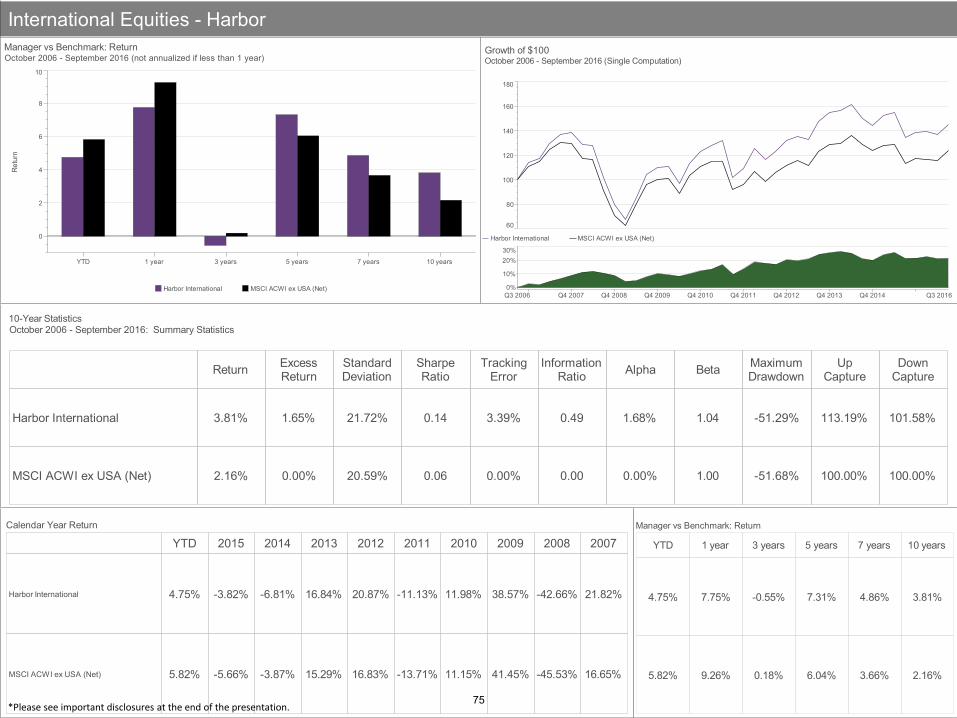
International Equities - HarborManager vs Benchmark: ReturnOctober 2006 - September 2016 (not annualized if less than 1 year)
Ret
urn
0
2
4
6
8
10
YTD 1 year 3 years 5 years 7 years 10 years
Harbor International MSCI ACWI ex USA (Net)
Growth of $100October 2006 - September 2016 (Single Computation)
60
80
100
120
140
160
180
Harbor International MSCI ACWI ex USA (Net)
0%
10%
20%30%
Q3 2006 Q4 2007 Q4 2008 Q4 2009 Q4 2010 Q4 2011 Q4 2012 Q4 2013 Q4 2014 Q3 2016
10-Year StatisticsOctober 2006 - September 2016: Summary Statistics
Harbor International
MSCI ACWI ex USA (Net)
Return ExcessReturn
StandardDeviation
SharpeRatio
TrackingError
InformationRatio Alpha Beta Maximum
DrawdownUp
CaptureDown
Capture
3.81% 1.65% 21.72% 0.14 3.39% 0.49 1.68% 1.04 -51.29% 113.19% 101.58%
2.16% 0.00% 20.59% 0.06 0.00% 0.00 0.00% 1.00 -51.68% 100.00% 100.00%
Harbor International
MSCI ACWI ex USA (Net)
YTD 2015 2014 2013 2012 2011 2010 2009 2008 2007
4.75% -3.82% -6.81% 16.84% 20.87% -11.13% 11.98% 38.57% -42.66% 21.82%
5.82% -5.66% -3.87% 15.29% 16.83% -13.71% 11.15% 41.45% -45.53% 16.65%
Calendar Year Return Manager vs Benchmark: Return
YTD 1 year 3 years 5 years 7 years 10 years
4.75% 7.75% -0.55% 7.31% 4.86% 3.81%
5.82% 9.26% 0.18% 6.04% 3.66% 2.16%
*Please see important disclosures at the end of the presentation. 75

Emerging Markets Index - iShares ETFManager vs Benchmark: ReturnOctober 2013 - September 2016 (not annualized if less than 1 year)
Ret
urn
0
5
10
15
20
YTD 1 year 3 years
iShares - MSCI Emerging Markets ETF MSCI Emerging Markets (Net)
Growth of $100October 2013 - September 2016 (Single Computation)
80
85
90
95
100
105
110
iShares - MSCI Emerging Markets ETF MSCI Emerging Markets (Net)
0%
0.5%
1%1.5%
Q3 2013 Q4 2013 Q2 2014 Q4 2014 Q2 2015 Q4 2015 Q2 2016 Q3 2016
3-Year StatisticsOctober 2013 - September 2016: Summary Statistics
iShares - MSCI Emerging Markets ETF
MSCI Emerging Markets (Net)
Return ExcessReturn
StandardDeviation
SharpeRatio
TrackingError
InformationRatio Alpha Beta Maximum
DrawdownUp
CaptureDown
Capture
-0.34% 0.23% 13.52% -0.03 0.58% 0.39 0.20% 0.98 -21.48% 100.40% 98.22%
-0.56% 0.00% 13.75% -0.05 0.00% 0.00 0.00% 1.00 -22.10% 100.00% 100.00%
iShares - MSCI Emerging Markets ETF
MSCI Emerging Markets (Net)
YTD 2015 2014
15.14% -13.86% -2.04%
16.02% -14.92% -2.19%
Calendar Year Return Manager vs Benchmark: Return
YTD 1 year 3 years
15.14% 16.47% -0.34%
16.02% 16.78% -0.56%
*Please see important disclosures at the end of the presentation. 76

Fixed Income - PIMCOManager vs Benchmark: ReturnOctober 2006 - September 2016 (not annualized if less than 1 year)
Ret
urn
0
0.5
1
1.5
2
2.5
3
3.5
4
YTD 1 year 3 years 5 years 7 years 10 years
PIMCO Low Duration Barclays U.S. Treasury: 1-3 Year
Growth of $100October 2006 - September 2016 (Single Computation)
100
105
110
115
120
125
130
135
140
145
PIMCO Low Duration Barclays U.S. Treasury: 1-3 Year
-10%
0%
10%
20%
Q3 2006 Q4 2007 Q4 2008 Q4 2009 Q4 2010 Q4 2011 Q4 2012 Q4 2013 Q4 2014 Q3 2016
10-Year StatisticsOctober 2006 - September 2016: Summary Statistics
PIMCO Low Duration
Barclays U.S. Treasury: 1-3 Year
Return ExcessReturn
StandardDeviation
SharpeRatio
TrackingError
InformationRatio Alpha Beta Maximum
DrawdownUp
CaptureDown
Capture
3.52% 1.25% 3.46% 0.77 3.62% 0.35 2.85% 0.32 -4.13% 110.47% -394.85%
2.27% 0.00% 1.75% 0.81 0.00% 0.00 0.00% 1.00 -0.96% 100.00% 100.00%
PIMCO Low Duration
Barclays U.S. Treasury: 1-3 Year
YTD 2015 2014 2013 2012 2011 2010 2009 2008 2007
1.80% 0.57% 0.68% 0.00% 6.06% 1.61% 4.86% 13.24% -1.38% 7.81%
1.33% 0.56% 0.63% 0.36% 0.43% 1.55% 2.40% 0.80% 6.67% 7.31%
Calendar Year Return Manager vs Benchmark: Return
YTD 1 year 3 years 5 years 7 years 10 years
1.80% 2.31% 1.23% 2.02% 2.42% 3.52%
1.33% 0.88% 0.86% 0.70% 1.04% 2.27%
*Please see important disclosures at the end of the presentation. 77

Fixed Income - Met WestManager vs Benchmark: ReturnOctober 2006 - September 2016 (not annualized if less than 1 year)
Ret
urn
0
0.5
1
1.5
2
2.5
3
3.5
4
4.5
YTD 1 year 3 years 5 years 7 years 10 years
Met West - Low Duration Bond Barclays U.S. Treasury: 1-3 Year
Growth of $100October 2006 - September 2016 (Single Computation)
80
90
100
110
120
130
140
Met West - Low Duration Bond Barclays U.S. Treasury: 1-3 Year
-20%
0%
20%
Q3 2006 Q4 2007 Q4 2008 Q4 2009 Q4 2010 Q4 2011 Q4 2012 Q4 2013 Q4 2014 Q3 2016
10-Year StatisticsOctober 2006 - September 2016: Summary Statistics
Met West - Low Duration Bond
Barclays U.S. Treasury: 1-3 Year
Return ExcessReturn
StandardDeviation
SharpeRatio
TrackingError
InformationRatio Alpha Beta Maximum
DrawdownUp
CaptureDown
Capture
2.81% 0.55% 4.97% 0.40 5.84% 0.09 5.34% -1.03 -16.87% 79.77% -423.69%
2.27% 0.00% 1.75% 0.81 0.00% 0.00 0.00% 1.00 -0.96% 100.00% 100.00%
Met West - Low Duration Bond
Barclays U.S. Treasury: 1-3 Year
YTD 2015 2014 2013 2012 2011 2010 2009 2008 2007
1.51% 0.45% 1.61% 2.00% 7.86% 1.19% 10.64% 15.35% -14.60% 2.68%
1.33% 0.56% 0.63% 0.36% 0.43% 1.55% 2.40% 0.80% 6.67% 7.31%
Calendar Year Return Manager vs Benchmark: Return
YTD 1 year 3 years 5 years 7 years 10 years
1.51% 1.41% 1.37% 2.79% 4.12% 2.81%
1.33% 0.88% 0.86% 0.70% 1.04% 2.27%
*Please see important disclosures at the end of the presentation. 78

Fixed Income - GuggenheimManager vs Benchmark: ReturnJanuary 2014 - September 2016 (not annualized if less than 1 year)
Ret
urn
0
0.5
1
1.5
2
2.5
3
3.5
4
YTD 1 year
Guggenheim Limited Duration Barclays U.S. Treasury: 1-3 Year
Growth of $100January 2014 - September 2016 (Single Computation)
100
102
104
106
108
110
Guggenheim Limited Duration Barclays U.S. Treasury: 1-3 Year
0%
2%
4%6%
Q4 2013 Q1 2014 Q2 2014 Q3 2014 Q4 2014 Q1 2015 Q2 2015 Q3 2015 Q4 2015 Q1 2016 Q2 2016 Q3 2016
Since Inception StatisticsJanuary 2014 - September 2016: Summary Statistics
Guggenheim Limited Duration
Barclays U.S. Treasury: 1-3 Year
Return ExcessReturn
StandardDeviation
SharpeRatio
TrackingError
InformationRatio Alpha Beta Maximum
DrawdownUp
CaptureDown
Capture
2.84% 1.92% 1.29% 2.14 1.42% 1.35 2.72% 0.13 -0.08% 196.88% -320.62%
0.91% 0.00% 0.71% 1.16 0.00% 0.00 0.00% 1.00 -0.43% 100.00% 100.00%
Guggenheim Limited Duration
Barclays U.S. Treasury: 1-3 Year
YTD 2015 2014
3.51% 1.97% 2.32%
1.33% 0.56% 0.63%
Calendar Year Return Manager vs Benchmark: Return
YTD 1 year
3.51% 3.43%
1.33% 0.88%
*Please see important disclosures at the end of the presentation. 79

Fixed Income - DoubleLineManager vs Benchmark: ReturnOctober 2011 - September 2016 (not annualized if less than 1 year)
Ret
urn
0
1
2
3
4
5
6
YTD 1 year 3 years 5 years
DoubleLine - Total Return Bloomberg Barclays U.S. Aggregate
Growth of $100October 2011 - September 2016 (Single Computation)
100
105
110
115
120
125
DoubleLine - Total Return Bloomberg Barclays U.S. Aggregate
0%
5%
10%
Q3 2011 Q2 2012 Q4 2012 Q2 2013 Q4 2013 Q2 2014 Q4 2014 Q2 2015 Q4 2015 Q3 2016
5-Year StatisticsOctober 2011 - September 2016: Summary Statistics
DoubleLine - Total Return
Barclays U.S. Aggregate
Return ExcessReturn
StandardDeviation
SharpeRatio
TrackingError
InformationRatio Alpha Beta Maximum
DrawdownUp
CaptureDown
Capture
4.54% 1.46% 2.44% 1.83 1.85% 0.79 2.44% 0.67 -1.59% 119.29% 33.35%
3.08% 0.00% 2.69% 1.12 0.00% 0.00 0.00% 1.00 -2.44% 100.00% 100.00%
DoubleLine - Total Return
Barclays U.S. Aggregate
YTD 2015 2014 2013 2012
4.07% 2.32% 6.73% 0.02% 9.16%
5.80% 0.55% 5.97% -2.02% 4.21%
Calendar Year Return Manager vs Benchmark: Return
YTD 1 year
4.07% 3.58%
5.80% 5.19%
3 years
4.26%
4.03%
5 years
4.54%
3.08%
*Please see important disclosures at the end of the presentation. 80

Fixed Income - PIMCOManager vs Benchmark: ReturnOctober 2009 - September 2016 (not annualized if less than 1 year)
Ret
urn
0
2
4
6
8
10
12
YTD 1 year 3 years 5 years 7 years
PIMCO Income Fund Barclays U.S. Aggregate
Growth of $100October 2009 - September 2016 (Single Computation)
100
120
140
160
180
200
PIMCO Income Fund Barclays U.S. Aggregate
0%
50%
100%
Q3 2009 Q4 2010 Q4 2011 Q4 2012 Q4 2013 Q4 2014 Q4 2015 Q3 2016
7-Year StatisticsOctober 2009 - September 2016: Summary Statistics
PIMCO Income Fund
Barclays U.S. Aggregate
Return ExcessReturn
StandardDeviation
SharpeRatio
TrackingError
InformationRatio Alpha Beta Maximum
DrawdownUp
CaptureDown
Capture
10.35% 6.25% 4.63% 2.22 4.75% 1.32 8.55% 0.44 -1.35% 189.36% -95.27%
4.10% 0.00% 2.99% 1.34 0.00% 0.00 0.00% 1.00 -2.44% 100.00% 100.00%
PIMCO Income Fund
Barclays U.S. Aggregate
YTD 2015 2014 2013 2012 2011 2010
7.14% 2.53% 7.09% 4.72% 22.07% 6.28% 20.35%
5.80% 0.55% 5.97% -2.02% 4.21% 7.84% 6.54%
Calendar Year Return Manager vs Benchmark: Return
YTD 1 year 3 years 5 years 7 years
7.14% 7.69% 6.09% 8.77% 10.35%
5.80% 5.19% 4.03% 3.08% 4.10%
*Please see important disclosures at the end of the presentation. 81

Fixed Income - Eaton VanceManager vs Benchmark: ReturnOctober 2006 - September 2016 (not annualized if less than 1 year)
Ret
urn
0
2
4
6
8
10
12
14
16
YTD 1 year 3 years 5 years 7 years 10 years
Eaton Vance Income Barclays U.S. Corporate High Yield
Growth of $100October 2006 - September 2016 (Single Computation)
60
80
100
120
140
160
180
200
220
Eaton Vance Income Barclays U.S. Corporate High Yield
-10%
0%
10%
Q3 2006 Q4 2007 Q4 2008 Q4 2009 Q4 2010 Q4 2011 Q4 2012 Q4 2013 Q4 2014 Q3 2016
10-Year StatisticsOctober 2006 - September 2016: Summary Statistics
Eaton Vance Income
Barclays U.S. Corporate High Yield
Return ExcessReturn
StandardDeviation
SharpeRatio
TrackingError
InformationRatio Alpha Beta Maximum
DrawdownUp
CaptureDown
Capture
6.86% -0.85% 12.86% 0.47 2.27% -0.37 -0.96% 1.03 -30.97% 94.44% 102.60%
7.71% 0.00% 12.26% 0.56 0.00% 0.00 0.00% 1.00 -27.11% 100.00% 100.00%
Eaton Vance Income
Barclays U.S. Corporate High Yield
YTD 2015 2014 2013 2012 2011 2010 2009 2008 2007
11.26% -1.96% 2.96% 7.37% 13.86% 4.85% 15.12% 57.51% -30.11% 2.49%
15.11% -4.47% 2.45% 7.44% 15.81% 4.98% 15.12% 58.21% -26.16% 1.87%
Calendar Year Return Manager vs Benchmark: Return
YTD 1 year 3 years 5 years 7 years 10 years
11.26% 10.04% 5.07% 7.74% 8.41% 6.86%
15.11% 12.73% 5.28% 8.34% 8.75% 7.71%
*Please see important disclosures at the end of the presentation. 82

Global Fixed Income - BrandywineManager vs Benchmark: ReturnOctober 2009 - September 2016 (not annualized if less than 1 year)
Ret
urn
0
2
4
6
8
10
12
14
YTD 1 year 3 years 5 years 7 years
Brandywine Global Opportunities Citi WGBI Unhedged
Growth of $100October 2009 - September 2016 (Single Computation)
90
100
110
120
130
140
150
Brandywine Global Opportunities Citi WGBI Unhedged
0%
20%
40%
Q3 2009 Q4 2010 Q4 2011 Q4 2012 Q4 2013 Q4 2014 Q4 2015 Q3 2016
7-Year StatisticsOctober 2009 - September 2016: Summary Statistics
Brandywine Global Opportunities
Citi WGBI Unhedged
Return ExcessReturn
StandardDeviation
SharpeRatio
TrackingError
InformationRatio Alpha Beta Maximum
DrawdownUp
CaptureDown
Capture
5.36% 3.46% 6.40% 0.82 4.21% 0.82 3.77% 0.84 -10.60% 102.78% 11.00%
1.90% 0.00% 5.82% 0.31 0.00% 0.00 0.00% 1.00 -9.86% 100.00% 100.00%
Brandywine Global Opportunities
Citi WGBI Unhedged
YTD 2015 2014 2013 2012 2011 2010
12.10% -8.63% 6.13% -4.04% 13.16% 7.79% 13.03%
11.07% -3.57% -0.48% -4.00% 1.65% 6.35% 5.17%
Calendar Year Return Manager vs Benchmark: Return
YTD 1 year 3 years 5 years 7 years
12.10% 11.46% 2.65% 3.53% 5.36%
11.07% 9.71% 1.78% 0.77% 1.90%
*Please see important disclosures at the end of the presentation. 83

Global Fixed Income - TempletonManager vs Benchmark: ReturnOctober 2006 - September 2016 (not annualized if less than 1 year)
Ret
urn
-2
0
2
4
6
8
10
12
YTD 1 year 3 years 5 years 7 years 10 years
Templeton Global Bond Citi WGBI Unhedged
Growth of $100October 2006 - September 2016 (Single Computation)
100
120
140
160
180
200
220
Templeton Global Bond Citi WGBI Unhedged
0%
50%
100%
Q3 2006 Q4 2007 Q4 2008 Q4 2009 Q4 2010 Q4 2011 Q4 2012 Q4 2013 Q4 2014 Q3 2016
10-Year StatisticsOctober 2006 - September 2016: Summary Statistics
Templeton Global Bond
Citi WGBI Unhedged
Return ExcessReturn
StandardDeviation
SharpeRatio
TrackingError
InformationRatio Alpha Beta Maximum
DrawdownUp
CaptureDown
Capture
6.50% 2.40% 7.23% 0.78 8.09% 0.30 5.06% 0.38 -7.73% 48.36% -64.35%
4.10% 0.00% 7.40% 0.44 0.00% 0.00 0.00% 1.00 -9.86% 100.00% 100.00%
Templeton Global Bond
Citi WGBI Unhedged
YTD 2015 2014 2013 2012 2011 2010 2009 2008 2007
-1.54% -4.03% 1.84% 2.41% 16.15% -2.21% 13.00% 19.21% 6.47% 11.26%
11.07% -3.57% -0.48% -4.00% 1.65% 6.35% 5.17% 2.55% 10.89% 10.95%
Calendar Year Return Manager vs Benchmark: Return
YTD 1 year 3 years 5 years 7 years 10 years
-1.54% 0.68% -0.39% 2.99% 3.81% 6.50%
11.07% 9.71% 1.78% 0.77% 1.90% 4.10%
*Please see important disclosures at the end of the presentation. 84
I M P O R T A N T D I S C L O S U R E S
To the extent the investments depicted herein represent international securities, you should be aware that there may be additional risks associated with international investing, including foreign economic, political, monetary and/or legal factors, changing currency exchange rates, foreign taxes, and differences in financial and accounting standards. These risks may be magnified in emerging markets. International investing may not be for everyone. Small capitalization companies may lack the financial resources, product diversification and competitive strengths of larger companies. In addition, the securities of small capitalization companies may not trade as readily as, and be subject to higher volatility than, those of larger, more established companies.
Bonds are subject to interest rate risk. When interest rates rise bond prices fall; generally the longer a bond's maturity, the more sensitive it is to this risk. Bonds may also be subject to call risk, which allows the issuer to retain the right to redeem the debt, fully or partially, before the scheduled maturity date. Proceeds from sales prior to maturity may be more or less than originally invested due to changes in market conditions or changes in the credit quality of the issuer.
Investing in alternative investments is speculative, not suitable for all clients, and intended for experienced and sophisticated investors who are willing to bear the high economic risks of the investment, which can include:
• loss of all or a substantial portion of the investment due to leveraging, short‐selling or other speculative investment practices;• lack of liquidity in that there may be no secondary market for the fund and none expected to develop;• volatility of returns; • restrictions on transferring interests in the fund;• potential lack of diversification and resulting higher risk due to concentration of trading authority with a single advisor;• absence of information regarding valuations and pricing;• delays in tax reporting;• less regulation and higher fees than mutual funds; • and advisor risk.
Although the statements and data in this report have been obtained from, and are based upon, sources that the Firm believes to be reliable, we do not guarantee their accuracy, and any such information may be incomplete or condensed. All opinions included in this report constitute the presenters judgment as of the date of this report and are subject to change without notice. This report is for informational purposes only and is not intended as an offer or solicitation with respect to the purchase or sale of any security. Past performance is not a guarantee of future results.
Actual returns would be reduced by expenses that may include management fees and costs of transactions. Expected return and risk (standard deviation) calculations are based on historical data for periods indicated.
The views expressed herein are those of the authors (Graystone Austin, Graystone Columbus/Grand Rapids/Wilkes Barre, Graystone Santa Rosa) and do not necessarily reflect the views of Morgan Stanley Wealth Management or its affiliates. All opinions are subject to change without notice. Neither the information provided nor any opinion expressed constitutes a solicitation for the purchase or sale of any security. Past performance is no guarantee of future results.
© 2016 Graystone Consulting is a business of Morgan Stanley.
85

CAL POLY POMONA FOUNDATION, INC.INVESTMENT SUMMARY AS OF SEPTEMBER 30, 2016
Policy Range Policy Range Total Graystone Common Fund FoundationAsset Class Minimum Maximum Policy Target Portfolio Allocation Portfolio Amount Portfolio Amount Portfolio Amount Portfolio Amount
Equities Domestic & Int'l (Dev & Emerging 10% 65% 23% 30% 11,956,624 11,956,624 Fixed Income 40% 85% 65% 65% 26,263,214 26,263,214 Cash Equivalents 0% 20% 0% 0% 90,156 90,156 Real Assets 0% 10% 2% 0% - - Real Estate 0% 10% 0% 0% - Alternative Investments 0% 25% 10% 5% Private Equity & Capital Partners 827,808 827,808 Innovation Way Infrastructure 1,389,088 1,389,088
100% 100% 40,526,890 38,309,994 827,808 1,389,088
86

This document is for institutional use only and redistribution is expressly prohibited.
Summary Investment Report
All Accounts
Cal Poly Pomona Foundation
July 1, 2016 - September 30, 2016
87

All Accounts
All fund returns are net of fees. Past performance is no assurance of future returns.
11/7/2016 7:51:06 PM Cal Poly Pomona Foundation 1
TOTAL PORTFOLIO MARKET VALUE AS OF 9/30/2016
Investment CategoryAdjusted
Market Value Allocation %
Portfolio Total Core Funds $790,438.00 100.00%
Portfolio Total $790,438.00 100.00%
88

All Accounts
All fund returns are net of fees. Past performance is no assurance of future returns.
11/7/2016 7:51:06 PM Cal Poly Pomona Foundation 2
NON-MARKETABLE INVESTMENTS SINCE INCEPTION TO VALUE DATE
Non-Marketable Fund Incep. Date Commitment Capital Calls DistributionsNet Income/
(Loss) Value Date Market Value IRR Multiple
Private Equity Partners VII 9/30/2007 $750,000.00 $647,625.00 ($409,810.00) $391,541.00 6/30/2016 $629,356.00 12.22% 1.60
Capital Partners IV 9/30/2007 $250,000.00 $222,500.00 ($140,738.00) $116,690.00 6/30/2016 $198,452.00 9.15% 1.52
Total Core Funds $1,000,000.00 $870,125.00 ($550,548.00) $508,231.00 $827,808.00 11.33% 1.58Non-Marketable Total $1,000,000.00 $870,125.00 ($550,548.00) $508,231.00 $827,808.00 11.33% 1.58
NON-MARKETABLE INVESTMENTS ROLL FORWARD FROM VALUE DATE TO 9/30/2016
Non-Marketable Fund Incep. Date CommitmentValuation
DateMost Recent
Valuation
Capital Callssince Valuation
Date
Distributionssince Valuation
DateAdjusted
Market Value
Private Equity Partners VII 9/30/2007 $750,000.00 6/30/2016 $629,356.00 $11,250.00 ($40,817.00) $599,789.00
Capital Partners IV 9/30/2007 $250,000.00 6/30/2016 $198,452.00 $625.00 ($8,428.00) $190,649.00
Total Core Funds $1,000,000.00 $827,808.00 $11,875.00 ($49,245.00) $790,438.00Non-Marketable Total $1,000,000.00 $827,808.00 $11,875.00 ($49,245.00) $790,438.00
* Note: Month-end adjusted balances for marketable cash funds reflect the impact of pending cash subscriptions. Adjusted Balances for non-marketable securities reflect the impact of all cash transactions
that have posted since the last valuation date.
1. IRR and multiple performance calculations are net of all fees and carried interest
2. IRR, or internal rate of return, represents the annualized implied discount rate calculated from the cash flows to/from the partnerships since inception of the respective partnership through the value date3. Multiple represents a cash-on-cash return calculated by adding distributions to the ending market value and dividing the total value by capital called – ((Distributions to date + Adjusted ending market
value)/$ called to date)
89

All Accounts
All fund returns are net of fees. Past performance is no assurance of future returns.
11/7/2016 7:51:06 PM Cal Poly Pomona Foundation 3
PORTFOLIO PERFORMANCE AS OF 9/30/2016
ASSETS INVESTMENT PERFORMANCE
InvestmentMarket Value
($)Average
Allocation
MTD QTD CYTD 1 Year 3 Years 5 Years 10 YearsAccount
InceptionAccount
Inception Date
Private Equity Partners VII 599,789 75.9% 0.00 3.74 8.73 9.62 16.80 14.33 4.36 12/31/2007US Private Equity 599,789 75.9% 0.00 3.74 8.73 9.62 16.80 14.33 4.36 12/31/2007Capital Partners IV 190,649 24.1% 0.00 2.82 4.05 2.88 12.04 10.17 1.89 12/31/2007Multi-Asset 190,649 24.1% 0.00 2.82 4.05 2.88 12.04 10.17 1.89 12/31/2007Total Non-Marketable 790,438 100.0% 0.00 3.52 7.56 7.91 15.57 13.19 -4.72 -3.14 9/30/2005Total Portfolio 790,438 100.0% 0.00 3.52 7.56 7.91 17.83 18.62 0.00 3.15 9/30/2003
90

All Accounts
All fund returns are net of fees. Past performance is no assurance of future returns.
11/7/2016 7:51:06 PM Cal Poly Pomona Foundation 4
Important Notes | Marketable Performance• The information included in this report is presented solely for the recipient named on the cover page of this report and its authorized representatives. The information provided may not be
reproduced or otherwise disseminated in whole or in part without our prior written consent. Neither the information nor any opinion contained in this report constitutes a solicitation or offer byCommonfund Asset Management Company, Inc., Commonfund Capital, Inc., or its affiliates (together “Commonfund”) to buy or sell any securities or securities derivatives products of any kind orprovide any investment advice or service.
• Returns include closed account history in group composites, if applicable.• All investment strategies have the potential for profit or loss. Changes in investment strategies, contributions or withdrawals may materially alter the performance, strategy and results of your
portfolio.• Different types of investments involve varying degrees of risk, and there can be no assurance that any specific investment will either be suitable or profitable for a client’s investment portfolio.• Unless otherwise indicated, any performance shown is unaudited, net of applicable underlying fund management, performance and other fees, and expenses. Performance shown presumes
reinvestment of earnings and excludes investor specific sales and other charges. Fees may be modified or waived for certain investors. Please refer to the specific funds offering documents formore information regarding the fund’s fees, charges and expenses, which will offset its gains. If returns are indicated as gross, such returns do not reflect the deduction of any fees or expenses.Fees and expenses, including management and performance fees, will reduce gross returns. Performance may vary substantially from year to year or even from month to month. An investor’sactual performance and actual fees may differ from the performance information shown due to, among other factors, capital contributions and withdrawals/redemptions, different share classes andeligibility to participate in “new issues.” The value of investments can go down as well as up. Past performance is not indicative of future results.
• Benchmarks, financial indices, and composite indices are shown for illustrative purposes only and are provided for the purpose of making general market data available as a point of referenceonly. Such benchmarks and financial indices may not be available for direct investment, may be unmanaged, assume reinvestment of income, do not reflect the impact of any tradingcommissions and costs, management or performance fees, and have limitations when used for comparison or other purposes because they, among other reasons, may have different tradingstrategy, volatility, credit, or other material characteristics (such as limitations on the number and types of securities or instruments). Commonfund fund’s investment objective is not restricted tothe securities and instruments comprising any one index. No representation is made that any benchmark or index is an appropriate measure for comparison. The information is gathered fromsources we believe are reliable but we cannot ensure accuracy. Commonfund does not guarantee the accuracy, completeness or timeliness of such information and such information is subject tochange, either expressly or impliedly, for any particular purpose.
• Performance is calculated monthly. Therefore, returns for any investments in any fund for less than a full month are not included in these performance figures.
Important Notes | Non-Marketable Performance• Investments in Programs for Commonfund Capital and Commonfund Realty are carried as of the most recent valuation date, which may not correspond to the marketable securities valuation
dates.• All performance data set forth herein is net of all fees and carried interest. Internal Rates of Return (IRR) should be evaluated in light of information on the investment program of the partnership,
the risks associated therewith, and performance of the partnership as disclosed in the Offering Memorandum for the partnership, the Audited Annual Reports of the partnership and the QuarterlyReports of the partnership. Return information is presented for these partnerships on a dollar-weighted (e.g. internal rate of return) basis, which is standard for the private capital industry, ratherthan the time-weighted (i.e., annual or other period rate of return) basis, which is used principally to report performance of publicly-traded securities. The IRR since inception is the most commonlyused calculation methodology for presentation of performance in the private capital business. Comparison of returns calculated on an IRR basis with returns on a time-weighted basis is notappropriate. For a description of the two return calculation methods, see Measuring Investment returns, Time vs. Dollar-Weighted – What’s the Difference? A copy is available from Commonfund.
• Distressed Debt programs are reported with a one quarter lag. For example, if the report 'As of' date is 9/30/YY then Distressed Debt programs are represented using 6/30/YY, or previous quartervalues.
• Private Capital and Real Estate programs are reported with a one quarter lag. For example, if the report 'As of' date is 9/30/YY then Private Capital and Real Estate programs are representedusing 6/30/YY, or previous quarter values.
• Private Capital and Commonfund Realty Partners I, L.P. returns are normally reported as an Internal Rate of Return (IRR). All other Commonfund investment returns are reported as TimeWeighted Rates of Return (TWR). For Consolidated Performance reporting purposes, TWRs are used for all individual and composite returns.
91

All Accounts
All fund returns are net of fees. Past performance is no assurance of future returns.
11/7/2016 7:51:06 PM Cal Poly Pomona Foundation 5
Important Notes | Description of Indices
The HFRI Monthly Indices (HFRI) are equally weighted performance indexes, utilized by numerous hedge fund managers as a benchmark for their own hedge funds. The HFRI are broken down into 4main strategies, each with multiple sub-strategies. All single-manager HFRI Index constituents are included in the HFRI Fund Weighted Composite, which accounts for over 2000 funds listed on theinternal HFR Database. Due to mutual agreements with the hedge fund managers listed in the HFR Database, we are not at liberty to disclose the particular funds behind any index to non-databasesubscribers. Funds included in the HFRI Monthly Indices must: Report monthly returns, Report Net of All Fees Returns, Report assets in USD, Have at least $50 Million under management or have beenactively trading for at least twelve (12) months. Funds are eligible for inclusion in the HFRI the month after their addition to HFR Database. For instance, a fund that is added to HFR Database in June iseligible for inclusion in the indices upon reporting their July performance. The HFRI are updated three times a month: Flash Update (5th business day of the month), Mid Update (15th of the month), andEnd Update (1st business day of following month). The current month and the prior three months are left as estimates and are subject to change. All performance prior to that is locked and is no longersubject to change. If a fund liquidates/closes, that fund's performance will be included in the HFRI as of that fund's last reported performance update. The HFRI Fund of Funds Index is not included in theHFRI Fund Weighted Composite Index. Both domestic and offshore funds are included in the HFRI. In cases where a manager lists mirrored-performance funds, only the fund with the larger asset size is
included in the HFRI.
See https://www.hedgefundresearch.com/index.php?fuse=indices-faq&1319810221
The MSCI EAFE Index (Europe, Australasia, Far East) is a free float-adjusted market capitalization index that is designed to measure the equity market performance of developed markets, excluding theUS & Canada. The MSCI EAFE Index consists of the following 21 developed market country indexes: Australia, Austria, Belgium, Denmark, Finland, France, Germany, Hong Kong, Ireland, Israel, Italy,
Japan, the Netherlands, New Zealand, Norway, Portugal, Singapore, Spain, Sweden, Switzerland, and the United Kingdom (List as of June 2014).
The MSCI US REIT Index is a free float�adjusted market capitalization weighted index that is comprised of Equity REIT securities. The MSCI US REIT Index includes securities with exposure to core real
estate (e.g. residential and retail properties) as well as securities with exposure to other types of real estate (e.g. casinos, theaters).
The MSCI ACWI Index is a free float-adjusted market capitalization weighted index that is designed to measure the equity market performance of developed and emerging markets. The MSCI ACWIconsists of 46 country indexes comprising 23 developed and 23 emerging market country indexes. The developed market country indexes included are: Australia, Austria, Belgium, Canada, Denmark,Finland, France, Germany, Hong Kong, Ireland, Israel, Italy, Japan, Netherlands, New Zealand, Norway, Portugal, Singapore, Spain, Sweden, Switzerland, the United Kingdom and the United States. Theemerging market country indexes included are: Brazil, Chile, China, Colombia, Czech Republic, Egypt, Greece, Hungary, India, Indonesia, Korea, Malaysia, Mexico, Peru, Philippines, Poland, Qatar,
Russia, South Africa, Taiwan, Thailand, Turkey, and United Arab Emirates. (List as of June 2014).
The CSFB Leveraged Loan Index is an index designed to mirror the investable universe of the $US-denominated leveraged loan market. The index inception is January 1992. The index frequency ismonthly. New loans are added to the index on their effective date if they qualify according to the following criteria: Loans must be rated “5B” or lower; only fully- funded term loans are included; the tenormust be at least one year; and the Issuers must be domiciled in developed countries (Issuers from developing countries are excluded). Fallen angels are added to the index subject to the new loan criteria.Loans are removed from the index when they are upgraded to investment grade, or when they exit the market (for example, at maturity, refinancing or bankruptcy workout). Note that issuers remain in theindex following default. Total return of the index is the sum of three components: principal, interest, and reinvestment return. The cumulative return assumes that coupon payments are reinvested into the
index at the beginning of each period.
The MSCI ACWI ex USA Index captures large and mid-cap representation across 22 of 23 Developed Markets (DM) countries*--excluding the United States. With 1,003 constituents, the index covers
approximately 85% of the free float-adjusted market capitalization in each country.
The MSCI Emerging Markets Index is a free float-adjusted market capitalization index that is designed to measure equity market performance of emerging markets. The MSCI Emerging Markets Indexconsists of the following 23 emerging market country indexes: Brazil, Chile, China, Colombia, Czech Republic, Egypt, Greece, Hungary, India, Indonesia, Korea, Malaysia, Mexico, Peru, Philippines,
Poland, Qatar, Russia, South Africa, Taiwan, Thailand, Turkey and United Arab Emirates (List as of June 2014).
The Dow Jones U.S. Select Real Estate Securities Index (RESI) represents equity real estate investment trusts (REITs) and real estate operating companies (REOCs) traded in the U.S. The Dow
Jones U.S. Select REIT Index is a subset of the Dow Jones Americas Select RESISM and includes only REITs and REIT-like securities.
92

All Accounts
All fund returns are net of fees. Past performance is no assurance of future returns.
11/7/2016 7:51:06 PM Cal Poly Pomona Foundation 6
The S&P Global Natural Resources Index includes 90 of the largest publicly-traded companies in natural resources and commodities businesses that meet specific investability requirements, offering
investors diversified and investable equity exposure across 3 primary commodity-related sectors: agribusiness, energy, and metals & mining.
The Bloomberg Commodity Index (BCOM) is calculated on an excess return basis and reflects commodity futures price movements. The index rebalances annually weighted 2/3 by trading volume and
1/3 by world production and weight-caps are applied at the commodity, sector and group level for diversification. Roll period typically occurs from 6th-10th business day based on the roll schedule.
The Barclays Capital U.S. Aggregate Bond Index measures the performance of the U.S. investment grade bond market. The index invests in a wide spectrum of public, investment-grade, taxable, fixedincome securities in the United States - including government, corporate, and international dollar-denominated bonds, as well as mortgage-backed and asset-backed securities, all with maturities of more
than 1 year.
The Barclays Capital U.S. Treasury Inflation Protected Securities (TIPS) Index includes all publicly issued, U.S. Treasury inflation-protected securities that have at least one year remaining to maturity,
are rated investment grade, and have $250 million or more of outstanding face value.
The Citigroup World Government Bond Index (WGBI) measures the performance of fixed-rate, local currency, investment grade sovereign bonds. The WGBI is a widely used benchmark that currentlycomprises sovereign debt from over 20 countries, denominated in a variety of currencies, and has more than 25 years of history available. The WGBI provides a broad benchmark for the global sovereign
fixed income market. Sub-indices are available in any combination of currency, maturity, or rating.
The BofA Merrill Lynch 1-3 US Year Treasury Index is an unmanaged index that tracks the performance of the direct sovereign debt of the U.S. Government having a maturity of at least one year and
less than three years. It is not possible to invest directly in an unmanaged index.
The S&P 500 Index is a widely recognized gauge of the U.S. equities market. This index is an unmanaged capitalization-weighted index consisting of 500 of the largest capitalization U.S. common stocks.
The returns of the S&P 500 include the reinvestment of dividends.
The Russell 2000 Index measures the performance of the small-cap segment of the U.S. equity universe. The Russell 2000 Index is a subset of the Russell 3000 Index representing approximately 10% ofthe total market capitalization of that index. It includes approximately 2000 of the smallest securities based on a combination of their market cap and current index membership. The Russell 2000 isconstructed to provide a comprehensive and unbiased small-cap barometer and is completely reconstituted annually to ensure larger stocks do not distort the performance and characteristics of the true
small-cap opportunity set.
The Russell 3000 Index measures the performance of the largest 3,000 U.S. companies representing approximately 98% of the investable U.S. equity market. The Russell 3000 Index is constructed to
provide a comprehensive, unbiased and stable barometer of the broad market and is completely reconstituted annually to ensure new and growing equities are reflected.
93

This document is for institutional use only and redistribution is expressly prohibited.
Wilton, ConnecticutTel 203 563 5000
San Francisco, CaliforniaTel 415 433 8800
London, United KingdomTel +44 20 7887 1540
Beijing, ChinaTel +86 10 5968 0198www.commonfund.org
This communication has been approved for distribution in the UK by Commonfund UK Limited, which is authorised and regulated by the UK Financial Conduct Authority. Only certain services provided by Commonfund UK Limited are regulated by the UK Financial Conduct Authority. Please contact the London office for further information on these services.
94

,dDate November 17,2016
Board of DirectorsCal Poly Pomona Foundation, lnc.
-,4David F. P renov gsfu/ S"/,*.olChief Financial Officer
lvl r
BdhryPmmrtoundation
Subject: INCOME TAX RETURN FORM 990 & 990-T Review
The Foundation is required to annually file the following Federal returns:
Form 990 Return of Organization Exempt from lncome Tax
Form 990-T Exempt Organization Business lncome Tax Return
ln addition, the Foundation must also file the corresponding State returns (Form 199 and Form 109) as well as
iil iil iRF-1 Annuat Registration Renewal Fee Report to Attorney General of California'
The Federal Form 990 part Vl Governance, Management and Disclosure requests the following information
under Section B Policies question 1 1a and 1 1 b:
1 1a. Has the organization provided a complete copy of this Form 990 to all members of its governing
body before filing the form?
llb.DescribeinScheduleotheprocess'ifany,usedbytheorganizationtoreviewthisForm990.
AccordinglywehaveprovidedallmembersofthegoverningbodyacompletecoPyol.Fq''990andall.rpp"rti^g'".n"aules along with the Foundation s Form g90 neview Policy # 124 for their review before
finaiizing and filing the Federal and State returns'
The following resolution is recommended for approval by the Finance Committee:
Recommended Action: The members of the Board of Directors have been provlded with a complete copy of
the Foundation,s Form 990 f"*i"ir, "no
all supporting schedules, and request the following resolution be
approved:
Now therefore be it resolved thatthe Foundation's Form 990 Tax return and all supporting schedules have
1""^ iri"riO"o too all members of the Board of Directors before the return is filed'
PASSED AND ADOPTED THIS 29th DAY OF NOVEMBER 2016.
ryBy
B of Directors
Memorandum
From:
To:
95
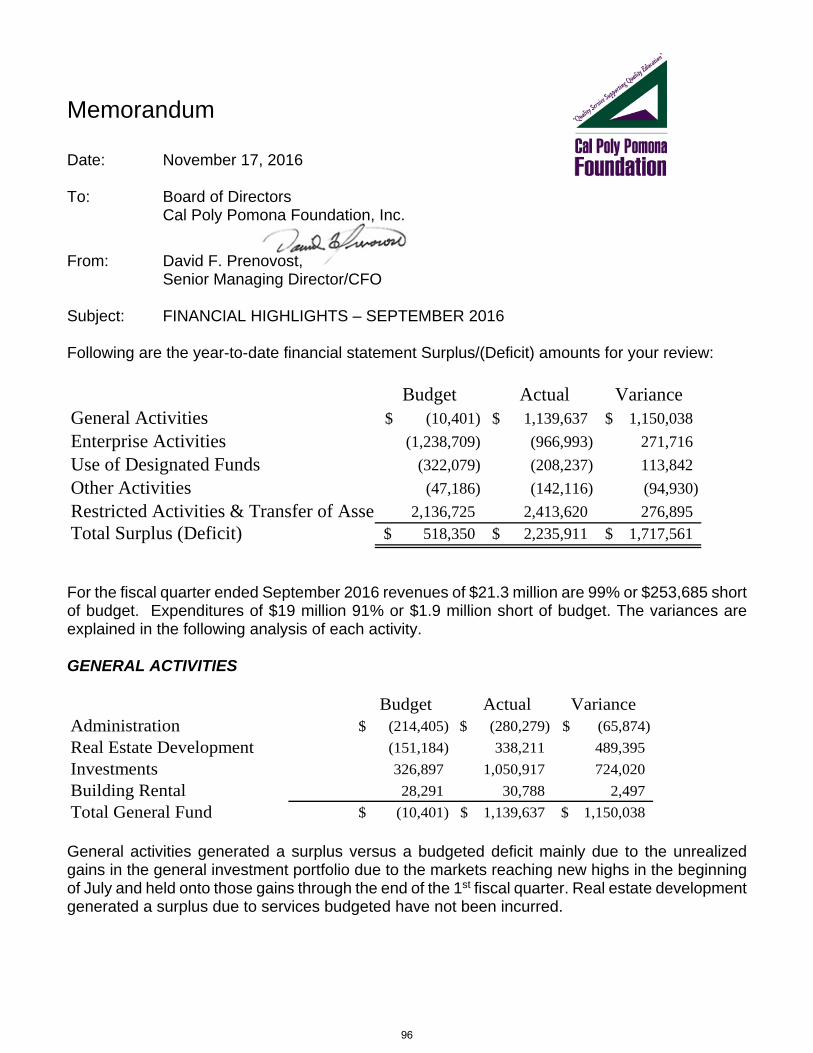
Memorandum Date: November 17, 2016 To: Board of Directors Cal Poly Pomona Foundation, Inc.
From: David F. Prenovost, Senior Managing Director/CFO Subject: FINANCIAL HIGHLIGHTS – SEPTEMBER 2016 Following are the year-to-date financial statement Surplus/(Deficit) amounts for your review:
Budget Actual VarianceGeneral Activities (10,401)$ 1,139,637$ 1,150,038$
Enterprise Activities (1,238,709) (966,993) 271,716
Use of Designated Funds (322,079) (208,237) 113,842
Other Activities (47,186) (142,116) (94,930)
Restricted Activities & Transfer of Asse 2,136,725 2,413,620 276,895
Total Surplus (Deficit) 518,350$ 2,235,911$ 1,717,561$
For the fiscal quarter ended September 2016 revenues of $21.3 million are 99% or $253,685 short of budget. Expenditures of $19 million 91% or $1.9 million short of budget. The variances are explained in the following analysis of each activity. GENERAL ACTIVITIES
Budget Actual VarianceAdministration (214,405)$ (280,279)$ (65,874)$
Real Estate Development (151,184) 338,211 489,395
Investments 326,897 1,050,917 724,020
Building Rental 28,291 30,788 2,497
Total General Fund (10,401)$ 1,139,637$ 1,150,038$ General activities generated a surplus versus a budgeted deficit mainly due to the unrealized gains in the general investment portfolio due to the markets reaching new highs in the beginning of July and held onto those gains through the end of the 1st fiscal quarter. Real estate development generated a surplus due to services budgeted have not been incurred.
96

ENTERPRISES ACTIVITIES
Surplus/(Deficit)
Budget Actual Variance
(1,238,709)$ (966,993)$ 271,716$ Enterprise revenues of $6.5 million are 96% or $294,674 short of budget mainly due to bookstore activities; expenditures of $7.5 million are 93% or $566,390 short of budget resulting in a deficit less than budget. Following is the summary of each Enterprise Activities:
BOOKSTORES
Surplus/(Deficit)
Budget Actual Variance
164,275$ 118,597$ (45,678)$ Bookstore revenues are 36% of Enterprise revenues and are 86% or $320,000 short of budget mainly due to new and used textbook sales/rentals, hardware sales and rental rebates. Cost of goods is 71% versus 70%; expenditures are 23% versus 23% of budget generating a surplus of 5% versus 7% budgeted. We continue to focus on used and rental books as well as digital textbook options to reduce the increasing costs for textbooks. The Presidential Order also continues to support the sales in the bookstore.
DINING SERVICES
Surplus/(Deficit)
Budget Actual Variance
(612,809)$ (403,521)$ 209,288$ Dining Service revenues are 42% of Enterprise Activities and exceed budget by 6% or $145,033, cost of goods is 30% versus 30% of budget and payroll and expenditures are 86% versus 95% of budget. Retail Operations - This reporting unit includes the retail units at Campus Center Marketplace and Bronco Student Center, convenient stores, vending, Kellogg West Catering/Conference Foods and commission vending. Revenues exceed budget by 7% or $113,608; cost of goods is 30% versus 31% of budget and payroll and expenditures are 84% versus 95% of budget generating a deficit of $249,216 versus a budgeted deficit of $436,601. Board Operations - This reporting unit includes the Board Operations at Los Olivos, Denny’s Diner and Vista Cafe. Revenues exceed budget by 3% or $26,644; costs goods are 31% versus 30% of budget, payroll and expenditures are 85% versus 90% of budget generating a deficit of $153,089 versus $175,627 budgeted.
97

KELLOGG WEST
Surplus/(Deficit)
Budget Actual Variance
14,942$ 82,712$ 67,770$ Kellogg West Conference Center & Hotel This unit includes room and conference center activities. Kellogg West revenues are 7% of Enterprise Activities and exceed budget by 8% or $34,397; payroll and expenditures are 82% versus 97% of budget generating a surplus greater than budgeted. UNIVERSITY VILLAGE
Surplus/(Deficit)
Budget Actual Variance
(805,117)$ (764,781)$ 40,336$ University Village - Revenues are 15% of Enterprise Activities and are 91% or $99,427 short of budget due to vacancies over the summer. As we begin the academic year occupancy is at 99% versus 97% budgeted. We continue to increase our outreach to area colleges and universities as well. Payroll and expenditures are 180% versus 176% budgeted resulting in a deficit less than budget.
DESIGNATED FUND
Surplus/(Deficit)
Budget Actual Variance
(322,079)$ (208,237)$ 113,842$ Designated fund expenditures include development, alumni affairs, public relations, publications, athletics and other and generated a deficit less with budgeted.
OTHER ACTIVITIES
Budget Actual VarianceSponsored Research 4,401 20,000 15,599
Agriculture-Aid-to-Instruction (207,408) (232,999) (25,591)
Continuing Education 155,818 121,363 (34,455)
Foundation Programs-Unrestricted 3 (50,480) (50,483)
Total Other Activities (47,186)$ (142,116)$ (94,930)$ Sponsored Research has generated a year to date surplus of $20,000 versus a budgeted surplus of $4,401; year to date indirect revenues exceeding budget by 10.70% or $44,473 and direct grant expenditures exceeded budget by 3.21% or $121,711 generating an effective rate of 11.75% versus the budgeted rate of 11.5%.
98

Agriculture-Aid-to-Instruction year to date revenues are 83% or $116,136 short of budget, costs of goods are 20% versus 18% of budget and payroll and expenditures are 121% versus 112% of budget generating a year to date deficit of $232,999 versus a budgeted deficit of $207,408 due to Agronomy Farm, Arabian Horse Center, Meat Lab, Swine Program, Danny’s Farm, Pumpkin Festival, West Wind Ranch, Wasmansdorff House and Agriscapes. Continuing Education year to date revenues are 53% or $1,171,435 short of budget mainly due to Global Ed Programs, CPELI Camps and Academic Studies Programs; payroll and expenditures are 91% versus 94% of budget generating a year to date surplus of $121,363 versus $154,818 budgeted. Foundation Programs-Unrestricted includes the activities that are not third party donor imposed stipulations. Year to date revenues are negative or ($4,016) versus $143,751 budgeted due to prior fiscal year indirect cost recoveries allocation between unrestricted and restricted programs; expenditures (excluding Transfers to the University # 7344) are 32% or $97,508 short of budget due to Bronco Student Welcome Week fees correction reversed in service and rental/land building expenditures, generating a year to date deficit versus a zero budgeted.
Budget Actual VarianceEndowment/Investments 1,241,222 3,953,605 2,712,383
Foundation Programs Restricted 895,503 (1,425,414) (2,320,917)
Total Other Activities 2,136,725$ 2,528,191$ 391,466$ Endowment/Investment – unrealized/realized investment earnings are $4.1 million versus a budgeted earnings of $1.1 million resulting in a surplus of $3.9 million versus a budgeted surplus of $1.2 million due to the markets reaching new highs in the beginning of July and held onto those gains through the end of the 1st fiscal quarter. Foundation Programs-Restricted - revenues are 29% or $2.2 million short of budget, expenditures exceed budget by 4% or $85,655 resulting in a deficit versus a budgeted surplus.
99

Unrestricted Restricted
Foundation Auxiliary Sponsored FoundationGeneral Designated Programs Activities Total Programs Programs Endowment Total Current Year June 30, 2016
Fund Fund Fund Fund Unrestricted Fund Fund Fund Restricted Total TotalCURRENT ASSETS:Cash:On hand and in commercial accounts (323,016) 1,200 400 85,529 (235,887) 0 7,548 0 7,548 (228,339) (229,856)Due to/(form) (86,664,660) 19,881,523 2,669,055 33,868,281 (30,245,801) 1,356,324 28,843,000 46,475 30,245,799 (2) 0Investments 34,217,054 182,062 0 0 34,399,116 0 373,464 659,773 1,033,237 35,432,353 38,180,582Marketable securities 11,837,270 0 0 0 11,837,270 0 1,255,164 88,898,423 90,153,587 101,990,857 97,914,241
Total cash and cash equivalent (40,933,352) 20,064,785 2,669,455 33,953,810 15,754,698 1,356,324 30,479,176 89,604,671 121,440,171 137,194,869 135,864,967
Receivables:Accounts and notes receivable 2,198,603 4,386 93,638 2,305,441 4,602,068 692,349 3,698,694 0 4,391,043 8,993,111 11,830,245Interfund loans (net) 1,389,088 0 0 0 1,389,088 0 50,000 0 50,000 1,439,088 1,739,088
3,587,691 4,386 93,638 2,305,441 5,991,156 692,349 3,748,694 0 4,441,043 10,432,199 13,569,333Less-Allowance for doubtful accounts 0 0 0 (31,406) (31,406) 0 (81,711) 0 (81,711) (113,117) (108,906)
Total receivables 3,587,691 4,386 93,638 2,274,035 5,959,750 692,349 3,666,983 0 4,359,332 10,319,082 13,460,427
Inventories 1,884,865 0 0 1,886,166 3,771,031 0 49,313 0 49,313 3,820,344 2,558,436Prepaid expenses and deferred charges 494,935 83,102 0 165,162 743,199 500 0 0 500 743,699 301,499OPEB asset 0 1,789,826 0 0 1,789,826 0 0 0 0 1,789,826 789,826
Total current assets (34,965,861) 21,942,099 2,763,093 38,279,173 28,018,504 2,049,173 34,195,472 89,604,671 125,849,316 153,867,820 152,975,155
FIXED ASSETSLand 14,583,927 0 0 212,000 14,795,927 0 1,642,219 0 1,642,219 16,438,146 16,438,146Buildings and improvements 15,276,285 0 532,412 51,622,007 67,430,704 0 1,613,426 0 1,613,426 69,044,130 69,787,286Equipment, furniture and fixtures 2,445,336 0 27,408 12,263,209 14,735,953 0 547,362 0 547,362 15,283,315 15,797,013Orchards 0 0 0 131,863 131,863 0 0 0 0 131,863 131,863Construction in progress 477,750 0 13,078 700,135 1,190,963 357,511 153,356 0 510,867 1,701,830 1,373,755
32,783,298 0 572,898 64,929,214 98,285,410 357,511 3,956,363 0 4,313,874 102,599,284 103,528,063Less-Accumulated depreciation (12,575,891) 0 (464,430) (39,866,993) (52,907,314) 0 (723,587) 0 (723,587) (53,630,901) (54,005,388)
Total fixed assets 20,207,407 0 108,468 25,062,221 45,378,096 357,511 3,232,776 0 3,590,287 48,968,383 49,522,675
Restricted Funds 0 0 0 0 137,151 303,547 0 440,698 440,698 440,538
Total assets (14,758,454) 21,942,099 2,871,561 63,341,394 73,396,600 2,543,835 37,731,795 89,604,671 129,880,301 203,276,901 202,938,368
DEFERRED OUTFLOWS OF RESOURCES:Unamortized loss on debt refunding 418,291 418,291 418,291 427,985Net pension obligations - contributions 1,065,195 1,065,195 1,065,195 1,065,195
CAL POLY POMONA FOUNDATION, INC.STATEMENTS OF FINANCIAL POSITION
for period ended September 30, 2016
100

Unrestricted Restricted
Foundation Auxiliary Sponsored FoundationGeneral Designated Programs Activities Total Programs Programs Endowment Total Current Year June 30, 2016
Fund Fund Fund Fund Unrestricted Fund Fund Fund Restricted Total Total
CAL POLY POMONA FOUNDATION, INC.STATEMENTS OF FINANCIAL POSITION
for period ended September 30, 2016
LIABILITIES:Accounts payable 253,782 32,978 6,192 756,192 1,049,144 42,140 60,335 0 102,475 1,151,619 2,447,834Accrued liabilities 765,705 (159,891) 2,540 824,764 1,433,118 215,395 14,426 46,578 276,399 1,709,517 1,367,956Receipts in excess of expenditures on 0 specific sponsored programs 0 0 0 0 0 1,928,789 0 0 1,928,789 1,928,789 1,976,238Deferred income 974,607 0 0 1,264,919 2,239,526 0 58,250 0 58,250 2,297,776 1,578,803Deposits held in custody for others 0 0 0 0 0 0 754,770 0 754,770 754,770 751,181Inter-fund loans 1,389,088 0 0 0 1,389,088 0 50,000 0 50,000 1,439,088 1,739,088
Total current liabilities 3,383,182 (126,913) 8,732 2,845,875 6,110,876 2,186,324 937,781 46,578 3,170,683 9,281,559 9,861,100
Long-term liabilities:Notes and contracts payable 0 0 0 0 0 0 202,493 0 202,493 202,493 300,902Unitrust liability 0 0 0 0 0 0 716,799 0 716,799 716,799 714,418Lease obligations 2,282,491 0 0 23,711,872 25,994,363 0 0 0 0 25,994,363 26,923,415Pension liability 5,338,104 0 0 5,338,104 0 0 0 0 5,338,104 5,338,104
Total long-term liabilities 7,620,595 0 0 23,711,872 31,332,467 0 919,292 0 919,292 32,251,759 33,276,839
Total liabilities 11,003,777 (126,913) 8,732 26,557,747 37,443,343 2,186,324 1,857,073 46,578 4,089,975 41,533,318 43,137,939
DEFERRED INFLOWS OF RESOURCES:Net pension obligation 2,222,239 2,222,239 0 2,222,239 2,437,154
Net Assets Beginning (26,531,957) 20,699,782 2,913,310 38,311,082 35,392,217 357,511 37,414,707 85,604,489 123,376,707 158,768,924 170,638,574
change in net Assets (387,318) 1,369,230 (50,481) (1,109,142) (177,711) 0 (1,539,986) 3,953,604 2,413,618 2,235,907 (11,782,118)
Total liabilities and Net Assets (13,693,259) 21,942,099 2,871,561 63,759,687 74,880,088 2,543,835 37,731,794 89,604,671 129,880,300 204,760,388 204,431,549
101

REVENUES EXPENSES SURPLUS/(DEFICIT) Surplus/DeficitFY 15‐16 FY 16‐17 YTD FY 15‐16 FY 16‐17 YTD FY 15‐16 FY 16‐17 YTD FY 15‐16 FY 16‐17 YTD Budget
Description YTD Actual Budget Actual YTD Actual Budget Actual YTD Actual Budget Actual Actual Budget (Not) Realized General Activities: Administration 995,158 1,049,796 918,755 1,100,656 1,264,201 1,199,034 (105,498) (214,405) (280,279) (508,104) (13,436) (266,843) Real Estate 848,625 948,975 959,549 539,058 1,100,159 621,338 309,567 (151,184) 338,211 321,456 219,967 118,244 Investments (1,359,948) 348,402 1,075,828 25,652 21,505 24,911 (1,385,600) 326,897 1,050,917 (922,918) 831,084 219,833 Building Rentals 199,526 201,366 201,364 166,769 173,075 170,576 32,757 28,291 30,788 115,447 112,364 (81,576)
TOTAL GENERAL 683,361 2,548,539 3,155,496 1,832,135 2,558,940 2,015,859 (1,148,774) (10,401) 1,139,637 (994,119) 1,149,979 (10,342)
Enterprise Activities: Bookstores 2,557,197 2,762,000 2,392,103 2,385,535 2,597,725 2,273,506 171,662 164,275 118,597 487,500 292,798 (174,201) Campus Center (Carl's/ Salad Bar/Taco 36,010 39,000 54,779 69,246 57,439 55,692 (33,236) (18,439) (913) 165,689 128,838 (129,751) Panda Express 11,298 11,247 12,730 7,990 6,721 2,640 3,308 4,526 10,090 212,223 196,218 (186,128) Cstore (Starbucks,SCE,Einstein,cba,Poly 477,372 498,096 563,000 622,410 616,582 661,463 (145,038) (118,486) (98,463) 302,487 520,328 (618,791) Vending & Carts 20,735 23,677 23,424 17,027 19,293 17,651 3,708 4,384 5,773 30,610 35,197 (29,424) Los Olivos 615,495 805,436 823,272 861,838 920,677 933,933 (246,343) (115,241) (110,661) 330,583 766,270 (876,931) Vista Café 86,633 92,930 89,607 134,010 127,556 107,950 (47,377) (34,626) (18,343) 59,624 40,075 (58,418) Denny's 20,334 22,046 34,177 60,799 47,806 58,262 (40,465) (25,760) (24,085) (15,566) (2,736) (21,349) Bronco Student Center 406,934 429,000 550,436 392,558 390,330 454,363 14,376 38,670 96,073 360,359 372,086 (276,013) FS Mgt/Overhead 156 308,895 406,403 304,786 (308,895) (406,403) (304,630) (1,021,058) (1,392,090) 1,087,460
Total Dining Services 1,674,811 1,921,432 2,151,581 2,474,773 2,592,807 2,596,740 (799,962) (671,375) (445,159) 424,951 664,186 (1,109,345) Catering/Conference Foods 644,747 651,223 561,327 561,175 592,657 519,689 83,572 58,566 41,638 377,389 99,412 (57,774) KW Conference Center 439,417 436,675 471,072 387,920 421,733 388,360 51,497 14,942 82,712 81,903 16,952 65,760 University Village 789,036 1,053,814 954,387 1,744,806 1,858,931 1,719,168 (955,770) (805,117) (764,781) 2,218,862 2,335,736 (3,100,517)
TOTAL ENTERPRISE 6,105,208 6,825,144 6,530,470 7,554,209 8,063,853 7,497,463 (1,449,001) (1,238,709) (966,993) 3,590,605 3,409,084 (4,376,077)TOTAL GEN & ENTERPRISE 6,788,569 9,373,683 9,685,966 9,386,344 10,622,793 9,513,322 (2,597,775) (1,249,110) 172,644 2,596,486 4,559,063 (4,386,419)
Uses of Designated Funds: Development 9,392 0 12,272 (9,392) (12,272) (67,110) Alumni Affairs 1,508 0 9,666 (1,508) (9,666) (49,525) Public Relations 1,191 280 96,620 347,499 97,603 (95,429) (347,499) (97,323) (673,829) Publications (12,871) 0 50,052 12,871 (50,052) (192,040) Athletics 2,095 0 28,818 (2,095) (28,818) (75,004) Other 800 800 (11,356) (25,420) 10,906 12,156 25,420 (10,106) (143,062)TOTAL DESIGNATED USES 1,991 ‐ 1,080 85,388 322,079 209,317 (83,397) (322,079) (208,237) (1,200,570) (1,508,330) 1,300,093
Other Activities: Research Office 467,811 415,457 459,930 441,523 411,056 439,930 26,288 4,401 20,000 45,152 20,004 (4) Agriculture 593,119 678,920 562,784 773,561 886,328 795,783 (180,442) (207,408) (232,999) (15,264) (12,352) (220,647) Continuing Education 2,076,440 2,488,077 1,316,642 1,343,002 2,333,259 1,195,279 733,438 154,818 121,363 956,727 318,581 (197,218) FDN Program‐Unrestricted 116,185 143,751 (4,016) 113,889 143,748 46,464 2,296 3 (50,480) 164,310 12 (50,492)
TOTAL OTHER 3,253,555 3,726,205 2,335,340 2,671,975 3,774,391 2,477,456 581,580 (48,186) (142,116) 1,150,925 326,245 (468,361)TOTAL SURPLUS (DEFICIT) 10,044,115 13,099,888 12,022,386 12,143,707 14,719,263 12,200,095 (2,099,592) (1,619,375) (177,709) 2,546,841 3,376,978 (3,554,687)
LO‐Housing Distribution (49,984) 0TOTAL FOUNDATION Net 10,044,115 13,099,888 12,022,386 12,143,707 14,719,263 12,200,095 (2,099,592) (1,619,375) (177,709) 2,496,857 3,376,978 (3,554,687)
CAL POLY POMONA FOUNDATION, INC.Statement of Activities
For period ending Sep 30, 2016 and 2015
11/2/2016 \\fao.csupomona.edu\admin\Shared\Meetings\Finance Committee\2016-2017 Finance Meetings\11-07-16_Fin Cttee\05c Statement of Activities 9-30-16 first page DONE102

REVENUES EXPENSES SURPLUS/(DEFICIT) Surplus/DeficitFY 15‐16 FY 16‐17 YTD FY 15‐16 FY 16‐17 YTD FY 15‐16 FY 16‐17 YTD FY 15‐16 FY 16‐17 YTD Budget
Description YTD Actual Budget Actual YTD Actual Budget Actual YTD Actual Budget Actual Actual Budget (Not) Realized
CAL POLY POMONA FOUNDATION, INC.Statement of Activities
For period ending Sep 30, 2016 and 2015
Restricted: Endowments/Investments (7,893,717) 1,467,052 4,070,937 248,979 225,830 117,332 (8,142,696) 1,241,222 3,953,605 (5,605,212) 5,526,109 (1,572,504) Foundation Programs 908,520 3,173,855 910,437 1,840,495 2,278,352 2,335,851 (931,975) 895,503 (1,425,414) 1,014,565 2,477,973 (3,903,387)TOTAL RESTRICTED (6,985,197) 4,640,907 4,981,374 2,089,474 2,504,182 2,453,183 (9,074,671) 2,136,725 2,528,191 (4,590,647) 8,004,082 (5,475,891)
Grants and Contracts 4,510,372 3,791,444 4,274,794 4,510,372 3,791,444 4,274,794 0 0 0 247,004 0 0Transfers to the University ‐ ‐ ‐ 71,485 0 114,571 (71,485) 0 (114,571) (9,932,030) 0 0TOTAL FOUNDATION NET 7,569,290 21,532,239 21,278,554 18,815,038 21,014,889 19,042,643 (11,245,748) 517,350 2,235,911 (11,778,816) 11,381,060 (9,030,578)
11/2/2016 \\fao.csupomona.edu\admin\Shared\Meetings\Finance Committee\2016-2017 Finance Meetings\11-07-16_Fin Cttee\05d Statement of Activities 9-30-16 second page DONE103
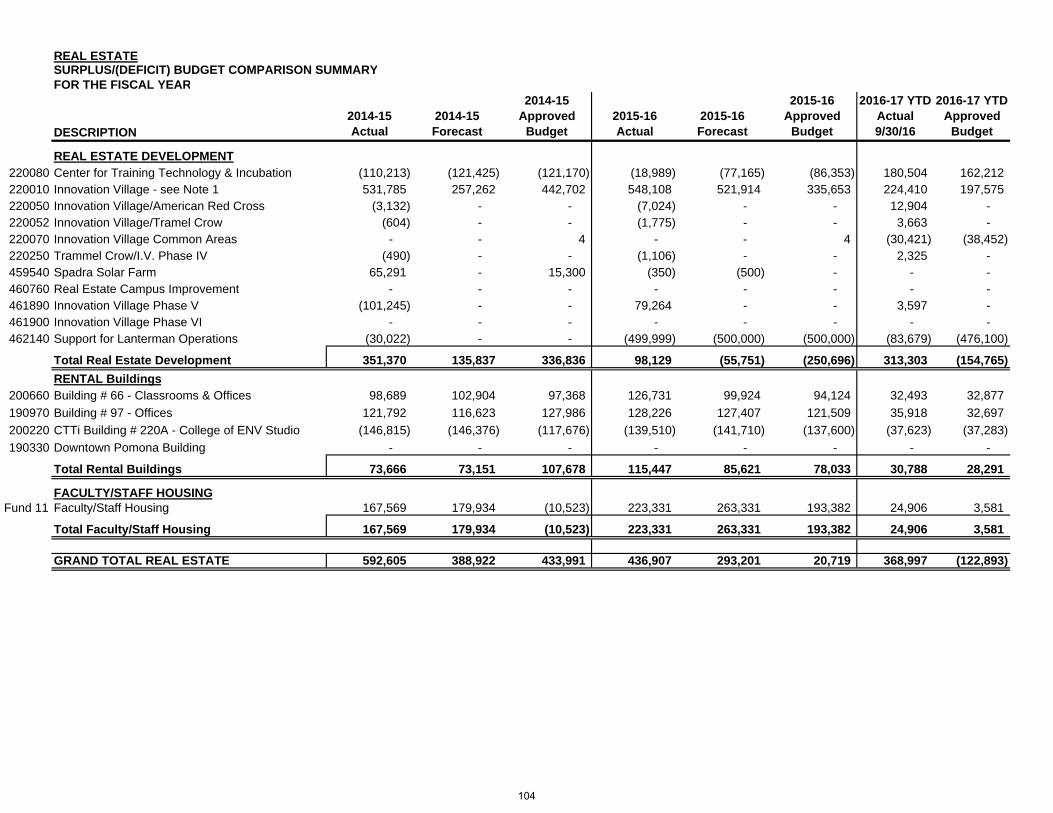
REAL ESTATESURPLUS/(DEFICIT) BUDGET COMPARISON SUMMARYFOR THE FISCAL YEAR
DESCRIPTION 2014-15 Actual
2014-15 Forecast
2014-15 Approved
Budget2015-16 Actual
2015-16 Forecast
2015-16 Approved
Budget
2016-17 YTD Actual 9/30/16
2016-17 YTD Approved
Budget
REAL ESTATE DEVELOPMENT220080 Center for Training Technology & Incubation (110,213) (121,425) (121,170) (18,989) (77,165) (86,353) 180,504 162,212 220010 Innovation Village - see Note 1 531,785 257,262 442,702 548,108 521,914 335,653 224,410 197,575 220050 Innovation Village/American Red Cross (3,132) - - (7,024) - - 12,904 - 220052 Innovation Village/Tramel Crow (604) - - (1,775) - - 3,663 - 220070 Innovation Village Common Areas - - 4 - - 4 (30,421) (38,452) 220250 Trammel Crow/I.V. Phase IV (490) - - (1,106) - - 2,325 - 459540 Spadra Solar Farm 65,291 - 15,300 (350) (500) - - - 460760 Real Estate Campus Improvement - - - - - - - - 461890 Innovation Village Phase V (101,245) - - 79,264 - - 3,597 - 461900 Innovation Village Phase VI - - - - - - - - 462140 Support for Lanterman Operations (30,022) - - (499,999) (500,000) (500,000) (83,679) (476,100)
Total Real Estate Development 351,370 135,837 336,836 98,129 (55,751) (250,696) 313,303 (154,765)
RENTAL Buildings200660 Building # 66 - Classrooms & Offices 98,689 102,904 97,368 126,731 99,924 94,124 32,493 32,877
190970 Building # 97 - Offices 121,792 116,623 127,986 128,226 127,407 121,509 35,918 32,697
200220 CTTi Building # 220A - College of ENV Studio (146,815) (146,376) (117,676) (139,510) (141,710) (137,600) (37,623) (37,283)
190330 Downtown Pomona Building - - - - - - - -
Total Rental Buildings 73,666 73,151 107,678 115,447 85,621 78,033 30,788 28,291
FACULTY/STAFF HOUSINGFund 11 Faculty/Staff Housing 167,569 179,934 (10,523) 223,331 263,331 193,382 24,906 3,581
Total Faculty/Staff Housing 167,569 179,934 (10,523) 223,331 263,331 193,382 24,906 3,581
GRAND TOTAL REAL ESTATE 592,605 388,922 433,991 436,907 293,201 20,719 368,997 (122,893)
104

AGRICULTURE FUNDSSURPLUS/(DEFICIT) BUDGET COMPARISON SUMMARYFOR THE FISCAL YEAR
DESCRIPTION 2014-15 Actual
2014-15 Forecast
2014-15 Approved
Budget2015-16 Actual
2015-16 Forecast
2015-16 Approved
Budget
2016-17 YTD
Actual 9/30/16
2016-17 YTD
Approved Budget
016200 Agronomy Farms (93,798) 149,919 16,038 (123,581) 233,984 24,341 (49,569) (65,104)
260200 Arabian Horse Show (48,409) (5,930) (3,538) (82,952) (160,454) 686 (91,341) (83,591)
020010 Beef Unit (41,031) 18 10,095 5,264 6,142 2,150 10,041 (2,533)
022500 Beef Show Sale Project - - - - - - - -
027190 Consignment Sales - - - - - - - -
340010 Fruit Industry 1,353 1,244 3,284 (24,274) 1,244 4,184 340 (6,325)
300010 Meat Lab (804) (500) 9,305 (537) - 982 - 1,055
320300 Ornamental Horticulture 3,467 3,406 2,274 13,411 28,429 2,393 (3,776) (14,857)
193040 Pine Tree Ranch 101,676 33,504 1,996 132,112 42,140 1,996 28,231 (11,643)
420010 Sheep Unit (56,356) 542 8,005 (13,149) 1,928 841 8,923 (11,220)
430010 Swine Unit (15,421) 2,334 5,089 3,565 908 9,074 (11,157) 4,284
260220 Farm Store at Kellogg Ranch 1,234 59,301 5,195 18,896 24,354 (4,665) (29,129) (30,803)
460360 Danny's Farm (6,819) - - (1,189) - - (5,852) -
350810 Truck and Trailer - - - - - - - -
428460 Vet Clinic (3,061) 1,088 4,249 (8,667) 2,463 4,210 93 (659)
350820 Pomona Organics St Project - - - - - - - -
462300 Pumpkin Festival - - - 5,036 3,811 (3,516) (12,621) 3,828
462530 Westwind Ranch - - - (42,617) - - (56,427) -
462540 Wasmansdorff House - Pine Tree - - - 102,447 102,227 - (10,247) -
462610 Agriscapes - - - 971 - - (10,507) 10,160
Total (157,969) 244,926 61,992 (15,264) 287,176 42,676 (232,998) (207,408)
105

CONTINUING EDUCATION PROGRAMSSURPLUS/(DEFICIT) BUDGET COMPARISON SUMMARYFOR THE FISCAL YEAR
DESCRIPTION 2014-15 Actual
2014-15 Forecast
2014-15 Approved
Budget2015-16 Actual
2015-16 Forecast
2015-16 Approved
Budget
2016-17 YTD Actual
9/30/16
2016-17 YTD
Approved Budget
COLLEGE OF EXTENDED UNIVERSITY - Programs283500 Administration 399,877 259,045 225,790 531,386 202,339 139,794 (151,687) (47,392) 283071 Computer Programs - - - - - - - - 283072 Certificate Programs - - - - - - - - 283080 English Language Inst. - - - - - - - - 283600 CEU International Training - - - - - - - - 283610 Int'l Workshop and Training - - - - - - - - 283620 Six Sigma Program 10,600 5,435 5,161 24,951 16,232 7,824 14,892 10,710 283630 Professional Project Management Program 4,726 8,515 9,916 12,560 3,219 11,765 7,192 2,897 283790 On Site Training Programs 3,808 10,055 2,016 8,529 8,897 10,333 3,707 (1,150) 283060 Start-Up Programs - - - - - - - - 283076 Technical Programs 9,173 20,800 22,760 (5,440) (5,840) 29,996 - (74) 283073 Test Prep Programs 8,032 21,888 13,680 21,108 11,247 12,584 19,746 1,863 460280 SUMMER SUPPORT @ CEU (243) (602) (525.00) (568) (810) (9,174) (9,685) (6,579) 460920 Business Comm & Grant Writing - - - (108) - - - - 460930 Accounting & Finance (612) 5,036.00 555 (1,234) (1,234) 15,707 (500) - 460940 Math & Science 155 (6,269) 2,444 (275) 763 (2,908) 17,289 (2,399) 460950 Hospitality & Service Industry 5,431 4,257 6,211 6,986 14,654 (1,336) 22,451 2,573 460960 Supply Chain Management (1,350) (4,475) 10,900 (110) (1,680) (1,374) - 1,353 460970 Human Resources Management 6,642 4,589 1,800 1,858 2,656 2,365 10,955 1,432 460980 Building & Construction Management 13,857 10,446 17,152 16,231 15,725 15,091 25,674 8,583 460990 Ed2Go (12,396) (10,770) (245,808) 6,872 7,700 (11,355) 6,597 1,174 461000 Art, Media, & Design (1,003) 1,642 - (1,110) (1,110) - - - 461010 Global Ed Programs Standard 7,257 (35,437) 13,898 56,563 136,104 132,415 28,329 310,598 461020 Global Ed Programs Camps - - - 75,289 55,500 - (54,422) 93,025 461030 CPELI Camps 28,471 1 81,931 84,995 5,686 57,539 94,516 72,943 461040 CPELI Standard 47,151 131,082 303,815 168,437 147,400 188,745 124,843 (208,506) 461820 Program Development (201,843) (281,455) - (232,680) (282,375) (380,959) (73,899) (96,859) 461840 Summer Camps (3,666) - - 10,164 12,121 - (72,889) (13,470) 461950 IT, Web & Social Media - - - (1,301) 438 - - (10,892) 462120 CEU CPP Aviation Hospitality - - - 160,247 55,114 20,391 98,686 35,287 462660 CEU Marketing Research - - - - (2,668) - - 731 462760 CEU Academic Studies Program - - - - - - (2,224) 3,539
Total College of Extended Univ Programs 324,067 143,783 471,696 943,350 400,078 237,443 109,571 159,387
106

CONTINUING EDUCATION PROGRAMSSURPLUS/(DEFICIT) BUDGET COMPARISON SUMMARYFOR THE FISCAL YEAR
DESCRIPTION 2014-15 Actual
2014-15 Forecast
2014-15 Approved
Budget2015-16 Actual
2015-16 Forecast
2015-16 Approved
Budget
2016-17 YTD Actual
9/30/16
2016-17 YTD
Approved Budget
COLLEGE OF ENGINEERING381500 Non-Credit Learning Admin (8,927) 49 30 1,530 38 48 - -
381675 Civil Engineering Review (10,156) 5,632 4,446 5,739 909 6,064 11,788 -
Total College of Engineering (19,083) 5,681 4,476 7,269 947 6,112 11,788 -
COLLEGE OF SCIENCE406440 Chemistry Agilent Project (1,807) 4,623 2,383 - 6,595 2,388 - (4,569)
Total College of Science (1,807) 4,623 2,383 - 6,595 2,388 - (4,569)
COLLEGE OF LETTERS, ARTS, AND SOCIAL SCIENCES
362030 GIS Certificate Program (9,728) - - 5,785 - - - -
Total College of Letters, Arts, and Social Sciences (9,728) - - 5,785 - - - -
COLLEGE OF ENVIRONMENTAL DESIGN
460200 CCLAWS CERTIFICATE L+RS (3,472) - 320 - - -
Total College of Environmental Design (3,472) - - 320 - - - -
GRAND TOTAL CONTINUING EDUCATION 289,977 154,087 478,555 956,724 407,620 245,943 121,359 154,818
107

Memorandum Date: November 17, 2016 To: Board of Directors Cal Poly Pomona Foundation, Inc.
From: David F. Prenovost, Senior Managing Director/Chief Financial Officer Subject: 2016-17 Insurance Coverage As you may know, the Foundation participates in the Auxiliary Organization Risk Management Alliance (AORMA), a Committee of the California State University Risk Management Authority (CSURMA), a joint powers authority and Alliant Insurance Services is the Program Administrator. The Foundation’s schedule of insurance premiums, coverage, limits and deductibles for the fiscal year 2016-17 is provided in the following document. This coverages exclude earth quake insurance that the insurance program determined was not economically feasible to purchase this year. In addition to the insurance coverage the Foundation established an Insurance Reserve policy # 174 in February 2006, attached for your reference. The insurance reserve currently has a balance of $124,203. The Insurance Reserve was established to pay the deductible amounts greater than $10,000.
108

Cal Poly Pomona Foundation2016/2017 CSURMA AORMA
Renewal Report
C A L P O L Y P O M O N A
C A L P O L Y P O M O N A
109

Cal Poly Pomona Foundation Dividend History
Total of $893,859 returned as Dividends to Cal Poly Pomona Foundation in last 10 years.
Policy Year Liability Workers’ Compensation
2006‐2007 $15,854 $52,623 2007‐2008 N/A $97,380 2008‐2009 $18,648 $136,882 2009‐2010 $9,538 $73,840 2010‐2011 $11,575 $87,385 2011‐2012 $60,950 $52,889 2012‐2013 $44,054 $37,759 2013‐2014 $39,796 $44,792 2014‐2015 $19,205 $38,077 2015‐2016 $36,670 $15,942
Total $256,290 $637,569
110
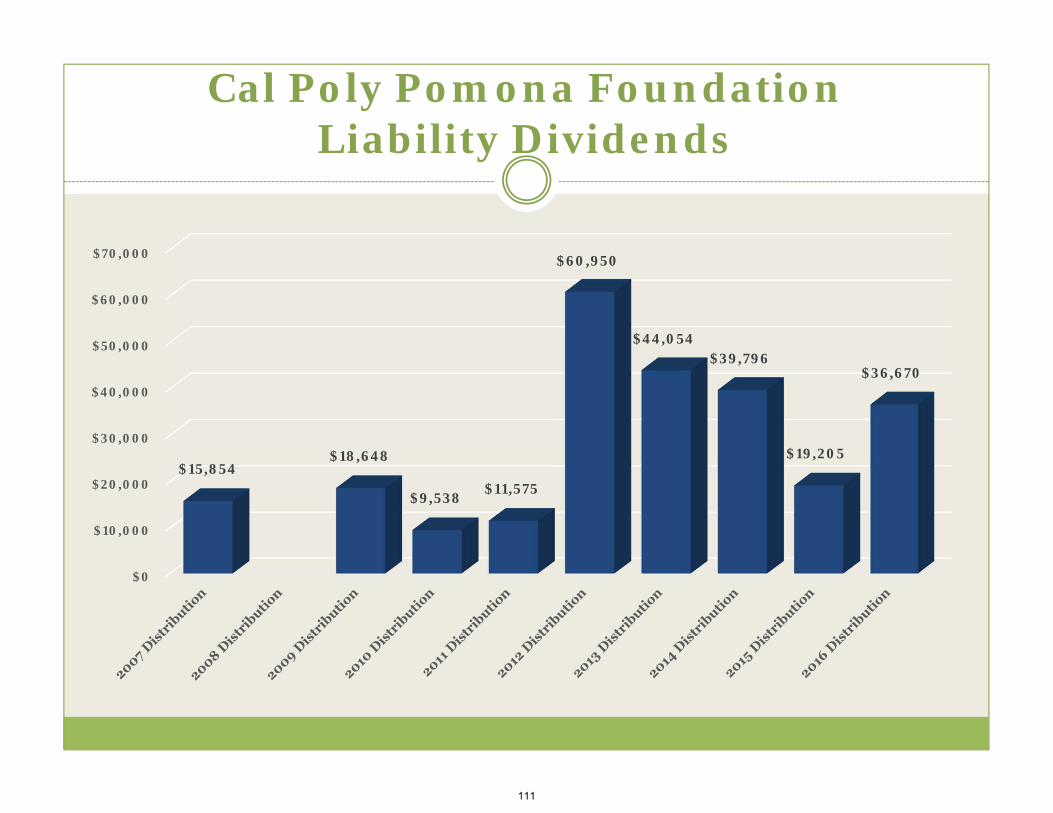
Cal Poly Pomona Foundation Liability Dividends
$0
$10,000
$20,000
$30,000
$40,000
$50,000
$60,000
$70,000
$15,854 $18,648
$9,538 $11,575
$60,950
$44,054 $39,796
$19,205
$36,670
111
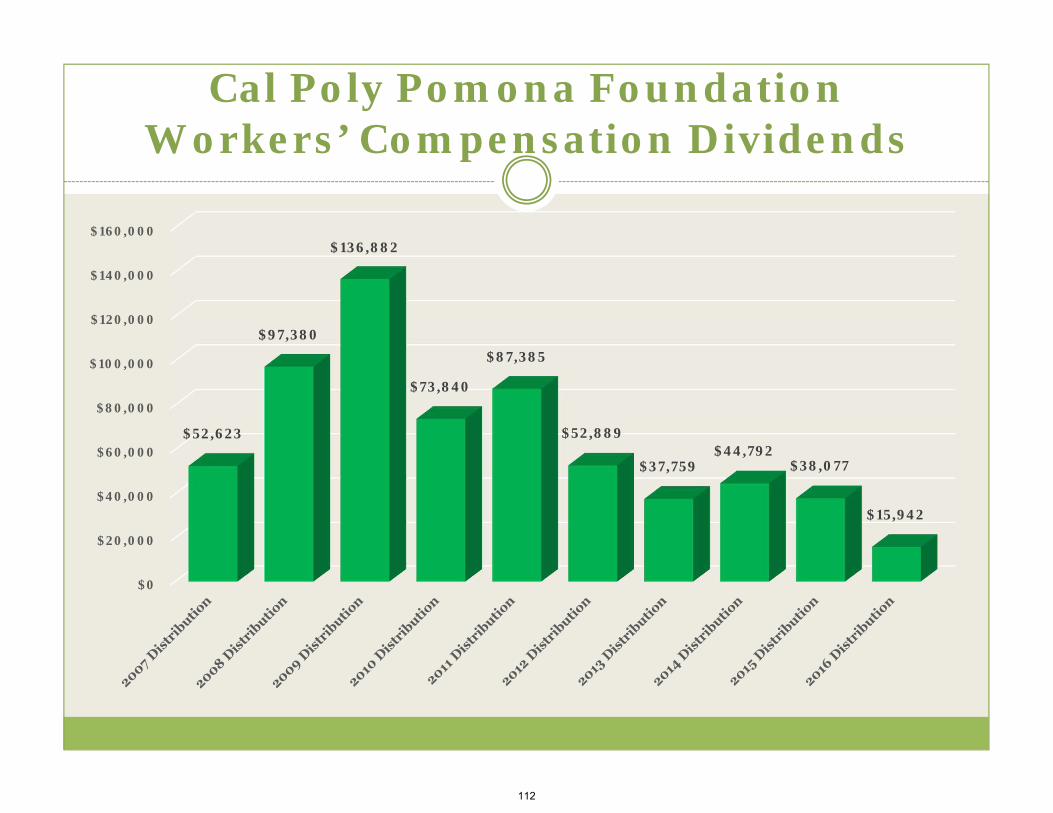
Cal Poly Pomona FoundationWorkers’ Compensation Dividends
$0
$20,000
$40,000
$60,000
$80,000
$100,000
$120,000
$140,000
$160,000
$52,623
$97,380
$136,882
$73,840
$87,385
$52,889
$37,759 $44,792
$38,077
$15,942
112

2016/2017 Insurance Cost
AORMA Insurance Program 2011/2012 2012/2013 2013/2014 2014/2015 2015/2016 2016/2017
Liability $151,062 $135,157 $142,332 $154,060 $168,783 $215,712
Workers’ Compensation $221,460 $200,972 $273,920 $310,658 $326,760 $347,849
Property $148,548 $175,094 $149,167 $110,334 $102,918 $48,802
Crime $4,338 $5,195 $7,410 $6,659 $8,834 $8,036
Cyber Risk Liability $622 $666 $711 $812 $923 $2,576
Identity Fraud Expense Reimbursement $511 $1,191 $1,164 $1,230 $1,093 $1,444
Foreign Travel N/A N/A N/A N/A N/A N/A
TOTAL $526,541 $518,275 $574,704 $583,753 $609,311 $624,419
113

2016/2017 Insurance Cost
* Fiduciary liability coverage is included within the AORMA Liability Program.
AORMA Individual Purchase Programs 2011/2012 2012/2013 2013/2014 2014/2015 2015/2016 2016/2017
Public Entity Physical Damage $1,086 $1,948 $4,455 $5,095 $6,565 $6,565 Participant Accident Insurance N/A N/A N/A $848 N/A N/AFiduciary Liability Insurance* * * * * * *Inland Marine Floater N/A N/A N/A N/A N/A N/ATotal $1,086 $1,948 $4,455 $5,943 $6,565 $6,565
114

Loss information – Total Incurred
AORMA Insurance Program 2010/2011 2011/2012 2012/2013 2013/2014 2014/2015 2015/2016
Liability $3,361 $375,938 $0 $3,391 $25,692 $7,488
Workers’ Compensation $97,548 $363,759 $122,218 $78,658 $90,170 $80,236
Property (excess of deductible) $0 $0 $0 $0 $0 $0
115
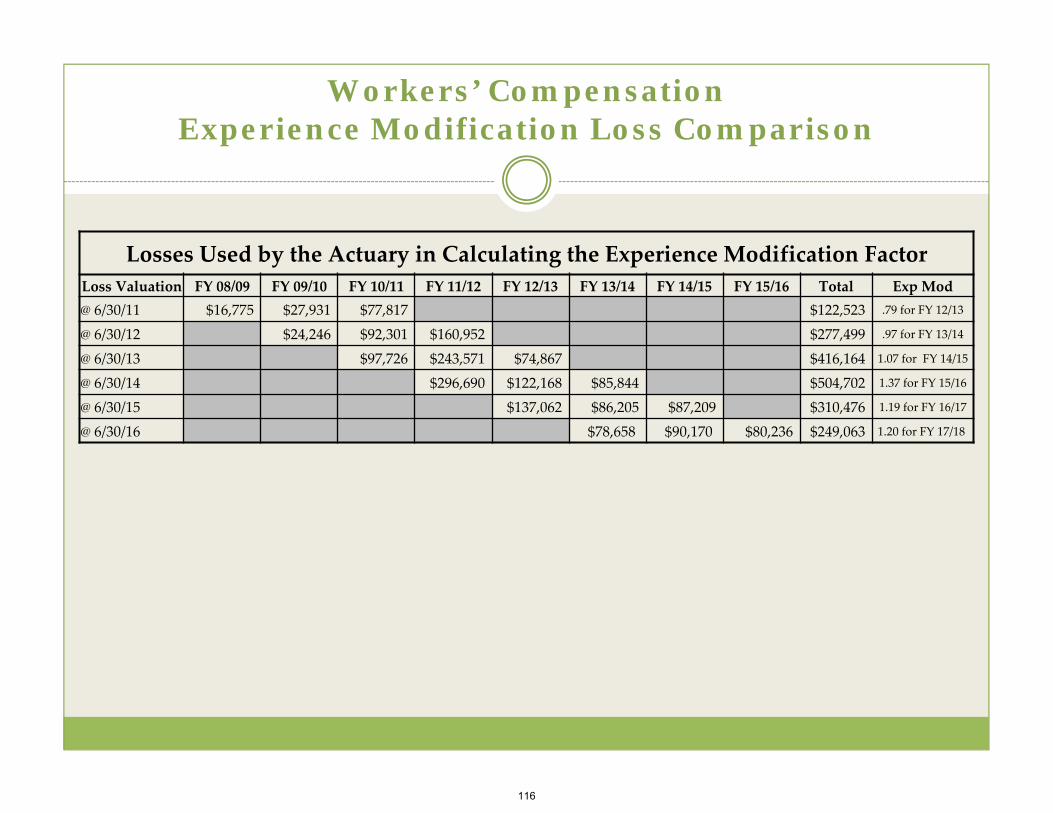
Workers’ Compensation Experience Modification Loss Comparison
Losses Used by the Actuary in Calculating the Experience Modification FactorLoss Valuation FY 08/09 FY 09/10 FY 10/11 FY 11/12 FY 12/13 FY 13/14 FY 14/15 FY 15/16 Total Exp Mod@ 6/30/11 $16,775 $27,931 $77,817 $122,523 .79 for FY 12/13
@ 6/30/12 $24,246 $92,301 $160,952 $277,499 .97 for FY 13/14
@ 6/30/13 $97,726 $243,571 $74,867 $416,164 1.07 for FY 14/15
@ 6/30/14 $296,690 $122,168 $85,844 $504,702 1.37 for FY 15/16
@ 6/30/15 $137,062 $86,205 $87,209 $310,476 1.19 for FY 16/17
@ 6/30/16 $78,658 $90,170 $80,236 $249,063 1.20 for FY 17/18
116

Future Financial Benefits of CSURMA AORMA Membership
Cal Poly Pomona Foundation ‐ Potential Share of Program Equity
$6,183,396
$328,338
Total Program WC Surplus Reserves at 6/30/16
Pomona Foundation
AORMA Workers’ Compensation Program
$6,465,172
$258,607
Total Program Liability Surplus Reserves at 6/30/16
Pomona Foundation
AORMA Liability Program
117
Questions?Contact your CSURMA AORMA Program
Administrators
Mimi [email protected]
(415) 403-1423
(415) 403-1408
118
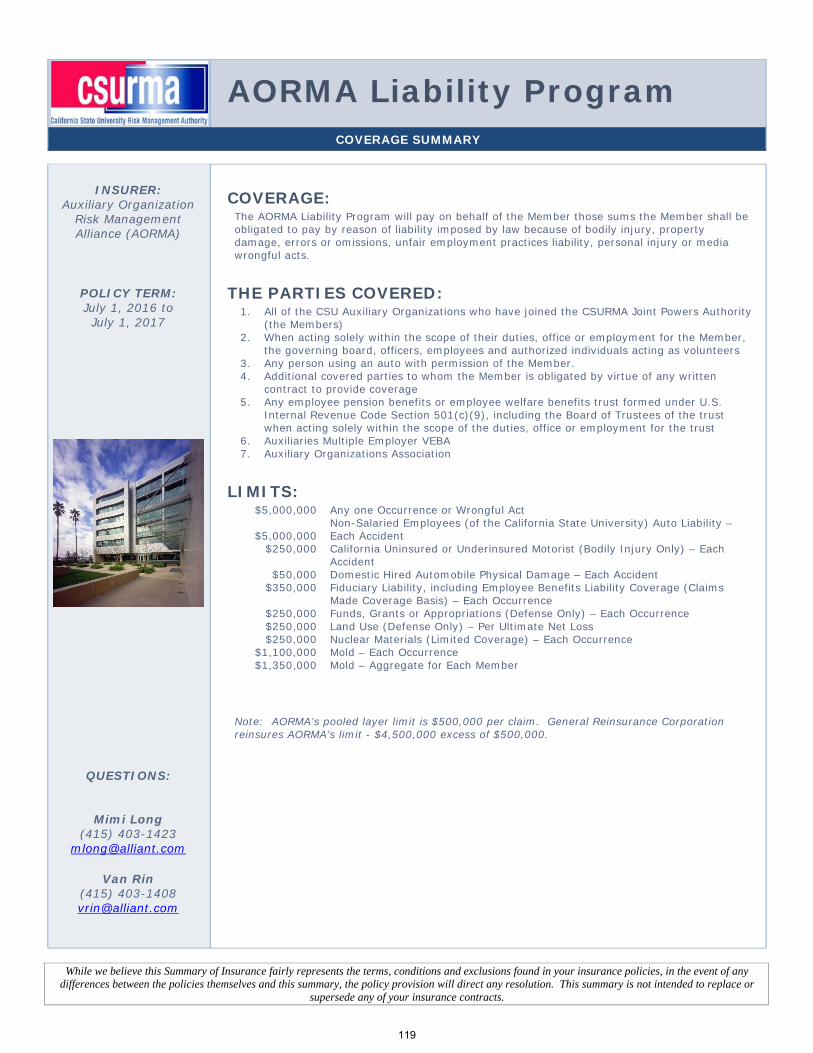
AORMA Liability Program COVERAGE SUMMARY
While we believe this Summary of Insurance fairly represents the terms, conditions and exclusions found in your insurance policies, in the event of any
differences between the policies themselves and this summary, the policy provision will direct any resolution. This summary is not intended to replace or supersede any of your insurance contracts.
INSURER: Auxiliary Organization
Risk Management Alliance (AORMA)
POLICY TERM: July 1, 2016 to July 1, 2017
QUESTIONS:
Mimi Long (415) 403-1423
Van Rin (415) 403-1408 [email protected]
COVERAGE: The AORMA Liability Program will pay on behalf of the Member those sums the Member shall be obligated to pay by reason of liability imposed by law because of bodily injury, property damage, errors or omissions, unfair employment practices liability, personal injury or media wrongful acts.
THE PARTIES COVERED: 1.
2.
3. 4.
5.
6. 7.
All of the CSU Auxiliary Organizations who have joined the CSURMA Joint Powers Authority (the Members) When acting solely within the scope of their duties, office or employment for the Member, the governing board, officers, employees and authorized individuals acting as volunteers Any person using an auto with permission of the Member. Additional covered parties to whom the Member is obligated by virtue of any written contract to provide coverage Any employee pension benefits or employee welfare benefits trust formed under U.S. Internal Revenue Code Section 501(c)(9), including the Board of Trustees of the trust when acting solely within the scope of the duties, office or employment for the trust Auxiliaries Multiple Employer VEBA Auxiliary Organizations Association
LIMITS: $5,000,000
$5,000,000
$250,000
$50,000 $350,000
$250,000 $250,000 $250,000
$1,100,000 $1,350,000
Any one Occurrence or Wrongful Act Non-Salaried Employees (of the California State University) Auto Liability – Each Accident California Uninsured or Underinsured Motorist (Bodily Injury Only) – Each Accident Domestic Hired Automobile Physical Damage – Each Accident Fiduciary Liability, including Employee Benefits Liability Coverage (Claims Made Coverage Basis) – Each Occurrence Funds, Grants or Appropriations (Defense Only) – Each Occurrence Land Use (Defense Only) – Per Ultimate Net Loss Nuclear Materials (Limited Coverage) – Each Occurrence Mold – Each Occurrence Mold – Aggregate for Each Member
Note: AORMA’s pooled layer limit is $500,000 per claim. General Reinsurance Corporation reinsures AORMA’s limit - $4,500,000 excess of $500,000.
119
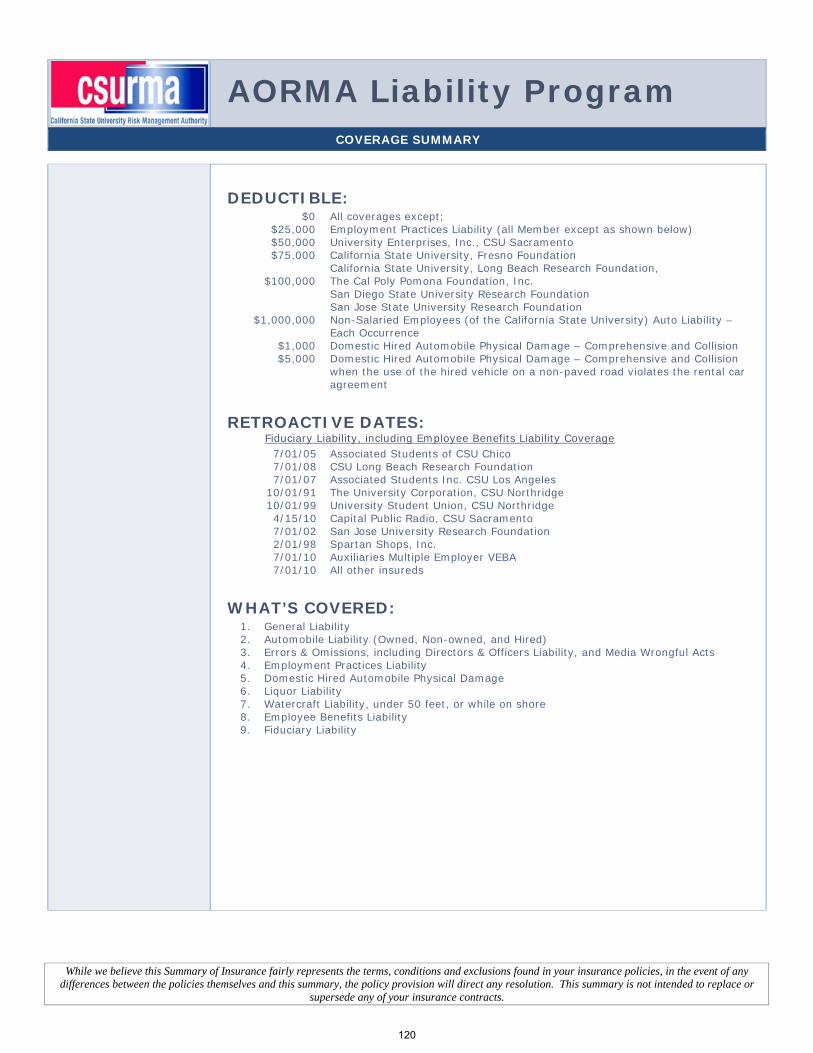
AORMA Liability Program COVERAGE SUMMARY
While we believe this Summary of Insurance fairly represents the terms, conditions and exclusions found in your insurance policies, in the event of any
differences between the policies themselves and this summary, the policy provision will direct any resolution. This summary is not intended to replace or supersede any of your insurance contracts.
DEDUCTIBLE: $0 All coverages except;
$25,000 Employment Practices Liability (all Member except as shown below) $50,000 University Enterprises, Inc., CSU Sacramento $75,000 California State University, Fresno Foundation
California State University, Long Beach Research Foundation, $100,000 The Cal Poly Pomona Foundation, Inc.
San Diego State University Research Foundation San Jose State University Research Foundation
$1,000,000 Non-Salaried Employees (of the California State University) Auto Liability – Each Occurrence
$1,000 Domestic Hired Automobile Physical Damage – Comprehensive and Collision $5,000 Domestic Hired Automobile Physical Damage – Comprehensive and Collision
when the use of the hired vehicle on a non-paved road violates the rental car agreement
RETROACTIVE DATES: Fiduciary Liability, including Employee Benefits Liability Coverage
7/01/05 7/01/08 7/01/07
10/01/91 10/01/99 4/15/10 7/01/02 2/01/98 7/01/10 7/01/10
Associated Students of CSU Chico CSU Long Beach Research Foundation Associated Students Inc. CSU Los Angeles The University Corporation, CSU Northridge University Student Union, CSU Northridge Capital Public Radio, CSU Sacramento San Jose University Research Foundation Spartan Shops, Inc. Auxiliaries Multiple Employer VEBA All other insureds
WHAT’S COVERED: 1. 2. 3. 4. 5. 6. 7. 8. 9.
General Liability Automobile Liability (Owned, Non-owned, and Hired) Errors & Omissions, including Directors & Officers Liability, and Media Wrongful Acts Employment Practices Liability Domestic Hired Automobile Physical Damage Liquor Liability Watercraft Liability, under 50 feet, or while on shore Employee Benefits Liability Fiduciary Liability
120
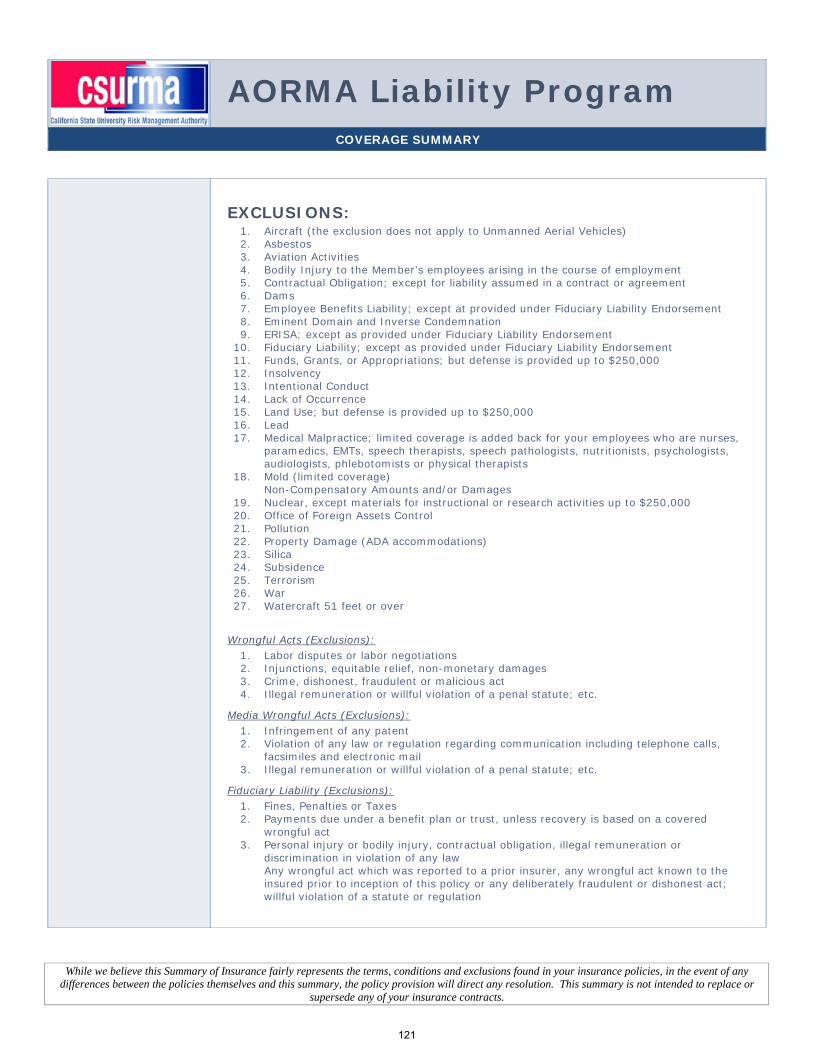
AORMA Liability Program COVERAGE SUMMARY
While we believe this Summary of Insurance fairly represents the terms, conditions and exclusions found in your insurance policies, in the event of any
differences between the policies themselves and this summary, the policy provision will direct any resolution. This summary is not intended to replace or supersede any of your insurance contracts.
EXCLUSIONS: 1. 2. 3. 4. 5. 6. 7. 8. 9.
10. 11. 12. 13. 14. 15. 16. 17.
18.
19. 20.21. 22. 23. 24. 25. 26. 27.
Aircraft (the exclusion does not apply to Unmanned Aerial Vehicles) Asbestos Aviation Activities Bodily Injury to the Member’s employees arising in the course of employment Contractual Obligation; except for liability assumed in a contract or agreement Dams Employee Benefits Liability; except at provided under Fiduciary Liability Endorsement Eminent Domain and Inverse Condemnation ERISA; except as provided under Fiduciary Liability Endorsement Fiduciary Liability; except as provided under Fiduciary Liability Endorsement Funds, Grants, or Appropriations; but defense is provided up to $250,000 Insolvency Intentional Conduct Lack of Occurrence Land Use; but defense is provided up to $250,000 Lead Medical Malpractice; limited coverage is added back for your employees who are nurses, paramedics, EMTs, speech therapists, speech pathologists, nutritionists, psychologists, audiologists, phlebotomists or physical therapists Mold (limited coverage) Non-Compensatory Amounts and/or Damages Nuclear, except materials for instructional or research activities up to $250,000 Office of Foreign Assets Control Pollution Property Damage (ADA accommodations) Silica Subsidence Terrorism War Watercraft 51 feet or over
Wrongful Acts (Exclusions): 1. 2. 3. 4.
Labor disputes or labor negotiations Injunctions, equitable relief, non-monetary damages Crime, dishonest, fraudulent or malicious act Illegal remuneration or willful violation of a penal statute; etc.
Media Wrongful Acts (Exclusions): 1. 2.
3.
Infringement of any patent Violation of any law or regulation regarding communication including telephone calls, facsimiles and electronic mail Illegal remuneration or willful violation of a penal statute; etc.
Fiduciary Liability (Exclusions): 1. 2.
3.
Fines, Penalties or Taxes Payments due under a benefit plan or trust, unless recovery is based on a covered wrongful act Personal injury or bodily injury, contractual obligation, illegal remuneration or discrimination in violation of any law Any wrongful act which was reported to a prior insurer, any wrongful act known to the insured prior to inception of this policy or any deliberately fraudulent or dishonest act; willful violation of a statute or regulation
121

AORMA Liability Program COVERAGE SUMMARY
While we believe this Summary of Insurance fairly represents the terms, conditions and exclusions found in your insurance policies, in the event of any
differences between the policies themselves and this summary, the policy provision will direct any resolution. This summary is not intended to replace or supersede any of your insurance contracts.
PUBLIC ENTITY EXCESS LIABILITY: Carrier: Limits:
Carrier: Limits:
Ironshore Specialty Insurance Company $5,000,000 Excess of $5,000,000 Allied World Assurance Company $10,000,000 Excess of $10,000,000
EXCESS FIDUCIARY LIABILITY: Carrier: Limits:
Lloyd’s of London $4,650,000 Excess of $350,000
HOW TO REPORT A CLAIM:
Carl Warren & Co. Mauri McGuire
(805) 650-7020 x1003 [email protected]
122

AORMA Property Program COVERAGE SUMMARY
While we believe this Summary of Insurance fairly represents the terms, conditions and exclusions found in your insurance policies, in the event of any
differences between the policies themselves and this summary, the policy provision will direct any resolution. This summary is not intended to replace or supersede any of your insurance contracts.
INSURER: Alliant Property
Insurance Program (APIP) – Various
Insurers
POLICY TERM: July 1, 2016 to July 1, 2017
QUESTIONS:
Mimi Long (415) 403-1423
Van Rin (415) 403-1408 [email protected]
COVERED ENTITY: California State University Risk Management Authority Auxiliary Organizations Risk Management Alliance Members
COVERAGE: The AORMA Property Program insures all property of every description both real and personal (including improvements, betterment and remodeling), of the Member, or property of others in the care, custody or control of the Member, for which the Member is liable, or under obligation to insure – subject to all terms, conditions and exclusions.
PERILS COVERED: All risk of direct physical loss or damage occurred during the policy period, subject to the policy exclusions.
MEMBER DEDUCTIBLE: All Risk Perils
$5,000 Per Occurrence (Personal Property & Business Interruption/Rents) Per Occurrence (Real Property)
$5,000 Buildings with a TIV of $10,000,000 of Less $10,000 Buildings with a TIV of between $10,000,001 and $25,000,000 $25,000 Buildings with a TIV of between $25,000,001 and $50,000,000 $50,000 Buildings with a TIV of $50,000,001 or more
Flood Insurance
$250,000 Flood - Zones A & V $100,000 Flood - All Other Zones
Public Entity Pollution Liability
$50,000 Per Pollution Condition 3 Days Per Pollution Condition - Business Interruption
$100,000 Per Pollution Condition - Catastrophe Management Expense
If two or more of the deductible amounts noted above apply to a single occurrence, the total to be deducted shall not exceed the largest per occurrence deductible amount applicable. This deductible statement does not apply to the Cyber Liability or Fine Arts, Artifacts and Archives deductibles noted below.
Cyber Liability
$25,000 Per Occurrence
Fine Arts, Artifacts and Archives $0 Per Occurrence
10% of TIV 10% of the value of the item damaged for losses due to earthquake
Note: TIV means Total Insurable Value
123
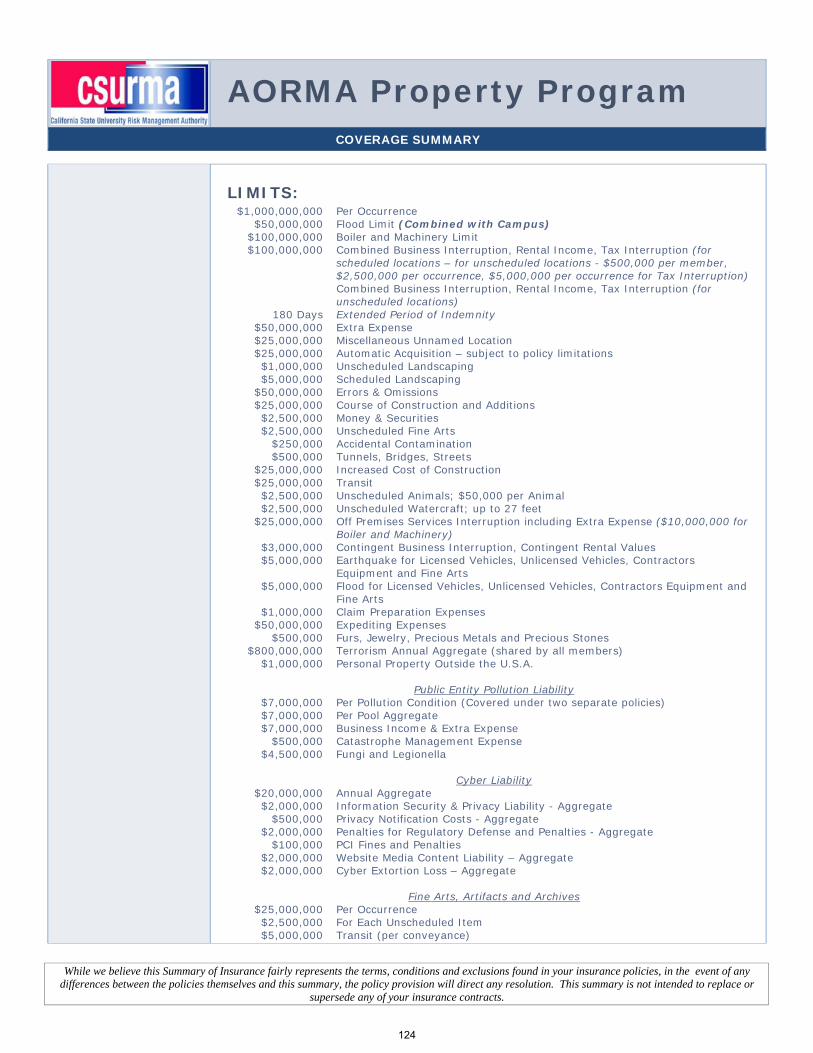
AORMA Property Program COVERAGE SUMMARY
While we believe this Summary of Insurance fairly represents the terms, conditions and exclusions found in your insurance policies, in the event of any
differences between the policies themselves and this summary, the policy provision will direct any resolution. This summary is not intended to replace or supersede any of your insurance contracts.
LIMITS: $1,000,000,000 Per Occurrence
$50,000,000 Flood Limit (Combined with Campus) $100,000,000 Boiler and Machinery Limit $100,000,000 Combined Business Interruption, Rental Income, Tax Interruption (for
scheduled locations – for unscheduled locations - $500,000 per member, $2,500,000 per occurrence, $5,000,000 per occurrence for Tax Interruption) Combined Business Interruption, Rental Income, Tax Interruption (for unscheduled locations)
180 Days Extended Period of Indemnity $50,000,000 Extra Expense $25,000,000 Miscellaneous Unnamed Location $25,000,000 Automatic Acquisition – subject to policy limitations $1,000,000 Unscheduled Landscaping $5,000,000 Scheduled Landscaping
$50,000,000 Errors & Omissions $25,000,000 Course of Construction and Additions $2,500,000 Money & Securities $2,500,000 Unscheduled Fine Arts
$250,000 Accidental Contamination $500,000 Tunnels, Bridges, Streets
$25,000,000 Increased Cost of Construction $25,000,000 Transit $2,500,000 Unscheduled Animals; $50,000 per Animal $2,500,000 Unscheduled Watercraft; up to 27 feet
$25,000,000 Off Premises Services Interruption including Extra Expense ($10,000,000 for Boiler and Machinery)
$3,000,000 Contingent Business Interruption, Contingent Rental Values $5,000,000 Earthquake for Licensed Vehicles, Unlicensed Vehicles, Contractors
Equipment and Fine Arts $5,000,000 Flood for Licensed Vehicles, Unlicensed Vehicles, Contractors Equipment and
Fine Arts $1,000,000 Claim Preparation Expenses
$50,000,000 Expediting Expenses $500,000 Furs, Jewelry, Precious Metals and Precious Stones
$800,000,000 Terrorism Annual Aggregate (shared by all members) $1,000,000 Personal Property Outside the U.S.A.
Public Entity Pollution Liability
$7,000,000 Per Pollution Condition (Covered under two separate policies) $7,000,000 Per Pool Aggregate $7,000,000 Business Income & Extra Expense
$500,000 Catastrophe Management Expense $4,500,000 Fungi and Legionella
Cyber Liability
$20,000,000 Annual Aggregate $2,000,000 Information Security & Privacy Liability - Aggregate
$500,000 Privacy Notification Costs - Aggregate $2,000,000 Penalties for Regulatory Defense and Penalties - Aggregate
$100,000 PCI Fines and Penalties $2,000,000 Website Media Content Liability – Aggregate $2,000,000 Cyber Extortion Loss – Aggregate
Fine Arts, Artifacts and Archives
$25,000,000 Per Occurrence $2,500,000 For Each Unscheduled Item $5,000,000 Transit (per conveyance)
124

AORMA Property Program COVERAGE SUMMARY
While we believe this Summary of Insurance fairly represents the terms, conditions and exclusions found in your insurance policies, in the event of any
differences between the policies themselves and this summary, the policy provision will direct any resolution. This summary is not intended to replace or supersede any of your insurance contracts.
MAJOR PERILS EXCLUDED: Consult the policy for a complete list of peril excluded. 1. Moths, vermin, termites, inherent vice, latent defect, faulty materials, error in design,
faulty workmanship, wear and tear 2. Normal settling, shrinkage or expansion 3. Delay or loss of market 4. Inventory shortage, dishonest acts of employees 5. Damage to personal property from shrinkage, evaporation, loss of weight, leakage,
breakage of fragile articles, marring, scratching, exposure to light or change in color, texture or flavor, unless caused by named perils
6. Damage to personal property in the open caused by rain, sleet or snow 7. War 8. Earthquake
LOSS VALUATION BASIS: Repair or Replacement Cost Actual Loss Sustained for Time Element Coverages Contractor’s Equipment / either Replacement Cost or Actual Cash Value (ACV) as declared by each member. If not declared, valuation will default to Actual Cash Value (ACV).
PUBLIC ENTITY POLLUTION LIABILITY SUMMARY – ATTACHED
CYBER LIABILITY SUMMARY – ATTACHED
BOILER AND MACHINERY SUMMARY – ATTACHED
FINE ARTS, ARCHIVES AND ARTIFACTS - ATTACHED
HOW TO REPORT A CLAIM:
Notify Alliant:
Michelle Maffei (415) 403-1418
Elaine Kim (415) 403-1458
After Hours Reporting:
Robert Frey (415) 403-1445
(415) 518-8490 (Cell) [email protected]
cc McLaren’s Young:
Cathryn O’Meara (949) 757-1413
(949) 757-1692 (Fax) [email protected]
125
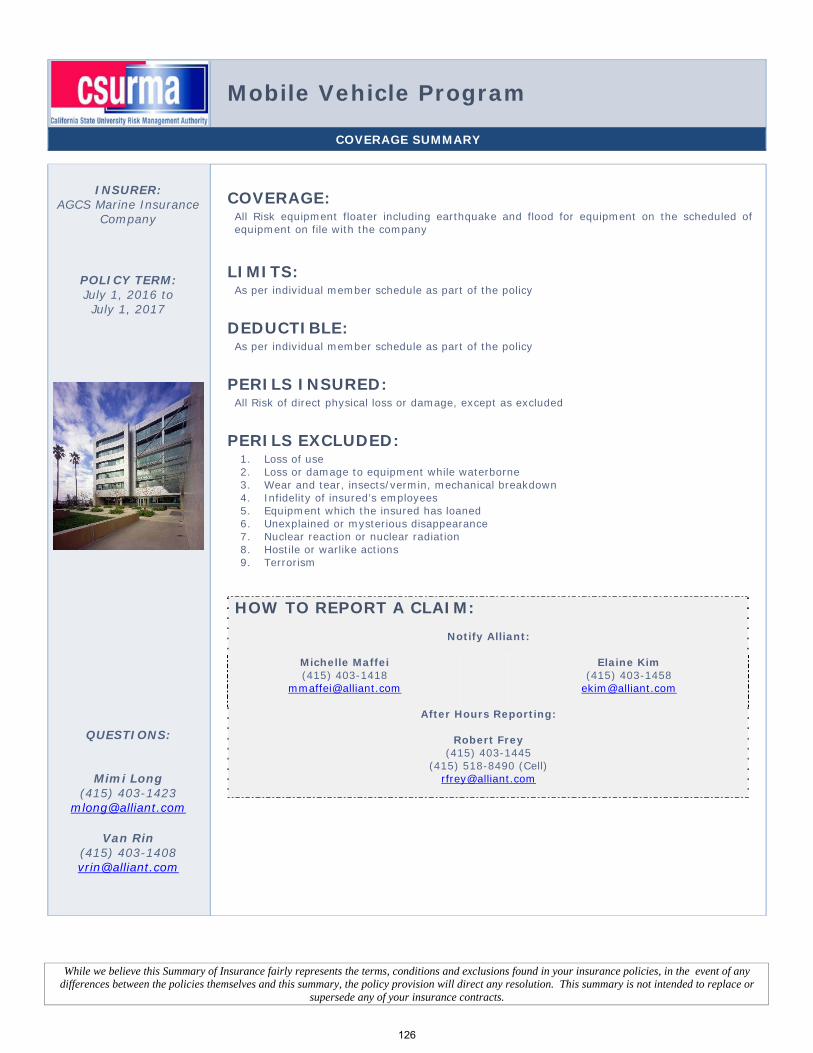
Mobile Vehicle Program
COVERAGE SUMMARY
While we believe this Summary of Insurance fairly represents the terms, conditions and exclusions found in your insurance policies, in the event of any
differences between the policies themselves and this summary, the policy provision will direct any resolution. This summary is not intended to replace or supersede any of your insurance contracts.
INSURER: AGCS Marine Insurance
Company
POLICY TERM: July 1, 2016 to July 1, 2017
QUESTIONS:
Mimi Long (415) 403-1423
Van Rin (415) 403-1408 [email protected]
COVERAGE: All Risk equipment floater including earthquake and flood for equipment on the scheduled of equipment on file with the company
LIMITS: As per individual member schedule as part of the policy
DEDUCTIBLE: As per individual member schedule as part of the policy
PERILS INSURED: All Risk of direct physical loss or damage, except as excluded
PERILS EXCLUDED: 1. 2. 3. 4. 5. 6. 7. 8. 9.
Loss of use Loss or damage to equipment while waterborne Wear and tear, insects/vermin, mechanical breakdown Infidelity of insured’s employees Equipment which the insured has loaned Unexplained or mysterious disappearance Nuclear reaction or nuclear radiation Hostile or warlike actions Terrorism
HOW TO REPORT A CLAIM:
Notify Alliant:
Michelle Maffei (415) 403-1418
Elaine Kim (415) 403-1458
After Hours Reporting:
Robert Frey (415) 403-1445
(415) 518-8490 (Cell) [email protected]
126
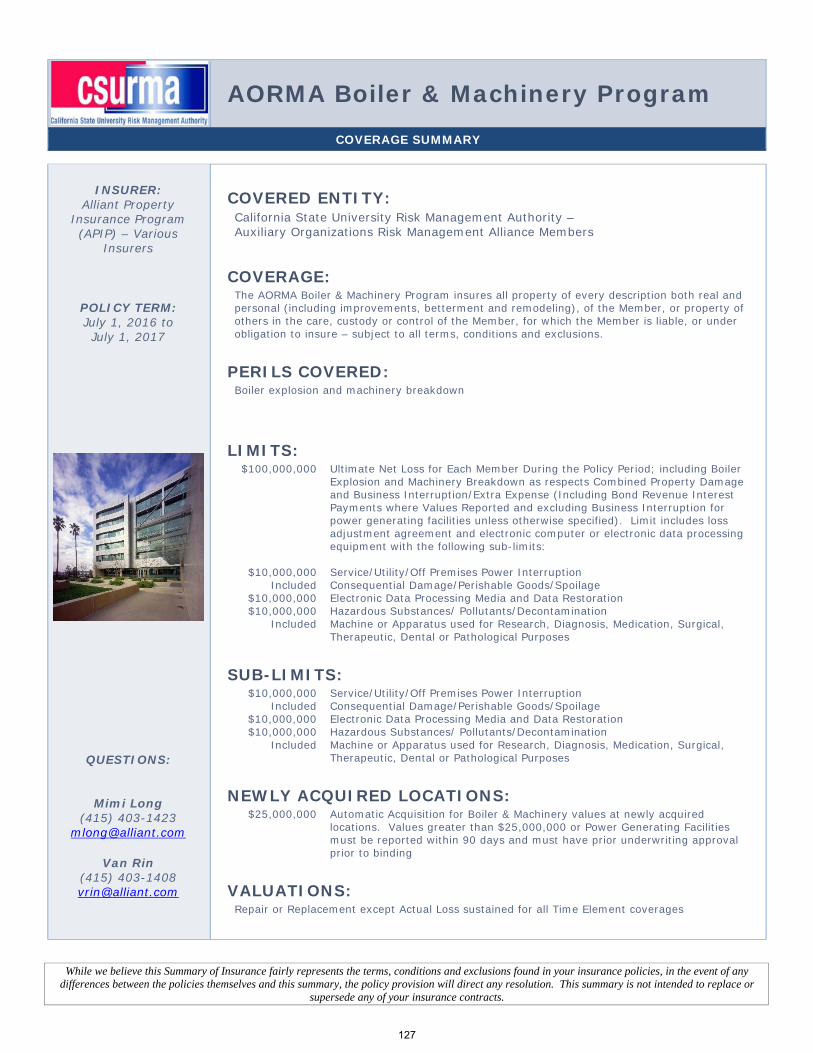
AORMA Boiler & Machinery Program
COVERAGE SUMMARY
While we believe this Summary of Insurance fairly represents the terms, conditions and exclusions found in your insurance policies, in the event of any
differences between the policies themselves and this summary, the policy provision will direct any resolution. This summary is not intended to replace or supersede any of your insurance contracts.
INSURER: Alliant Property
Insurance Program (APIP) – Various
Insurers
POLICY TERM: July 1, 2016 to July 1, 2017
QUESTIONS:
Mimi Long (415) 403-1423
Van Rin (415) 403-1408 [email protected]
COVERED ENTITY: California State University Risk Management Authority – Auxiliary Organizations Risk Management Alliance Members
COVERAGE: The AORMA Boiler & Machinery Program insures all property of every description both real and personal (including improvements, betterment and remodeling), of the Member, or property of others in the care, custody or control of the Member, for which the Member is liable, or under obligation to insure – subject to all terms, conditions and exclusions.
PERILS COVERED: Boiler explosion and machinery breakdown
LIMITS: $100,000,000
$10,000,000 Included
$10,000,000 $10,000,000
Included
Ultimate Net Loss for Each Member During the Policy Period; including Boiler Explosion and Machinery Breakdown as respects Combined Property Damage and Business Interruption/Extra Expense (Including Bond Revenue Interest Payments where Values Reported and excluding Business Interruption for power generating facilities unless otherwise specified). Limit includes loss adjustment agreement and electronic computer or electronic data processing equipment with the following sub-limits: Service/Utility/Off Premises Power Interruption Consequential Damage/Perishable Goods/Spoilage Electronic Data Processing Media and Data Restoration Hazardous Substances/ Pollutants/Decontamination Machine or Apparatus used for Research, Diagnosis, Medication, Surgical, Therapeutic, Dental or Pathological Purposes
SUB-LIMITS: $10,000,000
Included $10,000,000 $10,000,000
Included
Service/Utility/Off Premises Power Interruption Consequential Damage/Perishable Goods/Spoilage Electronic Data Processing Media and Data Restoration Hazardous Substances/ Pollutants/Decontamination Machine or Apparatus used for Research, Diagnosis, Medication, Surgical, Therapeutic, Dental or Pathological Purposes
NEWLY ACQUIRED LOCATIONS: $25,000,000 Automatic Acquisition for Boiler & Machinery values at newly acquired
locations. Values greater than $25,000,000 or Power Generating Facilities must be reported within 90 days and must have prior underwriting approval prior to binding
VALUATIONS: Repair or Replacement except Actual Loss sustained for all Time Element coverages
127

AORMA Boiler & Machinery Program
COVERAGE SUMMARY
While we believe this Summary of Insurance fairly represents the terms, conditions and exclusions found in your insurance policies, in the event of any
differences between the policies themselves and this summary, the policy provision will direct any resolution. This summary is not intended to replace or supersede any of your insurance contracts.
MEMBER DEDUCTIBLE: $5,000
1% of the Real Property Value
Per Occurrence (Personal Property & Business Interruption/Rents) – All Members Per Occurrence (Real Property) – Subject to minimum of $5,000 and maximum of $50,000 If two or more deductible amounts provided in this Declarations Page apply for a single occurrence the total to be deducted shall not exceed the largest per occurrence deductible amount applicable.
EXCLUSIONS (Including but not limited to): 1. 2. 3.
Testing Explosion, except for steam or centrifugal explosion Explosion of gas or unconsumed fuel from furnace of the boiler
OBJECTS EXCLUDED (Including but not limited to): 1. 2. 3.
Insulating or refractory material Buried Vessels or Piping Furnace, Oven, Stove, Incinerator, Pot Kiln
HOW TO REPORT A CLAIM:
Notify Alliant:
Michelle Maffei (415) 403-1418
Elaine Kim (415) 403-1458
After Hours Reporting:
Robert Frey (415) 403-1445
(415) 518-8490 (Cell) [email protected]
cc McLaren’s Young:
Cathryn O’Meara (949) 757-1413
(949) 757-1692 (Fax) [email protected]
128

Cyber Liability (with APIP) COVERAGE SUMMARY
While we believe this Summary of Insurance fairly represents the terms, conditions and exclusions found in your insurance policies, in the event of any
differences between the policies themselves and this summary, the policy provision will direct any resolution. This summary is not intended to replace or supersede any of your insurance contracts.
INSURER: Alliant Property
Insurance Program (APIP) – Lloyd’s of
London
POLICY TERM: July 1, 2016 to July 1, 2017
TERRITORY: Worldwide
RETROACTIVE DATE: July 1, 2008
QUESTIONS:
Mimi Long (415) 403-1423
Van Rin (415) 403-1408 [email protected]
COVERAGE: Information Security & Privacy Insurance with Electronic Media Liability Coverage
NAMED COVER ENTITY: California State University Risk Management Authority – Campuses
LIMITS: Third Party Liability
$2,000,000 $500,000
$2,000,000 $100,000
$2,000,000 $2,000,000
Information Security & Privacy Liability - Aggregate Privacy Notification Costs - Aggregate Penalties for Regulatory Defense and Penalties - Aggregate PCI Fines and Penalties Website Media Content Liability – Aggregate Cyber Extortion Loss – Aggregate
First Party Computer Security $2,000,000 $2,000,000
$50,000 $50,000
$150,000
Cyber Extortion Loss – Aggregate Data Protection Loss and Business Interruption Loss - Aggregate First Party Business Interruption Sub-Limits of Liability 1) Hourly Sublimit 2) Forensic Expense Sublimit 3) Dependent Business Interruption Sublimit.
RETENTION: $25,000
CSU Auxiliary Organizations Eight hour waiting period for first party claims
COINSURANCE: 10% For Public Relations Consultancy
OTHER SERVICES: Unlimited Access to e-Place Solutions as per attached brochure
129

Cyber Liability (with APIP) COVERAGE SUMMARY
While we believe this Summary of Insurance fairly represents the terms, conditions and exclusions found in your insurance policies, in the event of any
differences between the policies themselves and this summary, the policy provision will direct any resolution. This summary is not intended to replace or supersede any of your insurance contracts.
SPECIFIC COVERAGE PROVISIONS: Information Security and Privacy Liability – Violation of a privacy law for:
1.
2.
3. 4.
5.
Theft, loss or unauthorized disclosure of personally identifiable non-public information or third party corporate information that is in the care, custody or control of the Member, or an independent contractor that is holding, processing or transferring such information on behalf of the Member Failure of computer security to prevent a security breach including
a. Alteration, corruption, destruction, deletion, or damage to a data asset stored on computer systems
b. Failure to prevent transmission of malicious code from computer systems to third party computer systems
c. Participation in a denial of service attack directed against a third party computer system
The failure to timely disclose any of the above in violation of any breach notice law The failure to comply with a privacy policy involving the disclosure, sharing or selling of personally identifiable non-public information The failure to administer an identity theft prevention program
Privacy Notification Costs – Necessary costs to comply with a breach notice laws, including; 1. 2. 3. 4.
To hire security experts; Notification provisions, Public relations mitigation up to $50,000 subject to Nil coinsurance Credit monitoring for the purpose of mitigating potential damages and are subject to Nil coinsurance
a. Credit file monitoring, b. Mailing and third party administrative costs
To provide notification to: 1. 2.
Individuals who are required to be notified under the applicable Breach Notice Law; and In the Underwriters’ discretion, to individuals affected by an incident in which their Personally Identifiable Non-Public Information has been subject to theft, loss, or Unauthorized Disclosure in a manner which compromises the security or privacy of such individual by posing a significant risk of financial, reputational or other harm to the individual.
Regulatory Defense and Penalties - Regulatory proceeding resulting from a violation of a privacy law and caused by an incident described under certain sections of the information security and privacy liability section of the policy.
Website Media Content Liability - The following acts committed in the course of media activities:
1. 2. 3. 4. 5. 6. 7.
Defamation, libel, slander, trade libel Privacy violation Invasion or interference with publicity Plagiarism, piracy, misappropriation of ideas under implied contract Infringement of copyright Infringement of domain name, trademark Improper deep-linking or framing within electronic content
Cyber Extortion - Extortion threat by a person other than employees, directors, officers, principals, trustees, governors, managers, members, etc. First Party Data Protection - Data protection loss as a result of alteration, corruption, destruction, deletion, damage or inability to access data assets. First Party Network Business Interruption - Interruption or suspension of computer systems and is directly caused by a failure of computer security to prevent a security breach.
130

Cyber Liability (with APIP) COVERAGE SUMMARY
While we believe this Summary of Insurance fairly represents the terms, conditions and exclusions found in your insurance policies, in the event of any
differences between the policies themselves and this summary, the policy provision will direct any resolution. This summary is not intended to replace or supersede any of your insurance contracts.
EXCLUSIONS (including but not limited to): Coverage does not apply to any claim or loss from
1. 2. 3. 4.
5. 6. 7. 8. 9.
10. 11. 12. 13. 14. 15. 16. 17. 18.
19. 20.21. 22. 23. 24. 25.
Bodily Injury or Property Damage Any employer-employee relations, policies, practices Contractual Liability or Obligation Any actual or alleged act, error or omission or breach of duty by any director, officer, manager if claim is brought by principals, officers, directors, stockholders and the like Anti-Trust violations Unfair trade practices Unlawful collection or acquisition of Personally Identifiable Non-Public Information Distribution of unsolicited e-mails, facsimile, audio or video recording Prior knowledge or previously reported incidents Incidents occurring prior to retroactive date/continuity date Any act, error, omission, of computer security if occurred prior to policy inception Collusion Securities Act Violations Fair Labor Act Violations Discrimination Intentional Acts with regard to Privacy and Security Breach Infringement - Patent and Copyright Federal Trade Commission and related state, federal, local and foreign governmental activities Insured vs. Insured Money/Securities/Funds Transfer Broadcasting, Publications and Advertising War and Terrorism Radioactive Contamination Pollution Nuclear Incident
HOW TO REPORT A CLAIM: IMMEDIATE NOTICE should be made to Beazley Group NY:
Beazley Group NY
Beth Diamond
(646) 943-5900 [email protected]
Alliant:
Michelle Maffei (415) 403-1418
Elaine Kim (415) 403-1458
After Hours Reporting:
Robert Frey (415) 403-1445 / (415) 518-8490 (Cell)
131
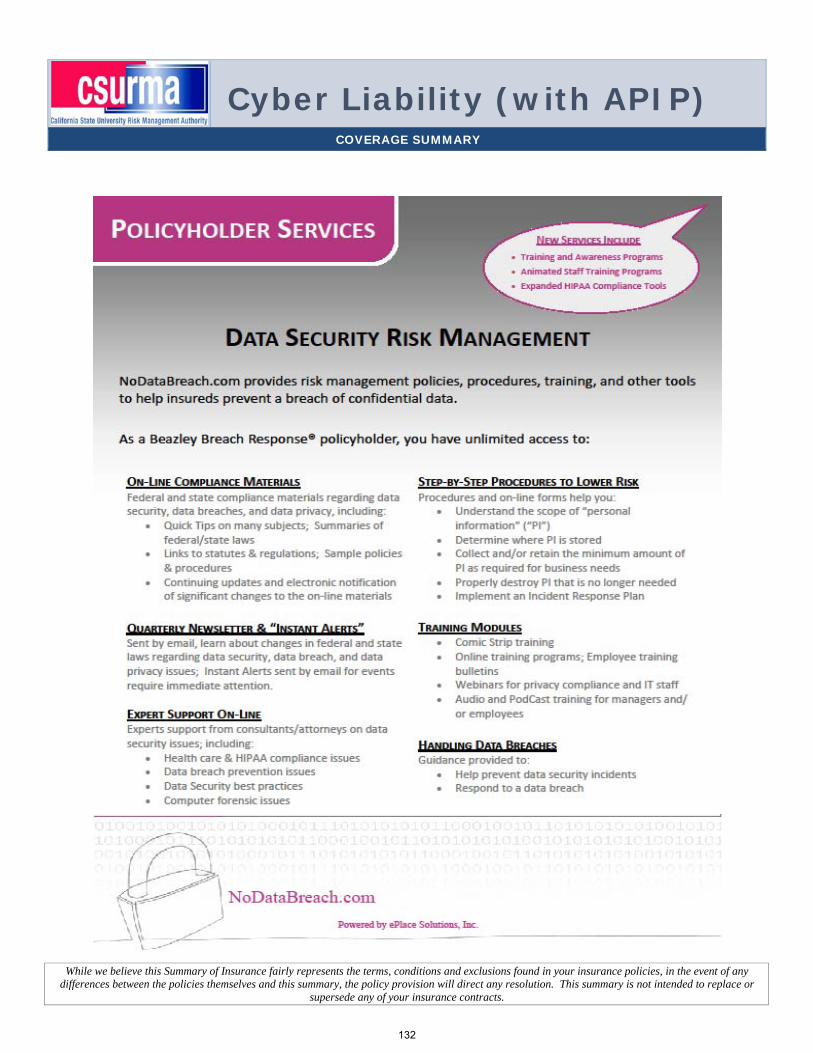
Cyber Liability (with APIP) COVERAGE SUMMARY
While we believe this Summary of Insurance fairly represents the terms, conditions and exclusions found in your insurance policies, in the event of any
differences between the policies themselves and this summary, the policy provision will direct any resolution. This summary is not intended to replace or supersede any of your insurance contracts.
132
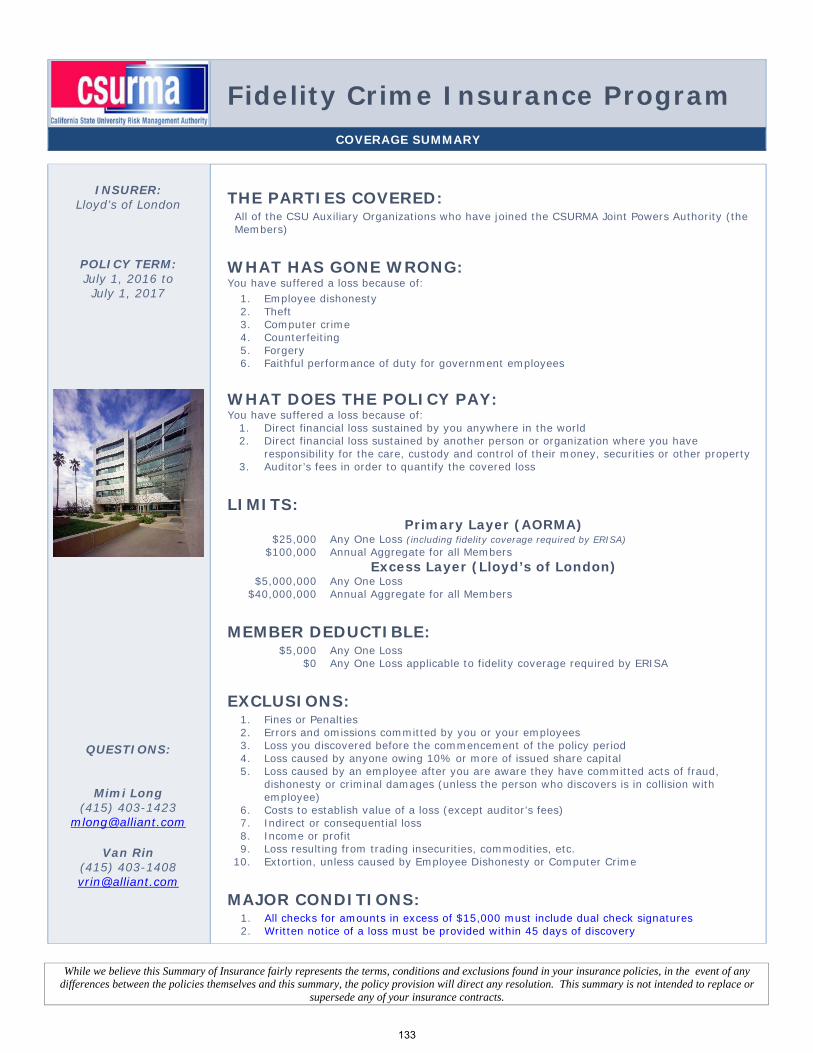
Fidelity Crime Insurance Program COVERAGE SUMMARY
While we believe this Summary of Insurance fairly represents the terms, conditions and exclusions found in your insurance policies, in the event of any
differences between the policies themselves and this summary, the policy provision will direct any resolution. This summary is not intended to replace or supersede any of your insurance contracts.
INSURER: Lloyd’s of London
POLICY TERM: July 1, 2016 to July 1, 2017
QUESTIONS:
Mimi Long (415) 403-1423
Van Rin (415) 403-1408 [email protected]
THE PARTIES COVERED: All of the CSU Auxiliary Organizations who have joined the CSURMA Joint Powers Authority (the Members)
WHAT HAS GONE WRONG: You have suffered a loss because of:
1. 2. 3. 4. 5. 6.
Employee dishonesty Theft Computer crime Counterfeiting Forgery Faithful performance of duty for government employees
WHAT DOES THE POLICY PAY: You have suffered a loss because of:
1. 2.
3.
Direct financial loss sustained by you anywhere in the world Direct financial loss sustained by another person or organization where you have responsibility for the care, custody and control of their money, securities or other property Auditor’s fees in order to quantify the covered loss
LIMITS: Primary Layer (AORMA)
$25,000 Any One Loss (including fidelity coverage required by ERISA) $100,000 Annual Aggregate for all Members
Excess Layer (Lloyd’s of London) $5,000,000 Any One Loss
$40,000,000 Annual Aggregate for all Members
MEMBER DEDUCTIBLE: $5,000 Any One Loss
$0 Any One Loss applicable to fidelity coverage required by ERISA
EXCLUSIONS: 1. 2. 3. 4. 5.
6. 7. 8. 9.
10.
Fines or Penalties Errors and omissions committed by you or your employees Loss you discovered before the commencement of the policy period Loss caused by anyone owing 10% or more of issued share capital Loss caused by an employee after you are aware they have committed acts of fraud, dishonesty or criminal damages (unless the person who discovers is in collision with employee) Costs to establish value of a loss (except auditor’s fees) Indirect or consequential loss Income or profit Loss resulting from trading insecurities, commodities, etc. Extortion, unless caused by Employee Dishonesty or Computer Crime
MAJOR CONDITIONS: 1. 2.
All checks for amounts in excess of $15,000 must include dual check signatures Written notice of a loss must be provided within 45 days of discovery
133

Fidelity Crime Insurance Program COVERAGE SUMMARY
While we believe this Summary of Insurance fairly represents the terms, conditions and exclusions found in your insurance policies, in the event of any
differences between the policies themselves and this summary, the policy provision will direct any resolution. This summary is not intended to replace or supersede any of your insurance contracts.
HOW TO REPORT A CLAIM:
Notify Alliant:
Michelle Maffei (415) 403-1418
Elaine Kim (415) 403-1458
After Hours Reporting:
Robert Frey (415) 403-1445
(415) 518-8490 (Cell) [email protected]
134

Identity Fraud Expense Reimbursement
COVERAGE SUMMARY
While we believe this Summary of Insurance fairly represents the terms, conditions and exclusions found in your insurance policies, in the event of any
differences between the policies themselves and this summary, the policy provision will direct any resolution. This summary is not intended to replace or supersede any of your insurance contracts.
INSURER: Travelers Excess and
Surplus Lines Company
POLICY TERM: July 1, 2016 to July 1, 2017
POLICY NO: 105960479
QUESTIONS:
Mimi Long
(415) 403-1423 [email protected]
Van Rin (415) 403-1408 [email protected]
COVERAGE: 1.
2. 3.
4.
5.
Lost wages as a result of time taken off from work to deal with the fraud, including wrongful incarceration – up to $500 per week for four weeks Notary and certified mail charges for completing and delivering fraud affidavits Fees to re-apply for loans that were denied as a result of erroneous credit information due to the identity theft Long distance telephone charges for calling merchants, law enforcement agencies or credit grantors to discuss an actual identity theft Attorney fees incurred, with Travelers Bond’s prior consent, for:
a. Defending suits brought incorrectly by merchants or their collection agencies b. Removing criminal or civil judgments wrongly entered against the victim c. Challenging information in a credit report
THIS BENEFIT APPLIES TO ANY INSURED PERSON - INSURED PERSON MEANS:
1. 2.
Any full-time or part-time employee of the Auxiliary Organization The spouse, domestic partner, child under 25 years of age or parent of the employee (residing in the same household)
LIMITS: $10,000 Any one loss
DEDUCTIBLE: None
EXCLUSIONS: 1. 2. 3.
Fraud, dishonest or criminal act of any person acting in concert with the Insured Person; Loss other than expenses; Loss that occurred prior to or after being an employee of the covered CSURMA AORMA Member
HOW TO REPORT A CLAIM:
Travelers Bond & Financial Products Claim Department (800) 842-8496
135

Public Entity Pollution Liability COVERAGE SUMMARY
While we believe this Summary of Insurance fairly represents the terms, conditions and exclusions found in your insurance policies, in the event of any
differences between the policies themselves and this summary, the policy provision will direct any resolution. This summary is not intended to replace or supersede any of your insurance contracts.
INSURER: Alliant Property
Insurance Program (APIP) – Lloyd’s of
London
POLICY TERM: July 1, 2016 to July 1, 2017
RETROACTIVE DATE: July 1, 2011
QUESTIONS:
Mimi Long (415) 403-1423
Van Rin (415) 403-1408 [email protected]
COVERED LOCATION: 1. 2.
All locations included on the Member’s Property Schedule Any non-owned disposal site – for third-party claims only
COVERED OPERATIONS: Covered operations means transportation and any operations that are identified in the application and any supporting documentation provided prior to the inception date, which are performed by or on behalf of a named insured outside the physical boundaries of a covered location. Includes spraying operations, street construction and repair, utility construction and repair, and refuse collection.
COVERAGE: This policy provides coverage for:
1.
2.
3.
4. 5.
Third party bodily injury or property damage, remediation costs and associated legal defense expense arising out of a pollution condition on, at, under, or migrating from a covered location, provided that the pollution condition commences on or after the retroactive date Third party bodily injury, property damage, remediation costs and associated legal defense expense resulting from a covered operation, provided that the pollution condition commences on or after the retroactive date. An actual business interruption loss resulting from the discovery of a covered pollution condition Catastrophe management costs Emergency response costs
LIMITS: $7,000,000 $7,000,000 $7,000,000
$500,000 $4,500,000
Per Pollution Condition (Covered under two separate policies) Per Pool Aggregate Business Income & Extra Expense Catastrophe Management Expense Fungi and Legionella
SELF-INSURED RETENTION: $50,000
$75,000
3 Days
$100,000 $750,000
Per Pollution Condition – Auxiliary Organizations (for the first $5,000,000 of the loss) Per Pollution Condition – Auxiliary Organizations (for losses in excess of $5,000,000 up to $7,000,000) Business Interruption (plus 4 additional days if the loss is in excess of $5,000,000) Catastrophe Management Expense Underground Storage Tanks
136

Public Entity Pollution Liability COVERAGE SUMMARY
While we believe this Summary of Insurance fairly represents the terms, conditions and exclusions found in your insurance policies, in the event of any
differences between the policies themselves and this summary, the policy provision will direct any resolution. This summary is not intended to replace or supersede any of your insurance contracts.
EXCLUSIONS: 1. 2. 3. 4. 5. 6. 7. 8. 9.
10. 11. 12. 13. 14. 15. 16. 17. 18. 19. 20. 21. 22. 23.
Asbestos Contractual Liability Divested Property Employer’s Liability Failure to Follow Asbestos and/or LBP Management Plan Fines and Penalties First Party Property Damage – Does not apply to remediation costs Fraud or Misrepresentation Insured’s Internal Expenses Insured vs. Insured Intentional Non-Compliance Landfills and Recycling Facilities – leased, owned or operated Lead-Based Paint Material Change in Risk Naturally Occurring Materials Pre-Existing Conditions Products Liability Professional Liability Regulatory Compliance Underground Storage Tanks Vehicles War or Terrorism Work Product
HOW TO REPORT A CLAIM: IMMEDIATE NOTICE should be made to ACE Environmental Risk:
To: ACE Environmental Risk Claims Manager
ACE USA Claims P.O. Box 5103
Scranton, PA 18505-0510 (888) 310-9553
cc: Alliant
Michelle Maffei (415) 403-1418
Elaine Kim (415) 403-1458
After Hours Reporting:
Robert Frey (415) 403-1445
(415) 518-8490 (Cell) [email protected]
137

Workers’ Compensation Program COVERAGE SUMMARY
While we believe this Summary of Insurance fairly represents the terms, conditions and exclusions found in your insurance policies, in the event of any
differences between the policies themselves and this summary, the policy provision will direct any resolution. This summary is not intended to replace or supersede any of your insurance contracts.
INSURER: Auxiliary Organization
Risk Management Alliance (AORMA)
POLICY TERM: July 1, 2016 to July 1, 2017
QUESTIONS:
Mimi Long (415) 403-1423
Van Rin (415) 403-1408 [email protected]
COVERAGE: Worker’s Compensation and Employers’ Liability
LIMITS: Primary - AORMA
$500,000 $500,000 $500,000
Workers’ Compensation - each accident Employer’s Liability - each accident Employer’s Liability – each employee for disease
Excess Statutory
$5,000,000 $5,000,000
Workers’ Compensation - each accident Employer’s Liability - each accident Employer’s Liability – each employee for disease
EXTENSION(S): 1.
2. 3. 4.
Allocable Loss Adjustment Expense (“defense costs”) included as loss to satisfy the retention All States Coverage USL&H (Incidental Only) Maritime Coverage (Incidental Only)
HOW TO REPORT A CLAIM: In the event of a Workers’ Compensation claim, please forward the Workers’ Compensation Claim Form (DWC1) and the Employer’s Report of Occupational Injury or Illness (Form 5020) to:
Sedgwick CMS Brian Montagnese (916) 851-4441
138

Memorandum Date: November 17, 2016 To: Board of Directors Cal Poly Pomona Foundation From: David F. Prenovost Senior Managing Director/CFO Subject: Status of Property & Liability Risk Management Issues Below is a status of risk management issues regarding property and liability.
1. Property Losses – No property losses occurred within fiscal year 2015-16 2. Three General Liability Losses (excluding employment practices) occurred during
fiscal year 2015-16. Only one claim is still open. Burglary in a classroom - $5,596 (closed)
Auto liability property damage - $392 (closed)
Slip, Trip and Fall - $1,500 (open)
We will continue to keep you apprised as necessary at our regularly scheduled meetings.
139
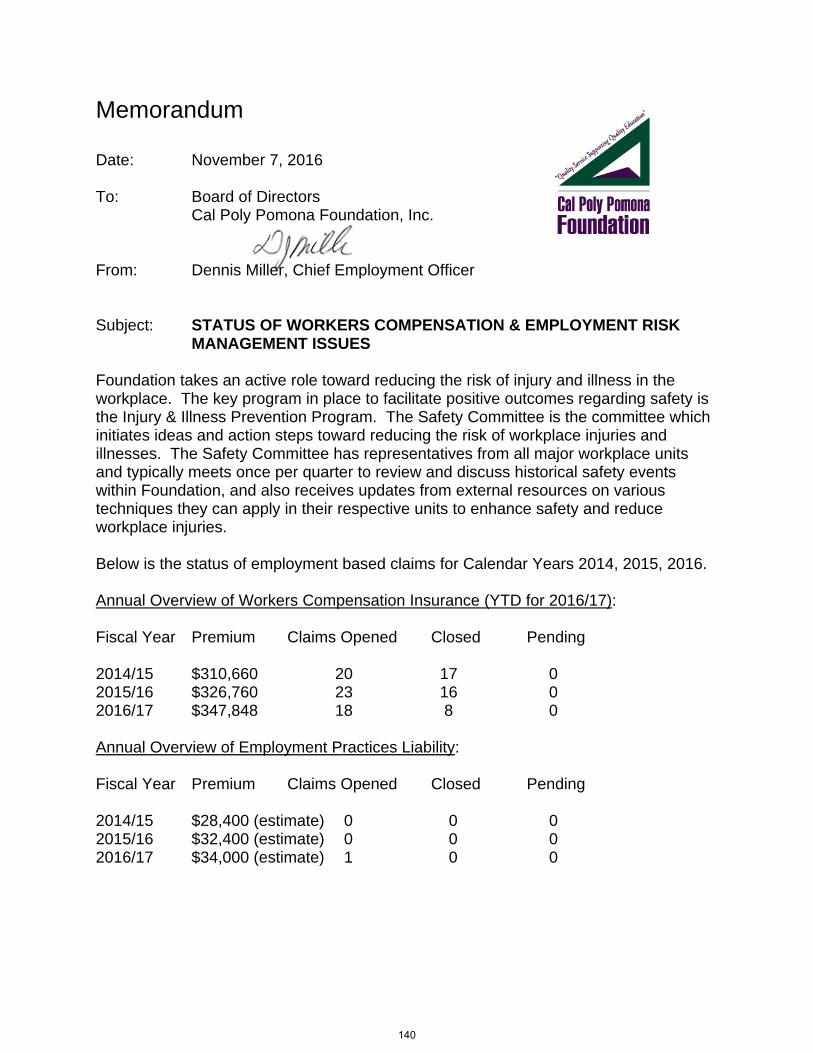
Memorandum Date: November 7, 2016 To: Board of Directors
Cal Poly Pomona Foundation, Inc.
From: Dennis Miller, Chief Employment Officer Subject: STATUS OF WORKERS COMPENSATION & EMPLOYMENT RISK
MANAGEMENT ISSUES Foundation takes an active role toward reducing the risk of injury and illness in the workplace. The key program in place to facilitate positive outcomes regarding safety is the Injury & Illness Prevention Program. The Safety Committee is the committee which initiates ideas and action steps toward reducing the risk of workplace injuries and illnesses. The Safety Committee has representatives from all major workplace units and typically meets once per quarter to review and discuss historical safety events within Foundation, and also receives updates from external resources on various techniques they can apply in their respective units to enhance safety and reduce workplace injuries. Below is the status of employment based claims for Calendar Years 2014, 2015, 2016. Annual Overview of Workers Compensation Insurance (YTD for 2016/17): Fiscal Year Premium Claims Opened Closed Pending 2014/15 $310,660 20 17 0 2015/16 $326,760 23 16 0 2016/17 $347,848 18 8 0 Annual Overview of Employment Practices Liability: Fiscal Year Premium Claims Opened Closed Pending 2014/15 $28,400 (estimate) 0 0 0 2015/16 $32,400 (estimate) 0 0 0 2016/17 $34,000 (estimate) 1 0 0
140

Memorandum Date: November 17, 2016 To: Board of Directors Cal Poly Pomona Foundation, Inc. From: G. Paul Storey Executive Director
Subject: Status Report on the 2016-2017 Board-approved
Capital Improvement Program A status update will be provided to the committee related to the 2016-2017 Board approved capital improvement budget as reflected in the attachment. The 2016-17 capital improvement budget approved by the Board included $1,797,990 for new capital improvement requests, and $314,750 in capital improvement carry forward from prior years.
141

CAL POLY POMONA FOUNDATION, INC 2016-17 PROPOSED CAPITAL BUDGET
Prior Proposed ProposedYears Detail Total
Remaining 2016-17 2016-17Enterprise Activities
Reserves Foundation Housing
220,400 University Village 220,400 220,400
Carpet/tile - Various Apts. ($60,000), Interior painting Bldg 95 & 105 Phase III ($92,000), Duct cleaning phase II and bldg 95 and 105 ($38,400), Replace heating and cooling units in 270 ($20,000), Star Rez web upgrade ($10,000)
Bronco Bookstore300,000 Bookstore 30,000 300,000 300,000 Sales floor, POS, and security server updates
Dining Services
113,000 Dining 137,000 LO replacement consulting ($10,000), Cognos Tableau project ($40,000), ECRS-Micros conversion project ($28,000), Bldg 97 upgrades ($35,000), Hill Consultant ($24,000)
Brewing Education 27,700
Conical fermenters for Tippy Dumps ($14,000), Tippy Dump secondary heating element ($1,700), Remote/mobile fermentation sensor/alarm ($3,000), Counterflow chillers for Tippy Dumps ($1,500), Misc. lab equipment/hardware ($7,500)
Carl's Jr. 23,500 EOL charbroiler replacement, plumbing50,000 Denny's 50,000 Den refresh ($30,000), Furniture, charging stations (20,000)
Einsteins 29,000 Microwaves ($4,000), Bagel oven rebuild ($10,000), Digital menu boards ($15,000)Innovation Brew Works 10,500 Hop planting/trellis ($2,500), Add hose bib to patio ($3,000), Bottling line ($5,000
62,000 Kellogg West Dining
62,000
Portable electric cambros ($10,000), Main kitchen 3 compartment sink replacement ($6,000), Wrap KW catering vehicles with KW catering sign ($10,000), KW portable walls overhaul ($6,000), Install sundry/snacks/food kiosk @ front desk ($12,000), Water heater booster installation for sinks and dishwasher ($15,000), Chef office remodel ($3,000)
30,000 Los Olivos 30,000 Box truck replacementQdoba 7,500 RethermolizerRound Table Pizza 8,500 Sound/PA systemStarbucks 30,000 Mandatory brand refresh plans, siteworkTotal Dining Services 415,700 Kellogg West Conference Center & Hotel
400,000
Kellogg West Rooms & Conference
400,000 400,000
Conference center renovations, A/V upgrades, replacement of 100 conference chairs and replacement of 100 conference center tables, Hillside Exterior renovations includingnew railing, lighting and painting
FacilitiesFacilities - - No capital budget requestedReal Estate Activities
40,000 Bldg 66 40,000 Atrium paint ($20,000), Restroom walls ($20,000)
62,000 CTTI Buildings 62,000
Retube boiler bldg #C ($12,000), Water heater replacement bldg #C ($5,000), Restroomstall replacement CTTi ($20,000), Fire Suppression System - Data Closets Bldg A ($25,000)
Total Real Estate Activities 102,000 Office of ResearchResearch and Sponsored Prog 15,900 15,900 Subscription to Evisions for Cayuse module 424College of Agriculture
Spadra/Westwind Ranch 165,000 - Paint building #28 ($90,000 Fruit & Crops Unit), Replacement of irrigation mainlines withYellow-mine PVC pipe at Westwind and Spadra Ranches ($75,000)
20,000 Pine Tree Ranch 20,000 - Replant 5 acres of avocado ($20,000)14,750 Swine Unit 14,750 - Purchase of Kawasaki quad50,000 Wasmandorf Avocado House 50,000 Renovations to the Wasmandorf Avocado House
Total College of Agriculture 50,000 142
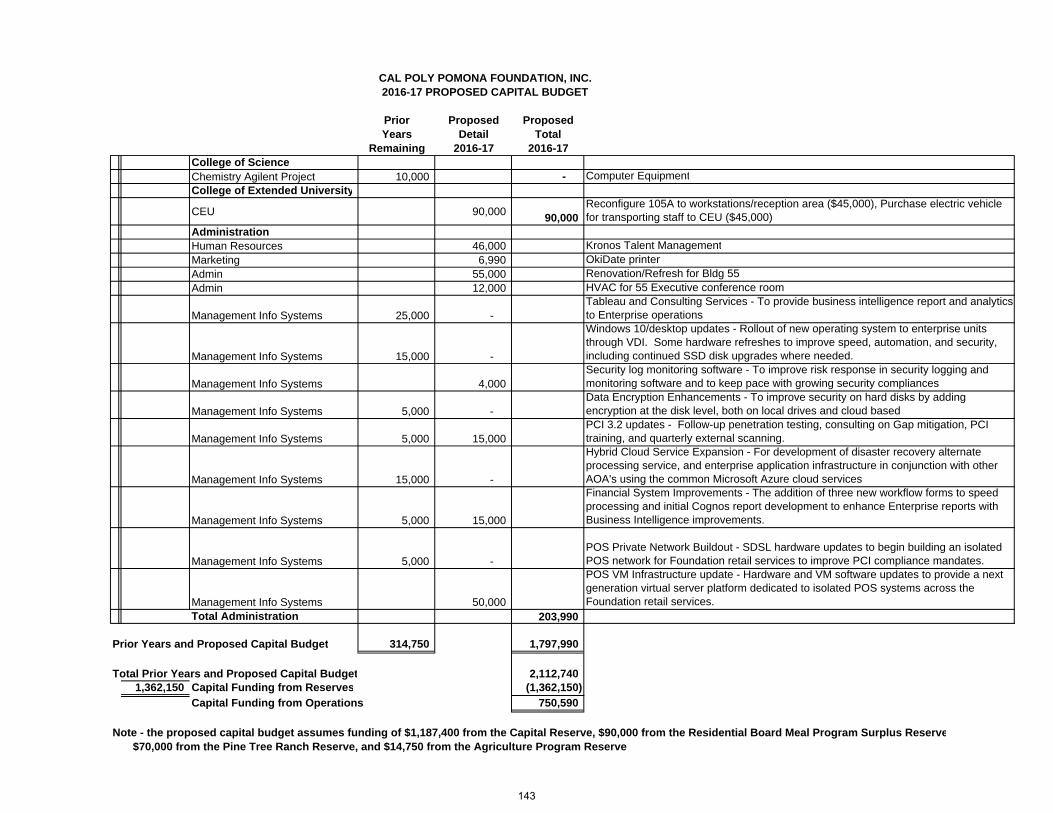
Prior Proposed ProposedYears Detail Total
Remaining 2016-17 2016-17
CAL POLY POMONA FOUNDATION, INC. 2016-17 PROPOSED CAPITAL BUDGET
College of ScienceChemistry Agilent Project 10,000 - Computer EquipmentCollege of Extended University
CEU 90,000 90,000
Reconfigure 105A to workstations/reception area ($45,000), Purchase electric vehicle for transporting staff to CEU ($45,000)
Administration Human Resources 46,000 Kronos Talent ManagementMarketing 6,990 OkiDate printerAdmin 55,000 Renovation/Refresh for Bldg 55Admin 12,000 HVAC for 55 Executive conference room
Management Info Systems 25,000 - Tableau and Consulting Services - To provide business intelligence report and analytics to Enterprise operations
Management Info Systems 15,000 -
Windows 10/desktop updates - Rollout of new operating system to enterprise units through VDI. Some hardware refreshes to improve speed, automation, and security, including continued SSD disk upgrades where needed.
Management Info Systems 4,000 Security log monitoring software - To improve risk response in security logging and monitoring software and to keep pace with growing security compliances
Management Info Systems 5,000 - Data Encryption Enhancements - To improve security on hard disks by adding encryption at the disk level, both on local drives and cloud based
Management Info Systems 5,000 15,000 PCI 3.2 updates - Follow-up penetration testing, consulting on Gap mitigation, PCI training, and quarterly external scanning.
Management Info Systems 15,000 -
Hybrid Cloud Service Expansion - For development of disaster recovery alternate processing service, and enterprise application infrastructure in conjunction with other AOA's using the common Microsoft Azure cloud services
Management Info Systems 5,000 15,000
Financial System Improvements - The addition of three new workflow forms to speed processing and initial Cognos report development to enhance Enterprise reports with Business Intelligence improvements.
Management Info Systems 5,000 - POS Private Network Buildout - SDSL hardware updates to begin building an isolated POS network for Foundation retail services to improve PCI compliance mandates.
Management Info Systems 50,000
POS VM Infrastructure update - Hardware and VM software updates to provide a next generation virtual server platform dedicated to isolated POS systems across the Foundation retail services.
Total Administration 203,990
Prior Years and Proposed Capital Budget 314,750 1,797,990
Total Prior Years and Proposed Capital Budget 2,112,740 1,362,150 Capital Funding from Reserves (1,362,150)
Capital Funding from Operations 750,590
Note - the proposed capital budget assumes funding of $1,187,400 from the Capital Reserve, $90,000 from the Residential Board Meal Program Surplus Reserve $70,000 from the Pine Tree Ranch Reserve, and $14,750 from the Agriculture Program Reserve
143

2016‐17 Cal Poly Pomona Capital Projects Update
Enterprise 16‐17 Budget
Description Update Expenditure to Date
Dining Services‐‐Original Amount Requested: $415,000
Dining $137,000
LO replacement consulting ($10,000), Cognos Tableau project ($40,000), ECRS‐Micros conversion project ($28,000), Bldg 97 upgrades ($35,000), Hill Consultant ($24,000)
Carpet/Paint and general 97 maintenance complete. Envision Strategies (LO Consulting) 50%, Micros Conversion Project 50%, Hill Consulting Complete‐
$31,520
Brewing Education and Innovation Brew Works
$38,200
Conical fermenters for Tippy Dumps ($14,000), Tippy Dump secondary heating element ($1,700), Remote/mobile fermentation sensor/alarm ($3,000), Counterflow chillers for Tippy Dumps ($1,500), Misc. lab equipment/hardware ($7,500) Hop planting/trellis ($2,500), Add hose bib to patio ($3,000), Bottling line ($5,000)
This project has been mostly completed, with the remote/mobile fermentation sensors being put on hold until further evaluation by the instructor(s). We also still have room in the budget for the lab equipment and hardware enhancements as our needs become more apparent. The conical fermenters should be noted, as they provide the fermentation control expected by students attending a world‐class brewing program. While the hop planting project did take place, other operational enhancements took priority in order to enhance the customer experience including a filtered/refrigerated water dispenser, and dimmable dining room fixtures. We anticipate pushing the bottling line project and hose bib project to the next fiscal year. We also employed Agronomy and Horticulture Club’ students directed by Aaron Fox from the College of Agriculture’s Urban and Community Agriculture department to plant Chinook hops surrounding the patio at Innovation Brew Works
$27,813
Carl's Jr. $23,500 EOL charbroiler replacement, plumbing
Oven is in transit for install the December. We anticipate this project to fall within budget
$4,179
Denny's $50,000 Den refresh ($30,000), Furniture, charging stations (20,000)
The final phase (primarily furniture) will be in place by January 3, 2017. We anticipate this project to fall within budget.
$35,611
Einsteins $29,000
Microwaves ($4,000), Bagel oven rebuild ($10,000), Digital menu boards ($15,000)
‐These projects will be deferred to the future $0
Kellogg West Dining
$62,000
Portable electric cambros ($10,000), Main kitchen 3 compartment sink replacement ($6,000), Wrap KW catering vehicles with KW catering sign ($10,000), KW portable walls overhaul ($6,000), Install sundry/snacks/food kiosk @ front desk ($12,000), Water heater booster installation for sinks and dishwasher ($15,000), Chef office remodel ($3,000)
All items have been completed, with exception of the water heater booster and Sundry/Snack/Food Kiosk. We anticipate these projects to fall within budget.
$15,509
Los Olivos $30,000 Box truck replacement
Deferred to future year‐ Will be reintroduced with a multi‐year dining vehicle plan (i.e., inclusive of LO replacement needs, EOL, etc.)
$0
Qdoba $7,500 Rethermolizer
This project is complete. $6,024
Round Table Pizza
$8,500 Sound/PA system
Sound system deferred to future, funds used to replace failed ice machine $4,100
Starbucks $30,000 Mandatory brand refresh plans, sitework
Conceptual drawings and schematics for anticipated $400k remodel summer 2017
$16,000
DINING SERVICES TOTAL BUDGETED $415,700 DINING SERVICES TOTAL SPENT TO DATE $140,756 144

2016‐17 Cal Poly Pomona Capital Projects Update
Enterprise 16‐17 Budget
Description Update Expenditure to Date
Information Technology‐‐Original Amount Requested: $159,000
IT $25,000
Tableau Licensing and Consulting Services ‐ To provide business intelligence report and analytics to Enterprise Operations.
Dining and Admin dashboards completed. $12,000
IT $15,000
Windows 10/Desktop Updates ‐ Rollout of new operating system to enterprise units through VDI. Some hardware refreshes to improve speed, automation, and security, including continued SSD disk upgrades where needed.
GPO's and Win10 images created. $2,000
IT $4,000
Security Log Monitoring Software ‐ To improve risk response in security logging and monitoring software and to keep pace with growing security compliances.
Varonis on order for log and change control. ‐
IT $5,000
Data Encryption Enhancements ‐ To improve security on harddisks by adding encryption at the disk level, both on local drives and cloud based.
Bitlocker licensing and Secure disks for mobile devices in process. ‐
IT
$20,000
PCI 3.2 Updates ‐ Follow‐up penetration testing, consulting on Gap mitigation, PCI training, and quarterly external scanning.
Penetration testing/scanning converted to Coalfire. $7,000
IT $15,000
Hybrid Cloud Service Expansion ‐ For development of disaster recovery alternate processing service, and enterprise application infrastructure in conjunction with other AOA's using the common Microsoft Azure cloud services.
Shop24 conversion and azure testing in process. ‐
IT $20,000
Financial System Improvements ‐ The addition of three new workflow forms to speed processing, and initial Cognos report development to enhance Enterprise reports with Business Intelligence improvements.
Webform/Workflows in process for AR department. $8,000
IT $5,000
POS Private Network Buildout ‐ SDSL hardware updates to begin building an isolated POS network for Foundation retail services to improve PCI compliance mandates.
Working with UIT to expand usage for ECRS convenience stores. ‐
IT $50,000
POS VM Infrastructure Update ‐ Hardware and VM software updates to provide a next generation virtual server platform dedicated to isolated POS systems across the Foundation retail services.
Fusionstorm/HP ugprade in process. $45,00
IT TOTAL BUDGETED $159,000 IT TOTAL SPENT TO DATE $74,000
145

2016‐17 Cal Poly Pomona Capital Projects Update
Enterprise 16‐17 Budget
Description Update Expenditure to Date
Kellogg West Conference Center and Hotel‐‐Original Amount Requested: $400,000
KW
$180,000
Conference Center renovations, A/V upgrades, replacement of 100 conference chairs and replacement of 100 conference center chairs
Completed: WIFI Upgrade: $62,933, Conference chairs: $42,728, New Conference Room Screens: $7,530.
TBD: New mounted VPS units to be purchased and installed in selected meeting rooms.
$113,191
KW
$35,000
Hillside Exterior renovations including new railing, lighting and painting
Exterior Woodview railing: $19,927, Exterior Woodview lighting: $9,091.
Completed.
$ 29,018
KW
$30,000
Other: Conference Center domestic hot water tank(s) replacement Bldg 76 Conference Center domestic hot water tanks: $28,895.
Completed.
$28,895
KW
$8,000
Conference Center heating & a/c electronic control boards Heating & a/c electronic boards have been purchased.
Completed.
$8,106
KW
$80,000
New carpet installed in interior hallways of Hillside and Woodview Bldgs. Painting, wall trim, chair molding and artwork for interior hallways of Hillside and Woodview Bldgs.
New artwork installed in interior hallways of Hillside and Woodview Bldgs.
TFD: Carpeting, painting, wall trim and chair molding of interior hallways of Hillside and Woodview Bldgs.
$1,016 KW TOTAL BUDGETED $333,000 KW TOTAL SPENT TO DATE $180,226
146

2016‐17 Cal Poly Pomona Capital Projects Update
Enterprise 16‐17 Budget
Description Update Expenditure to Date
University Village Housing‐‐Original Amount Requested: $220,400
Village $60,000
Carpet/tile ‐ various apts. Completed. Waiting for final billing for $35,925.54.
$22,289
Village $92,000
Interior painting: Phase III Bldgs. 95 & 105 Completed
$91,178
Village $38,400
Duct cleaning: Phase II (all) and Phase III Bldgs. 95 and 105 Completed
$38,400
Village $20,000
Replace heating and cooling units in Phase II Bldg. 270 Completed
$20,634
Village $10,000
Star Rez web upgrade Completed. $2,000 for training and maintenance waived.
$8,000 VILLAGE TOTAL BUDGETED $220,400 VILLAGE TOTAL SPENT TO DATE $180,501
Bronco Bookstore‐‐Original Amount Requested: $300,000
Bookstore $300,000
Sales floor, POS, and security server updates Design is complete, quotes are higher than anticipated and are still being requested.
$0 BOOKSTORE TOTAL BUDGETED $300,000 BOOKSTORE TOTAL SPENT TO DATE $0
147

2016‐17 Cal Poly Pomona Capital Projects Update
Enterprise 16‐17 Budget
Description Update Expenditure to Date
Real Estate Services‐‐Original Amount Requested: $102,000
RE $12,000
Boiler re‐tube In progress
$0
RE $40,000
Restroom stall partitions for CTTi In progress
$0
RE $25,000
Fire Suppression system for data closets in Bldg. A In progress
$0
RE $5,000
Water Heater Replacement for Bldg. C In progress
$0
RE $20,000
Painting Atrium of Bldg. 66 In progress
$0 RE TOTAL BUDGETED $102,000 RE TOTAL SPENT TO DATE $0
Employment Services (HR)‐‐Original Amount Requested: $46,000
Human Resources $46,000
Kronos Talent Management system
$15,000 HR TOTAL BUDGETED $46,000 HR TOTAL SPENT TO DATE $15,000
148
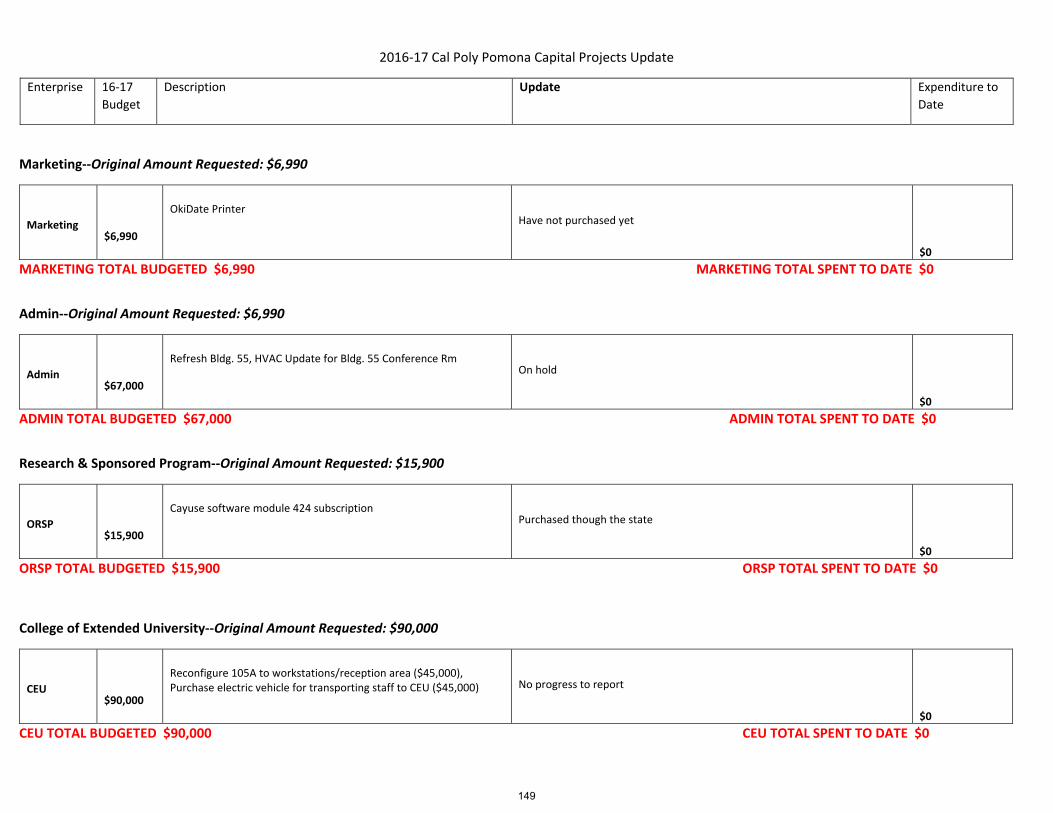
2016‐17 Cal Poly Pomona Capital Projects Update
Enterprise 16‐17 Budget
Description Update Expenditure to Date
Marketing‐‐Original Amount Requested: $6,990
Marketing $6,990
OkiDate Printer Have not purchased yet
$0 MARKETING TOTAL BUDGETED $6,990 MARKETING TOTAL SPENT TO DATE $0
Admin‐‐Original Amount Requested: $6,990
Admin $67,000
Refresh Bldg. 55, HVAC Update for Bldg. 55 Conference Rm On hold
$0 ADMIN TOTAL BUDGETED $67,000 ADMIN TOTAL SPENT TO DATE $0
Research & Sponsored Program‐‐Original Amount Requested: $15,900
ORSP $15,900
Cayuse software module 424 subscription Purchased though the state
$0 ORSP TOTAL BUDGETED $15,900 ORSP TOTAL SPENT TO DATE $0
College of Extended University‐‐Original Amount Requested: $90,000
CEU $90,000
Reconfigure 105A to workstations/reception area ($45,000), Purchase electric vehicle for transporting staff to CEU ($45,000) No progress to report
$0 CEU TOTAL BUDGETED $90,000 CEU TOTAL SPENT TO DATE $0
149

2016‐17 Cal Poly Pomona Capital Projects Update
Enterprise 16‐17 Budget
Description Update Expenditure to Date
College of Agriculture‐‐Original Amount Requested: $50,000
Ag
$50,000
Pine Tree Ranch –CARRYOVER ($20,000) Swine Unit –CARRYOVER ($14,750) Wasmandorf Avocado House ($15,000)
Pine Tree Ranch – see comments below regarding Wasmandorf Avocado House
Swine Unit – no progress
Wasmandorf Avocado House– $40,000 for HVAC, Flooring and electrical upgrades in progress
$0 AG TOTAL BUDGETED $50,000 AG TOTAL SPENT TO DATE $0
College of Science‐‐Original Amount Requested: $10,000 (CARRYOVER)
Agilent $10,000
Computer Equipment‐CARRYOVER ($10,000) No progress to report
$0 AGILENT TOTAL BUDGETED $10,000 AGILENT TOTAL SPENT TO DATE $0
150
Memorandum Date: November 17, 2016 To: Board of Directors
Cal Poly Pomona Foundation, Inc.
From: David F. Prenovost, Senior Managing Director/Chief Financial Officer
Subject: Analysis of Wells Fargo Commercial Card The following presentation was prepared by Wells Fargo and represents an Account Review of our Commercial Card Program. The account review includes analyses on the card usage, monthly statistical information, our top expense categories, the cost breakdown for our travel and entertainment expenses, and our top 50 merchants by purchase volume from 2012 through September 2016.
151

Account Review January – September 2016Cal Poly Pomona Foundation, Inc.
Sarah PennywittOctober 2016
152

Your program at a glance
Contractual average transaction size $200Current actual bps earnings $2,500,000-$4,999,999= 92 bps/next tier earnings $5,000,000-$7,499,999=102 bps
2
$800,000 commercial card line of credit
*The above-referenced numbers are based on customer’s YTD net purchase volume and average transaction size through YTD. Customer’s ability to earn a revenue share payment to be paid in 2017 is based solely on customer’s total year-end net purchase volume and average transaction size as set forth in the revenue share calculation in customer’s commercial card agreement. Wells Fargo Bank, N.A. does not make any representations or warranties concerning customer’s ability to: (i) meet its year-end net purchase volume, (ii) maintain its average transaction size, and/or (iii) earn a revenue share payment based upon the numbers set forth above.
2013 2015 Estimated 2016
[as of Sep]
% Change Based on Estimated
2016$3,091,428 $3,884,062 $4,069,457 4.77%
$257,619 $323,672 $339,121 4.77%
19,983 21,632 20,219 -6.53%
1,665 1,803 1,685 -6.53%
$188 $209 $223 6.80%
287 331 336 1.51%
$12,366 $35,460
Program Established: Aug, 2009
2012 2014 YTD 2016 [as of Sep]
Purchase Volume $2,804,880 $3,710,763 $3,052,093
Average Monthly Purchases $233,740 $309,230 $339,121
322 336
Number of Transactions 16,060 20,814 15,164
Average Monthly Number of Transactions
1,338 1,735 1,685
Revenue Share $11,220 $34,139 $27,582
Average Transaction Size $205 $224 $223
Highest Historical Card Count
278
153
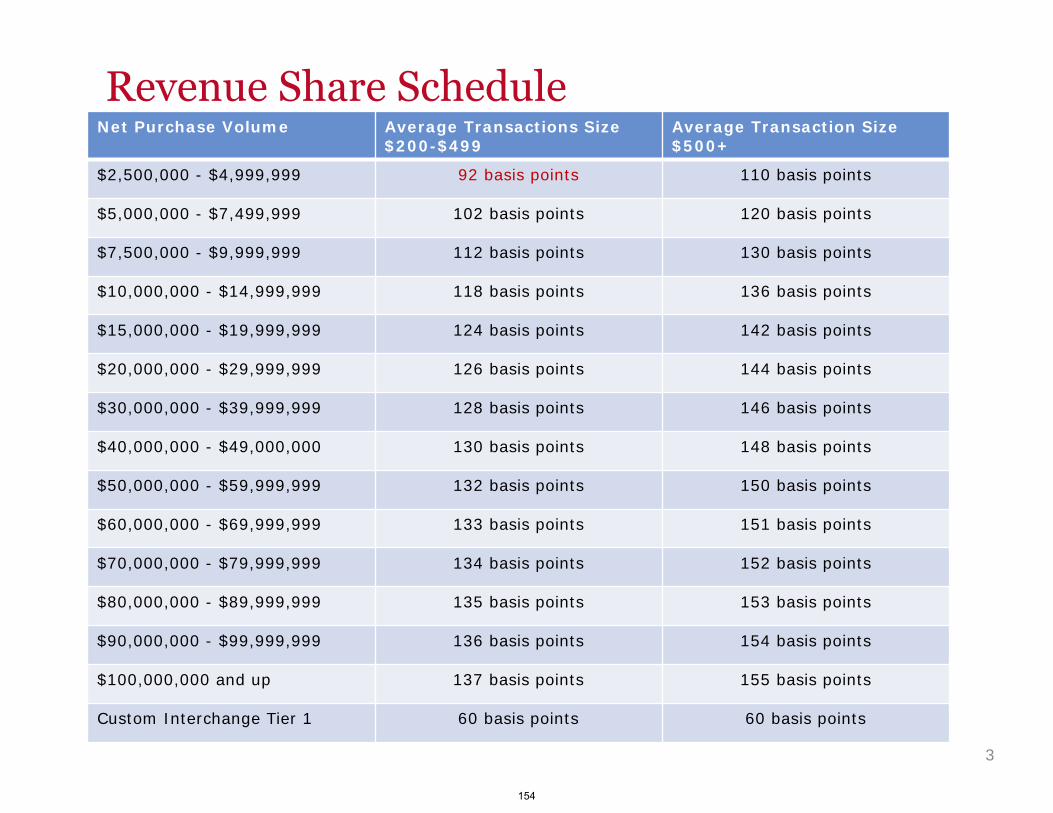
Revenue Share ScheduleNet Purchase Volume Average Transactions Size
$200-$499 Average Transaction Size $500+
$2,500,000 - $4,999,999 92 basis points 110 basis points
$5,000,000 - $7,499,999 102 basis points 120 basis points
$7,500,000 - $9,999,999 112 basis points 130 basis points
$10,000,000 - $14,999,999 118 basis points 136 basis points
$15,000,000 - $19,999,999 124 basis points 142 basis points
$20,000,000 - $29,999,999 126 basis points 144 basis points
$30,000,000 - $39,999,999 128 basis points 146 basis points
$40,000,000 - $49,000,000 130 basis points 148 basis points
$50,000,000 - $59,999,999 132 basis points 150 basis points
$60,000,000 - $69,999,999 133 basis points 151 basis points
$70,000,000 - $79,999,999 134 basis points 152 basis points
$80,000,000 - $89,999,999 135 basis points 153 basis points
$90,000,000 - $99,999,999 136 basis points 154 basis points
$100,000,000 and up 137 basis points 155 basis points
Custom Interchange Tier 1 60 basis points 60 basis points
3
154

Your program at a glance (continued)
4
155

Your account statistics
5
Net Purchase Volume Transactions (Debits + Credits)
Net Transactions (Debits - Credits)
Average Transaction
Size
Total Cards
Jan, 2015 $272,243 1,314 1,184 $230 322Feb, 2015 $312,361 2,053 1,673 $187 326Mar, 2015 $347,066 1,965 1,643 $211 324Apr, 2015 $314,785 1,442 1,328 $237 327
May, 2015 $376,580 2,086 1,748 $215 328Jun, 2015 $360,993 2,403 1,991 $181 324Jul, 2015 $367,923 1,664 1,514 $243 325
Aug, 2015 $367,381 1,982 1,546 $238 326Sep, 2015 $323,295 1,741 1,549 $209 330Oct, 2015 $360,110 1,967 1,739 $207 331Nov, 2015 $236,682 1,526 1,308 $181 324Dec, 2015 $244,643 1,489 1,353 $181 328
Grand Total: 2015 $3,884,062 21,632 18,577 $209
Net Purchase Volume Transactions (Debits + Credits)
Net Transactions (Debits - Credits)
Average Transaction
Size
Total Cards
Jan, 2016 $278,989 1,321 1,235 $226 329Feb, 2016 $319,874 2,039 1,691 $189 330Mar, 2016 $377,792 1,979 1,757 $215 328Apr, 2016 $367,144 1,499 1,389 $264 330
May, 2016 $392,480 1,813 1,707 $230 331Jun, 2016 $355,009 1,734 1,610 $221 329Jul, 2016 $323,168 1,351 1,263 $256 331
Aug, 2016 $344,467 1,578 1,468 $235 334Sep, 2016 $293,171 1,850 1,548 $189 336
Grand Total: 2016 $3,052,093 15,164 13,668 $223
Cal Poly Pomona Foundation, Inc.
Cal Poly Pomona Foundation, Inc.
156

How are you leveraging the WellsOne card strategy?
6
Amount Transactions Average Transaction
76.22% 83.35% $18423.78% 16.65% $287
$3,052,093 15,164
As of Sep, 2016
Expense:Travel & Entertainment:Total Card Volume:Data should be used for trending purposes only. Amounts may not match billing statement due to adjustments/chargebacks.
157

Your Top Expense Categories
7
Percent to Total EXPENSE
Spend Amount TransactionsAverage
Transaction34.69% MISCELLANEOUS STORES $807,030 6,037 $134
BOOK STORES [ 5942 ] $301,777 3,855 $78 DIRECT MARKETING - OTHER DIRECT MARKETERS [ 5969 ] $104,302 203 $514 MISCELLANEOUS AND SPECIALTY RETAIL STORES [ 5999 ] $76,862 292 $263
27.77% WHOLESALE DISTRIBUTORS AND MANUFACTURERS
$645,956 1,858 $348
DENTAL/LABORATORY/MEDICAL/OPHTHALMIC [ 5047 ] $120,748 323 $374 STATIONERY OFFICE SUPPLIES/ PRINTING [ 5111 ] $94,955 468 $203 INDUSTRIAL SUPPLIES NOT ELSEWHERE CLASSIFIED [ 5085 ] $93,505 194 $482
10.78% RETAIL STORES $250,809 2,196 $114 GROCERY STORES SUPERMARKETS [ 5411 ] $66,048 1,012 $65 HOME SUPPLY WAREHOUSE [ 5200 ] $49,244 513 $96 MISCELLANEOUS GENERAL MERCHANDISE [ 5399 ] $39,281 104 $378
10.33% BUSINESS SERVICES $240,251 802 $300 BUSINESS SERVICES NOT ELSEWHERE CLASSIFIED [ 7399 ] $109,448 542 $202 REPRODUCTION AND BLUEPRINTING SERVICE [ 7338 ] $43,261 52 $832 ADVERTISING SERVICES [ 7311 ] $24,211 79 $306
9.20% PROFESSIONAL SERVICES/ MEMBERSHIP ORGANIZATIONS
$213,919 680 $315
ORGANIZATIONS CHARITABLE AND SOCIAL SERVICE [ 8398 ] $52,563 125 $421 COLLEGES/UNIVERSITIES/PROFESSIONAL SCHOOLS [ 8220 ] $47,061 183 $257 ORGANIZATIONS MEMBERSHIP [ 8699 ] $46,131 151 $306
Top Expense Spending Categories and the Top 3 MCCs for each Category
As of Sep, 2016
Data should be used for trending purposes only. Amounts may not match billing statement due to adjustments/chargebacks.
158

Your Travel and Entertainment Breakdown
8
What program changes do you expect in 2016?
Amount Transactions Average Transaction
$69,932 18 $3,885$58,173 127 $458$45,865 19 $2,414$31,181 47 $663$20,380 5 $4,076
$44,794 143 $313$38,780 84 $462$24,135 72 $335$8,783 23 $382$8,100 8 $1,013
$92,781 730 $127$23,716 309 $77$5,429 8 $679
$758 4 $189
$15,100 79 $191$704 11 $64$605 2 $303$505 4 $126$476 2 $238
Top Airline, Car Rental, Hotel and Meal Merchants
As of Sep, 2016
HOTELS SHERATON HOTELS [ 3503 ] LODGING HOTELS MOTELS/ RESORTS [ 7011 ] HOLIDAY INNS [ 3501 ] HYATT HOTELS [ 3640 ] DOUBLETREE HOTELS [ 3692 ]
AIRLINES SOUTHWEST AIRLINES [ 3066 ] UNITED AIRLINES [ 3000 ] AMERICAN AIRLINES [ 3001 ] DELTA [ 3058 ] AIR CHINA [ 3261 ]
MEALS EATING PLACES RESTAURANTS [ 5812 ] QUICK PAYMENT SERVICE FAST-FOOD RESTAURANTS [ 5814 ] CATERERS [ 5811 ] BARS/COCKTAIL LOUNGES/DISCOTHEQUES [ 5813 ]
CAR RENTAL ENTERPRISE RENT-A-CAR [ 3405 ] TRUCK/ UTILITY TRAILER RENTAL [ 7513 ] BUDGET RENT-A-CAR [ 3366 ] HERTZ CORPORATION [ 3357 ] AVIS RENT A CAR [ 3389 ]Data should be used for trending purposes only. Amounts may not match billing statement due to adjustments/chargebacks.
159
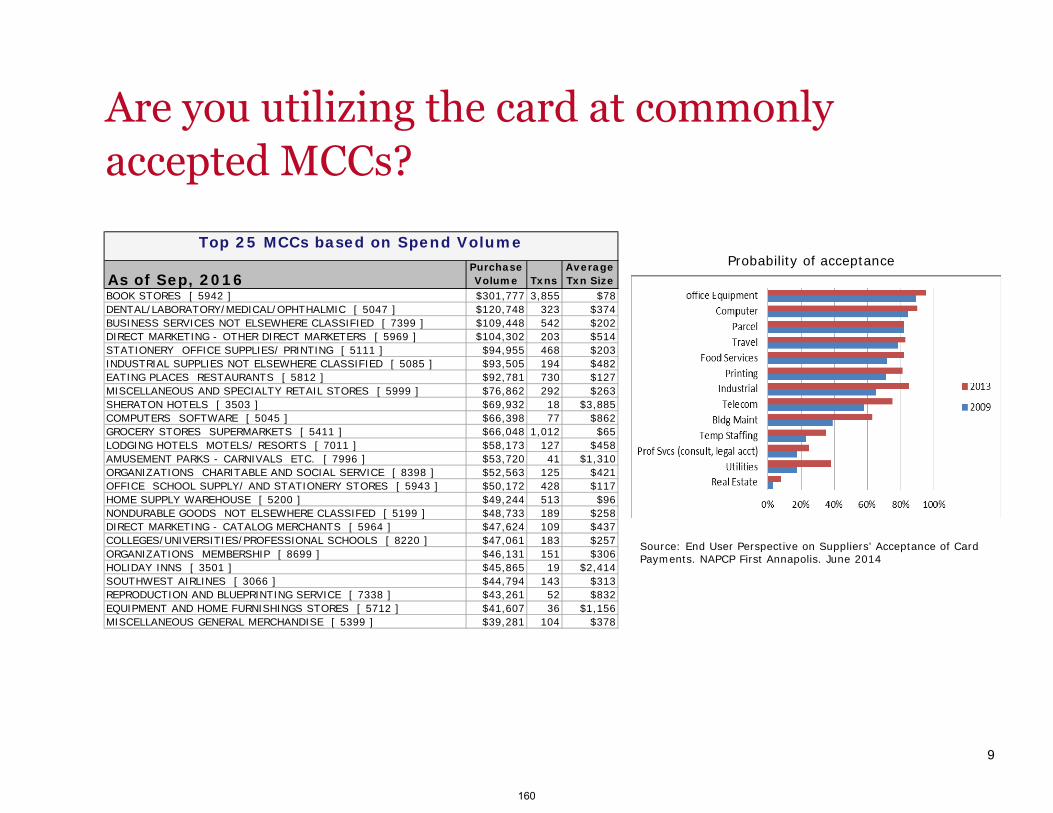
Are you utilizing the card at commonly accepted MCCs?
9
Probability of acceptance
Source: End User Perspective on Suppliers’ Acceptance of Card Payments. NAPCP First Annapolis. June 2014
As of Sep, 2016Purchase Volume Txns
Average Txn Size
BOOK STORES [ 5942 ] $301,777 3,855 $78DENTAL/LABORATORY/MEDICAL/OPHTHALMIC [ 5047 ] $120,748 323 $374BUSINESS SERVICES NOT ELSEWHERE CLASSIFIED [ 7399 ] $109,448 542 $202DIRECT MARKETING - OTHER DIRECT MARKETERS [ 5969 ] $104,302 203 $514STATIONERY OFFICE SUPPLIES/ PRINTING [ 5111 ] $94,955 468 $203INDUSTRIAL SUPPLIES NOT ELSEWHERE CLASSIFIED [ 5085 ] $93,505 194 $482EATING PLACES RESTAURANTS [ 5812 ] $92,781 730 $127MISCELLANEOUS AND SPECIALTY RETAIL STORES [ 5999 ] $76,862 292 $263SHERATON HOTELS [ 3503 ] $69,932 18 $3,885COMPUTERS SOFTWARE [ 5045 ] $66,398 77 $862GROCERY STORES SUPERMARKETS [ 5411 ] $66,048 1,012 $65LODGING HOTELS MOTELS/ RESORTS [ 7011 ] $58,173 127 $458AMUSEMENT PARKS - CARNIVALS ETC. [ 7996 ] $53,720 41 $1,310ORGANIZATIONS CHARITABLE AND SOCIAL SERVICE [ 8398 ] $52,563 125 $421OFFICE SCHOOL SUPPLY/ AND STATIONERY STORES [ 5943 ] $50,172 428 $117HOME SUPPLY WAREHOUSE [ 5200 ] $49,244 513 $96NONDURABLE GOODS NOT ELSEWHERE CLASSIFED [ 5199 ] $48,733 189 $258DIRECT MARKETING - CATALOG MERCHANTS [ 5964 ] $47,624 109 $437COLLEGES/UNIVERSITIES/PROFESSIONAL SCHOOLS [ 8220 ] $47,061 183 $257ORGANIZATIONS MEMBERSHIP [ 8699 ] $46,131 151 $306HOLIDAY INNS [ 3501 ] $45,865 19 $2,414SOUTHWEST AIRLINES [ 3066 ] $44,794 143 $313REPRODUCTION AND BLUEPRINTING SERVICE [ 7338 ] $43,261 52 $832EQUIPMENT AND HOME FURNISHINGS STORES [ 5712 ] $41,607 36 $1,156MISCELLANEOUS GENERAL MERCHANDISE [ 5399 ] $39,281 104 $378
Top 25 MCCs based on Spend Volume
160
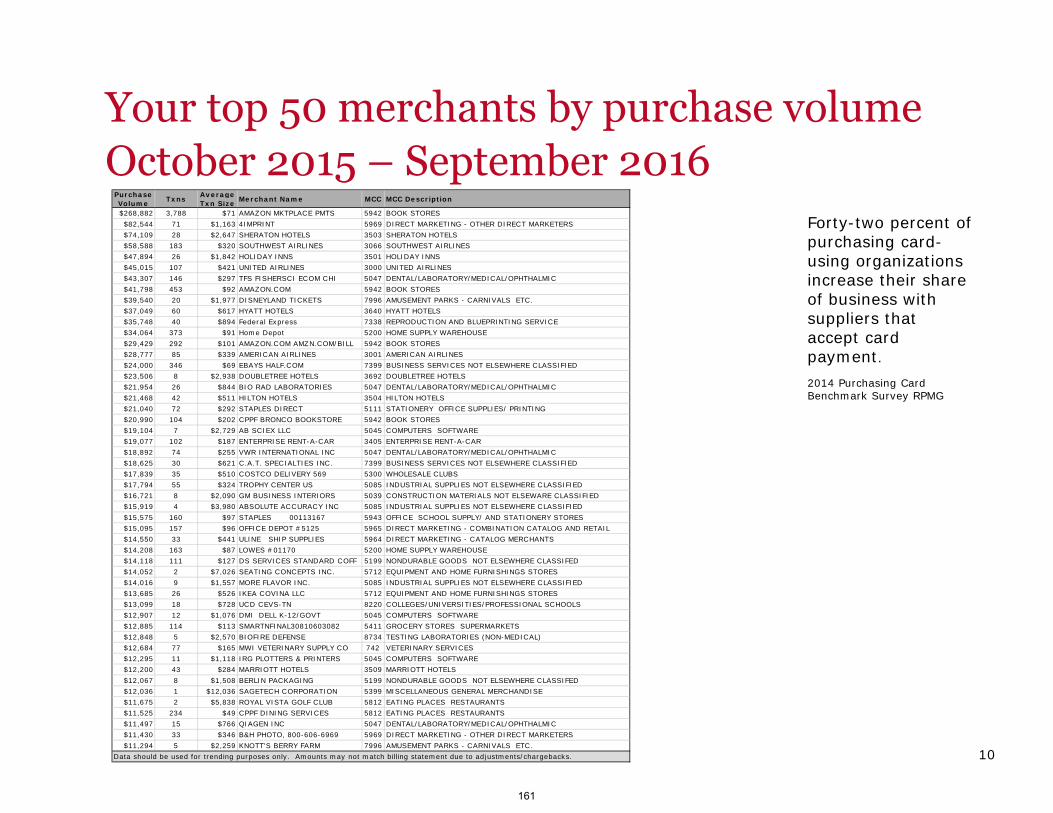
Your top 50 merchants by purchase volumeOctober 2015 – September 2016
10
Forty-two percent of purchasing card-using organizations increase their share of business with suppliers that accept card payment.2014 Purchasing Card Benchmark Survey RPMG
Purchase Volume Txns Average
Txn Size Merchant Name MCC MCC Description
$268,882 3,788 $71 AMAZON MKTPLACE PMTS 5942 BOOK STORES$82,544 71 $1,163 4IMPRINT 5969 DIRECT MARKETING - OTHER DIRECT MARKETERS$74,109 28 $2,647 SHERATON HOTELS 3503 SHERATON HOTELS$58,588 183 $320 SOUTHWEST AIRLINES 3066 SOUTHWEST AIRLINES$47,894 26 $1,842 HOLIDAY INNS 3501 HOLIDAY INNS$45,015 107 $421 UNITED AIRLINES 3000 UNITED AIRLINES$43,307 146 $297 TFS FISHERSCI ECOM CHI 5047 DENTAL/LABORATORY/MEDICAL/OPHTHALMIC$41,798 453 $92 AMAZON.COM 5942 BOOK STORES$39,540 20 $1,977 DISNEYLAND TICKETS 7996 AMUSEMENT PARKS - CARNIVALS ETC.$37,049 60 $617 HYATT HOTELS 3640 HYATT HOTELS$35,748 40 $894 Federal Express 7338 REPRODUCTION AND BLUEPRINTING SERVICE$34,064 373 $91 Home Depot 5200 HOME SUPPLY WAREHOUSE$29,429 292 $101 AMAZON.COM AMZN.COM/BILL 5942 BOOK STORES$28,777 85 $339 AMERICAN AIRLINES 3001 AMERICAN AIRLINES$24,000 346 $69 EBAYS HALF.COM 7399 BUSINESS SERVICES NOT ELSEWHERE CLASSIFIED$23,506 8 $2,938 DOUBLETREE HOTELS 3692 DOUBLETREE HOTELS$21,954 26 $844 BIO RAD LABORATORIES 5047 DENTAL/LABORATORY/MEDICAL/OPHTHALMIC$21,468 42 $511 HILTON HOTELS 3504 HILTON HOTELS$21,040 72 $292 STAPLES DIRECT 5111 STATIONERY OFFICE SUPPLIES/ PRINTING$20,990 104 $202 CPPF BRONCO BOOKSTORE 5942 BOOK STORES$19,104 7 $2,729 AB SCIEX LLC 5045 COMPUTERS SOFTWARE$19,077 102 $187 ENTERPRISE RENT-A-CAR 3405 ENTERPRISE RENT-A-CAR$18,892 74 $255 VWR INTERNATIONAL INC 5047 DENTAL/LABORATORY/MEDICAL/OPHTHALMIC$18,625 30 $621 C.A.T. SPECIALTIES INC. 7399 BUSINESS SERVICES NOT ELSEWHERE CLASSIFIED$17,839 35 $510 COSTCO DELIVERY 569 5300 WHOLESALE CLUBS$17,794 55 $324 TROPHY CENTER US 5085 INDUSTRIAL SUPPLIES NOT ELSEWHERE CLASSIFIED$16,721 8 $2,090 GM BUSINESS INTERIORS 5039 CONSTRUCTION MATERIALS NOT ELSEWARE CLASSIFIED$15,919 4 $3,980 ABSOLUTE ACCURACY INC 5085 INDUSTRIAL SUPPLIES NOT ELSEWHERE CLASSIFIED$15,575 160 $97 STAPLES 00113167 5943 OFFICE SCHOOL SUPPLY/ AND STATIONERY STORES$15,095 157 $96 OFFICE DEPOT #5125 5965 DIRECT MARKETING - COMBINATION CATALOG AND RETAIL$14,550 33 $441 ULINE SHIP SUPPLIES 5964 DIRECT MARKETING - CATALOG MERCHANTS$14,208 163 $87 LOWES #01170 5200 HOME SUPPLY WAREHOUSE$14,118 111 $127 DS SERVICES STANDARD COFF 5199 NONDURABLE GOODS NOT ELSEWHERE CLASSIFED$14,052 2 $7,026 SEATING CONCEPTS INC. 5712 EQUIPMENT AND HOME FURNISHINGS STORES$14,016 9 $1,557 MORE FLAVOR INC. 5085 INDUSTRIAL SUPPLIES NOT ELSEWHERE CLASSIFIED$13,685 26 $526 IKEA COVINA LLC 5712 EQUIPMENT AND HOME FURNISHINGS STORES$13,099 18 $728 UCD CEVS-TN 8220 COLLEGES/UNIVERSITIES/PROFESSIONAL SCHOOLS$12,907 12 $1,076 DMI DELL K-12/GOVT 5045 COMPUTERS SOFTWARE$12,885 114 $113 SMARTNFINAL30810603082 5411 GROCERY STORES SUPERMARKETS$12,848 5 $2,570 BIOFIRE DEFENSE 8734 TESTING LABORATORIES (NON-MEDICAL)$12,684 77 $165 MWI VETERINARY SUPPLY CO 742 VETERINARY SERVICES$12,295 11 $1,118 IRG PLOTTERS & PRINTERS 5045 COMPUTERS SOFTWARE$12,200 43 $284 MARRIOTT HOTELS 3509 MARRIOTT HOTELS$12,067 8 $1,508 BERLIN PACKAGING 5199 NONDURABLE GOODS NOT ELSEWHERE CLASSIFED$12,036 1 $12,036 SAGETECH CORPORATION 5399 MISCELLANEOUS GENERAL MERCHANDISE$11,675 2 $5,838 ROYAL VISTA GOLF CLUB 5812 EATING PLACES RESTAURANTS$11,525 234 $49 CPPF DINING SERVICES 5812 EATING PLACES RESTAURANTS$11,497 15 $766 QIAGEN INC 5047 DENTAL/LABORATORY/MEDICAL/OPHTHALMIC$11,430 33 $346 B&H PHOTO, 800-606-6969 5969 DIRECT MARKETING - OTHER DIRECT MARKETERS$11,294 5 $2,259 KNOTT'S BERRY FARM 7996 AMUSEMENT PARKS - CARNIVALS ETC.
Data should be used for trending purposes only. Amounts may not match billing statement due to adjustments/chargebacks.
161

Internal efficiencies you have gained
11
How many employees would you have to hire if your card program was eliminated?
Txns Purchase Volume
Average Txn Size Merchant Name MCC MCC Description
3,788 $268,882 $71 AMAZON MKTPLACE PMTS 5942 BOOK STORES453 $41,798 $92 AMAZON.COM 5942 BOOK STORES373 $34,064 $91 Home Depot 5200 HOME SUPPLY WAREHOUSE346 $24,000 $69 EBAYS HALF.COM 7399 BUSINESS SERVICES NOT ELSEWHERE CLASSIFIED292 $29,429 $101 AMAZON.COM AMZN.COM/BILL 5942 BOOK STORES234 $11,525 $49 CPPF DINING SERVICES 5812 EATING PLACES RESTAURANTS234 $9,434 $40 STATERBROS168 5411 GROCERY STORES SUPERMARKETS183 $58,588 $320 SOUTHWEST AIRLINES 3066 SOUTHWEST AIRLINES163 $14,208 $87 LOWES #01170 5200 HOME SUPPLY WAREHOUSE160 $15,575 $97 STAPLES 00113167 5943 OFFICE SCHOOL SUPPLY/ AND STATIONERY STORES157 $15,095 $96 OFFICE DEPOT #5125 5965 DIRECT MARKETING - COMBINATION CATALOG AND RETAIL146 $43,307 $297 TFS FISHERSCI ECOM CHI 5047 DENTAL/LABORATORY/MEDICAL/OPHTHALMIC114 $12,885 $113 SMARTNFINAL30810603082 5411 GROCERY STORES SUPERMARKETS111 $14,118 $127 DS SERVICES STANDARD COFF 5199 NONDURABLE GOODS NOT ELSEWHERE CLASSIFED110 $8,945 $81 ABEBOOKS.COM 5192 BOOKS PERIODICALS AND NEWSPAPERS107 $45,015 $421 UNITED AIRLINES 3000 UNITED AIRLINES104 $20,990 $202 CPPF BRONCO BOOKSTORE 5942 BOOK STORES102 $19,077 $187 ENTERPRISE RENT-A-CAR 3405 ENTERPRISE RENT-A-CAR87 $3,747 $43 MICHAELS STORES 6719 5970 ARTIST SUPPLY STORES/CRAFT SHOPS86 $4,985 $58 CPP FDN FARM STORE 5812 EATING PLACES RESTAURANTS85 $28,777 $339 AMERICAN AIRLINES 3001 AMERICAN AIRLINES81 $5,781 $71 ALIBRIS BOOKS 5969 DIRECT MARKETING - OTHER DIRECT MARKETERS77 $12,684 $165 MWI VETERINARY SUPPLY CO 742 VETERINARY SERVICES77 $10,413 $135 CTC CONSTANTCONTACT.COM 5968 DIRECT MARKETING CONTINUITY/SUBSCRIPTION MERCHANTS75 $4,856 $65 READYREFRESH BY NESTLE 5999 MISCELLANEOUS AND SPECIALTY RETAIL STORES74 $18,892 $255 VWR INTERNATIONAL INC 5047 DENTAL/LABORATORY/MEDICAL/OPHTHALMIC72 $21,040 $292 STAPLES DIRECT 5111 STATIONERY OFFICE SUPPLIES/ PRINTING71 $82,544 $1,163 4IMPRINT 5969 DIRECT MARKETING - OTHER DIRECT MARKETERS63 $10,380 $165 SHOES FOR CREWS LLC 5139 COMMERCIAL FOOTWEAR62 $9,077 $146 SMART AND FINA10903052 5411 GROCERY STORES SUPERMARKETS60 $37,049 $617 HYATT HOTELS 3640 HYATT HOTELS59 $3,048 $52 TARGET 00021790 5411 GROCERY STORES SUPERMARKETS57 $1,559 $27 DOLLAR TREE 5331 VARIETY STORES55 $17,794 $324 TROPHY CENTER US 5085 INDUSTRIAL SUPPLIES NOT ELSEWHERE CLASSIFIED55 $7,770 $141 MCMASTER-CARR 5085 INDUSTRIAL SUPPLIES NOT ELSEWHERE CLASSIFIED53 $4,371 $82 GILMORE LIQUID AIR CO 5169 CHEMICALS AND ALLIED PRODUCTS45 $76 $2 CPP FDN BOOKSTORE 8220 COLLEGES/UNIVERSITIES/PROFESSIONAL SCHOOLS43 $12,200 $284 MARRIOTT HOTELS 3509 MARRIOTT HOTELS43 $4,545 $106 SUPERSHUTTLE EXECUCARONT 4789 TRANSPORTATION SERVICES NOT ELSEWHERE CLASSIFIED42 $21,468 $511 HILTON HOTELS 3504 HILTON HOTELS42 $2,616 $62 PARTY CITY 5999 MISCELLANEOUS AND SPECIALTY RETAIL STORES40 $35,748 $894 Federal Express 7338 REPRODUCTION AND BLUEPRINTING SERVICE39 $1,793 $46 PRIME TIME SHUTTLE 4789 TRANSPORTATION SERVICES NOT ELSEWHERE CLASSIFIED36 $9,174 $255 THE WEBSTAURANT STORE 5046 COMMERCIAL EQUIPMENT NOT ELSEWHERE CLASSIFIED36 $672 $19 UBER TECHNOLOGIES INC 4121 LIMOUSINES AND TAXICABS35 $17,839 $510 COSTCO DELIVERY 569 5300 WHOLESALE CLUBS35 $2,048 $59 AKASAKA JAPANESE CUISINE 5812 EATING PLACES RESTAURANTS35 $1,324 $38 SUBWAY 00342212 5814 QUICK PAYMENT SERVICE FAST-FOOD RESTAURANTS34 $10,347 $304 SIGMA ALDRICH US 5969 DIRECT MARKETING - OTHER DIRECT MARKETERS34 $4,006 $118 SMART AND FINA11109246 5411 GROCERY STORES SUPERMARKETS
Data should be used for trending purposes only. Amounts may not match billing statement due to adjustments/chargebacks.
162

Custom Interchange volume
12
Monthly or quarterly custom interchange reporting is available upon request*Custom Interchange as qualified by Visa or MasterCard interchange criteria
*
As of Sep, 2016Total
Transactions Total Volume15,164 $3,052,093
163

Custom Interchange volume
13
Monthly or quarterly custom interchange reporting is available upon request*Custom Interchange as qualified by Visa or MasterCard interchange criteria
*
Transactions Total Avg Txn % to Total Volume
Tier1 Merchant Summary 1,102 $133,062 $121 4.36% AMAZON MKTPLACE PMTS 810 $81,224 $100 COSTCO DELIVERY 569 10 $7,775 $777 AMAZON.COM 82 $7,621 $93 AMAZON.COM AMZN.COM/BILL 51 $5,110 $100 WAL-MART #1883 4 $4,000 $1,000 Home Depot 17 $2,813 $165 LOWES #00316 8 $2,728 $341 SQ M W DESIGN 5 $2,229 $446 COSTCO.COM ONLINE 3 $2,098 $699 WM SUPERCENTER #1883 2 $2,000 $1,000 LOWES #01170 28 $1,931 $69 BEST BUY MHT 00001503 1 $1,412 $1,412 SQ BUNNY GUNNER 2 $1,275 $638 BEST BUY 00001024 2 $1,188 $594 SQ KAMPRATH SEEDS 1 $1,113 $1,113 HOMEDEPOT.COM 2 $1,077 $538 BEST BUY MHT 00010181 2 $1,035 $518 SAMS INTERNET 1 $925 $925 ABEBOOKS.COM 21 $713 $34 APPLE STORE #R094 1 $648 $648 SQ COURIER PRINTING, INC 2 $509 $255 WM SUPERCENTER #3717 1 $505 $505 WAL-MART #0692 1 $500 $500 BEST BUY 00007757 1 $478 $478 SQ 24/7 SERVICE LOCKSMIT 1 $265 $265 LOWES #00907 3 $229 $76 AMAZONPRIME MEMBERSHIP 3 $219 $73 CREATESPACE 3 $211 $70 APL APPLE ONLINE STORE 1 $162 $162 LOWES #01041 4 $162 $40 SQ JUST C, INC. 1 $147 $147 AMAZON WEB SERVICES 2 $126 $63 WALGREENS #4415 1 $82 $82 CVS/PHARMACY #09837 1 $69 $69 SQ NAMASTE TAXI SERVICE 1 $55 $55 CVS/PHARMACY #03553 4 $53 $13 LOWES #02270 1 $52 $52 BESTBUYCOM789295003706 1 $39 $39 WAL-MART #2288 3 $34 $11 SQ YELLOW GOSQ.COM 1 $30 $30 SQ LONG BEACH YELLOW CAB 1 $30 $30 BEST BUY MHT 00001792 1 $28 $28 CVS/PHARMACY #09503 1 $28 $28 ORCHARD SUPPLY #221 1 $27 $27 LOWES #01734 1 $22 $22 WAL-MART #3464 1 $20 $20 LOWES #02783 1 $18 $18 WAL-MART #1941 1 $14 $14 WM SUPERCENTER #3464 1 $10 $10 CVS/PHARMACY #04790 1 $9 $9 WAL-MART #4762 2 $9 $4 LOWES #01562 1 $3 $3
164

Custom Interchange volume
14
Monthly or quarterly custom interchange reporting is available upon request*Custom Interchange as qualified by Visa or MasterCard interchange criteria
*
Transactions Total Avg Txn % to Total Volume
Tier2 Merchant Summary 77 $7,691 $100 0.25% COSTCO WHSE #1015 13 $2,078 $160 COSTCO DELIVERY 569 6 $1,916 $319 COSTCO WHSE #0473 5 $667 $133 COSTCO WHSE #0686 5 $623 $125 WAL-MART #1941 7 $428 $61 WAL-MART #3464 5 $326 $65 SAMSCLUB #6610 3 $300 $100 SAMS CLUB #6610 4 $161 $40 COSTCO WHSE #0454 1 $159 $159 WAL-MART #5954 3 $151 $50 WALMART.COM 8009666546 2 $103 $51 WM SUPERCENTER #3464 3 $86 $29 WAL-MART #2288 3 $80 $27 SAMSCLUB #6240 1 $78 $78 WALMART.COM 1 $78 $78 WAL-MART #1922 2 $74 $37 WAL-MART #1693 2 $62 $31 WAL-MART #1992 1 $62 $62 SAMS CLUB #6240 1 $45 $45 WM SUPERCENTER #3132 1 $44 $44 WAL-MART #2523 1 $42 $42 SAMS CLUB #6619 1 $34 $34 SAMS CLUB #6624 1 $33 $33 COSTCO WHSE #0678 1 $19 $19 COSTCO WHSE #0445 1 $15 $15 WAL-MART #2251 1 $12 $12 WM SUPERCENTER #5687 1 $9 $9 WAL-MART #5687 1 $5 $5
165

Are your cards in the right hands?
15
Inactive accounts: 51 open accounts with no activity for 6+ months 22 open accounts that have never had activity
7 of these accounts were opened in the last 30 days
Source: 2014 Purchasing Card Benchmark Survey Results by RPMG Research Corporation 82% of cards are active
Active Cards
Total Cards
Percentage of Usage
Jan16 Feb16 Mar16 Apr16 May16 Jun16 Jul16 Aug16 Sep16
224 234 231 250 238 234 201 220 222
329 330 328 330 331 329 331 334 336
68% 71% 70% 76% 72% 71% 61% 66% 66%
166
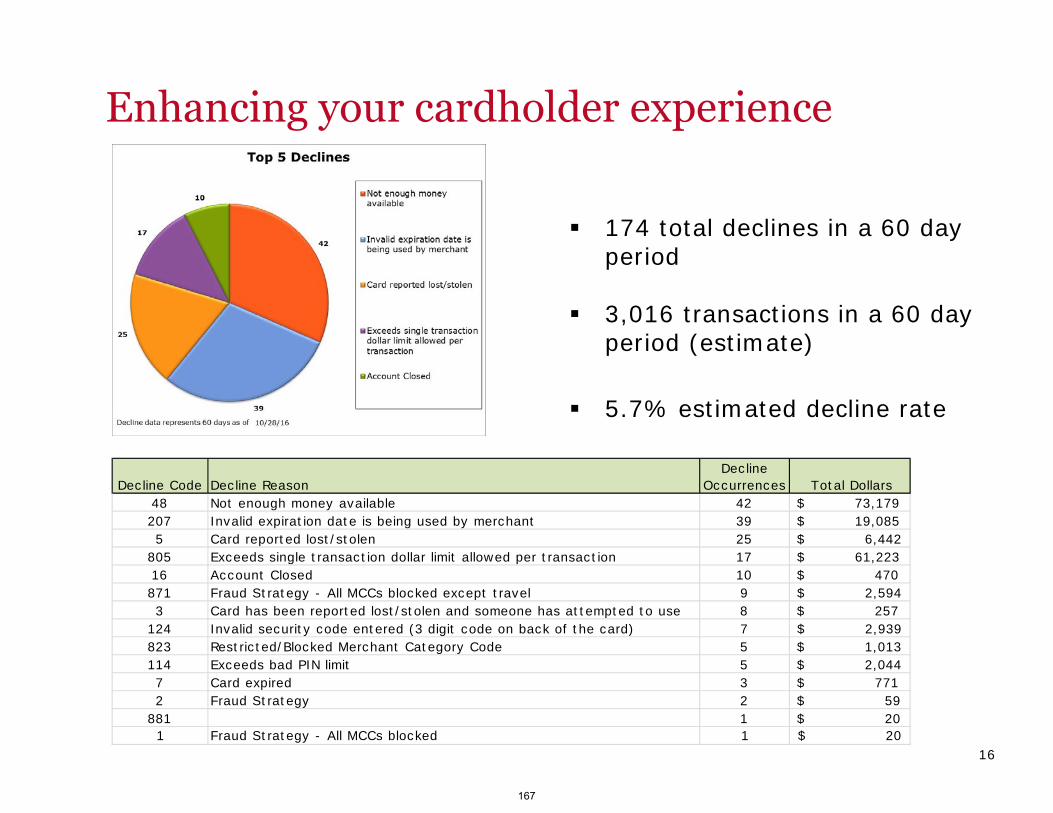
Enhancing your cardholder experience
174 total declines in a 60 day period
3,016 transactions in a 60 day period (estimate)
5.7% estimated decline rate
16
Decline Code Decline ReasonDecline
Occurrences Total Dollars 48 Not enough money available 42 $ 73,179 207 Invalid expiration date is being used by merchant 39 $ 19,085 5 Card reported lost/stolen 25 $ 6,442
805 Exceeds single transaction dollar limit allowed per transaction 17 $ 61,223 16 Account Closed 10 $ 470 871 Fraud Strategy - All MCCs blocked except travel 9 $ 2,594 3 Card has been reported lost/stolen and someone has attempted to use 8 $ 257
124 Invalid security code entered (3 digit code on back of the card) 7 $ 2,939 823 Restricted/Blocked Merchant Category Code 5 $ 1,013 114 Exceeds bad PIN limit 5 $ 2,044 7 Card expired 3 $ 771 2 Fraud Strategy 2 $ 59
881 1 $ 20 1 Fraud Strategy - All MCCs blocked 1 20$
167

Helpful information
168

Program Administrators
Program Administrators on Attachment B
David Prenovost– Company PA
Pauline Anongdeth
Lilia Maciel
Debbie Linthicum
Michele Ramirez
Program Administrators in CCER
18
Fraud ContactsDavid Prenovost
Pauline Anongdeth
Lilia Maciel
Debbie Linthicum
Michele Ramirez
169

Wells Fargo relationship team
WellsOne Service Center Phone: 800-932-0036
Email: [email protected]
Customer Care team
Technical team
Fraud team
Billing team
19
Relationship Manager Warren Guinane
213-253-7284
Account Manager Sarah Pennywitt
805-432-4618
TM Sales Consultant Charu Gorrepati
415-371-2570
170

Additional resources
Client webinars Wells Fargo Treasury Management website
https://newapproach.wellsfargotreasury.com WellsOne News
From: Your WellsOne Account Manager Sent periodically throughout the year
20
171

Thank you for your business!
© 2016 Wells Fargo Bank, N.A. All rights reserved. Confidential.
172

MEMORANDUM Date: November 17, 2016
To: Board of Directors Cal Poly Pomona Foundation, Inc.
From: G. Paul Storey Executive Director
Subject: Shared Services and Participation of Foundation Employees on AOA Committees and other affiliated expertise
Cal Poly Pomona Foundation (CPPF), as an auxiliary organization (AO), provides essential functions which are an integral part of the educational mission of the University such as managing contracts and grants, and administering enterprise activities that include the Bronco Bookstore, Dining Services, Village Student Housing complex, Kellogg West Hotel & Conference Center, Real Estate Development including Faculty Staff Housing, Innovation Village, CTTi Complex and Supplemental Programs including Continuing Education, Agricultural-Aid-to-Instruction, Endowments, Scholarships and Foundation Programs. We are a public benefit not-for-profit 501(c) entity nested within the framework of the public structure of the University, i.e., we are an instrumentality of the state and serve the University and at the same time, separate. This separation provides for a useful structure because we can provide property purchase and management, procurement, investment, and business administration as an alternative to public procedures. We have hiring flexibility, cash flow for seed programs and flexible ways to hold and use funds.
The AOA (Auxiliary Organizations Association) is tasked with providing assistance to auxiliary organizations and its mission is to facilitate the role of individual auxiliaries on their respective campuses by providing the auxiliaries resources and services that enable them to be more effective, such as: an annual conference, professional website offering information sharing, networking, legislative and legal updates and other resources, group insurance and pooled benefit programs, and representation of the collective interests of AOA members before policy-making groups of the CSU and the State of California, among other services.
Cal Poly Pomona Foundation and the other AOs are similar, and share services, systems, best practices and expertise with each other. The CPPF staff participates fully in AOA committees and shares their expertise with other auxiliaries.
Paul Storey – AOA Executive Committee, AOA Commercial Shops Committee, Public/Private Partnership consultant to other Auxiliaries
David Prenovost - AOA Financial Committee. AOA Audit Committee, Auxiliary Multiple Employer Voluntary Employee Benefits Association, CFO consultant to other Auxiliaries
Dennis Miller- AOA Human Resources Committee, HR consultant to other Auxiliaries, The Workforce Institute at Kronos - Advisory Board member.
Randy Townsend – AOA IT Committee Chair, AOA Executive Committee, POS/PCI consultant to other Auxiliaries, Tableau analytics consultant to other Auxiliaries, CSU ISAC Committee participant (2016-17)
Aaron Neilson - MICROS consultant to other Auxiliaries, AOA Commercial Shops, Credit Card technology (Chip&Pin/EMV) to at NACAS conference, NACUFS Pacific Region Planning Committee, Developing Brewing Education Advisory Board and developed Brewing Education Program for Continuing Education at CPP, NACAS Conference Brewery Presentation, presented POS Solution roundtable at NACAS conference
Sandra Vaughan-Acton – AOA Real Property Development Committee, Public/Private Partnership consultant to other Auxiliaries
Clint Aase- CSU AOA Store Group
173
Related Documents