CAL FACTS DECEMBER 2014

Welcome message from author
This document is posted to help you gain knowledge. Please leave a comment to let me know what you think about it! Share it to your friends and learn new things together.
Transcript
Mac TaylorL E G I S L AT I V E A N A LY S T
D E C E M B E R 2 0 1 4
CAL FACTSCAL FACTS2014
MAC TAYLORLEGISLATIVE ANALYST
CAL FACTSCAL FACTSDECEMBER2014
CAL FACTSDECEMBER 2014
i
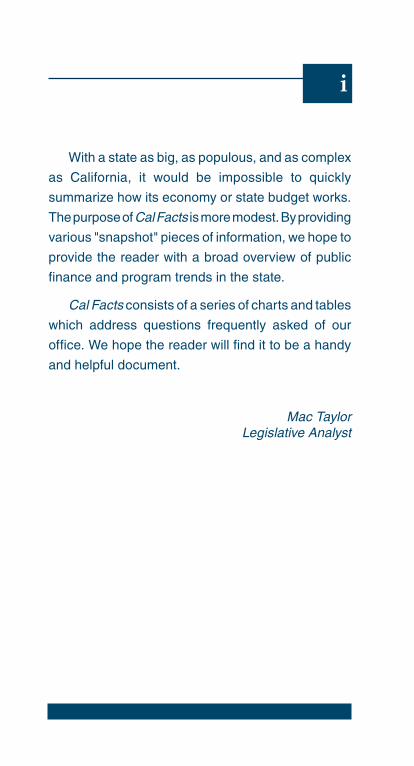
With a state as big, as populous, and as complex
as California, it would be impossible to quickly
summarize how its economy or state budget works.
The purpose of Cal Facts is more modest. By providing
various "snapshot" pieces of information, we hope to
provide the reader with a broad overview of public
finance and program trends in the state.
Cal Facts consists of a series of charts and tables
which address questions frequently asked of our
office. We hope the reader will find it to be a handy
and helpful document.
Mac TaylorLegislative Analyst

ii
LegisLative anaLyst’s Office staff
Legislative AnalystMac Taylor
State and Local FinanceJason SisneyMarianne O'Malley
Chas AlamoJustin GarosiSeth KersteinRyan MillerNick SchroederBrian UhlerBrian Weatherford
Corrections, Transportation, and EnvironmentAnthony SimbolBrian Brown Drew Soderborg
Ashley AmesRoss BrownVirginia EarlyAaron EdwardsAnton Favorini-CsorbaJeremy FraysseJames HackerHelen KersteinSarah LarsonAnita LeeJessica Peters
EducationJennifer Kuhn
Edgar CabralCarolyn ChuNatasha CollinsJason ConstantourosRachel EhlersPaul GolaszewskiJudy HeimanKenneth KapphahnJameel Naqvi
Health and Human ServicesMark NewtonShawn Martin
Amber DidierRashi KesarwaniLourdes MoralesGinni Bella NavarreFelix SuRyan Woolsey
Administration and Information ServicesLarry CastroSarah KleinbergKarry Dennis-Fowler
Michael GreerVu ChuDouglas DixonSandi Harvey
SupportTina McGeeIzet ArriagaSarah Scanlon
Jim StahleyAnthony Lucero
iii
cOntents
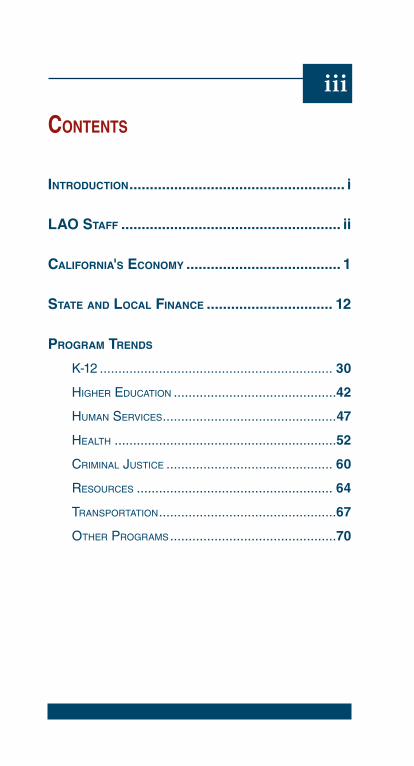
IntroductIon ..................................................... i
LAo StAff ...................................................... ii
cALIfornIA'S Economy ...................................... 1
StAtE And LocAL fInAncE ............................... 12
ProgrAm trEndS
K-12 ............................................................... 30
HigHer education ............................................42
Human ServiceS ...............................................47
HealtH ............................................................52
criminal JuStice ............................................. 60
reSourceS ..................................................... 64
tranSportation ................................................67
otHer programS .............................................70

iv
California’s EConomy
1
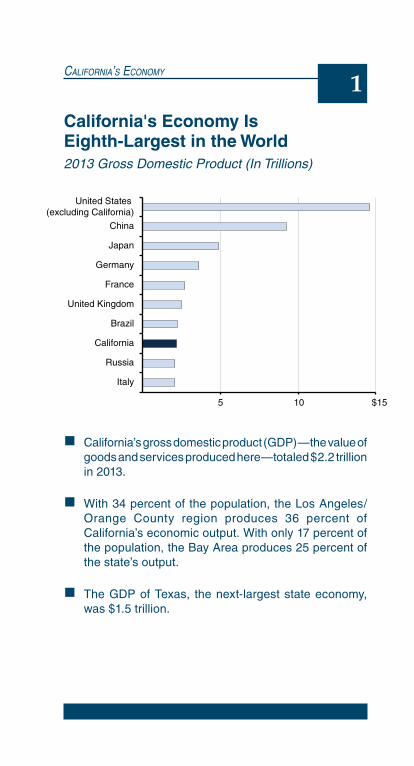
California's Economy Is Eighth-Largest in the World2013 Gross Domestic Product (In Trillions)
California’s gross domestic product (GDP)—the value of goods and services produced here—totaled $2.2 trillion in 2013.
With 34 percent of the population, the Los Angeles/Orange County region produces 36 percent of California’s economic output. With only 17 percent of the population, the Bay Area produces 25 percent of the state’s output.
The GDP of Texas, the next-largest state economy, was $1.5 trillion.
5 10 $15
Italy
Russia
California
Brazil
United Kingdom
France
Germany
Japan
China
United States (excluding California)
ARTWORK # CF_140496
Graphic Sign Off
SecretaryAnalystMPADeputy
Template_CalFACTS.ait
California’s EConomy
2
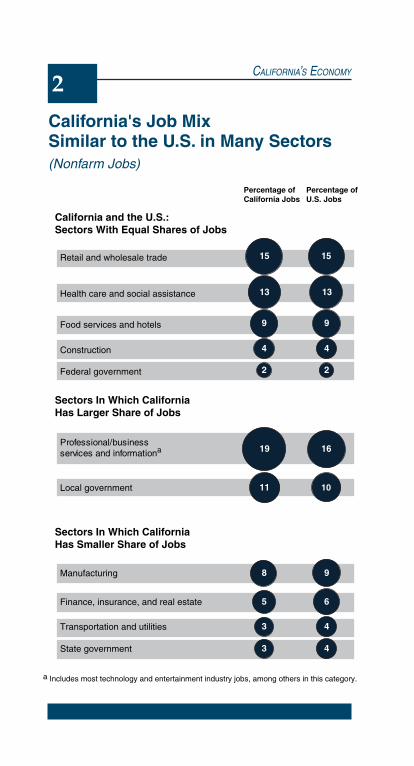
California's Job Mix Similar to the U.S. in Many Sectors(Nonfarm Jobs)
Percentage of California Jobs
Percentage of U.S. Jobs
California and the U.S.: Sectors With Equal Shares of Jobs
Retail and wholesale trade
Health care and social assistance
Food services and hotels
Construction
Federal government
Sectors In Which California Has Larger Share of Jobs
Professional/business services and informationa
Local government
Sectors In Which California Has Smaller Share of Jobs
Manufacturing
Finance, insurance, and real estate
Transportation and utilities
State government
a Includes most technology and entertainment industry jobs, among others in this category.
15 15
13 13
9 9
4 4
2 2
19 16
11 10
8 9
5 6
3 4
3 4
ARTWORK # CF_140496
Graphic Sign Off
SecretaryAnalystMPADeputy
Template_CalFACTS.ait
California’s EConomy
3
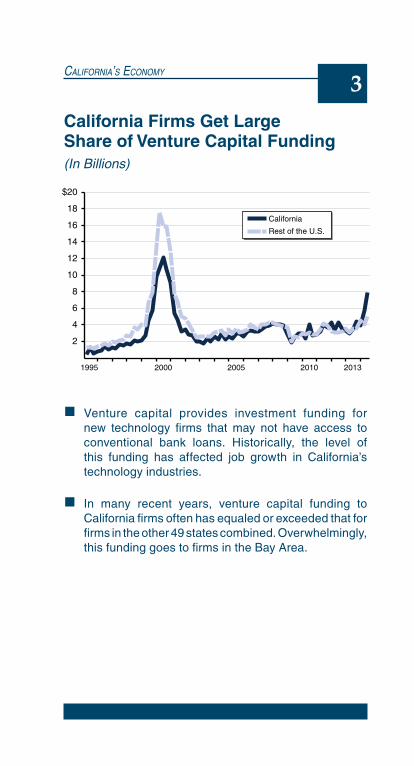
California Firms Get Large Share of Venture Capital Funding(In Billions)
Venture capital provides investment funding for new technology firms that may not have access to conventional bank loans. Historically, the level of this funding has affected job growth in California’s technology industries.
In many recent years, venture capital funding to California firms often has equaled or exceeded that for firms in the other 49 states combined. Overwhelmingly, this funding goes to firms in the Bay Area.
California
Rest of the U.S.
2
4
6
8
10
12
14
16
18
$20
1995 2000 2005 20132010
ARTWORK # CF_140496
Graphic Sign Off
SecretaryAnalystMPADeputy
Template_CalFACTS.ait

California’s EConomy
4
International Trade Is Important to California's Economy2013 International Goods Exportsa (In Billions)
10 20 30 40 $50
Other
Taiwan
South Korea
Japan
Canada
Mexico
China
European Union
10 20 30 40 $50
Other
Chemicals andPharmaceuticals
Agriculture,Food, andBeverages
Vehicles andMachinery
Computers andElectronics
California Exports by Product
California Exports by Destination
a Excludes exports of services. Nationwide, services account for about 30 percent of total exports.
ARTWORK # CF_140496
Graphic Sign Off
SecretaryAnalystMPADeputy
Template_CalFACTS.ait
California’s EConomy
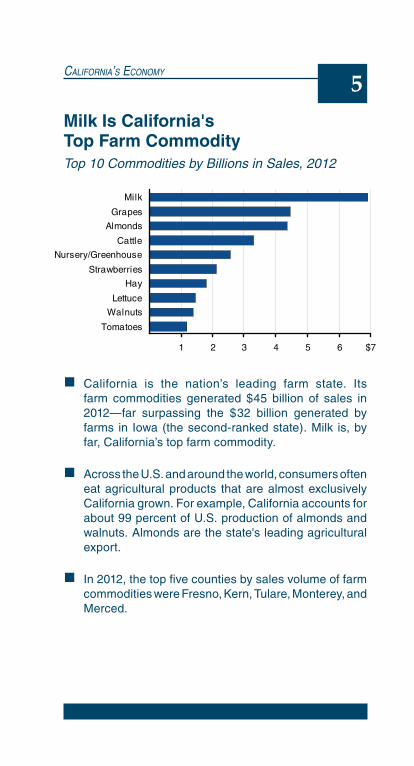
5Milk Is California's Top Farm CommodityTop 10 Commodities by Billions in Sales, 2012
California is the nation’s leading farm state. Its farm commodities generated $45 billion of sales in 2012—far surpassing the $32 billion generated by farms in Iowa (the second-ranked state). Milk is, by far, California’s top farm commodity.
Across the U.S. and around the world, consumers often eat agricultural products that are almost exclusively California grown. For example, California accounts for about 99 percent of U.S. production of almonds and walnuts. Almonds are the state's leading agricultural export.
In 2012, the top five counties by sales volume of farm commodities were Fresno, Kern, Tulare, Monterey, and Merced.
1 2 3 4 5 6 $7
Tomatoes
Walnuts
Lettuce
Hay
Strawberries
Nursery/Greenhouse
Cattle
Almonds
Grapes
Milk
ARTWORK # CF_140496
Graphic Sign Off
SecretaryAnalystMPADeputy
Template_CalFACTS.ait

California’s EConomy
6
Poverty Much Higher in California Under Alternative MeasurePercentage of Population Living Below Poverty Threshold From 2011 Through 2013
The Official Poverty Measure (OPM) defines a family as poor if their pretax cash income is less than a poverty threshold that is standard across the continental U.S.
In contrast, the Research Supplemental Poverty Measure (SPM) accounts for forms of public assistance not included in the OPM and adjusts poverty thresholds for a number of factors, such as the cost of housing.
From 2011 through 2013, California’s OPM poverty rate was somewhat higher than the in the rest of the U.S. California’s SPM poverty rate—at 23.4 percent—was much higher than in the rest of the U.S., primarily due to the state’s higher housing costs. This rate is equivalent to about 9 million Californians being considered poor.
16%
23.4%
14.8% 14.8%
5
10
15
20
25%
Official Poverty Measure Research Supplemental Poverty Measure
CaliforniaRest of U.S.
ARTWORK # CF_140496
Graphic Sign Off
SecretaryAnalystMPADeputy
Template_CalFACTS.ait
California’s EConomy
7
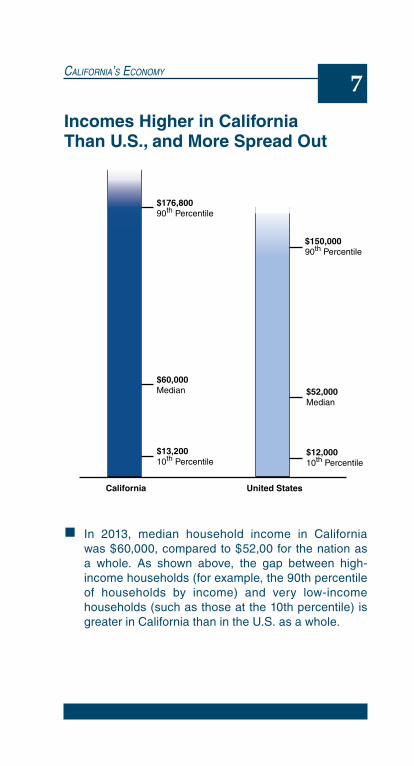
Incomes Higher in California Than U.S., and More Spread Out
In 2013, median household income in California was $60,000, compared to $52,00 for the nation as a whole. As shown above, the gap between high-income households (for example, the 90th percentile of households by income) and very low-income households (such as those at the 10th percentile) is greater in California than in the U.S. as a whole.
$52,000 Median
$60,000Median
$150,00090th Percentile
$176,80090th Percentile
$12,00010th Percentile
$13,20010th Percentile
California United States
ARTWORK # CF_140496
Graphic Sign Off
SecretaryAnalystMPADeputy
Template_CalFACTS.ait
California’s EConomy
8
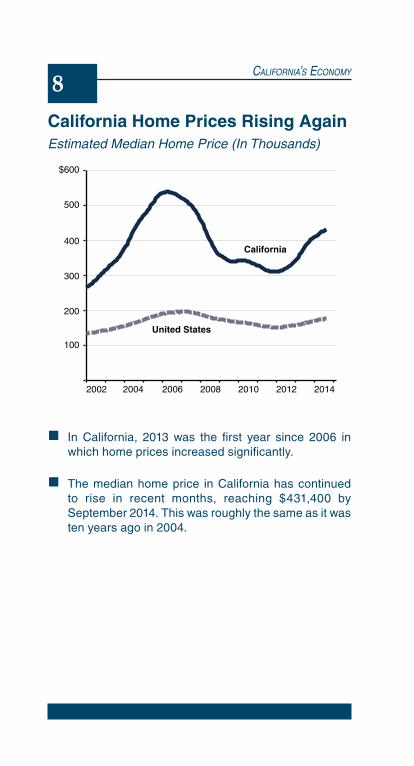
California Home Prices Rising AgainEstimated Median Home Price (In Thousands)
In California, 2013 was the first year since 2006 in which home prices increased significantly.
The median home price in California has continued to rise in recent months, reaching $431,400 by September 2014. This was roughly the same as it was ten years ago in 2004.
California
United States
100
200
300
400
500
$600
2002 2004 2006 2008 2010 2012 2014
ARTWORK # CF_140496
Graphic Sign Off
SecretaryAnalystMPADeputy
Template_CalFACTS.ait

California’s EConomy
9
Californians Spend More of Their Income on HousingShare of Household Income Spent on Housing, 2013
Housing Costs Have Grown Faster Than IncomesTotal Inflation-Adjusted Change Since 2002Housing Costs
2002 2004 2006 2008 2010 2012
5
-10
-5
10
15
20%
20 22 24 26 28 30%
Other States' Metro Areas
San Jose
San Francisco
Bakersfield
Sacramento
Oakland
Fresno
Santa Ana-Anaheim
Riverside-San Bernardino
San Diego
Los Angeles
Median Household Income
ARTWORK # CF_140496
Graphic Sign Off
SecretaryAnalystMPADeputy
Template_CalFACTS.ait
Housing Costs
2002 2004 2006 2008 2010 2012
5
-10
-5
10
15
20%
20 22 24 26 28 30%
Other States' Metro Areas
San Jose
San Francisco
Bakersfield
Sacramento
Oakland
Fresno
Santa Ana-Anaheim
Riverside-San Bernardino
San Diego
Los Angeles
Median Household Income
ARTWORK # CF_140496
Graphic Sign Off
SecretaryAnalystMPADeputy
Template_CalFACTS.ait
California’s EConomy
10
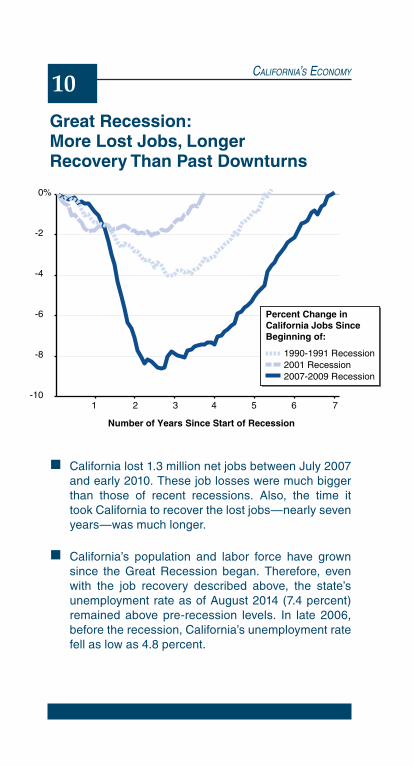
Great Recession: More Lost Jobs, Longer Recovery Than Past Downturns
California lost 1.3 million net jobs between July 2007 and early 2010. These job losses were much bigger than those of recent recessions. Also, the time it took California to recover the lost jobs—nearly seven years—was much longer.
California’s population and labor force have grown since the Great Recession began. Therefore, even with the job recovery described above, the state’s unemployment rate as of August 2014 (7.4 percent) remained above pre-recession levels. In late 2006, before the recession, California’s unemployment rate fell as low as 4.8 percent.
-10
-8
-6
-4
-2
0%
1 2 3 4 5 6
Number of Years Since Start of Recession
1990-1991 Recession2001 Recession2007-2009 Recession
Percent Change in California Jobs Since Beginning of:
7
ARTWORK # CF_140496
Graphic Sign Off
SecretaryAnalystMPADeputy
Template_CalFACTS.ait
California’s EConomy
11
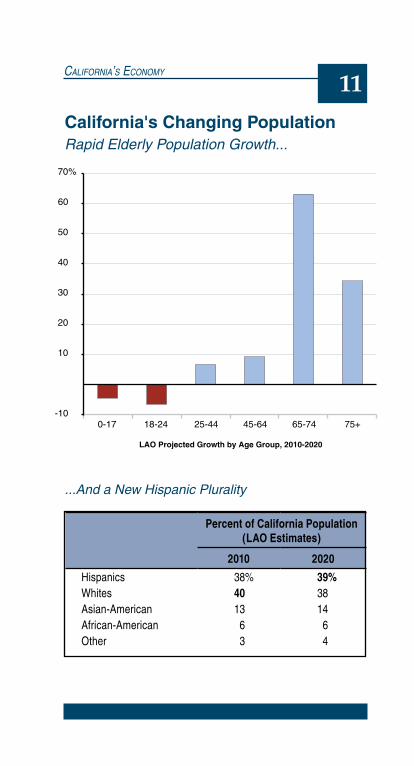
California's Changing PopulationRapid Elderly Population Growth...
...And a New Hispanic Plurality
-10
10
20
30
40
50
60
70%
0-17 18-24 25-44 45-64 65-74 75+
LAO Projected Growth by Age Group, 2010-2020
ARTWORK # CF_140496
Graphic Sign Off
SecretaryAnalystMPADeputy
Template_CalFACTS.ait
Percent of California Population (LAO Estimates)
2010 2020
Hispanics 38% 39%Whites 40 38Asian-American 13 14African-American 6 6Other 3 4
State and LocaL Finance
12
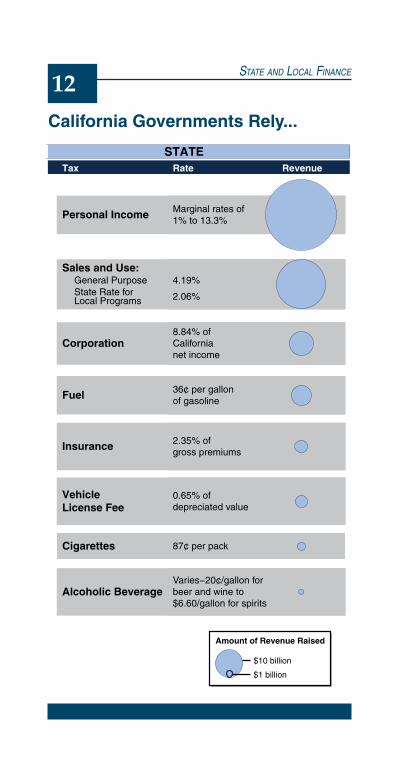
California Governments Rely...
STATE LOCALTax Rate Tax Rate
Personal Income
Sales and Use:
Corporation
Fuel
Insurance
Vehicle License Fee
Alcoholic Beverage
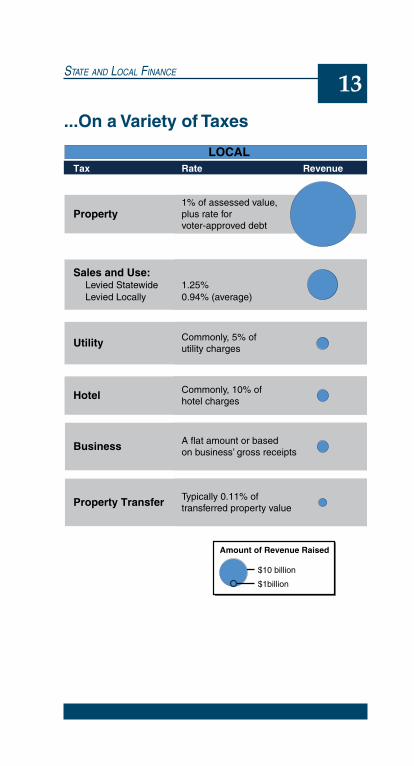
Property
Sales and Use:
Levied Locally
Utility
Hotel
Business
Property Transfer
Marginal rates of 1% to 13.3%
4.19%
8.84% ofCalifornia net income
36¢ per gallon of gasoline
2.35% of gross premiums
0.65% of depreciated value
Varies−20¢/gallon forbeer and wine to $6.60/gallon for spirits
1% of assessed value,plus rate for voter-approved debt
0.94% (average)
Commonly, 5% of utility charges
Commonly, 10% ofhotel charges
A flat amount or based on business’ gross receipts
Typically 0.11% of transferred property value
$10 billion
$1 billion
RevenueRevenue
Cigarettes 87¢ per pack
Amount of Revenue Raised
$10 billion
$1billion
Amount of Revenue Raised
2.06%State Rate for Local Programs
1.25%Levied StatewideGeneral Purpose
ARTWORK # CF_140496
Graphic Sign Off
SecretaryAnalystMPADeputy
Template_CalFACTS.ait
State and LocaL Finance 13
...On a Variety of Taxes
STATE LOCALTax Rate Tax Rate
Personal Income
Sales and Use:
Corporation
Fuel
Insurance
Vehicle License Fee
Alcoholic Beverage
Property
Sales and Use:
Levied Locally
Utility
Hotel
Business
Property Transfer
Marginal rates of 1% to 13.3%
4.19%
8.84% ofCalifornia net income
36¢ per gallon of gasoline
2.35% of gross premiums
0.65% of depreciated value
Varies−20¢/gallon forbeer and wine to $6.60/gallon for spirits
1% of assessed value,plus rate for voter-approved debt
0.94% (average)
Commonly, 5% of utility charges
Commonly, 10% ofhotel charges
A flat amount or based on business’ gross receipts
Typically 0.11% of transferred property value
$10 billion
$1 billion
RevenueRevenue
Cigarettes 87¢ per pack
Amount of Revenue Raised
$10 billion
$1billion
Amount of Revenue Raised
2.06%State Rate for Local Programs
1.25%Levied StatewideGeneral Purpose
ARTWORK # CF_140496
Graphic Sign Off
SecretaryAnalystMPADeputy
Template_CalFACTS.ait
State and LocaL Finance
14
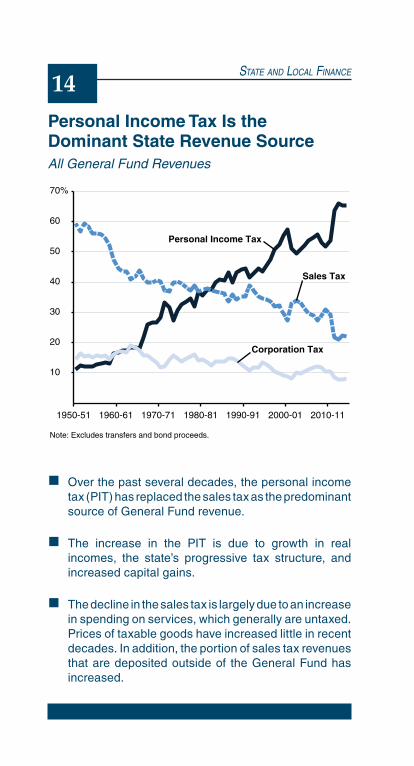
Personal Income Tax Is the Dominant State Revenue SourceAll General Fund Revenues
Over the past several decades, the personal income tax (PIT) has replaced the sales tax as the predominant source of General Fund revenue.
The increase in the PIT is due to growth in real incomes, the state’s progressive tax structure, and increased capital gains.
The decline in the sales tax is largely due to an increase in spending on services, which generally are untaxed. Prices of taxable goods have increased little in recent decades. In addition, the portion of sales tax revenues that are deposited outside of the General Fund has increased.
10
20
30
40
50
60
70%
1950-51 1960-61 1970-71 1980-81 1990-91 2000-01 2010-11
Personal Income Tax
Sales Tax
Corporation Tax
Note: Excludes transfers and bond proceeds.
ARTWORK # CF_140496
Graphic Sign Off
SecretaryAnalystMPADeputy
Template_CalFACTS.ait

State and LocaL Finance 15
Personal Income Tax Much More Volatile Than EconomyPercent Change From Prior Year
Personal income is a broad measure of economic activity in California. It measures wages and salaries and various other types of income, but it excludes capital gains (income resulting from sales of assets, such as stocks and homes).
Personal income taxes are the largest state revenue source. As shown above, these taxes are much more volatile than statewide personal income. This is partly because California taxes capital gains, which are especially volatile and mainly go to high-income taxpayers who pay the highest tax rates. These taxpayers’ other income also tends to be volatile.
Personal Income
Personal Income Tax
-30
-20
-10
0
10
20
30
40%
95-96 97-98 99-00 01-02 03-04 05-06 07-08 09-10 11-12 13-14
ARTWORK # CF_140496
Graphic Sign Off
SecretaryAnalystMPADeputy
Template_CalFACTS.ait
State and LocaL Finance
16
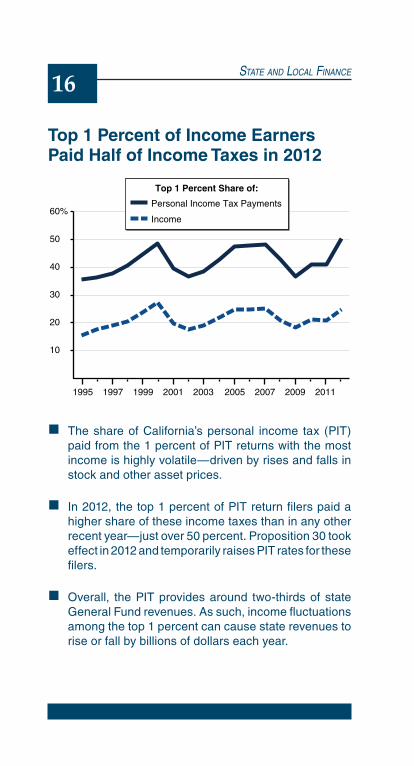
Top 1 Percent of Income Earners Paid Half of Income Taxes in 2012
The share of California’s personal income tax (PIT) paid from the 1 percent of PIT returns with the most income is highly volatile—driven by rises and falls in stock and other asset prices.
In 2012, the top 1 percent of PIT return filers paid a higher share of these income taxes than in any other recent year—just over 50 percent. Proposition 30 took effect in 2012 and temporarily raises PIT rates for these filers.
Overall, the PIT provides around two-thirds of state General Fund revenues. As such, income fluctuations among the top 1 percent can cause state revenues to rise or fall by billions of dollars each year.
Top 1 Percent Share of:
10
20
30
40
50
60%Income
Personal Income Tax Payments
1995 1997 1999 2001 2003 2005 2007 2009 2011
ARTWORK # CF_140496
Graphic Sign Off
SecretaryAnalystMPADeputy
Template_CalFACTS.ait
State and LocaL Finance 17
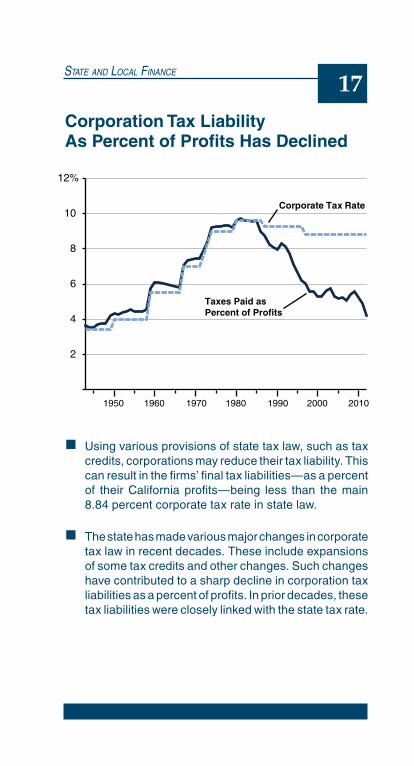
Corporation Tax Liability As Percent of Profits Has Declined
Using various provisions of state tax law, such as tax credits, corporations may reduce their tax liability. This can result in the firms’ final tax liabilities—as a percent of their California profits—being less than the main 8.84 percent corporate tax rate in state law.
The state has made various major changes in corporate tax law in recent decades. These include expansions of some tax credits and other changes. Such changes have contributed to a sharp decline in corporation tax liabilities as a percent of profits. In prior decades, these tax liabilities were closely linked with the state tax rate.
Taxes Paid as Percent of Profits
Corporate Tax Rate
2
4
6
8
10
12%
1950 1960 1970 1980 1990 2000 2010
ARTWORK # CF_140496
Graphic Sign Off
SecretaryAnalystMPADeputy
Template_CalFACTS.ait

State and LocaL Finance
18
Sales and Use Taxes Levied for State and Local Purposes
8.44% Average Statewide Rate
Temporary rate (Proposition 30, 2012)
Criminal justice programs (2011 realignment)
Optional local rates (statewide average)
City and county operations (1%a) and county transportation (0.25%)
Public safety (Proposition 172, 1993)
a Until the state pays off its deficit-financing bonds in mid-2015, the city and county operations rate is 0.75%, with the remaining 0.25% dedicated to state deficit financing bond payments.
General Fund (baseline)State general purpose rates
State rates for local programs
Health and human services programs (1991 realignment)
0.94%
1.25
1.06
0.50
0.50
0.25
3.94
Local rates
ARTWORK # CF_140496
Graphic Sign Off
SecretaryAnalystMPADeputy
Template_CalFACTS.ait

State and LocaL Finance 19
Consumers Are Spending a Declining Share of Income on Taxable Goods
Since 1970, the state’s sales tax base, “taxable sales,” has grown 6.3 percent per year, while personal income—the total income earned by businesses and individuals in California—has grown 7 percent per year. Californians are spending more of their income on housing, health care, and other services not subject to the sales tax.
Total state and local sales tax revenue has grown 7.4 percent per year since 1970. Revenue growth has outpaced taxable sales growth because the average sales tax rate has increased from 5 percent to 8.4 percent.
25
30
35
40
45
50
55%
1970 1975 1980 1985 1990 1995 2000 2005 2010
ARTWORK # CF_140496
Graphic Sign Off
SecretaryAnalystMPADeputy
Template_CalFACTS.ait
State and LocaL Finance
20
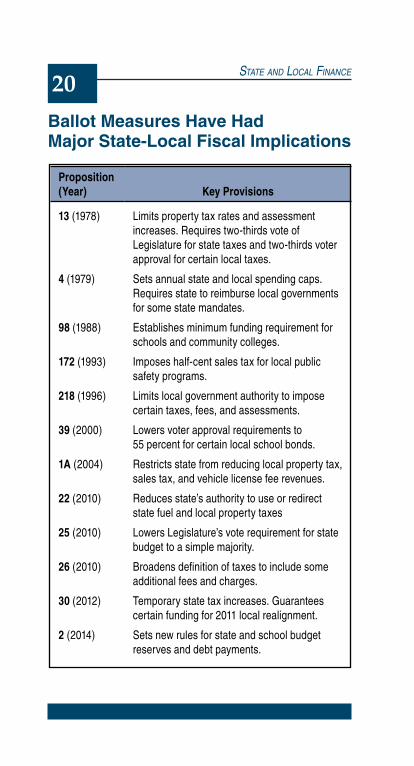
Ballot Measures Have Had Major State-Local Fiscal Implications
Proposition (Year) Key Provisions
13 (1978) Limits property tax rates and assessment increases. Requires two-thirds vote of Legislature for state taxes and two-thirds voter approval for certain local taxes.
4 (1979) Sets annual state and local spending caps. Requires state to reimburse local governments for some state mandates.
98 (1988) Establishes minimum funding requirement for schools and community colleges.
172 (1993) Imposes half-cent sales tax for local public safety programs.
218 (1996) Limits local government authority to impose certain taxes, fees, and assessments.
39 (2000) Lowers voter approval requirements to 55 percent for certain local school bonds.
1A (2004) Restricts state from reducing local property tax, sales tax, and vehicle license fee revenues.
22 (2010) Reduces state’s authority to use or redirect state fuel and local property taxes
25 (2010) Lowers Legislature’s vote requirement for state budget to a simple majority.
26 (2010) Broadens definition of taxes to include some additional fees and charges.
30 (2012) Temporary state tax increases. Guarantees certain funding for 2011 local realignment.
2 (2014) Sets new rules for state and school budget reserves and debt payments.
State and LocaL Finance 21
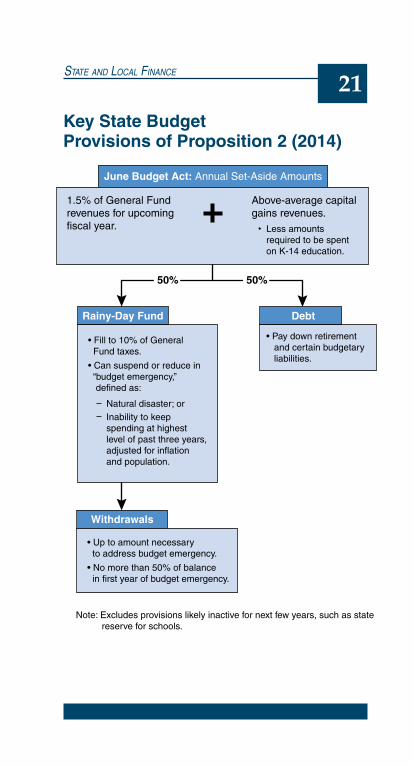
Key State Budget Provisions of Proposition 2 (2014)
June Budget Act: Annual Set-Aside Amounts
1.5% of General Fund revenues for upcoming fiscal year.
Above-average capital gains revenues.
Less amounts required to be spent on K-14 education.
50% 50%
Rainy-Day Fund
• Fill to 10% of General Fund taxes.
• Can suspend or reduce in “budget emergency,” defined as:
Natural disaster; orInability to keep spending at highest level of past three years, adjusted for inflation and population.
Debt
• Pay down retirement and certain budgetary liabilities.
Withdrawals
• Up to amount necessary to address budget emergency.
• No more than 50% of balance in first year of budget emergency.
Note: Excludes provisions likely inactive for next few years, such as state reserve for schools.
ARTWORK # CF_140496
Graphic Sign Off
SecretaryAnalystMPADeputy
Template_CalFACTS.ait
State and LocaL Finance
22
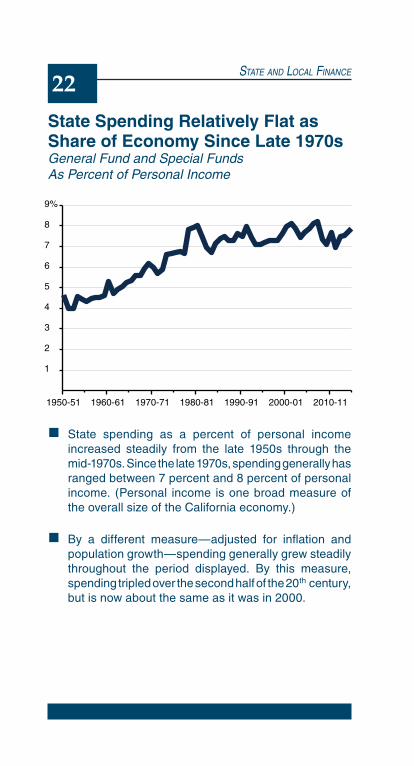
State Spending Relatively Flat as Share of Economy Since Late 1970s General Fund and Special Funds As Percent of Personal Income
State spending as a percent of personal income increased steadily from the late 1950s through the mid-1970s. Since the late 1970s, spending generally has ranged between 7 percent and 8 percent of personal income. (Personal income is one broad measure of the overall size of the California economy.)
By a different measure—adjusted for inflation and population growth—spending generally grew steadily throughout the period displayed. By this measure, spending tripled over the second half of the 20th century, but is now about the same as it was in 2000.
1
2
3
4
5
6
7
8
9%
1950-51 1960-61 1970-71 1980-81 1990-91 2000-01 2010-11
ARTWORK # CF_140496
Graphic Sign Off
SecretaryAnalystMPADeputy
Template_CalFACTS.ait
State and LocaL Finance 23
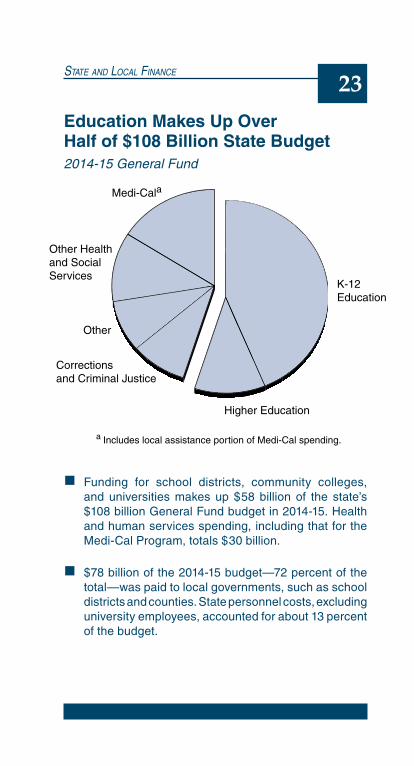
Education Makes Up Over Half of $108 Billion State Budget2014-15 General Fund
Funding for school districts, community colleges, and universities makes up $58 billion of the state’s $108 billion General Fund budget in 2014-15. Health and human services spending, including that for the Medi-Cal Program, totals $30 billion.
$78 billion of the 2014-15 budget—72 percent of the total—was paid to local governments, such as school districts and counties. State personnel costs, excluding university employees, accounted for about 13 percent of the budget.
Other Health and Social Services
Other
Correctionsand Criminal Justice
Higher Education
K-12 Education
Medi-Cala
a Includes local assistance portion of Medi-Cal spending.
ARTWORK # CF_140496
Graphic Sign Off
SecretaryAnalystMPADeputy
Template_CalFACTS.ait

State and LocaL Finance
24
Universities Represent One-Third of State Government Jobs
In 2013-14, the state employed about 354,000 full-time staff at a salary cost of roughly $26 billion (all funds).
The state long has had many positions that are authorized but not filled. The current vacancy rate across state departments is about 13 percent.
Over the past 30 years, state employment has averaged 9.0 state employees per 1,000 population. In 2013-14, there were about 9.3 employees per 1,000 population. On this basis, California ranked 46th among the states in 2012.
University of California
California Highway Patrol
State Hospital
Transportation
Corrections and Rehabilitation
Other
California State University
ARTWORK # CF_140496
Graphic Sign Off
SecretaryAnalystMPADeputy
Template_CalFACTS.ait
State and LocaL Finance 25
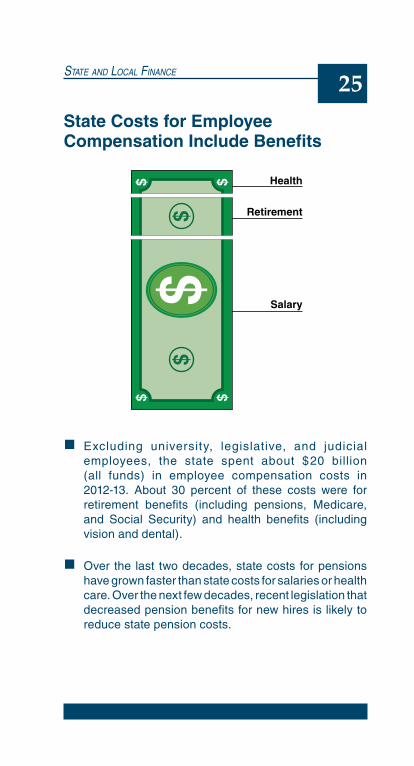
State Costs for Employee Compensation Include Benefits
Excluding university, legislative, and judicial employees, the state spent about $20 billion (all funds) in employee compensation costs in 2012-13. About 30 percent of these costs were for retirement benefits (including pensions, Medicare, and Social Security) and health benefits (including vision and dental).
Over the last two decades, state costs for pensions have grown faster than state costs for salaries or health care. Over the next few decades, recent legislation that decreased pension benefits for new hires is likely to reduce state pension costs.
Health
Retirement
Salary
ARTWORK # CF_140496
Graphic Sign Off
SecretaryAnalystMPADeputy
Template_CalFACTS.ait

State and LocaL Finance
26
Most State Liabilities Now Being Addressed(In Billions)
The state's $280 billion in key liabilities are summarized above. The state has budgeted funds or scheduled payments to address about $160 billion of these liabilities.
Under a 2014 law, the state will pay for about $20 billion of the $74 billion unfunded liability of the state’s teacher pension system known as CalSTRS. School and community college districts and teachers will pay for the remaining $54 billion.
10
20
30
40
50
60
70
80
$90 Being Addressed($160 Billion)
State RetireeHealth
UC andOther
Retirement
Budgetary Infrastructure Bonds
State, CSU,and CalSTRS
Pensions
Budgetary
Not Being Fully Addressed
($120 Billion)
ARTWORK # CF_140496
Graphic Sign Off
SecretaryAnalystMPADeputy
Template_CalFACTS.ait

State and LocaL Finance 27
MeasureGoverning
Body Voters
State
Tax 2/3 —Fee Majority —General obligation bond 2/3 MajorityLease revenue bond Majority —Initiative proposing revenue
or debt— Majority
Constitutional amendment proposed by the Legislature
2/3 Majority
Local
Tax: Funds used for general
purposes2/3a Majority
Funds used for specific purposes
2/3a 2/3
Property assessment Majority Majorityb
Fee Majorityc —General obligation bond: K-14 districts 2/3 55 percent Cities, counties, and special
districts2/3 2/3
Revenue bond Majority Majoritya
Other debt Majority —d
a For most local agencies.b Votes weighted by assessment liability of affected property owners.c Fees on property (excluding water, sewer, refuse collection, gas, and electric
fees) require voter approval.d Enhanced infrastructure financing district debt requires approval by 55 percent of
the district’s voters.
Voting Requirements to Increase Taxes, Fees, Assessments, or Debt
State and LocaL Finance
28
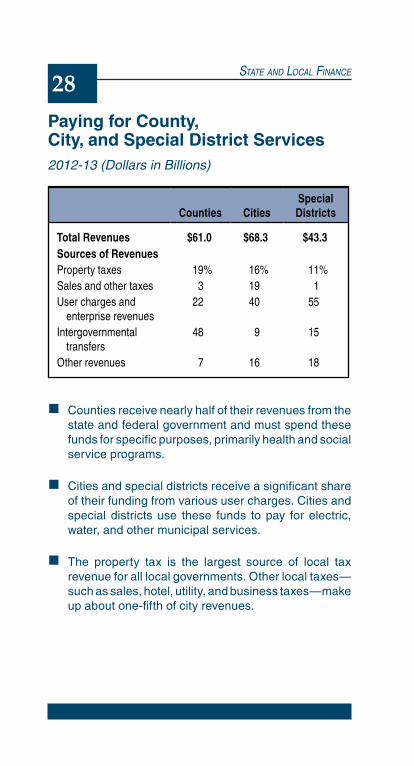
Paying for County, City, and Special District Services2012-13 (Dollars in Billions)
Counties receive nearly half of their revenues from the state and federal government and must spend these funds for specific purposes, primarily health and social service programs.
Cities and special districts receive a significant share of their funding from various user charges. Cities and special districts use these funds to pay for electric, water, and other municipal services.
The property tax is the largest source of local tax revenue for all local governments. Other local taxes—such as sales, hotel, utility, and business taxes—make up about one-fifth of city revenues.
Counties CitiesSpecial Districts
Total Revenues $61.0 $68.3 $43.3Sources of RevenuesProperty taxes 19% 16% 11%Sales and other taxes 3 19 1User charges and
enterprise revenues22 40 55
Intergovernmental transfers
48 9 15
Other revenues 7 16 18

State and LocaL Finance 29
Allocation of Property Tax Has Varied Over Time(Dollars in Billions)
Proposition 13 caps property tax rate at 1 percent and shifts control of its allocation to the state. Schools receive a smaller share of property taxes and are backfilled for their losses with state aid.
1978
State modifies property tax distribution to give a greater share of revenues to schools, thereby reducing state school spending.
1992
State increases the share of property taxes to cities and counties to offset (1) reduced vehicle license fees and (2) the state's use of local sales taxes to repay deficit financing bonds.
2004
State dissolves redevelopment agencies. Property taxes that once went to these agencies begin to flow back to other local governments in the area.
2012
Local sales taxes will be returned to cities and counties after the state retires its deficit financing bonds in 2014-15. Accordingly, city and county shares of property tax revenue will decline (and the schools' share will increase).
2015
&1993
ARTWORK # CF_140496
Graphic Sign Off
SecretaryAnalystMPADeputy
Template_CalFACTS.ait
Selected Years Revenue
Tax Revenue Distribution
Schools Counties Cities Other
1977-78 $10.3 53% 30% 10% 6%1979-80 5.7 39 32 13 161993-94 19.1 51 21 11 182012-13 49.9 40 25 19 16
Information includes debt levies."Other" includes redevelopment agencies and special districts.

Program Trends
30
California's Public Education System Is Extensive2013-14
K-12 Education949 Districts10,134 Schools6.2 Million Students539,000 FTE Faculty and Staffa $51 Billion Proposition 98 Support
California Community Colleges72 Districts112 Colleges1.1 Million FTE Students62,000 FTE Faculty and Staff$6.4 Billion Proposition 98 Support
California State University23 Campuses352,000 Resident FTE Students38,000 FTE Faculty and Staff$2.8 Billion State General Fund Support
University of California10 Campuses 5 Medical Centers 3 National Labs211,000 Resident FTE Students142,000 FTE Faculty and Staff$2.8 Billion State General Fund Support
a Reflects 2012-13 data (latest available).FTE = full-time equivalent.
ARTWORK # CF_140496
Graphic Sign Off
SecretaryAnalystMPADeputy
Template_CalFACTS.ait
Program Trends
31
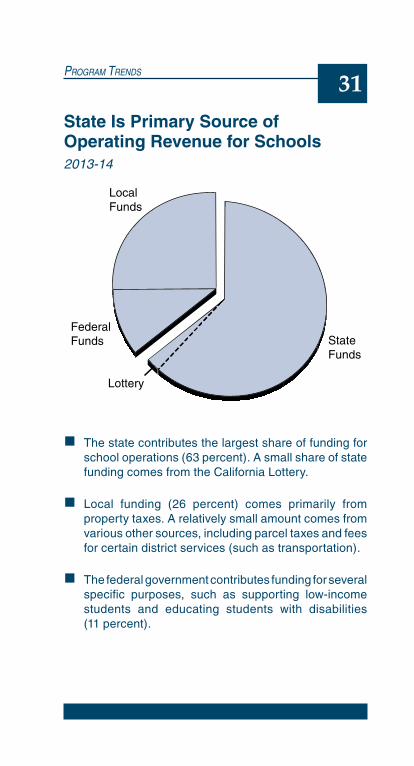
State Is Primary Source of Operating Revenue for Schools2013-14
The state contributes the largest share of funding for school operations (63 percent). A small share of state funding comes from the California Lottery.
Local funding (26 percent) comes primarily from property taxes. A relatively small amount comes from various other sources, including parcel taxes and fees for certain district services (such as transportation).
The federal government contributes funding for several specific purposes, such as supporting low-income students and educating students with disabilities (11 percent).
State Funds
Local Funds
Federal Funds
Lottery
ARTWORK # CF_140496
Graphic Sign Off
SecretaryAnalystMPADeputy
Template_CalFACTS.ait

Program Trends
32
Most School Spending Is for Instruction2012-13
More than $6 of every $10 is spent on instruction and instructional support—largely paying teacher salaries and benefits.
Almost $2 of every $10 is spent on facilities, including land acquisition, construction, and maintenance.
About $1 of every $10 is spent on pupil services, including school meals, pupil transportation, counseling, and health services.
Less than $1 of every $10 is spent on central administration, including the compensation of superintendents as well as central business, legal, and human resource functions.
Instruction
Facilities
Pupil Services
Administration
Other
ARTWORK # CF_140496
Graphic Sign Off
SecretaryAnalystMPADeputy
Template_CalFACTS.ait
Program Trends
33
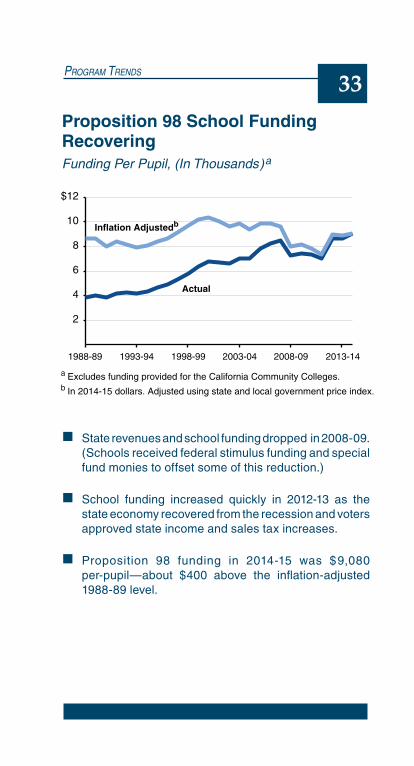
Proposition 98 School Funding RecoveringFunding Per Pupil, (In Thousands)a
State revenues and school funding dropped in 2008-09. (Schools received federal stimulus funding and special fund monies to offset some of this reduction.)
School funding increased quickly in 2012-13 as the state economy recovered from the recession and voters approved state income and sales tax increases.
Proposition 98 funding in 2014-15 was $9,080 per-pupil—about $400 above the inflation-adjusted 1988-89 level.
2
4
6
8
10
$12
Inflation Adjustedb
Actual
1993-94 1998-99 2003-04 2013-141988-89
a Excludes funding provided for the California Community Colleges.b In 2014-15 dollars. Adjusted using state and local government price index.
2008-09
ARTWORK # CF_140496
Graphic Sign Off
SecretaryAnalystMPADeputy
Template_CalFACTS.ait
Program Trends
34
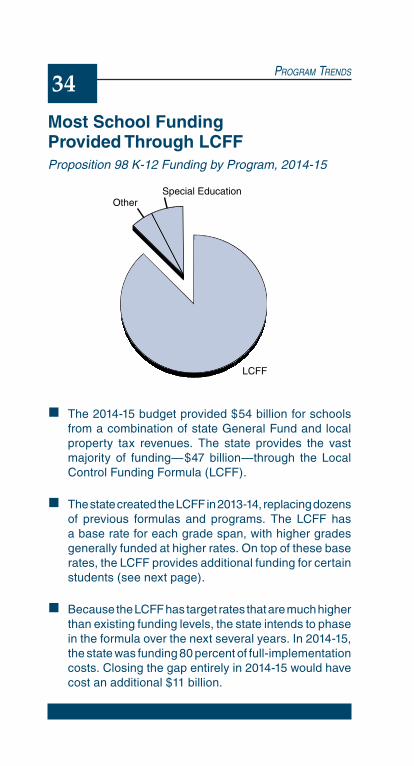
Most School Funding Provided Through LCFFProposition 98 K-12 Funding by Program, 2014-15
The 2014-15 budget provided $54 billion for schools from a combination of state General Fund and local property tax revenues. The state provides the vast majority of funding—$47 billion—through the Local Control Funding Formula (LCFF).
The state created the LCFF in 2013-14, replacing dozens of previous formulas and programs. The LCFF has a base rate for each grade span, with higher grades generally funded at higher rates. On top of these base rates, the LCFF provides additional funding for certain students (see next page).
Because the LCFF has target rates that are much higher than existing funding levels, the state intends to phase in the formula over the next several years. In 2014-15, the state was funding 80 percent of full-implementation costs. Closing the gap entirely in 2014-15 would have cost an additional $11 billion.
LCFF
Special EducationOther
ARTWORK # CF_140496
Graphic Sign Off
SecretaryAnalystMPADeputy
Template_CalFACTS.ait

Program Trends
35
LCFF Provides Additional Funding for Certain StudentsK-12 Students by Type
More than 60 percent of K-12 students are low income, English learners, or foster youth (which are counted as low income).
Under the Local Control Funding Formula (LCFF), these students generate supplemental funding equivalent to 20 percent of the base rate.
If these students comprise more than 55 percent of a district’s enrollment, the district also receives concentration funding equal to 50 percent of the base rate for each student above the threshold.
For more information on how the formula works, please see our report, An Overview of the Local Control Funding Formula (December 2013).
Low Income Only
Low Income and English Learner
English Learner Only
All Other
ARTWORK # CF_140496
Graphic Sign Off
SecretaryAnalystMPADeputy
Template_CalFACTS.ait
Program Trends
36
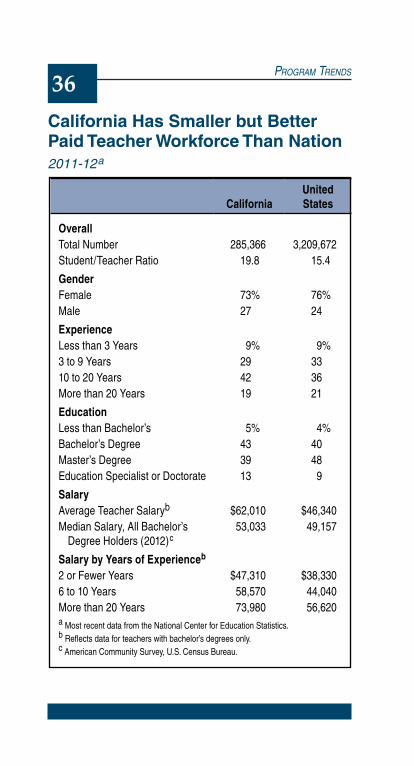
California Has Smaller but Better Paid Teacher Workforce Than Nation2011-12a
CaliforniaUnited States
OverallTotal Number 285,366 3,209,672Student/Teacher Ratio 19.8 15.4
GenderFemale 73% 76%Male 27 24
ExperienceLess than 3 Years 9% 9%3 to 9 Years 29 3310 to 20 Years 42 36More than 20 Years 19 21
EducationLess than Bachelor’s 5% 4%Bachelor’s Degree 43 40Master’s Degree 39 48Education Specialist or Doctorate 13 9
SalaryAverage Teacher Salaryb $62,010 $46,340Median Salary, All Bachelor’s
Degree Holders (2012)c53,033 49,157
Salary by Years of Experienceb
2 or Fewer Years $47,310 $38,3306 to 10 Years 58,570 44,040More than 20 Years 73,980 56,620a Most recent data from the National Center for Education Statistics.b Reflects data for teachers with bachelor’s degrees only.c American Community Survey, U.S. Census Bureau.
Program Trends
37
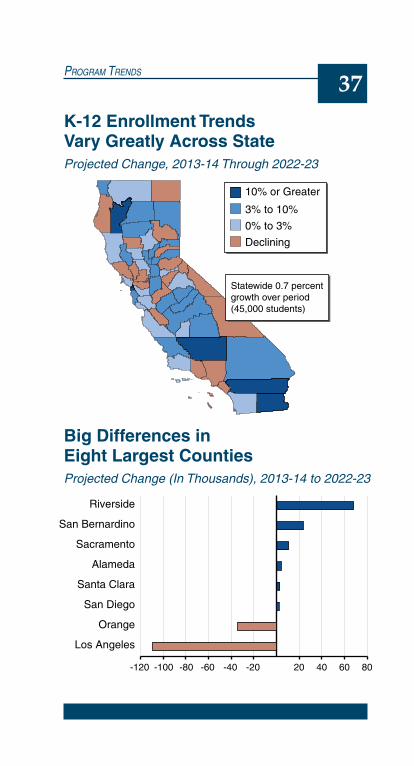
K-12 Enrollment Trends Vary Greatly Across StateProjected Change, 2013-14 Through 2022-23
-120 -100 -80 -60 -40 -20 20 40 60 80
Los Angeles
Orange
San Diego
Santa Clara
Alameda
Sacramento
San Bernardino
Riverside
10% or Greater
3% to 10%
0% to 3%
Declining
Statewide 0.7 percent growth over period (45,000 students)
ARTWORK # CF_140496
Graphic Sign Off
SecretaryAnalystMPADeputy
Template_CalFACTS.ait
Big Differences in Eight Largest CountiesProjected Change (In Thousands), 2013-14 to 2022-23
Program Trends
38
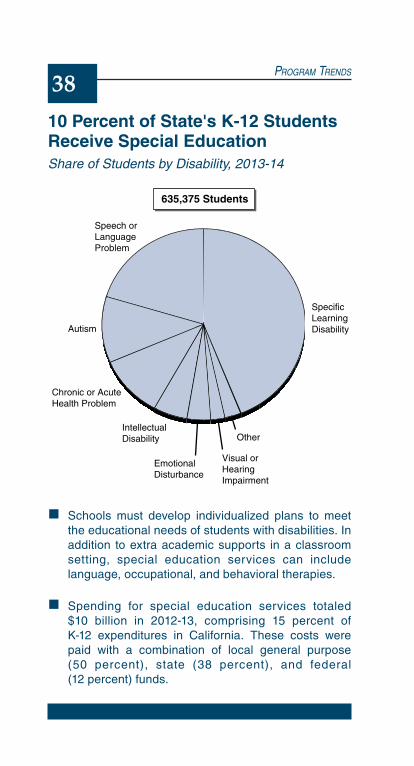
10 Percent of State's K-12 Students Receive Special EducationShare of Students by Disability, 2013-14
Schools must develop individualized plans to meet the educational needs of students with disabilities. In addition to extra academic supports in a classroom setting, special education services can include language, occupational, and behavioral therapies.
Spending for special education services totaled $10 billion in 2012-13, comprising 15 percent of K-12 expenditures in California. These costs were paid with a combination of local general purpose (50 percent), state (38 percent), and federal (12 percent) funds.
Chronic or Acute Health Problem
Autism
Other
Speech or Language Problem
Specific Learning Disability
Intellectual Disability
Visual or Hearing Impairment
Emotional Disturbance
635,375 Students
ARTWORK # CF_140496
Graphic Sign Off
SecretaryAnalystMPADeputy
Template_CalFACTS.ait

Program Trends
39
California Has Many English Learners Second Language Students by Classification
More than four in ten California students—almost 2.7 million students overall—speak a primary language other than English at home. The vast majority of these students (79 percent) speak Spanish.
Overall, about half of these students are classified as English learners whereas half are considered Fluent English Proficient (FEP). Elementary students, however, are much more likely to be classified as English learners than secondary students.
In California, reclassification from English learner to FEP is determined by school districts based on assessments of language and academic proficiency, teacher evaluation, and parental consultation.
Almost one-third of all English learners in the nation live in California.
10
20
30
40
50
60
70
80
90
100%
K 1 2 3 4 5 6 7 8 9 10 11 12
Grades Kindergarten Through 12
Fluent English Proficient
English Learners
ARTWORK # CF_140496
Graphic Sign Off
SecretaryAnalystMPADeputy
Template_CalFACTS.ait
Program Trends
40
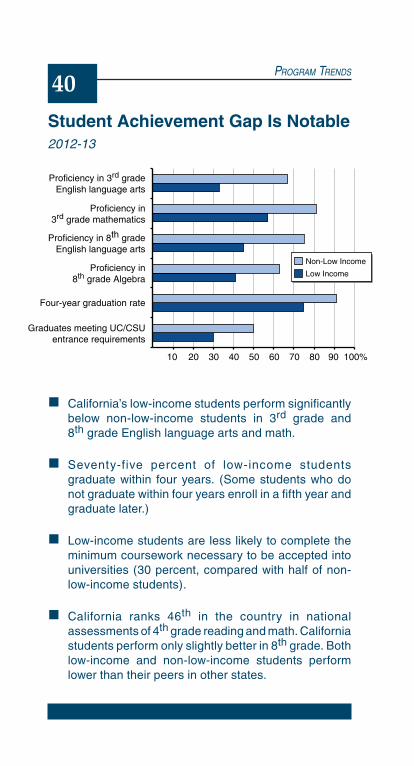
Student Achievement Gap Is Notable2012-13
California’s low-income students perform significantly below non-low-income students in 3rd grade and 8th grade English language arts and math.
Seventy-five percent of low-income students graduate within four years. (Some students who do not graduate within four years enroll in a fifth year and graduate later.)
Low-income students are less likely to complete the minimum coursework necessary to be accepted into universities (30 percent, compared with half of non-low-income students).
California ranks 46th in the country in national assessments of 4th grade reading and math. California students perform only slightly better in 8th grade. Both low-income and non-low-income students perform lower than their peers in other states.
10 20 30 40 50 60 70 80 90 100%
Graduates meeting UC/CSUentrance requirements
Four-year graduation rate
Proficiency in8th grade Algebra
Proficiency in 8th gradeEnglish language arts
Proficiency in3rd grade mathematics
Proficiency in 3rd gradeEnglish language arts
Non-Low Income
Low Income
ARTWORK # CF_140496
Graphic Sign Off
SecretaryAnalystMPADeputy
Template_CalFACTS.ait

Program Trends
41
State Subsidizes Child Care and PreschoolSlots and Funding by Age of Child, 2014-15
About 356,000 children will receive subsidized child care or preschool in 2014-15, costing over $2.4 billion. The state is providing 62 percent of total funding, with the federal government providing the remainder.
Low-income families (up to roughly $42,000 per year for a family of three) are eligible for subsidized child care and preschool programs. With the exception of State Preschool, programs require the parents to be working.
All families participating in California Work Opportunity and Responsibility to Kids are guaranteed subsidized child care. In addition, the state serves a small share of other low-income, working families.
111,504$762 million
129,984$889 million
114,983$786 million
Birth to Three Year Olds
Four Year Olds
Five to Twelve Year Olds
SlotsFunding
ARTWORK # CF_140496
Graphic Sign Off
SecretaryAnalystMPADeputy
Template_CalFACTS.ait
Program Trends
42
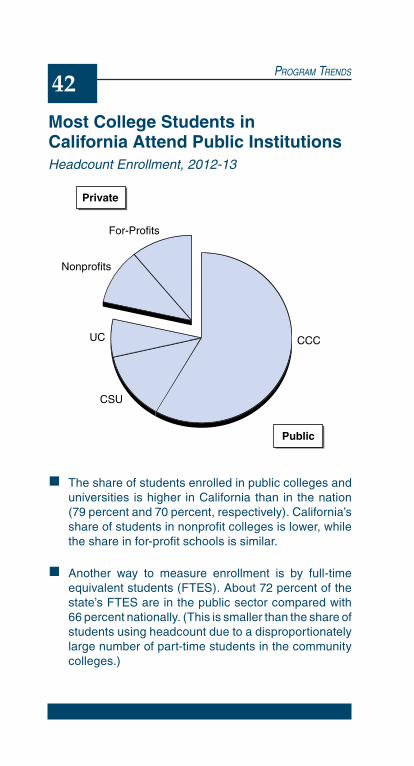
Most College Students in California Attend Public InstitutionsHeadcount Enrollment, 2012-13
The share of students enrolled in public colleges and universities is higher in California than in the nation (79 percent and 70 percent, respectively). California’s share of students in nonprofit colleges is lower, while the share in for-profit schools is similar.
Another way to measure enrollment is by full-time equivalent students (FTES). About 72 percent of the state’s FTES are in the public sector compared with 66 percent nationally. (This is smaller than the share of students using headcount due to a disproportionately large number of part-time students in the community colleges.)
CCC
CSU
UC
Nonprofits
For-Profits
Public
Private
ARTWORK # CF_140496
Graphic Sign Off
SecretaryAnalystMPADeputy
Template_CalFACTS.ait
Program Trends
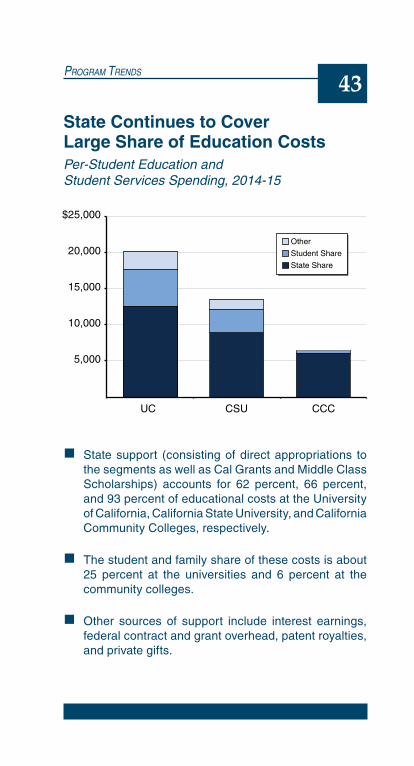
43
State Continues to Cover Large Share of Education CostsPer-Student Education and Student Services Spending, 2014-15
State support (consisting of direct appropriations to the segments as well as Cal Grants and Middle Class Scholarships) accounts for 62 percent, 66 percent, and 93 percent of educational costs at the University of California, California State University, and California Community Colleges, respectively.
The student and family share of these costs is about 25 percent at the universities and 6 percent at the community colleges.
Other sources of support include interest earnings, federal contract and grant overhead, patent royalties, and private gifts.
5,000
10,000
15,000
20,000
$25,000
UC CSU CCC
Other
Student Share
State Share
ARTWORK # CF_140496
Graphic Sign Off
SecretaryAnalystMPADeputy
Template_CalFACTS.ait
Program Trends
44
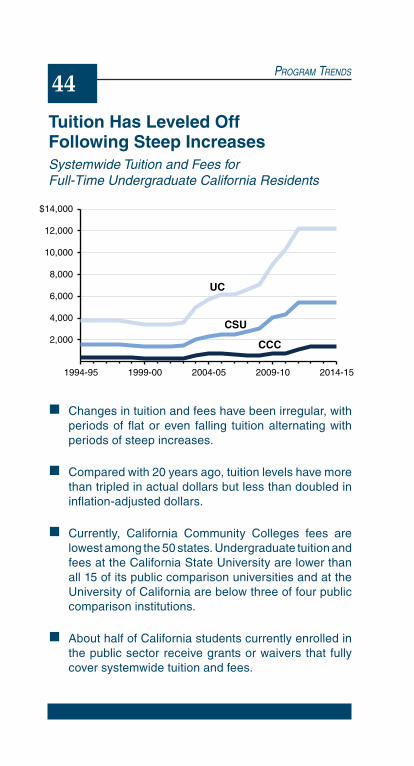
Tuition Has Leveled Off Following Steep IncreasesSystemwide Tuition and Fees for Full-Time Undergraduate California Residents
Changes in tuition and fees have been irregular, with periods of flat or even falling tuition alternating with periods of steep increases.
Compared with 20 years ago, tuition levels have more than tripled in actual dollars but less than doubled in inflation-adjusted dollars.
Currently, California Community Colleges fees are lowest among the 50 states. Undergraduate tuition and fees at the California State University are lower than all 15 of its public comparison universities and at the University of California are below three of four public comparison institutions.
About half of California students currently enrolled in the public sector receive grants or waivers that fully cover systemwide tuition and fees.
2,000
4,000
6,000
8,000
10,000
12,000
$14,000
1994-95 1999-00 2004-05 2009-10 2014-15
UC
CSU
CCC
ARTWORK # CF_140496
Graphic Sign Off
SecretaryAnalystMPADeputy
Template_CalFACTS.ait
Program Trends
45
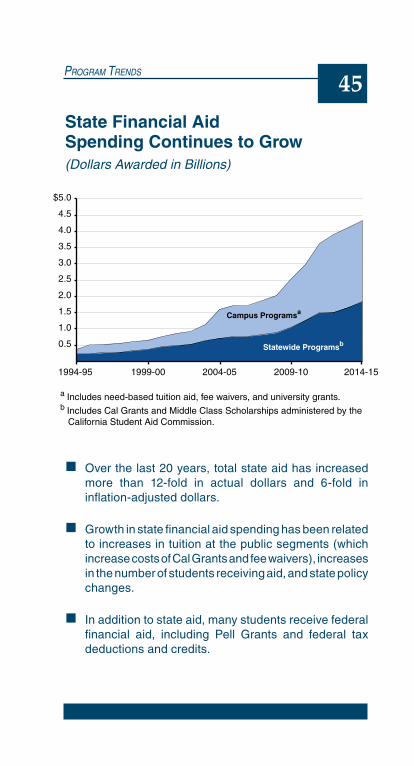
State Financial Aid Spending Continues to Grow(Dollars Awarded in Billions)
Over the last 20 years, total state aid has increased more than 12-fold in actual dollars and 6-fold in inflation-adjusted dollars.
Growth in state financial aid spending has been related to increases in tuition at the public segments (which increase costs of Cal Grants and fee waivers), increases in the number of students receiving aid, and state policy changes.
In addition to state aid, many students receive federal financial aid, including Pell Grants and federal tax deductions and credits.
Campus Programsa
Statewide Programsb
a Includes need-based tuition aid, fee waivers, and university grants.b Includes Cal Grants and Middle Class Scholarships administered by the California Student Aid Commission.
0.5
1.0
1.5
2.0
2.5
3.0
3.5
4.0
4.5
$5.0
1994-95 1999-00 2014-152009-102004-05
ARTWORK # CF_140496
Graphic Sign Off
SecretaryAnalystMPADeputy
Template_CalFACTS.ait
Program Trends
46
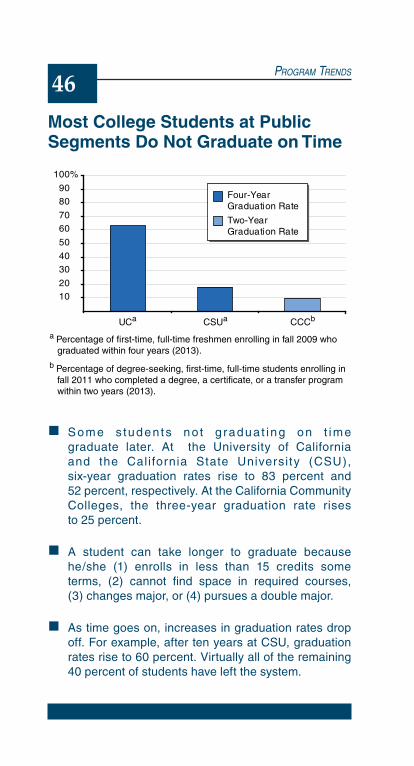
Most College Students at Public Segments Do Not Graduate on Time
Some s tudents no t g raduat ing on t ime graduate later. At the University of California and the Cali fornia State University (CSU), six-year graduation rates rise to 83 percent and 52 percent, respectively. At the California Community Colleges, the three-year graduation rate rises to 25 percent.
A student can take longer to graduate because he/she (1) enrolls in less than 15 credits some terms, (2) cannot find space in required courses, (3) changes major, or (4) pursues a double major.
As time goes on, increases in graduation rates drop off. For example, after ten years at CSU, graduation rates rise to 60 percent. Virtually all of the remaining 40 percent of students have left the system.
UCa CSUa CCCb
1020
3040
50
6070
8090
100%
Four-YearGraduation Rate
Two-YearGraduation Rate
a Percentage of first-time, full-time freshmen enrolling in fall 2009 who graduated within four years (2013).
b Percentage of degree-seeking, first-time, full-time students enrolling in fall 2011 who completed a degree, a certificate, or a transfer program within two years (2013).
ARTWORK # CF_140496
Graphic Sign Off
SecretaryAnalystMPADeputy
Template_CalFACTS.ait
Program Trends
47
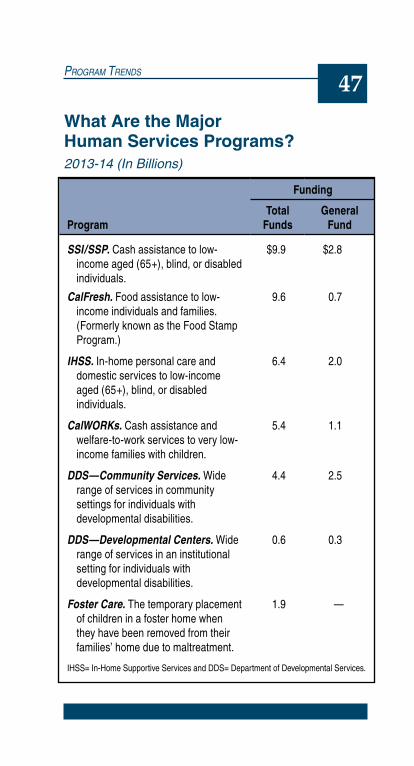
What Are the Major Human Services Programs?2013-14 (In Billions)
Program
Funding
Total Funds
General Fund
SSI/SSP. Cash assistance to low-income aged (65+), blind, or disabled individuals.
$9.9 $2.8
CalFresh. Food assistance to low-income individuals and families. (Formerly known as the Food Stamp Program.)
9.6 0.7
IHSS. In-home personal care and domestic services to low-income aged (65+), blind, or disabled individuals.
6.4 2.0
CalWORKs. Cash assistance and welfare-to-work services to very low-income families with children.
5.4 1.1
DDS—Community Services. Wide range of services in community settings for individuals with developmental disabilities.
4.4 2.5
DDS—Developmental Centers. Wide range of services in an institutional setting for individuals with developmental disabilities.
0.6 0.3
Foster Care. The temporary placement of children in a foster home when they have been removed from their families’ home due to maltreatment.
1.9 —
IHSS= In-Home Supportive Services and DDS= Department of Developmental Services.
Program Trends
48
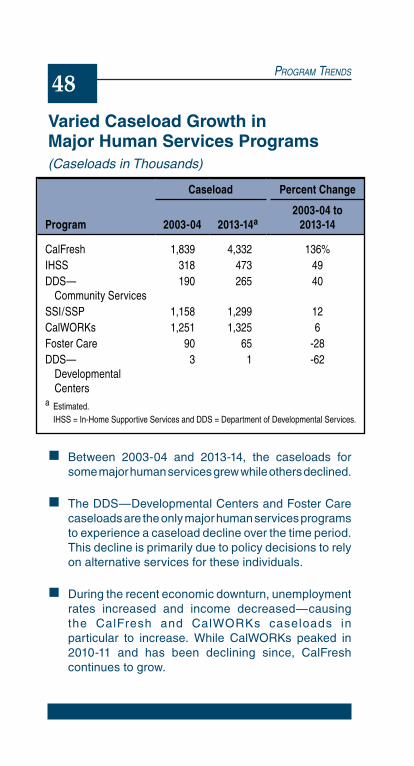
Varied Caseload Growth in Major Human Services Programs(Caseloads in Thousands)
Between 2003-04 and 2013-14, the caseloads for some major human services grew while others declined.
The DDS—Developmental Centers and Foster Care caseloads are the only major human services programs to experience a caseload decline over the time period. This decline is primarily due to policy decisions to rely on alternative services for these individuals.
During the recent economic downturn, unemployment rates increased and income decreased—causing the CalFresh and CalWORKs caseloads in particular to increase. While CalWORKs peaked in 2010-11 and has been declining since, CalFresh continues to grow.
Program
Caseload Percent Change
2003-04 2013-14a2003-04 to
2013-14
CalFresh 1,839 4,332 136%IHSS 318 473 49DDS—
Community Services190 265 40
SSI/SSP 1,158 1,299 12CalWORKs 1,251 1,325 6Foster Care 90 65 -28DDS—
Developmental Centers
3 1 -62
a Estimated. IHSS = In-Home Supportive Services and DDS = Department of Developmental Services.
Program Trends
49
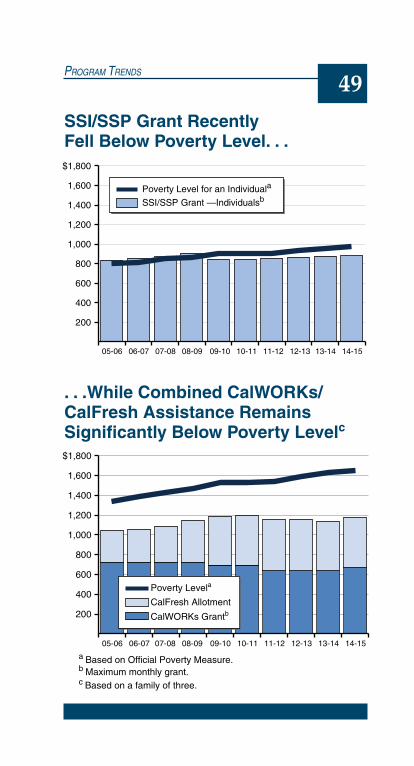
SSI/SSP Grant Recently Fell Below Poverty Level. . .
200
400
600
800
1,000
1,200
1,400
1,600
$1,800
05-06 06-07 07-08 08-09 09-10 10-11 11-12 12-13 13-14 14-15
200
400
600
800
1,000
1,200
1,400
1,600
$1,800
Poverty Level for an Individuala
SSI/SSP Grant —Individualsb
a Based on Official Poverty Measure.b Maximum monthly grant.
CalFresh Allotment
CalWORKs Grantb
Poverty Levela
05-06 06-07 07-08 08-09 09-10 10-11 11-12 12-13 13-14 14-15
c Based on a family of three.
ARTWORK # CF_140496
Graphic Sign Off
SecretaryAnalystMPADeputy
Template_CalFACTS.ait
200
400
600
800
1,000
1,200
1,400
1,600
$1,800
05-06 06-07 07-08 08-09 09-10 10-11 11-12 12-13 13-14 14-15
200
400
600
800
1,000
1,200
1,400
1,600
$1,800
Poverty Level for an Individuala
SSI/SSP Grant —Individualsb
a Based on Official Poverty Measure.b Maximum monthly grant.
CalFresh Allotment
CalWORKs Grantb
Poverty Levela
05-06 06-07 07-08 08-09 09-10 10-11 11-12 12-13 13-14 14-15
c Based on a family of three.
ARTWORK # CF_140496
Graphic Sign Off
SecretaryAnalystMPADeputy
Template_CalFACTS.ait
. . .While Combined CalWORKs/CalFresh Assistance Remains Significantly Below Poverty Levelc
Program Trends
50
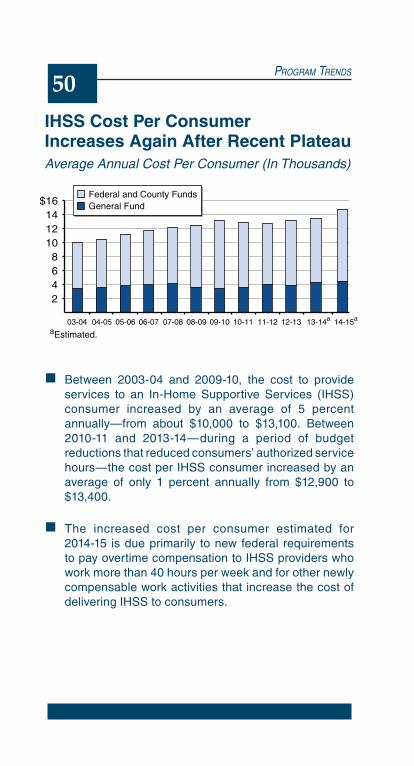
IHSS Cost Per Consumer Increases Again After Recent PlateauAverage Annual Cost Per Consumer (In Thousands)
Between 2003-04 and 2009-10, the cost to provide services to an In-Home Supportive Services (IHSS) consumer increased by an average of 5 percent annually—from about $10,000 to $13,100. Between 2010-11 and 2013-14—during a period of budget reductions that reduced consumers’ authorized service hours—the cost per IHSS consumer increased by an average of only 1 percent annually from $12,900 to $13,400.
The increased cost per consumer estimated for 2014-15 is due primarily to new federal requirements to pay overtime compensation to IHSS providers who work more than 40 hours per week and for other newly compensable work activities that increase the cost of delivering IHSS to consumers.
2468
101214
$16Federal and County FundsGeneral Fund
03-04 05-06 07-08 09-10 11-12 13-14a 14-15a
aEstimated.04-05 06-07 08-09 10-11 12-13
ARTWORK # CF_140496
Graphic Sign Off
SecretaryAnalystMPADeputy
Template_CalFACTS.ait
Program Trends
51
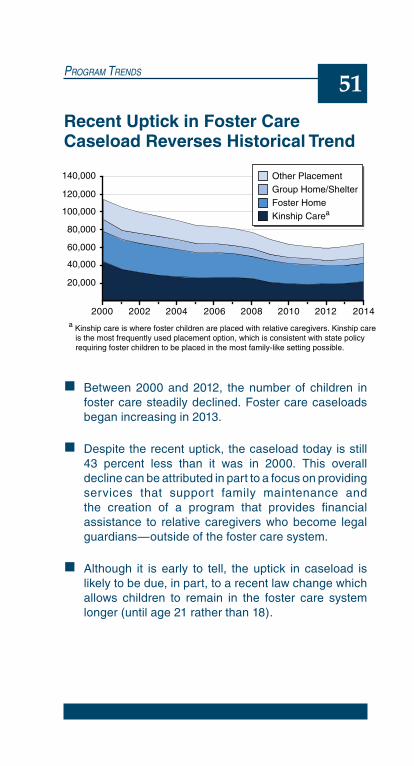
Recent Uptick in Foster Care Caseload Reverses Historical Trend
Between 2000 and 2012, the number of children in foster care steadily declined. Foster care caseloads began increasing in 2013.
Despite the recent uptick, the caseload today is still 43 percent less than it was in 2000. This overall decline can be attributed in part to a focus on providing services that support family maintenance and the creation of a program that provides financial assistance to relative caregivers who become legal guardians—outside of the foster care system.
Although it is early to tell, the uptick in caseload is likely to be due, in part, to a recent law change which allows children to remain in the foster care system longer (until age 21 rather than 18).
20,000
40,000
60,000
80,000
100,000
120,000
140,000
2000 2002 2004 2006 2008 2010 2012 2014
Other PlacementGroup Home/ShelterFoster HomeKinship Carea
ARTWORK # CF_140496
Graphic Sign Off
SecretaryAnalystMPADeputy
Template_CalFACTS.ait
a Kinship care is where foster children are placed with relative caregivers. Kinship care is the most frequently used placement option, which is consistent with state policy requiring foster children to be placed in the most family-like setting possible.
Program Trends
52
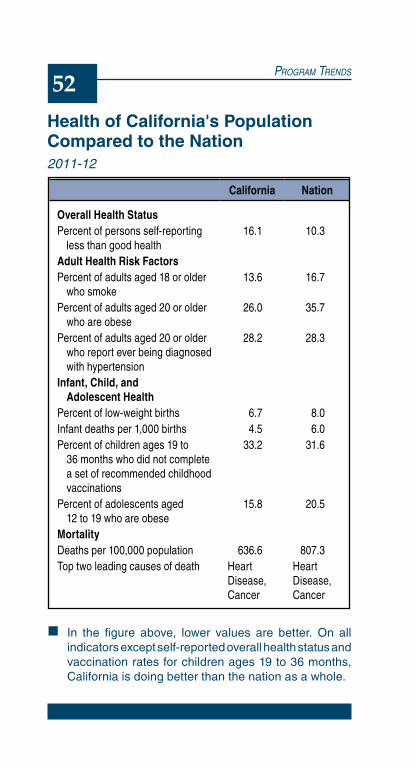
Health of California's Population Compared to the Nation2011-12
In the figure above, lower values are better. On all indicators except self-reported overall health status and vaccination rates for children ages 19 to 36 months, California is doing better than the nation as a whole.
California Nation
Overall Health StatusPercent of persons self-reporting
less than good health16.1 10.3
Adult Health Risk FactorsPercent of adults aged 18 or older
who smoke13.6 16.7
Percent of adults aged 20 or older who are obese
26.0 35.7
Percent of adults aged 20 or older who report ever being diagnosed with hypertension
28.2 28.3
Infant, Child, and Adolescent Health
Percent of low-weight births 6.7 8.0Infant deaths per 1,000 births 4.5 6.0Percent of children ages 19 to
36 months who did not complete a set of recommended childhood vaccinations
33.2 31.6
Percent of adolescents aged 12 to 19 who are obese
15.8 20.5
MortalityDeaths per 100,000 population 636.6 807.3Top two leading causes of death Heart
Disease, Cancer
Heart Disease, Cancer
Program Trends
53
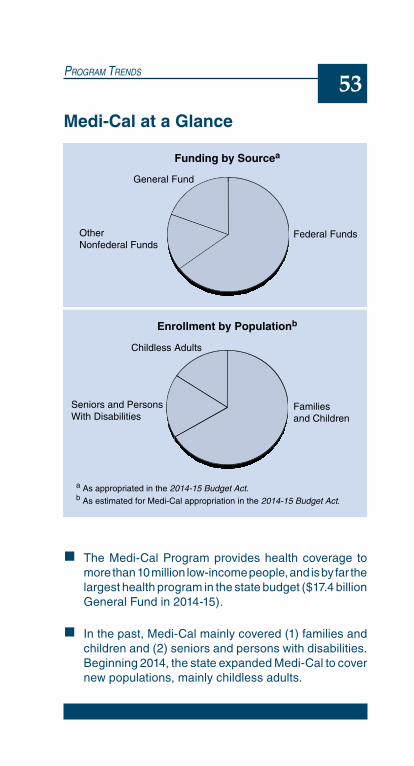
Medi-Cal at a Glance
The Medi-Cal Program provides health coverage to more than 10 million low-income people, and is by far the largest health program in the state budget ($17.4 billion General Fund in 2014-15).
In the past, Medi-Cal mainly covered (1) families and children and (2) seniors and persons with disabilities. Beginning 2014, the state expanded Medi-Cal to cover new populations, mainly childless adults.
General Fund
Federal Funds
Funding by Sourcea
Families and Children
Seniors and Persons With Disabilities
Childless Adults
Other Nonfederal Funds
a As appropriated in the 2014-15 Budget Act.b As estimated for Medi-Cal appropriation in the 2014-15 Budget Act.
Enrollment by Populationb
ARTWORK # CF_140496
Graphic Sign Off
SecretaryAnalystMPADeputy
Template_CalFACTS.ait

Program Trends
54
Majority of Medi-Cal Enrollment and Spending Now in Managed Care
Medi-Cal provides health care services under two arrangements: (1) fee-for-service (providers are paid for each service delivered) and (2) managed care (health plans are paid a fixed monthly rate per enrollee regardless of the number of services delivered).
While managed care has covered the majority of Medi-Cal enrollees over the past decade, until recently, the majority of General Fund spending was for fee-for-service. This is because the most expensive populations and services—such as seniors and persons with disabilities (SPDs) and long-term care—remained in fee-for-service.
Since 2011-12, the state has shifted SPDs from fee-for-service to managed care. In some counties, long-term care is now provided through managed care.
10
20
30
40
50
60
70
80%
2010-11 2011-12 2012-13 2013-14 2014-15
Percent of General Fund Spending in Managed Carea
Percent of Enrollment in Managed Careb
aAs appropriated in annual budget act.bActual for 2010-11 through 2012-13, estimated for 2013-14 and 2014-15.
ARTWORK # CF_140496
Graphic Sign Off
SecretaryAnalystMPADeputy
Template_CalFACTS.ait
Program Trends
55
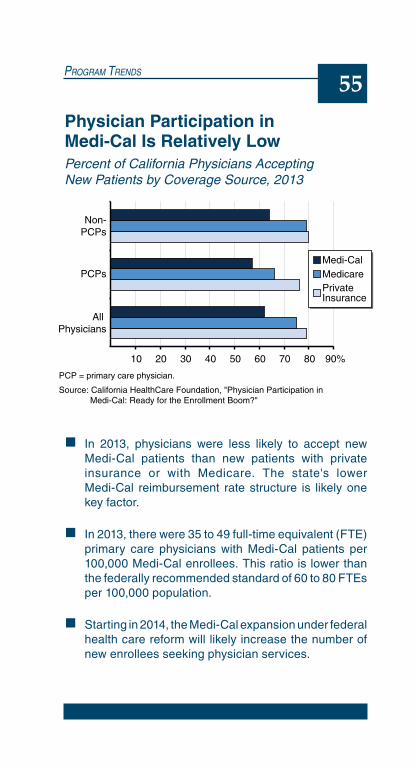
Physician Participation in Medi-Cal Is Relatively LowPercent of California Physicians Accepting New Patients by Coverage Source, 2013
In 2013, physicians were less likely to accept new Medi-Cal patients than new patients with private insurance or with Medicare. The state's lower Medi-Cal reimbursement rate structure is likely one key factor.
In 2013, there were 35 to 49 full-time equivalent (FTE) primary care physicians with Medi-Cal patients per 100,000 Medi-Cal enrollees. This ratio is lower than the federally recommended standard of 60 to 80 FTEs per 100,000 population.
Starting in 2014, the Medi-Cal expansion under federal health care reform will likely increase the number of new enrollees seeking physician services.
10 20 30 40 50 60 70 80 90%
All Physicians
PCPs
Non-PCPs
Medi-CalMedicarePrivate Insurance
PCP = primary care physician.
Source: California HealthCare Foundation, "Physician Participation in Medi-Cal: Ready for the Enrollment Boom?"
ARTWORK # CF_140496
Graphic Sign Off
SecretaryAnalystMPADeputy
Template_CalFACTS.ait

Program Trends
56
Health Insurance Coverage in 2013, Before Covered California Opened for EnrollmentAdults, Aged 18-64
At a given point in time during 2013, 24 percent of Californians aged 18 to 64, or about 5.7 million people, did not have health insurance coverage.
The Patient Protection and Affordable Care Act expanded health coverage through Medi-Cal and subsidies as of January 1, 2014. Medi-Cal eligibility was expanded to include previously ineligible adults with incomes up to 138 percent of the federal poverty level (FPL). Subsidized health insurance coverage, available through Covered California (the state’s Health Benefit Exchange), also became available to certain qualifying citizens and legal residents with incomes between 100 percent and 400 percent of FPL.
Employer-Sponsored
Medi-Cal
Other
Uninsured
ARTWORK # CF_140496
Graphic Sign Off
SecretaryAnalystMPADeputy
Template_CalFACTS.ait
Program Trends
57
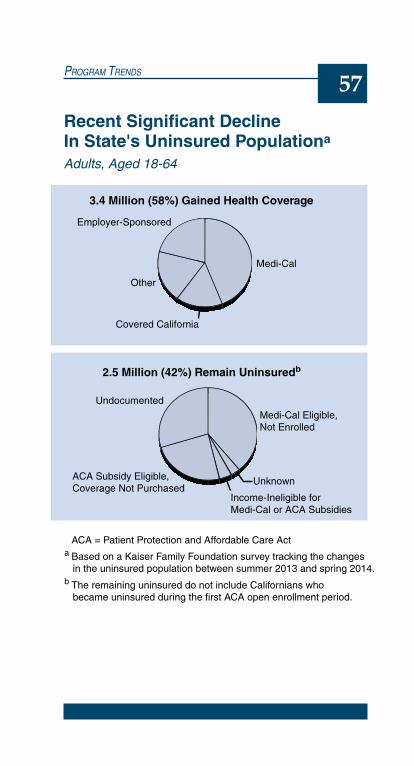
Recent Significant Decline In State's Uninsured Populationa
Adults, Aged 18-64
b The remaining uninsured do not include Californians who became uninsured during the first ACA open enrollment period.
2.5 Million (42%) Remain Uninsuredb
Medi-Cal Eligible,Not Enrolled
ACA Subsidy Eligible, Coverage Not Purchased
Income-Ineligible for Medi-Cal or ACA Subsidies
Undocumented
Unknown
3.4 Million (58%) Gained Health Coverage
Medi-Cal
Covered California
Employer-Sponsored
Other
ACA = Patient Protection and Affordable Care Acta Based on a Kaiser Family Foundation survey tracking the changes in the uninsured population between summer 2013 and spring 2014.
ARTWORK # CF_140496
Graphic Sign Off
SecretaryAnalystMPADeputy
Template_CalFACTS.ait

Program Trends
58
The Unemployment Insurance Trust Fund Insolvency Continues(In Billions)
The Unemployment Insurance Trust Fund has been insolvent since 2009, as high levels of unemployment during the recession resulted in the state paying more in unemployment benefits than it collected in revenues.
While the trust fund is insolvent, the state receives federal loans to finance unemployment benefits. At the end of 2013, the loan balance was $9.7 billion, with an annual interest payment of $259 million.
Revenues began to exceed benefit payments in 2013, but without an increase in revenues and/or a reduction in benefits, the trust fund is projected to remain insolvent until 2019 and risks returning to insolvency in a future recession.
Note: Dotted lines show Employment Development Department projections.
-15
-10
-5
5
10
$15
2000 2005 2010 2015
Revenues
Benefit Payments
Fund Balance Negative Fund Balances
ARTWORK # CF_140496
Graphic Sign Off
SecretaryAnalystMPADeputy
Template_CalFACTS.ait
Program Trends
59
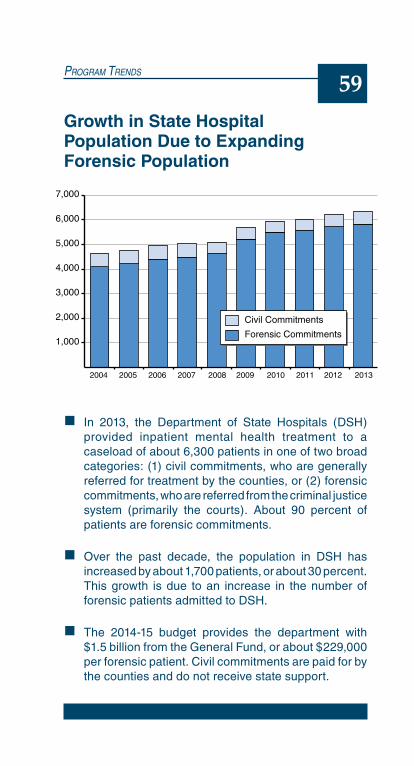
Growth in State Hospital Population Due to Expanding Forensic Population
In 2013, the Department of State Hospitals (DSH) provided inpatient mental health treatment to a caseload of about 6,300 patients in one of two broad categories: (1) civil commitments, who are generally referred for treatment by the counties, or (2) forensic commitments, who are referred from the criminal justice system (primarily the courts). About 90 percent of patients are forensic commitments.
Over the past decade, the population in DSH has increased by about 1,700 patients, or about 30 percent. This growth is due to an increase in the number of forensic patients admitted to DSH.
The 2014-15 budget provides the department with $1.5 billion from the General Fund, or about $229,000 per forensic patient. Civil commitments are paid for by the counties and do not receive state support.
1,000
2,000
3,000
4,000
5,000
6,000
7,000
2004 2005 2006 2007 2008 2009 2010 2011 2012 2013
Civil Commitments
Forensic Commitments
ARTWORK # CF_140496
Graphic Sign Off
SecretaryAnalystMPADeputy
Template_CalFACTS.ait

Program Trends
60
California Crime Rate at Historic LowCrimes per 100,000 Population
California has experienced a decline in both property and violent crime rates since the early 1990’s. Between 1993 and 2013, the state’s overall crime rate declined by half. This trend is similar to declines in crime patterns in the rest of the United States.
In 2013, about 3,000 crimes were committed in California per 100,000 residents—a total of about 1.2 million incidents. This is down from a high of over 2 million crimes reported annually in the early 1990s.
The state’s property crime rate is lower than the nationwide rate. However, the rate of violent crime (such as murder, rape, and assault) in California remains somewhat higher than the United States as a whole.
ARTWORK # CF_140496
Graphic Sign Off
SecretaryAnalystMPADeputy
Template_CalFACTS.ait
1,000
2,000
3,000
4,000
5,000
6,000
7,000
8,000
9,000
Total
Property
Violent
1965 1970 1975 1980 1985 1990 1995 2000 2005 2010
Program Trends
61
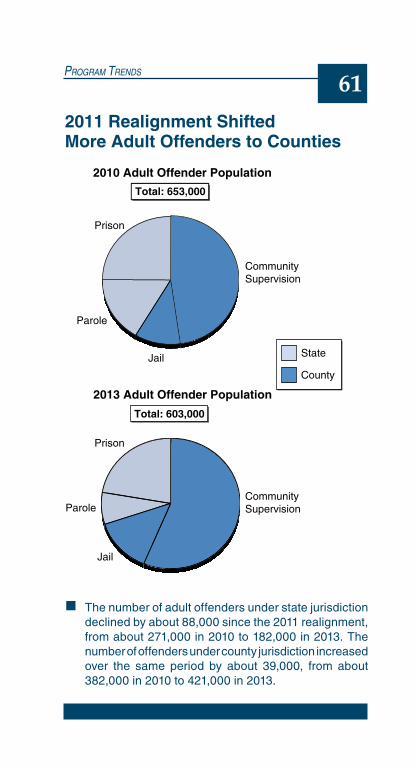
2011 Realignment Shifted More Adult Offenders to Counties
The number of adult offenders under state jurisdiction declined by about 88,000 since the 2011 realignment, from about 271,000 in 2010 to 182,000 in 2013. The number of offenders under county jurisdiction increased over the same period by about 39,000, from about 382,000 in 2010 to 421,000 in 2013.
2010 Adult Offender Population
State
County
Prison
Parole
Jail
Community Supervision
Total: 653,000
Prison
Parole
Jail
Community Supervision
2013 Adult Offender Population
Total: 603,000
ARTWORK # CF_140496
Graphic Sign Off
SecretaryAnalystMPADeputy
Template_CalFACTS.ait
Program Trends
62
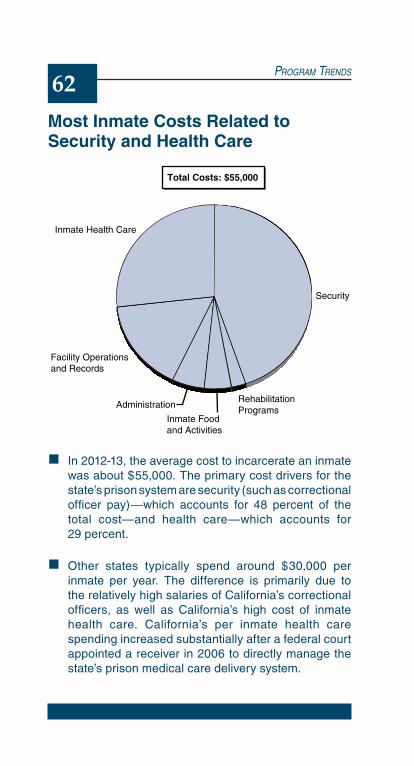
Most Inmate Costs Related to Security and Health Care
In 2012-13, the average cost to incarcerate an inmate was about $55,000. The primary cost drivers for the state’s prison system are security (such as correctional officer pay)—which accounts for 48 percent of the total cost—and health care—which accounts for 29 percent.
Other states typically spend around $30,000 per inmate per year. The difference is primarily due to the relatively high salaries of California’s correctional officers, as well as California’s high cost of inmate health care. California’s per inmate health care spending increased substantially after a federal court appointed a receiver in 2006 to directly manage the state’s prison medical care delivery system.
ARTWORK # CF_140496
Graphic Sign Off
SecretaryAnalystMPADeputy
Template_CalFACTS.ait
Security
Inmate Health Care
Facility Operations and Records
Administration
Inmate Food and Activities
Rehabilitation Programs
Total Costs: $55,000
Program Trends
63
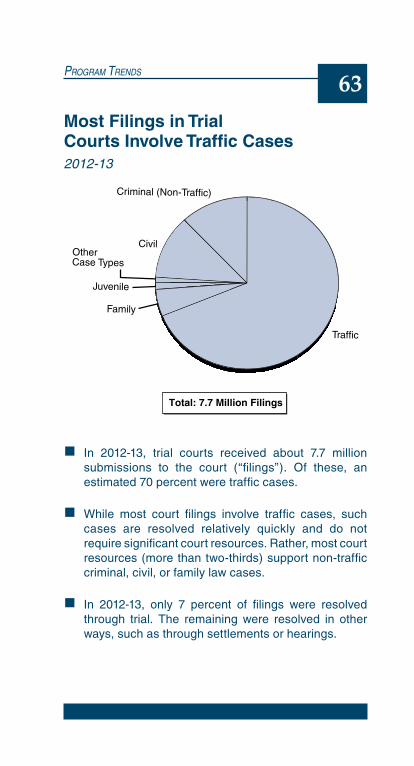
Most Filings in Trial Courts Involve Traffic Cases2012-13
In 2012-13, trial courts received about 7.7 million submissions to the court (“filings”). Of these, an estimated 70 percent were traffic cases.
While most court filings involve traffic cases, such cases are resolved relatively quickly and do not require significant court resources. Rather, most court resources (more than two-thirds) support non-traffic criminal, civil, or family law cases.
In 2012-13, only 7 percent of filings were resolved through trial. The remaining were resolved in other ways, such as through settlements or hearings.
Criminal (Non-Traffic)
Traffic
CivilOther Case Types
Juvenile
Family
Total: 7.7 Million Filings
ARTWORK # CF_140496
Graphic Sign Off
SecretaryAnalystMPADeputy
Template_CalFACTS.ait

Program Trends
64
Responsibility Areas for Wildland Fire Protection
The California Department of Forestry and Fire Protection (CalFire) has primary responsibility for wildland fire protection on more than 31 million acres of mostly privately owned lands, referred to as State Responsibility Areas (SRA). Local and federal agencies are responsible for the rest of the state.
Funding for SRA fire protection has generally been increasing, but it varies significantly each year depending on the number, severity, and location of wildfires.
State
Federal
Local
ARTWORK # CF_140496
Graphic Sign Off
SecretaryAnalystMPADeputy
Template_CalFACTS.ait

Program Trends
65
Groundwater Use Significantly Increases in Dry Years(Millions of Acre-Feet Per Year)
Water supplies for drinking, irrigation, and industrial uses in California mainly come from surface water and water available underground (referred to as “groundwater”). Groundwater is used significantly more in dry years, when less surface water is available. For example, groundwater use almost doubled in 2009 compared to 2005, while surface water use declined.
Groundwater use varies widely across different parts of the state. Over 70 percent of the state’s groundwater use occurs in the Central Valley.
Groundwater levels have dropped rapidly in recent years and reached historic lows in many parts of the state due to drought. This groundwater depletion can cause several problems—wells that run dry, subsidence (sinking land), damage to infrastructure, groundwater contamination, and permanent loss of groundwater storage.
5
10
15
20
25
30
Wet Year Average Year Dry Year
Surface WaterGroundwater
ARTWORK # CF_140496
Graphic Sign Off
SecretaryAnalystMPADeputy
Template_CalFACTS.ait
Program Trends
66
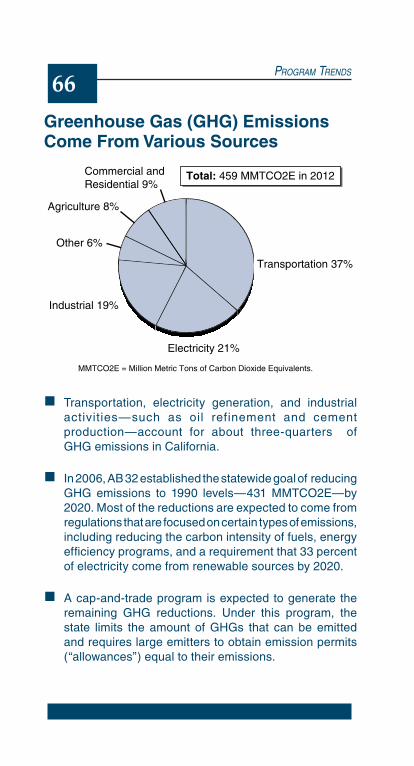
Greenhouse Gas (GHG) Emissions Come From Various Sources
Transportation, electricity generation, and industrial activities—such as oil refinement and cement production—account for about three-quarters of GHG emissions in California.
In 2006, AB 32 established the statewide goal of reducing GHG emissions to 1990 levels—431 MMTCO2E—by 2020. Most of the reductions are expected to come from regulations that are focused on certain types of emissions, including reducing the carbon intensity of fuels, energy efficiency programs, and a requirement that 33 percent of electricity come from renewable sources by 2020.
A cap-and-trade program is expected to generate the remaining GHG reductions. Under this program, the state limits the amount of GHGs that can be emitted and requires large emitters to obtain emission permits (“allowances”) equal to their emissions.
Transportation 37%
Electricity 21%
Industrial 19%
Commercial and Residential 9%
Agriculture 8%
Other 6%
Total: 459 MMTCO2E in 2012
MMTCO2E = Million Metric Tons of Carbon Dioxide Equivalents.
ARTWORK # CF_140496
Graphic Sign Off
SecretaryAnalystMPADeputy
Template_CalFACTS.ait

Program Trends
67
Transportation Funding Comes From Multiple Sources2014-15
Total transportation funding in the state will be roughly $28 billion in 2014-15.
Local governments provide half of all transportation funding in California. Local transportation funding sources include local sales taxes, transit fares, development impact fees, and property taxes.
About one-fourth of the state’s transportation funding comes from the federal government, supported primarily by federal excise taxes on diesel and gasoline.
The remaining one-fourth of transportation funding comes from a variety of state revenue sources—primarily excise taxes on gasoline.
Local
Weight Fees
Gasoline Excise Tax
Diesel Sales & Excise Taxes
Cap-and-Trade Revenues
Federal
State
ARTWORK # CF_140496
Graphic Sign Off
SecretaryAnalystMPADeputy
Template_CalFACTS.ait
Program Trends
68
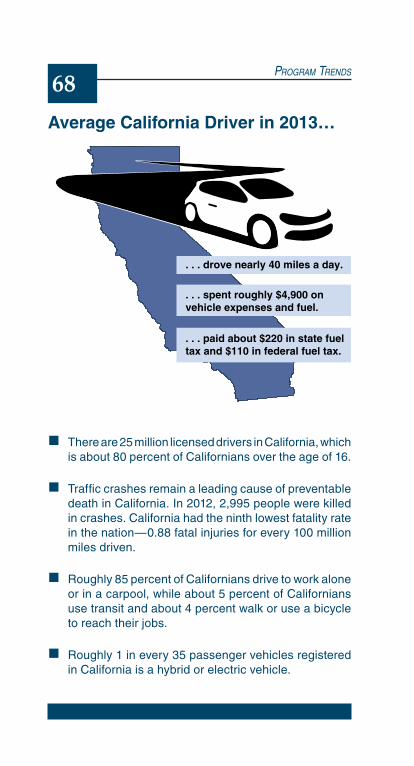
Average California Driver in 2013…
There are 25 million licensed drivers in California, which is about 80 percent of Californians over the age of 16.
Traffic crashes remain a leading cause of preventable death in California. In 2012, 2,995 people were killed in crashes. California had the ninth lowest fatality rate in the nation—0.88 fatal injuries for every 100 million miles driven.
Roughly 85 percent of Californians drive to work alone or in a carpool, while about 5 percent of Californians use transit and about 4 percent walk or use a bicycle to reach their jobs.
Roughly 1 in every 35 passenger vehicles registered in California is a hybrid or electric vehicle.
. . . drove nearly 40 miles a day.
. . . spent roughly $4,900 on vehicle expenses and fuel.
. . . paid about $220 in state fuel tax and $110 in federal fuel tax.
ARTWORK # CF_140496
Graphic Sign Off
SecretaryAnalystMPADeputy
Template_CalFACTS.ait

Program Trends
69
Most State Infrastructure Spending Is for Transportation and EducationInfrastructure Spending, 2003-04 to 2012-13
Over the past ten years, the state spent about $100 billion on infrastructure. More than 75 percent of this spending was for transportation projects and educational facilities (K-12 and higher education).
More than half of state infrastructure spending was for local infrastructure projects (such as local schools and roads) versus state projects (such as prisons and highways).
About two-thirds of the state’s infrastructure spending was financed using bonds. The remaining third of its infrastructure spending was paid up-front, almost all from special fund revenues, such as taxes on gas.
Transportation
K-12
Resources
Higher Education
Criminal Justice
Other
ARTWORK # CF_140496
Graphic Sign Off
SecretaryAnalystMPADeputy
Template_CalFACTS.ait
Program Trends
70
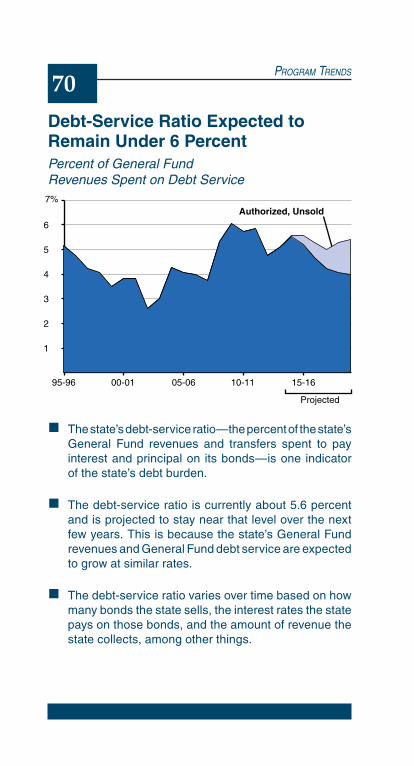
Debt-Service Ratio Expected to Remain Under 6 PercentPercent of General Fund Revenues Spent on Debt Service
The state’s debt-service ratio—the percent of the state’s General Fund revenues and transfers spent to pay interest and principal on its bonds—is one indicator of the state’s debt burden.
The debt-service ratio is currently about 5.6 percent and is projected to stay near that level over the next few years. This is because the state’s General Fund revenues and General Fund debt service are expected to grow at similar rates.
The debt-service ratio varies over time based on how many bonds the state sells, the interest rates the state pays on those bonds, and the amount of revenue the state collects, among other things.
Bonds Already Sold
1
2
3
4
5
6
7%
95-96 00-01 05-06 10-11 15-16
Projected
Authorized, Unsold
ARTWORK # CF_140496
Graphic Sign Off
SecretaryAnalystMPADeputy
Template_CalFACTS.ait
Program Trends
71
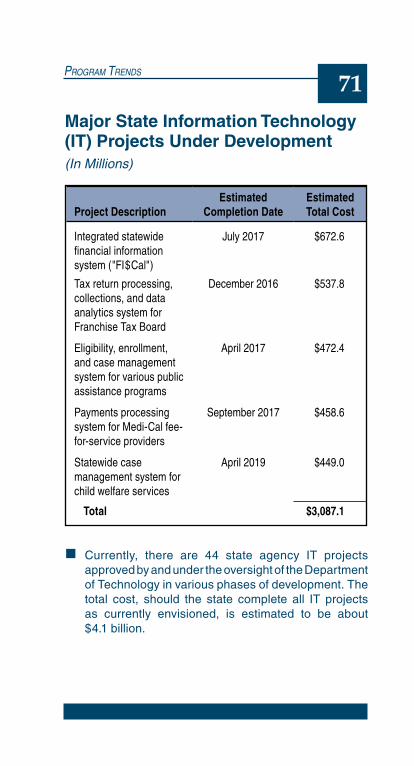
Major State Information Technology (IT) Projects Under Development(In Millions)
Currently, there are 44 state agency IT projects approved by and under the oversight of the Department of Technology in various phases of development. The total cost, should the state complete all IT projects as currently envisioned, is estimated to be about $4.1 billion.
Project DescriptionEstimated
Completion Date Estimated Total Cost
Integrated statewide financial information system ("FI$Cal")
July 2017 $672.6
Tax return processing, collections, and data analytics system for Franchise Tax Board
December 2016 $537.8
Eligibility, enrollment, and case management system for various public assistance programs
April 2017 $472.4
Payments processing system for Medi-Cal fee-for-service providers
September 2017 $458.6
Statewide case management system for child welfare services
April 2019 $449.0
Total $3,087.1

Program Trends
72
Gambling in California
CA LotteryAround 21,000 retailers All 58 counties$1.8 billion in revenue after winnings
Cardrooms89 cardrooms32 counties$850 million in revenue after winnings
Horse Racing38 temporary and permanent facilities19 counties$640 million in revenue after winnings
Charitable OrganizationsBingoCard night fundraisers
Tribal Gaming60 casinos26 counties$7 billion in revenue after winnings
ARTWORK # CF_140496
Graphic Sign Off
SecretaryAnalystMPADeputy
Template_CalFACTS.ait

WWW.LAO.CA.GOVAll LAO publications are posted on our website.
To be immediately notified when reports are released,
visit the site and click on Subscribe.
LAO PublicationsTo request publications call (916) 319-8317.
The LAO is located at 925 L Street, Suite 1000, Sacramento, CA 95814.
Related Documents