COMPREHENSIVE ANNUAL FINANCIAL REPORT Comprehensive Annual Financial Report for the Fiscal Year Ended September 30, 2016 St. Lucie County, Florida

Welcome message from author
This document is posted to help you gain knowledge. Please leave a comment to let me know what you think about it! Share it to your friends and learn new things together.
Transcript
COMPREHENSIVEANNUAL FINANCIAL REPORT
Comprehensive Annual Financial Report for the Fiscal Year Ended
September 30, 2016
St. Lucie County, Florida
ST. LUCIE COUNTY, FLORIDA
COMPREHENSIVE ANNUAL FINANCIAL REPORT FOR THE FISCAL YEAR ENDED SEPTEMBER 30, 2016
The Honorable Joseph E. Smith Clerk of the Circuit Court
Prepared By Clerk of the Circuit Court, Financial Operations Department
Shai Francis, CPA, CGFO, CGMA Chief Operating Officer of Financial Services

THIS PAGE INTENTIONALLY LEFT BLANK
i
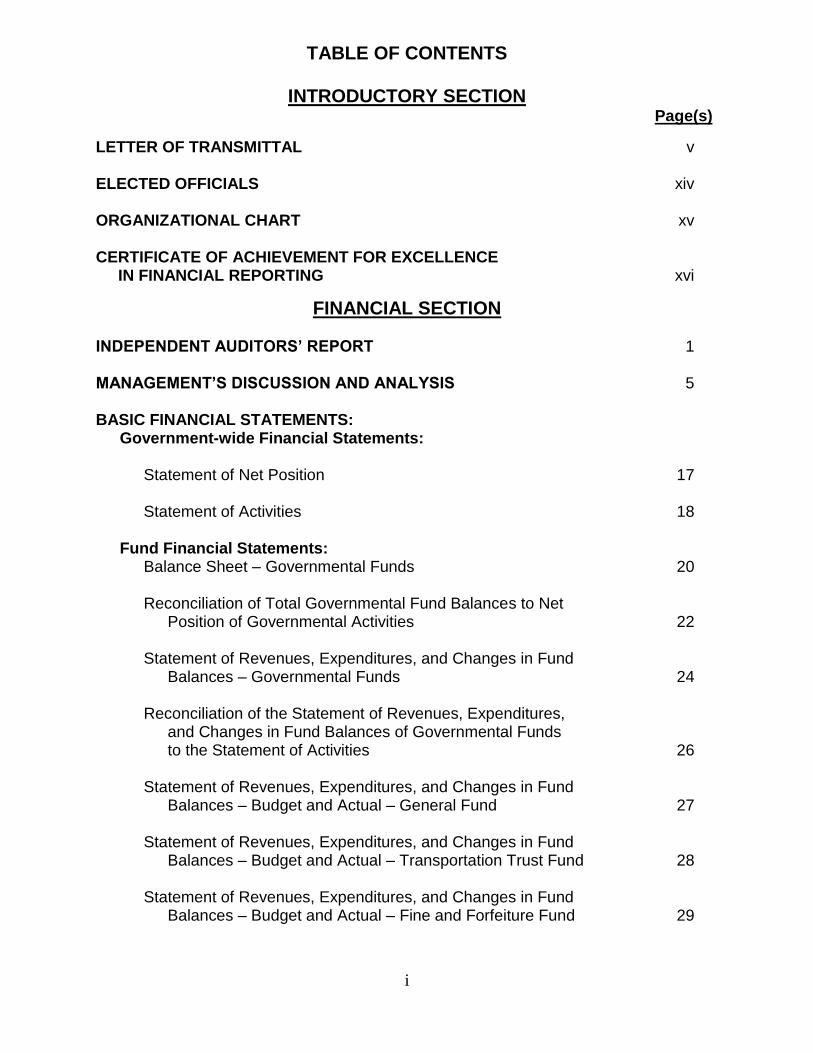
TABLE OF CONTENTS
INTRODUCTORY SECTION
Page(s) LETTER OF TRANSMITTAL v ELECTED OFFICIALS xiv ORGANIZATIONAL CHART xv CERTIFICATE OF ACHIEVEMENT FOR EXCELLENCE IN FINANCIAL REPORTING xvi
FINANCIAL SECTION INDEPENDENT AUDITORS’ REPORT 1 MANAGEMENT’S DISCUSSION AND ANALYSIS 5 BASIC FINANCIAL STATEMENTS:
Government-wide Financial Statements: Statement of Net Position 17 Statement of Activities 18
Fund Financial Statements: Balance Sheet – Governmental Funds 20 Reconciliation of Total Governmental Fund Balances to Net Position of Governmental Activities 22 Statement of Revenues, Expenditures, and Changes in Fund Balances – Governmental Funds 24 Reconciliation of the Statement of Revenues, Expenditures, and Changes in Fund Balances of Governmental Funds to the Statement of Activities 26 Statement of Revenues, Expenditures, and Changes in Fund Balances – Budget and Actual – General Fund 27 Statement of Revenues, Expenditures, and Changes in Fund Balances – Budget and Actual – Transportation Trust Fund 28 Statement of Revenues, Expenditures, and Changes in Fund Balances – Budget and Actual – Fine and Forfeiture Fund 29
ii
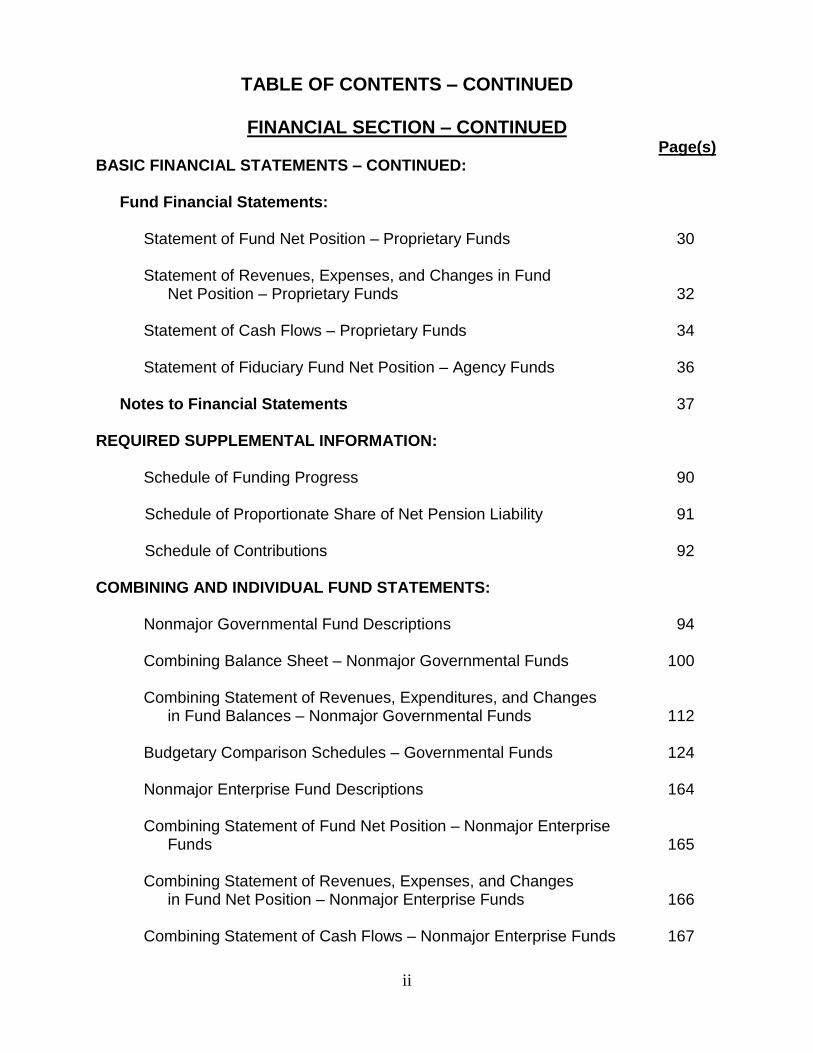
TABLE OF CONTENTS – CONTINUED
FINANCIAL SECTION – CONTINUED Page(s) BASIC FINANCIAL STATEMENTS – CONTINUED:
Fund Financial Statements: Statement of Fund Net Position – Proprietary Funds 30 Statement of Revenues, Expenses, and Changes in Fund Net Position – Proprietary Funds 32 Statement of Cash Flows – Proprietary Funds 34 Statement of Fiduciary Fund Net Position – Agency Funds 36
Notes to Financial Statements 37 REQUIRED SUPPLEMENTAL INFORMATION: Schedule of Funding Progress 90 Schedule of Proportionate Share of Net Pension Liability 91 Schedule of Contributions 92 COMBINING AND INDIVIDUAL FUND STATEMENTS: Nonmajor Governmental Fund Descriptions 94 Combining Balance Sheet – Nonmajor Governmental Funds 100 Combining Statement of Revenues, Expenditures, and Changes in Fund Balances – Nonmajor Governmental Funds 112 Budgetary Comparison Schedules – Governmental Funds 124
Nonmajor Enterprise Fund Descriptions 164 Combining Statement of Fund Net Position – Nonmajor Enterprise Funds 165 Combining Statement of Revenues, Expenses, and Changes in Fund Net Position – Nonmajor Enterprise Funds 166 Combining Statement of Cash Flows – Nonmajor Enterprise Funds 167
iii
TABLE OF CONTENTS – CONTINUED
FINANCIAL SECTION – CONTINUED Page(s) Combining Statement of Changes in Assets and Liabilities – 169 Agency Funds
STATISTICAL SECTION Schedule 1 Net Position by Component – Last Ten Fiscal Years 172 Schedule 2 Changes in Net Position – Last Ten Fiscal Years 174 Schedule 3 Fund Balances, Governmental Funds – Last Ten Fiscal Years 178 Schedule 4 Changes in Fund Balances, Governmental Funds – Last Ten Fiscal Years 180 Schedule 5 Tax Revenues by Source, Governmental Funds – Last Ten Fiscal Years 182 Schedule 6 Assessed Valuation and Estimated Actual Values of Taxable Property – Last Ten Fiscal Years 184 Schedule 7 Direct and Overlapping Property Tax Rates – Last Ten Fiscal Years 186
Schedule 8 Principal Property Taxpayers – Current Year and Nine Years Ago 188 Schedule 9 Property Tax Levies and Collections – Last Ten Fiscal Years 189 Schedule 10 Computation of Legal Debt Margin – September 30, 2015 190 Schedule 11 Ratios of Outstanding Debt by Type – Last Ten Fiscal Years 192 Schedule 12 Ratios of Net General Bonded Debt – Last Ten Fiscal Years 194 Schedule 13 Direct and Overlapping Governmental Activities Debt – September 30, 2016 195 Schedule 14 Pledged-Revenue Coverage – Last Ten Fiscal Years 196 Schedule 15 Demographic and Economic Statistics – Last Ten Years 200
iv
TABLE OF CONTENTS – CONTINUED
STATISTICAL SECTION - CONTINUED Page(s) Schedule 16 Principal Employers – Current Year and Nine Years Ago 201 Schedule 17 Full-time Equivalent County Government Employees by Function/Program – Last Ten Fiscal Years 202 Schedule 18 Operating Indicators by Function/Program – Last Ten Fiscal Years 204 Schedule 19 Capital Asset Statistics by Function/Program – Last Ten Fiscal Years 214
COMPLIANCE SECTION
FEDERAL AND STATE GRANTS: Independent Auditor’s Report on Internal Control over Financial
Reporting and on Compliance and other Matters based on an Audit of Financial Statements Performed in Accordance with Government Auditing Standards 217
Independent Auditor’s Report on Compliance for each Major
Federal Program and Report on Internal Control over Compliance required by Uniform Guidance and Chapter 10.550 Rules of the Auditor General 219
Schedule of Expenditures of Federal Awards and State Projects 222
Notes to Schedule of Expenditures of Federal Awards and State
Projects 227
Schedule of Findings and Questioned Cost – Federal Awards and State Projects 229
xiv
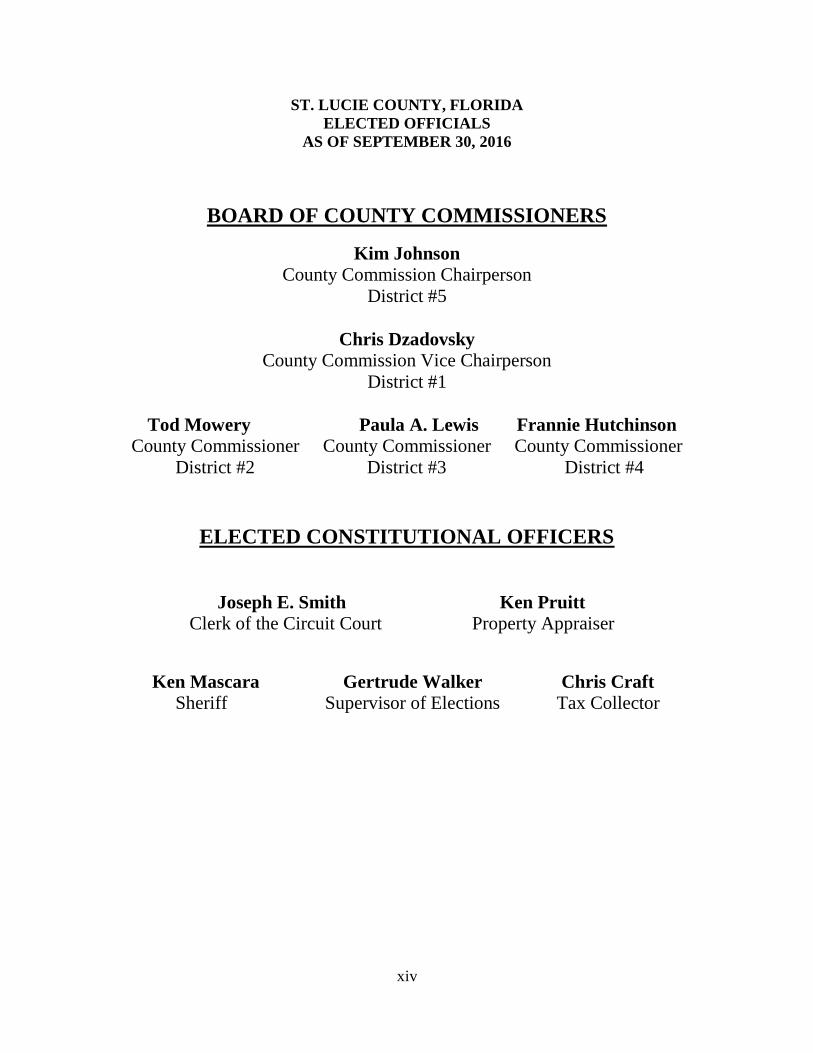
ST. LUCIE COUNTY, FLORIDA
ELECTED OFFICIALS
AS OF SEPTEMBER 30, 2016
BOARD OF COUNTY COMMISSIONERS
Kim Johnson
County Commission Chairperson
District #5
Chris Dzadovsky County Commission Vice Chairperson
District #1
Tod Mowery Paula A. Lewis Frannie Hutchinson
County Commissioner County Commissioner County Commissioner
District #2 District #3 District #4
ELECTED CONSTITUTIONAL OFFICERS
Joseph E. Smith Ken Pruitt
Clerk of the Circuit Court Property Appraiser
Ken Mascara Gertrude Walker Chris Craft
Sheriff Supervisor of Elections Tax Collector

THIS PAGE INTENTIONALLY LEFT BLANK
44
St. Lucie County, Florida
Management’s Discussion and Analysis
September 30, 2016
St. Lucie County’s (the “County”) discussion and analysis is designed to (a) assist the reader in focusing on significant
financial issues, (b) provide an overview of the County’s financial activity, (c) identify changes in the County’s financial
position, (d) identify any material deviations from the financial plan, and (e) identify individual fund issues or concerns.
Since the Management’s Discussion and Analysis (MD&A) is designed to focus on the current years activities, resulting
changes and currently known facts, please read it in conjunction with the Transmittal Letter (beginning on page v) and the
County’s financial statements (beginning on page 17).
HIGHLIGHTS
Financial Highlights
The assets of the County exceeded its liabilities at September 30, 2016 by $613.7 million (net position). None of
this amount may be used to meet the government’s ongoing obligations to citizens and creditors. This is the result
of increase in net pension liability.
The County’s total net position decreased by $6.1 million. The decrease is attributed to the increase in net pension
liability.
At September 30, 2016, the County’s governmental funds reported a combined ending fund balance of $188.3
million, an increase of $4.7 million in comparison with the prior year.
The County had a $3.1 million decrease in unassigned fund balance in the general fund. The decrease is mainly
attributed to the increase in emergency reserve.
USING THIS ANNUAL REPORT
The annual report consists of a series of financial statements. The government-wide financial statements (on pages 17, 18
and 19) provide information about the activities of the County as a whole and present a longer-term view of the County’s
finances. Fund financial statements begin on page 20. For governmental funds, these statements tell how these services
were financed in the short term as well as what remains for future spending. For proprietary funds, these statements provide
the same type of information as the government-wide financial statements, only in more detail. The County uses an internal
service fund to account for the management of its self-insurance activities. Because the self-insurance fund predominantly
benefits governmental rather than business-type functions, it has been included within governmental activities in the
government-wide financial statements. Fund financial statements also report the County’s operations in more detail by
providing information about the County’s most significant funds. The remaining statements provide financial information
about activities for which the County acts solely as a trustee or agent for the benefit of those outside of the government.
Reporting the County as a Whole
Our analysis of the County as a whole begins on page 17. The Statement of Net Position and the Statement of Activities
report information about the County as a whole and about its activities in a way that helps to assess the County’s financial
health. These statements include all assets and liabilities using the accrual basis of accounting, which is similar to the
accounting used in most private-sector companies. All of the current year revenues and expenses are taken into account
regardless of when cash is received or paid.
5
St. Lucie County, Florida
Management’s Discussion and Analysis (continued)
September 30, 2016
These two statements report the County’s net position and the changes in net position. You can think of the County’s net
position – the difference between assets plus deferred outflows of resources and liabilities plus the deferred inflows of
resources – as one way to measure the County’s financial health, or financial position. Over time, increases or decreases
in the County’s net position may serve as a useful indicator of whether the financial position of the County is improving or
deteriorating. You will need to consider other nonfinancial factors, however, such as changes in the County’s property tax
base and the condition of the County’s roads, to assess the overall health of the County.
In the Statement of Net Position and the Statement of Activities, we divide the County into two kinds of activities:
Governmental activities – Most of the County’s basic services are reported here, including the public safety, public
works, parks and recreation, and general administration. Taxes, franchise taxes, charges for services, grants, and
interest earnings finance most of these activities.
Business-type activities – The County charges a fee to customers to help it cover all or most of the cost of certain
services it provides. The County’s Bailing & Recycling, Water and Sewer District, South Hutchinson Utilities,
Golf Course, and Building Code operations are reported here.
Fund Financial Statements
Our analysis of the County’s major funds begins on page 20. The fund financial statements provide detailed information
about the most significant funds – not the County as a whole. Some funds are required to be established by State law and
by bond covenants. However, the County establishes many other funds to help it control and manage money and to show
that it is meeting legal responsibilities for using certain taxes, grants, and other monies such as fines and forfeitures.
Governmental Funds
Most of the County’s basic services are reported in governmental funds, which focus on how money flows into and out of
those funds and the balances left at year-end that are available for spending. Those funds are reported using an accounting
method called modified accrual, which measures cash and all other financial assets that can readily be converted to cash.
The governmental fund statements provide a detailed short-term view of the County’s general government operations and
the basic services it provides. Governmental fund information helps you determine whether there are more or fewer
financial resources that can be spent in the near future to finance the County’s programs. We describe the relationship (or
differences) between governmental activities (reported in the Statement of Net Position and the Statement of Activities) and
governmental funds in reconciliations presented on page 22 and page 26.
The County maintains fifty-nine individual governmental funds. Information is presented separately in the governmental
fund balance sheet and in the governmental fund statement of revenues, expenditures, and changes in fund balances for the
General Fund, Transportation Trust Fund, Fine and Forfeiture Fund, SHI Special Assessment Bond Fund, North Lennard
Road Bonds I&S Fund and Impact Fee Fund, all of which are considered to be major funds. Data from the other fifty-three
governmental funds are combined into a single, aggregated presentation as “other governmental funds”. Individual fund
data for each nonmajor governmental fund is provided in the form of combining statements and begins on page 100.
Annual budgets are adopted for all governmental funds. The budgetary comparison statements have been provided for all
governmental funds to demonstrate compliance with the budget.
The basic governmental fund financial statements can be found on pages 20-29 of this report.
6
St. Lucie County, Florida
Management’s Discussion and Analysis (continued)
September 30, 2016
Proprietary Funds
When the County charges customers for the services it provides – whether to outside customers or to other units of the
County – these services are generally reported in proprietary funds. The County maintains two different types of proprietary
funds. Enterprise funds are used to report the same functions presented as business-type activities in the government-wide
financial statements. The County uses enterprise funds to account for its Bailing & Recycling, Golf Course, Water & Sewer
and Building Code operations. The Internal Service Fund is an accounting device used to accumulate and allocate costs
internally among the County’s various functions. The County uses its Internal Service Fund to account for its insurance
programs. Because these insurance programs predominantly benefit governmental functions, it has been included within
governmental activities in the government-wide financial statements. Proprietary funds provide the same type of information
as the government-wide financial statements, only in more detail.
The basic proprietary fund financial statements can be found on pages 30 to 35 of this report.
Fiduciary Funds
The County holds deposits for various individuals and businesses for contract performance that are then returned when the
contract has been completed. The County also holds deposits for special assessment debt which the County is not obligated
to repay. These deposits are accounted for in an Agency fund, where assets equal liabilities. The basic fiduciary fund
financial statement can be found on page 36 of this report.
Notes to Financial Statements
The notes provide additional information that is essential to a full understanding of the data provided in the government-
wide and fund financial statements. The notes to financial statements can be found on pages 38 to 88 of this report.
Required Supplementary information
In addition to the basic financial statements and accompanying notes, this report also presents certain required
supplementary information highlighting the schedule of funding progress for other postemployment benefits, the County’s
Proportionate Share of Net Pension Liability and the County’s statutorily required contributions. The required
supplementary information can be found on page 90 to 92 of this report.
THE COUNTY AS A WHOLE
Financial Analysis of the County as a Whole
Over time, net position may serve as a useful indicator of a government’s financial position. As of September 30, 2016, the
assets and deferred outflows of resources exceeded liabilities and deferred inflows of resources by $613.7 million. Our
analysis focuses on net position (Table 1) and changes in net position (Table 2) of the County’s governmental and business-
type activities.
7
St. Lucie County, Florida
Management’s Discussion and Analysis (continued)
September 30, 2016
GOVERNMENT-WIDE STATEMENTS
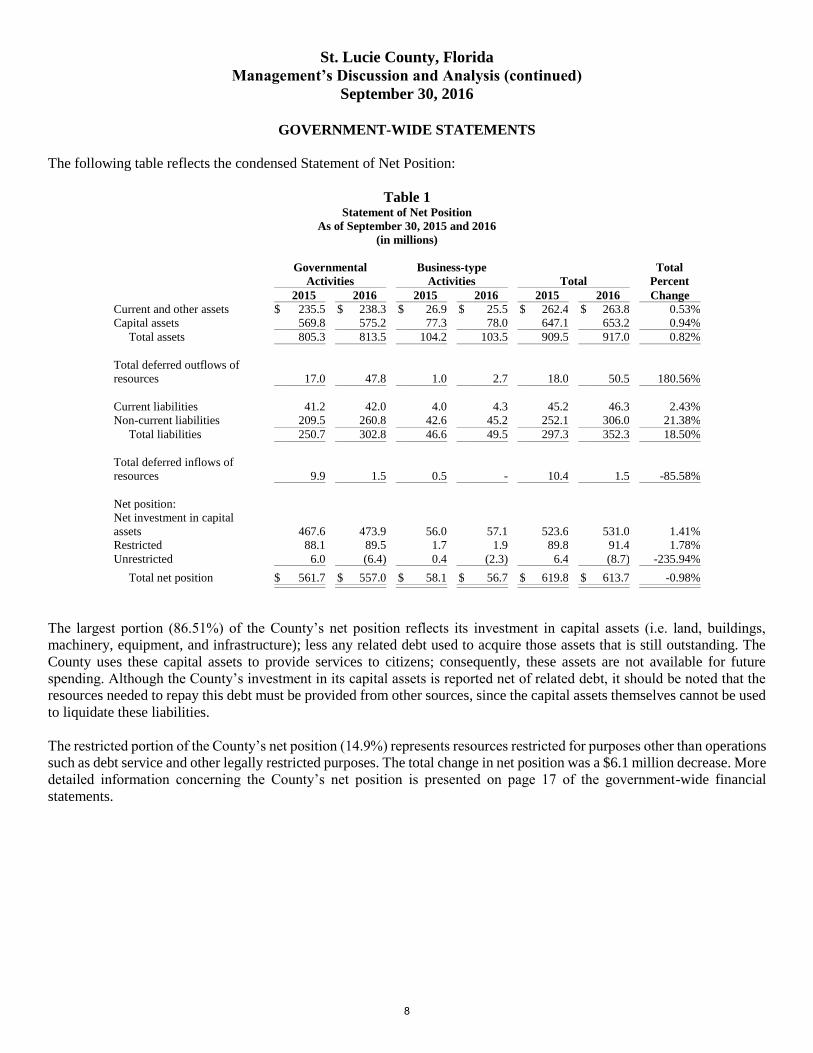
The following table reflects the condensed Statement of Net Position:
Table 1 Statement of Net Position
As of September 30, 2015 and 2016
(in millions)
Governmental
Activities
Business-type
Activities Total
Total
Percent
2015 2016 2015 2016 2015 2016 Change
Current and other assets $ 235.5 $ 238.3 $ 26.9 $ 25.5 $ 262.4 $ 263.8 0.53%
Capital assets 569.8 575.2 77.3 78.0 647.1 653.2 0.94%
Total assets 805.3 813.5 104.2 103.5 909.5 917.0 0.82%
Total deferred outflows of
resources 17.0 47.8 1.0 2.7 18.0 50.5 180.56%
Current liabilities 41.2 42.0 4.0 4.3 45.2 46.3 2.43%
Non-current liabilities 209.5 260.8 42.6 45.2 252.1 306.0 21.38%
Total liabilities 250.7 302.8 46.6 49.5 297.3 352.3 18.50%
Total deferred inflows of
resources 9.9 1.5 0.5 - 10.4 1.5 -85.58%
Net position:
Net investment in capital
assets 467.6 473.9 56.0 57.1 523.6 531.0 1.41%
Restricted 88.1 89.5 1.7 1.9 89.8 91.4 1.78%
Unrestricted 6.0 (6.4) 0.4 (2.3) 6.4 (8.7) -235.94%
Total net position $ 561.7 $ 557.0 $ 58.1 $ 56.7 $ 619.8 $ 613.7 -0.98%
The largest portion (86.51%) of the County’s net position reflects its investment in capital assets (i.e. land, buildings,
machinery, equipment, and infrastructure); less any related debt used to acquire those assets that is still outstanding. The
County uses these capital assets to provide services to citizens; consequently, these assets are not available for future
spending. Although the County’s investment in its capital assets is reported net of related debt, it should be noted that the
resources needed to repay this debt must be provided from other sources, since the capital assets themselves cannot be used
to liquidate these liabilities.
The restricted portion of the County’s net position (14.9%) represents resources restricted for purposes other than operations
such as debt service and other legally restricted purposes. The total change in net position was a $6.1 million decrease. More
detailed information concerning the County’s net position is presented on page 17 of the government-wide financial
statements.
8
St. Lucie County, Florida
Management’s Discussion and Analysis (continued)
September 30, 2016
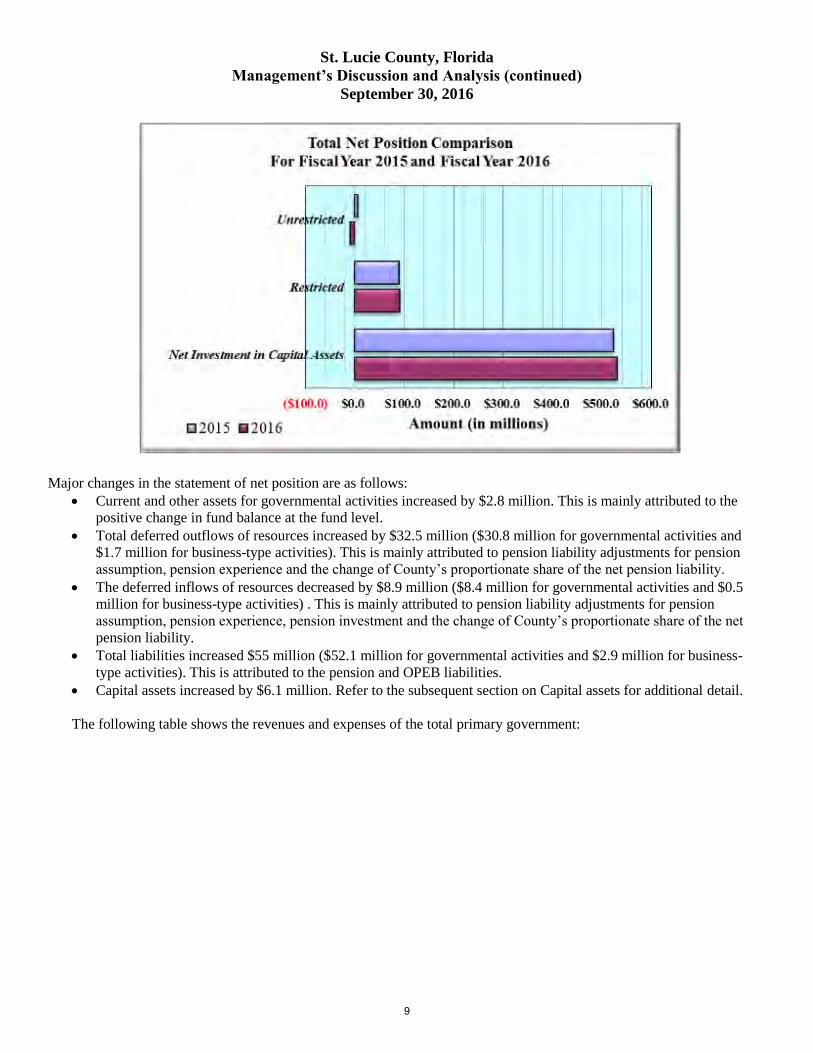
Major changes in the statement of net position are as follows:
Current and other assets for governmental activities increased by $2.8 million. This is mainly attributed to the
positive change in fund balance at the fund level.
Total deferred outflows of resources increased by $32.5 million ($30.8 million for governmental activities and
$1.7 million for business-type activities). This is mainly attributed to pension liability adjustments for pension
assumption, pension experience and the change of County’s proportionate share of the net pension liability.
The deferred inflows of resources decreased by $8.9 million ($8.4 million for governmental activities and $0.5
million for business-type activities) . This is mainly attributed to pension liability adjustments for pension
assumption, pension experience, pension investment and the change of County’s proportionate share of the net
pension liability.
Total liabilities increased $55 million ($52.1 million for governmental activities and $2.9 million for business-
type activities). This is attributed to the pension and OPEB liabilities.
Capital assets increased by $6.1 million. Refer to the subsequent section on Capital assets for additional detail.
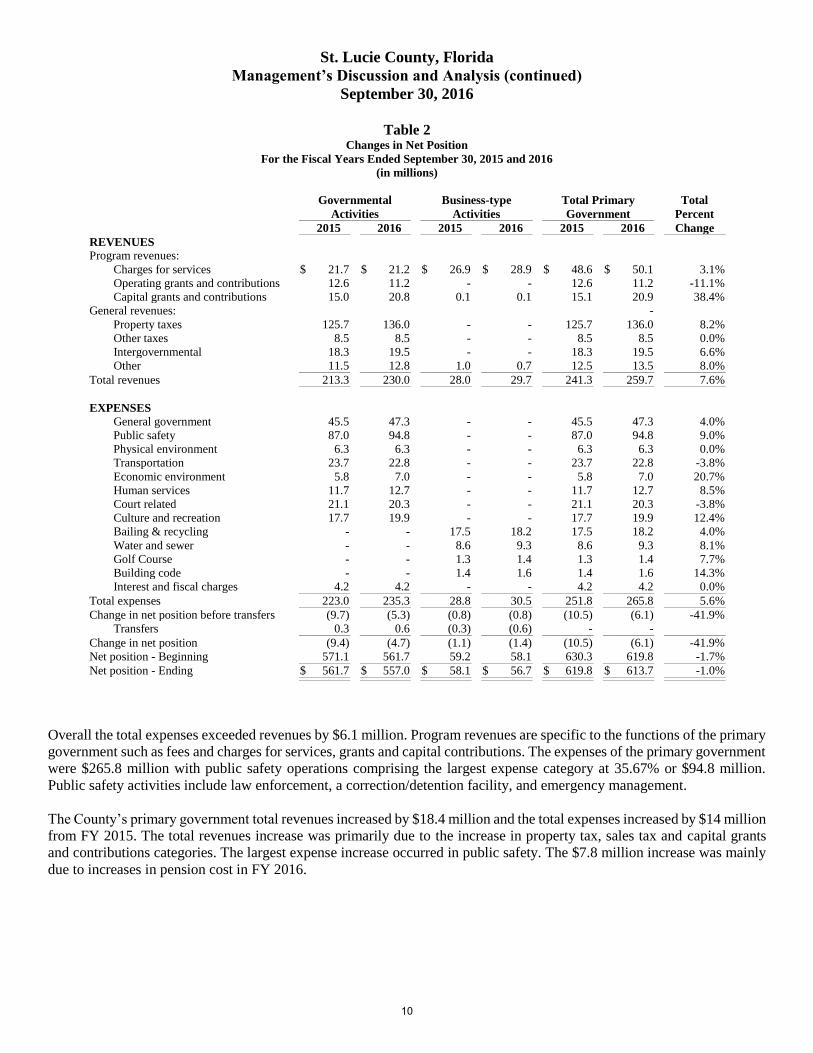
The following table shows the revenues and expenses of the total primary government:
9
St. Lucie County, Florida
Management’s Discussion and Analysis (continued)
September 30, 2016
Table 2 Changes in Net Position
For the Fiscal Years Ended September 30, 2015 and 2016
(in millions)
Governmental
Activities
Business-type
Activities
Total Primary
Government
Total
Percent
2015 2016 2015 2016 2015 2016 Change
REVENUES
Program revenues:
Charges for services $ 21.7 $ 21.2 $ 26.9 $ 28.9 $ 48.6 $ 50.1 3.1%
Operating grants and contributions 12.6 11.2 - - 12.6 11.2 -11.1%
Capital grants and contributions 15.0 20.8 0.1 0.1 15.1 20.9 38.4%
General revenues: -
Property taxes 125.7 136.0 - - 125.7 136.0 8.2%
Other taxes 8.5 8.5 - - 8.5 8.5 0.0%
Intergovernmental 18.3 19.5 - - 18.3 19.5 6.6%
Other 11.5 12.8 1.0 0.7 12.5 13.5 8.0%
Total revenues 213.3 230.0 28.0 29.7 241.3 259.7 7.6%
EXPENSES
General government 45.5 47.3 - - 45.5 47.3 4.0%
Public safety 87.0 94.8 - - 87.0 94.8 9.0%
Physical environment 6.3 6.3 - - 6.3 6.3 0.0%
Transportation 23.7 22.8 - - 23.7 22.8 -3.8%
Economic environment 5.8 7.0 - - 5.8 7.0 20.7%
Human services 11.7 12.7 - - 11.7 12.7 8.5%
Court related 21.1 20.3 - - 21.1 20.3 -3.8%
Culture and recreation 17.7 19.9 - - 17.7 19.9 12.4%
Bailing & recycling - - 17.5 18.2 17.5 18.2 4.0%
Water and sewer - - 8.6 9.3 8.6 9.3 8.1%
Golf Course - - 1.3 1.4 1.3 1.4 7.7%
Building code - - 1.4 1.6 1.4 1.6 14.3%
Interest and fiscal charges 4.2 4.2 - - 4.2 4.2 0.0%
Total expenses 223.0 235.3 28.8 30.5 251.8 265.8 5.6%
Change in net position before transfers (9.7) (5.3) (0.8) (0.8) (10.5) (6.1) -41.9%
Transfers 0.3 0.6 (0.3) (0.6) - -
Change in net position (9.4) (4.7) (1.1) (1.4) (10.5) (6.1) -41.9%
Net position - Beginning 571.1 561.7 59.2 58.1 630.3 619.8 -1.7%
Net position - Ending $ 561.7 $ 557.0 $ 58.1 $ 56.7 $ 619.8 $ 613.7 -1.0%
Overall the total expenses exceeded revenues by $6.1 million. Program revenues are specific to the functions of the primary
government such as fees and charges for services, grants and capital contributions. The expenses of the primary government
were $265.8 million with public safety operations comprising the largest expense category at 35.67% or $94.8 million.
Public safety activities include law enforcement, a correction/detention facility, and emergency management.
The County’s primary government total revenues increased by $18.4 million and the total expenses increased by $14 million
from FY 2015. The total revenues increase was primarily due to the increase in property tax, sales tax and capital grants
and contributions categories. The largest expense increase occurred in public safety. The $7.8 million increase was mainly
due to increases in pension cost in FY 2016.
10
St. Lucie County, Florida
Management’s Discussion and Analysis (continued)
September 30, 2016
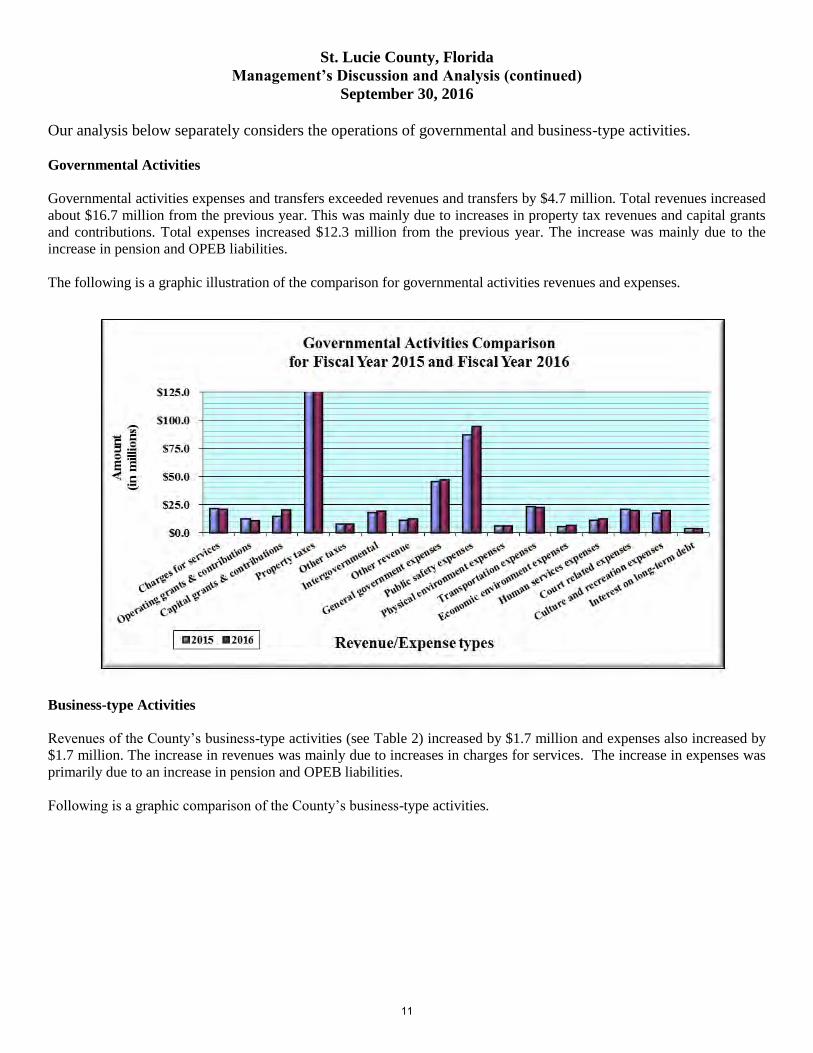
Our analysis below separately considers the operations of governmental and business-type activities.
Governmental Activities
Governmental activities expenses and transfers exceeded revenues and transfers by $4.7 million. Total revenues increased
about $16.7 million from the previous year. This was mainly due to increases in property tax revenues and capital grants
and contributions. Total expenses increased $12.3 million from the previous year. The increase was mainly due to the
increase in pension and OPEB liabilities.
The following is a graphic illustration of the comparison for governmental activities revenues and expenses.
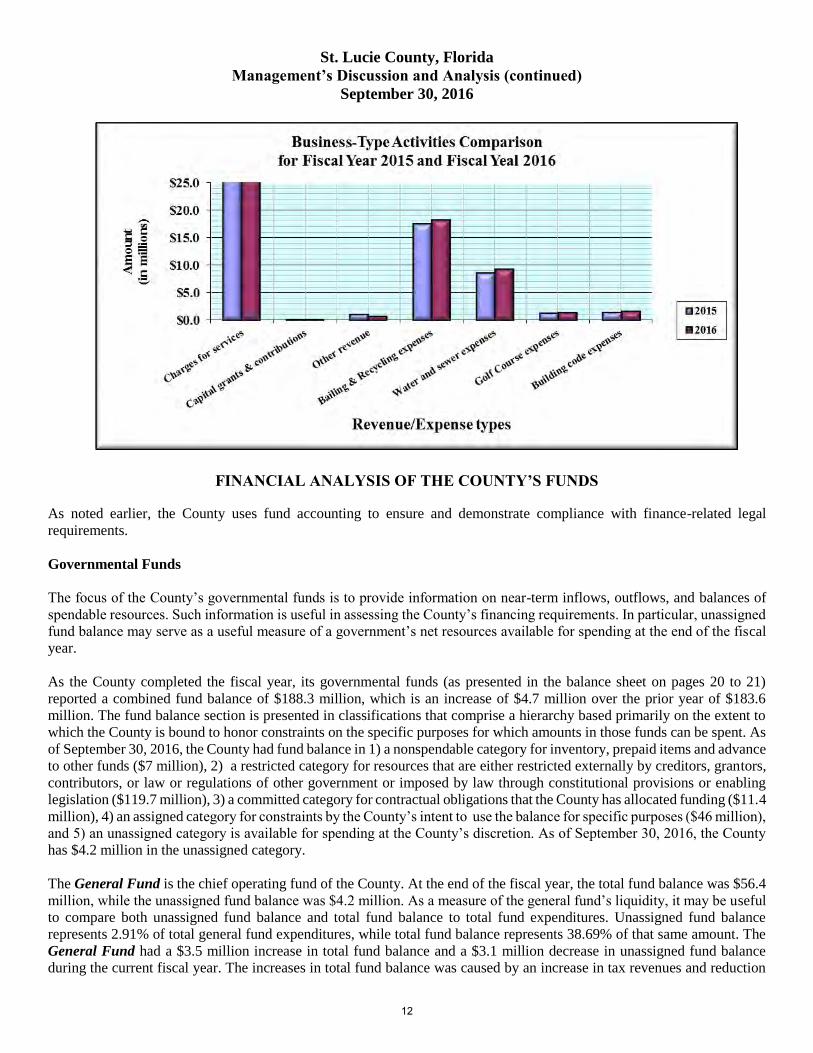
Business-type Activities
Revenues of the County’s business-type activities (see Table 2) increased by $1.7 million and expenses also increased by
$1.7 million. The increase in revenues was mainly due to increases in charges for services. The increase in expenses was
primarily due to an increase in pension and OPEB liabilities.
Following is a graphic comparison of the County’s business-type activities.
11
St. Lucie County, Florida
Management’s Discussion and Analysis (continued)
September 30, 2016
FINANCIAL ANALYSIS OF THE COUNTY’S FUNDS
As noted earlier, the County uses fund accounting to ensure and demonstrate compliance with finance-related legal
requirements.
Governmental Funds
The focus of the County’s governmental funds is to provide information on near-term inflows, outflows, and balances of
spendable resources. Such information is useful in assessing the County’s financing requirements. In particular, unassigned
fund balance may serve as a useful measure of a government’s net resources available for spending at the end of the fiscal
year.
As the County completed the fiscal year, its governmental funds (as presented in the balance sheet on pages 20 to 21)
reported a combined fund balance of $188.3 million, which is an increase of $4.7 million over the prior year of $183.6
million. The fund balance section is presented in classifications that comprise a hierarchy based primarily on the extent to
which the County is bound to honor constraints on the specific purposes for which amounts in those funds can be spent. As
of September 30, 2016, the County had fund balance in 1) a nonspendable category for inventory, prepaid items and advance
to other funds ($7 million), 2) a restricted category for resources that are either restricted externally by creditors, grantors,
contributors, or law or regulations of other government or imposed by law through constitutional provisions or enabling
legislation ($119.7 million), 3) a committed category for contractual obligations that the County has allocated funding ($11.4
million), 4) an assigned category for constraints by the County’s intent to use the balance for specific purposes ($46 million),
and 5) an unassigned category is available for spending at the County’s discretion. As of September 30, 2016, the County
has $4.2 million in the unassigned category.
The General Fund is the chief operating fund of the County. At the end of the fiscal year, the total fund balance was $56.4
million, while the unassigned fund balance was $4.2 million. As a measure of the general fund’s liquidity, it may be useful
to compare both unassigned fund balance and total fund balance to total fund expenditures. Unassigned fund balance
represents 2.91% of total general fund expenditures, while total fund balance represents 38.69% of that same amount. The
General Fund had a $3.5 million increase in total fund balance and a $3.1 million decrease in unassigned fund balance
during the current fiscal year. The increases in total fund balance was caused by an increase in tax revenues and reduction
12
St. Lucie County, Florida
Management’s Discussion and Analysis (continued)
September 30, 2016
in interfund transfers out. The decrease in unassigned fund balance was caused by an increase in the amount assigned for
emergency reserve.
The Transportation Trust Fund fund balance reflects a $0.6 million decrease from the prior fiscal year. The total fund
balance was $8.7 million, of which, $0.3 million is nonspendable and $8.4 million is restricted. The decrease of the total
fund balance from the prior year is mainly due to an increase in road maintenance expenditures.
The Fine and Forfeiture Fund fund balance reflects a $6.8 million decrease from the prior fiscal year. The total fund
balance was $14.9 million, all of which is restricted for the law enforcement and court related functions. The decrease of
the total fund balance from the prior year is due to the increases in operating expenditures and interfund transfers out.
The SHI Special Assessment Bond Fund accounts for the special assessment revenues pledged to pay the South Hutchinson
Island 1998 special assessment debt. The total fund balance was $2.2 million, all of which is restricted for debt service. The
total fund balance reflects a $0.6 million increase from the prior fiscal year. The increase is due to no early bond calls in
fiscal year 2016.
The N. Lennard Road Bonds I&S Fund accounts for the special assessment revenues pledged to pay the N. Lennard Road
Phase I, II, and III special assessment debts. It has a total fund balance of $2.2 million, all of which is restricted for debt
service. The total fund balance reflects a $0.16 million increase from the prior fiscal year. The increase reflects the
elimination of administrative charges from the general fund.
The Impact Fee Fund accounts for the impact fees used for parks, libraries, public buildings and correctional facilities. It
has a total fund balance of $26 million, most of which is restricted for capital projects. The total fund balance reflects a $1.3
million increase from the prior fiscal year. The increase is due to an increase in impact fees collections.
Proprietary Funds
The County’s proprietary funds provide the same type of information found in the government-wide financial statements,
but in more detail.
The total net position of the Bailing & Recycling Facility Fund at the end of the fiscal year totaled $27.5 million, while the
total unrestricted net position was negative $6.9 million. Compared to the prior year, the total net position had a decrease of
$1.1 million while the unrestricted net position had a decrease of $3.3 million. This is mainly due to the recognition of the
net pension liability.
The total net position of the Golf Course Fund at the end of the fiscal year totaled a negative $5 million. Compared to the
prior year, the net position had a slight decrease of $58,855. This is attributed to the recognition of the net pension liability.
The total net position of the Water and Sewer District Fund at the end of the fiscal year totaled $17.9 million, while the
unrestricted net position amounted to $3.1 million. In comparison to the prior year, the total net position had a decrease of
$519,578. This is attributed to the recognition of the net pension liability.
Other factors concerning the finances of these funds have already been addressed in the discussion of the County’s business-
type activities.
13
St. Lucie County, Florida
Management’s Discussion and Analysis (continued)
September 30, 2016
General Fund Budgetary Highlights
Variance between Original Budget and Final Budget
The General Fund includes activities of the Board of County Commissioners as well as all of the Constitutional
Offices. After the original budget is approved, it may be revised for a variety of reasons such as unforeseen circumstances,
corrections of errors, new bond or loan proceeds, new grant awards, and other revenues. During fiscal year 2016, the budget
for the general fund was amended from its original budget; which consists of total expenditures, transfers out, and ending
fund balance; of $197.4 million to its final budget of $202.2 million.
The original budget for revenue and other financing sources; which consists of total revenues, transfers in, lease purchase
proceeds, and proceeds from the sale of capital assets; was $154.6 million. Throughout the year, changes were made that
increased the total revenues by $1.5 million to $156.1 million.
The budget for expenditures and financing uses was originally adopted at $159.8 million. The final budget was $164.5
million, which was a $4.7 million increase. The final budget for the General Fund’s beginning fund balance increased by
$3.2 million compared to the original budget.
Variance Between Final Budget and Actual
The actual revenue and other financing sources came in under the final budget by $0.4 million primarily due to
intergovernmental revenues coming in under the budgeted amount. Timing of grant revenues caused the intergovernmental
revenue variance. Many of the grants the County received were paid on a reimbursement basis. Because not all of the grant
projects had been completed by year-end, the associated revenues were not received during the fiscal year. It is anticipated
that these grant revenues will be received in future periods.
The actual expenditures and other financing uses came in under the final budget by $12.3 million. General government
expenditures came in $4.4 million below the final budget. This was due to the timing of the Veterans’ Nursing Home
project, funds being carried into fiscal year 2017 related to All Aboard Florida, and variances in operating budgets. Public
Safety came in $3.1 million less than the final budget mostly due to the timing of inmate medical expenses. Economic
environment came in $1.5 million less than the final budget primarily due to the timing of grant projects and the County’s
job incentive program. Human Services came in $0.7 million less than the final budget. This was mainly due to the timing
of grant projects. Culture and Recreation came in $1.1 million less than the final budget. This was caused by variances in
operating budgets. Capital Outlay expenditures were $1.3 million less than the final budget primarily due to the timing of
capital projects.
Operating transfers out came in at the final budget level, while operating transfers in came in under the final budget by $1.5
million. The actual net change in fund balances was $3.5 million.
14
St. Lucie County, Florida
Management’s Discussion and Analysis (continued)
September 30, 2016
CAPITAL ASSET AND DEBT ADMINISTRATION
Capital Assets
At the end of fiscal year 2016, the County had $653.2 million invested in a broad range of capital assets, including land,
law enforcement and public works equipment, buildings, park facilities, roads, bridges, and stormwater drainage structures.
This amount represents a net increase (including additions and deductions) of $6.1 million, or 0.9%, over the prior year.
The following table illustrates the changes in capital assets. See pages 57 to 58 in the notes to financial statements for
detailed changes in capital assets.
Capital Assets
(net of depreciation, in millions)
Governmental
Activities Business-type Activities Total
Total
Percent
2015 2016 2015 2016 2015 2016 Change
Land $ 160.5 $ 161.1 $ 10.4 $ 10.4 $ 170.9 $ 171.5 0.4%
Buildings and improvements, net of
accumulated depreciation 365.8 355.3 58.1 55.5 423.9 410.8 -3.1%
Equipment, net of accumulated
depreciation 23.5 21.8 3.7 3.8 27.2 25.6 -5.9%
Construction in progress 20.0 37.0 5.1 8.3 25.1 45.3 80.5%
Total $ 569.8 $ 575.2 $ 77.3 $ 78.0 $ 647.1 $ 653.2 0.9%
Governmental activities had a major increase in the construction in progress category mainly due to the increase in planned
capital project expenditures for the Midway Road project and jail security system upgrade.
Business-type activities had a major increase in the construction in progress category mainly due to the recyclables
processing facility project.
Debt
On September 30, 2016, the County had $133.9 million in bonds, notes and capital leases outstanding versus $129.8 million
on September 30, 2015 – an increase of 3.14% – as shown in Table 4:
The increase in debt is the net result of the issuance of new debt and scheduled principal payments on long-term debt. See
pages 63 to 65 in the notes to financial statements for detailed changes in long-term debt.
Table 4
Governmental Business-type Total
Activities Activities Totals Percent
2015 2016 2015 2016 2015 2016 Change
General obligation debt $ 290,000 $ 20,000 $ - $ - $ 290,000 $ 20,000 -93.10%
Revenue bonds 60,320,000 56,960,000 - - 60,320,000 56,960,000 -5.57%
Revenue notes 41,026,115 40,357,751 - - 41,026,115 40,357,751 -1.63%
Special assessment bonds 6,739,690 6,588,054 - - 6,739,690 6,588,054 -2.25%
Capital leases 1,110,962 10,001,268 - - 1,110,962 10,001,268 800.23%
Water & sewer debt - - 20,295,000 19,925,000 20,295,000 19,925,000 -1.82%
Totals $ 109,486,767 $ 113,927,073 $ 20,295,000 $ 19,925,000 $ 129,781,767 $ 133,852,073 3.14%
15
St. Lucie County, Florida
Management’s Discussion and Analysis (continued)
September 30, 2016
Additional information on the County’s long-term debt can be found on pages 66 to 69 in the notes to financial statements.
ECONOMIC FACTORS AND NEXT YEAR’S BUDGETS AND RATES
The County’s elected officials considered many factors when setting the fiscal year 2017 budget, tax rates, and fees. One of
those factors is the economy. St. Lucie County’s local economy consists of services, tourism, agriculture, construction and
light manufacturing industries. Employment, income and housing are the three broad indicators that provides the best picture
of economic development.
In 2016, St Lucie County’s unemployment rate continued its post-recession decline, reaching 5.6%, significantly lower than
the 6.2% in previous year. Although these values are still far from the low unemployment rates of the pre-recession period,
this decline is consistent with the rest of the economy.
Personal income is another good indicator of the local economy. In 2015, St Lucie County personal income increased at a
rate of 6.6% compared to the State of Florida's 5.5%.
New construction in the unincorporated area decreased from 908 new homes in 2004 to 229 in 2016. In comparison to 2015,
the 2016 figure reflects a 64% increase. Total single family home sales decreased 1.6% from 5,404 in 2015 to 5,315 in
2016, while the State is experiencing a 0.9% increase. The median sale price for an existing single-family home in the area
was $180,000, which reflects an increase of 16.1% from 2015. The State median sale price reflects a 12.2% increase.
These indicators were taken into account when adopting the county’s budget for fiscal year 2017. The economic impacts
of the past few years have provided many challenges to the County. The County continues its aggressive assessment of
operations of its current and future fiscal position. The adopted budget was established on a combined total operating millage
rate of 7.7004 mills (one mill = $1 per $1,000 of assessed property value) to support the County’s operating budget and
dependent districts. The rate reflects a 0.4% decrease from the prior year. The utilization of reserves remains a budget
balancing factor for the general fund. Amounts available for appropriation in the Board of County Commissioners’ General
Fund budget in 2017 are $135.6 million, an increase of 4.03% from the original fiscal year 2016 budget of $130.3 million
and an increase of 0.28% from the final fiscal year 2016 budget of $135.2 million.
REQUEST FOR INFORMATION
This financial report is designed to provide our citizens, taxpayers, customers, investors and creditors with a general
overview of the County’s finances and to show the County’s accountability for the money it receives. If you have questions
about this report or need additional information, contact the County’s Finance Department, 2300 Virginia Avenue, Fort
Pierce, Florida 34982.
16
Governmental Business-type
Activities Activities Total
ASSETS
Current assets:
Cash and investments 211,368,596$ 23,979,112$ 235,347,708$
Restricted assets:
Cash and investments—customer deposits 1,319,559 439,160 1,758,719
Accounts receivable, net 1,364,789 1,658,837 3,023,626
Assessments receivable 9,874,471 - 9,874,471
Interest receivable 503,249 79,988 583,237
Due from other governments 6,750,962 36,715 6,787,677
Internal balances 6,087,904 (6,087,904) -
Inventories 543,363 211,334 754,697
Prepaid items 472,834 388 473,222
Total current assets 238,285,727 20,317,630 258,603,357
Non-current assets:
Restricted assets:
Cash and investments—landfill closure - 3,725,417 3,725,417
Cash and investments—renewal and replacement - 1,489,124 1,489,124
Capital assets, not being depreciated:
Land 161,078,116 10,356,397 171,434,513
Construction in progress 36,998,798 8,304,897 45,303,695
Capital assets, being depreciated:
Buildings and improvements 570,092,494 114,024,907 684,117,401
Machinery and equipment 88,122,533 13,234,513 101,357,046
Accumulated depreciation (281,060,083) (67,927,739) (348,987,822)
Total non-current assets 575,231,858 83,207,516 658,439,374
Total assets 813,517,585 103,525,146 917,042,731
DEFERRED OUTFLOWS OF RESOURCES
Deferred amount on refunding 3,014,212 298,682 3,312,894
Deferred outflows related to pension plan 44,759,404 2,366,378 47,125,782
Total deferred outflows of resources 47,773,616 2,665,060 50,438,676
LIABILITIES
Current liabilities:
Accounts payable 14,653,573 2,154,315 16,807,888
Matured bonds payable 4,633,386 370,000 5,003,386
Matured interest payable 1,439,330 478,175 1,917,505
Claims payable 659,238 - 659,238
Deposits payable from restricted assets 1,319,559 439,160 1,758,719
Accrued interest 515,030 - 515,030
Due to other governments 2,090,232 12,831 2,103,063
Bonds and notes payable - net 8,026,911 515,000 8,541,911
Special assessment debt - government commitment 360,934 - 360,934
Capital lease payable 1,019,823 - 1,019,823
Accrued compensated absences 6,980,599 272,351 7,252,950
Unearned revenues 309,127 10,267 319,394
Total current liabilities 42,007,742 4,252,099 46,259,841
Non-current liabilities:
Liabilities payable from restricted assets - 3,304,953 3,304,953
Bonds and notes payable - net 93,417,555 20,312,913 113,730,468
Special assessment debt - government commitment, net 6,227,120 - 6,227,120
Capital lease payable - net 8,981,445 - 8,981,445
Accrued compensated absences - net 7,926,877 308,471 8,235,348
Landfill long-term maintenance liabilities - 14,086,631 14,086,631
OPEB liability 36,610,875 1,704,832 38,315,707
Net pension liability 107,620,582 5,470,897 113,091,479
Total non-current liabilities 260,784,454 45,188,697 305,973,151
Total liabilities 302,792,196 49,440,796 352,232,992
DEFERRED INFLOWS OF RESOURCES
Deferred inflows related to pension plan 1,482,905 6,995 1,489,900
NET POSITION
Net investment in capital assets 473,852,620 57,093,744 530,946,364
Restricted for:
Transportation 13,264,250 - 13,264,250
Physical environment 4,809,944 - 4,809,944
Human services 5,070,180 - 5,070,180
Environmental land acquisition 692,655 - 692,655
Debt service 21,657,089 - 21,657,089
Renewal and replacement - 1,489,124 1,489,124
Capital projects 40,655,552 - 40,655,552
Other purposes 3,371,977 420,464 3,792,441
Unrestricted (6,358,167) (2,260,917) (8,619,084)
Total net position 557,016,100$ 56,742,415$ 613,758,515$
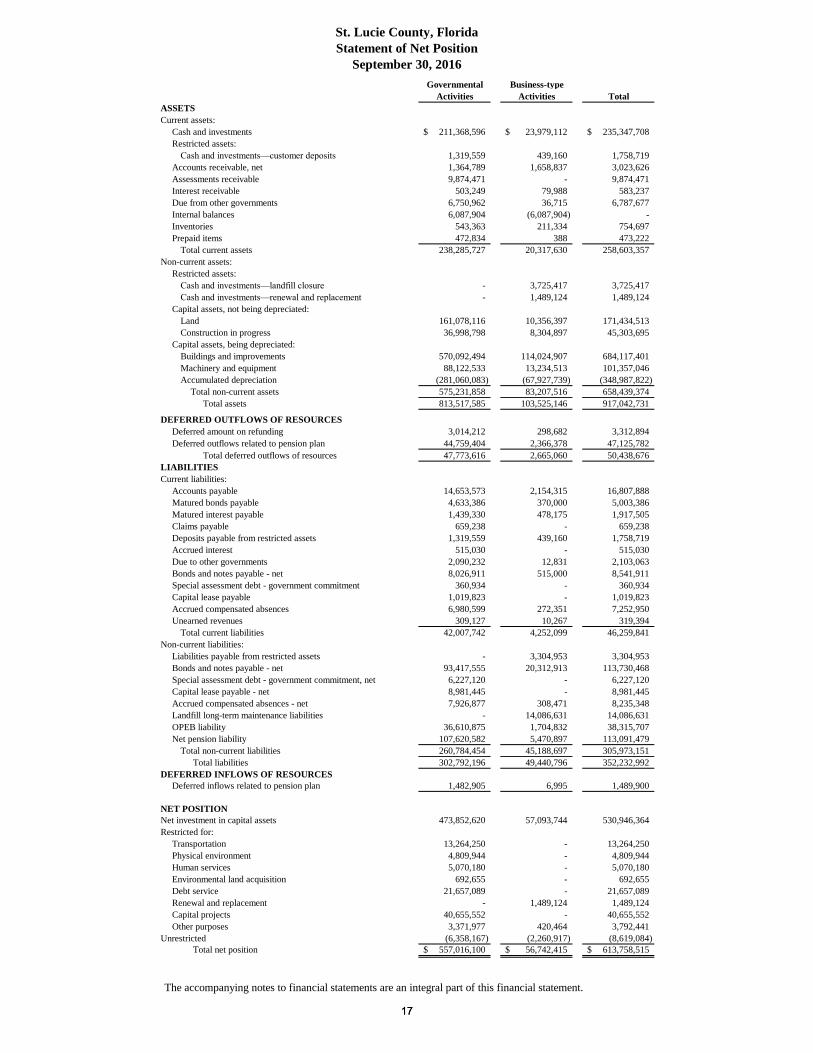
St. Lucie County, Florida
Statement of Net Position
September 30, 2016
The accompanying notes to financial statements are an integral part of this financial statement.
1717

Operating Capital
Charges for Grants and Grants and
Functions/Programs Expenses Services Contributions Contributions
Primary Government:
Governmental activities:
General government 47,318,679$ 8,707,858$ 994,487$ 564,406$
Public safety 94,870,750 2,656,847 3,051,895 628,674
Physical environment 6,314,624 - 865,042 6,072,564
Transportation 22,789,966 493,955 2,425,275 11,384,965
Economic environment 6,978,500 - 2,208,706 388,834
Human services 12,666,374 - 193,539 -
Culture and recreation 19,880,606 1,807,556 423,118 1,787,887
Court related 20,289,582 7,535,935 1,058,560 -
Interest on long-term debt 4,207,622 - - -
Total governmental activities 235,316,703 21,202,151 11,220,622 20,827,330
Business-type activities:
Bailing & recycling 18,185,680 17,318,921 - -
Golf course 1,415,595 1,236,384 - -
Water & sewer 9,315,147 8,282,856 - 91,378
Building code 1,620,227 2,068,301 - -
Total business-type activities 30,536,649 28,906,462 - 91,378
Total primary government 265,853,352$ 50,108,613$ 11,220,622$ 20,918,708$
General revenues:
Taxes:
Property taxes, levied for general purposes
Property taxes, levied for debt purposes
Sales taxes
Franchise taxes
State shared revenues
Investment income
Miscellaneous
Total general revenues
Transfers
Total general revenues and transfers
Change in net position
Net position - beginning of year
Net position - end of year
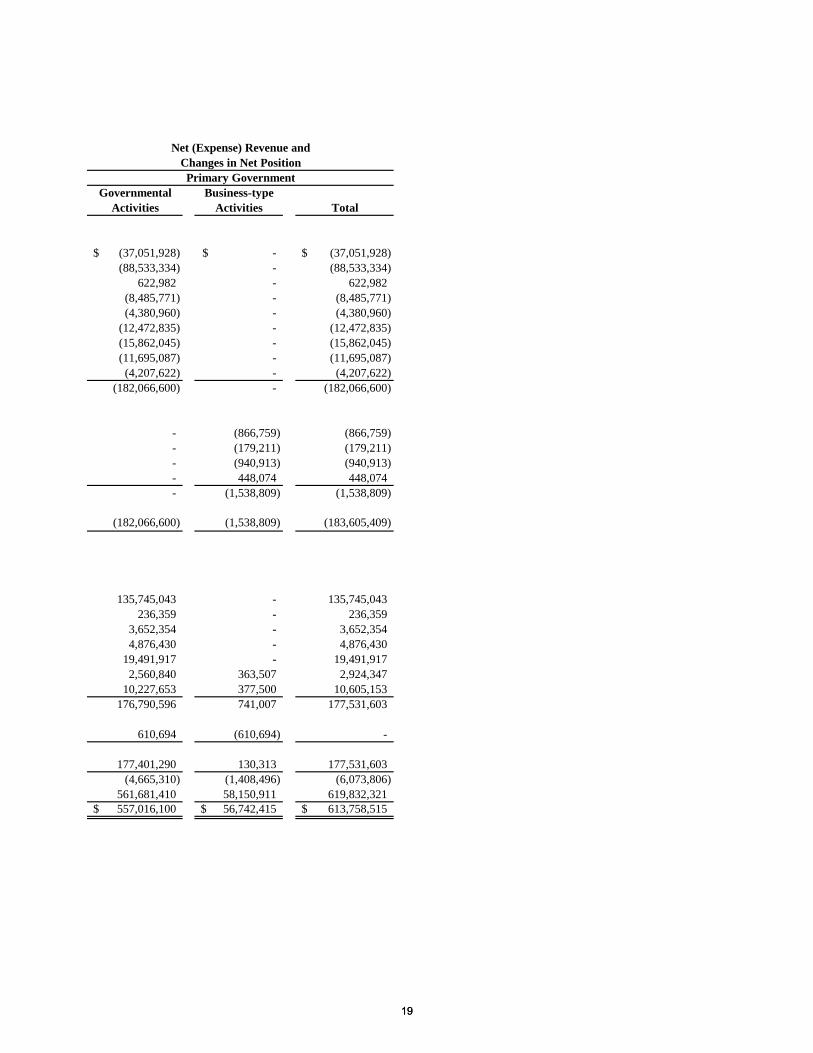
The accompanying notes to financial statements are an integral part of this financial statement.
St. Lucie County, Florida
Statement of Activities
For the Year Ended September 30, 2016
Program Revenues
1818
Governmental Business-type
Activities Activities Total
(37,051,928)$ -$ (37,051,928)$
(88,533,334) - (88,533,334)
622,982 - 622,982
(8,485,771) - (8,485,771)
(4,380,960) - (4,380,960)
(12,472,835) - (12,472,835)
(15,862,045) - (15,862,045)
(11,695,087) - (11,695,087)
(4,207,622) - (4,207,622)
(182,066,600) - (182,066,600)
- (866,759) (866,759)
- (179,211) (179,211)
- (940,913) (940,913)
- 448,074 448,074
- (1,538,809) (1,538,809)
(182,066,600) (1,538,809) (183,605,409)
135,745,043 - 135,745,043
236,359 - 236,359
3,652,354 - 3,652,354
4,876,430 - 4,876,430
19,491,917 - 19,491,917
2,560,840 363,507 2,924,347
10,227,653 377,500 10,605,153
176,790,596 741,007 177,531,603
610,694 (610,694) -
177,401,290 130,313 177,531,603
(4,665,310) (1,408,496) (6,073,806)
561,681,410 58,150,911 619,832,321
557,016,100$ 56,742,415$ 613,758,515$
Primary Government
Net (Expense) Revenue and
Changes in Net Position
1919
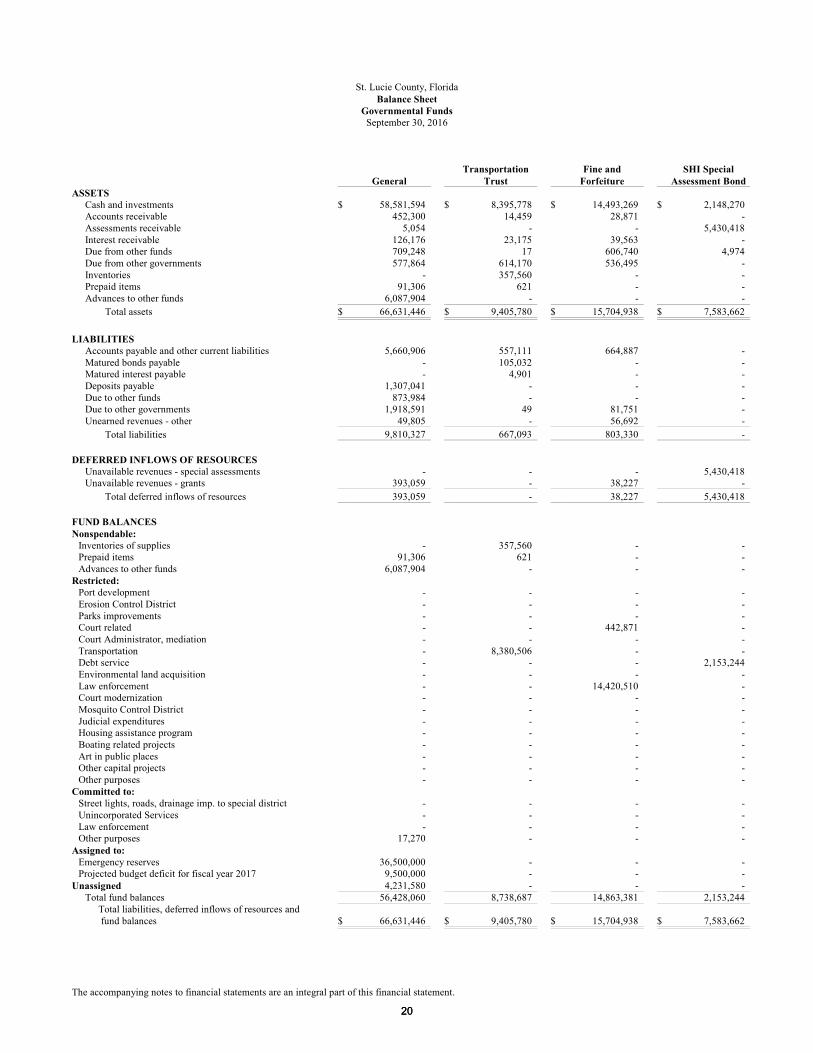
St. Lucie County, FloridaBalance Sheet
Governmental FundsSeptember 30, 2016
GeneralTransportation
TrustFine and
ForfeitureSHI Special
Assessment BondASSETS
Cash and investments $ 58,581,594 $ 8,395,778 $ 14,493,269 $ 2,148,270Accounts receivable 452,300 14,459 28,871 -Assessments receivable 5,054 - - 5,430,418Interest receivable 126,176 23,175 39,563 -Due from other funds 709,248 17 606,740 4,974Due from other governments 577,864 614,170 536,495 -Inventories - 357,560 - -Prepaid items 91,306 621 - -Advances to other funds 6,087,904 - - -
Total assets $ 66,631,446 $ 9,405,780 $ 15,704,938 $ 7,583,662
LIABILITIESAccounts payable and other current liabilities 5,660,906 557,111 664,887 -Matured bonds payable - 105,032 - -Matured interest payable - 4,901 - -Deposits payable 1,307,041 - - -Due to other funds 873,984 - - -Due to other governments 1,918,591 49 81,751 -Unearned revenues - other 49,805 - 56,692 -
Total liabilities 9,810,327 667,093 803,330 -
DEFERRED INFLOWS OF RESOURCESUnavailable revenues - special assessments - - - 5,430,418Unavailable revenues - grants 393,059 - 38,227 -
Total deferred inflows of resources 393,059 - 38,227 5,430,418
FUND BALANCESNonspendable:
Inventories of supplies - 357,560 - -Prepaid items 91,306 621 - -Advances to other funds 6,087,904 - - -
Restricted:Port development - - - -Erosion Control District - - - -Parks improvements - - - -Court related - - 442,871 -Court Administrator, mediation - - - -Transportation - 8,380,506 - -Debt service - - - 2,153,244Environmental land acquisition - - - -Law enforcement - - 14,420,510 -Court modernization - - - -Mosquito Control District - - - -Judicial expenditures - - - -Housing assistance program - - - -Boating related projects - - - -Art in public places - - - -Other capital projects - - - -Other purposes - - - -
Committed to:Street lights, roads, drainage imp. to special district - - - -Unincorporated Services - - - -Law enforcement - - - -Other purposes 17,270 - - -
Assigned to:Emergency reserves 36,500,000 - - -Projected budget deficit for fiscal year 2017 9,500,000 - - -
Unassigned 4,231,580 - - -Total fund balances 56,428,060 8,738,687 14,863,381 2,153,244
Total liabilities, deferred inflows of resources and fund balances $ 66,631,446 $ 9,405,780 $ 15,704,938 $ 7,583,662
The accompanying notes to financial statements are an integral part of this financial statement.
2020
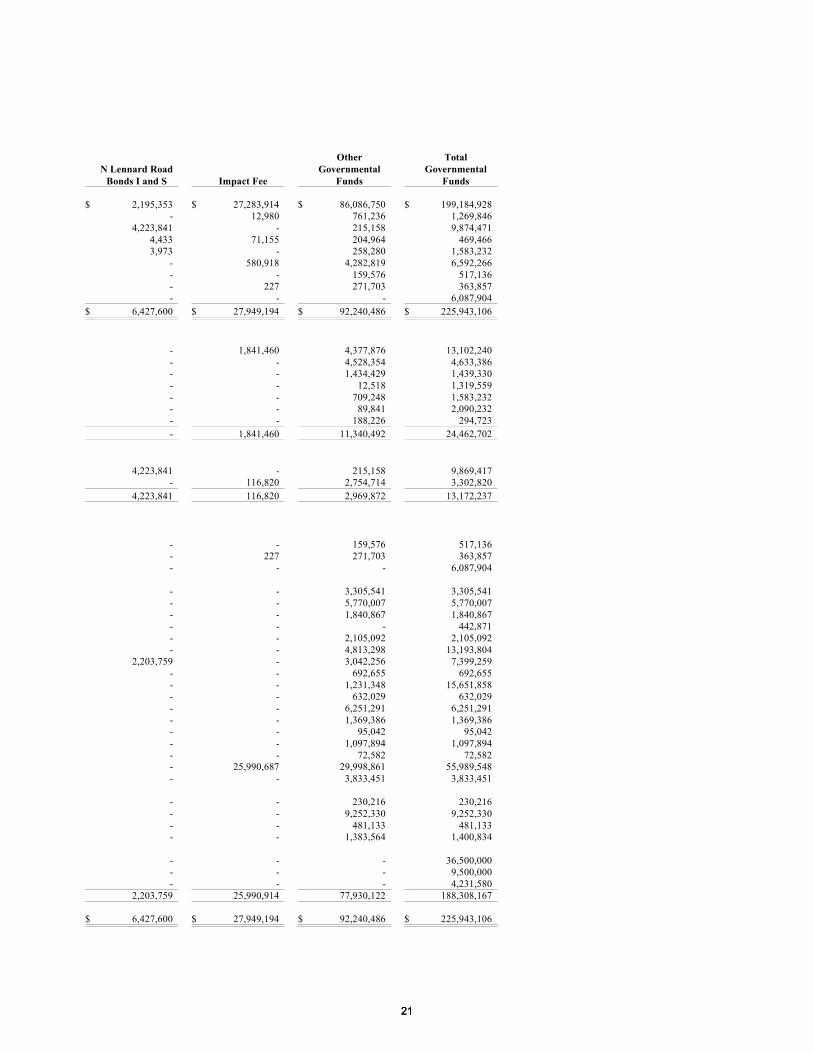
N Lennard RoadBonds I and S Impact Fee
OtherGovernmental
Funds
TotalGovernmental
Funds
$ 2,195,353 $ 27,283,914 $ 86,086,750 $ 199,184,928- 12,980 761,236 1,269,846
4,223,841 - 215,158 9,874,4714,433 71,155 204,964 469,4663,973 - 258,280 1,583,232
- 580,918 4,282,819 6,592,266- - 159,576 517,136- 227 271,703 363,857- - - 6,087,904
$ 6,427,600 $ 27,949,194 $ 92,240,486 $ 225,943,106
- 1,841,460 4,377,876 13,102,240- - 4,528,354 4,633,386- - 1,434,429 1,439,330- - 12,518 1,319,559- - 709,248 1,583,232- - 89,841 2,090,232- - 188,226 294,723- 1,841,460 11,340,492 24,462,702
4,223,841 - 215,158 9,869,417- 116,820 2,754,714 3,302,820
4,223,841 116,820 2,969,872 13,172,237
- - 159,576 517,136- 227 271,703 363,857- - - 6,087,904
- - 3,305,541 3,305,541- - 5,770,007 5,770,007- - 1,840,867 1,840,867- - - 442,871- - 2,105,092 2,105,092- - 4,813,298 13,193,804
2,203,759 - 3,042,256 7,399,259- - 692,655 692,655- - 1,231,348 15,651,858- - 632,029 632,029- - 6,251,291 6,251,291- - 1,369,386 1,369,386- - 95,042 95,042- - 1,097,894 1,097,894- - 72,582 72,582- 25,990,687 29,998,861 55,989,548- - 3,833,451 3,833,451
- - 230,216 230,216- - 9,252,330 9,252,330- - 481,133 481,133- - 1,383,564 1,400,834
- - - 36,500,000- - - 9,500,000- - - 4,231,580
2,203,759 25,990,914 77,930,122 188,308,167
$ 6,427,600 $ 27,949,194 $ 92,240,486 $ 225,943,106
2121
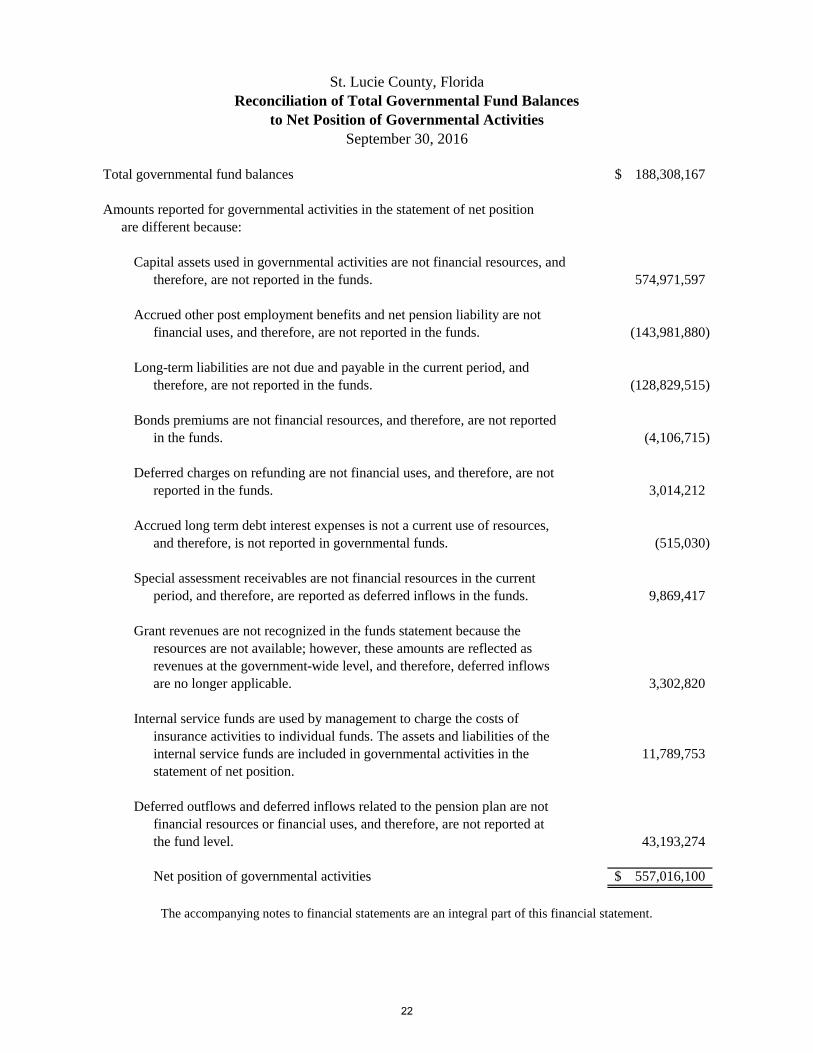
Total governmental fund balances 188,308,167$
Amounts reported for governmental activities in the statement of net position
are different because:
Capital assets used in governmental activities are not financial resources, and
therefore, are not reported in the funds. 574,971,597
Accrued other post employment benefits and net pension liability are not
financial uses, and therefore, are not reported in the funds. (143,981,880)
Long-term liabilities are not due and payable in the current period, and
therefore, are not reported in the funds. (128,829,515)
Bonds premiums are not financial resources, and therefore, are not reported
in the funds. (4,106,715)
Deferred charges on refunding are not financial uses, and therefore, are not
reported in the funds. 3,014,212
Accrued long term debt interest expenses is not a current use of resources,
and therefore, is not reported in governmental funds. (515,030)
Special assessment receivables are not financial resources in the current
period, and therefore, are reported as deferred inflows in the funds. 9,869,417
Grant revenues are not recognized in the funds statement because the
resources are not available; however, these amounts are reflected as
revenues at the government-wide level, and therefore, deferred inflows
are no longer applicable. 3,302,820
Internal service funds are used by management to charge the costs of
insurance activities to individual funds. The assets and liabilities of the
internal service funds are included in governmental activities in the 11,789,753
statement of net position.
Deferred outflows and deferred inflows related to the pension plan are not
financial resources or financial uses, and therefore, are not reported at
the fund level. 43,193,274
Net position of governmental activities 557,016,100$
St. Lucie County, Florida
Reconciliation of Total Governmental Fund Balances
to Net Position of Governmental Activities
September 30, 2016
The accompanying notes to financial statements are an integral part of this financial statement.
22

THIS PAGE INTENTIONALLY LEFT BLANK
2323
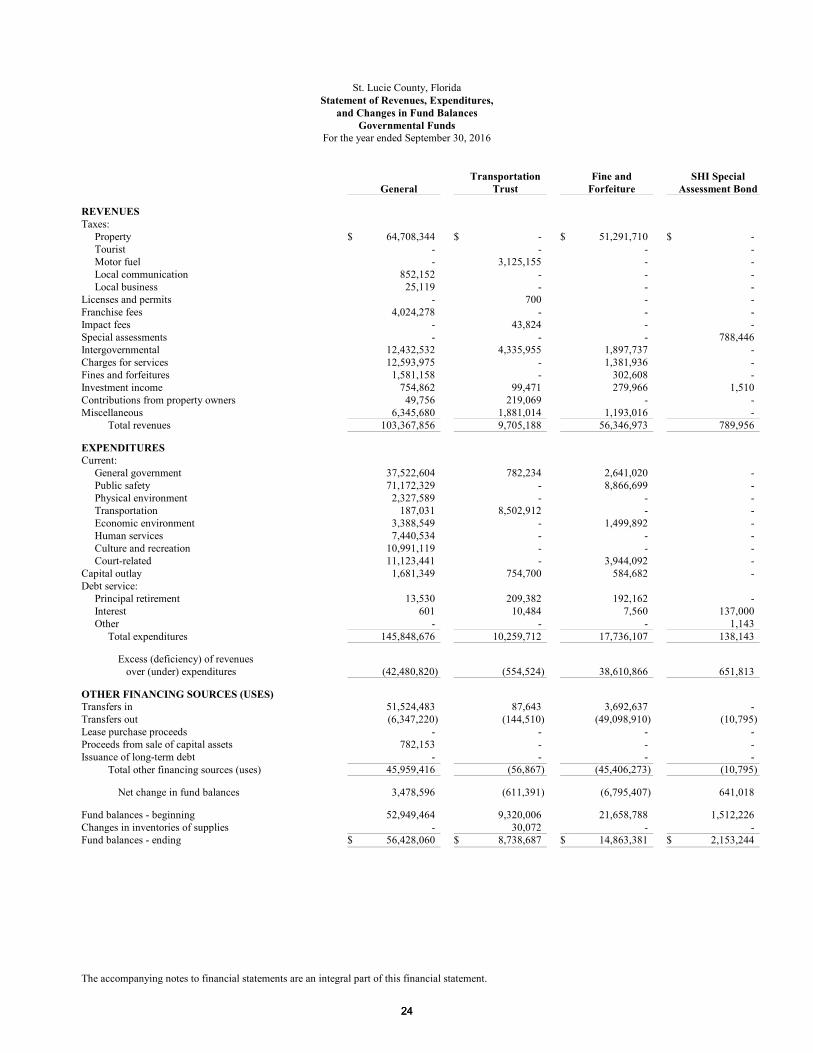
St. Lucie County, FloridaStatement of Revenues, Expenditures,
and Changes in Fund BalancesGovernmental Funds
For the year ended September 30, 2016
GeneralTransportation
TrustFine and
ForfeitureSHI Special
Assessment Bond
REVENUESTaxes:
Property $ 64,708,344 $ - $ 51,291,710 $ -Tourist - - - -Motor fuel - 3,125,155 - -Local communication 852,152 - - -Local business 25,119 - - -
Licenses and permits - 700 - -Franchise fees 4,024,278 - - -Impact fees - 43,824 - -Special assessments - - - 788,446Intergovernmental 12,432,532 4,335,955 1,897,737 -Charges for services 12,593,975 - 1,381,936 -Fines and forfeitures 1,581,158 - 302,608 -Investment income 754,862 99,471 279,966 1,510Contributions from property owners 49,756 219,069 - -Miscellaneous 6,345,680 1,881,014 1,193,016 -
Total revenues 103,367,856 9,705,188 56,346,973 789,956
EXPENDITURESCurrent:
General government 37,522,604 782,234 2,641,020 -Public safety 71,172,329 - 8,866,699 -Physical environment 2,327,589 - - -Transportation 187,031 8,502,912 - -Economic environment 3,388,549 - 1,499,892 -Human services 7,440,534 - - -Culture and recreation 10,991,119 - - -Court-related 11,123,441 - 3,944,092 -
Capital outlay 1,681,349 754,700 584,682 -Debt service:
Principal retirement 13,530 209,382 192,162 -Interest 601 10,484 7,560 137,000Other - - - 1,143
Total expenditures 145,848,676 10,259,712 17,736,107 138,143
Excess (deficiency) of revenues over (under) expenditures (42,480,820) (554,524) 38,610,866 651,813
OTHER FINANCING SOURCES (USES)Transfers in 51,524,483 87,643 3,692,637 -Transfers out (6,347,220) (144,510) (49,098,910) (10,795)Lease purchase proceeds - - - -Proceeds from sale of capital assets 782,153 - - -Issuance of long-term debt - - - -
Total other financing sources (uses) 45,959,416 (56,867) (45,406,273) (10,795)
Net change in fund balances 3,478,596 (611,391) (6,795,407) 641,018
Fund balances - beginning 52,949,464 9,320,006 21,658,788 1,512,226Changes in inventories of supplies - 30,072 - -Fund balances - ending $ 56,428,060 $ 8,738,687 $ 14,863,381 $ 2,153,244
The accompanying notes to financial statements are an integral part of this financial statement.
2424
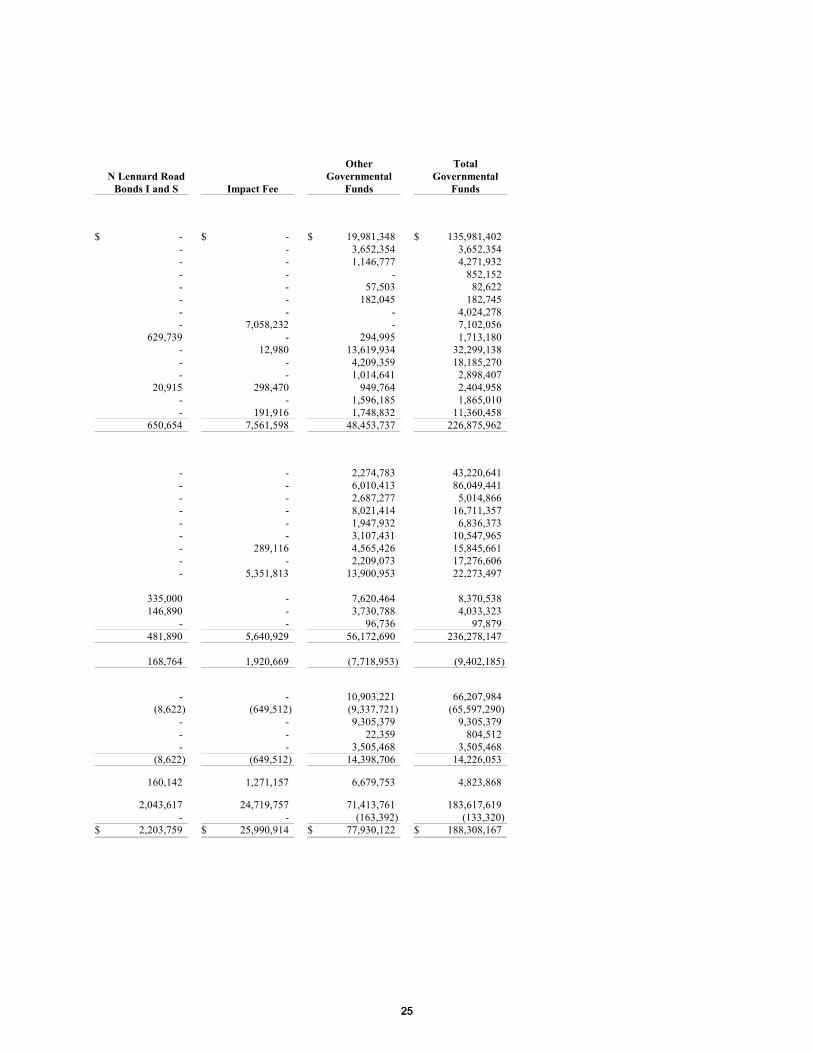
N Lennard RoadBonds I and S Impact Fee
OtherGovernmental
Funds
TotalGovernmental
Funds
$ - $ - $ 19,981,348 $ 135,981,402- - 3,652,354 3,652,354- - 1,146,777 4,271,932- - - 852,152- - 57,503 82,622- - 182,045 182,745- - - 4,024,278- 7,058,232 - 7,102,056
629,739 - 294,995 1,713,180- 12,980 13,619,934 32,299,138- - 4,209,359 18,185,270- - 1,014,641 2,898,407
20,915 298,470 949,764 2,404,958- - 1,596,185 1,865,010- 191,916 1,748,832 11,360,458
650,654 7,561,598 48,453,737 226,875,962
- - 2,274,783 43,220,641- - 6,010,413 86,049,441- - 2,687,277 5,014,866- - 8,021,414 16,711,357- - 1,947,932 6,836,373- - 3,107,431 10,547,965- 289,116 4,565,426 15,845,661- - 2,209,073 17,276,606- 5,351,813 13,900,953 22,273,497
335,000 - 7,620,464 8,370,538146,890 - 3,730,788 4,033,323
- - 96,736 97,879481,890 5,640,929 56,172,690 236,278,147
168,764 1,920,669 (7,718,953) (9,402,185)
- - 10,903,221 66,207,984(8,622) (649,512) (9,337,721) (65,597,290)
- - 9,305,379 9,305,379- - 22,359 804,512- - 3,505,468 3,505,468
(8,622) (649,512) 14,398,706 14,226,053
160,142 1,271,157 6,679,753 4,823,868
2,043,617 24,719,757 71,413,761 183,617,619- - (163,392) (133,320)
$ 2,203,759 $ 25,990,914 $ 77,930,122 $ 188,308,167
2525
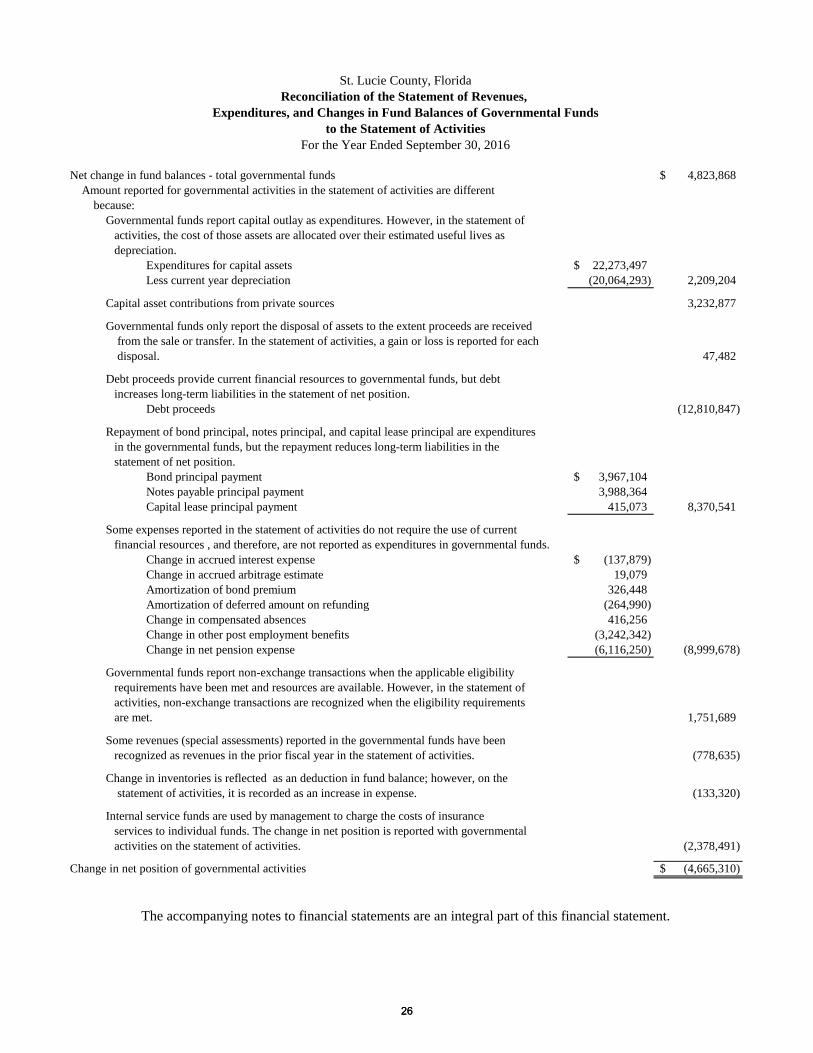
Net change in fund balances - total governmental funds 4,823,868$
Amount reported for governmental activities in the statement of activities are different
because:
Governmental funds report capital outlay as expenditures. However, in the statement of
activities, the cost of those assets are allocated over their estimated useful lives as
depreciation.
Expenditures for capital assets 22,273,497$
Less current year depreciation (20,064,293) 2,209,204
Capital asset contributions from private sources 3,232,877
Governmental funds only report the disposal of assets to the extent proceeds are received
from the sale or transfer. In the statement of activities, a gain or loss is reported for each
disposal. 47,482
Debt proceeds provide current financial resources to governmental funds, but debt
increases long-term liabilities in the statement of net position.
Debt proceeds (12,810,847)
Repayment of bond principal, notes principal, and capital lease principal are expenditures
in the governmental funds, but the repayment reduces long-term liabilities in the
statement of net position.
Bond principal payment 3,967,104$
Notes payable principal payment 3,988,364
Capital lease principal payment 415,073 8,370,541
Some expenses reported in the statement of activities do not require the use of current
financial resources , and therefore, are not reported as expenditures in governmental funds.
Change in accrued interest expense (137,879)$
Change in accrued arbitrage estimate 19,079
Amortization of bond premium 326,448
Amortization of deferred amount on refunding (264,990)
Change in compensated absences 416,256
Change in other post employment benefits (3,242,342)
Change in net pension expense (6,116,250) (8,999,678)
Governmental funds report non-exchange transactions when the applicable eligibility
requirements have been met and resources are available. However, in the statement of
activities, non-exchange transactions are recognized when the eligibility requirements
are met. 1,751,689
Some revenues (special assessments) reported in the governmental funds have been
recognized as revenues in the prior fiscal year in the statement of activities. (778,635)
Change in inventories is reflected as an deduction in fund balance; however, on the
statement of activities, it is recorded as an increase in expense. (133,320)
Internal service funds are used by management to charge the costs of insurance
services to individual funds. The change in net position is reported with governmental
activities on the statement of activities. (2,378,491)
Change in net position of governmental activities (4,665,310)$
St. Lucie County, Florida
Reconciliation of the Statement of Revenues,
Expenditures, and Changes in Fund Balances of Governmental Funds
to the Statement of Activities
For the Year Ended September 30, 2016
The accompanying notes to financial statements are an integral part of this financial statement.
2626
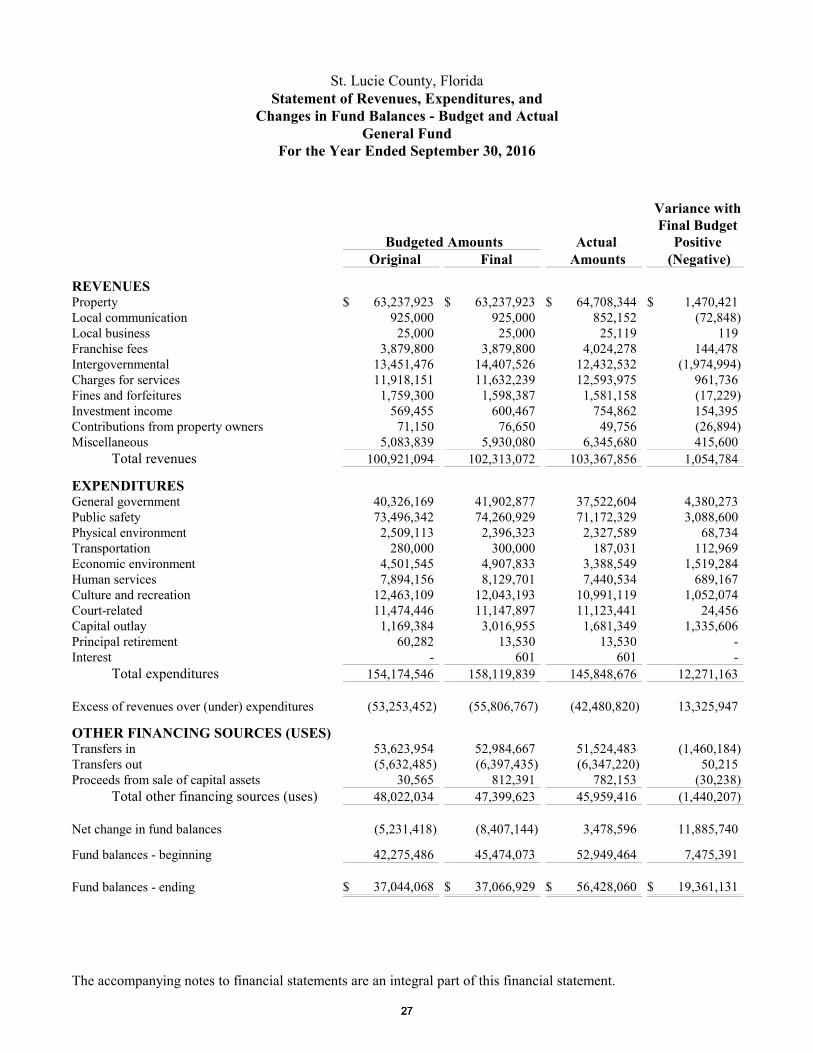
St. Lucie County, FloridaStatement of Revenues, Expenditures, and
Changes in Fund Balances - Budget and ActualGeneral Fund
For the Year Ended September 30, 2016
Budgeted Amounts Actual
Variance withFinal Budget
PositiveOriginal Final Amounts (Negative)
REVENUESProperty $ 63,237,923 $ 63,237,923 $ 64,708,344 $ 1,470,421Local communication 925,000 925,000 852,152 (72,848)Local business 25,000 25,000 25,119 119Franchise fees 3,879,800 3,879,800 4,024,278 144,478Intergovernmental 13,451,476 14,407,526 12,432,532 (1,974,994)Charges for services 11,918,151 11,632,239 12,593,975 961,736Fines and forfeitures 1,759,300 1,598,387 1,581,158 (17,229)Investment income 569,455 600,467 754,862 154,395Contributions from property owners 71,150 76,650 49,756 (26,894)Miscellaneous 5,083,839 5,930,080 6,345,680 415,600
Total revenues 100,921,094 102,313,072 103,367,856 1,054,784
EXPENDITURESGeneral government 40,326,169 41,902,877 37,522,604 4,380,273Public safety 73,496,342 74,260,929 71,172,329 3,088,600Physical environment 2,509,113 2,396,323 2,327,589 68,734Transportation 280,000 300,000 187,031 112,969Economic environment 4,501,545 4,907,833 3,388,549 1,519,284Human services 7,894,156 8,129,701 7,440,534 689,167Culture and recreation 12,463,109 12,043,193 10,991,119 1,052,074Court-related 11,474,446 11,147,897 11,123,441 24,456Capital outlay 1,169,384 3,016,955 1,681,349 1,335,606Principal retirement 60,282 13,530 13,530 -Interest - 601 601 -
Total expenditures 154,174,546 158,119,839 145,848,676 12,271,163
Excess of revenues over (under) expenditures (53,253,452) (55,806,767) (42,480,820) 13,325,947
OTHER FINANCING SOURCES (USES)Transfers in 53,623,954 52,984,667 51,524,483 (1,460,184)Transfers out (5,632,485) (6,397,435) (6,347,220) 50,215Proceeds from sale of capital assets 30,565 812,391 782,153 (30,238)
Total other financing sources (uses) 48,022,034 47,399,623 45,959,416 (1,440,207)
Net change in fund balances (5,231,418) (8,407,144) 3,478,596 11,885,740
Fund balances - beginning 42,275,486 45,474,073 52,949,464 7,475,391
Fund balances - ending $ 37,044,068 $ 37,066,929 $ 56,428,060 $ 19,361,131- - - -
The accompanying notes to financial statements are an integral part of this financial statement.
2727
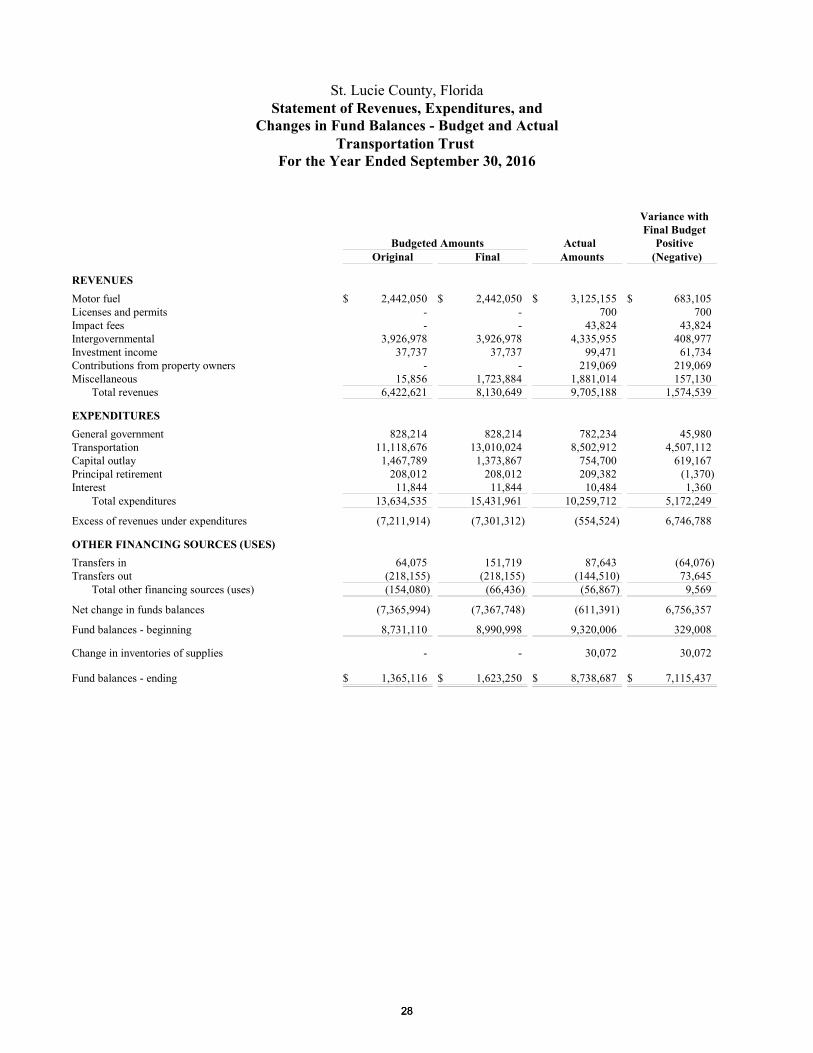
St. Lucie County, FloridaStatement of Revenues, Expenditures, and
Changes in Fund Balances - Budget and ActualTransportation Trust
For the Year Ended September 30, 2016
Budgeted Amounts Actual
Variance withFinal Budget
PositiveOriginal Final Amounts (Negative)
REVENUESMotor fuel $ 2,442,050 $ 2,442,050 $ 3,125,155 $ 683,105Licenses and permits - - 700 700Impact fees - - 43,824 43,824Intergovernmental 3,926,978 3,926,978 4,335,955 408,977Investment income 37,737 37,737 99,471 61,734Contributions from property owners - - 219,069 219,069Miscellaneous 15,856 1,723,884 1,881,014 157,130
Total revenues 6,422,621 8,130,649 9,705,188 1,574,539
EXPENDITURESGeneral government 828,214 828,214 782,234 45,980Transportation 11,118,676 13,010,024 8,502,912 4,507,112Capital outlay 1,467,789 1,373,867 754,700 619,167Principal retirement 208,012 208,012 209,382 (1,370)Interest 11,844 11,844 10,484 1,360
Total expenditures 13,634,535 15,431,961 10,259,712 5,172,249
Excess of revenues under expenditures (7,211,914) (7,301,312) (554,524) 6,746,788
OTHER FINANCING SOURCES (USES)Transfers in 64,075 151,719 87,643 (64,076)Transfers out (218,155) (218,155) (144,510) 73,645
Total other financing sources (uses) (154,080) (66,436) (56,867) 9,569
Net change in funds balances (7,365,994) (7,367,748) (611,391) 6,756,357
Fund balances - beginning 8,731,110 8,990,998 9,320,006 329,008
Change in inventories of supplies - - 30,072 30,072
Fund balances - ending $ 1,365,116 $ 1,623,250 $ 8,738,687 $ 7,115,437- - - -
2828
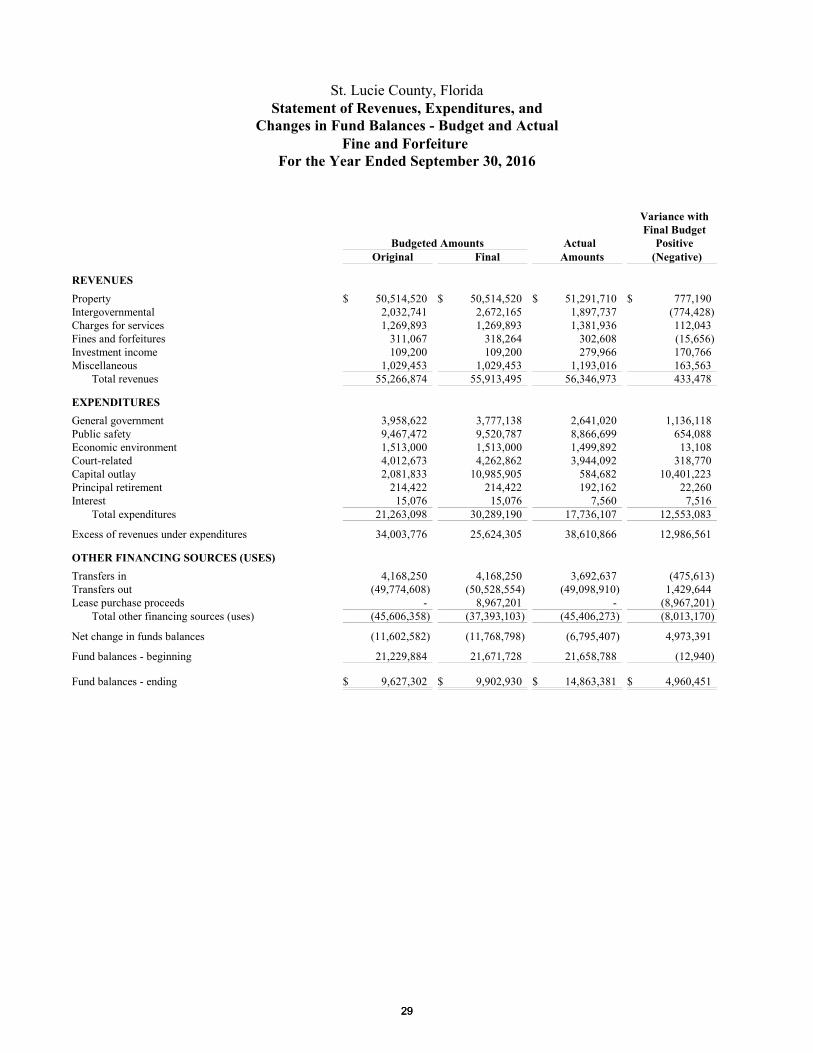
St. Lucie County, FloridaStatement of Revenues, Expenditures, and
Changes in Fund Balances - Budget and ActualFine and Forfeiture
For the Year Ended September 30, 2016
Budgeted Amounts Actual
Variance withFinal Budget
PositiveOriginal Final Amounts (Negative)
REVENUESProperty $ 50,514,520 $ 50,514,520 $ 51,291,710 $ 777,190Intergovernmental 2,032,741 2,672,165 1,897,737 (774,428)Charges for services 1,269,893 1,269,893 1,381,936 112,043Fines and forfeitures 311,067 318,264 302,608 (15,656)Investment income 109,200 109,200 279,966 170,766Miscellaneous 1,029,453 1,029,453 1,193,016 163,563
Total revenues 55,266,874 55,913,495 56,346,973 433,478
EXPENDITURESGeneral government 3,958,622 3,777,138 2,641,020 1,136,118Public safety 9,467,472 9,520,787 8,866,699 654,088Economic environment 1,513,000 1,513,000 1,499,892 13,108Court-related 4,012,673 4,262,862 3,944,092 318,770Capital outlay 2,081,833 10,985,905 584,682 10,401,223Principal retirement 214,422 214,422 192,162 22,260Interest 15,076 15,076 7,560 7,516
Total expenditures 21,263,098 30,289,190 17,736,107 12,553,083
Excess of revenues under expenditures 34,003,776 25,624,305 38,610,866 12,986,561
OTHER FINANCING SOURCES (USES)Transfers in 4,168,250 4,168,250 3,692,637 (475,613)Transfers out (49,774,608) (50,528,554) (49,098,910) 1,429,644Lease purchase proceeds - 8,967,201 - (8,967,201)
Total other financing sources (uses) (45,606,358) (37,393,103) (45,406,273) (8,013,170)
Net change in funds balances (11,602,582) (11,768,798) (6,795,407) 4,973,391
Fund balances - beginning 21,229,884 21,671,728 21,658,788 (12,940)
Fund balances - ending $ 9,627,302 $ 9,902,930 $ 14,863,381 $ 4,960,451- - - -
2929
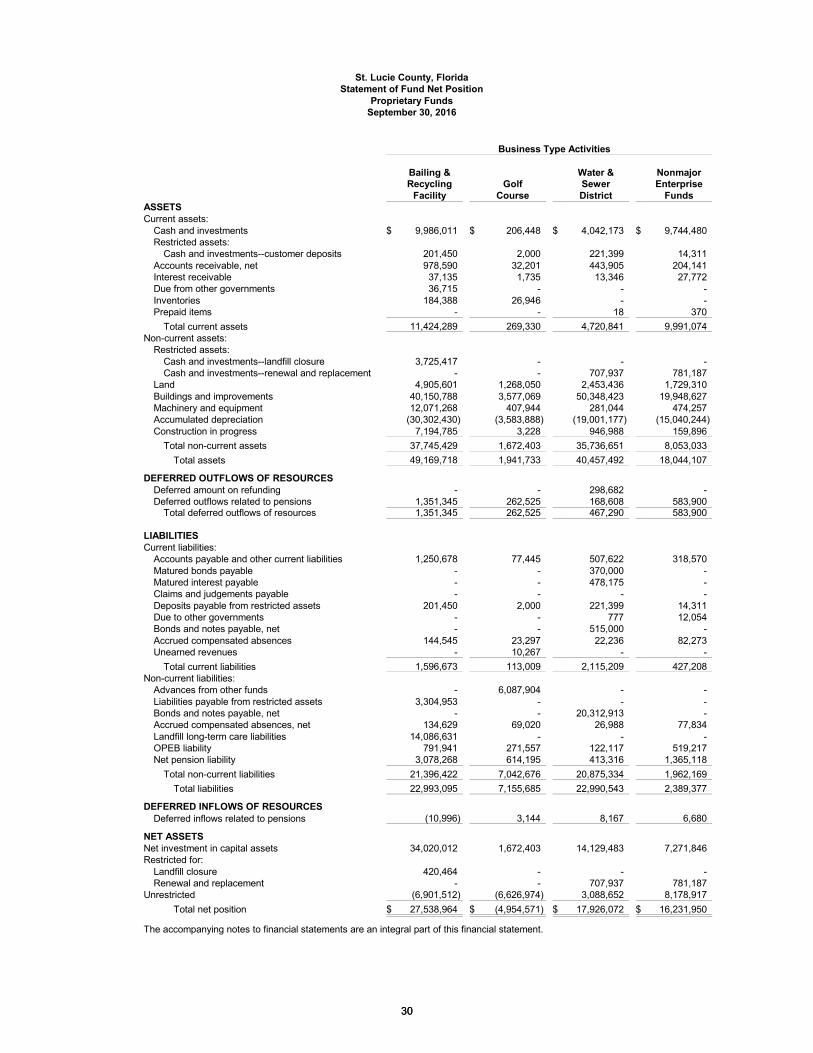
St. Lucie County, FloridaStatement of Fund Net Position
Proprietary FundsSeptember 30, 2016
Business Type Activities
Bailing &Recycling
FacilityGolf
Course
Water &SewerDistrict
NonmajorEnterprise
FundsASSETSCurrent assets:
Cash and investments $ 9,986,011 $ 206,448 $ 4,042,173 $ 9,744,480Restricted assets:
Cash and investments--customer deposits 201,450 2,000 221,399 14,311Accounts receivable, net 978,590 32,201 443,905 204,141Interest receivable 37,135 1,735 13,346 27,772Due from other governments 36,715 - - -Inventories 184,388 26,946 - -Prepaid items - - 18 370
Total current assets 11,424,289 269,330 4,720,841 9,991,074Non-current assets:
Restricted assets:Cash and investments--landfill closure 3,725,417 - - -Cash and investments--renewal and replacement - - 707,937 781,187
Land 4,905,601 1,268,050 2,453,436 1,729,310Buildings and improvements 40,150,788 3,577,069 50,348,423 19,948,627Machinery and equipment 12,071,268 407,944 281,044 474,257Accumulated depreciation (30,302,430) (3,583,888) (19,001,177) (15,040,244)Construction in progress 7,194,785 3,228 946,988 159,896
Total non-current assets 37,745,429 1,672,403 35,736,651 8,053,033Total assets 49,169,718 1,941,733 40,457,492 18,044,107
DEFERRED OUTFLOWS OF RESOURCESDeferred amount on refunding - - 298,682 -Deferred outflows related to pensions 1,351,345 262,525 168,608 583,900
Total deferred outflows of resources 1,351,345 262,525 467,290 583,900
LIABILITIESCurrent liabilities:
Accounts payable and other current liabilities 1,250,678 77,445 507,622 318,570Matured bonds payable - - 370,000 -Matured interest payable - - 478,175 -Claims and judgements payable - - - -Deposits payable from restricted assets 201,450 2,000 221,399 14,311Due to other governments - - 777 12,054Bonds and notes payable, net - - 515,000 -Accrued compensated absences 144,545 23,297 22,236 82,273Unearned revenues - 10,267 - -
Total current liabilities 1,596,673 113,009 2,115,209 427,208Non-current liabilities:
Advances from other funds - 6,087,904 - -Liabilities payable from restricted assets 3,304,953 - - -Bonds and notes payable, net - - 20,312,913 -Accrued compensated absences, net 134,629 69,020 26,988 77,834Landfill long-term care liabilities 14,086,631 - - -OPEB liability 791,941 271,557 122,117 519,217Net pension liability 3,078,268 614,195 413,316 1,365,118
Total non-current liabilities 21,396,422 7,042,676 20,875,334 1,962,169Total liabilities 22,993,095 7,155,685 22,990,543 2,389,377
DEFERRED INFLOWS OF RESOURCESDeferred inflows related to pensions (10,996) 3,144 8,167 6,680
NET ASSETSNet investment in capital assets 34,020,012 1,672,403 14,129,483 7,271,846Restricted for:
Landfill closure 420,464 - - -Renewal and replacement - - 707,937 781,187
Unrestricted (6,901,512) (6,626,974) 3,088,652 8,178,917Total net position $ 27,538,964 $ (4,954,571) $ 17,926,072 $ 16,231,950
The accompanying notes to financial statements are an integral part of this financial statement.
3030
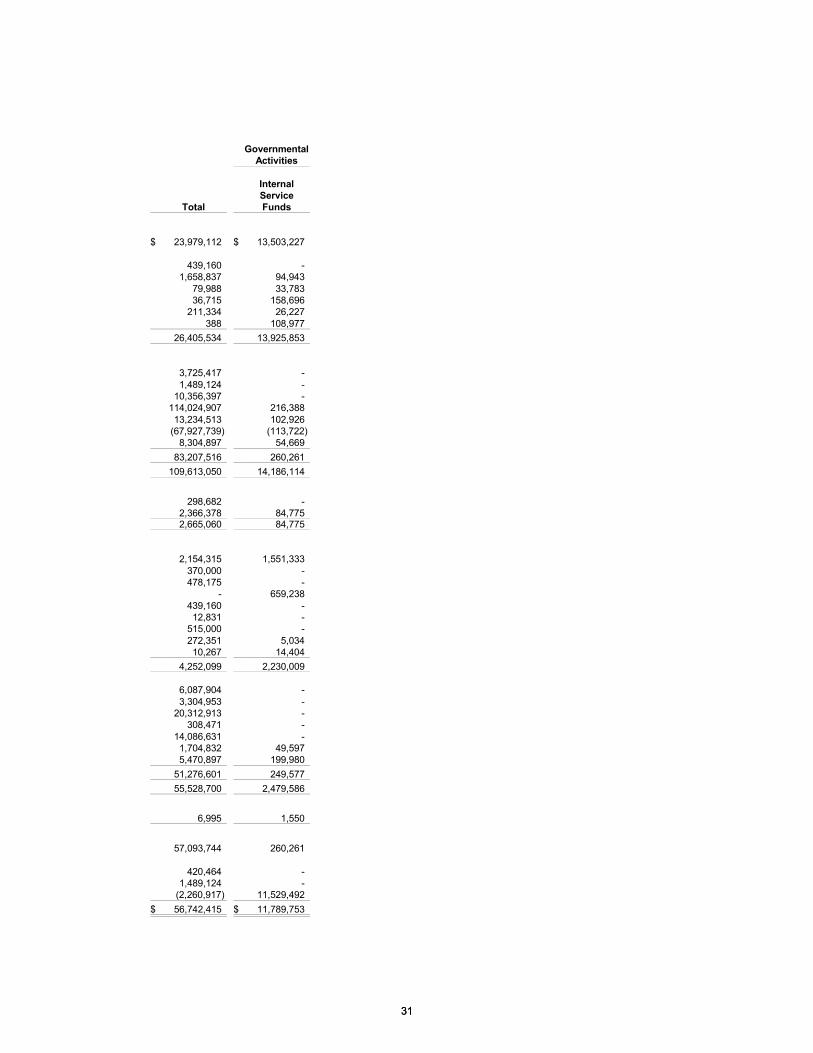
GovernmentalActivities
Total
InternalServiceFunds
$ 23,979,112 $ 13,503,227
439,160 -1,658,837 94,943
79,988 33,78336,715 158,696
211,334 26,227388 108,977
26,405,534 13,925,853
3,725,417 -1,489,124 -
10,356,397 -114,024,907 216,38813,234,513 102,926
(67,927,739) (113,722)8,304,897 54,669
83,207,516 260,261109,613,050 14,186,114
298,682 -2,366,378 84,7752,665,060 84,775
2,154,315 1,551,333370,000 -478,175 -
- 659,238439,160 -12,831 -
515,000 -272,351 5,03410,267 14,404
4,252,099 2,230,009
6,087,904 -3,304,953 -
20,312,913 -308,471 -
14,086,631 -1,704,832 49,5975,470,897 199,980
51,276,601 249,57755,528,700 2,479,586
6,995 1,550
57,093,744 260,261
420,464 -1,489,124 -
(2,260,917) 11,529,492$ 56,742,415 $ 11,789,753
3131
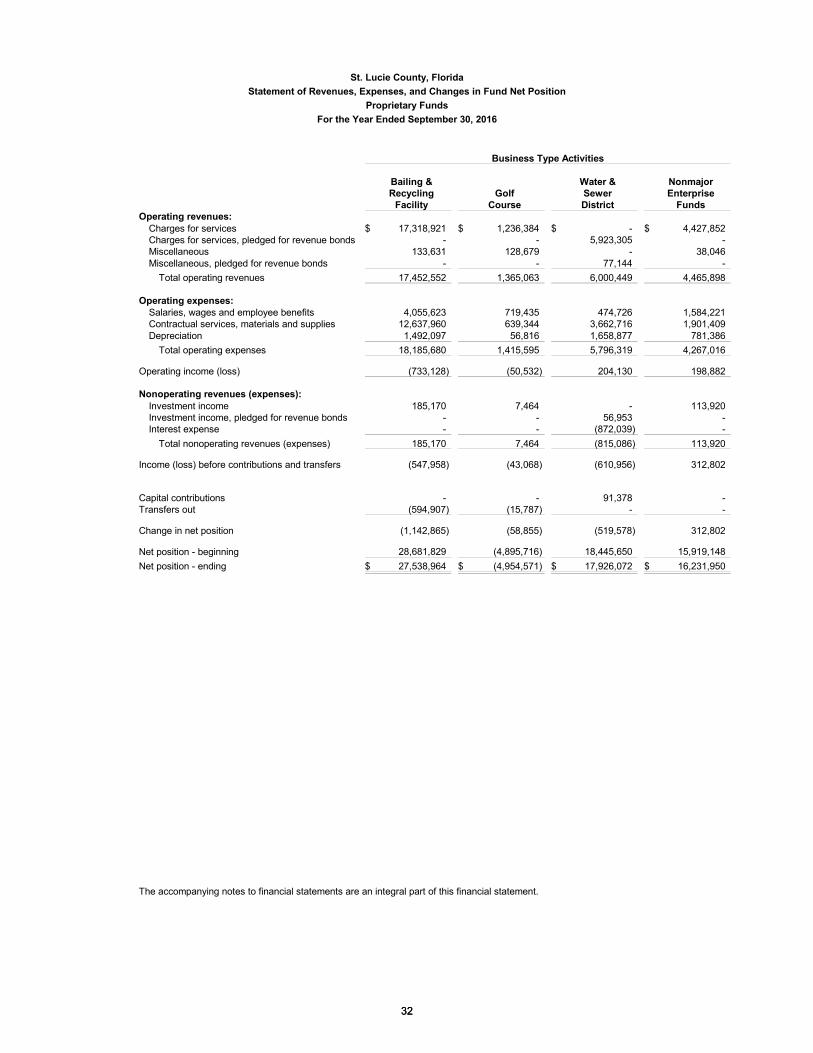
St. Lucie County, FloridaStatement of Revenues, Expenses, and Changes in Fund Net Position
Proprietary FundsFor the Year Ended September 30, 2016
Business Type Activities
Bailing &Recycling
FacilityGolf
Course
Water &SewerDistrict
NonmajorEnterprise
FundsOperating revenues:
Charges for services $ 17,318,921 $ 1,236,384 $ - $ 4,427,852Charges for services, pledged for revenue bonds - - 5,923,305 -Miscellaneous 133,631 128,679 - 38,046Miscellaneous, pledged for revenue bonds - - 77,144 -
Total operating revenues 17,452,552 1,365,063 6,000,449 4,465,898
Operating expenses:Salaries, wages and employee benefits 4,055,623 719,435 474,726 1,584,221Contractual services, materials and supplies 12,637,960 639,344 3,662,716 1,901,409Depreciation 1,492,097 56,816 1,658,877 781,386
Total operating expenses 18,185,680 1,415,595 5,796,319 4,267,016
Operating income (loss) (733,128) (50,532) 204,130 198,882
Nonoperating revenues (expenses):Investment income 185,170 7,464 - 113,920Investment income, pledged for revenue bonds - - 56,953 -Interest expense - - (872,039) -
Total nonoperating revenues (expenses) 185,170 7,464 (815,086) 113,920
Income (loss) before contributions and transfers (547,958) (43,068) (610,956) 312,802
Capital contributions - - 91,378 -Transfers out (594,907) (15,787) - -
Change in net position (1,142,865) (58,855) (519,578) 312,802
Net position - beginning 28,681,829 (4,895,716) 18,445,650 15,919,148Net position - ending $ 27,538,964 $ (4,954,571) $ 17,926,072 $ 16,231,950
The accompanying notes to financial statements are an integral part of this financial statement.
3232
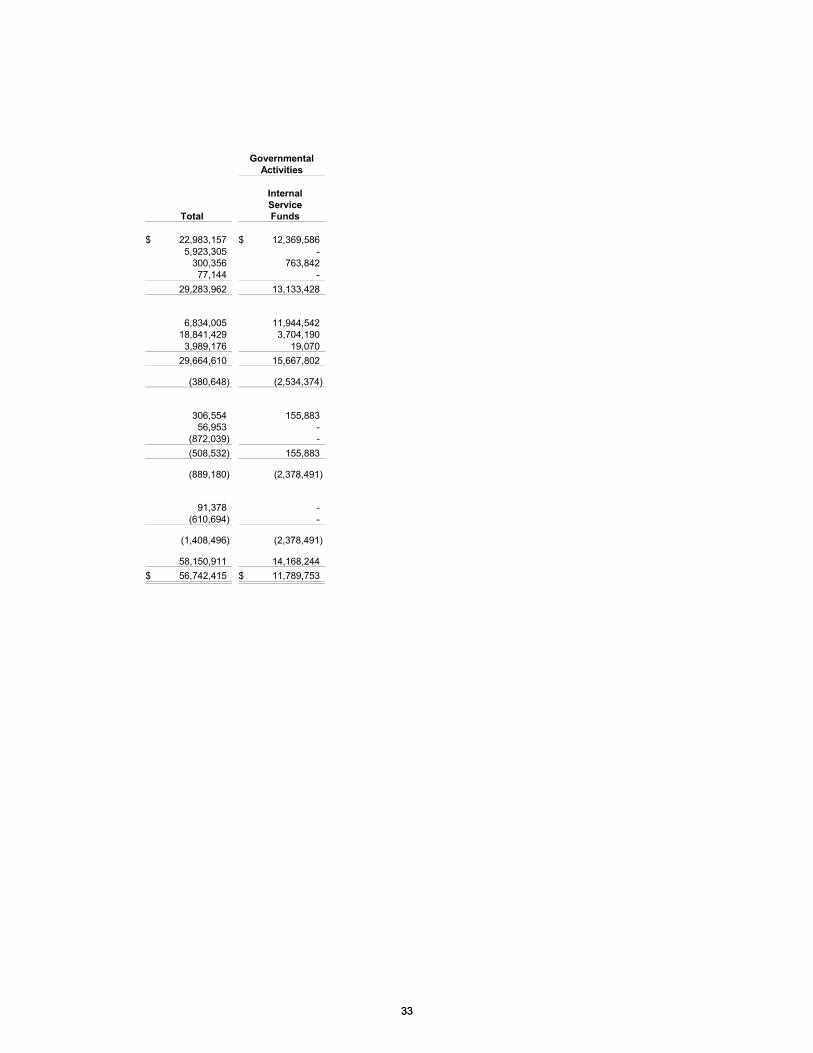
GovernmentalActivities
Total
InternalServiceFunds
$ 22,983,157 $ 12,369,5865,923,305 -
300,356 763,84277,144 -
29,283,962 13,133,428
6,834,005 11,944,54218,841,429 3,704,1903,989,176 19,070
29,664,610 15,667,802
(380,648) (2,534,374)
306,554 155,88356,953 -
(872,039) -(508,532) 155,883
(889,180) (2,378,491)
91,378 -(610,694) -
(1,408,496) (2,378,491)
58,150,911 14,168,244$ 56,742,415 $ 11,789,753
3333
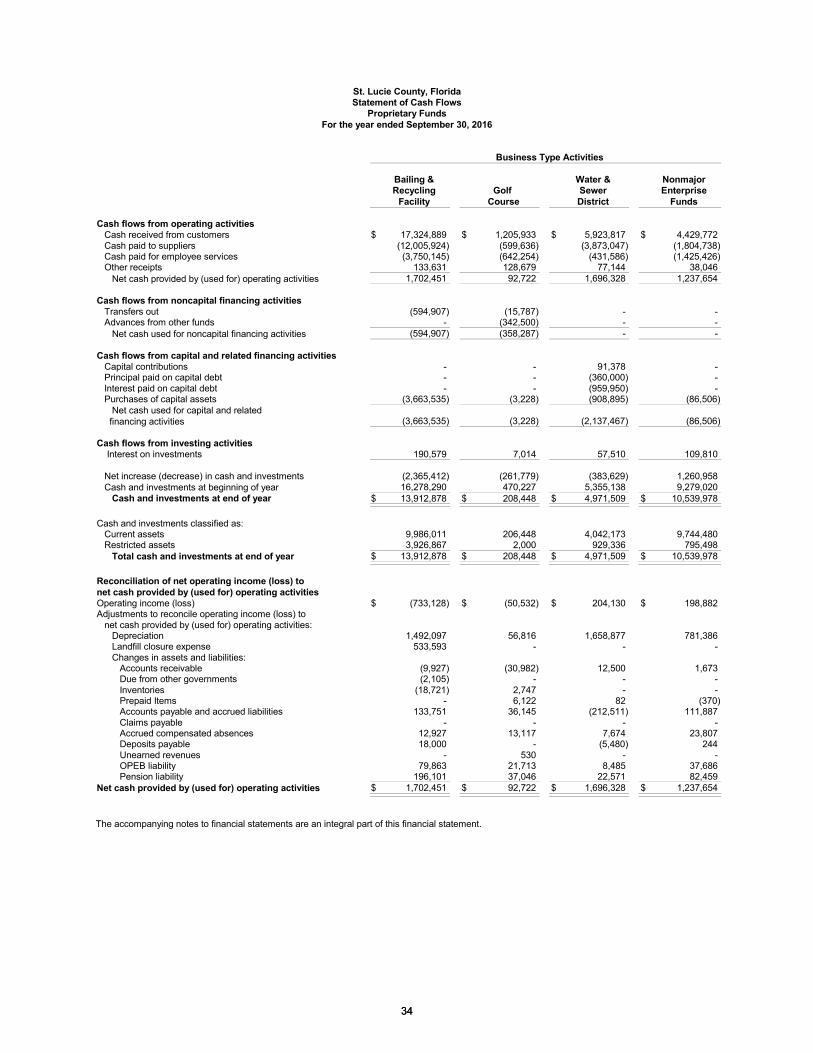
St. Lucie County, FloridaStatement of Cash Flows
Proprietary FundsFor the year ended September 30, 2016
Business Type Activities
Bailing & Water & NonmajorRecycling Golf Sewer Enterprise
Facility Course District Funds
Cash flows from operating activities Cash received from customers $ 17,324,889 $ 1,205,933 $ 5,923,817 $ 4,429,772 Cash paid to suppliers (12,005,924) (599,636) (3,873,047) (1,804,738) Cash paid for employee services (3,750,145) (642,254) (431,586) (1,425,426) Other receipts 133,631 128,679 77,144 38,046 Net cash provided by (used for) operating activities 1,702,451 92,722 1,696,328 1,237,654
Cash flows from noncapital financing activities Transfers out (594,907) (15,787) - - Advances from other funds - (342,500) - - Net cash used for noncapital financing activities (594,907) (358,287) - -
Cash flows from capital and related financing activities Capital contributions - - 91,378 - Principal paid on capital debt - - (360,000) - Interest paid on capital debt - - (959,950) - Purchases of capital assets (3,663,535) (3,228) (908,895) (86,506) Net cash used for capital and related financing activities (3,663,535) (3,228) (2,137,467) (86,506)
Cash flows from investing activities Interest on investments 190,579 7,014 57,510 109,810
Net increase (decrease) in cash and investments (2,365,412) (261,779) (383,629) 1,260,958 Cash and investments at beginning of year 16,278,290 470,227 5,355,138 9,279,020 Cash and investments at end of year $ 13,912,878 $ 208,448 $ 4,971,509 $ 10,539,978
Cash and investments classified as: Current assets 9,986,011 206,448 4,042,173 9,744,480 Restricted assets 3,926,867 2,000 929,336 795,498 Total cash and investments at end of year $ 13,912,878 $ 208,448 $ 4,971,509 $ 10,539,978
Reconciliation of net operating income (loss) tonet cash provided by (used for) operating activitiesOperating income (loss) $ (733,128) $ (50,532) $ 204,130 $ 198,882 Adjustments to reconcile operating income (loss) to net cash provided by (used for) operating activities: Depreciation 1,492,097 56,816 1,658,877 781,386 Landfill closure expense 533,593 - - - Changes in assets and liabilities: Accounts receivable (9,927) (30,982) 12,500 1,673 Due from other governments (2,105) - - - Inventories (18,721) 2,747 - - Prepaid Items - 6,122 82 (370) Accounts payable and accrued liabilities 133,751 36,145 (212,511) 111,887 Claims payable - - - - Accrued compensated absences 12,927 13,117 7,674 23,807 Deposits payable 18,000 - (5,480) 244 Unearned revenues - 530 - - OPEB liability 79,863 21,713 8,485 37,686 Pension liability 196,101 37,046 22,571 82,459 Net cash provided by (used for) operating activities $ 1,702,451 $ 92,722 $ 1,696,328 $ 1,237,654
The accompanying notes to financial statements are an integral part of this financial statement.
3434
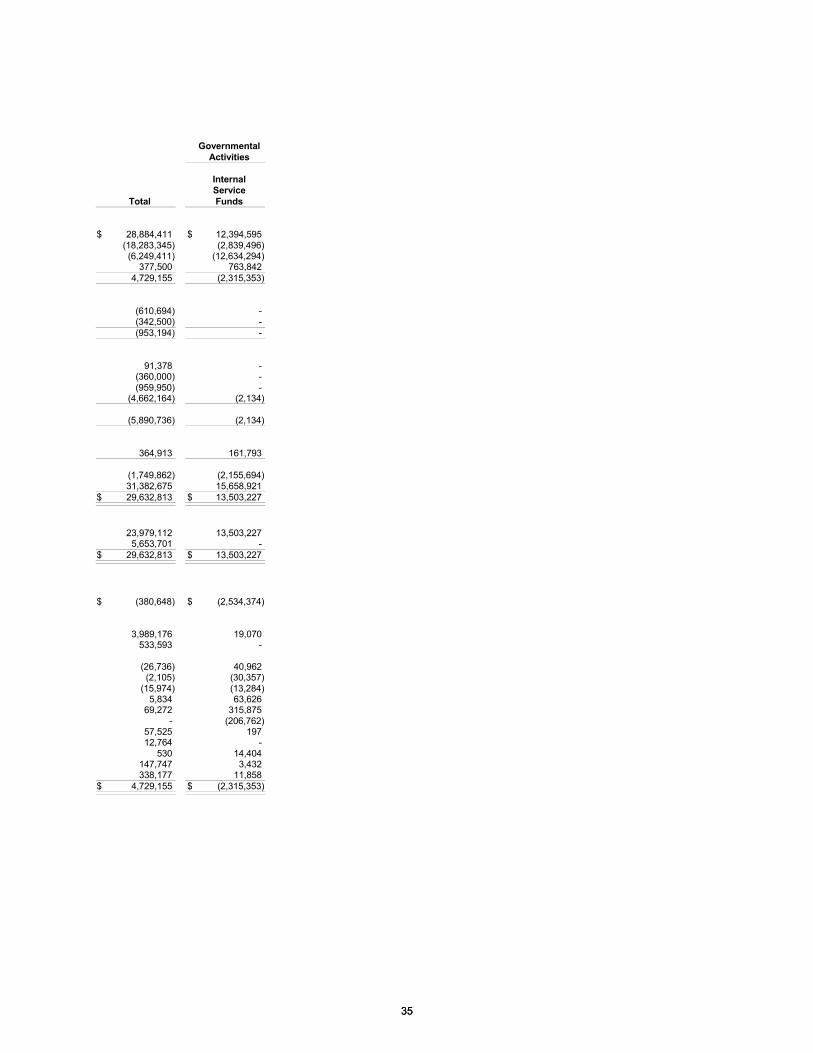
GovernmentalActivities
InternalService
Total Funds
$ 28,884,411 $ 12,394,595 (18,283,345) (2,839,496) (6,249,411) (12,634,294)
377,500 763,842 4,729,155 (2,315,353)
(610,694) - (342,500) - (953,194) -
91,378 - (360,000) - (959,950) -
(4,662,164) (2,134)
(5,890,736) (2,134)
364,913 161,793
(1,749,862) (2,155,694) 31,382,675 15,658,921
$ 29,632,813 $ 13,503,227
23,979,112 13,503,227 5,653,701 -
$ 29,632,813 $ 13,503,227
$ (380,648) $ (2,534,374)
3,989,176 19,070 533,593 -
(26,736) 40,962 (2,105) (30,357)
(15,974) (13,284) 5,834 63,626
69,272 315,875 - (206,762)
57,525 197 12,764 -
530 14,404 147,747 3,432 338,177 11,858
$ 4,729,155 $ (2,315,353)
3535
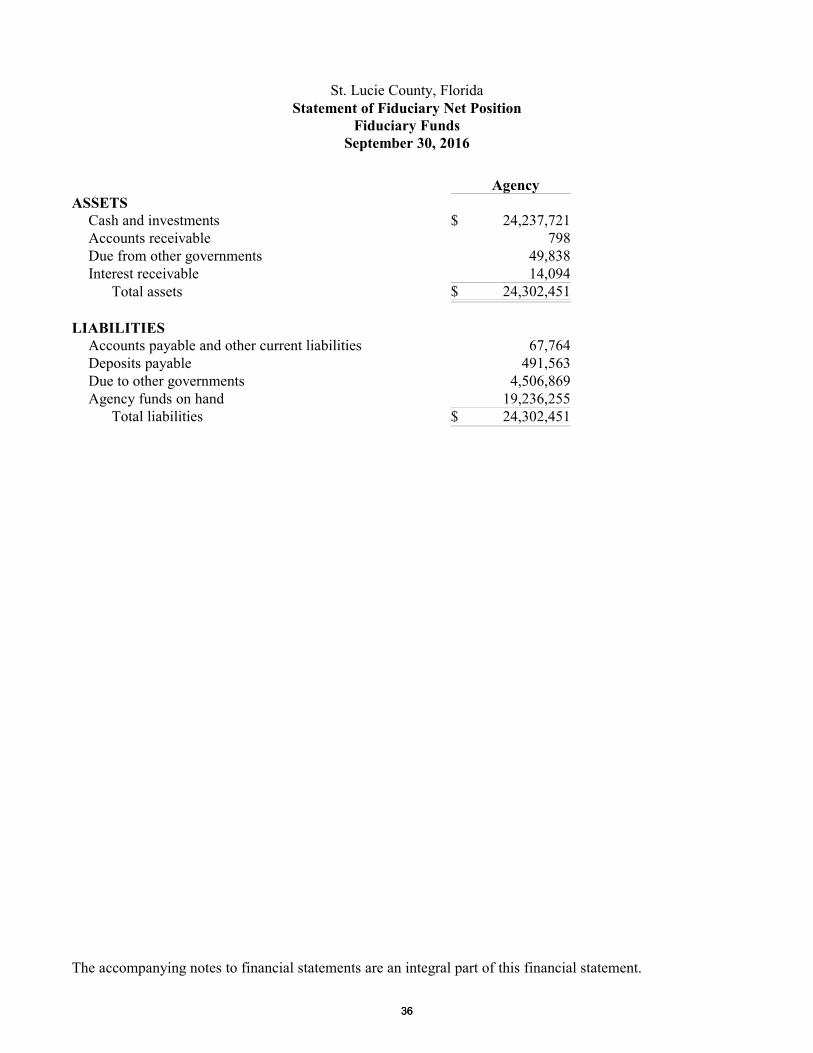
St. Lucie County, FloridaStatement of Fiduciary Net Position
Fiduciary FundsSeptember 30, 2016
AgencyASSETS
Cash and investments $ 24,237,721Accounts receivable 798Due from other governments 49,838Interest receivable 14,094
Total assets $ 24,302,451-
LIABILITIESAccounts payable and other current liabilities 67,764Deposits payable 491,563Due to other governments 4,506,869Agency funds on hand 19,236,255
Total liabilities $ 24,302,451
The accompanying notes to financial statements are an integral part of this financial statement.
3636
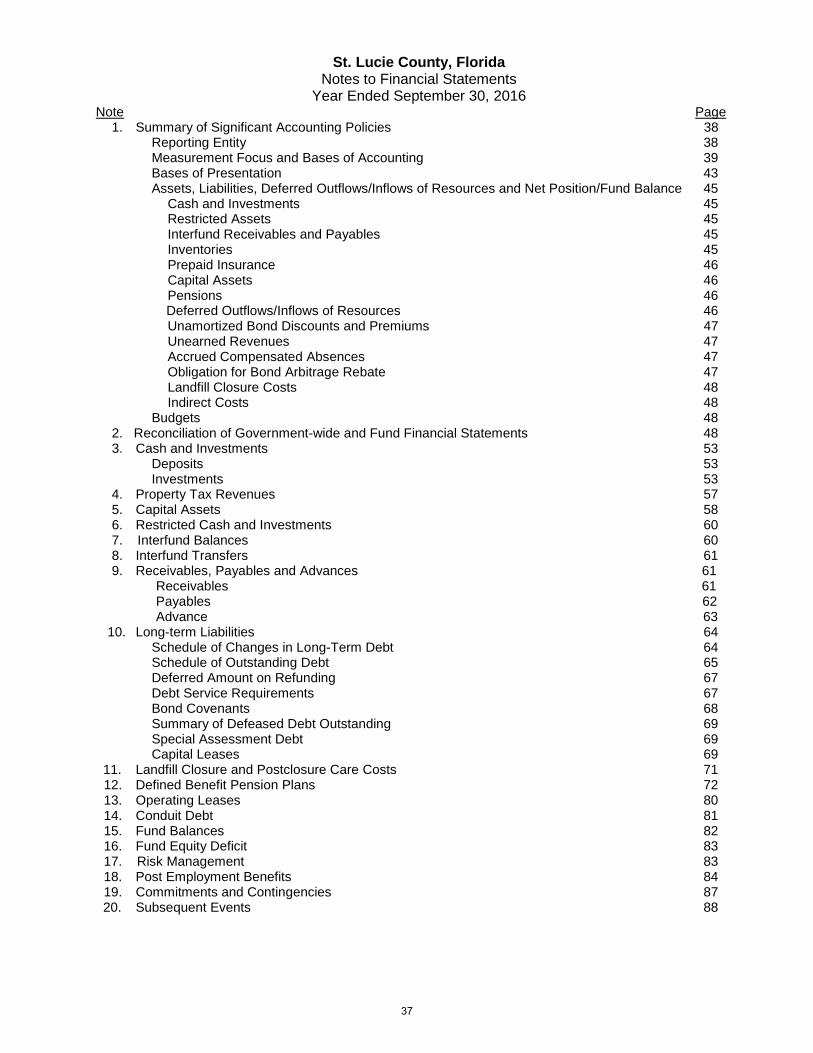
St. Lucie County, Florida Notes to Financial Statements
Year Ended September 30, 2016 Note Page 1. Summary of Significant Accounting Policies 38 Reporting Entity 38 Measurement Focus and Bases of Accounting 39 Bases of Presentation 43 Assets, Liabilities, Deferred Outflows/Inflows of Resources and Net Position/Fund Balance 45 Cash and Investments 45 Restricted Assets 45 Interfund Receivables and Payables 45 Inventories 45 Prepaid Insurance 46
Capital Assets 46 Pensions 46 Deferred Outflows/Inflows of Resources 46 Unamortized Bond Discounts and Premiums 47
Unearned Revenues 47 Accrued Compensated Absences 47 Obligation for Bond Arbitrage Rebate 47
Landfill Closure Costs 48 Indirect Costs 48 Budgets 48 2. Reconciliation of Government-wide and Fund Financial Statements 48
3. Cash and Investments 53 Deposits 53 Investments 53 4. Property Tax Revenues 57 5. Capital Assets 58 6. Restricted Cash and Investments 60 7. Interfund Balances 60 8. Interfund Transfers 61 9. Receivables, Payables and Advances 61 Receivables 61 Payables 62 Advance 63
10. Long-term Liabilities 64 Schedule of Changes in Long-Term Debt 64 Schedule of Outstanding Debt 65 Deferred Amount on Refunding 67 Debt Service Requirements 67 Bond Covenants 68 Summary of Defeased Debt Outstanding 69 Special Assessment Debt 69 Capital Leases 69
11. Landfill Closure and Postclosure Care Costs 71 12. Defined Benefit Pension Plans 72 13. Operating Leases 80 14. Conduit Debt 81 15. Fund Balances 82 16. Fund Equity Deficit 83 17. Risk Management 83 18. Post Employment Benefits 84 19. Commitments and Contingencies 87 20. Subsequent Events 88
37
St. Lucie County, Florida
Notes to Financial Statements
Year Ended September 30, 2016
NOTE 1 – SUMMARY OF SIGNIFICANT ACCOUNTING POLICIES
The financial statements of the County have been prepared in accordance with generally accepted
accounting principles (GAAP) as applied to governmental units. The Governmental Accounting
Standards Board (GASB) is the standard-setting body for governmental accounting and financial
reporting. The GASB periodically updates its codification of the existing Governmental Accounting and
Financial Reporting Standards that which, along with subsequent GASB pronouncements (Statements
and Interpretations), constitutes GAAP for governmental units.
A. Reporting Entity
St. Lucie County, Florida (The “County”), is a non-charter government pursuant to Article VIII, Section
(1)(f), of the Constitution of the State of Florida. The County financial statements contained herein
include and combine the operations of the Board of County Commissioners (the “Board”) and the Clerk
of the Circuit Court, Property Appraiser, Sheriff, Supervisor of Elections, and Tax Collector (the
“Constitutional Officers”).
The Clerk of the Circuit Court serves as ex-officio Clerk of the Board in accordance with Article VIII,
Section (1)(d), of the Constitution of the State of Florida, and Section 125.17, Florida Statutes.
In evaluating the County as a reporting entity, management has addressed all potential component units.
To be includable within the County’s financial statements, the component unit must be financially
accountable or the exclusion of the nature and significance of their relationship with the County would
cause the financial statements to be misleading or incomplete. Blended component units must be
financially accountable to the County; there must be a financial burden/benefit relationship and the
entity, although legally separate, must operate like a fund or department of the County.
Based on applying the above criteria, the County included the following component units in the financial
statements as blended component units.
1. St. Lucie County Mosquito Control District – The District was created by Chapter 29502, Laws of
Florida, Acts of 1953. The District controls mosquitoes and other arthropods of public health
importance for the County and is governed by a Board comprised of the County’s elected
Commissioners. The Board establishes the ad valorem millage for the District. The District is
reported as a special revenue fund and does not issue separate financial statements.
2. Erosion Control District – The District was created by Chapter 67-2001, Laws of Florida. The
District re-nourishes critically-eroded beaches impacted by inlet management and natural processes
in order to protect coastal resources, public and private properties and public infrastructures and is
governed by a Board comprised of the County’s elected Commissioners. The Board establishes the
ad valorem millage for the District. The District is reported as a special revenue fund and does not
issue separate financial statements.
3. St. Lucie County Water and Sewer District – The District was created by Section 153.53, Florida
Statutes. The District provides water, wastewater and reclaimed water service to customers within
the unincorporated areas of the County and is governed by a Board comprised of the County’s
elected Commissioners. The rates for user charges and bond issuance authorizations are approved by
38
St. Lucie County, Florida
Notes to Financial Statements (continued)
Year Ended September 30, 2016
the Board and the County is legally obligated to provide resources in case there are deficiencies in
debt service payments and resources are not available from any other remedies. The District is
reported as an enterprise fund and does not issue separate financial statements.
4. St. Lucie County Housing Finance Authority – The Authority was created by Section 159.601,
Florida Statutes. The Authority provides administrative services for housing assistance within the
County. The main revenue source is the residual funds from loan programs. The Authority is
financially dependent on the County and the Board of County Commissioners appoint a majority of
the Authority’s Board. The Authority is reported as a special revenue fund and does not issue
separate financial statements.
5. Central Florida Foreign-Trade Zone, Inc. (the “Trade Zone”) – The Trade Zone was created by
Sections 288.35 through 288.38, Florida Statutes in 1997 to facilitate the economic development of
the County. The Board of County Commissioners appoint a majority of the Trade Zone’s Board. The
Trade Zone is reported as part of the general fund and does not issue separate financial statements.
6. St. Lucie County Sustainability District - The District was created by Article VII, Section 10 of the
Florida Constitution, Chapter 125, F.S., and Chapter 189, F.S. for the purpose of encouraging,
accommodating, and financing energy efficiency and renewable energy improvements on residential
and commercial properties in the County through non-ad valorem assessments. The District is
reported as a special revenue fund and does not issue separate financial statements.
7. Treasure Coast Education Research and Development Authority – The Authority was created by
Section 159.703, Florida Statutes to foster economic development and broaden the economic base of
St. Lucie County. . The Authority is financially dependent on the County and the Board of County
Commissioners appoint a majority of the Authority’s Board. The Authority is reported as part of the
general fund and does not issue separate financial statements.
Other Entities
St. Lucie, Indian River, Martin and Okeechobee counties jointly fund the Office of the Medical
Examiner, 19th Judicial Circuit. The County partially funds the Indian River Crime Laboratory, which is
supported by various local law enforcement agencies. Books and records are maintained by the Sheriff.
The Governor of the State of Florida appoints the Medical Examiner. The County’s only financial
responsibility for the Medical Examiner is to fund its required percentage of the operating costs of that
office out of the General Fund. The other counties participate in funding the Medical Examiner’s office
in the same manner. Indian River State College maintains the accounting records for the Medical
Examiner’s office.
B. Measurement Focus and Bases of Accounting
The basic financial statements of the County are composed of the following:
Government-wide financial statements
Fund financial statements
39
St. Lucie County, Florida
Notes to Financial Statements (continued)
Year Ended September 30, 2016
Notes to financial statements
1. Government-wide Financial Statements
The government-wide financial statements are reported using the economic resources measurement
focus and the accrual basis of accounting. This means that revenues are recorded when earned and
expenses are recorded when a liability is incurred, regardless of the timing of the related cash flows.
Property taxes are recognized as revenues in the year for which they are levied. Grants and similar
items are recognized as revenues as soon as all eligibility requirements imposed by the provider have
been met.
In applying the “susceptible to accrual” concept to intergovernmental revenues pursuant to GASB
Statement No. 33, Accounting and Financial Reporting for Nonexchange Transactions as amended by
GASB Statement No. 36, Recipient Reporting of Certain Shared Nonexchange Revenues (the County
may act as either provider or recipient), the provider should recognize liabilities and expenses and the
recipient should recognize receivables and revenues when the applicable eligibility requirements
including time requirements, are met. Resources transmitted before the eligibility requirements are
met should, under most circumstances, be reported as advances by the provider and unearned
revenues by the recipient.
As a general rule the effect of interfund activity has been eliminated from the government-wide
financial statements.
The statement of activities demonstrates the degree to which the direct expenses of a given function
or segment are offset by program revenues. Direct expenses are those that are clearly identifiable
with a specific function or segment. Program revenues include 1) charges to customers or applicants
who purchase, use, or directly benefit from goods, services, or privileges provided by a given
function or segment and 2) grants and contributions that are restricted to meeting the operational or
capital requirements of a particular function or segment. Taxes and other items not properly included
among program revenues are reported instead as general revenues.
Business-type activities distinguish operating revenues and expenses from nonoperating items.
Operating revenues and expenses generally result from providing services and producing and
delivering goods in connection with a proprietary fund’s principal ongoing operations. Operating
expenses for enterprise funds include cost of sales and services, administrative expenses, and
depreciation on capital assets. All revenues and expenses not meeting this definition are reported as
nonoperating revenues and expenses.
The government-wide financial statements do not include the fiduciary funds of the County.
2. Fund Financial Statements
The underlying accounting system of the County is organized and operated on the basis of separate
funds, each of which is considered to be a separate accounting entity. The operations of each fund are
accounted for with a separate set of self-balancing accounts that comprise its assets, liabilities, fund
40
St. Lucie County, Florida
Notes to Financial Statements (continued)
Year Ended September 30, 2016
equity, revenues and expenditures (or expenses), as appropriate. Governmental resources are allocated
to and accounted for in individual funds based upon the constraints placed by the revenue sources.
Fund financial statements for the primary government’s governmental and proprietary funds display
information about major funds individually and nonmajor funds in the aggregate. The fiduciary
statement includes financial information for the agency fund, which represents assets held by the County
in a custodial capacity for other individuals or governments.
Governmental Funds
Governmental fund financial statements are reported using the current financial resources measurement
focus and the modified accrual basis of accounting. Revenues are considered to be available when they
are collected within the current period or soon thereafter to pay current period liabilities.
For this purpose, the County considers revenues to be available if they are collected within 45 days of
the end of the current fiscal period. Expenditures generally are recorded when a liability is incurred, as
under accrual accounting. Franchise fees, licenses, sales taxes, gas taxes, operating and capital grants,
and interest associated with the current fiscal period are all considered to be accrual items and so have
been recognized as revenues of the current fiscal period. All other revenue items are considered to be
measurable only when the County receives cash.
Under the current financial resources measurement focus (modified accrual basis), only current assets
and current liabilities are generally included on the balance sheet. The reported fund balance is
considered to be a measure of “available spendable resources”. Governmental fund operating statements
present increases (revenues and other financing sources) and decreases (expenditures and other
financing uses) in net current assets. Accordingly, they are said to present a summary of sources and
uses of “available spendable resources” during a period.
The non-current portion of long-term receivables (special assessments) due to governmental funds are
reported on their balance sheets because of their spending measurement focus. The non-current portions
of other long-term receivables are offset by fund balance reserve accounts. Because of their spending
measurement focus, expenditure recognition for governmental fund types excludes amounts represented
by non-current liabilities. Since they do not affect net current assets, such long-term amounts are not
recognized as governmental fund type expenditures or fund liabilities.
Amounts expended to acquire capital assets are not recorded as fund assets; they are recorded as
expenditures in the fund financial statements. The proceeds of long-term debt are recorded as an “other
financing source”. Debt service, compensated absences, and claims and judgments expenditures are
recorded when the payment is made.
a) Fund Balance Category
GASB Statement 54 – Fund Balance Reporting and Governmental Fund Type Definitions requires the
fund balance for governmental funds to be reported in classifications that comprise a hierarchy based
primarily on the extent to which the government is bound to honor constraints on the specific purposes
41
St. Lucie County, Florida
Notes to Financial Statements (continued)
Year Ended September 30, 2016
for which amounts in those funds can be spent. There are five categories of fund balance for
governmental funds under Statement 54:
Nonspendable Fund Balance – This category includes amounts that cannot be spent because they are
either (1) not in spendable form or (2) legally or contractually required to be maintained intact.
Restricted Fund Balance – This category includes amounts that have externally imposed restrictions or
restrictions imposed by laws.
Committed Fund Balance – This category usually includes the amount that can only be used for
specific purposes adopted by the Board of County Commissioners with an ordinance. This category also
includes contractual obligations which require a formal approval from the Board of County
Commissioners or a Constitutional Officer and the funding has been set aside for the purpose. This type
of fund balance can only be removed by the Board of County Commissioners or a Constitutional Officer
through the same approval process.
Assigned Fund Balance – This category usually consists of the Board of County Commissioners’ intent
to be used for specific purposes, but are neither restricted nor committed. The assigned fund balances
can also be assigned by the County Administrator pursuant to Board action. For fund balance reserve
assignments, see the fund balance policy below. Other assigned fund balances are approved by the
Board as part of the budget approval process through budget resolutions.
Unassigned Fund Balance – Residual amounts in the general fund that do not meet any of the other
fund balance classifications.
b) Fund Balance Policy
The County has a fund balance and reserve policy that set forth the following reserves of fund balance:
Reserve Policy – The County’s financial policy requires the Board of County Commissioners to
establish an emergency reserve in the general fund. The amount should be 5% of the total operating
budget excluding funds that have a minimum of 10% of the fund’s operating budget or $2,000,000 in
reserves, whichever is greater. The amount can only be utilized for natural and manmade disasters. The
amount is presented as an assigned fund balance of the general fund.
Budget Deficit Reserve Policy - The Board of County Commissioners established a budget deficit
reserve policy during fiscal year 2010. The intent of the reserve is to assign the needed amount from
unassigned fund balance for the following year’s budget purposes. The amount may be adjusted by the
County Administrator and can only be utilized for budget balancing needs. The amount is presented as
an assigned fund balance of the general fund.
c) Fund Balance Spending Hierarchy
For all governmental funds except special revenue funds, when restricted, committed, assigned, and
unassigned fund balances are combined in a fund, qualified expenditures are paid first from restricted or
42
St. Lucie County, Florida
Notes to Financial Statements (continued)
Year Ended September 30, 2016
committed fund balance, as appropriate, then assigned and finally unassigned fund balances. Qualified
expenditures reduce the appropriate fund balances when the expenditure is incurred.
For special revenue funds, when restricted and committed fund balances are combined in a special
revenue fund, expenditures are paid first from committed fund balance, as appropriate, then restricted
fund balances.
Proprietary Funds
The County’s enterprise funds and internal service fund are proprietary funds and are presented
using the economic resources measurement focus (accrual basis of accounting). Revenues are
recognized when they are earned and expenses are recognized when the related goods or services
are delivered. All current and non-current assets and liabilities are included on the Statement of
Net Position. Revenues represent increases and expenses represent decreases in total net position
on the Statement of Revenues, Expenses, and Changes in Net Position.
Proprietary fund operating revenues, such as charges for services, and operating expenses, such as
salaries, supplies, and contracted services, result from exchange transactions associated with the
principal activity of the fund. Exchange transactions are those in which each party receives and gives up
essentially equal values. Non-operating revenues, such as subsidies, taxes, and investment earnings, and
non-operating expenses, such as interest expense, loss on sale of assets, and arbitrage expense, result
from nonexchange transactions or ancillary activities. Amounts paid to acquire capital assets are
recorded in the fund as assets. The proceeds of long-term debt are recorded as a fund liability. Amounts
paid to reduce long-term indebtedness are reported as a reduction of the related liabilities.
Fiduciary Fund
The agency fund reports only assets and liabilities; therefore, it does not have a measurement focus.
However, it uses the accrual basis of accounting to recognize receivables and payables.
C. Bases of Presentation
GASB Statement 34 sets forth minimum criteria (percentage of the assets, liabilities, revenues, or
expenditures/expenses of either fund category and the governmental and proprietary combined)
for the determination of major funds. The County has elected to use GASB 34 minimum criteria
for major fund determination. The nonmajor funds are combined in a column titled, Other
Governmental Funds. The details of the nonmajor funds are listed in the combining section
under supplemental information.
1. Governmental Major Funds
General Fund – The General Fund is the general operating fund of the County. It is used to
account for all financial activity not accounted for in another fund.
Transportation Trust Fund – The Transportation Trust Fund accounts for the operations of the
road and bridge and engineering departments. Financing is provided primarily by gas taxes.
43
St. Lucie County, Florida
Notes to Financial Statements (continued)
Year Ended September 30, 2016
The Transportation Trust Fund did not meet the GASB 34 minimum criteria for major fund
determination for fiscal year 2016. However, the County elected this fund to be a major fund to
enhance consistency from the prior fiscal year.
Fine and Forfeiture Fund – The Fine and Forfeiture Fund accounts for law enforcement and
court-related projects that are funded by ad valorem taxes, fines, filing fees, and proceeds from
confiscated property.
SHI Special Assessment Bond Fund – The SHI Special Assessment Bond Fund accounts for
debt service assessment revenues pledged to pay the South Hutchinson Island 1998 special
assessment debts.
N. Lennard Road Bonds I & S Fund – The N. Lennard Road Bonds I & S Fund accounts for debt service
assessment revenues pledged to pay the N. Lennard Road Phase 1, 2 & 3 special assessment debts.
Impact Fee Fund – The Impact Fee Fund is used to account for impact fees used for parks, libraries,
public buildings and correctional buildings.
2. Proprietary Major Funds
Bailing & Recycling Facility Fund – The Bailing & Recycling Facility Fund provides funding
to operate the County’s landfills, a recycling division and the hazardous waste division. In
addition, estimated costs of closure and long-term care of the landfill operations are included in
this fund.
Golf Course Fund – The Golf Course Fund accounts for the operation of a high quality, low
cost, service oriented public golf course for the County.
Water & Sewer District Fund – The Water & Sewer District Fund accounts for the operation of a
water and sewer facility for certain residents in various sections of the County.
3. Other Fund Types
Internal Service Fund – The Internal Service Fund accounts for the payment of countywide health
and property and casualty liability insurances. Funding is provided by user charges to the various
departments of the Board and Constitutional Officers (except the Sheriff).
Fiduciary Funds – The Agency Funds are used to account for the collection and disbursement of
monies by the County on behalf of other governments and individuals, such as Constitutional
Officer investments, public law library funds, certain sales tax revenues, various Municipal
Service Benefit Units (MSBU), cash bonds, traffic fines, motor vehicle fees, ad valorem taxes,
delinquent taxes, and process serving within the County.
44
St. Lucie County, Florida
Notes to Financial Statements (continued)
Year Ended September 30, 2016
4. Non-current Governmental Assets/Liabilities GASB Statement 34 requires non-current governmental assets (such as land, buildings, and
improvements) and non-current governmental liabilities (such as general obligation bonds and
capital leases) to be reported in the governmental activities column in the government-wide
Statement of Net Position.
D. Assets, Liabilities, Deferred Outflows/Inflows of Resources and Net Position/Fund
Balance
1. Cash and Investments The County maintains a cash and investment pool that is available for use by all funds. Earnings from
the pooled investments are allocated to the respective funds based on applicable cash participation by
each fund. The investment pool is managed such that all participating funds have the ability to deposit
and withdraw cash as if they were demand deposit accounts. Therefore, all balances representing
participants’ equity in the investment pool are classified as cash and investments for financial statement
purposes. For the statement of cash flows, the County considers cash and investments to include the
Local Government Surplus Funds Trust Fund (Florida State Board of Administration) and the Florida
Local Government Investment Trust Fund.
In accordance with Sections 125.31 and 218.415, Florida Statutes, and the Board’s investment policy,
the Board is authorized to invest in negotiable direct obligations of, or obligations the principal and
interest of which are unconditionally guaranteed by, the United States Government, obligations of US
corporations, commercial papers, the State Investment Pool, Florida Local Government Investment
Trust, nonnegotiable interest-bearing time certificates of deposit, money market accounts, repurchase
agreements, equities and mutual funds. All investments are reported at fair value.
2. Restricted Assets
Certain assets of the County are classified as restricted assets on the Statement of Net position because
their use is limited either by law through constitutional provisions or enabling legislation; or by
restrictions imposed externally by creditors, grantors, contributors, or laws or regulations of other
governments.
3. Interfund Receivables and Payables
Activities between funds that are representative of lending/borrowing arrangements outstanding at the
end of the fiscal year are referred to as “due to/from other funds”. Long term lending/borrowing
arrangements between funds are classified as advances. Any residual balances outstanding between the
governmental activities and business-type activities are reported in the government-wide financial
statements as “internal balances”.
4. Inventories
Inventories of supplies in the special revenue funds are recognized as expenditures at the time of
purchase. Inventories on hand are recorded at cost on a first in-first out or weighted average basis. In
addition, a corresponding entry is made for a non-spendable fund balance. Inventories in the proprietary
fund types are recorded at cost using the weighted average method and recognized as expenses as they
are consumed.
45
St. Lucie County, Florida
Notes to Financial Statements (continued)
Year Ended September 30, 2016
5. Prepaid Insurance
Normal operating prepaid insurance is expensed when paid. Prepaid bond insurance is capitalized as
prepaid insurance and amortized over the life of the bonds.
6. Capital Assets
Capital assets, which include land, buildings, improvements, equipment and construction in progress,
are reported in the applicable governmental or business-type activities column.
The County defines software and equipment as capital assets with an initial, individual cost of $1,000 or
more and an estimated useful life in excess of one year. In addition, the County defines land, building,
infrastructure, and improvements other than buildings as capital assets with an initial cost of $25,000 or
more and an estimated useful life in excess of one year. The valuation basis for all assets is historical
cost.
Donated capital assets are recorded at estimated fair market value at the date of the donation. The costs
of normal maintenance and repairs that do not add to the value of the asset, or materially extend its
useful life, are not capitalized.
Major outlays for capital assets and improvements are capitalized as projects are constructed. Interest
incurred during the construction phase of capital assets of business-type activities is included as part of
the capitalized value of assets constructed.
Depreciation of capital assets is computed and recorded by utilizing the straight-line method. Estimated
useful lives of the various classes of depreciable capital assets are as follows: buildings, 7-39 years;
improvements, 5-50 years; and equipment, 2-10 years.
The County holds legal title to the capital assets (except the equipment of the Sheriff) used in the
operation of the Board, Clerk of the Circuit Court, Property Appraiser, Sheriff, Supervisor of Elections
and Tax Collector, and is accountable for them under Florida Law. The Sheriff holds legal title to the
equipment used in its operations and is accountable for them under Florida law.
7. Pensions
In the government-wide statement of net position, liabilities are recognized for the County’s
proportionate share of each pension plan’s net pension liability. For purposes of measuring the net
pension liability, deferred outflows of resources and deferred inflows of resources related to pensions,
and pension expense, information about the fiduciary net position of the Florida Retirement System
(FRS) defined benefit plan and the Health Insurance Subsidy (HIS) defined benefit plan and additions
to/deductions from the FRS and the HIS fiduciary net position have been determined on the same basis
as they are reported by the FRS and the HIS plans. For this purpose, defined benefit payments (including
refunds of employee contributions) are recognized when due and payable in accordance with benefit
terms. Investments are reported as fair value.
8. Deferred Outflows/Inflows of Resources
Deferred outflows of resources represent a consumption of net position/fund balance that applies to a
future period(s) and so will not be recognized as an outflow of resources (expense/expenditure) until
46
St. Lucie County, Florida
Notes to Financial Statements (continued)
Year Ended September 30, 2016
then. The deferred amount on refunding and deferred outflows related to the pension plan reported on
the Statement of Net Position. A deferred amount on refunding results from the difference in the
carrying value of refunded debt and its reacquisition price. This amount is deferred and amortized over
the shorter of the life of the refunded or refunding debt. Deferred outflows related to the pension plan
represent the County’s share of the FRS (Florida Retirement System) and HIS (Health Insurance
subsidy) pension liabilities.
Deferred inflows of resources represent an acquisition of net position/fund balance that applies to a
future period(s) and so will not be recognized as an inflow of resources (revenue) until then. The
unavailable revenues are reported only in the governmental funds balance sheet. The sources of the
unavailable revenues are special assessments on road paving, utility projects and grant reimbursements.
This amount is deferred and recognized as revenues in the period the amounts become available. The
deferred inflows related to the pension plan represent the County’s share of the FRS and HIS pension
liabilities, which is only reported on the Statement of Net Position.
9. Unamortized Bond Discounts and Premiums
Proprietary fund revenue bond discounts and premiums are presented on the government-wide and fund
financial statements. The costs are amortized over the life of the bonds using the appropriate method of
accounting. For financial reporting, the unamortized bond discounts and premiums are netted against
the applicable long-term debt. The governmental fund bond discounts and premiums are presented on
the government-wide financial statements. The costs are amortized over the life of the bonds using the
appropriate method of accounting. For financial reporting, the unamortized bond discounts and
premiums are netted against the applicable long-term debt.
10. Unearned Revenues
Unearned revenues reported in government-wide financial statements will be recognized as revenues in
the fiscal year they are earned in accordance with the accrual basis of accounting.
11. Accrued Compensated Absences
The County accrues unused portions of vacation pay and comp time in the period the fund liability is
incurred. As permitted by Governmental Accounting Standards Board Statement No. 16, the vesting
method is used to accrue the sick leave liability. The liability is based on the sick leave accumulated at
year-end by those employees who are currently eligible to receive termination payments as well as other
employees who are expected to become eligible to receive such payments.
Even though the County has appropriated, accumulated and earmarked expendable available fund
resources for these amounts, the portion not normally expected to be liquidated with expendable
available financial resources is not reported as a fund liability (in accordance with Interpretation No. 6
of the Governmental Accounting Standards Board – Recognition and Measurement of Certain Liabilities
and Expenditures) in governmental fund financial statements. The accrued compensated absence
liabilities payable from available resources are recognized as expenditures in governmental funds if they
have matured.
12. Obligation for Bond Arbitrage Rebate
Pursuant to Section 148(f) of the U.S. Internal Revenue Code, the County must rebate to the United
States Government the excess of interest earned from the investment of certain debt proceeds and
47
St. Lucie County, Florida
Notes to Financial Statements (continued)
Year Ended September 30, 2016
pledged revenues over the yield rate of the applicable debt. This approach treats the rebate as an
expense when it is actually payable to the federal government.
13. Landfill Closure Costs
Under the terms of current state and federal regulations, the Bailing & Recycling Facility is required to
place a final cover on closed landfill areas, and to perform certain monitoring and maintenance functions
for a period of up to 30 years after closure. The Bailing & Recycling Facility recognizes these costs of
closure and post-closure maintenance over the active life of each landfill area, based on landfill capacity
used during the period. Required obligations for closure and post-closure costs are recognized in the
Bailing & Recycling Facility Fund.
14. Indirect Costs
The County utilizes a pre-determined automatic indirect cost distribution formula to distribute its annual
indirect costs. Certain indirect costs are included in the program expense reported for individual
functions and activities.
E. Budgets
Pursuant to Section 129.03, Florida Statutes, budgets are prepared and adopted for the Board after public
hearings for the governmental funds, in accordance with Section 200.65, Florida Statutes. The
Constitutional Officers submit, at various times, to the Board and to certain divisions within the
Department of Revenue, State of Florida, a proposed operating budget for the fiscal year commencing
the following October 1. The operating budget includes proposed expenditures and the means of
financing them, as set forth in Chapter 129 Florida Statutes. The Department of Revenue, State of
Florida, has the final authority on the operating budgets for the Tax Collector and Property Appraiser
included in the General Fund. The Florida Court Clerk Operations Corporation has the final authority on
the court related operating budget for the Clerk of the Circuit Court included in the general fund.
The County utilizes the same basis of accounting for budgets as it does for revenues and expenditures in
its various funds. All budgeted appropriations lapse at year end. Formal budgets are adopted for the
general, special revenue, debt service and capital projects funds. The legal level of budgetary control is
at the fund level. As a result, deficits in the budget columns of the accompanying financial statements
may occur in individual expenditure line items.
NOTE 2 – RECONCILIATION OF GOVERNMENT-WIDE AND FUND FINANCIAL
STATEMENTS
A. Explanation of Differences between the Governmental Fund Balance Sheet and the
Government-wide Statement of Net Position
The governmental fund balance sheet includes a reconciliation between fund balance-total
governmental funds and net position-governmental activities as reported in the government-wide
statement of net position. “Total fund balances” of the County’s governmental funds
($188,308,167) differs from “net position” of governmental activities ($557,016,100) reported in
the statement of net position. This difference primarily results from the long-term economic
focus of the statement of net position versus the current financial resources focus of the
governmental fund balance sheet. The effect of the differences is illustrated below.
48
St. Lucie County, Florida
Notes to Financial Statements (continued)
Year Ended September 30, 2016
Capital related items
When capital assets (land, building and improvements, equipment, and construction in progress)
that are to be used in the governmental activities are purchased or constructed, the costs of those
assets are reported as expenditures in governmental funds. However, the statement of net
position included those capital assets among the assets of the County as a whole.
Cost of capital assets $ 855,917,958
Less: Accumulated depreciation (280,946,361)
Total $ 574,971,597
Other post-employment benefits/net pension liability
Accrued other post-employment benefits are not financial uses, and therefore, are not reported in
the funds.
Other post-employment benefits $ (36,561,278)
Net pension liability (107,420,602)
Total $ (143,981,880)
Long-term debt transactions
Long-term liabilities applicable to the County’s governmental activities are not due and payable
in the current period and accordingly are not reported in the funds. Balances at September 30,
2016 were:
Bonds payable $ (56,980,000)
Notes payable (40,357,751)
Special assessment bonds (6,588,054)
Capital lease payable (10,001,268)
Compensated absences (14,902,442)
Total $ (128,829,515)
Deferred amount on refunding
The deferred amount on refunding of bonds, net of accumulated amortization, is reflected in the
deferred outflows of resources in the statement of net position.
Deferred amount on refunding $ 3,279,201
Less: Amortization expense (264,989)
Total $ 3,014,212
Bond premiums
Certain premiums are reflected net of accumulated amortization in the notes and bonds payable in
the statement of net position.
Bond premiums $ (4,433,163)
Less: Amortization expense 326,448
Total $ (4,106,715)
49
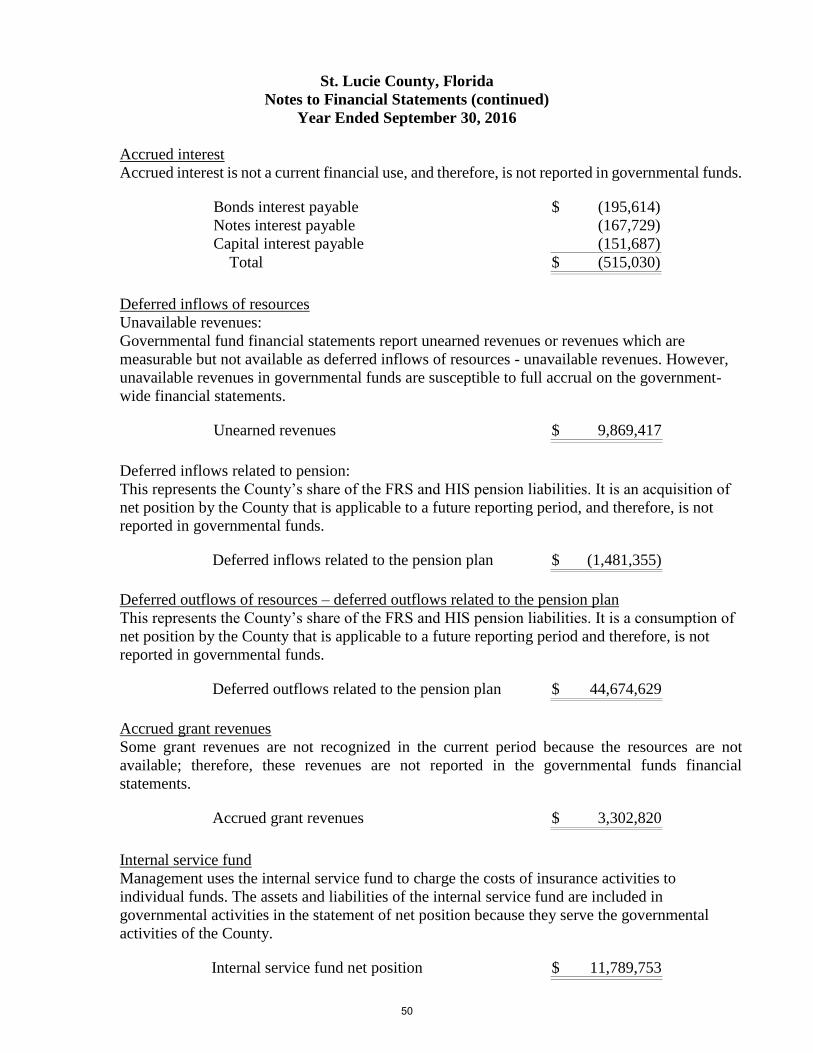
St. Lucie County, Florida
Notes to Financial Statements (continued)
Year Ended September 30, 2016
Accrued interest
Accrued interest is not a current financial use, and therefore, is not reported in governmental funds.
Bonds interest payable $ (195,614)
Notes interest payable (167,729)
Capital interest payable (151,687)
Total $ (515,030)
Deferred inflows of resources
Unavailable revenues:
Governmental fund financial statements report unearned revenues or revenues which are
measurable but not available as deferred inflows of resources - unavailable revenues. However,
unavailable revenues in governmental funds are susceptible to full accrual on the government-
wide financial statements.
Unearned revenues $ 9,869,417
Deferred inflows related to pension:
This represents the County’s share of the FRS and HIS pension liabilities. It is an acquisition of
net position by the County that is applicable to a future reporting period, and therefore, is not
reported in governmental funds.
Deferred inflows related to the pension plan $ (1,481,355)
Deferred outflows of resources – deferred outflows related to the pension plan
This represents the County’s share of the FRS and HIS pension liabilities. It is a consumption of
net position by the County that is applicable to a future reporting period and therefore, is not
reported in governmental funds.
Deferred outflows related to the pension plan $ 44,674,629
Accrued grant revenues
Some grant revenues are not recognized in the current period because the resources are not
available; therefore, these revenues are not reported in the governmental funds financial
statements.
Accrued grant revenues $ 3,302,820
Internal service fund
Management uses the internal service fund to charge the costs of insurance activities to
individual funds. The assets and liabilities of the internal service fund are included in
governmental activities in the statement of net position because they serve the governmental
activities of the County.
Internal service fund net position $ 11,789,753
50
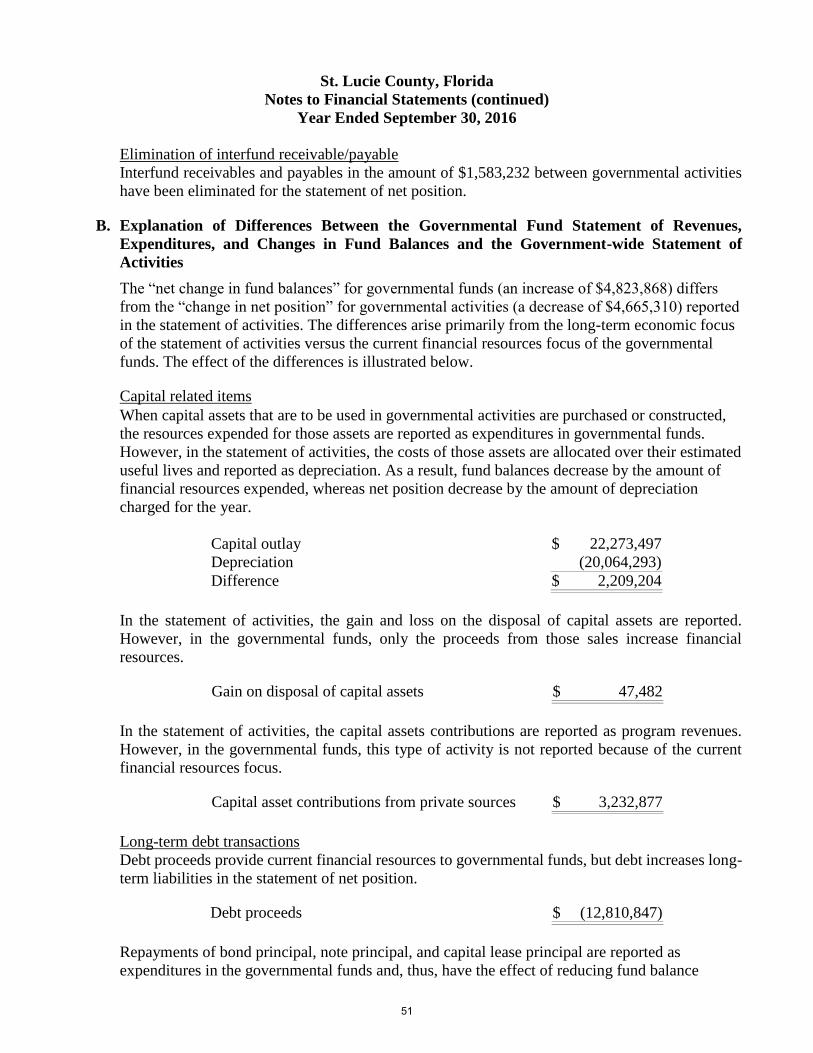
St. Lucie County, Florida
Notes to Financial Statements (continued)
Year Ended September 30, 2016
Elimination of interfund receivable/payable
Interfund receivables and payables in the amount of $1,583,232 between governmental activities
have been eliminated for the statement of net position.
B. Explanation of Differences Between the Governmental Fund Statement of Revenues,
Expenditures, and Changes in Fund Balances and the Government-wide Statement of
Activities
The “net change in fund balances” for governmental funds (an increase of $4,823,868) differs
from the “change in net position” for governmental activities (a decrease of $4,665,310) reported
in the statement of activities. The differences arise primarily from the long-term economic focus
of the statement of activities versus the current financial resources focus of the governmental
funds. The effect of the differences is illustrated below.
Capital related items
When capital assets that are to be used in governmental activities are purchased or constructed,
the resources expended for those assets are reported as expenditures in governmental funds.
However, in the statement of activities, the costs of those assets are allocated over their estimated
useful lives and reported as depreciation. As a result, fund balances decrease by the amount of
financial resources expended, whereas net position decrease by the amount of depreciation
charged for the year.
Capital outlay $ 22,273,497
Depreciation (20,064,293)
Difference $ 2,209,204
In the statement of activities, the gain and loss on the disposal of capital assets are reported.
However, in the governmental funds, only the proceeds from those sales increase financial
resources.
Gain on disposal of capital assets $ 47,482
In the statement of activities, the capital assets contributions are reported as program revenues.
However, in the governmental funds, this type of activity is not reported because of the current
financial resources focus.
Capital asset contributions from private sources $ 3,232,877
Long-term debt transactions
Debt proceeds provide current financial resources to governmental funds, but debt increases long-
term liabilities in the statement of net position.
Debt proceeds $ (12,810,847)
Repayments of bond principal, note principal, and capital lease principal are reported as
expenditures in the governmental funds and, thus, have the effect of reducing fund balance
51
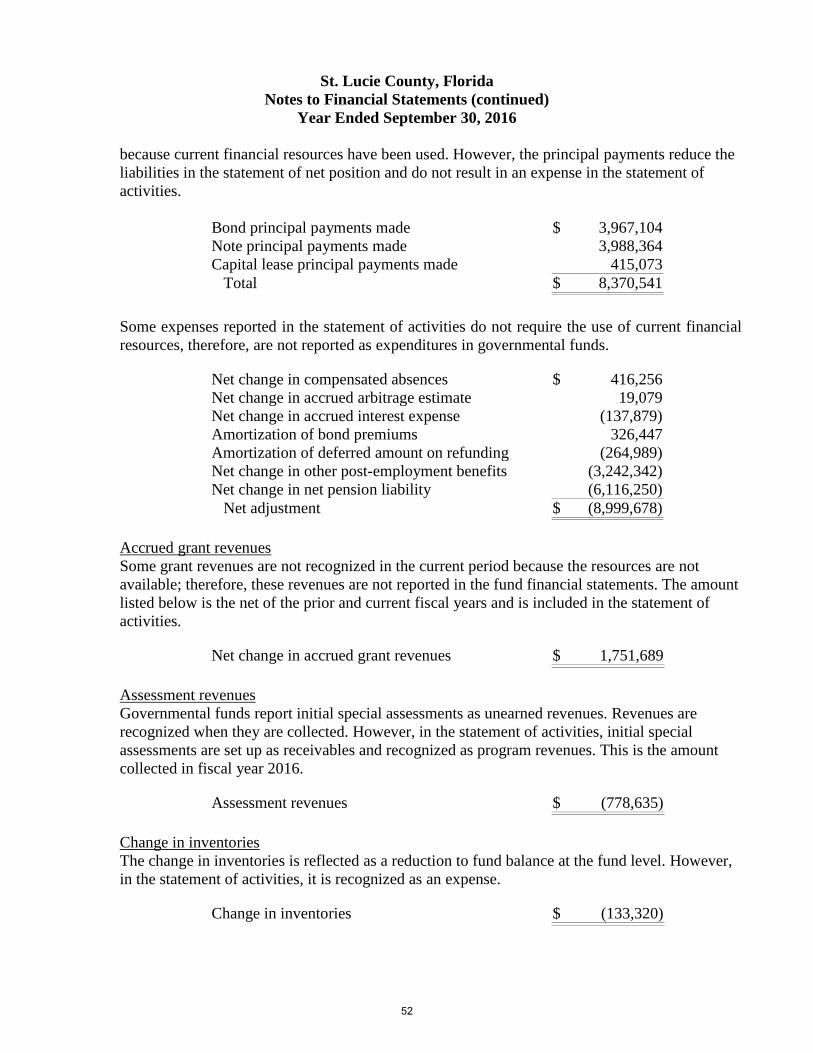
St. Lucie County, Florida
Notes to Financial Statements (continued)
Year Ended September 30, 2016
because current financial resources have been used. However, the principal payments reduce the
liabilities in the statement of net position and do not result in an expense in the statement of
activities.
Bond principal payments made $ 3,967,104
Note principal payments made 3,988,364
Capital lease principal payments made 415,073
Total $ 8,370,541
Some expenses reported in the statement of activities do not require the use of current financial
resources, therefore, are not reported as expenditures in governmental funds.
Net change in compensated absences $ 416,256
Net change in accrued arbitrage estimate 19,079
Net change in accrued interest expense (137,879)
Amortization of bond premiums 326,447
Amortization of deferred amount on refunding (264,989)
Net change in other post-employment benefits (3,242,342)
Net change in net pension liability (6,116,250)
Net adjustment $ (8,999,678)
Accrued grant revenues
Some grant revenues are not recognized in the current period because the resources are not
available; therefore, these revenues are not reported in the fund financial statements. The amount
listed below is the net of the prior and current fiscal years and is included in the statement of
activities.
Net change in accrued grant revenues $ 1,751,689
Assessment revenues
Governmental funds report initial special assessments as unearned revenues. Revenues are
recognized when they are collected. However, in the statement of activities, initial special
assessments are set up as receivables and recognized as program revenues. This is the amount
collected in fiscal year 2016.
Assessment revenues $ (778,635)
Change in inventories
The change in inventories is reflected as a reduction to fund balance at the fund level. However,
in the statement of activities, it is recognized as an expense.
Change in inventories $ (133,320)
52
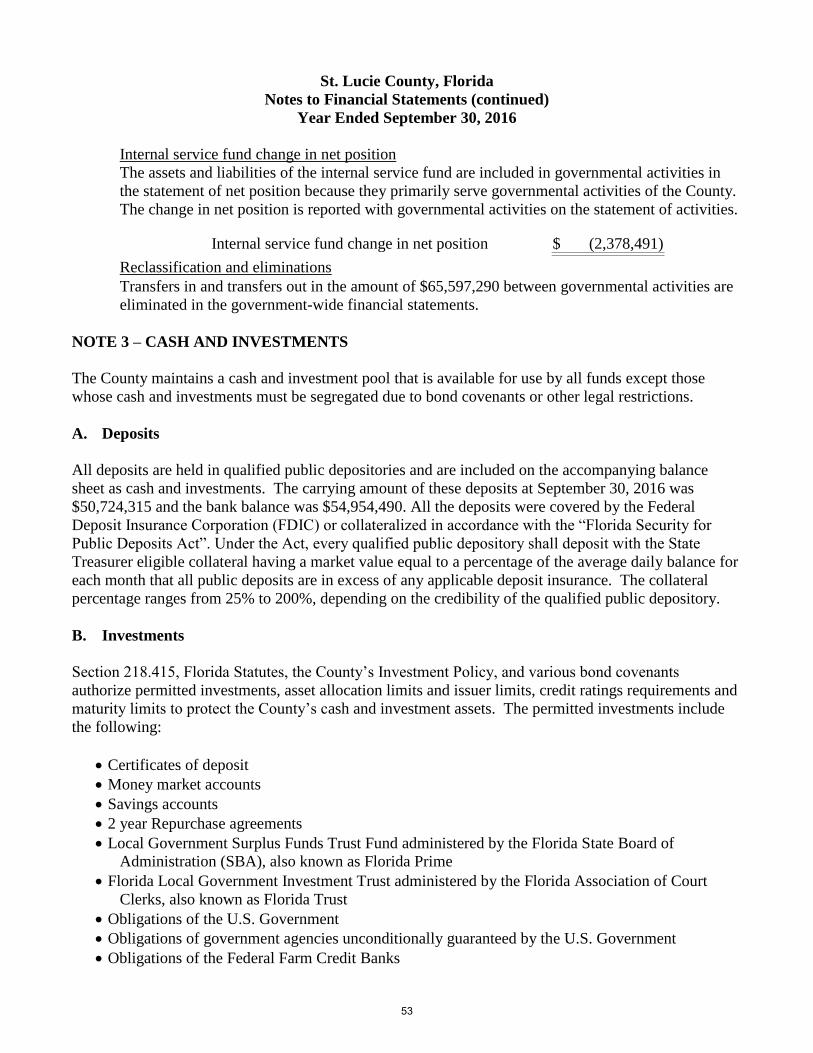
St. Lucie County, Florida
Notes to Financial Statements (continued)
Year Ended September 30, 2016
Internal service fund change in net position
The assets and liabilities of the internal service fund are included in governmental activities in
the statement of net position because they primarily serve governmental activities of the County.
The change in net position is reported with governmental activities on the statement of activities.
Internal service fund change in net position $ (2,378,491)
Reclassification and eliminations
Transfers in and transfers out in the amount of $65,597,290 between governmental activities are
eliminated in the government-wide financial statements.
NOTE 3 – CASH AND INVESTMENTS
The County maintains a cash and investment pool that is available for use by all funds except those
whose cash and investments must be segregated due to bond covenants or other legal restrictions.
A. Deposits
All deposits are held in qualified public depositories and are included on the accompanying balance
sheet as cash and investments. The carrying amount of these deposits at September 30, 2016 was
$50,724,315 and the bank balance was $54,954,490. All the deposits were covered by the Federal
Deposit Insurance Corporation (FDIC) or collateralized in accordance with the “Florida Security for
Public Deposits Act”. Under the Act, every qualified public depository shall deposit with the State
Treasurer eligible collateral having a market value equal to a percentage of the average daily balance for
each month that all public deposits are in excess of any applicable deposit insurance. The collateral
percentage ranges from 25% to 200%, depending on the credibility of the qualified public depository.
B. Investments
Section 218.415, Florida Statutes, the County’s Investment Policy, and various bond covenants
authorize permitted investments, asset allocation limits and issuer limits, credit ratings requirements and
maturity limits to protect the County’s cash and investment assets. The permitted investments include
the following:
Certificates of deposit
Money market accounts
Savings accounts
2 year Repurchase agreements
Local Government Surplus Funds Trust Fund administered by the Florida State Board of
Administration (SBA), also known as Florida Prime
Florida Local Government Investment Trust administered by the Florida Association of Court
Clerks, also known as Florida Trust
Obligations of the U.S. Government
Obligations of government agencies unconditionally guaranteed by the U.S. Government
Obligations of the Federal Farm Credit Banks
53
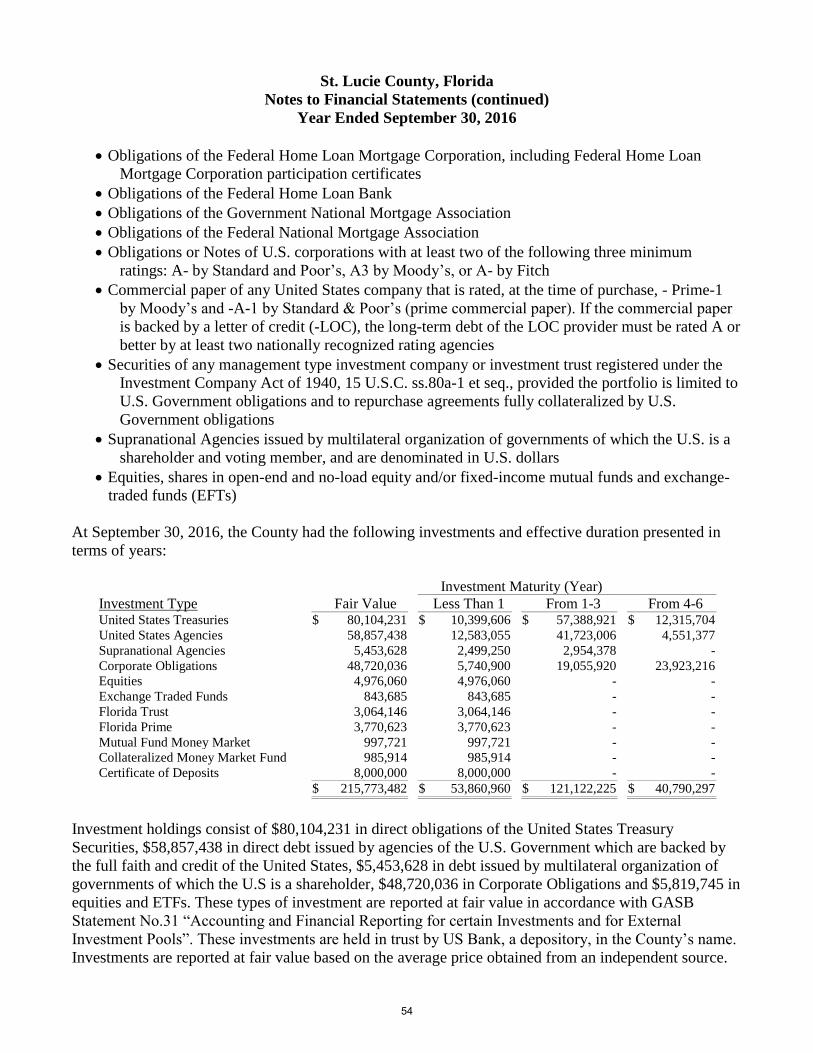
St. Lucie County, Florida
Notes to Financial Statements (continued)
Year Ended September 30, 2016
Obligations of the Federal Home Loan Mortgage Corporation, including Federal Home Loan
Mortgage Corporation participation certificates
Obligations of the Federal Home Loan Bank
Obligations of the Government National Mortgage Association
Obligations of the Federal National Mortgage Association
Obligations or Notes of U.S. corporations with at least two of the following three minimum
ratings: A- by Standard and Poor’s, A3 by Moody’s, or A- by Fitch
Commercial paper of any United States company that is rated, at the time of purchase, - Prime-1
by Moody’s and -A-1 by Standard & Poor’s (prime commercial paper). If the commercial paper
is backed by a letter of credit (-LOC), the long-term debt of the LOC provider must be rated A or
better by at least two nationally recognized rating agencies
Securities of any management type investment company or investment trust registered under the
Investment Company Act of 1940, 15 U.S.C. ss.80a-1 et seq., provided the portfolio is limited to
U.S. Government obligations and to repurchase agreements fully collateralized by U.S.
Government obligations
Supranational Agencies issued by multilateral organization of governments of which the U.S. is a
shareholder and voting member, and are denominated in U.S. dollars
Equities, shares in open-end and no-load equity and/or fixed-income mutual funds and exchange-
traded funds (EFTs)
At September 30, 2016, the County had the following investments and effective duration presented in
terms of years:
Investment Maturity (Year)
Investment Type Fair Value Less Than 1 From 1-3 From 4-6 United States Treasuries $ 80,104,231 $ 10,399,606 $ 57,388,921 $ 12,315,704
United States Agencies 58,857,438 12,583,055 41,723,006 4,551,377
Supranational Agencies 5,453,628 2,499,250 2,954,378 -
Corporate Obligations 48,720,036 5,740,900 19,055,920 23,923,216
Equities 4,976,060 4,976,060 - -
Exchange Traded Funds 843,685 843,685 - -
Florida Trust 3,064,146 3,064,146 - -
Florida Prime 3,770,623 3,770,623 - -
Mutual Fund Money Market 997,721 997,721 - -
Collateralized Money Market Fund 985,914 985,914 - -
Certificate of Deposits 8,000,000 8,000,000 - -
$ 215,773,482 $ 53,860,960 $ 121,122,225 $ 40,790,297
Investment holdings consist of $80,104,231 in direct obligations of the United States Treasury
Securities, $58,857,438 in direct debt issued by agencies of the U.S. Government which are backed by
the full faith and credit of the United States, $5,453,628 in debt issued by multilateral organization of
governments of which the U.S is a shareholder, $48,720,036 in Corporate Obligations and $5,819,745 in
equities and ETFs. These types of investment are reported at fair value in accordance with GASB
Statement No.31 “Accounting and Financial Reporting for certain Investments and for External
Investment Pools”. These investments are held in trust by US Bank, a depository, in the County’s name.
Investments are reported at fair value based on the average price obtained from an independent source.
54
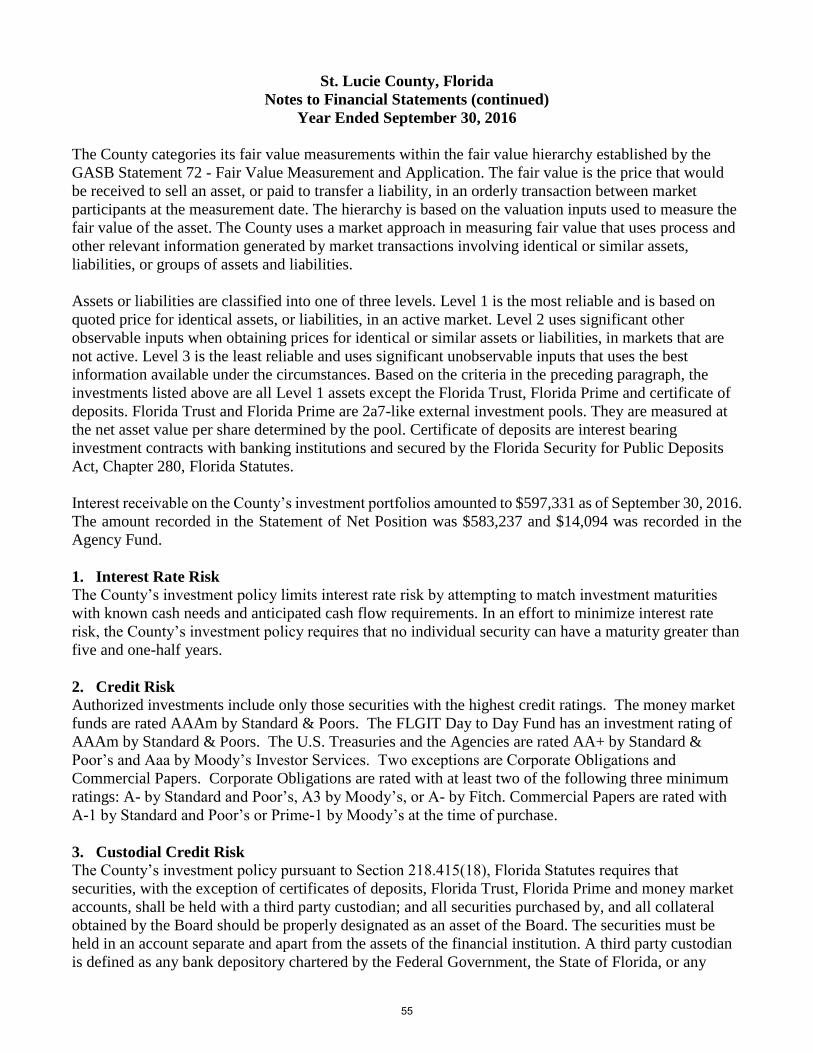
St. Lucie County, Florida
Notes to Financial Statements (continued)
Year Ended September 30, 2016
The County categories its fair value measurements within the fair value hierarchy established by the
GASB Statement 72 - Fair Value Measurement and Application. The fair value is the price that would
be received to sell an asset, or paid to transfer a liability, in an orderly transaction between market
participants at the measurement date. The hierarchy is based on the valuation inputs used to measure the
fair value of the asset. The County uses a market approach in measuring fair value that uses process and
other relevant information generated by market transactions involving identical or similar assets,
liabilities, or groups of assets and liabilities.
Assets or liabilities are classified into one of three levels. Level 1 is the most reliable and is based on
quoted price for identical assets, or liabilities, in an active market. Level 2 uses significant other
observable inputs when obtaining prices for identical or similar assets or liabilities, in markets that are
not active. Level 3 is the least reliable and uses significant unobservable inputs that uses the best
information available under the circumstances. Based on the criteria in the preceding paragraph, the
investments listed above are all Level 1 assets except the Florida Trust, Florida Prime and certificate of
deposits. Florida Trust and Florida Prime are 2a7-like external investment pools. They are measured at
the net asset value per share determined by the pool. Certificate of deposits are interest bearing
investment contracts with banking institutions and secured by the Florida Security for Public Deposits
Act, Chapter 280, Florida Statutes.
Interest receivable on the County’s investment portfolios amounted to $597,331 as of September 30, 2016.
The amount recorded in the Statement of Net Position was $583,237 and $14,094 was recorded in the
Agency Fund.
1. Interest Rate Risk
The County’s investment policy limits interest rate risk by attempting to match investment maturities
with known cash needs and anticipated cash flow requirements. In an effort to minimize interest rate
risk, the County’s investment policy requires that no individual security can have a maturity greater than
five and one-half years.
2. Credit Risk
Authorized investments include only those securities with the highest credit ratings. The money market
funds are rated AAAm by Standard & Poors. The FLGIT Day to Day Fund has an investment rating of
AAAm by Standard & Poors. The U.S. Treasuries and the Agencies are rated AA+ by Standard &
Poor’s and Aaa by Moody’s Investor Services. Two exceptions are Corporate Obligations and
Commercial Papers. Corporate Obligations are rated with at least two of the following three minimum
ratings: A- by Standard and Poor’s, A3 by Moody’s, or A- by Fitch. Commercial Papers are rated with
A-1 by Standard and Poor’s or Prime-1 by Moody’s at the time of purchase.
3. Custodial Credit Risk
The County’s investment policy pursuant to Section 218.415(18), Florida Statutes requires that
securities, with the exception of certificates of deposits, Florida Trust, Florida Prime and money market
accounts, shall be held with a third party custodian; and all securities purchased by, and all collateral
obtained by the Board should be properly designated as an asset of the Board. The securities must be
held in an account separate and apart from the assets of the financial institution. A third party custodian
is defined as any bank depository chartered by the Federal Government, the State of Florida, or any
55
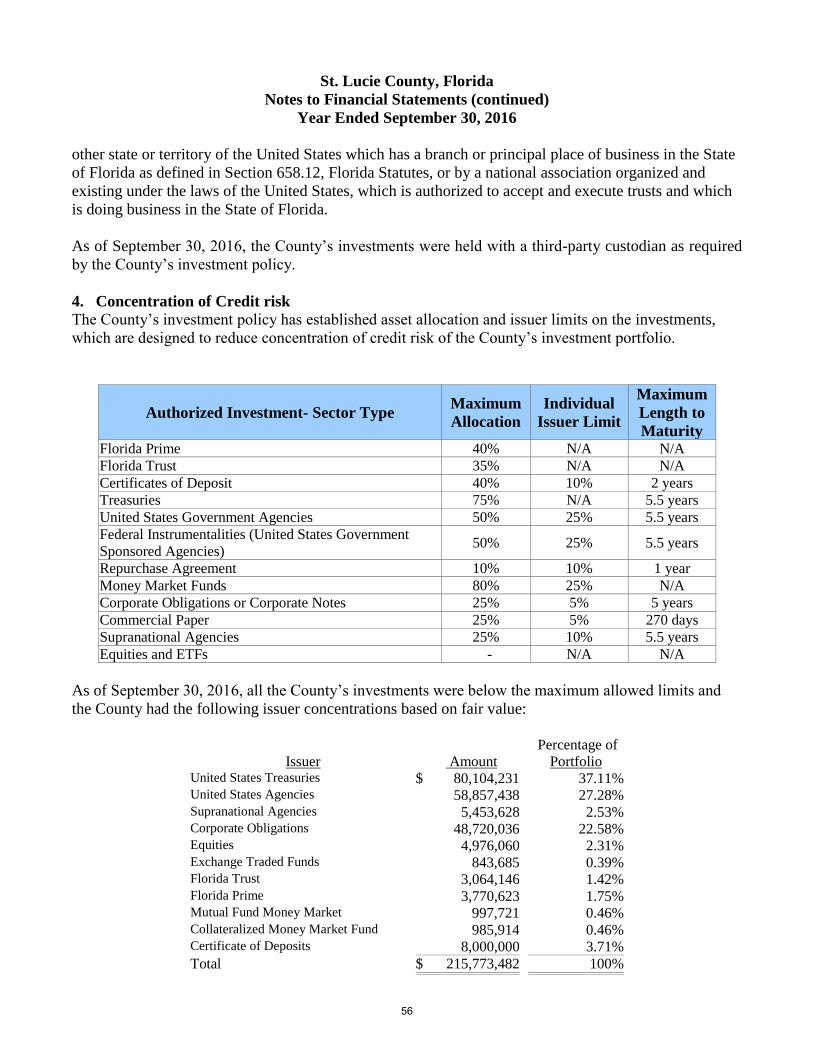
St. Lucie County, Florida
Notes to Financial Statements (continued)
Year Ended September 30, 2016
other state or territory of the United States which has a branch or principal place of business in the State
of Florida as defined in Section 658.12, Florida Statutes, or by a national association organized and
existing under the laws of the United States, which is authorized to accept and execute trusts and which
is doing business in the State of Florida.
As of September 30, 2016, the County’s investments were held with a third-party custodian as required
by the County’s investment policy.
4. Concentration of Credit risk
The County’s investment policy has established asset allocation and issuer limits on the investments,
which are designed to reduce concentration of credit risk of the County’s investment portfolio.
Authorized Investment- Sector Type Maximum
Allocation
Individual
Issuer Limit
Maximum
Length to
Maturity Florida Prime 40% N/A N/A
Florida Trust 35% N/A N/A
Certificates of Deposit 40% 10% 2 years
Treasuries 75% N/A 5.5 years
United States Government Agencies 50% 25% 5.5 years
Federal Instrumentalities (United States Government
Sponsored Agencies) 50% 25% 5.5 years
Repurchase Agreement 10% 10% 1 year
Money Market Funds 80% 25% N/A
Corporate Obligations or Corporate Notes 25% 5% 5 years
Commercial Paper 25% 5% 270 days
Supranational Agencies 25% 10% 5.5 years
Equities and ETFs - N/A N/A
As of September 30, 2016, all the County’s investments were below the maximum allowed limits and
the County had the following issuer concentrations based on fair value:
Percentage of
Issuer Amount Portfolio United States Treasuries $ 80,104,231 37.11% United States Agencies 58,857,438 27.28% Supranational Agencies 5,453,628 2.53% Corporate Obligations 48,720,036 22.58% Equities 4,976,060 2.31% Exchange Traded Funds 843,685 0.39% Florida Trust 3,064,146 1.42% Florida Prime 3,770,623 1.75% Mutual Fund Money Market 997,721 0.46% Collateralized Money Market Fund 985,914 0.46% Certificate of Deposits 8,000,000 3.71%
Total $ 215,773,482 100%
56
St. Lucie County, Florida
Notes to Financial Statements (continued)
Year Ended September 30, 2016
NOTE 4 – PROPERTY TAX REVENUES
Taxable values for all property are established as of January 1, which is the date of lien, for the fiscal
year starting October 1. Property tax revenues recognized for the 2015-2016 fiscal year were levied in
October 2015. All taxes are due and payable on November 1 or as soon as the assessments roll is
certified and delivered to the Tax Collector. Discounts are allowed for early payment at the rate of 4%
in November, 3% in December, 2% in January, and 1% in February. Taxes paid in March are without
discount.
All unpaid taxes become delinquent as of April 1. Virtually all unpaid taxes are collected via the sale of
tax certificates on or prior to June 1; therefore, there were no material taxes receivable at fiscal year end.
57
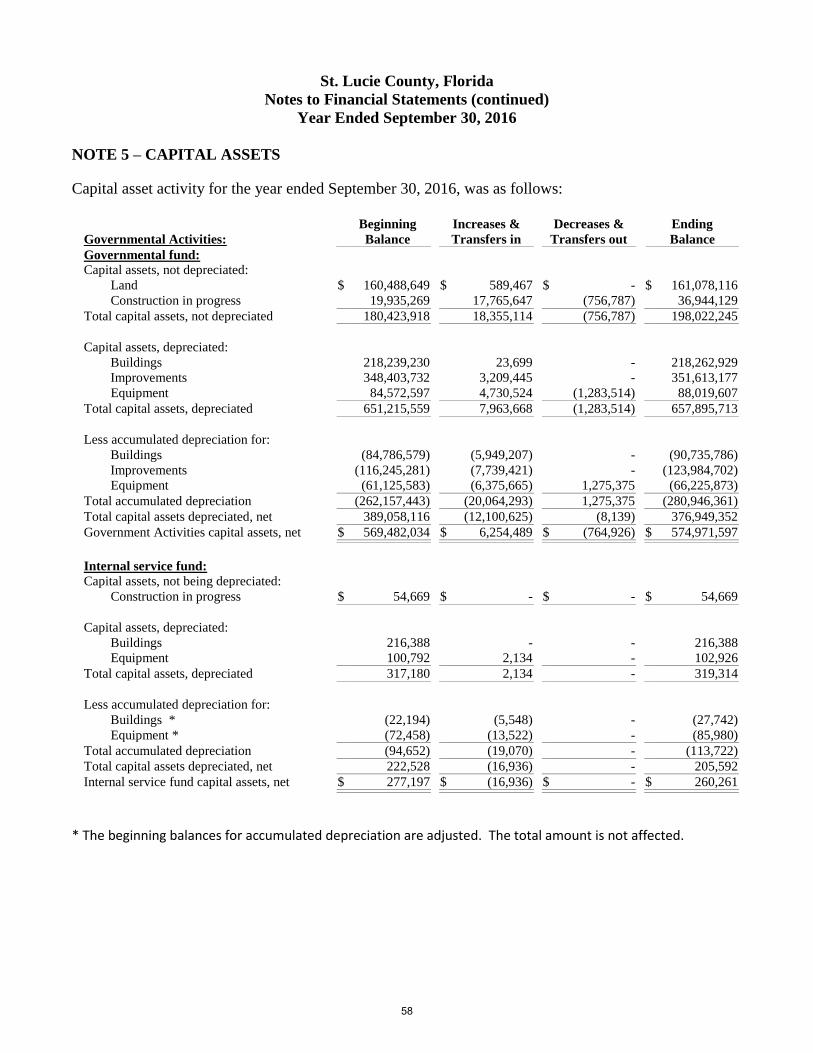
St. Lucie County, Florida
Notes to Financial Statements (continued)
Year Ended September 30, 2016
NOTE 5 – CAPITAL ASSETS
Capital asset activity for the year ended September 30, 2016, was as follows:
Governmental Activities: Beginning
Balance
Increases &
Transfers in
Decreases &
Transfers out
Ending
Balance
Governmental fund:
Capital assets, not depreciated:
Land $ 160,488,649 $ 589,467 $ - $ 161,078,116
Construction in progress 19,935,269 17,765,647 (756,787) 36,944,129
Total capital assets, not depreciated 180,423,918 18,355,114 (756,787) 198,022,245
Capital assets, depreciated:
Buildings 218,239,230 23,699 - 218,262,929
Improvements 348,403,732 3,209,445 - 351,613,177
Equipment 84,572,597 4,730,524 (1,283,514) 88,019,607
Total capital assets, depreciated 651,215,559 7,963,668 (1,283,514) 657,895,713
Less accumulated depreciation for:
Buildings (84,786,579) (5,949,207) - (90,735,786)
Improvements (116,245,281) (7,739,421) - (123,984,702)
Equipment (61,125,583) (6,375,665) 1,275,375 (66,225,873)
Total accumulated depreciation (262,157,443) (20,064,293) 1,275,375 (280,946,361)
Total capital assets depreciated, net 389,058,116 (12,100,625) (8,139) 376,949,352
Government Activities capital assets, net $ 569,482,034 $ 6,254,489 $ (764,926) $ 574,971,597
Internal service fund:
Capital assets, not being depreciated:
Construction in progress $ 54,669 $ - $ - $ 54,669
Capital assets, depreciated:
Buildings 216,388 - - 216,388
Equipment 100,792 2,134 - 102,926
Total capital assets, depreciated 317,180 2,134 - 319,314
Less accumulated depreciation for:
Buildings * (22,194) (5,548) - (27,742)
Equipment * (72,458) (13,522) - (85,980)
Total accumulated depreciation (94,652) (19,070) - (113,722)
Total capital assets depreciated, net 222,528 (16,936) - 205,592
Internal service fund capital assets, net $ 277,197 $ (16,936) $ - $ 260,261
* The beginning balances for accumulated depreciation are adjusted. The total amount is not affected.
58
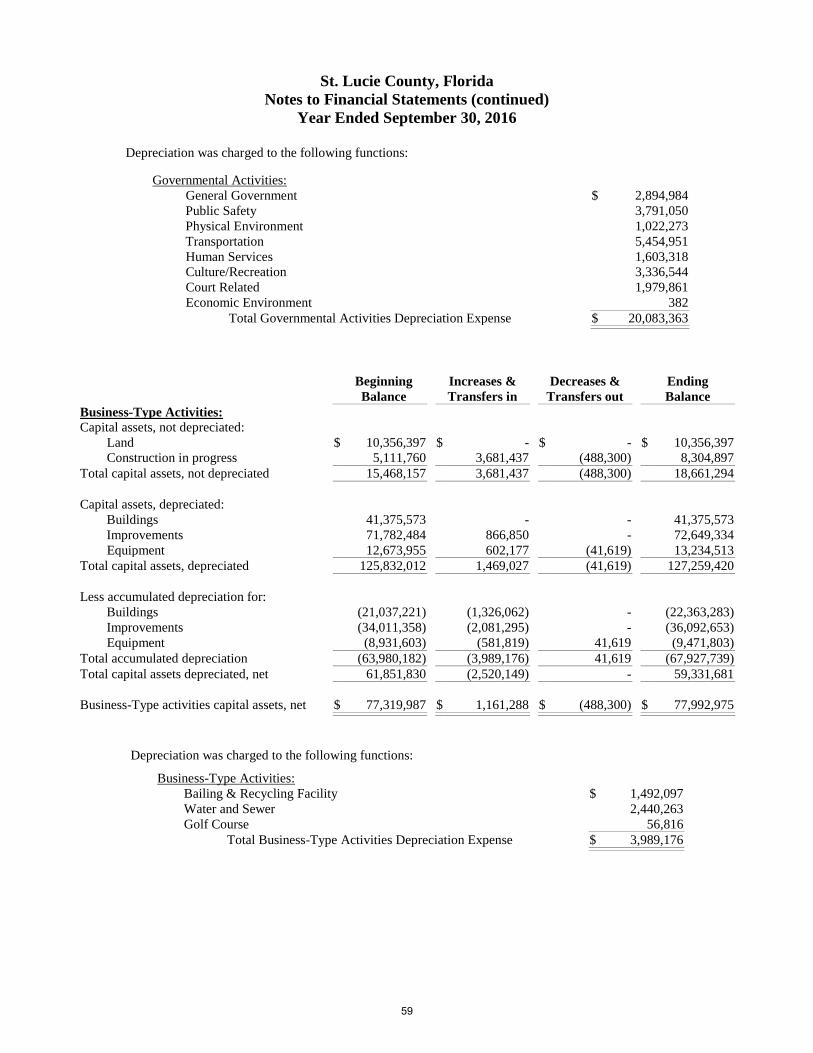
St. Lucie County, Florida
Notes to Financial Statements (continued)
Year Ended September 30, 2016
Depreciation was charged to the following functions:
Governmental Activities:
General Government $ 2,894,984
Public Safety 3,791,050
Physical Environment 1,022,273
Transportation 5,454,951
Human Services 1,603,318
Culture/Recreation 3,336,544
Court Related 1,979,861
Economic Environment 382
Total Governmental Activities Depreciation Expense $ 20,083,363
Beginning
Balance
Increases &
Transfers in
Decreases &
Transfers out
Ending
Balance
Business-Type Activities:
Capital assets, not depreciated:
Land $ 10,356,397 $ - $ - $ 10,356,397
Construction in progress 5,111,760 3,681,437 (488,300) 8,304,897
Total capital assets, not depreciated 15,468,157 3,681,437 (488,300) 18,661,294
Capital assets, depreciated:
Buildings 41,375,573 - - 41,375,573
Improvements 71,782,484 866,850 - 72,649,334
Equipment 12,673,955 602,177 (41,619) 13,234,513
Total capital assets, depreciated 125,832,012 1,469,027 (41,619) 127,259,420
Less accumulated depreciation for:
Buildings (21,037,221) (1,326,062) - (22,363,283)
Improvements (34,011,358) (2,081,295) - (36,092,653)
Equipment (8,931,603) (581,819) 41,619 (9,471,803)
Total accumulated depreciation (63,980,182) (3,989,176) 41,619 (67,927,739)
Total capital assets depreciated, net 61,851,830 (2,520,149) - 59,331,681
Business-Type activities capital assets, net $ 77,319,987 $ 1,161,288 $ (488,300) $ 77,992,975
Depreciation was charged to the following functions:
Business-Type Activities:
Bailing & Recycling Facility $ 1,492,097
Water and Sewer 2,440,263
Golf Course 56,816
Total Business-Type Activities Depreciation Expense $ 3,989,176
59
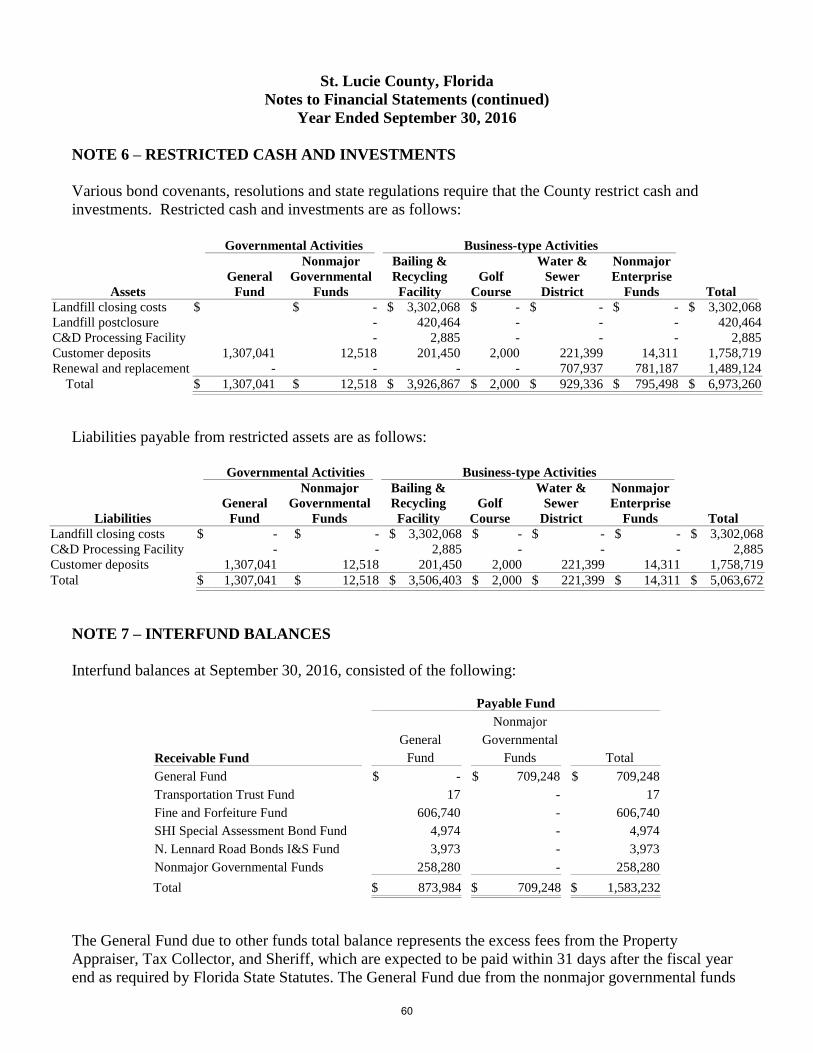
St. Lucie County, Florida
Notes to Financial Statements (continued)
Year Ended September 30, 2016
NOTE 6 – RESTRICTED CASH AND INVESTMENTS
Various bond covenants, resolutions and state regulations require that the County restrict cash and
investments. Restricted cash and investments are as follows:
Governmental Activities Business-type Activities
Assets
General
Fund
Nonmajor
Governmental
Funds
Bailing &
Recycling
Facility
Golf
Course
Water &
Sewer
District
Nonmajor
Enterprise
Funds Total
Landfill closing costs $ $ - $ 3,302,068 $ - $ - $ - $ 3,302,068
Landfill postclosure - 420,464 - - - 420,464
C&D Processing Facility - 2,885 - - - 2,885
Customer deposits 1,307,041 12,518 201,450 2,000 221,399 14,311 1,758,719
Renewal and replacement - - - - 707,937 781,187 1,489,124
Total $ 1,307,041 $ 12,518 $ 3,926,867 $ 2,000 $ 929,336 $ 795,498 $ 6,973,260
Liabilities payable from restricted assets are as follows:
Governmental Activities Business-type Activities
Liabilities
General
Fund
Nonmajor
Governmental
Funds
Bailing &
Recycling
Facility
Golf
Course
Water &
Sewer
District
Nonmajor
Enterprise
Funds Total
Landfill closing costs $ - $ - $ 3,302,068 $ - $ - $ - $ 3,302,068
C&D Processing Facility - - 2,885 - - - 2,885
Customer deposits 1,307,041 12,518 201,450 2,000 221,399 14,311 1,758,719
Total $ 1,307,041 $ 12,518 $ 3,506,403 $ 2,000 $ 221,399 $ 14,311 $ 5,063,672
NOTE 7 – INTERFUND BALANCES
Interfund balances at September 30, 2016, consisted of the following:
Payable Fund
Nonmajor
General Governmental
Receivable Fund Fund Funds Total
General Fund $ - $ 709,248 $ 709,248
Transportation Trust Fund 17 - 17
Fine and Forfeiture Fund 606,740 - 606,740
SHI Special Assessment Bond Fund 4,974 - 4,974
N. Lennard Road Bonds I&S Fund 3,973 - 3,973
Nonmajor Governmental Funds 258,280 - 258,280
Total $ 873,984 $ 709,248 $ 1,583,232
The General Fund due to other funds total balance represents the excess fees from the Property
Appraiser, Tax Collector, and Sheriff, which are expected to be paid within 31 days after the fiscal year
end as required by Florida State Statutes. The General Fund due from the nonmajor governmental funds
60
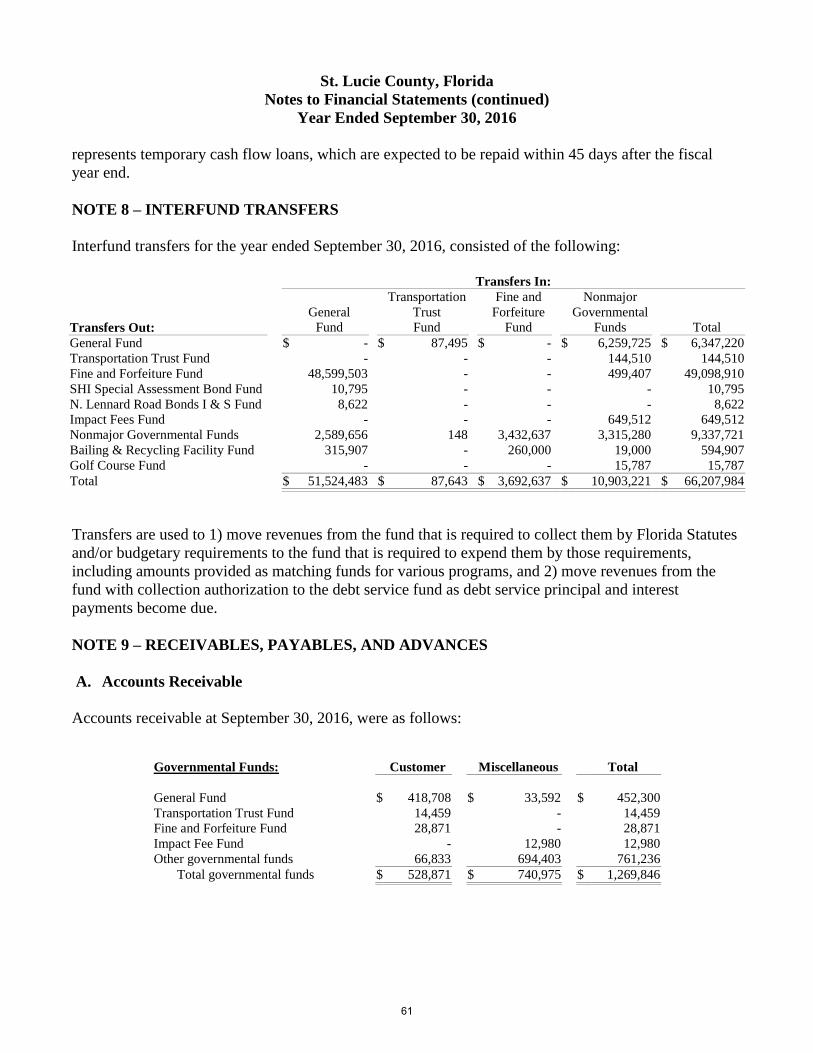
St. Lucie County, Florida
Notes to Financial Statements (continued)
Year Ended September 30, 2016
represents temporary cash flow loans, which are expected to be repaid within 45 days after the fiscal
year end.
NOTE 8 – INTERFUND TRANSFERS
Interfund transfers for the year ended September 30, 2016, consisted of the following:
Transfers In:
Transportation Fine and Nonmajor
General Trust Forfeiture Governmental
Transfers Out: Fund Fund Fund Funds Total
General Fund $ - $ 87,495 $ - $ 6,259,725 $ 6,347,220
Transportation Trust Fund - - - 144,510 144,510
Fine and Forfeiture Fund 48,599,503 - - 499,407 49,098,910
SHI Special Assessment Bond Fund 10,795 - - - 10,795
N. Lennard Road Bonds I & S Fund 8,622 - - - 8,622
Impact Fees Fund - - - 649,512 649,512
Nonmajor Governmental Funds 2,589,656 148 3,432,637 3,315,280 9,337,721
Bailing & Recycling Facility Fund 315,907 - 260,000 19,000 594,907
Golf Course Fund - - - 15,787 15,787
Total $ 51,524,483 $ 87,643 $ 3,692,637 $ 10,903,221 $ 66,207,984
Transfers are used to 1) move revenues from the fund that is required to collect them by Florida Statutes
and/or budgetary requirements to the fund that is required to expend them by those requirements,
including amounts provided as matching funds for various programs, and 2) move revenues from the
fund with collection authorization to the debt service fund as debt service principal and interest
payments become due.
NOTE 9 – RECEIVABLES, PAYABLES, AND ADVANCES
A. Accounts Receivable
Accounts receivable at September 30, 2016, were as follows:
Governmental Funds: Customer Miscellaneous Total
General Fund $ 418,708 $ 33,592 $ 452,300
Transportation Trust Fund 14,459 - 14,459
Fine and Forfeiture Fund 28,871 - 28,871
Impact Fee Fund - 12,980 12,980
Other governmental funds 66,833 694,403 761,236
Total governmental funds $ 528,871 $ 740,975 $ 1,269,846
61
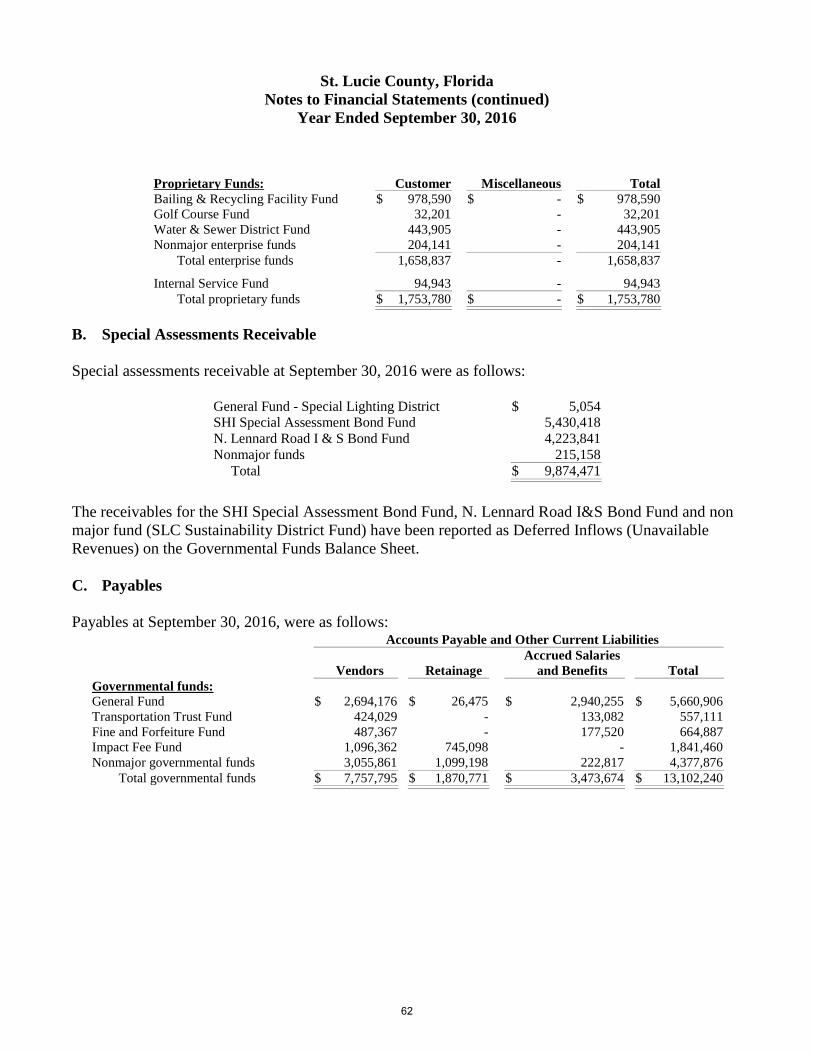
St. Lucie County, Florida
Notes to Financial Statements (continued)
Year Ended September 30, 2016
Proprietary Funds: Customer Miscellaneous Total
Bailing & Recycling Facility Fund $ 978,590 $ - $ 978,590
Golf Course Fund 32,201 - 32,201
Water & Sewer District Fund 443,905 - 443,905
Nonmajor enterprise funds 204,141 - 204,141
Total enterprise funds 1,658,837 - 1,658,837
Internal Service Fund 94,943 - 94,943
Total proprietary funds $ 1,753,780 $ - $ 1,753,780
B. Special Assessments Receivable
Special assessments receivable at September 30, 2016 were as follows:
General Fund - Special Lighting District $ 5,054
SHI Special Assessment Bond Fund 5,430,418
N. Lennard Road I & S Bond Fund 4,223,841
Nonmajor funds 215,158
Total $ 9,874,471
The receivables for the SHI Special Assessment Bond Fund, N. Lennard Road I&S Bond Fund and non
major fund (SLC Sustainability District Fund) have been reported as Deferred Inflows (Unavailable
Revenues) on the Governmental Funds Balance Sheet.
C. Payables
Payables at September 30, 2016, were as follows:
Accounts Payable and Other Current Liabilities
Vendors Retainage
Accrued Salaries
and Benefits Total
Governmental funds:
General Fund $ 2,694,176 $ 26,475 $ 2,940,255 $ 5,660,906
Transportation Trust Fund 424,029 - 133,082 557,111
Fine and Forfeiture Fund 487,367 - 177,520 664,887
Impact Fee Fund 1,096,362 745,098 - 1,841,460
Nonmajor governmental funds 3,055,861 1,099,198 222,817 4,377,876
Total governmental funds $ 7,757,795 $ 1,870,771 $ 3,473,674 $ 13,102,240
62
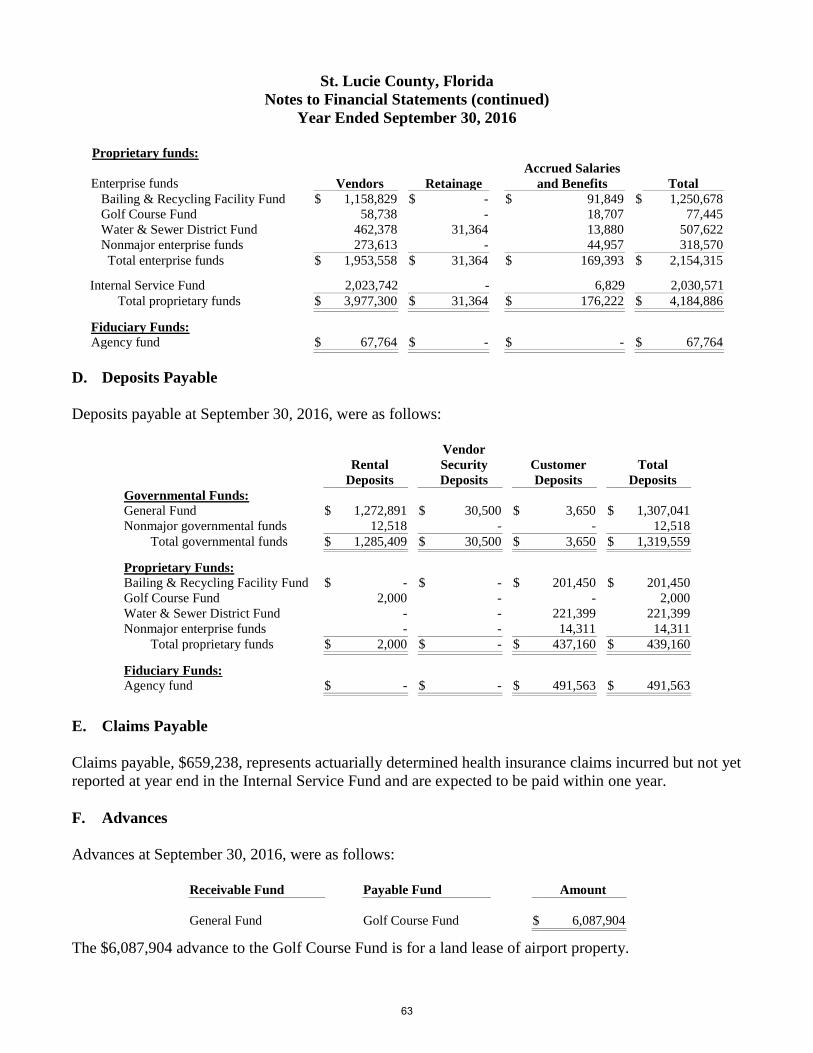
St. Lucie County, Florida
Notes to Financial Statements (continued)
Year Ended September 30, 2016
Proprietary funds:
Enterprise funds
Vendors
Retainage
Accrued Salaries
and Benefits
Total
Bailing & Recycling Facility Fund $ 1,158,829 $ - $ 91,849 $ 1,250,678
Golf Course Fund 58,738 - 18,707 77,445
Water & Sewer District Fund 462,378 31,364 13,880 507,622
Nonmajor enterprise funds 273,613 - 44,957 318,570
Total enterprise funds $ 1,953,558 $ 31,364 $ 169,393 $ 2,154,315
Internal Service Fund 2,023,742 - 6,829 2,030,571
Total proprietary funds $ 3,977,300 $ 31,364 $ 176,222 $ 4,184,886
Fiduciary Funds:
Agency fund $ 67,764 $ - $ - $ 67,764
D. Deposits Payable
Deposits payable at September 30, 2016, were as follows:
Vendor
Rental Security Customer Total
Deposits Deposits Deposits Deposits
Governmental Funds:
General Fund $ 1,272,891 $ 30,500 $ 3,650 $ 1,307,041
Nonmajor governmental funds 12,518 - - 12,518
Total governmental funds $ 1,285,409 $ 30,500 $ 3,650 $ 1,319,559
Proprietary Funds:
Bailing & Recycling Facility Fund $ - $ - $ 201,450 $ 201,450
Golf Course Fund 2,000 - - 2,000
Water & Sewer District Fund - - 221,399 221,399
Nonmajor enterprise funds - - 14,311 14,311
Total proprietary funds $ 2,000 $ - $ 437,160 $ 439,160
Fiduciary Funds:
Agency fund $ - $ - $ 491,563 $ 491,563
E. Claims Payable
Claims payable, $659,238, represents actuarially determined health insurance claims incurred but not yet
reported at year end in the Internal Service Fund and are expected to be paid within one year.
F. Advances
Advances at September 30, 2016, were as follows:
Receivable Fund Payable Fund Amount
General Fund Golf Course Fund $ 6,087,904
The $6,087,904 advance to the Golf Course Fund is for a land lease of airport property.
63
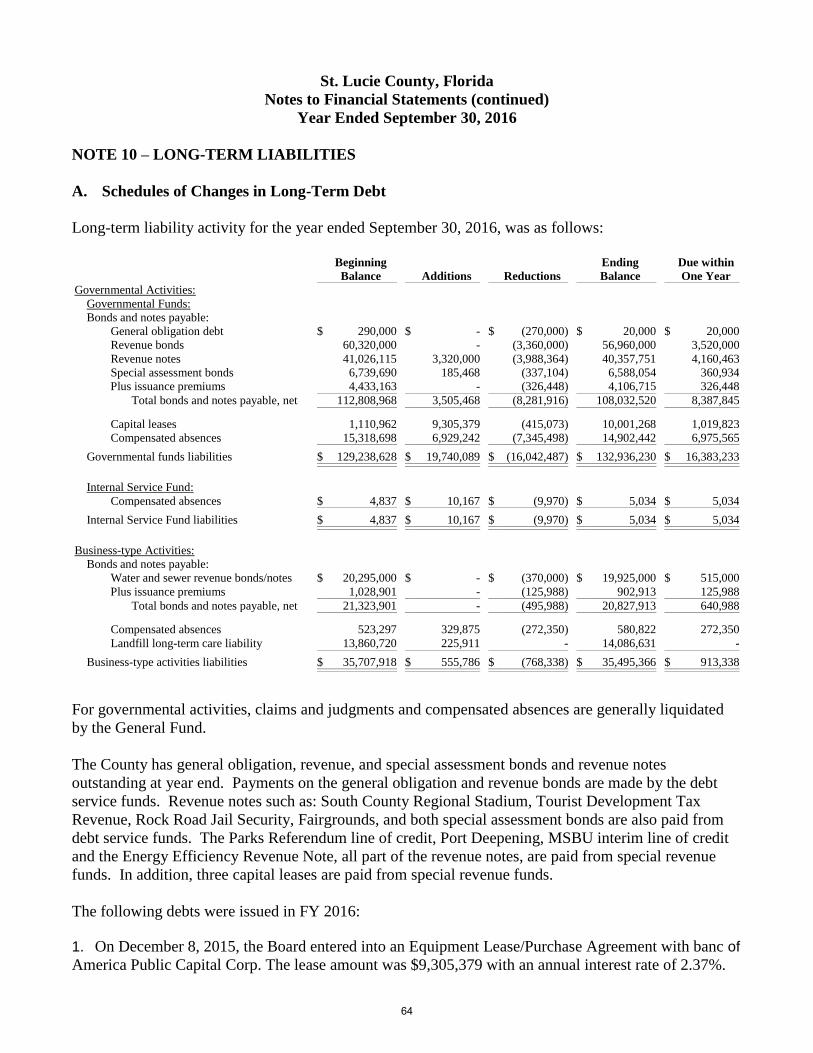
St. Lucie County, Florida
Notes to Financial Statements (continued)
Year Ended September 30, 2016
NOTE 10 – LONG-TERM LIABILITIES
A. Schedules of Changes in Long-Term Debt
Long-term liability activity for the year ended September 30, 2016, was as follows:
Beginning Ending Due within
Balance Additions Reductions Balance One Year
Governmental Activities:
Governmental Funds:
Bonds and notes payable:
General obligation debt $ 290,000 $ - $ (270,000) $ 20,000 $ 20,000
Revenue bonds 60,320,000 - (3,360,000) 56,960,000 3,520,000
Revenue notes 41,026,115 3,320,000 (3,988,364) 40,357,751 4,160,463
Special assessment bonds 6,739,690 185,468 (337,104) 6,588,054 360,934
Plus issuance premiums 4,433,163 - (326,448) 4,106,715 326,448
Total bonds and notes payable, net 112,808,968 3,505,468 (8,281,916) 108,032,520 8,387,845
Capital leases 1,110,962 9,305,379 (415,073) 10,001,268 1,019,823
Compensated absences 15,318,698 6,929,242 (7,345,498) 14,902,442 6,975,565
Governmental funds liabilities $ 129,238,628 $ 19,740,089 $ (16,042,487) $ 132,936,230 $ 16,383,233
Internal Service Fund:
Compensated absences $ 4,837 $ 10,167 $ (9,970) $ 5,034 $ 5,034
Internal Service Fund liabilities $ 4,837 $ 10,167 $ (9,970) $ 5,034 $ 5,034
Business-type Activities:
Bonds and notes payable:
Water and sewer revenue bonds/notes $ 20,295,000 $ - $ (370,000) $ 19,925,000 $ 515,000
Plus issuance premiums 1,028,901 - (125,988) 902,913 125,988
Total bonds and notes payable, net 21,323,901 - (495,988) 20,827,913 640,988
Compensated absences 523,297 329,875 (272,350) 580,822 272,350
Landfill long-term care liability 13,860,720 225,911 - 14,086,631 -
Business-type activities liabilities $ 35,707,918 $ 555,786 $ (768,338) $ 35,495,366 $ 913,338
For governmental activities, claims and judgments and compensated absences are generally liquidated
by the General Fund.
The County has general obligation, revenue, and special assessment bonds and revenue notes
outstanding at year end. Payments on the general obligation and revenue bonds are made by the debt
service funds. Revenue notes such as: South County Regional Stadium, Tourist Development Tax
Revenue, Rock Road Jail Security, Fairgrounds, and both special assessment bonds are also paid from
debt service funds. The Parks Referendum line of credit, Port Deepening, MSBU interim line of credit
and the Energy Efficiency Revenue Note, all part of the revenue notes, are paid from special revenue
funds. In addition, three capital leases are paid from special revenue funds.
The following debts were issued in FY 2016:
1. On December 8, 2015, the Board entered into an Equipment Lease/Purchase Agreement with banc of
America Public Capital Corp. The lease amount was $9,305,379 with an annual interest rate of 2.37%.
64
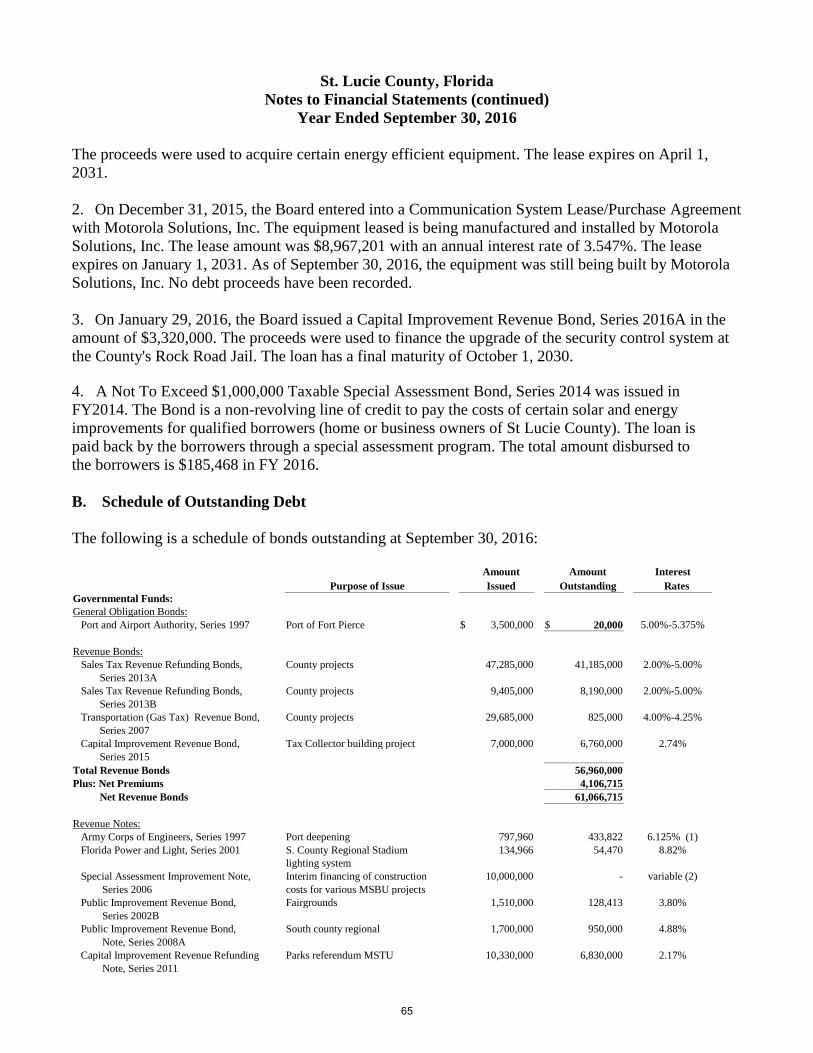
St. Lucie County, Florida
Notes to Financial Statements (continued)
Year Ended September 30, 2016
The proceeds were used to acquire certain energy efficient equipment. The lease expires on April 1,
2031.
2. On December 31, 2015, the Board entered into a Communication System Lease/Purchase Agreement
with Motorola Solutions, Inc. The equipment leased is being manufactured and installed by Motorola
Solutions, Inc. The lease amount was $8,967,201 with an annual interest rate of 3.547%. The lease
expires on January 1, 2031. As of September 30, 2016, the equipment was still being built by Motorola
Solutions, Inc. No debt proceeds have been recorded.
3. On January 29, 2016, the Board issued a Capital Improvement Revenue Bond, Series 2016A in the
amount of $3,320,000. The proceeds were used to finance the upgrade of the security control system at
the County's Rock Road Jail. The loan has a final maturity of October 1, 2030.
4. A Not To Exceed $1,000,000 Taxable Special Assessment Bond, Series 2014 was issued in
FY2014. The Bond is a non-revolving line of credit to pay the costs of certain solar and energy
improvements for qualified borrowers (home or business owners of St Lucie County). The loan is
paid back by the borrowers through a special assessment program. The total amount disbursed to
the borrowers is $185,468 in FY 2016.
B. Schedule of Outstanding Debt
The following is a schedule of bonds outstanding at September 30, 2016:
Amount Amount Interest
Purpose of Issue Issued Outstanding Rates
Governmental Funds:
General Obligation Bonds:
Port and Airport Authority, Series 1997 Port of Fort Pierce $ 3,500,000 $ 20,000 5.00%-5.375%
Revenue Bonds:
Sales Tax Revenue Refunding Bonds, County projects 47,285,000 41,185,000 2.00%-5.00%
Series 2013A
Sales Tax Revenue Refunding Bonds, County projects 9,405,000 8,190,000 2.00%-5.00%
Series 2013B
Transportation (Gas Tax) Revenue Bond, County projects 29,685,000 825,000 4.00%-4.25%
Series 2007
Capital Improvement Revenue Bond, Tax Collector building project 7,000,000 6,760,000 2.74%
Series 2015
Total Revenue Bonds 56,960,000
Plus: Net Premiums 4,106,715
Net Revenue Bonds 61,066,715
Revenue Notes:
Army Corps of Engineers, Series 1997 Port deepening 797,960 433,822 6.125% (1)
Florida Power and Light, Series 2001 S. County Regional Stadium 134,966 54,470 8.82%
lighting system
Special Assessment Improvement Note, Interim financing of construction 10,000,000 - variable (2)
Series 2006 costs for various MSBU projects
Public Improvement Revenue Bond, Fairgrounds 1,510,000 128,413 3.80%
Series 2002B
Public Improvement Revenue Bond, South county regional 1,700,000 950,000 4.88%
Note, Series 2008A
Capital Improvement Revenue Refunding Parks referendum MSTU 10,330,000 6,830,000 2.17%
Note, Series 2011
65
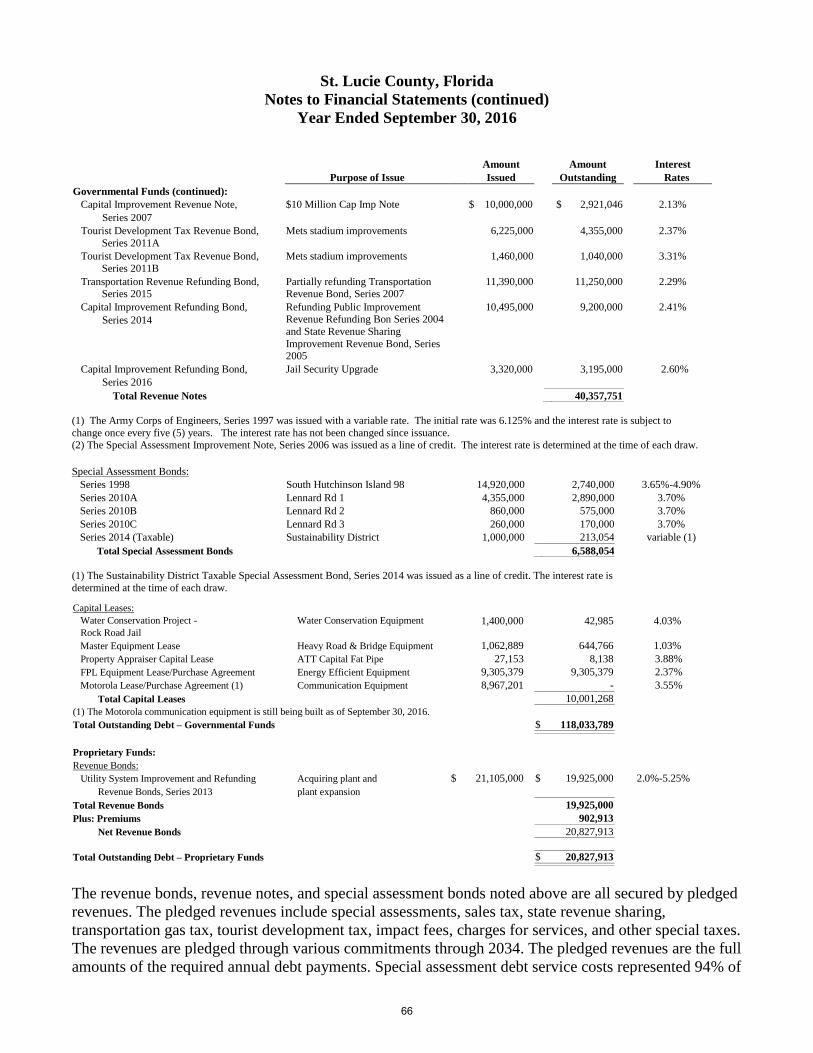
St. Lucie County, Florida
Notes to Financial Statements (continued)
Year Ended September 30, 2016
Amount Amount Interest
Purpose of Issue Issued Outstanding Rates
Governmental Funds (continued):
Capital Improvement Revenue Note, $10 Million Cap Imp Note $ 10,000,000 $ 2,921,046 2.13%
Series 2007
Tourist Development Tax Revenue Bond,
Series 2011A
Mets stadium improvements
6,225,000
4,355,000
2.37%
Tourist Development Tax Revenue Bond,
Series 2011B
Mets stadium improvements
1,460,000
1,040,000 3.31%
Transportation Revenue Refunding Bond, Series 2015
Partially refunding Transportation Revenue Bond, Series 2007
11,390,000
11,250,000 2.29%
Capital Improvement Refunding Bond,
Series 2014
Refunding Public Improvement Revenue Refunding Bon Series 2004
and State Revenue Sharing
Improvement Revenue Bond, Series 2005
10,495,000
9,200,000
2.41%
Capital Improvement Refunding Bond,
Series 2016
Jail Security Upgrade 3,320,000 3,195,000 2.60%
Total Revenue Notes 40,357,751
(1) The Army Corps of Engineers, Series 1997 was issued with a variable rate. The initial rate was 6.125% and the interest rate is subject to
change once every five (5) years. The interest rate has not been changed since issuance. (2) The Special Assessment Improvement Note, Series 2006 was issued as a line of credit. The interest rate is determined at the time of each draw.
Special Assessment Bonds:
Series 1998 South Hutchinson Island 98 14,920,000 2,740,000 3.65%-4.90%
Series 2010A Lennard Rd 1 4,355,000 2,890,000 3.70%
Series 2010B Lennard Rd 2 860,000 575,000 3.70%
Series 2010C Lennard Rd 3 260,000 170,000 3.70%
Series 2014 (Taxable) Sustainability District 1,000,000 213,054 variable (1)
Total Special Assessment Bonds 6,588,054
(1) The Sustainability District Taxable Special Assessment Bond, Series 2014 was issued as a line of credit. The interest rate is
determined at the time of each draw.
Capital Leases:
Water Conservation Project -
Rock Road Jail
Water Conservation Equipment
1,400,000
42,985 4.03%
Master Equipment Lease Heavy Road & Bridge Equipment 1,062,889 644,766 1.03%
Property Appraiser Capital Lease ATT Capital Fat Pipe 27,153 8,138 3.88%
FPL Equipment Lease/Purchase Agreement Energy Efficient Equipment 9,305,379 9,305,379 2.37%
Motorola Lease/Purchase Agreement (1) Communication Equipment 8,967,201 - 3.55%
Total Capital Leases 10,001,268
(1) The Motorola communication equipment is still being built as of September 30, 2016.
Total Outstanding Debt – Governmental Funds $ 118,033,789
Proprietary Funds:
Revenue Bonds:
Utility System Improvement and Refunding Acquiring plant and $ 21,105,000 $ 19,925,000 2.0%-5.25%
Revenue Bonds, Series 2013 plant expansion
Total Revenue Bonds 19,925,000
Plus: Premiums 902,913
Net Revenue Bonds 20,827,913
Total Outstanding Debt – Proprietary Funds $ 20,827,913
The revenue bonds, revenue notes, and special assessment bonds noted above are all secured by pledged
revenues. The pledged revenues include special assessments, sales tax, state revenue sharing,
transportation gas tax, tourist development tax, impact fees, charges for services, and other special taxes.
The revenues are pledged through various commitments through 2034. The pledged revenues are the full
amounts of the required annual debt payments. Special assessment debt service costs represented 94% of
66
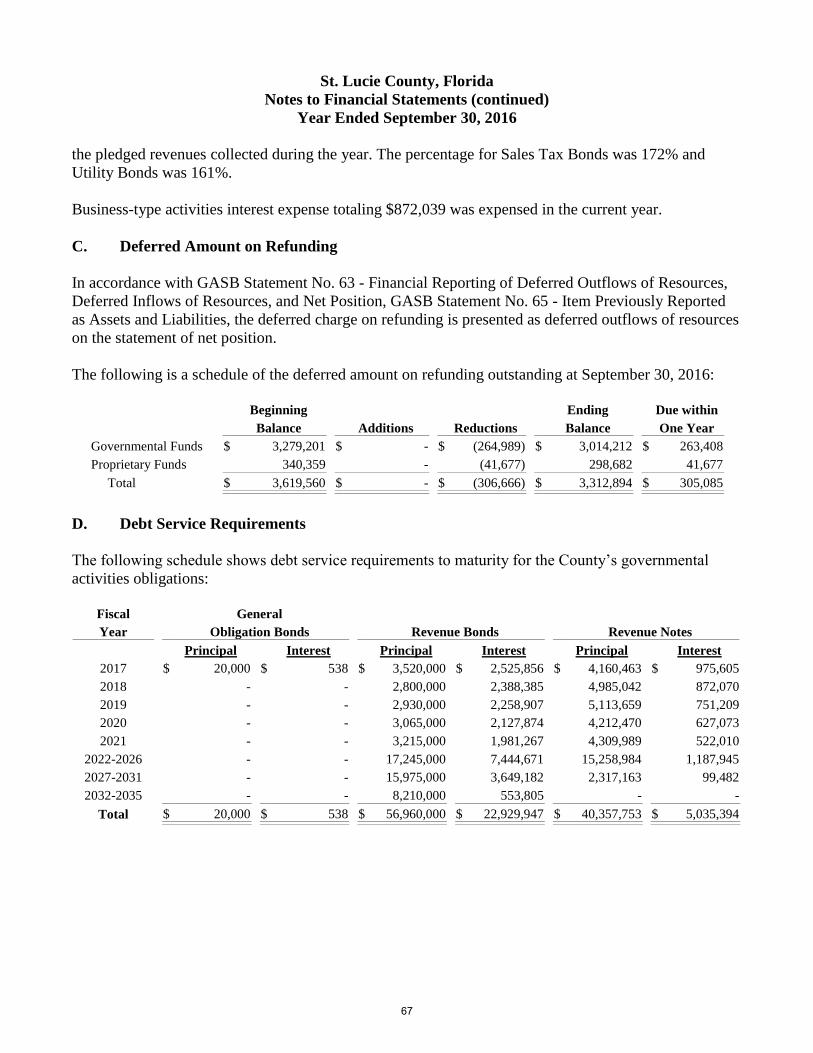
St. Lucie County, Florida
Notes to Financial Statements (continued)
Year Ended September 30, 2016
the pledged revenues collected during the year. The percentage for Sales Tax Bonds was 172% and
Utility Bonds was 161%.
Business-type activities interest expense totaling $872,039 was expensed in the current year.
C. Deferred Amount on Refunding
In accordance with GASB Statement No. 63 - Financial Reporting of Deferred Outflows of Resources,
Deferred Inflows of Resources, and Net Position, GASB Statement No. 65 - Item Previously Reported
as Assets and Liabilities, the deferred charge on refunding is presented as deferred outflows of resources
on the statement of net position.
The following is a schedule of the deferred amount on refunding outstanding at September 30, 2016:
Beginning Ending Due within
Balance Additions Reductions Balance One Year
Governmental Funds $ 3,279,201 $ - $ (264,989) $ 3,014,212 $ 263,408
Proprietary Funds 340,359 - (41,677) 298,682 41,677
Total $ 3,619,560 $ - $ (306,666) $ 3,312,894 $ 305,085
D. Debt Service Requirements
The following schedule shows debt service requirements to maturity for the County’s governmental
activities obligations:
Fiscal General
Year Obligation Bonds Revenue Bonds Revenue Notes
Principal Interest Principal Interest Principal Interest
2017 $ 20,000 $ 538 $ 3,520,000 $ 2,525,856 $ 4,160,463 $ 975,605
2018 - - 2,800,000 2,388,385 4,985,042 872,070
2019 - - 2,930,000 2,258,907 5,113,659 751,209
2020 - - 3,065,000 2,127,874 4,212,470 627,073
2021 - - 3,215,000 1,981,267 4,309,989 522,010
2022-2026 - - 17,245,000 7,444,671 15,258,984 1,187,945
2027-2031 - - 15,975,000 3,649,182 2,317,163 99,482
2032-2035 - - 8,210,000 553,805 - -
Total $ 20,000 $ 538 $ 56,960,000 $ 22,929,947 $ 40,357,753 $ 5,035,394
67
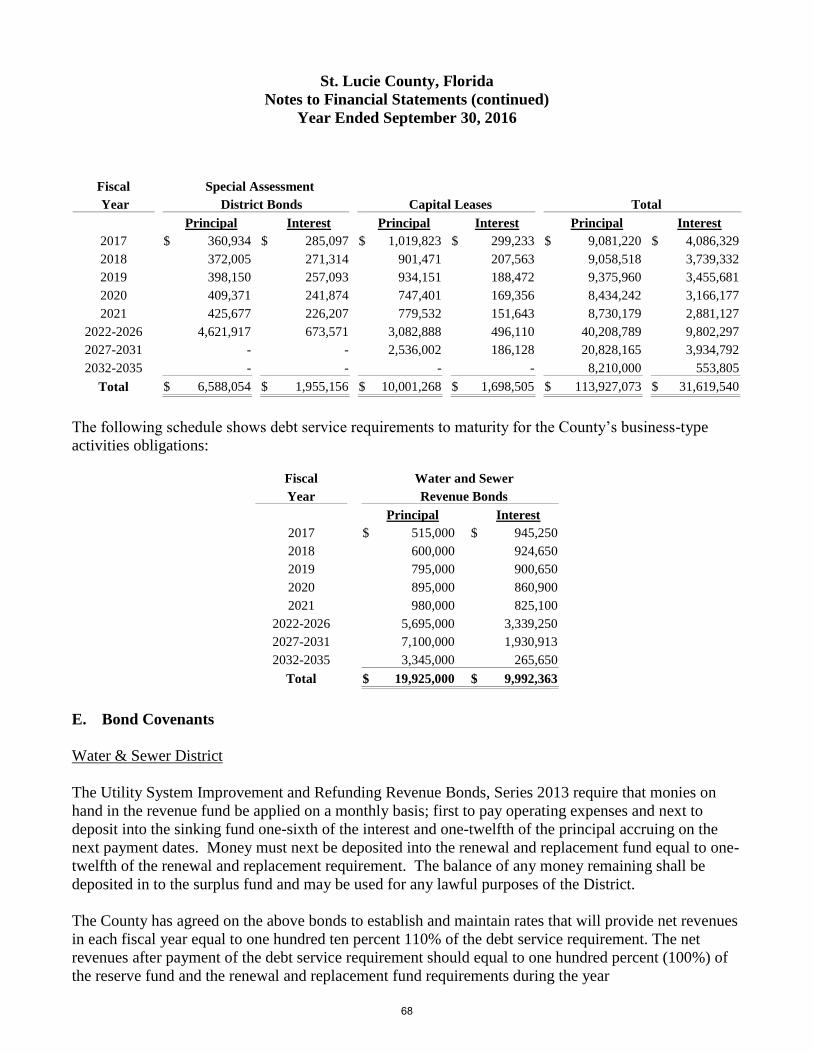
St. Lucie County, Florida
Notes to Financial Statements (continued)
Year Ended September 30, 2016
Fiscal
Year
Special Assessment
District Bonds Capital Leases Total
Principal Interest Principal Interest Principal Interest
2017 $ 360,934 $ 285,097 $ 1,019,823 $ 299,233 $ 9,081,220 $ 4,086,329
2018 372,005 271,314 901,471 207,563 9,058,518 3,739,332
2019 398,150 257,093 934,151 188,472 9,375,960 3,455,681
2020 409,371 241,874 747,401 169,356 8,434,242 3,166,177
2021 425,677 226,207 779,532 151,643 8,730,179 2,881,127
2022-2026 4,621,917 673,571 3,082,888 496,110 40,208,789 9,802,297
2027-2031 - - 2,536,002 186,128 20,828,165 3,934,792
2032-2035 - - - - 8,210,000 553,805
Total $ 6,588,054 $ 1,955,156 $ 10,001,268 $ 1,698,505 $ 113,927,073 $ 31,619,540
The following schedule shows debt service requirements to maturity for the County’s business-type
activities obligations:
Fiscal Water and Sewer
Year Revenue Bonds
Principal Interest
2017 $ 515,000 $ 945,250
2018 600,000 924,650
2019 795,000 900,650
2020 895,000 860,900
2021 980,000 825,100
2022-2026 5,695,000 3,339,250
2027-2031 7,100,000 1,930,913
2032-2035 3,345,000 265,650
Total $ 19,925,000 $ 9,992,363
E. Bond Covenants
Water & Sewer District
The Utility System Improvement and Refunding Revenue Bonds, Series 2013 require that monies on
hand in the revenue fund be applied on a monthly basis; first to pay operating expenses and next to
deposit into the sinking fund one-sixth of the interest and one-twelfth of the principal accruing on the
next payment dates. Money must next be deposited into the renewal and replacement fund equal to one-
twelfth of the renewal and replacement requirement. The balance of any money remaining shall be
deposited in to the surplus fund and may be used for any lawful purposes of the District.
The County has agreed on the above bonds to establish and maintain rates that will provide net revenues
in each fiscal year equal to one hundred ten percent 110% of the debt service requirement. The net
revenues after payment of the debt service requirement should equal to one hundred percent (100%) of
the reserve fund and the renewal and replacement fund requirements during the year
68
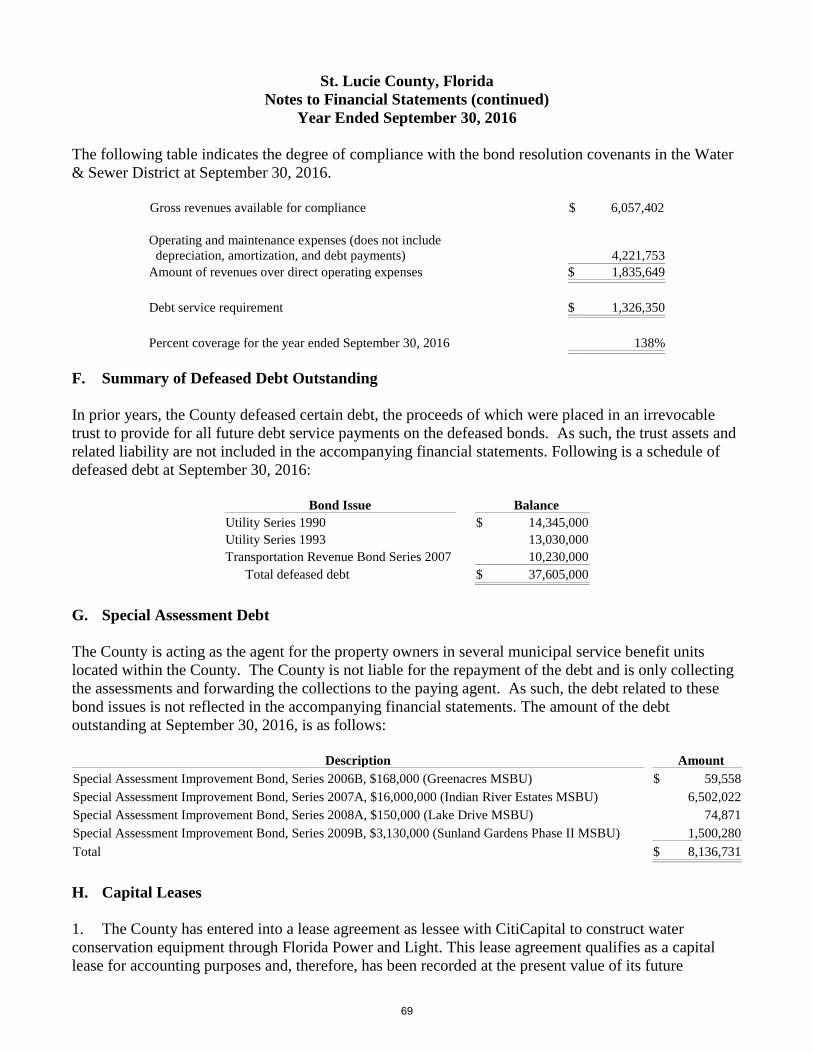
St. Lucie County, Florida
Notes to Financial Statements (continued)
Year Ended September 30, 2016
The following table indicates the degree of compliance with the bond resolution covenants in the Water
& Sewer District at September 30, 2016.
Gross revenues available for compliance $ 6,057,402
Operating and maintenance expenses (does not include
depreciation, amortization, and debt payments) 4,221,753
Amount of revenues over direct operating expenses $ 1,835,649
Debt service requirement $ 1,326,350
Percent coverage for the year ended September 30, 2016 138%
F. Summary of Defeased Debt Outstanding
In prior years, the County defeased certain debt, the proceeds of which were placed in an irrevocable
trust to provide for all future debt service payments on the defeased bonds. As such, the trust assets and
related liability are not included in the accompanying financial statements. Following is a schedule of
defeased debt at September 30, 2016:
Bond Issue Balance
Utility Series 1990 $ 14,345,000
Utility Series 1993 13,030,000
Transportation Revenue Bond Series 2007 10,230,000
Total defeased debt $ 37,605,000
G. Special Assessment Debt
The County is acting as the agent for the property owners in several municipal service benefit units
located within the County. The County is not liable for the repayment of the debt and is only collecting
the assessments and forwarding the collections to the paying agent. As such, the debt related to these
bond issues is not reflected in the accompanying financial statements. The amount of the debt
outstanding at September 30, 2016, is as follows:
Description Amount
Special Assessment Improvement Bond, Series 2006B, $168,000 (Greenacres MSBU) $ 59,558
Special Assessment Improvement Bond, Series 2007A, $16,000,000 (Indian River Estates MSBU) 6,502,022
Special Assessment Improvement Bond, Series 2008A, $150,000 (Lake Drive MSBU) 74,871
Special Assessment Improvement Bond, Series 2009B, $3,130,000 (Sunland Gardens Phase II MSBU) 1,500,280
Total $ 8,136,731
H. Capital Leases
1. The County has entered into a lease agreement as lessee with CitiCapital to construct water
conservation equipment through Florida Power and Light. This lease agreement qualifies as a capital
lease for accounting purposes and, therefore, has been recorded at the present value of its future
69
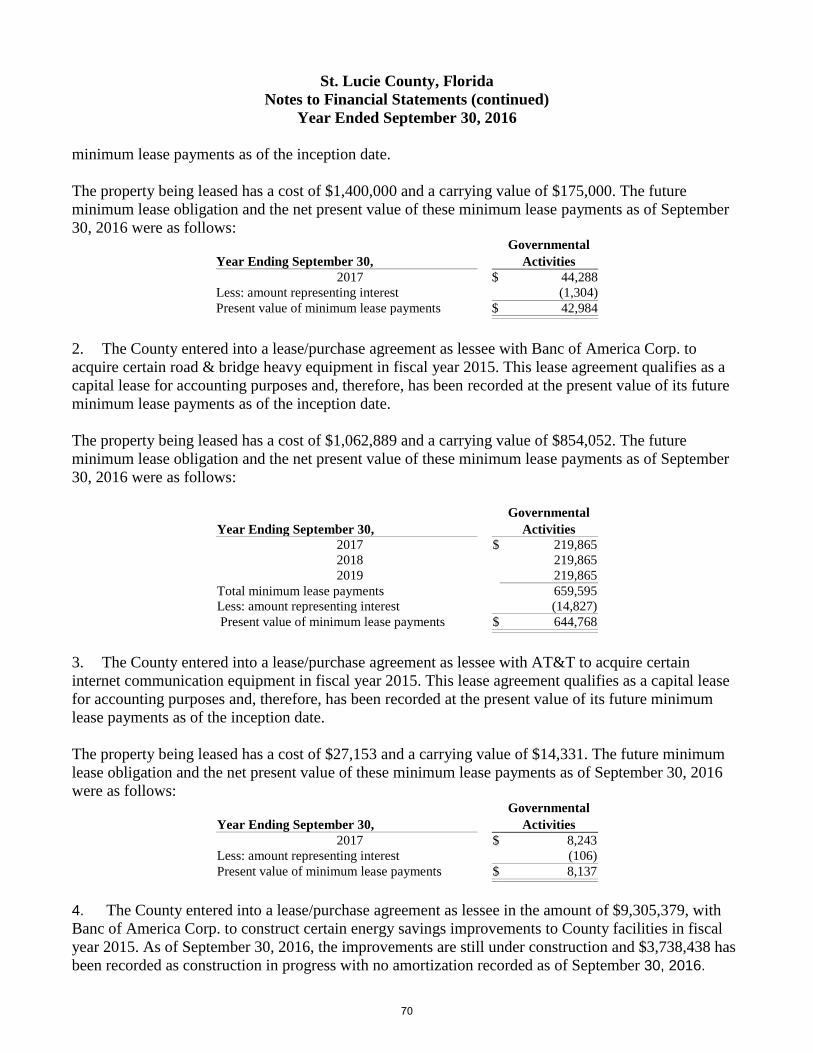
St. Lucie County, Florida
Notes to Financial Statements (continued)
Year Ended September 30, 2016
minimum lease payments as of the inception date.
The property being leased has a cost of $1,400,000 and a carrying value of $175,000. The future
minimum lease obligation and the net present value of these minimum lease payments as of September
30, 2016 were as follows:
Governmental
Year Ending September 30, Activities
2017 $ 44,288
Less: amount representing interest (1,304)
Present value of minimum lease payments $ 42,984
2. The County entered into a lease/purchase agreement as lessee with Banc of America Corp. to
acquire certain road & bridge heavy equipment in fiscal year 2015. This lease agreement qualifies as a
capital lease for accounting purposes and, therefore, has been recorded at the present value of its future
minimum lease payments as of the inception date.
The property being leased has a cost of $1,062,889 and a carrying value of $854,052. The future
minimum lease obligation and the net present value of these minimum lease payments as of September
30, 2016 were as follows:
Governmental
Year Ending September 30, Activities
2017 $ 219,865
2018 219,865
2019 219,865
Total minimum lease payments 659,595
Less: amount representing interest (14,827)
Present value of minimum lease payments $ 644,768
3. The County entered into a lease/purchase agreement as lessee with AT&T to acquire certain
internet communication equipment in fiscal year 2015. This lease agreement qualifies as a capital lease
for accounting purposes and, therefore, has been recorded at the present value of its future minimum
lease payments as of the inception date.
The property being leased has a cost of $27,153 and a carrying value of $14,331. The future minimum
lease obligation and the net present value of these minimum lease payments as of September 30, 2016
were as follows: Governmental
Year Ending September 30, Activities
2017 $ 8,243
Less: amount representing interest (106)
Present value of minimum lease payments $ 8,137
4. The County entered into a lease/purchase agreement as lessee in the amount of $9,305,379, with
Banc of America Corp. to construct certain energy savings improvements to County facilities in fiscal
year 2015. As of September 30, 2016, the improvements are still under construction and $3,738,438 has
been recorded as construction in progress with no amortization recorded as of September 30, 2016.
70
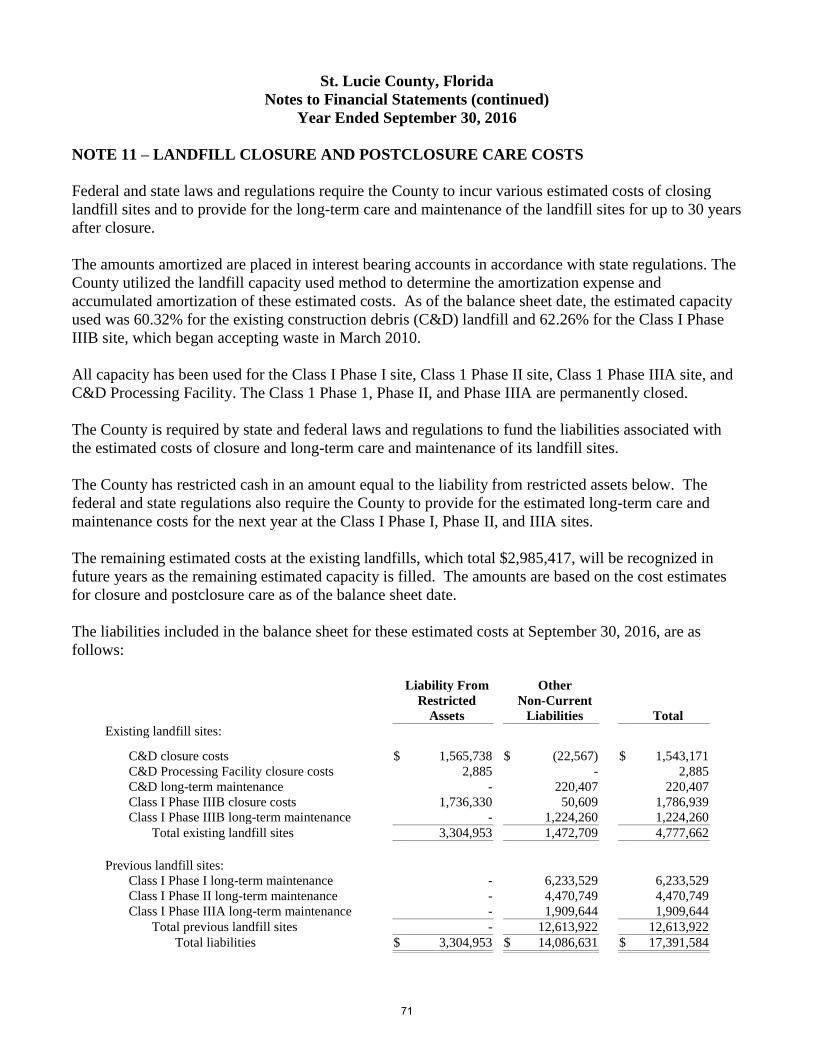
St. Lucie County, Florida
Notes to Financial Statements (continued)
Year Ended September 30, 2016
NOTE 11 – LANDFILL CLOSURE AND POSTCLOSURE CARE COSTS
Federal and state laws and regulations require the County to incur various estimated costs of closing
landfill sites and to provide for the long-term care and maintenance of the landfill sites for up to 30 years
after closure.
The amounts amortized are placed in interest bearing accounts in accordance with state regulations. The
County utilized the landfill capacity used method to determine the amortization expense and
accumulated amortization of these estimated costs. As of the balance sheet date, the estimated capacity
used was 60.32% for the existing construction debris (C&D) landfill and 62.26% for the Class I Phase
IIIB site, which began accepting waste in March 2010.
All capacity has been used for the Class I Phase I site, Class 1 Phase II site, Class 1 Phase IIIA site, and
C&D Processing Facility. The Class 1 Phase 1, Phase II, and Phase IIIA are permanently closed.
The County is required by state and federal laws and regulations to fund the liabilities associated with
the estimated costs of closure and long-term care and maintenance of its landfill sites.
The County has restricted cash in an amount equal to the liability from restricted assets below. The
federal and state regulations also require the County to provide for the estimated long-term care and
maintenance costs for the next year at the Class I Phase I, Phase II, and IIIA sites.
The remaining estimated costs at the existing landfills, which total $2,985,417, will be recognized in
future years as the remaining estimated capacity is filled. The amounts are based on the cost estimates
for closure and postclosure care as of the balance sheet date.
The liabilities included in the balance sheet for these estimated costs at September 30, 2016, are as
follows:
Liability From Other
Restricted Non-Current
Assets Liabilities Total
Existing landfill sites:
C&D closure costs $ 1,565,738 $ (22,567) $ 1,543,171
C&D Processing Facility closure costs 2,885 - 2,885
C&D long-term maintenance - 220,407 220,407
Class I Phase IIIB closure costs 1,736,330 50,609 1,786,939
Class I Phase IIIB long-term maintenance - 1,224,260 1,224,260
Total existing landfill sites 3,304,953 1,472,709 4,777,662
Previous landfill sites:
Class I Phase I long-term maintenance - 6,233,529 6,233,529
Class I Phase II long-term maintenance - 4,470,749 4,470,749
Class I Phase IIIA long-term maintenance - 1,909,644 1,909,644
Total previous landfill sites - 12,613,922 12,613,922
Total liabilities $ 3,304,953 $ 14,086,631 $ 17,391,584
71
St. Lucie County, Florida
Notes to Financial Statements (continued)
Year Ended September 30, 2016
Federal and state regulations require $1,565,738 to be set aside in the restricted cash and liabilities from
restricted assets for C&D closure costs. GAAP requires the liabilities to reflect the capacity used, which
is $1,543,171. Therefore, a negative amount of $22,567 is presented in the other non-current liability
column.
The County currently expects to close the existing C&D site in 2058 and the existing Class 1 Phase IIIB
site in 2021. Actual costs may be higher due to inflation, changes in technology, or changes in
regulations. The County has established liabilities for the estimated postclosure care and maintenance
on the closed landfill sites. The estimated costs for the postclosure care and maintenance of these sites
are reflected as landfill closure liabilities in the accompanying balance sheet.
NOTE 12 – DEFINED BENEFIT PENSION PLANS
Florida Retirement System:
General Information - All of the County’s employees participate in the Florida Retirement System
(FRS). As provided by Chapters 121 and 112, Florida Statutes, the FRS provides two cost sharing,
multiple employer defined benefit plans administered by the Florida Department of Management
Services, Division of Retirement, including the FRS Pension Plan (“Pension Plan”) and the Retiree
Health Insurance Subsidy (“HIS Plan”). Under Section 121.4501, Florida Statutes, the FRS also
provides a defined contribution plan (“Investment Plan”) alternative to the FRS Pension Plan, which is
administered by the State Board of Administration (“SBA”). As a general rule, membership in the FRS
is compulsory for all employees working in a regularly established position for a state agency, county
government, district school board, state university, community college, or a participating city or special
district within the State of Florida. The FRS provides retirement and disability benefits, annual cost-of-
living adjustments, and death benefits to plan members and beneficiaries. Benefits are established by
Chapter 121, Florida Statutes, and Chapter 60S, Florida Administrative Code. Amendments to the law
can be made only by an act of the Florida State Legislature.
The State of Florida annually issues a publicly available financial report that includes financial
statements and required supplementary information for the FRS. The latest available report may be
obtained by writing to the State of Florida Division of Retirement, Department of Management Services,
P.O. Box 9000, Tallahassee, Florida 32315-9000, or from the Web site:
www.dms.myflorida.com/workforce_operations/retirement/publications.
The County’s pension expense totaled $16,394,711 for the fiscal year ended September 30, 2016.
Pension Plan
Plan Description – The Pension Plan is a cost-sharing multiple-employer defined benefit pension plan,
with a Deferred Retirement Option Program (“DROP”) for eligible employees.
Benefits Provided - Benefits under the Pension Plan are computed on the basis of age, average final
compensation, and service credit. For Pension Plan members enrolled before July 1, 2011, Regular class
72
St. Lucie County, Florida
Notes to Financial Statements (continued)
Year Ended September 30, 2016
members who retire at or after age 62 with at least six years of credited service or 30 years of service
regardless of age are entitled to a retirement benefit payable monthly for life, equal to 1.6% of their final
average compensation based on the five highest years of salary, for each year of credited service.
Vested members with less than 30 years of service may retire before age 62 and receive reduced
retirement benefits. Special Risk Administrative Support class members who retire at or after age 55
with at least six years of credited service or 25 years of service regardless of age are entitled to a
retirement benefit payable monthly for life, equal to 1.6% of their final average compensation based on
the five highest years of salary, for each year of credited service. Special Risk class members (sworn law
enforcement officers, firefighters, and correctional officers) who retire at or after age 55 with at least six
years of credited service, or with 25 years of service regardless of age, are entitled to a retirement benefit
payable monthly for life, equal to 3.0% of their final average compensation based on the five highest
years of salary for each year of credited service. Senior Management Service class members who retire
at or after age 62 with at least six years of credited service or 30 years of service regardless of age are
entitled to a retirement benefit payable monthly for life, equal to 2.0% of their final average
compensation based on the five highest years of salary for each year of credited service. Elected
Officers’ class members who retire at or after age 62 with at least six years of credited service or 30
years of service regardless of age are entitled to a retirement benefit payable monthly for life, equal to
3.0% (3.33% for judges and justices) of their final average compensation based on the five highest years
of salary for each year of credited service.
For Plan members enrolled on or after July 1, 2011, the vesting requirement is extended to eight years of
credited service for all these members and increasing normal retirement to age 65 or 33 years of service
regardless of age for Regular, Senior Management Service, and Elected Officers’ class members, and to
age 60 or 30 years of service regardless of age for Special Risk and Special Risk Administrative Support
class members. Also, the final average compensation for all these members will be based on the eight
highest years of salary.
As provided in Section 121.101, Florida Statutes, if the member is initially enrolled in the Pension Plan
before July 1, 2011, and all service credit was accrued before July 1, 2011, the annual cost-of living
adjustment is three percent per year. If the member is initially enrolled before July 1, 2011, and has
service credit on or after July 1, 2011, there is an individually calculated cost-of-living adjustment. The
annual cost-of-living adjustment is a proportion of three percent determined by dividing the sum of the
pre-July 2011 service credit by the total service credit at retirement multiplied by three percent. Plan
members initially enrolled on or after July 1, 2011, will not have a cost-of-living adjustment after
retirement.
In addition to the above benefits, the DROP program allows eligible members to defer receipt of
monthly retirement benefit payments while continuing employment with a FRS employer for a period
not to exceed 60 months after electing to participate. Deferred monthly benefits are held in the FRS
Trust Fund and accrue interest. There are no required contributions by DROP participants. The net
pension liability does not include amounts for DROP participants as these members are considered
retired and are not accruing additional pension benefits.
Contributions – Effective July 1, 2011, all enrolled members of the FRS, other than DROP participants,
are required to contribute three percent of their salary to the FRS. In addition to member contributions,
governmental employers are required to make contributions to the FRS based on state-wide contribution
73
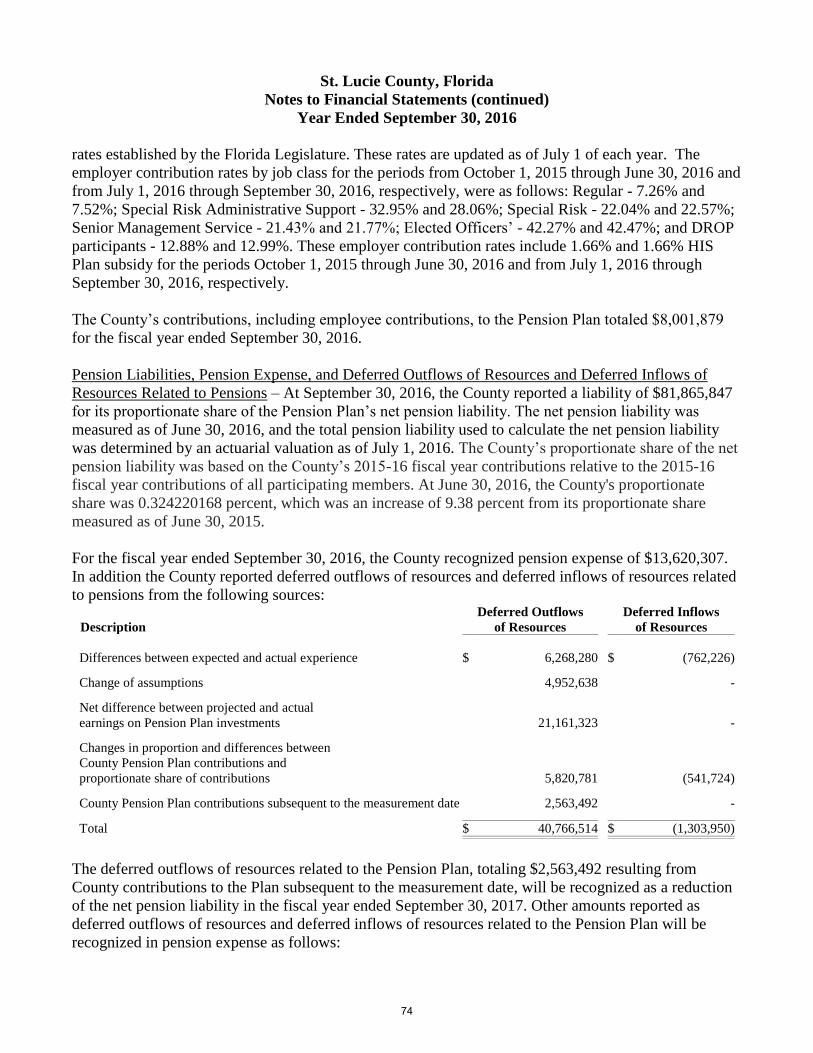
St. Lucie County, Florida
Notes to Financial Statements (continued)
Year Ended September 30, 2016
rates established by the Florida Legislature. These rates are updated as of July 1 of each year. The
employer contribution rates by job class for the periods from October 1, 2015 through June 30, 2016 and
from July 1, 2016 through September 30, 2016, respectively, were as follows: Regular - 7.26% and
7.52%; Special Risk Administrative Support - 32.95% and 28.06%; Special Risk - 22.04% and 22.57%;
Senior Management Service - 21.43% and 21.77%; Elected Officers’ - 42.27% and 42.47%; and DROP
participants - 12.88% and 12.99%. These employer contribution rates include 1.66% and 1.66% HIS
Plan subsidy for the periods October 1, 2015 through June 30, 2016 and from July 1, 2016 through
September 30, 2016, respectively.
The County’s contributions, including employee contributions, to the Pension Plan totaled $8,001,879
for the fiscal year ended September 30, 2016.
Pension Liabilities, Pension Expense, and Deferred Outflows of Resources and Deferred Inflows of
Resources Related to Pensions – At September 30, 2016, the County reported a liability of $81,865,847
for its proportionate share of the Pension Plan’s net pension liability. The net pension liability was
measured as of June 30, 2016, and the total pension liability used to calculate the net pension liability
was determined by an actuarial valuation as of July 1, 2016. The County’s proportionate share of the net
pension liability was based on the County’s 2015-16 fiscal year contributions relative to the 2015-16
fiscal year contributions of all participating members. At June 30, 2016, the County's proportionate
share was 0.324220168 percent, which was an increase of 9.38 percent from its proportionate share
measured as of June 30, 2015.
For the fiscal year ended September 30, 2016, the County recognized pension expense of $13,620,307.
In addition the County reported deferred outflows of resources and deferred inflows of resources related
to pensions from the following sources:
Description
Deferred Outflows
of Resources
Deferred Inflows
of Resources
Differences between expected and actual experience $ 6,268,280 $ (762,226)
Change of assumptions 4,952,638 -
Net difference between projected and actual
earnings on Pension Plan investments 21,161,323 -
Changes in proportion and differences between
County Pension Plan contributions and
proportionate share of contributions 5,820,781 (541,724)
County Pension Plan contributions subsequent to the measurement date 2,563,492 -
Total $ 40,766,514 $ (1,303,950)
The deferred outflows of resources related to the Pension Plan, totaling $2,563,492 resulting from
County contributions to the Plan subsequent to the measurement date, will be recognized as a reduction
of the net pension liability in the fiscal year ended September 30, 2017. Other amounts reported as
deferred outflows of resources and deferred inflows of resources related to the Pension Plan will be
recognized in pension expense as follows:
74
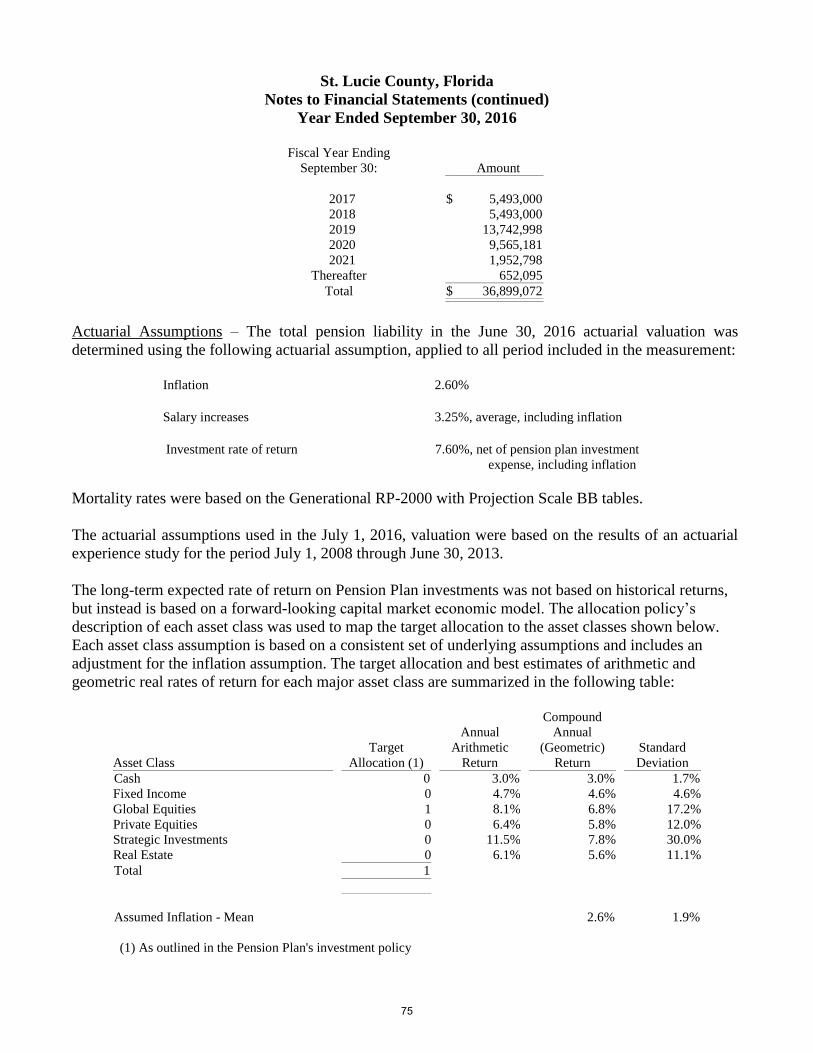
St. Lucie County, Florida
Notes to Financial Statements (continued)
Year Ended September 30, 2016
Fiscal Year Ending
September 30: Amount
2017 $ 5,493,000
2018 5,493,000
2019 13,742,998
2020 9,565,181
2021 1,952,798
Thereafter 652,095
Total $ 36,899,072
Actuarial Assumptions – The total pension liability in the June 30, 2016 actuarial valuation was
determined using the following actuarial assumption, applied to all period included in the measurement:
Inflation 2.60%
Salary increases 3.25%, average, including inflation
Investment rate of return 7.60%, net of pension plan investment
expense, including inflation
Mortality rates were based on the Generational RP-2000 with Projection Scale BB tables.
The actuarial assumptions used in the July 1, 2016, valuation were based on the results of an actuarial
experience study for the period July 1, 2008 through June 30, 2013.
The long-term expected rate of return on Pension Plan investments was not based on historical returns,
but instead is based on a forward-looking capital market economic model. The allocation policy’s
description of each asset class was used to map the target allocation to the asset classes shown below.
Each asset class assumption is based on a consistent set of underlying assumptions and includes an
adjustment for the inflation assumption. The target allocation and best estimates of arithmetic and
geometric real rates of return for each major asset class are summarized in the following table:
Asset Class
Target
Allocation (1)
Annual
Arithmetic
Return
Compound
Annual
(Geometric)
Return
Standard
Deviation
Cash 0 3.0% 3.0% 1.7%
Fixed Income 0 4.7% 4.6% 4.6%
Global Equities 1 8.1% 6.8% 17.2%
Private Equities 0 6.4% 5.8% 12.0%
Strategic Investments 0 11.5% 7.8% 30.0%
Real Estate 0 6.1% 5.6% 11.1%
Total 1
Assumed Inflation - Mean 2.6% 1.9%
(1) As outlined in the Pension Plan's investment policy
75
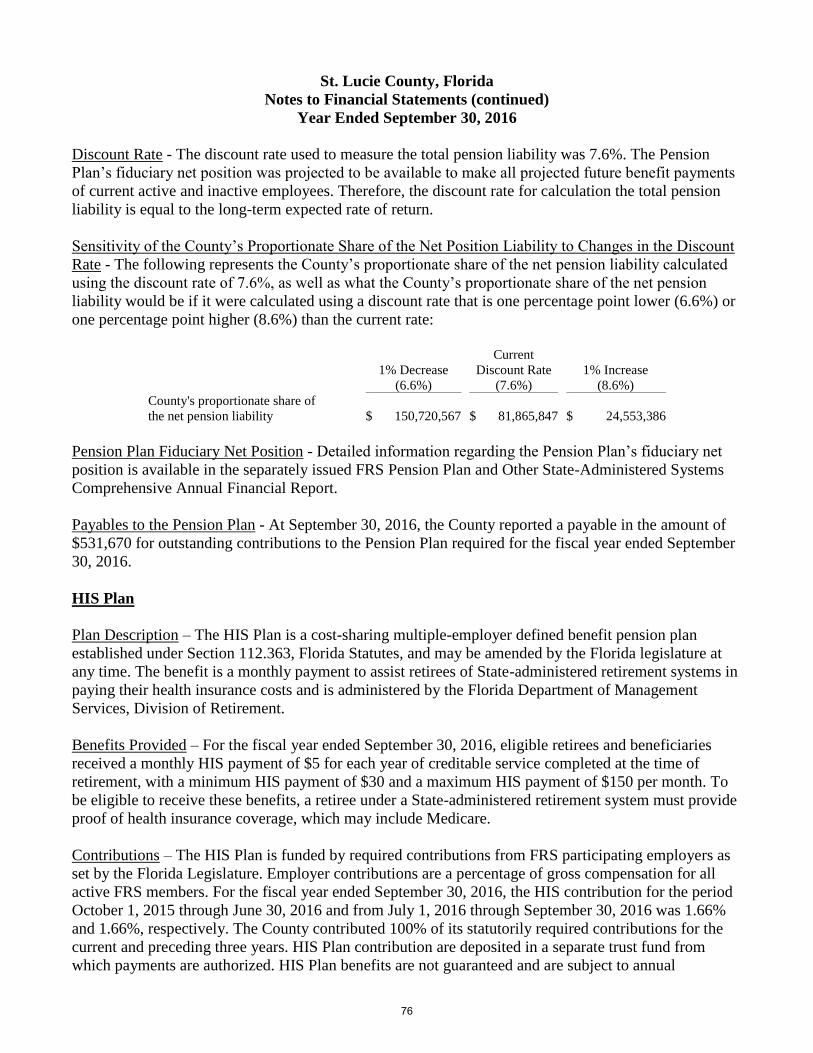
St. Lucie County, Florida
Notes to Financial Statements (continued)
Year Ended September 30, 2016
Discount Rate - The discount rate used to measure the total pension liability was 7.6%. The Pension
Plan’s fiduciary net position was projected to be available to make all projected future benefit payments
of current active and inactive employees. Therefore, the discount rate for calculation the total pension
liability is equal to the long-term expected rate of return.
Sensitivity of the County’s Proportionate Share of the Net Position Liability to Changes in the Discount
Rate - The following represents the County’s proportionate share of the net pension liability calculated
using the discount rate of 7.6%, as well as what the County’s proportionate share of the net pension
liability would be if it were calculated using a discount rate that is one percentage point lower (6.6%) or
one percentage point higher (8.6%) than the current rate:
1% Decrease
(6.6%)
Current
Discount Rate
(7.6%)
1% Increase
(8.6%)
County's proportionate share of
the net pension liability $ 150,720,567 $ 81,865,847 $ 24,553,386
Pension Plan Fiduciary Net Position - Detailed information regarding the Pension Plan’s fiduciary net
position is available in the separately issued FRS Pension Plan and Other State-Administered Systems
Comprehensive Annual Financial Report.
Payables to the Pension Plan - At September 30, 2016, the County reported a payable in the amount of
$531,670 for outstanding contributions to the Pension Plan required for the fiscal year ended September
30, 2016.
HIS Plan
Plan Description – The HIS Plan is a cost-sharing multiple-employer defined benefit pension plan
established under Section 112.363, Florida Statutes, and may be amended by the Florida legislature at
any time. The benefit is a monthly payment to assist retirees of State-administered retirement systems in
paying their health insurance costs and is administered by the Florida Department of Management
Services, Division of Retirement.
Benefits Provided – For the fiscal year ended September 30, 2016, eligible retirees and beneficiaries
received a monthly HIS payment of $5 for each year of creditable service completed at the time of
retirement, with a minimum HIS payment of $30 and a maximum HIS payment of $150 per month. To
be eligible to receive these benefits, a retiree under a State-administered retirement system must provide
proof of health insurance coverage, which may include Medicare.
Contributions – The HIS Plan is funded by required contributions from FRS participating employers as
set by the Florida Legislature. Employer contributions are a percentage of gross compensation for all
active FRS members. For the fiscal year ended September 30, 2016, the HIS contribution for the period
October 1, 2015 through June 30, 2016 and from July 1, 2016 through September 30, 2016 was 1.66%
and 1.66%, respectively. The County contributed 100% of its statutorily required contributions for the
current and preceding three years. HIS Plan contribution are deposited in a separate trust fund from
which payments are authorized. HIS Plan benefits are not guaranteed and are subject to annual
76
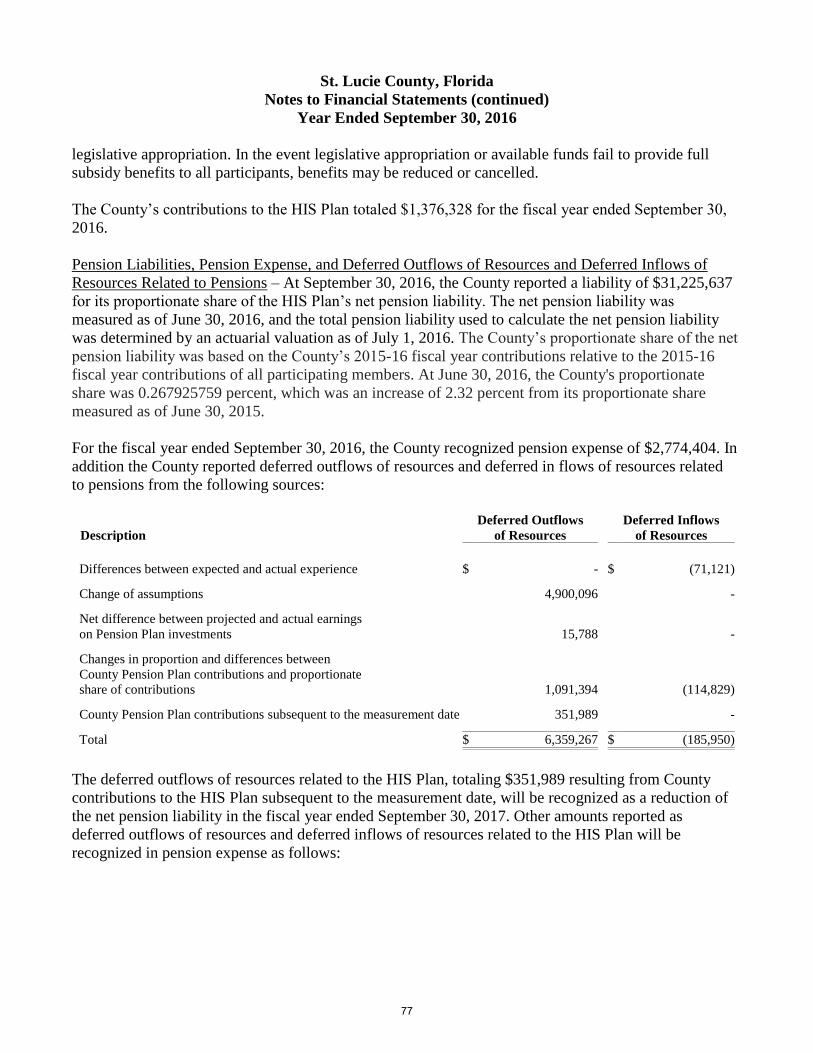
St. Lucie County, Florida
Notes to Financial Statements (continued)
Year Ended September 30, 2016
legislative appropriation. In the event legislative appropriation or available funds fail to provide full
subsidy benefits to all participants, benefits may be reduced or cancelled.
The County’s contributions to the HIS Plan totaled $1,376,328 for the fiscal year ended September 30,
2016.
Pension Liabilities, Pension Expense, and Deferred Outflows of Resources and Deferred Inflows of
Resources Related to Pensions – At September 30, 2016, the County reported a liability of $31,225,637
for its proportionate share of the HIS Plan’s net pension liability. The net pension liability was
measured as of June 30, 2016, and the total pension liability used to calculate the net pension liability
was determined by an actuarial valuation as of July 1, 2016. The County’s proportionate share of the net
pension liability was based on the County’s 2015-16 fiscal year contributions relative to the 2015-16
fiscal year contributions of all participating members. At June 30, 2016, the County's proportionate
share was 0.267925759 percent, which was an increase of 2.32 percent from its proportionate share
measured as of June 30, 2015.
For the fiscal year ended September 30, 2016, the County recognized pension expense of $2,774,404. In
addition the County reported deferred outflows of resources and deferred in flows of resources related
to pensions from the following sources:
Description
Deferred Outflows
of Resources
Deferred Inflows
of Resources
Differences between expected and actual experience $ - $ (71,121)
Change of assumptions 4,900,096 -
Net difference between projected and actual earnings
on Pension Plan investments 15,788 -
Changes in proportion and differences between
County Pension Plan contributions and proportionate
share of contributions 1,091,394 (114,829)
County Pension Plan contributions subsequent to the measurement date 351,989 -
Total $ 6,359,267 $ (185,950)
The deferred outflows of resources related to the HIS Plan, totaling $351,989 resulting from County
contributions to the HIS Plan subsequent to the measurement date, will be recognized as a reduction of
the net pension liability in the fiscal year ended September 30, 2017. Other amounts reported as
deferred outflows of resources and deferred inflows of resources related to the HIS Plan will be
recognized in pension expense as follows:
77
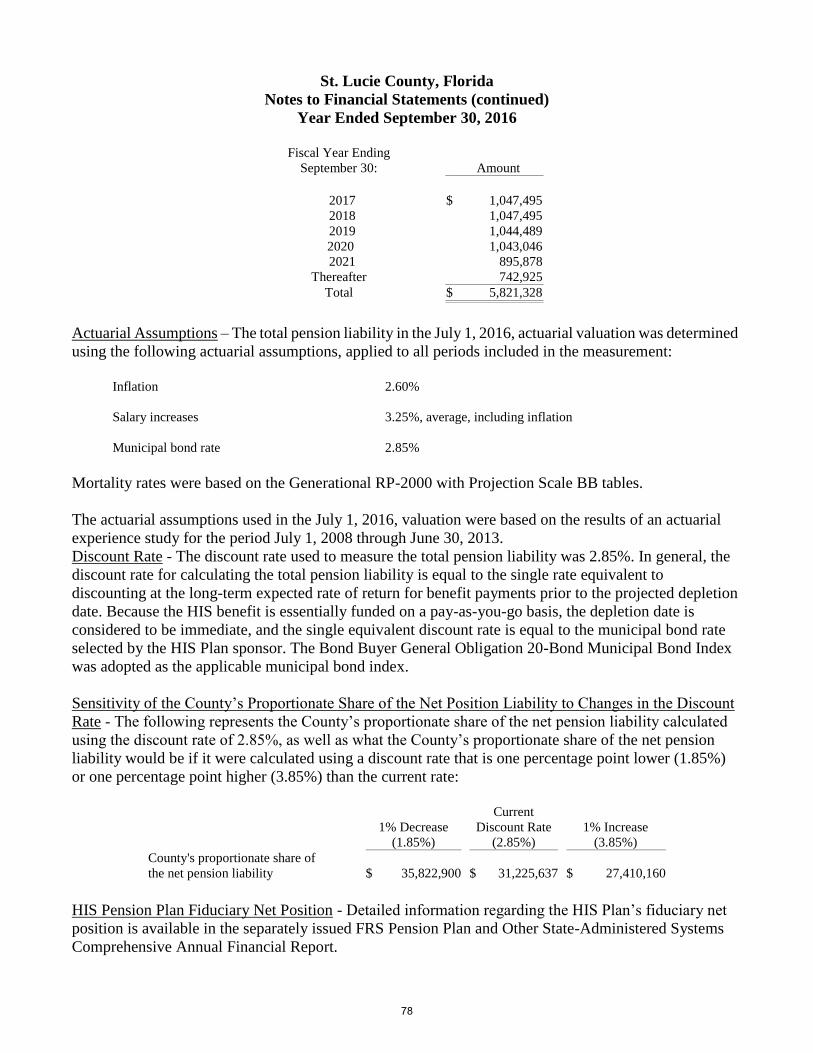
St. Lucie County, Florida
Notes to Financial Statements (continued)
Year Ended September 30, 2016
Fiscal Year Ending
September 30: Amount
2017 $ 1,047,495
2018 1,047,495
2019 1,044,489
2020 1,043,046
2021 895,878
Thereafter 742,925
Total $ 5,821,328
Actuarial Assumptions – The total pension liability in the July 1, 2016, actuarial valuation was determined
using the following actuarial assumptions, applied to all periods included in the measurement:
Inflation 2.60%
Salary increases 3.25%, average, including inflation
Municipal bond rate 2.85%
Mortality rates were based on the Generational RP-2000 with Projection Scale BB tables.
The actuarial assumptions used in the July 1, 2016, valuation were based on the results of an actuarial
experience study for the period July 1, 2008 through June 30, 2013.
Discount Rate - The discount rate used to measure the total pension liability was 2.85%. In general, the
discount rate for calculating the total pension liability is equal to the single rate equivalent to
discounting at the long-term expected rate of return for benefit payments prior to the projected depletion
date. Because the HIS benefit is essentially funded on a pay-as-you-go basis, the depletion date is
considered to be immediate, and the single equivalent discount rate is equal to the municipal bond rate
selected by the HIS Plan sponsor. The Bond Buyer General Obligation 20-Bond Municipal Bond Index
was adopted as the applicable municipal bond index.
Sensitivity of the County’s Proportionate Share of the Net Position Liability to Changes in the Discount
Rate - The following represents the County’s proportionate share of the net pension liability calculated
using the discount rate of 2.85%, as well as what the County’s proportionate share of the net pension
liability would be if it were calculated using a discount rate that is one percentage point lower (1.85%)
or one percentage point higher (3.85%) than the current rate:
1% Decrease
(1.85%)
Current
Discount Rate
(2.85%)
1% Increase
(3.85%)
County's proportionate share of
the net pension liability $ 35,822,900 $ 31,225,637 $ 27,410,160
HIS Pension Plan Fiduciary Net Position - Detailed information regarding the HIS Plan’s fiduciary net
position is available in the separately issued FRS Pension Plan and Other State-Administered Systems
Comprehensive Annual Financial Report.
78
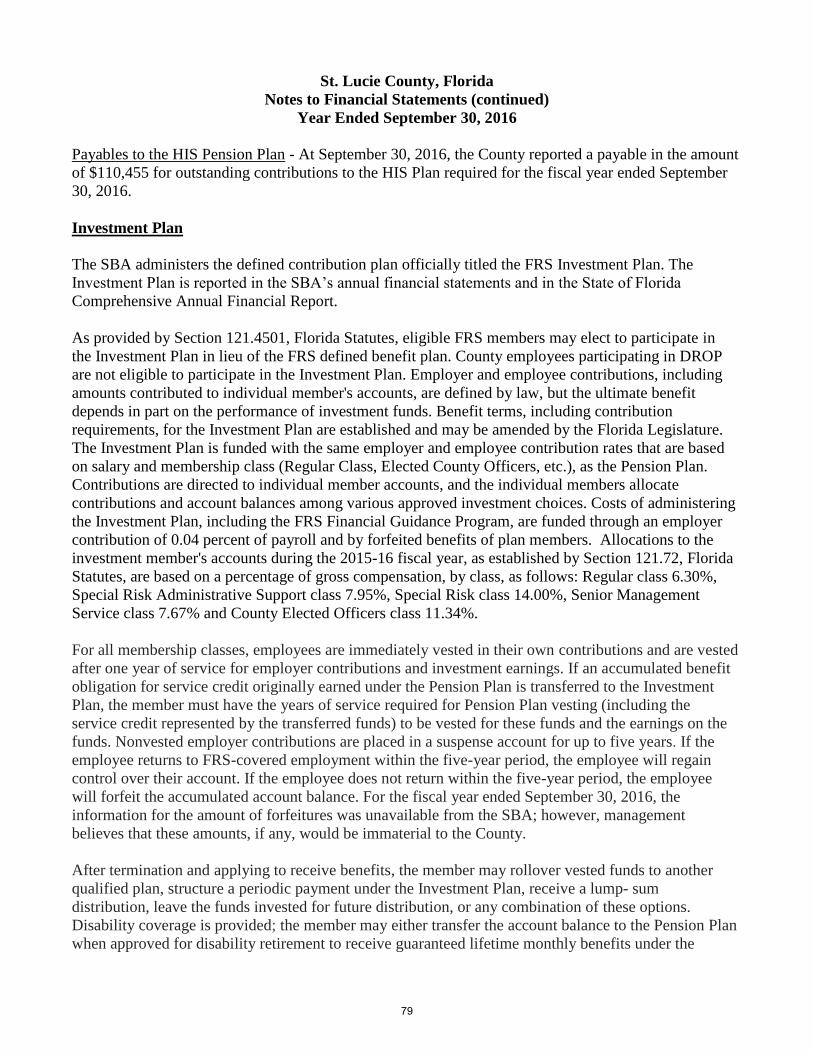
St. Lucie County, Florida
Notes to Financial Statements (continued)
Year Ended September 30, 2016
Payables to the HIS Pension Plan - At September 30, 2016, the County reported a payable in the amount
of $110,455 for outstanding contributions to the HIS Plan required for the fiscal year ended September
30, 2016.
Investment Plan
The SBA administers the defined contribution plan officially titled the FRS Investment Plan. The
Investment Plan is reported in the SBA’s annual financial statements and in the State of Florida
Comprehensive Annual Financial Report.
As provided by Section 121.4501, Florida Statutes, eligible FRS members may elect to participate in
the Investment Plan in lieu of the FRS defined benefit plan. County employees participating in DROP
are not eligible to participate in the Investment Plan. Employer and employee contributions, including
amounts contributed to individual member's accounts, are defined by law, but the ultimate benefit
depends in part on the performance of investment funds. Benefit terms, including contribution
requirements, for the Investment Plan are established and may be amended by the Florida Legislature.
The Investment Plan is funded with the same employer and employee contribution rates that are based
on salary and membership class (Regular Class, Elected County Officers, etc.), as the Pension Plan.
Contributions are directed to individual member accounts, and the individual members allocate
contributions and account balances among various approved investment choices. Costs of administering
the Investment Plan, including the FRS Financial Guidance Program, are funded through an employer
contribution of 0.04 percent of payroll and by forfeited benefits of plan members. Allocations to the
investment member's accounts during the 2015-16 fiscal year, as established by Section 121.72, Florida
Statutes, are based on a percentage of gross compensation, by class, as follows: Regular class 6.30%,
Special Risk Administrative Support class 7.95%, Special Risk class 14.00%, Senior Management
Service class 7.67% and County Elected Officers class 11.34%.
For all membership classes, employees are immediately vested in their own contributions and are vested
after one year of service for employer contributions and investment earnings. If an accumulated benefit
obligation for service credit originally earned under the Pension Plan is transferred to the Investment
Plan, the member must have the years of service required for Pension Plan vesting (including the
service credit represented by the transferred funds) to be vested for these funds and the earnings on the
funds. Nonvested employer contributions are placed in a suspense account for up to five years. If the
employee returns to FRS-covered employment within the five-year period, the employee will regain
control over their account. If the employee does not return within the five-year period, the employee
will forfeit the accumulated account balance. For the fiscal year ended September 30, 2016, the
information for the amount of forfeitures was unavailable from the SBA; however, management
believes that these amounts, if any, would be immaterial to the County.
After termination and applying to receive benefits, the member may rollover vested funds to another
qualified plan, structure a periodic payment under the Investment Plan, receive a lump sum
distribution, leave the funds invested for future distribution, or any combination of these options.
Disability coverage is provided; the member may either transfer the account balance to the Pension Plan
when approved for disability retirement to receive guaranteed lifetime monthly benefits under the
79
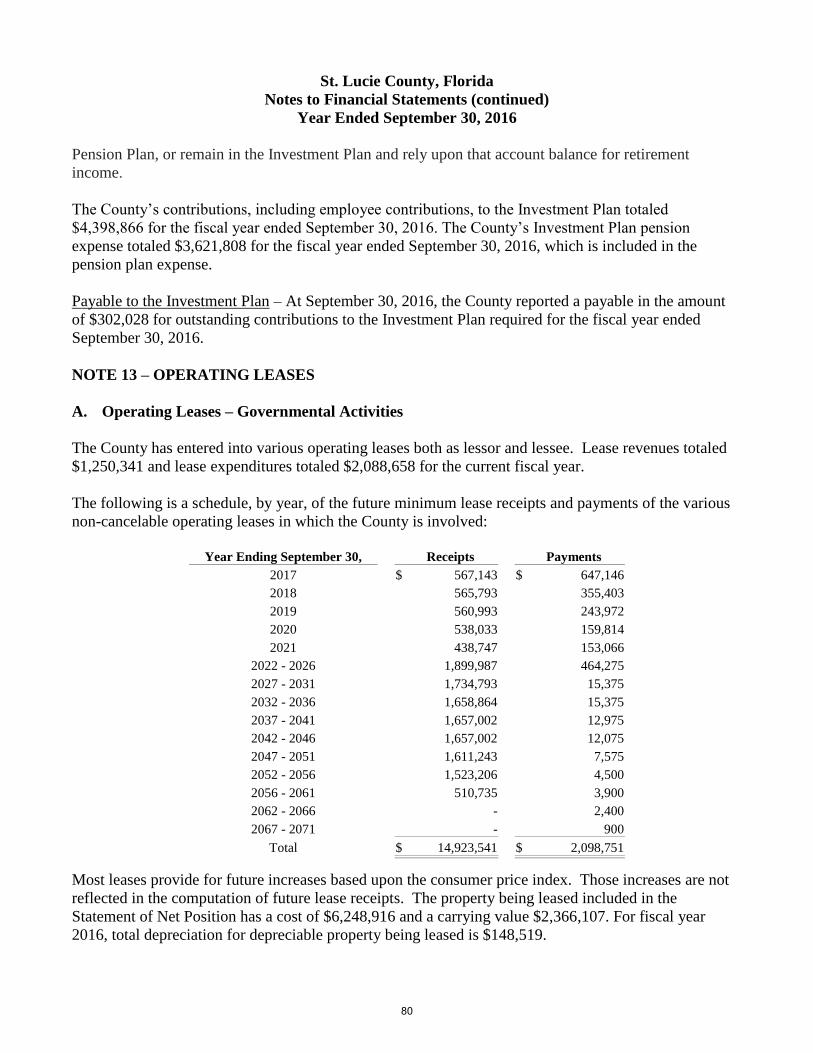
St. Lucie County, Florida
Notes to Financial Statements (continued)
Year Ended September 30, 2016
Pension Plan, or remain in the Investment Plan and rely upon that account balance for retirement
income.
The County’s contributions, including employee contributions, to the Investment Plan totaled
$4,398,866 for the fiscal year ended September 30, 2016. The County’s Investment Plan pension
expense totaled $3,621,808 for the fiscal year ended September 30, 2016, which is included in the
pension plan expense.
Payable to the Investment Plan – At September 30, 2016, the County reported a payable in the amount
of $302,028 for outstanding contributions to the Investment Plan required for the fiscal year ended
September 30, 2016.
NOTE 13 – OPERATING LEASES
A. Operating Leases – Governmental Activities
The County has entered into various operating leases both as lessor and lessee. Lease revenues totaled
$1,250,341 and lease expenditures totaled $2,088,658 for the current fiscal year.
The following is a schedule, by year, of the future minimum lease receipts and payments of the various
non-cancelable operating leases in which the County is involved:
Year Ending September 30, Receipts Payments
2017 $ 567,143 $ 647,146
2018 565,793 355,403
2019 560,993 243,972
2020 538,033 159,814
2021 438,747 153,066
2022 - 2026 1,899,987 464,275
2027 - 2031 1,734,793 15,375
2032 - 2036 1,658,864 15,375
2037 - 2041 1,657,002 12,975
2042 - 2046 1,657,002 12,075
2047 - 2051 1,611,243 7,575
2052 - 2056 1,523,206 4,500
2056 - 2061 510,735 3,900
2062 - 2066 - 2,400
2067 - 2071 - 900
Total $ 14,923,541 $ 2,098,751
Most leases provide for future increases based upon the consumer price index. Those increases are not
reflected in the computation of future lease receipts. The property being leased included in the
Statement of Net Position has a cost of $6,248,916 and a carrying value $2,366,107. For fiscal year
2016, total depreciation for depreciable property being leased is $148,519.
80
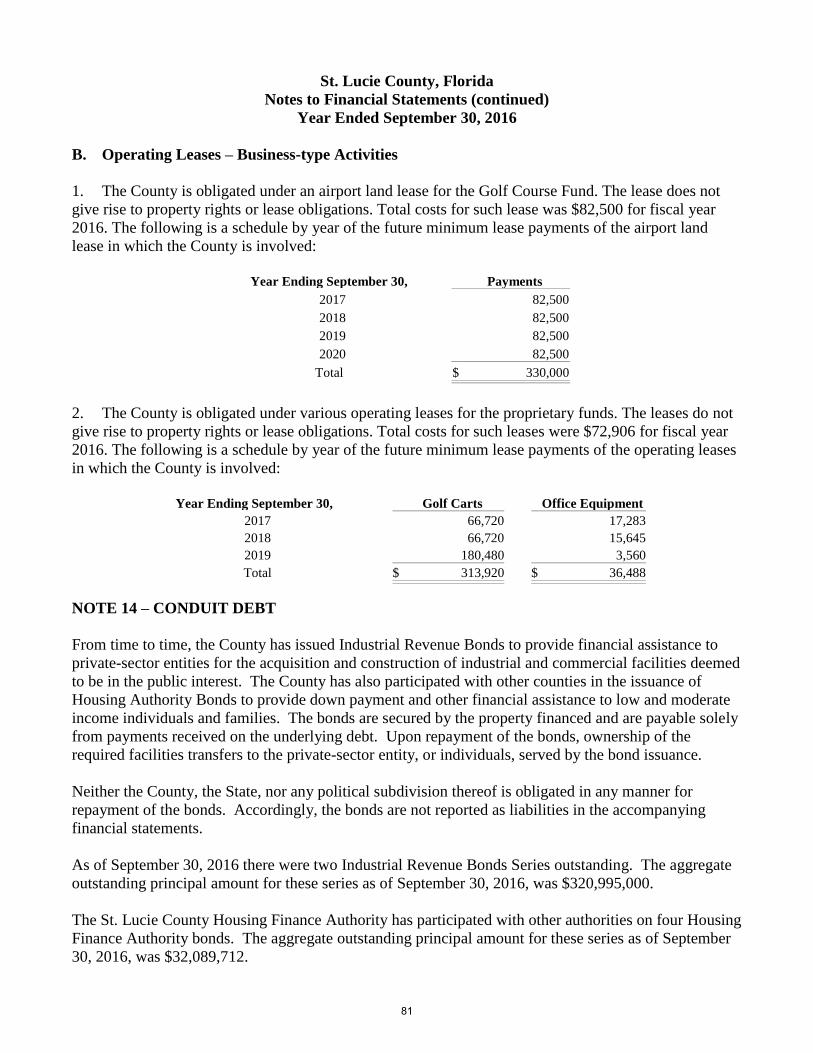
St. Lucie County, Florida
Notes to Financial Statements (continued)
Year Ended September 30, 2016
B. Operating Leases – Business-type Activities
1. The County is obligated under an airport land lease for the Golf Course Fund. The lease does not
give rise to property rights or lease obligations. Total costs for such lease was $82,500 for fiscal year
2016. The following is a schedule by year of the future minimum lease payments of the airport land
lease in which the County is involved:
Year Ending September 30, Payments
2017 82,500
2018 82,500
2019 82,500
2020 82,500
Total $ 330,000
2. The County is obligated under various operating leases for the proprietary funds. The leases do not
give rise to property rights or lease obligations. Total costs for such leases were $72,906 for fiscal year
2016. The following is a schedule by year of the future minimum lease payments of the operating leases
in which the County is involved:
Year Ending September 30, Golf Carts Office Equipment
2017 66,720 17,283
2018 66,720 15,645
2019 180,480 3,560
Total $ 313,920 $ 36,488
NOTE 14 – CONDUIT DEBT
From time to time, the County has issued Industrial Revenue Bonds to provide financial assistance to
private-sector entities for the acquisition and construction of industrial and commercial facilities deemed
to be in the public interest. The County has also participated with other counties in the issuance of
Housing Authority Bonds to provide down payment and other financial assistance to low and moderate
income individuals and families. The bonds are secured by the property financed and are payable solely
from payments received on the underlying debt. Upon repayment of the bonds, ownership of the
required facilities transfers to the private-sector entity, or individuals, served by the bond issuance.
Neither the County, the State, nor any political subdivision thereof is obligated in any manner for
repayment of the bonds. Accordingly, the bonds are not reported as liabilities in the accompanying
financial statements.
As of September 30, 2016 there were two Industrial Revenue Bonds Series outstanding. The aggregate
outstanding principal amount for these series as of September 30, 2016, was $320,995,000.
The St. Lucie County Housing Finance Authority has participated with other authorities on four Housing
Finance Authority bonds. The aggregate outstanding principal amount for these series as of September
30, 2016, was $32,089,712.
81
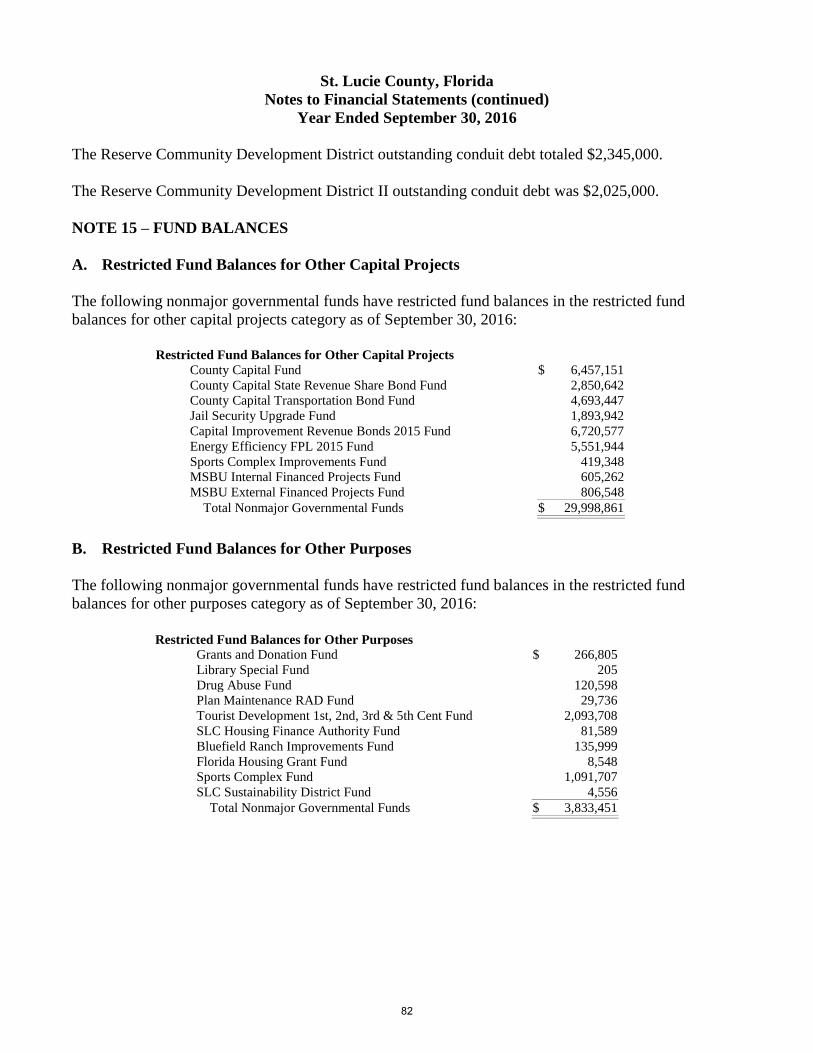
St. Lucie County, Florida
Notes to Financial Statements (continued)
Year Ended September 30, 2016
The Reserve Community Development District outstanding conduit debt totaled $2,345,000.
The Reserve Community Development District II outstanding conduit debt was $2,025,000.
NOTE 15 – FUND BALANCES
A. Restricted Fund Balances for Other Capital Projects
The following nonmajor governmental funds have restricted fund balances in the restricted fund
balances for other capital projects category as of September 30, 2016:
Restricted Fund Balances for Other Capital Projects
County Capital Fund $ 6,457,151
County Capital State Revenue Share Bond Fund 2,850,642
County Capital Transportation Bond Fund 4,693,447
Jail Security Upgrade Fund 1,893,942
Capital Improvement Revenue Bonds 2015 Fund 6,720,577
Energy Efficiency FPL 2015 Fund 5,551,944
Sports Complex Improvements Fund 419,348
MSBU Internal Financed Projects Fund 605,262
MSBU External Financed Projects Fund 806,548
Total Nonmajor Governmental Funds $ 29,998,861
B. Restricted Fund Balances for Other Purposes
The following nonmajor governmental funds have restricted fund balances in the restricted fund
balances for other purposes category as of September 30, 2016:
Restricted Fund Balances for Other Purposes
Grants and Donation Fund $ 266,805
Library Special Fund 205
Drug Abuse Fund 120,598
Plan Maintenance RAD Fund 29,736
Tourist Development 1st, 2nd, 3rd & 5th Cent Fund 2,093,708
SLC Housing Finance Authority Fund 81,589
Bluefield Ranch Improvements Fund 135,999
Florida Housing Grant Fund 8,548
Sports Complex Fund 1,091,707
SLC Sustainability District Fund 4,556
Total Nonmajor Governmental Funds $ 3,833,451
82
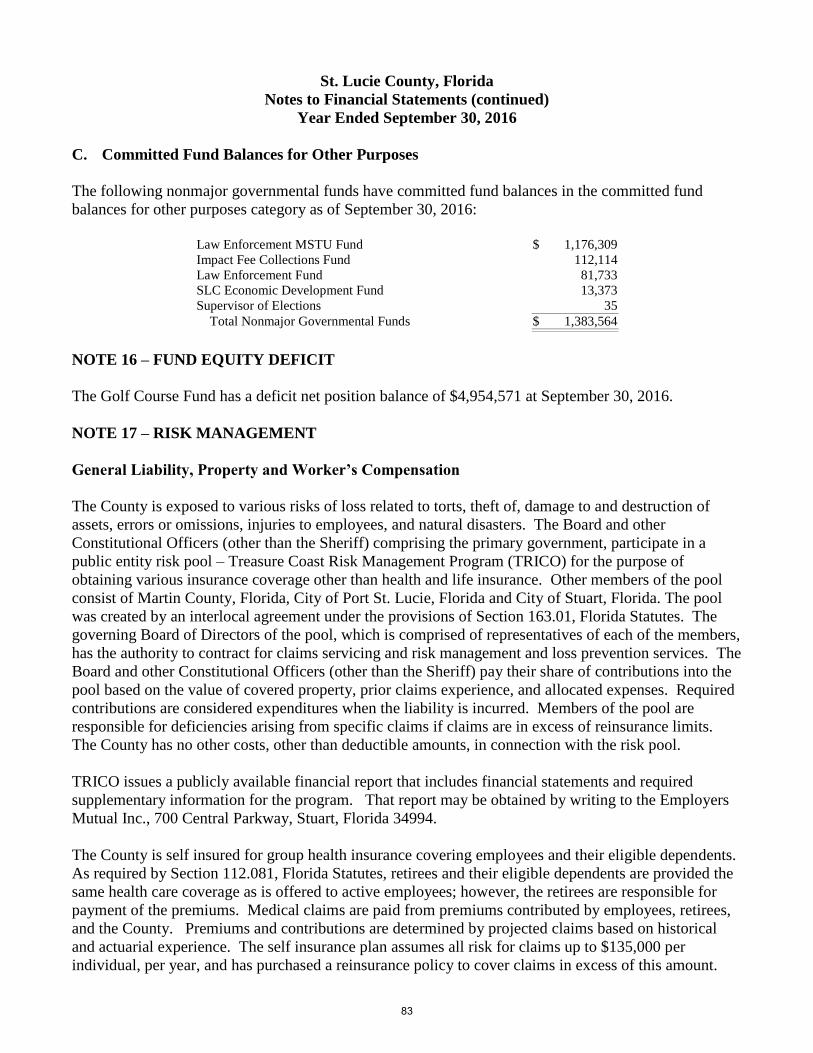
St. Lucie County, Florida
Notes to Financial Statements (continued)
Year Ended September 30, 2016
C. Committed Fund Balances for Other Purposes
The following nonmajor governmental funds have committed fund balances in the committed fund
balances for other purposes category as of September 30, 2016:
Law Enforcement MSTU Fund $ 1,176,309
Impact Fee Collections Fund 112,114
Law Enforcement Fund 81,733
SLC Economic Development Fund 13,373
Supervisor of Elections 35
Total Nonmajor Governmental Funds $ 1,383,564
NOTE 16 – FUND EQUITY DEFICIT
The Golf Course Fund has a deficit net position balance of $4,954,571 at September 30, 2016.
NOTE 17 – RISK MANAGEMENT
General Liability, Property and Worker’s Compensation
The County is exposed to various risks of loss related to torts, theft of, damage to and destruction of
assets, errors or omissions, injuries to employees, and natural disasters. The Board and other
Constitutional Officers (other than the Sheriff) comprising the primary government, participate in a
public entity risk pool – Treasure Coast Risk Management Program (TRICO) for the purpose of
obtaining various insurance coverage other than health and life insurance. Other members of the pool
consist of Martin County, Florida, City of Port St. Lucie, Florida and City of Stuart, Florida. The pool
was created by an interlocal agreement under the provisions of Section 163.01, Florida Statutes. The
governing Board of Directors of the pool, which is comprised of representatives of each of the members,
has the authority to contract for claims servicing and risk management and loss prevention services. The
Board and other Constitutional Officers (other than the Sheriff) pay their share of contributions into the
pool based on the value of covered property, prior claims experience, and allocated expenses. Required
contributions are considered expenditures when the liability is incurred. Members of the pool are
responsible for deficiencies arising from specific claims if claims are in excess of reinsurance limits.
The County has no other costs, other than deductible amounts, in connection with the risk pool.
TRICO issues a publicly available financial report that includes financial statements and required
supplementary information for the program. That report may be obtained by writing to the Employers
Mutual Inc., 700 Central Parkway, Stuart, Florida 34994.
The County is self insured for group health insurance covering employees and their eligible dependents.
As required by Section 112.081, Florida Statutes, retirees and their eligible dependents are provided the
same health care coverage as is offered to active employees; however, the retirees are responsible for
payment of the premiums. Medical claims are paid from premiums contributed by employees, retirees,
and the County. Premiums and contributions are determined by projected claims based on historical
and actuarial experience. The self insurance plan assumes all risk for claims up to $135,000 per
individual, per year, and has purchased a reinsurance policy to cover claims in excess of this amount.
83
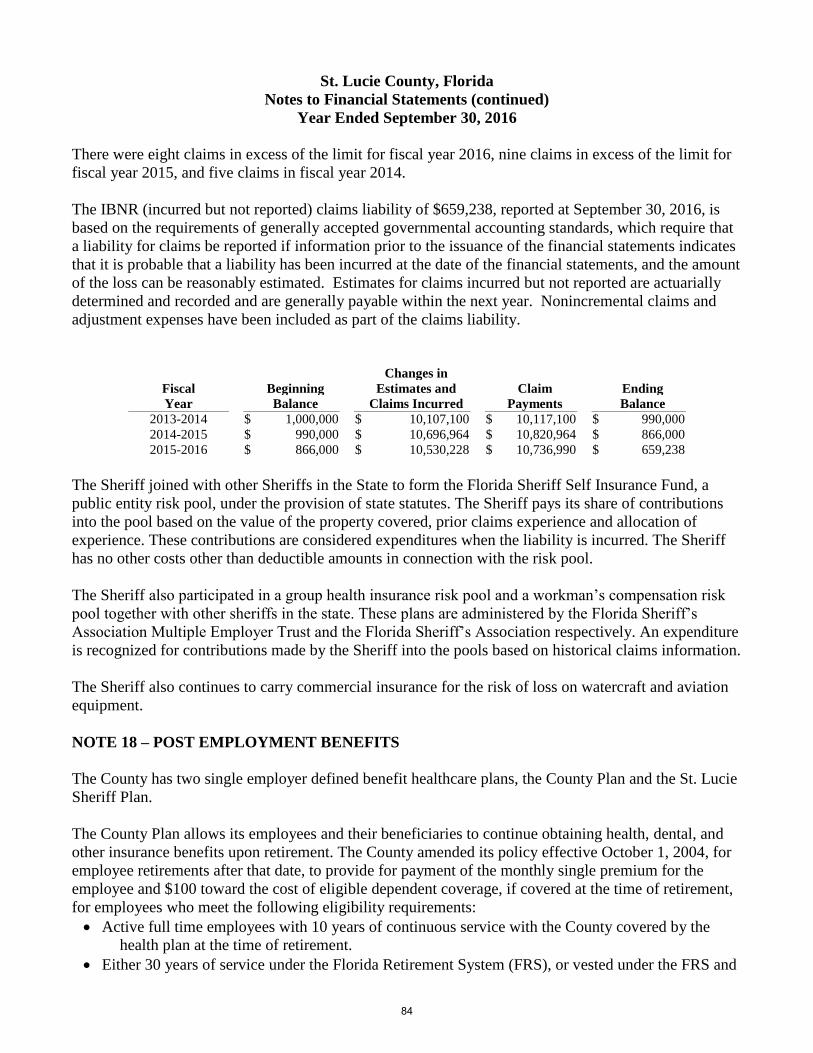
St. Lucie County, Florida
Notes to Financial Statements (continued)
Year Ended September 30, 2016
There were eight claims in excess of the limit for fiscal year 2016, nine claims in excess of the limit for
fiscal year 2015, and five claims in fiscal year 2014.
The IBNR (incurred but not reported) claims liability of $659,238, reported at September 30, 2016, is
based on the requirements of generally accepted governmental accounting standards, which require that
a liability for claims be reported if information prior to the issuance of the financial statements indicates
that it is probable that a liability has been incurred at the date of the financial statements, and the amount
of the loss can be reasonably estimated. Estimates for claims incurred but not reported are actuarially
determined and recorded and are generally payable within the next year. Nonincremental claims and
adjustment expenses have been included as part of the claims liability.
Changes in
Fiscal Beginning Estimates and Claim Ending
Year Balance Claims Incurred Payments Balance
2013-2014 $ 1,000,000 $ 10,107,100 $ 10,117,100 $ 990,000
2014-2015 $ 990,000 $ 10,696,964 $ 10,820,964 $ 866,000
2015-2016 $ 866,000 $ 10,530,228 $ 10,736,990 $ 659,238
The Sheriff joined with other Sheriffs in the State to form the Florida Sheriff Self Insurance Fund, a
public entity risk pool, under the provision of state statutes. The Sheriff pays its share of contributions
into the pool based on the value of the property covered, prior claims experience and allocation of
experience. These contributions are considered expenditures when the liability is incurred. The Sheriff
has no other costs other than deductible amounts in connection with the risk pool.
The Sheriff also participated in a group health insurance risk pool and a workman’s compensation risk
pool together with other sheriffs in the state. These plans are administered by the Florida Sheriff’s
Association Multiple Employer Trust and the Florida Sheriff’s Association respectively. An expenditure
is recognized for contributions made by the Sheriff into the pools based on historical claims information.
The Sheriff also continues to carry commercial insurance for the risk of loss on watercraft and aviation
equipment.
NOTE 18 – POST EMPLOYMENT BENEFITS
The County has two single employer defined benefit healthcare plans, the County Plan and the St. Lucie
Sheriff Plan.
The County Plan allows its employees and their beneficiaries to continue obtaining health, dental, and
other insurance benefits upon retirement. The County amended its policy effective October 1, 2004, for
employee retirements after that date, to provide for payment of the monthly single premium for the
employee and $100 toward the cost of eligible dependent coverage, if covered at the time of retirement,
for employees who meet the following eligibility requirements:
Active full time employees with 10 years of continuous service with the County covered by the
health plan at the time of retirement.
Either 30 years of service under the Florida Retirement System (FRS), or vested under the FRS and
84
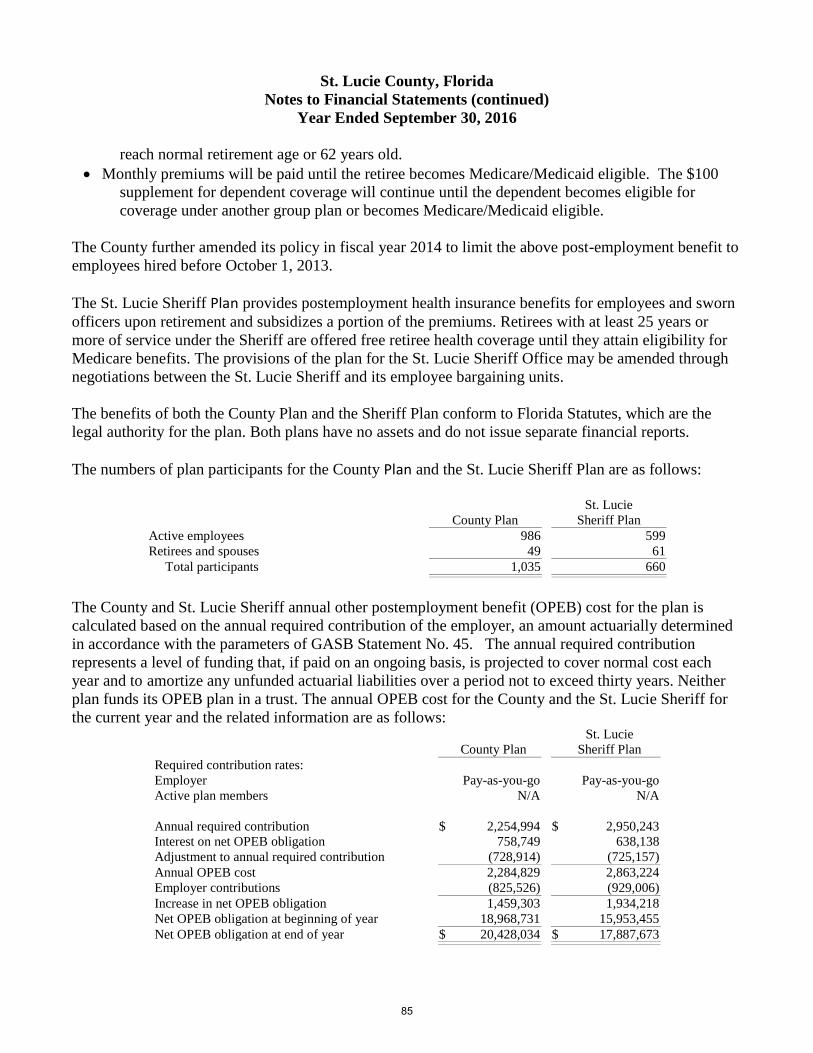
St. Lucie County, Florida
Notes to Financial Statements (continued)
Year Ended September 30, 2016
reach normal retirement age or 62 years old.
Monthly premiums will be paid until the retiree becomes Medicare/Medicaid eligible. The $100
supplement for dependent coverage will continue until the dependent becomes eligible for
coverage under another group plan or becomes Medicare/Medicaid eligible.
The County further amended its policy in fiscal year 2014 to limit the above post-employment benefit to
employees hired before October 1, 2013.
The St. Lucie Sheriff Plan provides postemployment health insurance benefits for employees and sworn
officers upon retirement and subsidizes a portion of the premiums. Retirees with at least 25 years or
more of service under the Sheriff are offered free retiree health coverage until they attain eligibility for
Medicare benefits. The provisions of the plan for the St. Lucie Sheriff Office may be amended through
negotiations between the St. Lucie Sheriff and its employee bargaining units.
The benefits of both the County Plan and the Sheriff Plan conform to Florida Statutes, which are the
legal authority for the plan. Both plans have no assets and do not issue separate financial reports.
The numbers of plan participants for the County Plan and the St. Lucie Sheriff Plan are as follows:
County Plan
St. Lucie
Sheriff Plan
Active employees 986 599
Retirees and spouses 49 61
Total participants 1,035 660
The County and St. Lucie Sheriff annual other postemployment benefit (OPEB) cost for the plan is
calculated based on the annual required contribution of the employer, an amount actuarially determined
in accordance with the parameters of GASB Statement No. 45. The annual required contribution
represents a level of funding that, if paid on an ongoing basis, is projected to cover normal cost each
year and to amortize any unfunded actuarial liabilities over a period not to exceed thirty years. Neither
plan funds its OPEB plan in a trust. The annual OPEB cost for the County and the St. Lucie Sheriff for
the current year and the related information are as follows:
County Plan
St. Lucie
Sheriff Plan
Required contribution rates:
Employer Pay-as-you-go Pay-as-you-go
Active plan members N/A N/A
Annual required contribution $ 2,254,994 $ 2,950,243
Interest on net OPEB obligation 758,749 638,138
Adjustment to annual required contribution (728,914) (725,157)
Annual OPEB cost 2,284,829 2,863,224
Employer contributions (825,526) (929,006)
Increase in net OPEB obligation 1,459,303 1,934,218
Net OPEB obligation at beginning of year 18,968,731 15,953,455
Net OPEB obligation at end of year $ 20,428,034 $ 17,887,673
85
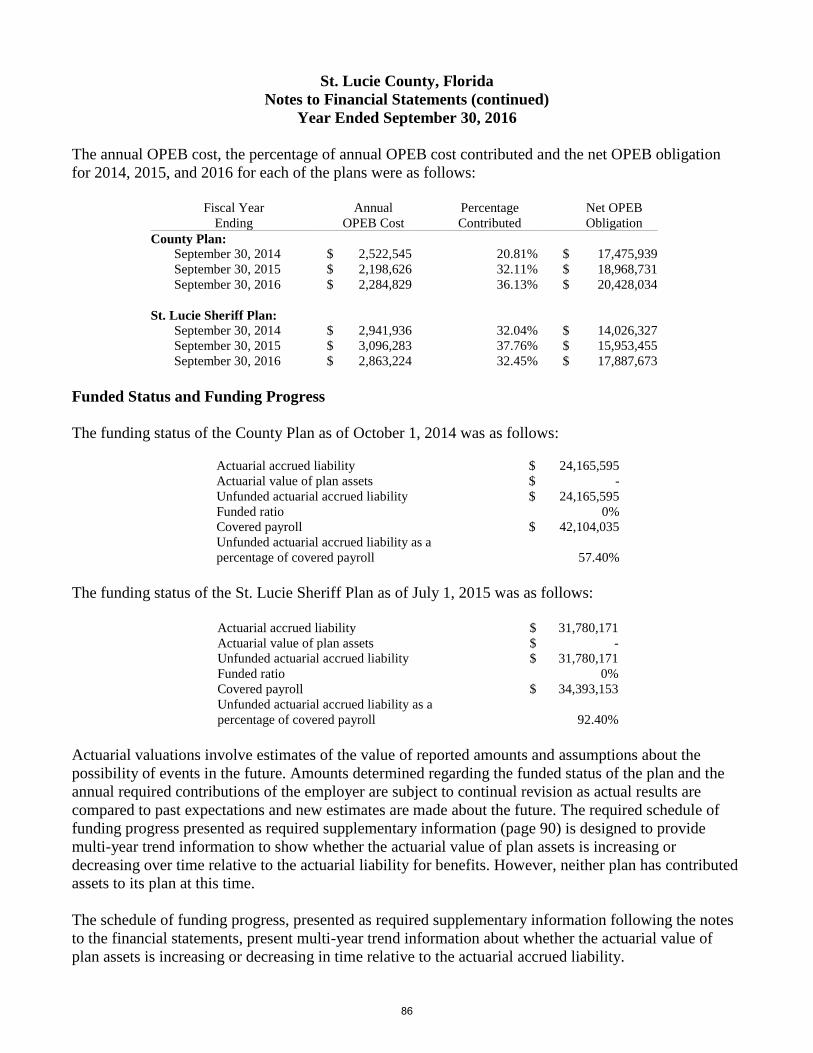
St. Lucie County, Florida
Notes to Financial Statements (continued)
Year Ended September 30, 2016
The annual OPEB cost, the percentage of annual OPEB cost contributed and the net OPEB obligation
for 2014, 2015, and 2016 for each of the plans were as follows:
Fiscal Year Annual Percentage Net OPEB
Ending OPEB Cost Contributed Obligation
County Plan:
September 30, 2014 $ 2,522,545 20.81% $ 17,475,939
September 30, 2015 $ 2,198,626 32.11% $ 18,968,731
September 30, 2016 $ 2,284,829 36.13% $ 20,428,034
St. Lucie Sheriff Plan:
September 30, 2014 $ 2,941,936 32.04% $ 14,026,327
September 30, 2015 $ 3,096,283 37.76% $ 15,953,455
September 30, 2016 $ 2,863,224 32.45% $ 17,887,673
Funded Status and Funding Progress
The funding status of the County Plan as of October 1, 2014 was as follows:
Actuarial accrued liability $ 24,165,595
Actuarial value of plan assets $ -
Unfunded actuarial accrued liability $ 24,165,595
Funded ratio 0%
Covered payroll $ 42,104,035
Unfunded actuarial accrued liability as a
percentage of covered payroll 57.40%
The funding status of the St. Lucie Sheriff Plan as of July 1, 2015 was as follows:
Actuarial accrued liability $ 31,780,171
Actuarial value of plan assets $ -
Unfunded actuarial accrued liability $ 31,780,171
Funded ratio 0%
Covered payroll $ 34,393,153
Unfunded actuarial accrued liability as a
percentage of covered payroll 92.40%
Actuarial valuations involve estimates of the value of reported amounts and assumptions about the
possibility of events in the future. Amounts determined regarding the funded status of the plan and the
annual required contributions of the employer are subject to continual revision as actual results are
compared to past expectations and new estimates are made about the future. The required schedule of
funding progress presented as required supplementary information (page 90) is designed to provide
multi-year trend information to show whether the actuarial value of plan assets is increasing or
decreasing over time relative to the actuarial liability for benefits. However, neither plan has contributed
assets to its plan at this time.
The schedule of funding progress, presented as required supplementary information following the notes
to the financial statements, present multi-year trend information about whether the actuarial value of
plan assets is increasing or decreasing in time relative to the actuarial accrued liability.
86
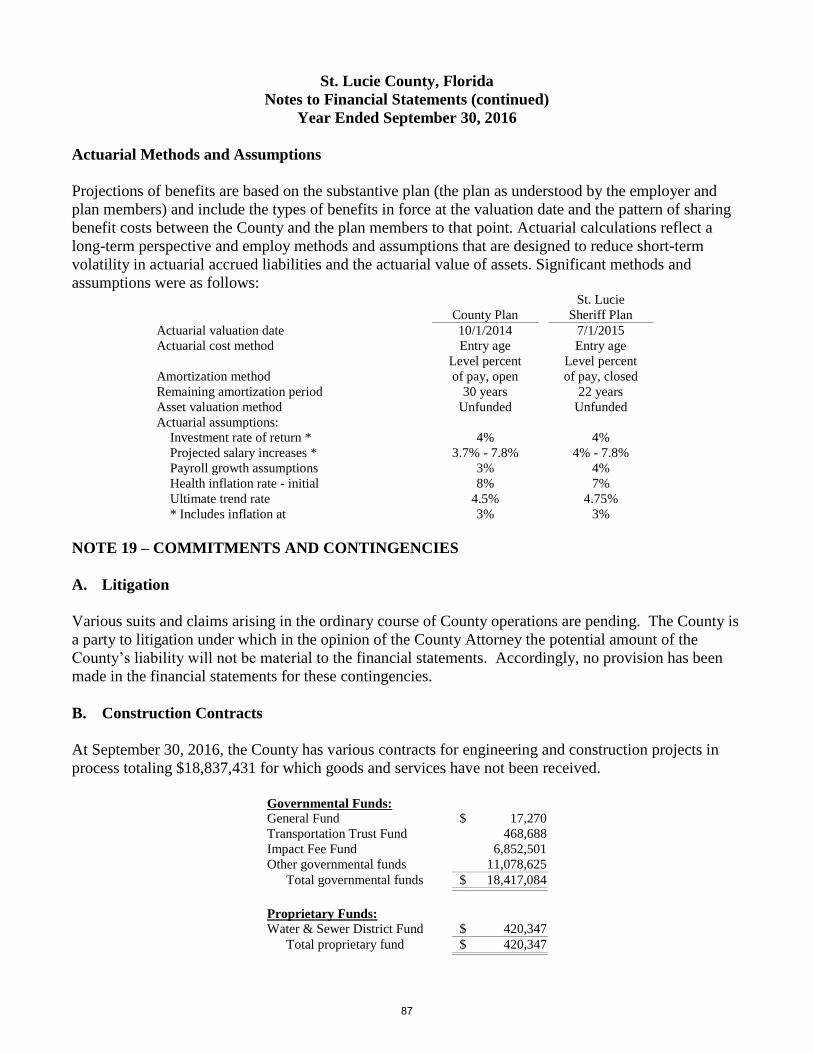
St. Lucie County, Florida
Notes to Financial Statements (continued)
Year Ended September 30, 2016
Actuarial Methods and Assumptions
Projections of benefits are based on the substantive plan (the plan as understood by the employer and
plan members) and include the types of benefits in force at the valuation date and the pattern of sharing
benefit costs between the County and the plan members to that point. Actuarial calculations reflect a
long-term perspective and employ methods and assumptions that are designed to reduce short-term
volatility in actuarial accrued liabilities and the actuarial value of assets. Significant methods and
assumptions were as follows:
County Plan
St. Lucie
Sheriff Plan
Actuarial valuation date 10/1/2014 7/1/2015
Actuarial cost method Entry age Entry age
Amortization method
Level percent
of pay, open
Level percent
of pay, closed
Remaining amortization period 30 years 22 years
Asset valuation method Unfunded Unfunded
Actuarial assumptions:
Investment rate of return * 4% 4%
Projected salary increases * 3.7% - 7.8% 4% - 7.8%
Payroll growth assumptions 3% 4%
Health inflation rate - initial 8% 7%
Ultimate trend rate 4.5% 4.75%
* Includes inflation at 3% 3%
NOTE 19 – COMMITMENTS AND CONTINGENCIES
A. Litigation
Various suits and claims arising in the ordinary course of County operations are pending. The County is
a party to litigation under which in the opinion of the County Attorney the potential amount of the
County’s liability will not be material to the financial statements. Accordingly, no provision has been
made in the financial statements for these contingencies.
B. Construction Contracts
At September 30, 2016, the County has various contracts for engineering and construction projects in
process totaling $18,837,431 for which goods and services have not been received.
Governmental Funds:
General Fund $ 17,270
Transportation Trust Fund 468,688
Impact Fee Fund 6,852,501
Other governmental funds 11,078,625
Total governmental funds $ 18,417,084
Proprietary Funds:
Water & Sewer District Fund $ 420,347
Total proprietary fund $ 420,347
87
St. Lucie County, Florida
Notes to Financial Statements (continued)
Year Ended September 30, 2016
C. Grants
Amounts received, or receivable, from grantor agencies are subject to audit and adjustment by grantor
agencies. If any expenditure is disallowed as a result of these audits the claims for reimbursement to the
grantor agency would become a liability of the County. In the opinion of management, any such
adjustment would not be significant.
NOTE 20 – SUBSEQUENT EVENTS
1. On December 22, 2016, the County issued a Taxable Capital Improvement Revenue Refunding
Note, Series 2016B in the amount of $4,832,000. The proceeds were used to pay off the County's
Tourist Development Tax Improvement and Refunding Revenue Bond, Series 2011A and Tourist
Development Tax Refunding Revenue Bond, Taxable Series 2011B. The loan has a final maturity
of November 1, 2023.
88
REQUIRED SUPPLEMENTAL INFORMATION
8989
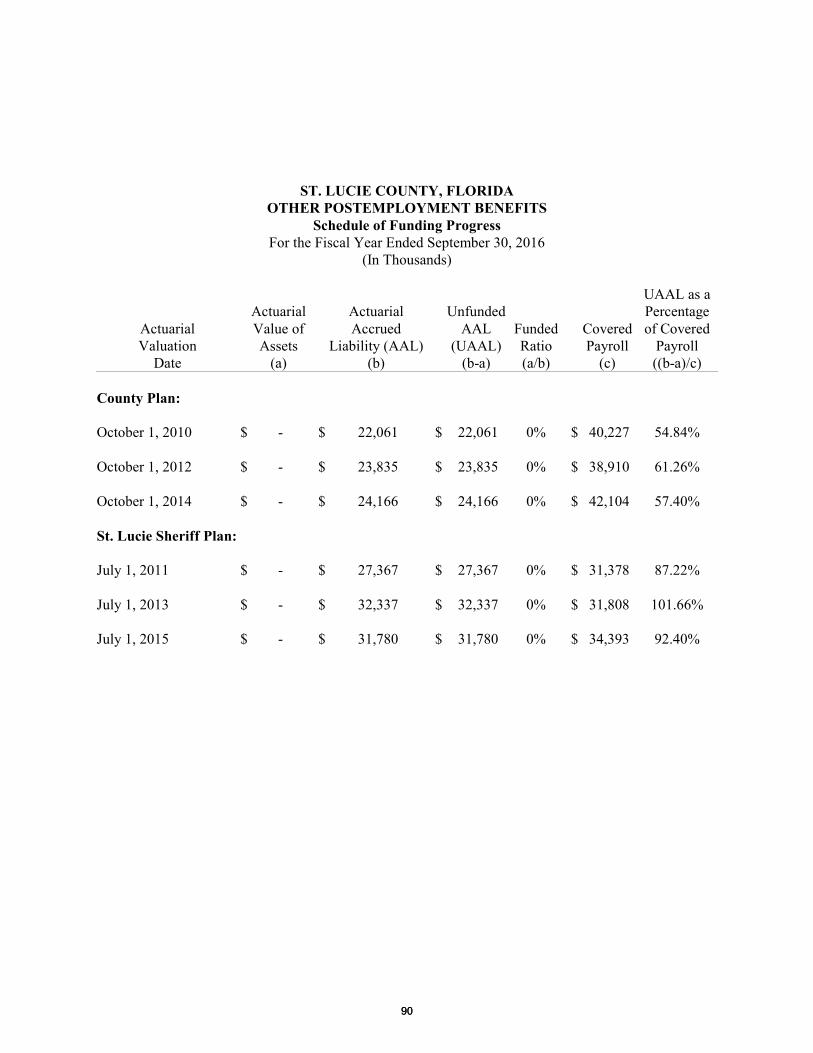
ST. LUCIE COUNTY, FLORIDAOTHER POSTEMPLOYMENT BENEFITS
Schedule of Funding ProgressFor the Fiscal Year Ended September 30, 2016
(In Thousands)
UAAL as aActuarial Actuarial Unfunded Percentage
Actuarial Value of Accrued AAL Funded Covered of CoveredValuation Assets Liability (AAL) (UAAL) Ratio Payroll Payroll
Date (a) (b) (b-a) (a/b) (c) ((b-a)/c)
County Plan:
October 1, 2010 $ - $ 22,061 $ 22,061 0% $ 40,227 54.84%
October 1, 2012 $ - $ 23,835 $ 23,835 0% $ 38,910 61.26%
October 1, 2014 $ - $ 24,166 $ 24,166 0% $ 42,104 57.40%
St. Lucie Sheriff Plan:
July 1, 2011 $ - $ 27,367 $ 27,367 0% $ 31,378 87.22%
July 1, 2013 $ - $ 32,337 $ 32,337 0% $ 31,808 101.66%
July 1, 2015 $ - $ 31,780 $ 31,780 0% $ 34,393 92.40%
9090
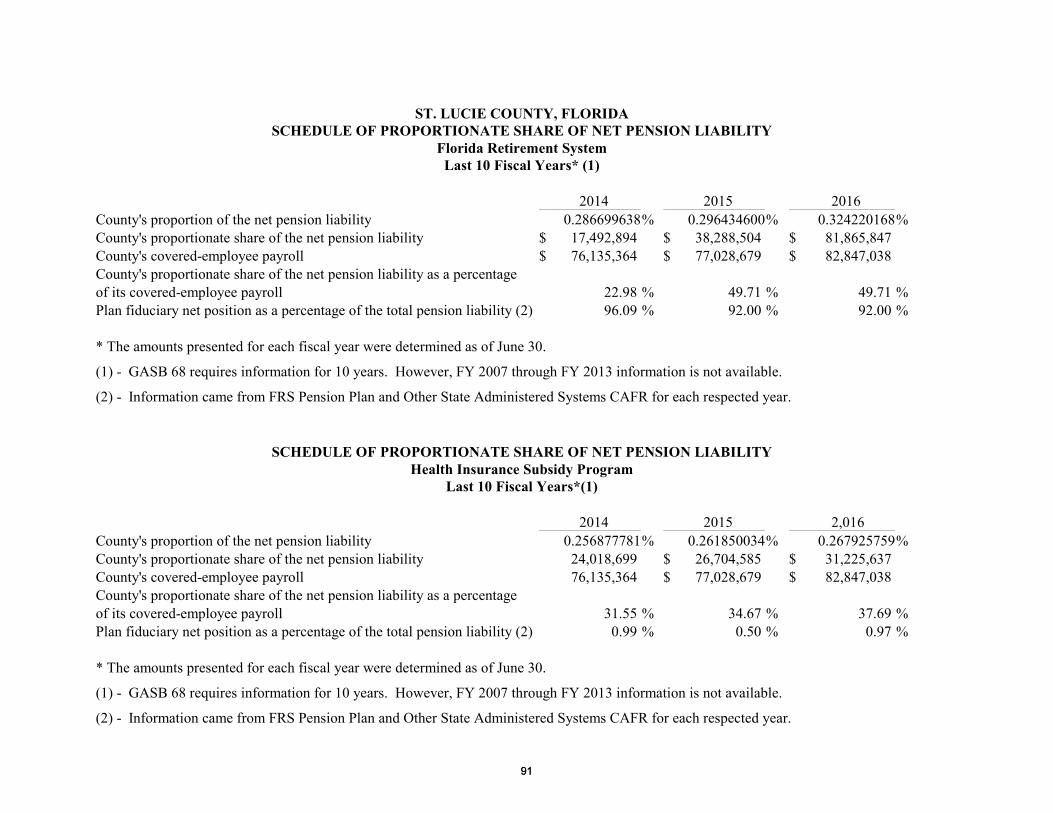
ST. LUCIE COUNTY, FLORIDASCHEDULE OF PROPORTIONATE SHARE OF NET PENSION LIABILITY
Florida Retirement SystemLast 10 Fiscal Years* (1)
2014 2015 2016County's proportion of the net pension liability 0.286699638% 0.296434600% 0.324220168%County's proportionate share of the net pension liability $ 17,492,894 $ 38,288,504 $ 81,865,847 County's covered-employee payroll $ 76,135,364 $ 77,028,679 $ 82,847,038 County's proportionate share of the net pension liability as a percentageof its covered-employee payroll 22.98 % 49.71 % 49.71 %Plan fiduciary net position as a percentage of the total pension liability (2) 96.09 % 92.00 % 92.00 %
* The amounts presented for each fiscal year were determined as of June 30.
(1) - GASB 68 requires information for 10 years. However, FY 2007 through FY 2013 information is not available.
(2) - Information came from FRS Pension Plan and Other State Administered Systems CAFR for each respected year.
SCHEDULE OF PROPORTIONATE SHARE OF NET PENSION LIABILITYHealth Insurance Subsidy Program
Last 10 Fiscal Years*(1)
2014 2015 2,016 County's proportion of the net pension liability 0.256877781% 0.261850034% 0.267925759%County's proportionate share of the net pension liability 24,018,699 $ 26,704,585 $ 31,225,637 County's covered-employee payroll 76,135,364 $ 77,028,679 $ 82,847,038 County's proportionate share of the net pension liability as a percentageof its covered-employee payroll 31.55 % 34.67 % 37.69 %Plan fiduciary net position as a percentage of the total pension liability (2) 0.99 % 0.50 % 0.97 %
* The amounts presented for each fiscal year were determined as of June 30.
(1) - GASB 68 requires information for 10 years. However, FY 2007 through FY 2013 information is not available.
(2) - Information came from FRS Pension Plan and Other State Administered Systems CAFR for each respected year.
9191
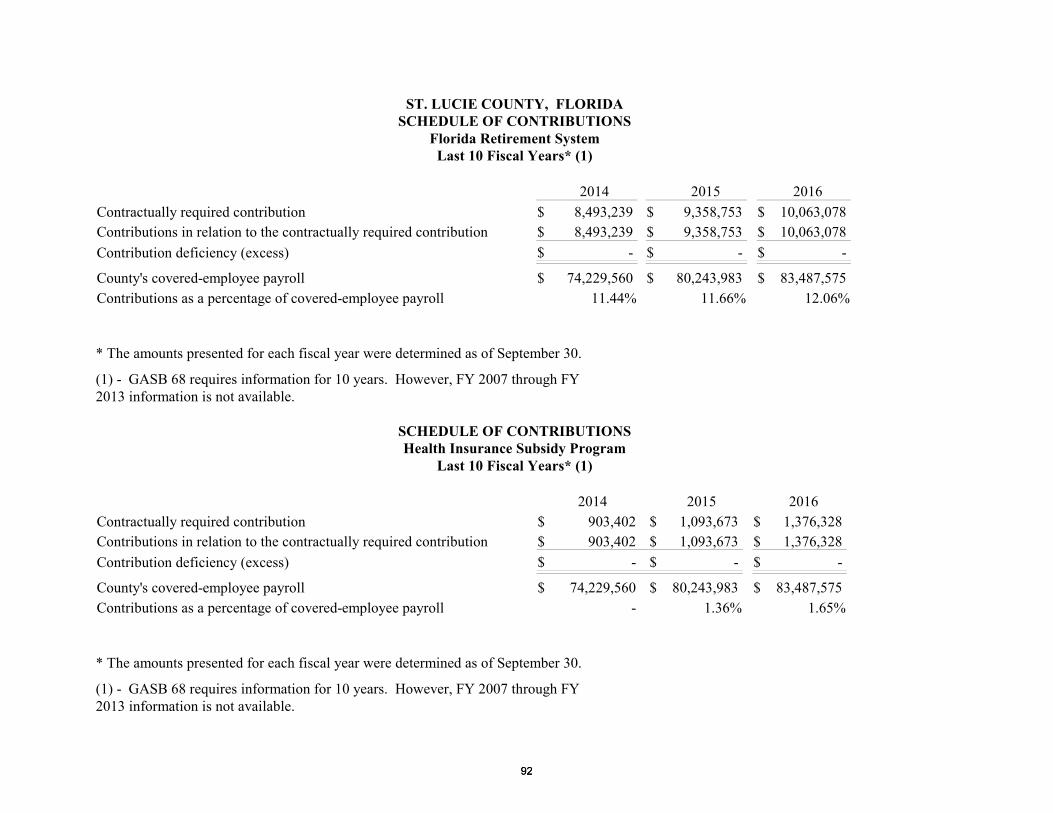
ST. LUCIE COUNTY, FLORIDASCHEDULE OF CONTRIBUTIONS
Florida Retirement SystemLast 10 Fiscal Years* (1)
2014 2015 2016Contractually required contribution $ 8,493,239 $ 9,358,753 $ 10,063,078 Contributions in relation to the contractually required contribution $ 8,493,239 $ 9,358,753 $ 10,063,078 Contribution deficiency (excess) $ - $ - $ -
County's covered-employee payroll $ 74,229,560 $ 80,243,983 $ 83,487,575 Contributions as a percentage of covered-employee payroll 11.44% 11.66% 12.06%
* The amounts presented for each fiscal year were determined as of September 30.
(1) - GASB 68 requires information for 10 years. However, FY 2007 through FY2013 information is not available.
SCHEDULE OF CONTRIBUTIONSHealth Insurance Subsidy Program
Last 10 Fiscal Years* (1)
2014 2015 2016Contractually required contribution $ 903,402 $ 1,093,673 $ 1,376,328 Contributions in relation to the contractually required contribution $ 903,402 $ 1,093,673 $ 1,376,328 Contribution deficiency (excess) $ - $ - $ -
County's covered-employee payroll $ 74,229,560 $ 80,243,983 $ 83,487,575 Contributions as a percentage of covered-employee payroll - 1.36% 1.65%
* The amounts presented for each fiscal year were determined as of September 30.
(1) - GASB 68 requires information for 10 years. However, FY 2007 through FY2013 information is not available.
9292
NONMAJOR GOVERNMENTAL FUNDS
9393
ST. LUCIE COUNTY, FLORIDANonmajor Governmental Fund Descriptions
Special Revenue Funds
Special Revenue Funds are used to account for specific revenue sources that are legallyrestricted to expenditures for specific purposes.
Unincorporated Services Fund – The fund is used to account for Ad Valorem taxes, fees andfines that are restricted to the Unincorporated District for economic development expenditures.
Law Enforcement MSTU Fund – The fund is used to account for Ad Valorem taxes that aretransferred to the Fine & Forfeiture Fund for the Unincorporated Area Road patrol expenditures.
Grants and Donations Fund – The fund is used to account for Federal, State, Local and othergrant revenue sources.
Library Special Fund – The fund is used to account for State grants and donations made to thelibrary.
Drug Abuse Fund – The fund is used to account for Drug Abuse Court fines.
Special Assessment District Fund – The fund is used to account for Ad Valorem taxes that arerestricted to Unincorporated District for economic development.
Parks MSTU Fund – The fund is used to account for Ad Valorem taxes that are restricted tocapital improvements to recreational facilities.
SLC Public Transit MSTU Fund – The fund is used to account Ad Valorem taxes that are usedfor local public transportation expenditures.
Port Fund – The fund is used to account for Special Assessments, Federal and State grants usedfor Port development.
Airport Fund – The fund is used to account for Federal and State grants used for expansion andoperations of the Airport.
Mosquito Control Fund – The fund is used to account for the operations of the Mosquito ControlDistrict, which are funded by Ad Valorem taxes.
Impact Fee Collections Fund – The fund is used to account for the administration of impact feecollections.
Plan Maintenance RAD Fund – The fund is used to account other contributions and State grantsfor the radiological planning and exercises.
9494
Tourism Development 1st, 2nd, 3rd & 5th Cent Fund – The fund is used to account for TourismDevelopment taxes which are used for Sports Complex parks and to pay for capital facilities thatpromote tourism at the St. Lucie County Fairgrounds and the area north of Midway Road.
Court Facility Fund – The fund is used to account for Court Fees restricted to Judicialmaintenance & capital improvements.
SLC Housing Finance Authority Fund – The fund is used to account for residual funds from loanprograms.
Environmental Land Acquisitions Fund – The fund is used to account for the purchase ofenvironmentally sensitive land.
Court Administrator Fund – The fund is used to account for Court Administration, Mediationthrough fines and forfeitures, other Circuit Counties Share and Grant funding.
Erosion Control Fund – The fund is used to account for Ad Valorem taxes restricted to erosioncontrol operations, maintenance and construction.
Housing Assistance SHIP Fund – The fund is used to account for Grant funding for HousingAssistance Programs.
Boating Improvement Projects Fund – The fund is used to account for Vessel fees used forboating improvements.
Bluefield Ranch Improvements Fund – The fund is used to account for private contributions andCampsite User fees for property management and restoration.
Florida Housing Grant Fund – The fund is used to account for Federal, State and other grantfunding that provide housing related assistance for eligible County residents.
Sports Complex Fund – The fund is used to account for operating revenues and the 2-centtourism tax revenues to pay for the operation and maintenance of the facility.
SLC Sustainability District Fund – The fund is used to account for bond proceeds and specialassessment revenues for sustainability and renewable energy improvement programs.
Law Enforcement Fund – The fund is used to account for the proceeds from the sale ofconfiscated property through the Sheriff’s office.
SLC Art in Public Places Fund – The fund is used to account for art work per local ordinancethrough various capital projects.
SLC Economic Development Fund – The fund is used to account for local business taxes anddelinquent taxes.
9595
Clerk of the Circuit Court Fund – The fund is used to account for Clerk’s Court ModernizationTrust Fund.
Sheriff Fund – The fund is used to account for grant funds and other revenue received forspecific purposes.
Supervisor of Elections Fund – The fund is used to account for the receipt of grant funds.
Debt Service Funds
Debt Service Funds are used to account for the accumulation of pledged funds that are legallyrestricted to pay debts.
Impact Fees I & S Fund – The fund is used to account for the accumulation of SpecialAssessments and Impact Fees pledged to pay the principal, interest, and fiscal charges on theRock Road Jail security system.
Sales Tax Revenue Bonds I&S – The Sales Tax Revenue Bonds I&S Fund accounts forthe accumulation of sales tax revenues pledged to pay the principal, interest, and otherfiscal charges on the Sales Tax Refunding Revenue Bonds.
County Capital I & S Fund – The fund is used to account for the accumulation of interfundtransfers pledged to pay the principal, interest, and fiscal charges on the Capital ImprovementRevenue note.
Transportation I & S Fund – The fund is used to account for the accumulation of interfundtransfers pledged to pay the principal, interest, and fiscal charges on the Transportation Revenuenote.
Capital Improvement Revenue Refunding 2014 Fund – The fund is used to account for the StateRevenue Sharing revenue and Intergovernmental Radio Communication surcharges pledged topay the principal, interest and fiscal charges on the Capital Improvement note.
Capital Improvement Revenue Bonds Series 2016 Jail Fund – The fund is used to account for theaccumulation of interfund transfers pledged to pay the principal, interest, and fiscal charges onthe Capital Improvement note.
Capital Improvement Revenue Bonds 2015 Fund – The fund is used to account for theaccumulation of Tax Collector debt reimbursement revenue pledged to pay the principal, interest,and fiscal charges on the Capital Improvement Revenue bond.
Lease Purchase FPL 2015 Fund – The fund is used to account for the accumulation of interfundtransfers pledged to pay the principal, interest, and fiscal charges on the purchasing of certainenergy equipment.
9696
Lease Purchase Motorola Fund – The fund is used to account for the accumulation of interfundtransfers pledged to pay the principal, interest, and fiscal charges on the purchasing of acommunication system.
Port I & S Fund – The fund is used to account for the accumulation of Ad Valorem taxes pledgedto pay the principal, interest, and fiscal charges on the purchasing of land in the Port of FortPierce Bond.
Capital Projects I & S Fund – The fund is used to account for the accumulation of InterfundTransfers pledged to pay the principal, interest, and fiscal charges on the line of credit for theMSBU’s.
Sports Complex Fund – The fund is used to account for the accumulation of Sales, Use and Fueltaxes pledged to pay the principal, interest, and fiscal charges on the Improvement of the ThomasJ. White Stadium bond.
Capital Projects FundsCapital projects funds are used to account for the acquisition and construction of majorcapital projects other than those financed by proprietary funds.
County Capital Fund – The fund is used to account for the transportation and park capitalprojects, which are funded by gas tax and franchise fees.
County Capital State Revenue Share Bond Fund – The fund is used to account for state revenuesharing monies used for capital improvements.
County Capital Transportation Bond Fund – The fund is used to account for thetransportation capital projects funded by bond proceeds pledged by gas tax revenues.
Jail Security Upgrade Fund – The fund is used to account for the upgrade of securitysystem at the Rock Road Correction Center projects funded by proceeds from theissuance of debt.
Capital Improvement Revenue Bonds 2015 Fund – The fund is used to account for bondproceeds used for the construction of the Tax Collector Building.
Energy Efficiency FPL 2015 Fund – The fund is used to account for the FPL upgrade ofenergy efficiency funded by capital lease proceeds.
Sports Complex Improvements Fund – The fund is used to account for cash balances from bondproceeds used for sports complex projects.
Environmental Land Capital Fund – The fund is used to account for cash balances from bondproceeds used for land acquisitions.
9797

MSBU Internal Financed Projects Fund – The fund is used to account for the assessmentproceeds from property owners and to pay for capital project related expenditures.
MSBU External Financed Projects Fund – The fund is used to account for the assessmentproceeds from property owners and debt proceeds to pay for capital projects and project relatedexpenditures.
9898

THIS PAGE INTENTIONALLY LEFT BLANK
9999
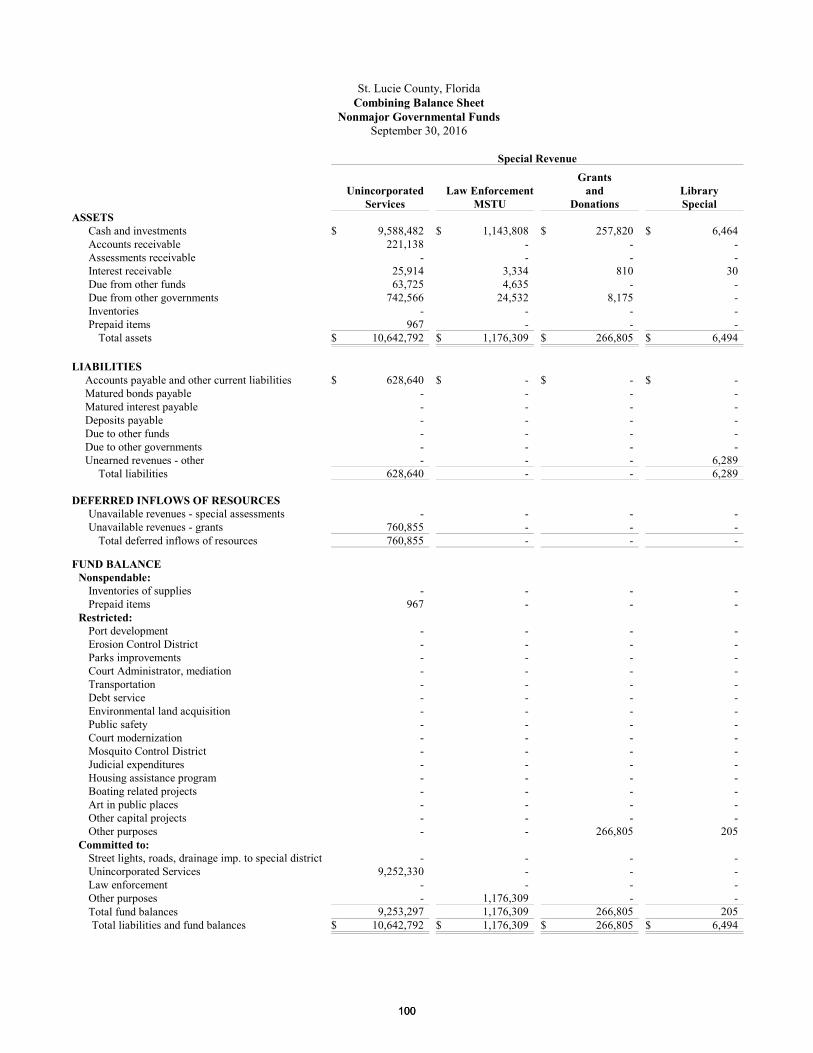
St. Lucie County, FloridaCombining Balance Sheet
Nonmajor Governmental FundsSeptember 30, 2016
Special Revenue
UnincorporatedServices
Law EnforcementMSTU
Grantsand
DonationsLibrarySpecial
ASSETSCash and investments $ 9,588,482 $ 1,143,808 $ 257,820 $ 6,464Accounts receivable 221,138 - - -Assessments receivable - - - -Interest receivable 25,914 3,334 810 30Due from other funds 63,725 4,635 - -Due from other governments 742,566 24,532 8,175 -Inventories - - - -Prepaid items 967 - - -
Total assets $ 10,642,792 $ 1,176,309 $ 266,805 $ 6,494
LIABILITIESAccounts payable and other current liabilities $ 628,640 $ - $ - $ -Matured bonds payable - - - -Matured interest payable - - - -Deposits payable - - - -Due to other funds - - - -Due to other governments - - - -Unearned revenues - other - - - 6,289
Total liabilities 628,640 - - 6,289
DEFERRED INFLOWS OF RESOURCESUnavailable revenues - special assessments - - - -Unavailable revenues - grants 760,855 - - -
Total deferred inflows of resources 760,855 - - -
FUND BALANCENonspendable:
Inventories of supplies - - - -Prepaid items 967 - - -
Restricted:Port development - - - -Erosion Control District - - - -Parks improvements - - - -Court Administrator, mediation - - - -Transportation - - - -Debt service - - - -Environmental land acquisition - - - -Public safety - - - -Court modernization - - - -Mosquito Control District - - - -Judicial expenditures - - - -Housing assistance program - - - -Boating related projects - - - -Art in public places - - - -Other capital projects - - - -Other purposes - - 266,805 205
Committed to:Street lights, roads, drainage imp. to special district - - - -Unincorporated Services 9,252,330 - - -Law enforcement - - - -Other purposes - 1,176,309 - -Total fund balances 9,253,297 1,176,309 266,805 205Total liabilities and fund balances $ 10,642,792 $ 1,176,309 $ 266,805 $ 6,494
100100
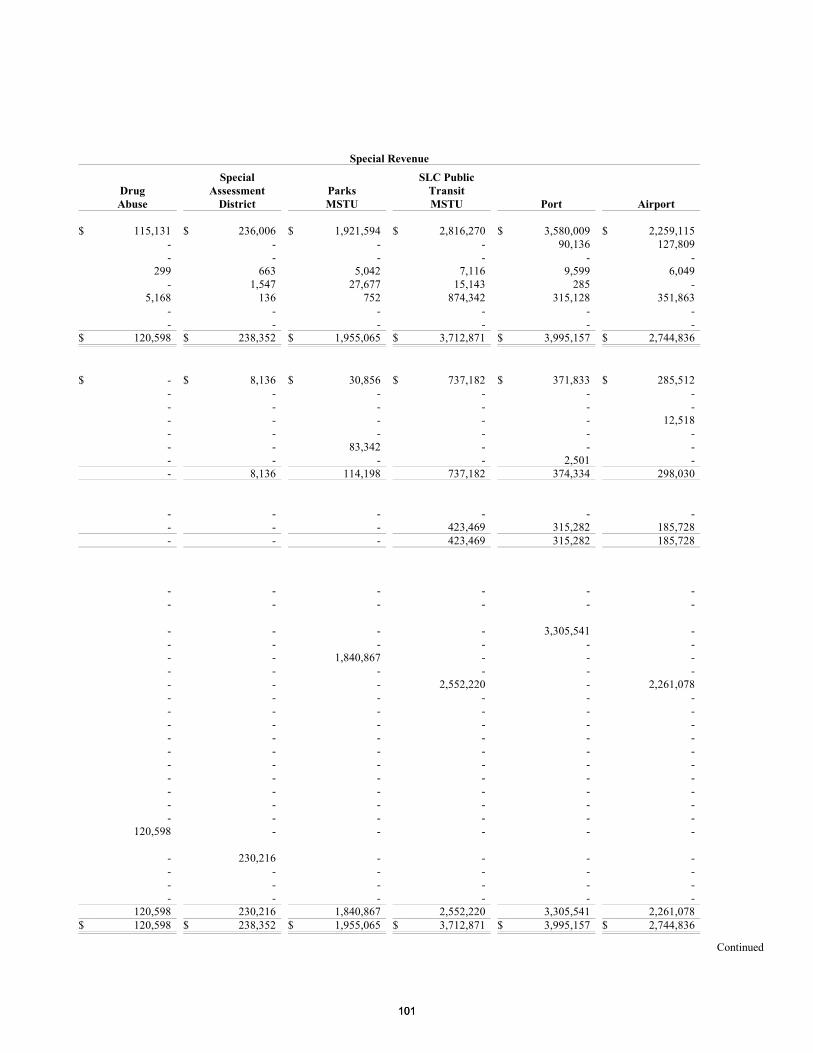
Special Revenue
DrugAbuse
SpecialAssessment
DistrictParksMSTU
SLC PublicTransitMSTU Port Airport
$ 115,131 $ 236,006 $ 1,921,594 $ 2,816,270 $ 3,580,009 $ 2,259,115- - - - 90,136 127,809- - - - - -
299 663 5,042 7,116 9,599 6,049- 1,547 27,677 15,143 285 -
5,168 136 752 874,342 315,128 351,863- - - - - -- - - - - -
$ 120,598 $ 238,352 $ 1,955,065 $ 3,712,871 $ 3,995,157 $ 2,744,836
$ - $ 8,136 $ 30,856 $ 737,182 $ 371,833 $ 285,512- - - - - -- - - - - -- - - - - 12,518- - - - - -- - 83,342 - - -- - - - 2,501 -- 8,136 114,198 737,182 374,334 298,030
- - - - - -- - - 423,469 315,282 185,728- - - 423,469 315,282 185,728
- - - - - -- - - - - -
- - - - 3,305,541 -- - - - - -- - 1,840,867 - - -- - - - - -- - - 2,552,220 - 2,261,078- - - - - -- - - - - -- - - - - -- - - - - -- - - - - -- - - - - -- - - - - -- - - - - -- - - - - -- - - - - -
120,598 - - - - -
- 230,216 - - - -- - - - - -- - - - - -- - - - - -
120,598 230,216 1,840,867 2,552,220 3,305,541 2,261,078$ 120,598 $ 238,352 $ 1,955,065 $ 3,712,871 $ 3,995,157 $ 2,744,836
Continued
101101

St. Lucie County, FloridaCombining Balance Sheet
Nonmajor Governmental FundsSeptember 30, 2016
Special Revenue
MosquitoControl
ImpactFee
Collections
PlanMaintenance
RAD
TourismDevelopment1st, 2nd, 3rd& 5th Cent
ASSETSCash and investments $ 6,428,997 $ 118,511 $ 52,469 $ 1,941,395Accounts receivable 51 - - 1,000Assessments receivable - - - -Interest receivable 17,433 360 274 5,104Due from other funds 28,523 - - 21,403Due from other governments 558,346 - - 149,536Inventories 159,576 - - -Prepaid items - - - -
Total assets $ 7,192,926 $ 118,871 $ 52,743 $ 2,118,438
LIABILITIESAccounts payable and other current liabilities $ 259,183 $ 6,757 $ 11,943 $ 24,730Matured bonds payable - - - -Matured interest payable - - - -Deposits payable - - - -Due to other funds - - - -Due to other governments - - - -Unearned revenues - other - - 11,064 -
Total liabilities 259,183 6,757 23,007 24,730
DEFERRED INFLOWS OF RESOURCESUnavailable revenues - special assessments - - - -Unavailable revenues - grants 522,876 - - -
Total deferred inflows of resources 522,876 - - -
FUND BALANCENonspendable:
Inventories of supplies 159,576 - - -Prepaid items - - - -
Restricted:Port development - - - -Erosion Control District - - - -Parks improvements - - - -Court Administrator, mediation - - - -Transportation - - - -Debt service - - - -Environmental land acquisition - - - -Public safety - - - -Court modernization - - - -Mosquito Control District 6,251,291 - - -Judicial expenditures - - - -Housing assistance program - - - -Boating related projects - - - -Art in public places - - - -Other capital projects - - - -Other purposes - - 29,736 2,093,708
Committed to:Street lights, roads, drainage imp. to special district - - - -Unincorporated Services - - - -Law enforcement - - - -Other purposes - 112,114 - -Total fund balances 6,410,867 112,114 29,736 2,093,708Total liabilities and fund balances $ 7,192,926 $ 118,871 $ 52,743 $ 2,118,438
102102
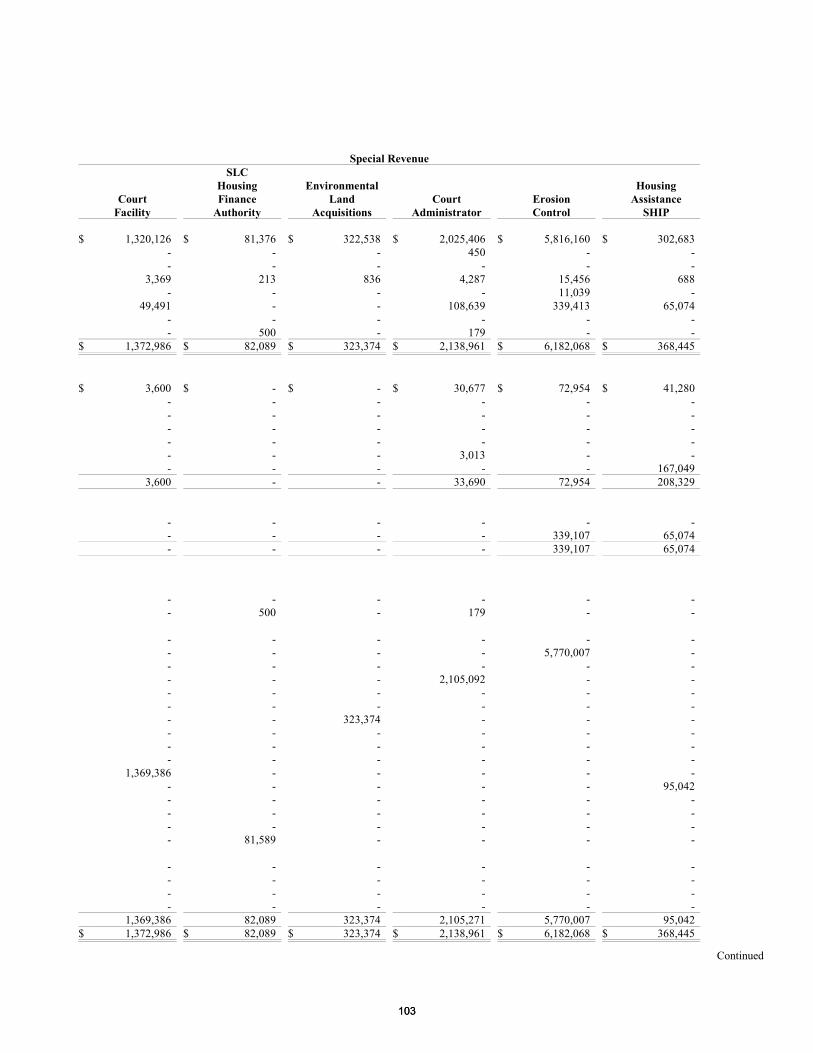
Special Revenue
CourtFacility
SLCHousingFinance
Authority
EnvironmentalLand
AcquisitionsCourt
AdministratorErosionControl
HousingAssistance
SHIP
$ 1,320,126 $ 81,376 $ 322,538 $ 2,025,406 $ 5,816,160 $ 302,683- - - 450 - -- - - - - -
3,369 213 836 4,287 15,456 688- - - - 11,039 -
49,491 - - 108,639 339,413 65,074- - - - - -- 500 - 179 - -
$ 1,372,986 $ 82,089 $ 323,374 $ 2,138,961 $ 6,182,068 $ 368,445
$ 3,600 $ - $ - $ 30,677 $ 72,954 $ 41,280- - - - - -- - - - - -- - - - - -- - - - - -- - - 3,013 - -- - - - - 167,049
3,600 - - 33,690 72,954 208,329
- - - - - -- - - - 339,107 65,074- - - - 339,107 65,074
- - - - - -- 500 - 179 - -
- - - - - -- - - - 5,770,007 -- - - - - -- - - 2,105,092 - -- - - - - -- - - - - -- - 323,374 - - -- - - - - -- - - - - -- - - - - -
1,369,386 - - - - -- - - - - 95,042- - - - - -- - - - - -- - - - - -- 81,589 - - - -
- - - - - -- - - - - -- - - - - -- - - - - -
1,369,386 82,089 323,374 2,105,271 5,770,007 95,042$ 1,372,986 $ 82,089 $ 323,374 $ 2,138,961 $ 6,182,068 $ 368,445
Continued
103103
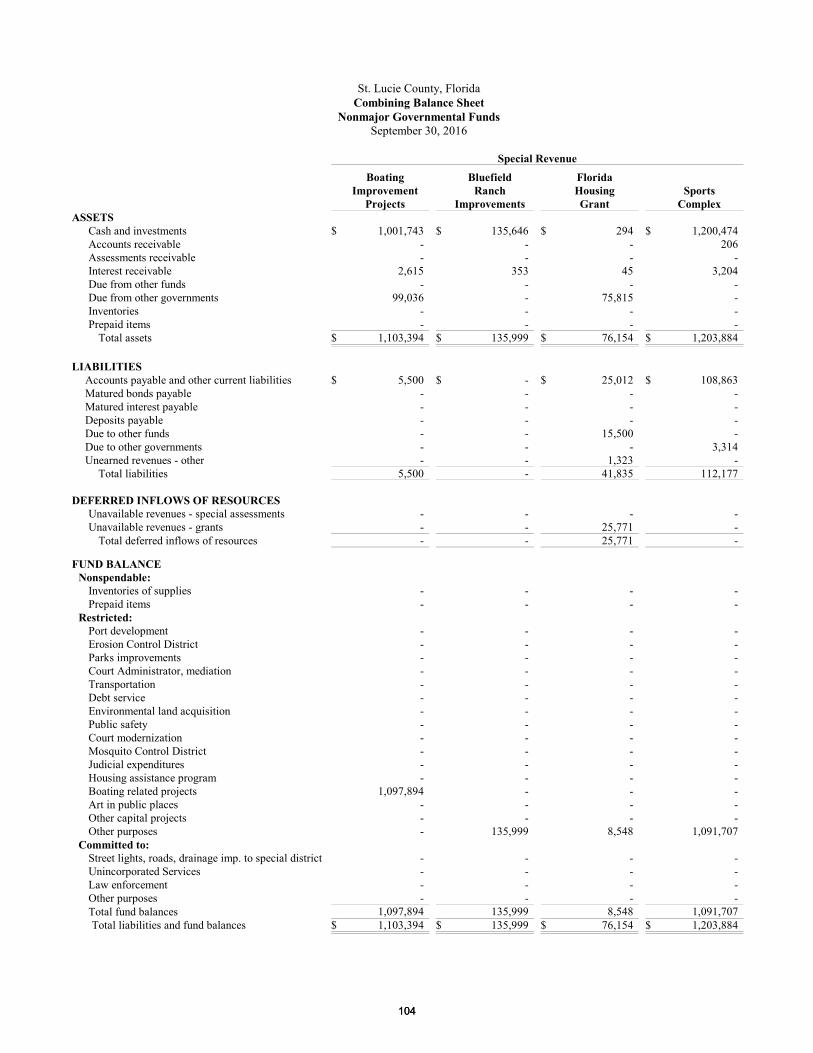
St. Lucie County, FloridaCombining Balance Sheet
Nonmajor Governmental FundsSeptember 30, 2016
Special Revenue
BoatingImprovement
Projects
BluefieldRanch
Improvements
FloridaHousingGrant
SportsComplex
ASSETSCash and investments $ 1,001,743 $ 135,646 $ 294 $ 1,200,474Accounts receivable - - - 206Assessments receivable - - - -Interest receivable 2,615 353 45 3,204Due from other funds - - - -Due from other governments 99,036 - 75,815 -Inventories - - - -Prepaid items - - - -
Total assets $ 1,103,394 $ 135,999 $ 76,154 $ 1,203,884
LIABILITIESAccounts payable and other current liabilities $ 5,500 $ - $ 25,012 $ 108,863Matured bonds payable - - - -Matured interest payable - - - -Deposits payable - - - -Due to other funds - - 15,500 -Due to other governments - - - 3,314Unearned revenues - other - - 1,323 -
Total liabilities 5,500 - 41,835 112,177
DEFERRED INFLOWS OF RESOURCESUnavailable revenues - special assessments - - - -Unavailable revenues - grants - - 25,771 -
Total deferred inflows of resources - - 25,771 -
FUND BALANCENonspendable:
Inventories of supplies - - - -Prepaid items - - - -
Restricted:Port development - - - -Erosion Control District - - - -Parks improvements - - - -Court Administrator, mediation - - - -Transportation - - - -Debt service - - - -Environmental land acquisition - - - -Public safety - - - -Court modernization - - - -Mosquito Control District - - - -Judicial expenditures - - - -Housing assistance program - - - -Boating related projects 1,097,894 - - -Art in public places - - - -Other capital projects - - - -Other purposes - 135,999 8,548 1,091,707
Committed to:Street lights, roads, drainage imp. to special district - - - -Unincorporated Services - - - -Law enforcement - - - -Other purposes - - - -Total fund balances 1,097,894 135,999 8,548 1,091,707Total liabilities and fund balances $ 1,103,394 $ 135,999 $ 76,154 $ 1,203,884
104104
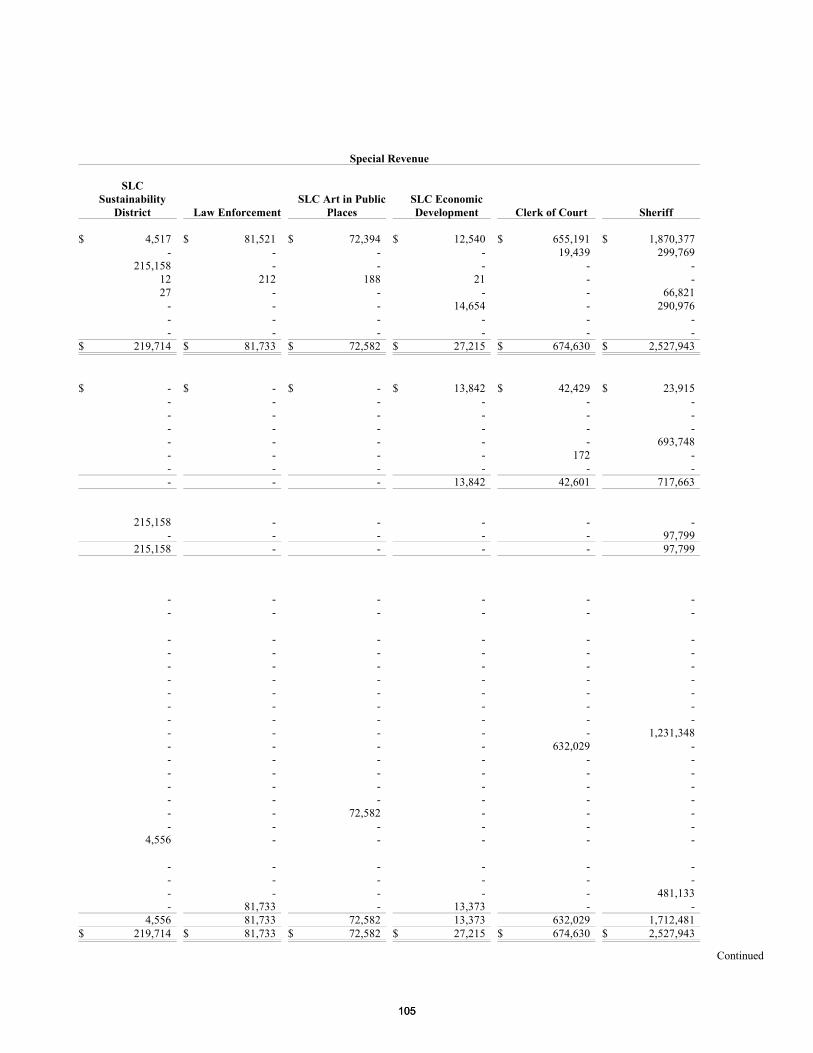
Special Revenue
SLCSustainability
District Law EnforcementSLC Art in Public
PlacesSLC EconomicDevelopment Clerk of Court Sheriff
$ 4,517 $ 81,521 $ 72,394 $ 12,540 $ 655,191 $ 1,870,377- - - - 19,439 299,769
215,158 - - - - -12 212 188 21 - -27 - - - - 66,821
- - - 14,654 - 290,976- - - - - -- - - - - -
$ 219,714 $ 81,733 $ 72,582 $ 27,215 $ 674,630 $ 2,527,943
$ - $ - $ - $ 13,842 $ 42,429 $ 23,915- - - - - -- - - - - -- - - - - -- - - - - 693,748- - - - 172 -- - - - - -- - - 13,842 42,601 717,663
215,158 - - - - -- - - - - 97,799
215,158 - - - - 97,799
- - - - - -- - - - - -
- - - - - -- - - - - -- - - - - -- - - - - -- - - - - -- - - - - -- - - - - -- - - - - 1,231,348- - - - 632,029 -- - - - - -- - - - - -- - - - - -- - - - - -- - 72,582 - - -- - - - - -
4,556 - - - - -
- - - - - -- - - - - -- - - - - 481,133- 81,733 - 13,373 - -
4,556 81,733 72,582 13,373 632,029 1,712,481$ 219,714 $ 81,733 $ 72,582 $ 27,215 $ 674,630 $ 2,527,943
Continued
105105
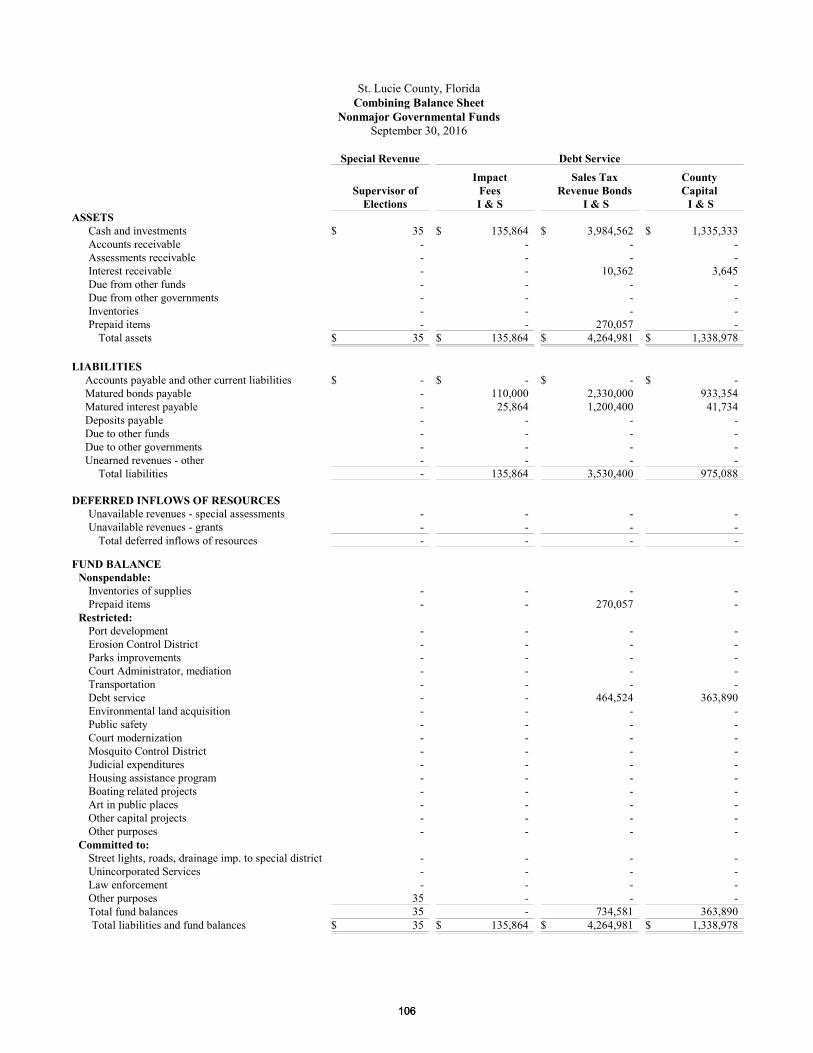
St. Lucie County, FloridaCombining Balance Sheet
Nonmajor Governmental FundsSeptember 30, 2016
Special Revenue Debt Service
Supervisor ofElections
ImpactFeesI & S
Sales TaxRevenue Bonds
I & S
CountyCapital I & S
ASSETSCash and investments $ 35 $ 135,864 $ 3,984,562 $ 1,335,333Accounts receivable - - - -Assessments receivable - - - -Interest receivable - - 10,362 3,645Due from other funds - - - -Due from other governments - - - -Inventories - - - -Prepaid items - - 270,057 -
Total assets $ 35 $ 135,864 $ 4,264,981 $ 1,338,978
LIABILITIESAccounts payable and other current liabilities $ - $ - $ - $ -Matured bonds payable - 110,000 2,330,000 933,354Matured interest payable - 25,864 1,200,400 41,734Deposits payable - - - -Due to other funds - - - -Due to other governments - - - -Unearned revenues - other - - - -
Total liabilities - 135,864 3,530,400 975,088
DEFERRED INFLOWS OF RESOURCESUnavailable revenues - special assessments - - - -Unavailable revenues - grants - - - -
Total deferred inflows of resources - - - -
FUND BALANCENonspendable:
Inventories of supplies - - - -Prepaid items - - 270,057 -
Restricted:Port development - - - -Erosion Control District - - - -Parks improvements - - - -Court Administrator, mediation - - - -Transportation - - - -Debt service - - 464,524 363,890Environmental land acquisition - - - -Public safety - - - -Court modernization - - - -Mosquito Control District - - - -Judicial expenditures - - - -Housing assistance program - - - -Boating related projects - - - -Art in public places - - - -Other capital projects - - - -Other purposes - - - -
Committed to:Street lights, roads, drainage imp. to special district - - - -Unincorporated Services - - - -Law enforcement - - - -Other purposes 35 - - -Total fund balances 35 - 734,581 363,890Total liabilities and fund balances $ 35 $ 135,864 $ 4,264,981 $ 1,338,978
106106
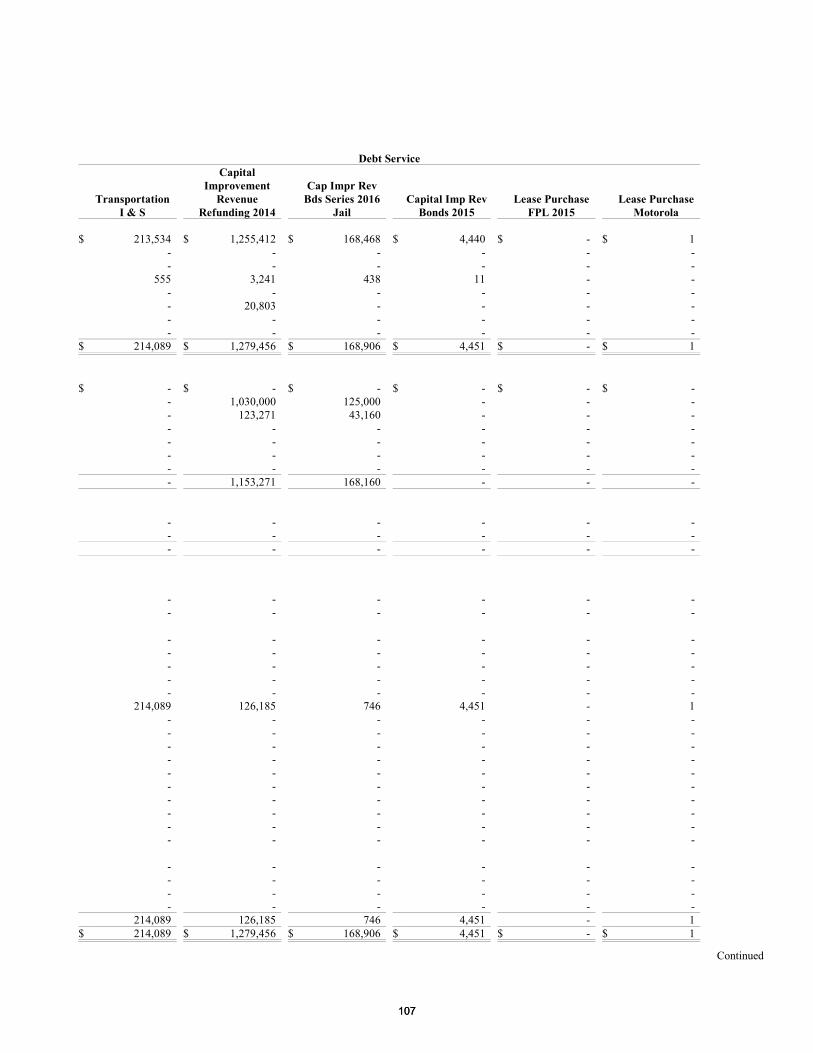
Debt Service
TransportationI & S
CapitalImprovement
RevenueRefunding 2014
Cap Impr RevBds Series 2016
JailCapital Imp Rev
Bonds 2015Lease Purchase
FPL 2015Lease Purchase
Motorola
$ 213,534 $ 1,255,412 $ 168,468 $ 4,440 $ - $ 1- - - - - -- - - - - -
555 3,241 438 11 - -- - - - - -- 20,803 - - - -- - - - - -- - - - - -
$ 214,089 $ 1,279,456 $ 168,906 $ 4,451 $ - $ 1
$ - $ - $ - $ - $ - $ -- 1,030,000 125,000 - - -- 123,271 43,160 - - -- - - - - -- - - - - -- - - - - -- - - - - -- 1,153,271 168,160 - - -
- - - - - -- - - - - -- - - - - -
- - - - - -- - - - - -
- - - - - -- - - - - -- - - - - -- - - - - -- - - - - -
214,089 126,185 746 4,451 - 1- - - - - -- - - - - -- - - - - -- - - - - -- - - - - -- - - - - -- - - - - -- - - - - -- - - - - -- - - - - -
- - - - - -- - - - - -- - - - - -- - - - - -
214,089 126,185 746 4,451 - 1$ 214,089 $ 1,279,456 $ 168,906 $ 4,451 $ - $ 1
Continued
107107
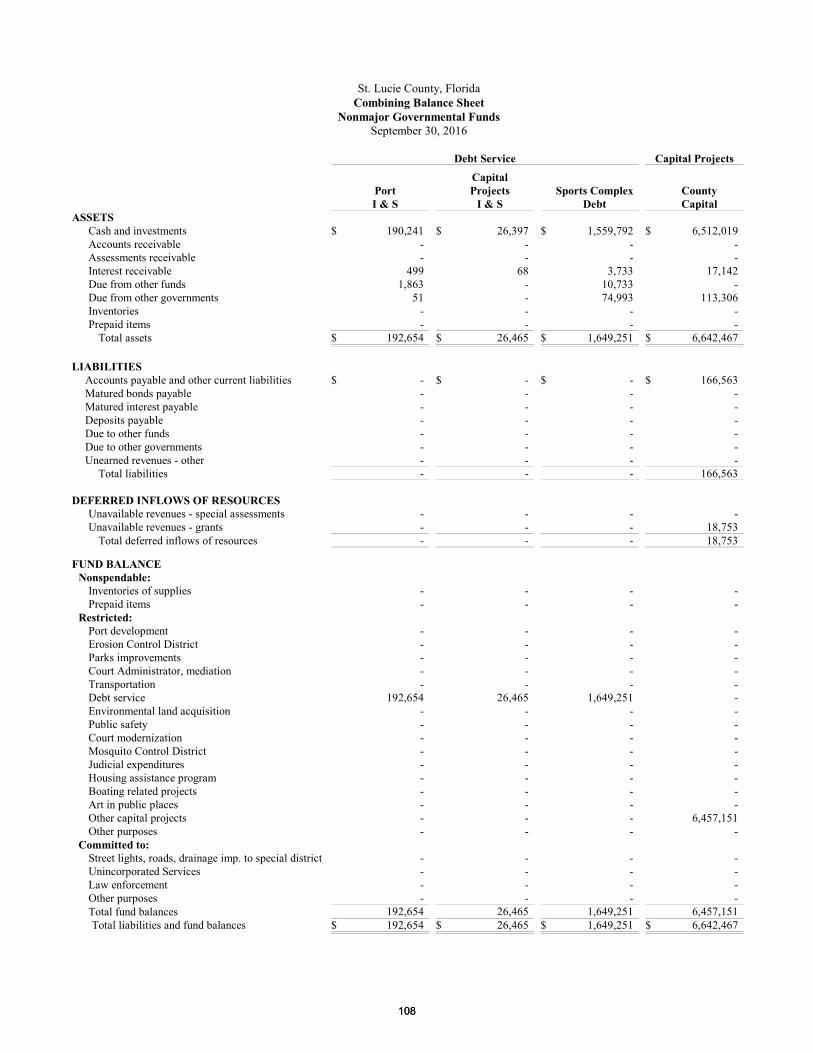
St. Lucie County, FloridaCombining Balance Sheet
Nonmajor Governmental FundsSeptember 30, 2016
Debt Service Capital Projects
PortI & S
CapitalProjects
I & SSports Complex
DebtCountyCapital
ASSETSCash and investments $ 190,241 $ 26,397 $ 1,559,792 $ 6,512,019Accounts receivable - - - -Assessments receivable - - - -Interest receivable 499 68 3,733 17,142Due from other funds 1,863 - 10,733 -Due from other governments 51 - 74,993 113,306Inventories - - - -Prepaid items - - - -
Total assets $ 192,654 $ 26,465 $ 1,649,251 $ 6,642,467
LIABILITIESAccounts payable and other current liabilities $ - $ - $ - $ 166,563Matured bonds payable - - - -Matured interest payable - - - -Deposits payable - - - -Due to other funds - - - -Due to other governments - - - -Unearned revenues - other - - - -
Total liabilities - - - 166,563
DEFERRED INFLOWS OF RESOURCESUnavailable revenues - special assessments - - - -Unavailable revenues - grants - - - 18,753
Total deferred inflows of resources - - - 18,753
FUND BALANCENonspendable:
Inventories of supplies - - - -Prepaid items - - - -
Restricted:Port development - - - -Erosion Control District - - - -Parks improvements - - - -Court Administrator, mediation - - - -Transportation - - - -Debt service 192,654 26,465 1,649,251 -Environmental land acquisition - - - -Public safety - - - -Court modernization - - - -Mosquito Control District - - - -Judicial expenditures - - - -Housing assistance program - - - -Boating related projects - - - -Art in public places - - - -Other capital projects - - - 6,457,151Other purposes - - - -
Committed to:Street lights, roads, drainage imp. to special district - - - -Unincorporated Services - - - -Law enforcement - - - -Other purposes - - - -Total fund balances 192,654 26,465 1,649,251 6,457,151Total liabilities and fund balances $ 192,654 $ 26,465 $ 1,649,251 $ 6,642,467
108108
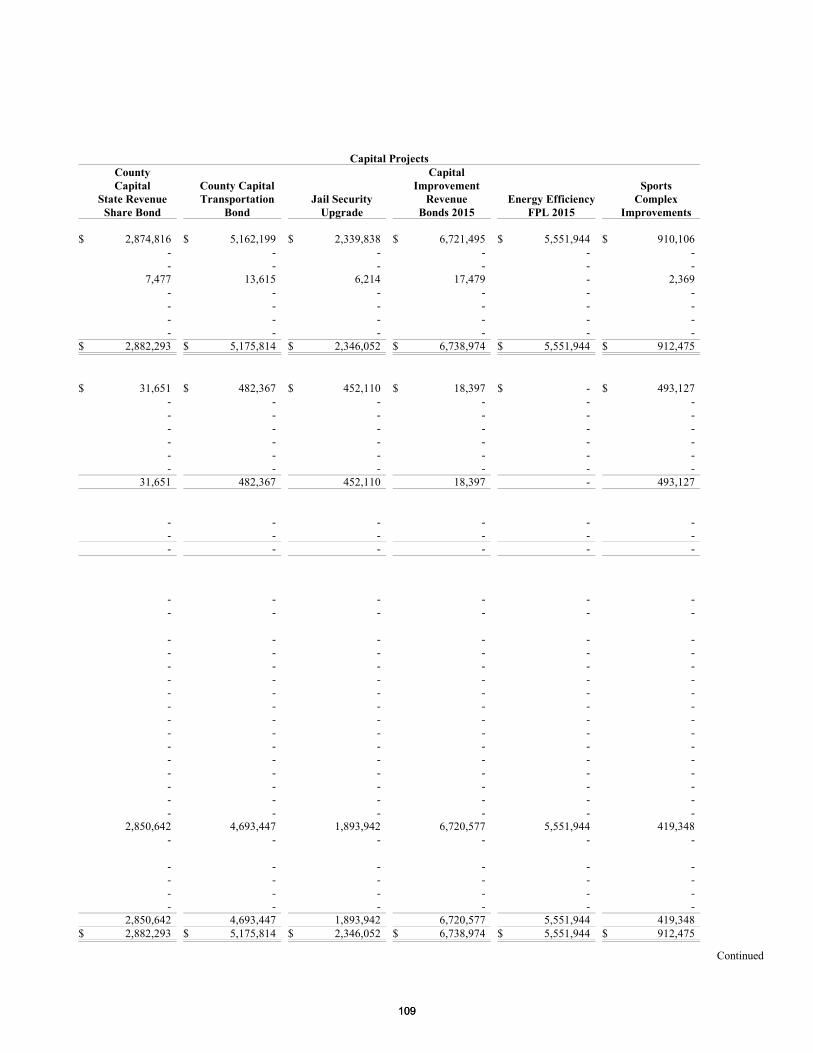
Capital ProjectsCountyCapital
State RevenueShare Bond
County CapitalTransportation
BondJail Security
Upgrade
CapitalImprovement
RevenueBonds 2015
Energy EfficiencyFPL 2015
SportsComplex
Improvements
$ 2,874,816 $ 5,162,199 $ 2,339,838 $ 6,721,495 $ 5,551,944 $ 910,106- - - - - -- - - - - -
7,477 13,615 6,214 17,479 - 2,369- - - - - -- - - - - -- - - - - -- - - - - -
$ 2,882,293 $ 5,175,814 $ 2,346,052 $ 6,738,974 $ 5,551,944 $ 912,475
$ 31,651 $ 482,367 $ 452,110 $ 18,397 $ - $ 493,127- - - - - -- - - - - -- - - - - -- - - - - -- - - - - -- - - - - -
31,651 482,367 452,110 18,397 - 493,127
- - - - - -- - - - - -- - - - - -
- - - - - -- - - - - -
- - - - - -- - - - - -- - - - - -- - - - - -- - - - - -- - - - - -- - - - - -- - - - - -- - - - - -- - - - - -- - - - - -- - - - - -- - - - - -- - - - - -
2,850,642 4,693,447 1,893,942 6,720,577 5,551,944 419,348- - - - - -
- - - - - -- - - - - -- - - - - -- - - - - -
2,850,642 4,693,447 1,893,942 6,720,577 5,551,944 419,348$ 2,882,293 $ 5,175,814 $ 2,346,052 $ 6,738,974 $ 5,551,944 $ 912,475
Continued
109109
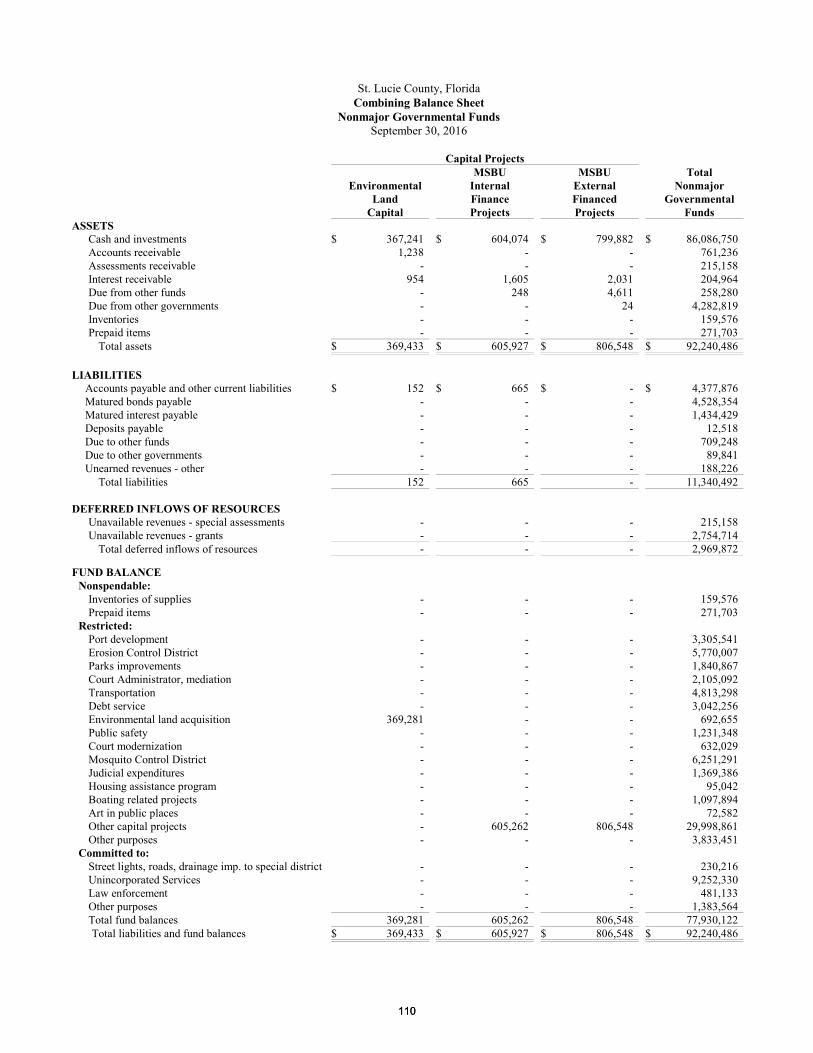
St. Lucie County, FloridaCombining Balance Sheet
Nonmajor Governmental FundsSeptember 30, 2016
Capital Projects
EnvironmentalLand
Capital
MSBUInternalFinanceProjects
MSBUExternalFinancedProjects
TotalNonmajor
GovernmentalFunds
ASSETSCash and investments $ 367,241 $ 604,074 $ 799,882 $ 86,086,750Accounts receivable 1,238 - - 761,236Assessments receivable - - - 215,158Interest receivable 954 1,605 2,031 204,964Due from other funds - 248 4,611 258,280Due from other governments - - 24 4,282,819Inventories - - - 159,576Prepaid items - - - 271,703
Total assets $ 369,433 $ 605,927 $ 806,548 $ 92,240,486
LIABILITIESAccounts payable and other current liabilities $ 152 $ 665 $ - $ 4,377,876Matured bonds payable - - - 4,528,354Matured interest payable - - - 1,434,429Deposits payable - - - 12,518Due to other funds - - - 709,248Due to other governments - - - 89,841Unearned revenues - other - - - 188,226
Total liabilities 152 665 - 11,340,492
DEFERRED INFLOWS OF RESOURCESUnavailable revenues - special assessments - - - 215,158Unavailable revenues - grants - - - 2,754,714
Total deferred inflows of resources - - - 2,969,872
FUND BALANCENonspendable:
Inventories of supplies - - - 159,576Prepaid items - - - 271,703
Restricted:Port development - - - 3,305,541Erosion Control District - - - 5,770,007Parks improvements - - - 1,840,867Court Administrator, mediation - - - 2,105,092Transportation - - - 4,813,298Debt service - - - 3,042,256Environmental land acquisition 369,281 - - 692,655Public safety - - - 1,231,348Court modernization - - - 632,029Mosquito Control District - - - 6,251,291Judicial expenditures - - - 1,369,386Housing assistance program - - - 95,042Boating related projects - - - 1,097,894Art in public places - - - 72,582Other capital projects - 605,262 806,548 29,998,861Other purposes - - - 3,833,451
Committed to:Street lights, roads, drainage imp. to special district - - - 230,216Unincorporated Services - - - 9,252,330Law enforcement - - - 481,133Other purposes - - - 1,383,564Total fund balances 369,281 605,262 806,548 77,930,122Total liabilities and fund balances $ 369,433 $ 605,927 $ 806,548 $ 92,240,486
110110

THIS PAGE INTENTIONALLY LEFT BLANK
111111
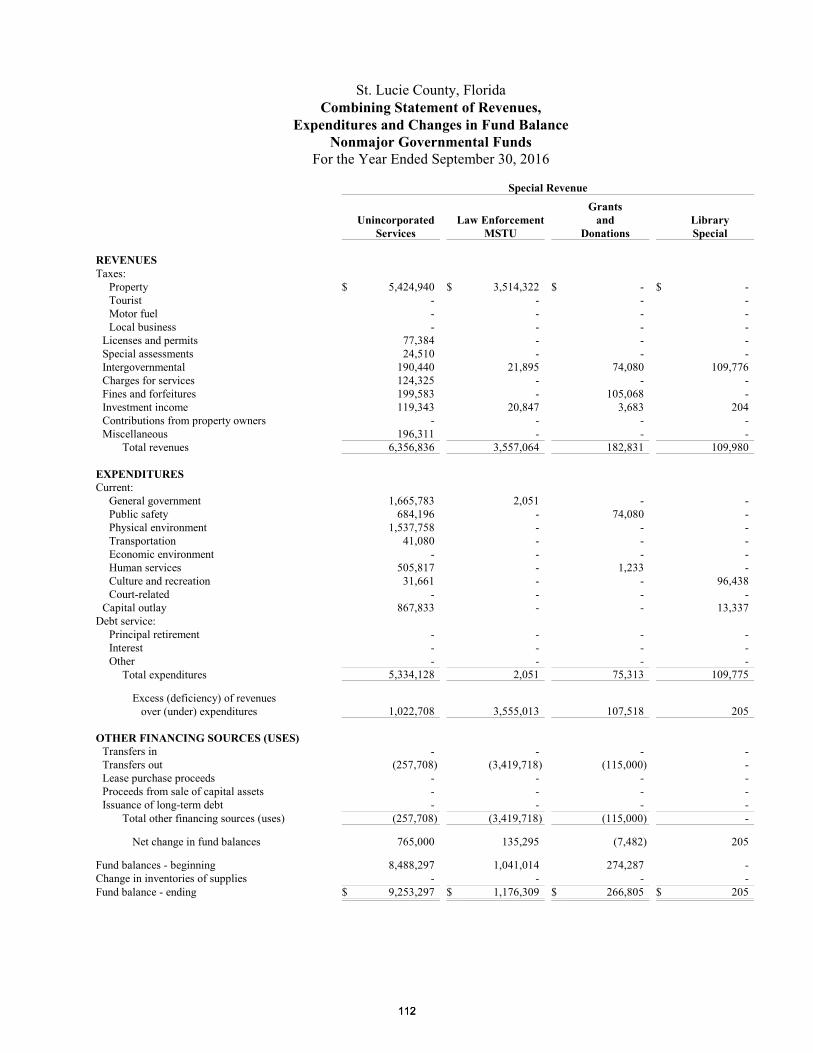
St. Lucie County, FloridaCombining Statement of Revenues,
Expenditures and Changes in Fund BalanceNonmajor Governmental Funds
For the Year Ended September 30, 2016
Special Revenue
UnincorporatedServices
Law EnforcementMSTU
Grantsand
DonationsLibrarySpecial
REVENUESTaxes:
Property $ 5,424,940 $ 3,514,322 $ - $ -Tourist - - - -Motor fuel - - - -Local business - - - -
Licenses and permits 77,384 - - -Special assessments 24,510 - - -Intergovernmental 190,440 21,895 74,080 109,776Charges for services 124,325 - - -Fines and forfeitures 199,583 - 105,068 -Investment income 119,343 20,847 3,683 204Contributions from property owners - - - -Miscellaneous 196,311 - - -
Total revenues 6,356,836 3,557,064 182,831 109,980
EXPENDITURESCurrent:
General government 1,665,783 2,051 - -Public safety 684,196 - 74,080 -Physical environment 1,537,758 - - -Transportation 41,080 - - -Economic environment - - - -Human services 505,817 - 1,233 -Culture and recreation 31,661 - - 96,438Court-related - - - -
Capital outlay 867,833 - - 13,337Debt service:
Principal retirement - - - -Interest - - - -Other - - - -
Total expenditures 5,334,128 2,051 75,313 109,775
Excess (deficiency) of revenues over (under) expenditures 1,022,708 3,555,013 107,518 205
OTHER FINANCING SOURCES (USES)Transfers in - - - -Transfers out (257,708) (3,419,718) (115,000) -Lease purchase proceeds - - - -Proceeds from sale of capital assets - - - -Issuance of long-term debt - - - -
Total other financing sources (uses) (257,708) (3,419,718) (115,000) -
Net change in fund balances 765,000 135,295 (7,482) 205
Fund balances - beginning 8,488,297 1,041,014 274,287 -Change in inventories of supplies - - - -Fund balance - ending $ 9,253,297 $ 1,176,309 $ 266,805 $ 205
112112
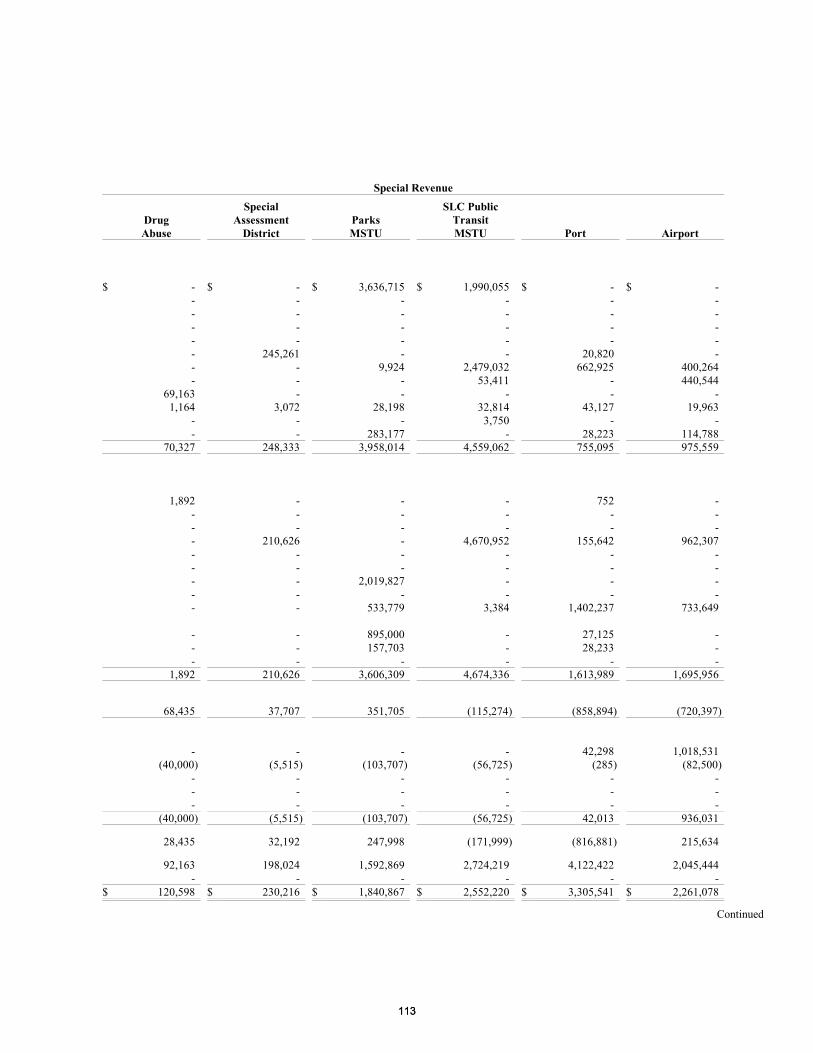
Special Revenue
DrugAbuse
SpecialAssessment
DistrictParksMSTU
SLC PublicTransitMSTU Port Airport
$ - $ - $ 3,636,715 $ 1,990,055 $ - $ -- - - - - -- - - - - -- - - - - -- - - - - -- 245,261 - - 20,820 -- - 9,924 2,479,032 662,925 400,264- - - 53,411 - 440,544
69,163 - - - - -1,164 3,072 28,198 32,814 43,127 19,963
- - - 3,750 - -- - 283,177 - 28,223 114,788
70,327 248,333 3,958,014 4,559,062 755,095 975,559
1,892 - - - 752 -- - - - - -- - - - - -- 210,626 - 4,670,952 155,642 962,307- - - - - -- - - - - -- - 2,019,827 - - -- - - - - -- - 533,779 3,384 1,402,237 733,649
- - 895,000 - 27,125 -- - 157,703 - 28,233 -- - - - - -
1,892 210,626 3,606,309 4,674,336 1,613,989 1,695,956
68,435 37,707 351,705 (115,274) (858,894) (720,397)
- - - - 42,298 1,018,531(40,000) (5,515) (103,707) (56,725) (285) (82,500)
- - - - - -- - - - - -- - - - - -
(40,000) (5,515) (103,707) (56,725) 42,013 936,031
28,435 32,192 247,998 (171,999) (816,881) 215,634
92,163 198,024 1,592,869 2,724,219 4,122,422 2,045,444- - - - - -
$ 120,598 $ 230,216 $ 1,840,867 $ 2,552,220 $ 3,305,541 $ 2,261,078
Continued
113113
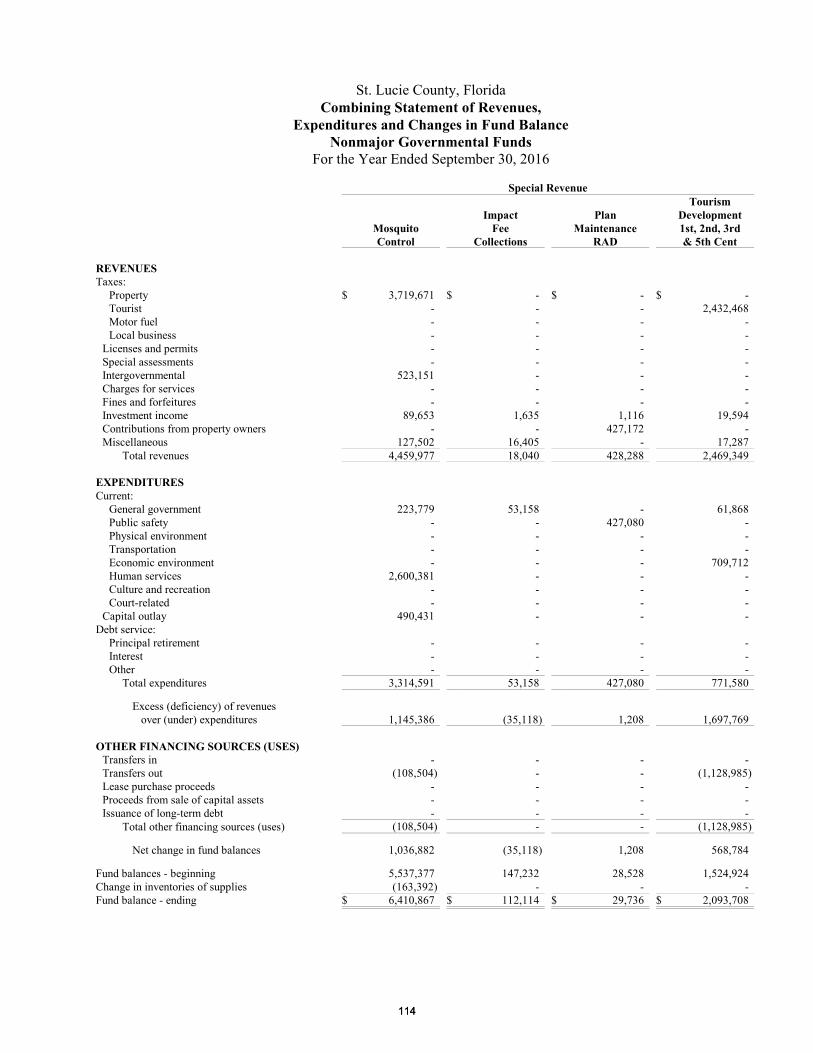
St. Lucie County, FloridaCombining Statement of Revenues,
Expenditures and Changes in Fund BalanceNonmajor Governmental Funds
For the Year Ended September 30, 2016
Special Revenue
MosquitoControl
ImpactFee
Collections
PlanMaintenance
RAD
TourismDevelopment1st, 2nd, 3rd& 5th Cent
REVENUESTaxes:
Property $ 3,719,671 $ - $ - $ -Tourist - - - 2,432,468Motor fuel - - - -Local business - - - -
Licenses and permits - - - -Special assessments - - - -Intergovernmental 523,151 - - -Charges for services - - - -Fines and forfeitures - - - -Investment income 89,653 1,635 1,116 19,594Contributions from property owners - - 427,172 -Miscellaneous 127,502 16,405 - 17,287
Total revenues 4,459,977 18,040 428,288 2,469,349
EXPENDITURESCurrent:
General government 223,779 53,158 - 61,868Public safety - - 427,080 -Physical environment - - - -Transportation - - - -Economic environment - - - 709,712Human services 2,600,381 - - -Culture and recreation - - - -Court-related - - - -
Capital outlay 490,431 - - -Debt service:
Principal retirement - - - -Interest - - - -Other - - - -
Total expenditures 3,314,591 53,158 427,080 771,580
Excess (deficiency) of revenues over (under) expenditures 1,145,386 (35,118) 1,208 1,697,769
OTHER FINANCING SOURCES (USES)Transfers in - - - -Transfers out (108,504) - - (1,128,985)Lease purchase proceeds - - - -Proceeds from sale of capital assets - - - -Issuance of long-term debt - - - -
Total other financing sources (uses) (108,504) - - (1,128,985)
Net change in fund balances 1,036,882 (35,118) 1,208 568,784
Fund balances - beginning 5,537,377 147,232 28,528 1,524,924Change in inventories of supplies (163,392) - - -Fund balance - ending $ 6,410,867 $ 112,114 $ 29,736 $ 2,093,708
114114
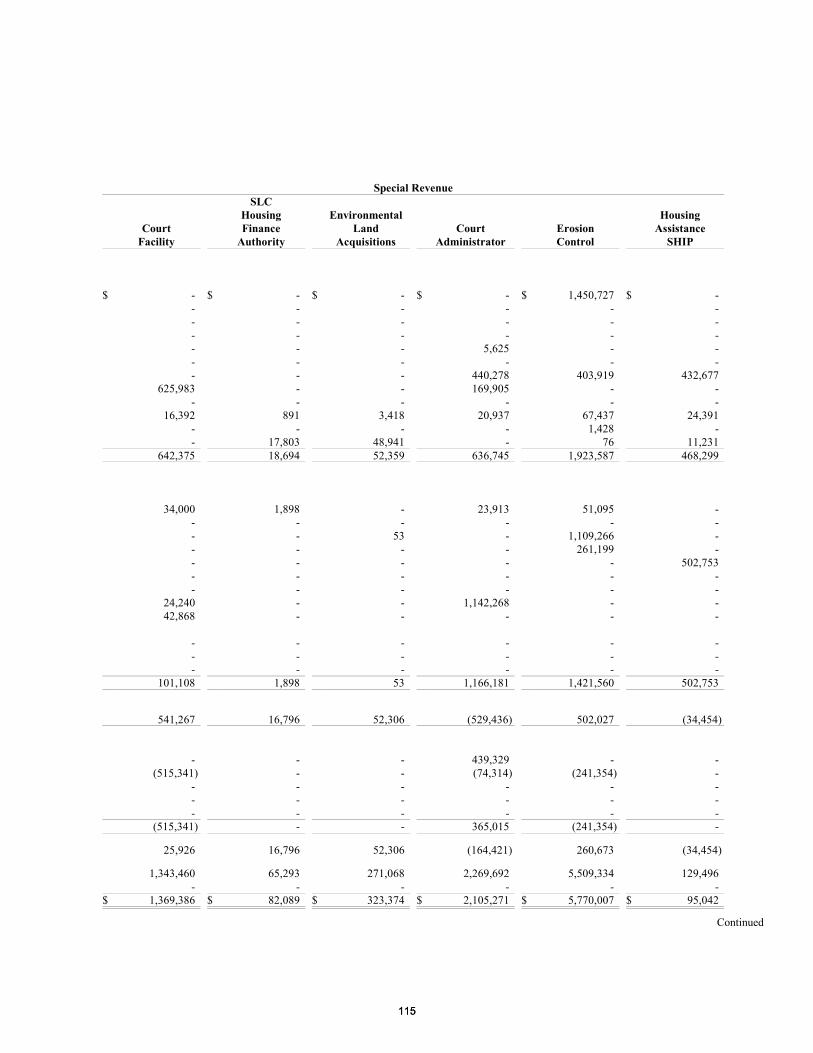
Special Revenue
CourtFacility
SLCHousingFinance
Authority
EnvironmentalLand
AcquisitionsCourt
AdministratorErosionControl
HousingAssistance
SHIP
$ - $ - $ - $ - $ 1,450,727 $ -- - - - - -- - - - - -- - - - - -- - - 5,625 - -- - - - - -- - - 440,278 403,919 432,677
625,983 - - 169,905 - -- - - - - -
16,392 891 3,418 20,937 67,437 24,391- - - - 1,428 -- 17,803 48,941 - 76 11,231
642,375 18,694 52,359 636,745 1,923,587 468,299
34,000 1,898 - 23,913 51,095 -- - - - - -- - 53 - 1,109,266 -- - - - 261,199 -- - - - - 502,753- - - - - -- - - - - -
24,240 - - 1,142,268 - -42,868 - - - - -
- - - - - -- - - - - -- - - - - -
101,108 1,898 53 1,166,181 1,421,560 502,753
541,267 16,796 52,306 (529,436) 502,027 (34,454)
- - - 439,329 - -(515,341) - - (74,314) (241,354) -
- - - - - -- - - - - -- - - - - -
(515,341) - - 365,015 (241,354) -
25,926 16,796 52,306 (164,421) 260,673 (34,454)
1,343,460 65,293 271,068 2,269,692 5,509,334 129,496- - - - - -
$ 1,369,386 $ 82,089 $ 323,374 $ 2,105,271 $ 5,770,007 $ 95,042
Continued
115115
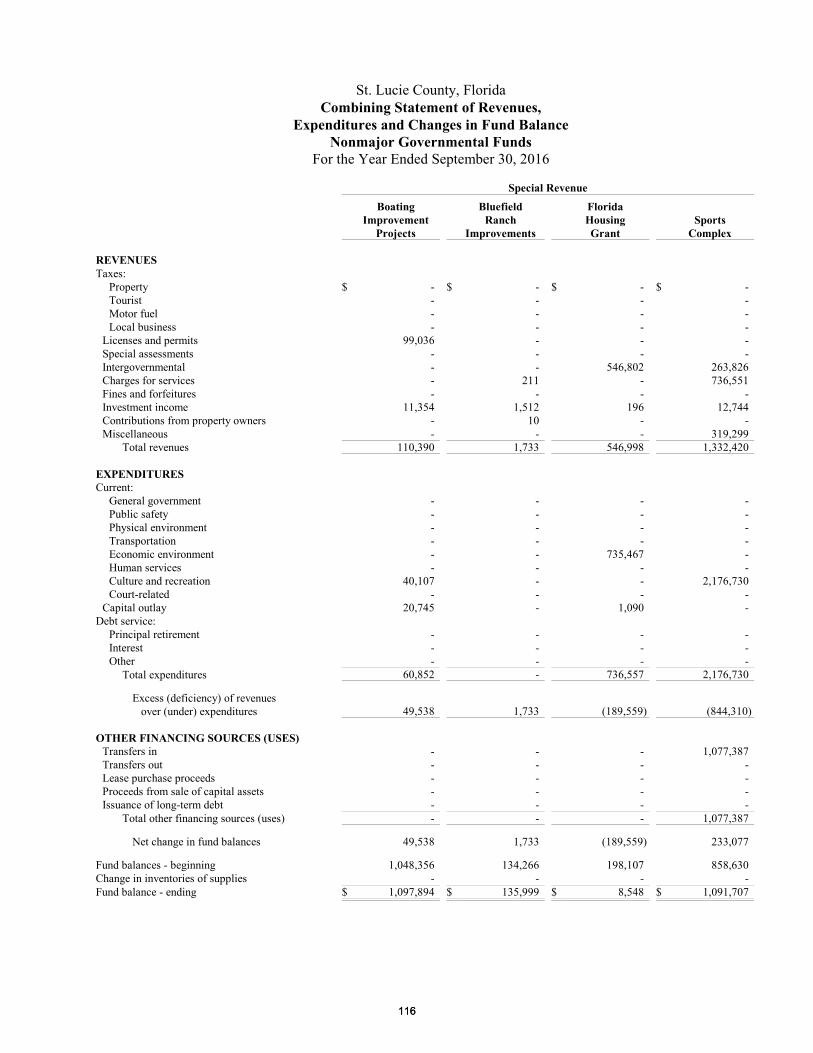
St. Lucie County, FloridaCombining Statement of Revenues,
Expenditures and Changes in Fund BalanceNonmajor Governmental Funds
For the Year Ended September 30, 2016
Special Revenue
BoatingImprovement
Projects
BluefieldRanch
Improvements
FloridaHousingGrant
SportsComplex
REVENUESTaxes:
Property $ - $ - $ - $ -Tourist - - - -Motor fuel - - - -Local business - - - -
Licenses and permits 99,036 - - -Special assessments - - - -Intergovernmental - - 546,802 263,826Charges for services - 211 - 736,551Fines and forfeitures - - - -Investment income 11,354 1,512 196 12,744Contributions from property owners - 10 - -Miscellaneous - - - 319,299
Total revenues 110,390 1,733 546,998 1,332,420
EXPENDITURESCurrent:
General government - - - -Public safety - - - -Physical environment - - - -Transportation - - - -Economic environment - - 735,467 -Human services - - - -Culture and recreation 40,107 - - 2,176,730Court-related - - - -
Capital outlay 20,745 - 1,090 -Debt service:
Principal retirement - - - -Interest - - - -Other - - - -
Total expenditures 60,852 - 736,557 2,176,730
Excess (deficiency) of revenues over (under) expenditures 49,538 1,733 (189,559) (844,310)
OTHER FINANCING SOURCES (USES)Transfers in - - - 1,077,387Transfers out - - - -Lease purchase proceeds - - - -Proceeds from sale of capital assets - - - -Issuance of long-term debt - - - -
Total other financing sources (uses) - - - 1,077,387
Net change in fund balances 49,538 1,733 (189,559) 233,077
Fund balances - beginning 1,048,356 134,266 198,107 858,630Change in inventories of supplies - - - -Fund balance - ending $ 1,097,894 $ 135,999 $ 8,548 $ 1,091,707
116116
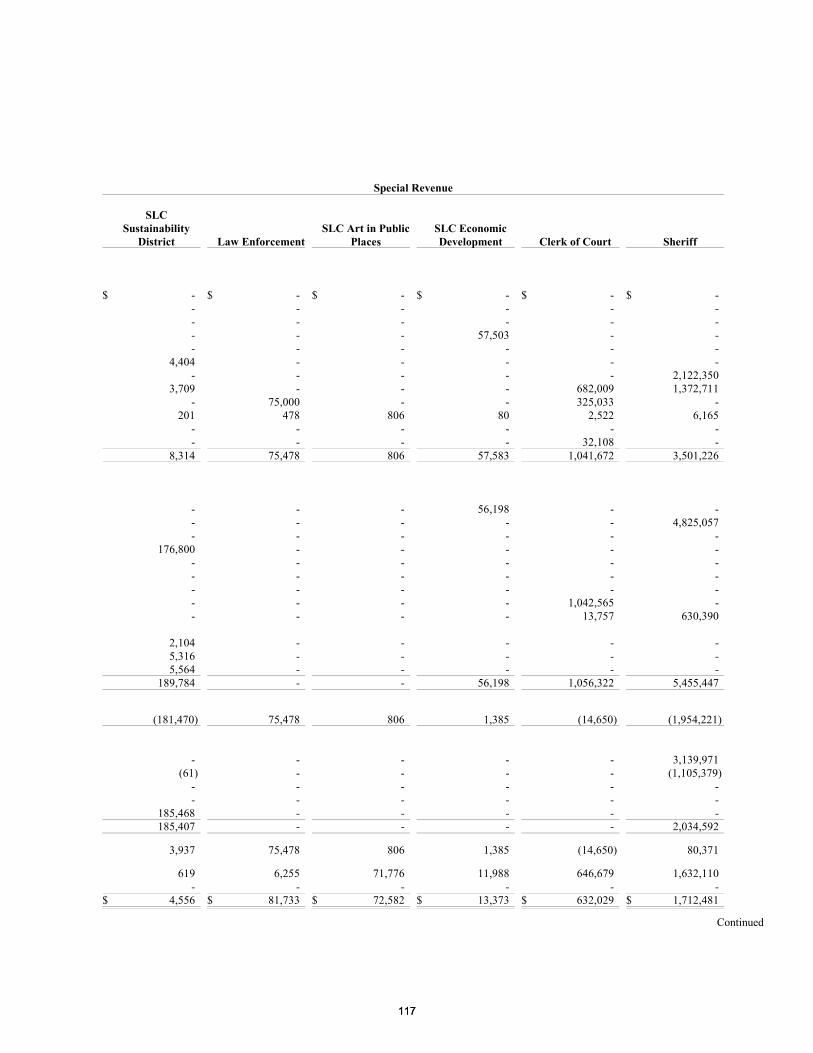
Special Revenue
SLCSustainability
District Law EnforcementSLC Art in Public
PlacesSLC EconomicDevelopment Clerk of Court Sheriff
$ - $ - $ - $ - $ - $ -- - - - - -- - - - - -- - - 57,503 - -- - - - - -
4,404 - - - - -- - - - - 2,122,350
3,709 - - - 682,009 1,372,711- 75,000 - - 325,033 -
201 478 806 80 2,522 6,165- - - - - -- - - - 32,108 -
8,314 75,478 806 57,583 1,041,672 3,501,226
- - - 56,198 - -- - - - - 4,825,057- - - - - -
176,800 - - - - -- - - - - -- - - - - -- - - - - -- - - - 1,042,565 -- - - - 13,757 630,390
2,104 - - - - -5,316 - - - - -5,564 - - - - -
189,784 - - 56,198 1,056,322 5,455,447
(181,470) 75,478 806 1,385 (14,650) (1,954,221)
- - - - - 3,139,971(61) - - - - (1,105,379)
- - - - - -- - - - - -
185,468 - - - - -185,407 - - - - 2,034,592
3,937 75,478 806 1,385 (14,650) 80,371
619 6,255 71,776 11,988 646,679 1,632,110- - - - - -
$ 4,556 $ 81,733 $ 72,582 $ 13,373 $ 632,029 $ 1,712,481
Continued
117117
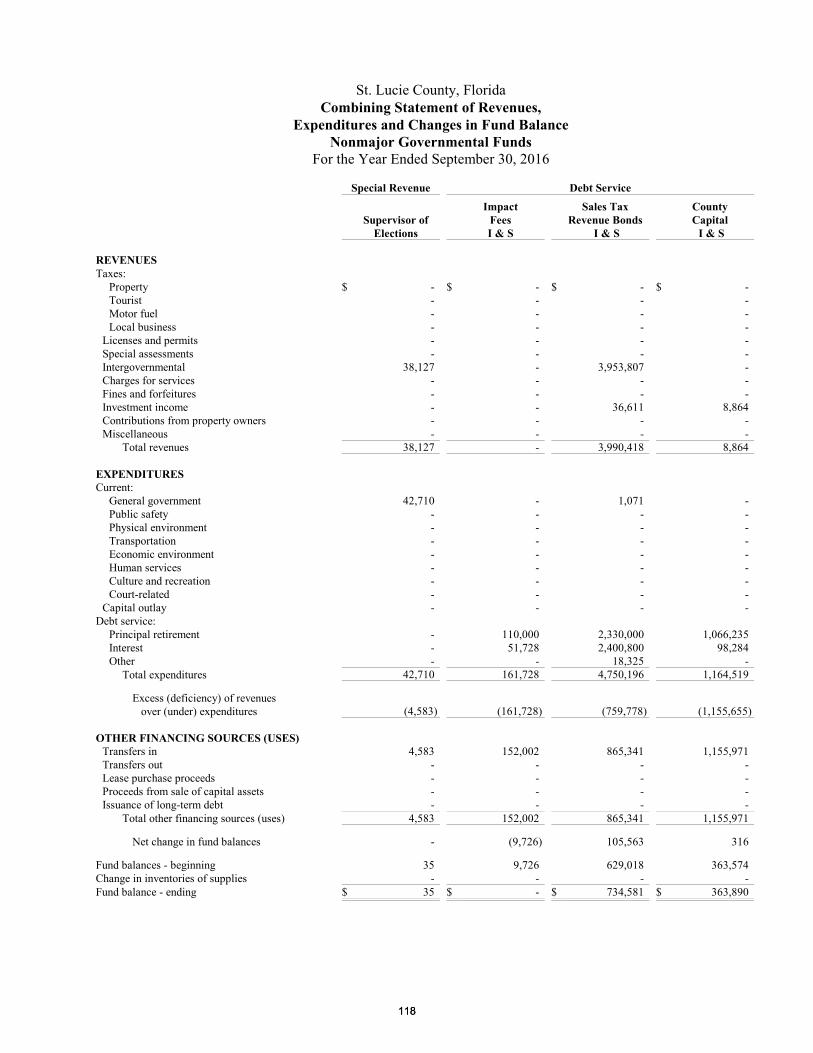
St. Lucie County, FloridaCombining Statement of Revenues,
Expenditures and Changes in Fund BalanceNonmajor Governmental Funds
For the Year Ended September 30, 2016
Special Revenue Debt Service
Supervisor ofElections
ImpactFeesI & S
Sales TaxRevenue Bonds
I & S
CountyCapital I & S
REVENUESTaxes:
Property $ - $ - $ - $ -Tourist - - - -Motor fuel - - - -Local business - - - -
Licenses and permits - - - -Special assessments - - - -Intergovernmental 38,127 - 3,953,807 -Charges for services - - - -Fines and forfeitures - - - -Investment income - - 36,611 8,864Contributions from property owners - - - -Miscellaneous - - - -
Total revenues 38,127 - 3,990,418 8,864
EXPENDITURESCurrent:
General government 42,710 - 1,071 -Public safety - - - -Physical environment - - - -Transportation - - - -Economic environment - - - -Human services - - - -Culture and recreation - - - -Court-related - - - -
Capital outlay - - - -Debt service:
Principal retirement - 110,000 2,330,000 1,066,235Interest - 51,728 2,400,800 98,284Other - - 18,325 -
Total expenditures 42,710 161,728 4,750,196 1,164,519
Excess (deficiency) of revenues over (under) expenditures (4,583) (161,728) (759,778) (1,155,655)
OTHER FINANCING SOURCES (USES)Transfers in 4,583 152,002 865,341 1,155,971Transfers out - - - -Lease purchase proceeds - - - -Proceeds from sale of capital assets - - - -Issuance of long-term debt - - - -
Total other financing sources (uses) 4,583 152,002 865,341 1,155,971
Net change in fund balances - (9,726) 105,563 316
Fund balances - beginning 35 9,726 629,018 363,574Change in inventories of supplies - - - -Fund balance - ending $ 35 $ - $ 734,581 $ 363,890
118118
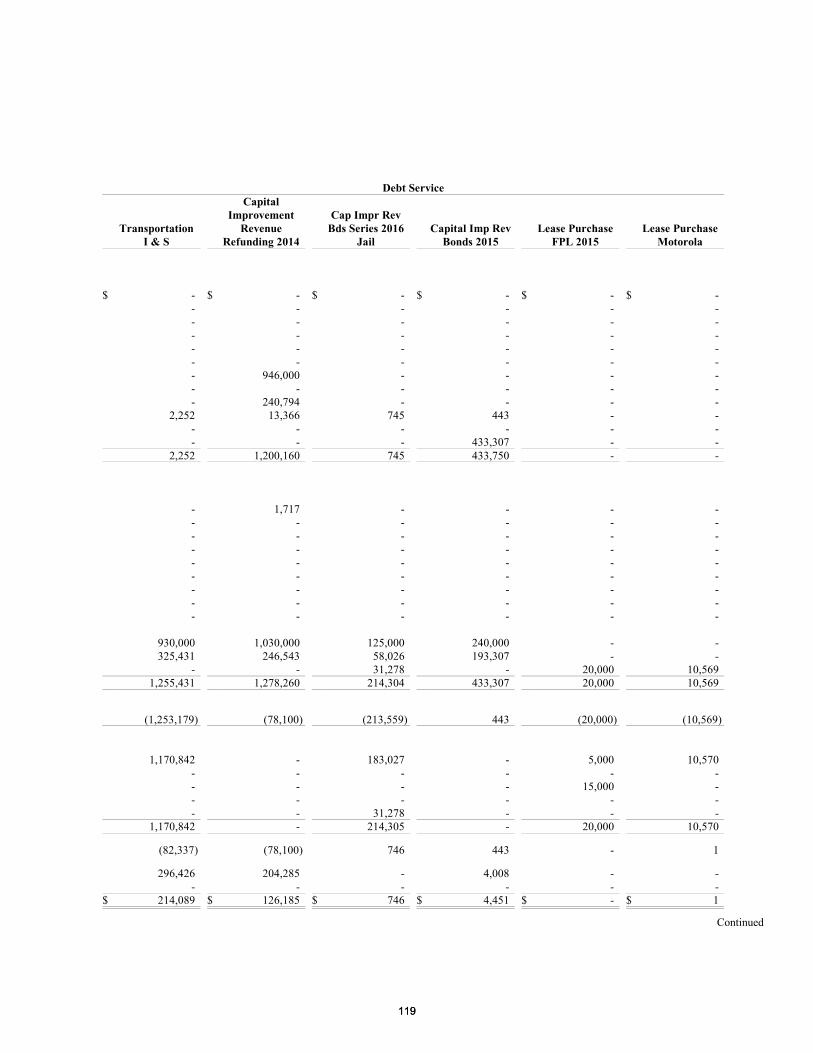
Debt Service
TransportationI & S
CapitalImprovement
RevenueRefunding 2014
Cap Impr RevBds Series 2016
JailCapital Imp Rev
Bonds 2015Lease Purchase
FPL 2015Lease Purchase
Motorola
$ - $ - $ - $ - $ - $ -- - - - - -- - - - - -- - - - - -- - - - - -- - - - - -- 946,000 - - - -- - - - - -- 240,794 - - - -
2,252 13,366 745 443 - -- - - - - -- - - 433,307 - -
2,252 1,200,160 745 433,750 - -
- 1,717 - - - -- - - - - -- - - - - -- - - - - -- - - - - -- - - - - -- - - - - -- - - - - -- - - - - -
930,000 1,030,000 125,000 240,000 - -325,431 246,543 58,026 193,307 - -
- - 31,278 - 20,000 10,5691,255,431 1,278,260 214,304 433,307 20,000 10,569
(1,253,179) (78,100) (213,559) 443 (20,000) (10,569)
1,170,842 - 183,027 - 5,000 10,570- - - - - -- - - - 15,000 -- - - - - -- - 31,278 - - -
1,170,842 - 214,305 - 20,000 10,570
(82,337) (78,100) 746 443 - 1
296,426 204,285 - 4,008 - -- - - - - -
$ 214,089 $ 126,185 $ 746 $ 4,451 $ - $ 1
Continued
119119
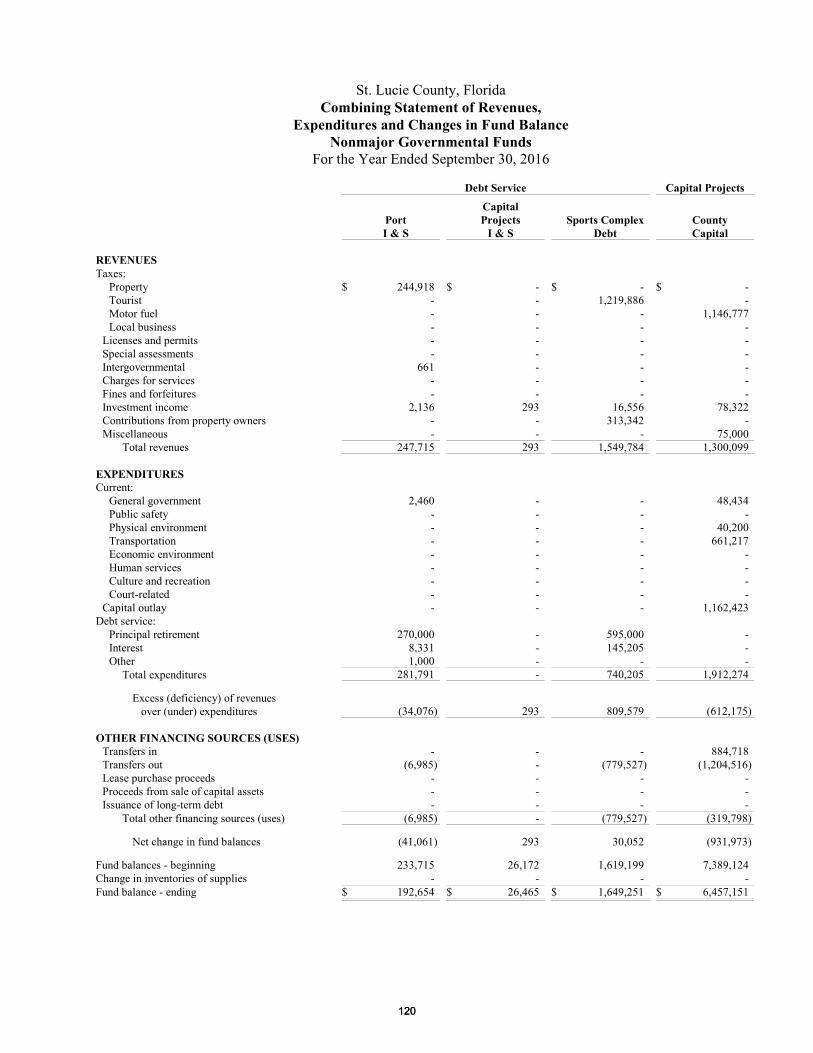
St. Lucie County, FloridaCombining Statement of Revenues,
Expenditures and Changes in Fund BalanceNonmajor Governmental Funds
For the Year Ended September 30, 2016
Debt Service Capital Projects
PortI & S
CapitalProjects
I & SSports Complex
DebtCountyCapital
REVENUESTaxes:
Property $ 244,918 $ - $ - $ -Tourist - - 1,219,886 -Motor fuel - - - 1,146,777Local business - - - -
Licenses and permits - - - -Special assessments - - - -Intergovernmental 661 - - -Charges for services - - - -Fines and forfeitures - - - -Investment income 2,136 293 16,556 78,322Contributions from property owners - - 313,342 -Miscellaneous - - - 75,000
Total revenues 247,715 293 1,549,784 1,300,099
EXPENDITURESCurrent:
General government 2,460 - - 48,434Public safety - - - -Physical environment - - - 40,200Transportation - - - 661,217Economic environment - - - -Human services - - - -Culture and recreation - - - -Court-related - - - -
Capital outlay - - - 1,162,423Debt service:
Principal retirement 270,000 - 595,000 -Interest 8,331 - 145,205 -Other 1,000 - - -
Total expenditures 281,791 - 740,205 1,912,274
Excess (deficiency) of revenues over (under) expenditures (34,076) 293 809,579 (612,175)
OTHER FINANCING SOURCES (USES)Transfers in - - - 884,718Transfers out (6,985) - (779,527) (1,204,516)Lease purchase proceeds - - - -Proceeds from sale of capital assets - - - -Issuance of long-term debt - - - -
Total other financing sources (uses) (6,985) - (779,527) (319,798)
Net change in fund balances (41,061) 293 30,052 (931,973)
Fund balances - beginning 233,715 26,172 1,619,199 7,389,124Change in inventories of supplies - - - -Fund balance - ending $ 192,654 $ 26,465 $ 1,649,251 $ 6,457,151
120120
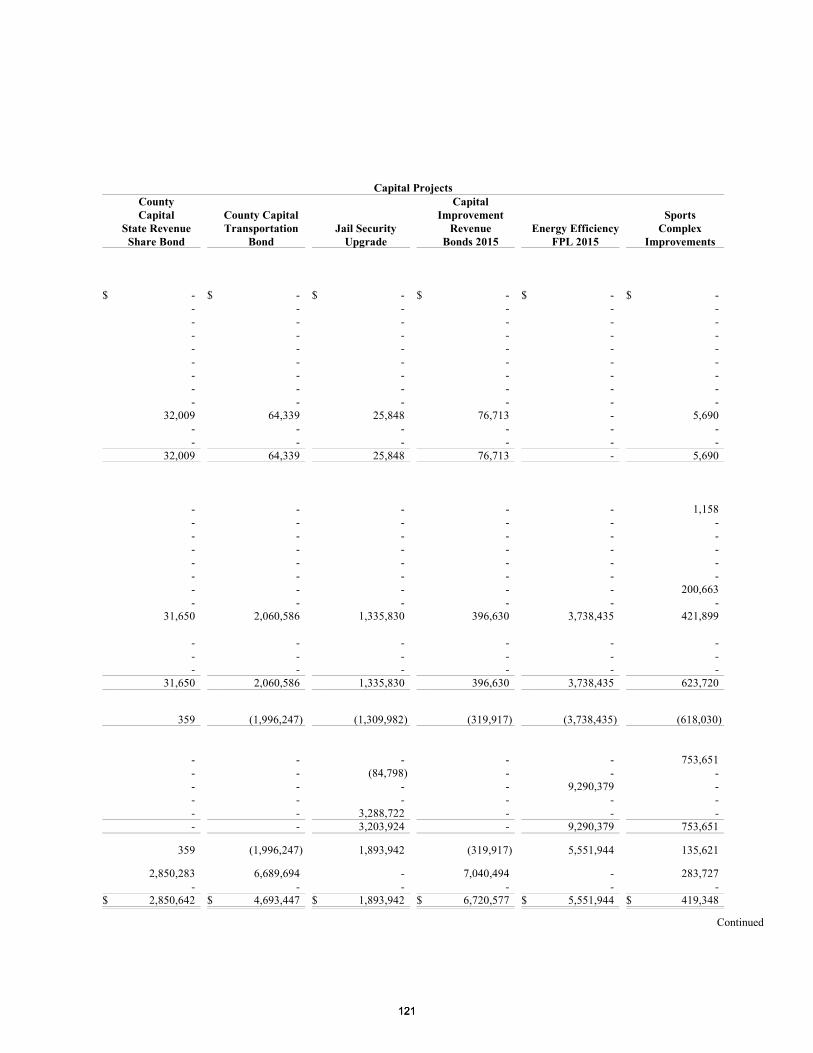
Capital ProjectsCountyCapital
State RevenueShare Bond
County CapitalTransportation
BondJail Security
Upgrade
CapitalImprovement
RevenueBonds 2015
Energy EfficiencyFPL 2015
SportsComplex
Improvements
$ - $ - $ - $ - $ - $ -- - - - - -- - - - - -- - - - - -- - - - - -- - - - - -- - - - - -- - - - - -- - - - - -
32,009 64,339 25,848 76,713 - 5,690- - - - - -- - - - - -
32,009 64,339 25,848 76,713 - 5,690
- - - - - 1,158- - - - - -- - - - - -- - - - - -- - - - - -- - - - - -- - - - - 200,663- - - - - -
31,650 2,060,586 1,335,830 396,630 3,738,435 421,899
- - - - - -- - - - - -- - - - - -
31,650 2,060,586 1,335,830 396,630 3,738,435 623,720
359 (1,996,247) (1,309,982) (319,917) (3,738,435) (618,030)
- - - - - 753,651- - (84,798) - - -- - - - 9,290,379 -- - - - - -- - 3,288,722 - - -- - 3,203,924 - 9,290,379 753,651
359 (1,996,247) 1,893,942 (319,917) 5,551,944 135,621
2,850,283 6,689,694 - 7,040,494 - 283,727- - - - - -
$ 2,850,642 $ 4,693,447 $ 1,893,942 $ 6,720,577 $ 5,551,944 $ 419,348
Continued
121121
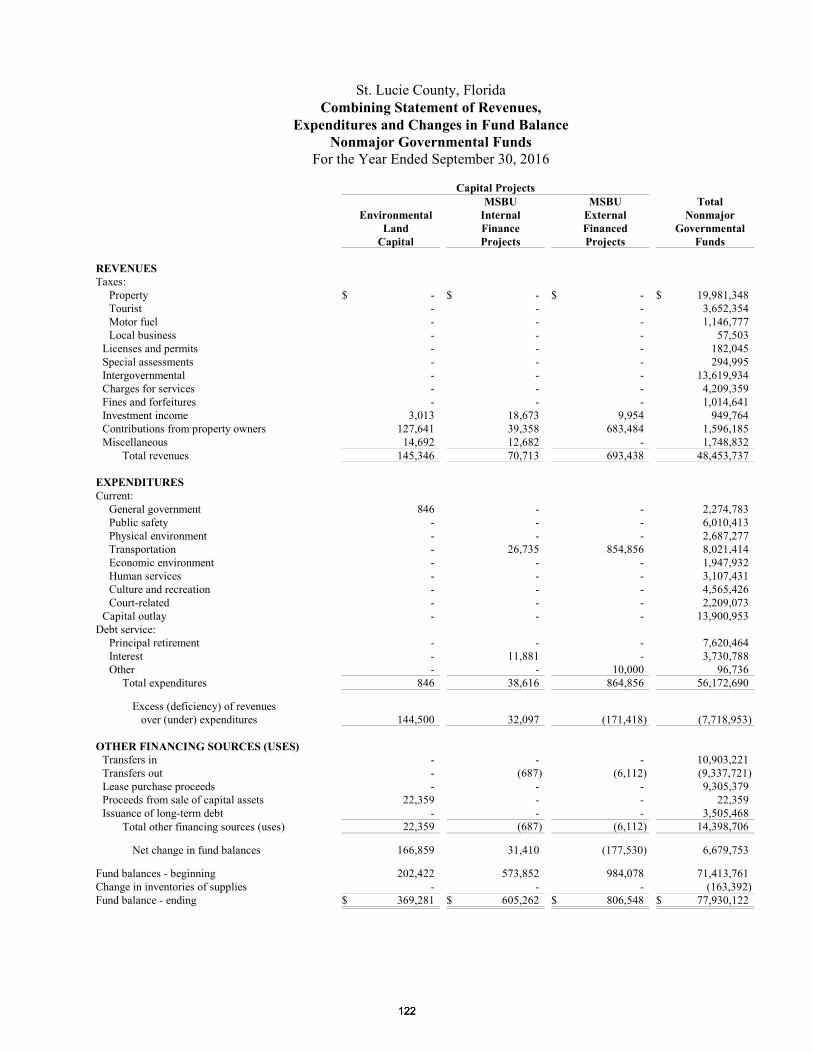
St. Lucie County, FloridaCombining Statement of Revenues,
Expenditures and Changes in Fund BalanceNonmajor Governmental Funds
For the Year Ended September 30, 2016
Capital Projects
EnvironmentalLand
Capital
MSBUInternalFinanceProjects
MSBUExternalFinancedProjects
TotalNonmajor
GovernmentalFunds
REVENUESTaxes:
Property $ - $ - $ - $ 19,981,348Tourist - - - 3,652,354Motor fuel - - - 1,146,777Local business - - - 57,503
Licenses and permits - - - 182,045Special assessments - - - 294,995Intergovernmental - - - 13,619,934Charges for services - - - 4,209,359Fines and forfeitures - - - 1,014,641Investment income 3,013 18,673 9,954 949,764Contributions from property owners 127,641 39,358 683,484 1,596,185Miscellaneous 14,692 12,682 - 1,748,832
Total revenues 145,346 70,713 693,438 48,453,737
EXPENDITURESCurrent:
General government 846 - - 2,274,783Public safety - - - 6,010,413Physical environment - - - 2,687,277Transportation - 26,735 854,856 8,021,414Economic environment - - - 1,947,932Human services - - - 3,107,431Culture and recreation - - - 4,565,426Court-related - - - 2,209,073
Capital outlay - - - 13,900,953Debt service:
Principal retirement - - - 7,620,464Interest - 11,881 - 3,730,788Other - - 10,000 96,736
Total expenditures 846 38,616 864,856 56,172,690
Excess (deficiency) of revenues over (under) expenditures 144,500 32,097 (171,418) (7,718,953)
OTHER FINANCING SOURCES (USES)Transfers in - - - 10,903,221Transfers out - (687) (6,112) (9,337,721)Lease purchase proceeds - - - 9,305,379Proceeds from sale of capital assets 22,359 - - 22,359Issuance of long-term debt - - - 3,505,468
Total other financing sources (uses) 22,359 (687) (6,112) 14,398,706
Net change in fund balances 166,859 31,410 (177,530) 6,679,753
Fund balances - beginning 202,422 573,852 984,078 71,413,761Change in inventories of supplies - - - (163,392)Fund balance - ending $ 369,281 $ 605,262 $ 806,548 $ 77,930,122
122122

THIS PAGE INTENTIONALLY LEFT BLANK
123123
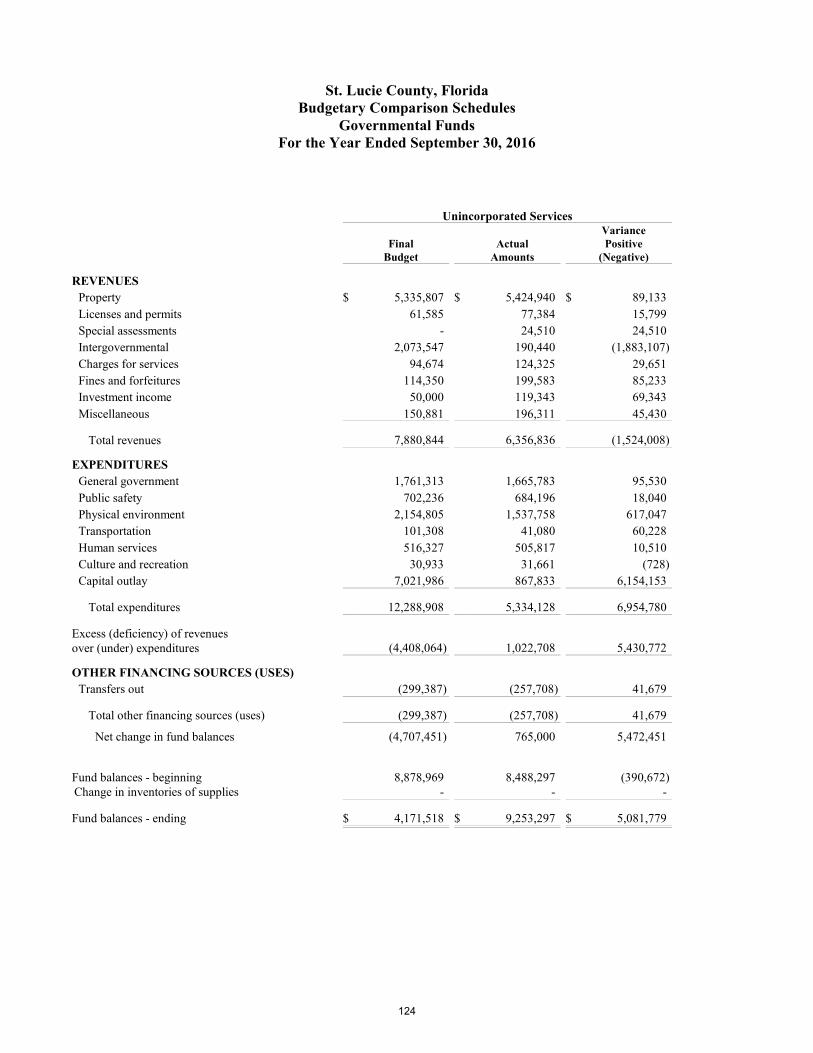
St. Lucie County, FloridaBudgetary Comparison Schedules
Governmental FundsFor the Year Ended September 30, 2016
Unincorporated Services
FinalBudget
ActualAmounts
VariancePositive
(Negative)
REVENUESProperty $ 5,335,807 $ 5,424,940 $ 89,133Licenses and permits 61,585 77,384 15,799Special assessments - 24,510 24,510Intergovernmental 2,073,547 190,440 (1,883,107)Charges for services 94,674 124,325 29,651Fines and forfeitures 114,350 199,583 85,233Investment income 50,000 119,343 69,343Miscellaneous 150,881 196,311 45,430
Total revenues 7,880,844 6,356,836 (1,524,008)
EXPENDITURESGeneral government 1,761,313 1,665,783 95,530Public safety 702,236 684,196 18,040Physical environment 2,154,805 1,537,758 617,047Transportation 101,308 41,080 60,228Human services 516,327 505,817 10,510Culture and recreation 30,933 31,661 (728)Capital outlay 7,021,986 867,833 6,154,153
Total expenditures 12,288,908 5,334,128 6,954,780
Excess (deficiency) of revenues over (under) expenditures (4,408,064) 1,022,708 5,430,772
OTHER FINANCING SOURCES (USES)Transfers out (299,387) (257,708) 41,679
Total other financing sources (uses) (299,387) (257,708) 41,679
Net change in fund balances (4,707,451) 765,000 5,472,451
Fund balances - beginning 8,878,969 8,488,297 (390,672)Change in inventories of supplies - - -
Fund balances - ending $ 4,171,518 $ 9,253,297 $ 5,081,779
124
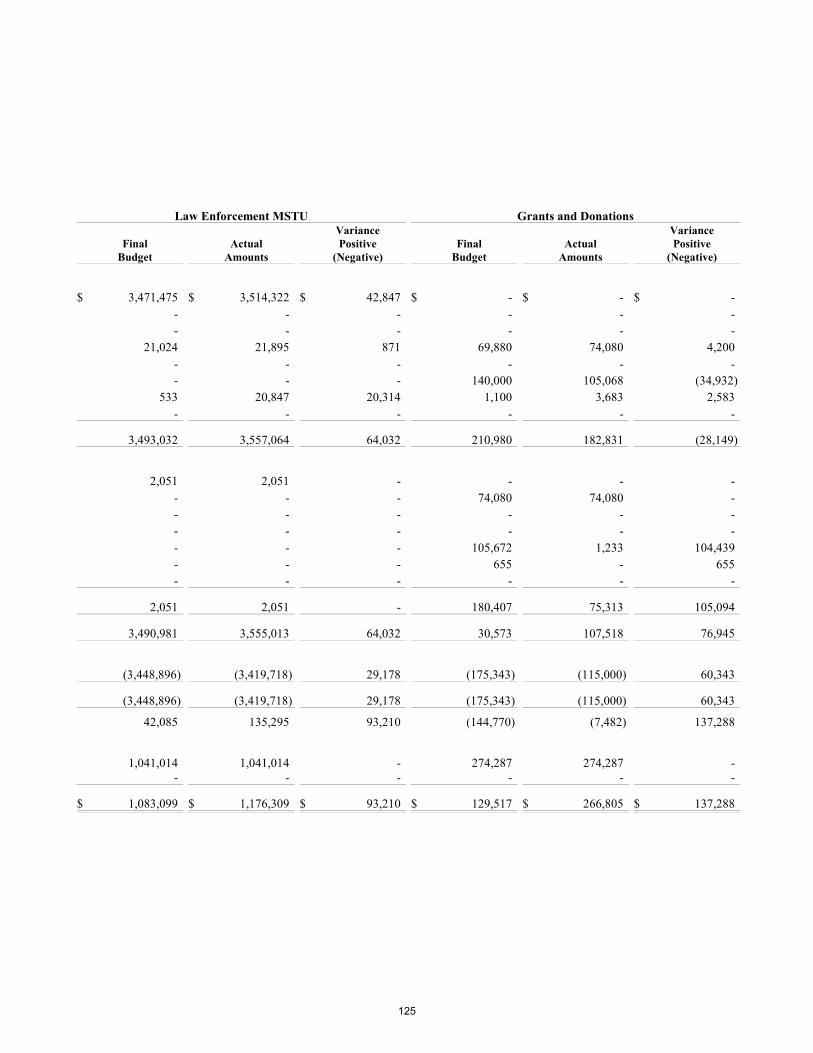
Law Enforcement MSTU Grants and Donations
FinalBudget
ActualAmounts
VariancePositive
(Negative)Final
BudgetActual
Amounts
VariancePositive
(Negative)
$ 3,471,475 $ 3,514,322 $ 42,847 $ - $ - $ -- - - - - -- - - - - -
21,024 21,895 871 69,880 74,080 4,200- - - - - -- - - 140,000 105,068 (34,932)
533 20,847 20,314 1,100 3,683 2,583- - - - - -
3,493,032 3,557,064 64,032 210,980 182,831 (28,149)
2,051 2,051 - - - -- - - 74,080 74,080 -- - - - - -- - - - - -- - - 105,672 1,233 104,439- - - 655 - 655- - - - - -
2,051 2,051 - 180,407 75,313 105,094
3,490,981 3,555,013 64,032 30,573 107,518 76,945
(3,448,896) (3,419,718) 29,178 (175,343) (115,000) 60,343
(3,448,896) (3,419,718) 29,178 (175,343) (115,000) 60,343
42,085 135,295 93,210 (144,770) (7,482) 137,288
1,041,014 1,041,014 - 274,287 274,287 -- - - - - -
$ 1,083,099 $ 1,176,309 $ 93,210 $ 129,517 $ 266,805 $ 137,288
125
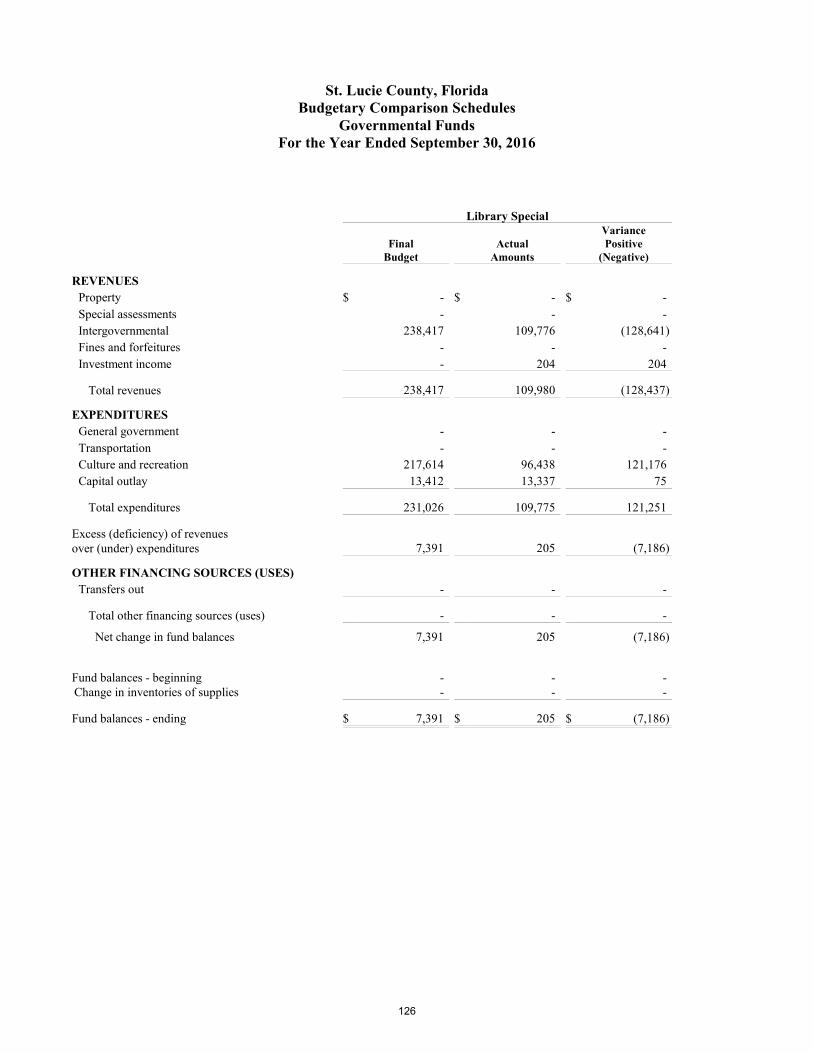
St. Lucie County, FloridaBudgetary Comparison Schedules
Governmental FundsFor the Year Ended September 30, 2016
Library Special
FinalBudget
ActualAmounts
VariancePositive
(Negative)
REVENUESProperty $ - $ - $ -Special assessments - - -Intergovernmental 238,417 109,776 (128,641)Fines and forfeitures - - -Investment income - 204 204
Total revenues 238,417 109,980 (128,437)
EXPENDITURESGeneral government - - -Transportation - - -Culture and recreation 217,614 96,438 121,176Capital outlay 13,412 13,337 75
Total expenditures 231,026 109,775 121,251
Excess (deficiency) of revenues over (under) expenditures 7,391 205 (7,186)
OTHER FINANCING SOURCES (USES)Transfers out - - -
Total other financing sources (uses) - - -
Net change in fund balances 7,391 205 (7,186)
Fund balances - beginning - - -Change in inventories of supplies - - -
Fund balances - ending $ 7,391 $ 205 $ (7,186)
126
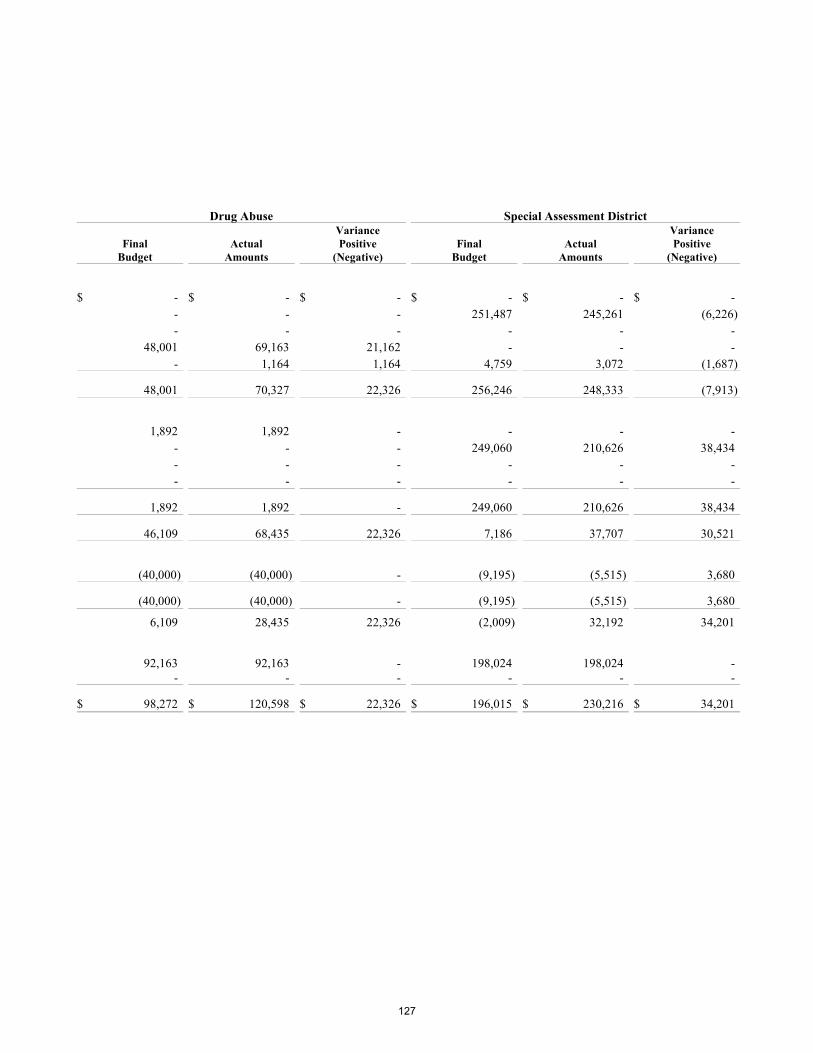
Drug Abuse Special Assessment District
FinalBudget
ActualAmounts
VariancePositive
(Negative)Final
BudgetActual
Amounts
VariancePositive
(Negative)
$ - $ - $ - $ - $ - $ -- - - 251,487 245,261 (6,226)- - - - - -
48,001 69,163 21,162 - - -- 1,164 1,164 4,759 3,072 (1,687)
48,001 70,327 22,326 256,246 248,333 (7,913)
1,892 1,892 - - - -- - - 249,060 210,626 38,434- - - - - -- - - - - -
1,892 1,892 - 249,060 210,626 38,434
46,109 68,435 22,326 7,186 37,707 30,521
(40,000) (40,000) - (9,195) (5,515) 3,680
(40,000) (40,000) - (9,195) (5,515) 3,680
6,109 28,435 22,326 (2,009) 32,192 34,201
92,163 92,163 - 198,024 198,024 -- - - - - -
$ 98,272 $ 120,598 $ 22,326 $ 196,015 $ 230,216 $ 34,201
127
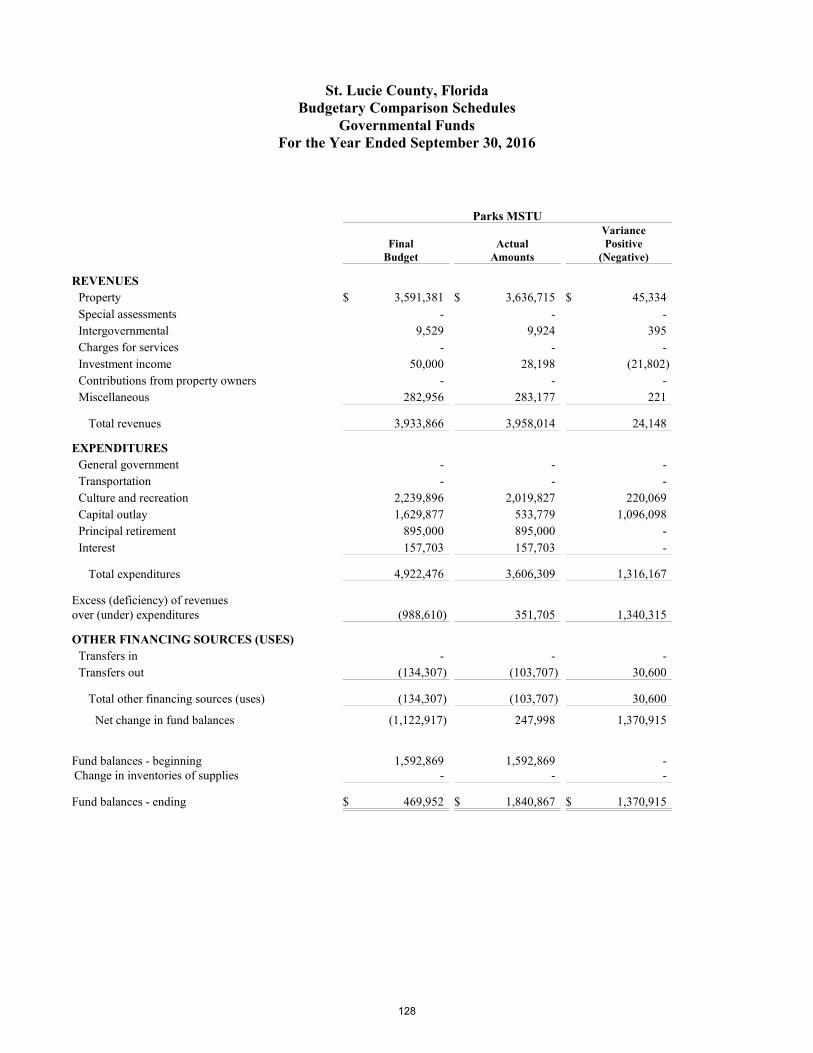
St. Lucie County, FloridaBudgetary Comparison Schedules
Governmental FundsFor the Year Ended September 30, 2016
Parks MSTU
FinalBudget
ActualAmounts
VariancePositive
(Negative)
REVENUESProperty $ 3,591,381 $ 3,636,715 $ 45,334Special assessments - - -Intergovernmental 9,529 9,924 395Charges for services - - -Investment income 50,000 28,198 (21,802)Contributions from property owners - - -Miscellaneous 282,956 283,177 221
Total revenues 3,933,866 3,958,014 24,148
EXPENDITURESGeneral government - - -Transportation - - -Culture and recreation 2,239,896 2,019,827 220,069Capital outlay 1,629,877 533,779 1,096,098Principal retirement 895,000 895,000 -Interest 157,703 157,703 -
Total expenditures 4,922,476 3,606,309 1,316,167
Excess (deficiency) of revenues over (under) expenditures (988,610) 351,705 1,340,315
OTHER FINANCING SOURCES (USES)Transfers in - - -Transfers out (134,307) (103,707) 30,600
Total other financing sources (uses) (134,307) (103,707) 30,600
Net change in fund balances (1,122,917) 247,998 1,370,915
Fund balances - beginning 1,592,869 1,592,869 -Change in inventories of supplies - - -
Fund balances - ending $ 469,952 $ 1,840,867 $ 1,370,915
128
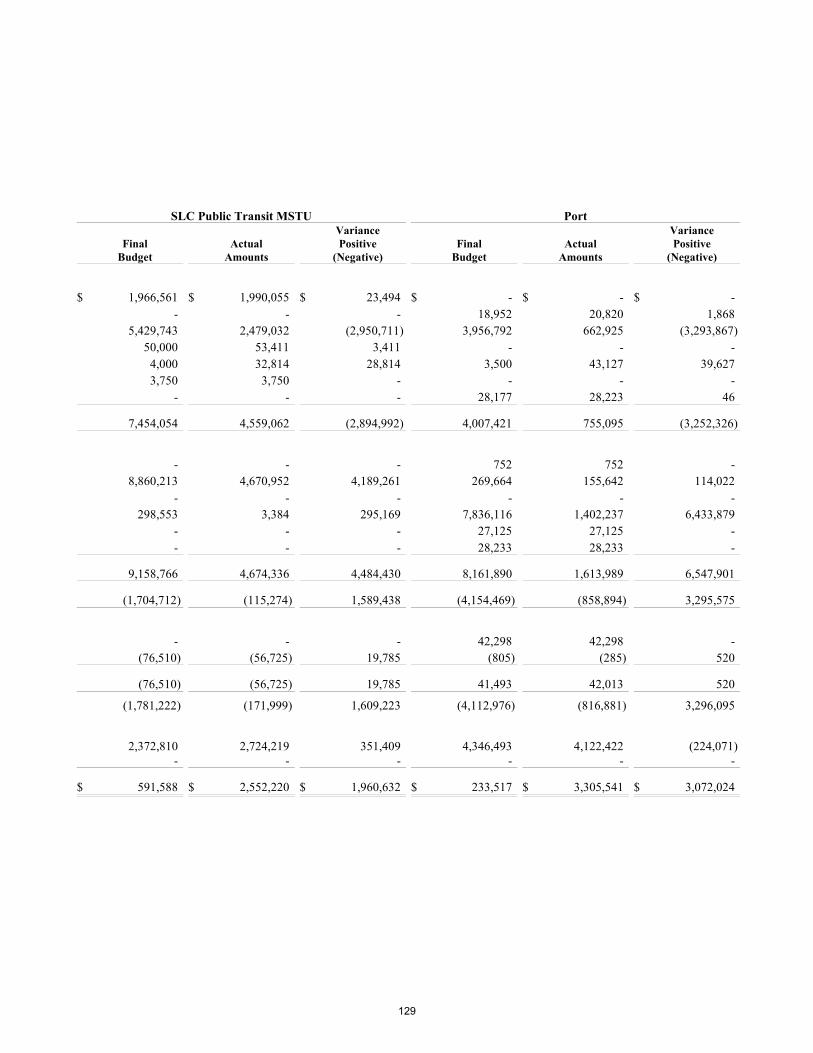
SLC Public Transit MSTU Port
FinalBudget
ActualAmounts
VariancePositive
(Negative)Final
BudgetActual
Amounts
VariancePositive
(Negative)
$ 1,966,561 $ 1,990,055 $ 23,494 $ - $ - $ -- - - 18,952 20,820 1,868
5,429,743 2,479,032 (2,950,711) 3,956,792 662,925 (3,293,867)50,000 53,411 3,411 - - -
4,000 32,814 28,814 3,500 43,127 39,6273,750 3,750 - - - -
- - - 28,177 28,223 46
7,454,054 4,559,062 (2,894,992) 4,007,421 755,095 (3,252,326)
- - - 752 752 -8,860,213 4,670,952 4,189,261 269,664 155,642 114,022
- - - - - -298,553 3,384 295,169 7,836,116 1,402,237 6,433,879
- - - 27,125 27,125 -- - - 28,233 28,233 -
9,158,766 4,674,336 4,484,430 8,161,890 1,613,989 6,547,901
(1,704,712) (115,274) 1,589,438 (4,154,469) (858,894) 3,295,575
- - - 42,298 42,298 -(76,510) (56,725) 19,785 (805) (285) 520
(76,510) (56,725) 19,785 41,493 42,013 520
(1,781,222) (171,999) 1,609,223 (4,112,976) (816,881) 3,296,095
2,372,810 2,724,219 351,409 4,346,493 4,122,422 (224,071)- - - - - -
$ 591,588 $ 2,552,220 $ 1,960,632 $ 233,517 $ 3,305,541 $ 3,072,024
129
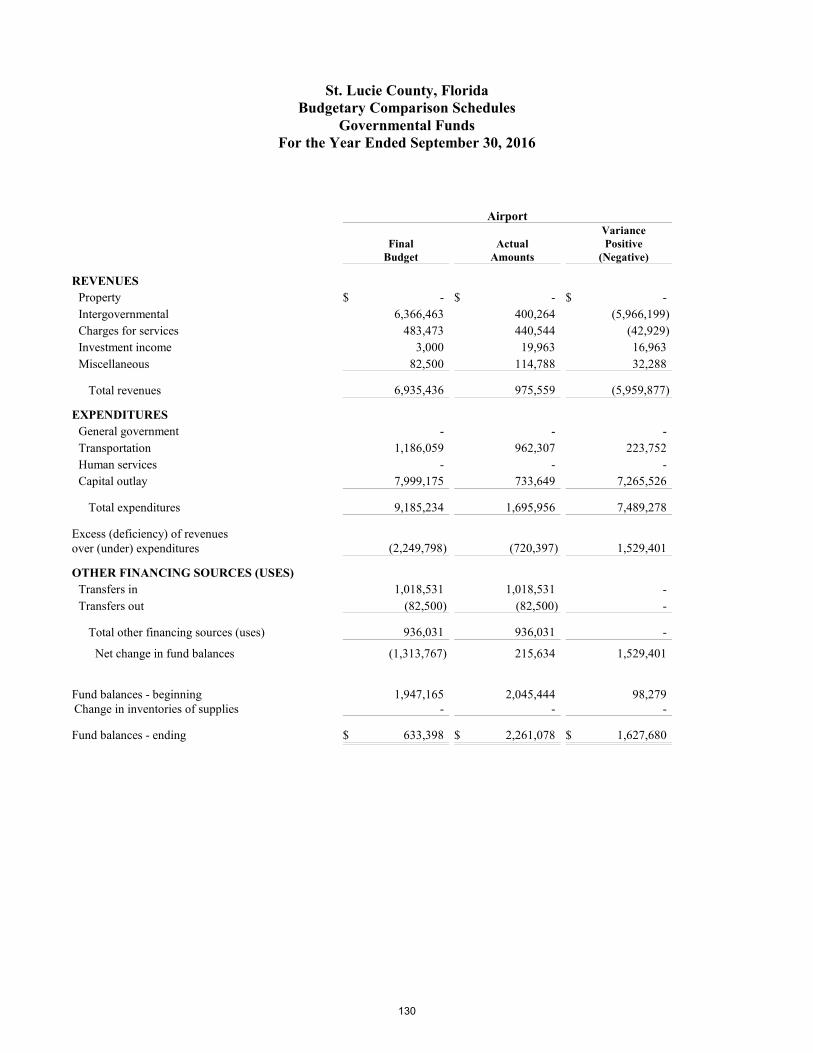
St. Lucie County, FloridaBudgetary Comparison Schedules
Governmental FundsFor the Year Ended September 30, 2016
Airport
FinalBudget
ActualAmounts
VariancePositive
(Negative)
REVENUESProperty $ - $ - $ -Intergovernmental 6,366,463 400,264 (5,966,199)Charges for services 483,473 440,544 (42,929)Investment income 3,000 19,963 16,963Miscellaneous 82,500 114,788 32,288
Total revenues 6,935,436 975,559 (5,959,877)
EXPENDITURESGeneral government - - -Transportation 1,186,059 962,307 223,752Human services - - -Capital outlay 7,999,175 733,649 7,265,526
Total expenditures 9,185,234 1,695,956 7,489,278
Excess (deficiency) of revenues over (under) expenditures (2,249,798) (720,397) 1,529,401
OTHER FINANCING SOURCES (USES)Transfers in 1,018,531 1,018,531 -Transfers out (82,500) (82,500) -
Total other financing sources (uses) 936,031 936,031 -
Net change in fund balances (1,313,767) 215,634 1,529,401
Fund balances - beginning 1,947,165 2,045,444 98,279Change in inventories of supplies - - -
Fund balances - ending $ 633,398 $ 2,261,078 $ 1,627,680
130
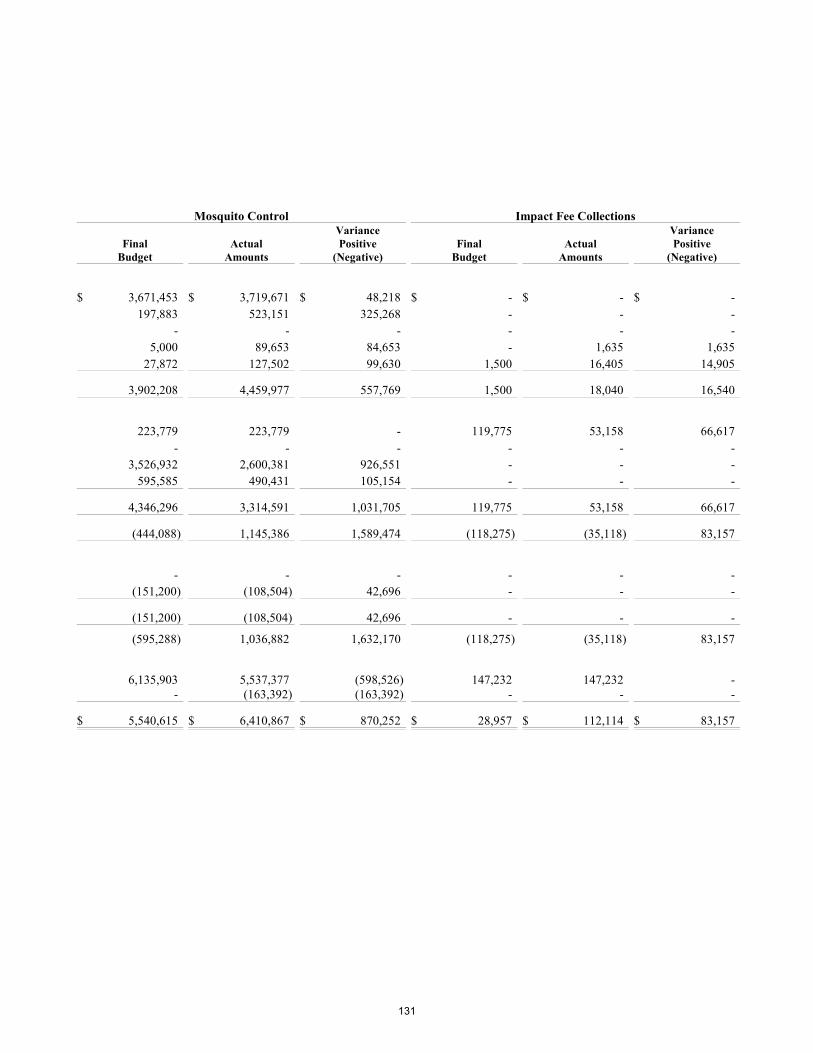
Mosquito Control Impact Fee Collections
FinalBudget
ActualAmounts
VariancePositive
(Negative)Final
BudgetActual
Amounts
VariancePositive
(Negative)
$ 3,671,453 $ 3,719,671 $ 48,218 $ - $ - $ -197,883 523,151 325,268 - - -
- - - - - -5,000 89,653 84,653 - 1,635 1,635
27,872 127,502 99,630 1,500 16,405 14,905
3,902,208 4,459,977 557,769 1,500 18,040 16,540
223,779 223,779 - 119,775 53,158 66,617- - - - - -
3,526,932 2,600,381 926,551 - - -595,585 490,431 105,154 - - -
4,346,296 3,314,591 1,031,705 119,775 53,158 66,617
(444,088) 1,145,386 1,589,474 (118,275) (35,118) 83,157
- - - - - -(151,200) (108,504) 42,696 - - -
(151,200) (108,504) 42,696 - - -
(595,288) 1,036,882 1,632,170 (118,275) (35,118) 83,157
6,135,903 5,537,377 (598,526) 147,232 147,232 -- (163,392) (163,392) - - -
$ 5,540,615 $ 6,410,867 $ 870,252 $ 28,957 $ 112,114 $ 83,157
131
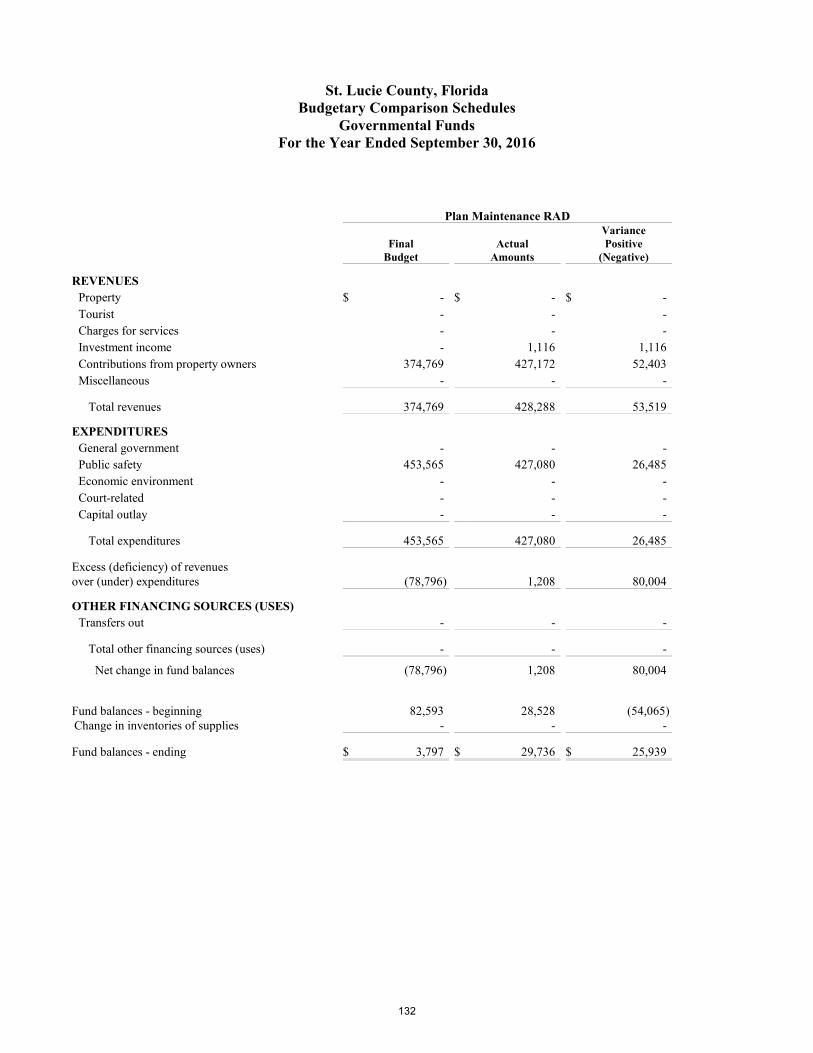
St. Lucie County, FloridaBudgetary Comparison Schedules
Governmental FundsFor the Year Ended September 30, 2016
Plan Maintenance RAD
FinalBudget
ActualAmounts
VariancePositive
(Negative)
REVENUESProperty $ - $ - $ -Tourist - - -Charges for services - - -Investment income - 1,116 1,116Contributions from property owners 374,769 427,172 52,403Miscellaneous - - -
Total revenues 374,769 428,288 53,519
EXPENDITURESGeneral government - - -Public safety 453,565 427,080 26,485Economic environment - - -Court-related - - -Capital outlay - - -
Total expenditures 453,565 427,080 26,485
Excess (deficiency) of revenues over (under) expenditures (78,796) 1,208 80,004
OTHER FINANCING SOURCES (USES)Transfers out - - -
Total other financing sources (uses) - - -
Net change in fund balances (78,796) 1,208 80,004
Fund balances - beginning 82,593 28,528 (54,065)Change in inventories of supplies - - -
Fund balances - ending $ 3,797 $ 29,736 $ 25,939
132
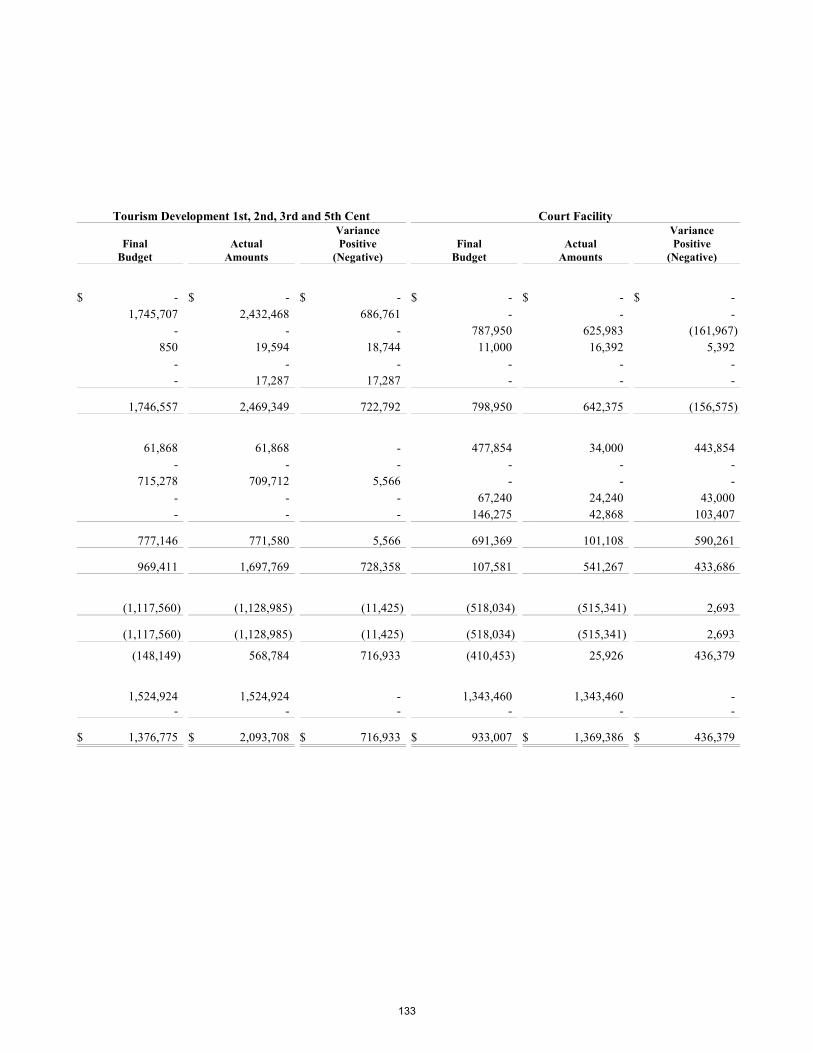
Tourism Development 1st, 2nd, 3rd and 5th Cent Court Facility
FinalBudget
ActualAmounts
VariancePositive
(Negative)Final
BudgetActual
Amounts
VariancePositive
(Negative)
$ - $ - $ - $ - $ - $ -1,745,707 2,432,468 686,761 - - -
- - - 787,950 625,983 (161,967)850 19,594 18,744 11,000 16,392 5,392
- - - - - -- 17,287 17,287 - - -
1,746,557 2,469,349 722,792 798,950 642,375 (156,575)
61,868 61,868 - 477,854 34,000 443,854- - - - - -
715,278 709,712 5,566 - - -- - - 67,240 24,240 43,000- - - 146,275 42,868 103,407
777,146 771,580 5,566 691,369 101,108 590,261
969,411 1,697,769 728,358 107,581 541,267 433,686
(1,117,560) (1,128,985) (11,425) (518,034) (515,341) 2,693
(1,117,560) (1,128,985) (11,425) (518,034) (515,341) 2,693
(148,149) 568,784 716,933 (410,453) 25,926 436,379
1,524,924 1,524,924 - 1,343,460 1,343,460 -- - - - - -
$ 1,376,775 $ 2,093,708 $ 716,933 $ 933,007 $ 1,369,386 $ 436,379
133
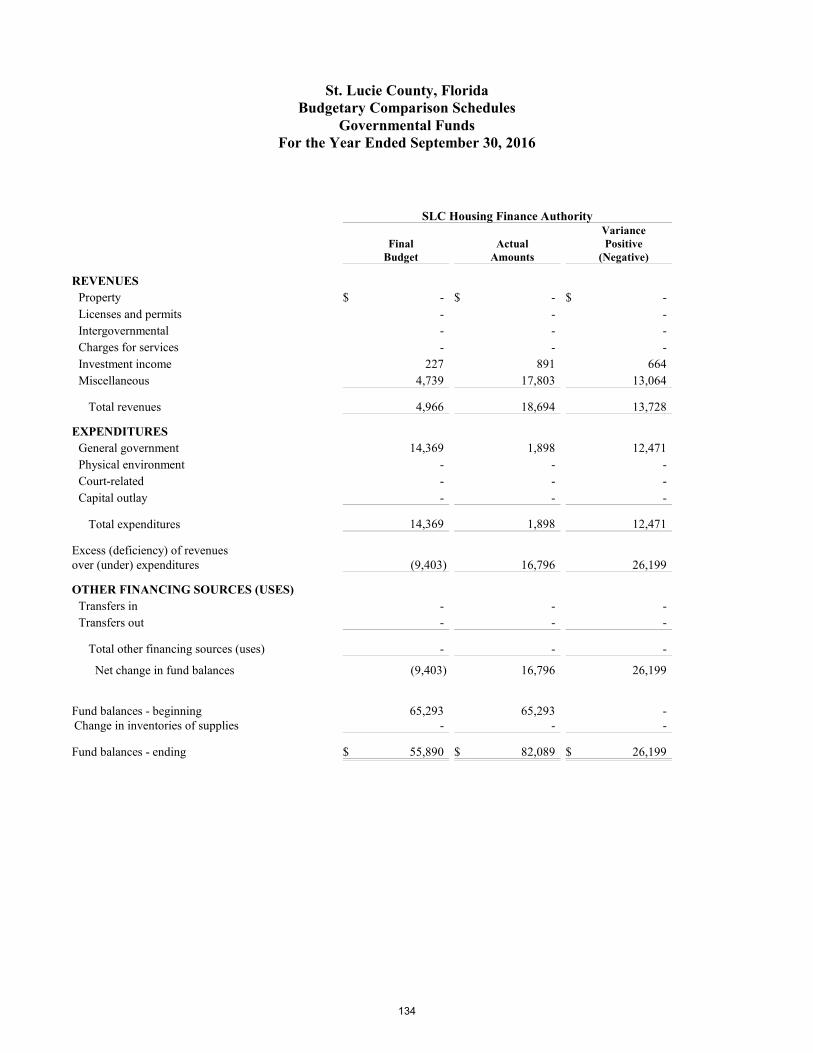
St. Lucie County, FloridaBudgetary Comparison Schedules
Governmental FundsFor the Year Ended September 30, 2016
SLC Housing Finance Authority
FinalBudget
ActualAmounts
VariancePositive
(Negative)
REVENUESProperty $ - $ - $ -Licenses and permits - - -Intergovernmental - - -Charges for services - - -Investment income 227 891 664Miscellaneous 4,739 17,803 13,064
Total revenues 4,966 18,694 13,728
EXPENDITURESGeneral government 14,369 1,898 12,471Physical environment - - -Court-related - - -Capital outlay - - -
Total expenditures 14,369 1,898 12,471
Excess (deficiency) of revenues over (under) expenditures (9,403) 16,796 26,199
OTHER FINANCING SOURCES (USES)Transfers in - - -Transfers out - - -
Total other financing sources (uses) - - -
Net change in fund balances (9,403) 16,796 26,199
Fund balances - beginning 65,293 65,293 -Change in inventories of supplies - - -
Fund balances - ending $ 55,890 $ 82,089 $ 26,199
134
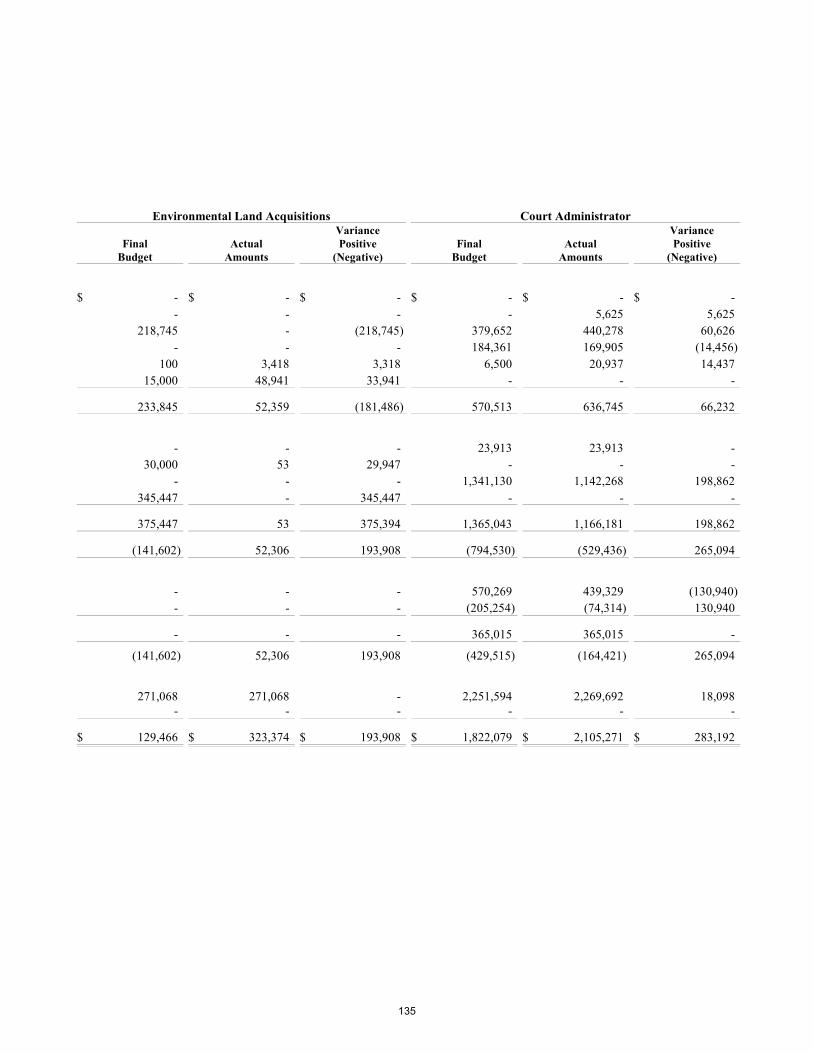
Environmental Land Acquisitions Court Administrator
FinalBudget
ActualAmounts
VariancePositive
(Negative)Final
BudgetActual
Amounts
VariancePositive
(Negative)
$ - $ - $ - $ - $ - $ -- - - - 5,625 5,625
218,745 - (218,745) 379,652 440,278 60,626- - - 184,361 169,905 (14,456)
100 3,418 3,318 6,500 20,937 14,43715,000 48,941 33,941 - - -
233,845 52,359 (181,486) 570,513 636,745 66,232
- - - 23,913 23,913 -30,000 53 29,947 - - -
- - - 1,341,130 1,142,268 198,862345,447 - 345,447 - - -
375,447 53 375,394 1,365,043 1,166,181 198,862
(141,602) 52,306 193,908 (794,530) (529,436) 265,094
- - - 570,269 439,329 (130,940)- - - (205,254) (74,314) 130,940
- - - 365,015 365,015 -
(141,602) 52,306 193,908 (429,515) (164,421) 265,094
271,068 271,068 - 2,251,594 2,269,692 18,098- - - - - -
$ 129,466 $ 323,374 $ 193,908 $ 1,822,079 $ 2,105,271 $ 283,192
135
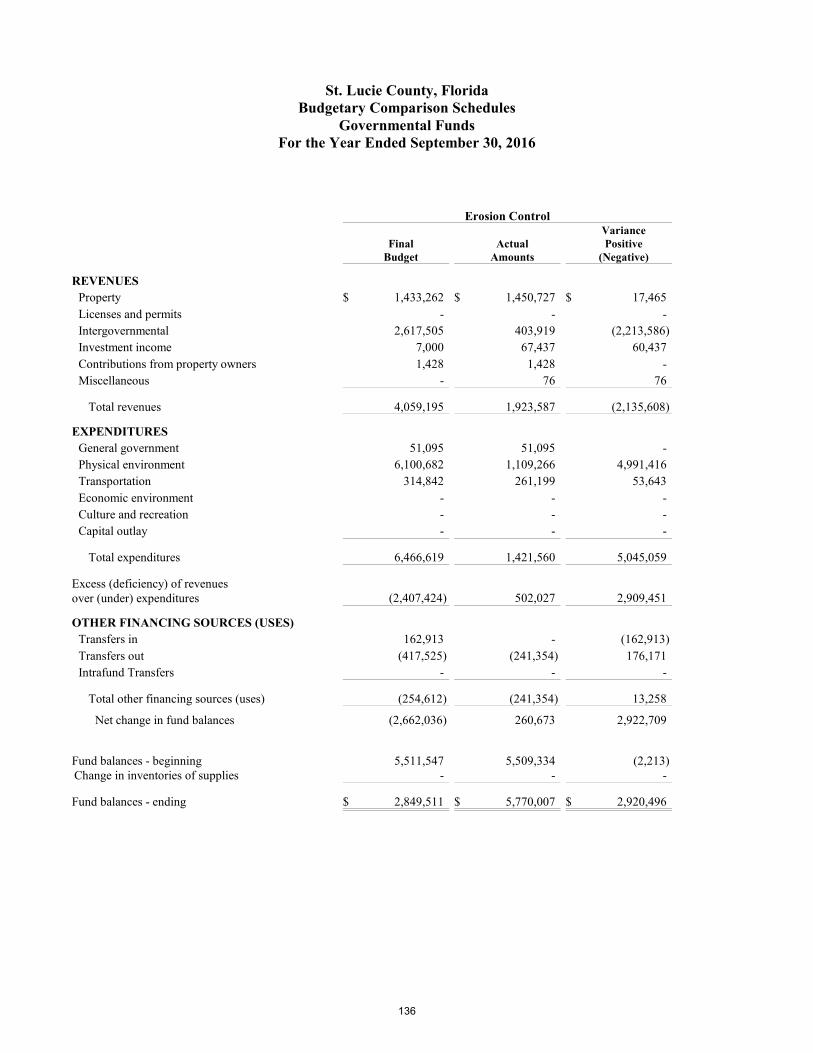
St. Lucie County, FloridaBudgetary Comparison Schedules
Governmental FundsFor the Year Ended September 30, 2016
Erosion Control
FinalBudget
ActualAmounts
VariancePositive
(Negative)
REVENUESProperty $ 1,433,262 $ 1,450,727 $ 17,465Licenses and permits - - -Intergovernmental 2,617,505 403,919 (2,213,586)Investment income 7,000 67,437 60,437Contributions from property owners 1,428 1,428 -Miscellaneous - 76 76
Total revenues 4,059,195 1,923,587 (2,135,608)
EXPENDITURESGeneral government 51,095 51,095 -Physical environment 6,100,682 1,109,266 4,991,416Transportation 314,842 261,199 53,643Economic environment - - -Culture and recreation - - -Capital outlay - - -
Total expenditures 6,466,619 1,421,560 5,045,059
Excess (deficiency) of revenues over (under) expenditures (2,407,424) 502,027 2,909,451
OTHER FINANCING SOURCES (USES)Transfers in 162,913 - (162,913)Transfers out (417,525) (241,354) 176,171Intrafund Transfers - - -
Total other financing sources (uses) (254,612) (241,354) 13,258
Net change in fund balances (2,662,036) 260,673 2,922,709
Fund balances - beginning 5,511,547 5,509,334 (2,213)Change in inventories of supplies - - -
Fund balances - ending $ 2,849,511 $ 5,770,007 $ 2,920,496
136
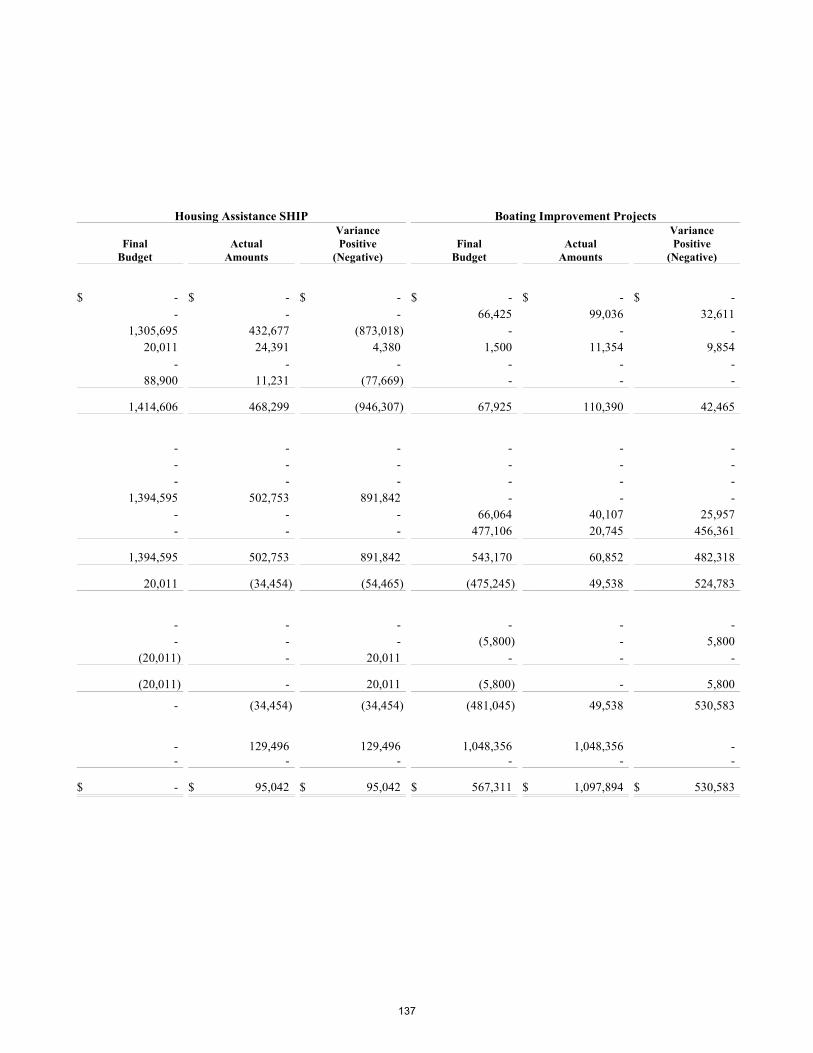
Housing Assistance SHIP Boating Improvement Projects
FinalBudget
ActualAmounts
VariancePositive
(Negative)Final
BudgetActual
Amounts
VariancePositive
(Negative)
$ - $ - $ - $ - $ - $ -- - - 66,425 99,036 32,611
1,305,695 432,677 (873,018) - - -20,011 24,391 4,380 1,500 11,354 9,854
- - - - - -88,900 11,231 (77,669) - - -
1,414,606 468,299 (946,307) 67,925 110,390 42,465
- - - - - -- - - - - -- - - - - -
1,394,595 502,753 891,842 - - -- - - 66,064 40,107 25,957- - - 477,106 20,745 456,361
1,394,595 502,753 891,842 543,170 60,852 482,318
20,011 (34,454) (54,465) (475,245) 49,538 524,783
- - - - - -- - - (5,800) - 5,800
(20,011) - 20,011 - - -
(20,011) - 20,011 (5,800) - 5,800
- (34,454) (34,454) (481,045) 49,538 530,583
- 129,496 129,496 1,048,356 1,048,356 -- - - - - -
$ - $ 95,042 $ 95,042 $ 567,311 $ 1,097,894 $ 530,583
137
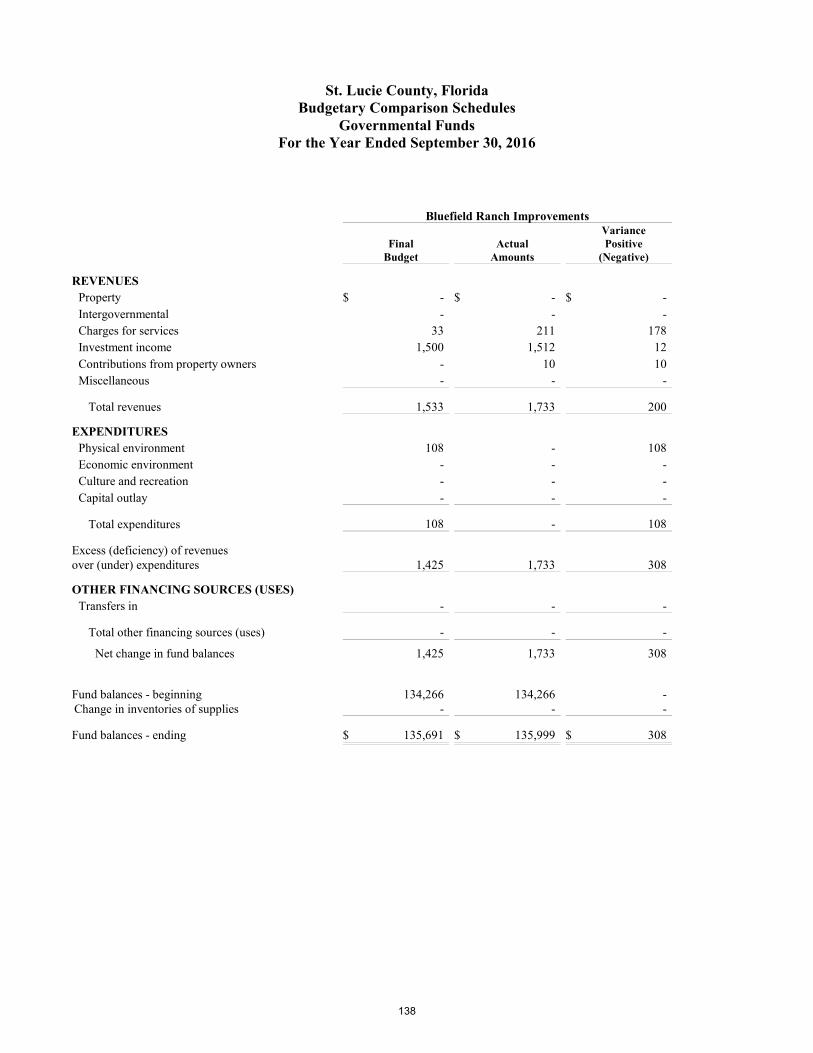
St. Lucie County, FloridaBudgetary Comparison Schedules
Governmental FundsFor the Year Ended September 30, 2016
Bluefield Ranch Improvements
FinalBudget
ActualAmounts
VariancePositive
(Negative)
REVENUESProperty $ - $ - $ -Intergovernmental - - -Charges for services 33 211 178Investment income 1,500 1,512 12Contributions from property owners - 10 10Miscellaneous - - -
Total revenues 1,533 1,733 200
EXPENDITURESPhysical environment 108 - 108Economic environment - - -Culture and recreation - - -Capital outlay - - -
Total expenditures 108 - 108
Excess (deficiency) of revenues over (under) expenditures 1,425 1,733 308
OTHER FINANCING SOURCES (USES)Transfers in - - -
Total other financing sources (uses) - - -
Net change in fund balances 1,425 1,733 308
Fund balances - beginning 134,266 134,266 -Change in inventories of supplies - - -
Fund balances - ending $ 135,691 $ 135,999 $ 308
138
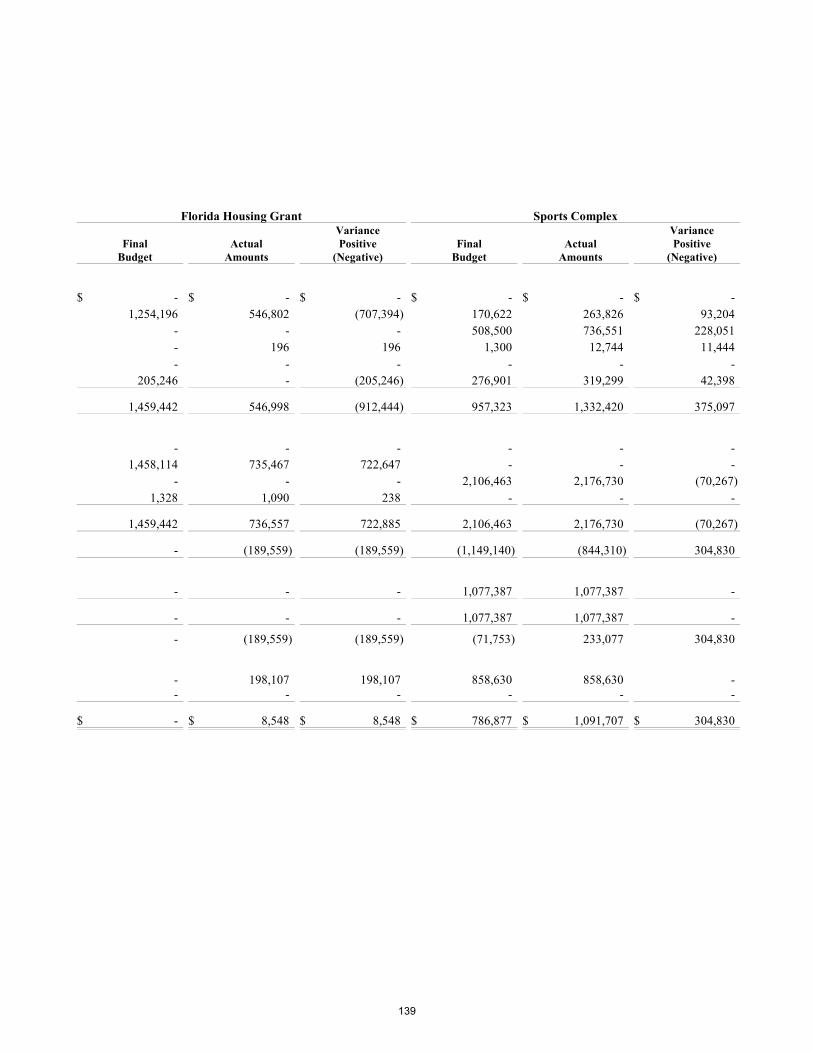
Florida Housing Grant Sports Complex
FinalBudget
ActualAmounts
VariancePositive
(Negative)Final
BudgetActual
Amounts
VariancePositive
(Negative)
$ - $ - $ - $ - $ - $ -1,254,196 546,802 (707,394) 170,622 263,826 93,204
- - - 508,500 736,551 228,051- 196 196 1,300 12,744 11,444- - - - - -
205,246 - (205,246) 276,901 319,299 42,398
1,459,442 546,998 (912,444) 957,323 1,332,420 375,097
- - - - - -1,458,114 735,467 722,647 - - -
- - - 2,106,463 2,176,730 (70,267)1,328 1,090 238 - - -
1,459,442 736,557 722,885 2,106,463 2,176,730 (70,267)
- (189,559) (189,559) (1,149,140) (844,310) 304,830
- - - 1,077,387 1,077,387 -
- - - 1,077,387 1,077,387 -
- (189,559) (189,559) (71,753) 233,077 304,830
- 198,107 198,107 858,630 858,630 -- - - - - -
$ - $ 8,548 $ 8,548 $ 786,877 $ 1,091,707 $ 304,830
139
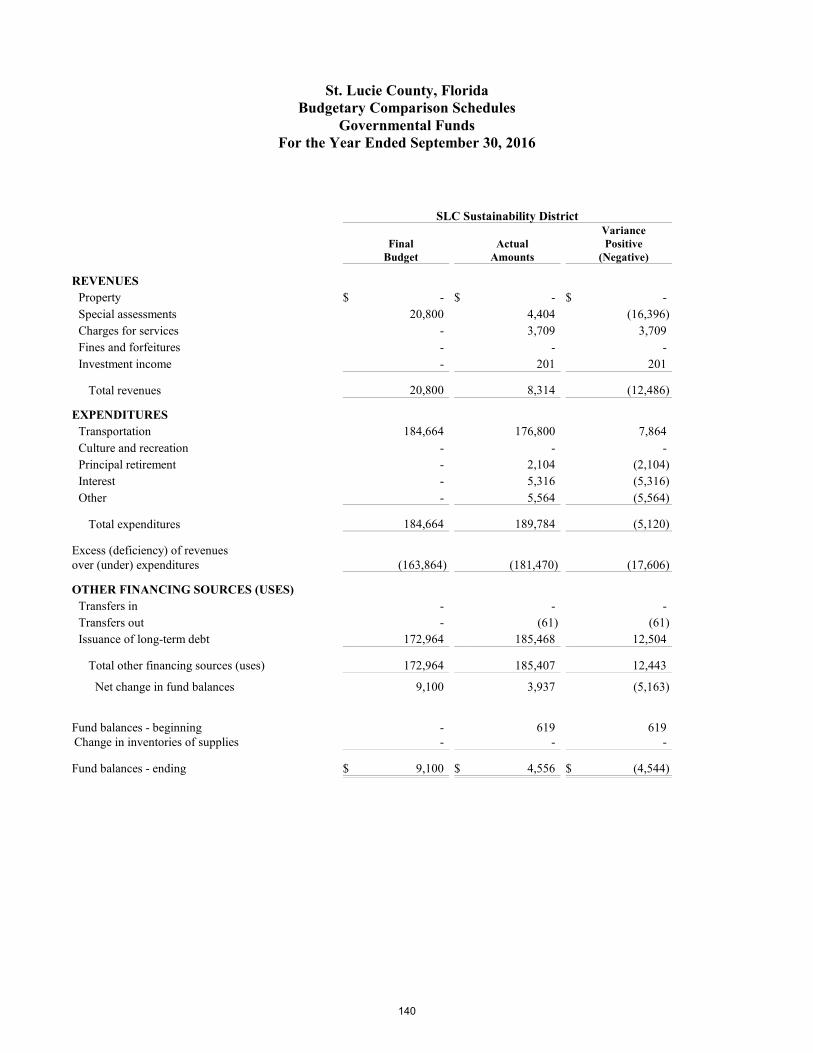
St. Lucie County, FloridaBudgetary Comparison Schedules
Governmental FundsFor the Year Ended September 30, 2016
SLC Sustainability District
FinalBudget
ActualAmounts
VariancePositive
(Negative)
REVENUESProperty $ - $ - $ -Special assessments 20,800 4,404 (16,396)Charges for services - 3,709 3,709Fines and forfeitures - - -Investment income - 201 201
Total revenues 20,800 8,314 (12,486)
EXPENDITURESTransportation 184,664 176,800 7,864Culture and recreation - - -Principal retirement - 2,104 (2,104)Interest - 5,316 (5,316)Other - 5,564 (5,564)
Total expenditures 184,664 189,784 (5,120)
Excess (deficiency) of revenues over (under) expenditures (163,864) (181,470) (17,606)
OTHER FINANCING SOURCES (USES)Transfers in - - -Transfers out - (61) (61)Issuance of long-term debt 172,964 185,468 12,504
Total other financing sources (uses) 172,964 185,407 12,443
Net change in fund balances 9,100 3,937 (5,163)
Fund balances - beginning - 619 619Change in inventories of supplies - - -
Fund balances - ending $ 9,100 $ 4,556 $ (4,544)
140
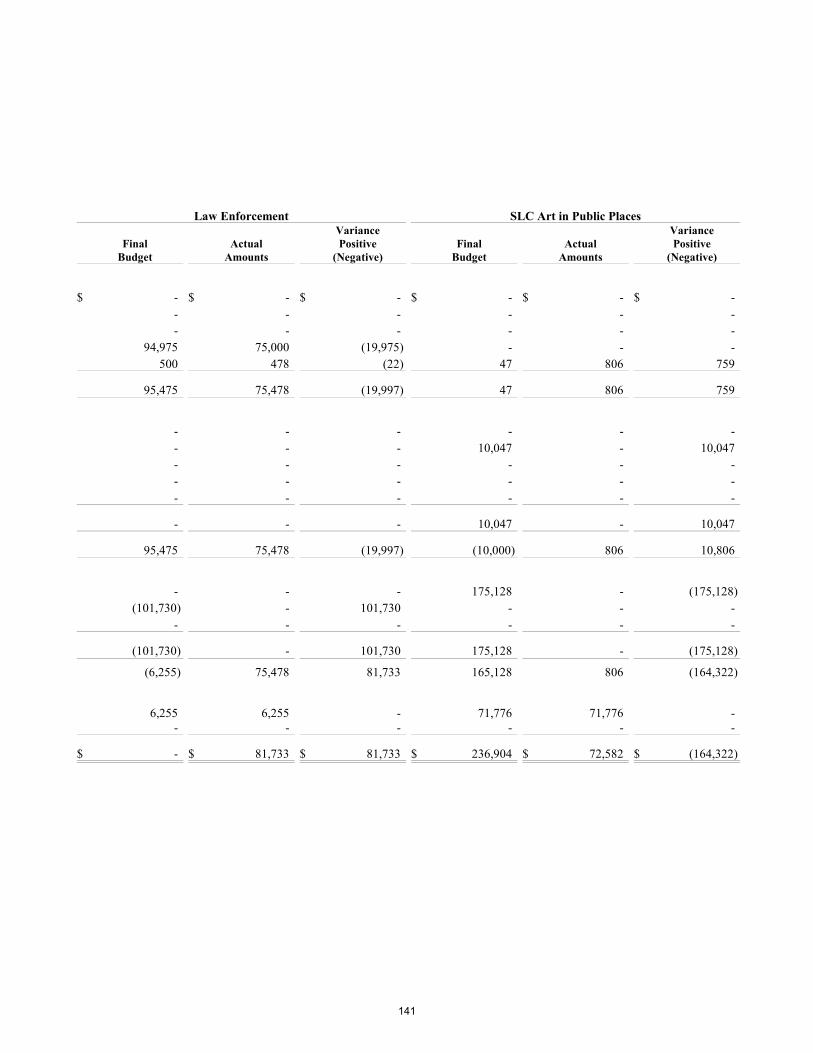
Law Enforcement SLC Art in Public Places
FinalBudget
ActualAmounts
VariancePositive
(Negative)Final
BudgetActual
Amounts
VariancePositive
(Negative)
$ - $ - $ - $ - $ - $ -- - - - - -- - - - - -
94,975 75,000 (19,975) - - -500 478 (22) 47 806 759
95,475 75,478 (19,997) 47 806 759
- - - - - -- - - 10,047 - 10,047- - - - - -- - - - - -- - - - - -
- - - 10,047 - 10,047
95,475 75,478 (19,997) (10,000) 806 10,806
- - - 175,128 - (175,128)(101,730) - 101,730 - - -
- - - - - -
(101,730) - 101,730 175,128 - (175,128)
(6,255) 75,478 81,733 165,128 806 (164,322)
6,255 6,255 - 71,776 71,776 -- - - - - -
$ - $ 81,733 $ 81,733 $ 236,904 $ 72,582 $ (164,322)
141
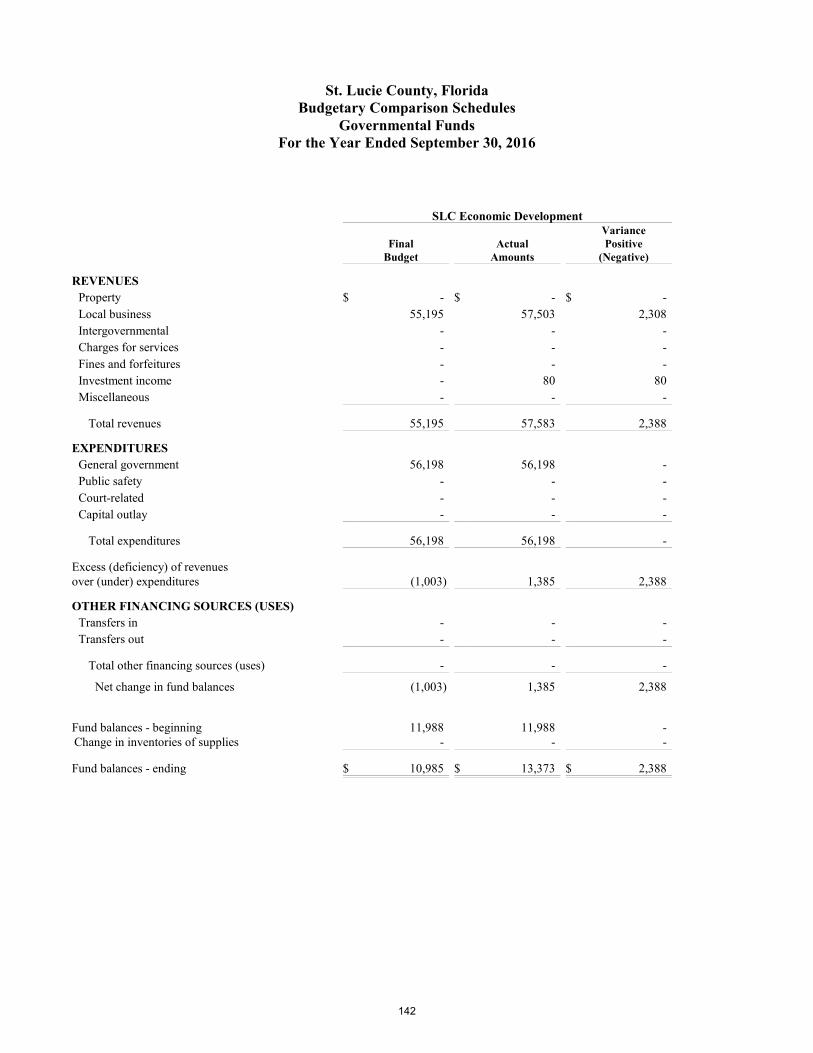
St. Lucie County, FloridaBudgetary Comparison Schedules
Governmental FundsFor the Year Ended September 30, 2016
SLC Economic Development
FinalBudget
ActualAmounts
VariancePositive
(Negative)
REVENUESProperty $ - $ - $ -Local business 55,195 57,503 2,308Intergovernmental - - -Charges for services - - -Fines and forfeitures - - -Investment income - 80 80Miscellaneous - - -
Total revenues 55,195 57,583 2,388
EXPENDITURESGeneral government 56,198 56,198 -Public safety - - -Court-related - - -Capital outlay - - -
Total expenditures 56,198 56,198 -
Excess (deficiency) of revenues over (under) expenditures (1,003) 1,385 2,388
OTHER FINANCING SOURCES (USES)Transfers in - - -Transfers out - - -
Total other financing sources (uses) - - -
Net change in fund balances (1,003) 1,385 2,388
Fund balances - beginning 11,988 11,988 -Change in inventories of supplies - - -
Fund balances - ending $ 10,985 $ 13,373 $ 2,388
142
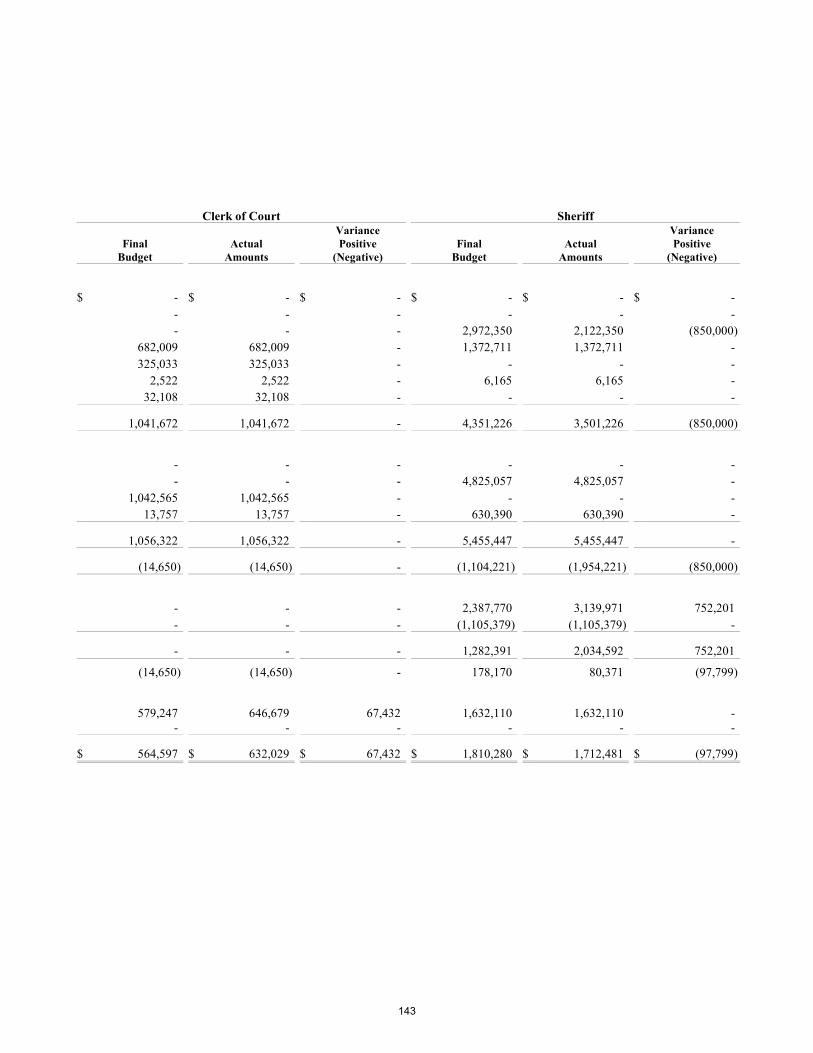
Clerk of Court Sheriff
FinalBudget
ActualAmounts
VariancePositive
(Negative)Final
BudgetActual
Amounts
VariancePositive
(Negative)
$ - $ - $ - $ - $ - $ -- - - - - -- - - 2,972,350 2,122,350 (850,000)
682,009 682,009 - 1,372,711 1,372,711 -325,033 325,033 - - - -
2,522 2,522 - 6,165 6,165 -32,108 32,108 - - - -
1,041,672 1,041,672 - 4,351,226 3,501,226 (850,000)
- - - - - -- - - 4,825,057 4,825,057 -
1,042,565 1,042,565 - - - -13,757 13,757 - 630,390 630,390 -
1,056,322 1,056,322 - 5,455,447 5,455,447 -
(14,650) (14,650) - (1,104,221) (1,954,221) (850,000)
- - - 2,387,770 3,139,971 752,201- - - (1,105,379) (1,105,379) -
- - - 1,282,391 2,034,592 752,201
(14,650) (14,650) - 178,170 80,371 (97,799)
579,247 646,679 67,432 1,632,110 1,632,110 -- - - - - -
$ 564,597 $ 632,029 $ 67,432 $ 1,810,280 $ 1,712,481 $ (97,799)
143
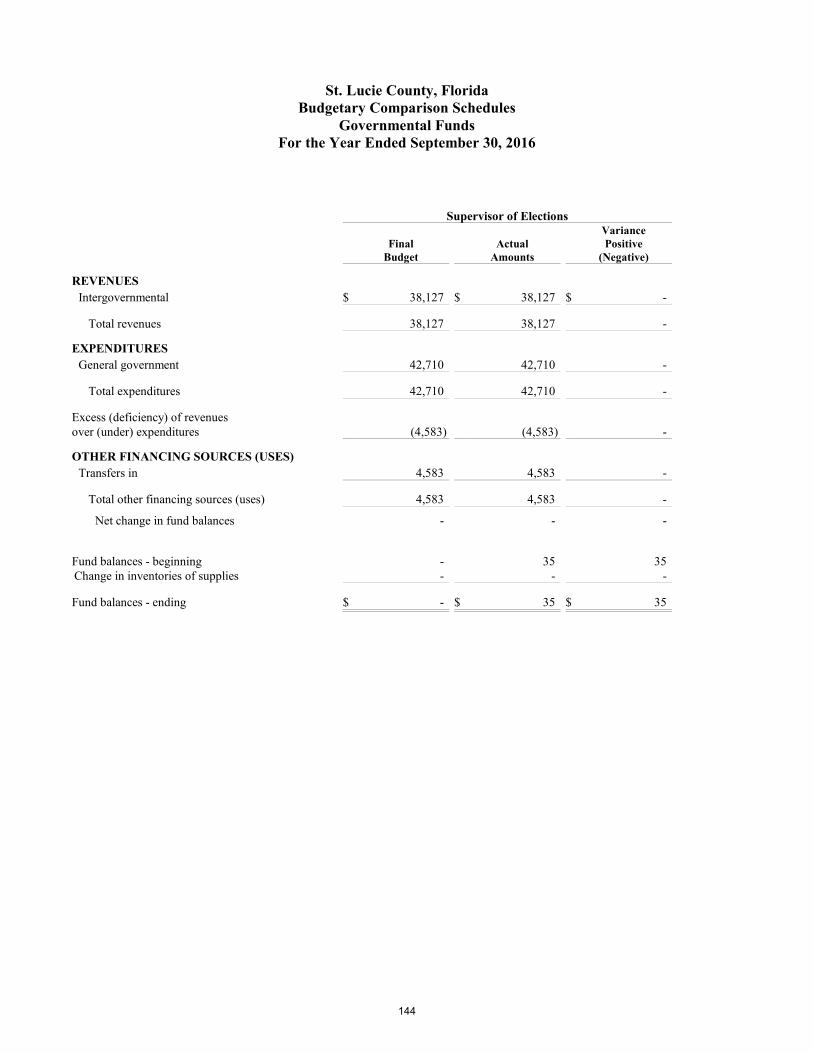
St. Lucie County, FloridaBudgetary Comparison Schedules
Governmental FundsFor the Year Ended September 30, 2016
Supervisor of Elections
FinalBudget
ActualAmounts
VariancePositive
(Negative)
REVENUESIntergovernmental $ 38,127 $ 38,127 $ -
Total revenues 38,127 38,127 -
EXPENDITURESGeneral government 42,710 42,710 -
Total expenditures 42,710 42,710 -
Excess (deficiency) of revenues over (under) expenditures (4,583) (4,583) -
OTHER FINANCING SOURCES (USES)Transfers in 4,583 4,583 -
Total other financing sources (uses) 4,583 4,583 -
Net change in fund balances - - -
Fund balances - beginning - 35 35Change in inventories of supplies - - -
Fund balances - ending $ - $ 35 $ 35
144

THIS PAGE INTENTIONALLY LEFT BLANK
145145
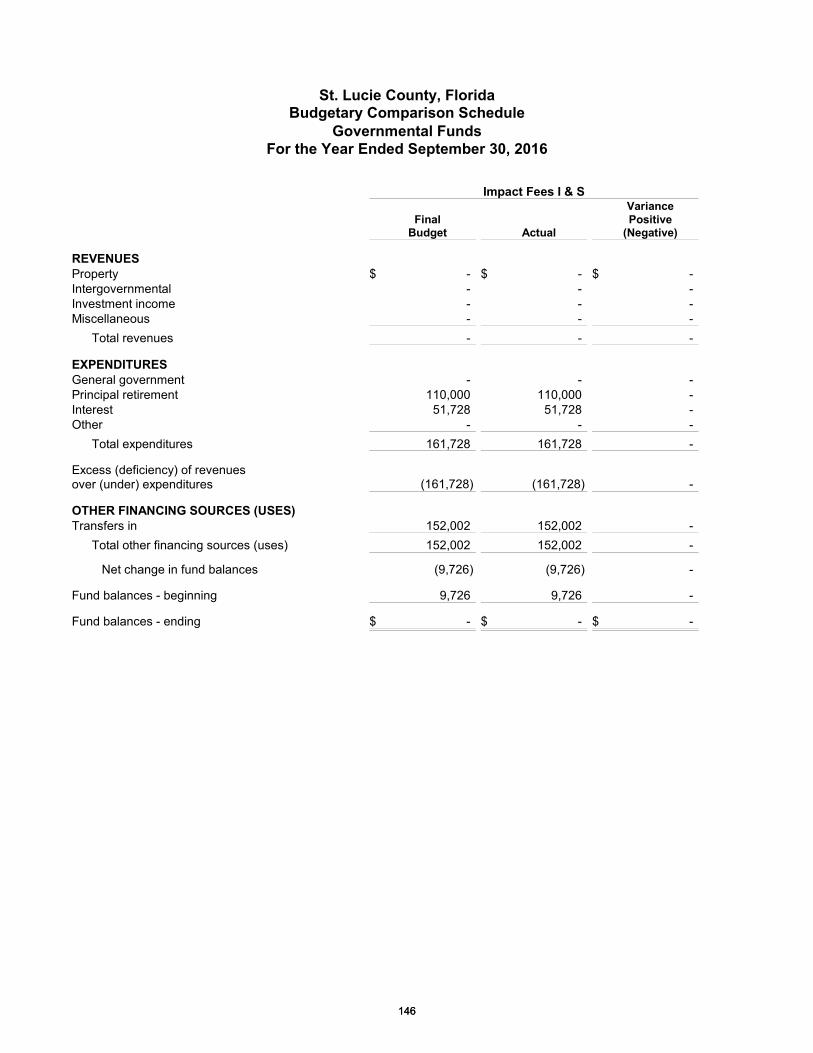
St. Lucie County, FloridaBudgetary Comparison Schedule
Governmental FundsFor the Year Ended September 30, 2016
Impact Fees I & S
FinalBudget Actual
VariancePositive
(Negative)
REVENUESProperty $ - $ - $ -Intergovernmental - - -Investment income - - -Miscellaneous - - -
Total revenues - - -
EXPENDITURESGeneral government - - -Principal retirement 110,000 110,000 -Interest 51,728 51,728 -Other - - -
Total expenditures 161,728 161,728 -
Excess (deficiency) of revenuesover (under) expenditures (161,728) (161,728) -
OTHER FINANCING SOURCES (USES)Transfers in 152,002 152,002 -
Total other financing sources (uses) 152,002 152,002 -
Net change in fund balances (9,726) (9,726) -
Fund balances - beginning 9,726 9,726 -
Fund balances - ending $ - $ - $ -
146146
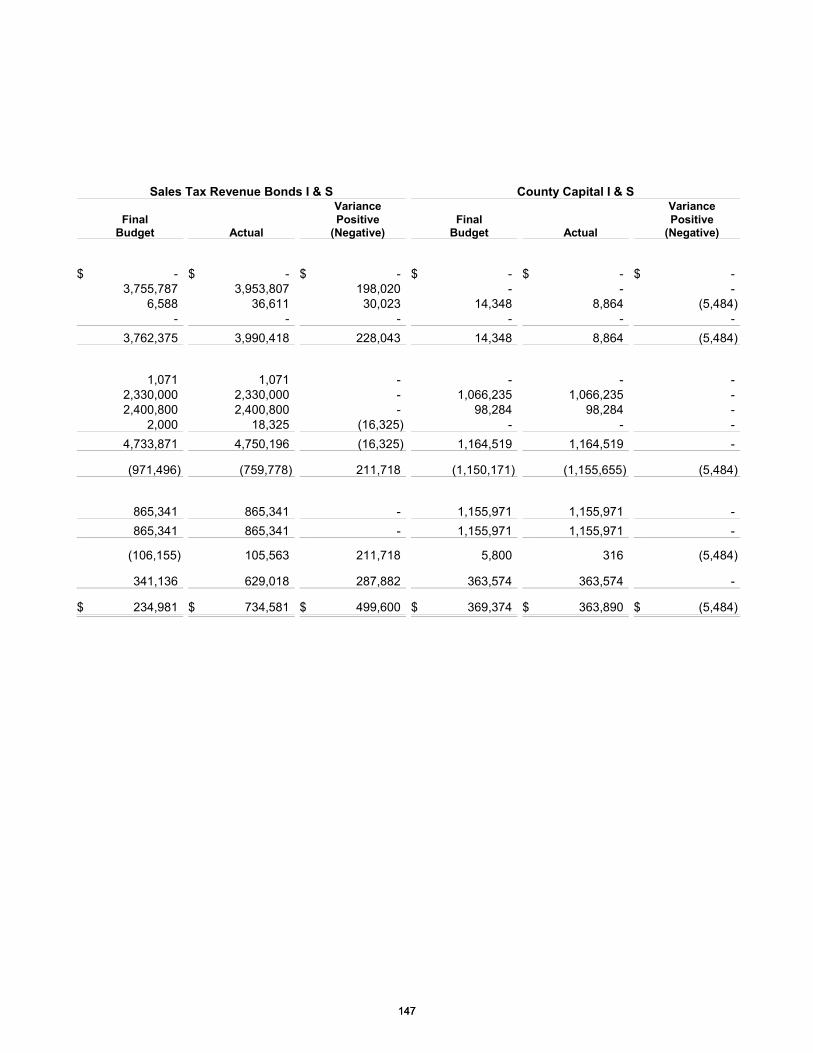
Sales Tax Revenue Bonds I & S County Capital I & S
FinalBudget Actual
VariancePositive
(Negative)Final
Budget Actual
VariancePositive
(Negative)
$ - $ - $ - $ - $ - $ -3,755,787 3,953,807 198,020 - - -
6,588 36,611 30,023 14,348 8,864 (5,484)- - - - - -
3,762,375 3,990,418 228,043 14,348 8,864 (5,484)
1,071 1,071 - - - -2,330,000 2,330,000 - 1,066,235 1,066,235 -2,400,800 2,400,800 - 98,284 98,284 -
2,000 18,325 (16,325) - - -4,733,871 4,750,196 (16,325) 1,164,519 1,164,519 -
(971,496) (759,778) 211,718 (1,150,171) (1,155,655) (5,484)
865,341 865,341 - 1,155,971 1,155,971 -865,341 865,341 - 1,155,971 1,155,971 -
(106,155) 105,563 211,718 5,800 316 (5,484)
341,136 629,018 287,882 363,574 363,574 -
$ 234,981 $ 734,581 $ 499,600 $ 369,374 $ 363,890 $ (5,484)
147147
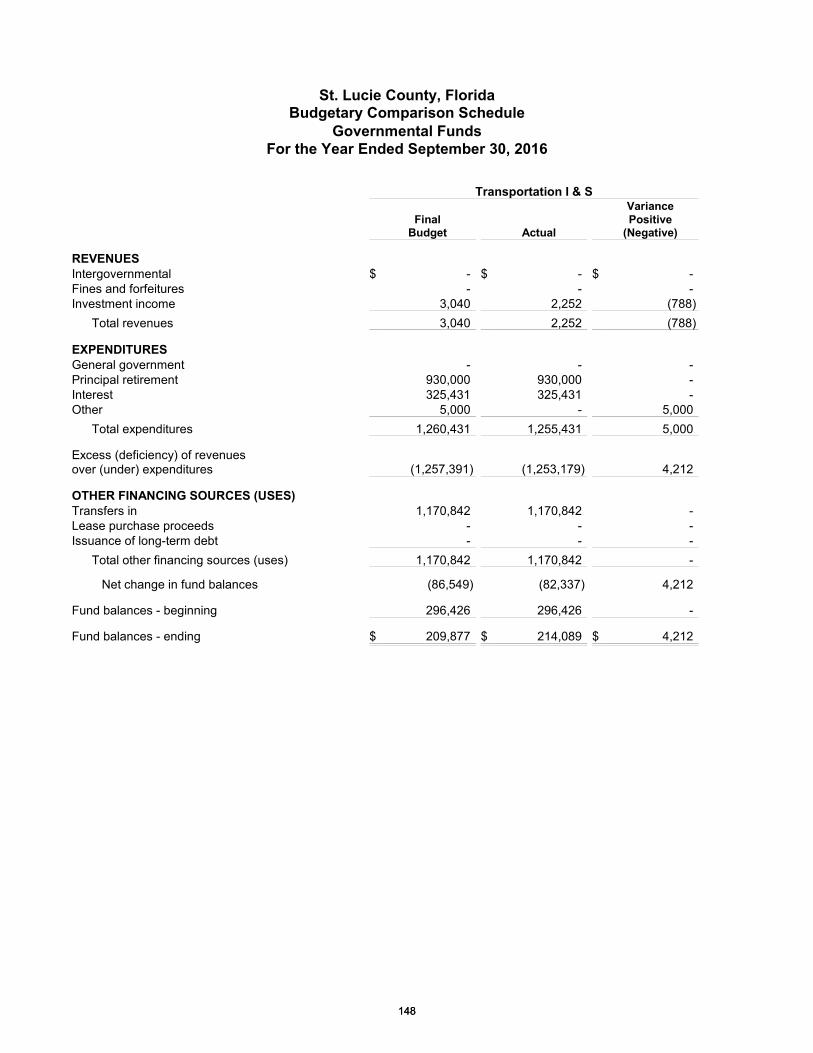
St. Lucie County, FloridaBudgetary Comparison Schedule
Governmental FundsFor the Year Ended September 30, 2016
Transportation I & S
FinalBudget Actual
VariancePositive
(Negative)
REVENUESIntergovernmental $ - $ - $ -Fines and forfeitures - - -Investment income 3,040 2,252 (788)
Total revenues 3,040 2,252 (788)
EXPENDITURESGeneral government - - -Principal retirement 930,000 930,000 -Interest 325,431 325,431 -Other 5,000 - 5,000
Total expenditures 1,260,431 1,255,431 5,000
Excess (deficiency) of revenuesover (under) expenditures (1,257,391) (1,253,179) 4,212
OTHER FINANCING SOURCES (USES)Transfers in 1,170,842 1,170,842 -Lease purchase proceeds - - -Issuance of long-term debt - - -
Total other financing sources (uses) 1,170,842 1,170,842 -
Net change in fund balances (86,549) (82,337) 4,212
Fund balances - beginning 296,426 296,426 -
Fund balances - ending $ 209,877 $ 214,089 $ 4,212
148148
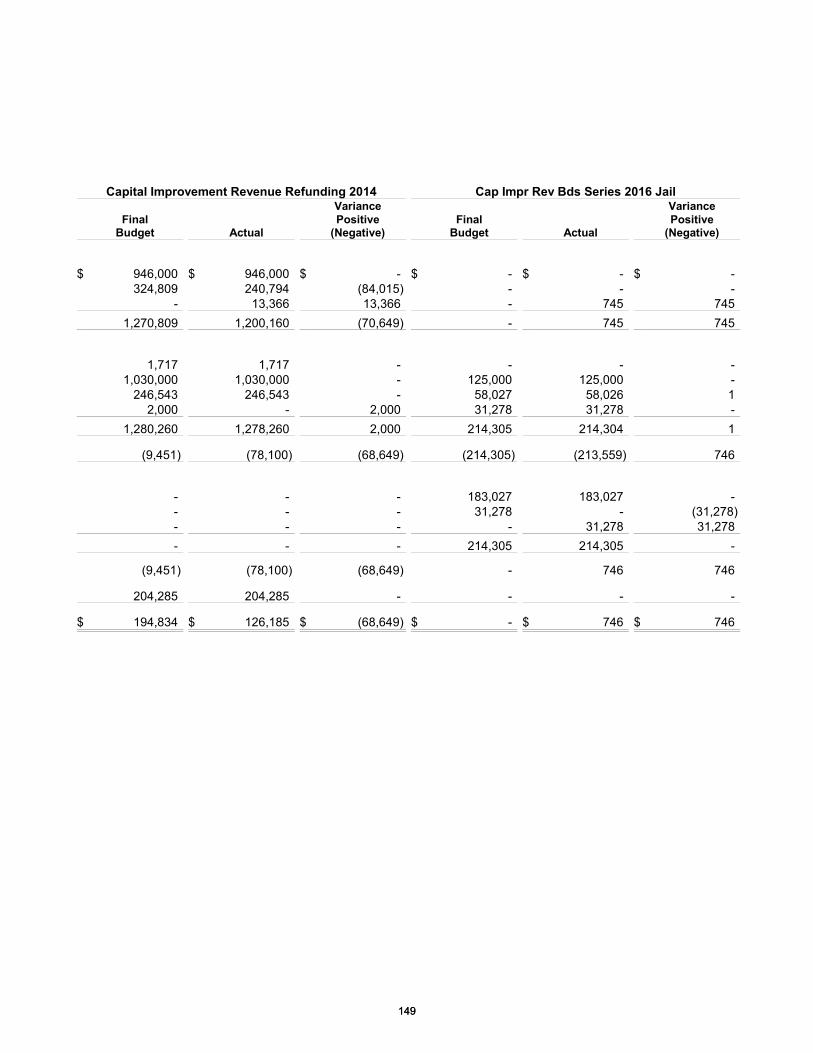
Capital Improvement Revenue Refunding 2014 Cap Impr Rev Bds Series 2016 Jail
FinalBudget Actual
VariancePositive
(Negative)Final
Budget Actual
VariancePositive
(Negative)
$ 946,000 $ 946,000 $ - $ - $ - $ -324,809 240,794 (84,015) - - -
- 13,366 13,366 - 745 7451,270,809 1,200,160 (70,649) - 745 745
1,717 1,717 - - - -1,030,000 1,030,000 - 125,000 125,000 -
246,543 246,543 - 58,027 58,026 12,000 - 2,000 31,278 31,278 -
1,280,260 1,278,260 2,000 214,305 214,304 1
(9,451) (78,100) (68,649) (214,305) (213,559) 746
- - - 183,027 183,027 -- - - 31,278 - (31,278)- - - - 31,278 31,278- - - 214,305 214,305 -
(9,451) (78,100) (68,649) - 746 746
204,285 204,285 - - - -
$ 194,834 $ 126,185 $ (68,649) $ - $ 746 $ 746
149149
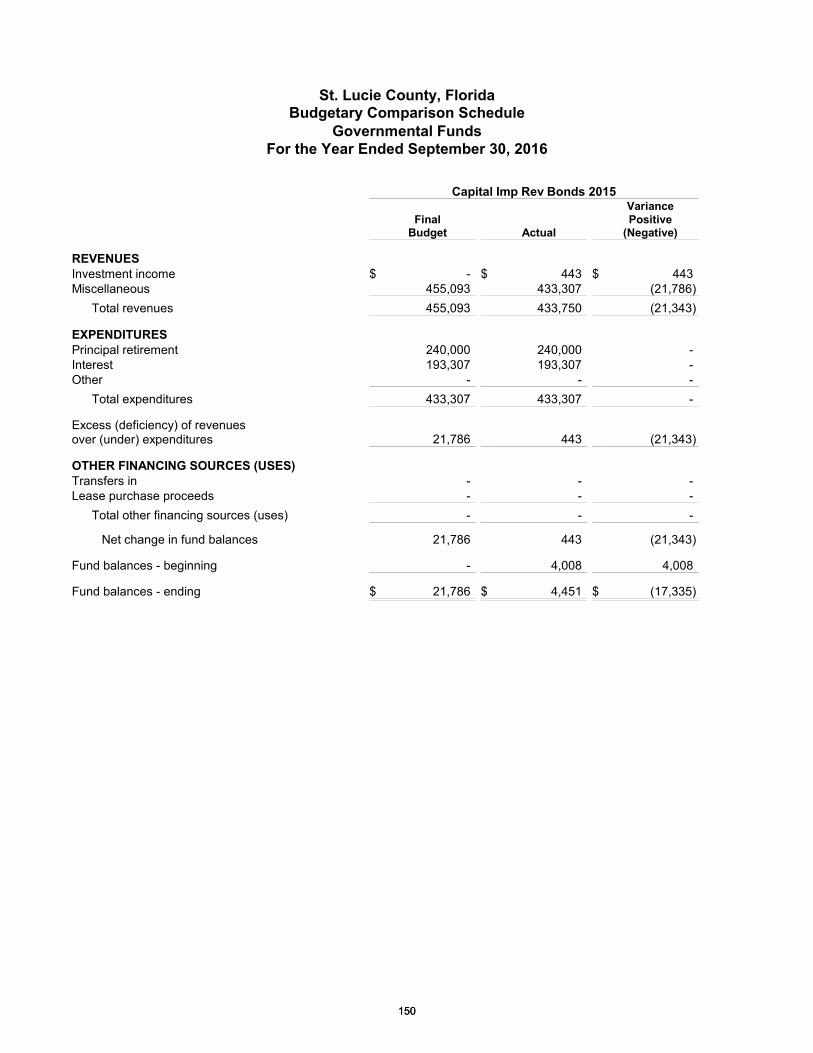
St. Lucie County, FloridaBudgetary Comparison Schedule
Governmental FundsFor the Year Ended September 30, 2016
Capital Imp Rev Bonds 2015
FinalBudget Actual
VariancePositive
(Negative)
REVENUESInvestment income $ - $ 443 $ 443Miscellaneous 455,093 433,307 (21,786)
Total revenues 455,093 433,750 (21,343)
EXPENDITURESPrincipal retirement 240,000 240,000 -Interest 193,307 193,307 -Other - - -
Total expenditures 433,307 433,307 -
Excess (deficiency) of revenuesover (under) expenditures 21,786 443 (21,343)
OTHER FINANCING SOURCES (USES)Transfers in - - -Lease purchase proceeds - - -
Total other financing sources (uses) - - -
Net change in fund balances 21,786 443 (21,343)
Fund balances - beginning - 4,008 4,008
Fund balances - ending $ 21,786 $ 4,451 $ (17,335)
150150
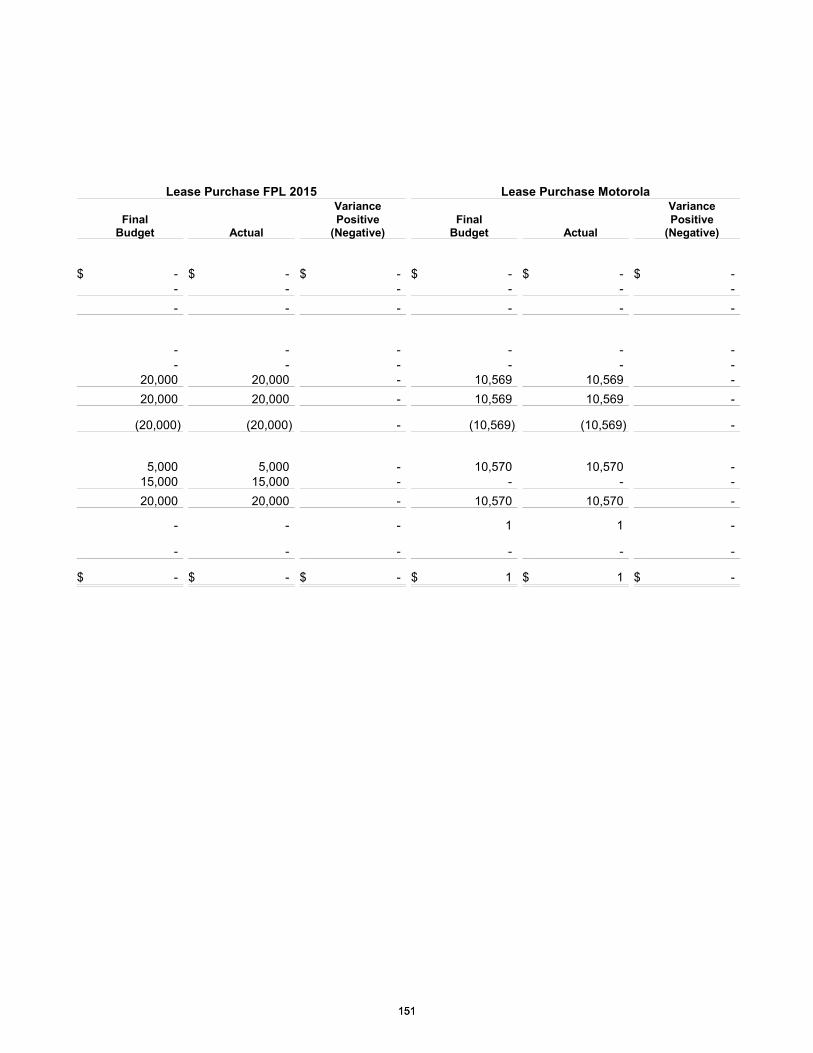
Lease Purchase FPL 2015 Lease Purchase Motorola
FinalBudget Actual
VariancePositive
(Negative)Final
Budget Actual
VariancePositive
(Negative)
$ - $ - $ - $ - $ - $ -- - - - - -- - - - - -
- - - - - -- - - - - -
20,000 20,000 - 10,569 10,569 -20,000 20,000 - 10,569 10,569 -
(20,000) (20,000) - (10,569) (10,569) -
5,000 5,000 - 10,570 10,570 -15,000 15,000 - - - -20,000 20,000 - 10,570 10,570 -
- - - 1 1 -
- - - - - -
$ - $ - $ - $ 1 $ 1 $ -
151151
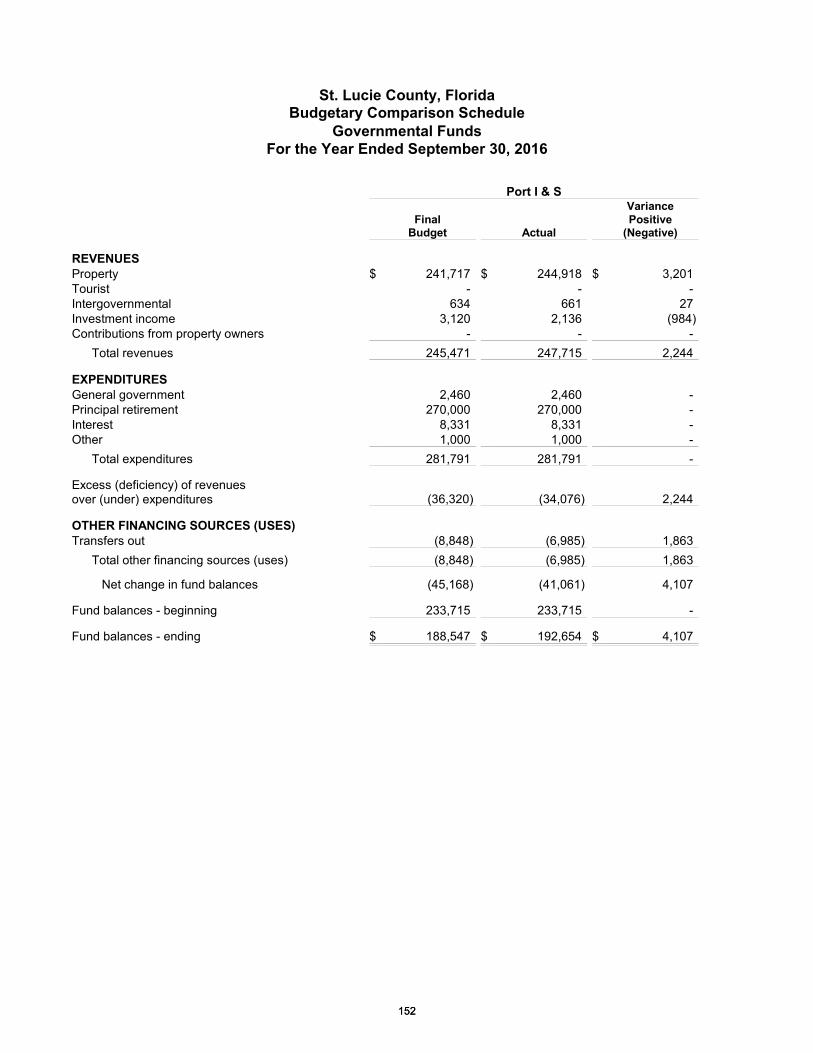
St. Lucie County, FloridaBudgetary Comparison Schedule
Governmental FundsFor the Year Ended September 30, 2016
Port I & S
FinalBudget Actual
VariancePositive
(Negative)
REVENUESProperty $ 241,717 $ 244,918 $ 3,201Tourist - - -Intergovernmental 634 661 27Investment income 3,120 2,136 (984)Contributions from property owners - - -
Total revenues 245,471 247,715 2,244
EXPENDITURESGeneral government 2,460 2,460 -Principal retirement 270,000 270,000 -Interest 8,331 8,331 -Other 1,000 1,000 -
Total expenditures 281,791 281,791 -
Excess (deficiency) of revenuesover (under) expenditures (36,320) (34,076) 2,244
OTHER FINANCING SOURCES (USES)Transfers out (8,848) (6,985) 1,863
Total other financing sources (uses) (8,848) (6,985) 1,863
Net change in fund balances (45,168) (41,061) 4,107
Fund balances - beginning 233,715 233,715 -
Fund balances - ending $ 188,547 $ 192,654 $ 4,107
152152
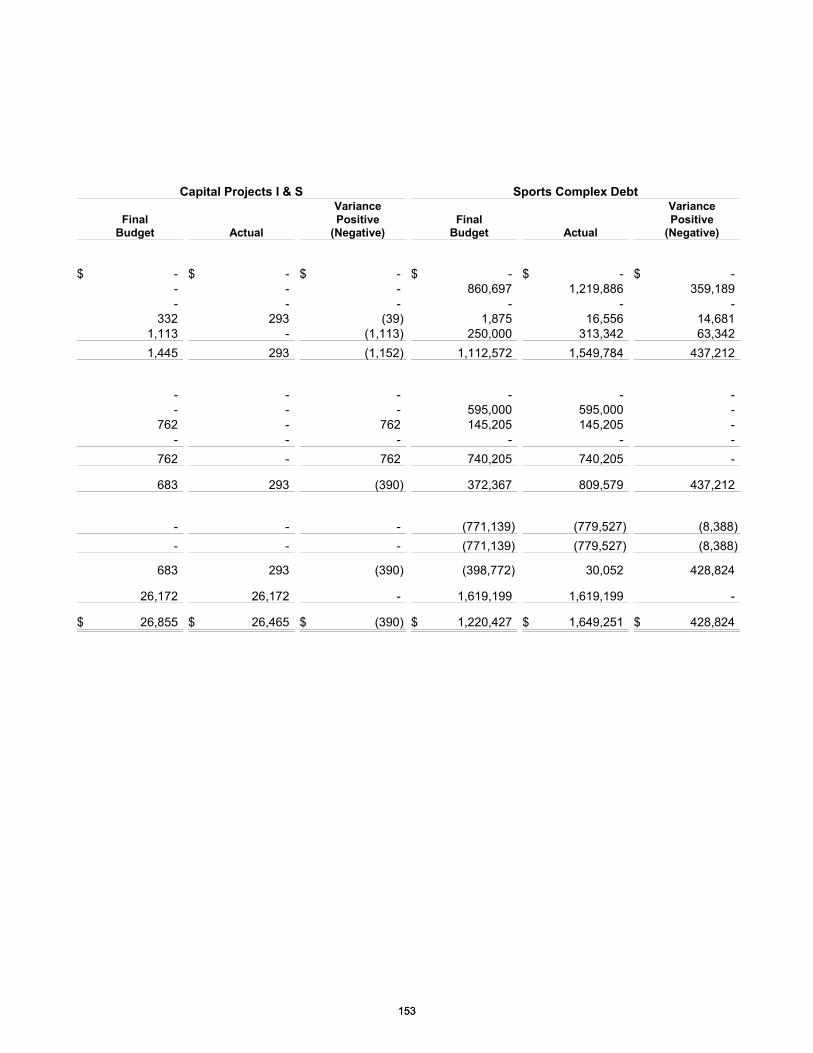
Capital Projects I & S Sports Complex Debt
FinalBudget Actual
VariancePositive
(Negative)Final
Budget Actual
VariancePositive
(Negative)
$ - $ - $ - $ - $ - $ -- - - 860,697 1,219,886 359,189- - - - - -
332 293 (39) 1,875 16,556 14,6811,113 - (1,113) 250,000 313,342 63,3421,445 293 (1,152) 1,112,572 1,549,784 437,212
- - - - - -- - - 595,000 595,000 -
762 - 762 145,205 145,205 -- - - - - -
762 - 762 740,205 740,205 -
683 293 (390) 372,367 809,579 437,212
- - - (771,139) (779,527) (8,388)- - - (771,139) (779,527) (8,388)
683 293 (390) (398,772) 30,052 428,824
26,172 26,172 - 1,619,199 1,619,199 -
$ 26,855 $ 26,465 $ (390) $ 1,220,427 $ 1,649,251 $ 428,824
153153
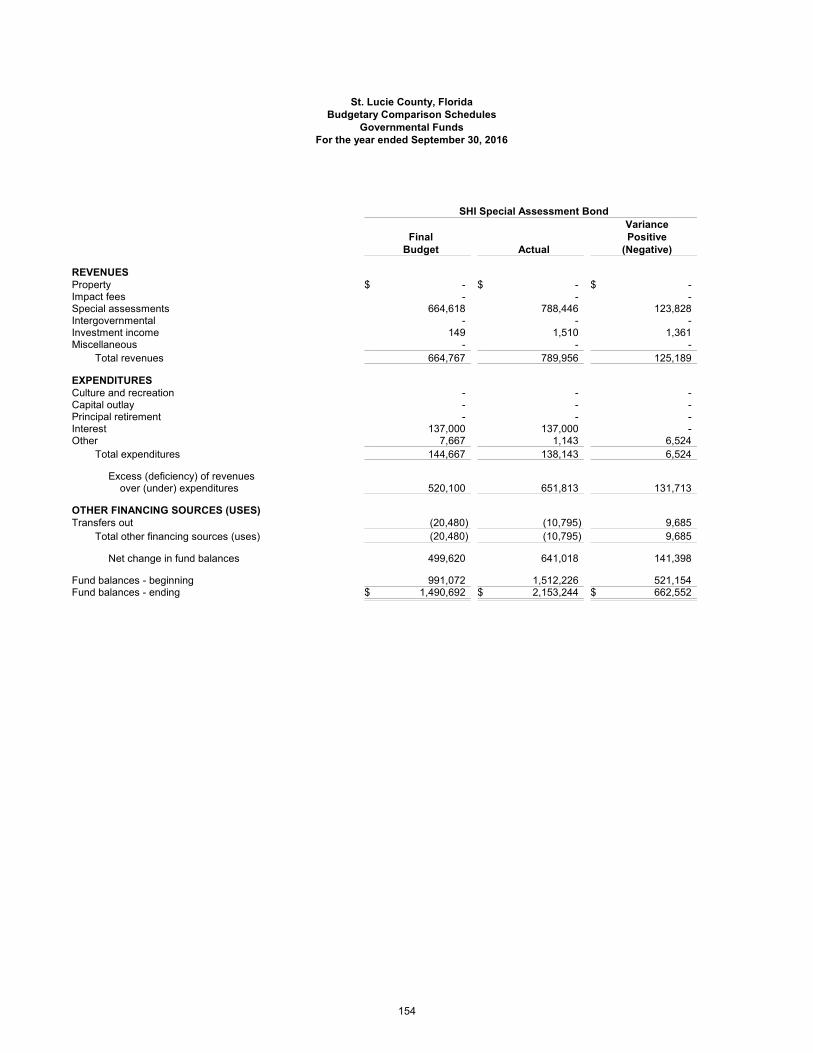
St. Lucie County, FloridaBudgetary Comparison Schedules
Governmental FundsFor the year ended September 30, 2016
SHI Special Assessment Bond
FinalBudget Actual
VariancePositive
(Negative)
REVENUESProperty $ - $ - $ -Impact fees - - -Special assessments 664,618 788,446 123,828Intergovernmental - - -Investment income 149 1,510 1,361Miscellaneous - - -
Total revenues 664,767 789,956 125,189
EXPENDITURESCulture and recreation - - -Capital outlay - - -Principal retirement - - -Interest 137,000 137,000 -Other 7,667 1,143 6,524
Total expenditures 144,667 138,143 6,524
Excess (deficiency) of revenues over (under) expenditures 520,100 651,813 131,713
OTHER FINANCING SOURCES (USES)Transfers out (20,480) (10,795) 9,685
Total other financing sources (uses) (20,480) (10,795) 9,685
Net change in fund balances 499,620 641,018 141,398
Fund balances - beginning 991,072 1,512,226 521,154Fund balances - ending $ 1,490,692 $ 2,153,244 $ 662,552
- - -
154
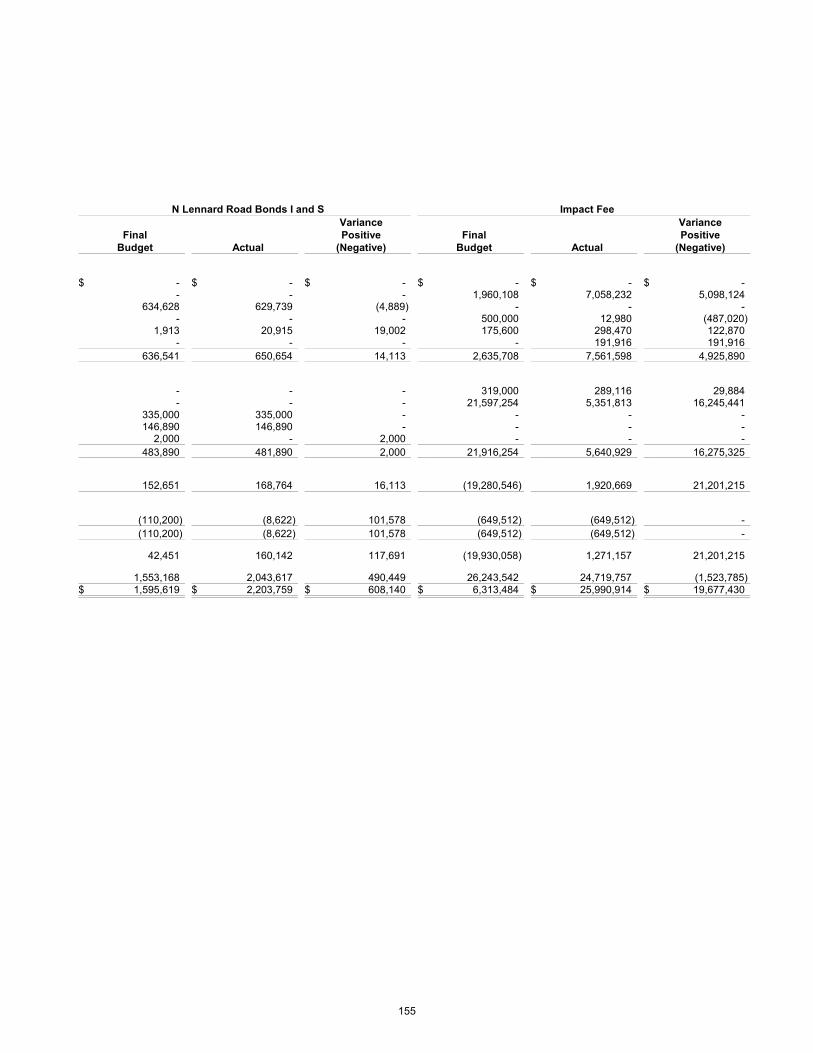
N Lennard Road Bonds I and S Impact Fee
FinalBudget Actual
VariancePositive
(Negative)Final
Budget Actual
VariancePositive
(Negative)
$ - $ - $ - $ - $ - $ -- - - 1,960,108 7,058,232 5,098,124
634,628 629,739 (4,889) - - -- - - 500,000 12,980 (487,020)
1,913 20,915 19,002 175,600 298,470 122,870- - - - 191,916 191,916
636,541 650,654 14,113 2,635,708 7,561,598 4,925,890
- - - 319,000 289,116 29,884- - - 21,597,254 5,351,813 16,245,441
335,000 335,000 - - - -146,890 146,890 - - - -
2,000 - 2,000 - - -483,890 481,890 2,000 21,916,254 5,640,929 16,275,325
152,651 168,764 16,113 (19,280,546) 1,920,669 21,201,215
(110,200) (8,622) 101,578 (649,512) (649,512) -(110,200) (8,622) 101,578 (649,512) (649,512) -
42,451 160,142 117,691 (19,930,058) 1,271,157 21,201,215
1,553,168 2,043,617 490,449 26,243,542 24,719,757 (1,523,785)$ 1,595,619 $ 2,203,759 $ 608,140 $ 6,313,484 $ 25,990,914 $ 19,677,430
- - - - - -
155
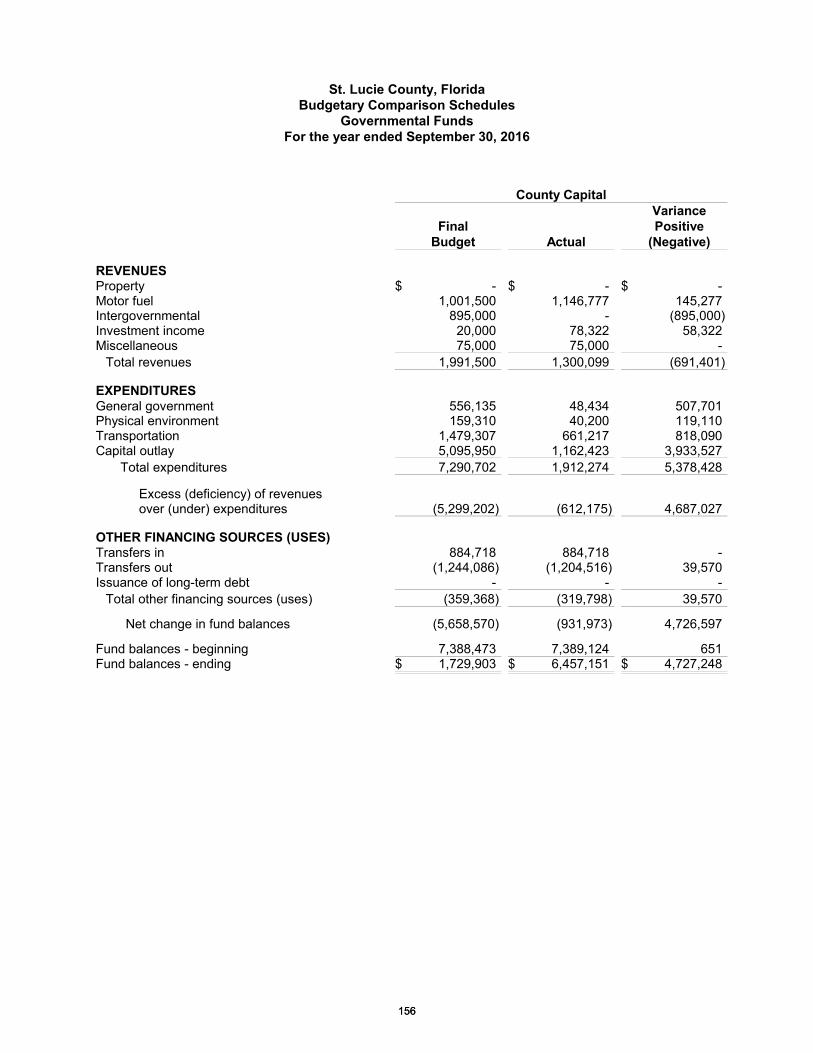
St. Lucie County, FloridaBudgetary Comparison Schedules
Governmental FundsFor the year ended September 30, 2016
County Capital
FinalBudget Actual
VariancePositive
(Negative)
REVENUESProperty $ - $ - $ -Motor fuel 1,001,500 1,146,777 145,277Intergovernmental 895,000 - (895,000)Investment income 20,000 78,322 58,322Miscellaneous 75,000 75,000 -
Total revenues 1,991,500 1,300,099 (691,401)
EXPENDITURESGeneral government 556,135 48,434 507,701Physical environment 159,310 40,200 119,110Transportation 1,479,307 661,217 818,090Capital outlay 5,095,950 1,162,423 3,933,527
Total expenditures 7,290,702 1,912,274 5,378,428
Excess (deficiency) of revenuesover (under) expenditures (5,299,202) (612,175) 4,687,027
OTHER FINANCING SOURCES (USES)Transfers in 884,718 884,718 -Transfers out (1,244,086) (1,204,516) 39,570Issuance of long-term debt - - -
Total other financing sources (uses) (359,368) (319,798) 39,570
Net change in fund balances (5,658,570) (931,973) 4,726,597
Fund balances - beginning 7,388,473 7,389,124 651Fund balances - ending $ 1,729,903 $ 6,457,151 $ 4,727,248
156156
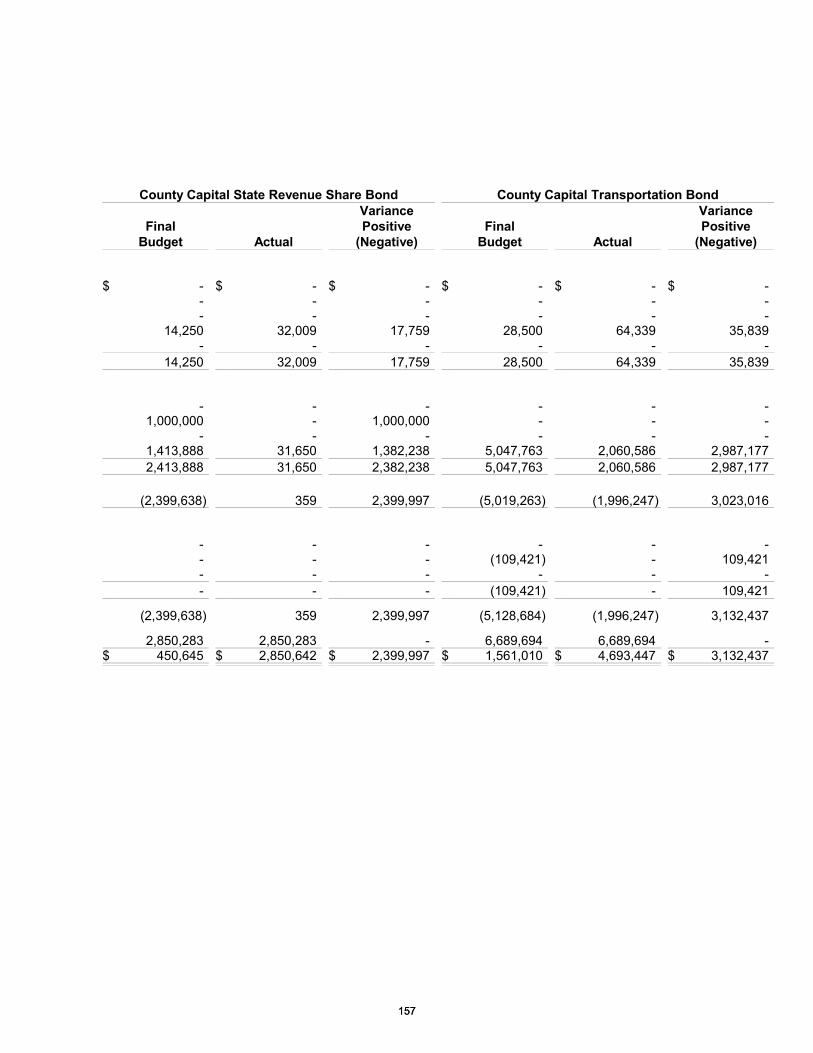
County Capital State Revenue Share Bond County Capital Transportation Bond
FinalBudget Actual
VariancePositive
(Negative)Final
Budget Actual
VariancePositive
(Negative)
$ - $ - $ - $ - $ - $ -- - - - - -- - - - - -
14,250 32,009 17,759 28,500 64,339 35,839- - - - - -
14,250 32,009 17,759 28,500 64,339 35,839
- - - - - -1,000,000 - 1,000,000 - - -
- - - - - -1,413,888 31,650 1,382,238 5,047,763 2,060,586 2,987,1772,413,888 31,650 2,382,238 5,047,763 2,060,586 2,987,177
(2,399,638) 359 2,399,997 (5,019,263) (1,996,247) 3,023,016
- - - - - -- - - (109,421) - 109,421- - - - - -- - - (109,421) - 109,421
(2,399,638) 359 2,399,997 (5,128,684) (1,996,247) 3,132,437
2,850,283 2,850,283 - 6,689,694 6,689,694 -$ 450,645 $ 2,850,642 $ 2,399,997 $ 1,561,010 $ 4,693,447 $ 3,132,437
157157
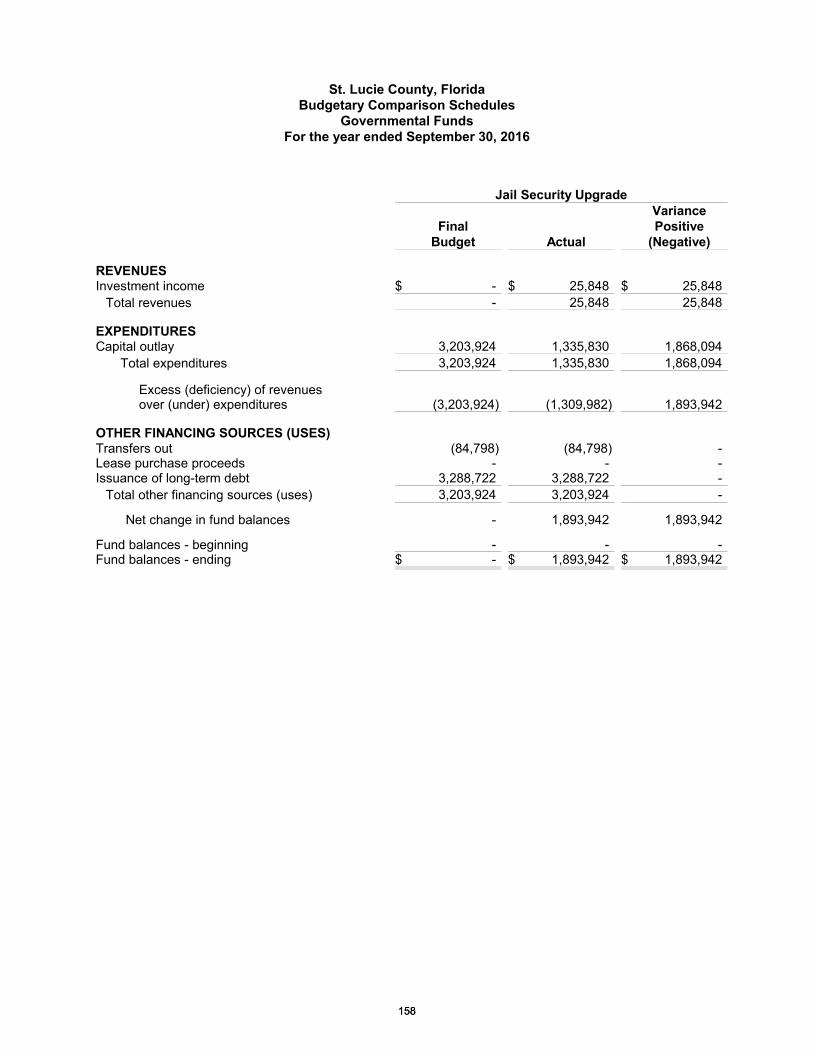
St. Lucie County, FloridaBudgetary Comparison Schedules
Governmental FundsFor the year ended September 30, 2016
Jail Security Upgrade
FinalBudget Actual
VariancePositive
(Negative)
REVENUESInvestment income $ - $ 25,848 $ 25,848
Total revenues - 25,848 25,848
EXPENDITURESCapital outlay 3,203,924 1,335,830 1,868,094
Total expenditures 3,203,924 1,335,830 1,868,094
Excess (deficiency) of revenuesover (under) expenditures (3,203,924) (1,309,982) 1,893,942
OTHER FINANCING SOURCES (USES)Transfers out (84,798) (84,798) -Lease purchase proceeds - - -Issuance of long-term debt 3,288,722 3,288,722 -
Total other financing sources (uses) 3,203,924 3,203,924 -
Net change in fund balances - 1,893,942 1,893,942
Fund balances - beginning - - -Fund balances - ending $ - $ 1,893,942 $ 1,893,942
158158
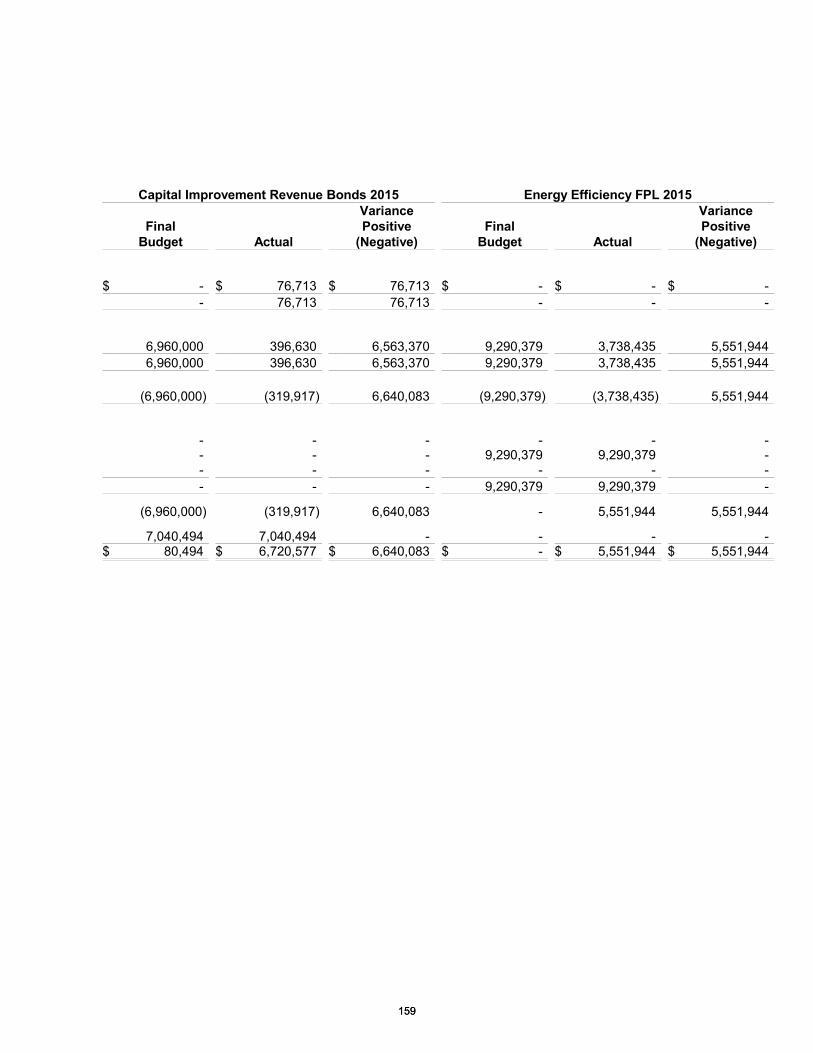
Capital Improvement Revenue Bonds 2015 Energy Efficiency FPL 2015
FinalBudget Actual
VariancePositive
(Negative)Final
Budget Actual
VariancePositive
(Negative)
$ - $ 76,713 $ 76,713 $ - $ - $ -- 76,713 76,713 - - -
6,960,000 396,630 6,563,370 9,290,379 3,738,435 5,551,9446,960,000 396,630 6,563,370 9,290,379 3,738,435 5,551,944
(6,960,000) (319,917) 6,640,083 (9,290,379) (3,738,435) 5,551,944
- - - - - -- - - 9,290,379 9,290,379 -- - - - - -- - - 9,290,379 9,290,379 -
(6,960,000) (319,917) 6,640,083 - 5,551,944 5,551,944
7,040,494 7,040,494 - - - -$ 80,494 $ 6,720,577 $ 6,640,083 $ - $ 5,551,944 $ 5,551,944
159159
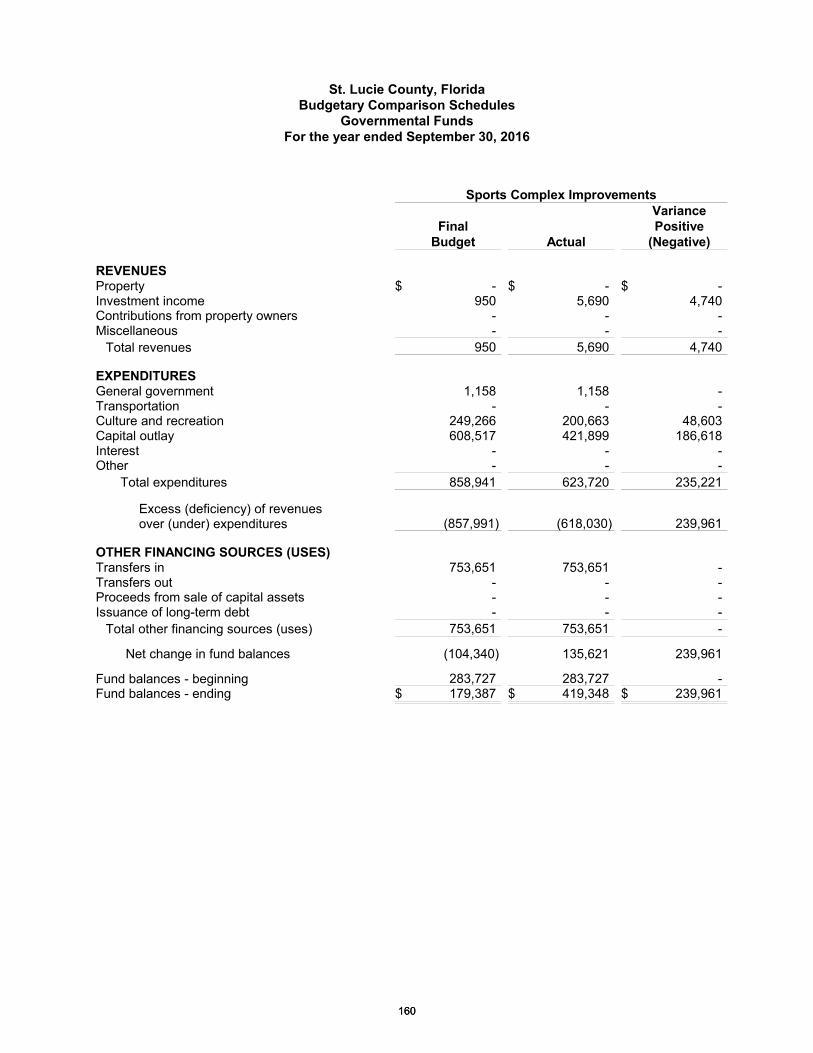
St. Lucie County, FloridaBudgetary Comparison Schedules
Governmental FundsFor the year ended September 30, 2016
Sports Complex Improvements
FinalBudget Actual
VariancePositive
(Negative)
REVENUESProperty $ - $ - $ -Investment income 950 5,690 4,740Contributions from property owners - - -Miscellaneous - - -
Total revenues 950 5,690 4,740
EXPENDITURESGeneral government 1,158 1,158 -Transportation - - -Culture and recreation 249,266 200,663 48,603Capital outlay 608,517 421,899 186,618Interest - - -Other - - -
Total expenditures 858,941 623,720 235,221
Excess (deficiency) of revenuesover (under) expenditures (857,991) (618,030) 239,961
OTHER FINANCING SOURCES (USES)Transfers in 753,651 753,651 -Transfers out - - -Proceeds from sale of capital assets - - -Issuance of long-term debt - - -
Total other financing sources (uses) 753,651 753,651 -
Net change in fund balances (104,340) 135,621 239,961
Fund balances - beginning 283,727 283,727 -Fund balances - ending $ 179,387 $ 419,348 $ 239,961
160160
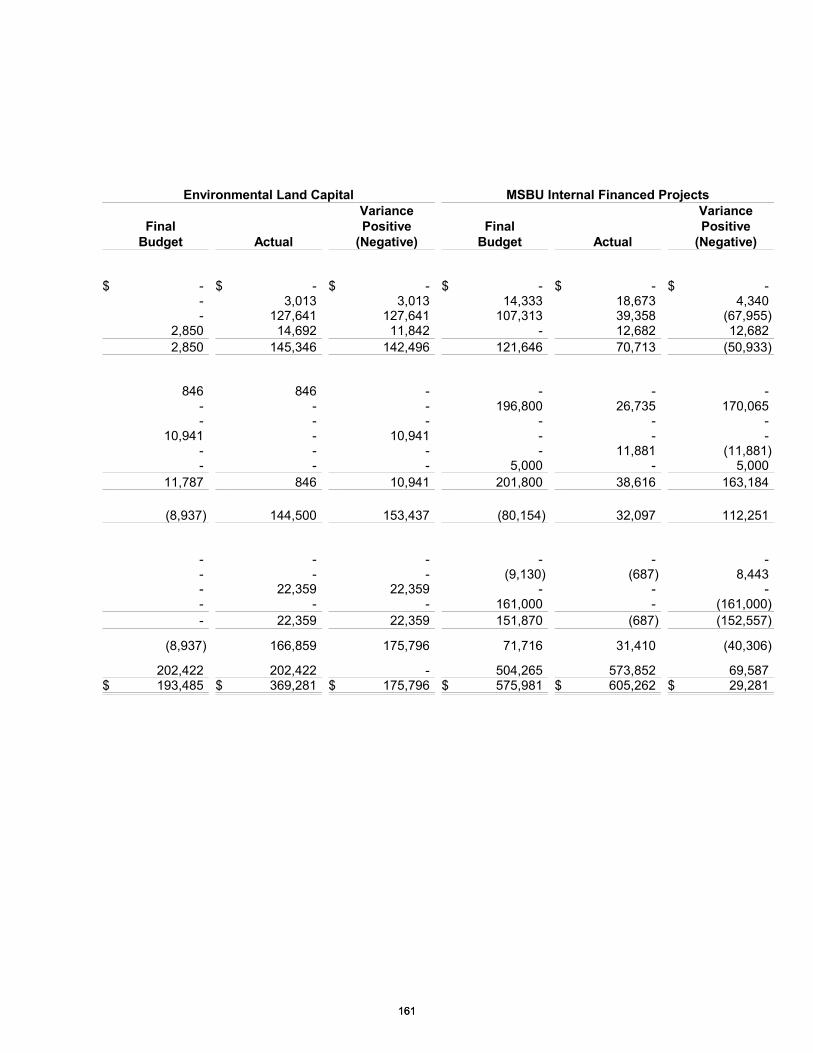
Environmental Land Capital MSBU Internal Financed Projects
FinalBudget Actual
VariancePositive
(Negative)Final
Budget Actual
VariancePositive
(Negative)
$ - $ - $ - $ - $ - $ -- 3,013 3,013 14,333 18,673 4,340- 127,641 127,641 107,313 39,358 (67,955)
2,850 14,692 11,842 - 12,682 12,6822,850 145,346 142,496 121,646 70,713 (50,933)
846 846 - - - -- - - 196,800 26,735 170,065- - - - - -
10,941 - 10,941 - - -- - - - 11,881 (11,881)- - - 5,000 - 5,000
11,787 846 10,941 201,800 38,616 163,184
(8,937) 144,500 153,437 (80,154) 32,097 112,251
- - - - - -- - - (9,130) (687) 8,443- 22,359 22,359 - - -- - - 161,000 - (161,000)- 22,359 22,359 151,870 (687) (152,557)
(8,937) 166,859 175,796 71,716 31,410 (40,306)
202,422 202,422 - 504,265 573,852 69,587$ 193,485 $ 369,281 $ 175,796 $ 575,981 $ 605,262 $ 29,281
161161
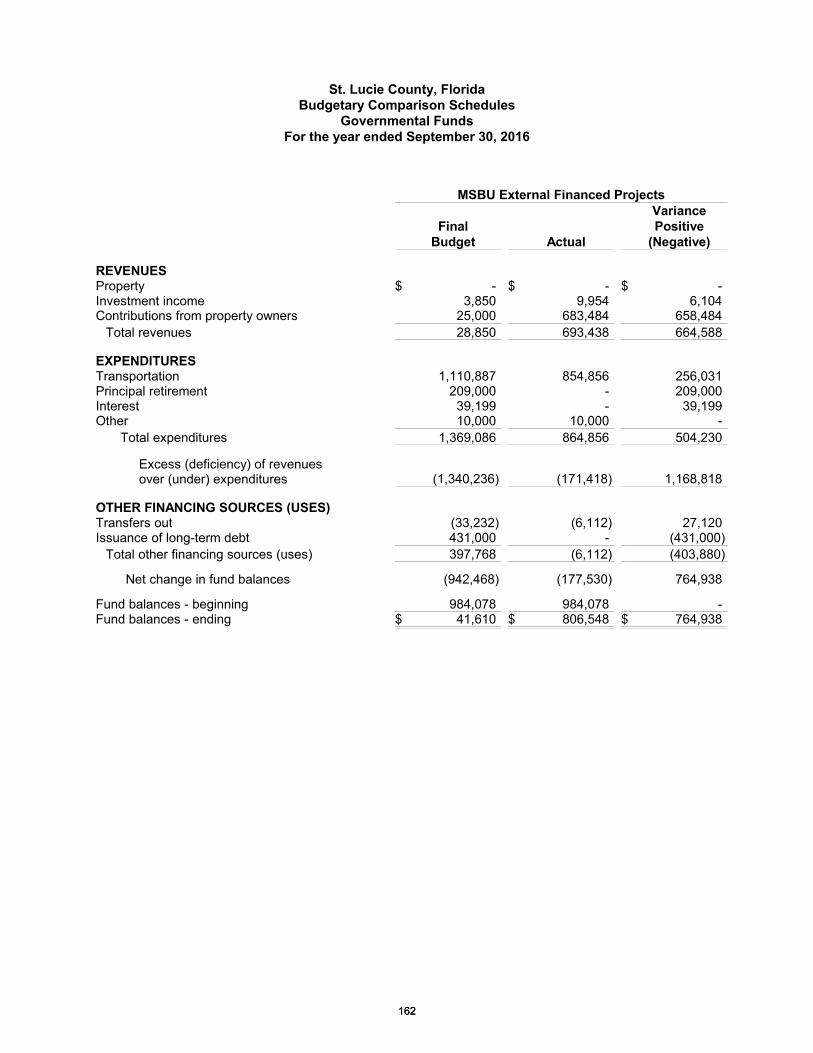
St. Lucie County, FloridaBudgetary Comparison Schedules
Governmental FundsFor the year ended September 30, 2016
MSBU External Financed Projects
FinalBudget Actual
VariancePositive
(Negative)
REVENUESProperty $ - $ - $ -Investment income 3,850 9,954 6,104Contributions from property owners 25,000 683,484 658,484
Total revenues 28,850 693,438 664,588
EXPENDITURESTransportation 1,110,887 854,856 256,031Principal retirement 209,000 - 209,000Interest 39,199 - 39,199Other 10,000 10,000 -
Total expenditures 1,369,086 864,856 504,230
Excess (deficiency) of revenuesover (under) expenditures (1,340,236) (171,418) 1,168,818
OTHER FINANCING SOURCES (USES)Transfers out (33,232) (6,112) 27,120Issuance of long-term debt 431,000 - (431,000)
Total other financing sources (uses) 397,768 (6,112) (403,880)
Net change in fund balances (942,468) (177,530) 764,938
Fund balances - beginning 984,078 984,078 -Fund balances - ending $ 41,610 $ 806,548 $ 764,938
162162

THIS PAGE INTENTIONALLY LEFT BLANK
163163
ST. LUCIE COUNTY, FLORIDANonmajor Enterprise Fund Descriptions
Enterprise Funds
Enterprise funds impose fees or charges on those who use their services, primarily tocustomers outside the financial reporting entity.
South Hutchinson Utilities Fund – The fund is used to account for the operation of a wastewatertreatment plant for certain residents in various sections of the County.
Building Code Fund – The fund is used to account for permit fees to pay for the expenses forbuilding code compliance.
164164
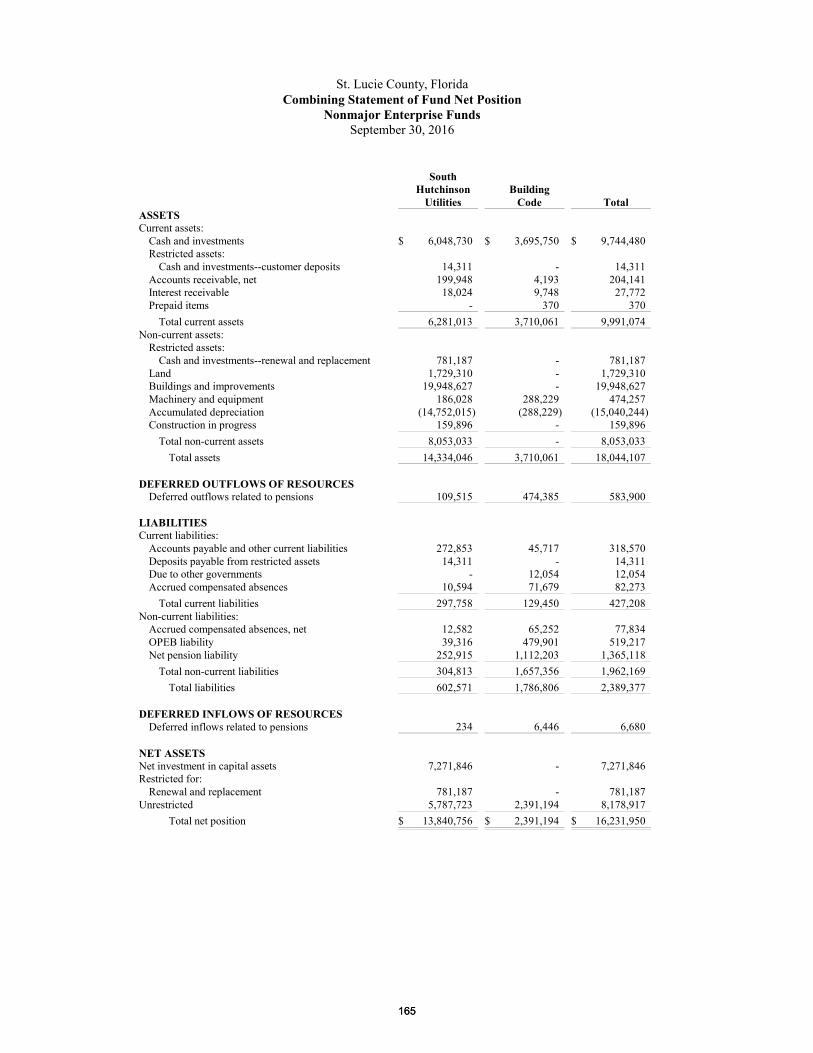
St. Lucie County, FloridaCombining Statement of Fund Net Position
Nonmajor Enterprise FundsSeptember 30, 2016
SouthHutchinson
UtilitiesBuilding
Code TotalASSETSCurrent assets:
Cash and investments $ 6,048,730 $ 3,695,750 $ 9,744,480Restricted assets:
Cash and investments--customer deposits 14,311 - 14,311Accounts receivable, net 199,948 4,193 204,141Interest receivable 18,024 9,748 27,772Prepaid items - 370 370
Total current assets 6,281,013 3,710,061 9,991,074Non-current assets:
Restricted assets:Cash and investments--renewal and replacement 781,187 - 781,187
Land 1,729,310 - 1,729,310Buildings and improvements 19,948,627 - 19,948,627Machinery and equipment 186,028 288,229 474,257Accumulated depreciation (14,752,015) (288,229) (15,040,244)Construction in progress 159,896 - 159,896
Total non-current assets 8,053,033 - 8,053,033Total assets 14,334,046 3,710,061 18,044,107
DEFERRED OUTFLOWS OF RESOURCESDeferred outflows related to pensions 109,515 474,385 583,900
LIABILITIESCurrent liabilities:
Accounts payable and other current liabilities 272,853 45,717 318,570Deposits payable from restricted assets 14,311 - 14,311Due to other governments - 12,054 12,054Accrued compensated absences 10,594 71,679 82,273
Total current liabilities 297,758 129,450 427,208Non-current liabilities:
Accrued compensated absences, net 12,582 65,252 77,834OPEB liability 39,316 479,901 519,217Net pension liability 252,915 1,112,203 1,365,118
Total non-current liabilities 304,813 1,657,356 1,962,169Total liabilities 602,571 1,786,806 2,389,377
DEFERRED INFLOWS OF RESOURCESDeferred inflows related to pensions 234 6,446 6,680
NET ASSETSNet investment in capital assets 7,271,846 - 7,271,846Restricted for:
Renewal and replacement 781,187 - 781,187Unrestricted 5,787,723 2,391,194 8,178,917
Total net position $ 13,840,756 $ 2,391,194 $ 16,231,950
165165
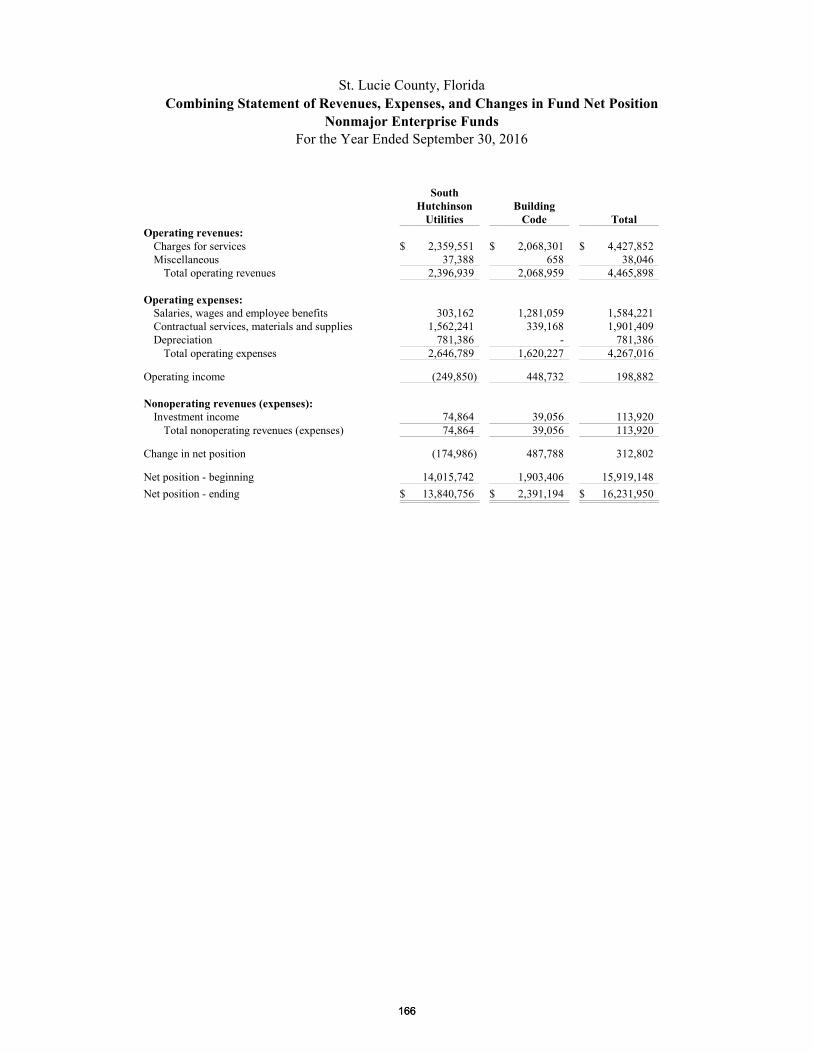
St. Lucie County, FloridaCombining Statement of Revenues, Expenses, and Changes in Fund Net Position
Nonmajor Enterprise FundsFor the Year Ended September 30, 2016
SouthHutchinson
UtilitiesBuilding
Code TotalOperating revenues:
Charges for services $ 2,359,551 $ 2,068,301 $ 4,427,852Miscellaneous 37,388 658 38,046
Total operating revenues 2,396,939 2,068,959 4,465,898
Operating expenses:Salaries, wages and employee benefits 303,162 1,281,059 1,584,221Contractual services, materials and supplies 1,562,241 339,168 1,901,409Depreciation 781,386 - 781,386
Total operating expenses 2,646,789 1,620,227 4,267,016
Operating income (249,850) 448,732 198,882
Nonoperating revenues (expenses):Investment income 74,864 39,056 113,920
Total nonoperating revenues (expenses) 74,864 39,056 113,920
Change in net position (174,986) 487,788 312,802
Net position - beginning 14,015,742 1,903,406 15,919,148Net position - ending $ 13,840,756 $ 2,391,194 $ 16,231,950
166166
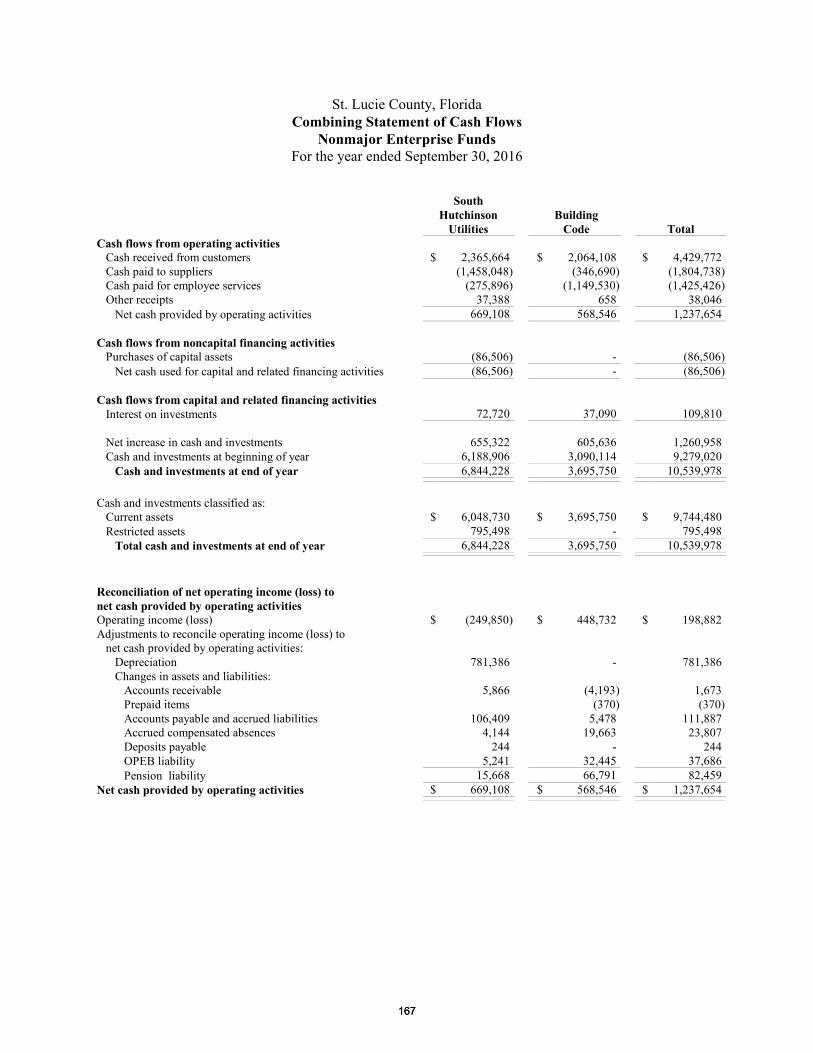
St. Lucie County, FloridaCombining Statement of Cash Flows
Nonmajor Enterprise FundsFor the year ended September 30, 2016
SouthHutchinson Building
Utilities Code TotalCash flows from operating activities Cash received from customers $ 2,365,664 $ 2,064,108 $ 4,429,772 Cash paid to suppliers (1,458,048) (346,690) (1,804,738) Cash paid for employee services (275,896) (1,149,530) (1,425,426) Other receipts 37,388 658 38,046 Net cash provided by operating activities 669,108 568,546 1,237,654
Cash flows from noncapital financing activities Purchases of capital assets (86,506) - (86,506) Net cash used for capital and related financing activities (86,506) - (86,506)
Cash flows from capital and related financing activities Interest on investments 72,720 37,090 109,810
Net increase in cash and investments 655,322 605,636 1,260,958 Cash and investments at beginning of year 6,188,906 3,090,114 9,279,020 Cash and investments at end of year 6,844,228 3,695,750 10,539,978
Cash and investments classified as: Current assets $ 6,048,730 $ 3,695,750 $ 9,744,480 Restricted assets 795,498 - 795,498 Total cash and investments at end of year 6,844,228 3,695,750 10,539,978
Reconciliation of net operating income (loss) tonet cash provided by operating activitiesOperating income (loss) $ (249,850) $ 448,732 $ 198,882 Adjustments to reconcile operating income (loss) to net cash provided by operating activities: Depreciation 781,386 - 781,386 Changes in assets and liabilities: Accounts receivable 5,866 (4,193) 1,673 Prepaid items (370) (370) Accounts payable and accrued liabilities 106,409 5,478 111,887 Accrued compensated absences 4,144 19,663 23,807 Deposits payable 244 - 244 OPEB liability 5,241 32,445 37,686 Pension liability 15,668 66,791 82,459 Net cash provided by operating activities $ 669,108 $ 568,546 $ 1,237,654
167167
AGENCY FUNDS
168168
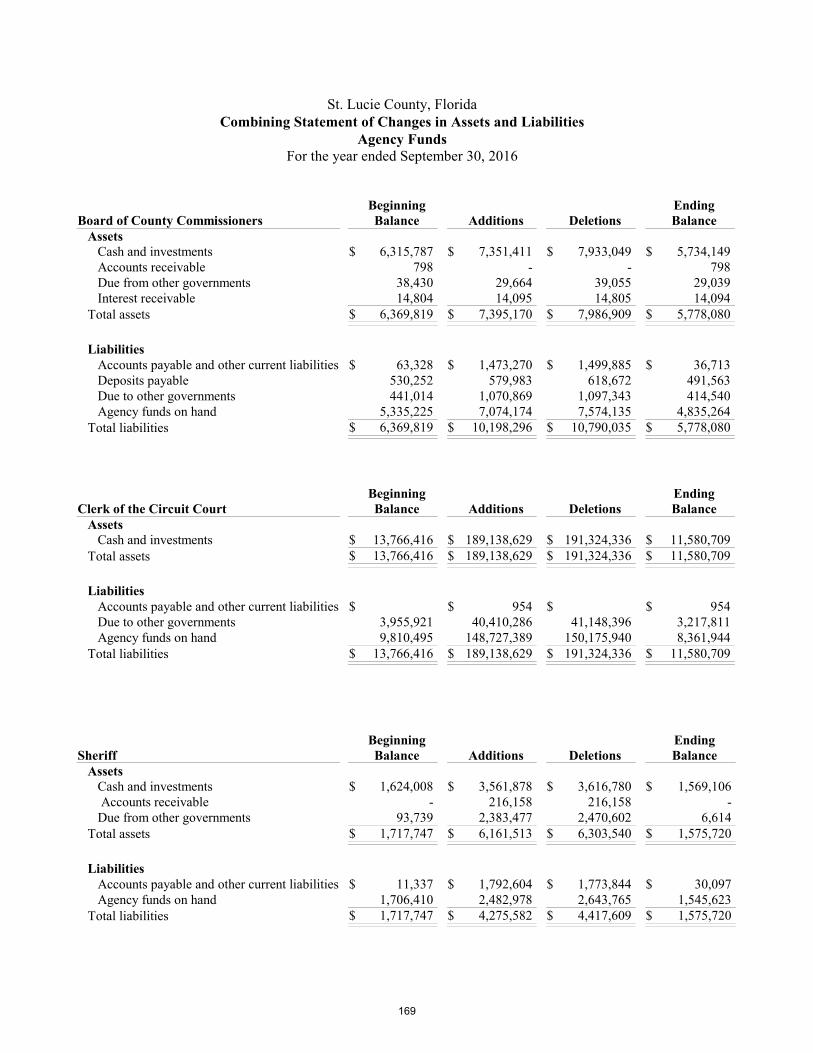
St. Lucie County, FloridaCombining Statement of Changes in Assets and Liabilities
Agency FundsFor the year ended September 30, 2016
Beginning EndingBoard of County Commissioners Balance Additions Deletions Balance Assets Cash and investments $ 6,315,787 $ 7,351,411 $ 7,933,049 $ 5,734,149 Accounts receivable 798 - - 798 Due from other governments 38,430 29,664 39,055 29,039 Interest receivable 14,804 14,095 14,805 14,094 Total assets $ 6,369,819 $ 7,395,170 $ 7,986,909 $ 5,778,080
Liabilities Accounts payable and other current liabilities $ 63,328 $ 1,473,270 $ 1,499,885 $ 36,713 Deposits payable 530,252 579,983 618,672 491,563 Due to other governments 441,014 1,070,869 1,097,343 414,540 Agency funds on hand 5,335,225 7,074,174 7,574,135 4,835,264 Total liabilities $ 6,369,819 $ 10,198,296 $ 10,790,035 $ 5,778,080
Beginning EndingClerk of the Circuit Court Balance Additions Deletions Balance Assets Cash and investments $ 13,766,416 $ 189,138,629 $ 191,324,336 $ 11,580,709 Total assets $ 13,766,416 $ 189,138,629 $ 191,324,336 $ 11,580,709
Liabilities Accounts payable and other current liabilities $ $ 954 $ $ 954 Due to other governments 3,955,921 40,410,286 41,148,396 3,217,811 Agency funds on hand 9,810,495 148,727,389 150,175,940 8,361,944 Total liabilities $ 13,766,416 $ 189,138,629 $ 191,324,336 $ 11,580,709
Beginning EndingSheriff Balance Additions Deletions Balance Assets Cash and investments $ 1,624,008 $ 3,561,878 $ 3,616,780 $ 1,569,106 Accounts receivable - 216,158 216,158 - Due from other governments 93,739 2,383,477 2,470,602 6,614 Total assets $ 1,717,747 $ 6,161,513 $ 6,303,540 $ 1,575,720
Liabilities Accounts payable and other current liabilities $ 11,337 $ 1,792,604 $ 1,773,844 $ 30,097 Agency funds on hand 1,706,410 2,482,978 2,643,765 1,545,623 Total liabilities $ 1,717,747 $ 4,275,582 $ 4,417,609 $ 1,575,720
169
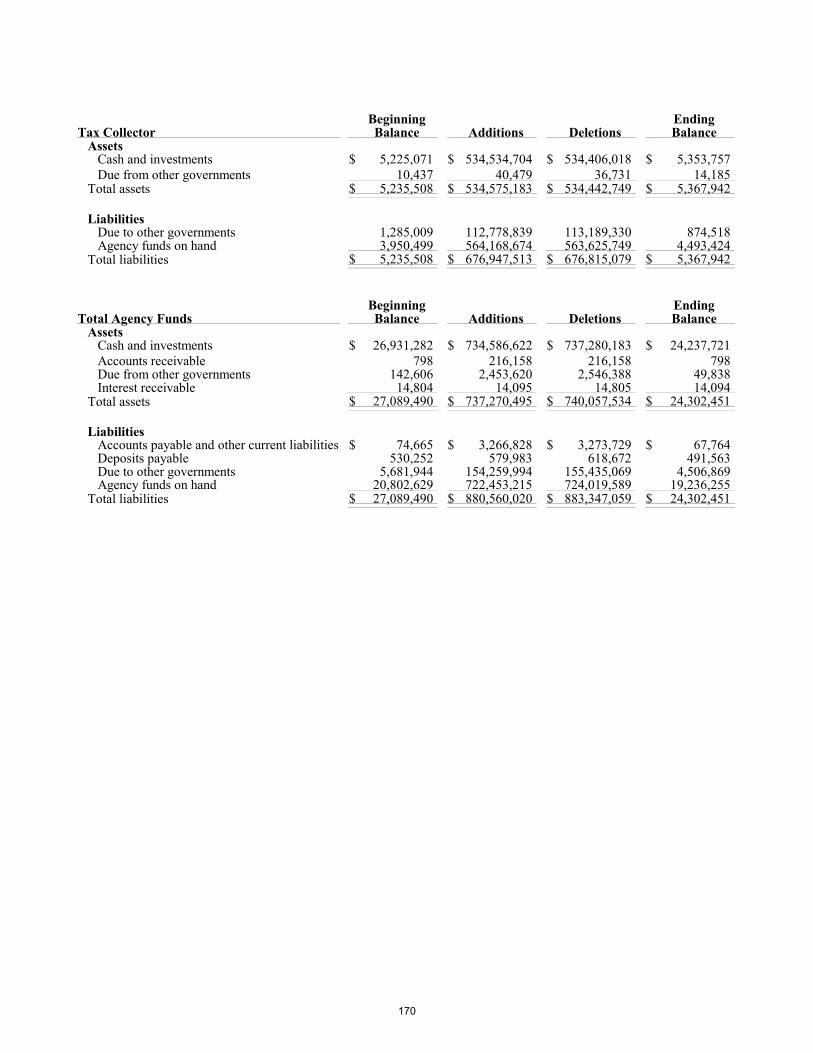
Beginning EndingTax Collector Balance Additions Deletions Balance Assets Cash and investments $ 5,225,071 $ 534,534,704 $ 534,406,018 $ 5,353,757 Due from other governments 10,437 40,479 36,731 14,185 Total assets $ 5,235,508 $ 534,575,183 $ 534,442,749 $ 5,367,942
Liabilities Due to other governments 1,285,009 112,778,839 113,189,330 874,518 Agency funds on hand 3,950,499 564,168,674 563,625,749 4,493,424 Total liabilities $ 5,235,508 $ 676,947,513 $ 676,815,079 $ 5,367,942
Beginning EndingTotal Agency Funds Balance Additions Deletions Balance Assets Cash and investments $ 26,931,282 $ 734,586,622 $ 737,280,183 $ 24,237,721 Accounts receivable 798 216,158 216,158 798 Due from other governments 142,606 2,453,620 2,546,388 49,838 Interest receivable 14,804 14,095 14,805 14,094 Total assets $ 27,089,490 $ 737,270,495 $ 740,057,534 $ 24,302,451
Liabilities Accounts payable and other current liabilities $ 74,665 $ 3,266,828 $ 3,273,729 $ 67,764 Deposits payable 530,252 579,983 618,672 491,563 Due to other governments 5,681,944 154,259,994 155,435,069 4,506,869 Agency funds on hand 20,802,629 722,453,215 724,019,589 19,236,255 Total liabilities $ 27,089,490 $ 880,560,020 $ 883,347,059 $ 24,302,451
170
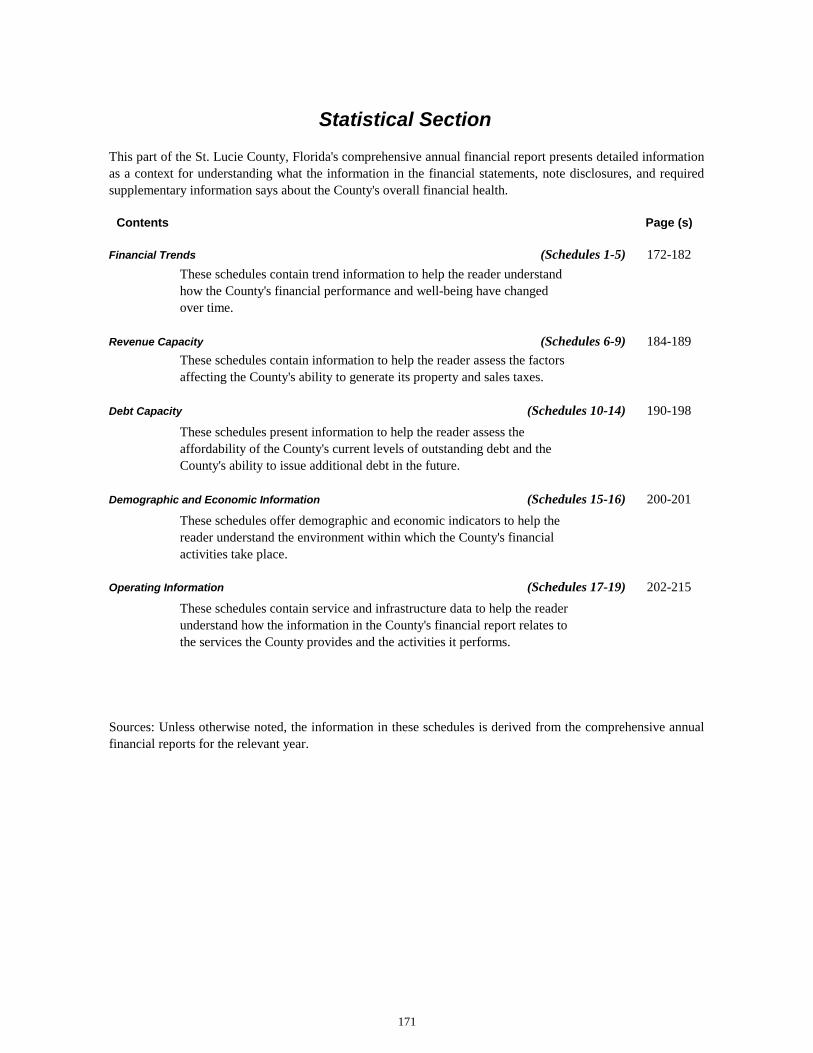
Contents Page (s)
Financial Trends (Schedules 1-5) 172-182
These schedules contain trend information to help the reader understand
how the County's financial performance and well-being have changed
over time.
Revenue Capacity (Schedules 6-9) 184-189
These schedules contain information to help the reader assess the factors
affecting the County's ability to generate its property and sales taxes.
Debt Capacity (Schedules 10-14) 190-198
These schedules present information to help the reader assess the
affordability of the County's current levels of outstanding debt and the
County's ability to issue additional debt in the future.
Demographic and Economic Information (Schedules 15-16) 200-201
These schedules offer demographic and economic indicators to help the
reader understand the environment within which the County's financial
activities take place.
Operating Information (Schedules 17-19) 202-215
These schedules contain service and infrastructure data to help the reader
understand how the information in the County's financial report relates to
the services the County provides and the activities it performs.
Statistical Section
This part of the St. Lucie County, Florida's comprehensive annual financial report presents detailed information
as a context for understanding what the information in the financial statements, note disclosures, and required
supplementary information says about the County's overall financial health.
Sources: Unless otherwise noted, the information in these schedules is derived from the comprehensive annual
financial reports for the relevant year.
171
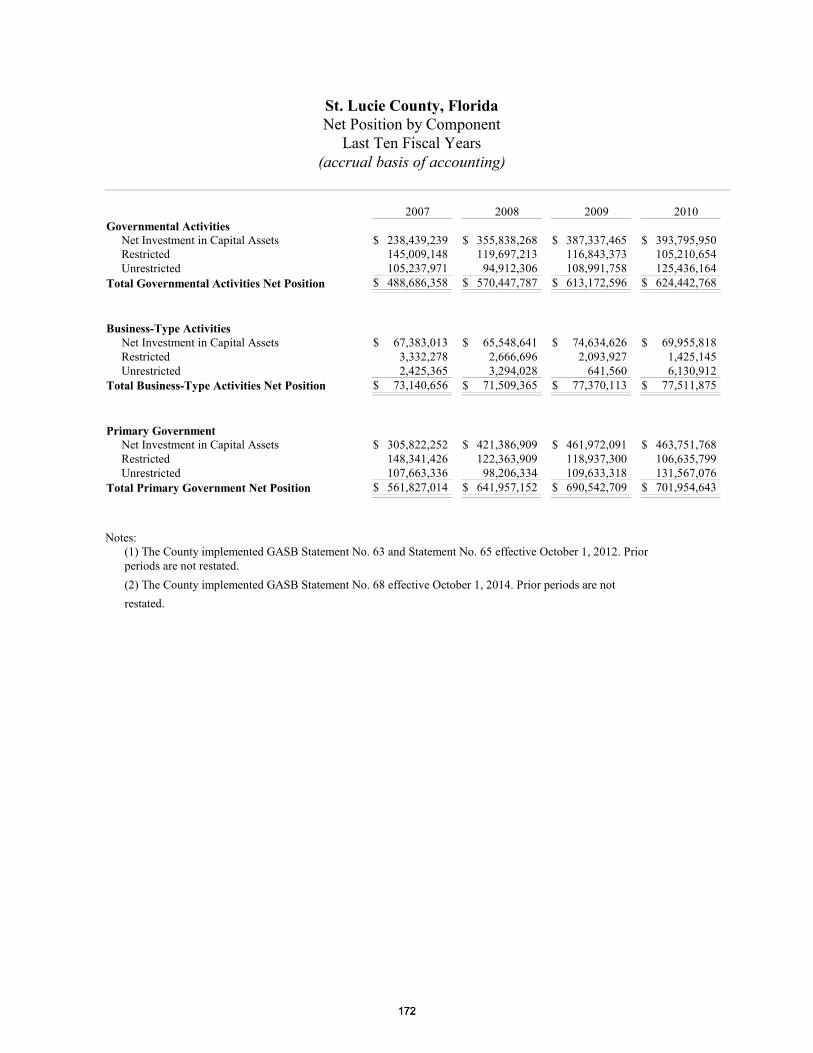
St. Lucie County, FloridaNet Position by Component
Last Ten Fiscal Years(accrual basis of accounting)
2007 2008 2009 2010 Governmental Activities Net Investment in Capital Assets $ 238,439,239 $ 355,838,268 $ 387,337,465 $ 393,795,950 Restricted 145,009,148 119,697,213 116,843,373 105,210,654 Unrestricted 105,237,971 94,912,306 108,991,758 125,436,164 Total Governmental Activities Net Position $ 488,686,358 $ 570,447,787 $ 613,172,596 $ 624,442,768
Business-Type Activities Net Investment in Capital Assets $ 67,383,013 $ 65,548,641 $ 74,634,626 $ 69,955,818 Restricted 3,332,278 2,666,696 2,093,927 1,425,145 Unrestricted 2,425,365 3,294,028 641,560 6,130,912 Total Business-Type Activities Net Position $ 73,140,656 $ 71,509,365 $ 77,370,113 $ 77,511,875
Primary Government Net Investment in Capital Assets $ 305,822,252 $ 421,386,909 $ 461,972,091 $ 463,751,768 Restricted 148,341,426 122,363,909 118,937,300 106,635,799 Unrestricted 107,663,336 98,206,334 109,633,318 131,567,076 Total Primary Government Net Position $ 561,827,014 $ 641,957,152 $ 690,542,709 $ 701,954,643
Notes:(1) The County implemented GASB Statement No. 63 and Statement No. 65 effective October 1, 2012. Priorperiods are not restated. (2) The County implemented GASB Statement No. 68 effective October 1, 2014. Prior periods are notrestated.
172172
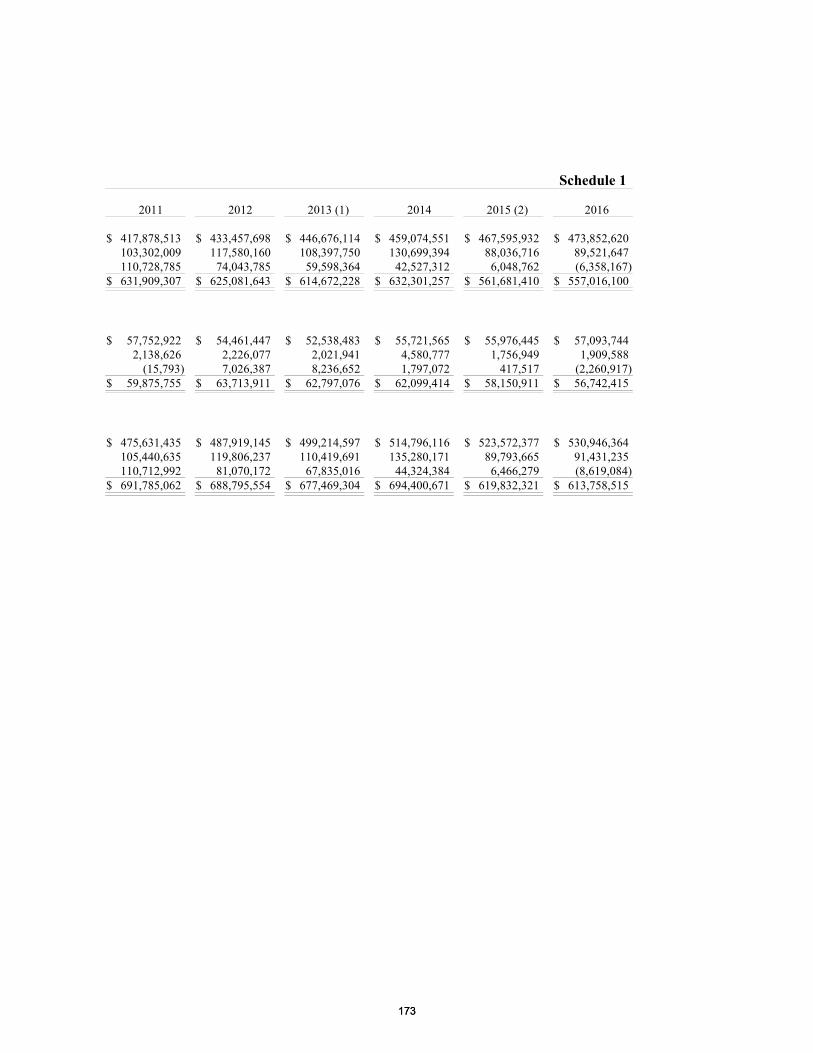
Schedule 1
2011 2012 2013 (1) 2014 2015 (2) 2016
$ 417,878,513 $ 433,457,698 $ 446,676,114 $ 459,074,551 $ 467,595,932 $ 473,852,620 103,302,009 117,580,160 108,397,750 130,699,394 88,036,716 89,521,647 110,728,785 74,043,785 59,598,364 42,527,312 6,048,762 (6,358,167)
$ 631,909,307 $ 625,081,643 $ 614,672,228 $ 632,301,257 $ 561,681,410 $ 557,016,100
$ 57,752,922 $ 54,461,447 $ 52,538,483 $ 55,721,565 $ 55,976,445 $ 57,093,744 2,138,626 2,226,077 2,021,941 4,580,777 1,756,949 1,909,588
(15,793) 7,026,387 8,236,652 1,797,072 417,517 (2,260,917)$ 59,875,755 $ 63,713,911 $ 62,797,076 $ 62,099,414 $ 58,150,911 $ 56,742,415
$ 475,631,435 $ 487,919,145 $ 499,214,597 $ 514,796,116 $ 523,572,377 $ 530,946,364 105,440,635 119,806,237 110,419,691 135,280,171 89,793,665 91,431,235 110,712,992 81,070,172 67,835,016 44,324,384 6,466,279 (8,619,084)
$ 691,785,062 $ 688,795,554 $ 677,469,304 $ 694,400,671 $ 619,832,321 $ 613,758,515
173173
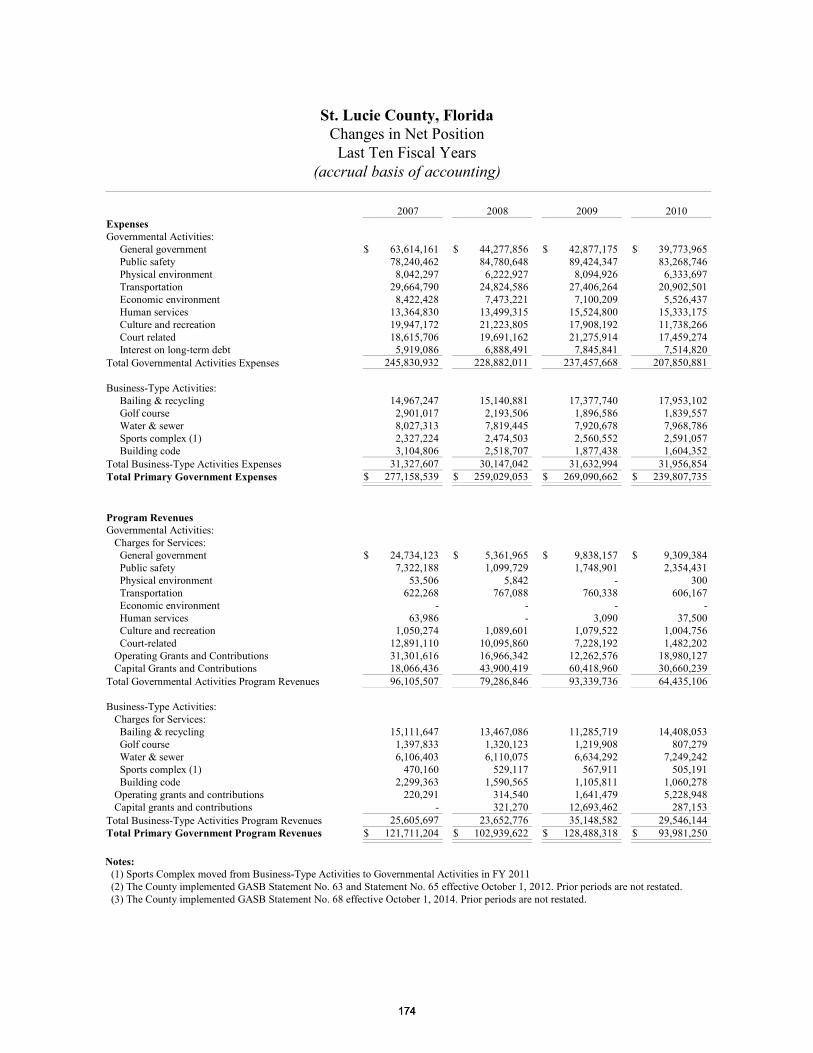
St. Lucie County, FloridaChanges in Net PositionLast Ten Fiscal Years
(accrual basis of accounting)
2007 2008 2009 2010 ExpensesGovernmental Activities: General government $ 63,614,161 $ 44,277,856 $ 42,877,175 $ 39,773,965 Public safety 78,240,462 84,780,648 89,424,347 83,268,746 Physical environment 8,042,297 6,222,927 8,094,926 6,333,697 Transportation 29,664,790 24,824,586 27,406,264 20,902,501 Economic environment 8,422,428 7,473,221 7,100,209 5,526,437 Human services 13,364,830 13,499,315 15,524,800 15,333,175 Culture and recreation 19,947,172 21,223,805 17,908,192 11,738,266 Court related 18,615,706 19,691,162 21,275,914 17,459,274 Interest on long-term debt 5,919,086 6,888,491 7,845,841 7,514,820 Total Governmental Activities Expenses 245,830,932 228,882,011 237,457,668 207,850,881
Business-Type Activities: Bailing & recycling 14,967,247 15,140,881 17,377,740 17,953,102 Golf course 2,901,017 2,193,506 1,896,586 1,839,557 Water & sewer 8,027,313 7,819,445 7,920,678 7,968,786 Sports complex (1) 2,327,224 2,474,503 2,560,552 2,591,057 Building code 3,104,806 2,518,707 1,877,438 1,604,352 Total Business-Type Activities Expenses 31,327,607 30,147,042 31,632,994 31,956,854 Total Primary Government Expenses $ 277,158,539 $ 259,029,053 $ 269,090,662 $ 239,807,735
Program RevenuesGovernmental Activities: Charges for Services: General government $ 24,734,123 $ 5,361,965 $ 9,838,157 $ 9,309,384 Public safety 7,322,188 1,099,729 1,748,901 2,354,431 Physical environment 53,506 5,842 - 300 Transportation 622,268 767,088 760,338 606,167 Economic environment - - - - Human services 63,986 - 3,090 37,500 Culture and recreation 1,050,274 1,089,601 1,079,522 1,004,756 Court-related 12,891,110 10,095,860 7,228,192 1,482,202 Operating Grants and Contributions 31,301,616 16,966,342 12,262,576 18,980,127 Capital Grants and Contributions 18,066,436 43,900,419 60,418,960 30,660,239 Total Governmental Activities Program Revenues 96,105,507 79,286,846 93,339,736 64,435,106
Business-Type Activities: Charges for Services: Bailing & recycling 15,111,647 13,467,086 11,285,719 14,408,053 Golf course 1,397,833 1,320,123 1,219,908 807,279 Water & sewer 6,106,403 6,110,075 6,634,292 7,249,242 Sports complex (1) 470,160 529,117 567,911 505,191 Building code 2,299,363 1,590,565 1,105,811 1,060,278 Operating grants and contributions 220,291 314,540 1,641,479 5,228,948 Capital grants and contributions - 321,270 12,693,462 287,153 Total Business-Type Activities Program Revenues 25,605,697 23,652,776 35,148,582 29,546,144 Total Primary Government Program Revenues $ 121,711,204 $ 102,939,622 $ 128,488,318 $ 93,981,250
Notes:(1) Sports Complex moved from Business-Type Activities to Governmental Activities in FY 2011(2) The County implemented GASB Statement No. 63 and Statement No. 65 effective October 1, 2012. Prior periods are not restated. (3) The County implemented GASB Statement No. 68 effective October 1, 2014. Prior periods are not restated.
174174
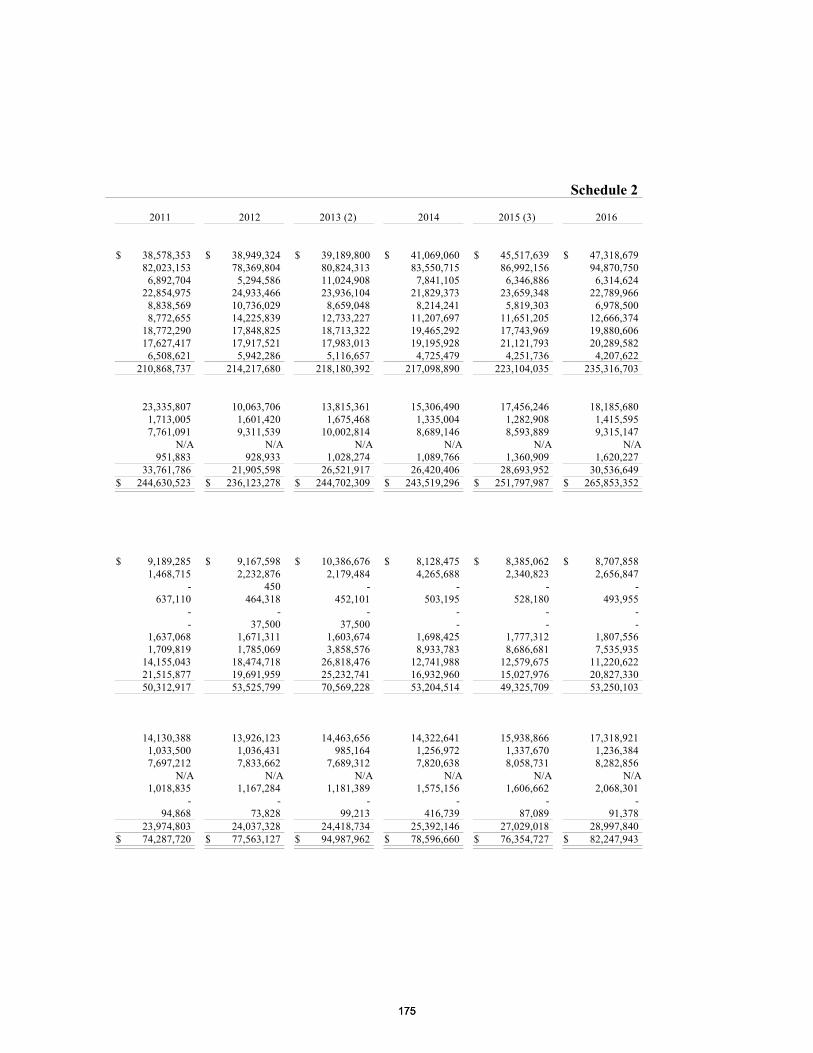
Schedule 2
2011 2012 2013 (2) 2014 2015 (3) 2016
$ 38,578,353 $ 38,949,324 $ 39,189,800 $ 41,069,060 $ 45,517,639 $ 47,318,679 82,023,153 78,369,804 80,824,313 83,550,715 86,992,156 94,870,750
6,892,704 5,294,586 11,024,908 7,841,105 6,346,886 6,314,624 22,854,975 24,933,466 23,936,104 21,829,373 23,659,348 22,789,966
8,838,569 10,736,029 8,659,048 8,214,241 5,819,303 6,978,500 8,772,655 14,225,839 12,733,227 11,207,697 11,651,205 12,666,374
18,772,290 17,848,825 18,713,322 19,465,292 17,743,969 19,880,606 17,627,417 17,917,521 17,983,013 19,195,928 21,121,793 20,289,582
6,508,621 5,942,286 5,116,657 4,725,479 4,251,736 4,207,622 210,868,737 214,217,680 218,180,392 217,098,890 223,104,035 235,316,703
23,335,807 10,063,706 13,815,361 15,306,490 17,456,246 18,185,680 1,713,005 1,601,420 1,675,468 1,335,004 1,282,908 1,415,595 7,761,091 9,311,539 10,002,814 8,689,146 8,593,889 9,315,147
N/A N/A N/A N/A N/A N/A 951,883 928,933 1,028,274 1,089,766 1,360,909 1,620,227
33,761,786 21,905,598 26,521,917 26,420,406 28,693,952 30,536,649 $ 244,630,523 $ 236,123,278 $ 244,702,309 $ 243,519,296 $ 251,797,987 $ 265,853,352
$ 9,189,285 $ 9,167,598 $ 10,386,676 $ 8,128,475 $ 8,385,062 $ 8,707,858 1,468,715 2,232,876 2,179,484 4,265,688 2,340,823 2,656,847
- 450 - - - - 637,110 464,318 452,101 503,195 528,180 493,955
- - - - - - - 37,500 37,500 - - -
1,637,068 1,671,311 1,603,674 1,698,425 1,777,312 1,807,556 1,709,819 1,785,069 3,858,576 8,933,783 8,686,681 7,535,935
14,155,043 18,474,718 26,818,476 12,741,988 12,579,675 11,220,622 21,515,877 19,691,959 25,232,741 16,932,960 15,027,976 20,827,330 50,312,917 53,525,799 70,569,228 53,204,514 49,325,709 53,250,103
14,130,388 13,926,123 14,463,656 14,322,641 15,938,866 17,318,921 1,033,500 1,036,431 985,164 1,256,972 1,337,670 1,236,384 7,697,212 7,833,662 7,689,312 7,820,638 8,058,731 8,282,856
N/A N/A N/A N/A N/A N/A 1,018,835 1,167,284 1,181,389 1,575,156 1,606,662 2,068,301
- - - - - - 94,868 73,828 99,213 416,739 87,089 91,378
23,974,803 24,037,328 24,418,734 25,392,146 27,029,018 28,997,840 $ 74,287,720 $ 77,563,127 $ 94,987,962 $ 78,596,660 $ 76,354,727 $ 82,247,943
175175
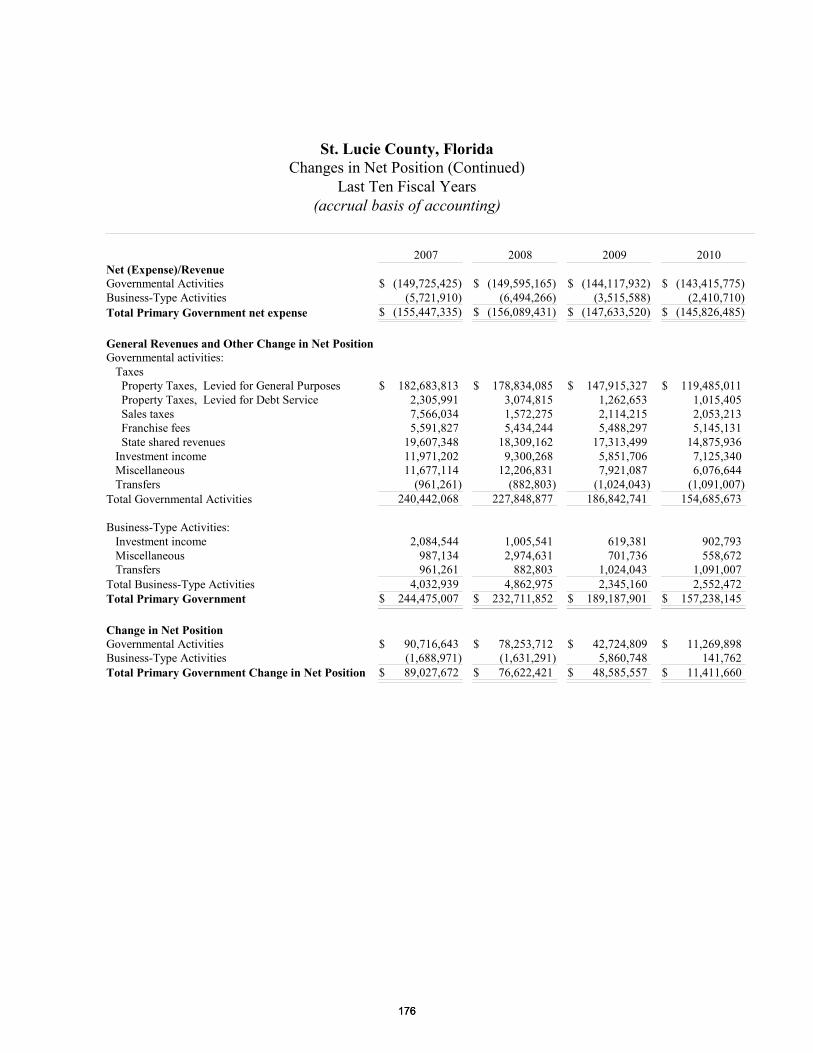
St. Lucie County, FloridaChanges in Net Position (Continued)
Last Ten Fiscal Years(accrual basis of accounting)
2007 2008 2009 2010 Net (Expense)/RevenueGovernmental Activities $ (149,725,425) $ (149,595,165) $ (144,117,932) $ (143,415,775)Business-Type Activities (5,721,910) (6,494,266) (3,515,588) (2,410,710)Total Primary Government net expense $ (155,447,335) $ (156,089,431) $ (147,633,520) $ (145,826,485)
General Revenues and Other Change in Net PositionGovernmental activities: Taxes Property Taxes, Levied for General Purposes $ 182,683,813 $ 178,834,085 $ 147,915,327 $ 119,485,011 Property Taxes, Levied for Debt Service 2,305,991 3,074,815 1,262,653 1,015,405 Sales taxes 7,566,034 1,572,275 2,114,215 2,053,213 Franchise fees 5,591,827 5,434,244 5,488,297 5,145,131 State shared revenues 19,607,348 18,309,162 17,313,499 14,875,936 Investment income 11,971,202 9,300,268 5,851,706 7,125,340 Miscellaneous 11,677,114 12,206,831 7,921,087 6,076,644 Transfers (961,261) (882,803) (1,024,043) (1,091,007)Total Governmental Activities 240,442,068 227,848,877 186,842,741 154,685,673
Business-Type Activities: Investment income 2,084,544 1,005,541 619,381 902,793 Miscellaneous 987,134 2,974,631 701,736 558,672 Transfers 961,261 882,803 1,024,043 1,091,007 Total Business-Type Activities 4,032,939 4,862,975 2,345,160 2,552,472 Total Primary Government $ 244,475,007 $ 232,711,852 $ 189,187,901 $ 157,238,145
Change in Net PositionGovernmental Activities $ 90,716,643 $ 78,253,712 $ 42,724,809 $ 11,269,898 Business-Type Activities (1,688,971) (1,631,291) 5,860,748 141,762 Total Primary Government Change in Net Position $ 89,027,672 $ 76,622,421 $ 48,585,557 $ 11,411,660
176176
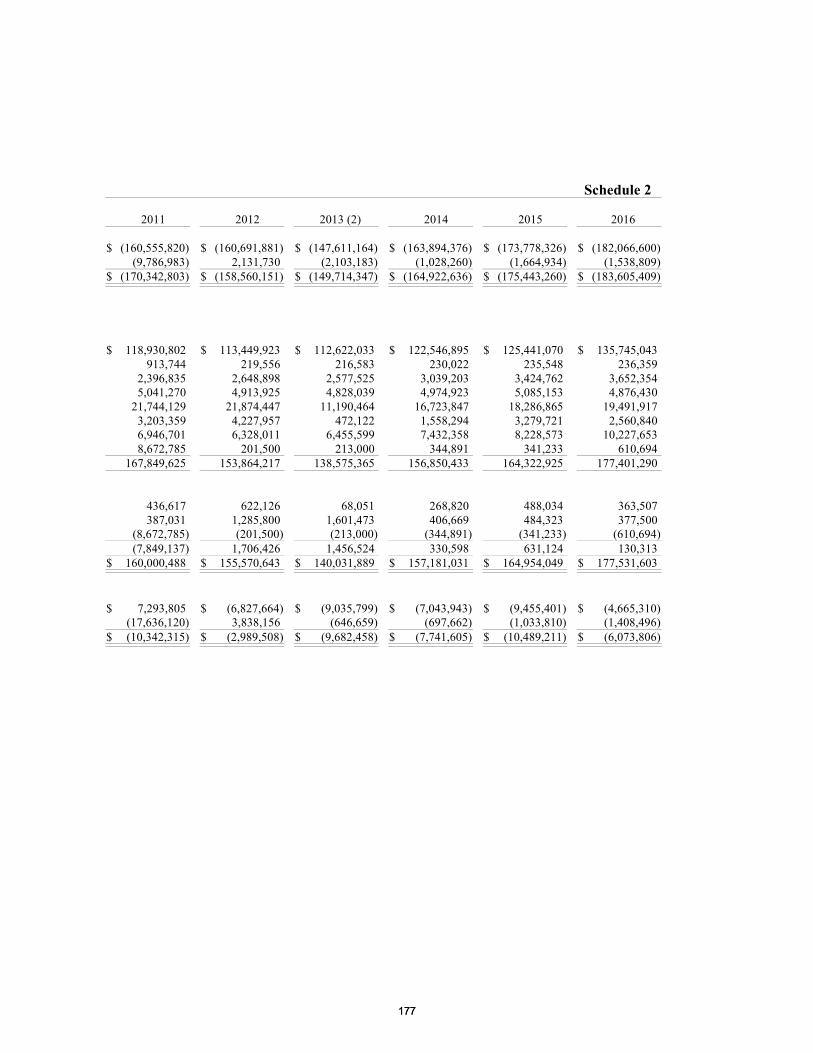
Schedule 2
2011 2012 2013 (2) 2014 2015 2016
$ (160,555,820) $ (160,691,881) $ (147,611,164) $ (163,894,376) $ (173,778,326) $ (182,066,600) (9,786,983) 2,131,730 (2,103,183) (1,028,260) (1,664,934) (1,538,809)
$ (170,342,803) $ (158,560,151) $ (149,714,347) $ (164,922,636) $ (175,443,260) $ (183,605,409)
$ 118,930,802 $ 113,449,923 $ 112,622,033 $ 122,546,895 $ 125,441,070 $ 135,745,043 913,744 219,556 216,583 230,022 235,548 236,359
2,396,835 2,648,898 2,577,525 3,039,203 3,424,762 3,652,354 5,041,270 4,913,925 4,828,039 4,974,923 5,085,153 4,876,430
21,744,129 21,874,447 11,190,464 16,723,847 18,286,865 19,491,917 3,203,359 4,227,957 472,122 1,558,294 3,279,721 2,560,840 6,946,701 6,328,011 6,455,599 7,432,358 8,228,573 10,227,653 8,672,785 201,500 213,000 344,891 341,233 610,694
167,849,625 153,864,217 138,575,365 156,850,433 164,322,925 177,401,290
436,617 622,126 68,051 268,820 488,034 363,507 387,031 1,285,800 1,601,473 406,669 484,323 377,500
(8,672,785) (201,500) (213,000) (344,891) (341,233) (610,694) (7,849,137) 1,706,426 1,456,524 330,598 631,124 130,313
$ 160,000,488 $ 155,570,643 $ 140,031,889 $ 157,181,031 $ 164,954,049 $ 177,531,603
$ 7,293,805 $ (6,827,664) $ (9,035,799) $ (7,043,943) $ (9,455,401) $ (4,665,310) (17,636,120) 3,838,156 (646,659) (697,662) (1,033,810) (1,408,496)
$ (10,342,315) $ (2,989,508) $ (9,682,458) $ (7,741,605) $ (10,489,211) $ (6,073,806)
177177
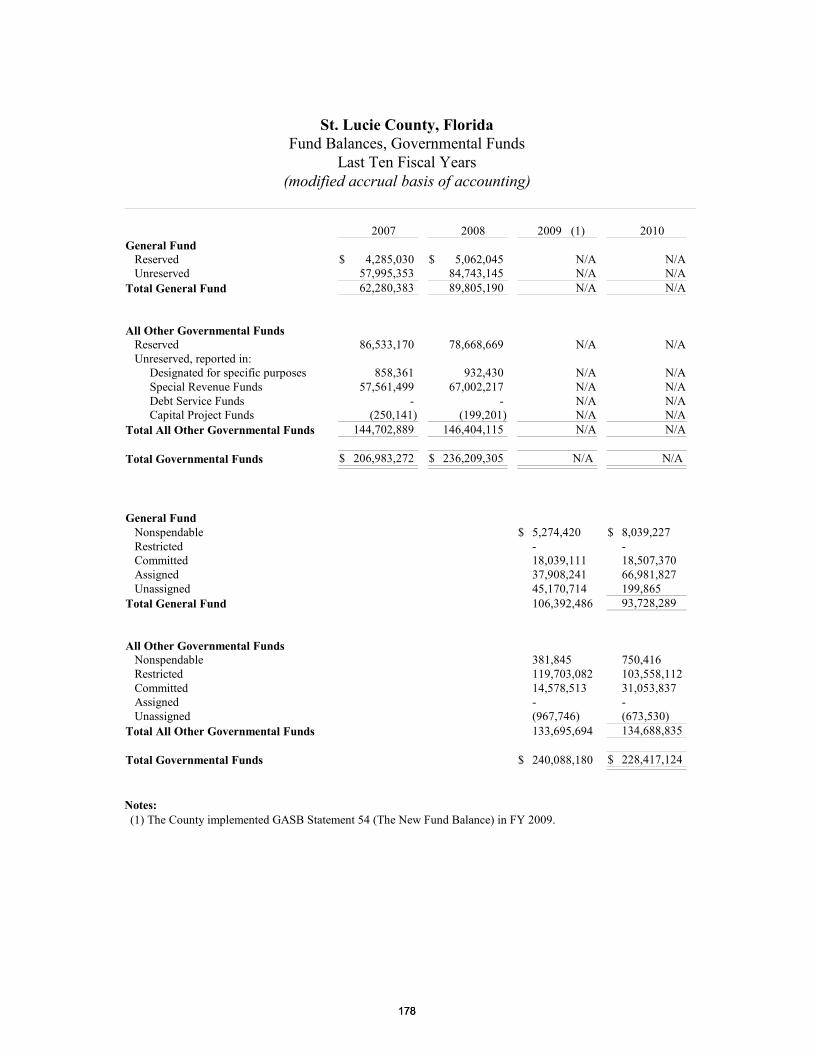
St. Lucie County, FloridaFund Balances, Governmental Funds
Last Ten Fiscal Years(modified accrual basis of accounting)
2007 2008 2009 (1) 2010 General Fund Reserved $ 4,285,030 $ 5,062,045 N/A N/A Unreserved 57,995,353 84,743,145 N/A N/ATotal General Fund 62,280,383 89,805,190 N/A N/A
All Other Governmental Funds Reserved 86,533,170 78,668,669 N/A N/A Unreserved, reported in: Designated for specific purposes 858,361 932,430 N/A N/A Special Revenue Funds 57,561,499 67,002,217 N/A N/A Debt Service Funds - - N/A N/A Capital Project Funds (250,141) (199,201) N/A N/ATotal All Other Governmental Funds 144,702,889 146,404,115 N/A N/A
Total Governmental Funds $ 206,983,272 $ 236,209,305 N/A N/A
General Fund Nonspendable $ 5,274,420 $ 8,039,227 Restricted - - Committed 18,039,111 18,507,370 Assigned 37,908,241 66,981,827 Unassigned 45,170,714 199,865 Total General Fund 106,392,486 93,728,289
All Other Governmental Funds Nonspendable 381,845 750,416 Restricted 119,703,082 103,558,112 Committed 14,578,513 31,053,837 Assigned - - Unassigned (967,746) (673,530)Total All Other Governmental Funds 133,695,694 134,688,835
Total Governmental Funds $ 240,088,180 $ 228,417,124
Notes:(1) The County implemented GASB Statement 54 (The New Fund Balance) in FY 2009.
178178
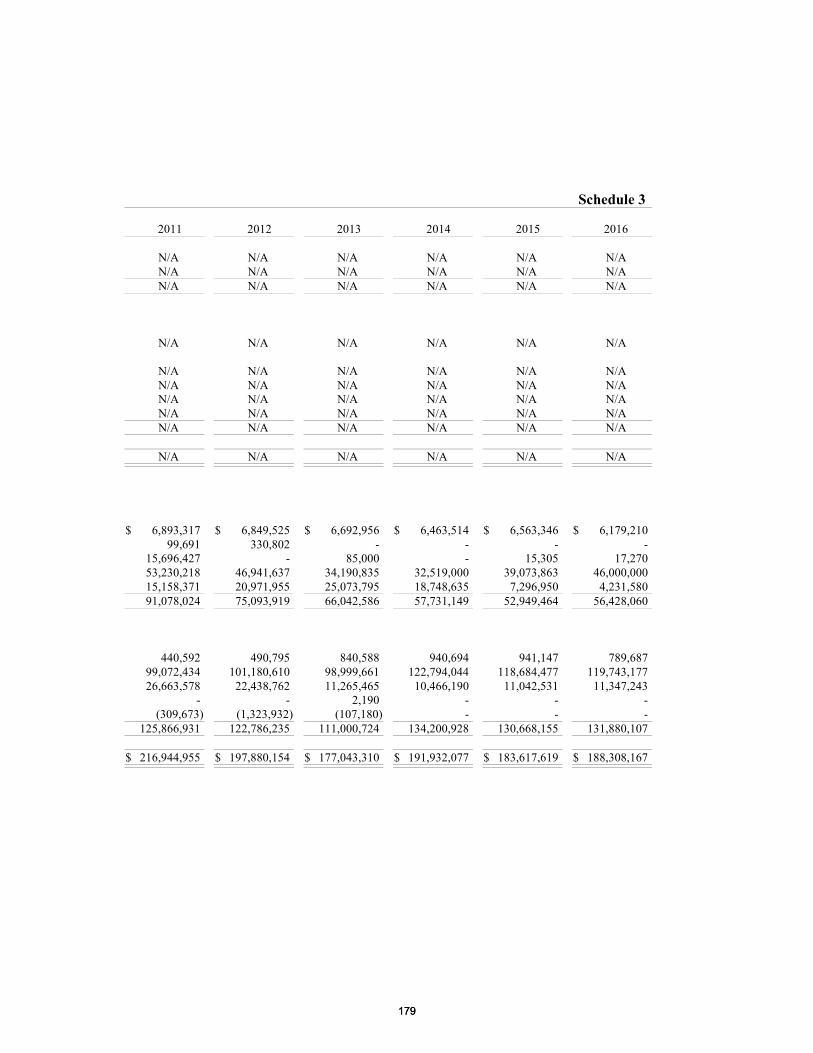
Schedule 3
2011 2012 2013 2014 2015 2016
N/A N/A N/A N/A N/A N/AN/A N/A N/A N/A N/A N/AN/A N/A N/A N/A N/A N/A
N/A N/A N/A N/A N/A N/A
N/A N/A N/A N/A N/A N/AN/A N/A N/A N/A N/A N/AN/A N/A N/A N/A N/A N/AN/A N/A N/A N/A N/A N/AN/A N/A N/A N/A N/A N/A
N/A N/A N/A N/A N/A N/A
$ 6,893,317 $ 6,849,525 $ 6,692,956 $ 6,463,514 $ 6,563,346 $ 6,179,210 99,691 330,802 - - - -
15,696,427 - 85,000 - 15,305 17,270 53,230,218 46,941,637 34,190,835 32,519,000 39,073,863 46,000,000 15,158,371 20,971,955 25,073,795 18,748,635 7,296,950 4,231,580 91,078,024 75,093,919 66,042,586 57,731,149 52,949,464 56,428,060
440,592 490,795 840,588 940,694 941,147 789,687 99,072,434 101,180,610 98,999,661 122,794,044 118,684,477 119,743,177 26,663,578 22,438,762 11,265,465 10,466,190 11,042,531 11,347,243
- - 2,190 - - - (309,673) (1,323,932) (107,180) - - -
125,866,931 122,786,235 111,000,724 134,200,928 130,668,155 131,880,107
$ 216,944,955 $ 197,880,154 $ 177,043,310 $ 191,932,077 $ 183,617,619 $ 188,308,167
179179
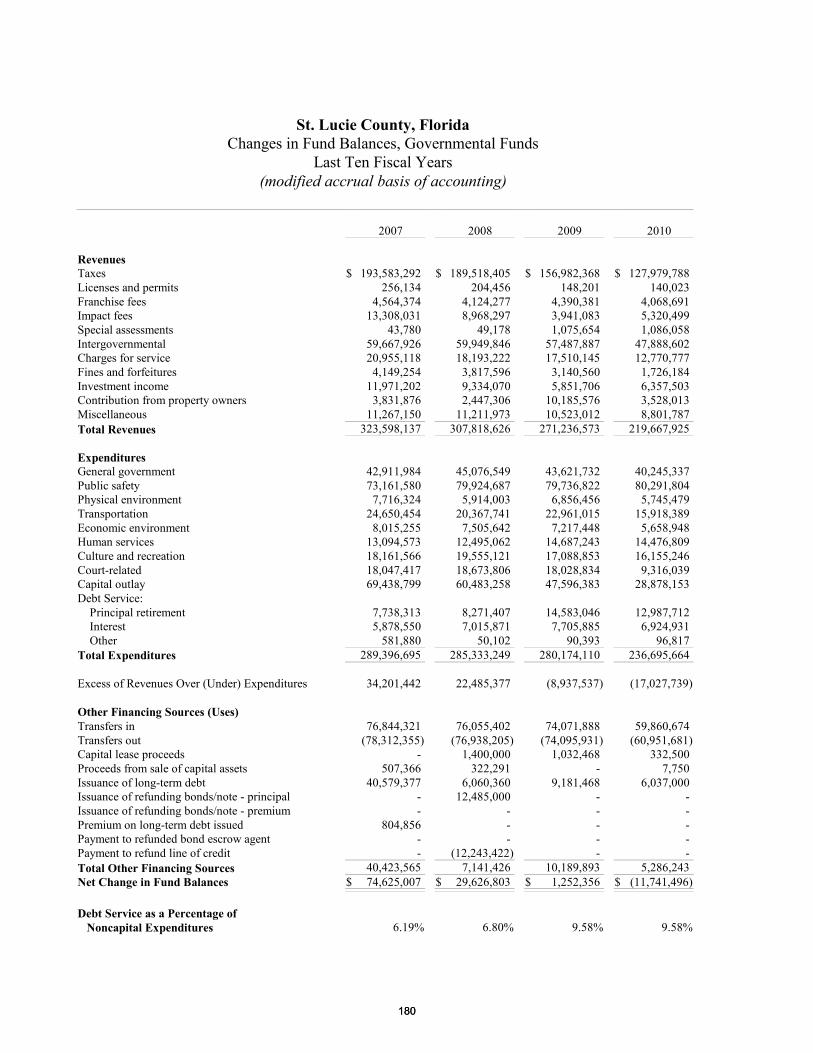
St. Lucie County, FloridaChanges in Fund Balances, Governmental Funds
Last Ten Fiscal Years(modified accrual basis of accounting)
2007 2008 2009 2010
RevenuesTaxes $ 193,583,292 $ 189,518,405 $ 156,982,368 $ 127,979,788 Licenses and permits 256,134 204,456 148,201 140,023 Franchise fees 4,564,374 4,124,277 4,390,381 4,068,691 Impact fees 13,308,031 8,968,297 3,941,083 5,320,499 Special assessments 43,780 49,178 1,075,654 1,086,058 Intergovernmental 59,667,926 59,949,846 57,487,887 47,888,602 Charges for service 20,955,118 18,193,222 17,510,145 12,770,777 Fines and forfeitures 4,149,254 3,817,596 3,140,560 1,726,184 Investment income 11,971,202 9,334,070 5,851,706 6,357,503 Contribution from property owners 3,831,876 2,447,306 10,185,576 3,528,013 Miscellaneous 11,267,150 11,211,973 10,523,012 8,801,787 Total Revenues 323,598,137 307,818,626 271,236,573 219,667,925
ExpendituresGeneral government 42,911,984 45,076,549 43,621,732 40,245,337 Public safety 73,161,580 79,924,687 79,736,822 80,291,804 Physical environment 7,716,324 5,914,003 6,856,456 5,745,479 Transportation 24,650,454 20,367,741 22,961,015 15,918,389 Economic environment 8,015,255 7,505,642 7,217,448 5,658,948 Human services 13,094,573 12,495,062 14,687,243 14,476,809 Culture and recreation 18,161,566 19,555,121 17,088,853 16,155,246 Court-related 18,047,417 18,673,806 18,028,834 9,316,039 Capital outlay 69,438,799 60,483,258 47,596,383 28,878,153 Debt Service: Principal retirement 7,738,313 8,271,407 14,583,046 12,987,712 Interest 5,878,550 7,015,871 7,705,885 6,924,931 Other 581,880 50,102 90,393 96,817 Total Expenditures 289,396,695 285,333,249 280,174,110 236,695,664
Excess of Revenues Over (Under) Expenditures 34,201,442 22,485,377 (8,937,537) (17,027,739)
Other Financing Sources (Uses)Transfers in 76,844,321 76,055,402 74,071,888 59,860,674 Transfers out (78,312,355) (76,938,205) (74,095,931) (60,951,681)Capital lease proceeds - 1,400,000 1,032,468 332,500 Proceeds from sale of capital assets 507,366 322,291 - 7,750 Issuance of long-term debt 40,579,377 6,060,360 9,181,468 6,037,000 Issuance of refunding bonds/note - principal - 12,485,000 - - Issuance of refunding bonds/note - premium - - - - Premium on long-term debt issued 804,856 - - - Payment to refunded bond escrow agent - - - - Payment to refund line of credit - (12,243,422) - - Total Other Financing Sources 40,423,565 7,141,426 10,189,893 5,286,243 Net Change in Fund Balances $ 74,625,007 $ 29,626,803 $ 1,252,356 $ (11,741,496)
Debt Service as a Percentage of Noncapital Expenditures 6.19% 6.80% 9.58% 9.58%
180180
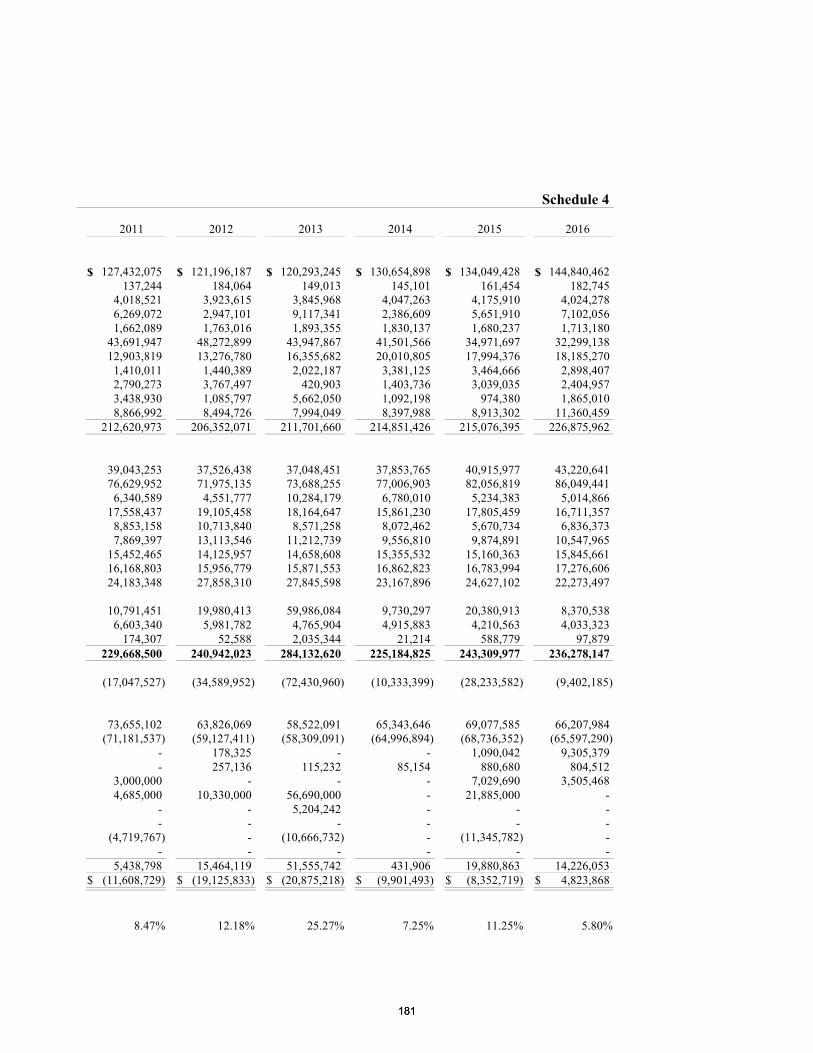
Schedule 4
2011 2012 2013 2014 2015 2016
$ 127,432,075 $ 121,196,187 $ 120,293,245 $ 130,654,898 $ 134,049,428 $ 144,840,462 137,244 184,064 149,013 145,101 161,454 182,745
4,018,521 3,923,615 3,845,968 4,047,263 4,175,910 4,024,278 6,269,072 2,947,101 9,117,341 2,386,609 5,651,910 7,102,056 1,662,089 1,763,016 1,893,355 1,830,137 1,680,237 1,713,180
43,691,947 48,272,899 43,947,867 41,501,566 34,971,697 32,299,138 12,903,819 13,276,780 16,355,682 20,010,805 17,994,376 18,185,270
1,410,011 1,440,389 2,022,187 3,381,125 3,464,666 2,898,407 2,790,273 3,767,497 420,903 1,403,736 3,039,035 2,404,957 3,438,930 1,085,797 5,662,050 1,092,198 974,380 1,865,010 8,866,992 8,494,726 7,994,049 8,397,988 8,913,302 11,360,459
212,620,973 206,352,071 211,701,660 214,851,426 215,076,395 226,875,962
39,043,253 37,526,438 37,048,451 37,853,765 40,915,977 43,220,641 76,629,952 71,975,135 73,688,255 77,006,903 82,056,819 86,049,441
6,340,589 4,551,777 10,284,179 6,780,010 5,234,383 5,014,866 17,558,437 19,105,458 18,164,647 15,861,230 17,805,459 16,711,357
8,853,158 10,713,840 8,571,258 8,072,462 5,670,734 6,836,373 7,869,397 13,113,546 11,212,739 9,556,810 9,874,891 10,547,965
15,452,465 14,125,957 14,658,608 15,355,532 15,160,363 15,845,661 16,168,803 15,956,779 15,871,553 16,862,823 16,783,994 17,276,606 24,183,348 27,858,310 27,845,598 23,167,896 24,627,102 22,273,497
10,791,451 19,980,413 59,986,084 9,730,297 20,380,913 8,370,538 6,603,340 5,981,782 4,765,904 4,915,883 4,210,563 4,033,323
174,307 52,588 2,035,344 21,214 588,779 97,879 229,668,500 240,942,023 284,132,620 225,184,825 243,309,977 236,278,147
(17,047,527) (34,589,952) (72,430,960) (10,333,399) (28,233,582) (9,402,185)
73,655,102 63,826,069 58,522,091 65,343,646 69,077,585 66,207,984 (71,181,537) (59,127,411) (58,309,091) (64,996,894) (68,736,352) (65,597,290)
- 178,325 - - 1,090,042 9,305,379 - 257,136 115,232 85,154 880,680 804,512
3,000,000 - - - 7,029,690 3,505,468 4,685,000 10,330,000 56,690,000 - 21,885,000 -
- - 5,204,242 - - - - - - - - -
(4,719,767) - (10,666,732) - (11,345,782) - - - - - - -
5,438,798 15,464,119 51,555,742 431,906 19,880,863 14,226,053 $ (11,608,729) $ (19,125,833) $ (20,875,218) $ (9,901,493) $ (8,352,719) $ 4,823,868
8.47% 12.18% 25.27% 7.25% 11.25% 5.80%
181181
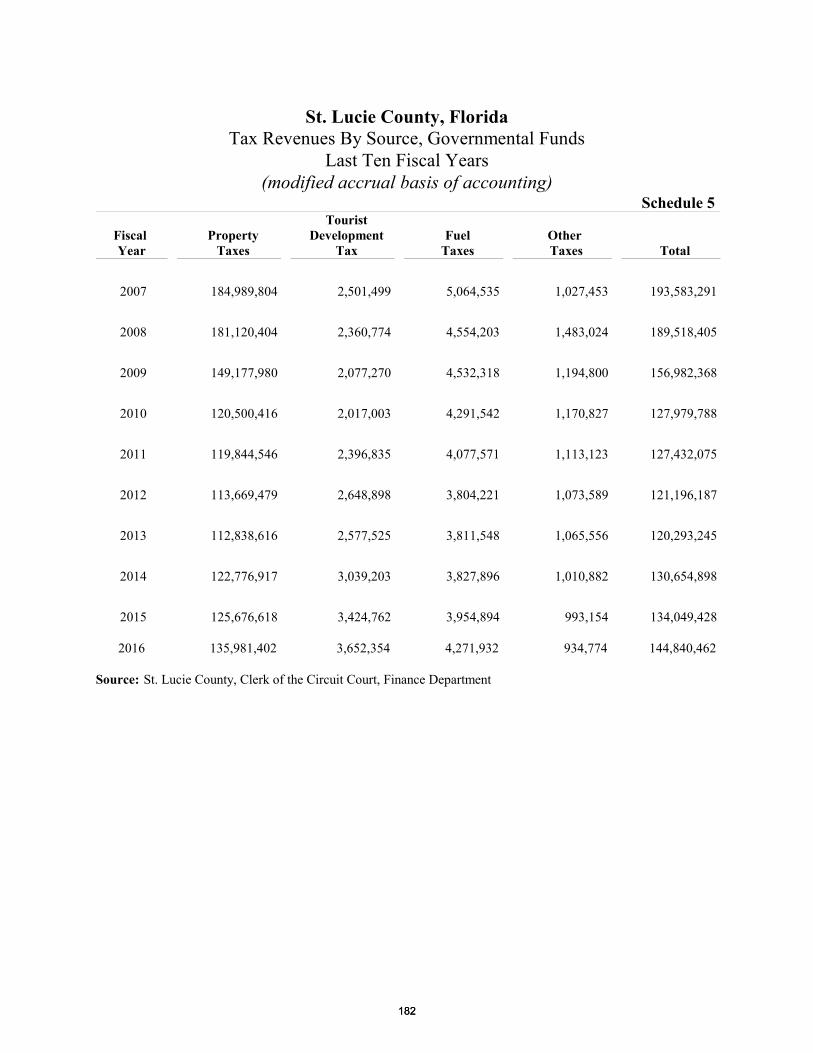
St. Lucie County, FloridaTax Revenues By Source, Governmental Funds
Last Ten Fiscal Years(modified accrual basis of accounting)
Schedule 5Tourist
Fiscal Property Development Fuel Other Year Taxes Tax Taxes Taxes Total
2007 184,989,804 2,501,499 5,064,535 1,027,453 193,583,291
2008 181,120,404 2,360,774 4,554,203 1,483,024 189,518,405
2009 149,177,980 2,077,270 4,532,318 1,194,800 156,982,368
2010 120,500,416 2,017,003 4,291,542 1,170,827 127,979,788
2011 119,844,546 2,396,835 4,077,571 1,113,123 127,432,075
2012 113,669,479 2,648,898 3,804,221 1,073,589 121,196,187
2013 112,838,616 2,577,525 3,811,548 1,065,556 120,293,245
2014 122,776,917 3,039,203 3,827,896 1,010,882 130,654,898
2015 125,676,618 3,424,762 3,954,894 993,154 134,049,428
2016 135,981,402 3,652,354 4,271,932 934,774 144,840,462
Source: St. Lucie County, Clerk of the Circuit Court, Finance Department
182182

THIS PAGE INTENTIONALLY LEFT BLANK
183183
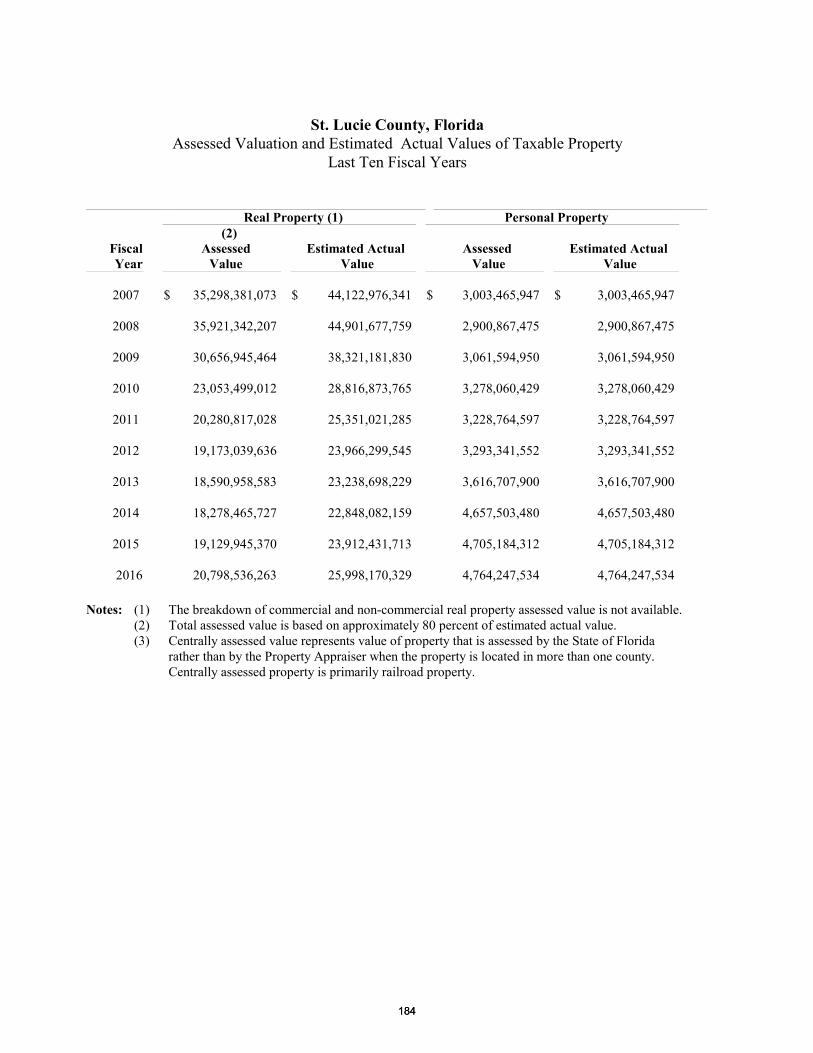
St. Lucie County, FloridaAssessed Valuation and Estimated Actual Values of Taxable Property
Last Ten Fiscal Years
Real Property (1) Personal Property (2)
Fiscal Assessed Estimated Actual Assessed Estimated Actual Year Value Value Value Value
2007 $ 35,298,381,073 $ 44,122,976,341 $ 3,003,465,947 $ 3,003,465,947
2008 35,921,342,207 44,901,677,759 2,900,867,475 2,900,867,475
2009 30,656,945,464 38,321,181,830 3,061,594,950 3,061,594,950
2010 23,053,499,012 28,816,873,765 3,278,060,429 3,278,060,429
2011 20,280,817,028 25,351,021,285 3,228,764,597 3,228,764,597
2012 19,173,039,636 23,966,299,545 3,293,341,552 3,293,341,552
2013 18,590,958,583 23,238,698,229 3,616,707,900 3,616,707,900
2014 18,278,465,727 22,848,082,159 4,657,503,480 4,657,503,480
2015 19,129,945,370 23,912,431,713 4,705,184,312 4,705,184,312
2016 20,798,536,263 25,998,170,329 4,764,247,534 4,764,247,534
Notes: (1) The breakdown of commercial and non-commercial real property assessed value is not available.(2) Total assessed value is based on approximately 80 percent of estimated actual value.(3) Centrally assessed value represents value of property that is assessed by the State of Florida
rather than by the Property Appraiser when the property is located in more than one county. Centrally assessed property is primarily railroad property.
184184
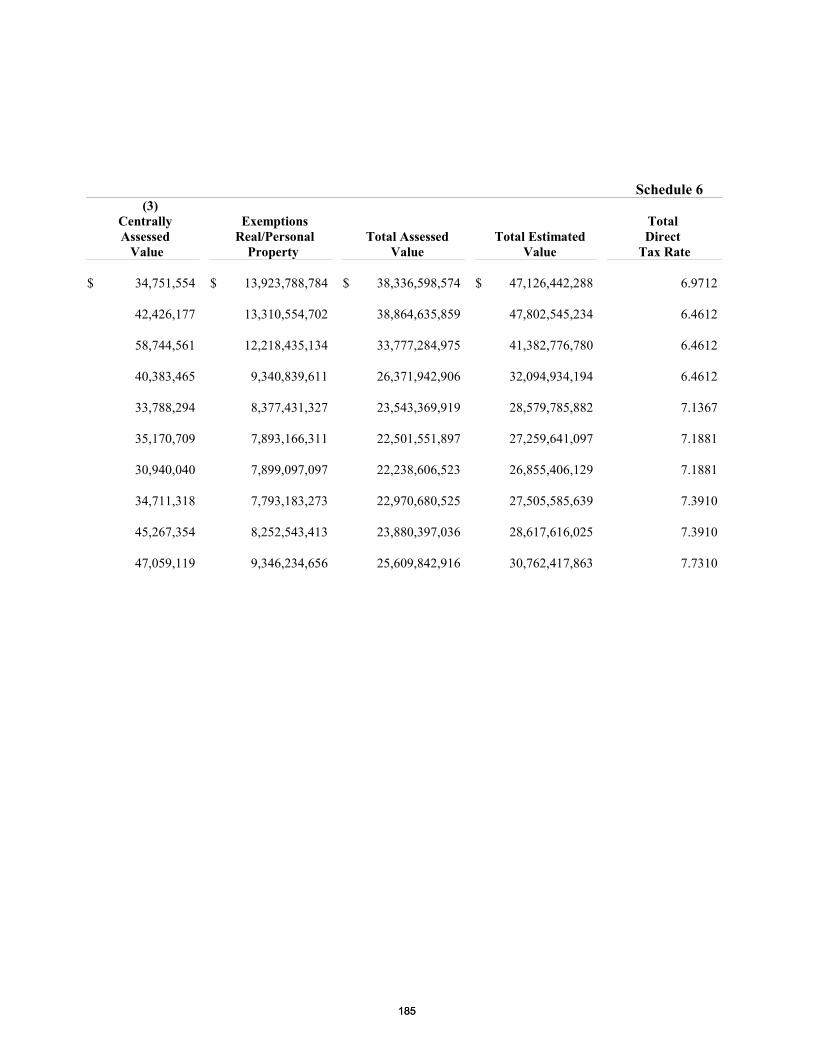
Schedule 6 (3)
Centrally Exemptions Total Assessed Real/Personal Total Assessed Total Estimated Direct
Value Property Value Value Tax Rate
$ 34,751,554 $ 13,923,788,784 $ 38,336,598,574 $ 47,126,442,288 6.9712
42,426,177 13,310,554,702 38,864,635,859 47,802,545,234 6.4612
58,744,561 12,218,435,134 33,777,284,975 41,382,776,780 6.4612
40,383,465 9,340,839,611 26,371,942,906 32,094,934,194 6.4612
33,788,294 8,377,431,327 23,543,369,919 28,579,785,882 7.1367
35,170,709 7,893,166,311 22,501,551,897 27,259,641,097 7.1881
30,940,040 7,899,097,097 22,238,606,523 26,855,406,129 7.1881
34,711,318 7,793,183,273 22,970,680,525 27,505,585,639 7.3910
45,267,354 8,252,543,413 23,880,397,036 28,617,616,025 7.3910
47,059,119 9,346,234,656 25,609,842,916 30,762,417,863 7.7310
185185
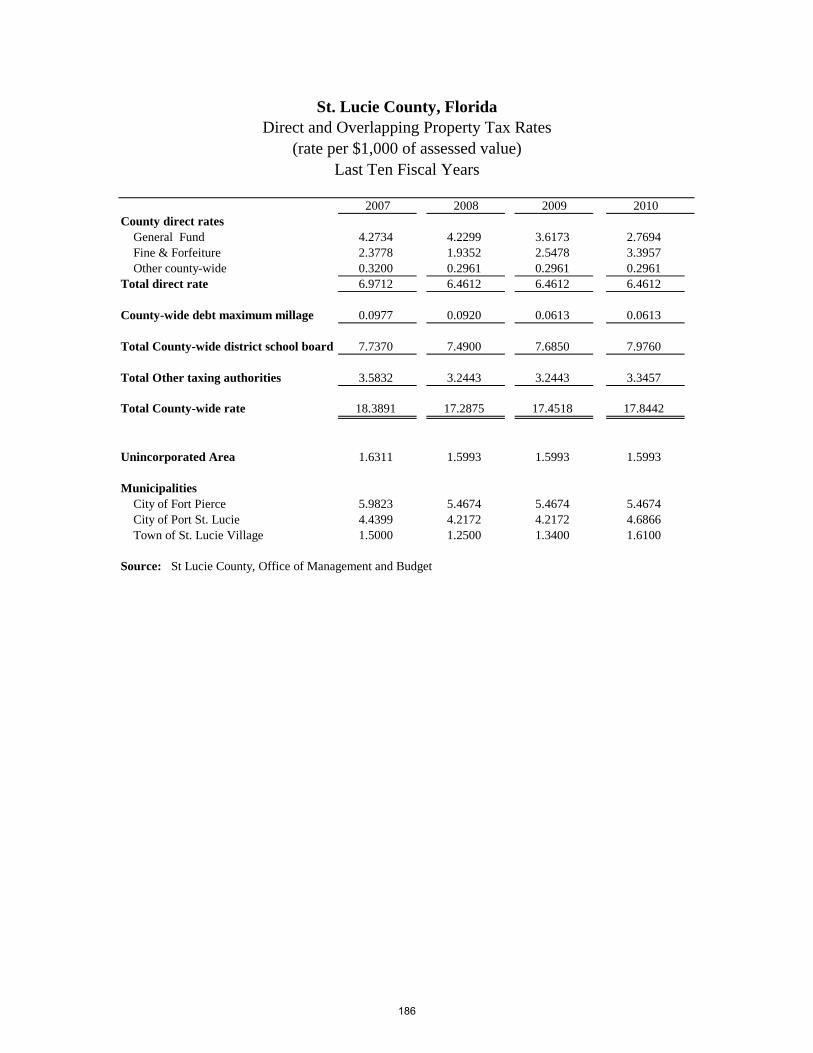
2007 2008 2009 2010
County direct rates
General Fund 4.2734 4.2299 3.6173 2.7694
Fine & Forfeiture 2.3778 1.9352 2.5478 3.3957
Other county-wide 0.3200 0.2961 0.2961 0.2961
Total direct rate 6.9712 6.4612 6.4612 6.4612
County-wide debt maximum millage 0.0977 0.0920 0.0613 0.0613
Total County-wide district school board 7.7370 7.4900 7.6850 7.9760
Total Other taxing authorities 3.5832 3.2443 3.2443 3.3457
Total County-wide rate 18.3891 17.2875 17.4518 17.8442
Unincorporated Area 1.6311 1.5993 1.5993 1.5993
Municipalities
City of Fort Pierce 5.9823 5.4674 5.4674 5.4674
City of Port St. Lucie 4.4399 4.2172 4.2172 4.6866
Town of St. Lucie Village 1.5000 1.2500 1.3400 1.6100
Source: St Lucie County, Office of Management and Budget
St. Lucie County, Florida
Direct and Overlapping Property Tax Rates
(rate per $1,000 of assessed value)
Last Ten Fiscal Years
186
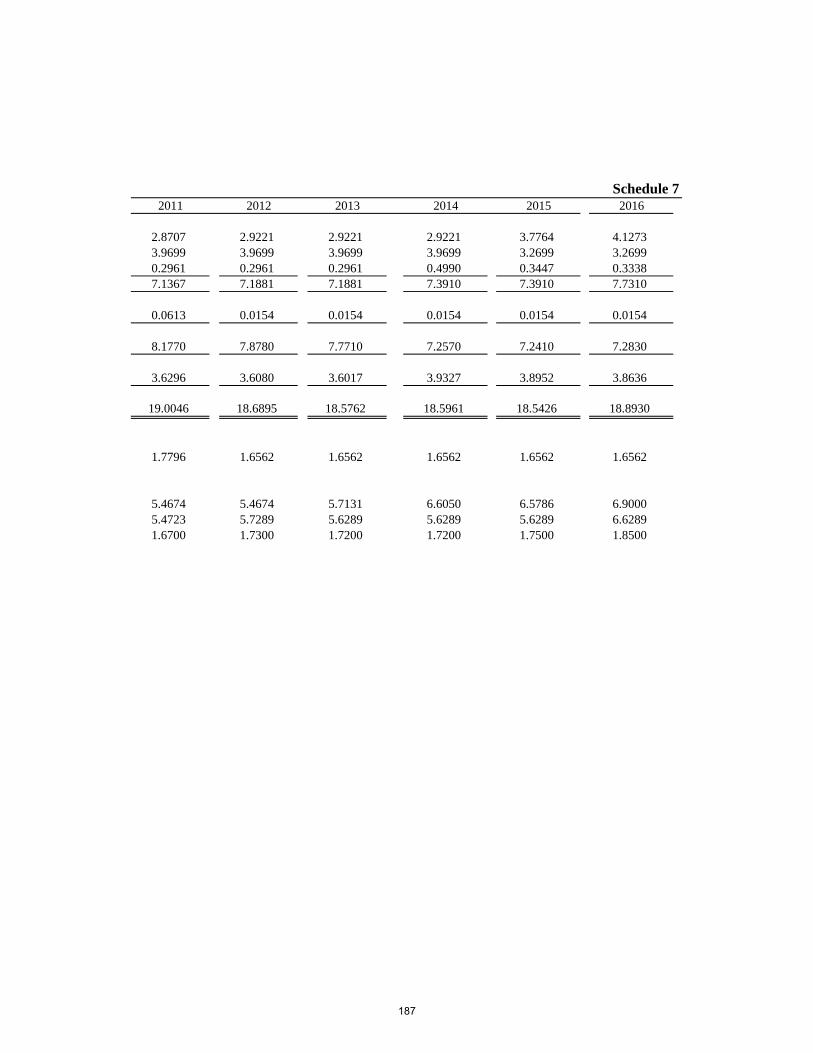
Schedule 7
2011 2012 2013 2014 2015 2016
2.8707 2.9221 2.9221 2.9221 3.7764 4.1273
3.9699 3.9699 3.9699 3.9699 3.2699 3.2699
0.2961 0.2961 0.2961 0.4990 0.3447 0.3338
7.1367 7.1881 7.1881 7.3910 7.3910 7.7310
0.0613 0.0154 0.0154 0.0154 0.0154 0.0154
8.1770 7.8780 7.7710 7.2570 7.2410 7.2830
3.6296 3.6080 3.6017 3.9327 3.8952 3.8636
19.0046 18.6895 18.5762 18.5961 18.5426 18.8930
1.7796 1.6562 1.6562 1.6562 1.6562 1.6562
5.4674 5.4674 5.7131 6.6050 6.5786 6.9000
5.4723 5.7289 5.6289 5.6289 5.6289 6.6289
1.6700 1.7300 1.7200 1.7200 1.7500 1.8500
187
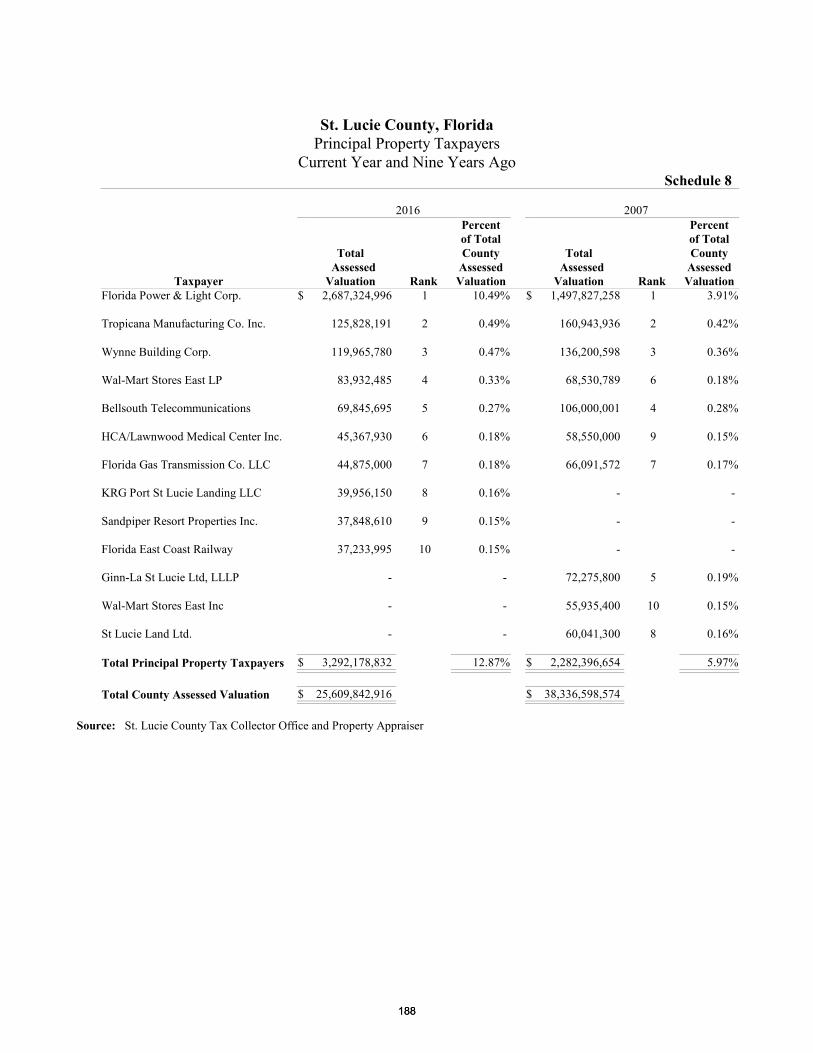
St. Lucie County, FloridaPrincipal Property Taxpayers
Current Year and Nine Years AgoSchedule 8
2016 2007Percent Percentof Total of Total
Total County Total County Assessed Assessed Assessed Assessed
Taxpayer Valuation Rank Valuation Valuation Rank ValuationFlorida Power & Light Corp. $ 2,687,324,996 1 10.49% $ 1,497,827,258 1 3.91%
Tropicana Manufacturing Co. Inc. 125,828,191 2 0.49% 160,943,936 2 0.42%
Wynne Building Corp. 119,965,780 3 0.47% 136,200,598 3 0.36%
Wal-Mart Stores East LP 83,932,485 4 0.33% 68,530,789 6 0.18%
Bellsouth Telecommunications 69,845,695 5 0.27% 106,000,001 4 0.28%
HCA/Lawnwood Medical Center Inc. 45,367,930 6 0.18% 58,550,000 9 0.15%
Florida Gas Transmission Co. LLC 44,875,000 7 0.18% 66,091,572 7 0.17%
KRG Port St Lucie Landing LLC 39,956,150 8 0.16% - -
Sandpiper Resort Properties Inc. 37,848,610 9 0.15% - -
Florida East Coast Railway 37,233,995 10 0.15% - -
Ginn-La St Lucie Ltd, LLLP - - 72,275,800 5 0.19%
Wal-Mart Stores East Inc - - 55,935,400 10 0.15%
St Lucie Land Ltd. - - 60,041,300 8 0.16%
Total Principal Property Taxpayers $ 3,292,178,832 12.87% $ 2,282,396,654 5.97%
Total County Assessed Valuation $ 25,609,842,916 $ 38,336,598,574
Source: St. Lucie County Tax Collector Office and Property Appraiser
188188
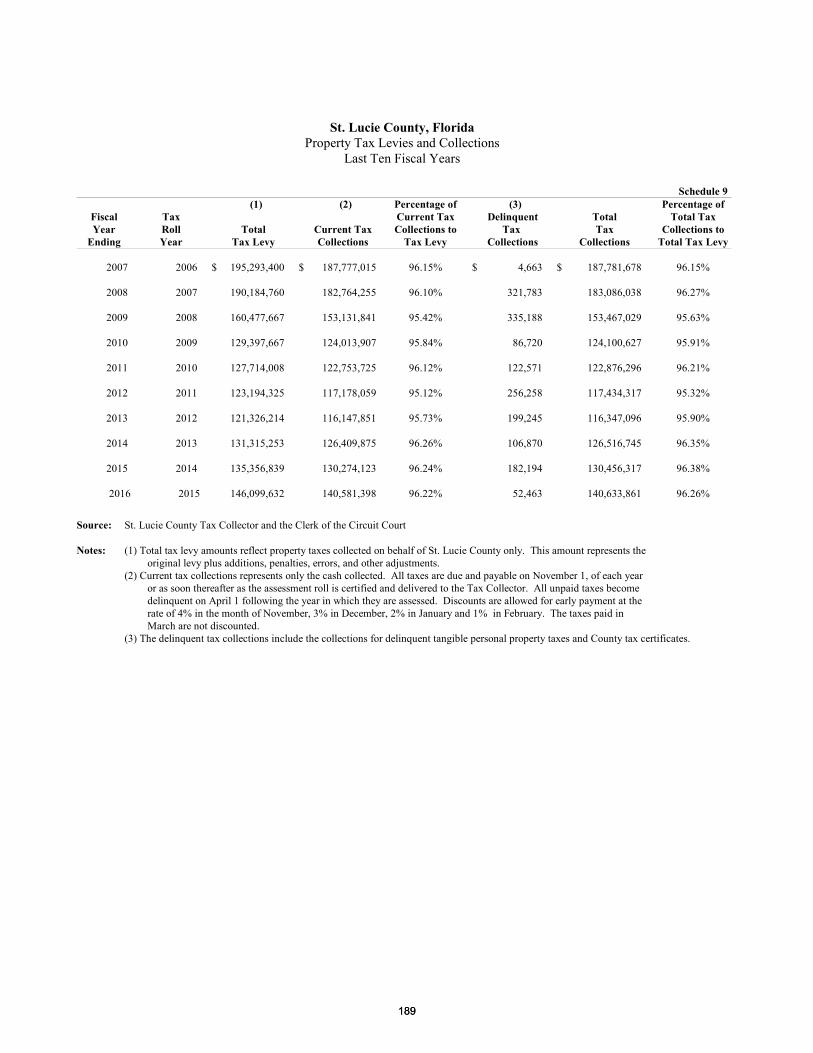
St. Lucie County, FloridaProperty Tax Levies and Collections
Last Ten Fiscal Years
Schedule 9 (1) (2) Percentage of (3) Percentage of
Fiscal Tax Current Tax Delinquent Total Total TaxYear Roll Total Current Tax Collections to Tax Tax Collections to
Ending Year Tax Levy Collections Tax Levy Collections Collections Total Tax Levy
2007 2006 $ 195,293,400 $ 187,777,015 96.15% $ 4,663 $ 187,781,678 96.15%
2008 2007 190,184,760 182,764,255 96.10% 321,783 183,086,038 96.27%
2009 2008 160,477,667 153,131,841 95.42% 335,188 153,467,029 95.63%
2010 2009 129,397,667 124,013,907 95.84% 86,720 124,100,627 95.91%
2011 2010 127,714,008 122,753,725 96.12% 122,571 122,876,296 96.21%
2012 2011 123,194,325 117,178,059 95.12% 256,258 117,434,317 95.32%
2013 2012 121,326,214 116,147,851 95.73% 199,245 116,347,096 95.90%
2014 2013 131,315,253 126,409,875 96.26% 106,870 126,516,745 96.35%
2015 2014 135,356,839 130,274,123 96.24% 182,194 130,456,317 96.38%
2016 2015 146,099,632 140,581,398 96.22% 52,463 140,633,861 96.26%
Source: St. Lucie County Tax Collector and the Clerk of the Circuit Court
Notes: (1) Total tax levy amounts reflect property taxes collected on behalf of St. Lucie County only. This amount represents theoriginal levy plus additions, penalties, errors, and other adjustments.
(2) Current tax collections represents only the cash collected. All taxes are due and payable on November 1, of each yearor as soon thereafter as the assessment roll is certified and delivered to the Tax Collector. All unpaid taxes becomedelinquent on April 1 following the year in which they are assessed. Discounts are allowed for early payment at therate of 4% in the month of November, 3% in December, 2% in January and 1% in February. The taxes paid inMarch are not discounted.
(3) The delinquent tax collections include the collections for delinquent tangible personal property taxes and County tax certificates.
189189
St. Lucie County, FloridaComputation of Legal Debt Margin
September 30, 2016Schedule 10
The Constitution of the State of Florida, Florida Statute 200.181, and St. Lucie County set no legaldebt limit.
190190

THIS PAGE INTENTIONALLY LEFT BLANK
191191
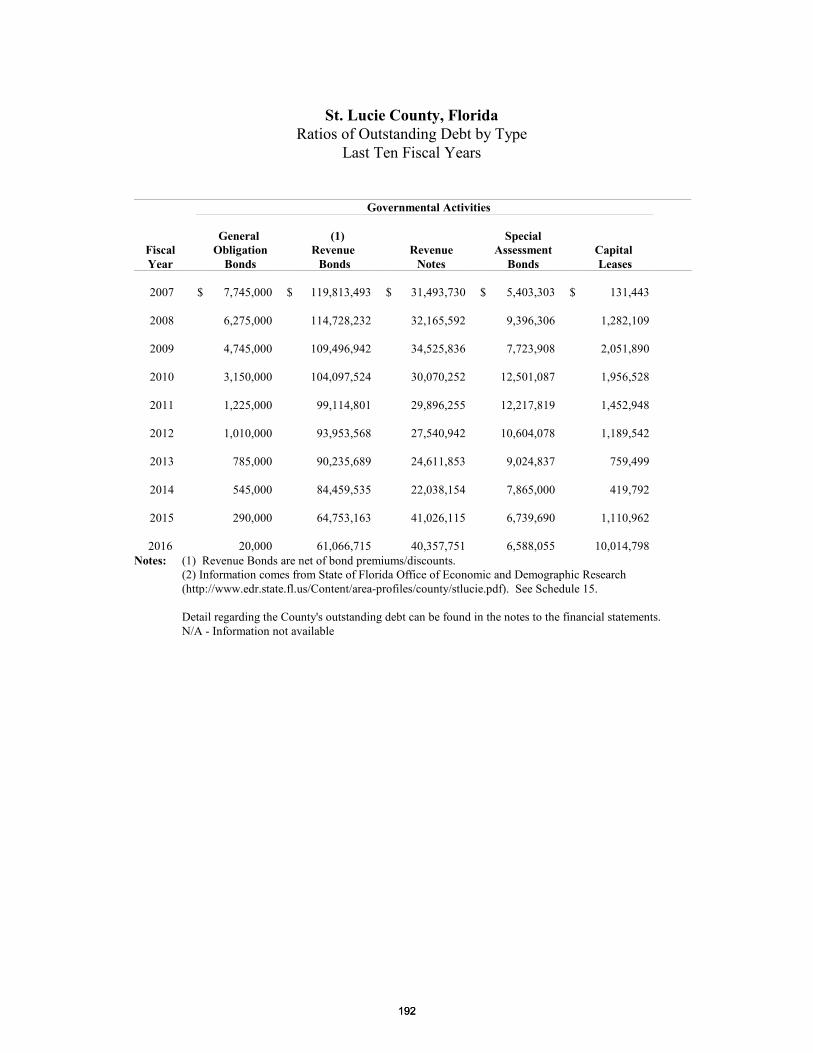
St. Lucie County, FloridaRatios of Outstanding Debt by Type
Last Ten Fiscal Years
Governmental Activities
General (1) SpecialFiscal Obligation Revenue Revenue Assessment Capital Year Bonds Bonds Notes Bonds Leases
2007 $ 7,745,000 $ 119,813,493 $ 31,493,730 $ 5,403,303 $ 131,443
2008 6,275,000 114,728,232 32,165,592 9,396,306 1,282,109
2009 4,745,000 109,496,942 34,525,836 7,723,908 2,051,890
2010 3,150,000 104,097,524 30,070,252 12,501,087 1,956,528
2011 1,225,000 99,114,801 29,896,255 12,217,819 1,452,948
2012 1,010,000 93,953,568 27,540,942 10,604,078 1,189,542
2013 785,000 90,235,689 24,611,853 9,024,837 759,499
2014 545,000 84,459,535 22,038,154 7,865,000 419,792
2015 290,000 64,753,163 41,026,115 6,739,690 1,110,962
2016 20,000 61,066,715 40,357,751 6,588,055 10,014,798 Notes: (1) Revenue Bonds are net of bond premiums/discounts.
(2) Information comes from State of Florida Office of Economic and Demographic Research(http://www.edr.state.fl.us/Content/area-profiles/county/stlucie.pdf). See Schedule 15.
Detail regarding the County's outstanding debt can be found in the notes to the financial statements.N/A - Information not available
192192
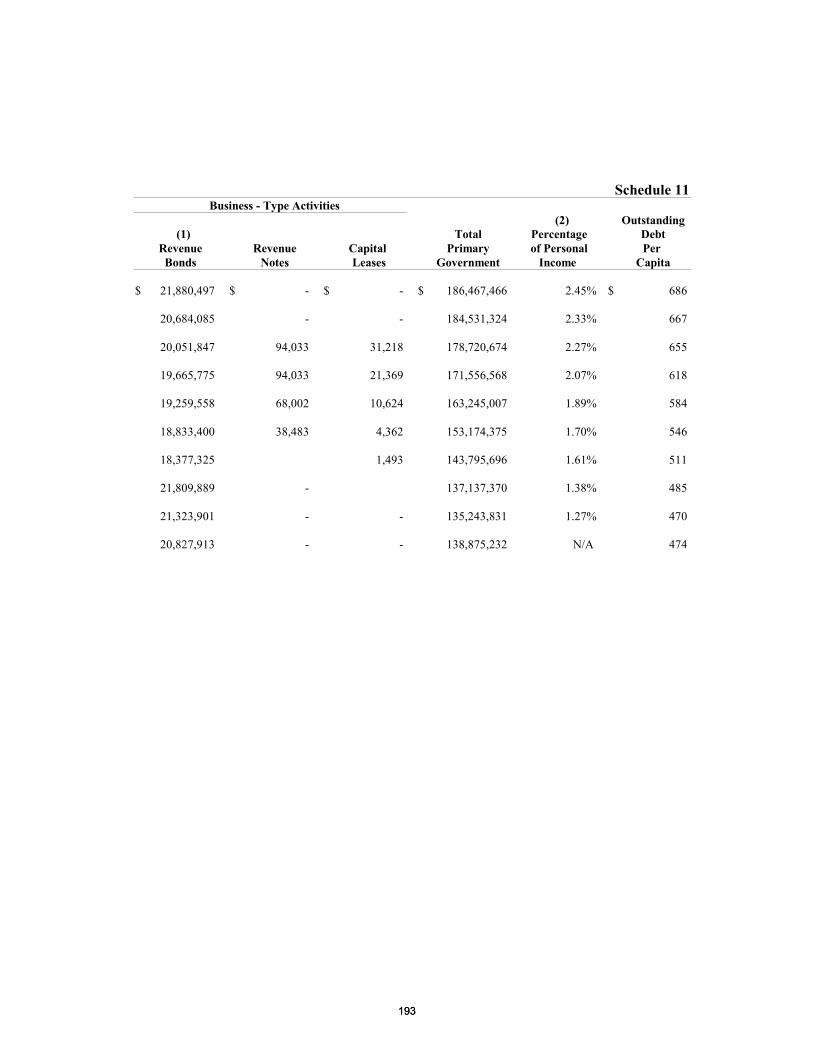
Schedule 11Business - Type Activities
(2) Outstanding (1) Total Percentage Debt
Revenue Revenue Capital Primary of Personal Per Bonds Notes Leases Government Income Capita
$ 21,880,497 $ - $ - $ 186,467,466 2.45% $ 686
20,684,085 - - 184,531,324 2.33% 667
20,051,847 94,033 31,218 178,720,674 2.27% 655
19,665,775 94,033 21,369 171,556,568 2.07% 618
19,259,558 68,002 10,624 163,245,007 1.89% 584
18,833,400 38,483 4,362 153,174,375 1.70% 546
18,377,325 1,493 143,795,696 1.61% 511
21,809,889 - 137,137,370 1.38% 485
21,323,901 - - 135,243,831 1.27% 470
20,827,913 - - 138,875,232 N/A 474
193193
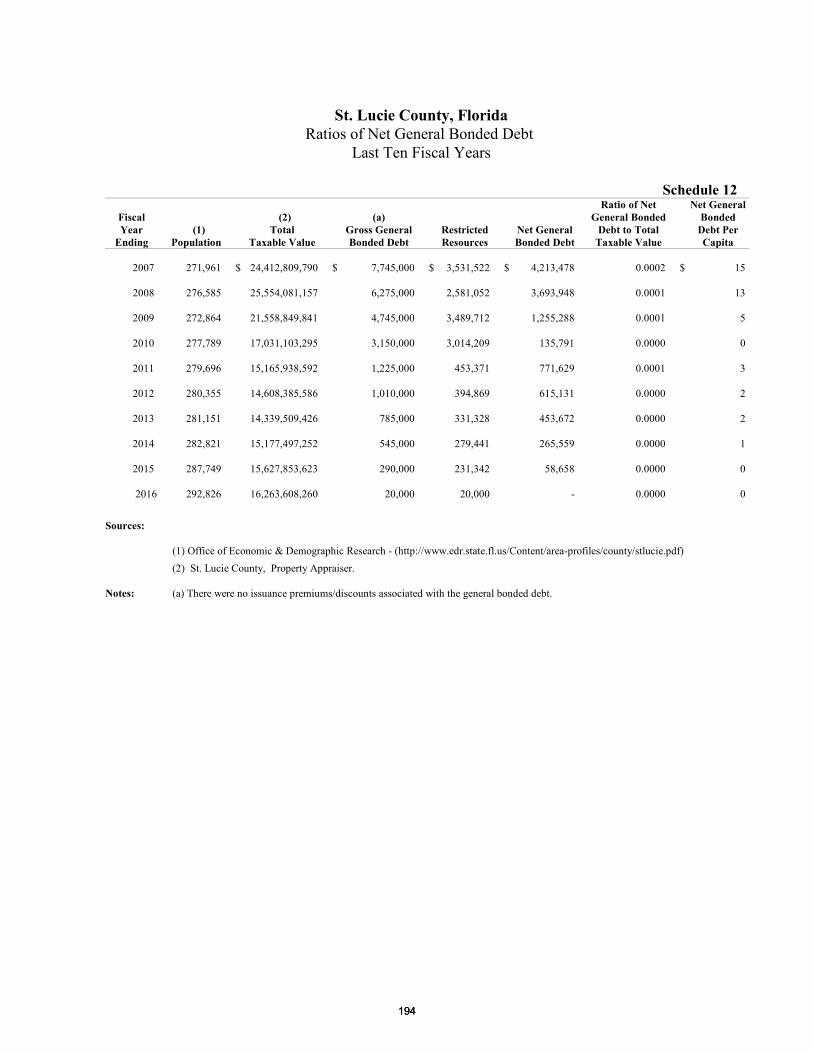
St. Lucie County, FloridaRatios of Net General Bonded Debt
Last Ten Fiscal Years
Schedule 12Ratio of Net Net General
Fiscal (2) (a) General Bonded BondedYear (1) Total Gross General Restricted Net General Debt to Total Debt Per
Ending Population Taxable Value Bonded Debt Resources Bonded Debt Taxable Value Capita
2007 271,961 $ 24,412,809,790 $ 7,745,000 $ 3,531,522 $ 4,213,478 0.0002 $ 15
2008 276,585 25,554,081,157 6,275,000 2,581,052 3,693,948 0.0001 13
2009 272,864 21,558,849,841 4,745,000 3,489,712 1,255,288 0.0001 5
2010 277,789 17,031,103,295 3,150,000 3,014,209 135,791 0.0000 0
2011 279,696 15,165,938,592 1,225,000 453,371 771,629 0.0001 3
2012 280,355 14,608,385,586 1,010,000 394,869 615,131 0.0000 2
2013 281,151 14,339,509,426 785,000 331,328 453,672 0.0000 2
2014 282,821 15,177,497,252 545,000 279,441 265,559 0.0000 1
2015 287,749 15,627,853,623 290,000 231,342 58,658 0.0000 0
2016 292,826 16,263,608,260 20,000 20,000 - 0.0000 0
Sources:
(1) Office of Economic & Demographic Research - (http://www.edr.state.fl.us/Content/area-profiles/county/stlucie.pdf)(2) St. Lucie County, Property Appraiser.
Notes: (a) There were no issuance premiums/discounts associated with the general bonded debt.
194194
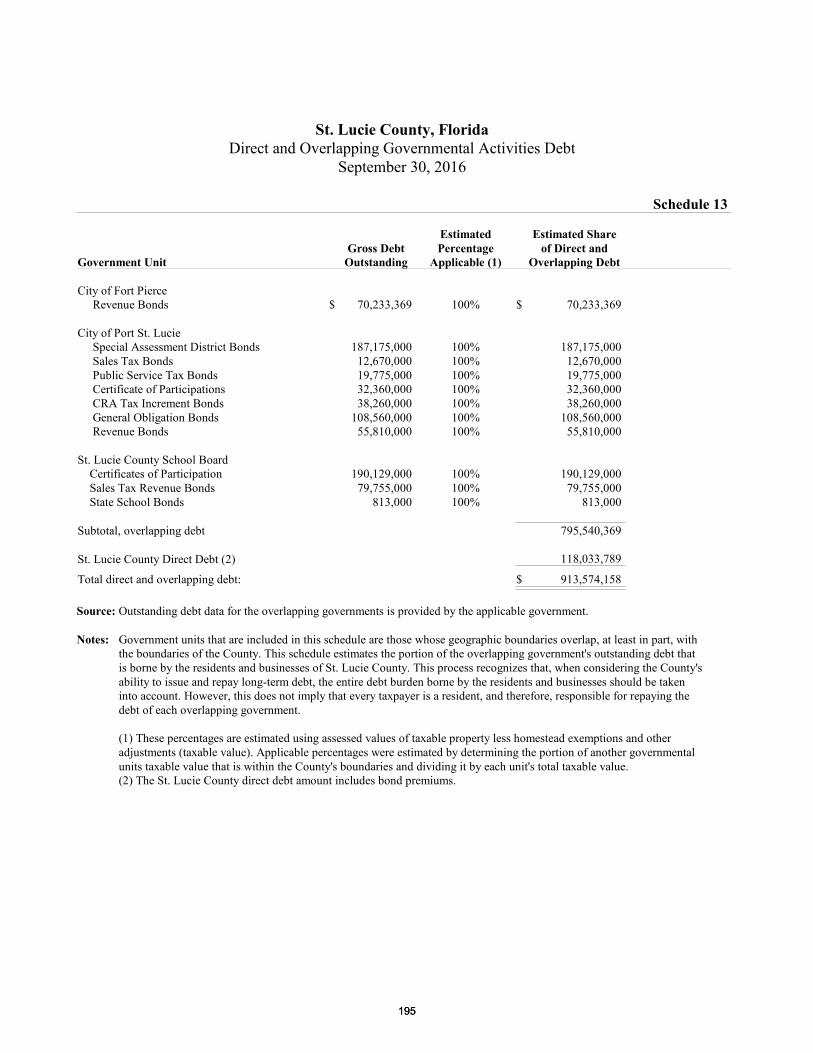
St. Lucie County, FloridaDirect and Overlapping Governmental Activities Debt
September 30, 2016
Schedule 13
Estimated Estimated ShareGross Debt Percentage of Direct and
Government Unit Outstanding Applicable (1) Overlapping Debt
City of Fort Pierce Revenue Bonds $ 70,233,369 100% $ 70,233,369
City of Port St. Lucie Special Assessment District Bonds 187,175,000 100% 187,175,000 Sales Tax Bonds 12,670,000 100% 12,670,000 Public Service Tax Bonds 19,775,000 100% 19,775,000 Certificate of Participations 32,360,000 100% 32,360,000 CRA Tax Increment Bonds 38,260,000 100% 38,260,000 General Obligation Bonds 108,560,000 100% 108,560,000 Revenue Bonds 55,810,000 100% 55,810,000
St. Lucie County School Board Certificates of Participation 190,129,000 100% 190,129,000 Sales Tax Revenue Bonds 79,755,000 100% 79,755,000 State School Bonds 813,000 100% 813,000
Subtotal, overlapping debt 795,540,369
St. Lucie County Direct Debt (2) 118,033,789
Total direct and overlapping debt: $ 913,574,158
Source: Outstanding debt data for the overlapping governments is provided by the applicable government.
Notes: Government units that are included in this schedule are those whose geographic boundaries overlap, at least in part, withthe boundaries of the County. This schedule estimates the portion of the overlapping government's outstanding debt thatis borne by the residents and businesses of St. Lucie County. This process recognizes that, when considering the County'sability to issue and repay long-term debt, the entire debt burden borne by the residents and businesses should be takeninto account. However, this does not imply that every taxpayer is a resident, and therefore, responsible for repaying thedebt of each overlapping government.
(1) These percentages are estimated using assessed values of taxable property less homestead exemptions and otheradjustments (taxable value). Applicable percentages were estimated by determining the portion of another governmentalunits taxable value that is within the County's boundaries and dividing it by each unit's total taxable value.(2) The St. Lucie County direct debt amount includes bond premiums.
195195
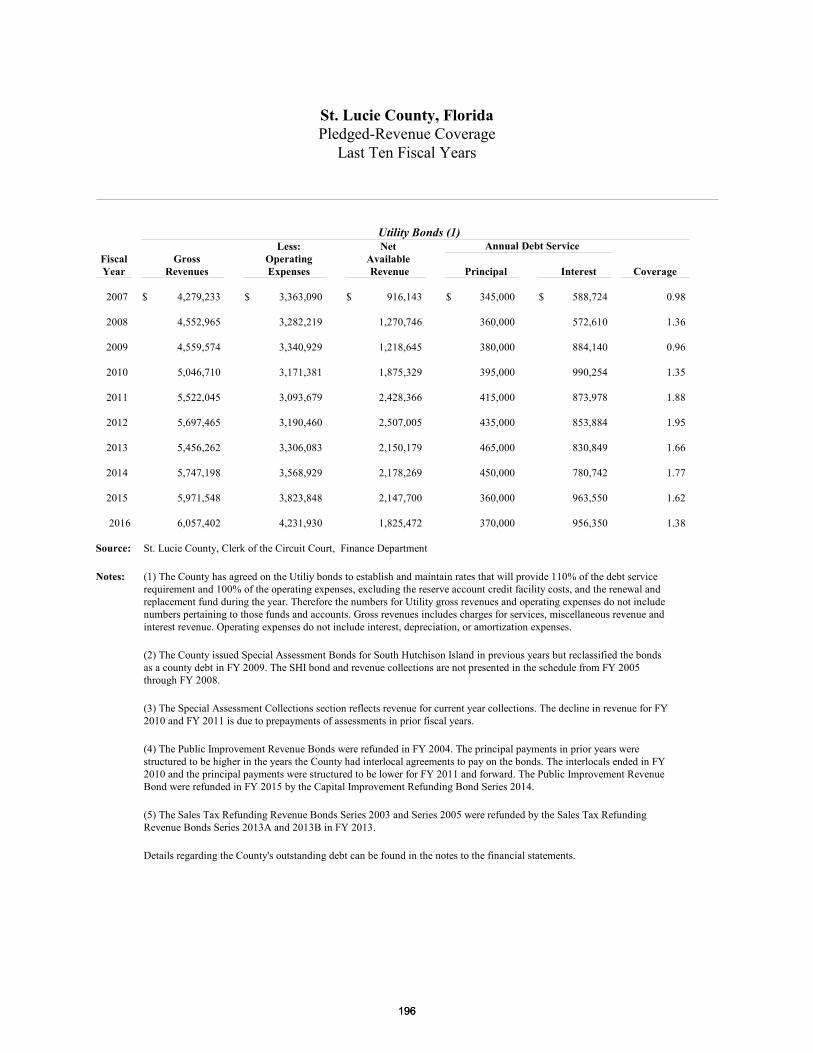
St. Lucie County, FloridaPledged-Revenue Coverage
Last Ten Fiscal Years
Utility Bonds (1)Less: Net Annual Debt Service
Fiscal Gross Operating Available Year Revenues Expenses Revenue Principal Interest Coverage
2007 $ 4,279,233 $ 3,363,090 $ 916,143 $ 345,000 $ 588,724 0.98
2008 4,552,965 3,282,219 1,270,746 360,000 572,610 1.36
2009 4,559,574 3,340,929 1,218,645 380,000 884,140 0.96
2010 5,046,710 3,171,381 1,875,329 395,000 990,254 1.35
2011 5,522,045 3,093,679 2,428,366 415,000 873,978 1.88
2012 5,697,465 3,190,460 2,507,005 435,000 853,884 1.95
2013 5,456,262 3,306,083 2,150,179 465,000 830,849 1.66
2014 5,747,198 3,568,929 2,178,269 450,000 780,742 1.77
2015 5,971,548 3,823,848 2,147,700 360,000 963,550 1.62
2016 6,057,402 4,231,930 1,825,472 370,000 956,350 1.38
Source: St. Lucie County, Clerk of the Circuit Court, Finance Department
Notes: (1) The County has agreed on the Utiliy bonds to establish and maintain rates that will provide 110% of the debt servicerequirement and 100% of the operating expenses, excluding the reserve account credit facility costs, and the renewal andreplacement fund during the year. Therefore the numbers for Utility gross revenues and operating expenses do not includenumbers pertaining to those funds and accounts. Gross revenues includes charges for services, miscellaneous revenue andinterest revenue. Operating expenses do not include interest, depreciation, or amortization expenses.
(2) The County issued Special Assessment Bonds for South Hutchison Island in previous years but reclassified the bondsas a county debt in FY 2009. The SHI bond and revenue collections are not presented in the schedule from FY 2005through FY 2008.
(3) The Special Assessment Collections section reflects revenue for current year collections. The decline in revenue for FY2010 and FY 2011 is due to prepayments of assessments in prior fiscal years.
(4) The Public Improvement Revenue Bonds were refunded in FY 2004. The principal payments in prior years werestructured to be higher in the years the County had interlocal agreements to pay on the bonds. The interlocals ended in FY2010 and the principal payments were structured to be lower for FY 2011 and forward. The Public Improvement RevenueBond were refunded in FY 2015 by the Capital Improvement Refunding Bond Series 2014.
(5) The Sales Tax Refunding Revenue Bonds Series 2003 and Series 2005 were refunded by the Sales Tax RefundingRevenue Bonds Series 2013A and 2013B in FY 2013.
Details regarding the County's outstanding debt can be found in the notes to the financial statements.
196196
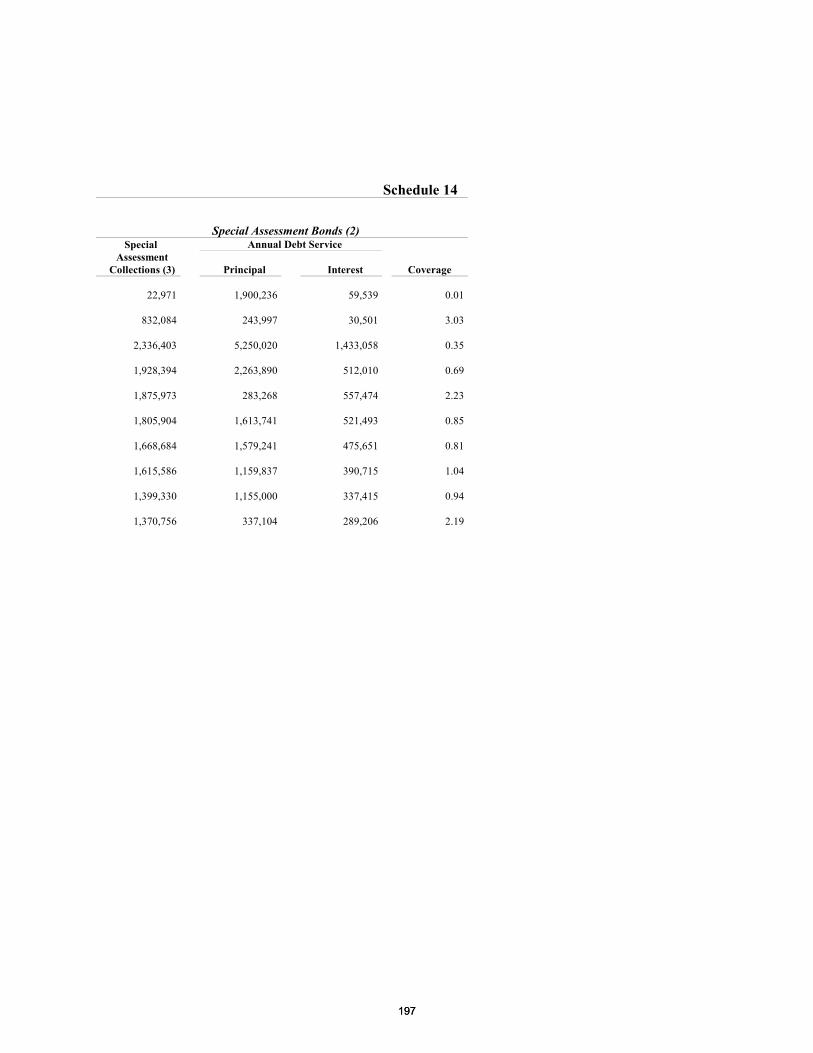
Schedule 14
Special Assessment Bonds (2)Special Annual Debt Service
AssessmentCollections (3) Principal Interest Coverage
22,971 1,900,236 59,539 0.01
832,084 243,997 30,501 3.03
2,336,403 5,250,020 1,433,058 0.35
1,928,394 2,263,890 512,010 0.69
1,875,973 283,268 557,474 2.23
1,805,904 1,613,741 521,493 0.85
1,668,684 1,579,241 475,651 0.81
1,615,586 1,159,837 390,715 1.04
1,399,330 1,155,000 337,415 0.94
1,370,756 337,104 289,206 2.19
197197
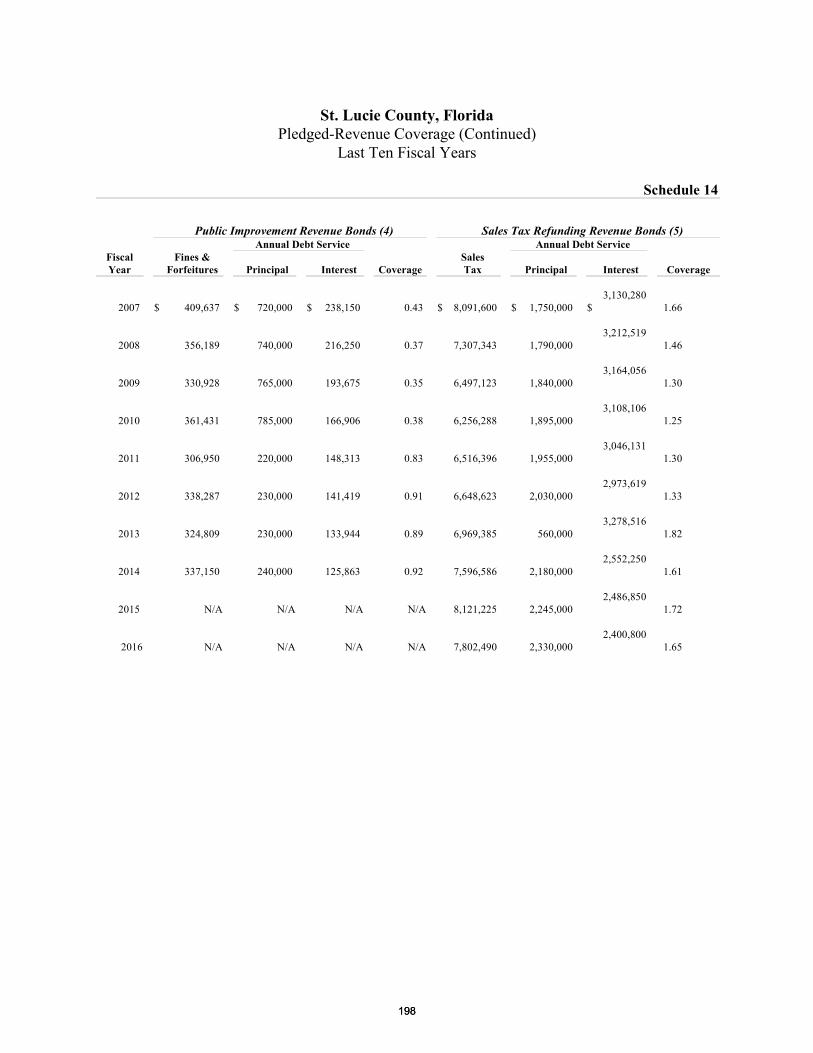
St. Lucie County, FloridaPledged-Revenue Coverage (Continued)
Last Ten Fiscal Years
Schedule 14
Public Improvement Revenue Bonds (4) Sales Tax Refunding Revenue Bonds (5)Annual Debt Service Annual Debt Service
Fiscal Fines & SalesYear Forfeitures Principal Interest Coverage Tax Principal Interest Coverage
2007 $ 409,637 $ 720,000 $ 238,150 0.43 $ 8,091,600 $ 1,750,000 $ 3,130,280
1.66
2008 356,189 740,000 216,250 0.37 7,307,343 1,790,000 3,212,519
1.46
2009 330,928 765,000 193,675 0.35 6,497,123 1,840,000 3,164,056
1.30
2010 361,431 785,000 166,906 0.38 6,256,288 1,895,000 3,108,106
1.25
2011 306,950 220,000 148,313 0.83 6,516,396 1,955,000 3,046,131
1.30
2012 338,287 230,000 141,419 0.91 6,648,623 2,030,000 2,973,619
1.33
2013 324,809 230,000 133,944 0.89 6,969,385 560,000 3,278,516
1.82
2014 337,150 240,000 125,863 0.92 7,596,586 2,180,000 2,552,250
1.61
2015 N/A N/A N/A N/A 8,121,225 2,245,000 2,486,850
1.72
2016 N/A N/A N/A N/A 7,802,490 2,330,000 2,400,800
1.65
198198

THIS PAGE INTENTIONALLY LEFT BLANK
199199
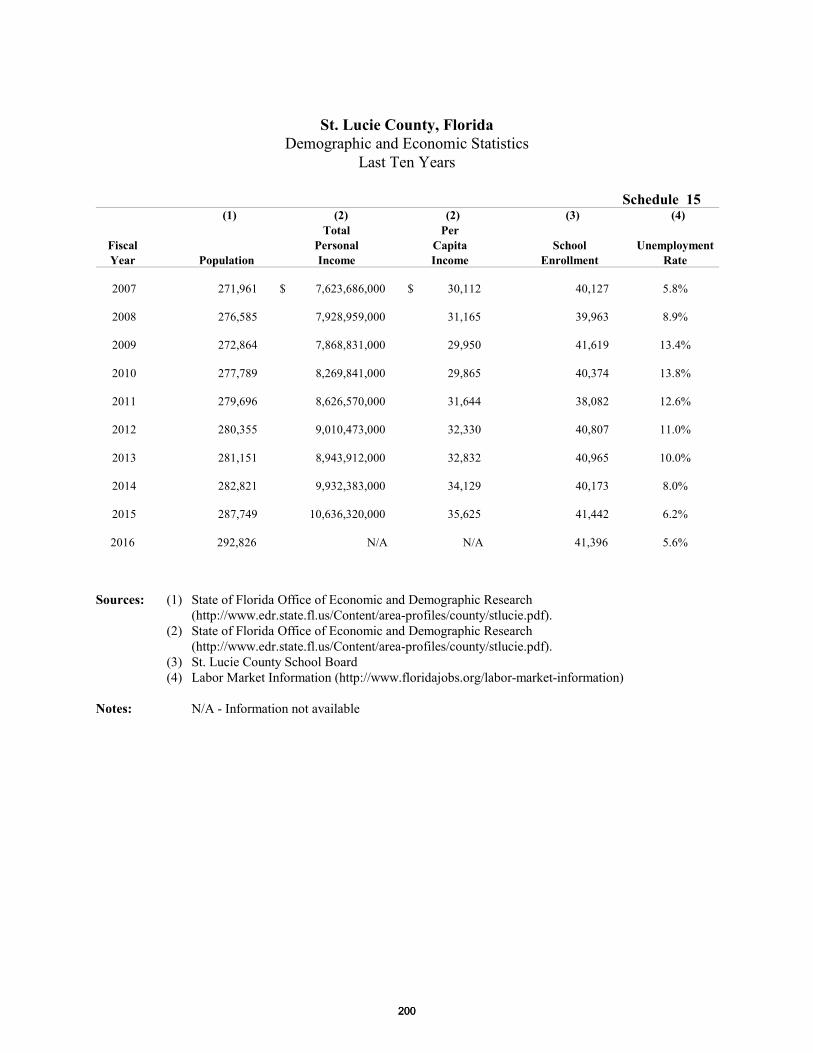
St. Lucie County, FloridaDemographic and Economic Statistics
Last Ten Years
Schedule 15 (1) (2) (2) (3) (4)
Total PerFiscal Personal Capita School UnemploymentYear Population Income Income Enrollment Rate
2007 271,961 $ 7,623,686,000 $ 30,112 40,127 5.8%
2008 276,585 7,928,959,000 31,165 39,963 8.9%
2009 272,864 7,868,831,000 29,950 41,619 13.4%
2010 277,789 8,269,841,000 29,865 40,374 13.8%
2011 279,696 8,626,570,000 31,644 38,082 12.6%
2012 280,355 9,010,473,000 32,330 40,807 11.0%
2013 281,151 8,943,912,000 32,832 40,965 10.0%
2014 282,821 9,932,383,000 34,129 40,173 8.0%
2015 287,749 10,636,320,000 35,625 41,442 6.2%
2016 292,826 N/A N/A 41,396 5.6%
Sources: (1) State of Florida Office of Economic and Demographic Research(http://www.edr.state.fl.us/Content/area-profiles/county/stlucie.pdf).
(2) State of Florida Office of Economic and Demographic Research(http://www.edr.state.fl.us/Content/area-profiles/county/stlucie.pdf).
(3) St. Lucie County School Board(4) Labor Market Information (http://www.floridajobs.org/labor-market-information)
Notes: N/A - Information not available
200200
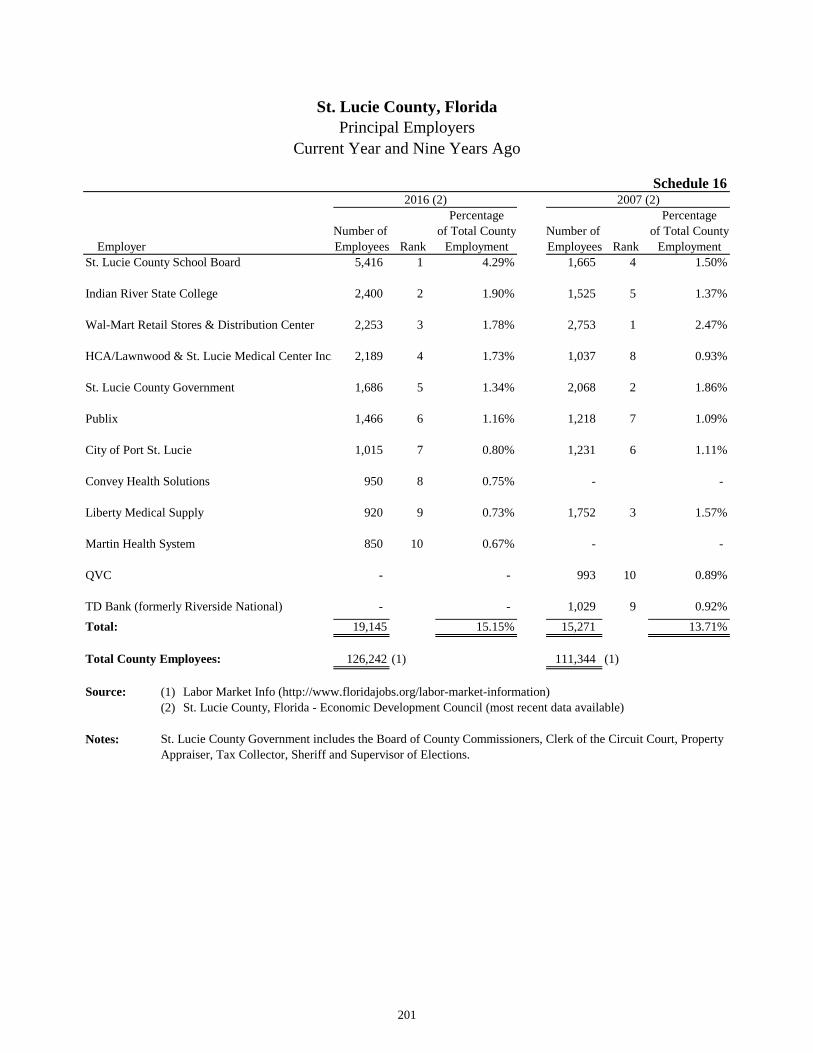
Schedule 16
Percentage Percentage
Number of of Total County Number of of Total County
Employer Employees Rank Employment Employees Rank Employment
St. Lucie County School Board 5,416 1 4.29% 1,665 4 1.50%
Indian River State College 2,400 2 1.90% 1,525 5 1.37%
Wal-Mart Retail Stores & Distribution Center 2,253 3 1.78% 2,753 1 2.47%
HCA/Lawnwood & St. Lucie Medical Center Inc. 2,189 4 1.73% 1,037 8 0.93%
St. Lucie County Government 1,686 5 1.34% 2,068 2 1.86%
Publix 1,466 6 1.16% 1,218 7 1.09%
City of Port St. Lucie 1,015 7 0.80% 1,231 6 1.11%
Convey Health Solutions 950 8 0.75% - -
Liberty Medical Supply 920 9 0.73% 1,752 3 1.57%
Martin Health System 850 10 0.67% - -
QVC - - 993 10 0.89%
TD Bank (formerly Riverside National) - - 1,029 9 0.92%
Total: 19,145 15.15% 15,271 13.71%
Total County Employees: 126,242 (1) 111,344 (1)
Source: (1) Labor Market Info (http://www.floridajobs.org/labor-market-information)
(2) St. Lucie County, Florida - Economic Development Council (most recent data available)
Notes:
201
St. Lucie County, Florida
Principal Employers
Current Year and Nine Years Ago
2016 (2) 2007 (2)
St. Lucie County Government includes the Board of County Commissioners, Clerk of the Circuit Court, Property
Appraiser, Tax Collector, Sheriff and Supervisor of Elections.
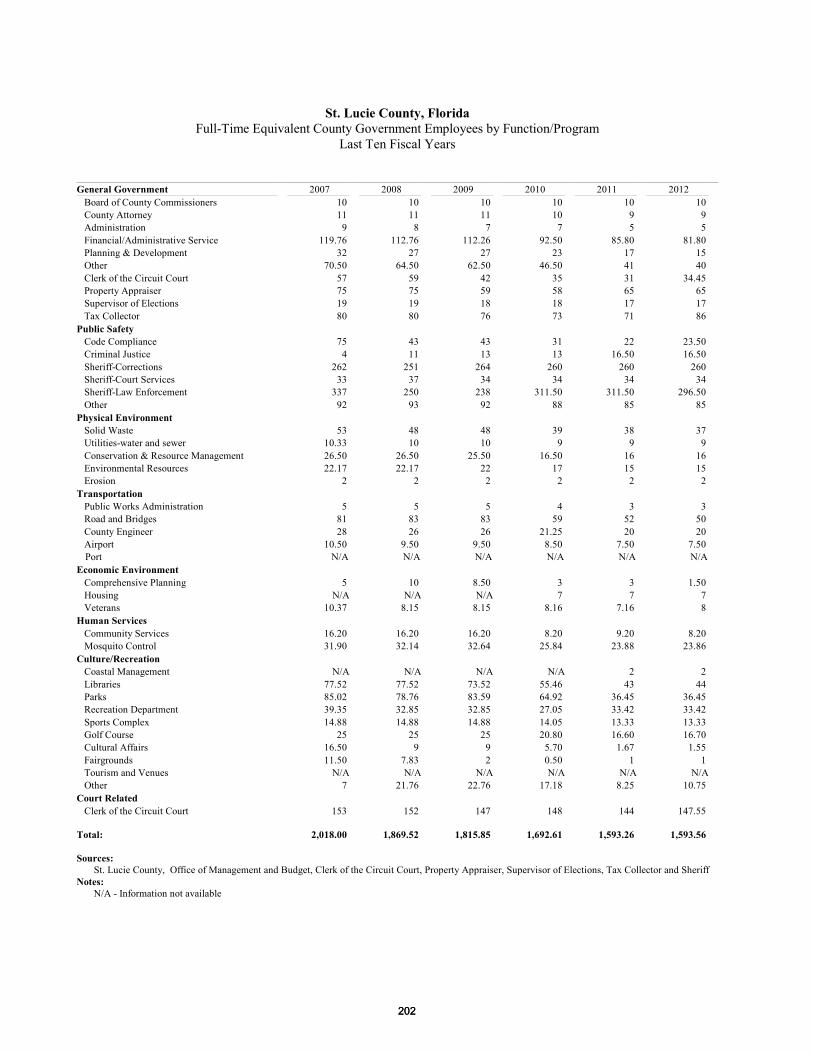
St. Lucie County, FloridaFull-Time Equivalent County Government Employees by Function/Program
Last Ten Fiscal Years
General Government 2007 2008 2009 2010 2011 2012 Board of County Commissioners 10 10 10 10 10 10 County Attorney 11 11 11 10 9 9 Administration 9 8 7 7 5 5 Financial/Administrative Service 119.76 112.76 112.26 92.50 85.80 81.80 Planning & Development 32 27 27 23 17 15 Other 70.50 64.50 62.50 46.50 41 40 Clerk of the Circuit Court 57 59 42 35 31 34.45 Property Appraiser 75 75 59 58 65 65 Supervisor of Elections 19 19 18 18 17 17 Tax Collector 80 80 76 73 71 86 Public Safety Code Compliance 75 43 43 31 22 23.50 Criminal Justice 4 11 13 13 16.50 16.50 Sheriff-Corrections 262 251 264 260 260 260 Sheriff-Court Services 33 37 34 34 34 34 Sheriff-Law Enforcement 337 250 238 311.50 311.50 296.50 Other 92 93 92 88 85 85 Physical Environment Solid Waste 53 48 48 39 38 37 Utilities-water and sewer 10.33 10 10 9 9 9 Conservation & Resource Management 26.50 26.50 25.50 16.50 16 16 Environmental Resources 22.17 22.17 22 17 15 15 Erosion 2 2 2 2 2 2 Transportation Public Works Administration 5 5 5 4 3 3 Road and Bridges 81 83 83 59 52 50 County Engineer 28 26 26 21.25 20 20 Airport 10.50 9.50 9.50 8.50 7.50 7.50 Port N/A N/A N/A N/A N/A N/AEconomic Environment Comprehensive Planning 5 10 8.50 3 3 1.50 Housing N/A N/A N/A 7 7 7 Veterans 10.37 8.15 8.15 8.16 7.16 8 Human Services Community Services 16.20 16.20 16.20 8.20 9.20 8.20 Mosquito Control 31.90 32.14 32.64 25.84 23.88 23.86 Culture/Recreation Coastal Management N/A N/A N/A N/A 2 2 Libraries 77.52 77.52 73.52 55.46 43 44 Parks 85.02 78.76 83.59 64.92 36.45 36.45 Recreation Department 39.35 32.85 32.85 27.05 33.42 33.42 Sports Complex 14.88 14.88 14.88 14.05 13.33 13.33 Golf Course 25 25 25 20.80 16.60 16.70 Cultural Affairs 16.50 9 9 5.70 1.67 1.55 Fairgrounds 11.50 7.83 2 0.50 1 1 Tourism and Venues N/A N/A N/A N/A N/A N/A Other 7 21.76 22.76 17.18 8.25 10.75 Court Related Clerk of the Circuit Court 153 152 147 148 144 147.55
Total: 2,018.00 1,869.52 1,815.85 1,692.61 1,593.26 1,593.56
Sources: St. Lucie County, Office of Management and Budget, Clerk of the Circuit Court, Property Appraiser, Supervisor of Elections, Tax Collector and Sheriff
Notes: N/A - Information not available
202202
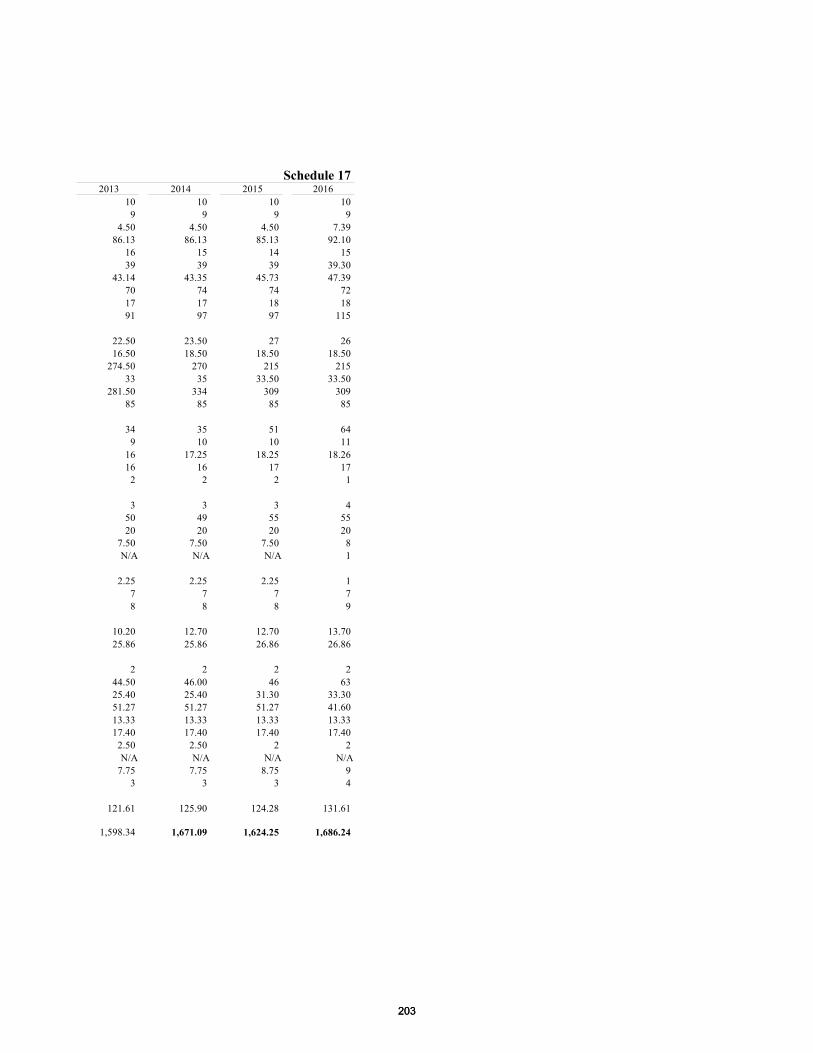
Schedule 17 2013 2014 2015 2016
10 10 10 10 9 9 9 9
4.50 4.50 4.50 7.39 86.13 86.13 85.13 92.10
16 15 14 15 39 39 39 39.30
43.14 43.35 45.73 47.39 70 74 74 72 17 17 18 18 91 97 97 115
22.50 23.50 27 26 16.50 18.50 18.50 18.50
274.50 270 215 215 33 35 33.50 33.50
281.50 334 309 309 85 85 85 85
34 35 51 64 9 10 10 11
16 17.25 18.25 18.26 16 16 17 17
2 2 2 1
3 3 3 4 50 49 55 55 20 20 20 20
7.50 7.50 7.50 8 N/A N/A N/A 1
2.25 2.25 2.25 1 7 7 7 7 8 8 8 9
10.20 12.70 12.70 13.70 25.86 25.86 26.86 26.86
2 2 2 2 44.50 46.00 46 63 25.40 25.40 31.30 33.30 51.27 51.27 51.27 41.60 13.33 13.33 13.33 13.33 17.40 17.40 17.40 17.40
2.50 2.50 2 2 N/A N/A N/A N/A
7.75 7.75 8.75 9 3 3 3 4
121.61 125.90 124.28 131.61
1,598.34 1,671.09 1,624.25 1,686.24
203203
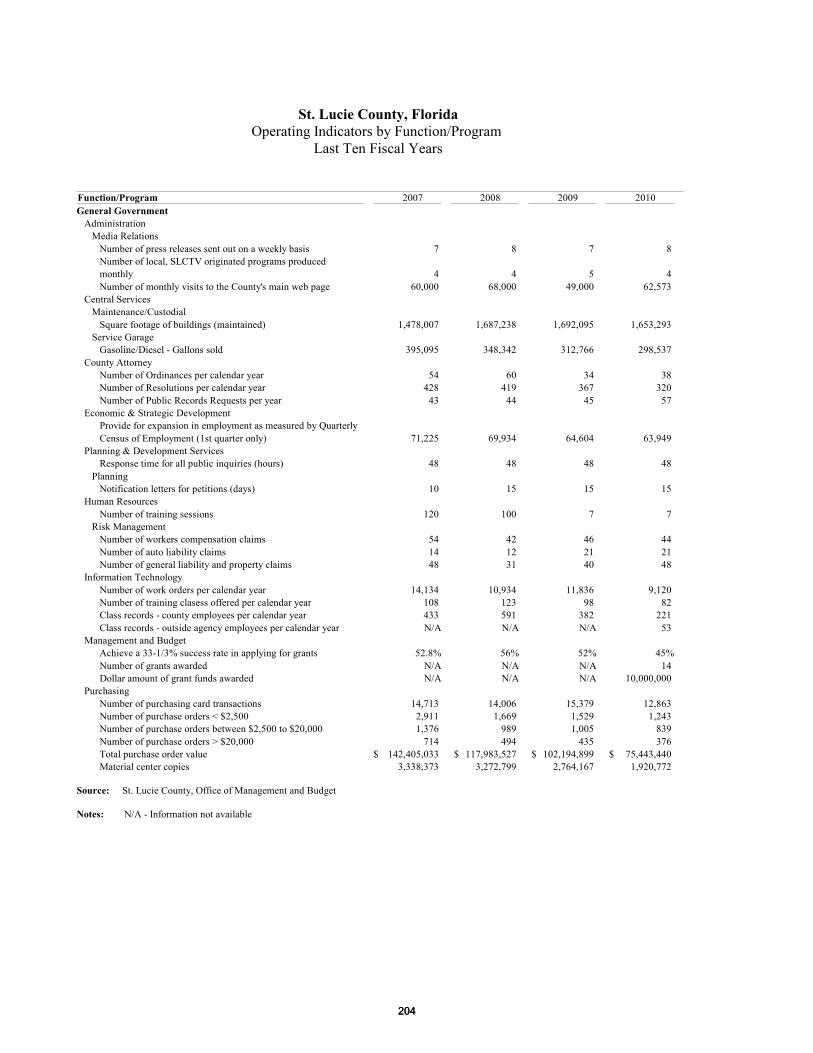
St. Lucie County, FloridaOperating Indicators by Function/Program
Last Ten Fiscal Years
Function/Program 2007 2008 2009 2010 General Government Administration Media Relations Number of press releases sent out on a weekly basis 7 8 7 8 Number of local, SLCTV originated programs produced monthly 4 4 5 4 Number of monthly visits to the County's main web page 60,000 68,000 49,000 62,573 Central Services Maintenance/Custodial Square footage of buildings (maintained) 1,478,007 1,687,238 1,692,095 1,653,293 Service Garage Gasoline/Diesel - Gallons sold 395,095 348,342 312,766 298,537 County Attorney Number of Ordinances per calendar year 54 60 34 38 Number of Resolutions per calendar year 428 419 367 320 Number of Public Records Requests per year 43 44 45 57 Economic & Strategic Development Provide for expansion in employment as measured by Quarterly Census of Employment (1st quarter only) 71,225 69,934 64,604 63,949 Planning & Development Services Response time for all public inquiries (hours) 48 48 48 48 Planning Notification letters for petitions (days) 10 15 15 15 Human Resources Number of training sessions 120 100 7 7 Risk Management Number of workers compensation claims 54 42 46 44 Number of auto liability claims 14 12 21 21 Number of general liability and property claims 48 31 40 48 Information Technology Number of work orders per calendar year 14,134 10,934 11,836 9,120 Number of training clasess offered per calendar year 108 123 98 82 Class records - county employees per calendar year 433 591 382 221 Class records - outside agency employees per calendar year N/A N/A N/A 53 Management and Budget Achieve a 33-1/3% success rate in applying for grants 52.8% 56% 52% 45% Number of grants awarded N/A N/A N/A 14 Dollar amount of grant funds awarded N/A N/A N/A 10,000,000 Purchasing Number of purchasing card transactions 14,713 14,006 15,379 12,863 Number of purchase orders < $2,500 2,911 1,669 1,529 1,243 Number of purchase orders between $2,500 to $20,000 1,376 989 1,005 839 Number of purchase orders > $20,000 714 494 435 376 Total purchase order value $ 142,405,033 $ 117,983,527 $ 102,194,899 $ 75,443,440 Material center copies 3,338,373 3,272,799 2,764,167 1,920,772
Source: St. Lucie County, Office of Management and Budget
Notes: N/A - Information not available
204204
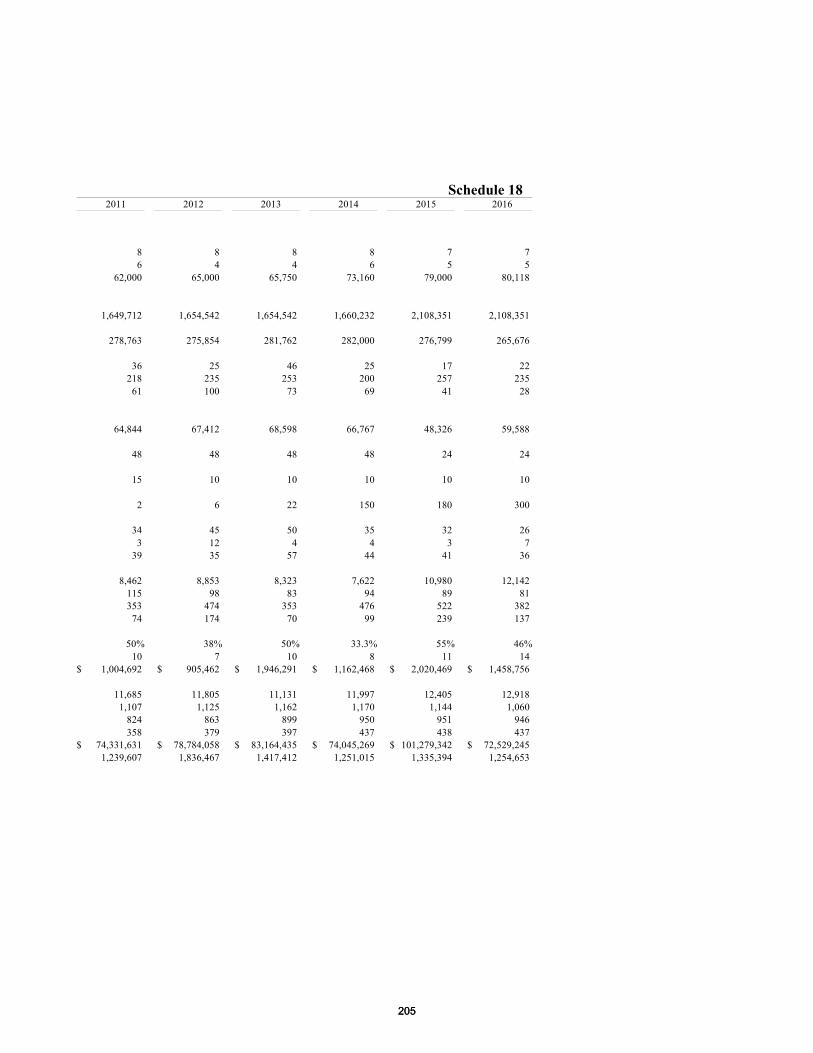
Schedule 18 2011 2012 2013 2014 2015 2016
8 8 8 8 7 7 6 4 4 6 5 5
62,000 65,000 65,750 73,160 79,000 80,118
1,649,712 1,654,542 1,654,542 1,660,232 2,108,351 2,108,351
278,763 275,854 281,762 282,000 276,799 265,676
36 25 46 25 17 22 218 235 253 200 257 235
61 100 73 69 41 28
64,844 67,412 68,598 66,767 48,326 59,588
48 48 48 48 24 24
15 10 10 10 10 10
2 6 22 150 180 300
34 45 50 35 32 26 3 12 4 4 3 7
39 35 57 44 41 36
8,462 8,853 8,323 7,622 10,980 12,142 115 98 83 94 89 81 353 474 353 476 522 382
74 174 70 99 239 137
50% 38% 50% 33.3% 55% 46% 10 7 10 8 11 14
$ 1,004,692 $ 905,462 $ 1,946,291 $ 1,162,468 $ 2,020,469 $ 1,458,756
11,685 11,805 11,131 11,997 12,405 12,918 1,107 1,125 1,162 1,170 1,144 1,060
824 863 899 950 951 946 358 379 397 437 438 437
$ 74,331,631 $ 78,784,058 $ 83,164,435 $ 74,045,269 $ 101,279,342 $ 72,529,245 1,239,607 1,836,467 1,417,412 1,251,015 1,335,394 1,254,653
205205
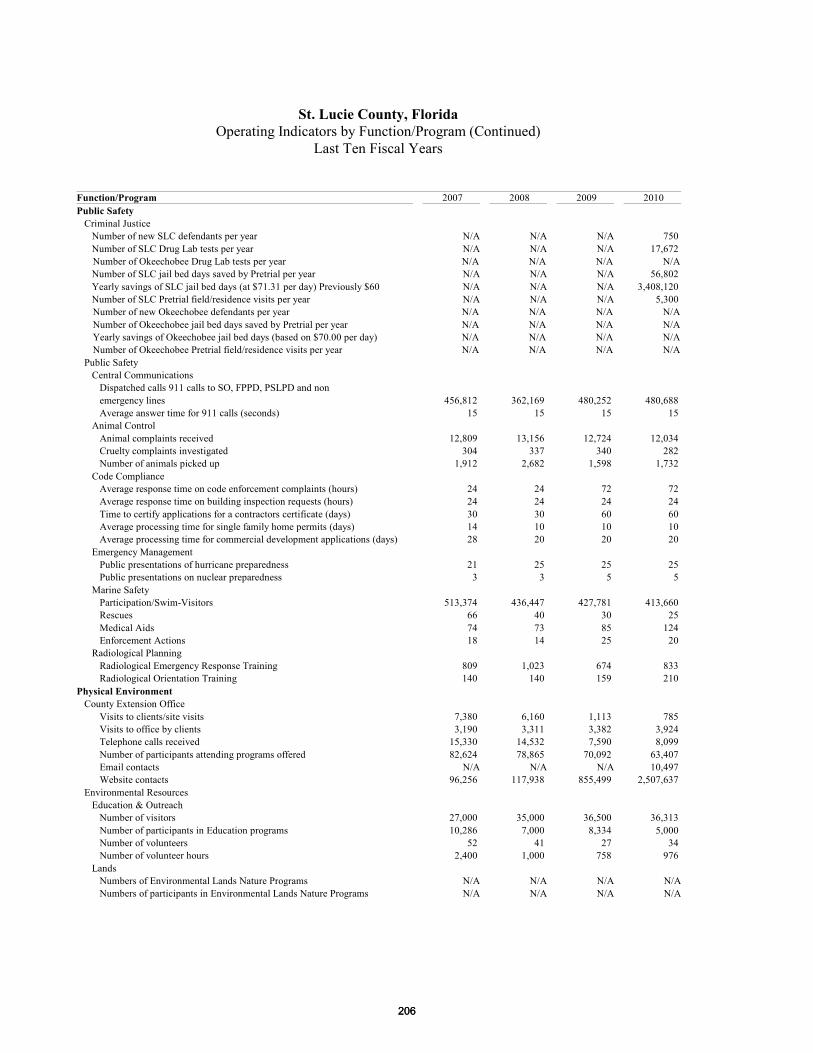
St. Lucie County, FloridaOperating Indicators by Function/Program (Continued)
Last Ten Fiscal Years
Function/Program 2007 2008 2009 2010 Public Safety Criminal Justice Number of new SLC defendants per year N/A N/A N/A 750 Number of SLC Drug Lab tests per year N/A N/A N/A 17,672 Number of Okeechobee Drug Lab tests per year N/A N/A N/A N/A Number of SLC jail bed days saved by Pretrial per year N/A N/A N/A 56,802 Yearly savings of SLC jail bed days (at $71.31 per day) Previously $60 N/A N/A N/A 3,408,120 Number of SLC Pretrial field/residence visits per year N/A N/A N/A 5,300 Number of new Okeechobee defendants per year N/A N/A N/A N/A Number of Okeechobee jail bed days saved by Pretrial per year N/A N/A N/A N/A Yearly savings of Okeechobee jail bed days (based on $70.00 per day) N/A N/A N/A N/A Number of Okeechobee Pretrial field/residence visits per year N/A N/A N/A N/A Public Safety Central Communications Dispatched calls 911 calls to SO, FPPD, PSLPD and non emergency lines 456,812 362,169 480,252 480,688 Average answer time for 911 calls (seconds) 15 15 15 15 Animal Control Animal complaints received 12,809 13,156 12,724 12,034 Cruelty complaints investigated 304 337 340 282 Number of animals picked up 1,912 2,682 1,598 1,732 Code Compliance Average response time on code enforcement complaints (hours) 24 24 72 72 Average response time on building inspection requests (hours) 24 24 24 24 Time to certify applications for a contractors certificate (days) 30 30 60 60 Average processing time for single family home permits (days) 14 10 10 10 Average processing time for commercial development applications (days) 28 20 20 20 Emergency Management Public presentations of hurricane preparedness 21 25 25 25 Public presentations on nuclear preparedness 3 3 5 5 Marine Safety Participation/Swim-Visitors 513,374 436,447 427,781 413,660 Rescues 66 40 30 25 Medical Aids 74 73 85 124 Enforcement Actions 18 14 25 20 Radiological Planning Radiological Emergency Response Training 809 1,023 674 833 Radiological Orientation Training 140 140 159 210 Physical Environment County Extension Office Visits to clients/site visits 7,380 6,160 1,113 785 Visits to office by clients 3,190 3,311 3,382 3,924 Telephone calls received 15,330 14,532 7,590 8,099 Number of participants attending programs offered 82,624 78,865 70,092 63,407 Email contacts N/A N/A N/A 10,497 Website contacts 96,256 117,938 855,499 2,507,637 Environmental Resources Education & Outreach Number of visitors 27,000 35,000 36,500 36,313 Number of participants in Education programs 10,286 7,000 8,334 5,000 Number of volunteers 52 41 27 34 Number of volunteer hours 2,400 1,000 758 976 Lands Numbers of Environmental Lands Nature Programs N/A N/A N/A N/A Numbers of participants in Environmental Lands Nature Programs N/A N/A N/A N/A
206206
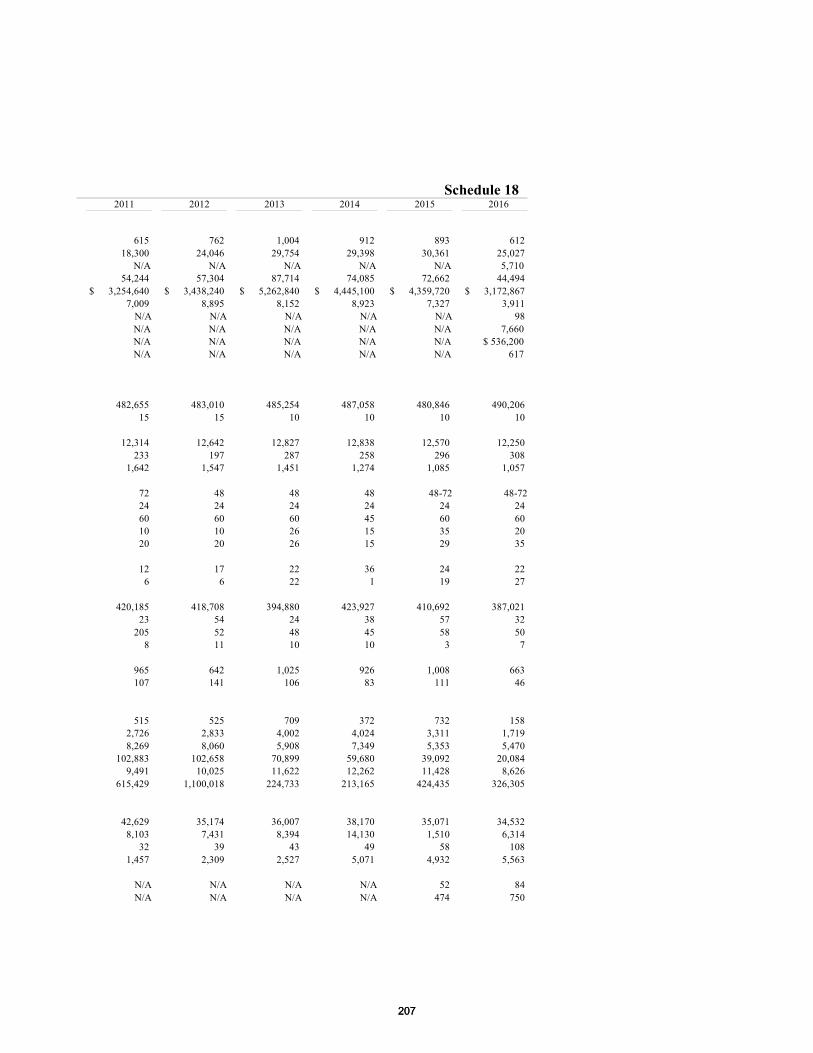
Schedule 18 2011 2012 2013 2014 2015 2016
615 762 1,004 912 893 612 18,300 24,046 29,754 29,398 30,361 25,027
N/A N/A N/A N/A N/A 5,710 54,244 57,304 87,714 74,085 72,662 44,494
$ 3,254,640 $ 3,438,240 $ 5,262,840 $ 4,445,100 $ 4,359,720 $ 3,172,867 7,009 8,895 8,152 8,923 7,327 3,911
N/A N/A N/A N/A N/A 98 N/A N/A N/A N/A N/A 7,660 N/A N/A N/A N/A N/A $ 536,200 N/A N/A N/A N/A N/A 617
482,655 483,010 485,254 487,058 480,846 490,206 15 15 10 10 10 10
12,314 12,642 12,827 12,838 12,570 12,250 233 197 287 258 296 308
1,642 1,547 1,451 1,274 1,085 1,057
72 48 48 48 48-72 48-72 24 24 24 24 24 24 60 60 60 45 60 60 10 10 26 15 35 20 20 20 26 15 29 35
12 17 22 36 24 22 6 6 22 1 19 27
420,185 418,708 394,880 423,927 410,692 387,021 23 54 24 38 57 32
205 52 48 45 58 50 8 11 10 10 3 7
965 642 1,025 926 1,008 663 107 141 106 83 111 46
515 525 709 372 732 158 2,726 2,833 4,002 4,024 3,311 1,719 8,269 8,060 5,908 7,349 5,353 5,470
102,883 102,658 70,899 59,680 39,092 20,084 9,491 10,025 11,622 12,262 11,428 8,626
615,429 1,100,018 224,733 213,165 424,435 326,305
42,629 35,174 36,007 38,170 35,071 34,532 8,103 7,431 8,394 14,130 1,510 6,314
32 39 43 49 58 108 1,457 2,309 2,527 5,071 4,932 5,563
N/A N/A N/A N/A 52 84 N/A N/A N/A N/A 474 750
207207
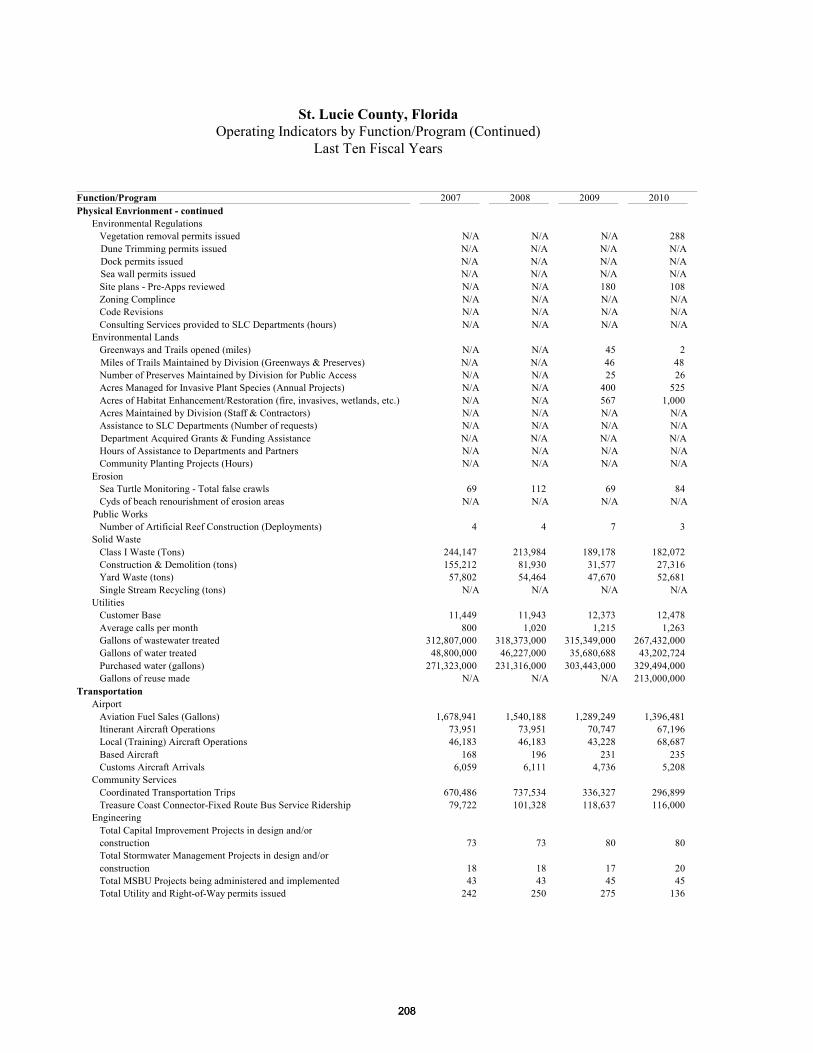
St. Lucie County, FloridaOperating Indicators by Function/Program (Continued)
Last Ten Fiscal Years
Function/Program 2007 2008 2009 2010 Physical Envrionment - continued Environmental Regulations Vegetation removal permits issued N/A N/A N/A 288 Dune Trimming permits issued N/A N/A N/A N/A Dock permits issued N/A N/A N/A N/A Sea wall permits issued N/A N/A N/A N/A Site plans - Pre-Apps reviewed N/A N/A 180 108 Zoning Complince N/A N/A N/A N/A Code Revisions N/A N/A N/A N/A Consulting Services provided to SLC Departments (hours) N/A N/A N/A N/A Environmental Lands Greenways and Trails opened (miles) N/A N/A 45 2 Miles of Trails Maintained by Division (Greenways & Preserves) N/A N/A 46 48 Number of Preserves Maintained by Division for Public Access N/A N/A 25 26 Acres Managed for Invasive Plant Species (Annual Projects) N/A N/A 400 525 Acres of Habitat Enhancement/Restoration (fire, invasives, wetlands, etc.) N/A N/A 567 1,000 Acres Maintained by Division (Staff & Contractors) N/A N/A N/A N/A Assistance to SLC Departments (Number of requests) N/A N/A N/A N/A Department Acquired Grants & Funding Assistance N/A N/A N/A N/A Hours of Assistance to Departments and Partners N/A N/A N/A N/A Community Planting Projects (Hours) N/A N/A N/A N/A Erosion Sea Turtle Monitoring - Total false crawls 69 112 69 84 Cyds of beach renourishment of erosion areas N/A N/A N/A N/A Public Works Number of Artificial Reef Construction (Deployments) 4 4 7 3 Solid Waste Class I Waste (Tons) 244,147 213,984 189,178 182,072 Construction & Demolition (tons) 155,212 81,930 31,577 27,316 Yard Waste (tons) 57,802 54,464 47,670 52,681 Single Stream Recycling (tons) N/A N/A N/A N/A Utilities Customer Base 11,449 11,943 12,373 12,478 Average calls per month 800 1,020 1,215 1,263 Gallons of wastewater treated 312,807,000 318,373,000 315,349,000 267,432,000 Gallons of water treated 48,800,000 46,227,000 35,680,688 43,202,724 Purchased water (gallons) 271,323,000 231,316,000 303,443,000 329,494,000 Gallons of reuse made N/A N/A N/A 213,000,000 Transportation Airport Aviation Fuel Sales (Gallons) 1,678,941 1,540,188 1,289,249 1,396,481 Itinerant Aircraft Operations 73,951 73,951 70,747 67,196 Local (Training) Aircraft Operations 46,183 46,183 43,228 68,687 Based Aircraft 168 196 231 235 Customs Aircraft Arrivals 6,059 6,111 4,736 5,208 Community Services Coordinated Transportation Trips 670,486 737,534 336,327 296,899 Treasure Coast Connector-Fixed Route Bus Service Ridership 79,722 101,328 118,637 116,000 Engineering Total Capital Improvement Projects in design and/or construction 73 73 80 80 Total Stormwater Management Projects in design and/or construction 18 18 17 20 Total MSBU Projects being administered and implemented 43 43 45 45 Total Utility and Right-of-Way permits issued 242 250 275 136
208208
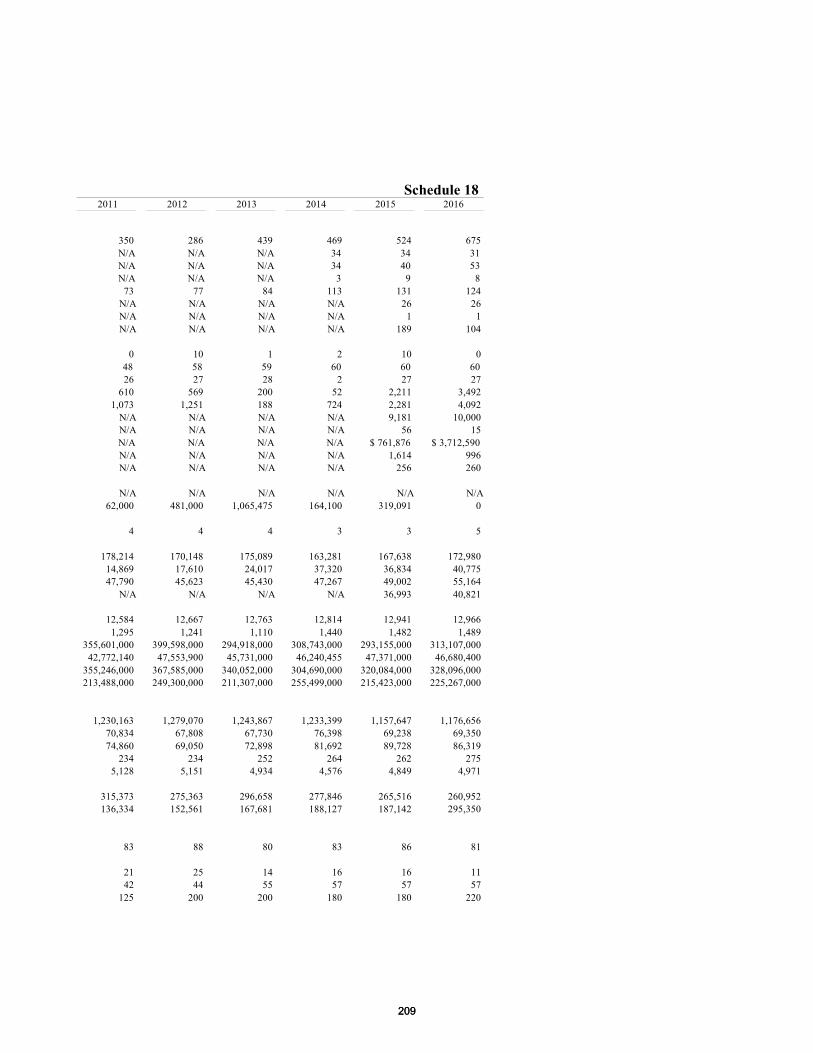
Schedule 18 2011 2012 2013 2014 2015 2016
350 286 439 469 524 675 N/A N/A N/A 34 34 31 N/A N/A N/A 34 40 53 N/A N/A N/A 3 9 8 73 77 84 113 131 124 N/A N/A N/A N/A 26 26 N/A N/A N/A N/A 1 1 N/A N/A N/A N/A 189 104
0 10 1 2 10 0 48 58 59 60 60 60 26 27 28 2 27 27
610 569 200 52 2,211 3,492 1,073 1,251 188 724 2,281 4,092
N/A N/A N/A N/A 9,181 10,000 N/A N/A N/A N/A 56 15 N/A N/A N/A N/A $ 761,876 $ 3,712,590 N/A N/A N/A N/A 1,614 996 N/A N/A N/A N/A 256 260
N/A N/A N/A N/A N/A N/A 62,000 481,000 1,065,475 164,100 319,091 0
4 4 4 3 3 5
178,214 170,148 175,089 163,281 167,638 172,980 14,869 17,610 24,017 37,320 36,834 40,775 47,790 45,623 45,430 47,267 49,002 55,164
N/A N/A N/A N/A 36,993 40,821
12,584 12,667 12,763 12,814 12,941 12,966 1,295 1,241 1,110 1,440 1,482 1,489
355,601,000 399,598,000 294,918,000 308,743,000 293,155,000 313,107,000 42,772,140 47,553,900 45,731,000 46,240,455 47,371,000 46,680,400
355,246,000 367,585,000 340,052,000 304,690,000 320,084,000 328,096,000 213,488,000 249,300,000 211,307,000 255,499,000 215,423,000 225,267,000
1,230,163 1,279,070 1,243,867 1,233,399 1,157,647 1,176,656 70,834 67,808 67,730 76,398 69,238 69,350 74,860 69,050 72,898 81,692 89,728 86,319
234 234 252 264 262 275 5,128 5,151 4,934 4,576 4,849 4,971
315,373 275,363 296,658 277,846 265,516 260,952 136,334 152,561 167,681 188,127 187,142 295,350
83 88 80 83 86 81
21 25 14 16 16 11 42 44 55 57 57 57
125 200 200 180 180 220
209209
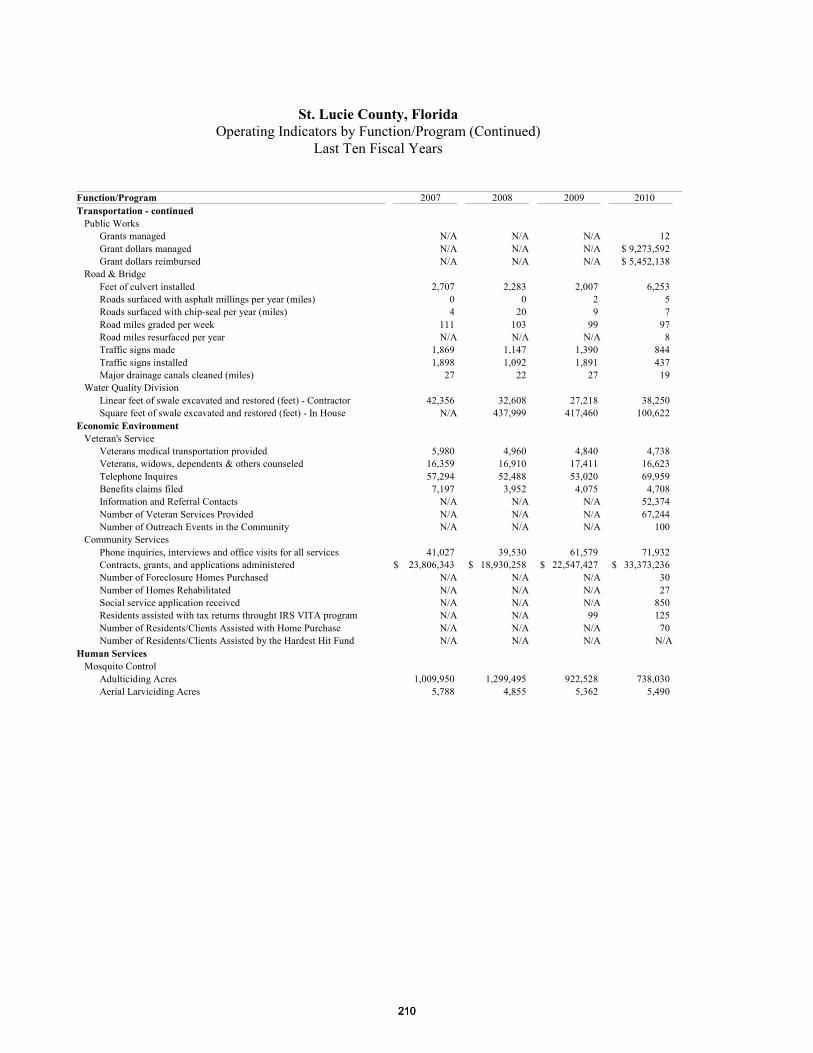
St. Lucie County, FloridaOperating Indicators by Function/Program (Continued)
Last Ten Fiscal Years
Function/Program 2007 2008 2009 2010Transportation - continued Public Works Grants managed N/A N/A N/A 12 Grant dollars managed N/A N/A N/A $ 9,273,592 Grant dollars reimbursed N/A N/A N/A $ 5,452,138 Road & Bridge Feet of culvert installed 2,707 2,283 2,007 6,253 Roads surfaced with asphalt millings per year (miles) 0 0 2 5 Roads surfaced with chip-seal per year (miles) 4 20 9 7 Road miles graded per week 111 103 99 97 Road miles resurfaced per year N/A N/A N/A 8 Traffic signs made 1,869 1,147 1,390 844 Traffic signs installed 1,898 1,092 1,891 437 Major drainage canals cleaned (miles) 27 22 27 19 Water Quality Division Linear feet of swale excavated and restored (feet) - Contractor 42,356 32,608 27,218 38,250 Square feet of swale excavated and restored (feet) - In House N/A 437,999 417,460 100,622 Economic Environment Veteran's Service Veterans medical transportation provided 5,980 4,960 4,840 4,738 Veterans, widows, dependents & others counseled 16,359 16,910 17,411 16,623 Telephone Inquires 57,294 52,488 53,020 69,959 Benefits claims filed 7,197 3,952 4,075 4,708 Information and Referral Contacts N/A N/A N/A 52,374 Number of Veteran Services Provided N/A N/A N/A 67,244 Number of Outreach Events in the Community N/A N/A N/A 100 Community Services Phone inquiries, interviews and office visits for all services 41,027 39,530 61,579 71,932 Contracts, grants, and applications administered $ 23,806,343 $ 18,930,258 $ 22,547,427 $ 33,373,236 Number of Foreclosure Homes Purchased N/A N/A N/A 30 Number of Homes Rehabilitated N/A N/A N/A 27 Social service application received N/A N/A N/A 850 Residents assisted with tax returns throught IRS VITA program N/A N/A 99 125 Number of Residents/Clients Assisted with Home Purchase N/A N/A N/A 70 Number of Residents/Clients Assisted by the Hardest Hit Fund N/A N/A N/A N/AHuman Services Mosquito Control Adulticiding Acres 1,009,950 1,299,495 922,528 738,030 Aerial Larviciding Acres 5,788 4,855 5,362 5,490
210210
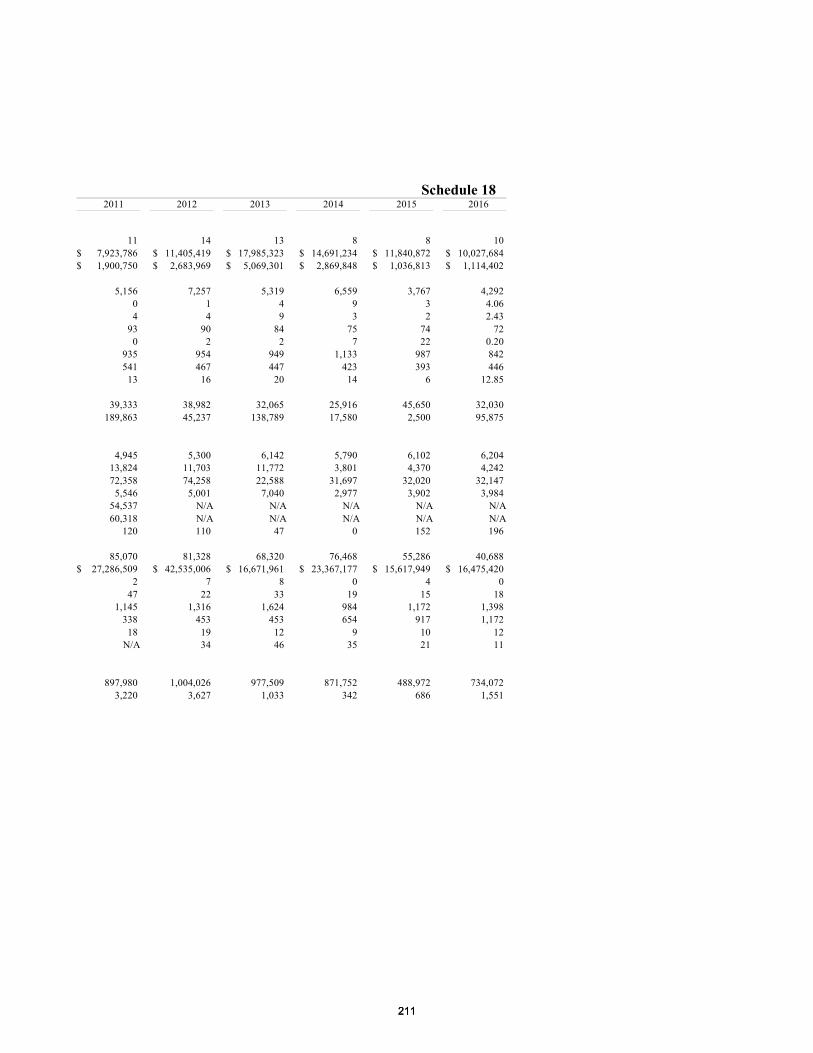
Schedule 18 2011 2012 2013 2014 2015 2016
11 14 13 8 8 10 $ 7,923,786 $ 11,405,419 $ 17,985,323 $ 14,691,234 $ 11,840,872 $ 10,027,684 $ 1,900,750 $ 2,683,969 $ 5,069,301 $ 2,869,848 $ 1,036,813 $ 1,114,402
5,156 7,257 5,319 6,559 3,767 4,292 0 1 4 9 3 4.06 4 4 9 3 2 2.43
93 90 84 75 74 72 0 2 2 7 22 0.20
935 954 949 1,133 987 842 541 467 447 423 393 446
13 16 20 14 6 12.85
39,333 38,982 32,065 25,916 45,650 32,030 189,863 45,237 138,789 17,580 2,500 95,875
4,945 5,300 6,142 5,790 6,102 6,204 13,824 11,703 11,772 3,801 4,370 4,242 72,358 74,258 22,588 31,697 32,020 32,147
5,546 5,001 7,040 2,977 3,902 3,984 54,537 N/A N/A N/A N/A N/A 60,318 N/A N/A N/A N/A N/A
120 110 47 0 152 196
85,070 81,328 68,320 76,468 55,286 40,688 $ 27,286,509 $ 42,535,006 $ 16,671,961 $ 23,367,177 $ 15,617,949 $ 16,475,420
2 7 8 0 4 0 47 22 33 19 15 18
1,145 1,316 1,624 984 1,172 1,398 338 453 453 654 917 1,172
18 19 12 9 10 12 N/A 34 46 35 21 11
897,980 1,004,026 977,509 871,752 488,972 734,072 3,220 3,627 1,033 342 686 1,551
211211
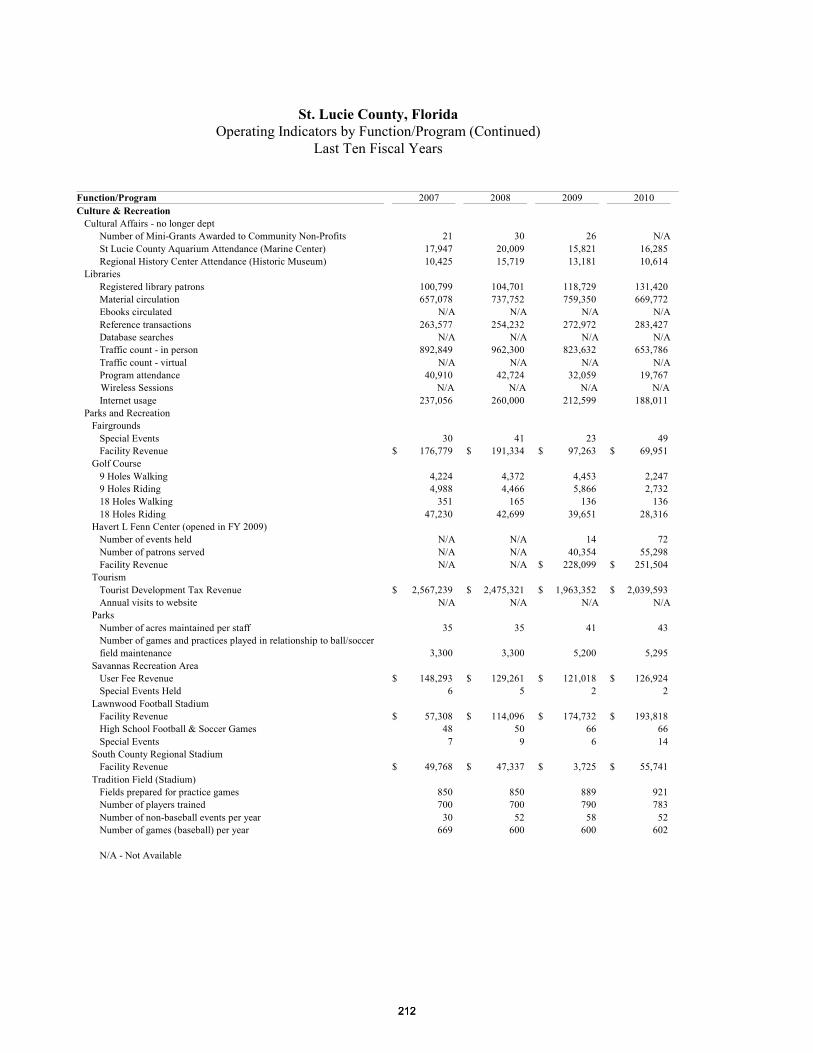
St. Lucie County, FloridaOperating Indicators by Function/Program (Continued)
Last Ten Fiscal Years
Function/Program 2007 2008 2009 2010 Culture & Recreation Cultural Affairs - no longer dept Number of Mini-Grants Awarded to Community Non-Profits 21 30 26 N/A St Lucie County Aquarium Attendance (Marine Center) 17,947 20,009 15,821 16,285 Regional History Center Attendance (Historic Museum) 10,425 15,719 13,181 10,614 Libraries Registered library patrons 100,799 104,701 118,729 131,420 Material circulation 657,078 737,752 759,350 669,772 Ebooks circulated N/A N/A N/A N/A Reference transactions 263,577 254,232 272,972 283,427 Database searches N/A N/A N/A N/A Traffic count - in person 892,849 962,300 823,632 653,786 Traffic count - virtual N/A N/A N/A N/A Program attendance 40,910 42,724 32,059 19,767 Wireless Sessions N/A N/A N/A N/A Internet usage 237,056 260,000 212,599 188,011 Parks and Recreation Fairgrounds Special Events 30 41 23 49 Facility Revenue $ 176,779 $ 191,334 $ 97,263 $ 69,951 Golf Course 9 Holes Walking 4,224 4,372 4,453 2,247 9 Holes Riding 4,988 4,466 5,866 2,732 18 Holes Walking 351 165 136 136 18 Holes Riding 47,230 42,699 39,651 28,316 Havert L Fenn Center (opened in FY 2009) Number of events held N/A N/A 14 72 Number of patrons served N/A N/A 40,354 55,298 Facility Revenue N/A N/A $ 228,099 $ 251,504 Tourism Tourist Development Tax Revenue $ 2,567,239 $ 2,475,321 $ 1,963,352 $ 2,039,593 Annual visits to website N/A N/A N/A N/A Parks Number of acres maintained per staff 35 35 41 43 Number of games and practices played in relationship to ball/soccer field maintenance 3,300 3,300 5,200 5,295 Savannas Recreation Area User Fee Revenue $ 148,293 $ 129,261 $ 121,018 $ 126,924 Special Events Held 6 5 2 2 Lawnwood Football Stadium Facility Revenue $ 57,308 $ 114,096 $ 174,732 $ 193,818 High School Football & Soccer Games 48 50 66 66 Special Events 7 9 6 14 South County Regional Stadium Facility Revenue $ 49,768 $ 47,337 $ 3,725 $ 55,741 Tradition Field (Stadium) Fields prepared for practice games 850 850 889 921 Number of players trained 700 700 790 783 Number of non-baseball events per year 30 52 58 52 Number of games (baseball) per year 669 600 600 602
N/A - Not Available
212212
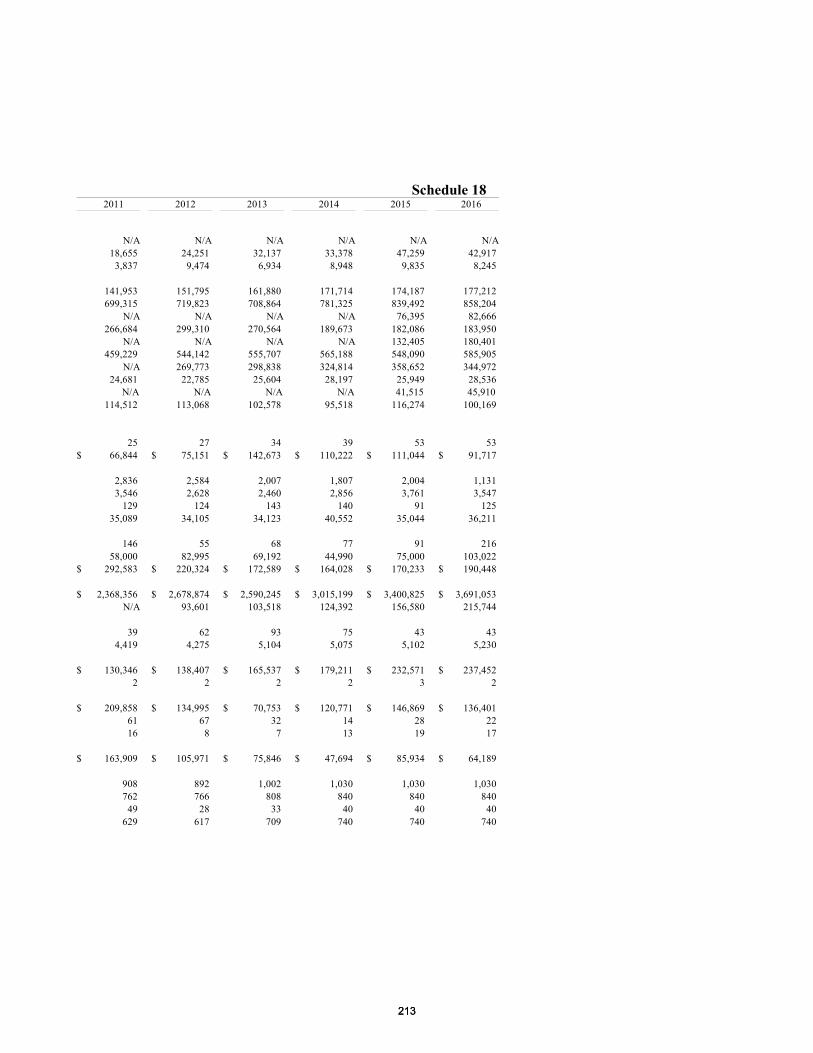
Schedule 18 2011 2012 2013 2014 2015 2016
N/A N/A N/A N/A N/A N/A 18,655 24,251 32,137 33,378 47,259 42,917
3,837 9,474 6,934 8,948 9,835 8,245
141,953 151,795 161,880 171,714 174,187 177,212 699,315 719,823 708,864 781,325 839,492 858,204
N/A N/A N/A N/A 76,395 82,666 266,684 299,310 270,564 189,673 182,086 183,950
N/A N/A N/A N/A 132,405 180,401 459,229 544,142 555,707 565,188 548,090 585,905
N/A 269,773 298,838 324,814 358,652 344,972 24,681 22,785 25,604 28,197 25,949 28,536
N/A N/A N/A N/A 41,515 45,910 114,512 113,068 102,578 95,518 116,274 100,169
25 27 34 39 53 53 $ 66,844 $ 75,151 $ 142,673 $ 110,222 $ 111,044 $ 91,717
2,836 2,584 2,007 1,807 2,004 1,131 3,546 2,628 2,460 2,856 3,761 3,547
129 124 143 140 91 125 35,089 34,105 34,123 40,552 35,044 36,211
146 55 68 77 91 216 58,000 82,995 69,192 44,990 75,000 103,022
$ 292,583 $ 220,324 $ 172,589 $ 164,028 $ 170,233 $ 190,448
$ 2,368,356 $ 2,678,874 $ 2,590,245 $ 3,015,199 $ 3,400,825 $ 3,691,053 N/A 93,601 103,518 124,392 156,580 215,744
39 62 93 75 43 43 4,419 4,275 5,104 5,075 5,102 5,230
$ 130,346 $ 138,407 $ 165,537 $ 179,211 $ 232,571 $ 237,452 2 2 2 2 3 2
$ 209,858 $ 134,995 $ 70,753 $ 120,771 $ 146,869 $ 136,401 61 67 32 14 28 22 16 8 7 13 19 17
$ 163,909 $ 105,971 $ 75,846 $ 47,694 $ 85,934 $ 64,189
908 892 1,002 1,030 1,030 1,030 762 766 808 840 840 840
49 28 33 40 40 40 629 617 709 740 740 740
213213
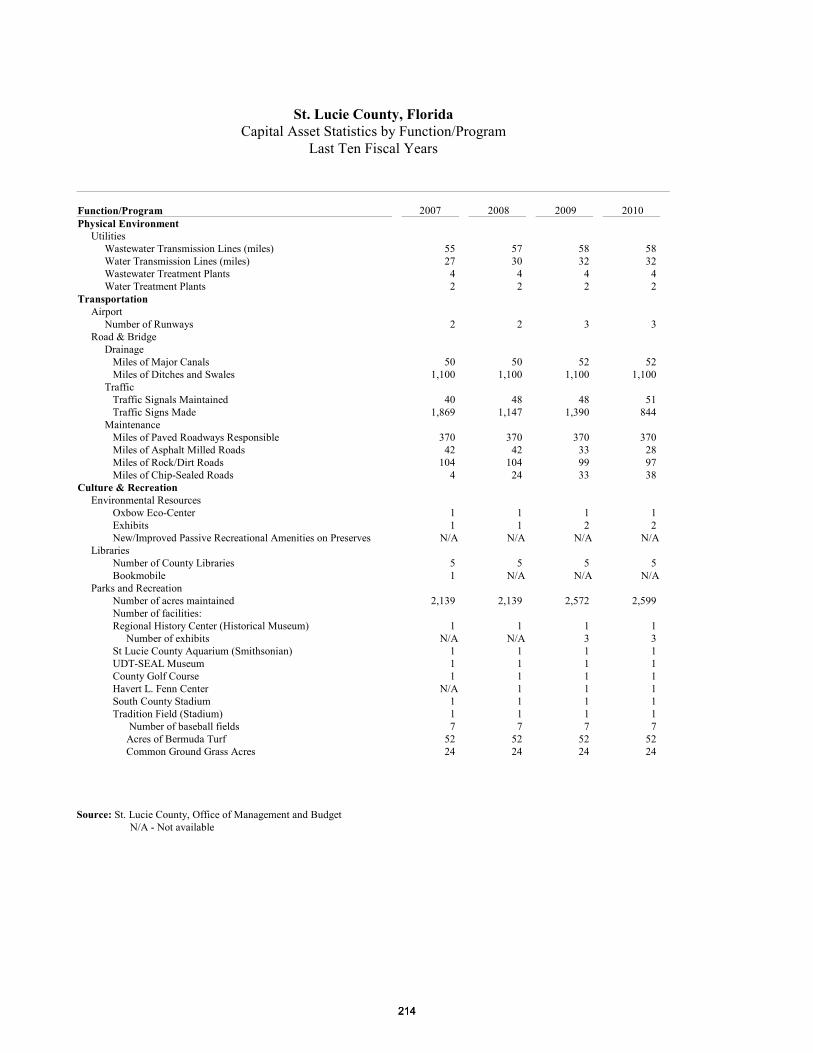
St. Lucie County, FloridaCapital Asset Statistics by Function/Program
Last Ten Fiscal Years
Function/Program 2007 2008 2009 2010 Physical Environment Utilities Wastewater Transmission Lines (miles) 55 57 58 58 Water Transmission Lines (miles) 27 30 32 32 Wastewater Treatment Plants 4 4 4 4 Water Treatment Plants 2 2 2 2 Transportation Airport Number of Runways 2 2 3 3 Road & Bridge Drainage Miles of Major Canals 50 50 52 52 Miles of Ditches and Swales 1,100 1,100 1,100 1,100 Traffic Traffic Signals Maintained 40 48 48 51 Traffic Signs Made 1,869 1,147 1,390 844 Maintenance Miles of Paved Roadways Responsible 370 370 370 370 Miles of Asphalt Milled Roads 42 42 33 28 Miles of Rock/Dirt Roads 104 104 99 97 Miles of Chip-Sealed Roads 4 24 33 38 Culture & Recreation Environmental Resources Oxbow Eco-Center 1 1 1 1 Exhibits 1 1 2 2 New/Improved Passive Recreational Amenities on Preserves N/A N/A N/A N/A Libraries Number of County Libraries 5 5 5 5 Bookmobile 1 N/A N/A N/A Parks and Recreation Number of acres maintained 2,139 2,139 2,572 2,599 Number of facilities: Regional History Center (Historical Museum) 1 1 1 1 Number of exhibits N/A N/A 3 3 St Lucie County Aquarium (Smithsonian) 1 1 1 1 UDT-SEAL Museum 1 1 1 1 County Golf Course 1 1 1 1 Havert L. Fenn Center N/A 1 1 1 South County Stadium 1 1 1 1 Tradition Field (Stadium) 1 1 1 1 Number of baseball fields 7 7 7 7 Acres of Bermuda Turf 52 52 52 52 Common Ground Grass Acres 24 24 24 24
Source: St. Lucie County, Office of Management and Budget N/A - Not available
214214
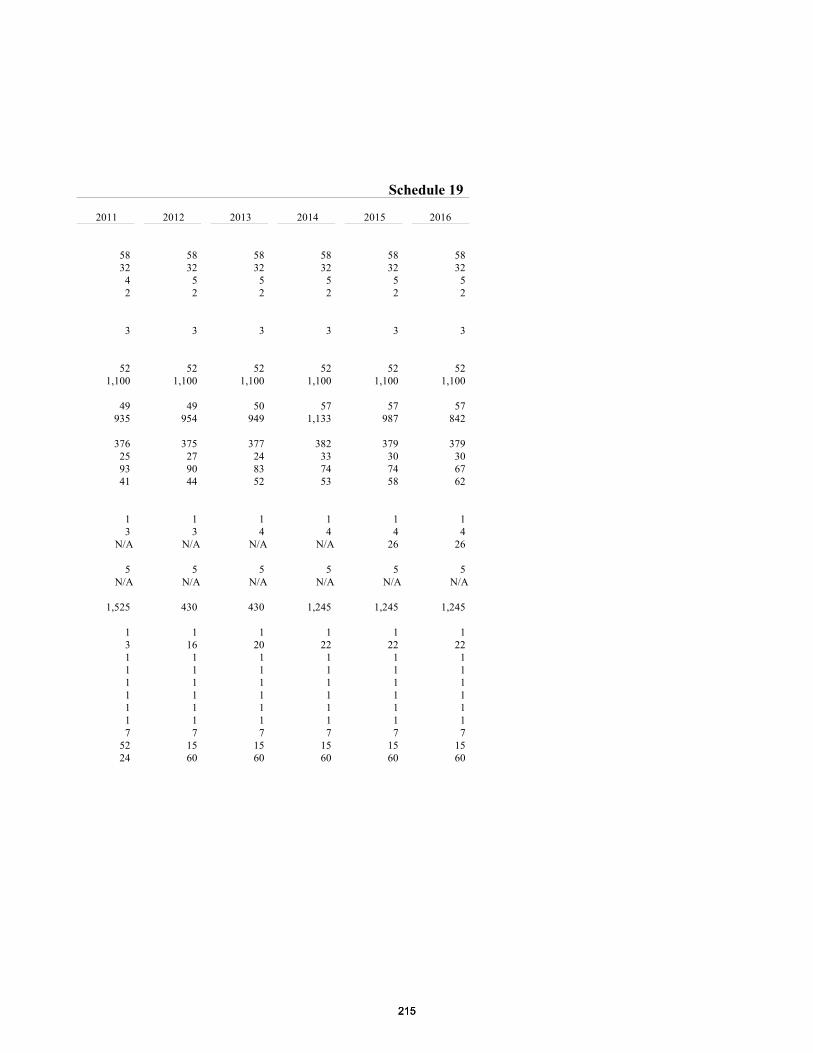
Schedule 19
2011 2012 2013 2014 2015 2016
58 58 58 58 58 58 32 32 32 32 32 32
4 5 5 5 5 5 2 2 2 2 2 2
3 3 3 3 3 3
52 52 52 52 52 52 1,100 1,100 1,100 1,100 1,100 1,100
49 49 50 57 57 57 935 954 949 1,133 987 842
376 375 377 382 379 379 25 27 24 33 30 30 93 90 83 74 74 67 41 44 52 53 58 62
1 1 1 1 1 1 3 3 4 4 4 4
N/A N/A N/A N/A 26 26
5 5 5 5 5 5 N/A N/A N/A N/A N/A N/A
1,525 430 430 1,245 1,245 1,245
1 1 1 1 1 1 3 16 20 22 22 22 1 1 1 1 1 1 1 1 1 1 1 1 1 1 1 1 1 1 1 1 1 1 1 1 1 1 1 1 1 1 1 1 1 1 1 1 7 7 7 7 7 7
52 15 15 15 15 15 24 60 60 60 60 60
215215

THIS PAGE INTENTIONALLY LEFT BLANK
216216
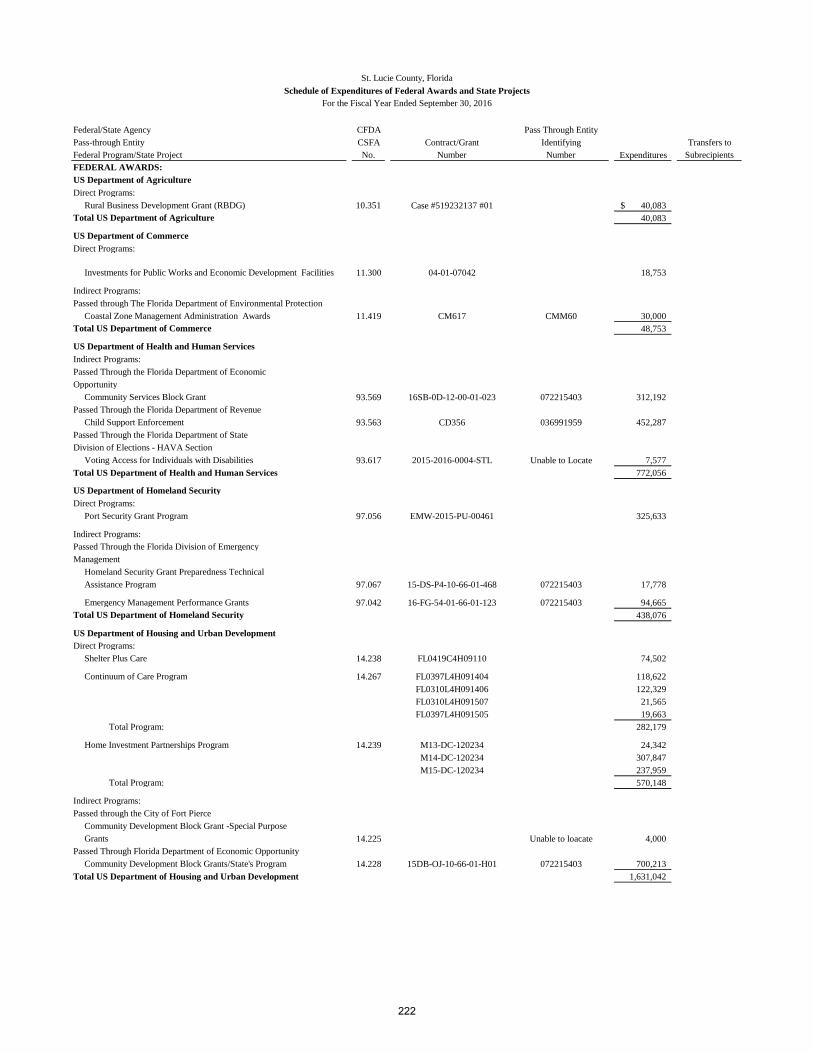
Federal/State Agency CFDA Pass Through Entity
Pass-through Entity CSFA Contract/Grant Identifying Transfers to
Federal Program/State Project No. Number Number Expenditures Subrecipients
FEDERAL AWARDS:
US Department of Agriculture
Direct Programs:
Rural Business Development Grant (RBDG) 10.351 Case #519232137 #01 40,083$
Total US Department of Agriculture 40,083
US Department of Commerce
Direct Programs:
Investments for Public Works and Economic Development Facilities 11.300 04-01-07042 18,753
Indirect Programs:
Passed through The Florida Department of Environmental Protection
Coastal Zone Management Administration Awards 11.419 CM617 CMM60 30,000
Total US Department of Commerce 48,753
US Department of Health and Human Services
Indirect Programs:
Passed Through the Florida Department of Economic
Opportunity
Community Services Block Grant 93.569 16SB-0D-12-00-01-023 072215403 312,192
Passed Through the Florida Department of Revenue
Child Support Enforcement 93.563 CD356 036991959 452,287
Passed Through the Florida Department of State
Division of Elections - HAVA Section
Voting Access for Individuals with Disabilities 93.617 2015-2016-0004-STL Unable to Locate 7,577
Total US Department of Health and Human Services 772,056
US Department of Homeland Security
Direct Programs:
Port Security Grant Program 97.056 EMW-2015-PU-00461 325,633
Indirect Programs:
Passed Through the Florida Division of Emergency
Management
Homeland Security Grant Preparedness Technical
Assistance Program 97.067 15-DS-P4-10-66-01-468 072215403 17,778
Emergency Management Performance Grants 97.042 16-FG-54-01-66-01-123 072215403 94,665
Total US Department of Homeland Security 438,076
US Department of Housing and Urban Development
Direct Programs:
Shelter Plus Care 14.238 FL0419C4H09110 74,502
Continuum of Care Program 14.267 FL0397L4H091404 118,622
FL0310L4H091406 122,329
FL0310L4H091507 21,565
FL0397L4H091505 19,663
Total Program: 282,179
Home Investment Partnerships Program 14.239 M13-DC-120234 24,342
M14-DC-120234 307,847
M15-DC-120234 237,959
Total Program: 570,148
Indirect Programs:
Passed through the City of Fort Pierce
Community Development Block Grant -Special Purpose
Grants 14.225 Unable to loacate 4,000
Passed Through Florida Department of Economic Opportunity
Community Development Block Grants/State's Program 14.228 15DB-OJ-10-66-01-H01 072215403 700,213
Total US Department of Housing and Urban Development 1,631,042
St. Lucie County, Florida
Schedule of Expenditures of Federal Awards and State Projects
For the Fiscal Year Ended September 30, 2016
222
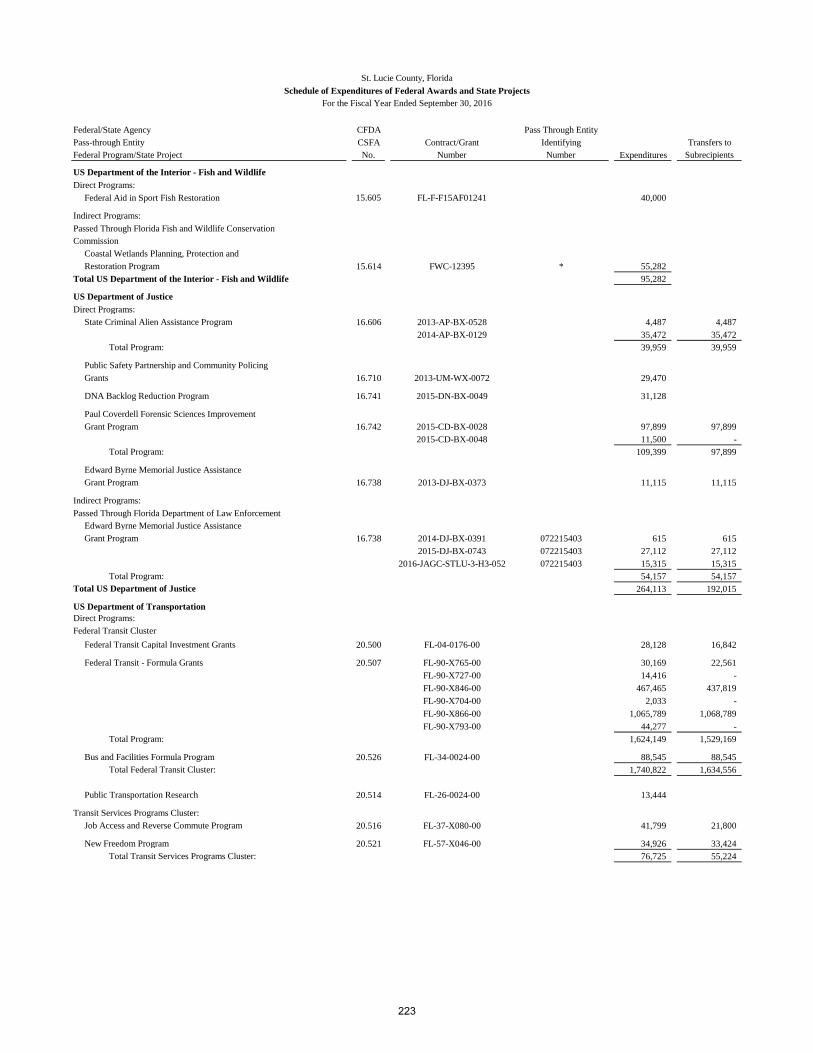
Federal/State Agency CFDA Pass Through Entity
Pass-through Entity CSFA Contract/Grant Identifying Transfers to
Federal Program/State Project No. Number Number Expenditures Subrecipients
St. Lucie County, Florida
Schedule of Expenditures of Federal Awards and State Projects
For the Fiscal Year Ended September 30, 2016
US Department of the Interior - Fish and Wildlife
Direct Programs:
Federal Aid in Sport Fish Restoration 15.605 FL-F-F15AF01241 40,000
Indirect Programs:
Passed Through Florida Fish and Wildlife Conservation
Commission
Coastal Wetlands Planning, Protection and
Restoration Program 15.614 FWC-12395 * 55,282
Total US Department of the Interior - Fish and Wildlife 95,282
US Department of Justice
Direct Programs:
State Criminal Alien Assistance Program 16.606 2013-AP-BX-0528 4,487 4,487
2014-AP-BX-0129 35,472 35,472
Total Program: 39,959 39,959
Public Safety Partnership and Community Policing
Grants 16.710 2013-UM-WX-0072 29,470
DNA Backlog Reduction Program 16.741 2015-DN-BX-0049 31,128
Paul Coverdell Forensic Sciences Improvement
Grant Program 16.742 2015-CD-BX-0028 97,899 97,899
2015-CD-BX-0048 11,500 -
Total Program: 109,399 97,899
Edward Byrne Memorial Justice Assistance
Grant Program 16.738 2013-DJ-BX-0373 11,115 11,115
Indirect Programs:
Passed Through Florida Department of Law Enforcement
Edward Byrne Memorial Justice Assistance
Grant Program 16.738 2014-DJ-BX-0391 072215403 615 615
2015-DJ-BX-0743 072215403 27,112 27,112
2016-JAGC-STLU-3-H3-052 072215403 15,315 15,315
Total Program: 54,157 54,157
Total US Department of Justice 264,113 192,015
US Department of Transportation
Direct Programs:
Federal Transit Cluster
Federal Transit Capital Investment Grants 20.500 FL-04-0176-00 28,128 16,842
Federal Transit - Formula Grants 20.507 FL-90-X765-00 30,169 22,561
FL-90-X727-00 14,416 -
FL-90-X846-00 467,465 437,819
FL-90-X704-00 2,033 -
FL-90-X866-00 1,065,789 1,068,789
FL-90-X793-00 44,277 -
Total Program: 1,624,149 1,529,169
Bus and Facilities Formula Program 20.526 FL-34-0024-00 88,545 88,545
Total Federal Transit Cluster: 1,740,822 1,634,556
Public Transportation Research 20.514 FL-26-0024-00 13,444
Transit Services Programs Cluster:
Job Access and Reverse Commute Program 20.516 FL-37-X080-00 41,799 21,800
New Freedom Program 20.521 FL-57-X046-00 34,926 33,424
Total Transit Services Programs Cluster: 76,725 55,224
223
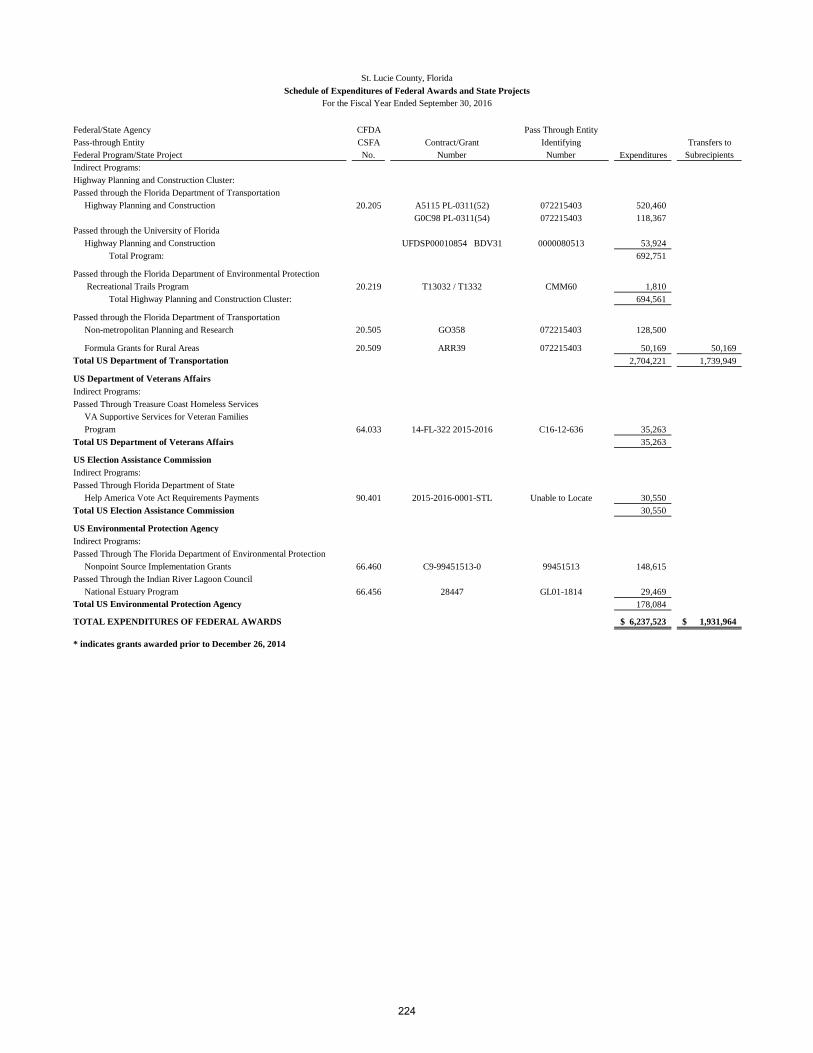
Federal/State Agency CFDA Pass Through Entity
Pass-through Entity CSFA Contract/Grant Identifying Transfers to
Federal Program/State Project No. Number Number Expenditures Subrecipients
St. Lucie County, Florida
Schedule of Expenditures of Federal Awards and State Projects
For the Fiscal Year Ended September 30, 2016
Indirect Programs:
Highway Planning and Construction Cluster:
Passed through the Florida Department of Transportation
Highway Planning and Construction 20.205 A5115 PL-0311(52) 072215403 520,460
G0C98 PL-0311(54) 072215403 118,367
Passed through the University of Florida
Highway Planning and Construction UFDSP00010854 BDV31 0000080513 53,924
Total Program: 692,751
Passed through the Florida Department of Environmental Protection
Recreational Trails Program 20.219 T13032 / T1332 CMM60 1,810
Total Highway Planning and Construction Cluster: 694,561
Passed through the Florida Department of Transportation
Non-metropolitan Planning and Research 20.505 GO358 072215403 128,500
Formula Grants for Rural Areas 20.509 ARR39 072215403 50,169 50,169
Total US Department of Transportation 2,704,221 1,739,949
US Department of Veterans Affairs
Indirect Programs:
Passed Through Treasure Coast Homeless Services
VA Supportive Services for Veteran Families
Program 64.033 14-FL-322 2015-2016 C16-12-636 35,263
Total US Department of Veterans Affairs 35,263
US Election Assistance Commission
Indirect Programs:
Passed Through Florida Department of State
Help America Vote Act Requirements Payments 90.401 2015-2016-0001-STL Unable to Locate 30,550
Total US Election Assistance Commission 30,550
US Environmental Protection Agency
Indirect Programs:
Passed Through The Florida Department of Environmental Protection
Nonpoint Source Implementation Grants 66.460 C9-99451513-0 99451513 148,615
Passed Through the Indian River Lagoon Council
National Estuary Program 66.456 28447 GL01-1814 29,469
Total US Environmental Protection Agency 178,084
TOTAL EXPENDITURES OF FEDERAL AWARDS 6,237,523$ 1,931,964$
* indicates grants awarded prior to December 26, 2014
224
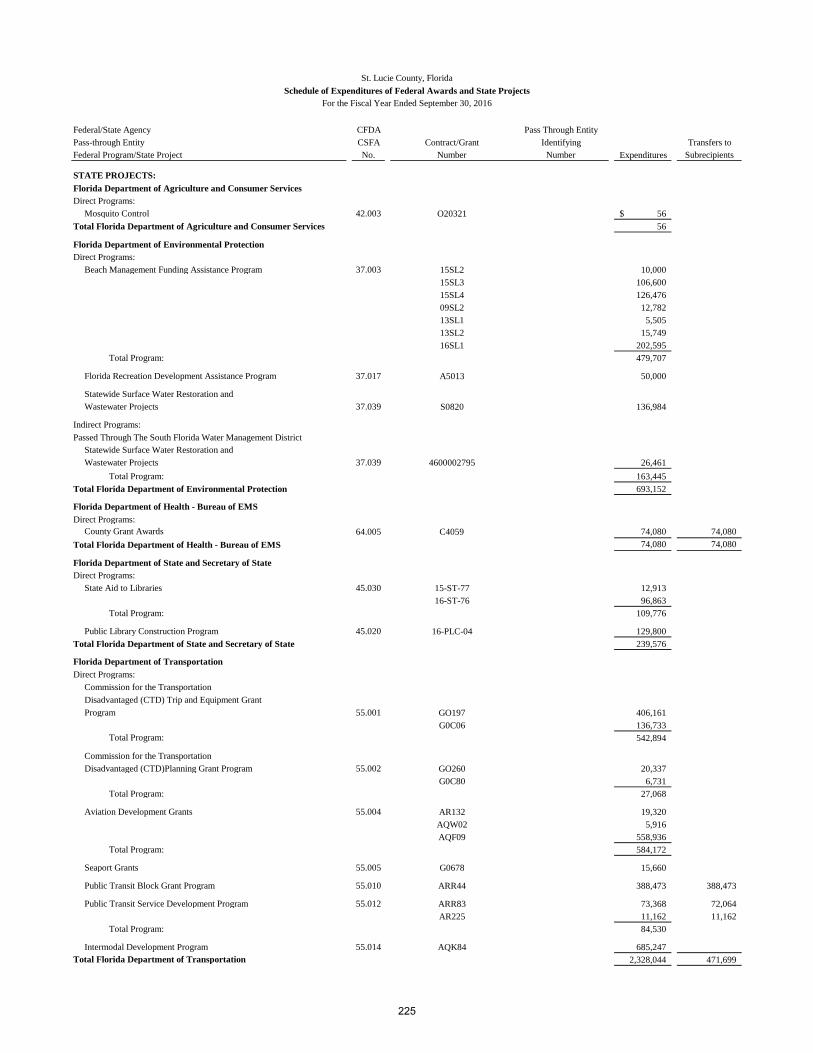
Federal/State Agency CFDA Pass Through Entity
Pass-through Entity CSFA Contract/Grant Identifying Transfers to
Federal Program/State Project No. Number Number Expenditures Subrecipients
St. Lucie County, Florida
Schedule of Expenditures of Federal Awards and State Projects
For the Fiscal Year Ended September 30, 2016
STATE PROJECTS:
Florida Department of Agriculture and Consumer Services
Direct Programs:
Mosquito Control 42.003 O20321 56$
Total Florida Department of Agriculture and Consumer Services 56
Florida Department of Environmental Protection
Direct Programs:
Beach Management Funding Assistance Program 37.003 15SL2 10,000
15SL3 106,600
15SL4 126,476
09SL2 12,782
13SL1 5,505
13SL2 15,749
16SL1 202,595
Total Program: 479,707
Florida Recreation Development Assistance Program 37.017 A5013 50,000
Statewide Surface Water Restoration and
Wastewater Projects 37.039 S0820 136,984
Indirect Programs:
Passed Through The South Florida Water Management District
Statewide Surface Water Restoration and
Wastewater Projects 37.039 4600002795 26,461
Total Program: 163,445
Total Florida Department of Environmental Protection 693,152
Florida Department of Health - Bureau of EMS
Direct Programs:
County Grant Awards 64.005 C4059 74,080 74,080
Total Florida Department of Health - Bureau of EMS 74,080 74,080
Florida Department of State and Secretary of State
Direct Programs:
State Aid to Libraries 45.030 15-ST-77 12,913
16-ST-76 96,863
Total Program: 109,776
Public Library Construction Program 45.020 16-PLC-04 129,800
Total Florida Department of State and Secretary of State 239,576
Florida Department of Transportation
Direct Programs:
Commission for the Transportation
Disadvantaged (CTD) Trip and Equipment Grant
Program 55.001 GO197 406,161
G0C06 136,733
Total Program: 542,894
Commission for the Transportation
Disadvantaged (CTD)Planning Grant Program 55.002 GO260 20,337
G0C80 6,731
Total Program: 27,068
Aviation Development Grants 55.004 AR132 19,320
AQW02 5,916
AQF09 558,936
Total Program: 584,172
Seaport Grants 55.005 G0678 15,660
Public Transit Block Grant Program 55.010 ARR44 388,473 388,473
Public Transit Service Development Program 55.012 ARR83 73,368 72,064
AR225 11,162 11,162
Total Program: 84,530
Intermodal Development Program 55.014 AQK84 685,247
Total Florida Department of Transportation 2,328,044 471,699
225
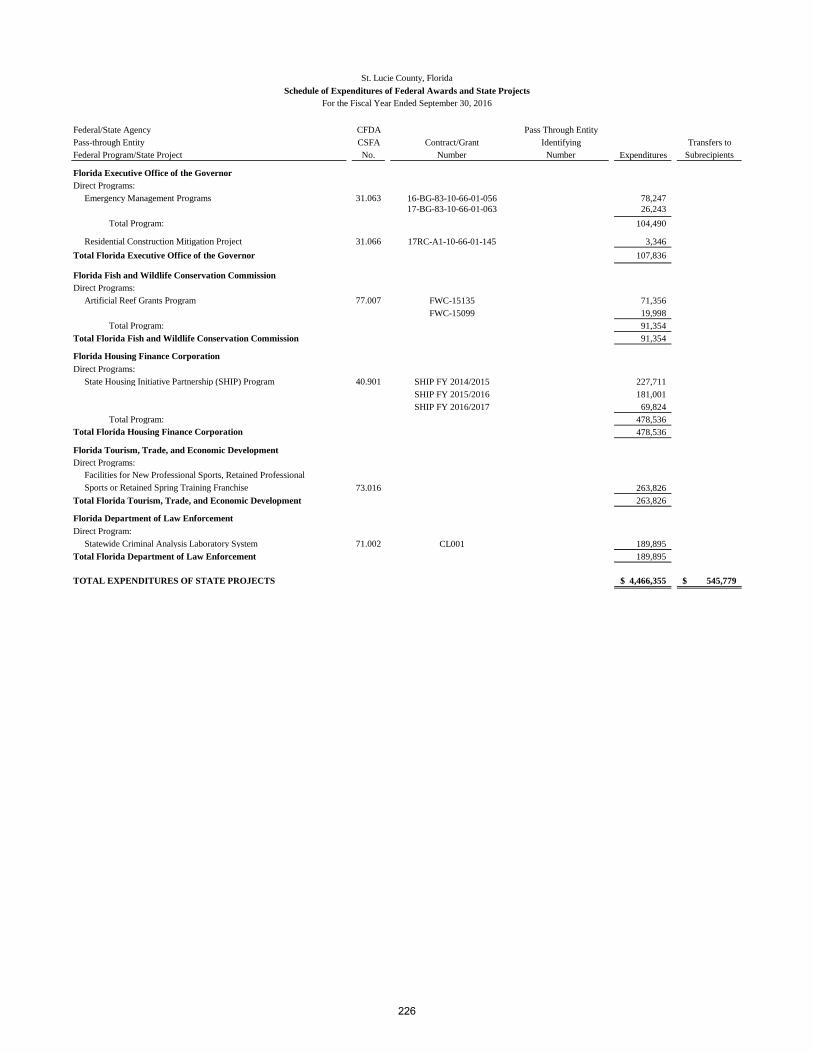
Federal/State Agency CFDA Pass Through Entity
Pass-through Entity CSFA Contract/Grant Identifying Transfers to
Federal Program/State Project No. Number Number Expenditures Subrecipients
St. Lucie County, Florida
Schedule of Expenditures of Federal Awards and State Projects
For the Fiscal Year Ended September 30, 2016
Florida Executive Office of the Governor
Direct Programs:
Emergency Management Programs 31.063 16-BG-83-10-66-01-056 78,247
17-BG-83-10-66-01-063 26,243
Total Program: 104,490
Residential Construction Mitigation Project 31.066 17RC-A1-10-66-01-145 3,346
Total Florida Executive Office of the Governor 107,836
Florida Fish and Wildlife Conservation Commission
Direct Programs:
Artificial Reef Grants Program 77.007 FWC-15135 71,356
FWC-15099 19,998
Total Program: 91,354
Total Florida Fish and Wildlife Conservation Commission 91,354
Florida Housing Finance Corporation
Direct Programs:
State Housing Initiative Partnership (SHIP) Program 40.901 SHIP FY 2014/2015 227,711
SHIP FY 2015/2016 181,001
SHIP FY 2016/2017 69,824
Total Program: 478,536
Total Florida Housing Finance Corporation 478,536
Florida Tourism, Trade, and Economic Development
Direct Programs:
Facilities for New Professional Sports, Retained Professional
Sports or Retained Spring Training Franchise 73.016 263,826
Total Florida Tourism, Trade, and Economic Development 263,826
Florida Department of Law Enforcement
Direct Program:
Statewide Criminal Analysis Laboratory System 71.002 CL001 189,895
Total Florida Department of Law Enforcement 189,895
TOTAL EXPENDITURES OF STATE PROJECTS 4,466,355$ 545,779$
226
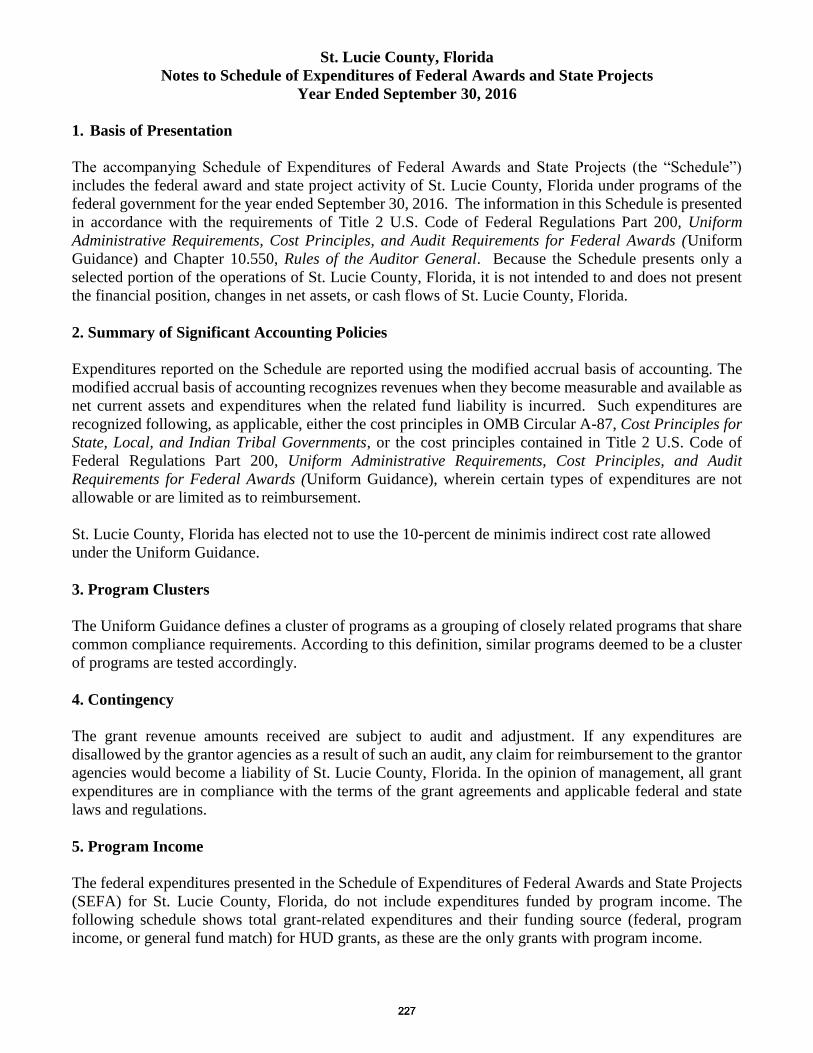
St. Lucie County, Florida
Notes to Schedule of Expenditures of Federal Awards and State Projects
Year Ended September 30, 2016
1. Basis of Presentation
The accompanying Schedule of Expenditures of Federal Awards and State Projects (the “Schedule”)
includes the federal award and state project activity of St. Lucie County, Florida under programs of the
federal government for the year ended September 30, 2016. The information in this Schedule is presented
in accordance with the requirements of Title 2 U.S. Code of Federal Regulations Part 200, Uniform
Administrative Requirements, Cost Principles, and Audit Requirements for Federal Awards (Uniform
Guidance) and Chapter 10.550, Rules of the Auditor General. Because the Schedule presents only a
selected portion of the operations of St. Lucie County, Florida, it is not intended to and does not present
the financial position, changes in net assets, or cash flows of St. Lucie County, Florida.
2. Summary of Significant Accounting Policies
Expenditures reported on the Schedule are reported using the modified accrual basis of accounting. The
modified accrual basis of accounting recognizes revenues when they become measurable and available as
net current assets and expenditures when the related fund liability is incurred. Such expenditures are
recognized following, as applicable, either the cost principles in OMB Circular A-87, Cost Principles for
State, Local, and Indian Tribal Governments, or the cost principles contained in Title 2 U.S. Code of
Federal Regulations Part 200, Uniform Administrative Requirements, Cost Principles, and Audit
Requirements for Federal Awards (Uniform Guidance), wherein certain types of expenditures are not
allowable or are limited as to reimbursement.
St. Lucie County, Florida has elected not to use the 10-percent de minimis indirect cost rate allowed
under the Uniform Guidance.
3. Program Clusters
The Uniform Guidance defines a cluster of programs as a grouping of closely related programs that share
common compliance requirements. According to this definition, similar programs deemed to be a cluster
of programs are tested accordingly.
4. Contingency
The grant revenue amounts received are subject to audit and adjustment. If any expenditures are
disallowed by the grantor agencies as a result of such an audit, any claim for reimbursement to the grantor
agencies would become a liability of St. Lucie County, Florida. In the opinion of management, all grant
expenditures are in compliance with the terms of the grant agreements and applicable federal and state
laws and regulations.
5. Program Income
The federal expenditures presented in the Schedule of Expenditures of Federal Awards and State Projects
(SEFA) for St. Lucie County, Florida, do not include expenditures funded by program income. The
following schedule shows total grant-related expenditures and their funding source (federal, program
income, or general fund match) for HUD grants, as these are the only grants with program income.
227227
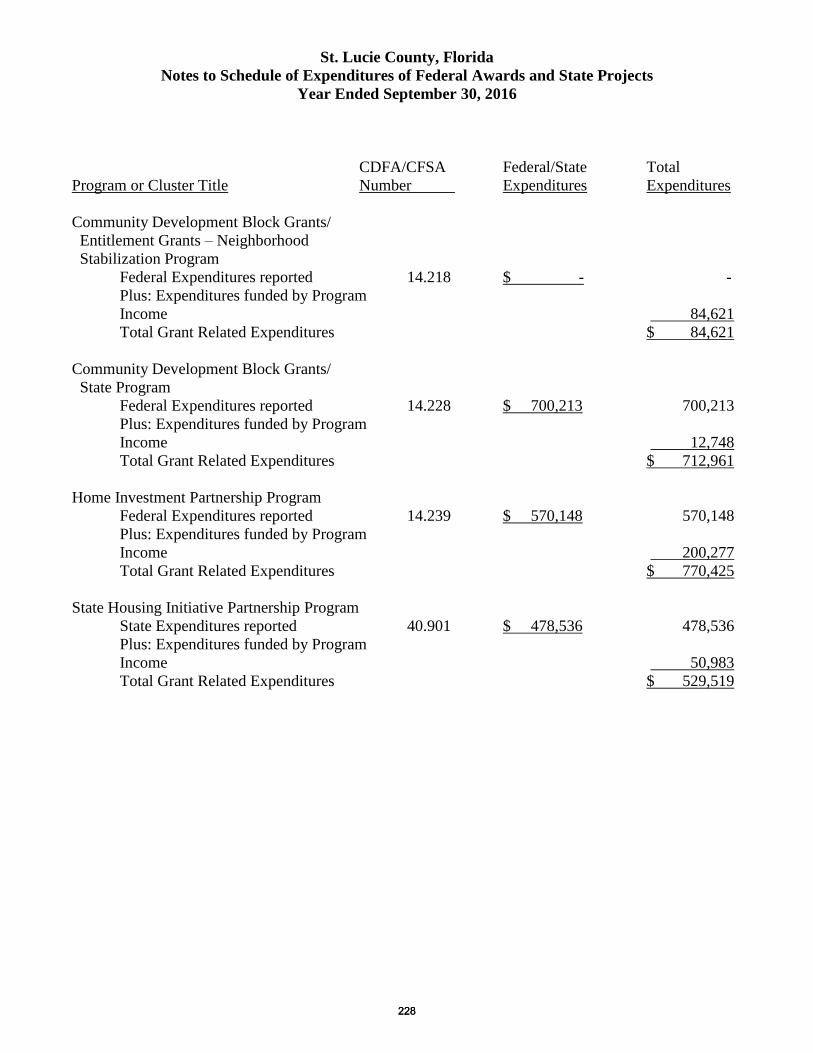
St. Lucie County, Florida
Notes to Schedule of Expenditures of Federal Awards and State Projects
Year Ended September 30, 2016
CDFA/CFSA Federal/State Total
Program or Cluster Title Number Expenditures Expenditures
Community Development Block Grants/
Entitlement Grants – Neighborhood
Stabilization Program
Federal Expenditures reported 14.218 $ - -
Plus: Expenditures funded by Program
Income 84,621
Total Grant Related Expenditures $ 84,621
Community Development Block Grants/
State Program
Federal Expenditures reported 14.228 $ 700,213 700,213
Plus: Expenditures funded by Program
Income 12,748
Total Grant Related Expenditures $ 712,961
Home Investment Partnership Program
Federal Expenditures reported 14.239 $ 570,148 570,148
Plus: Expenditures funded by Program
Income 200,277
Total Grant Related Expenditures $ 770,425
State Housing Initiative Partnership Program
State Expenditures reported 40.901 $ 478,536 478,536
Plus: Expenditures funded by Program
Income 50,983
Total Grant Related Expenditures $ 529,519
228228
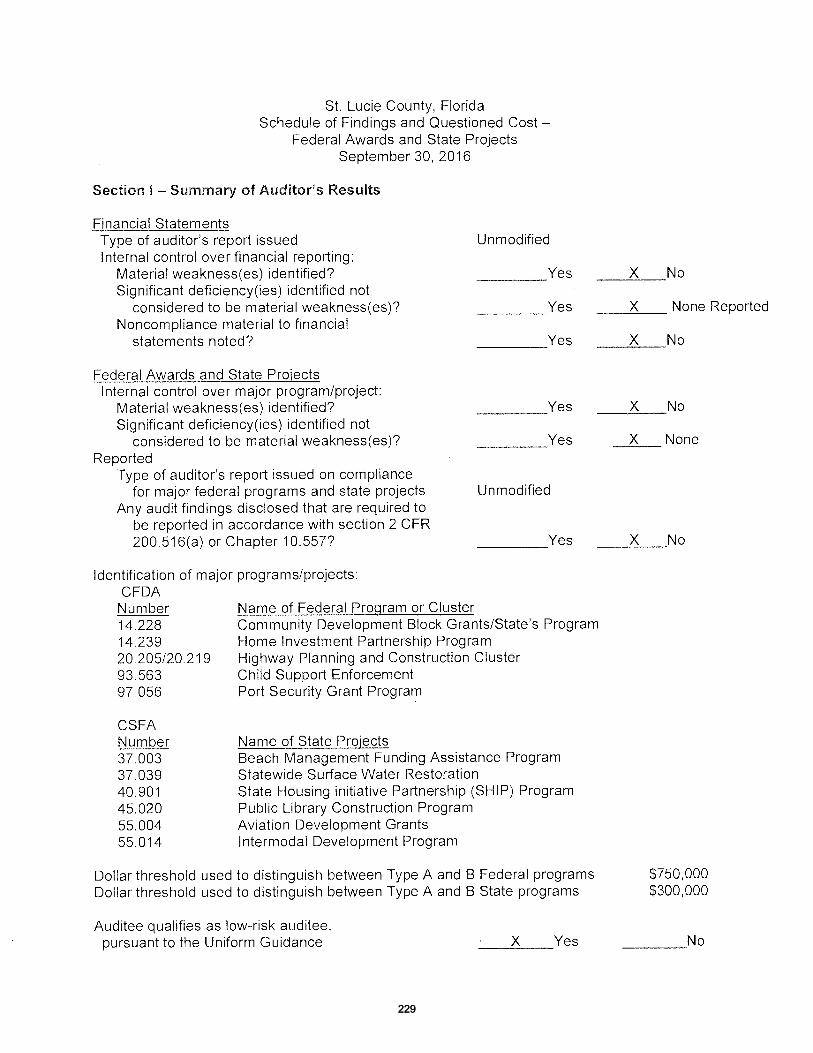
229229
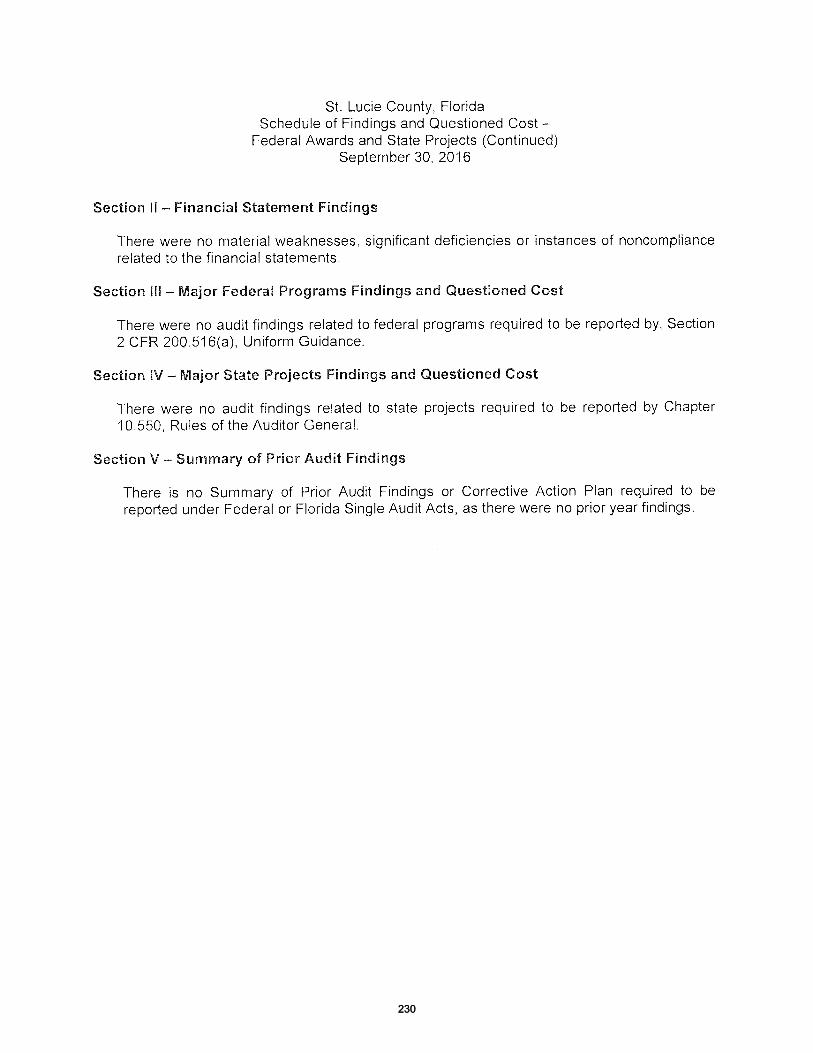
230230

Comprehensive Annual Financial Report for the Fiscal Year Ended
September 30, 2016
www.stlucieclerk.com
Related Documents