H2 at Scale CaFCP April 25, 2017 1 April 25, 2017 CaFCP Meeting H 2 @Scale: Energy system-wide benefits of increased H 2 implementation THE Ames Lab H2@Scale Workshop Report available at http://www.nrel.gov/docs/fy17osti/68244.pdf H2@Scale webinar available at http://energy.gov/eere/fuelcells/downloads/h2-scale-potential-opportunity-webinar

Welcome message from author
This document is posted to help you gain knowledge. Please leave a comment to let me know what you think about it! Share it to your friends and learn new things together.
Transcript
H2 at Scale CaFCP April 25, 2017 1
April 25, 2017
CaFCP Meeting H2 @Scale:
Energy system-wide benefits of increased H2 implementation
THEAmesLab
H2@Scale Workshop Report available at http://www.nrel.gov/docs/fy17osti/68244.pdf
H2@Scale webinar available at http://energy.gov/eere/fuelcells/downloads/h2-scale-potential-opportunity-webinar
H2 at Scale CaFCP April 25, 2017 2
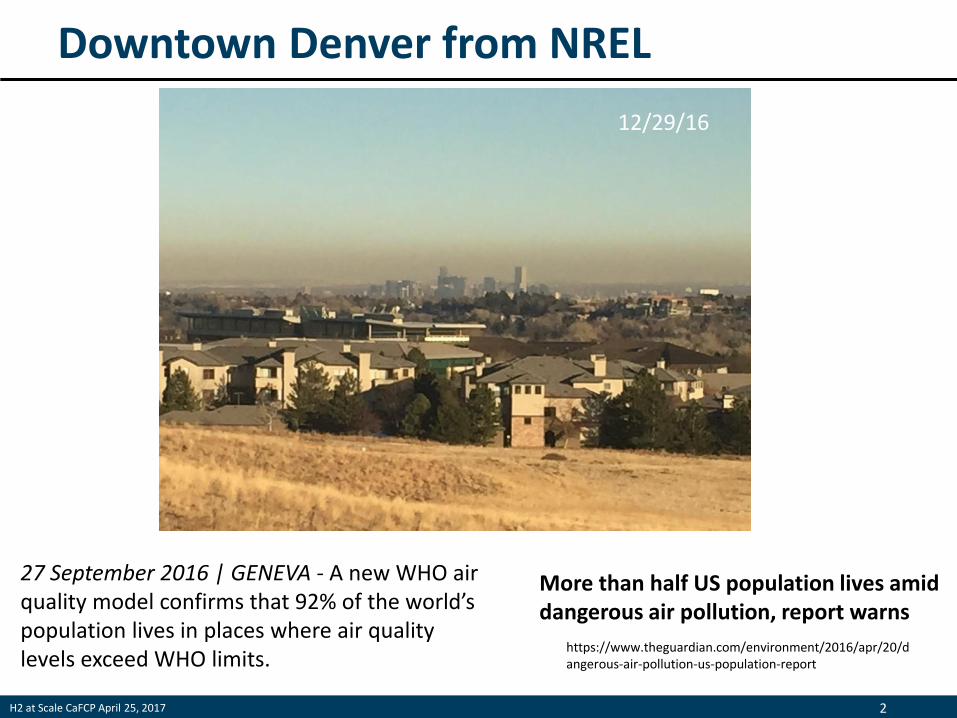
Downtown Denver from NREL
How do we supply all these services in the
most beneficial manner?
12/29/16
27 September 2016 | GENEVA - A new WHO air quality model confirms that 92% of the world’s population lives in places where air quality levels exceed WHO limits.
More than half US population lives amid dangerous air pollution, report warns
https://www.theguardian.com/environment/2016/apr/20/dangerous-air-pollution-us-population-report
H2 at Scale CaFCP April 25, 2017 3
Energy System Challenge
• Multi-sector requirements
o Transportation
o Industrial
o Grid
How do we supply all these services in the
most beneficial manner?
H2 at Scale CaFCP April 25, 2017 4
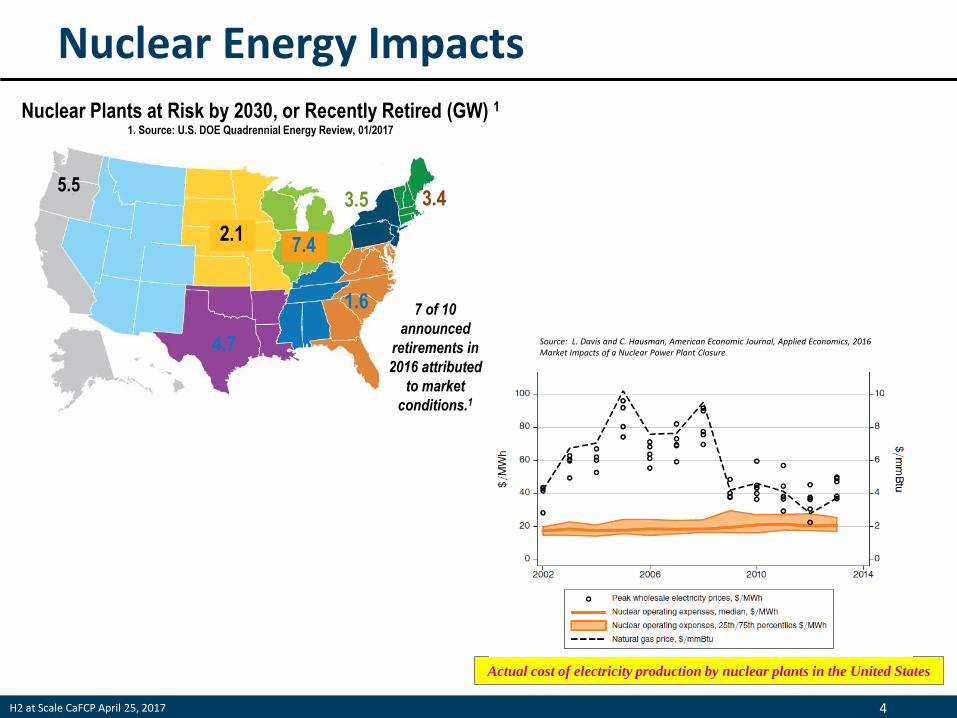
Nuclear Energy Impacts Nuclear Plants at Risk by 2030, or Recently Retired (GW) 1
1. Source: U.S. DOE Quadrennial Energy Review, 01/2017
4.7
5.5
1.6
2.1 7.4
3.5 3.4
7 of 10
announced
retirements in
2016 attributed
to market
conditions.1
Actual cost of electricity production by nuclear plants in the United States
Source: L. Davis and C. Hausman, American Economic Journal, Applied Economics, 2016 Market Impacts of a Nuclear Power Plant Closure
H2 at Scale CaFCP April 25, 2017 5
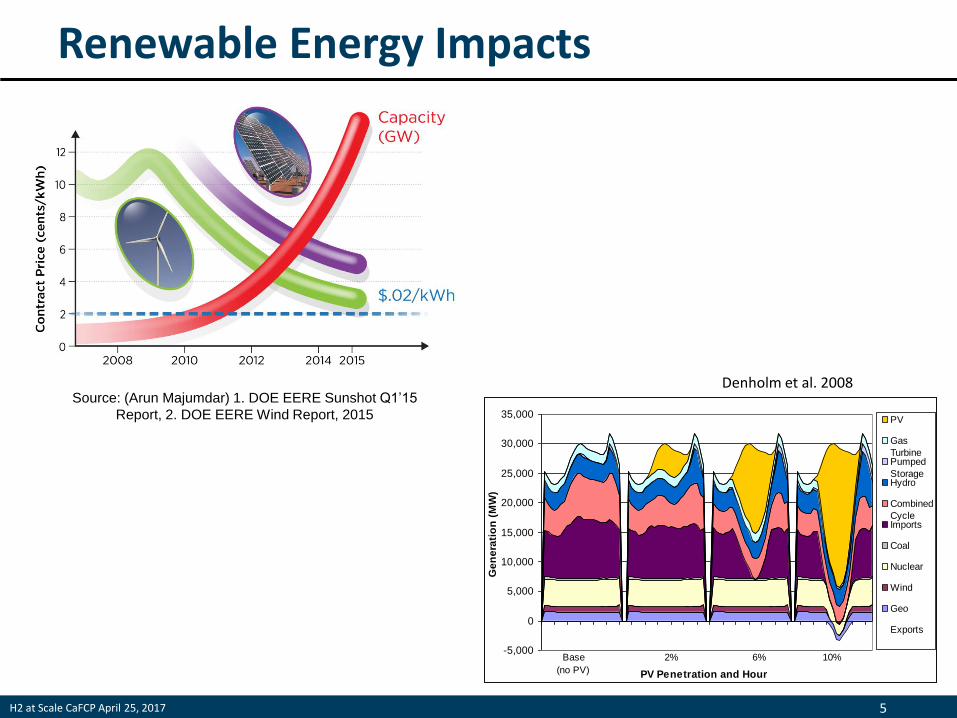
Renewable Energy Impacts
-5,000
0
5,000
10,000
15,000
20,000
25,000
30,000
35,000
PV Penetration and Hour
Ge
ne
rati
on
(M
W)
PV
Gas
TurbinePumped
StorageHydro
Combined
CycleImports
Coal
Nuclear
Wind
Geo
Exports
Base 2% 6% 10%
(no PV)
Source: (Arun Majumdar) 1. DOE EERE Sunshot Q1’15
Report, 2. DOE EERE Wind Report, 2015
Denholm et al. 2008
6
% V
aria
ble
Re
ne
wab
le E
ne
rgy
(of
ann
ual
en
erg
y)
System Size (GW) 1 0.1 0.01 0.001 1000 100 10
25
50
75
100
Credit: B. Kroposki, NREL
8
0
5
2
3
Alaska Village
Ireland Cont. USA
4
2
Denmark*
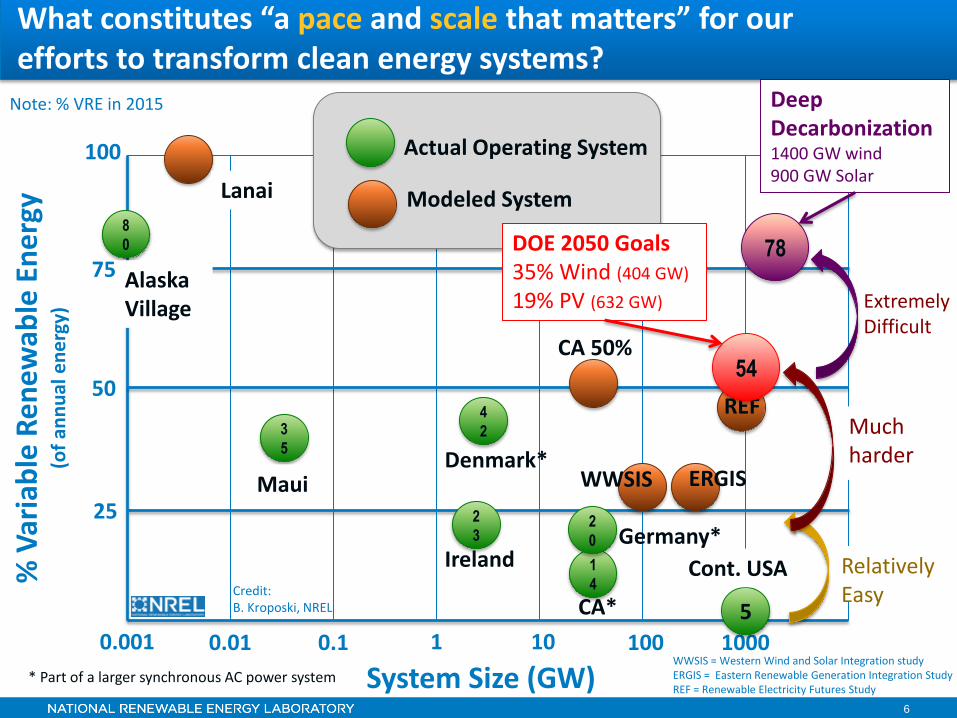
Actual Operating System
3
5
Maui
1
4
CA*
Relatively Easy
Much harder
WWSIS
CA 50%
Lanai Modeled System
ERGIS
REF
54
DOE 2050 Goals 35% Wind (404 GW)
19% PV (632 GW)
Deep Decarbonization 1400 GW wind 900 GW Solar
78
* Part of a larger synchronous AC power system
2
0 Germany*
What constitutes “a pace and scale that matters” for our efforts to transform clean energy systems?
Extremely Difficult
Note: % VRE in 2015
WWSIS = Western Wind and Solar Integration study ERGIS = Eastern Renewable Generation Integration Study REF = Renewable Electricity Futures Study
H2 at Scale CaFCP April 25, 2017 7
• Dwight D. Eisenhower
"If you can't solve a problem, enlarge it"
H2 at Scale CaFCP April 25, 2017 8
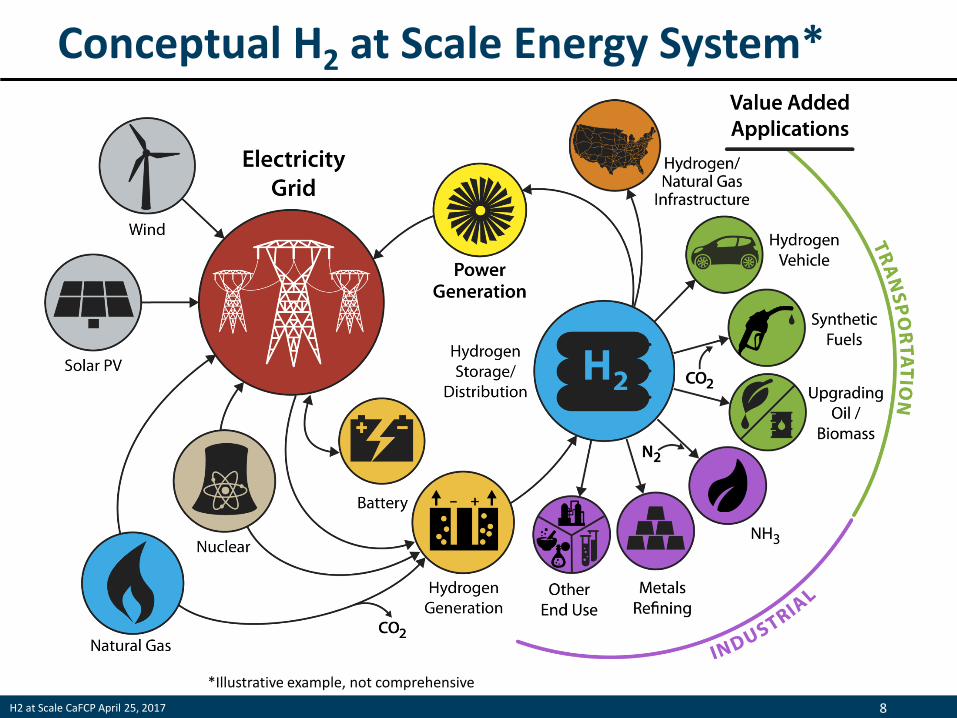
RE Grid plus battery storage Conceptual H2 at Scale Energy System*
*Illustrative example, not comprehensive
H2 at Scale CaFCP April 25, 2017 9
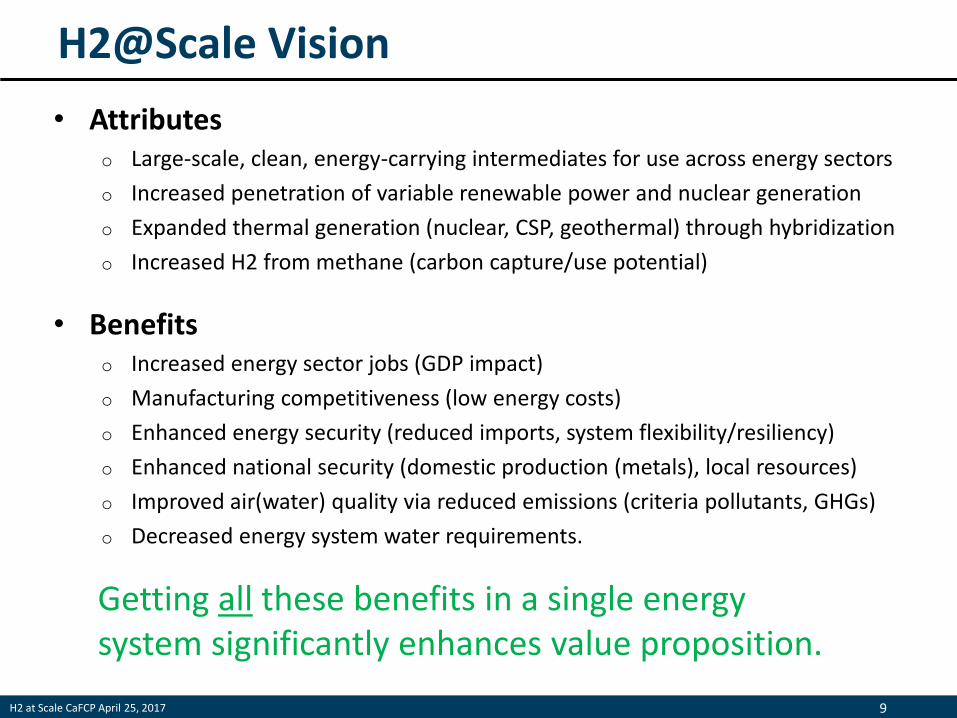
H2@Scale Vision
• Attributes o Large-scale, clean, energy-carrying intermediates for use across energy sectors
o Increased penetration of variable renewable power and nuclear generation
o Expanded thermal generation (nuclear, CSP, geothermal) through hybridization
o Increased H2 from methane (carbon capture/use potential)
• Benefits o Increased energy sector jobs (GDP impact)
o Manufacturing competitiveness (low energy costs)
o Enhanced energy security (reduced imports, system flexibility/resiliency)
o Enhanced national security (domestic production (metals), local resources)
o Improved air(water) quality via reduced emissions (criteria pollutants, GHGs)
o Decreased energy system water requirements.
Getting all these benefits in a single energy system significantly enhances value proposition.
H2 at Scale CaFCP April 25, 2017 10
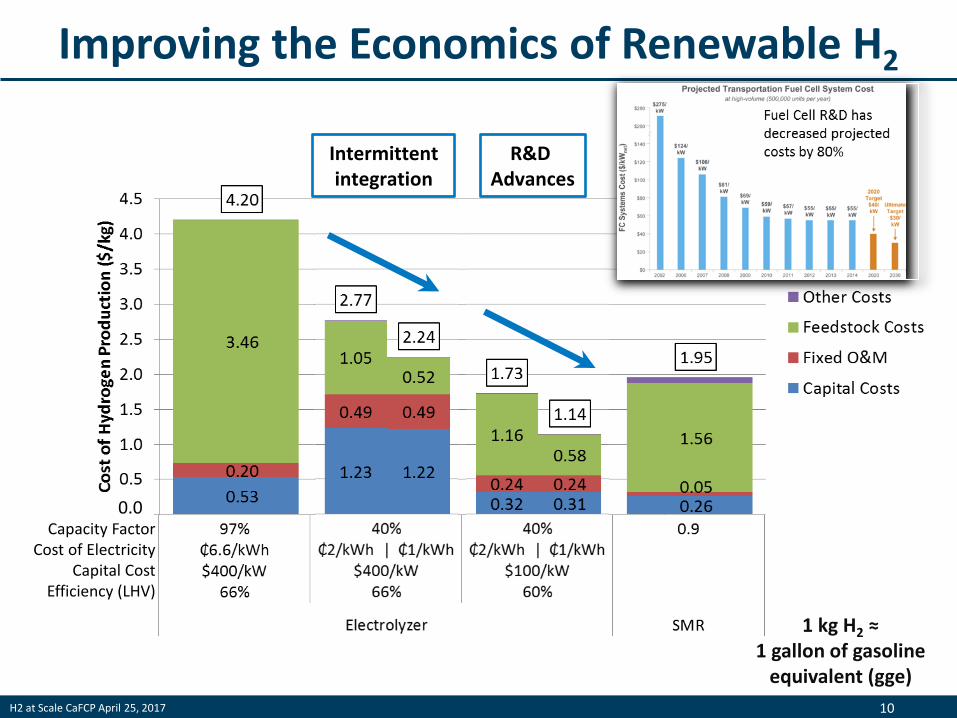
Improving the Economics of Renewable H2
0.0 Capacity Factor
Cost of Electricity Capital Cost
Efficiency (LHV)
Intermittent integration
R&D Advances
1 kg H2 ≈ 1 gallon of gasoline
equivalent (gge)
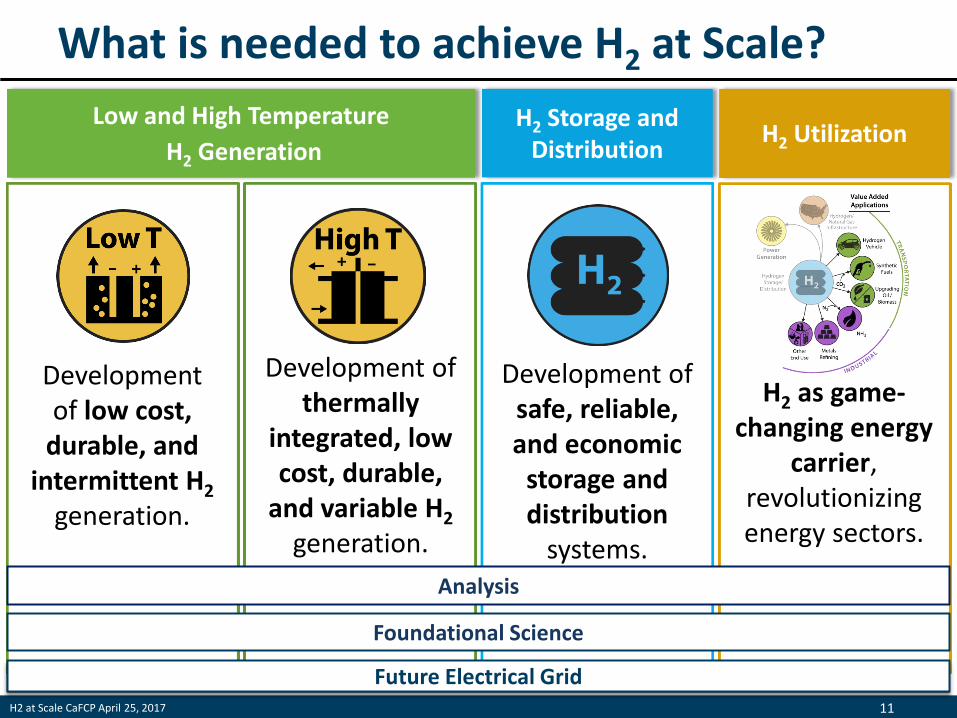
H2 at Scale CaFCP April 25, 2017 11
H2 Storage and Distribution
Development of safe, reliable, and economic
storage and distribution
systems.
Low and High Temperature
H2 Generation H2 Utilization
Development of low cost,
durable, and intermittent H2
generation.
Development of thermally
integrated, low cost, durable,
and variable H2 generation.
H2 as game- changing energy
carrier, revolutionizing energy sectors.
Future Electrical Grid
Analysis
Foundational Science
What is needed to achieve H2 at Scale?
H2 at Scale CaFCP April 25, 2017 12
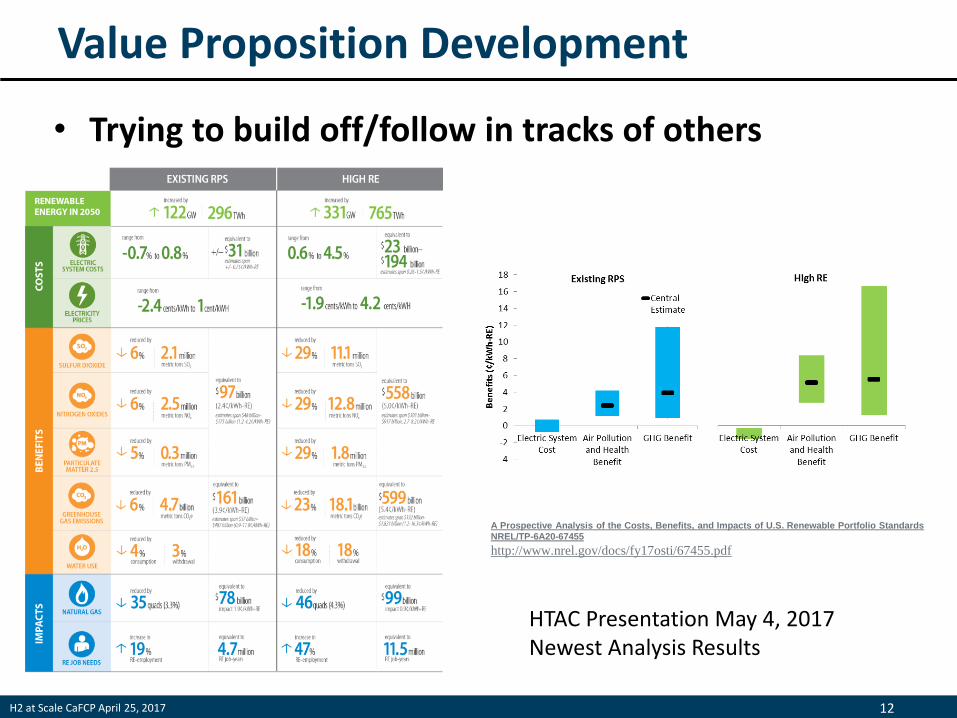
Value Proposition Development
• Trying to build off/follow in tracks of others
A Prospective Analysis of the Costs, Benefits, and Impacts of U.S. Renewable Portfolio Standards
NREL/TP-6A20-67455
http://www.nrel.gov/docs/fy17osti/67455.pdf
HTAC Presentation May 4, 2017 Newest Analysis Results
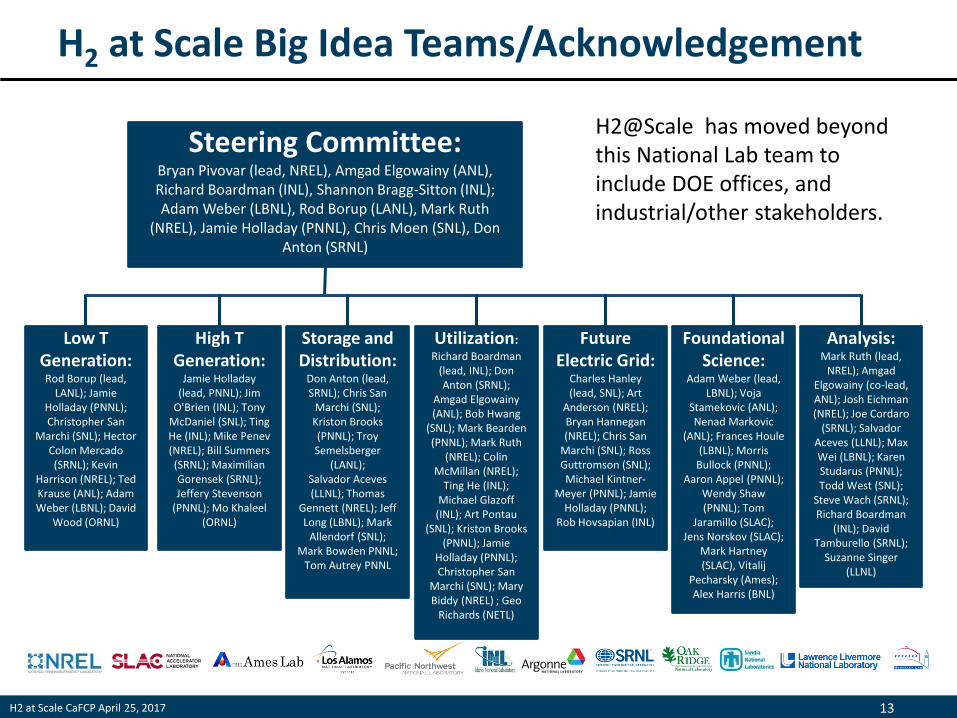
H2 at Scale CaFCP April 25, 2017 13
H2 at Scale Big Idea Teams/Acknowledgement
Steering Committee: Bryan Pivovar (lead, NREL), Amgad Elgowainy (ANL), Richard Boardman (INL), Shannon Bragg-Sitton (INL); Adam Weber (LBNL), Rod Borup (LANL), Mark Ruth
(NREL), Jamie Holladay (PNNL), Chris Moen (SNL), Don Anton (SRNL)
Low T Generation:
Rod Borup (lead, LANL); Jamie
Holladay (PNNL); Christopher San
Marchi (SNL); Hector Colon Mercado (SRNL); Kevin
Harrison (NREL); Ted Krause (ANL); Adam Weber (LBNL); David
Wood (ORNL)
High T Generation:
Jamie Holladay (lead, PNNL); Jim
O'Brien (INL); Tony McDaniel (SNL); Ting He (INL); Mike Penev (NREL); Bill Summers (SRNL); Maximilian Gorensek (SRNL); Jeffery Stevenson
(PNNL); Mo Khaleel (ORNL)
Utilization: Richard Boardman
(lead, INL); Don Anton (SRNL);
Amgad Elgowainy (ANL); Bob Hwang
(SNL); Mark Bearden (PNNL); Mark Ruth
(NREL); Colin McMillan (NREL);
Ting He (INL); Michael Glazoff
(INL); Art Pontau (SNL); Kriston Brooks
(PNNL); Jamie Holladay (PNNL); Christopher San
Marchi (SNL); Mary Biddy (NREL) ; Geo
Richards (NETL)
Storage and Distribution:
Don Anton (lead, SRNL); Chris San
Marchi (SNL); Kriston Brooks (PNNL); Troy Semelsberger
(LANL); Salvador Aceves (LLNL); Thomas
Gennett (NREL); Jeff Long (LBNL); Mark
Allendorf (SNL); Mark Bowden PNNL;
Tom Autrey PNNL
Future Electric Grid:
Charles Hanley (lead, SNL); Art
Anderson (NREL); Bryan Hannegan (NREL); Chris San
Marchi (SNL); Ross Guttromson (SNL); Michael Kintner-
Meyer (PNNL); Jamie Holladay (PNNL);
Rob Hovsapian (INL)
Foundational Science:
Adam Weber (lead, LBNL); Voja
Stamekovic (ANL); Nenad Markovic
(ANL); Frances Houle (LBNL); Morris
Bullock (PNNL); Aaron Appel (PNNL);
Wendy Shaw (PNNL); Tom
Jaramillo (SLAC); Jens Norskov (SLAC);
Mark Hartney (SLAC), Vitalij
Pecharsky (Ames); Alex Harris (BNL)
Analysis: Mark Ruth (lead,
NREL); Amgad Elgowainy (co-lead, ANL); Josh Eichman (NREL); Joe Cordaro
(SRNL); Salvador Aceves (LLNL); Max Wei (LBNL); Karen Studarus (PNNL); Todd West (SNL);
Steve Wach (SRNL); Richard Boardman
(INL); David Tamburello (SRNL);
Suzanne Singer (LLNL)
H2@Scale has moved beyond this National Lab team to include DOE offices, and industrial/other stakeholders.
H2 at Scale CaFCP April 25, 2017 14
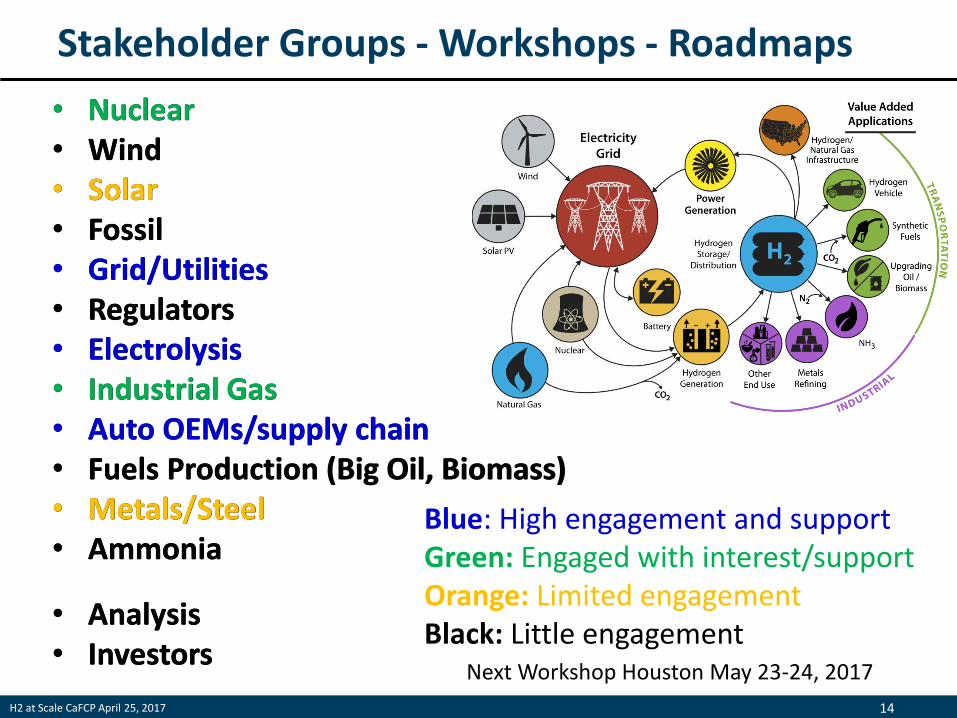
Stakeholder Groups - Workshops - Roadmaps
• Nuclear • Wind • Solar • Fossil • Grid/Utilities • Regulators • Electrolysis • Industrial Gas • Auto OEMs/supply chain • Fuels Production (Big Oil, Biomass) • Metals/Steel • Ammonia
• Analysis • Investors
Blue: High engagement and support Green: Engaged with interest/support Orange: Limited engagement Black: Little engagement
• Nuclear • Wind • Solar • Fossil • Grid/Utilities • Regulators • Electrolysis • Industrial Gas • Auto OEMs/supply chain • Fuels Production (Big Oil, Biomass) • Metals/Steel • Ammonia
• Analysis • Investors
Next Workshop Houston May 23-24, 2017
H2 at Scale CaFCP April 25, 2017 15
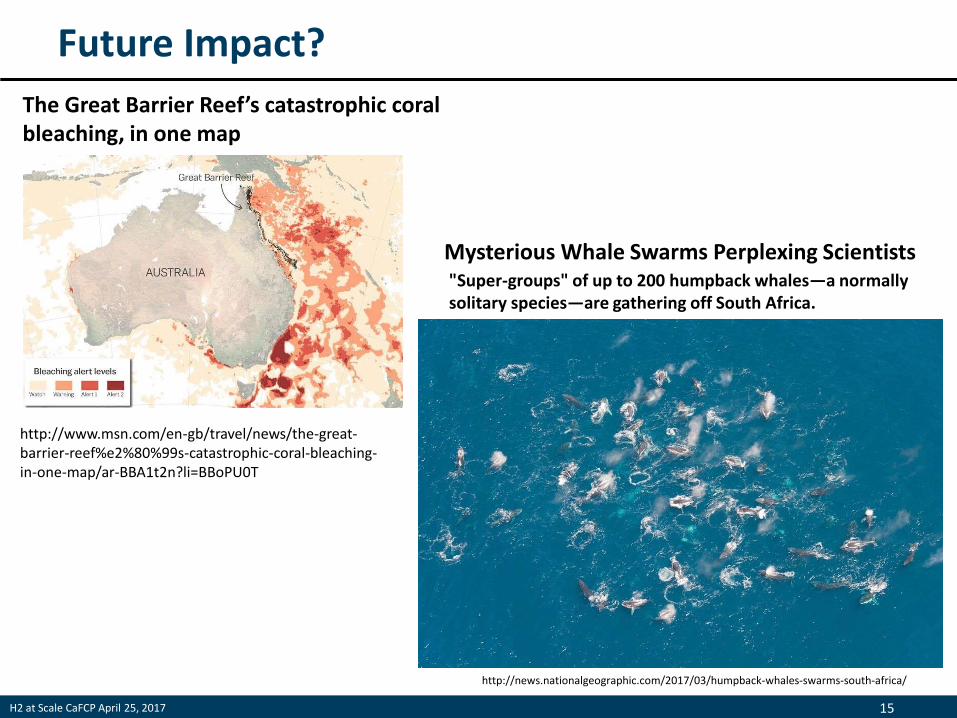
Future Impact?
http://news.nationalgeographic.com/2017/03/humpback-whales-swarms-south-africa/
Mysterious Whale Swarms Perplexing Scientists "Super-groups" of up to 200 humpback whales—a normally solitary species—are gathering off South Africa.
http://www.msn.com/en-gb/travel/news/the-great-barrier-reef%e2%80%99s-catastrophic-coral-bleaching-in-one-map/ar-BBA1t2n?li=BBoPU0T
The Great Barrier Reef’s catastrophic coral bleaching, in one map
H2 at Scale CaFCP April 25, 2017 16
Back up
H2 at Scale CaFCP April 25, 2017 17
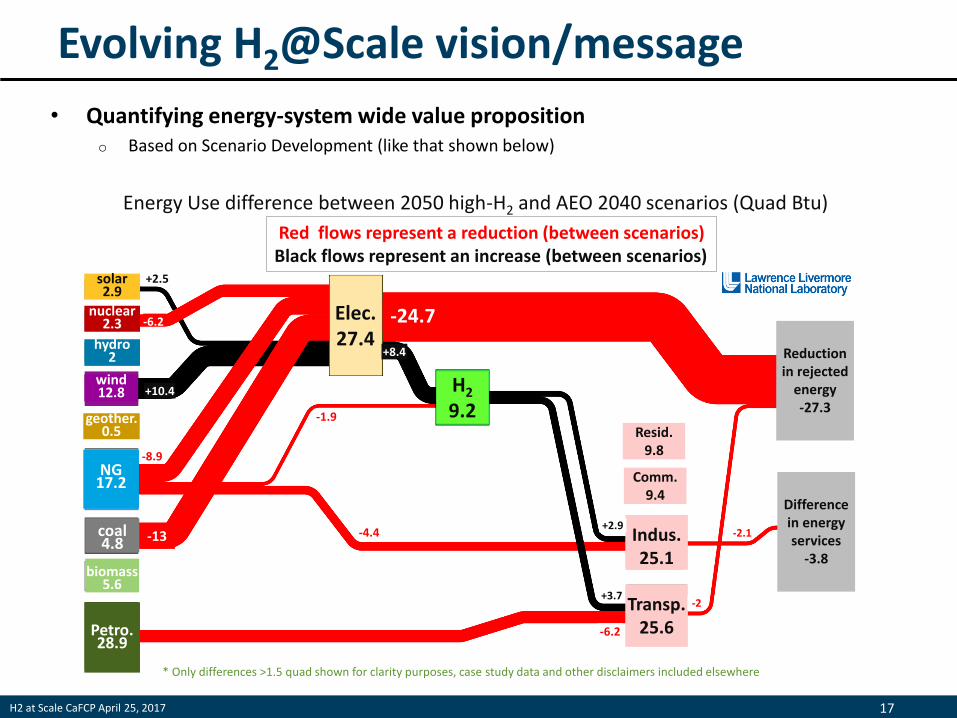
Evolving H2@Scale vision/message
• Quantifying energy-system wide value proposition o Based on Scenario Development (like that shown below)
* Only differences >1.5 quad shown for clarity purposes, case study data and other disclaimers included elsewhere
Energy Use difference between 2050 high-H2 and AEO 2040 scenarios (Quad Btu)
Red flows represent a reduction (between scenarios)Black flows represent an increase (between scenarios)
-24.7
H2
9.2
Comm.9.4
Indus.25.1
Transp.25.6
Elec.27.4
+8.4
+10.4
+2.5
+3.7
+2.9
-6.2
-2
-2.1-4.4
-1.9
-8.9
-13
-6.2
Reduction in rejected
energy-27.3
Difference in energy services
-3.8
solar2.9
nuclear2.3
hydro2
wind12.8
geother.0.5
NG17.2
coal4.8
biomass5.6
Petro.28.9
Resid.9.8
H2 at Scale CaFCP April 25, 2017 18
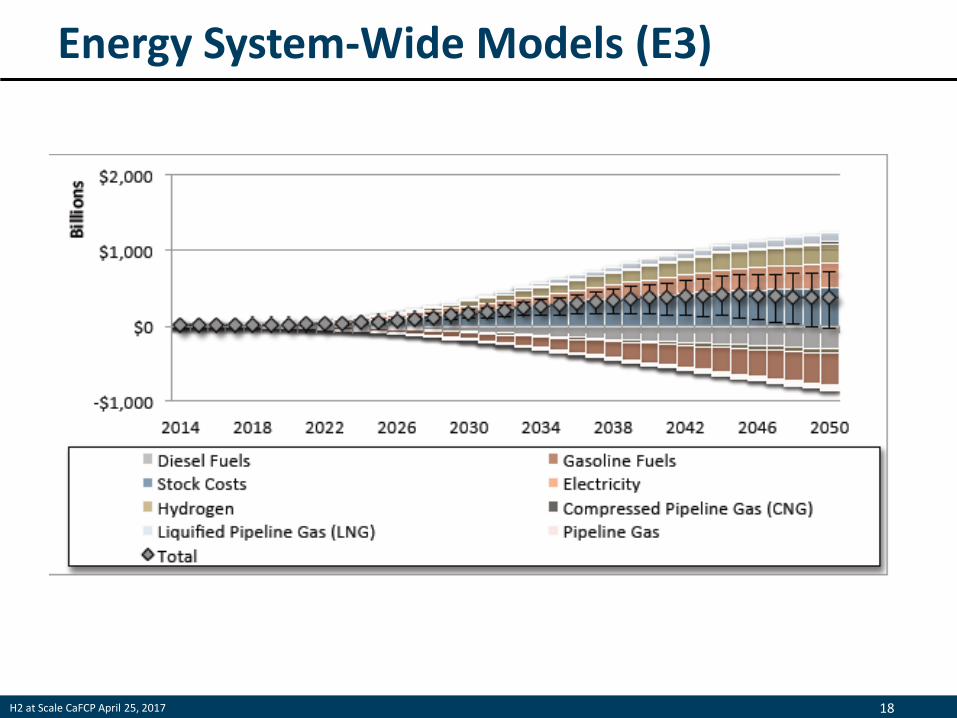
Energy System-Wide Models (E3)
H2 at Scale CaFCP April 25, 2017 19
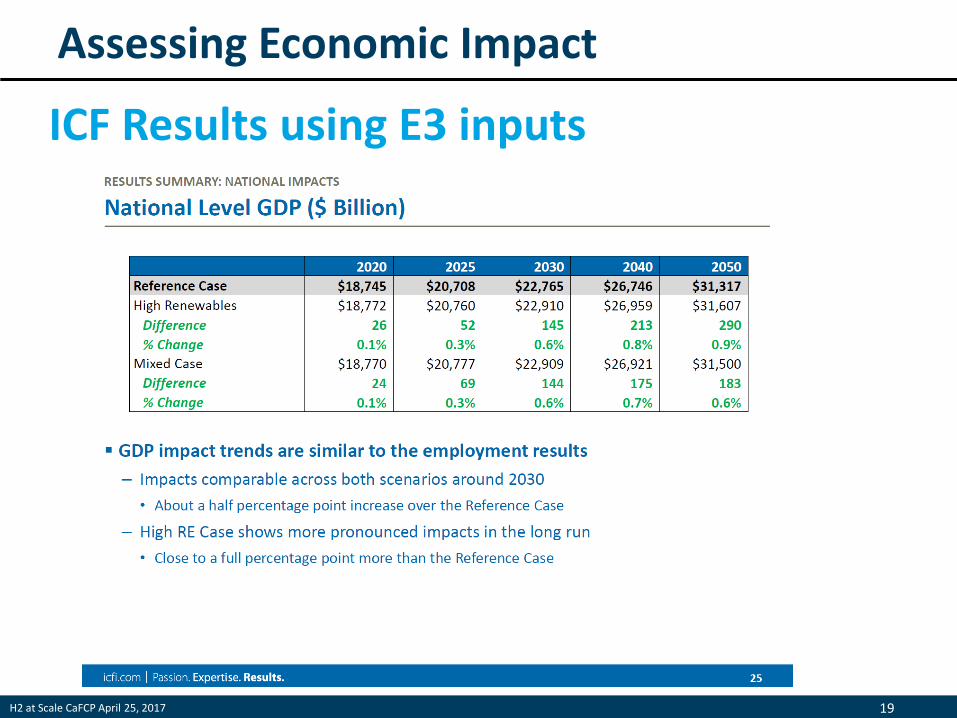
Assessing Economic Impact
ICF Results using E3 inputs
Related Documents