actions Actor's and observer's primary motor cortices stabilize similarly after seen or heard motor Gina Caetano, Veikko Jousmäki, and Riitta Hari doi:10.1073/pnas.0702453104 published online Apr 30, 2007; PNAS This information is current as of May 2007. Supplementary Material www.pnas.org/cgi/content/full/0702453104/DC1 Supplementary material can be found at: www.pnas.org#otherarticles This article has been cited by other articles: E-mail Alerts . click here at the top right corner of the article or Receive free email alerts when new articles cite this article - sign up in the box Rights & Permissions www.pnas.org/misc/rightperm.shtml To reproduce this article in part (figures, tables) or in entirety, see: Reprints www.pnas.org/misc/reprints.shtml To order reprints, see: Notes:

Welcome message from author
This document is posted to help you gain knowledge. Please leave a comment to let me know what you think about it! Share it to your friends and learn new things together.
Transcript

actionsActor's and observer's primary motor cortices stabilize similarly after seen or heard motor
Gina Caetano, Veikko Jousmäki, and Riitta Hari
doi:10.1073/pnas.0702453104 published online Apr 30, 2007; PNAS
This information is current as of May 2007.
Supplementary Material www.pnas.org/cgi/content/full/0702453104/DC1
Supplementary material can be found at:
www.pnas.org#otherarticlesThis article has been cited by other articles:
E-mail Alerts. click hereat the top right corner of the article or
Receive free email alerts when new articles cite this article - sign up in the box
Rights & Permissions www.pnas.org/misc/rightperm.shtml
To reproduce this article in part (figures, tables) or in entirety, see:
Reprints www.pnas.org/misc/reprints.shtml
To order reprints, see:
Notes:

Actor’s and observer’s primary motor corticesstabilize similarly after seen or heard motor actionsGina Caetano*, Veikko Jousmaki*, and Riitta Hari*†‡
*Brain Research Unit, Low Temperature Laboratory, Helsinki University of Technology, P.O. Box 2200, FIN-02015 HUT, Espoo, Finland;and †Department of Clinical Neurophysiology, Helsinki University Central Hospital, FIN-00290, Helsinki, Finland
Contributed by Riitta Hari, March 15, 2007 (sent for review July 3, 2006)
We quantified rhythmic brain activity, recorded with whole-scalpmagnetoencephalography (MEG), of 13 healthy subjects who wereperforming, seeing, or hearing the tapping of a drum membranewith the right index finger. In the actor’s primary motor (M1)cortex, the level of the �20-Hz brain rhythms started to decrease,as a sign of M1 activation, �2 s before the action and thenincreased, with a clear rebound �0.6 s after the tapping, as a signof M1 stabilization. A very similar time course occurred in the M1cortex of the observer: the activation, although less vigorous thanin the actor, started �0.8 s before the action and was followed bya rebound. When the subject just heard the tapping sound, nopreaction activation was visible, but a rebound followed thesound. The �10-Hz somatosensory rhythm, which also started todecrease before own and viewed actions, returned to the baselinelevel �0.6 s later after own actions than observed actions. Thisdelay likely reflects proprioceptive input to the cortex, availableonly during own actions, and therefore could be related to thebrain signature of the sense of agency. The strikingly similar motorcortex reactivity during the first and third person actions expandsprevious data on brain mechanisms of intersubjective understand-ing. Besides motor cortex activation before own and observed(predicted) actions, the M1 cortex of both the viewer and thelistener stabilized in a very similar manner after brisk motoractions.
brain rhythms � intersubjectivity � magnetoencephalography �mirror neurons � motor cortex
A large part of our social interaction is based on nonverbalcommunication that relies on facial expressions, gaze, pos-
tures, and gestures, all used to interpret other people’s inten-tions, motivations, and feelings.
A very important contribution to the understanding of theneural basis of human nonverbal communication came from theidentification and characterization of an action observation/execution matching system in monkey frontal-lobe area F5 (1, 2).A similar action/observation matching network, the mirror-neuron system (MNS), has been identified in the human brain byneuroimaging studies (for a review, see ref. 3). Experimentscarried out while the subjects observed actions performed byothers indicate that the human MNS includes at least the inferiorfrontal gyrus (Broca’s region and its right hemisphere homo-logue, the human counterparts of the monkey F5 area) and theprimary motor (M1) cortex in the precentral cortex. Moreover,the motor mirror neurons receive contribution from the superiortemporal sulcus via the inferior parietal lobule (4–9). In themonkey brain, the inferior parietal lobule also contains mirrorneurons, which are supposed to contribute to the understandingof the actor’s intentions (10).
Anatomically, the M1 cortex is downstream from the inferiorfrontal gyrus (IFG), the core area of the MNS, and therefore thereactivity of the IFG can be reflected in the functional state ofthe M1 cortex. The human M1 cortex is activated both duringobservation and execution of motor tasks, as has been demon-strated by monitoring the �20-Hz oscillatory activity of the M1cortex with magnetoencephalography (MEG) (6).
The motor cortex �20-Hz activity is a part of the Rolandic �rhythm; the other, �10-Hz component receives a strong contri-bution from the primary somatosensory (S1) cortex (11, 12).Both components are suppressed during brisk movements,whereas their level increases after the movement, a phenomenonknown as a ‘‘rebound.’’
Several findings relate the �20-Hz postmovement rebound tostabilization of the motor cortex after any perturbation: first, therebound occurs after both voluntary finger movements and afterpassive movements elicited by electric median nerve stimuli (11).Second, the motor cortex excitability, probed with transcranialmagnetic stimulation, is reduced during the 20-Hz rebounds(13). Third, the �20-Hz level increases during immobility (14)and after administration of GABAergic benzodiazepine (15).Fourth, during isometric contraction, the �20-Hz oscillationsare coherent with surface electromyogram (EMG). This cortex–muscle coherence is typically reduced or abolished in the be-ginning of a movement, whereas it is prominent during staticphases of motor tasks, increasing immediately after the end of aphasic movement, provided that the steady contraction is stillmaintained (16). Intraoperative cortical stimulation in patientsin whom the cortical site of the cortex–muscle coherence waspreoperatively determined (17), as well as combined transcranialmagnetic stimulation and cortex–muscle coherence studies, inpatients with congenital hemiparesis (18), further indicate thatthe Rolandic �20-Hz oscillations mainly originate from the M1cortex. Thus, the �20-Hz rebound likely arises from the motorcortex, being related to increased cortical inhibition and therebyto stabilization of the M1 cortex.
In the present study, we probed the functional state of thesensorimotor cortex by monitoring oscillatory MEG activity.The aim was to find possible similarities between own motoraction vs. visual and auditory observation of other person’ssimilar actions. Action-related sounds were included because themonkey mirror neurons also react to sounds of hand actions (19)and because many human actions are easily recognized from theassociated sounds, even when the actor is invisible. In humans,action-related sounds have been shown to change the cortico-spinal excitability (20).
Previous studies have demonstrated important similaritiesbetween the first and third person before and during motoractions, both in behavior and in motor cortex reactivity. First,during attentive observation of well-predictable hand move-
Author contributions: G.C., V.J., and R.H. designed research; G.C. performed research; V.J.contributed new nonmagnetic drum tools; G.C. and R.H. analyzed data; and G.C., V.J., andR.H. wrote the paper.
The authors declare no conflict of interest.
Freely available online through the PNAS open access option.
Abbreviations: MNS, mirror-neuron system; MEG, magnetoencephalography; EMG, elec-tromyogram; TFR, time-frequency representation; S1, primary somatosensory; M1, primarymotor.
‡To whom correspondence should be addressed. E-mail: [email protected].
This article contains supporting information online at www.pnas.org/cgi/content/full/0702453104/DC1.
© 2007 by The National Academy of Sciences of the USA
www.pnas.org�cgi�doi�10.1073�pnas.0702453104 PNAS Early Edition � 1 of 5
NEU
ROSC
IEN
CE
ments, the eye fixations of the viewer precede locations of theactor’s hand, slightly later but otherwise similarly as the fixationsof the actor (21). Second, premovement electroencephalo-graphic activation in the viewer’s brain (although weaker) issimilar to that in the actor’s brain (22). Third, the motor cortexis activated during manipulative finger movements similarly(although less intensively) in the actor and in the viewer (6).
Here we expand the similarities of brain mechanisms betweenthe viewer and actor to the whole action sequence by showingthat the M1 cortex, besides activating before own and observedactions, stabilizes after the movements in a highly similar mannerboth in the actor’s and observer’s brain.
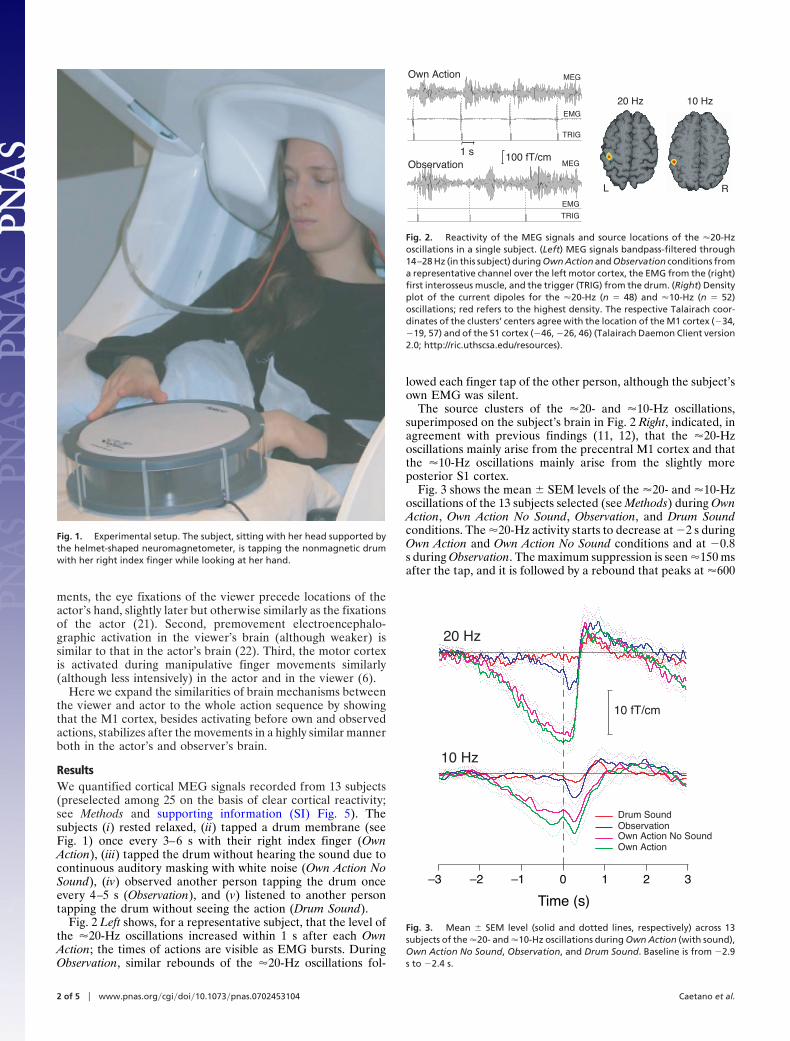
ResultsWe quantified cortical MEG signals recorded from 13 subjects(preselected among 25 on the basis of clear cortical reactivity;see Methods and supporting information (SI) Fig. 5). Thesubjects (i) rested relaxed, (ii) tapped a drum membrane (seeFig. 1) once every 3–6 s with their right index finger (OwnAction), (iii) tapped the drum without hearing the sound due tocontinuous auditory masking with white noise (Own Action NoSound), (iv) observed another person tapping the drum onceevery 4–5 s (Observation), and (v) listened to another persontapping the drum without seeing the action (Drum Sound).
Fig. 2 Left shows, for a representative subject, that the level ofthe �20-Hz oscillations increased within 1 s after each OwnAction; the times of actions are visible as EMG bursts. DuringObservation, similar rebounds of the �20-Hz oscillations fol-
lowed each finger tap of the other person, although the subject’sown EMG was silent.
The source clusters of the �20- and �10-Hz oscillations,superimposed on the subject’s brain in Fig. 2 Right, indicated, inagreement with previous findings (11, 12), that the �20-Hzoscillations mainly arise from the precentral M1 cortex and thatthe �10-Hz oscillations mainly arise from the slightly moreposterior S1 cortex.
Fig. 3 shows the mean � SEM levels of the �20- and �10-Hzoscillations of the 13 subjects selected (see Methods) during OwnAction, Own Action No Sound, Observation, and Drum Soundconditions. The �20-Hz activity starts to decrease at �2 s duringOwn Action and Own Action No Sound conditions and at �0.8s during Observation. The maximum suppression is seen �150 msafter the tap, and it is followed by a rebound that peaks at �600
Fig. 1. Experimental setup. The subject, sitting with her head supported bythe helmet-shaped neuromagnetometer, is tapping the nonmagnetic drumwith her right index finger while looking at her hand.
Own Action MEG
EMG
TRIG
Observation1 s 100 fT/cm
MEG
EMG
TRIG
L R
20 Hz 10 Hz
Fig. 2. Reactivity of the MEG signals and source locations of the �20-Hzoscillations in a single subject. (Left) MEG signals bandpass-filtered through14–28 Hz (in this subject) during Own Action and Observation conditions froma representative channel over the left motor cortex, the EMG from the (right)first interosseus muscle, and the trigger (TRIG) from the drum. (Right) Densityplot of the current dipoles for the �20-Hz (n � 48) and �10-Hz (n � 52)oscillations; red refers to the highest density. The respective Talairach coor-dinates of the clusters’ centers agree with the location of the M1 cortex (�34,�19, 57) and of the S1 cortex (�46, �26, 46) (Talairach Daemon Client version2.0; http://ric.uthscsa.edu/resources).
10 fT/cm
20 Hz
Time (s)
–3 –2 –1 0 1 2 3
10 Hz
Drum SoundObservation Own Action No SoundOwn Action
Fig. 3. Mean � SEM level (solid and dotted lines, respectively) across 13subjects of the �20- and �10-Hz oscillations during Own Action (with sound),Own Action No Sound, Observation, and Drum Sound. Baseline is from �2.9s to �2.4 s.
2 of 5 � www.pnas.org�cgi�doi�10.1073�pnas.0702453104 Caetano et al.
ms. A similar pattern is observed for �10-Hz activity, with themaximum suppression at �270 ms after the tap, in all fourconditions, followed by a tiny rebound that peaks �600 ms laterfor own actions than observed actions.
During the Observation condition, the maximum suppressionof the 20-Hz activity was only 42 � 9% of that during Own Action(P � 0.005, two-tailed paired t test, n � 13). The �20-Hzrebounds, measured as the mean values from 500 to 900 ms,were, in all four conditions, statistically significantly (P � 0.05)above the baseline (defined as the mean level from �2.9 to �2.4s), without any systematic differences in the peak amplitudes.Nor did the latencies of the maximum suppression, of therebound onset, or of the rebound peak differ between theconditions.
When the rebounds were computed with respect to a baselinefrom �600 to 0 ms (during the suppression period before thetap), the �20-Hz level crossed the baseline 178 � 5 ms later (P �0.0005, n � 13) during the Observation than during the OwnAction condition. Thus, the selection of a baseline too close tothe action would result in a rather different picture of the relativetimings of the rebounds in different conditions.
For the �10-Hz oscillations, only tiny rebounds were visible,but they were not statistically significant with respect to thebaseline from �2.9 to �2.4 s. The maximum suppression oc-curred at about the same time for all conditions, but duringObservation, the suppression was only 46 � 16% (P � 0.05) ofthat observed during Own Action. Strikingly, the �10-Hz levelreturned to the baseline 580 � 195 ms (P � 0.05, n � 10) laterduring Own Action than during Observation.
Further examination of the Own Action traces in Fig. 3 showsapproximately similar onset times and durations for the �20-Hzand �10-Hz suppressions but a statistically significantly slowerrecovery for the �10-Hz than for the �20-Hz activity (slopesfrom the maximum suppression to the peak rebound were 24 �5 fT�cm�1�s�1 and 69 � 12 fT�cm�1�s�1, respectively; P � 0.005).
In the original group of all 25 subjects, the averaged signalswere similar, with statistically significant �20-Hz rebounds in allconditions, but the mean rebound amplitudes were weaker (by40–50% during own and observed actions, measured frommaximum suppression to maximum rebound), and the intersub-ject variability was larger than in the study group of 13 persons.
Additional control recordings in three subjects showed no�20-Hz rebounds to 1-kHz tone pips presented once every 4 s.
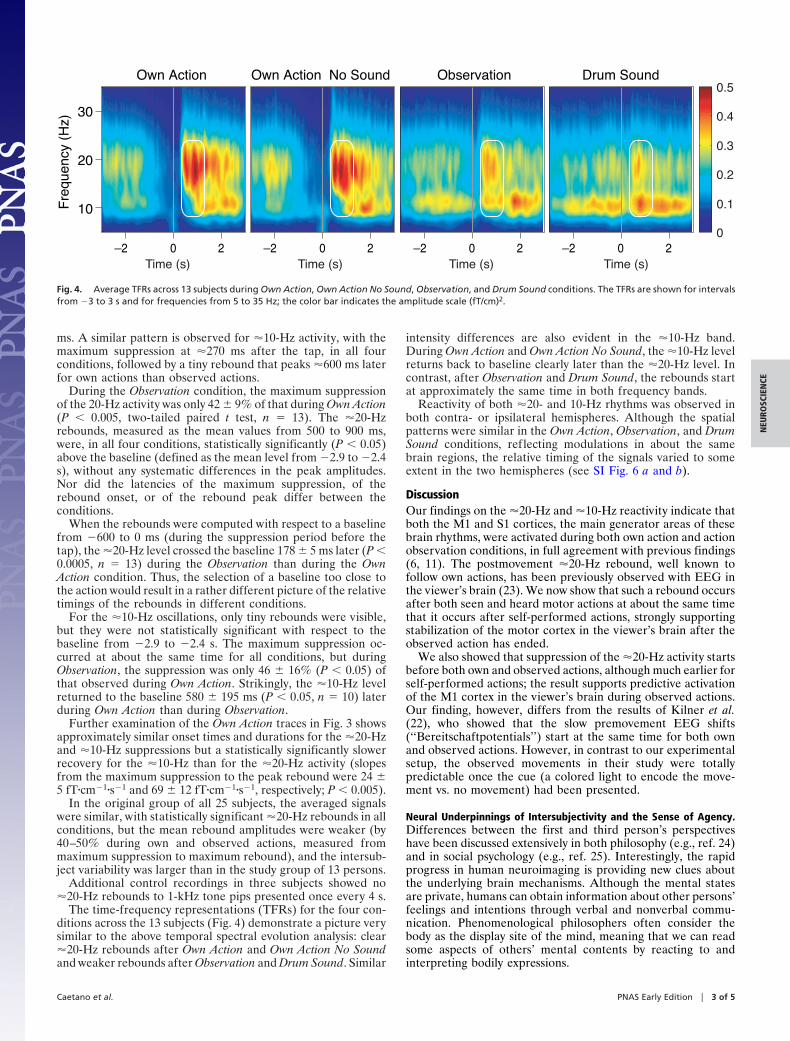
The time-frequency representations (TFRs) for the four con-ditions across the 13 subjects (Fig. 4) demonstrate a picture verysimilar to the above temporal spectral evolution analysis: clear�20-Hz rebounds after Own Action and Own Action No Soundand weaker rebounds after Observation and Drum Sound. Similar
intensity differences are also evident in the �10-Hz band.During Own Action and Own Action No Sound, the �10-Hz levelreturns back to baseline clearly later than the �20-Hz level. Incontrast, after Observation and Drum Sound, the rebounds startat approximately the same time in both frequency bands.
Reactivity of both �20- and 10-Hz rhythms was observed inboth contra- or ipsilateral hemispheres. Although the spatialpatterns were similar in the Own Action, Observation, and DrumSound conditions, reflecting modulations in about the samebrain regions, the relative timing of the signals varied to someextent in the two hemispheres (see SI Fig. 6 a and b).
DiscussionOur findings on the �20-Hz and �10-Hz reactivity indicate thatboth the M1 and S1 cortices, the main generator areas of thesebrain rhythms, were activated during both own action and actionobservation conditions, in full agreement with previous findings(6, 11). The postmovement �20-Hz rebound, well known tofollow own actions, has been previously observed with EEG inthe viewer’s brain (23). We now show that such a rebound occursafter both seen and heard motor actions at about the same timethat it occurs after self-performed actions, strongly supportingstabilization of the motor cortex in the viewer’s brain after theobserved action has ended.
We also showed that suppression of the �20-Hz activity startsbefore both own and observed actions, although much earlier forself-performed actions; the result supports predictive activationof the M1 cortex in the viewer’s brain during observed actions.Our finding, however, differs from the results of Kilner et al.(22), who showed that the slow premovement EEG shifts(‘‘Bereitschaftpotentials’’) start at the same time for both ownand observed actions. However, in contrast to our experimentalsetup, the observed movements in their study were totallypredictable once the cue (a colored light to encode the move-ment vs. no movement) had been presented.
Neural Underpinnings of Intersubjectivity and the Sense of Agency.Differences between the first and third person’s perspectiveshave been discussed extensively in both philosophy (e.g., ref. 24)and in social psychology (e.g., ref. 25). Interestingly, the rapidprogress in human neuroimaging is providing new clues aboutthe underlying brain mechanisms. Although the mental statesare private, humans can obtain information about other persons’feelings and intentions through verbal and nonverbal commu-nication. Phenomenological philosophers often consider thebody as the display site of the mind, meaning that we can readsome aspects of others’ mental contents by reacting to andinterpreting bodily expressions.
Drum Sound ObservationOwn Action No SoundOwn Action F
requ
ency
(H
z)
Time (s) Time (s) Time (s) Time (s)–2 0 2
0.5
0.4
0.3
0.2
0.1
0–2 0 2–2 0 220–2
10
20
30
Fig. 4. Average TFRs across 13 subjects during Own Action, Own Action No Sound, Observation, and Drum Sound conditions. The TFRs are shown for intervalsfrom �3 to 3 s and for frequencies from 5 to 35 Hz; the color bar indicates the amplitude scale (fT/cm)2.
Caetano et al. PNAS Early Edition � 3 of 5
NEU
ROSC
IEN
CE

The MNS has been suggested to form the basis of understandingother people’s motor actions (3). Within this framework, otherpeople’s actions are considered to trigger in the observer internalsimulation of similar actions and thereby even prediction of otherpeople’s goal-directed movements. A central role in this process istaken by the core part of the human MNS, the inferior frontal gyrusand its reciprocal connections with the parietal lobe; these connec-tions seem dysfunctional in high-functioning autistic subjects suf-fering from Asperger’s syndrome (26).
The activation of the observer’s own motor system leads to aproblem of distinguishing between self and others at the neu-ronal level. Proposed solutions include at least efference copiesfrom the movement preparation areas and proprioceptive inputduring own movements, as well as weaker activation of the motorsystem during observed than during performed action (forreviews, see refs. 27 and 28).
Several brain areas contribute to the sense of agency: the inferiorparietal lobe, the precuneus, and the somatosensory cortex (29), aswell as the superior parietal lobule, an integration area of visual andsomatosensory inputs to motor outputs (30). Moreover, importantareas, in terms of self-reference, exist in the mesial cortical areas(31) and in the somatosensory cortex (32).
Our data give additional support for the role of somatosensoryafference in distinguishing self and others at the neuronal level.The �10-Hz activity recovered to the baseline level �580 mslater during Own Action than during Observation. This delaycould reflect the more intensive and longer effect on the S1cortex by the afferent somatosensory input during Own Actionthan by the neuronal activity related to the simulated motoractions seen in others during Observation.
Previous studies have indicated that the S1 activity can bemodulated by imagined and observed movements (33–35). Onepossible route for the S1 activation and the related �10-Hzsuppression, besides direct somatosensory input, is via reciprocalcortical connections between the pre- and postcentral corticesduring both motor action and motor imagery.
The observed delay of the �10-Hz recovery during OwnAction could thus be a cortical-level correlate for the sense ofagency, indicating that the somatosensory cortical network hasa plausible role in the internal simulation of the sensory conse-quences of other person’s movements, either seen or heard. Thepresence vs. absence of proprioceptive feedback helps to main-tain a sound sense of agency.
ConclusionOur results demonstrate that the similarities in neural mecha-nisms between the actor’s and the viewer’s brains extend beyondthe motor cortex activation before and during the movement tothe postmovement stabilization of the motor cortex after theseen or heard action. Furthermore, the somatosensory cortexplausibly plays an important role in the internal simulation of theobserved action by contributing to the distinction between ownand other’s actions on the basis of sensory and proprioceptivefeedback. The unraveled motor and sensory mechanisms furtheremphasize and extend the qualitative similarities between thefirst and third person’s brain mechanisms and likely supportintersubjective understanding between interacting persons.
Materials and MethodsSubjects. We screened 25 healthy adults with no history ofneurological nor hearing disorders but selected for furtheranalysis only those 13 subjects (29.5 � 4.5 yrs; six females andseven males; all right-handed) who showed a clear reactivity intheir brain rhythms, i.e., at least a 10 fT/cm increase in the motorcortex �20-Hz level after Own Action (‘‘rebound,’’ mean valuesfrom 500 to 900 ms with respect to the time of drum tapping, witha baseline from �600 to 0 ms; see SI Fig. 5). An informedconsent was obtained from all subjects after explanation of the
experiment. The MEG recordings had a prior approval by thelocal ethics committee.
Experimental Setup and Stimuli. A silent electronic Roland V-drum (Roland, Hamamatsu, Shizuoka, Japan) was adapted to betotally nonmagnetic. The signal from the drum’s piezoelectrictransducer was used both to produce a trigger for MEG signalaveraging and to obtain the action-sound from tapping the drummembrane. The sounds were presented through plastic tubes toear pieces (Etymotic Research Inc., Elk Grove Village, IL)tightly fitted into the ear canals. The loudness of the tappingsound was �66 dB sound pressure level, and the loudness of thewhite noise used for auditory masking was 69 dB, and both werekept constant for all subjects.
Control sounds, 100-ms tone bursts (1 kHz, 80-ms plateau and10-ms rise and fall time; �74 dB) were presented binaurally onceevery 4 s to three of the subjects participating in the main study.
The experimenter sat on a bench on the right side of thesubject at a right angle with respect to the subject’s headingdirection and sitting position. The subject was able to see only theright forearm of the experimenter, who stayed behind a whitescreen of paper. During both Observation and Drum Soundconditions, the experimenter tapped the drum briskly with hisright index finger.
The subjects trained the brisk tapping movement with timeintervals of �4 s (without counting) before entering the mea-surement room and when in position to be measured. However,during the experiment, the individual tapping intervals variedfrom 3 to 6 s. For the experimenter, who was allowed to countsilently the intervals, the intervals varied from 4 to 5 s.
MEG Recordings. Cortical MEG signals were recorded with a306-channel neuromagnetometer (Vectorview; Neuromag Ltd.,Helsinki, Finland) that houses 102 identical triple-sensor elementsin a helmet-shaped array. Each sensor element consists of twoorthogonal planar gradiometers and one magnetometer, providingthree independent measurements of the magnetic field. The planargradiometers measure the two orthogonal tangential derivatives ofthe magnetic field component that is normal to the helmet surfaceat the sensor location, and they detect the largest signal just abovea local dipolar current source (36).
During the MEG recording, the subjects were sitting com-fortably in a magnetically shielded room, with their head tightlypressed against the helmet-shaped neuromagnetometer. Theywere asked to keep their head immobile and their eyes open andto avoid eye blinking during the stimulation.
MEG signals were recorded with a 0.03–172 Hz passband andwere digitized at 600 Hz. Surface EMG was recorded from theextensor indicis proprius muscle in the right forearm in allsubjects, and also from the right first interosseous muscle inthree subjects. Two sets of 35 single trials were averaged onlineto check replicability during the Own Action, Own Action NoSound, Observation, and Drum Sound conditions; 100 single trialswere averaged in the Control condition. The analysis epochslasted for 3,500 ms, including a prestimulus baseline of 1,000 ms.Vertical and horizontal electrooculograms (EOGs) were mea-sured simultaneously, and epochs coinciding with EOG signalsexceeding 300 �V were rejected from the MEG analysis. Spon-taneous activity was recorded continuously so that 70–150(mean across subjects � 91) single trials, each containing oneaction, were collected; the data were stored on a magnetoopticaldisk for offline analysis.
Four head position indicator coils were attached to thesubject’s scalp to measure the head position with respect to thesensor array. The locations of these coils were determined withrespect to three anatomical landmarks (left and right preauric-ular points and nasion) by using a 3D digitizer (Isotrak 3S10002;Polhemus Navigation Sciences, Colchester, VT). The magnetic
4 of 5 � www.pnas.org�cgi�doi�10.1073�pnas.0702453104 Caetano et al.

fields generated by currents fed into the head position indicatorcoils were then measured when the subject was in the position forthe experiment, and the locations of the coils were determinedwith respect to the sensor array. The anatomical landmarks andadditional points were used to align MEG and magnetic reso-nance image coordinate systems. The structural magnetic reso-nance images of the subject’s brain were acquired by usinga 1.5-T Siemens Magnetom system (Siemens, Erlangen,Germany).
Data Analysis. Stimulus-related changes in the level of the �10-Hzand �20-Hz sensorimotor oscillations were visualized by calcu-lating temporal spectral evolution and TFRs for epochs starting3 s before and ending 3 s after the trigger pulses that indicatedthe times of the tappings.Temporal spectral evolution. The level of the oscillatory activity wasquantified from traces obtained by first bandpass filtering thesignals through 8–13 Hz for the �10-Hz band and through 14–30Hz, depending on the individual frequency maxima, for the�20-Hz band. The filtered signals were then rectified and finallyaveraged time-locked to the stimuli (11). We included all epochsbecause, for example, eye-blink artifacts are in a differentfrequency range than the frequency bands of interest. Thestrengths of the �10-Hz and �20-Hz rebounds were determined,for each subject, from the MEG channel over the left Rolandiccortex that showed the strongest �20-Hz reactivity during OwnAction. The mean � SEM across subjects was calculated for boththe 13 selected subjects (presented in Fig. 3 and discussed
throughout the article) and for the full set of 25 subjects, withrespect to baseline from �2.9 s to �2.4 s.TFR. The TFRs were calculated from the channel selected for theanalysis of the temporal spectral evolution in each subject.Frequencies of 5–35 Hz, with steps of 0.25 Hz, were analyzed byusing wavelets with a width of seven cycles. A grand-averageTFR was calculated separately, across the 13 selected subjects,for all four experimental conditions.Source modeling. For source identification, the head was modeledas a spherical conductor, with the origin defined from theindividual magnetic resonance images (36). Equivalent currentdipoles (ECDs) were found by least-squares fits of signalsobtained in the Own Action condition, both for �20-Hz oscil-lations and for �10-Hz oscillations occurring 0.5–2.0 s after thetap. The sources were identified on the basis of 18 sensors overthe left Rolandic area, where the signals were the largest. OnlyECDs with goodness of fit (g) exceeding 80% were accepted. Thespatial density was computed for 48 and 52 source locations,respectively, and superimposed on the individual magnetic res-onance images.
We thank Helge Kainulainen for technical help in modifying the drum;Jan Kujala (Helsinki University of Technology) for providing thesoftware for source density plots; and Henri Autti, Jari Kainulainen,Seppo Mattila, and Sini Salonen for assistance in running the experi-ments. This work was supported by the Academy of Finland (NationalCenters of Excellence Program 2006–2011), the Sigrid Juselius Foun-dation in Finland, the Instrumentarium Foundation in Finland, andFundacao para a Ciencia e Tecnologia Programa Praxis XXI BD-6206/2001 in Portugal.
1. Gallese V, Fadiga L, Fogassi L, Rizzolatti G (1996) Brain 119:593–609.2. Rizzolatti G, Fadiga L, Gallese V, Fogassi L (1996) Cogn Brain Res 3:131–141.3. Rizzolatti G, Craighero L (2004) Annu Rev Neurosci 27:169–192.4. Fadiga L, Fogassi L, Pavesi G, Rizzolatti G (1995) Eur J Neurosci 11:3983–3994.5. Rizzolatti G, Fadiga L, Matelli M, Bettinardi V, Paulesu E, Perani D, Fazio F
(1996) Brain Res 111:246–252.6. Hari R, Forss N, Avikainen S, Kirveskari E, Salenius S, Rizzolatti G (1998)
Proc Natl Acad Sci USA 95:15061–15065.7. Iacoboni M, Woods R, Brass M, Bekkering H, Mazziota J, Rizzolatti G (1999)
Science 286:2526–2528.8. Nishitani N, Hari R (2000) Proc Natl Acad Sci USA 97:913–918.9. Nishitani N, Hari R (2002) Neuron 36:1211–1220.
10. Fogassi L, Ferrari P, Gesierich B, Rozzi S, Chersi F, Rizzolatti G (2005) Science308:662–667.
11. Salmelin R, Hari R (1994) Neuroscience 60:537–550.12. Hari R, Salmelin R (1997) Trends Neurosci 20:44–49.13. Chen R, Corwell B, Hallett M (1999) Exp Brain Res 129:77–86.14. Niedermeyer E (2005) in Electroencephalography: Basic Principles, Clinical
Applications and Related Fields, eds Niedermeyer E, Lopes da Silva F (Lip-pincott Williams & Wilkins, Philadelphia), pp 167–192.
15. Jensen O, Goel P, Kopell N, Pohja M, Hari R (2005) NeuroImage 26:347–355.16. Kilner J, Baker S, Salenius S, Hari R, Lemon R (2000) J Neurosci 20:8839–8845.17. Makela J, Kirveskari E, Seppa M, Hamalainen M, Forss N, Avikainen S,
Salonen O, Salenius S, Kovala T, Randell T, Jaaskelainen J, Hari R (2001) HumBrain Mapp 12:180–192.
18. Gerloff C, Braun C, Staudt M, Hegner LY, Dichgans J, Krageloh-Mann I(2006) Hum Brain Mapp 27:789–798.
19. Kohler E, Keysers C, Umilta M, Fogassi L, Gallese V, Rizzolatti G (2002)Science 297:846–848.
20. Aziz-Zadeh L, Iacobini M, Zaidel E, Wilson S, Mazziota J (2004) EurJ Neurosci 19:2609–2612.
21. Flanagan J, Johansson R (2003) Nature 424:769–771.22. Kilner J, Vargas C, Duval S, Blakemore S, Sirigu A (2004) Nat Neurosci
7:1299–1301.23. Babiloni C, Babiloni F, Carducci F, Cincotti F, Cocozza G, Del Percio C,
Moretti DV, Rossini PM (2002) NeuroImage 17:559–572.24. Merleau-Ponty M (1945) Phenomenologie de la Perception (Gallimard, Paris).25. Mead GH (1934) Mind, Self, and Society from the Standpoint of a Social
Behaviorist, ed Morris CW (Univ of Chicago Press, Chicago).26. Nishitani N, Avikainen S, Hari R (2004) Ann Neurol 55:558–562.27. Farrer C, Franck N, Frith CD, Decety J, Georgieff N, d’Amato T, Jeannerod
M (2004) Psychiatry Res 131:31–44.28. Hari R, Nishitani N (2004) in Functional Neuroimaging of Visual Cognition.
Attention and Performance XX, eds Kanwisher N, Duncan J (Oxford Univ Press,Oxford), pp 463–479.
29. Ruby P, Decety J (2001) Nat Neurosci 4:546–550.30. MacDonald PA, Paus T (2003) Cereb Cortex 13:962–967.31. Vogeley K, May M, Ritzl A, Falkai P, Zilles K, Fink GR (2004) J Cognit
Neurosci 16:817–827.32. Jackson P, Meltzoff A, Decety J (2006) NeuroImage 31:429–439.33. Avikainen S, Forss N, Hari R (2002) NeuroImage 15:640–646.34. Hasson U, Nir Y, Levy I, Fuhrmann G, Malach R (2004) Science 303:1634–
1640.35. Mottonen R, Jarvelainen J, Sams M, Hari R (2005) NeuroImage 24:
187–192.36. Hamalainen M, Hari R, Ilmoniemi R, Knuutila J, Lounasmaa OV (1993) Rev
Mod Phys 65:413–497.
Caetano et al. PNAS Early Edition � 5 of 5
NEU
ROSC
IEN
CE
Related Documents