ASSUNTOS EUROPEUS | EUROPEAN AFFAIRS Regional Convergence in Portugal The Role of National (and EU) Policies COLECÇÃO CADERNOS INA

Welcome message from author
This document is posted to help you gain knowledge. Please leave a comment to let me know what you think about it! Share it to your friends and learn new things together.
Transcript
ASSUNTOS EUROPEUS | EUROPEAN AFFAIRS
Regional Convergence in PortugalThe Role of National (and EU) Policies
COLECÇÃO CADERNOS INA
Outros títulos da Colecção Cadernos INA:
1 – Métodos Interactivos para o Planeamento e Desenvolvimento de Sistemas de Informação
2 – Fundamentos da Metodologia de Reunião em Espaço Aberto
3 – Guião para a Auto-Avaliação de Desempenho de Escolas Públicas do 2º e 3º ciclos do ensino básico e/ou ensino secundário com base no Modelo de Excelência (EFQM) da Fundação Europeia para a Gestão da Qualidade – Parte 1
4 – Guião para a Auto-Avaliação de Desempenho de Escolas Públicas do 2º e 3º ciclos do ensino básico e/ou ensino secundário com base no Modelo de Excelência (EFQM) da Fundação Europeia para a Gestão da Qualidade – Parte 2
5 – Construção de um Sistema de Suporte à Decisão com base no Balanço Social da Administração Pública
6 – Serviço Nacional de Saúde e Saúde Ocupacional
7 – Planos Directores Municipais em fase de transição
8 - Avaliar as Escolas para Modernizar os Sistemas de Ensino no Contexto da Reforma Administrativa
9 - European Impact on Multi-Level Governance in Portugal: Pa� erns of Adaptation and Learning (1988-1999)
10 - Cultural Diff erences and Economic Policy Implementation: Lesson from Portugal
11 - Gestão Pública e Cidade Digital no Brasil Sociedade de Informações e Cultura Local
Celeste AmorimAnne� e Bongardt
Marta Ferreira DiasRicardo Silva
andMiguel Lebre de Freitas
and Francisco Torres(Coord.)
Oeiras 2004
Regional Convergence in PortugalThe Role of National (and EU) Policies
Ficha Técnica
Título: Regional Convergence in Portugal The Role of National (and EU) Policies
Autores: Celeste Amorim, Anne� e Bongardt, Marta Ferreira Dias, Ricardo Silva e Miguel Lebre de Freitas e Francisco Torres (coords)
DEGEI, Universidade de AveiroEmails: [email protected]; � [email protected].
Colecção: Cadernos INAISBN: 972-9222-39-8Depósito legal n.º
Editor:INA – Instituto Nacional de Administração Palácio dos Marqueses de Pombal 2784-540 Oeiras Tel.: 21 446 53 39 Fax: 21 446 53 68 URL: www.ina.pt E-mail: [email protected]
Capa: Sara CoelhoGráfi ca: Sersilito - Empresa Gráfi ca, Lda.Tiragem: 1000 exemplares
Nenhuma parte desta obra pode ser reproduzida por qualquer processo electrónico, mecânico ou fotográfi co, incluindo fotocópia, xerocópia ou gravação, sem autorização prévia dos autores.
As opiniões expressas nesta obra são da exclusiva responsabilidade dos seus autores.
Biblioteca Nacional – Catalogação na Publicação
Regional Convergence in PortugalThe Role of National (and UE) Policies
ISBN 972-9222-39-8
CDU 35 (81) 004 (81) 621.39 (81)

To António Silva, father of one the authors, who so unexpectedly le� us this summer...
A António Silva, Pai de um dos autores, que tão inesperadamente nos deixou este verão...

ABSTRACT | RESUMO
Neste estudo aferimos o impacto de um número alargado de políticas nacionais na coesão das 7 regiões NUTS II portuguesas. O estudo centra-se sobretudo na coesão económica regional, embora os efeitos na coesão social também sejam considerados. Procuramos também aferir até que ponto as regiões portuguesas foram capazes de partilhar equitativamente o crescimento económico do País ou até que ponto se verifi caram assimetrias e divergências nos seus padrões de crescimento. Sendo o objectivo deste estudo a análise do impacto das políticas nacionais na coesão regional, não deixamos de contrastar o impacto das políticas comunitárias em duas regiões. Essa análise é especialmente importante para Portugal devido à importância dos programas comunitários e ao facto de os esforços nacionais e da União Europeia estarem fortemente interligados.
Classifi cação do JEL: O18, O22, O23, O38, O52.
Palavras-chave: Coesão regional, União Europeia, Convergência, Políticas, Instituições.
In this study we assess the impact of a wide range of Portuguese domestic policies on cohesion in Portugal’s seven NUTS II regions. We focus mainly on regional economic cohesion, although social cohesion eff ects are also considered. We also look at whether the Portuguese regions have been able to share equally in the country’s overall growth or whether there have been asymmetries and divergences in their growth pa� erns. While the purpose of the study is to analyse the policy impact of national rather than Community policies on cohesion, we examine the impact of Community policies in two regions for reference. This is important for the case of Portugal where structural operations have been substantial and where European Union and national eff orts seem to be highly intertwined.
JEL classifi cation: O18, O22, O23, O38, O52.
Keywords: Regional cohesion, European Union, Convergence, Policies, Institutions.

EXECUTIVE SUMMARY
This study assesses the impact of Portuguese domestic policies on cohesion in its seven NUTS II regions. The discussion, along the lines of a broader study by Begg
et al. (2004), focuses mainly on regional economic cohesion, although social cohesion eff ects are also considered.
While it is well known that Portugal as a whole has been able to converge to the Community average since joining the European Community in 1986, not all Portuguese regions have been able to share equally in that growth and there were asymmetries and divergences in the growth pa� erns.
The purpose of this study is to analyse the impact of national rather than Community policies on cohesion. However, two regional case studies enrich the analysis to the extent that they allow examining and contrasting the impact of Community policies in two out of the seven Portuguese regions (one continental and one ultra-peripheral). This is important for the case of Portugal (especially during the period of analysis, 1990-2001) where European Union and national eff orts seem to be highly intertwined. Portuguese national policies are closely tied to EU funding, and given the lack of a regional policy tradition, most were set up under the EU policies framework.
There is a wide range of national policies with a positive or negative bearing on cohesion, some of which explicitly have a regional dimension while others have only indirect eff ects on regional cohesion. Several policies could have been addressed but were le� out of the discussion, given that the primary goal of this study is not to examine in detail all the initiatives but rather to analyse those national policies that are most relevant at a regional level.
We examine the following policies:
a) Macroeconomic policy, which plays a major role in stabilising demand and the level of unemployment. In general terms macroeconomic developments have had a positive impact on cohesion. The regime shi� (to Economic and Monetary Union, with the Stability and Growth Pact) has doubtlessly created favourable conditions for economic growth in the poorer regions. However, the transition to the new regime (the euro hold-up eff ect, with the consequent fast expansion of domestic credit and domestic demand exacerbated by a pro-cyclical fi scal policy) gave rise to adjustment costs not equally shared by all regions.
b) Public expenditures, whose impact emerges through a variety of channels, also have a territorial dimension even though they are defi ned at the country-level. It is a common concern to EU member states, including Portugal, to ensure that the level of provision does not diff er too much between localities. Unfortunately, given the available data, the relative scale of public expenditure in diff erent regions in Portugal cannot be properly assessed. In broad terms, the principle of covering the entire territory with the provision of public goods has a competitiveness-enhancing eff ect on the less prosperous regions. This also translates into a signifi cant social
SUMÁRIO EXECUTIVO
Este estudo avalia o impacto das políticas nacionais portuguesas na coesão das sete regiões NUTS II. Tal como o trabalho mais geral de Begg et al. (2004), o seu
enfoque é primordialmente na coesão económica embora os aspectos ligados à coesão social também sejam tidos em consideração.
Embora Portugal como um todo tenha convergido com a média comunitária desde a sua adesão à Comunidade Europeia em 1986, nem todas as suas regiões puderam partilhar da mesma maneira desse crescimento, tendo-se verifi cado assimetrias e divergências nos seus padrões de crescimento.
O objectivo deste estudo é analisar o impacto das políticas nacionais na coesão. Contudo, dois exemplos regionais enriquecem a análise na medida em que permitem examinar e contrastar o impacto das políticas comunitárias em duas das sete regiões portuguesas (uma continental e outra ultraperiférica). Esse contraste é importante para Portugal (especialmente durante o período em análise, 1990-2001) na medida em que as contribuições comunitária e nacional estão muito interligadas. As políticas nacionais portuguesas estão fortemente ligadas aos fundos da União Europeia e, dada a falta de tradição de uma política regional portuguesa, elas são na sua maioria delineadas no âmbito dos quadros comunitários de apoio.
Existem várias e diversas políticas nacionais com um impacto potencial (positivo ou negativo) na coesão, algumas das quais têm uma dimensão regional explícita enquanto outras apenas afectam indirectamente a coesão regional. Algumas dessas políticas poderiam ter sido analisadas mas foram deixadas fora deste estudo cujo objectivo principal não é examinar em detalhe as várias iniciativas mas sim analisar as políticas nacionais cujo impacto é potencialmente mais relevante ao nível regional.
Examinamos as seguintes políticas:
a) Política Macroeconómica, cujo papel na estabilização da procura e do nível de desemprego é essencial. Em termos gerais os desenvolvimentos macroeconómicos recentes tiveram um impacto positivo na coesão. A alteração de regime (para a União Económica e Monetária, com o Pacto de Estabilidade e Crescimento) criou sem dúvida condições favoráveis para o crescimento económico das regiões mais pobres. Contudo, a transição para o novo regime (o efeito esticão do euro, com a consequente rápida expansão do crédito interno e a procura interna exacerbada por uma política fi scal pró-cíclica) deram origem a custos de ajustamento partilhados de forma diferente pelas várias regiões.
b) Despesas públicas, cujo impacto se faz sentir através duma variedade de canais, também têm uma dimensão territorial embora sejam defi nidas ao nível do país. É uma preocupação comum a todos os Estados Membros da UE, incluindo Portugal, assegurar que o nível de provisões não difere demasiado entre localidades. Infelizmente, dada a informação disponível, não é possível avaliar a escala relativa
cohesion eff ect, as employment in the public administration tends to be an important source of income in less populated areas. However, those expenditures that were a counterpart of the second Community Support Framework (1994-1999) did not adequately address the need to reduce regional imbalances. Only within the third Community Support Framework (2000-2006) is the ‘regional cohesion problem’ being clearly addressed.
c) Transfers from central government to municipalities and to the autonomous regions. These policies play an important role in economic cohesion to the extent that the level of proximity and discretion with respect to their utilisation infl uences their eff ectiveness. Transfers from the central government, infl uencing the regional distribution of income, also impact on social cohesion and act as a regional demand stabilisation tool. Transfers to autonomous regions (Açores, Madeira) are the translation of a specifi c regional policy towards overseas regions. To the extent that the delegation of decision-making results in more effi cient resource allocation, the economic impact on cohesion is positive. However, the high discretionary capacity of the regional authorities regarding the use of subsidies has translated into important distortions, dampening incentives, reducing effi ciency and creating dependency. That means that larger regional discretion is not necessarily be� er than centralisation.
d) State aids, which have a potential role in social cohesion (preservation of jobs) but that are highly ineffi cient since they distort trade and competition between fi rms, regions and countries and delay structural change (this is especially true for sectoral aid). The evidence is of excessive concentration in the richest regions, thus working against social cohesion, and in the autonomous regions, reinforcing the negative eff ects pointed out in c).
f) Science and technology policy may enhance the ability of fi rms located in less prosperous regions to compete. However, there can be a trade-off between a� empts to reinforce national competitiveness and the desire to spread the benefi ts of high technology across regions. The evidence suggests that science and technology policy in Portugal, not having a regional dimension, does not succeed in counterbalancing the general tendency for concentration of research activities in the main centres.
g) Foreign direct investment policy is an important part of a regional development strategy. It not only has a direct incidence on economic activity, income and jobs but it is also a mechanism for transferring technology, new managerial techniques and know-how. The same policy dilemma of the previous policy applies: large-scale FDI, with most potential positive externalities, tends to be located in the most prosperous regions. Although FDI policies have incorporated a regional dimension, there have been no signifi cant practical results.
We also draw on secondary data as well as on primary qualitative data collected through interviews with policy makers, regional leaders and academics. Open-ended exploratory questions have allowed for the collection of comprehensive data on regional specifi cities. All seven Portuguese regions are characterised in terms of their
» EXECUTIVE SUMMARY
» SUMÁRIO EXECUTIVO
de despesa pública nas diferentes regiões em Portugal. Em termos gerais, o princípio de cobertura de todo o território com a provisão de bens públicos tem um efeito estimulador da concorrência nas regiões menos prósperas. Isso também se traduz num efeito signifi cativo na coesão social, dado que o emprego na administração pública tende a representar uma fonte importante de rendimento em regiões menos povoadas. Contudo, as despesas utilizadas como contrapartida do segundo Quadro Comunitário de Apoio (1944-1999) não internalizaram adequadamente a necessidade de reduzir os desequilíbrios regionais. Apenas no âmbito do terceiro Quadro Comunitário de Apoio (2000-2006) o “problema da coesão regional” é claramente internalizado.
c) Transferências do governo central para os municípios e para as regiões autónomas. Estas políticas desempenham um papel importante na coesão económica na medida em que o nível de proximidade e discricionariedade relativamente à sua utilização infl uencia a sua efectividade. Transferências do governo central, infl uenciando a distribuição regional do rendimento, também têm um impacto sobre a coesão social e actuam como um instrumento de estabilização da procura regional. As transferências para as regiões autónomas (Açores, Madeira) traduzem uma política regional específi ca para as regiões não continentais. Na medida em que a delegação das decisões resulta numa afectação mais efi ciente de recursos, o impacto económico na coesão é positivo. Contudo, a elevada capacidade discricionária das autoridades regionais no que respeita à utilização de subsídios tem-se traduzido em distorções signifi cativas, reduzindo a efi ciência e criando dependência. Isso signifi ca que uma maior discricionariedade regional não é necessariamente superior à centralização.
d) Ajudas de Estado, which have a potential role in social cohesion (preservation of jobs) but that are highly ineffi cient since they distort trade and competition between fi rms, regions and countries and delay structural change (this is especially true for sectoral aid). The evidence is that of excessive concentration in the richest regions, thus working against social cohesion, and in the autonomous regions, reinforcing the negative eff ects pointed out in c).
e) Employment and social policies, which in some cases have a region-specifi c conditionality, can act in favour of a region’s competitiveness and social cohesion. Among these, training is of special relevance, due to its potentially productivity-enhancing eff ect. The existing evidence, however, shows that, with the exception of Alentejo, training expenditures have not been proportionally higher in the poorer regions. Labour market regulations have been pointed out as a major shortcoming in Portugal, preventing adaptability and structural reform. However, its diff erential impact tends to advance cohesion to the extent that there is more de facto fl exibility in less prosperous regions. Social expenditures do have implications for the eff ective distribution of public expenditures between regions, not because the amount spent in any region is determined by regional concerns, but because of the regional distribution of people elegible for social support. While it is obvious that social policies have a positive impact on reducing regional per capita income disparities, their eff ectiveness depends on the ability of the policy to cover all of the territory
evolution over the decade 1991-2001, their specialisation pa� ern and the evolution of regional indicators. Interview evidence on the assessment by regional representatives of the domestic policies’ impact on regional cohesion is also presented and contrasted with the researchers’ perspective.
In general (with the exception of Açores and Madeira), regional authorities’ discretion is very limited. Most policies that take place at the regional level are mere extensions of policies determined nationally which in turn tend not to have an explicit regional dimension.
To a large extent, Portugal features national policies with regional concerns as a consequence and in the moulds of EU policy, in particular according to the requirements of the Community Support Framework (CSF) programmes. There is a good match between national and EU designations of territories for regional and other forms of economic development assistance. The structural funds framework that is widely adopted for national policy and most government spending on promoting economic and social cohesion goes through the CSF. Since the CSF is rather demanding in terms of national contributions, the scope for other national initiatives involving public expenditures is very limited.
Given that some national public expenditures in Portugal are closely tied to EU funding, the regional distribution of CSF funds serves as a useful indicator for the regional incidence of public expenditures. Under the second CSF, however, regional problems were largely disregarded. This is shown by the fact that the funds per capita for the poorest regions (Açores and Alentejo) were substantially lower than those for the richest regions (Lisboa e Vale do Tejo, Centro and Madeira).
Not surprisingly, the evidence for the period 1995-2000 shows divergence between the Portuguese regions, both in per capita terms and in terms of GVA per worker. Among the Portuguese regions, only Madeira has approached the country average in terms of per capita GDP. Taking a longer time horizon (1990-2001), so as to avoid the diff erential impact of the business cycle, we observe that only Algarve and Norte have succeded in growing faster than the country average, both in terms of GVA per capita and GVA per working age person. As far as regional convergence is concerned, the overall picture has been disappointing.
» EXECUTIVE SUMMARY
equitatively. The evidence on unemployment compensations points, however, to a higher coverage rate in the more prosperous regions.
f) Science and technology policy may enhance the ability of fi rms located in less prosperous regions to compete. However, there can be a tension between a� empts to reinforce national competitiveness and the desire to spread the benefi ts of high technology across regions. The evidence suggest that science and technology policy in Portugal, not having a regional dimension, does not succeed in counterbalancing the general tendency for concentration of research activities in the main centres.
g) Foreign direct investment policy is an important part of a regional development strategy. It is not only has a direct incidence on economic activity, income and jobs but it is also a mechanism for transferring technology, new managerial techniques and know-how. The same policy dilemma of the previous policy applies: large-scale FDI, with most potential positive externalities, tends to be located in the most prosperous regions. Although FDI policies have incorporated a regional dimension, there have been no signifi cant practical results.
We also draw on secondary data as well as on primary qualitative data collected through interviews with policy makers, regional leaders and academics. Open-ended exploratory questions have allowed for the collection of comprehensive data on regional specifi cities. All seven Portuguese regions are characterised in terms of their evolution over the decade 1991-2001, their specialisation pa� ern and the evolution of regional indicators. Interview evidence on the assessment by regional representatives of the domestic policies’ impact on regional cohesion is also presented and contrasted with the researchers’ perspective.
In general (with the exception of Açores and Madeira), regional authorities’ discretion is very limited. Most policies that take place at the regional level are mere extensions of policies determined nationally which in turn tend not to have an explicit regional dimension.
To a large extent, Portugal features national policies with regional concerns as a consequence and in the moulds of EU policy, in particular according to the requirements of the Community support framework programmes. There is a good match between national and EU designations of territories for regional and other forms of economic development assistance. The structural funds framework that is widely adopted for national policy and most government spending on promoting economic and social cohesion goes through the CSF. Since the CSF is rather demanding in terms of national contributions, the scope for other national initiatives involving public expenditures is very limited.
Given that some national public expenditures in Portugal are closely tied to EU funding, the regional distribution of CSF funds serves as a useful indicator for the regional incidence of public expenditures. Under the second Community Support Framework, however, regional problems were largely disregarded. This is shown by the fact that
» SUMÁRIO EXECUTIVO
equitatively. The evidence on unemployment compensations points, however, to a
» SUMÁRIO EXECUTIVO
the funds per capita for the poorest regions (Açores and Alentejo) were substantially lower than those for the richest regions (Lisboa e Vale do Tejo, Centro and Madeira).
Not surprisingly, the evidence for the period 1995-2000 shows divergence between the Portuguese regions, both in per capita terms and in terms of GVA per worker. Among the Portuguese regions, only Madeira has approached the country average in terms of per capita GDP. Taking a longer time horizon (1990-2001), so as to avoid the diff erential impact of the business cycle, we observe that only Algarve and Norte have succeded in growing faster than the country average, both in terms of GVA per capita and GVA per working age person. As far as regional convergence is concerned, the overall picture has been disappointing.

List of Figures
List of Tables
List of Boxes
List of Abbreviations
Acknowledgements
Chapter 1 - Introduction
Chapter 2 – The impact of national policies on cohesion
2.1 - Macroeconomic policy
2.2 - Public expenditures
2.3 - Transfers from Central Government
2.3.1 - Transfers to municipalities
2.3.2 - Transfers to autonomous regions
2.4 - State aid
2.5 - Employment and social policies
2.6 - Science and technology
2.7 - Foreign direct investment policy
Chapter 3 - Regional convergence in Portugal
3.1 - Convergence among Portuguese regions
3.2 - Regional profi les
3.2.1 – Região Norte
3.2.2 – Região Centro
3.2.3 - Região Lisboa e Vale do Tejo
TABLE OF CONTENTS | SUMÁRIO
19
20
22
24
31
33
37
37
41
50
50
52
55
61
69
81
87
87
91
91
99
105
3.2.4 - Região Alentejo
3.2.5 - Região Algarve
3.2.6 - Região Autónoma dos Açores
3.2.7 - Região Autónoma da Madeira
Chapter 4 – The impact of Community policies on cohesion
4.1 – Ambit of the analysis
4.2 - Case study 1: Região Autónoma dos Açores
4.2.1 – Impact of specifi c policies
4.2.2 – Coordination between policies
4.2.3 – Governance issues
4.2.4 – Summary and guidelines for Community action
4.3 - Case study 2: Algarve
4.3.1 – Impact of specifi c policies
4.3.2 – Coordination between policies
4.3.3 – Governance
4.3.4 – Summary and guidelines for Community action
Chapter 5 - Conclusions
References
Appendix A - Supplementary statistics for the regions of Açores and Algarve
A.1 - Açores
A.2 - Algarve
Appendix B – Map of NUTS II Portuguese regions
110
115
119
123
129
129
130
132
137
137
137
139
140
144
145
146
147
154
160
160
162
166
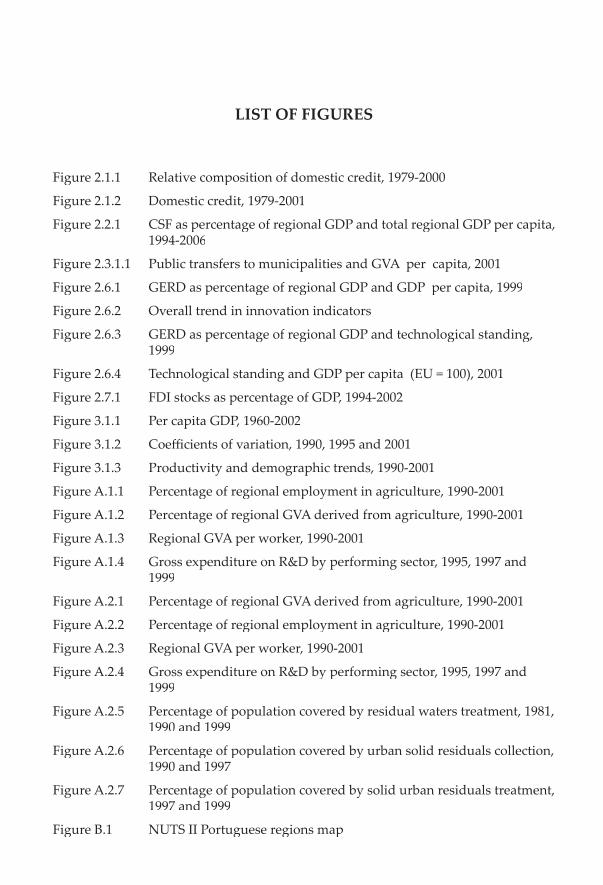
LIST OF FIGURES
Figure 2.1.1 Relative composition of domestic credit, 1979-2000
Figure 2.1.2 Domestic credit, 1979-2001
Figure 2.2.1 CSF as percentage of regional GDP and total regional GDP per capita, 1994-2006
Figure 2.3.1.1 Public transfers to municipalities and GVA per capita, 2001
Figure 2.6.1 GERD as percentage of regional GDP and GDP per capita, 1999
Figure 2.6.2 Overall trend in innovation indicators
Figure 2.6.3 GERD as percentage of regional GDP and technological standing, 1999
Figure 2.6.4 Technological standing and GDP per capita (EU = 100), 2001
Figure 2.7.1 FDI stocks as percentage of GDP, 1994-2002
Figure 3.1.1 Per capita GDP, 1960-2002
Figure 3.1.2 Coeffi cients of variation, 1990, 1995 and 2001
Figure 3.1.3 Productivity and demographic trends, 1990-2001
Figure A.1.1 Percentage of regional employment in agriculture, 1990-2001
Figure A.1.2 Percentage of regional GVA derived from agriculture, 1990-2001
Figure A.1.3 Regional GVA per worker, 1990-2001
Figure A.1.4 Gross expenditure on R&D by performing sector, 1995, 1997 and 1999
Figure A.2.1 Percentage of regional GVA derived from agriculture, 1990-2001
Figure A.2.2 Percentage of regional employment in agriculture, 1990-2001
Figure A.2.3 Regional GVA per worker, 1990-2001
Figure A.2.4 Gross expenditure on R&D by performing sector, 1995, 1997 and 1999
Figure A.2.5 Percentage of population covered by residual waters treatment, 1981, 1990 and 1999
Figure A.2.6 Percentage of population covered by urban solid residuals collection, 1990 and 1997
Figure A.2.7 Percentage of population covered by solid urban residuals treatment, 1997 and 1999
Figure B.1 NUTS II Portuguese regions map
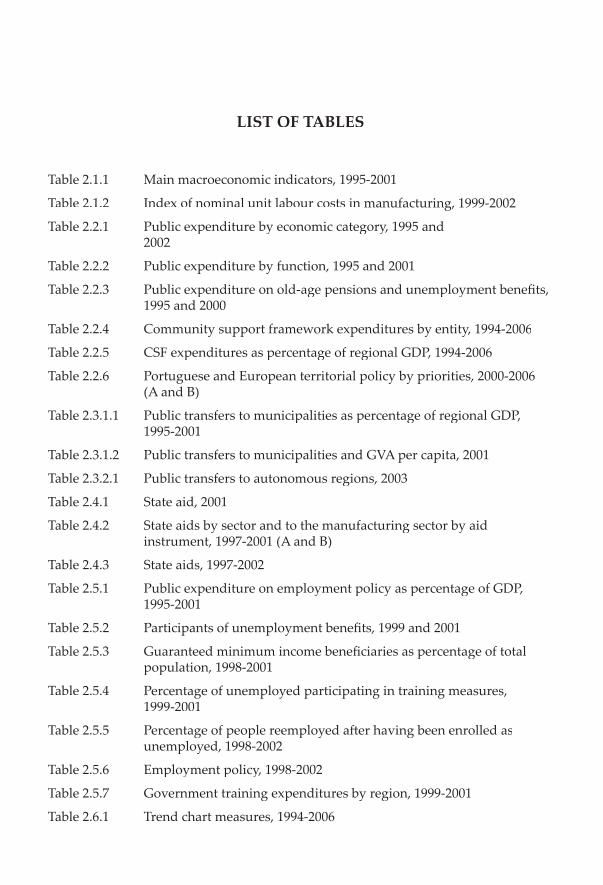
LIST OF TABLES
Table 2.1.1 Main macroeconomic indicators, 1995-2001
TableTableT 2.1.2 Index of nominal unit labour costs in manufacturing, 1999-2002
Table 2.2.1 Public expenditure by economic category, 1995 and 2002
Table 2.2.2 Public expenditure by function, 1995 and 2001
Table 2.2.3 Public expenditure on old-age pensions and unemployment benefi ts, 1995 and 2000
Table 2.2.4 Community support framework expenditures by entity, 1994-2006
Table 2.2.5 CSF expenditures as percentage of regional GDP, 1994-2006
Table 2.2.6 Portuguese and European territorial policy by priorities, 2000-2006 (A and B)
Table 2.3.1.1 Public transfers to municipalities as percentage of regional GDP, 1995-2001
Table 2.3.1.2 Public transfers to municipalities and GVA per capita, 2001
Table 2.3.2.1 Public transfers to autonomous regions, 2003
Table 2.4.1 State aid, 2001
Table 2.4.2 State aids by sector and to the manufacturing sector by aid instrument, 1997-2001 (A and B)
Table 2.4.3 State aids, 1997-2002
Table 2.5.1 Public expenditure on employment policy as percentage of GDP, 1995-2001
Table 2.5.2 Participants of unemployment benefi ts, 1999 and 2001
Table 2.5.3 Guaranteed minimum income benefi ciaries as percentage of total population, 1998-2001
Table 2.5.4 Percentage of unemployed participating in training measures, 1999-2001
Table 2.5.5 Percentage of people reemployed a� er having been enrolled as unemployed, 1998-2002
Table 2.5.6 Employment policy, 1998-2002
Table 2.5.7 Government training expenditures by region, 1999-2001
Table 2.6.1 Trend chart measures, 1994-2006
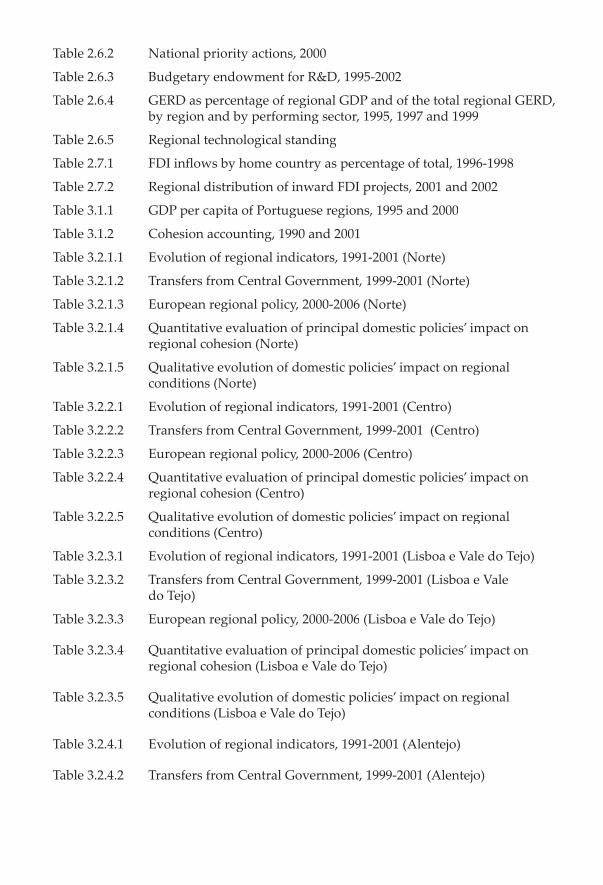
Table 2.6.2 National priority actions, 2000
Table 2.6.3 Budgetary endowment for R&D, 1995-2002
Table 2.6.4 GERD as percentage of regional GDP and of the total regional GERD, by region and by performing sector, 1995, 1997 and 1999
Table 2.6.5 Regional technological standing
Table 2.7.1 FDI infl ows by home country as percentage of total, 1996-1998
Table 2.7.2 Regional distribution of inward FDI projects, 2001 and 2002
Table 3.1.1 GDP per capita of Portuguese regions, 1995 and 2000
Table 3.1.2 Cohesion accounting, 1990 and 2001
Table 3.2.1.1 Evolution of regional indicators, 1991-2001 (Norte)
Table 3.2.1.2 Transfers from Central Government, 1999-2001 (Norte)
Table 3.2.1.3 European regional policy, 2000-2006 (Norte)
Table 3.2.1.4 Quantitative evaluation of principal domestic policies’ impact on regional cohesion (Norte)
Table 3.2.1.5 Qualitative evolution of domestic policies’ impact on regional conditions (Norte)
Table 3.2.2.1 Evolution of regional indicators, 1991-2001 (Centro)
Table 3.2.2.2 Transfers from Central Government, 1999-2001 (Centro)
Table 3.2.2.3 European regional policy, 2000-2006 (Centro)
Table 3.2.2.4 Quantitative evaluation of principal domestic policies’ impact on regional cohesion (Centro)
Table 3.2.2.5 Qualitative evolution of domestic policies’ impact on regional conditions (Centro)
Table 3.2.3.1 Evolution of regional indicators, 1991-2001 (Lisboa e Vale do Tejo)
Table 3.2.3.2 Transfers from Central Government, 1999-2001 (Lisboa e Vale do Tejo)
Table 3.2.3.3 European regional policy, 2000-2006 (Lisboa e Vale do Tejo)
Table 3.2.3.4 Quantitative evaluation of principal domestic policies’ impact on regional cohesion (Lisboa e Vale do Tejo)
Table 3.2.3.5 Qualitative evolution of domestic policies’ impact on regional conditions (Lisboa e Vale do Tejo)
Table 3.2.4.1 Evolution of regional indicators, 1991-2001 (Alentejo)
Table 3.2.4.2 Transfers from Central Government, 1999-2001 (Alentejo)
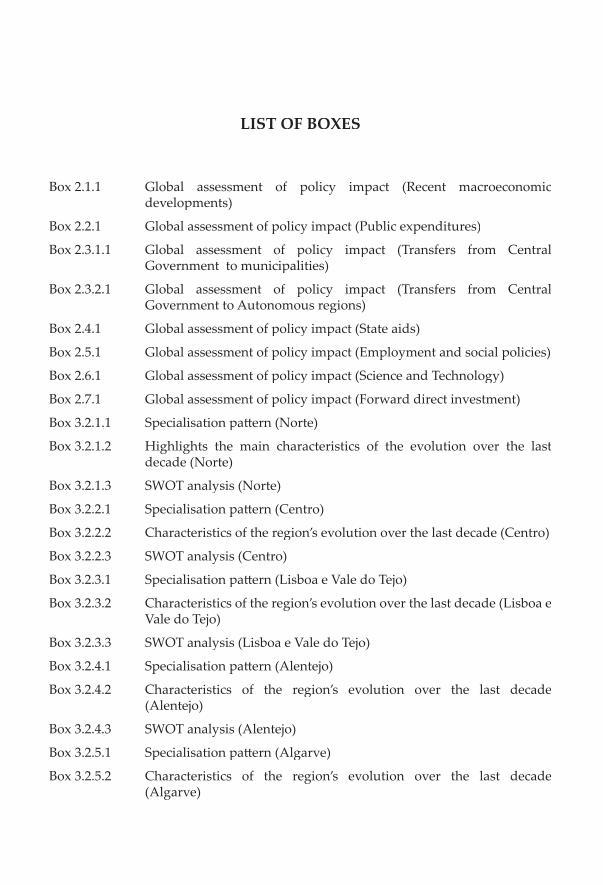
LIST OF BOXES
Box 2.1.1 Global assessment of policy impact (Recent macroeconomic developments)
Box 2.2.1 Global assessment of policy impact (Public expenditures)
Box 2.3.1.1 Global assessment of policy impact (Transfers from Central Government to municipalities)
Box 2.3.2.1 Global assessment of policy impact (Transfers from Central Government to Autonomous regions)
Box 2.4.1 Global assessment of policy impact (State aids)
Box 2.5.1 Global assessment of policy impact (Employment and social policies)
Box 2.6.1 Global assessment of policy impact (Science and Technology)
Box 2.7.1 Global assessment of policy impact (Forward direct investment)
Box 3.2.1.1 Specialisation pa� ern (Norte)
Box 3.2.1.2 Highlights the main characteristics of the evolution over the last decade (Norte)
Box 3.2.1.3 SWOT analysis (Norte)
Box 3.2.2.1 Specialisation pa� ern (Centro)
Box 3.2.2.2 Characteristics of the region’s evolution over the last decade (Centro)
Box 3.2.2.3 SWOT analysis (Centro)
Box 3.2.3.1 Specialisation pa� ern (Lisboa e Vale do Tejo)
Box 3.2.3.2 Characteristics of the region’s evolution over the last decade (Lisboa e Vale do Tejo)
Box 3.2.3.3 SWOT analysis (Lisboa e Vale do Tejo)
Box 3.2.4.1 Specialisation pa� ern (Alentejo)
Box 3.2.4.2 Characteristics of the region’s evolution over the last decade (Alentejo)
Box 3.2.4.3 SWOT analysis (Alentejo)
Box 3.2.5.1 Specialisation pa� ern (Algarve)
Box 3.2.5.2 Characteristics of the region’s evolution over the last decade (Algarve)
Box 3.2.5.3 SWOT analysis (Algarve)
Box 3.2.6.1 Specialisation pa� ern (Região Autónoma dos Açores)
Box 3.2.6.2 Characteristics of the region’s evolution over the last decade (Região Autónoma dos Açores)
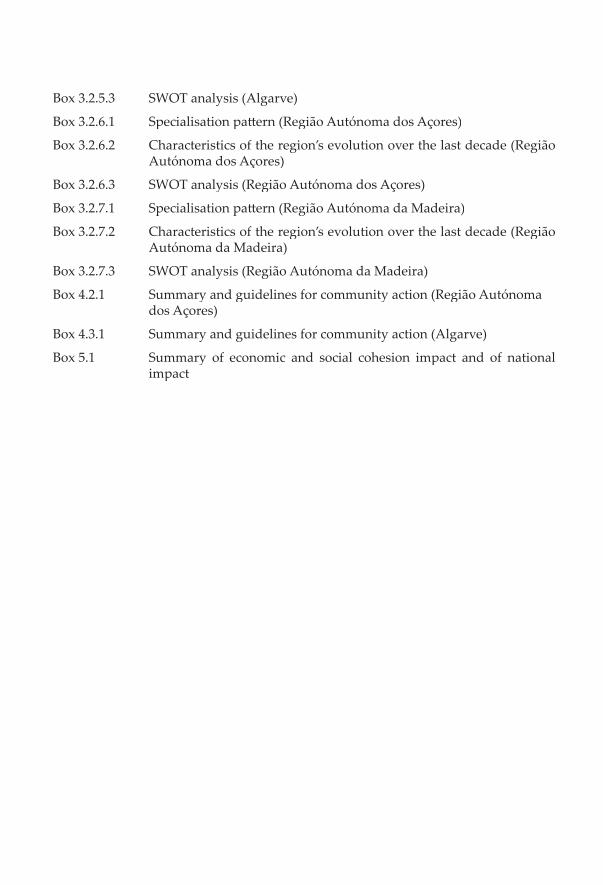
Box 3.2.6.3 SWOT analysis (Região Autónoma dos Açores)
Box 3.2.7.1 Specialisation pa� ern (Região Autónoma da Madeira)
Box 3.2.7.2 Characteristics of the region’s evolution over the last decade (Região Autónoma da Madeira)
Box 3.2.7.3 SWOT analysis (Região Autónoma da Madeira)
Box 4.2.1 Summary and guidelines for community action (Região Autónoma dos Açores)
Box 4.3.1 Summary and guidelines for community action (Algarve)
Box 5.1 Summary of economic and social cohesion impact and of national impact
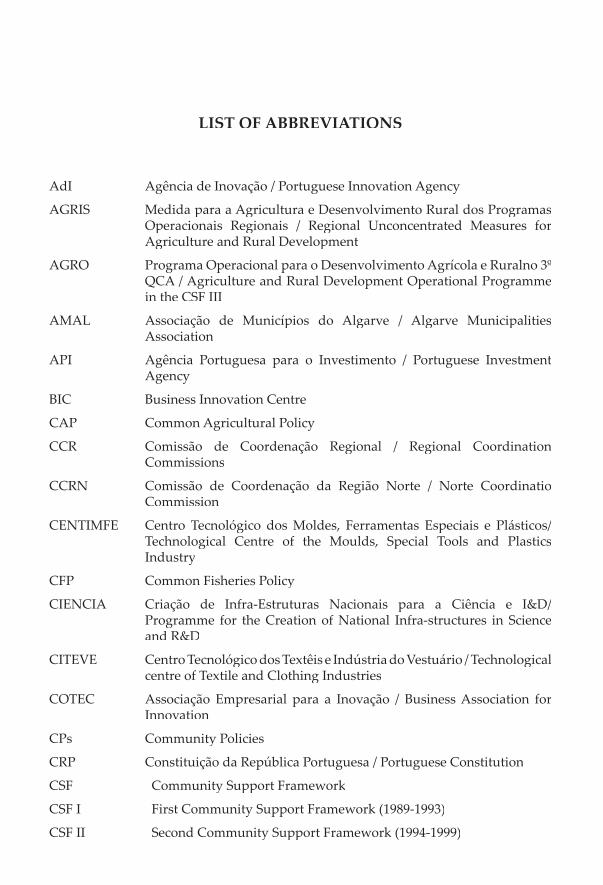
LIST OF ABBREVIATIONS
AdI Agência de Inovação / Portuguese Innovation Agency
AGRIS Medida para a Agricultura e Desenvolvimento Rural dos Programas Operacionais Regionais / Regional Unconcentrated Measures for Agriculture and Rural Development
AGRO Programa Operacional para o Desenvolvimento Agrícola e Ruralno 3º QCA / Agriculture and Rural Development Operational Programme in the CSF III
AMAL Associação de Municípios do Algarve / Algarve Municipalities Association
API Agência Portuguesa para o Investimento / Portuguese Investment Agency
BIC Business Innovation Centre
CAP Common Agricultural Policy
CCR Comissão de Coordenação Regional / Regional Coordination Commissions
CCRN Comissão de Coordenação da Região Norte / Norte Coordinatio Commission
CENTIMFE Centro Tecnológico dos Moldes, Ferramentas Especiais e Plásticos/ Technological Centre of the Moulds, Special Tools and Plastics Industry
CFP Common Fisheries Policy
CIENCIA Criação de Infra-Estruturas Nacionais para a Ciência e I&D/ Programme for the Creation of National Infra-structures in Science and R&D
CITEVE Centro Tecnológico dos Textêis e Indústria do Vestuário / Technological centre of Textile and Clothing Industries
COTEC Associação Empresarial para a Inovação / Business Association for Innovation
CPs Community Policies
CRP Constituição da República Portuguesa / Portuguese Constitution
CSF Community Support Framework
CSF I First Community Support Framework (1989-1993)
CSF II Second Community Support Framework (1994-1999)
CSF III Third Community Support Framework (2000-2006)
CTC Community Technology Centres
DG Directorate-General
DGCompetition Directorate-General of Competition
DG REGIO Regional Policy Directorate-General
DGDR Direcção Geral de Desenvolvimento Regional / Directorate-Generalof Regional Development
DGO Direcção Geral do Orçamento / Budget Directorate-General
EAGGF European Agricultural Guidance and Guarantee Fund
EC European Community
EMU Economic and Monetary Union
EPO European Patent Offi ce
EQUAL European Social Fund Initiative
ERDF European Regional Development Fund
ESF European Social Fund
ESM Employment Social Market
ESSPROS European System of Integrated Social Protection Statistics
EU European Union
EUROSTAT Statistical Offi ce of the European Communities
FBM Fundo de Base Municipal / Municipal Base Fund
FCM Fundo de Coesão Municipal / Municipal Cohesion Fund
FDI Foreign Direct Investment
FEF Fundo de Equilíbrio Financeiro / Financial Balance Fund
FFF Fundo de Financiamento das Freguesias / Smallest Portuguese Unit of local government Financing Fund
FGM Fundo Geral Municipal / Municipalities’ General Fund
FIFG Financial Instrument for Fisheries Guidance
FSIP Fund for Support of Innovators Projects
GAPIs Gabinetes de Apoio à Propriedade Industrial / Industrial Property Support Offi ces
GDFC Gross Domestic Fixed Capital formation
GDP Gross Domestic Product
GERD Gross Expenditure on R&D
GVA Gross Value Added
ICEP Instituto do Comércio Externo Português / Government Agency Investments, Trade and Tourism of Portugal
ICN Instituto de Conservação da Natureza / Nature Protection Institute
ICT Information and Communications Technology
IDI Inward Direct Investment
IEFP Instituto de Emprego e Formação Profi ssional / Professional Training and Employment Institute
IFADAP Instituto de Financiamento e Apoio ao Desenvolvimento da Agricultura e Pescas / Institute of Financing and Support for the Development of Agriculture and Fisheries
ILDE Iniciativas Locais para o Desenvolvimento e Emprego / Regional Initiatives for Development and Employment
INE Instituto Nacional de Estatística / Portuguese Statistics Institute
INEGI Instituto de Engenharia Mecânica e Gestão Industrial / Institute of Mechanics Engineering and Industrial Management
INESC Instituto de Engenharia de Sistemas e Computadores / Institute of Systems and Computer Engineering
INOVAlgarve Programa de Acções Inovadoras da Região do Algarve / Programme of Innovative Actions for the Region of Algarve
INTERREG Interregional Co-operation Programme
IRS Imposto sobre o Rendimento das Pessoas Singulares / Personal Income Tax
LEADER Linking Between Actions of Rural Economy Development
LFL Lei do Financiamento Local / Local Finance Law
LISACTION Programa de Acções Orientadas para a Inovação de Lisboa e Vale do Tejo / Lisboa e Vale do Tejo Programme on Innovation-Oriented Actions
MA Environment Ministry
MARE Operational Fisheries Programme
MARIS Generic Assignment for Regionally Unconcentrated Measures of Fisheries
MCES Ministério da Ciência e do Ensino Superior / Science and Higher Education Ministry
MCT Ministério da Ciência e da Tecnologia / Science andTechnology Ministry
ME Ministério da Economia / Economics Ministry
MF Ministério das Finanças / Finance Ministry
MNEs Multinational Enterprises
MSST Ministério da Segurança Social e do Trabalho / Labour and Locial Security Ministry
NORTINOV Programa Regional de Acções Inovativas do Norte dePortugal / Regional Programme for Innovative Actions of the Region Norte
NTBIs New Technology-Based Industries
NUTS II Second-level Administrative Units of Europe
NUTS III Tertiary-level Administrative Units of Europe
OCES Observatório da Ciência e do Ensino Superior / Science andHigher Education Observatory
OE Orçamento de Estado / State Budget
OECD Organisation for Economic Co-operation and Development
OGE Orçamento Geral do Estado / General State Budget
PASI Plano de Acção para a Sociedade da Informação / Action Plan for the Information Society
PEDAP Programa Específi co para o Desenvolvimento da Agricultura Portuguesa / Specifi c Programme for the Development of Portuguese Agriculture
PEDIP Programa Específi co para o Desenvolvimento da Indústria Portuguesa/ Specifi c Programme for the Development of Portuguese Industry
PEDIZA II Programa específi co para o desenvolvimento integrado do Alqueva / Specifi c Programme for the Integrated Development of Alqueva
PEDRAA Programa Específi co para o Desenvolvimento da Região Autónoma dos Açores / Specifi c Programme for the Development of the Açores Autonomous Region
PEPS Programa de Emprego e Protecção Social / Employment and SociaProtection Programme
PIC Programas de Iniciativa Comunitária / Community Initiative programmes
PITER Programas Integrados Turísticos Estruturantes e de Base Regional/Regional Programme for Tourism Development
PNDES Programa Nacional de Desenvolvimento Económico e Social/National Programme for Economic and Social Development
PNE Plano Nacional de Emprego / National Employment Plan
POCTI P Programa Operacional para a Ciência Tecnologia e Inovação/Operational programme for Science, Technology and Innovation
POE Programa Operacional para a Economia / Operational Programmefor the Economy
POLIS Programa de Requalifi cação Urbana e Valorização Ambiental/Urban Requalifi cation and Environment Valuation Programme
POSEIMA Programa de Opções Específi cas para fazer face à distância eInsularidade da Madeira e dos Açores / Specifi c options programmeto address distance and insularity of Madeira and Açores
POSI Programa Operacional para a Sociedade da Informação / Operational Programme for the Information Society
PPCE Programa para a Produtividade e Crescimento da Economia/Programme for the Productivity and Growth of the Economy
PPP Purchasing Power Parity
PRASD Programa de Recuperação de Áreas e Sectores Deprimidos/Reconvergence Programme for Depressed Areas and Sectors
PRAXIS XXI Intervenção Operacional para a Ciência e Tecnologia / Operational intervention for Science and Technology
PRIME Programa de Incentivos à Modernização da Economia / IncentivePro-gramme for the Modernisation of the Economy
PROA Programa Operacional do Algarve no II QCA / OperationalProgramme for Algarve in the CSF II
PROALGARVE Programa Operacional do Algarve no III QCA / Operational Programme for Algarve in the CSF III
PROCOM Programa de Suporte à Modernização do Comércio/ Support Programme for Commerce Modernisation
PRODEP Programa para o Desenvolvimento da Educação em Portugal/Educational Development Programme for Portugal
PRODESA Programa Operacional para o Desenvolvimento Económico e Socialdos Açores / Operational Programme for the Economic and Social Development of Açores
PROINOV Programa Integrado de Suporte à Inovação / Integrated Programmefor Innovation Support
PROPAM Programa Específi co para o Desenvolvimento da Região Autónoma da Madeira / Specifi c Programme for the Development of Madeira Autonomous Region
PROTAL Plano de Ordenamento Territorial / Spacial Planning
PTE Pactos Territoriais para o Emprego / Territorial Employment Pacts
R&D Research and Development
REGIS Community Initiative Programmes for the Development of Ultra-Peripheral Regions
RIAT Redes de Informação e Assistência Técnica / Information and Technical Assistance Networks
RIME Regime de Incentivos às Micro Empresas / Incentive System for Micro-enterprises
RITTS Regional Innovation and Technology Transfer Strategies
RMG Rendimento Mínimo Garantido / Guaranteed Minimum Income
RRE Redes Regionais de Emprego / Regional Employment Networks
RRSII Revealed Regional Summary Innovation Index
RTD Research and Technological Development
S&E Science and Engineering
S&T Science and Technology
SAJE Sistema de Apoio a Jovens Empresários / Support System for Young Entrepreneurs
SGP Stability and Growth Pact
SIBR Sistema de Incentivos de Base Regional / Regionally-based Incentive System
SIDER Sistema de Incentivos para o Desenvolvimento Regional / Incentive System for Regional Development
SIFIT Sistema de Incentivos Financeiros ao Investimento no Turismo/Financial Incentives System for Tourism Investment
SIME Sistema de Incentivos à Modernização das Empresas / Incentive System for Business Modernisation
SIPIE Sistema de Incentivos às Pequenas Iniciativas Empresariais/ Incentive System for Small Business Initiatives
SMEs Small and Medium-Sized Enterprises
STRIDE Science and Technology for Regional Innovation and Developmentin Europe
TEU Treaty on European Union
TFP Total Factor Productivity
TIP Territorial Improvement Programme
UNCTAD United Nations Conference on Trade and Development
UNINOVA Instituto para o Desenvolvimento de Novas Tecnologias / Institute for the Development of New Technologies
VAT Value Added Tax

ACKNOWLEDGEMENTS
This study is an outgrowth of the authors’ earlier research carried out at the University of Aveiro within a broader study on the impact of Member State policies on social
and economic cohesion at the regional level. That research was funded by the European Commission (2002 CE 160 AT 172) and gathered a consortium made up by a core team, constituting of Iain Begg, project coordinador, Carlos Mulas-Granados, El Mouhoub Mouhoud, Frank Barry, Gianfranco Viesti, V. Monastiriotis, Phedon Nicolaides, Sébastien Dupuch, and two of us (Miguel Lebre de Freitas and Francisco Torres, also coordinators of the Portuguese team), based at the London School of Economics and at other European universities and institutes, among which the University of Aveiro, and a network of correspondents from all EU-15 Member States. The study also draws on our contributions to a complementary study on the impact of Community policies on regional cohesion, which has improved our understanding of how national policies are closely tied to Community policies and EU funding and for which we are especially grateful to Ricardo Rodríguez Contreras and many people in the Açores and Algarve whose helpful discussions are acknowledged in that study.
We would like to express our gratitude to DG Regio of the European Commission for its support, and to Vasco Cal and Mathew Brooke, in particular. In addition, we would like to thank participants in the several working sessions that took place at the European Information Centre Jacques Delors in Lisbon, at the DG Regio in Brussels, at the University of Aveiro, and in a workshop held at the National Institute for Public Administration (INA) in July 2003 to discuss our work, namely Vasco Cal, Luís Valadares Tavares, Nuno Vitorino, Ana Filipa Pereira and Isabel Marques, and, of course, our colleagues of the core team, especially Iain Begg. We are also indebted to Teresa Moura, Maria João Botelho, Luísa Dias, Luís Alves Monteiro and Jorge Abegão, for fruitful discussions, as well as to Rui Monteiro and Cláudia Leite, CCR Norte, Rui Jacinto, CCR Centro, Isabel de Carvalho, CCR, LVT and Manuel Bento Rosado, CCR Alentejo.
Of course, we take full responsibility for the remaining errors and shortcomings of this study, whose views do not necessarily coincide with the views expressed in the above-referred projects nor do they implicate any of the above-mentioned institutions and the institutions with whom the authors are affi liated.

1.
INTRODUCTION
Cohesion is a wide concept. In a broad sense, it embraces inequalities, whether in terms of income, living standards, employment or of environmental conditions,
and has to be seen in terms of opportunities as well as outcomes (Ardy et al., 2002a). Convergence, a related notion, focuses on “real variables” such as per capita income or productivity. Convergence and divergence, however, are long-term processes that refl ect both history and the eff ects of recent trends that shape the ability of a region to compete.
Following the terminology of the fi rst Cohesion Report (European Commission, 1996), economic cohesion refers to the aim of promoting competitiveness and convergence through faster GDP growth in the poorest regions. Such an aim implicitly requires EU policies to raise the production capability of the poorer regions, thus creating conditions for faster growth, rather than simply promoting consumption through income transfers from the richer areas. As pointed out by Ardy et al. (2002b), the EU views cohesion as a development issue: one of the ways for the EU to achieve cohesion is through structural and cohesion funding that seeks to foster the long-term growth potential of regions, avoiding situations of dependence on those transfers and of high unemployment. The concept shall, then, be distinguished from the notion of social cohesion, which is related to the aim of ensuring that the least well-off have access to social protection and services of general interest. Social cohesion may be assessed by means of a number of indicators; some of the most important ones are unemployment, inequality of incomes, poverty, and social exclusion which in turn is multidimensional.
Three basic mechanisms through which policies impact on economic and social cohesion can be identifi ed:
A fi rst mechanism is economic effi ciency. Policies aimed at promoting the effi cient allocation of resources include regulation and institutional development, adequate incentives, the internalisation of externalities, a sound tax system, increased competition, public infrastructure, training and other labour market measures and science and technology-related initiatives. Their purpose is to correct shortcomings on the supply side of the economy that result in an ineffi cient economic performance.
A second mechanism is income redistribution. Policies aimed at reducing income disparities at the individual level may have a signifi cant regional impact if the incidence of social needs is asymmetrically distributed among regions, even when they do not have any regional dimension. Regions with below-average economic activity will have a propensity to draw in proportionally higher infl ows of public expenditure, while
34
dynamic regions contribute more to tax revenue.
A third mechanism is demand stabilisation, which may act in a preventive way with respect to disparities. The inter-play of public expenditure and taxation performs an important role in stabilising demand, a� enuating short-term fl uctuations in regional demand that might otherwise give rise to problems of cohesion.
It should be noted that each one of these three mechanisms may have an impact on both economic and social cohesion.
Some of the policies that act through the three mechanisms are implemented at the Member State level while others may involve both Community and national eff orts.
- Community policies, insofar as they aim at raising the productivity of the less competitive regions, are specifi cally aimed at promoting economic cohesion (through Structural Funds, the Cohesion Fund, the CAP and others).
- Demand stabilisation in the Eurozone may to some extent be undertaken by the ECB, although this is only possible when not confl icting with the primary objective of price stability. At the Community level, however, the budget is too small to provide a demand stabilisation function. Therefore, the burden of demand stabilisation falls mainly on national policies. The scale of domestic public expenditure, typically in the range of 40-50 per cent of GDP, is much greater than that emanating from the EU, roughly amounting to 1 per cent of GDP.
- As far as income redistribution is concerned, Community policies do not have any direct role. Member States’ policies, in contrast, deliberately do.
The fact that some cohesion policies can only be implemented through action at the Member State level while others may involve both Community and national eff orts requires good coordination between both levels of government as to avoid that diff erent policies contradict each other and in order to maximise eff ectiveness.
PURPOSE OF THE STUDY
This study sets out to assess the impact of Portuguese domestic policies on cohesion in its seven regions. The discussion, along the lines of the broader study of Begg et al. (2004), focuses mainly on regional economic cohesion, although social cohesion eff ects are also considered. While it is well known that Portugal as a whole has been able to converge to the Community average since joining the EC in 1986, it remains to be seen whether the Portuguese regions have been able to share equally in that growth or whether there have been asymmetries and divergences in the growth pa� erns.
Our purpose is to analyse the impact of national rather than Community policies on cohesion. However, two regional studies enrich the analysis to the extent that they allow examining and contrasting the impact of Community policies in two out of the seven Portuguese regions (one continental and one ultra-peripheral). This is important for the case of Portugal (especially during the period of analysis, 1990-2001) where EU and national eff orts seem to be highly intertwined. Portuguese national policies are closely tied to EU funding, and given the lack of a regional policy tradition, most were set up under the EU policies framework.
35
There is a wide range of national policies with a positive or negative bearing on cohesion, some of which explicitly have a regional dimension while others have only indirect eff ects on regional cohesion. The following policies are examined in this study:
a) Macroeconomic policy. This policy plays a major role in stabilising demand and the level of unemployment. Its impact on cohesion comes through various channels: the interest rate, the exchange rate, taxation, the scale of public expenditures and output and price stability. Although determined at the aggregate level, macroeconomic policy may have a diff erential eff ect across regions.
b) Public expenditures. As far as regional cohesion is concerned, the impact of public expenditures will emerge through a variety of channels, namely investments in education, health, social security, transport infrastructure. Even though being defi ned at the country-level, public structural expenditures may also have an indirect eff ect on regional cohesion (a territorial dimension) by increasing accessibility and living conditions in many laggard areas and also as a source of employment in less populated areas.
c) Transfers from central government. Transfers to municipalities and to the autonomous regions may play an important role in cohesion to the extent that the level of proximity with respect to the utilisation of national funds may work in favour of its eff ectiveness. Public transfers, impacting on the regional distribution of income, have also a role in social cohesion and may act as a regional demand stabilisation tool.
d) State aid. State aid has a potential role in social cohesion, but can distort trade and competition between fi rms, regions or countries and delay restructuring. Whether or not state aids contribute to cohesion depends on their sectoral and spatial distribution, on the degree of distortion provoked in the market and on whether such distortions work in favour or against less-favoured regions.
e) Employment and social policies. In general, these policies are potentially eff ective in boosting social cohesion. Employment policies that improve the a� ributes of the labour force may also contribute to economic cohesion, by facilitating adaptability and entrepreneurship and helping to make individuals more employable. Yet, whether they are being used so as to improve the relative position of less-favoured regions is an open question.
f) Science and technology. Science and Technology policy can be thought of as a specifi c set of policies that aim to improve the ability of fi rms to compete. However, regions have diff erent capacities to exploit the potential stemming from innovation and innovation diff usion. At the national level there can be a tension between a� empts to reinforce national competitive advantage and the desire to spread the benefi ts of high technology across regions.
g) Foreign direct investment policy. Inward investment is typically an important part of a regional development strategy. FDI not only has a direct incidence on economic activity, income and jobs; it is also a mechanism for transferring technology, new managerial techniques and know-how. As in the case of Science and Technology
36
policy, there might be a policy dilemma between wanting investment to go towards the less-developed regions and the fact that investment is more easily a� racted to the be� er-endowed regions.
Whereas other policies could have been addressed, the primary goal of this study is not to examine in detail all initiatives but rather to analyse those national policies that are most relevant at a regional level.
We draw on secondary data as well as on primary qualitative data collected through interviews with policy makers, regional leaders and academics. Open-ended exploratory questions allow for the collection of comprehensive data on regional specifi cities. All seven Portuguese regions are characterised in terms of their evolution over the decade 1991-2001, their specialisation pa� erns and the evolution of regional indicators. Interview evidence on the assessment by regional representatives of the domestic policies’ impact on regional cohesion is also presented and contrasted with the researchers’ perspective.
The study is organised as follows: In Chapter 2 we analyse the impact of the above-mentioned national policies on cohesion. Chapter 3 addresses the question whether there has been convergence among the Portuguese NUTS II regions, characterising each of the seven regions both in quantitative and qualitative terms. This chapter also provides a qualitative evaluation of each policy dimension, based on the researchers’ perspective and also on the opinions of key policy actors. The impact of Community policies is analysed in Chapter 4 where two regional case studies, Açores and Algarve, are presented. Chapter 5 concludes.
37
2.
THE IMPACT OF NATIONAL POLICIES ON COHESION
2.1 – MACROECONOMIC POLICY
Long-term eff ects are positive: the incidence of nominal instability is asymmetric, hurting more those without access to fi nancial instruments. EMU and SGP have
a competitiveness-enhancing eff ect in laggard regions.
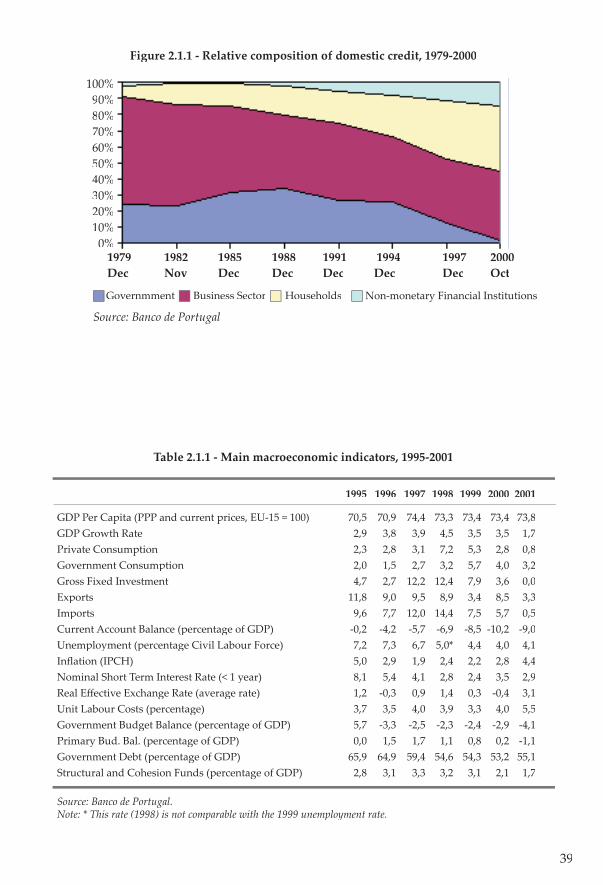
During the transition to European and Monetary Union (EMU), domestic credit expanded at very fast rates in Portugal (see fi gure 2.1.1). The rapid expansion in the demand for credit goes hand in hand with the changing composition of domestic credit in Portugal between 1979 and 2000, with households and non-monetary fi nancial institutions (mainly devoted to consumer credit) emerging as important actors (see fi gure 2.1.1) while public sector borrowing requirements decreased signifi cantly. This change was motivated by the drop in interest rates (see table 2.1.1) and the elimination of liquidity constraints that allowed households to smooth their lifetime expenditures, a� er decades of fi nancial repression. The phenomenon accelerated in 1998 when Portugal qualifi ed for the euro. Domestic banks were able to import money from abroad at favourable conditions.
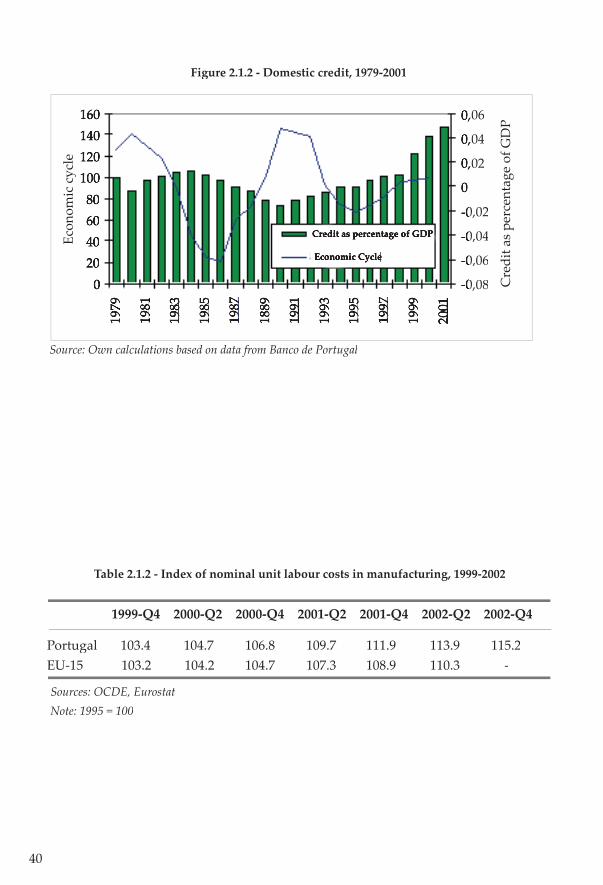
The fast expansion of domestic credit allowed domestic demand to grow at a very high pace in the late 1990s (see fi gure 2.1.2). This phenomenon was exacerbated by a pro-cyclical fi scal policy. In a small open economy, this leads to a rise in the relative price of non-tradable goods, a production shi� from tradables to non-tradables and a current account defi cit. In the non-tradables sector, there was an enormous impact on the demand for real estate. As real estate prices were rising, speculative demand emerged, driving the prices even higher. The resulting pressure on the labour market caused wages to grow signifi cantly faster than productivity, leading to an increase in unit labour costs and the loss of external competitiveness (see table 2.1.2).
Since the shi� in aggregate demand due to monetary and fi scal factors was of a temporary nature, the large current account defi cit that emerged was not a problem in itself, but rather a symptom of the macroeconomic adjustment that was taking place.
1 - The overall balance of payments defi cit was even larger because economic agents in general, and pension funds in particular, were re-adjusting the composition of their portfolios from domestic securities into eurozone securities other than those issued by Portuguese entities. Also, direct investment overseas by the business sector contributed signifi cantly to raise the econmy’s fi nancing needs.
38
The relative price eff ect (real appreciation) may however be a source of concern. In the last three decades, changes in relative prices had been made easier by nominal exchange rate adjustments. Now, this instrument is no longer available. The question is, then, whether nominal prices in the non-tradable sector will be able to fall. Thus far, producers have been reluctant to adjust prices downward, thus giving rise to excess supply and rising unemployment in some services and a sharp contraction in the real estate sector. In some urban areas, namely in the greater Lisbon area, a large excess supply of residential buildings has emerged.
The question is whether these developments have impacted diff erently on Portuguese regions. On an a priori basis, one would say that those regions in which the boom in the real estate sector was more pronounced would be more aff ected by the current crisis, especially the metropolitan areas that expanded without caring about urban quality. This includes the region of Lisboa e Vale do Tejo in particular, but also important urban areas in Norte and some cities in the coastal Algarve. In the vicinity of Lisbon, the traditional defi cit in residential buildings was clearly overcome and a large excess supply has emerged. The same is true for areas around major industrial cities all over the country. In the Algarve, the demand was mostly driven by tourism, so that the excess supply might be easier to invert with the business cycle.
These developments created some concerns about the stability of the banking sector. If large building companies go bankrupt, some banks will be forced to sell the assets received as a collateral, probably pushing prices down. However, in the worst-case scenario, the most aff ected banks would lose value, becoming vulnerable to external take-overs. In the Common Market, the transfer of property has as a stabilising eff ect.
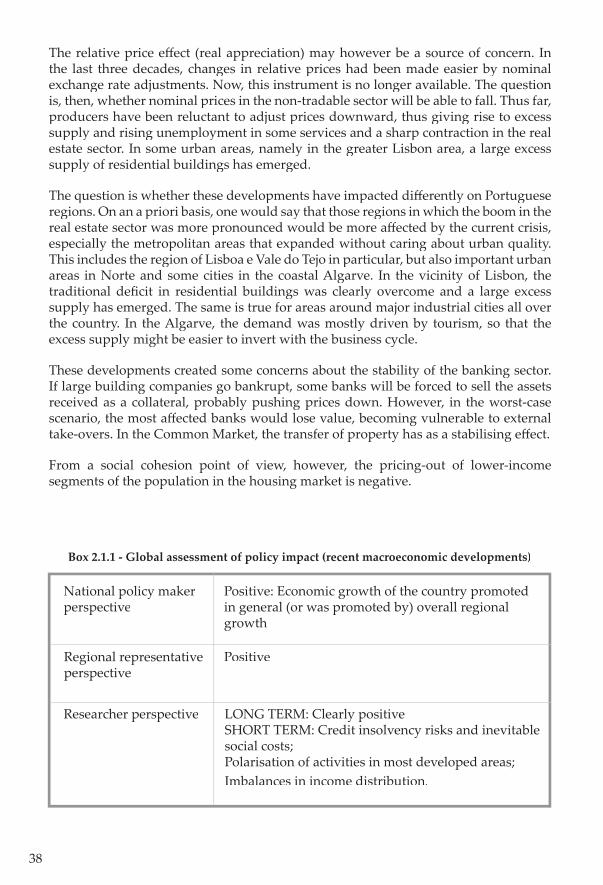
From a social cohesion point of view, however, the pricing-out of lower-income segments of the population in the housing market is negative.
Box 2.1.1 - Global assessment of policy impact (recent macroeconomic developments)
National policy maker perspective
Regional representative perspective
Positive: Economic growth of the country promoted in general (or was promoted by) overall regional growth
Positive
Researcher perspective LONG TERM: Clearly positive SHORT TERM: Credit insolvency risks and inevitable social costs; Polarisation of activities in most developed areas; Imbalances in income distribution.
39
Figure 2.1.1 - Relative composition of domestic credit, 1979-2000
1995 1996 1997 1998 1999 2000 2001
GDP Per Capita (PPP and current prices, EU-15 = 100) 70,5 70,9 74,4 73,3 73,4 73,4 73,8GDP Growth Rate 2,9 3,8 3,9 4,5 3,5 3,5 1,7Private Consumption 2,3 2,8 3,1 7,2 5,3 2,8 0,8Government Consumption 2,0 1,5 2,7 3,2 5,7 4,0 3,2Gross Fixed Investment 4,7 2,7 12,2 12,4 7,9 3,6 0,0Exports 11,8 9,0 9,5 8,9 3,4 8,5 3,3Imports 9,6 7,7 12,0 14,4 7,5 5,7 0,5Current Account Balance (percentage of GDP) -0,2 -4,2 -5,7 -6,9 -8,5 -10,2 -9,0Unemployment (percentage Civil Labour Force) 7,2 7,3 6,7 5,0* 4,4 4,0 4,1Infl ation (IPCH) 5,0 2,9 1,9 2,4 2,2 2,8 4,4Nominal Short Term Interest Rate (< 1 year) 8,1 5,4 4,1 2,8 2,4 3,5 2,9Real Eff ective Exchange Rate (average rate) 1,2 -0,3 0,9 1,4 0,3 -0,4 3,1Unit Labour Costs (percentage) 3,7 3,5 4,0 3,9 3,3 4,0 5,5Government Budget Balance (percentage of GDP) 5,7 -3,3 -2,5 -2,3 -2,4 -2,9 -4,1Primary Bud. Bal. (percentage of GDP) 0,0 1,5 1,7 1,1 0,8 0,2 -1,1Government Debt (percentage of GDP) 65,9 64,9 59,4 54,6 54,3 53,2 55,1Structural and Cohesion Funds (percentage of GDP) 2,8 3,1 3,3 3,2 3,1 2,1 1,7
Source: Banco de Portugal. Note: * This rate (1998) is not comparable with the 1999 unemployment rate.
Table 2.1.1 - Main macroeconomic indicators, 1995-2001
1979 1982 1985 1988 1991 1994 1997 2000Dec Nov Dec Dec Dec Dec Dec Oct
100%90%80%70%60%50%40%30%20%10%0%
Governmment Business Sector Households Non-monetary Financial Institutions
Source: Banco de Portugal
40
Figure 2.1.2 - Domestic credit, 1979-2001
Cre
dit a
s pe
rcen
tage
of G
DP0,060,06
0,040,04
0,020,02
0
-0,02-0,02
-0,04-0,04
-0,06-0,06
-0,08-0,08
160140120100806040200
1979
1981
1983
1985
1987
1889
1991
1993
1995
1997
1999
2001
Credit as percentage of GDP
Economic Cycle
Source: Own calculations based on data from Banco de Portugal
Table 2.1.2 - Index of nominal unit labour costs in manufacturing, 1999-2002
Sources: OCDE, EurostatNote: 1995 = 100
1999-Q4 2000-Q2 2000-Q4 2001-Q2 2001-Q4 2002-Q2 2002-Q4
Portugal 103.4 104.7 106.8 109.7 111.9 113.9 115.2EU-15 103.2 104.2 104.7 107.3 108.9 110.3 -
Econ
omic
cyc
le
41
2.2 - PUBLIC EXPENDITURES
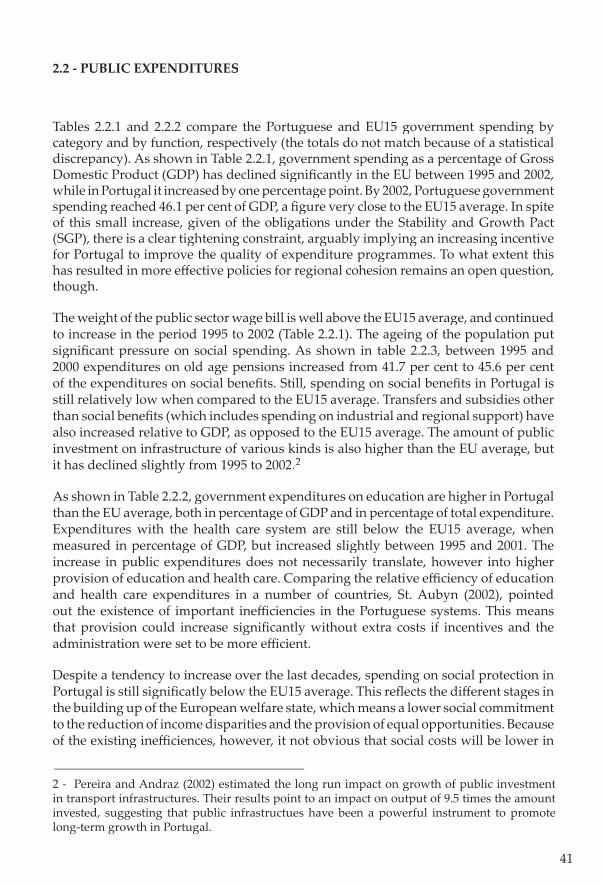
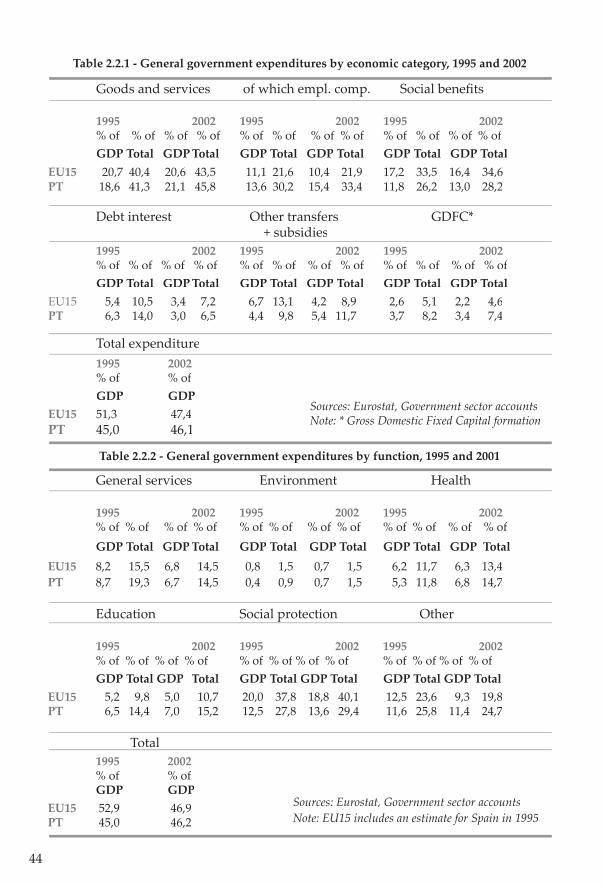
Tables 2.2.1 and 2.2.2 compare the Portuguese and EU15 government spending by category and by function, respectively (the totals do not match because of a statistical discrepancy). As shown in Table 2.2.1, government spending as a percentage of Gross Domestic Product (GDP) has declined signifi cantly in the EU between 1995 and 2002, while in Portugal it increased by one percentage point. By 2002, Portuguese government spending reached 46.1 per cent of GDP, a fi gure very close to the EU15 average. In spite of this small increase, given of the obligations under the Stability and Growth Pact (SGP), there is a clear tightening constraint, arguably implying an increasing incentive for Portugal to improve the quality of expenditure programmes. To what extent this has resulted in more eff ective policies for regional cohesion remains an open question, though.
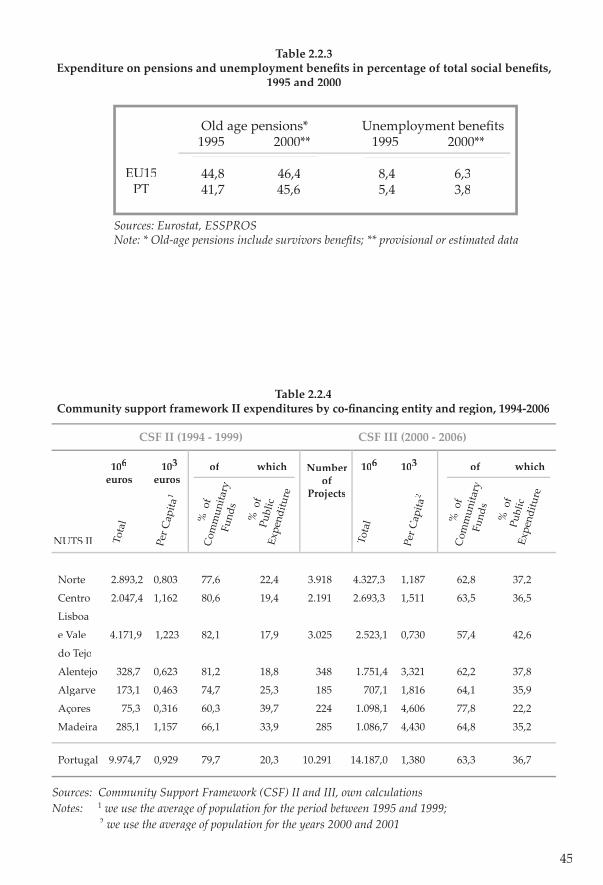
The weight of the public sector wage bill is well above the EU15 average, and continued to increase in the period 1995 to 2002 (Table 2.2.1). The ageing of the population put signifi cant pressure on social spending. As shown in table 2.2.3, between 1995 and 2000 expenditures on old age pensions increased from 41.7 per cent to 45.6 per cent of the expenditures on social benefi ts. Still, spending on social benefi ts in Portugal is still relatively low when compared to the EU15 average. Transfers and subsidies other than social benefi ts (which includes spending on industrial and regional support) have also increased relative to GDP, as opposed to the EU15 average. The amount of public investment on infrastructure of various kinds is also higher than the EU average, but it has declined slightly from 1995 to 2002.2
As shown in Table 2.2.2, government expenditures on education are higher in Portugal than the EU average, both in percentage of GDP and in percentage of total expenditure. Expenditures with the health care system are still below the EU15 average, when measured in percentage of GDP, but increased slightly between 1995 and 2001. The increase in public expenditures does not necessarily translate, however into higher provision of education and health care. Comparing the relative effi ciency of education and health care expenditures in a number of countries, St. Aubyn (2002), pointed out the existence of important ineffi ciencies in the Portuguese systems. This means that provision could increase signifi cantly without extra costs if incentives and the administration were set to be more effi cient.
Despite a tendency to increase over the last decades, spending on social protection in Portugal is still signifi catly below the EU15 average. This refl ects the diff erent stages in the building up of the European welfare state, which means a lower social commitment to the reduction of income disparities and the provision of equal opportunities. Because of the existing ineffi ciences, however, it not obvious that social costs will be lower in
2 - Pereira and Andraz (2002) estimated the long run impact on growth of public investment in transport infrastructures. Their results point to an impact on output of 9.5 times the amount invested, suggesting that public infrastructues have been a powerful instrument to promote long-term growth in Portugal.
42
Portugal than in other European countries, in which case globalisation and increasing competition will force a rescaling of the current model of social protection.
Most public expenditures in Portugal do not possess an explicit regional dimension. Policy-making in Portugal is very much centralised and regional and local authorities’ discretion over the way they spend the budget is very limited. Expenditures that take place at the regional or local level are a direct consequence of policies determined nationally. Notwithstanding, to the extent that the amount spent in diff erent regions depends on the age structure of the resident population and on the perceived needs for social support, this may translate into higher levels of government expenditure per capita in less prosperous regions. In that case, social cohesion is acccounted for indirectly at the regional level. Social expenditures have, however, only a limited eff ect on strengthening underlying competitiveness. Although in Portugal there is a concern, as in other countries, to ensure that the provision levels of essential public goods do not diff er much across the territory, infrastructure building tends to be concentrated in regions with larger populations. Unfortunatly, the relative scale of the diff erent public expenditures in diff erent regions in Portugal cannot be assessed because of data unavailability.
The regional distribution of CSF funds may provide an indication of the regional incidence of those public expenditures that are set to co-fi nance EU funding.4 As shown in Tables 2.2.4 under CSF II, funds per capita for the poorest regions of Açores and Alentejo were substantially lower than those for the richest regions of Lisboa e Vale do Tejo, Centro and Madeira. CSF funds per capita in Lisboa e Vale do Tejo are nearly six times the amount received by Açores. Table 2.2.5 shows that, relative to regional GDP, transfers to the poorest regions Açores and Alentejo amount to barely 0.8 and 1.39 per cent, respectively, while the richest region Lisboa e Vale do Tejo received 1.67 per cent. This suggests that, if CSF II induced public expenditure did have any impact on regional cohesion, it might have been one of divergence rather than convergence.5
Under CSF III, in contrast, transfers tend to be inversely related to income, with Lisboa e Vale do Tejo receiving less than a fourth of the amount per head of population of the poorer region of Alentejo (see Table 2.2.6).
Although spending under the CSFs may provide an insight on how concerns about regional cohesion have evolved, it is important to note that the size of these expenditures is very small when compared to total government expenditures (as shown in Table 2.2.5, between 1994 and 2006, CSF II funds amounted to only 1.8 per cent of GDP on average). Hence, the regional distribution of CSF expenditures tell us nothing about
3 - The Third Report on Economic and Social Cohesion (2004) confi rms this expectation for the case of the United Kingdom. 4 - Note that taking opportunity of structural funds is quite demanding from a domestic budget point of view. Table 2.2.1 shows that the share of public (national) expenditure has increased markedly from 20 to 37 per cent of the total CSF. Given this pressure, the scope for other national initiatives in similar areas of intervention is very small.5 - Note, however, that the modernisation of the most advanced regions may be highly important in the early stages of development, if the Williamson hypothesis (1965), that regional imbalances fi rst rise and then decrease when the economy meets a growth pa� ern, holds (see Artis and Nixson, 2001).
43
the regional distribution of government expenditures.
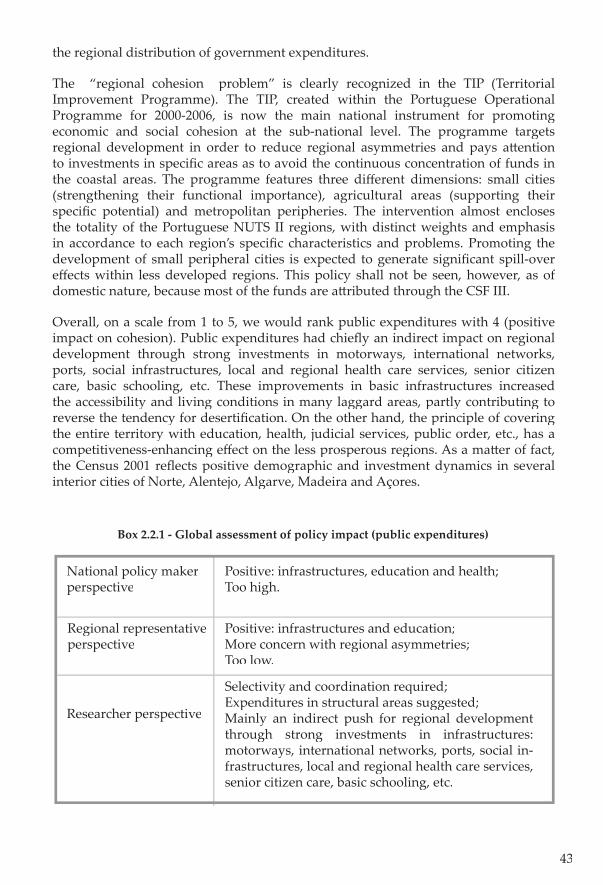
The “regional cohesion problem” is clearly recognized in the TIP (Territorial Improvement Programme). The TIP, created within the Portuguese Operational Programme for 2000-2006, is now the main national instrument for promoting economic and social cohesion at the sub-national level. The programme targets regional development in order to reduce regional asymmetries and pays a� ention to investments in specifi c areas as to avoid the continuous concentration of funds in the coastal areas. The programme features three diff erent dimensions: small cities (strengthening their functional importance), agricultural areas (supporting their specifi c potential) and metropolitan peripheries. The intervention almost encloses the totality of the Portuguese NUTS II regions, with distinct weights and emphasis in accordance to each region’s specifi c characteristics and problems. Promoting the development of small peripheral cities is expected to generate signifi cant spill-over eff ects within less developed regions. This policy shall not be seen, however, as of domestic nature, because most of the funds are a� ributed through the CSF III.
Overall, on a scale from 1 to 5, we would rank public expenditures with 4 (positive impact on cohesion). Public expenditures had chiefl y an indirect impact on regional development through strong investments in motorways, international networks, ports, social infrastructures, local and regional health care services, senior citizen care, basic schooling, etc. These improvements in basic infrastructures increased the accessibility and living conditions in many laggard areas, partly contributing to reverse the tendency for desertifi cation. On the other hand, the principle of covering the entire territory with education, health, judicial services, public order, etc., has a competitiveness-enhancing eff ect on the less prosperous regions. As a ma� er of fact, the Census 2001 refl ects positive demographic and investment dynamics in several interior cities of Norte, Alentejo, Algarve, Madeira and Açores.
Box 2.2.1 - Global assessment of policy impact (public expenditures)
National policy maker perspective
Positive: infrastructures, education and health; Too high.
Researcher perspective
Regional representative perspective
Positive: infrastructures and education;More concern with regional asymmetries;Too low.
Selectivity and coordination required;Expenditures in structural areas suggested;Mainly an indirect push for regional development through strong investments in infrastructures: motorways, international networks, ports, social in-frastructures, local and regional health care services, senior citizen care, basic schooling, etc.
44
Table 2.2.1 - General government expenditures by economic category, 1995 and 2002
Goods and services of which empl. comp. Social benefi ts
1995 2002 1995 2002 1995 2002 % of % of % of % of % of % of % of % of % of % of % of % of
GDP Total GDP Total GDP Total GDP Total GDP Total GDP TotalEU15 20,7 40,4 20,6 43,5 11,1 21,6 10,4 21,9 17,2 33,5 16,4 34,6 PT 18,6 41,3 21,1 45,8 13,6 30,2 15,4 33,4 11,8 26,2 13,0 28,2
Debt interest Other transfers GDFC* + subsidies
1995 2002 1995 2002 1995 2002 % of % of % of % of % of % of % of % of % of % of % of % of GDP Total GDP Total GDP Total GDP Total GDP Total GDP Total EU15 5,4 10,5 3,4 7,2 6,7 13,1 4,2 8,9 2,6 5,1 2,2 4,6PT 6,3 14,0 3,0 6,5 4,4 9,8 5,4 11,7 3,7 8,2 3,4 7,4
Total expenditure1995 2002
% of % of GDP GDP
EU15 51,3 47,4PT 45,0 46,1
Sources: Eurostat, Government sector accountsNote: * Gross Domestic Fixed Capital formation
General services Environment Health
1995 2002 1995 2002 1995 2002 % of % of % of % of % of % of % of % of % of % of % of % of GDP Total GDP Total GDP Total GDP Total GDP Total GDP TotalEU15 8,2 15,5 6,8 14,5 0,8 1,5 0,7 1,5 6,2 11,7 6,3 13,4PT 8,7 19,3 6,7 14,5 0,4 0,9 0,7 1,5 5,3 11,8 6,8 14,7
Education Social protection Other
1995 2002 1995 2002 1995 2002 % of % of % of % of % of % of % of % of % of % of % of % of
GDP Total GDP Total GDP Total GDP Total GDP Total GDP TotalEU15 5,2 9,8 5,0 10,7 20,0 37,8 18,8 40,1 12,5 23,6 9,3 19,8PT 6,5 14,4 7,0 15,2 12,5 27,8 13,6 29,4 11,6 25,8 11,4 24,7 Total
1995 2002 % of % of
GDP GDPEU15 52,9 46,9PT 45,0 46,2
Table 2.2.2 - General government expenditures by function, 1995 and 2001
Sources: Eurostat, Government sector accountsNote: EU15 includes an estimate for Spain in 1995
45
Table 2.2.3Expenditure on pensions and unemployment benefi ts in percentage of total social benefi ts,
1995 and 2000
Old age pensions* 1995 2000** 44,8 46,4 41,7 45,6
Unemployment benefi ts 1995 2000** 8,4 6,3 5,4 3,8
EU15PT
Sources: Eurostat, ESSPROSNote: * Old-age pensions include survivors benefi ts; ** provisional or estimated data
Table 2.2.4Community support framework II expenditures by co-fi nancing entity and region, 1994-2006
Sources: Community Support Framework (CSF) II and III, own calculationsNotes: 1 we use the average of population for the period between 1995 and 1999;
2 we use the average of population for the years 2000 and 2001
CSF II (1994 - 1999) CSF III (2000 - 2006)
106 103 of which 106 103 of which euros euros
Norte 2.893,2 0,803 77,6 22,4 3.918 4.327,3 1,187 62,8 37,2
Centro 2.047,4 1,162 80,6 19,4 2.191 2.693,3 1,511 63,5 36,5
Lisboa
e Vale 4.171,9 1,223 82,1 17,9 3.025 2.523,1 0,730 57,4 42,6
do Tejo
Alentejo 328,7 0,623 81,2 18,8 348 1.751,4 3,321 62,2 37,8
Algarve 173,1 0,463 74,7 25,3 185 707,1 1,816 64,1 35,9
Açores 75,3 0,316 60,3 39,7 224 1.098,1 4,606 77,8 22,2
Madeira 285,1 1,157 66,1 33,9 285 1.086,7 4,430 64,8 35,2
Portugal 9.974,7 0,929 79,7 20,3 10.291 14.187,0 1,380 63,3 36,7
Tota
l
Per C
apita
1
% o
f C
omm
unita
ry
Com
mun
itary
Fund
s
% o
f Pu
blic
Expe
nditu
re
Number Number Number of
Projects
Tota
l
Per C
apita
2
% o
f C
omm
unita
ryFu
nds
% o
f Pu
blic
Expe
nditu
reNUTS II
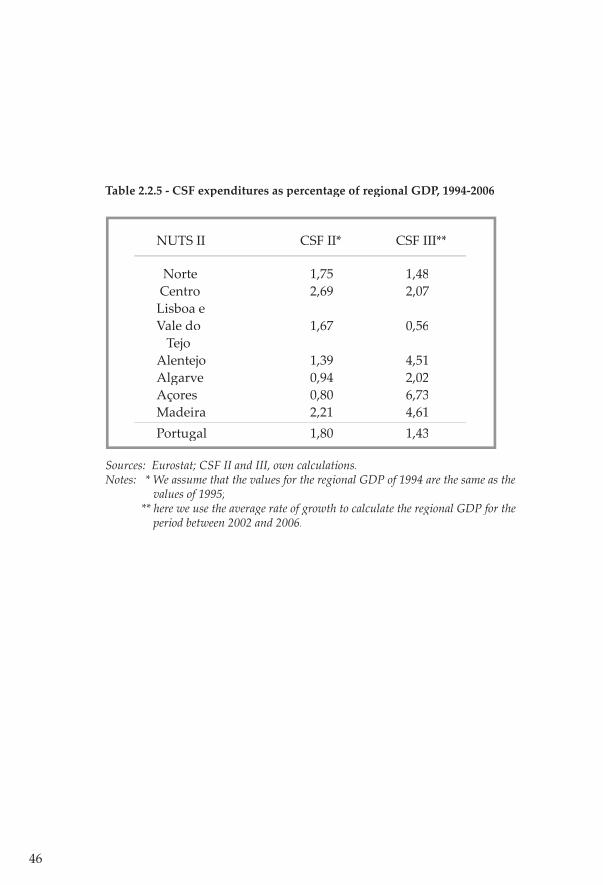
46
Table 2.2.5 - CSF expenditures as percentage of regional GDP, 1994-2006
Sources: Eurostat; CSF II and III, own calculations.Notes: * We assume that the values for the regional GDP of 1994 are the same as the values of 1995; ** here we use the average rate of growth to calculate the regional GDP for the period between 2002 and 2006.
NUTS II CSF II* CSF III**
Norte 1,75 1,48 Centro 2,69 2,07 Lisboa e Vale do 1,67 0,56 Tejo Alentejo 1,39 4,51 Algarve 0,94 2,02 Açores 0,80 6,73 Madeira 2,21 4,61 Portugal 1,80 1,43

47
CSF II funds as percentage ofCSF II funds as percentage ofregional GDP
Total regional GDP Total regional GDP per capita
3,0
2,5
2,0
1,5
1,0
0,5
0,0
80,070,060,050,040,030,020,010,00,0
Nor
te
Cen
tro
Lisb
oa e
val
e d
o Te
jo
Ale
ntej
o
Alg
arve
Mad
eira
Aço
res
Port
ugal
Figure 2.2.1 - CSF as percentage of regional GDP and total regional GDP per capita, 1994-2006
Sources: Eurostat; CSF II and III, own calculations. Notes: We use the population average for the period between 1995 and 1999; the values are in 103
euros; we assume that the values for the regional GDP of 1994 are the same as the values of 1995.
140,0
120,0
100,0
80,0
60,0
40,0
20,0
0,0
8,08,07,07,06,06,05,05,04,04,03,03,02,02,01,01,00,00,0
CSF III funds as percentage ofregional GDP
Total regional GDP per capita
Nor
teN
orte
Cen
tro
Cen
tro
Lisb
oa e
val
eLi
sboa
e v
ale
do
Tejo
do
Tejo
Ale
ntej
oA
lent
ejo
Alg
arve
Alg
arve
Mad
eira
Mad
eira
Aço
res
Aço
res
Port
ugal
Port
ugal
Sources: Eurostat; CSF II and III, own calculations. Notes: We use the population average for the period between 1995 and 1999; the GDP pc values are in 103 euros; we assume that the values for the regional GDP of 1994 are the same as the 1995 values; here we use the average rate of growth to calculate the regional GDP for the period between 2002 and 2006.
Tota
l reg
iona
l GD
P pe
r cap
ita
CSF
II fu
nds
as p
erce
ntag
e of
regi
onal
GD
P
Tota
l reg
iona
l GD
P pe
r cap
ita
CSF
II fu
nds
as p
erce
ntag
e of
regi
onal
GD
P
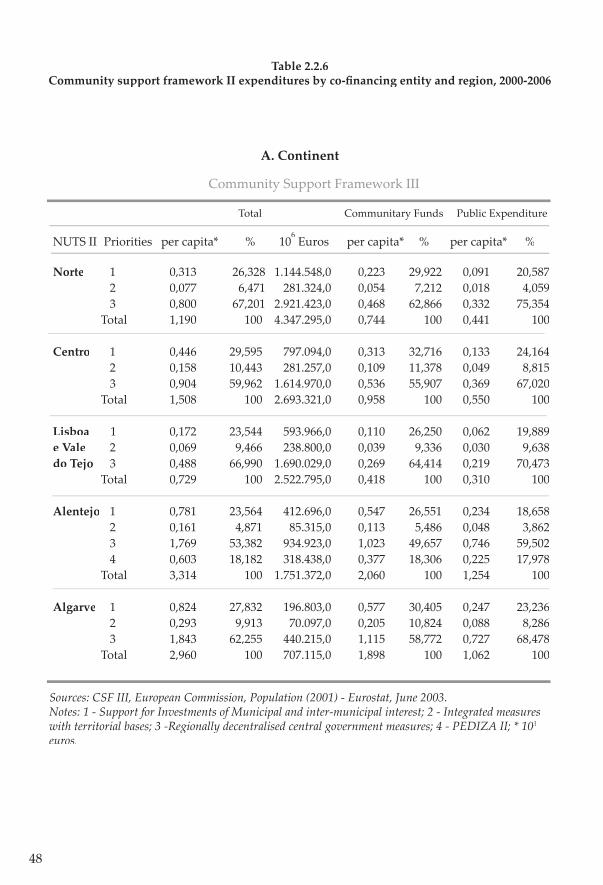
48
Community Support Framework III Total Communitary Funds Public Expenditure
NUTS II Priorities per capita* % 106 Euros per capita* % per capita* %
Norte 1 0,313 26,328 1.144.548,0 0,223 29,922 0,091 20,587 2 0,077 6,471 281.324,0 0,054 7,212 0,018 4,059 3 0,800 67,201 2.921.423,0 0,468 62,866 0,332 75,354 Total 1,190 100 4.347.295,0 0,744 100 0,441 100
Centro 1 0,446 29,595 797.094,0 0,313 32,716 0,133 24,164 2 0,158 10,443 281.257,0 0,109 11,378 0,049 8,815 3 0,904 59,962 1.614.970,0 0,536 55,907 0,369 67,020 Total 1,508 100 2.693.321,0 0,958 100 0,550 100
Lisboa 1 0,172 23,544 593.966,0 0,110 26,250 0,062 19,889e Vale 2 0,069 9,466 238.800,0 0,039 9,336 0,030 9,638do Tejo 3 0,488 66,990 1.690.029,0 0,269 64,414 0,219 70,473 Total 0,729 100 2.522.795,0 0,418 100 0,310 100
Alentejo 1 0,781 23,564 412.696,0 0,547 26,551 0,234 18,658 2 0,161 4,871 85.315,0 0,113 5,486 0,048 3,862 3 1,769 53,382 934.923,0 1,023 49,657 0,746 59,502 4 0,603 18,182 318.438,0 0,377 18,306 0,225 17,978 Total 3,314 100 1.751.372,0 2,060 100 1,254 100
Algarve 1 0,824 27,832 196.803,0 0,577 30,405 0,247 23,236 2 0,293 9,913 70.097,0 0,205 10,824 0,088 8,286 3 1,843 62,255 440.215,0 1,115 58,772 0,727 68,478 Total 2,960 100 707.115,0 1,898 100 1,062 100
Sources: CSF III, European Commission, Population (2001) - Eurostat, June 2003. Notes: 1 - Support for Investments of Municipal and inter-municipal interest; 2 - Integrated measures with territorial bases; 3 -Regionally decentralised central government measures; 4 - PEDIZA II; * 103
euros.
A. Continent
Table 2.2.6 Community support framework II expenditures by co-fi nancing entity and region, 2000-2006
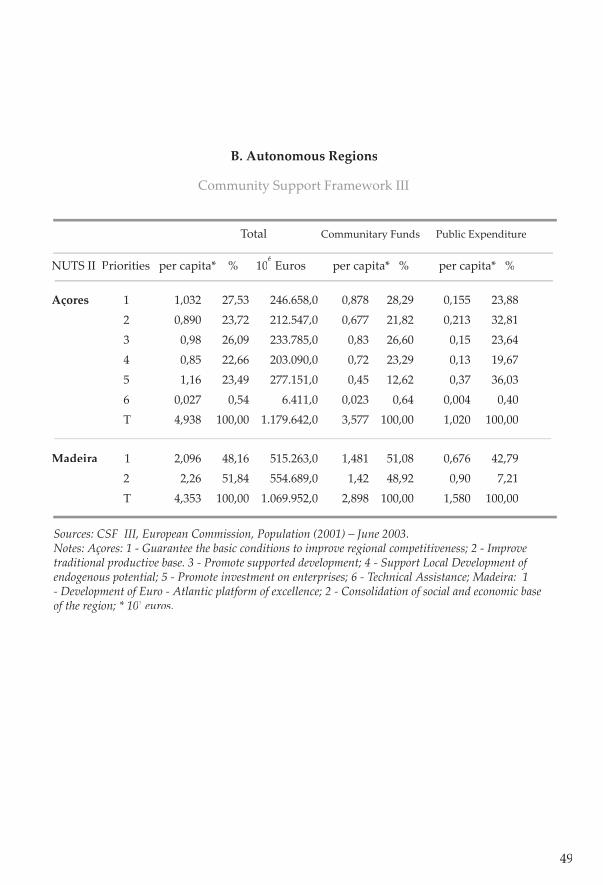
49
B. Autonomous Regions
Community Support Framework III
Total Communitary Funds Public Expenditure
NUTS II Priorities per capita* % 106 Euros per capita* % per capita* %
Açores 1 1,032 27,53 246.658,0 0,878 28,29 0,155 23,88 2 0,890 23,72 212.547,0 0,677 21,82 0,213 32,81 3 0,98 26,09 233.785,0 0,83 26,60 0,15 23,64 4 0,85 22,66 203.090,0 0,72 23,29 0,13 19,67 5 1,16 23,49 277.151,0 0,45 12,62 0,37 36,03 6 0,027 0,54 6.411,0 0,023 0,64 0,004 0,40 T 4,938 100,00 1.179.642,0 3,577 100,00 1,020 100,00
Madeira 1 2,096 48,16 515.263,0 1,481 51,08 0,676 42,79 2 2,26 51,84 554.689,0 1,42 48,92 0,90 7,21 T 4,353 100,00 1.069.952,0 2,898 100,00 1,580 100,00
Sources: CSF III, European Commission, Population (2001) – June 2003.Notes: Açores: 1 - Guarantee the basic conditions to improve regional competitiveness; 2 - Improve traditional productive base. 3 - Promote supported development; 4 - Support Local Development of endogenous potential; 5 - Promote investment on enterprises; 6 - Technical Assistance; Madeira: 1 - Development of Euro - Atlantic platform of excellence; 2 - Consolidation of social and economic base of the region; * 103 euros.
50
2.3 - TRANSFERS FROM CENTRAL GOVERNMENT
2.3.1 - TRANSFERS TO MUNICIPALITIES
In Portugal taxes are predominantly levied centrally. The burden of regional and local taxes represents less than fi ve per cent of general government revenues. Municipalities are hence largely dependent on transfers from the state.
Transfers to municipalities follow the Principle of “Equilíbrio Financeiro”, which envisages a “fair” distribution of resources between the State and municipalities (vertical balance) and between municipalities of the same type (horizontal balance). The Portuguese Constitution establishes in its article 254, n.º 1 that: “Municipalities shall share, in their own right, and in accordance with the law, the revenue from direct taxation”. Transfers to municipalities correspond to a percentage of the arithmetic average of the receipts from those taxes.
A 1999 law extinguished the FEF (Financial Balance Fund) and created three new instruments: the FGM (Municipalities’ General Fund) that allocates resources to the regions, largely based on regional needs for spending per capita (this value is assessed centrally, involving the estimation of a standardised level of service per head of population), but with additional criteria that benefi t two island regions; a second fund, with explicit cohesion objectives (FCM - Municipal Cohesion Fund) is limited to less developed municipalities, while two additional funds aim ensure that the municipalities have adequate resources (FFF - Freguesias (smallest unit of local government) Financing Fund - and the FBM - Municipal Base Fund -, created in 2002).
The municipalities’ participation in the state taxes is currently defi ned by the LFL (Local Finance Law) [Law n. º 94/2001, of 20 August]. At present, the fi nancial State transfers to municipalities are processed through the four distinct instruments referred above:
i) FGM (Municipalities’ General Fund)
This fund is a� ributed to all municipalities. The total of the FGM is distributed through three territorial units (Continent, Autonomous Region of Açores and Autonomous Region of Madeira), as a direct function of criteria like resident population or area. The distribution to the municipalities inside territorial units obeys to a variety of diff erent criteria, such as: resident population under 15 years, the number of municipalities within the region, area, or related to the receipts from direct taxes.
The fund aims to endow the municipalities with fi nancial conditions adjusted to their performance in terms of eff ected investment relative to a� ributions. The fund envisages a vertical balance in function of the type and amount of carried-out investments per item.
ii) FCM (Municipal Cohesion Fund)
This fund acts as a complement to the FGM and aims at strengthening municipal
51
cohesion and fostering the correction of asymmetries, to the benefi t of the less developed municipalities (horizontal balance). It is to be received only by those municipalities with a development index below the national average. The assignments of this fund have been inherited from the Cohesion Fund created by the European Union in favour of its less developed Member States, namely in Southern Europe.
iii) FBM (Municipal Base Fund)
This fund was created in 2002. It aims at endowing the municipalities with minimum fi nancial capacity for their functioning. It is distributed on equal terms and by equal amounts.
iv) FFF (Freguesias Financing Fund)
When the law of local fi nance began to be enforced, the freguesias (smallest administrative units in Portugal) at the outset benefi ted from an autonomous fund corresponding to 2.5 per cent of the simple arithmetic average of the receipts from direct (personal and corporate) and indirect (VAT - Value Added Tax) taxation, assigned for FFF. This fund is distributed through three territorial units (Continent, Açores and Madeira) in accordance with criteria such as resident population or area. The public transfer under item c) of paragraph 12 of the Budget Law of 2001 was substituted in the following years by FBM. Regional distribution follows the same criteria.
As shown in tables 2.3.1.1 and 2.3.1.2 and in fi gure 2.3.1.1, transfers to municipalities are higher in per capita terms in the least prosperous regions, Alentejo and Açores. In percentage of regional GDP, public transfers ranged between 0.67 per cent (for the richer area of Lisboa e Vale do Tejo) and 3.04 per cent (the poor region of Alentejo) of regional GDP in 1995, and between 0.78 per cent (for the richer area of Lisboa e Vale do Tejo) and 4.24 per cent (the poor region of Alentejo) in 2001. Taking all these funds together, public transfers to municipalities in terms of regional GDP increased steadily over the period 1995-2001 (with exception of the year 1998), with a higher increase in the poorer regions (Alentejo and Açores). Looking at fi gure 2.3.1, it is evident that by 2001 the transfers per capita were relatively higher in the less prosperous regions of Alentejo and Açores.
According to these data and to the policy makers and to regional representatives interviewed, transfers from to municipalities are seen as endowing the la� er with the indispensable minimum fi nancial capacity for their functioning, and to have a positive impact on both economic and social cohesion. The recent changes in the legislation suggest that in the future these transfers will still contribute to reducing regional imbalances. Nevertheless, since the scope for higher funding is limited, the quality of local expenditures and the effi ciency of the location criteria for the distribution of funds among municipalities are of crucial importance.
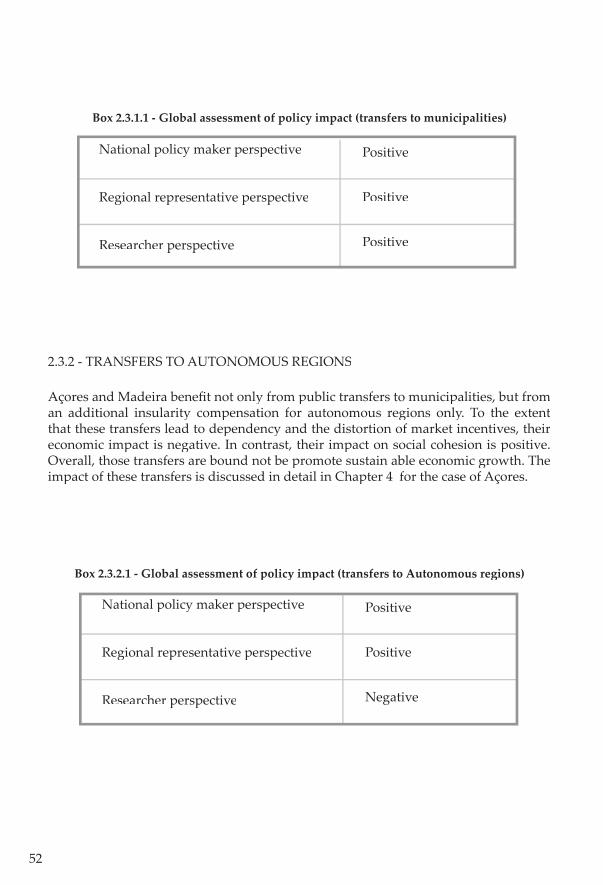
52
Box 2.3.1.1 - Global assessment of policy impact (transfers to municipalities)
National policy maker perspective
Regional representative perspective
Researcher perspective
Positive
Positive
Positive
2.3.2 - TRANSFERS TO AUTONOMOUS REGIONS
Açores and Madeira benefi t not only from public transfers to municipalities, but from an additional insularity compensation for autonomous regions only. To the extent that these transfers lead to dependency and the distortion of market incentives, their economic impact is negative. In contrast, their impact on social cohesion is positive. Overall, those transfers are bound not be promote sustain able economic growth. The impact of these transfers is discussed in detail in Chapter 4 for the case of Açores.
Box 2.3.2.1 - Global assessment of policy impact (transfers to Autonomous regions)
National policy maker perspective
Regional representative perspective
Researcher perspective
Positive
Positive
Negative

53
Sources: OE, DGO, MFNotes: 1 The Fundo de Equilíbrio Financeiro was replaced by Fundo de Coesão Municipal, Fundo Geral
Municipal and Fundo Financiamento das Freguesias in 1999; 2 Alínea c) is a public transfer to municipalities that only exists in 2001, being replaced by FBM
therea� er.
1,23 1,21 1,27 1,30 - - -- - - - 0,32 0,34 0,34- - - - 1,00 1,02 0,93- - - - - 0,12 0,12- - - - - - 0,171,23 1,21 1,27 1,30 1,33 1,48 1,562,68 2,85 2,85 2,90 - - -- - - - 0,70 0,72 0,67- - - - 2,25 1,99 2,04- - - - - 0,22 0,26- - - - - - 0,462,68 2,85 2,85 2,90 2,95 2,94 3,430,67 0,68 0,67 0,66 - - -- - - - 0,07 0,07 0,07- - - - 0,61 0,62 0,57- - - - - 0,06 0,06- - - - - - 0,080,67 0,68 0,67 0,66 0,68 0,75 0,783,04 3,14 3,09 3,79 - - -- - - - 0,61 0,57 0,51- - - - 2,82 3,02 2,65- - - - - 0,30 0,31- - - - - - 0,773,04 3,14 3,09 3,79 3,42 3,89 4,241,82 1,86 1,83 1,74 - - -- - - - 0,20 0,15 0,07- - - - 1,64 1,70 1,51- - - - - 0,15 0,14- - - - - - 0,341,82 1,86 1,83 1,74 1,84 2,00 2,052,60 2,95 2,95 2,87 - - -- - - - 0,88 0,95 1,09- - - - 2,09 2,17 1,59- - - - - 0,24 0,24- - - - - - 0,832,60 2,95 2,95 2,87 2,97 3,35 3,751,46 1,49 1,49 1,44 - - -- - - - 0,50 0,58 0,48- - - - 1,01 1,00 0,93- - - - - 0,12 0,12- - - - - - 0,341,46 1,49 1,49 1,44 1,51 1,70 1,87
NUTS II Funds 1995 1996 1997 1998 1999 2000 2001
FEF1
FCMFGMFFFalínea c)2
TotalFEFFCMFGMFFFalínea c)TotalFEFFCMFGMFFFalínea c)TotalFEFFCMFGMFFFalínea c)TotalFEFFCMFGMFFFalínea c)TotalFEFFCMFGMFFFalínea c)TotalFEFFCMFGMFFFalínea c)Total
Norte
Centro
Lisboa e Vale do Tejo
Alentejo
Algarve
Açores
Madeira
Table 2.3.1.1 - Public transfers to municipalities as percentage of regional GDP, 1995-2001
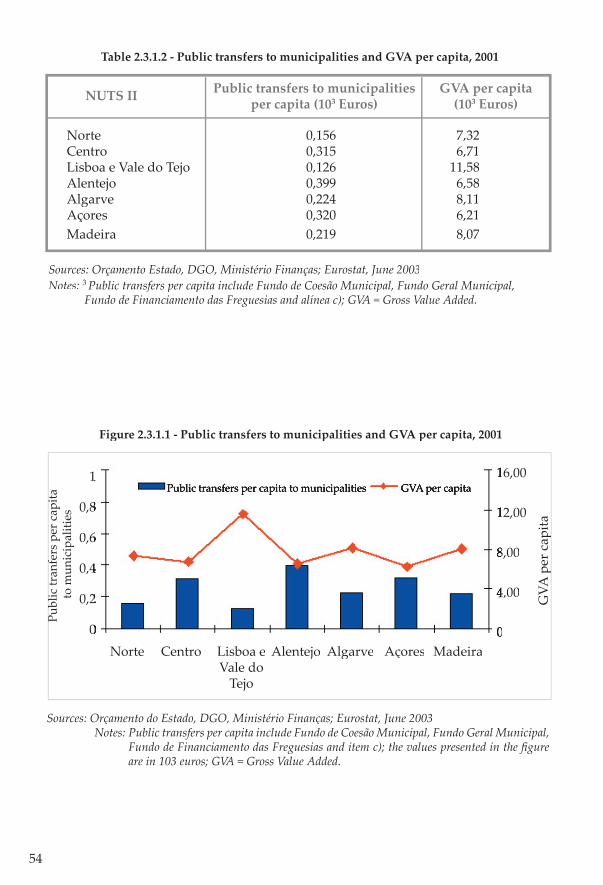
54
Norte 0,156 7,32Centro 0,315 6,71Lisboa e Vale do Tejo 0,126 11,58Alentejo 0,399 6,58Algarve 0,224 8,11Açores 0,320 6,21Madeira 0,219 8,07
NUTS II Public transfers to municipalities per capita (103 Euros)
GVA per capita (103 Euros)
Sources: Orçamento Estado, DGO, Ministério Finanças; Eurostat, June 2003Notes: 3 Public transfers per capita include Fundo de Coesão Municipal, Fundo Geral Municipal, Fundo de Financiamento das Freguesias and alínea c); GVA = Gross Value Added.
Table 2.3.1.2 - Public transfers to municipalities and GVA per capita, 2001
Sources: Orçamento do Estado, DGO, Ministério Finanças; Eurostat, June 2003 Notes: Public transfers per capita include Fundo de Coesão Municipal, Fundo Geral Municipal,
Fundo de Financiamento das Freguesias and item c); the values presented in the fi gure are in 103 euros; GVA = Gross Value Added.
Figure 2.3.1.1 - Public transfers to municipalities and GVA per capita, 2001
11
0,80,8
0,60,6
0,40,4
0,20,2
00
16,0016,00
12,0012,00
8,008,00
4,004,00
00Norte Centro Lisboa e
Vale do Tejo
Alentejo Algarve Açores Madeira
Public transfers per capita to municipalities GVA per capita
GVA
per
cap
itaG
VA p
er c
apita
Publ
ic tr
anfe
rs p
er c
apita
Publ
ic tr
anfe
rs p
er c
apita
to m
unic
ipal
ities
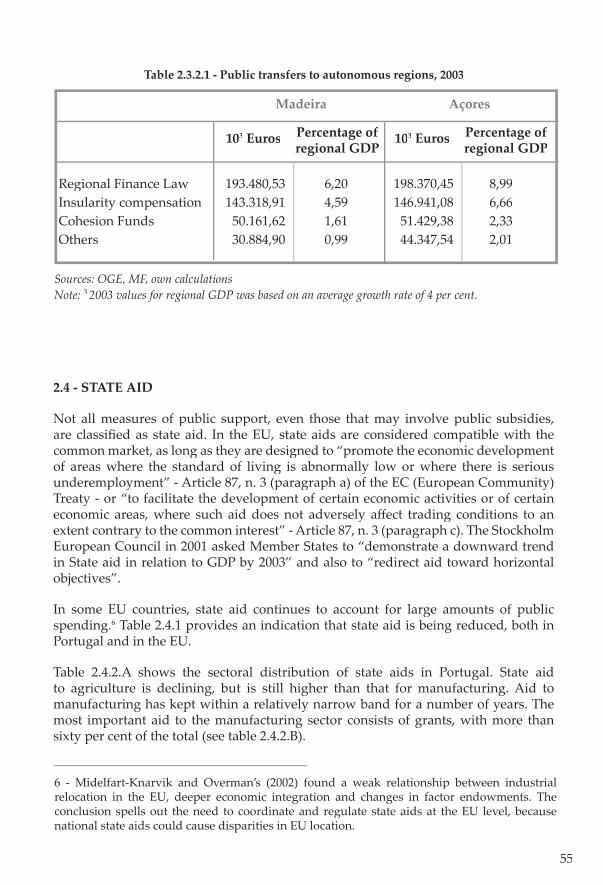
55
Regional Finance Law 193.480,53 6,20 198.370,45 8,99Insularity compensation 143.318,91 4,59 146.941,08 6,66Cohesion Funds 50.161,62 1,61 51.429,38 2,33Others 30.884,90 0,99 44.347,54 2,01
Madeira
103 Euros Percentage of regional GDP
103 Euros Percentage of regional GDP
Açores
Sources: OGE, MF, own calculations Note: 3 2003 values for regional GDP was based on an average growth rate of 4 per cent.
Table 2.3.2.1 - Public transfers to autonomous regions, 2003
2.4 - STATE AID
Not all measures of public support, even those that may involve public subsidies, are classifi ed as state aid. In the EU, state aids are considered compatible with the common market, as long as they are designed to “promote the economic development of areas where the standard of living is abnormally low or where there is serious underemployment” - Article 87, n. 3 (paragraph a) of the EC (European Community) Treaty - or “to facilitate the development of certain economic activities or of certain economic areas, where such aid does not adversely aff ect trading conditions to an extent contrary to the common interest” - Article 87, n. 3 (paragraph c). The Stockholm European Council in 2001 asked Member States to “demonstrate a downward trend in State aid in relation to GDP by 2003” and also to “redirect aid toward horizontal objectives”.
In some EU countries, state aid continues to account for large amounts of public spending.6 Table 2.4.1 provides an indication that state aid is being reduced, both in Portugal and in the EU.
Table 2.4.2.A shows the sectoral distribution of state aids in Portugal. State aid to agriculture is declining, but is still higher than that for manufacturing. Aid to manufacturing has kept within a relatively narrow band for a number of years. The most important aid to the manufacturing sector consists of grants, with more than sixty per cent of the total (see table 2.4.2.B).
6 - Midelfart-Knarvik and Overman’s (2002) found a weak relationship between industrial relocation in the EU, deeper economic integration and changes in factor endowments. The conclusion spells out the need to coordinate and regulate state aids at the EU level, because national state aids could cause disparities in EU location.
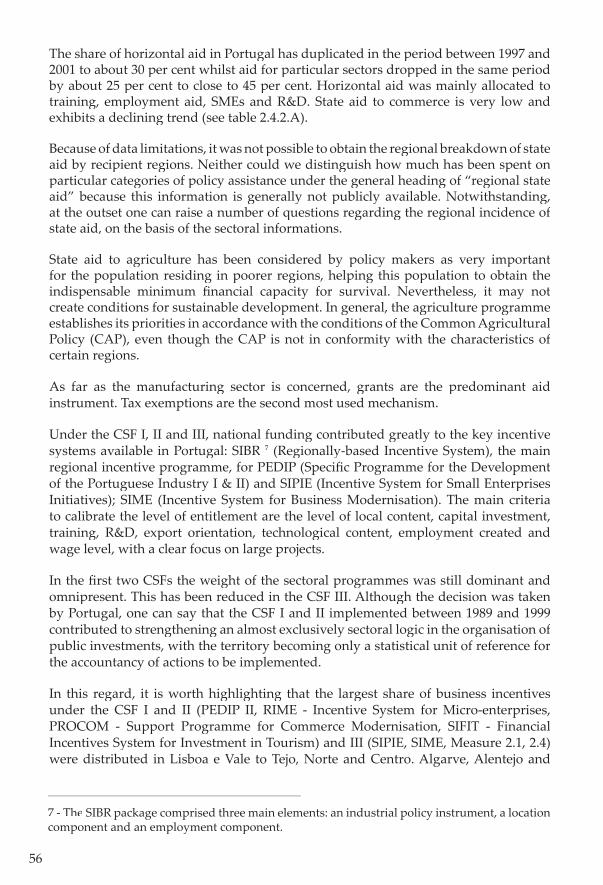
56
The share of horizontal aid in Portugal has duplicated in the period between 1997 and 2001 to about 30 per cent whilst aid for particular sectors dropped in the same period by about 25 per cent to close to 45 per cent. Horizontal aid was mainly allocated to training, employment aid, SMEs and R&D. State aid to commerce is very low and exhibits a declining trend (see table 2.4.2.A).
Because of data limitations, it was not possible to obtain the regional breakdown of state aid by recipient regions. Neither could we distinguish how much has been spent on particular categories of policy assistance under the general heading of “regional state aid” because this information is generally not publicly available. Notwithstanding, at the outset one can raise a number of questions regarding the regional incidence of state aid, on the basis of the sectoral informations.
State aid to agriculture has been considered by policy makers as very important for the population residing in poorer regions, helping this population to obtain the indispensable minimum fi nancial capacity for survival. Nevertheless, it may not create conditions for sustainable development. In general, the agriculture programme establishes its priorities in accordance with the conditions of the Common Agricultural Policy (CAP), even though the CAP is not in conformity with the characteristics of certain regions.
As far as the manufacturing sector is concerned, grants are the predominant aid instrument. Tax exemptions are the second most used mechanism.
Under the CSF I, II and III, national funding contributed greatly to the key incentive systems available in Portugal: SIBR 7 (Regionally-based Incentive System), the main regional incentive programme, for PEDIP (Specifi c Programme for the Development of the Portuguese Industry I & II) and SIPIE (Incentive System for Small Enterprises Initiatives); SIME (Incentive System for Business Modernisation). The main criteria to calibrate the level of entitlement are the level of local content, capital investment, training, R&D, export orientation, technological content, employment created and wage level, with a clear focus on large projects.
In the fi rst two CSFs the weight of the sectoral programmes was still dominant and omnipresent. This has been reduced in the CSF III. Although the decision was taken by Portugal, one can say that the CSF I and II implemented between 1989 and 1999 contributed to strengthening an almost exclusively sectoral logic in the organisation of public investments, with the territory becoming only a statistical unit of reference for the accountancy of actions to be implemented.
In this regard, it is worth highlighting that the largest share of business incentives under the CSF I and II (PEDIP II, RIME - Incentive System for Micro-enterprises, PROCOM - Support Programme for Commerce Modernisation, SIFIT - Financial Incentives System for Investment in Tourism) and III (SIPIE, SIME, Measure 2.1, 2.4) were distributed in Lisboa e Vale to Tejo, Norte and Centro. Algarve, Alentejo and
7 - The SIBR package comprised three main elements: an industrial policy instrument, a location component and an employment component.
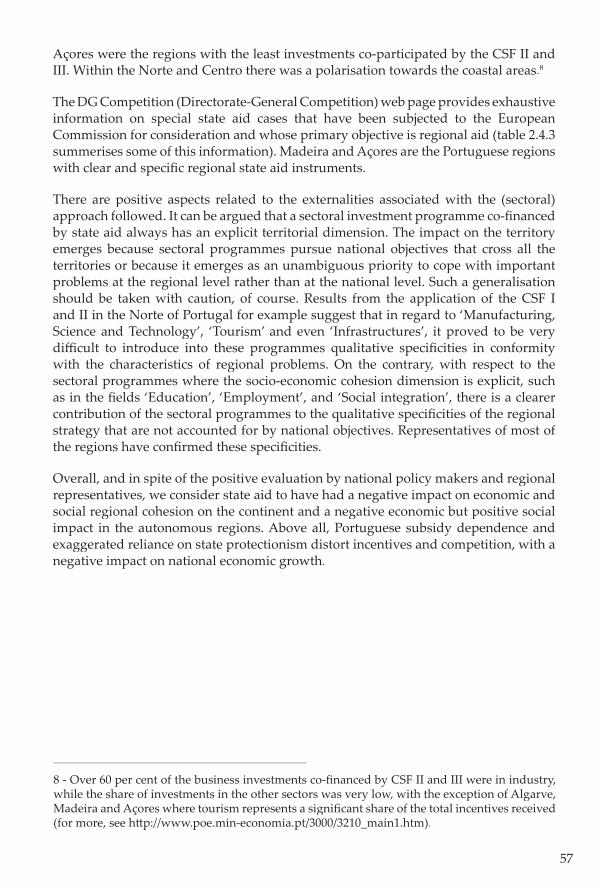
57
8 - Over 60 per cent of the business investments co-fi nanced by CSF II and III were in industry, while the share of investments in the other sectors was very low, with the exception of Algarve, Madeira and Açores where tourism represents a signifi cant share of the total incentives received (for more, see h� p://www.poe.min-economia.pt/3000/3210_main1.htm).
Açores were the regions with the least investments co-participated by the CSF II and III. Within the Norte and Centro there was a polarisation towards the coastal areas.8
The DG Competition (Directorate-General Competition) web page provides exhaustive information on special state aid cases that have been subjected to the European Commission for consideration and whose primary objective is regional aid (table 2.4.3 summerises some of this information). Madeira and Açores are the Portuguese regions with clear and specifi c regional state aid instruments.
There are positive aspects related to the externalities associated with the (sectoral) approach followed. It can be argued that a sectoral investment programme co-fi nanced by state aid always has an explicit territorial dimension. The impact on the territory emerges because sectoral programmes pursue national objectives that cross all the territories or because it emerges as an unambiguous priority to cope with important problems at the regional level rather than at the national level. Such a generalisation should be taken with caution, of course. Results from the application of the CSF I and II in the Norte of Portugal for example suggest that in regard to ‘Manufacturing, Science and Technology’, ‘Tourism’ and even ‘Infrastructures’, it proved to be very diffi cult to introduce into these programmes qualitative specifi cities in conformity with the characteristics of regional problems. On the contrary, with respect to the sectoral programmes where the socio-economic cohesion dimension is explicit, such as in the fi elds ‘Education’, ‘Employment’, and ‘Social integration’, there is a clearer contribution of the sectoral programmes to the qualitative specifi cities of the regional strategy that are not accounted for by national objectives. Representatives of most of the regions have confi rmed these specifi cities.
Overall, and in spite of the positive evaluation by national policy makers and regional representatives, we consider state aid to have had a negative impact on economic and social regional cohesion on the continent and a negative economic but positive social impact in the autonomous regions. Above all, Portuguese subsidy dependence and exaggerated reliance on state protectionism distort incentives and competition, with a negative impact on national economic growth.
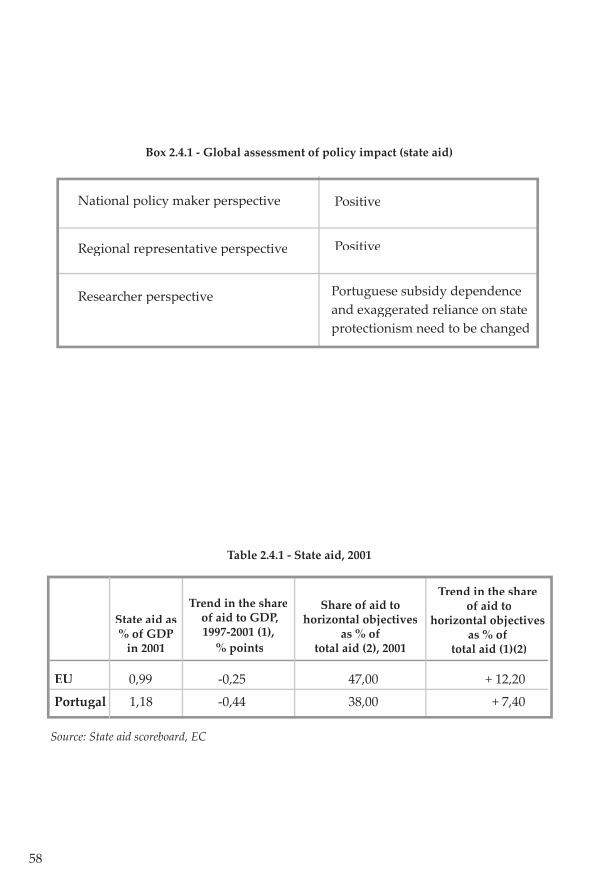
58
Box 2.4.1 - Global assessment of policy impact (state aid)
National policy maker perspective
Regional representative perspective
Researcher perspective
Positive
Positive
Portuguese subsidy dependence and exaggerated reliance on state protectionism need to be changed
Source: State aid scoreboard, EC
Table 2.4.1 - State aid, 2001
EU 0,99 -0,25 47,00 + 12,20
Portugal 1,18 -0,44 38,00 + 7,40
State aid as % of GDP
in 2001
Trend in the share of aid to GDP, 1997-2001 (1),
% points
Share of aid to horizontal objectives
as % of total aid (2), 2001
Trend in the share of aid to
horizontal objectives as % of
total aid (1)(2)
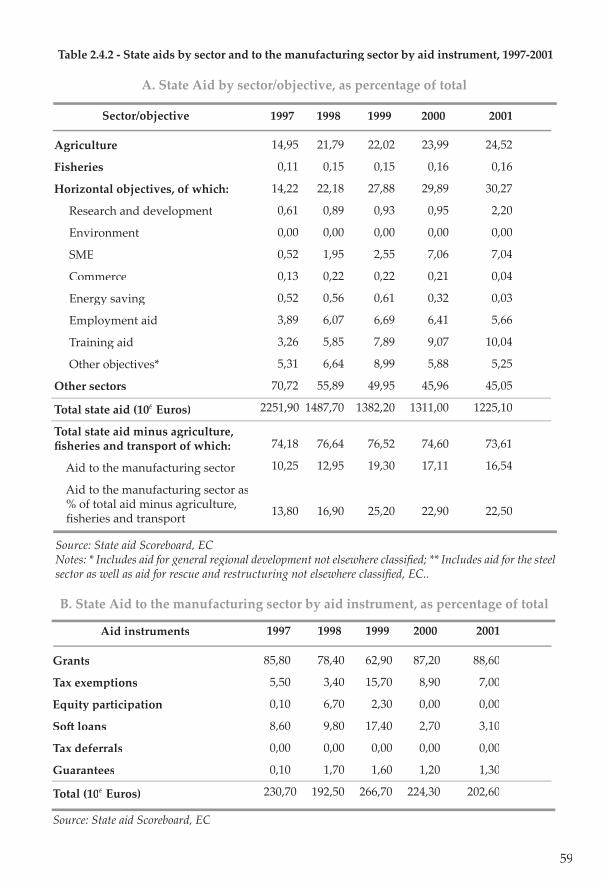
59
Table 2.4.2 - State aids by sector and to the manufacturing sector by aid instrument, 1997-2001
Source: State aid Scoreboard, EC Notes: * Includes aid for general regional development not elsewhere classifi ed; ** Includes aid for the steel sector as well as aid for rescue and restructuring not elsewhere classifi ed, EC..
14,95 21,79 22,02 23,99 24,52
0,11 0,15 0,15 0,16 0,16
14,22 22,18 27,88 29,89 30,27
0,61 0,89 0,93 0,95 2,20
0,00 0,00 0,00 0,00 0,00
0,52 1,95 2,55 7,06 7,04
0,13 0,22 0,22 0,21 0,04
0,52 0,56 0,61 0,32 0,03
3,89 6,07 6,69 6,41 5,66
3,26 5,85 7,89 9,07 10,04
5,31 6,64 8,99 5,88 5,25
70,72 55,89 49,95 45,96 45,05
2251,90 1487,70 1382,20 1311,00 1225,10
74,18 76,64 76,52 74,60 73,61
10,25 12,95 19,30 17,11 16,54
13,80 16,90 25,20 22,90 22,50
Sector/objective
Agriculture
Fisheries
Horizontal objectives, of which:
Research and development
Environment
SME
Commerce
Energy saving
Employment aid
Training aid
Other objectives*
Other sectors
Total state aid (106 Euros)
Total state aid minus agriculture, fi sheries and transport of which:
Aid to the manufacturing sector
Aid to the manufacturing sector as % of total aid minus agriculture, fi sheries and transport
A. State Aid by sector/objective, as percentage of total
1997 1998 1999 2000 2001
85,80 78,40 62,90 87,20 88,60
5,50 3,40 15,70 8,90 7,00
0,10 6,70 2,30 0,00 0,00
8,60 9,80 17,40 2,70 3,10
0,00 0,00 0,00 0,00 0,00
0,10 1,70 1,60 1,20 1,30
230,70 192,50 266,70 224,30 202,60
Aid instruments
Grants
Tax exemptions
Equity participation
So� loans
Tax deferrals
Guarantees
Total (106 Euros)
B. State Aid to the manufacturing sector by aid instrument, as percentage of total
Source: State aid Scoreboard, EC
1997 1998 1999 2000 2001
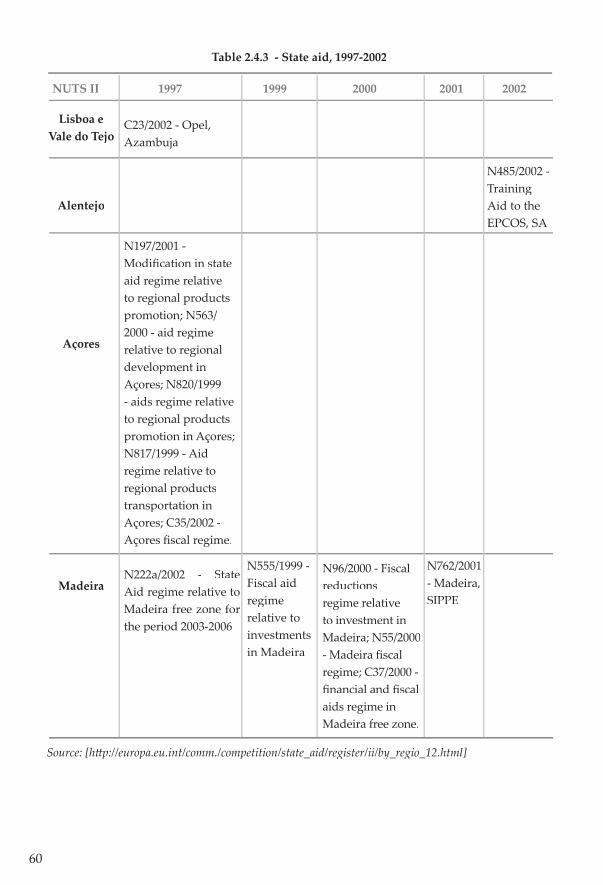
60
Table 2.4.3 - State aid, 1997-2002
N485/2002 - Training Aid to the EPCOS, SA
NUTS II 1997 1999 2000 2001 2002
C23/2002 - Opel, Azambuja
N197/2001 - Modifi cation in state aid regime relative to regional products promotion; N563/2000 - aid regime relative to regional development in Açores; N820/1999 - aids regime relative to regional products promotion in Açores; N817/1999 - Aid regime relative to regional products transportation in Açores; C35/2002 - Açores fi scal regime.
N222a/2002 - State Aid regime relative to Madeira free zone for the period 2003-2006
Lisboa e Vale do Tejo
Alentejo
Açores
MadeiraN555/1999 - Fiscal aid regime relative to investments in Madeira
N96/2000 - Fiscal reductions regime relative to investment in Madeira; N55/2000 - Madeira fi scal regime; C37/2000 -fi nancial and fi scal aids regime in Madeira free zone.
N762/2001 - Madeira, SIPPE
Source: [h� p://europa.eu.int/comm./competition/state_aid/register/ii/by_regio_12.html]
61
2.5 - EMPLOYMENT AND SOCIAL POLICIES
Over the recent years, the Portuguese labour market has depicted a globally positive performance. Between 1998 and 2001, employment in Portugal has grown at an annual average of 1.8 per cent. The employment evolution continues to be more favourable in Portugal than in the rest of the European Union (EU). The unemployment rate in Portugal, still signifi cantly below the EU average, was 4.1 per cent in 2001, up 0.1 per cent from the year before. In the EU, the unemployment rate has dropped from 8.1 to 7.6 per cent in the same period. Since the beginning of 2002, the evolution of the unemployment rate has been signifi cantly negative, due to cyclical reasons.
In March 2000, the Lisbon European Council elaborated a strategy stressing the importance of a “fully decentralised approach, applied in line with the principle of subsidiarity in which the Union, the Member States, the regional and local levels, as well as the social partners and civil society will be actively involved, using variable forms of partnership”. The Commission supports the role that local and regional actors can play in the development of new forms of governance in the Union. However, the level of involvement of regional and local actors in the European Employment Strategy depends on the political and constitutional structures of each Member State, and has to be determined in accordance with the principle of subsidiarity.
Since 1997 the annual PNE (National Employment Plan) has been profoundly articulated with the interventions supported by structural community fi nancial instruments - ERDF (European Regional Development Fund), EAGGF and FIFG (Financial Instrument for Fisheries Guidance), the cohesion fund and in particular the ESF (European Social Fund). The PNE has the following general objectives, following the European Strategy for Employment:
=> Promoting youths’ adequate transition to working life;
=> Promoting the social-professional inclusion and comba� ing long-term unemployment and exclusion;
=> Improving manpower’s basic professional qualifi cations under the perspective of life-long learning, in particular in regard to permanent vocational training and the fi ght against technological inadequacy;
=> Promoting the quality of employment, namely through the reinforcement of labour protection, notably at the labour security level.
However, the Portuguese employment policy still focuses strongly on unemployment benefi ts, as illustrated by table 2.5.1 for the period 1995-2001. Besides measures for the disabled, the most important instruments of employment policy are, fi rst, labour market training and, second, unemployment compensation. All these instruments are managed by a Central Authority (MSST - Labour and Social Security Ministry).
The support for the unemployed in Portugal consists of the a� ribution of the following compensations:
i) Unemployment Benefi ts;
62
ii) Unemployment Social Benefi ts (prior or subsequent to the Unemployment Benefi t).
These compensations have two purposes: to compensate the benefi ciary for the lack of remuneration or the reduction because of partial timework earnings and to promote job creation.
In July 1997 the RMG (Guaranteed Minimum Income) was introduced, aimed at guaranteeing minimum living conditions to the benefi ciaries and their families in situations of serious economic needs. This income is usually complemented by some measures that aim at the gradual social and professional insertion of the benefi ciaries and the members of their families. This model is not included in the system of non-contributory benefi ts.
Regarding the regional incidence of the employment policy, table 2.5.2 illustrates the diff erent rate of coverage of unemployment benefi ts. The support for the unemployed in Portugal depicts an unequal regional distribution. On the positive extreme there is the region Centro where about 77 per cent of the unemployed enjoyed this fi nancial support, whereas in the Alentejo about 70 per cent of the unemployed did not benefi t from compensation. Still, one needs to draw a� ention to the positive evolution in the effi ciency of this instrument. Recall that the two columns are not added.
As for unemployment social benefi ts, table 2.5.2 highlights the discrepancy between the regions of Alentejo and Algarve relatively to the gross rate of unemployment benefi t coverage. This situation results from the large importance of the agricultural sector in employment and is a consequence of the fact that many people do not qualify for unemployment benefi ts due to insuffi cient social security contributions. In these cases, the solution is the a� ribution of social unemployment benefi t. For that reason the gross coverage rate of this instrument is very high in those two regions.
The RMG is a measure in frank expansion: since its implementation the a� ributed sums have increased every year, having passed from 43.834 thousand euros in 1997 to 261.774 thousand euros in 1999. In terms of the evolution of the number of individuals to whom this income was a� ributed (titular of the RMG) in 1997 there were 14.184 benefi ciaries of this measure while in 1999 this number reached 153 885.
An analysis of the annual evolution of the number of RMG benefi ciaries as per cent of the active population (table 2.5.3) leads to the conclusion that Açores is the region that tops the list. Norte, Lisboa e Vale do Tejo and Centro are the regions that over fi ve years (1998 at 2002) featured the greatest number of benefi ciaries. In 2002, these three regions had about 86.1 per cent of the total number of existing benefi ciaries in Portugal (Norte: 37 per cent; Lisboa e Vale do Tejo: 27.2 per cent; Centro: 21.9 per cent).
Programmes promoting self-employment and stimulating measures to integrate disabled workers are managed by central authorities. Training measures are disaggregated between those allocated to employed and to unemployed workers. Both programmes are managed by the IEFP (Professional Training and Employment Institute), in two ways: direct management and participated management. This la� er one consists of a partnership of the IEFP with some private professional training centres.
63
Table 2.5.4 shows the number of unemployed workers participating in these training programmes in per cent of the total enrolled unemployed in the period 1999-2001, by region. The regional distribution of this indicator is very similar, with the exception of the case of Alentejo. In almost all regions this percentage is very low, suggesting an insuffi cient application of this measure.
The Portuguese PNE subscribed to the logic that promoting employment and fi ghting unemployment is more eff ective when employment policies are implemented at regional and local levels. This strategy allows a response more adapted to the actual problems, a more effi cient use of resources, a be� er coordination of initiatives and a greater co-responsibility of the public and private sectors that can contribute to this objective.9
Public employment services are managed by IEFP regional delegations, although legislation and general decisions are taken by the central government. As one can see from table 2.6.5, the percentage of people who found a job a� er being enrolled as unemployed is very low in all regions, a fact that may be interpreted as indicating some ineffi ciency of this employment measure.
There are also some local programmes of employment promotion such as the RRE (Regional Networks for Employment), PTE (Territorial Employment Pacts) and ILDE (Regional Initiatives for Development and Employment). Community initiatives, such as Employment and Urban, also grant central authorities greater fl exibility in applying active policy strategies.
In the autonomous Regions of Açores and Madeira, the support of the Structural Funds, within CSF, is prevailing, integrated in the corresponding regional operational programmes of multi-fund character (PEDRAA - Specifi c Programme for the Development of Açores Autonomous Region - and PROPAM - Specifi c Programme for the Development of Madeira Autonomous Region - in the Açores and Madeira, respectively). In regions where employment and unemployment problems are more pressing, the establishment of specifi c intervention programmes seems justifi ed, featuring commi� ed and comprehensive action in regard to the factors that determine employment evolution, strengthened by means of interventions conceived and stimulated in compliance with the specifi cities of those regions. Within this context, the regional employment plans of Alentejo and the Metropolitan area of Porto have been created and are being currently implemented; the regional employment plan of Trás-os-Montes and Alto Douro has been concluded in 2001.
The institutionalisation of the Employment Social Market (ESM) in July 1996 allowed for some already existing activities (occupational programmes and protecting employment) to join new initiatives. In the fi ve-year period 1998-2002, action was assured through a set of programmes and measures: schools’ workshops (1996); joint initiatives and protocols (1996); insertion in companies (1998); digital Alentejo (1999); employment insertion (2000).
9 - Figueiredo (2001) compares the fi ve Portuguese regions and concludes that there has been a cumulative process of divergence, caused by diff erentials in regional competitiveness. He argues that national policy only contributes to reducing regional disparities to the extent that it contains a local dimension.
64
These Programmes have a distinct nature, integrating components of occupational, formative and employment nature. What they have in common is the fact that they strengthen employment conditions for the unemployed who a� end the training.
The application of training and employment policies in territorial forms is at the origin of the creation of employment regional networks, initiated in 1998 and concluded in December 2000, as a strategic option, with the set up of the last one for the region of Lisboa.
With the local one being the privileged sphere for fi nding an answer to problems, the Regional Networks are an intervention model which aims to use all the resources and potentialities of each region, stimulating the partnership for local development, for employment promotion and for professional qualifi cation.
The promotion of human resources, the creation of conditions that allow for the fi xing of the population and the combat of exclusion are especially highlighted in the context of the objectives stipulated for the regional networks.
The success of the interventions necessarily depends on the intermediaries’ capacity to make the best out of each region. Functioning in networks and partnerships, the decentralised services of the public administration, the municipalities, trade unions and employers and local development associations and other local agents come to increase signifi cantly the possibilities to get an up-to-date diagnosis of the reality where they intervene, thereby giving value eff ectively to all the local resources (human, material and fi nancial).
The construction of RRE and PTE constitutes the framework for some existing instruments of regional and local policies with incidence in the areas of employment, training and poverty and social exclusion. Thus, these measures stimulate the development of positive and dynamic relations for the training of competences and job fi nding.
Based on the data, the interviews with national policy makers and regional representatives, the employment policy had a highly positive impact on regional cohesion. However, one should take into account potential trade-off s and pay due a� ention to and control the application of this policy to the extent that the short-term impact may well be to distort the incentives to work, thus impairing the functioning of the labour market in the long run, especially with respect to those with lower skills and in less developed regions. From a researcher point of view, economic and social policies have a positive impact on economic and social cohesion, respectively, given that training in particular enhances the growth potential while social problems are addressed.
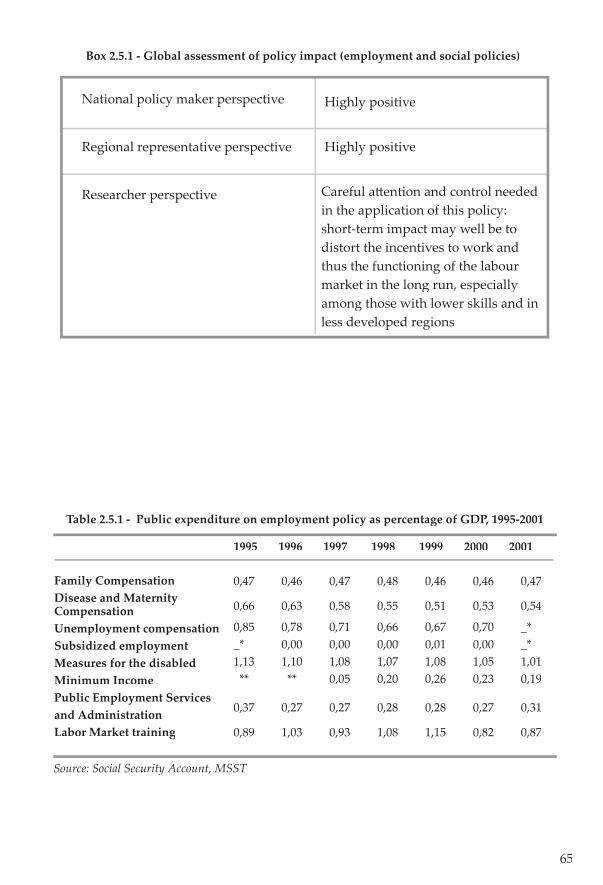
65
Box 2.5.1 - Global assessment of policy impact (employment and social policies)
National policy maker perspective
Regional representative perspective
Researcher perspective
Highly positive
Highly positive
Careful a� ention and control needed in the application of this policy: short-term impact may well be to distort the incentives to work and thus the functioning of the labour market in the long run, especially among those with lower skills and in less developed regions
1995 1996 1997 1998 1999 2000 2001
0,47 0,46 0,47 0,48 0,46 0,46 0,47
0,66 0,63 0,58 0,55 0,51 0,53 0,54
0,85 0,78 0,71 0,66 0,67 0,70 _*_* 0,00 0,00 0,00 0,01 0,00 _*1,13 1,10 1,08 1,07 1,08 1,05 1,01_** _** 0,05 0,20 0,26 0,23 0,19
0,37 0,27 0,27 0,28 0,28 0,27 0,31
0,89 1,03 0,93 1,08 1,15 0,82 0,87
Family CompensationDisease and Maternity CompensationUnemployment compensationSubsidized employmentMeasures for the disabledMinimum IncomePublic Employment Services and AdministrationLabor Market training
Table 2.5.1 - Public expenditure on employment policy as percentage of GDP, 1995-2001
Source: Social Security Account, MSST
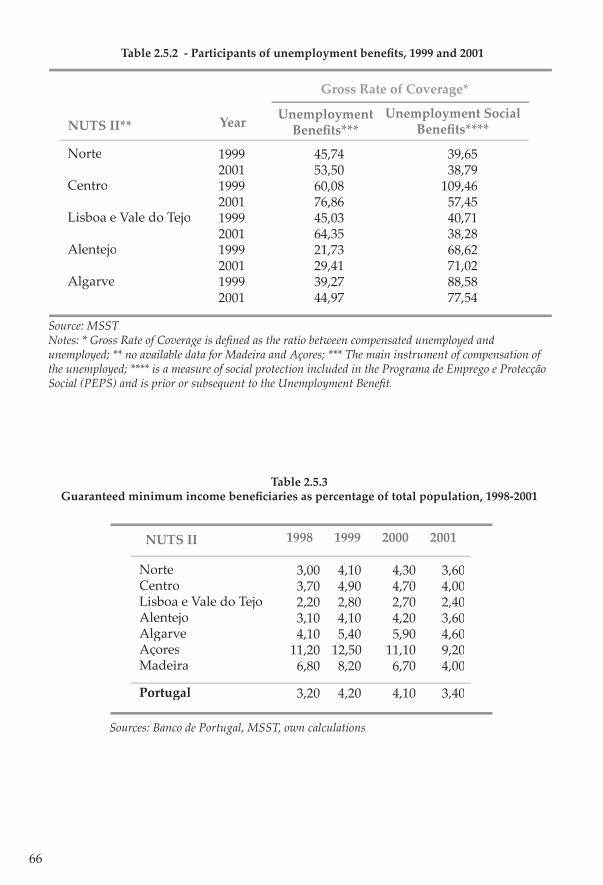
66
Source: MSSTNotes: * Gross Rate of Coverage is defi ned as the ratio between compensated unemployed and unemployed; ** no available data for Madeira and Açores; *** The main instrument of compensation of the unemployed; **** is a measure of social protection included in the Programa de Emprego e Protecção Social (PEPS) and is prior or subsequent to the Unemployment Benefi t.
Table 2.5.2 - Participants of unemployment benefi ts, 1999 and 2001
1999 45,74 39,652001 53,50 38,791999 60,08 109,462001 76,86 57,451999 45,03 40,712001 64,35 38,281999 21,73 68,622001 29,41 71,021999 39,27 88,582001 44,97 77,54
NUTS II**Unemployment
Benefi ts***Unemployment Social
Benefi ts****
Norte
Centro
Lisboa e Vale do Tejo
Alentejo
Algarve
Year
Gross Rate of Coverage*
3,00 4,10 4,30 3,60 3,70 4,90 4,70 4,00 2,20 2,80 2,70 2,40 3,10 4,10 4,20 3,60 4,10 5,40 5,90 4,6011,20 12,50 11,10 9,20 6,80 8,20 6,70 4,00
3,20 4,20 4,10 3,40
NUTS II
NorteCentroLisboa e Vale do TejoAlentejoAlgarveAçoresMadeira
Portugal
1998 1999 2000 2001
Sources: Banco de Portugal, MSST, own calculations
Table 2.5.3Guaranteed minimum income benefi ciaries as percentage of total population, 1998-2001
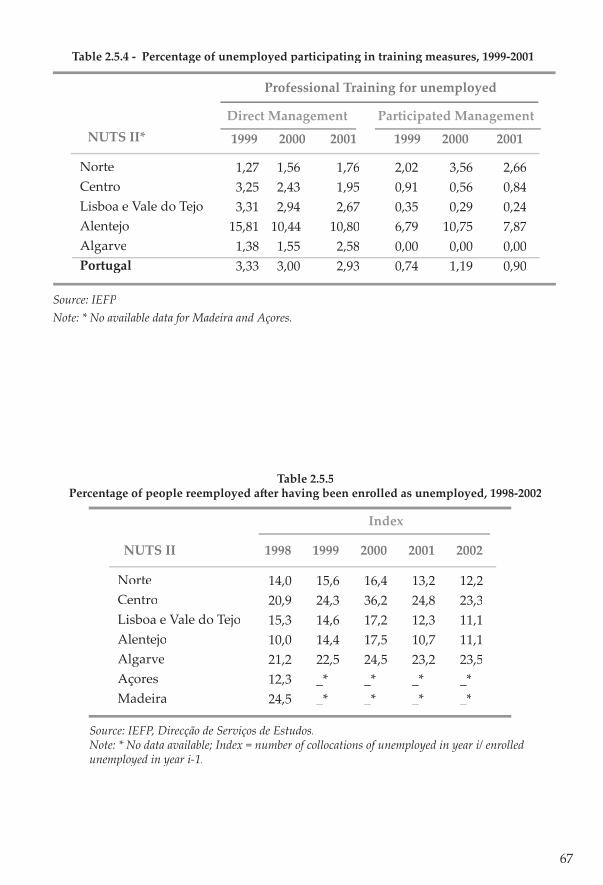
67
Source: IEFPNote: * No available data for Madeira and Açores.
Table 2.5.4 - Percentage of unemployed participating in training measures, 1999-2001
1,27 1,56 1,76 3,25 2,43 1,95 3,31 2,94 2,6715,81 10,44 10,80 1,38 1,55 2,58 3,33 3,00 2,93
NUTS II*
NorteCentroLisboa e Vale do TejoAlentejoAlgarvePortugal
1999 2000 2001
2,02 3,56 2,660,91 0,56 0,840,35 0,29 0,246,79 10,75 7,870,00 0,00 0,000,74 1,19 0,90
1999 2000 2001
Direct Management Participated Management
Professional Training for unemployed
Source: IEFP, Direcção de Serviços de Estudos.Note: * No data available; Index = number of collocations of unemployed in year i/ enrolled unemployed in year i-1.
14,0 15,6 16,4 13,2 12,220,9 24,3 36,2 24,8 23,315,3 14,6 17,2 12,3 11,110,0 14,4 17,5 10,7 11,121,2 22,5 24,5 23,2 23,512,3 _* _* _* _*24,5 _* _* _* _*
NUTS II
NorteCentroLisboa e Vale do TejoAlentejoAlgarveAçoresMadeira
1998 1999 2000 2001 2002
Index
Table 2.5.5Percentage of people reemployed a� er having been enrolled as unemployed, 1998-2002

68
Employment Social MarketPact for SolidarityIncentives for employment creation (ILDE, SAJE)Support for enterprise promotion and development (BIC)Implementation of the Regional Network for Employment Three Territorial Pacts for Employment (approved by the European Union)Programme of Promotion of Casual employment in the Public AdministrationCreation of Fund to Support Innovators Projects (FSIP)PEDIP measure for support of delocation of industry to inland regions
Some Instruments of Employment Policy
Source: IEFP
Table 2.5.6 - Employment policy, 1998-2002
Source: MSST Notes: * No available data for Madeira and Açores; the values presented with in table are in percentage of the total.
Table 2.5.3Guaranteed minimum income benefi ciaries as percentage of total population, 1998-2001
34,83 35,18 35,10 11,70 12,36 13,05 31,35 33,83 34,23 18,44 15,09 13,88 3,68 3,54 3,75
29.852,00 35.911,00 35.854,00
NUTS II*
NorteCentroLisboa e Vale do TejoAlentejoAlgarve
Total (103 Euros)
1999 2000 2001
69
2.6 - SCIENCE AND TECHNOLOGY
Up to the 1990s, there was no clear innovation and technology policy in Portugal. More recently, technology policy received strong support as one of the structural policies needed to improve the prospects of economic development in Portugal. The Government supported the development of local technological capabilities with programmes geared towards technical assistance for local fi rms, incentives for foreign direct investment, quality and training, and the modernisation of infrastructure. Additional funds have been allocated in Portugal through the EC Structural Funds for the Objective I regions and from Research and Technological Development Framework Programmes (RTD). R&D has signifi cantly progressed over the past decade thanks to support provided by EC programmes that have fi nanced more than half of the cost of the R&D infrastructure. Portugal evolved signifi cantly over the last few years.10
Over the 1990s, Portugal launched a number of specifi c programmes for the development of scientifi c and technological activities: CIENCIA (Programme for Creation of National Infra-structures in Science and R&D); Programme “Ciência Viva” launched in 1996-1997 by the Ministry of Science and Technology with the purpose of promoting the ‘scientifi c culture’ of the Portuguese population, stimulating the geminating of scientifi c institutions and schools and the scientifi c occupation of young people in their vacations in institutions of scientifi c research.
Education was singled out has the cornerstone of Portuguese science and technology policy in the 1990s. The strong public investment in higher education, via PRAXIS XXI (Operational intervention for Science and Technology) and PRODEP (Educative Development Programme for Portugal), the MCT (Science and Technology Ministry), which had been more focussed on science than on technology, strengthened its support for higher education and for university-based scientifi c research. The creation of a Science and Higher Education Ministry bears witness to the blurring of boundaries between science and higher education. A further improvement is expected from the government’s creation of the Commission on the Teaching of Mathematics and Sciences, which aims at increasing the future supply of science and engineering graduates.
In 2000 the government launched PROINOV, an integrated programme which emphasises policy instruments of a horizontal nature, clearly in line with EC objectives and policy recommendations. In regard to the development of a regulatory framework conducive to innovation, it pursued four main actions: First, the launching of the measures on R&D activities by consortia (see PT 21 in table 2.6.1), under the POCTI (Science, Technology and Innovation Operational Programme) and POSI (Information Society Operational Programme). Second, the measure on mobilising programmes for technological development (PT 23) - the PASI (Action Plan for the Information Society) - under the POE (Operational Programme for the Economy), also aimed at supporting consortia between S&T (Science and Technology) activities and companies to carry out
10 - Rodrigues, Neves and Mira Godinho’s (2003) book puts together the main contributions of the expert team involved in the launching and development of PROINOV (Integrated Programme on Innovation Support), including three main parts dealing with the broader perspective, the organisation, and the ways on how to make the Portuguese innovation system more dynamic.

70
projects concerning the development of new, innovative products and/or processes. Third, the creation of the GAPIs (Industrial Property Support Offi ces - PT 26) whose aim is to provide support on the strategic use of intellectual property rights. The fourth relevant measure was the revision of the fi nancial incentives for investment in R&D (PT 4). This confi rms a trend towards an increased use of tax instead of fi nancial incentives, in accordance with the suggestion by the European Community. In addition, actions were also launched to encourage the creation and growth of innovative enterprises (objective 3). A document by the Economics Ministry spells out the intention to launch a network for providing technology support services to companies. Similarly, the recent PME Digital Initiative envisages the creation of information and technical assistance networks (RIAT - Information and Technical Assistance Networks) to help SMEs to respond to challenges related to the digital economy. Another area where some eff orts are being undertaken is the support and development of incubator services for fi rms.
Life-long learning is another area where some progress was made. A major step was the agreement reached last year at the Social Concertation Council, on employment, the labour market, education and training, where specifi c reference was made to the importance of life-long learning. To that end, the Government has introduced policies to improve the qualifi cation and employability of adults and to develop a national system for training, certifi cation and development of competences in telecommunica-tions and information technologies.
While the national government did not have any specifi c regional technology strategy, it is possible to explore the regional incidence of main science and technology policy actions in the recent past.
Over time, the Government supported the development of local technological capabilities with programmes geared towards technical assistance to local fi rms, incentives for foreign direct investment (FDI), training, and the modernisation of infrastructure. The territorial impact of these measures emerges from its sectoral component, and is largely a� ributable to the location of the initiatives that receive funding. In general, the most developed regions will have the most dynamic socio-economic actors. Hence, at the outset this suggests that the most developed regions are the ones which will benefi t most from these initiatives.
The decentralised component of the operational regional interventions in the domain of science, technology and innovation corresponds to the CIENCIA programme that envisages to strike a balance such that 50 per cent of the investment is outside the Lisboa e Vale do Tejo region, chiefl y for the development of actions related to scientifi c and technological culture, especially to the creation of “centros de ciência viva” at the district level. The creation of these centres is based on the set-up of local partnerships between cities and scientifi c institutions, technological educational institutions, companies with R&D activities, centres, or other public and private entities with activities of formation and scientifi c and technological diff usion. During the period under review there was an upsurge in the debate on innovation policy, mainly spurred by initiatives taken by the President of the Republic – the ‘Innovation Week’ and the launching of COTEC (Business Association for Innovation). The launching of COTEC also contributed to an increase in public awareness of innovation.
Nowadays there are two main groups of activities to stimulate and co-ordinate regional
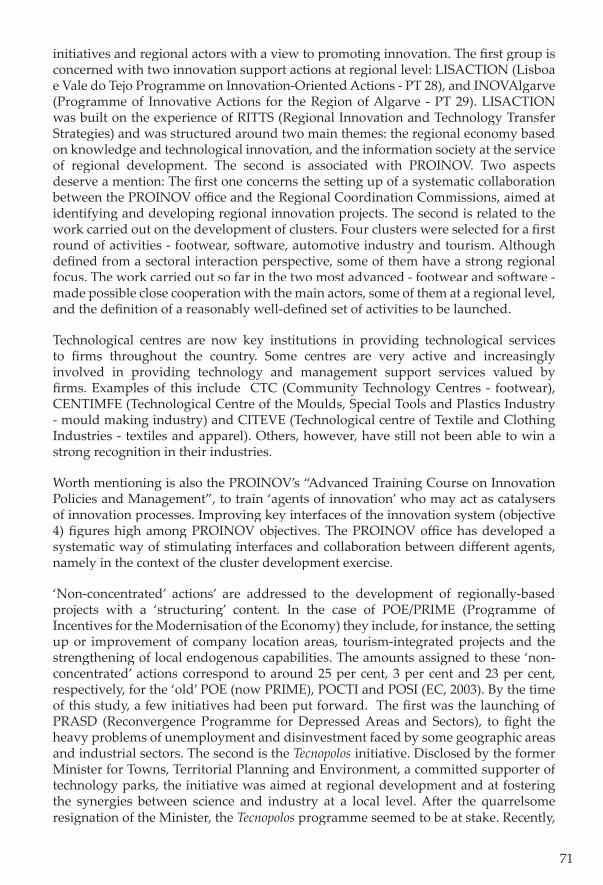
71
initiatives and regional actors with a view to promoting innovation. The fi rst group is concerned with two innovation support actions at regional level: LISACTION (Lisboa e Vale do Tejo Programme on Innovation-Oriented Actions - PT 28), and INOVAlgarve (Programme of Innovative Actions for the Region of Algarve - PT 29). LISACTION was built on the experience of RITTS (Regional Innovation and Technology Transfer Strategies) and was structured around two main themes: the regional economy based on knowledge and technological innovation, and the information society at the service of regional development. The second is associated with PROINOV. Two aspects deserve a mention: The fi rst one concerns the se� ing up of a systematic collaboration between the PROINOV offi ce and the Regional Coordination Commissions, aimed at identifying and developing regional innovation projects. The second is related to the work carried out on the development of clusters. Four clusters were selected for a fi rst round of activities - footwear, so� ware, automotive industry and tourism. Although defi ned from a sectoral interaction perspective, some of them have a strong regional focus. The work carried out so far in the two most advanced - footwear and so� ware - made possible close cooperation with the main actors, some of them at a regional level, and the defi nition of a reasonably well-defi ned set of activities to be launched.
Technological centres are now key institutions in providing technological services to fi rms throughout the country. Some centres are very active and increasingly involved in providing technology and management support services valued by fi rms. Examples of this include CTC (Community Technology Centres - footwear), CENTIMFE (Technological Centre of the Moulds, Special Tools and Plastics Industry - mould making industry) and CITEVE (Technological centre of Textile and Clothing Industries - textiles and apparel). Others, however, have still not been able to win a strong recognition in their industries.
Worth mentioning is also the PROINOV’s “Advanced Training Course on Innovation Policies and Management”, to train ‘agents of innovation’ who may act as catalysers of innovation processes. Improving key interfaces of the innovation system (objective 4) fi gures high among PROINOV objectives. The PROINOV offi ce has developed a systematic way of stimulating interfaces and collaboration between diff erent agents, namely in the context of the cluster development exercise.
‘Non-concentrated’ actions’ are addressed to the development of regionally-based projects with a ‘structuring’ content. In the case of POE/PRIME (Programme of Incentives for the Modernisation of the Economy) they include, for instance, the se� ing up or improvement of company location areas, tourism-integrated projects and the strengthening of local endogenous capabilities. The amounts assigned to these ‘non-concentrated’ actions correspond to around 25 per cent, 3 per cent and 23 per cent, respectively, for the ‘old’ POE (now PRIME), POCTI and POSI (EC, 2003). By the time of this study, a few initiatives had been put forward. The fi rst was the launching of PRASD (Reconvergence Programme for Depressed Areas and Sectors), to fi ght the heavy problems of unemployment and disinvestment faced by some geographic areas and industrial sectors. The second is the Tecnopolos initiative. Disclosed by the former Minister for Towns, Territorial Planning and Environment, a commi� ed supporter of technology parks, the initiative was aimed at regional development and at fostering the synergies between science and industry at a local level. A� er the quarrelsome resignation of the Minister, the Tecnopolos programme seemed to be at stake. Recently,
72
however, the new Minister assured that it would be implemented soon. A fi nal reference is due to the re-launching of the Oporto Science and Technology Park. This will involve an investment of €12 million. Besides the Maia pole (branch) already in place, it will have two others in Taipas and Feira which will focus on automotive technology.
Overall, the territorial impact of these policies is largely a� ributable to the location of the initiatives that receive the funding. In general, the most developed regions have the most dynamic socio-economic actors. Therefore, at the outset one may expect suggest that the most developed regions are the ones which will benefi t most from these initiatives.
Table 2.6.1 summarises the policy measures envisaged by Portuguese government targeting of R&D, while table 2.6.2 provides a positive qualitative evaluation of the Portuguese policy according to EU policy priority actions.
Public R&D expenditures are a good indicator of the existence of voluntary policies directed at specifi c regions. Table 2.6.3 shows a continuous increase in the share of public budget R&D as a percentage of GDP and as per cent of Portuguese government budget.
Table 2.6.4 displays total GERD (Gross Expenditure on R&D) in the Portuguese NUTS II regions in per cent of regional GDP. With the exception of Madeira, GERD as a percentage of regional GDP has been increasing for all regions. Figure 2.6.1 shows a positive relationship between gross expenditure on R&D in percentage terms of regional GDP and regional GDP per capita.
Traditionally, Lisboa e Vale do Tejo and Centro have been the regions with the highest GERD in per cent of GDP. On the other extreme we fi nd Madeira and Algarve, with the lowest value of GERD as a percentage of regional GDP during the period under consideration. In 1999, exceptionally, Açores was the region with the highest R&D expenditure in per cent of regional GDP (2.62 per cent), refl ecting rather some extraordinary governmental spending than properly a trend.
Business GERD is very low for all regions compared to EU average (see table 2.6.4), registering signifi cant values only in the richest regions of Lisboa e Vale do Tejo, Centro and Norte. The poor performance of Madeira and Açores in this regard is notorious.
As for government expenditure on R&D in the Portuguese regions, table 2.6.4 indicates that there is a signifi cant concentration in Lisboa and Vale do Tejo in the continental part of Portugal. By 1999, government GERD reached 0.32 per cent of regional GDP in Lisboa e Vale do Tejo, with each of the remaining regions receiving less than 0.1 per cent of regional GDP. It is noteworthing that Government GERD is particularly visible in the richest area of Lisboa e Vale do Tejo, and on the Islands, Açores in particular. For the other regions, government GERD never represents more then 0.1 per cent of regional GDP.
A region’s public R&D intensity will also depend heavily on the presence of both university and public and non-profi t research institutes. Up to 2001, the most visible
73
regional eff orts and eff ects of R&D policy regard the national education programme and tertiary education in particular.
Higher education GERD is less concentrated than government GERD. With the exception of the Islands and of Lisboa e Vale do Tejo, higher education GERD accounts for the largest share of total GERD (see table 2.6.4). This fact results from the growth of universities and polytechnic institutes in many regions all over the country. Higher education GERD has increased continuously over the triennial and in 1999 representsover 0.26 per cent of regional GDP for all regions, with the exception of Madeira.
A� er the review on the regional incidence of the Portuguese science and technology policy in recent years, we explore next the current situation in terms of the technological standing of Portugal and of its seven NUTS II regions.
Figure 2.6.2 shows the results for the 2003 SII-1. Finland and Sweden have by far the highest SII-1 and are confi rmed as the European innovation leaders. Spain, Portugal and Greece display the weakest innovation performance. In comparison with the SII 2001, Portugal shi� ed from a “falling behind” to a “catching up” situation.
In 1999 Portugal’s R&D expenditure as a percentage of GDP was 0.77 compared with 1.81 for the EU average. With levels about half of those of the EU average for the supply of new science and engineering (S&E) graduates and population with tertiary education, patent applications and business R&D expenditures are particularly low relative to the EU. These indicators show however shows strong signs of catching up.
The indicator public budget to R&D as a percentage of GDP increased from 0.45 in 1995 to 0.69 in 2002. Regarding education, the positive development is due to the launching of new courses by public and private universities in the fi rst half of the 1990s. In spite of these positive developments, the University remained to some extent closed to the interaction with the outside world. The promotion of the diff usion of knowledge and technologies, although always included in the agenda, was not accomplished.11
In spite of the above improvements, the business sector is among the weaker areas of innovation performance in Portugal.12 High-tech patent applications, business R&D and, to a lesser extent, the employment shares in high-tech services and medium/high-tech manufacturing are all well below the EU average. The government launched several initiatives to promote R&D, but these may take a long time to show results, because Portugal’s specialisation in traditional sectors with low R&D-intensity will take time to change.
11 - There are, however, a few exceptions of interaction between the University and Industry, either directly (namely in the University of Aveiro and Minho) or through inter-face organisations (such as INEGI - Institute of Mechanics Engineering and Industrial Management - in Porto, UNINOVA - Institute for the Development of New Technologies - and INESC - Institute of Engineering of Systems and Computers - in Lisbon, and Institute Pedro Nunes in Coimbra).12 - Amorim (2002) shows that there are signs of change, but much remains to be done regarding the innovative behaviour of fi rms in product and process innovation as well as in complementary organisational modernisation, and interactions between fi rms and external services.
74
Portugal has also improved signifi cantly with respect to two indicators related to the information society: information and communications technology (ICT) expenditures and home Internet access. This suggests that the Portuguese economy is relatively profi cient in adopting new technologies. Growth of home internet access started from low base levels in 1998/99 and was spurred by several government initiatives (e.g. POSI).
It remains to be investigated whether these developments apply equally to the entire country, or whether they have a certain regional specifi city. To address this question, table 2.6.5 displays the technological standing of the Portuguese NUTS II regions. The regional innovation summary indicator shows a strong concentration of technological capacity in a few regions, namely Lisboa and Vale do Tejo and Centro. These are the two regions above the country average. Nevertheless, they both rank below the EU average. Yet, despite statistical similarities some diff erences can be identifi ed between these two regions. The fi rst one, Lisboa e Vale do Tejo, has the best-educated workforce and a relative orientation towards services. It is the region with the highest per capita income in Portugal. The second region, Centro, has a relative orientation towards manufacturing (European Comission, 2003). The region’s per capita income is above the average but below that of Lisboa e Vale do Tejo
Figure 2.6.3 shows that regional technological standing positively by related to GERD as a percentage of regional GDP, while fi gure 2.6.4 shows the relationship between a region’s technological standing and its GDP per capita (EU=100). It suggests a positive relationship between a region’s innovative performance as measured by its technological standing, and its per capita income. Lisboa e Vale do Tejo, the region with the highest GDP per capita, is also the leading Portuguese region in terms of innovative performance. In the European innovation scoreboard (2002 and 2003), Lisboa e Vale do Tejo boasts the highest values for all 14 indicators, with the exception of participation in life-long learning, share of innovative enterprises and innovation expenditures. Açores depicts the lowest values. The high per capita income levels of e.g. Madeira and Algarve, however, do indicate that there are other factors that also generate high incomes.
From a researcher’s point of view it emerges that Portuguese Science and Technology policy did not have an explicit regional imprint until the end of the 1990s. Portugal’s growth trajectory has been determined by the technology imports of various types. It seems that the conditions under which the infl ows of technology can be exploited have changed and that there is an increasing need to introduce matching eff orts on the side of the recipient regions. We also found that the structural funds and the timing of the adjustment processes at the national level exercised signifi cant infl uence on corporate performance and innovation dynamics. For example, structural funds and monetary and exchange rate policies conditioned corporate decisions in terms of the speed of modernisation of production processes and furthermore of the selection of suppliers of equipment and engineering services.
From a researcher perspective, the Science and Technology policy resumes to a negative impact on economic cohesion and a neutral one on social cohesion. The cohesion problem raises the issue of the role of an active technology policy in the catching-up
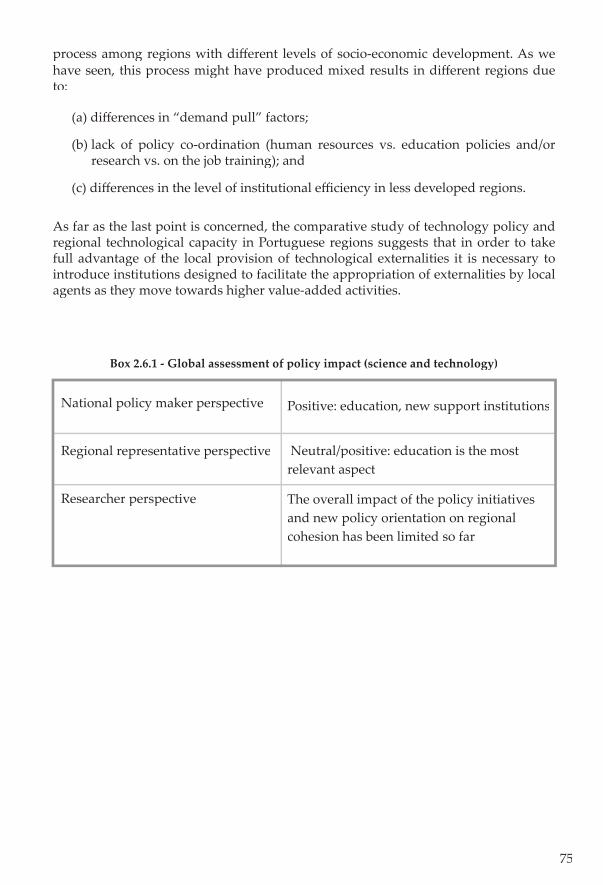
75
process among regions with diff erent levels of socio-economic development. As we have seen, this process might have produced mixed results in diff erent regions due to:
(a) diff erences in “demand pull” factors;
(b) lack of policy co-ordination (human resources vs. education policies and/or research vs. on the job training); and
(c) diff erences in the level of institutional effi ciency in less developed regions.
As far as the last point is concerned, the comparative study of technology policy and regional technological capacity in Portuguese regions suggests that in order to take full advantage of the local provision of technological externalities it is necessary to introduce institutions designed to facilitate the appropriation of externalities by local agents as they move towards higher value-added activities.
Box 2.6.1 - Global assessment of policy impact (science and technology)
National policy maker perspective
Regional representative perspective
Researcher perspective
Positive: education, new support institutions
Neutral/positive: education is the most relevant aspect
The overall impact of the policy initiatives and new policy orientation on regional cohesion has been limited so far
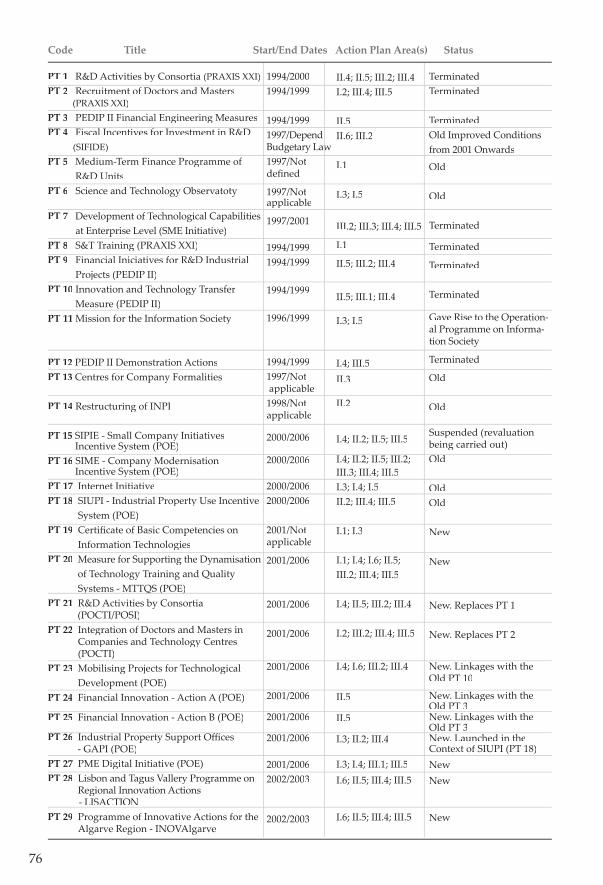
76
PT 1 R&D Activities by Consortia (PRAXIS XXI)PT 2 Recruitment of Doctors and Masters (PRAXIS XXI)PT 3 PEDIP II Financial Engineering MeasuresPT 4 Fiscal Incentives for Investment in R&D
(SIFIDE)PT 5 Medium-Term Finance Programme of
R&D UnitsPT 6 Science and Technology Observatoty
PT 7 Development of Technological Capabilities at Enterprise Level (SME Initiative)
PT 8 S&T Training (PRAXIS XXI)PT 9 Financial Iniciatives for R&D Industrial
Projects (PEDIP II)PT 10 Innovation and Technology Transfer
Measure (PEDIP II)PT 11 Mission for the Information Society
PT 12 PEDIP II Demonstration ActionsPT 13 Centres for Company Formalities
PT 14 Restructuring of INPI
PT 15 SIPIE - Small Company Initiatives Incentive System (POE)PT 16 SIME - Company Modernisation Incentive System (POE)PT 17 Internet InitiativePT 18 SIUPI - Industrial Property Use Incentive
System (POE)PT 19 Certifi cate of Basic Competencies on
Information TechnologiesPT 20 Measure for Supporting the Dynamisation
of Technology Training and Quality Systems - MTTQS (POE)
PT 21 R&D Activities by Consortia (POCTI/POSI)PT 22 Integration of Doctors and Masters in
Companies and Technology Centres (POCTI)
PT 23 Mobilising Projects for Technological Development (POE)
PT 24 Financial Innovation - Action A (POE)
PT 25 Financial Innovation - Action B (POE)
PT 26 Industrial Property Support Offi ces - GAPI (POE)PT 27 PME Digital Initiative (POE)PT 28 Lisbon and Tagus Vallery Programme on
Regional Innovation Actions - LISACTIONPT 29 Programme of Innovative Actions for the
Algarve Region - INOVAlgarve
1994/20001994/1999
1994/19991997/DependBudgetary Law1997/Notdefi ned
1997/Notapplicable
1997/2001
1994/19991994/1999
1994/1999
1996/1999
1994/19991997/Not applicable1998/Not applicable
2000/2006
2000/2006
2000/20062000/2006
2001/Not applicable
2001/2006
2001/2006
2001/2006
2001/2006
2001/2006
2001/2006
2001/2006
2001/20062002/2003
2002/2003
II.4; II.5; III.2; III.4I.2; III.4; III.5
II.5II.6; III.2
I.1
I.3; I.5
III.2; III.3; III.4; III.5
I.1
II.5; III.2; III.4
II.5; III.1; III.4
I.3; I.5
I.4; III.5II.3
II.2
I.4; II.2; II.5; III.5
I.4; II.2; II.5; III.2;III.3; III.4; III.5I.3; I.4; I.5II.2; III.4; III.5
I.1; I.3
I.1; I.4; I.6; II.5; III.2; III.4; III.5
I.4; II.5; III.2; III.4
I.2; III.2; III.4; III.5
I.4; I.6; III.2; III.4
II.5
II.5
I.3; II.2; III.4
I.3; I.4; III.1; III.5I.6; II.5; III.4; III.5
I.6; II.5; III.4; III.5
TerminatedTerminated
TerminatedOld Improved Conditions from 2001 Onwards
Old
Old
Terminated
Terminated
Terminated
Terminated
Gave Rise to the Operation-al Programme on Informa-tion Society
Terminated
Old
Old
Suspended (revaluation being carried out)Old
OldOld
New
New
New. Replaces PT 1
New. Replaces PT 2
New. Linkages with theOld PT 10
New. Linkages with the Old PT 3New. Linkages with theOld PT 3New. Launched in theContext of SIUPI (PT 18)NewNew
New
Code Title Start/End Dates Action Plan Area(s) Status
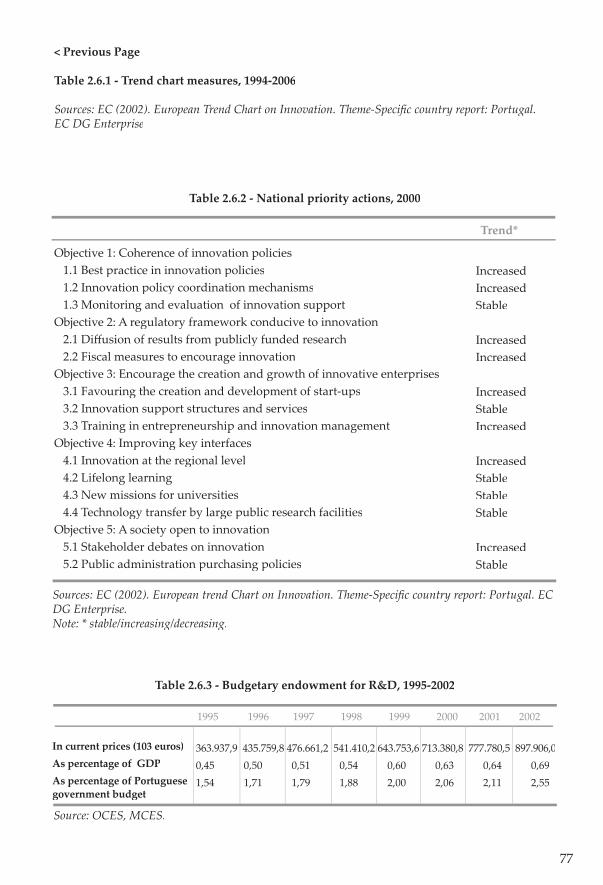
77
< Previous Page
Table 2.6.1 - Trend chart measures, 1994-2006
Sources: EC (2002). European Trend Chart on Innovation. Theme-Specifi c country report: Portugal. EC DG Enterprise
Table 2.6.2 - National priority actions, 2000
Sources: EC (2002). European trend Chart on Innovation. Theme-Specifi c country report: Portugal. EC DG Enterprise. Note: * stable/increasing/decreasing.
Table 2.6.3 - Budgetary endowment for R&D, 1995-2002
Source: OCES, MCES.
363.937,9 435.759,8 476.661,2 541.410,2 643.753,6 713.380,8 777.780,5 897.906,00,45 0,50 0,51 0,54 0,60 0,63 0,64 0,691,54 1,71 1,79 1,88 2,00 2,06 2,11 2,55
In current prices (103 euros)As percentage of GDPAs percentage of Portuguesegovernment budget
1995 1996 1997 1998 1999 2000 2001 2002
IncreasedIncreasedStable
IncreasedIncreased
IncreasedStableIncreased
IncreasedStableStableStable
IncreasedStable
Objective 1: Coherence of innovation policies 1.1 Best practice in innovation policies 1.2 Innovation policy coordination mechanisms 1.3 Monitoring and evaluation of innovation supportObjective 2: A regulatory framework conducive to innovation 2.1 Diff usion of results from publicly funded research 2.2 Fiscal measures to encourage innovationObjective 3: Encourage the creation and growth of innovative enterprises 3.1 Favouring the creation and development of start-ups 3.2 Innovation support structures and services 3.3 Training in entrepreneurship and innovation managementObjective 4: Improving key interfaces 4.1 Innovation at the regional level 4.2 Lifelong learning 4.3 New missions for universities 4.4 Technology transfer by large public research facilitiesObjective 5: A society open to innovation 5.1 Stakeholder debates on innovation 5.2 Public administration purchasing policies
Trend*
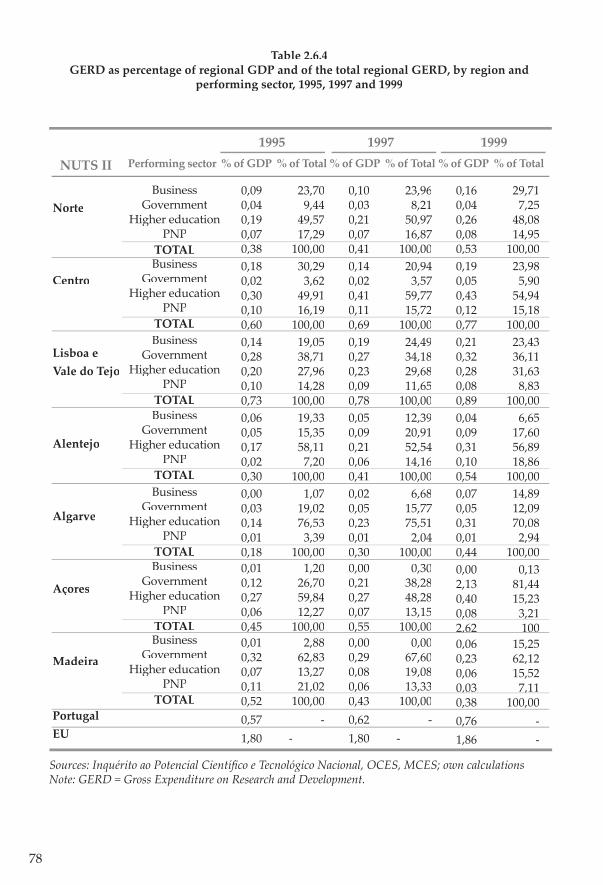
78
Sources: Inquérito ao Potencial Científi co e Tecnológico Nacional, OCES, MCES; own calculationsNote: GERD = Gross Expenditure on Research and Development.
Table 2.6.4GERD as percentage of regional GDP and of the total regional GERD, by region and
performing sector, 1995, 1997 and 1999
0,09 23,700,04 9,440,19 49,570,07 17,290,38 100,000,18 30,290,02 3,620,30 49,910,10 16,190,60 100,000,14 19,050,28 38,710,20 27,960,10 14,280,73 100,000,06 19,330,05 15,350,17 58,110,02 7,200,30 100,000,00 1,070,03 19,020,14 76,530,01 3,390,18 100,000,01 1,200,12 26,700,27 59,840,06 12,270,45 100,000,01 2,880,32 62,830,07 13,270,11 21,020,52 100,000,57 -1,80 -
NUTS II
Norte
Centro
Lisboa e Vale do Tejo
Alentejo
Algarve
Açores
Madeira
PortugalEU
% of GDP % of Total
1999
BusinessGovernment
Higher educationPNP
TOTAL
0,10 23,960,03 8,210,21 50,970,07 16,870,41 100,000,14 20,940,02 3,570,41 59,770,11 15,720,69 100,000,19 24,490,27 34,180,23 29,680,09 11,650,78 100,000,05 12,390,09 20,910,21 52,540,06 14,160,41 100,000,02 6,680,05 15,770,23 75,510,01 2,040,30 100,000,00 0,300,21 38,280,27 48,280,07 13,150,55 100,000,00 0,000,29 67,600,08 19,080,06 13,330,43 100,000,62 -1,80 -
0,16 29,710,04 7,250,26 48,080,08 14,950,53 100,000,19 23,980,05 5,900,43 54,940,12 15,180,77 100,000,21 23,430,32 36,110,28 31,630,08 8,830,89 100,000,04 6,650,09 17,600,31 56,890,10 18,860,54 100,000,07 14,890,05 12,090,31 70,080,01 2,940,44 100,000,00 0,132,13 81,440,40 15,230,08 3,212,62 1000,06 15,250,23 62,120,06 15,520,03 7,110,38 100,000,76 -1,86 -
% of GDP % of Total% of GDP % of Total
BusinessGovernment
Higher educationPNP
TOTALBusiness
GovernmentHigher education
PNPTOTALBusiness
GovernmentHigher education
PNPTOTALBusiness
GovernmentHigher education
PNPTOTALBusiness
GovernmentHigher education
PNPTOTALBusiness
GovernmentHigher education
PNPTOTAL
Performing sector
19971995
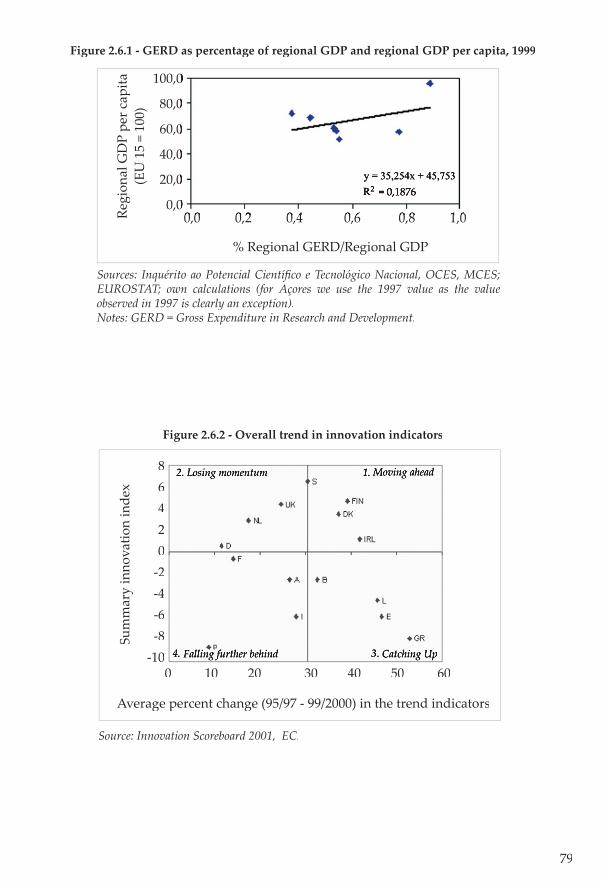
79
Sources: Inquérito ao Potencial Científi co e Tecnológico Nacional, OCES, MCES; EUROSTAT; own calculations (for Açores we use the 1997 value as the value observed in 1997 is clearly an exception).Notes: GERD = Gross Expenditure in Research and Development.
Figure 2.6.1 - GERD as percentage of regional GDP and regional GDP per capita, 1999
0 10 20 30 40 50 60
Average percent change (95/97 - 99/2000) in the trend indicators
86420
-2-4-6-8
-10
Sum
mar
y in
nova
tion
inde
x
2. Losing momentum 1. Moving ahead
3. Catching Up4. Falling further behind
Source: Innovation Scoreboard 2001, EC.
Figure 2.6.2 - Overall trend in innovation indicators
100,0100,0
80,080,0
60,060,0
40,040,0
20,020,0
0,00,00,0 0,2 0,4 0,6 0,8 1,00,0 0,2 0,4 0,6 0,8 1,0
% Regional GERD/Regional GDP
Regi
onal
GD
P pe
r cap
ita(E
U 1
5 =
100)
y = 35,254x + 45,753R2 = 0,1876
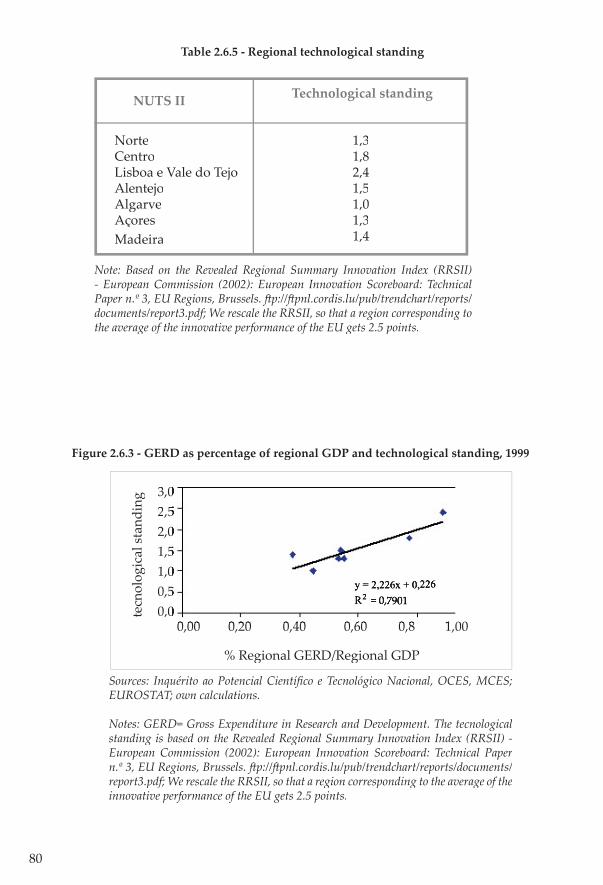
80
3,03,02,5,52,02,01,51,51,01,00,50,50,00,0
0,00 0,20 0,40 0,60 0,8 1,000,00 0,20 0,40 0,60 0,8 1,00
% Regional GERD/Regional GDP
tecn
olog
ical
sta
ndin
g
y = 2,226x + 0,226R2 = 0,7901
Note: Based on the Revealed Regional Summary Innovation Index (RRSII) - European Commission (2002): European Innovation Scoreboard: Technical Paper n.º 3, EU Regions, Brussels. � p://� pnl.cordis.lu/pub/trendchart/reports/documents/report3.pdf; We rescale the RRSII, so that a region corresponding to the average of the innovative performance of the EU gets 2.5 points.
Table 2.6.5 - Regional technological standing
NorteCentroLisboa e Vale do Tejo AlentejoAlgarveAçores Madeira
NUTS II Technological standing
1,31,82,41,51,01,31,4
Sources: Inquérito ao Potencial Científi co e Tecnológico Nacional, OCES, MCES; EUROSTAT; own calculations.
Notes: GERD= Gross Expenditure in Research and Development. The tecnological standing is based on the Revealed Regional Summary Innovation Index (RRSII) - European Commission (2002): European Innovation Scoreboard: Technical Paper n.º 3, EU Regions, Brussels. � p://� pnl.cordis.lu/pub/trendchart/reports/documents/report3.pdf; We rescale the RRSII, so that a region corresponding to the average of the innovative performance of the EU gets 2.5 points.
Figure 2.6.3 - GERD as percentage of regional GDP and technological standing, 1999
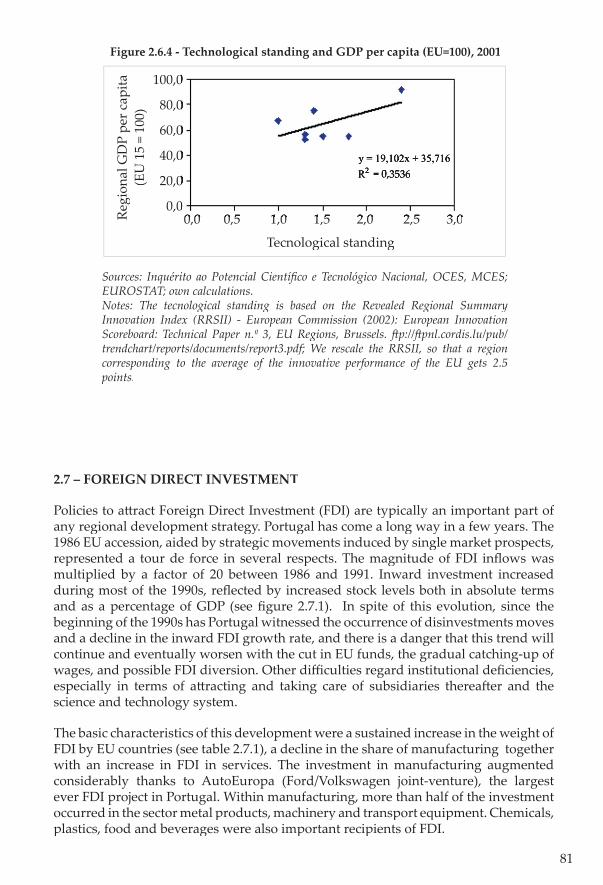
81
Sources: Inquérito ao Potencial Científi co e Tecnológico Nacional, OCES, MCES; EUROSTAT; own calculations. Notes: The tecnological standing is based on the Revealed Regional Summary Innovation Index (RRSII) - European Commission (2002): European Innovation Scoreboard: Technical Paper n.º 3, EU Regions, Brussels. � p://� pnl.cordis.lu/pub/trendchart/reports/documents/report3.pdf; We rescale the RRSII, so that a region corresponding to the average of the innovative performance of the EU gets 2.5 points.
Figure 2.6.4 - Technological standing and GDP per capita (EU=100), 2001
100,0100,0
80,080,0
60,060,0
40,040,0
20,020,0
0,00,00,0 0,5 1,0 1,5 2,0 2,5 3,00,0 0,5 1,0 1,5 2,0 2,5 3,0
Tecnological standing
Regi
onal
GD
P pe
r cap
ita(E
U 1
5 =
100)
y = 19,102x + 35,716R2 = 0,3536
2.7 – FOREIGN DIRECT INVESTMENT
Policies to a� ract Foreign Direct Investment (FDI) are typically an important part of any regional development strategy. Portugal has come a long way in a few years. The 1986 EU accession, aided by strategic movements induced by single market prospects, represented a tour de force in several respects. The magnitude of FDI infl ows was multiplied by a factor of 20 between 1986 and 1991. Inward investment increased during most of the 1990s, refl ected by increased stock levels both in absolute terms and as a percentage of GDP (see fi gure 2.7.1). In spite of this evolution, since the beginning of the 1990s has Portugal witnessed the occurrence of disinvestments moves and a decline in the inward FDI growth rate, and there is a danger that this trend will continue and eventually worsen with the cut in EU funds, the gradual catching-up of wages, and possible FDI diversion. Other diffi culties regard institutional defi ciencies, especially in terms of a� racting and taking care of subsidiaries therea� er and the science and technology system.
The basic characteristics of this development were a sustained increase in the weight of FDI by EU countries (see table 2.7.1), a decline in the share of manufacturing together with an increase in FDI in services. The investment in manufacturing augmented considerably thanks to AutoEuropa (Ford/Volkswagen joint-venture), the largest ever FDI project in Portugal. Within manufacturing, more than half of the investment occurred in the sector metal products, machinery and transport equipment. Chemicals, plastics, food and beverages were also important recipients of FDI.
82
Most studies claim that Multinational Enterprises (MNEs) had clearly a positive impact overall, raising productivity levels directly or through competition and demonstrating eff ects on domestic entrepreneurs. They contributed to investment, value and employment creation which otherwise may not have occurred. However, for the most recent period, the studies also note the over-specialisation of inward FDI, the predominance of rationalised types of subsidiaries with a low value-added scope, the scarce spill-over potential and the reduced interaction between MNEs and local industry.
It is argued that this situation resulted partly from the weaknesses of the local industrial fabric and from inadequate government policies. The low value-added scope of most subsidiaries located in Portugal is partly related to a weak and fragmented national system of innovation and to a lack of links between industry and University. Regarding policy, the main criticisms refer to the lack of success at targeting, passivity, concession of important incentives without evidence of clear guidelines, apart from a focus on very large projects. State aid, through direct FDI incentives, infrastructure development and indirectly, through the stimulus it provided to domestic consumption, might have fostered FDI. However, the emphasis on Portugal as a cheap labour location did not prove eff ective. Instead, there was a weakening of the bargaining power of the Portuguese authorities vis-à-vis foreign investors.
In the beginning of this century, Portugal rethought her approach towards FDI. The new approach highlights country excellence in science & technology, culture, and business practices. It emphasises Portuguese advantages: strategic access to markets, proactive investment reforms, cost-competitive, qualifi ed and fl exible workforce, strategic commitment to education and science, excellent environment to live and work, infrastructure and FDI record of accomplishment. The Portuguese track record in automotive, chemicals, electric and electronics, ICT, life sciences, moulds and tourism evidences a clear commitment to high-value added industries/activities.
API, the new Portuguese Investment Agency was created in November 2002, with the mission to promote large-scale investment in Portugal. This translates into a� racting more projects (from new and existing investors), but also higher value-adding initiatives. To promote the competitiveness and the productivity of the Portuguese economy, through the support of investments with a signifi cant impact on the national GVA (Gross Value Added), the Government elaborated a package of measures, whose general philosophy takes the State as a risk partner and intends to reward eff ective performance and fi scal transparency. Finally, an investment code is being created in Portugal, with the aim to review, simplify and coordinate the normative support for productive investment.
The economic development of the country as such has been the primary goal of FDI policy, given the generally low level of development and the overall need for modernisation and for investment. Concerns about regional imbalances ranked much lower. Overall, the territorial concepts in the defi nition and formulation of the Portuguese inward investment policy refer to the delimitation of areas eligible for fi nancial support and the modulation of assistance rates and to measures on the basis of specifi c territorial criteria. The regional aspects refer mainly to bonuses for investments located in regions with Purchasing Power Parity (PPP) below the national average. Nowadays, the large FDI projects are negotiated with API on a case-by-case
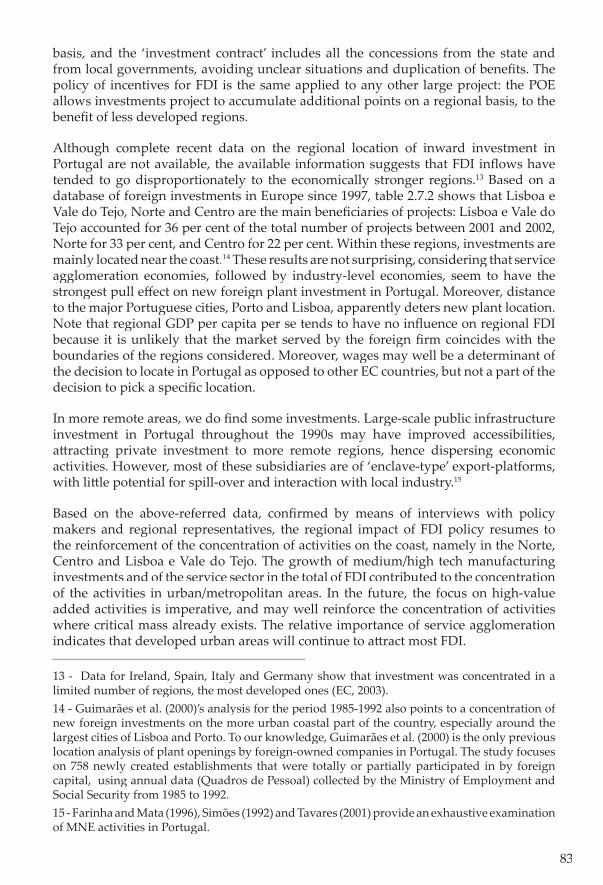
83
basis, and the ‘investment contract’ includes all the concessions from the state and from local governments, avoiding unclear situations and duplication of benefi ts. The policy of incentives for FDI is the same applied to any other large project: the POE allows investments project to accumulate additional points on a regional basis, to the benefi t of less developed regions.
Although complete recent data on the regional location of inward investment in Portugal are not available, the available information suggests that FDI infl ows have tended to go disproportionately to the economically stronger regions.13 Based on a database of foreign investments in Europe since 1997, table 2.7.2 shows that Lisboa e Vale do Tejo, Norte and Centro are the main benefi ciaries of projects: Lisboa e Vale do Tejo accounted for 36 per cent of the total number of projects between 2001 and 2002, Norte for 33 per cent, and Centro for 22 per cent. Within these regions, investments are mainly located near the coast.14 These results are not surprising, considering that service agglomeration economies, followed by industry-level economies, seem to have the strongest pull eff ect on new foreign plant investment in Portugal. Moreover, distance to the major Portuguese cities, Porto and Lisboa, apparently deters new plant location. Note that regional GDP per capita per se tends to have no infl uence on regional FDI because it is unlikely that the market served by the foreign fi rm coincides with the boundaries of the regions considered. Moreover, wages may well be a determinant of the decision to locate in Portugal as opposed to other EC countries, but not a part of the decision to pick a specifi c location.
In more remote areas, we do fi nd some investments. Large-scale public infrastructure investment in Portugal throughout the 1990s may have improved accessibilities, a� racting private investment to more remote regions, hence dispersing economic activities. However, most of these subsidiaries are of ‘enclave-type’ export-platforms, with li� le potential for spill-over and interaction with local industry.15
Based on the above-referred data, confi rmed by means of interviews with policy makers and regional representatives, the regional impact of FDI policy resumes to the reinforcement of the concentration of activities on the coast, namely in the Norte, Centro and Lisboa e Vale do Tejo. The growth of medium/high tech manufacturing investments and of the service sector in the total of FDI contributed to the concentration of the activities in urban/metropolitan areas. In the future, the focus on high-value added activities is imperative, and may well reinforce the concentration of activities where critical mass already exists. The relative importance of service agglomeration indicates that developed urban areas will continue to a� ract most FDI.
13 - Data for Ireland, Spain, Italy and Germany show that investment was concentrated in a limited number of regions, the most developed ones (EC, 2003). 14 - Guimarães et al. (2000)’s analysis for the period 1985-1992 also points to a concentration of new foreign investments on the more urban coastal part of the country, especially around the largest cities of Lisboa and Porto. To our knowledge, Guimarães et al. (2000) is the only previous location analysis of plant openings by foreign-owned companies in Portugal. The study focuses on 758 newly created establishments that were totally or partially participated in by foreign capital, using annual data (Quadros de Pessoal) collected by the Ministry of Employment and Social Security from 1985 to 1992.15 - Farinha and Mata (1996), Simões (1992) and Tavares (2001) provide an exhaustive examination of MNE activities in Portugal.
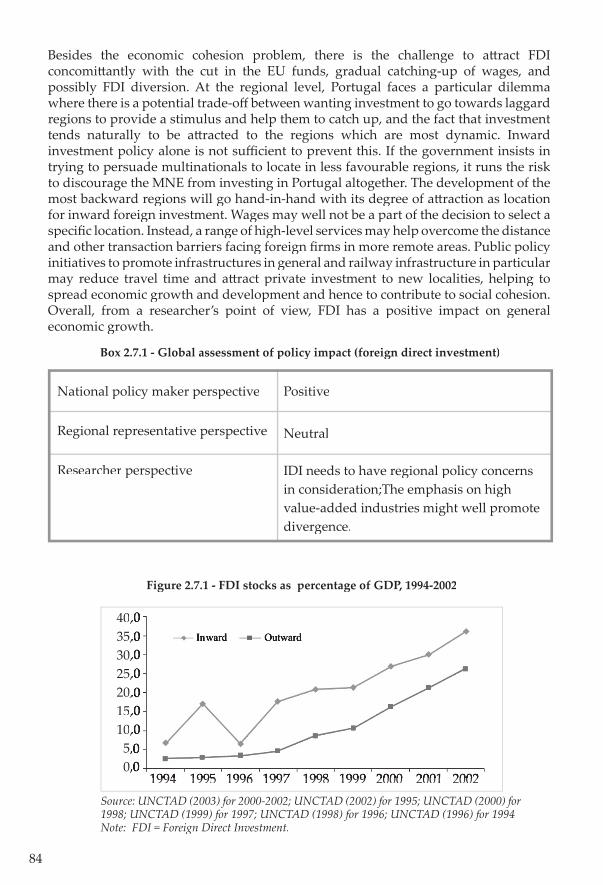
84
Besides the economic cohesion problem, there is the challenge to a� ract FDI concomi� antly with the cut in the EU funds, gradual catching-up of wages, and possibly FDI diversion. At the regional level, Portugal faces a particular dilemma where there is a potential trade-off between wanting investment to go towards laggard regions to provide a stimulus and help them to catch up, and the fact that investment tends naturally to be a� racted to the regions which are most dynamic. Inward investment policy alone is not suffi cient to prevent this. If the government insists in trying to persuade multinationals to locate in less favourable regions, it runs the risk to discourage the MNE from investing in Portugal altogether. The development of the most backward regions will go hand-in-hand with its degree of a� raction as location for inward foreign investment. Wages may well not be a part of the decision to select a specifi c location. Instead, a range of high-level services may help overcome the distance and other transaction barriers facing foreign fi rms in more remote areas. Public policy initiatives to promote infrastructures in general and railway infrastructure in particular may reduce travel time and a� ract private investment to new localities, helping to spread economic growth and development and hence to contribute to social cohesion. Overall, from a researcher’s point of view, FDI has a positive impact on general economic growth.
Box 2.7.1 - Global assessment of policy impact (foreign direct investment)
National policy maker perspective
Regional representative perspective
Researcher perspective
Positive
Neutral
IDI needs to have regional policy concerns in consideration;The emphasis on high value-added industries might well promote divergence.
Source: UNCTAD (2003) for 2000-2002; UNCTAD (2002) for 1995; UNCTAD (2000) for 1998; UNCTAD (1999) for 1997; UNCTAD (1998) for 1996; UNCTAD (1996) for 1994 Note: FDI = Foreign Direct Investment.
Figure 2.7.1 - FDI stocks as percentage of GDP, 1994-2002
1994 1994 1991995 5 1991996 6 1991997 7 1991998 8 1991999 2000 2001 20029 2000 2001 2002
40,0,035,035,030,030,025,025,020,020,015,0,010,0,05,05,00,00,0
OutwardInward
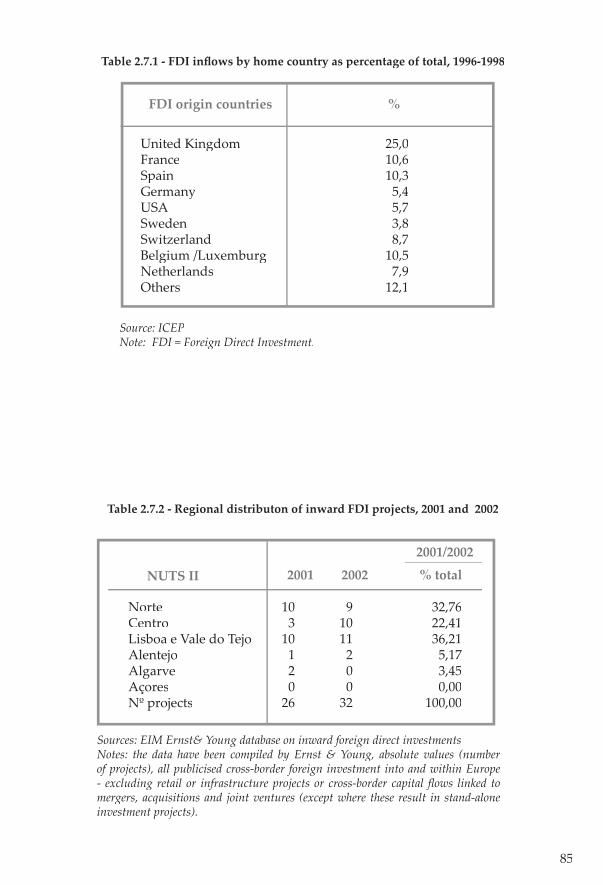
85
Source: ICEP Note: FDI = Foreign Direct Investment.
Table 2.7.1 - FDI infl ows by home country as percentage of total, 1996-1998
United KingdomFranceSpainGermanyUSASwedenSwitzerlandBelgium /LuxemburgNetherlandsOthers
FDI origin countries %
25,010,610,35,45,73,88,7
10,57,9
12,1
Sources: EIM Ernst& Young database on inward foreign direct investmentsNotes: the data have been compiled by Ernst & Young, absolute values (number of projects), all publicised cross-border foreign investment into and within Europe - excluding retail or infrastructure projects or cross-border capital fl ows linked to mergers, acquisitions and joint ventures (except where these result in stand-alone investment projects).
Table 2.7.2 - Regional distributon of inward FDI projects, 2001 and 2002
NorteCentroLisboa e Vale do TejoAlentejoAlgarveAçoresNº projects
NUTS II 2001
10 9 32,76 3 10 22,4110 11 36,21 1 2 5,17 2 0 3,45 0 0 0,0026 32 100,00
2002 % total
2001/2002

86
87
3.
REGIONAL CONVERGENCE IN PORTUGAL
3.1 - CONVERGENCE AMONG PORTUGUESE REGIONS
Over the last decades, the Portuguese economy exhibited an outstanding growth performance. Between 1980 and 2000, Portugal ranked fourth among
25 Organisation for Economic Co-operation and Development (OECD) countries in terms of growth of per capita GDP, and third in terms of growth of GDP per worker. This period of fast economic growth allowed the country to consistently reduce its income gap vis-à-vis the EU average. Figure 3.1.1 shows the convergence path of the four cohesion countries with respect to the EU-15 average. The fi gure suggests that the speed of convergence has not been uniform over time.16 The same is true for Greece and Spain, but not for Ireland. GDP per capita depends on demographic factors, labour participation and productivity. Evidence at the country level indicates that Portugal, when compared to other cohesion EU countries, exhibits a high employment rate and a very low productivity level.
The question is whether the Portuguese regions equally shared in growth. To address this question, table 3.1.1 displays the GDP per capita in the Portuguese NUTS II regions, in per cent of the country average and of the EU average.17 The fi gures indicate that, between 1995 and 2000, among all Portuguese regions, only Madeira has succeeded in approaching the country level (Açores also improved its position, but only slightly). The regions Norte, Centro, Alentejo, Algarve and Lisboa e Vale do Tejo have diverged from the country average.
Because the period under analysis is very short, the data presented in Table 3.1.1 are sensible to asymmetries in the incidence of the business cycle. To overcome this, we focus on a longer time horizon. Table 3.1.2 compares, in terms of per capita GVA, the relative position of the diff erent Portuguese regions vis-à-vis the country average in 1990 and 2001. Comparing the levels of 1990 and 200118, we observe that Norte, Lisboa e
16 - A more profound investigation using the stochastic approach to convergence (see, for example, Carlino, G. and Mills, L., 1993), allowing for structural breaks in the speed of convergence and with an appropriate representation of the business cycle, suggests that the speed of convergence did indeed decline with the oil shock, but no other structural break is identifi ed a� erwards, including at the time of EC accession (see Freitas, 2002).17 - Figures on regional output are being subject to successive revisions and data are not necessarily consistent across tables. For this reason, we try to identify in each table the specifi c database being used. In the latest DGRegio database, data from GDP and GVA appear to reveal some inconsistencies. 18 -Data before 1990 are not shown due to lack of reliability.
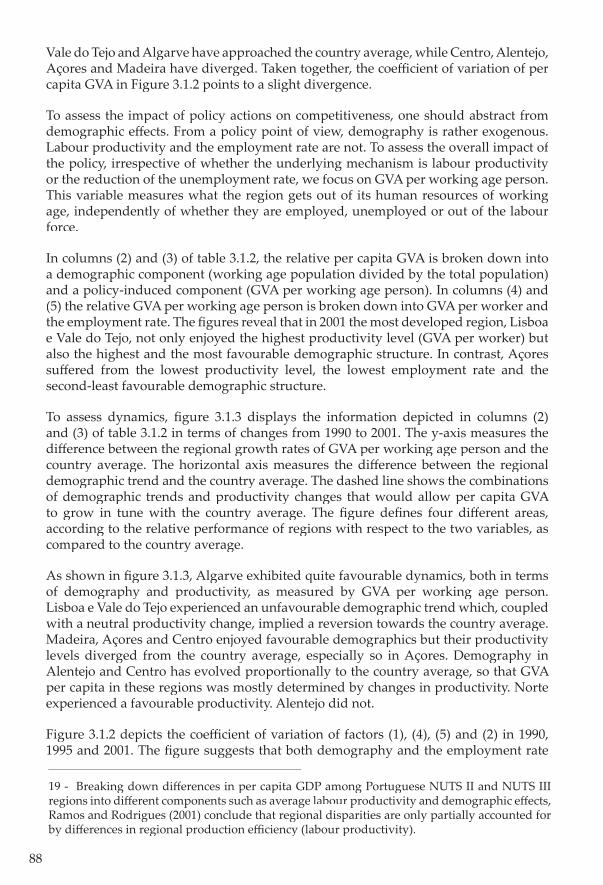
88
Vale do Tejo and Algarve have approached the country average, while Centro, Alentejo, Açores and Madeira have diverged. Taken together, the coeffi cient of variation of per capita GVA in Figure 3.1.2 points to a slight divergence.
To assess the impact of policy actions on competitiveness, one should abstract from demographic eff ects. From a policy point of view, demography is rather exogenous. Labour productivity and the employment rate are not. To assess the overall impact of the policy, irrespective of whether the underlying mechanism is labour productivity or the reduction of the unemployment rate, we focus on GVA per working age person. This variable measures what the region gets out of its human resources of working age, independently of whether they are employed, unemployed or out of the labour force.
In columns (2) and (3) of table 3.1.2, the relative per capita GVA is broken down into a demographic component (working age population divided by the total population) and a policy-induced component (GVA per working age person). In columns (4) and (5) the relative GVA per working age person is broken down into GVA per worker and the employment rate. The fi gures reveal that in 2001 the most developed region, Lisboa e Vale do Tejo, not only enjoyed the highest productivity level (GVA per worker) but also the highest and the most favourable demographic structure. In contrast, Açores suff ered from the lowest productivity level, the lowest employment rate and the second-least favourable demographic structure.
To assess dynamics, fi gure 3.1.3 displays the information depicted in columns (2) and (3) of table 3.1.2 in terms of changes from 1990 to 2001. The y-axis measures the diff erence between the regional growth rates of GVA per working age person and the country average. The horizontal axis measures the diff erence between the regional demographic trend and the country average. The dashed line shows the combinations of demographic trends and productivity changes that would allow per capita GVA to grow in tune with the country average. The fi gure defi nes four diff erent areas, according to the relative performance of regions with respect to the two variables, as compared to the country average.
As shown in fi gure 3.1.3, Algarve exhibited quite favourable dynamics, both in terms of demography and productivity, as measured by GVA per working age person. Lisboa e Vale do Tejo experienced an unfavourable demographic trend which, coupled with a neutral productivity change, implied a reversion towards the country average. Madeira, Açores and Centro enjoyed favourable demographics but their productivity levels diverged from the country average, especially so in Açores. Demography in Alentejo and Centro has evolved proportionally to the country average, so that GVA per capita in these regions was mostly determined by changes in productivity. Norte experienced a favourable productivity. Alentejo did not.
Figure 3.1.2 depicts the coeffi cient of variation of factors (1), (4), (5) and (2) in 1990, 1995 and 2001. The fi gure suggests that both demography and the employment rate
19 - Breaking down diff erences in per capita GDP among Portuguese NUTS II and NUTS III regions into diff erent components such as average labour productivity and demographic eff ects, Ramos and Rodrigues (2001) conclude that regional disparities are only partially accounted for by diff erences in regional production effi ciency (labour productivity).
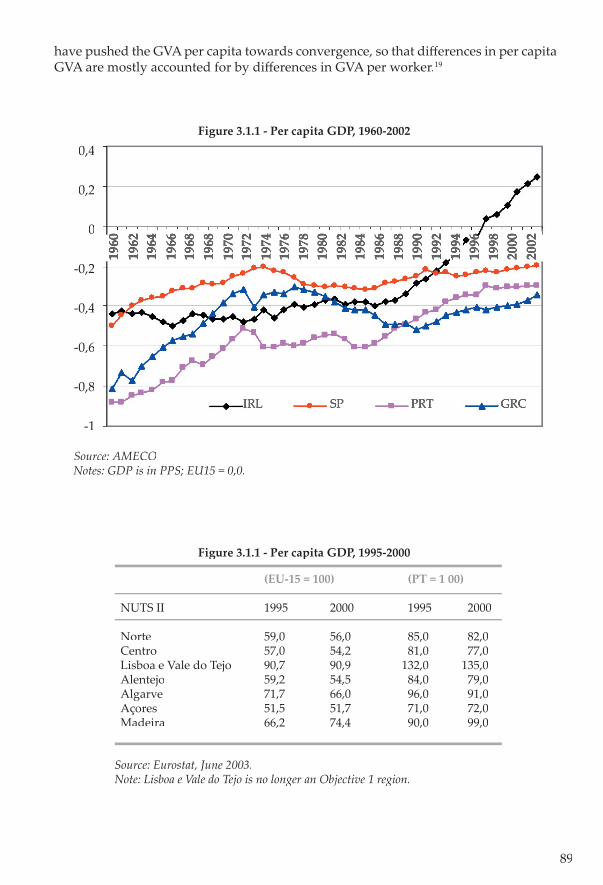
89
(EU-15 = 100) (PT = 1 00)
NUTS II 1995 2000 1995 2000
Norte 59,0 56,0 85,0 82,0Centro 57,0 54,2 81,0 77,0Lisboa e Vale do Tejo 90,7 90,9 132,0 135,0Alentejo 59,2 54,5 84,0 79,0Algarve 71,7 66,0 96,0 91,0Açores 51,5 51,7 71,0 72,0Madeira 66,2 74,4 90,0 99,0
1960
1962
1964
1966
1968
1968
1970
1972
1974
1976
1978
1980
1982
1984
1986
1988
1990
1992
1994
1996
1998
2000
2002
IRL SP PRT GRC
0,4
0,2
0
-0,2
-0,4
-0,6
-0,8
-1
Figure 3.1.1 - Per capita GDP, 1960-2002
Source: AMECO Notes: GDP is in PPS; EU15 = 0,0.
Figure 3.1.1 - Per capita GDP, 1995-2000
Source: Eurostat, June 2003.Note: Lisboa e Vale do Tejo is no longer an Objective 1 region.
have pushed the GVA per capita towards convergence, so that diff erences in per capita GVA are mostly accounted for by diff erences in GVA per worker.19
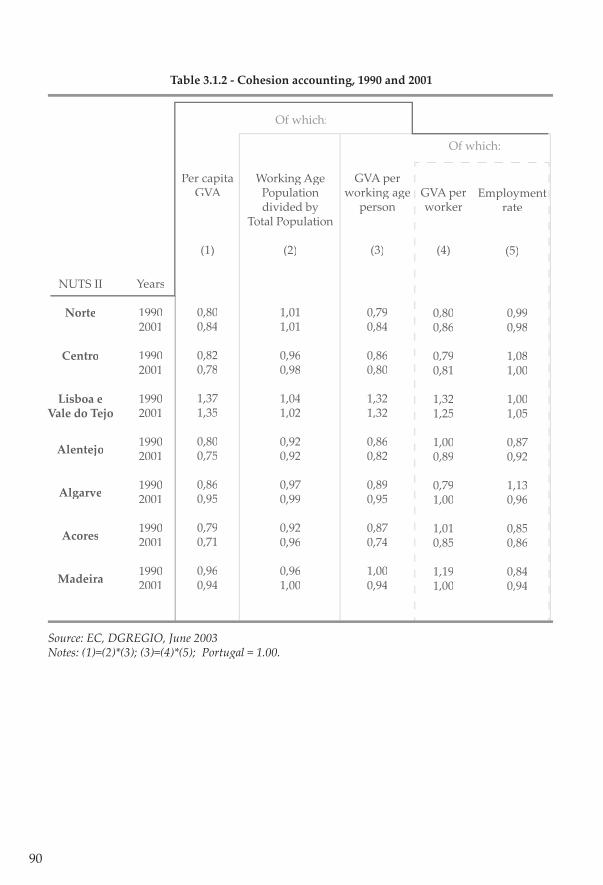
90
Table 3.1.2 - Cohesion accounting, 1990 and 2001
Source: EC, DGREGIO, June 2003 Notes: (1)=(2)*(3); (3)=(4)*(5); Portugal = 1.00.
NUTS II
Norte
Centro
Lisboa e Vale do Tejo
Alentejo
Algarve
Acores
Madeira
Years
19902001
19902001
19902001
19902001
19902001
19902001
19902001
Working Age Population divided by
Total Population
(2)
Per capita GVA
(1)
GVA per working age
person
(3)
GVA per worker
(4)
Employment rate
(5)
0,800,84
0,820,78
1,371,35
0,800,75
0,860,95
0,790,71
0,960,94
0,990,98
1,081,00
1,001,05
0,870,92
1,130,96
0,850,86
0,840,94
0,800,86
0,790,81
1,321,25
1,000,89
0,791,00
1,010,85
1,191,00
0,790,84
0,860,80
1,321,32
0,860,82
0,890,95
0,870,74
1,000,94
1,011,01
0,960,98
1,041,02
0,920,92
0,970,99
0,920,96
0,961,00
Of which:
Of which:

91
Figure 3.1.2 - Coeffi cients of variation, 1990, 1995 and 2001
1990 1995 2001
0,2500,2250,2000,1750,1500,1250,1000,0750,0500,0250,000
GVA per capita GVA per worker Employment rate Demography
Source: Own calculations based on data from table 3.1.2.
Source: Own calculations based on data from table 3.1.2.
Figure 3.1.3 - Productivity and demographic trends, 1990-2001
Demographic Trends Change in the ratio “Working age Population to Total Population” 1990-2001
(diff erences relative to the country average)
10,0010,00
5,00
0,00
-5,00
-10,00
-15,00
-20,00
-6,00 -4,00 -2,00 2,00 4,00 6,00-6,00 -4,00 -2,00 2,00 4,00 6,00
Norte AlgarveLisboa e Vale
do Tejo
Alentejo • Centro
Prod
uctiv
ity T
rend
sC
hang
e in
GVA
per
wor
king
age
per
son,
199
0-20
01
(diff
eren
ces
rela
tive
to th
e co
untr
y av
erag
e)
92
3.2 - REGIONAL PROFILES
The data provided in this section draws on secondary data as well as on primary qualitative data collected through interviews with policy makers, regional leaders and academics. The interviews were based on a pre-defi ned questionnaire on the impact of national/regional policies on the development path of each region in the recent past. In addition, open-ended exploratory questions allowed for the collection of comprehensive data on regional specifi cities that were not predicted at the outset.
Herea� er, all seven Portuguese regions are characterised in terms of their evolution over the decade 1991-2001, their specialisation pa� ern and the evolution of regional indicators. Then, a SWOT analysis evidences strengths, weaknesses, opportunities and threats for the development of the regions. Finally, we present interview evidence on the assessment by regional representatives of the domestic policies’ impact on regional cohesion and contrast it with a researcher’s perspective.
3.2.1 - REGIONAL PROFILE: NORTE
The Norte is the largest Portuguese NUTS II region in terms of population and population employed. It is thus of major concern to see that per capita GDP and GVA per head of this region have persistently been below the national and the European average, placing itself amongst the poorest regions Europe-wide.20 Moreover, table 3.2.1.1 shows that, between 1995 and 2001, the Norte has worsened its GDP per capita level with reference both to the EU average and to the national average. Nevertheless, in table 3.1.2 above (see subsection 3.1), we observed that in terms of per capita GVA, Norte has approached the country average over 1990-2001. The development is characterised by a favourable productivity trend coupled with a neutral demographic change (see fi gure 3.1.3, subsection 3.1).
The Norte region has been traditionally industrial. According to the 2001 Census, industry accounts for 43 per cent of total employment in the region, the highest value in the country and amongst the highest shares Europe-wide. The region specialises in traditional industry (see Box 3.2.1.1), and the restructuring process over the last decades reinforced this pa� ern.
20 - Figures on regional output are being subject to successive revisions and data are not necessarily consistent across tables. For this reason, we try to identify in each table the specifi c database being used. In the latest DGRegio (Regional Policy Directorate-General) database, data from GDP and GVA appear to reveal some inconsistencies.
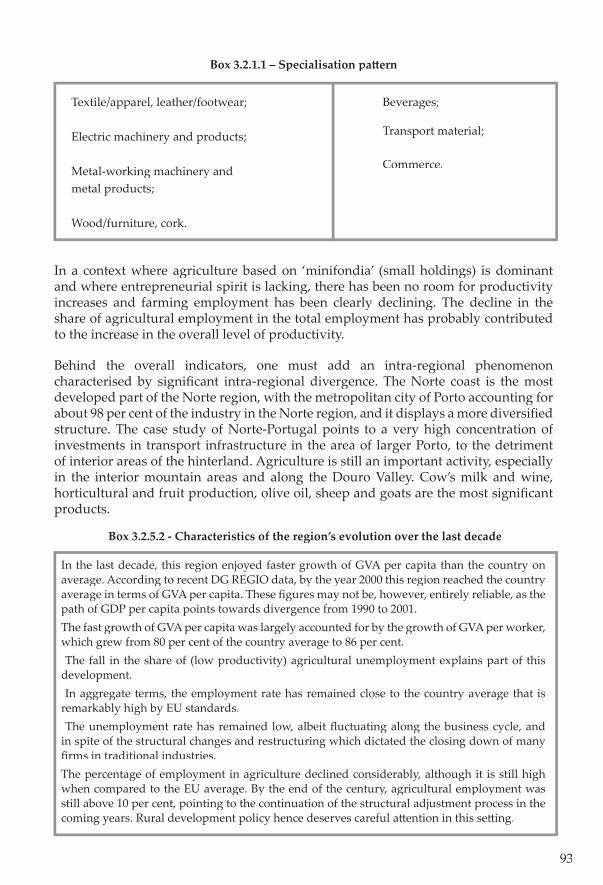
93
Box 3.2.1.1 – Specialisation pa� ern
In a context where agriculture based on ‘minifondia’ (small holdings) is dominant and where entrepreneurial spirit is lacking, there has been no room for productivity increases and farming employment has been clearly declining. The decline in the share of agricultural employment in the total employment has probably contributed to the increase in the overall level of productivity.
Behind the overall indicators, one must add an intra-regional phenomenon characterised by signifi cant intra-regional divergence. The Norte coast is the most developed part of the Norte region, with the metropolitan city of Porto accounting for about 98 per cent of the industry in the Norte region, and it displays a more diversifi ed structure. The case study of Norte-Portugal points to a very high concentration of investments in transport infrastructure in the area of larger Porto, to the detriment of interior areas of the hinterland. Agriculture is still an important activity, especially in the interior mountain areas and along the Douro Valley. Cow’s milk and wine, horticultural and fruit production, olive oil, sheep and goats are the most signifi cant products.
In the last decade, this region enjoyed faster growth of GVA per capita than the country on average. According to recent DG REGIO data, by the year 2000 this region reached the country average in terms of GVA per capita. These fi gures may not be, however, entirely reliable, as the path of GDP per capita points towards divergence from 1990 to 2001. The fast growth of GVA per capita was largely accounted for by the growth of GVA per worker, which grew from 80 per cent of the country average to 86 per cent. The fall in the share of (low productivity) agricultural unemployment explains part of this development. In aggregate terms, the employment rate has remained close to the country average that is remarkably high by EU standards. The unemployment rate has remained low, albeit fl uctuating along the business cycle, and in spite of the structural changes and restructuring which dictated the closing down of many fi rms in traditional industries. The percentage of employment in agriculture declined considerably, although it is still high when compared to the EU average. By the end of the century, agricultural employment was still above 10 per cent, pointing to the continuation of the structural adjustment process in the coming years. Rural development policy hence deserves careful a� ention in this se� ing.
Box 3.2.5.2 - Characteristics of the region’s evolution over the last decade
Textile/apparel, leather/footwear;
Electric machinery and products;
Metal-working machinery and metal products;
Wood/furniture, cork.
Beverages;
Transport material;
Commerce.
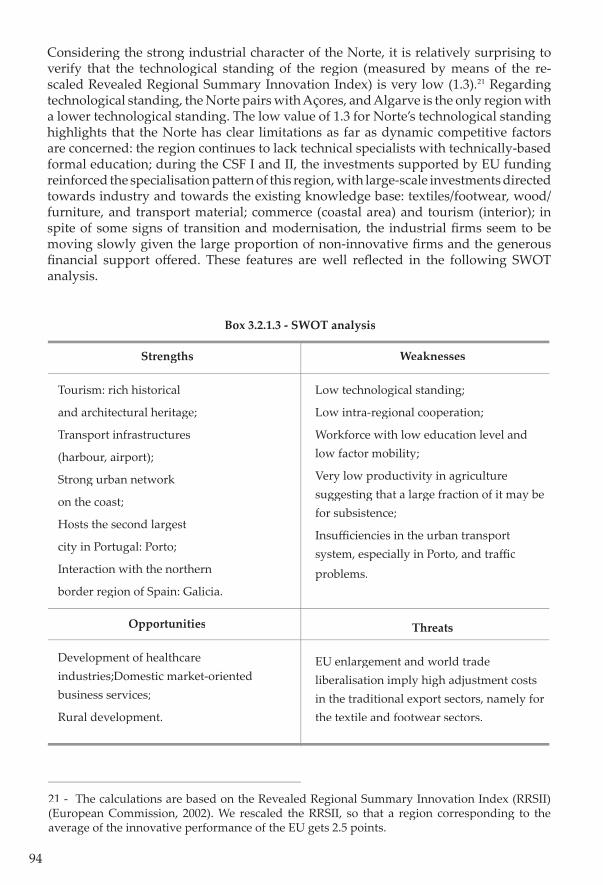
94
Strengths
Tourism: rich historical
and architectural heritage;
Transport infrastructures
(harbour, airport);
Strong urban network
on the coast;
Hosts the second largest
city in Portugal: Porto;
Interaction with the northern
border region of Spain: Galicia.
Opportunities
Development of healthcare industries;Domestic market-oriented business services;
Rural development.
Weaknesses
Low technological standing;
Low intra-regional cooperation;
Workforce with low education level and low factor mobility;
Very low productivity in agriculture suggesting that a large fraction of it may be for subsistence;
Insuffi ciencies in the urban transport system, especially in Porto, and traffi cproblems.
Threats
EU enlargement and world trade liberalisation imply high adjustment costs in the traditional export sectors, namely for the textile and footwear sectors.
Box 3.2.1.3 - SWOT analysis
Considering the strong industrial character of the Norte, it is relatively surprising to verify that the technological standing of the region (measured by means of the re-scaled Revealed Regional Summary Innovation Index) is very low (1.3).21 Regarding technological standing, the Norte pairs with Açores, and Algarve is the only region with a lower technological standing. The low value of 1.3 for Norte’s technological standing highlights that the Norte has clear limitations as far as dynamic competitive factors are concerned: the region continues to lack technical specialists with technically-based formal education; during the CSF I and II, the investments supported by EU funding reinforced the specialisation pa� ern of this region, with large-scale investments directed towards industry and towards the existing knowledge base: textiles/footwear, wood/furniture, and transport material; commerce (coastal area) and tourism (interior); in spite of some signs of transition and modernisation, the industrial fi rms seem to be moving slowly given the large proportion of non-innovative fi rms and the generous fi nancial support off ered. These features are well refl ected in the following SWOT analysis.
21 - The calculations are based on the Revealed Regional Summary Innovation Index (RRSII) (European Commission, 2002). We rescaled the RRSII, so that a region corresponding to the average of the innovative performance of the EU gets 2.5 points.
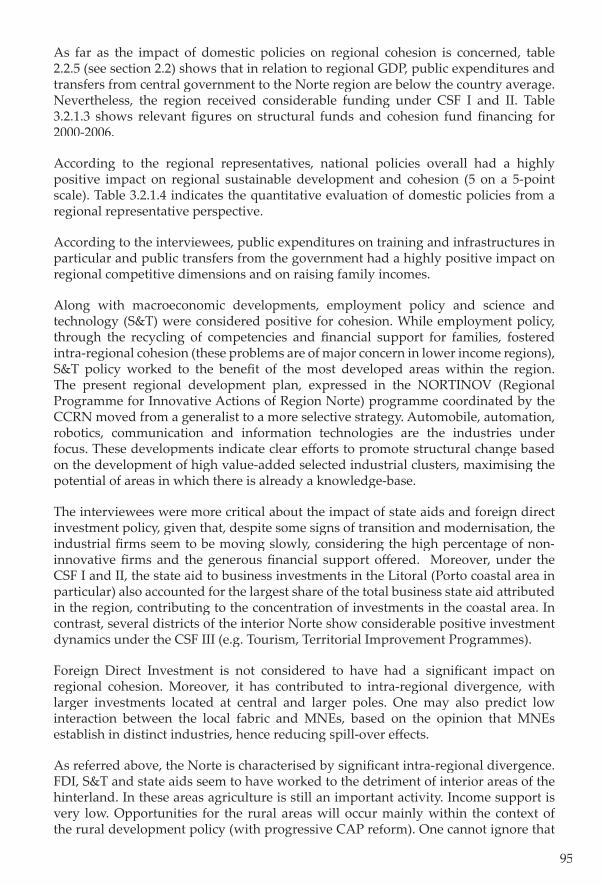
95
As far as the impact of domestic policies on regional cohesion is concerned, table 2.2.5 (see section 2.2) shows that in relation to regional GDP, public expenditures and transfers from central government to the Norte region are below the country average. Nevertheless, the region received considerable funding under CSF I and II. Table 3.2.1.3 shows relevant fi gures on structural funds and cohesion fund fi nancing for 2000-2006.
According to the regional representatives, national policies overall had a highly positive impact on regional sustainable development and cohesion (5 on a 5-point scale). Table 3.2.1.4 indicates the quantitative evaluation of domestic policies from a regional representative perspective.
According to the interviewees, public expenditures on training and infrastructures in particular and public transfers from the government had a highly positive impact on regional competitive dimensions and on raising family incomes.
Along with macroeconomic developments, employment policy and science and technology (S&T) were considered positive for cohesion. While employment policy, through the recycling of competencies and fi nancial support for families, fostered intra-regional cohesion (these problems are of major concern in lower income regions), S&T policy worked to the benefi t of the most developed areas within the region. The present regional development plan, expressed in the NORTINOV (Regional Programme for Innovative Actions of Region Norte) programme coordinated by the CCRN moved from a generalist to a more selective strategy. Automobile, automation, robotics, communication and information technologies are the industries under focus. These developments indicate clear eff orts to promote structural change based on the development of high value-added selected industrial clusters, maximising the potential of areas in which there is already a knowledge-base.
The interviewees were more critical about the impact of state aids and foreign direct investment policy, given that, despite some signs of transition and modernisation, the industrial fi rms seem to be moving slowly, considering the high percentage of non-innovative fi rms and the generous fi nancial support off ered. Moreover, under the CSF I and II, the state aid to business investments in the Litoral (Porto coastal area in particular) also accounted for the largest share of the total business state aid a� ributed in the region, contributing to the concentration of investments in the coastal area. In contrast, several districts of the interior Norte show considerable positive investment dynamics under the CSF III (e.g. Tourism, Territorial Improvement Programmes).
Foreign Direct Investment is not considered to have had a signifi cant impact on regional cohesion. Moreover, it has contributed to intra-regional divergence, with larger investments located at central and larger poles. One may also predict low interaction between the local fabric and MNEs, based on the opinion that MNEs establish in distinct industries, hence reducing spill-over eff ects.
As referred above, the Norte is characterised by signifi cant intra-regional divergence. FDI, S&T and state aids seem to have worked to the detriment of interior areas of the hinterland. In these areas agriculture is still an important activity. Income support is very low. Opportunities for the rural areas will occur mainly within the context of the rural development policy (with progressive CAP reform). One cannot ignore that
96
the receptivity to this type of policy represents a very strong asset, mainly because a major part of rural areas still preserve a major capacity to fi x people and activities. In the Douro-valley with its large potential in terms of image, resource-landscape and heritage or in rural areas where rural tourism is already developed and organised, the challenge is not one of starting from zero but, on the contrary, to strengthen a tendency whose eff ects already start to be perceived by the population. It is these areas of the Norte region which benefi ted most from the LEADER initiative by developing the component of rural development, by improving the endowment with social and cultural facilities, etc. In territories where desertifi cation progressed irreversibly, the environmental component of CAP will become a key factor enabling rural income to reach a threshold essential for fi xing people.
As refl ected in table 3.2.1.5, with the exception of business support and tourism, domestic policies overall are considered to have had a strongly positive impact on a variety of areas, from social to economic dimensions.
In order to improve policy effi ciency, regional representatives call for greater involvement of private fi rms, associations and institutions in the design and implementation of regional policy. It is sugested that increasing effi ciency in the allocation of resources and changes in governance would to improve the policies’ impact. The regional representative argues that decentralization to regional and local entities has been minimal. There is higher coordination between regional and local levels, but communication with national programme leaders is diffi cult.
In spite of not being the primary aim of this research, the fi eldwork did provide some insights about the impact of prominent European Community policies on regional cohesion. The relevance of structural funds was clearly highlighted. (5 on a 5-point scale). While environmental policy had a positive impact, fi sheries and agricultural policies had a negative to neutral impact on regional cohesion. Agriculture programmes were not able to eliminate the problems inherited from the past: very small holdings, auto-suffi ciency agriculture and low productivity; yet, these measures infl uenced the quality of life and the environment positively.
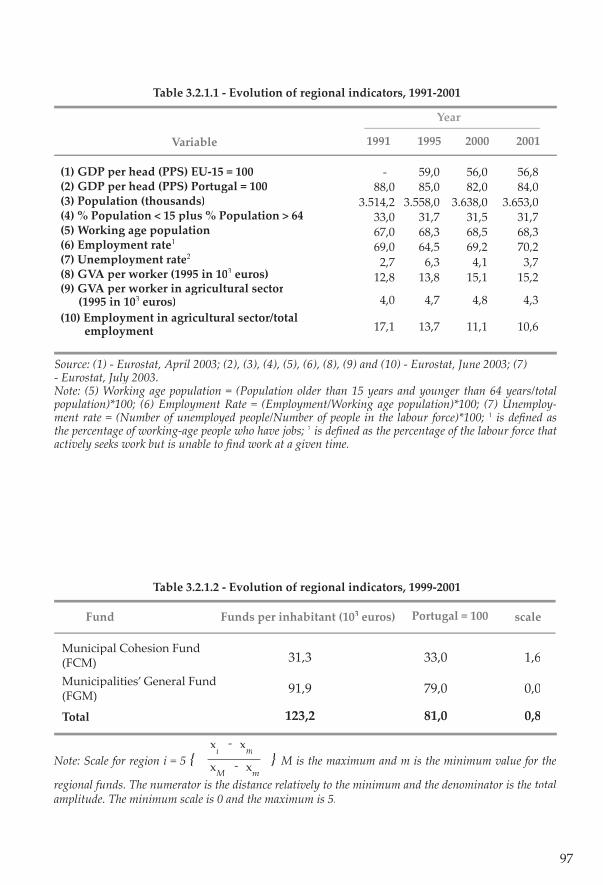
97
Source: (1) - Eurostat, April 2003; (2), (3), (4), (5), (6), (8), (9) and (10) - Eurostat, June 2003; (7) - Eurostat, July 2003. Note: (5) Working age population = (Population older than 15 years and younger than 64 years/total population)*100; (6) Employment Rate = (Employment/Working age population)*100; (7) Unemploy-ment rate = (Number of unemployed people/Number of people in the labour force)*100; 1 is defi ned as the percentage of working-age people who have jobs; 2 is defi ned as the percentage of the labour force that actively seeks work but is unable to fi nd work at a given time.
Table 3.2.1.1 - Evolution of regional indicators, 1991-2001
Municipal Cohesion Fund(FCM) Municipalities’ General Fund (FGM)
Total
Fund
31,3 33,0 1,6
91,9 79,0 0,0
123,2 81,0 0,8
Funds per inhabitant (103 euros) Portugal = 100 scale
Note: Scale for region i = 5 { } M is the maximum and m is the minimum value for the
regional funds. The numerator is the distance relatively to the minimum and the denominator is the total amplitude. The minimum scale is 0 and the maximum is 5.
xi -
xm
xM -
xm
(1) GDP per head (PPS) EU-15 = 100(2) GDP per head (PPS) Portugal = 100(3) Population (thousands)(4) % Population < 15 plus % Population > 64(5) Working age population(6) Employment rate1
(7) Unemployment rate2
(8) GVA per worker (1995 in 103 euros)(9) GVA per worker in agricultural sector (1995 in 103 euros)(10) Employment in agricultural sector/total employment
Variable 1991 1995 2000 2001
- 59,0 56,0 56,8 88,0 85,0 82,0 84,03.514,2 3.558,0 3.638,0 3.653,0 33,0 31,7 31,5 31,7 67,0 68,3 68,5 68,3 69,0 64,5 69,2 70,2 2,7 6,3 4,1 3,7 12,8 13,8 15,1 15,2
4,0 4,7 4,8 4,3
17,1 13,7 11,1 10,6
Year
Table 3.2.1.2 - Evolution of regional indicators, 1999-2001
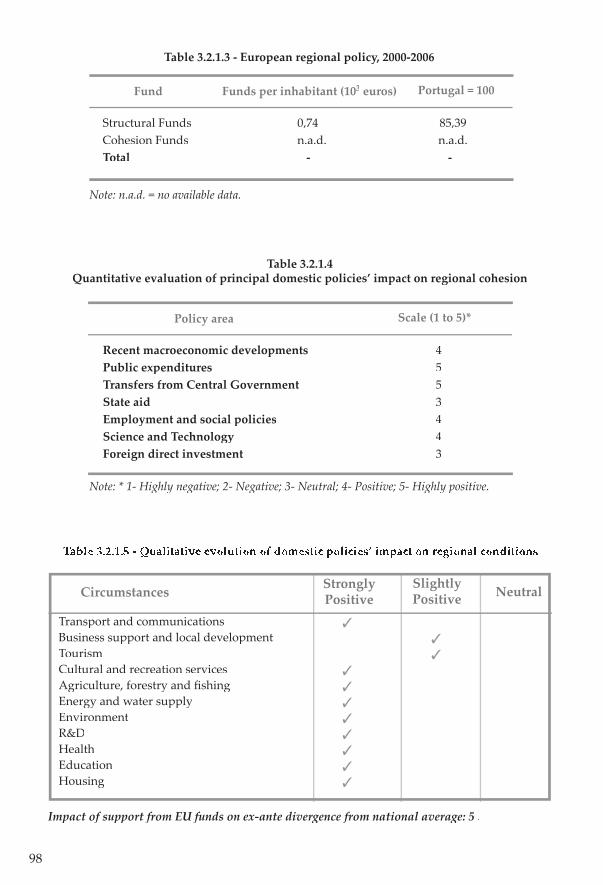
98
Note: * 1- Highly negative; 2- Negative; 3- Neutral; 4- Positive; 5- Highly positive.
Table 3.2.1.4 Quantitative evaluation of principal domestic policies’ impact on regional cohesion
Recent macroeconomic developmentsPublic expendituresTransfers from Central GovernmentState aidEmployment and social policiesScience and TechnologyForeign direct investment
Policy area
4 553443
Scale (1 to 5)*
Structural FundsCohesion FundsTotal
Fund
0,74 85,39n.a.d. n.a.d. - -
Funds per inhabitant (103 euros) Portugal = 100
Note: n.a.d. = no available data.
Table 3.2.1.3 - European regional policy, 2000-2006
Transport and communicationsBusiness support and local developmentTourismCultural and recreation services Agriculture, forestry and fi shingEnergy and water supplyEnvironmentR&DHealthEducationHousing
Circumstances Strongly Positive
Slightly Positive Neutral
Table 3.2.1.5 - Qualitative evolution of domestic policies’ impact on regional conditions
Impact of support from EU funds on ex-ante divergence from national average: 5 .
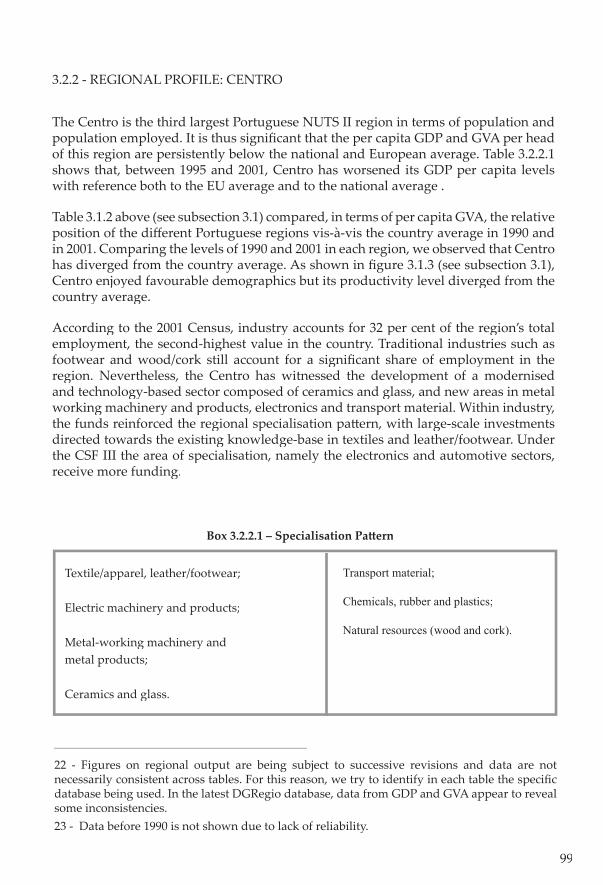
99
3.2.2 - REGIONAL PROFILE: CENTRO
The Centro is the third largest Portuguese NUTS II region in terms of population and population employed. It is thus signifi cant that the per capita GDP and GVA per head of this region are persistently below the national and European average. Table 3.2.2.1 shows that, between 1995 and 2001, Centro has worsened its GDP per capita levels with reference both to the EU average and to the national average .
Table 3.1.2 above (see subsection 3.1) compared, in terms of per capita GVA, the relative position of the diff erent Portuguese regions vis-à-vis the country average in 1990 and in 2001. Comparing the levels of 1990 and 2001 in each region, we observed that Centro has diverged from the country average. As shown in fi gure 3.1.3 (see subsection 3.1), Centro enjoyed favourable demographics but its productivity level diverged from the country average.
According to the 2001 Census, industry accounts for 32 per cent of the region’s total employment, the second-highest value in the country. Traditional industries such as footwear and wood/cork still account for a signifi cant share of employment in the region. Nevertheless, the Centro has witnessed the development of a modernised and technology-based sector composed of ceramics and glass, and new areas in metal working machinery and products, electronics and transport material. Within industry, the funds reinforced the regional specialisation pa� ern, with large-scale investments directed towards the existing knowledge-base in textiles and leather/footwear. Under the CSF III the area of specialisation, namely the electronics and automotive sectors, receive more funding.
22 - Figures on regional output are being subject to successive revisions and data are not necessarily consistent across tables. For this reason, we try to identify in each table the specifi c database being used. In the latest DGRegio database, data from GDP and GVA appear to reveal some inconsistencies. 23 - Data before 1990 is not shown due to lack of reliability.
Box 3.2.2.1 – Specialisation Pa� ern
Textile/apparel, leather/footwear;
Electric machinery and products;
Metal-working machinery and metal products;
Ceramics and glass.
Transport material;
Chemicals, rubber and plastics;
Natural resources (wood and cork).
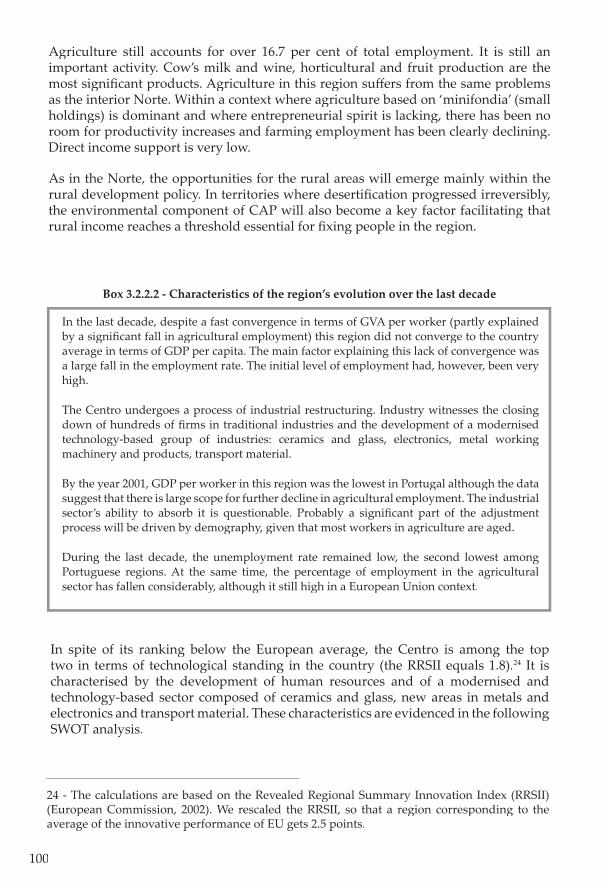
100
Agriculture still accounts for over 16.7 per cent of total employment. It is still an important activity. Cow’s milk and wine, horticultural and fruit production are the most signifi cant products. Agriculture in this region suff ers from the same problems as the interior Norte. Within a context where agriculture based on ‘minifondia’ (small holdings) is dominant and where entrepreneurial spirit is lacking, there has been no room for productivity increases and farming employment has been clearly declining. Direct income support is very low.
As in the Norte, the opportunities for the rural areas will emerge mainly within the rural development policy. In territories where desertifi cation progressed irreversibly, the environmental component of CAP will also become a key factor facilitating that rural income reaches a threshold essential for fi xing people in the region.
In spite of its ranking below the European average, the Centro is among the top two in terms of technological standing in the country (the RRSII equals 1.8).24 It is characterised by the development of human resources and of a modernised and technology-based sector composed of ceramics and glass, new areas in metals and electronics and transport material. These characteristics are evidenced in the following SWOT analysis.
24 - The calculations are based on the Revealed Regional Summary Innovation Index (RRSII) (European Commission, 2002). We rescaled the RRSII, so that a region corresponding to the average of the innovative performance of EU gets 2.5 points.
In the last decade, despite a fast convergence in terms of GVA per worker (partly explained by a signifi cant fall in agricultural employment) this region did not converge to the country average in terms of GDP per capita. The main factor explaining this lack of convergence was a large fall in the employment rate. The initial level of employment had, however, been very high.
The Centro undergoes a process of industrial restructuring. Industry witnesses the closing down of hundreds of fi rms in traditional industries and the development of a modernised technology-based group of industries: ceramics and glass, electronics, metal working machinery and products, transport material.
By the year 2001, GDP per worker in this region was the lowest in Portugal although the data suggest that there is large scope for further decline in agricultural employment. The industrial sector’s ability to absorb it is questionable. Probably a signifi cant part of the adjustment process will be driven by demography, given that most workers in agriculture are aged.
During the last decade, the unemployment rate remained low, the second lowest among Portuguese regions. At the same time, the percentage of employment in the agricultural sector has fallen considerably, although it still high in a European Union context.
Box 3.2.2.2 - Characteristics of the region’s evolution over the last decade
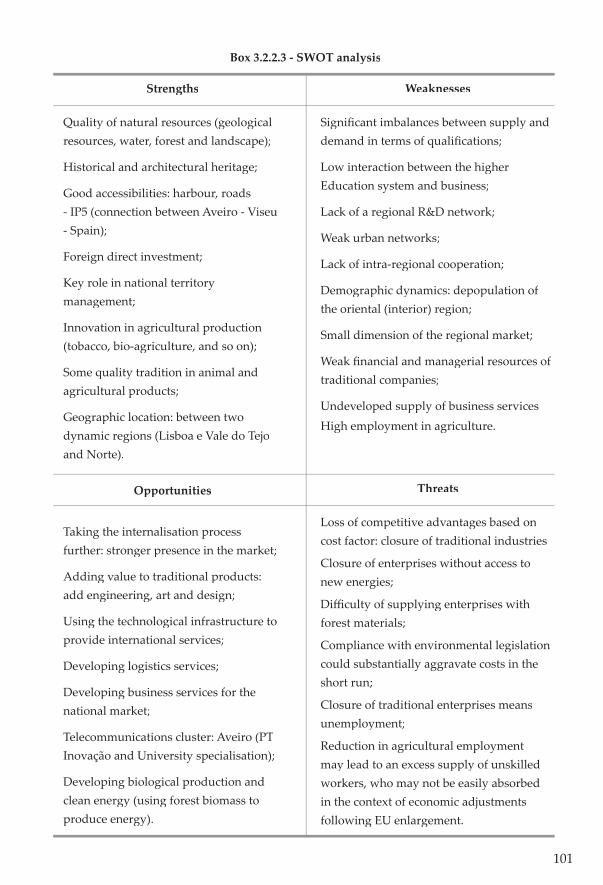
101
Strengths
Quality of natural resources (geological resources, water, forest and landscape);
Historical and architectural heritage;
Good accessibilities: harbour, roads - IP5 (connection between Aveiro - Viseu - Spain);
Foreign direct investment;
Key role in national territory management;
Innovation in agricultural production (tobacco, bio-agriculture, and so on);
Some quality tradition in animal and agricultural products;
Geographic location: between two dynamic regions (Lisboa e Vale do Tejo and Norte).
Opportunities
Taking the internalisation process further: stronger presence in the market;
Adding value to traditional products: add engineering, art and design;
Using the technological infrastructure to provide international services;
Developing logistics services;
Developing business services for the national market;
Telecommunications cluster: Aveiro (PT Inovação and University specialisation);
Developing biological production and clean energy (using forest biomass to produce energy).
Weaknesses
Signifi cant imbalances between supply and demand in terms of qualifi cations;
Low interaction between the higher Education system and business;
Lack of a regional R&D network;
Weak urban networks;
Lack of intra-regional cooperation;
Demographic dynamics: depopulation of the oriental (interior) region;
Small dimension of the regional market;
Weak fi nancial and managerial resources of traditional companies;
Undeveloped supply of business services High employment in agriculture.
Threats
Loss of competitive advantages based on cost factor: closure of traditional industries
Closure of enterprises without access to new energies;
Diffi culty of supplying enterprises with forest materials;
Compliance with environmental legislation could substantially aggravate costs in the short run;
Closure of traditional enterprises means unemployment;
Reduction in agricultural employment may lead to an excess supply of unskilled workers, who may not be easily absorbed in the context of economic adjustments following EU enlargement.
Box 3.2.2.3 - SWOT analysis
102
The Centro has received a signifi cantly large amount of public expenditures (tables 2.2.4 and 2.2.5, see section 2.2), public transfers (tables 2.3.1.1 and 2.3.1.2, see section 2.3, and table 3.2.2.2 below), and business state aid under the CSFs. These budgets are relatively positive when analysing per capita values at a country level. Furthermore, The centro’s share of the CSFs total has increased over the CSF I, II and III, mainly at the expense of Lisboa e Vale do Tejo. Table 3.2.2.3 shows fi nancing by structural funds and cohesion funds for 2000-2006.
According to the regional representatives interviewed, national policies had a highly positive impact (5) overall on regional sustainable development of the region and on intra-regional cohesion.
Table 3.2.2.4 shows the quantitative evaluation of domestic policies from the regional representatives’ perspective. Employment policy was decisive for cohesion through the recycling of competencies and fi nancial support for families. Public transfers, investments in education, in basic infrastructures and communication networks were essential to increase regional a� ractiveness overall as well as to avoid the human desertifi cation of less developed areas within the region. There is a generalised view that these transfers fostered intra-regional cohesion since the referred problems (unemployment, lack of infrastructures and accessibility) were of major concern in low income areas. State aid, business incentives for R&D and SMEs were considered important for industrial restructuring.
While macroeconomic developments and FDI were considered to have had a neutral impact on regional cohesion, public expenditures are said to have had a negative impact in spite of the relatively high amounts received in the region.
As refl ected in table 3.2.2.5, with the exception of support for business, transports, tourism and agriculture, domestic policies are considered to have had a strongly positive impact overall on a variety of areas, ranging from social to economic dimensions.
In order to improve policy effi ciency, regional representatives call for higher involvement of regional entities, private fi rms, associations and institutions in the design and implementation of policy.
Regarding Community Policies (CPs), while environmental policy had a positive impact, fi sheries and agricultural policies had a negative and a neutral impact on regional cohesion, respectively. Agriculture programmes were not able to eliminate the inherited problems from the past: very small holdings, auto-suffi ciency agriculture and low productivity.
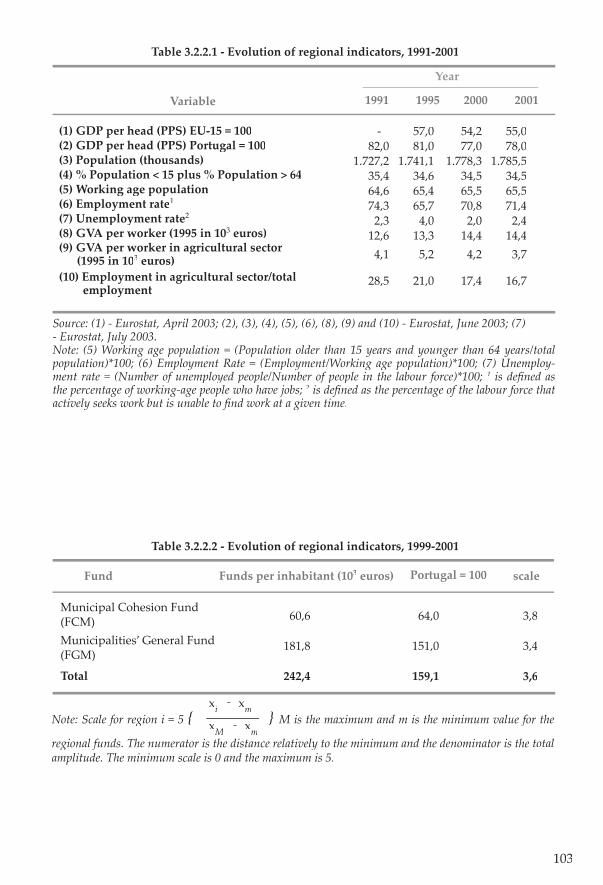
103
Source: (1) - Eurostat, April 2003; (2), (3), (4), (5), (6), (8), (9) and (10) - Eurostat, June 2003; (7) - Eurostat, July 2003. Note: (5) Working age population = (Population older than 15 years and younger than 64 years/total population)*100; (6) Employment Rate = (Employment/Working age population)*100; (7) Unemploy-ment rate = (Number of unemployed people/Number of people in the labour force)*100; 1 is defi ned as the percentage of working-age people who have jobs; 2 is defi ned as the percentage of the labour force that actively seeks work but is unable to fi nd work at a given time.
Table 3.2.2.1 - Evolution of regional indicators, 1991-2001
Municipal Cohesion Fund(FCM) Municipalities’ General Fund (FGM)
Total
Fund
60,6 64,0 3,8
181,8 151,0 3,4
242,4 159,1 3,6
Funds per inhabitant (103 euros) Portugal = 100 scale
(1) GDP per head (PPS) EU-15 = 100(2) GDP per head (PPS) Portugal = 100(3) Population (thousands)(4) % Population < 15 plus % Population > 64(5) Working age population(6) Employment rate1
(7) Unemployment rate2
(8) GVA per worker (1995 in 103 euros)(9) GVA per worker in agricultural sector (1995 in 103 euros)(10) Employment in agricultural sector/total employment
Variable 1991 1995 2000 2001
- 57,0 54,2 55,0 82,0 81,0 77,0 78,01.727,2 1.741,1 1.778,3 1.785,5 35,4 34,6 34,5 34,5 64,6 65,4 65,5 65,5 74,3 65,7 70,8 71,4 2,3 4,0 2,0 2,4 12,6 13,3 14,4 14,4 4,1 5,2 4,2 3,7
28,5 21,0 17,4 16,7
Year
Table 3.2.2.2 - Evolution of regional indicators, 1999-2001
Note: Scale for region i = 5 { } M is the maximum and m is the minimum value for the
regional funds. The numerator is the distance relatively to the minimum and the denominator is the total amplitude. The minimum scale is 0 and the maximum is 5.
xi -
xm
xM -
xm
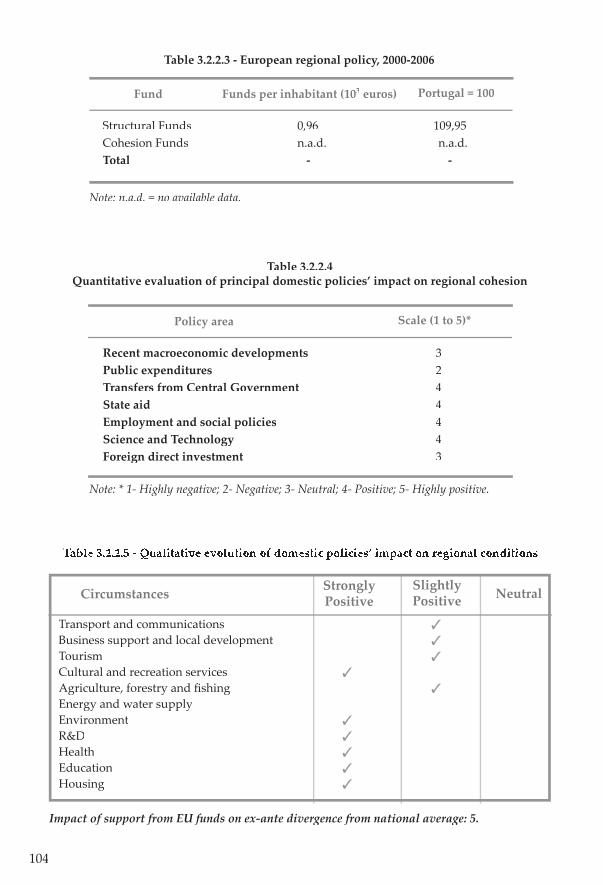
104
Note: * 1- Highly negative; 2- Negative; 3- Neutral; 4- Positive; 5- Highly positive.
Table 3.2.2.4 Quantitative evaluation of principal domestic policies’ impact on regional cohesion
Recent macroeconomic developmentsPublic expendituresTransfers from Central GovernmentState aidEmployment and social policiesScience and TechnologyForeign direct investment
Policy area
3 244443
Scale (1 to 5)*
Structural FundsCohesion FundsTotal
Fund
0,96 109,95n.a.d. n.a.d. - -
Funds per inhabitant (103 euros) Portugal = 100
Note: n.a.d. = no available data.
Table 3.2.2.3 - European regional policy, 2000-2006
Transport and communicationsBusiness support and local developmentTourismCultural and recreation services Agriculture, forestry and fi shingEnergy and water supplyEnvironmentR&DHealthEducationHousing
Circumstances Strongly Positive
Slightly Positive Neutral
Table 3.2.2.5 - Qualitative evolution of domestic policies’ impact on regional conditions
Impact of support from EU funds on ex-ante divergence from national average: 5.
105
3.2.3 - REGIONAL PROFILE: LISBOA E VALE DO TEJO
Lisboa e Vale do Tejo includes the Portuguese capital, Lisbon (Lisboa), and a surrounding area that has been very a� ractive to medium/high-tech manufacturing (e.g. automotive sector in Palmela), displaying high investment and educational dynamics. With the highest GDP per head in Portugal, Lisboa e Vale do Tejo is the only Portuguese NUTS II region which does not qualify as Objective 1. This region was covered under Objective 1 up to 1999 and has meanwhile passed the 75 per cent income threshold. Nevertheless, the unemployment rate is one of the highest in the country.
Lisboa e Vale do Tejo still enjoys not only a high productivity level but also a high employment rate and a favourable demographic structure.25 However, table 3.1.2 above (see subsection 3.1), shows that Lisboa e Vale do Tejo’s per capita GVA has decreased towards the country average between 1990-2001. As shown in fi gure 3.1.3 (see subsection 3.1), Lisboa e Vale do Tejo experienced an unfavourable demographic trend which, coupled with a neutral productivity change, implied a reversion towards the country average value.
The status of the region is related to various systemic conditions, which favour continuous development and opportunities for growth. Services account for over 60 per cent of the population employed, while the share of employment in agriculture (3.8 per cent) is the lowest in the country (see table 3.2.3.1). Probably due to conditions existing from the outset, namely strong tertiary education, high-value services, accessibilities and centrality with proximity to decision centres, the region appears to have made the best out of policy conditions.
25 - In Table A.2.1.2, the relative per capita GVA is broken down into a demographic component (working age population divided by total population) and a policy-induced component (GVA per working age person). In Columns (4) and (5), the relative GVA per working age person is broken down into GVA per worker and the employment rate.
Box 3.2.3.1 – Specialisation pa� ern
Heavy industriesServices
CommerceTransport materialNatural resources
Tourism
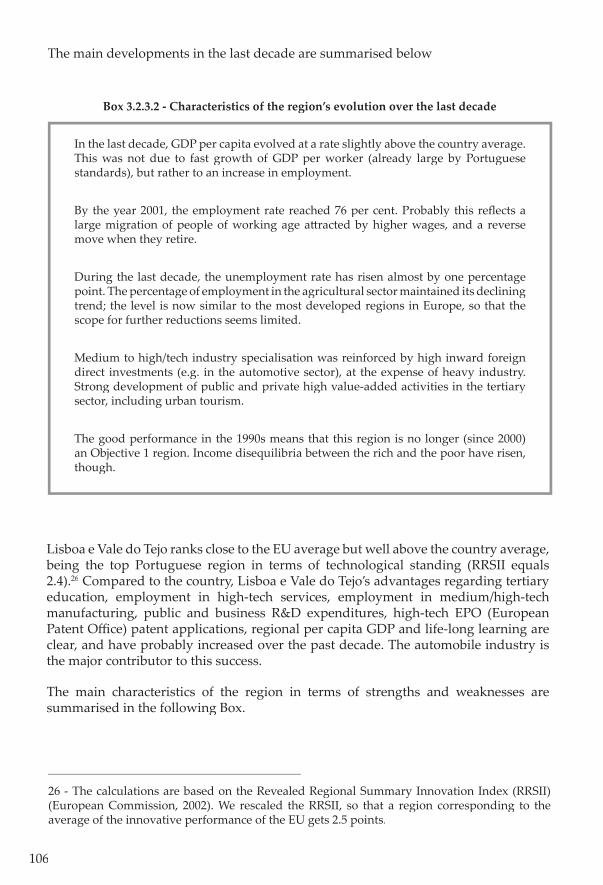
106
The main developments in the last decade are summarised below
In the last decade, GDP per capita evolved at a rate slightly above the country average. This was not due to fast growth of GDP per worker (already large by Portuguese standards), but rather to an increase in employment.
By the year 2001, the employment rate reached 76 per cent. Probably this refl ects a large migration of people of working age a� racted by higher wages, and a reverse move when they retire.
During the last decade, the unemployment rate has risen almost by one percentage point. The percentage of employment in the agricultural sector maintained its declining trend; the level is now similar to the most developed regions in Europe, so that the scope for further reductions seems limited.
Medium to high/tech industry specialisation was reinforced by high inward foreign direct investments (e.g. in the automotive sector), at the expense of heavy industry. Strong development of public and private high value-added activities in the tertiary sector, including urban tourism.
The good performance in the 1990s means that this region is no longer (since 2000) an Objective 1 region. Income disequilibria between the rich and the poor have risen, though.
Box 3.2.3.2 - Characteristics of the region’s evolution over the last decade
Lisboa e Vale do Tejo ranks close to the EU average but well above the country average, being the top Portuguese region in terms of technological standing (RRSII equals 2.4).26 Compared to the country, Lisboa e Vale do Tejo’s advantages regarding tertiary education, employment in high-tech services, employment in medium/high-tech manufacturing, public and business R&D expenditures, high-tech EPO (European Patent Offi ce) patent applications, regional per capita GDP and life-long learning are clear, and have probably increased over the past decade. The automobile industry is the major contributor to this success.
The main characteristics of the region in terms of strengths and weaknesses are summarised in the following Box.
26 - The calculations are based on the Revealed Regional Summary Innovation Index (RRSII) (European Commission, 2002). We rescaled the RRSII, so that a region corresponding to the average of the innovative performance of the EU gets 2.5 points.
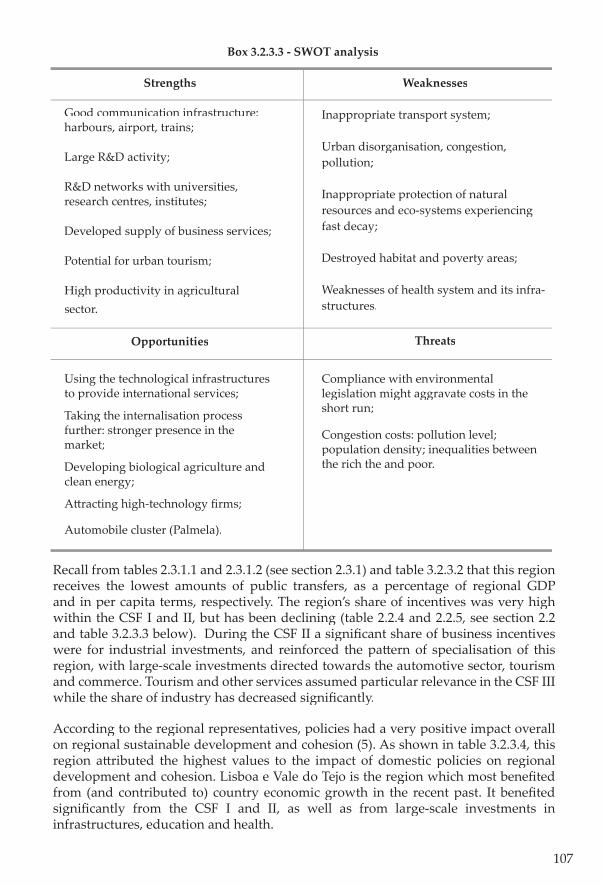
107
Strengths
Good communication infrastructure: harbours, airport, trains;
Large R&D activity;
R&D networks with universities, research centres, institutes;
Developed supply of business services;
Potential for urban tourism;
High productivity in agricultural sector.
Opportunities
Using the technological infrastructures to provide international services;
Taking the internalisation process further: stronger presence in the market;
Developing biological agriculture and clean energy;
A� racting high-technology fi rms;
Automobile cluster (Palmela).
Weaknesses
Inappropriate transport system;
Urban disorganisation, congestion, pollution;
Inappropriate protection of natural resources and eco-systems experiencing fast decay;
Destroyed habitat and poverty areas;
Weaknesses of health system and its infra-structures.
Threats
Compliance with environmental legislation might aggravate costs in the short run;
Congestion costs: pollution level; population density; inequalities between the rich the and poor.
Box 3.2.3.3 - SWOT analysis
Recall from tables 2.3.1.1 and 2.3.1.2 (see section 2.3.1) and table 3.2.3.2 that this region receives the lowest amounts of public transfers, as a percentage of regional GDP and in per capita terms, respectively. The region’s share of incentives was very high within the CSF I and II, but has been declining (table 2.2.4 and 2.2.5, see section 2.2 and table 3.2.3.3 below). During the CSF II a signifi cant share of business incentives were for industrial investments, and reinforced the pa� ern of specialisation of this region, with large-scale investments directed towards the automotive sector, tourism and commerce. Tourism and other services assumed particular relevance in the CSF III while the share of industry has decreased signifi cantly.
According to the regional representatives, policies had a very positive impact overall on regional sustainable development and cohesion (5). As shown in table 3.2.3.4, this region a� ributed the highest values to the impact of domestic policies on regional development and cohesion. Lisboa e Vale do Tejo is the region which most benefi ted from (and contributed to) country economic growth in the recent past. It benefi ted signifi cantly from the CSF I and II, as well as from large-scale investments in infrastructures, education and health.
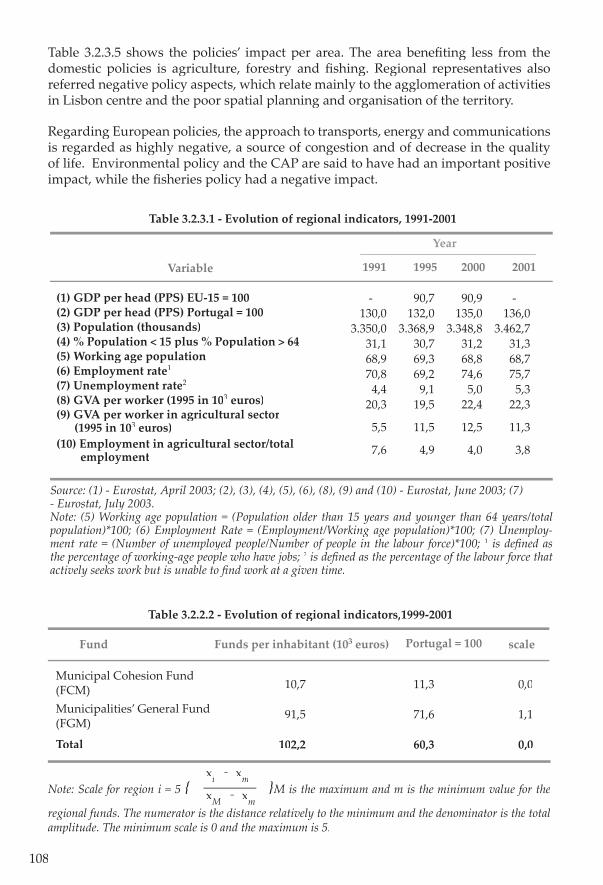
108
Table 3.2.3.5 shows the policies’ impact per area. The area benefi ting less from the domestic policies is agriculture, forestry and fi shing. Regional representatives also referred negative policy aspects, which relate mainly to the agglomeration of activities in Lisbon centre and the poor spatial planning and organisation of the territory.
Regarding European policies, the approach to transports, energy and communications is regarded as highly negative, a source of congestion and of decrease in the quality of life. Environmental policy and the CAP are said to have had an important positive impact, while the fi sheries policy had a negative impact.
Source: (1) - Eurostat, April 2003; (2), (3), (4), (5), (6), (8), (9) and (10) - Eurostat, June 2003; (7) - Eurostat, July 2003. Note: (5) Working age population = (Population older than 15 years and younger than 64 years/total population)*100; (6) Employment Rate = (Employment/Working age population)*100; (7) Unemploy-ment rate = (Number of unemployed people/Number of people in the labour force)*100; 1 is defi ned as the percentage of working-age people who have jobs; 2 is defi ned as the percentage of the labour force that actively seeks work but is unable to fi nd work at a given time.
Table 3.2.3.1 - Evolution of regional indicators, 1991-2001
Municipal Cohesion Fund(FCM) Municipalities’ General Fund (FGM)
Total
Fund
10,7 11,3 0,0
91,5 71,6 1,1
102,2 60,3 0,0
Funds per inhabitant (103 euros) Portugal = 100 scale
(1) GDP per head (PPS) EU-15 = 100(2) GDP per head (PPS) Portugal = 100(3) Population (thousands)(4) % Population < 15 plus % Population > 64(5) Working age population(6) Employment rate1
(7) Unemployment rate2
(8) GVA per worker (1995 in 103 euros)(9) GVA per worker in agricultural sector (1995 in 103 euros)(10) Employment in agricultural sector/total employment
Variable 1991 1995 2000 2001
- 90,7 90,9 - 130,0 132,0 135,0 136,03.350,0 3.368,9 3.348,8 3.462,7 31,1 30,7 31,2 31,3 68,9 69,3 68,8 68,7 70,8 69,2 74,6 75,7 4,4 9,1 5,0 5,3 20,3 19,5 22,4 22,3
5,5 11,5 12,5 11,3
7,6 4,9 4,0 3,8
Year
Table 3.2.2.2 - Evolution of regional indicators,1999-2001
Note: Scale for region i = 5 { }M is the maximum and m is the minimum value for the
regional funds. The numerator is the distance relatively to the minimum and the denominator is the total amplitude. The minimum scale is 0 and the maximum is 5.
xi -
xm
xM -
xm
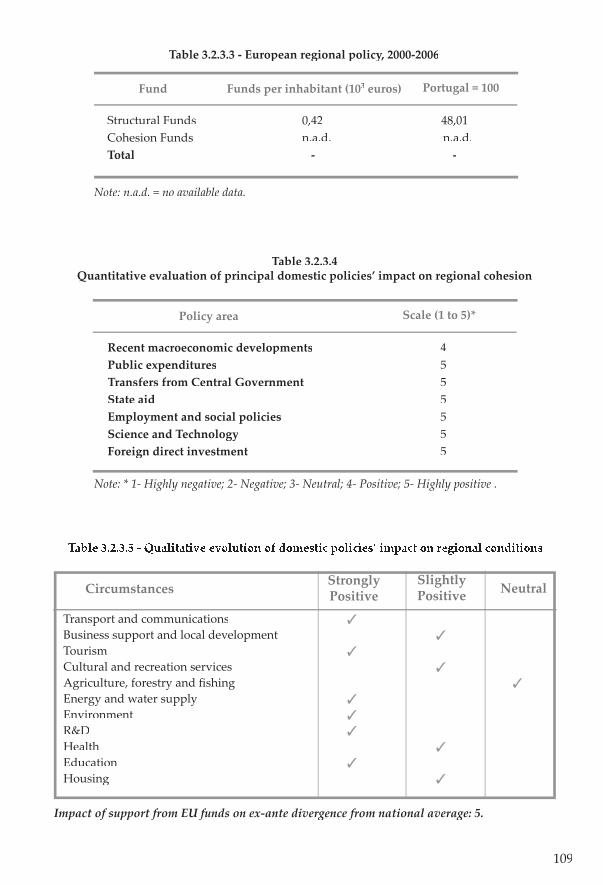
109
Note: * 1- Highly negative; 2- Negative; 3- Neutral; 4- Positive; 5- Highly positive .
Table 3.2.3.4 Quantitative evaluation of principal domestic policies’ impact on regional cohesion
Recent macroeconomic developmentsPublic expendituresTransfers from Central GovernmentState aidEmployment and social policiesScience and TechnologyForeign direct investment
Policy area
4 555555
Scale (1 to 5)*
Structural FundsCohesion FundsTotal
Fund
0,42 48,01n.a.d. n.a.d. - -
Funds per inhabitant (103 euros) Portugal = 100
Note: n.a.d. = no available data.
Table 3.2.3.3 - European regional policy, 2000-2006
Transport and communicationsBusiness support and local developmentTourismCultural and recreation services Agriculture, forestry and fi shingEnergy and water supplyEnvironmentR&DHealthEducationHousing
Circumstances Strongly Positive
Slightly Positive Neutral
Table 3.2.3.5 - Qualitative evolution of domestic policies’ impact on regional conditions
Impact of support from EU funds on ex-ante divergence from national average: 5.
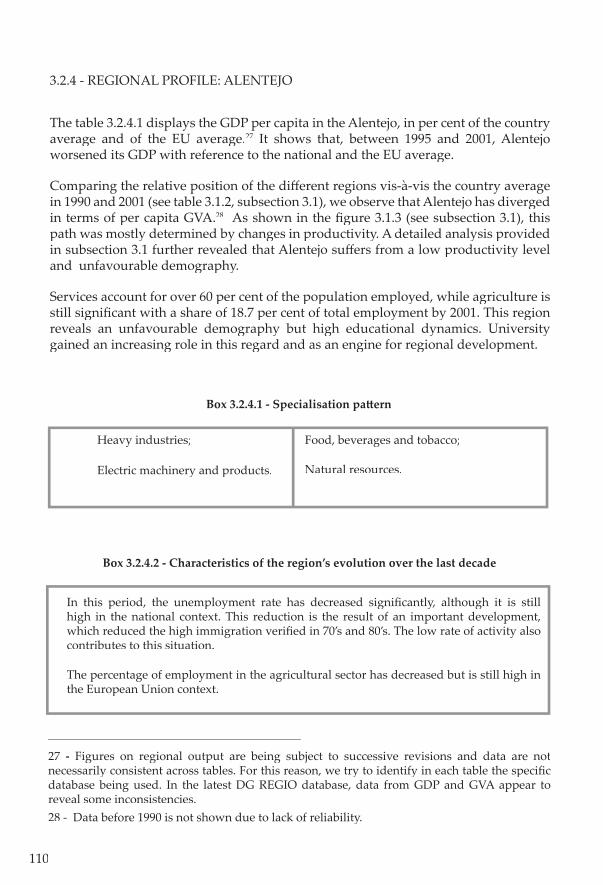
110
3.2.4 - REGIONAL PROFILE: ALENTEJO
The table 3.2.4.1 displays the GDP per capita in the Alentejo, in per cent of the country average and of the EU average.27 It shows that, between 1995 and 2001, Alentejo worsened its GDP with reference to the national and the EU average.
Comparing the relative position of the diff erent regions vis-à-vis the country average in 1990 and 2001 (see table 3.1.2, subsection 3.1), we observe that Alentejo has diverged in terms of per capita GVA.28 As shown in the fi gure 3.1.3 (see subsection 3.1), this path was mostly determined by changes in productivity. A detailed analysis provided in subsection 3.1 further revealed that Alentejo suff ers from a low productivity level and unfavourable demography.
Services account for over 60 per cent of the population employed, while agriculture is still signifi cant with a share of 18.7 per cent of total employment by 2001. This region reveals an unfavourable demography but high educational dynamics. University gained an increasing role in this regard and as an engine for regional development.
27 - Figures on regional output are being subject to successive revisions and data are not necessarily consistent across tables. For this reason, we try to identify in each table the specifi c database being used. In the latest DG REGIO database, data from GDP and GVA appear to reveal some inconsistencies. 28 - Data before 1990 is not shown due to lack of reliability.
In this period, the unemployment rate has decreased signifi cantly, although it is still high in the national context. This reduction is the result of an important development, which reduced the high immigration verifi ed in 70’s and 80’s. The low rate of activity also contributes to this situation.
The percentage of employment in the agricultural sector has decreased but is still high in the European Union context.
Box 3.2.4.2 - Characteristics of the region’s evolution over the last decade
Box 3.2.4.1 - Specialisation pa� ern
Heavy industries;
Electric machinery and products.
Food, beverages and tobacco;
Natural resources.
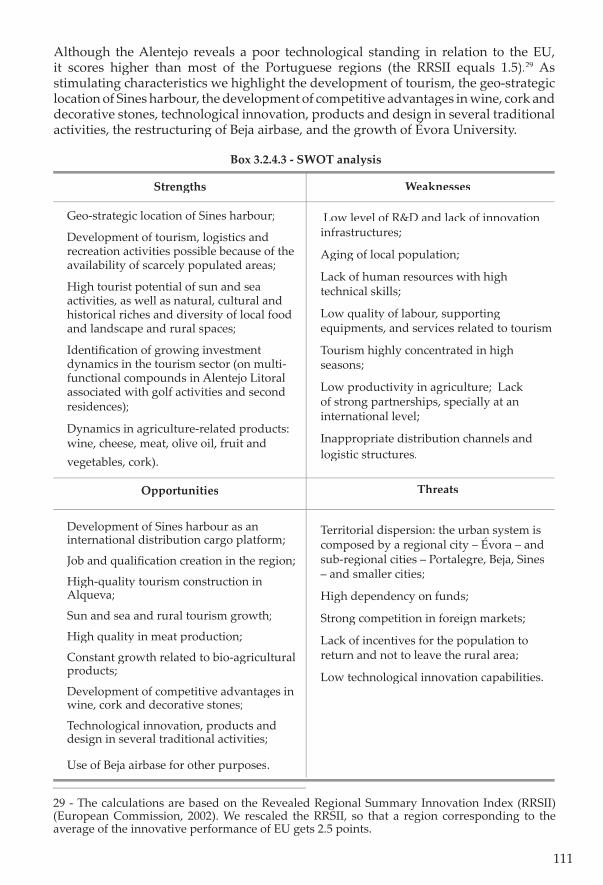
111
Although the Alentejo reveals a poor technological standing in relation to the EU, it scores higher than most of the Portuguese regions (the RRSII equals 1.5).29 As stimulating characteristics we highlight the development of tourism, the geo-strategic location of Sines harbour, the development of competitive advantages in wine, cork and decorative stones, technological innovation, products and design in several traditional activities, the restructuring of Beja airbase, and the growth of Évora University.decorative stones, technological innovation, products and design in several traditional activities, the restructuring of Beja airbase, and the growth of Évora University.decorative stones, technological innovation, products and design in several traditional
Box 3.2.4.3 - SWOT analysis
Strengths
Geo-strategic location of Sines harbour;
Development of tourism, logistics and recreation activities possible because of the availability of scarcely populated areas;
High tourist potential of sun and sea activities, as well as natural, cultural and historical riches and diversity of local food and landscape and rural spaces;
Identifi cation of growing investment dynamics in the tourism sector (on multi-functional compounds in Alentejo Litoral associated with golf activities and second residences);
Dynamics in agriculture-related products: wine, cheese, meat, olive oil, fruit and vegetables, cork).
Opportunities
Development of Sines harbour as an international distribution cargo platform;
Job and qualifi cation creation in the region;
High-quality tourism construction in Alqueva;
Sun and sea and rural tourism growth;
High quality in meat production;
Constant growth related to bio-agricultural products;
Development of competitive advantages in wine, cork and decorative stones;
Technological innovation, products and design in several traditional activities;
Use of Beja airbase for other purposes.
Weaknesses
Low level of R&D and lack of innovation infrastructures;
Aging of local population;
Lack of human resources with high technical skills;
Low quality of labour, supporting equipments, and services related to tourism
Tourism highly concentrated in high seasons;
Low productivity in agriculture; Lack of strong partnerships, specially at an international level;
Inappropriate distribution channels and logistic structures.
Threats
Territorial dispersion: the urban system is composed by a regional city – Évora – and sub-regional cities – Portalegre, Beja, Sines – and smaller cities;
High dependency on funds;
Strong competition in foreign markets;
Lack of incentives for the population to return and not to leave the rural area;
Low technological innovation capabilities.
29 - The calculations are based on the Revealed Regional Summary Innovation Index (RRSII) (European Commission, 2002). We rescaled the RRSII, so that a region corresponding to the average of the innovative performance of EU gets 2.5 points.
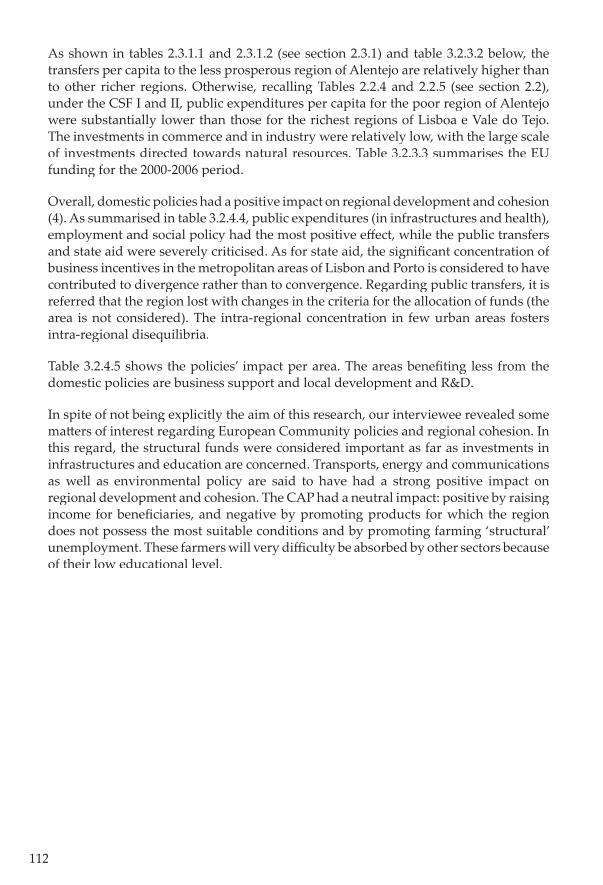
112
As shown in tables 2.3.1.1 and 2.3.1.2 (see section 2.3.1) and table 3.2.3.2 below, the transfers per capita to the less prosperous region of Alentejo are relatively higher than to other richer regions. Otherwise, recalling Tables 2.2.4 and 2.2.5 (see section 2.2), under the CSF I and II, public expenditures per capita for the poor region of Alentejo were substantially lower than those for the richest regions of Lisboa e Vale do Tejo. The investments in commerce and in industry were relatively low, with the large scale of investments directed towards natural resources. Table 3.2.3.3 summarises the EU funding for the 2000-2006 period.
Overall, domestic policies had a positive impact on regional development and cohesion (4). As summarised in table 3.2.4.4, public expenditures (in infrastructures and health), employment and social policy had the most positive eff ect, while the public transfers and state aid were severely criticised. As for state aid, the signifi cant concentration of business incentives in the metropolitan areas of Lisbon and Porto is considered to have contributed to divergence rather than to convergence. Regarding public transfers, it is referred that the region lost with changes in the criteria for the allocation of funds (the area is not considered). The intra-regional concentration in few urban areas fosters intra-regional disequilibria.
Table 3.2.4.5 shows the policies’ impact per area. The areas benefi ting less from the domestic policies are business support and local development and R&D.
In spite of not being explicitly the aim of this research, our interviewee revealed some ma� ers of interest regarding European Community policies and regional cohesion. In this regard, the structural funds were considered important as far as investments in infrastructures and education are concerned. Transports, energy and communications as well as environmental policy are said to have had a strong positive impact on regional development and cohesion. The CAP had a neutral impact: positive by raising income for benefi ciaries, and negative by promoting products for which the region does not possess the most suitable conditions and by promoting farming ‘structural’ unemployment. These farmers will very diffi culty be absorbed by other sectors because of their low educational level.
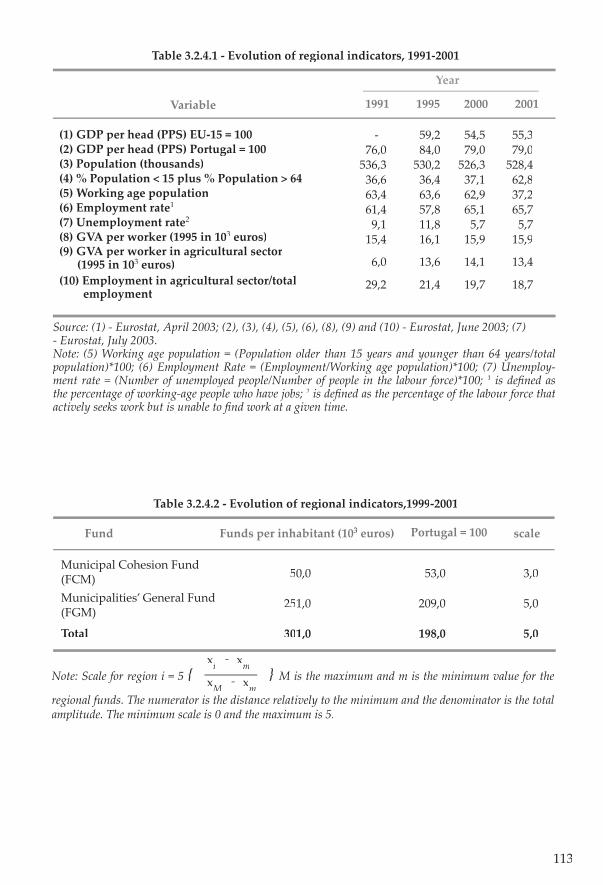
113
Source: (1) - Eurostat, April 2003; (2), (3), (4), (5), (6), (8), (9) and (10) - Eurostat, June 2003; (7) - Eurostat, July 2003. Note: (5) Working age population = (Population older than 15 years and younger than 64 years/total population)*100; (6) Employment Rate = (Employment/Working age population)*100; (7) Unemploy-ment rate = (Number of unemployed people/Number of people in the labour force)*100; 1 is defi ned as the percentage of working-age people who have jobs; 2 is defi ned as the percentage of the labour force that actively seeks work but is unable to fi nd work at a given time.
Table 3.2.4.1 - Evolution of regional indicators, 1991-2001
(1) GDP per head (PPS) EU-15 = 100(2) GDP per head (PPS) Portugal = 100(3) Population (thousands)(4) % Population < 15 plus % Population > 64(5) Working age population(6) Employment rate1
(7) Unemployment rate2
(8) GVA per worker (1995 in 103 euros)(9) GVA per worker in agricultural sector (1995 in 103 euros)(10) Employment in agricultural sector/total employment
Variable 1991 1995 2000 2001
- 59,2 54,5 55,3 76,0 84,0 79,0 79,0 536,3 530,2 526,3 528,4 36,6 36,4 37,1 62,8 63,4 63,6 62,9 37,2 61,4 57,8 65,1 65,7 9,1 11,8 5,7 5,7 15,4 16,1 15,9 15,9
6,0 13,6 14,1 13,4
29,2 21,4 19,7 18,7
Year
Municipal Cohesion Fund(FCM) Municipalities’ General Fund (FGM)
Total
Fund
50,0 53,0 3,0
251,0 209,0 5,0
301,0 198,0 5,0
Funds per inhabitant (103 euros) Portugal = 100 scale
Table 3.2.4.2 - Evolution of regional indicators,1999-2001
Note: Scale for region i = 5 { } M is the maximum and m is the minimum value for the
regional funds. The numerator is the distance relatively to the minimum and the denominator is the total amplitude. The minimum scale is 0 and the maximum is 5.
xi -
xm
xM -
xm
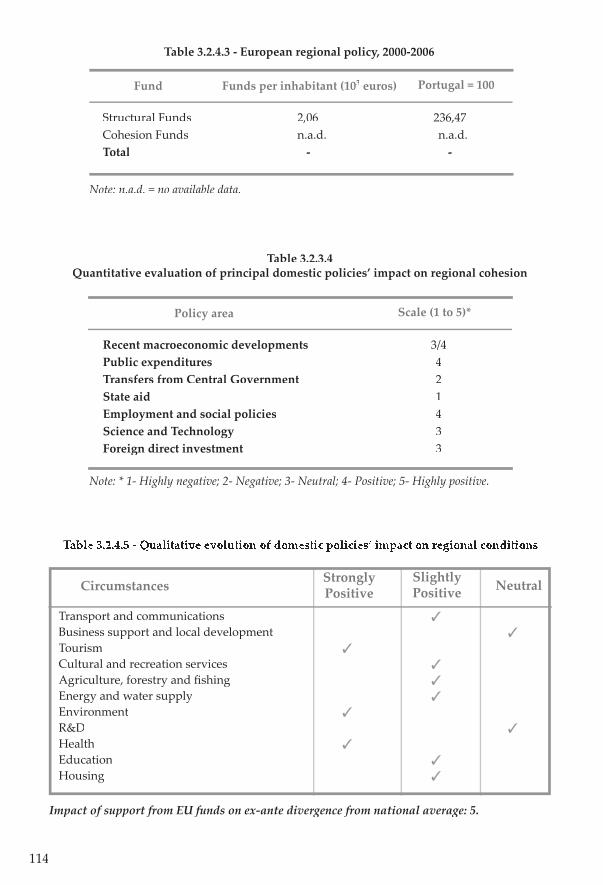
114
Note: * 1- Highly negative; 2- Negative; 3- Neutral; 4- Positive; 5- Highly positive.
Table 3.2.3.4 Quantitative evaluation of principal domestic policies’ impact on regional cohesion
Recent macroeconomic developmentsPublic expendituresTransfers from Central GovernmentState aidEmployment and social policiesScience and TechnologyForeign direct investment
Policy area
3/4 421433
Scale (1 to 5)*
Structural FundsCohesion FundsTotal
Fund
2,06 236,47n.a.d. n.a.d. - -
Funds per inhabitant (103 euros) Portugal = 100
Note: n.a.d. = no available data.
Table 3.2.4.3 - European regional policy, 2000-2006
Transport and communicationsBusiness support and local developmentTourismCultural and recreation services Agriculture, forestry and fi shingEnergy and water supplyEnvironmentR&DHealthEducationHousing
Circumstances Strongly Positive
Slightly Positive Neutral
Table 3.2.4.5 - Qualitative evolution of domestic policies’ impact on regional conditions
Impact of support from EU funds on ex-ante divergence from national average: 5.
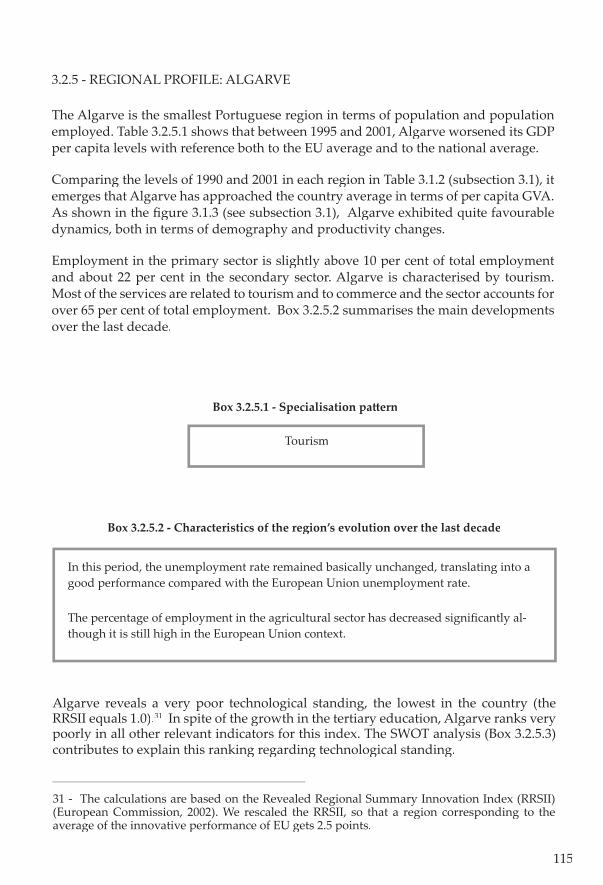
115
In this period, the unemployment rate remained basically unchanged, translating into a good performance compared with the European Union unemployment rate.
The percentage of employment in the agricultural sector has decreased signifi cantly al-though it is still high in the European Union context.
Box 3.2.5.2 - Characteristics of the region’s evolution over the last decade
Box 3.2.5.1 - Specialisation pa� ern
Tourism
3.2.5 - REGIONAL PROFILE: ALGARVE
The Algarve is the smallest Portuguese region in terms of population and population employed. Table 3.2.5.1 shows that between 1995 and 2001, Algarve worsened its GDP per capita levels with reference both to the EU average and to the national average.
Comparing the levels of 1990 and 2001 in each region in Table 3.1.2 (subsection 3.1), it emerges that Algarve has approached the country average in terms of per capita GVA. As shown in the fi gure 3.1.3 (see subsection 3.1), Algarve exhibited quite favourable dynamics, both in terms of demography and productivity changes.
Employment in the primary sector is slightly above 10 per cent of total employment and about 22 per cent in the secondary sector. Algarve is characterised by tourism. Most of the services are related to tourism and to commerce and the sector accounts for over 65 per cent of total employment. Box 3.2.5.2 summarises the main developments over the last decade.
Algarve reveals a very poor technological standing, the lowest in the country (the RRSII equals 1.0).31 In spite of the growth in the tertiary education, Algarve ranks very poorly in all other relevant indicators for this index. The SWOT analysis (Box 3.2.5.3) contributes to explain this ranking regarding technological standing.
31 - The calculations are based on the Revealed Regional Summary Innovation Index (RRSII) (European Commission, 2002). We rescaled the RRSII, so that a region corresponding to the average of the innovative performance of EU gets 2.5 points.
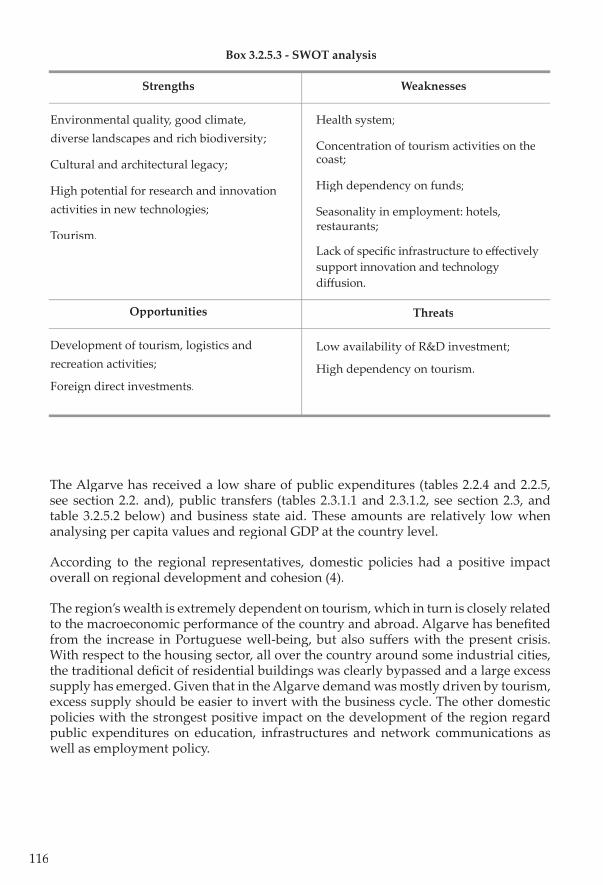
116
The Algarve has received a low share of public expenditures (tables 2.2.4 and 2.2.5, see section 2.2. and), public transfers (tables 2.3.1.1 and 2.3.1.2, see section 2.3, and table 3.2.5.2 below) and business state aid. These amounts are relatively low when analysing per capita values and regional GDP at the country level.
According to the regional representatives, domestic policies had a positive impact overall on regional development and cohesion (4).
The region’s wealth is extremely dependent on tourism, which in turn is closely related to the macroeconomic performance of the country and abroad. Algarve has benefi ted from the increase in Portuguese well-being, but also suff ers with the present crisis. With respect to the housing sector, all over the country around some industrial cities, the traditional defi cit of residential buildings was clearly bypassed and a large excess supply has emerged. Given that in the Algarve demand was mostly driven by tourism, excess supply should be easier to invert with the business cycle. The other domestic policies with the strongest positive impact on the development of the region regard public expenditures on education, infrastructures and network communications as well as employment policy.
Strengths
Environmental quality, good climate, diverse landscapes and rich biodiversity;
Cultural and architectural legacy;
High potential for research and innovation activities in new technologies;
Tourism.
Opportunities
Development of tourism, logistics and recreation activities;
Foreign direct investments.
Weaknesses
Health system;
Concentration of tourism activities on thecoast;
High dependency on funds;
Seasonality in employment: hotels,restaurants;
Lack of specifi c infrastructure to eff ectively support innovation and technology diff usion.
Threats
Low availability of R&D investment;
High dependency on tourism.
Box 3.2.5.3 - SWOT analysis
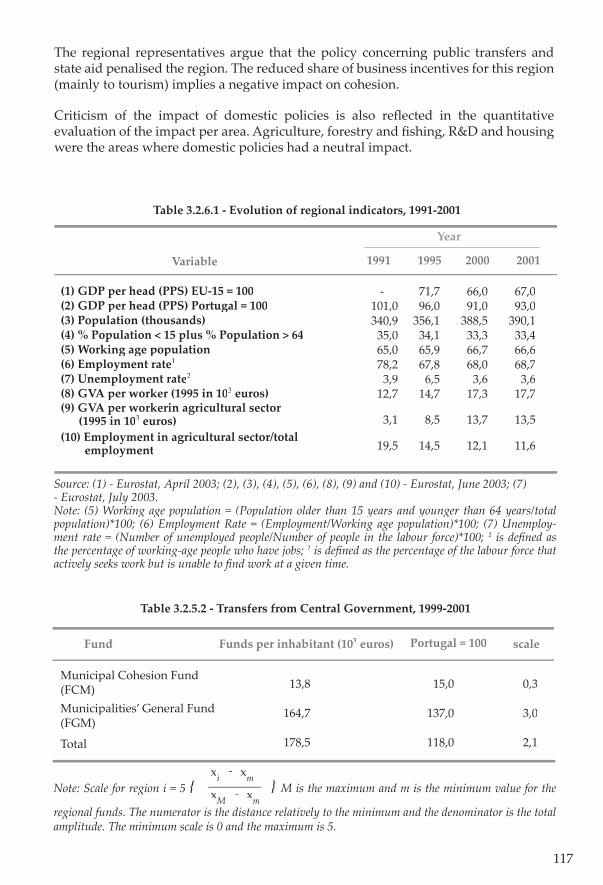
117
Source: (1) - Eurostat, April 2003; (2), (3), (4), (5), (6), (8), (9) and (10) - Eurostat, June 2003; (7) - Eurostat, July 2003. Note: (5) Working age population = (Population older than 15 years and younger than 64 years/total population)*100; (6) Employment Rate = (Employment/Working age population)*100; (7) Unemploy-ment rate = (Number of unemployed people/Number of people in the labour force)*100; 1 is defi ned as the percentage of working-age people who have jobs; 2 is defi ned as the percentage of the labour force that actively seeks work but is unable to fi nd work at a given time.
Table 3.2.6.1 - Evolution of regional indicators, 1991-2001
(1) GDP per head (PPS) EU-15 = 100(2) GDP per head (PPS) Portugal = 100(3) Population (thousands)(4) % Population < 15 plus % Population > 64(5) Working age population(6) Employment rate1
(7) Unemployment rate2
(8) GVA per worker (1995 in 103 euros)(9) GVA per workerin agricultural sector (1995 in 103 euros)(10) Employment in agricultural sector/total employment
Variable 1991 1995 2000 2001
- 71,7 66,0 67,0101,0 96,0 91,0 93,0340,9 356,1 388,5 390,1 35,0 34,1 33,3 33,4 65,0 65,9 66,7 66,6 78,2 67,8 68,0 68,7 3,9 6,5 3,6 3,6 12,7 14,7 17,3 17,7
3,1 8,5 13,7 13,5
19,5 14,5 12,1 11,6
Year
Table 3.2.5.2 - Transfers from Central Government, 1999-2001
Municipal Cohesion Fund(FCM) Municipalities’ General Fund (FGM)
Total
Fund
13,8 15,0 0,3
164,7 137,0 3,0
178,5 118,0 2,1
Funds per inhabitant (103 euros) Portugal = 100 scale
The regional representatives argue that the policy concerning public transfers and state aid penalised the region. The reduced share of business incentives for this region (mainly to tourism) implies a negative impact on cohesion.
Criticism of the impact of domestic policies is also refl ected in the quantitative evaluation of the impact per area. Agriculture, forestry and fi shing, R&D and housing were the areas where domestic policies had a neutral impact.
Note: Scale for region i = 5 { } M is the maximum and m is the minimum value for the
regional funds. The numerator is the distance relatively to the minimum and the denominator is the total amplitude. The minimum scale is 0 and the maximum is 5.
xi -
xm
xM -
xm
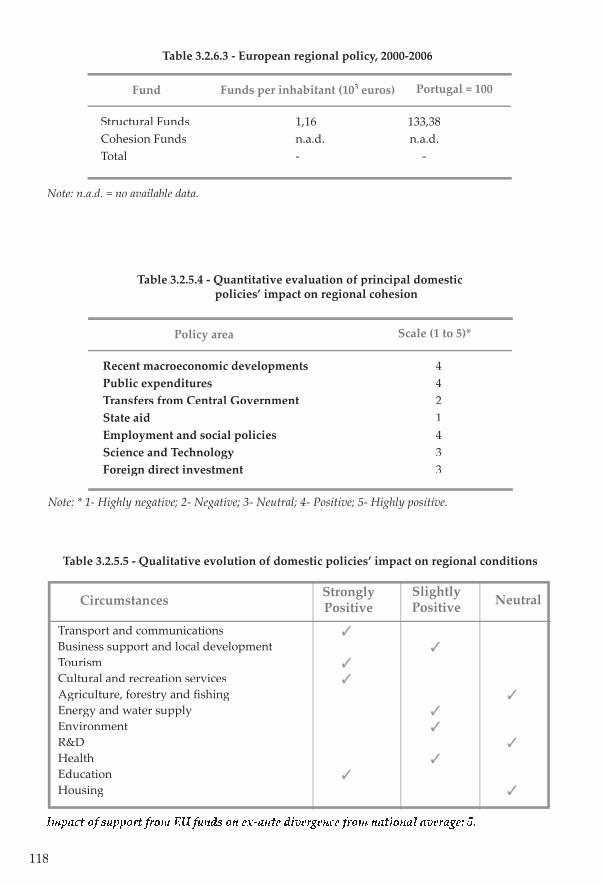
118
Table 3.2.5.5 - Qualitative evolution of domestic policies’ impact on regional conditions
Note: * 1- Highly negative; 2- Negative; 3- Neutral; 4- Positive; 5- Highly positive.
Table 3.2.5.4 - Quantitative evaluation of principal domestic policies’ impact on regional cohesion
Recent macroeconomic developmentsPublic expendituresTransfers from Central GovernmentState aidEmployment and social policiesScience and TechnologyForeign direct investment
Policy area
4 421433
Scale (1 to 5)*
Structural FundsCohesion FundsTotal
Fund
1,16 133,38n.a.d. n.a.d.- -
Funds per inhabitant (103 euros) Portugal = 100
Note: n.a.d. = no available data.
Table 3.2.6.3 - European regional policy, 2000-2006
Transport and communicationsBusiness support and local developmentTourismCultural and recreation services Agriculture, forestry and fi shingEnergy and water supplyEnvironmentR&DHealthEducationHousing
Circumstances Strongly Positive
Slightly Positive Neutral
Impact of support from EU funds on ex-ante divergence from national average: 5.
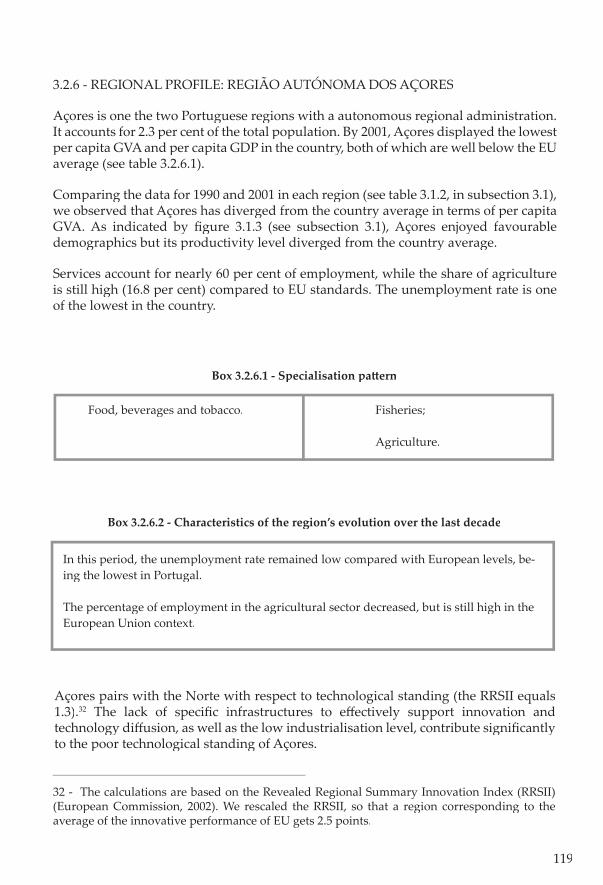
119
Açores pairs with the Norte with respect to technological standing (the RRSII equals 1.3).32 The lack of specifi c infrastructures to eff ectively support innovation and technology diff usion, as well as the low industrialisation level, contribute signifi cantly to the poor technological standing of Açores.
32 - The calculations are based on the Revealed Regional Summary Innovation Index (RRSII) (European Commission, 2002). We rescaled the RRSII, so that a region corresponding to the average of the innovative performance of EU gets 2.5 points.
In this period, the unemployment rate remained low compared with European levels, be-ing the lowest in Portugal.
The percentage of employment in the agricultural sector decreased, but is still high in the European Union context.
Box 3.2.6.2 - Characteristics of the region’s evolution over the last decade
Box 3.2.6.1 - Specialisation pa� ern
Food, beverages and tobacco. Fisheries;
Agriculture.
3.2.6 - REGIONAL PROFILE: REGIÃO AUTÓNOMA DOS AÇORES
Açores is one the two Portuguese regions with a autonomous regional administration. It accounts for 2.3 per cent of the total population. By 2001, Açores displayed the lowest per capita GVA and per capita GDP in the country, both of which are well below the EU average (see table 3.2.6.1).
Comparing the data for 1990 and 2001 in each region (see table 3.1.2, in subsection 3.1), we observed that Açores has diverged from the country average in terms of per capita GVA. As indicated by fi gure 3.1.3 (see subsection 3.1), Açores enjoyed favourable demographics but its productivity level diverged from the country average.
Services account for nearly 60 per cent of employment, while the share of agriculture is still high (16.8 per cent) compared to EU standards. The unemployment rate is one of the lowest in the country.
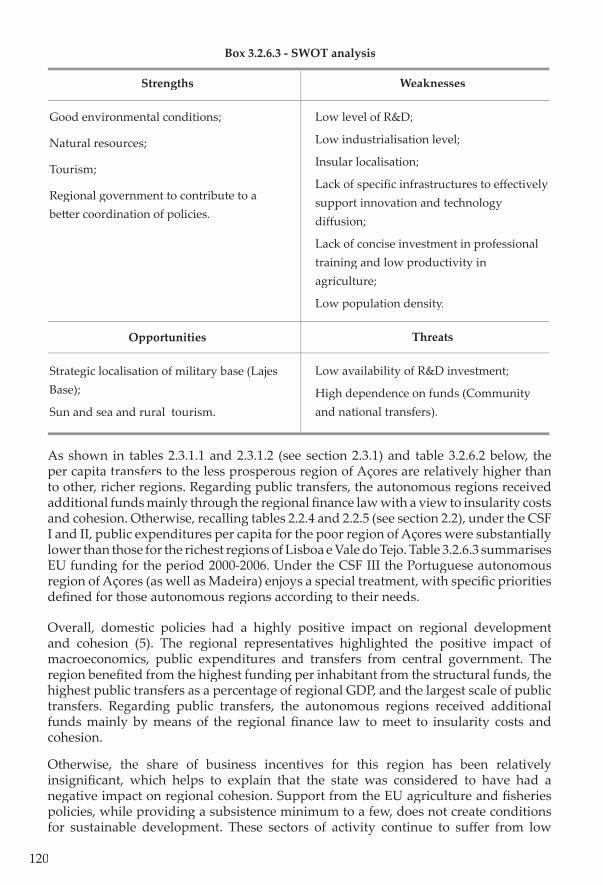
120
As shown in tables 2.3.1.1 and 2.3.1.2 (see section 2.3.1) and table 3.2.6.2 below, the per capita transfers to the less prosperous region of Açores are relatively higher than to other, richer regions. Regarding public transfers, the autonomous regions received additional funds mainly through the regional fi nance law with a view to insularity costs and cohesion. Otherwise, recalling tables 2.2.4 and 2.2.5 (see section 2.2), under the CSF I and II, public expenditures per capita for the poor region of Açores were substantially lower than those for the richest regions of Lisboa e Vale do Tejo. Table 3.2.6.3 summarises EU funding for the period 2000-2006. Under the CSF III the Portuguese autonomous region of Açores (as well as Madeira) enjoys a special treatment, with specifi c priorities defi ned for those autonomous regions according to their needs.
Overall, domestic policies had a highly positive impact on regional development and cohesion (5). The regional representatives highlighted the positive impact of macroeconomics, public expenditures and transfers from central government. The region benefi ted from the highest funding per inhabitant from the structural funds, the highest public transfers as a percentage of regional GDP, and the largest scale of public transfers. Regarding public transfers, the autonomous regions received additional funds mainly by means of the regional fi nance law to meet to insularity costs and cohesion.
Otherwise, the share of business incentives for this region has been relatively insignifi cant, which helps to explain that the state was considered to have had a negative impact on regional cohesion. Support from the EU agriculture and fi sheries policies, while providing a subsistence minimum to a few, does not create conditions for sustainable development. These sectors of activity continue to suff er from low
Strengths
Good environmental conditions;
Natural resources;
Tourism;
Regional government to contribute to a be� er coordination of policies.
Opportunities
Strategic localisation of military base (Lajes Base);
Sun and sea and rural tourism.
Weaknesses
Low level of R&D;
Low industrialisation level;
Insular localisation;
Lack of specifi c infrastructures to eff ectively support innovation and technology diff usion;
Lack of concise investment in professional training and low productivity in agriculture;
Low population density.
Threats
Low availability of R&D investment;
High dependence on funds (Community and national transfers).
Box 3.2.6.3 - SWOT analysis
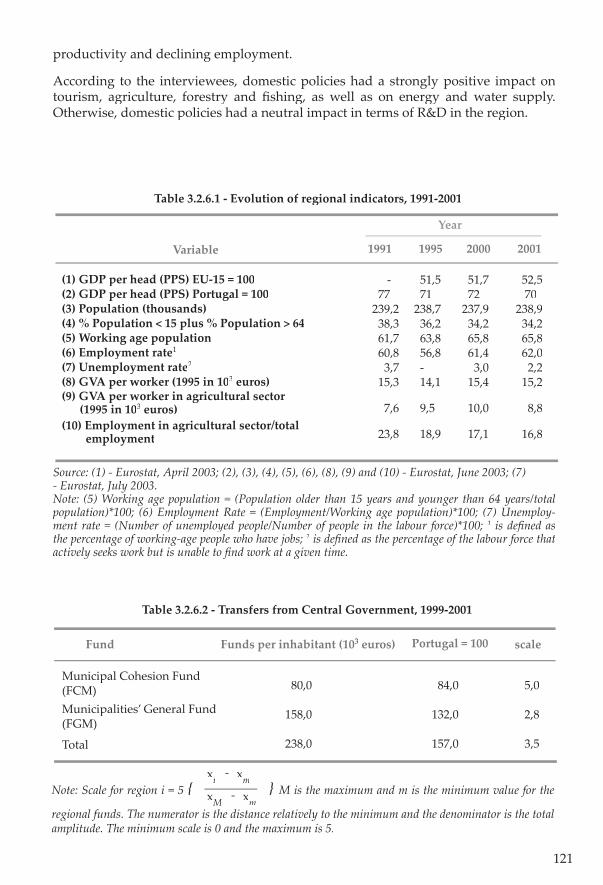
121
Table 3.2.6.2 - Transfers from Central Government, 1999-2001
Municipal Cohesion Fund(FCM) Municipalities’ General Fund (FGM)
Total
Fund
80,0 84,0 5,0
158,0 132,0 2,8
238,0 157,0 3,5
Funds per inhabitant (103 euros) Portugal = 100 scale
Source: (1) - Eurostat, April 2003; (2), (3), (4), (5), (6), (8), (9) and (10) - Eurostat, June 2003; (7) - Eurostat, July 2003. Note: (5) Working age population = (Population older than 15 years and younger than 64 years/total population)*100; (6) Employment Rate = (Employment/Working age population)*100; (7) Unemploy-ment rate = (Number of unemployed people/Number of people in the labour force)*100; 1 is defi ned as the percentage of working-age people who have jobs; 2 is defi ned as the percentage of the labour force that actively seeks work but is unable to fi nd work at a given time.
Table 3.2.6.1 - Evolution of regional indicators, 1991-2001
(1) GDP per head (PPS) EU-15 = 100(2) GDP per head (PPS) Portugal = 100(3) Population (thousands)(4) % Population < 15 plus % Population > 64(5) Working age population(6) Employment rate1
(7) Unemployment rate2
(8) GVA per worker (1995 in 103 euros)(9) GVA per worker in agricultural sector (1995 in 103 euros)(10) Employment in agricultural sector/total employment
Variable 1991 1995 2000 2001
- 51,5 51,7 52,5 77 71 72 70239,2 238,7 237,9 238,9 38,3 36,2 34,2 34,2 61,7 63,8 65,8 65,8 60,8 56,8 61,4 62,0 3,7 - 3,0 2,2 15,3 14,1 15,4 15,2
7,6 9,5 10,0 8,8
23,8 18,9 17,1 16,8
Year
productivity and declining employment.
According to the interviewees, domestic policies had a strongly positive impact on tourism, agriculture, forestry and fi shing, as well as on energy and water supply. Otherwise, domestic policies had a neutral impact in terms of R&D in the region.
Note: Scale for region i = 5 { } M is the maximum and m is the minimum value for the
regional funds. The numerator is the distance relatively to the minimum and the denominator is the total amplitude. The minimum scale is 0 and the maximum is 5.
xi -
xm
xM -
xm
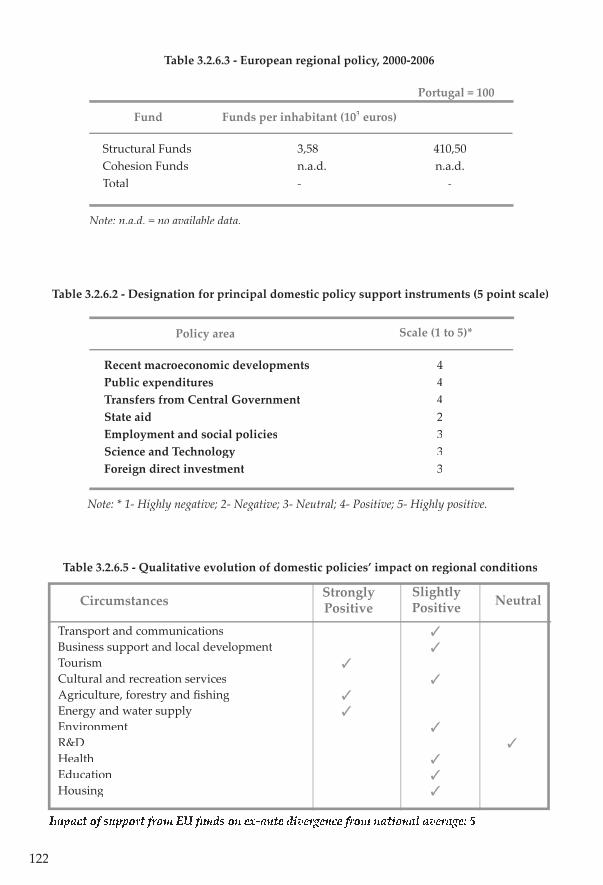
122
Circumstances
Note: * 1- Highly negative; 2- Negative; 3- Neutral; 4- Positive; 5- Highly positive.
Table 3.2.6.2 - Designation for principal domestic policy support instruments (5 point scale)
Recent macroeconomic developmentsPublic expendituresTransfers from Central GovernmentState aidEmployment and social policiesScience and TechnologyForeign direct investment
Policy area
4 442333
Scale (1 to 5)*
Structural FundsCohesion FundsTotal
Fund
3,58 410,50n.a.d. n.a.d.- -
Funds per inhabitant (103 euros)
Portugal = 100
Note: n.a.d. = no available data.
Table 3.2.6.3 - European regional policy, 2000-2006
Table 3.2.6.5 - Qualitative evolution of domestic policies’ impact on regional conditions
Transport and communicationsBusiness support and local developmentTourismCultural and recreation services Agriculture, forestry and fi shingEnergy and water supplyEnvironmentR&DHealthEducationHousing
Strongly Positive
Slightly Positive Neutral
Impact of support from EU funds on ex-ante divergence from national average: 5
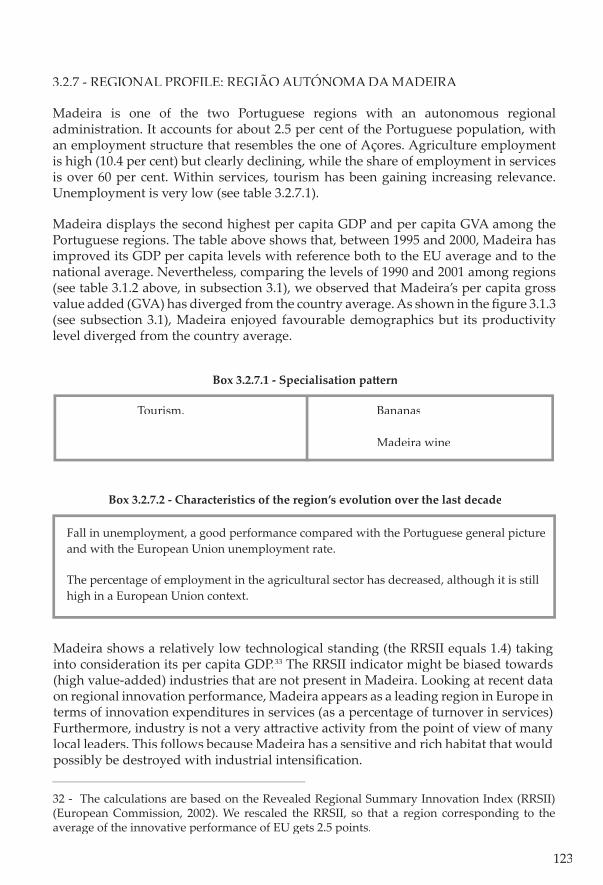
123
Fall in unemployment, a good performance compared with the Portuguese general picture and with the European Union unemployment rate.
The percentage of employment in the agricultural sector has decreased, although it is still high in a European Union context.
Box 3.2.7.2 - Characteristics of the region’s evolution over the last decade
Box 3.2.7.1 - Specialisation pa� ern
Tourism. Bananas
Madeira wine
3.2.7 - REGIONAL PROFILE: REGIÃO AUTÓNOMA DA MADEIRA
Madeira is one of the two Portuguese regions with an autonomous regional administration. It accounts for about 2.5 per cent of the Portuguese population, with an employment structure that resembles the one of Açores. Agriculture employment is high (10.4 per cent) but clearly declining, while the share of employment in services is over 60 per cent. Within services, tourism has been gaining increasing relevance. Unemployment is very low (see table 3.2.7.1).
Madeira displays the second highest per capita GDP and per capita GVA among the Portuguese regions. The table above shows that, between 1995 and 2000, Madeira has improved its GDP per capita levels with reference both to the EU average and to the national average. Nevertheless, comparing the levels of 1990 and 2001 among regions (see table 3.1.2 above, in subsection 3.1), we observed that Madeira’s per capita gross value added (GVA) has diverged from the country average. As shown in the fi gure 3.1.3 (see subsection 3.1), Madeira enjoyed favourable demographics but its productivity level diverged from the country average.
Madeira shows a relatively low technological standing (the RRSII equals 1.4) taking into consideration its per capita GDP.33 The RRSII indicator might be biased towards (high value-added) industries that are not present in Madeira. Looking at recent data on regional innovation performance, Madeira appears as a leading region in Europe in terms of innovation expenditures in services (as a percentage of turnover in services) Furthermore, industry is not a very a� ractive activity from the point of view of many local leaders. This follows because Madeira has a sensitive and rich habitat that would possibly be destroyed with industrial intensifi cation.
32 - The calculations are based on the Revealed Regional Summary Innovation Index (RRSII) (European Commission, 2002). We rescaled the RRSII, so that a region corresponding to the average of the innovative performance of EU gets 2.5 points.
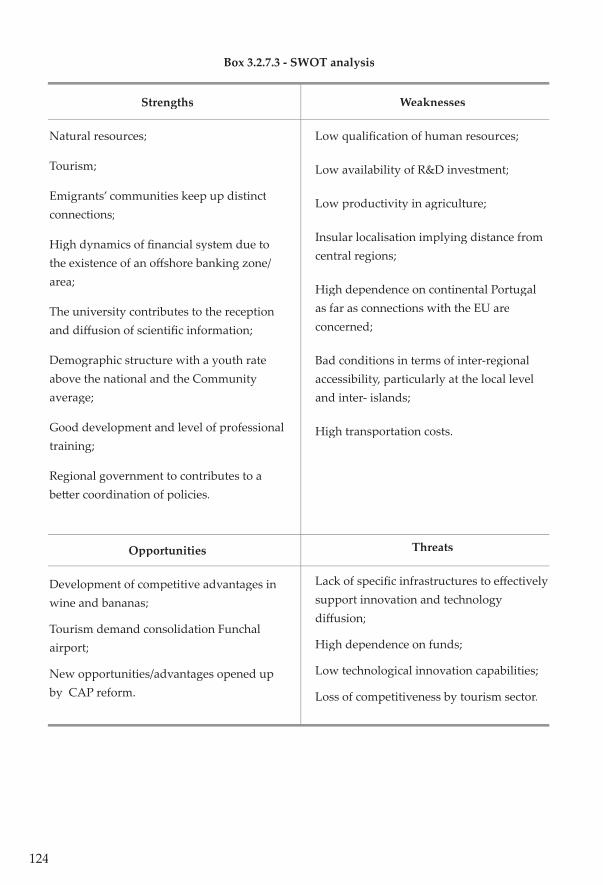
124
Strengths
Natural resources;
Tourism;
Emigrants’ communities keep up distinct connections;
High dynamics of fi nancial system due to the existence of an off shore banking zone/area;
The university contributes to the reception and diff usion of scientifi c information;
Demographic structure with a youth rate above the national and the Community average;
Good development and level of professional training;
Regional government to contributes to a be� er coordination of policies.
Opportunities
Development of competitive advantages in wine and bananas;
Tourism demand consolidation Funchal airport;
New opportunities/advantages opened up by CAP reform.
Weaknesses
Low qualifi cation of human resources;
Low availability of R&D investment;
Low productivity in agriculture;
Insular localisation implying distance from central regions;
High dependence on continental Portugal as far as connections with the EU are concerned;
Bad conditions in terms of inter-regional accessibility, particularly at the local level and inter- islands;
High transportation costs.
Threats
Lack of specifi c infrastructures to eff ectively support innovation and technology diff usion;
High dependence on funds;
Low technological innovation capabilities;
Loss of competitiveness by tourism sector.
Box 3.2.7.3 - SWOT analysis
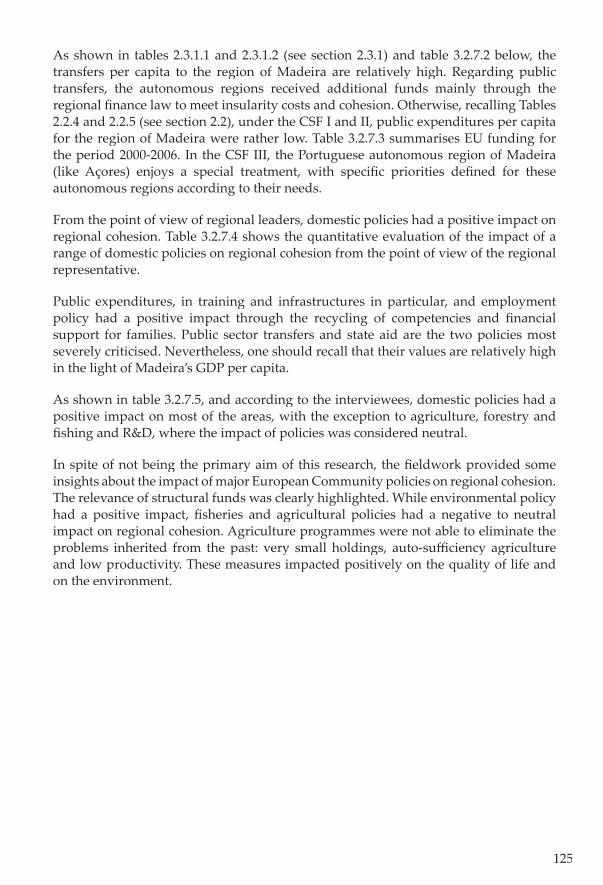
125
As shown in tables 2.3.1.1 and 2.3.1.2 (see section 2.3.1) and table 3.2.7.2 below, the transfers per capita to the region of Madeira are relatively high. Regarding public transfers, the autonomous regions received additional funds mainly through the regional fi nance law to meet insularity costs and cohesion. Otherwise, recalling Tables 2.2.4 and 2.2.5 (see section 2.2), under the CSF I and II, public expenditures per capita for the region of Madeira were rather low. Table 3.2.7.3 summarises EU funding for the period 2000-2006. In the CSF III, the Portuguese autonomous region of Madeira (like Açores) enjoys a special treatment, with specifi c priorities defi ned for these autonomous regions according to their needs.
From the point of view of regional leaders, domestic policies had a positive impact on regional cohesion. Table 3.2.7.4 shows the quantitative evaluation of the impact of a range of domestic policies on regional cohesion from the point of view of the regional representative.
Public expenditures, in training and infrastructures in particular, and employment policy had a positive impact through the recycling of competencies and fi nancial support for families. Public sector transfers and state aid are the two policies most severely criticised. Nevertheless, one should recall that their values are relatively high in the light of Madeira’s GDP per capita.
As shown in table 3.2.7.5, and according to the interviewees, domestic policies had a positive impact on most of the areas, with the exception to agriculture, forestry and fi shing and R&D, where the impact of policies was considered neutral.
In spite of not being the primary aim of this research, the fi eldwork provided some insights about the impact of major European Community policies on regional cohesion. The relevance of structural funds was clearly highlighted. While environmental policy had a positive impact, fi sheries and agricultural policies had a negative to neutral impact on regional cohesion. Agriculture programmes were not able to eliminate the problems inherited from the past: very small holdings, auto-suffi ciency agriculture and low productivity. These measures impacted positively on the quality of life and on the environment.
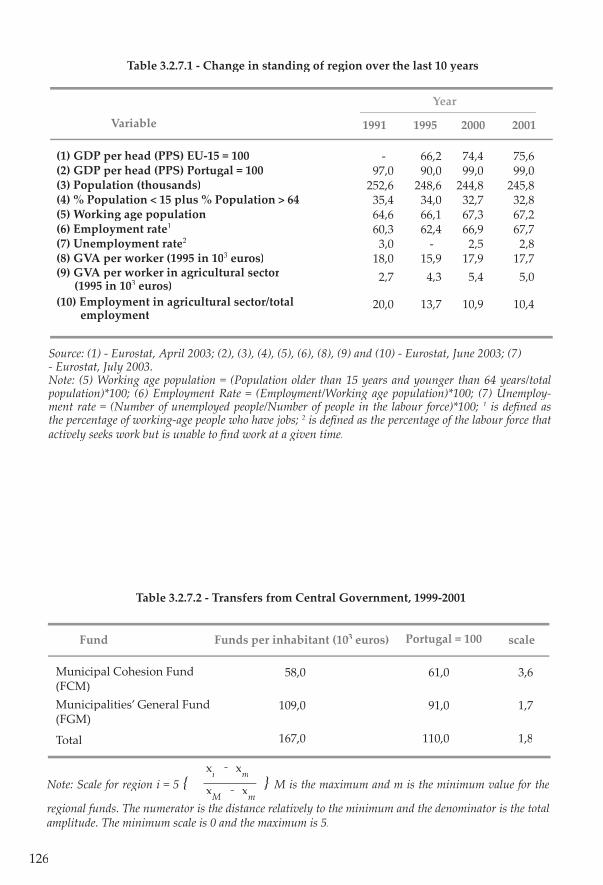
126
Table 3.2.7.2 - Transfers from Central Government, 1999-2001
Municipal Cohesion Fund(FCM) Municipalities’ General Fund (FGM)
Total
Fund
58,0 61,0 3,6
109,0 91,0 1,7
167,0 110,0 1,8
Funds per inhabitant (103 euros) Portugal = 100 scale
Source: (1) - Eurostat, April 2003; (2), (3), (4), (5), (6), (8), (9) and (10) - Eurostat, June 2003; (7) - Eurostat, July 2003. Note: (5) Working age population = (Population older than 15 years and younger than 64 years/total population)*100; (6) Employment Rate = (Employment/Working age population)*100; (7) Unemploy-ment rate = (Number of unemployed people/Number of people in the labour force)*100; 1 is defi ned as the percentage of working-age people who have jobs; 2 is defi ned as the percentage of the labour force that actively seeks work but is unable to fi nd work at a given time.
Table 3.2.7.1 - Change in standing of region over the last 10 years
(1) GDP per head (PPS) EU-15 = 100(2) GDP per head (PPS) Portugal = 100(3) Population (thousands)(4) % Population < 15 plus % Population > 64(5) Working age population(6) Employment rate1
(7) Unemployment rate2
(8) GVA per worker (1995 in 103 euros)(9) GVA per worker in agricultural sector (1995 in 103 euros)(10) Employment in agricultural sector/total employment
Variable 1991 1995 2000 2001
- 66,2 74,4 75,6 97,0 90,0 99,0 99,0252,6 248,6 244,8 245,8 35,4 34,0 32,7 32,8 64,6 66,1 67,3 67,2 60,3 62,4 66,9 67,7 3,0 - 2,5 2,8 18,0 15,9 17,9 17,7 2,7 4,3 5,4 5,0
20,0 13,7 10,9 10,4
Year
Note: Scale for region i = 5 { } M is the maximum and m is the minimum value for the
regional funds. The numerator is the distance relatively to the minimum and the denominator is the total amplitude. The minimum scale is 0 and the maximum is 5.
xi -
xm
xM -
xm
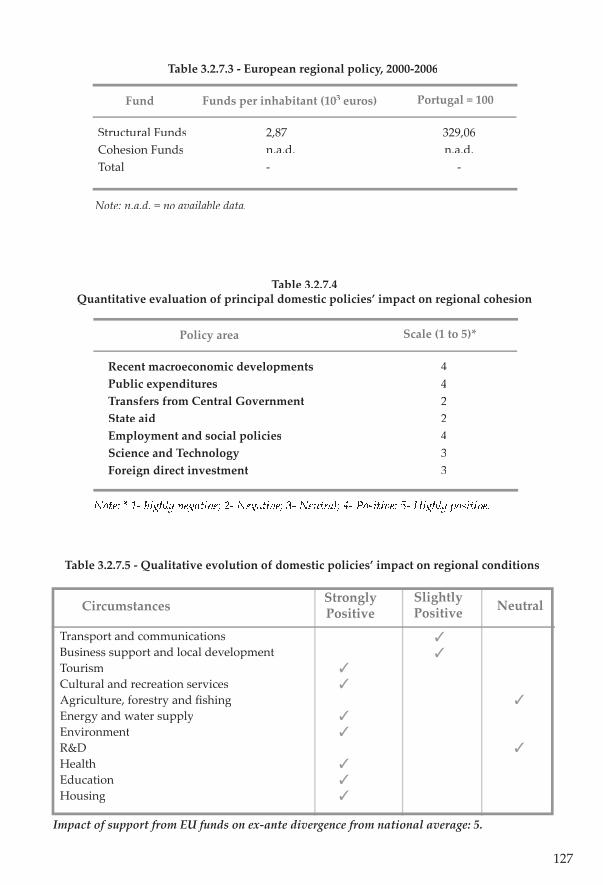
127
Table 3.2.7.5 - Qualitative evolution of domestic policies’ impact on regional conditions
Transport and communicationsBusiness support and local developmentTourismCultural and recreation services Agriculture, forestry and fi shingEnergy and water supplyEnvironmentR&DHealthEducationHousing
Circumstances Strongly Positive
Slightly Positive Neutral
Note: * 1- highly negative; 2- Negative; 3- Neutral; 4- Positive; 5- Highly positive.
Table 3.2.7.4 Quantitative evaluation of principal domestic policies’ impact on regional cohesion
Recent macroeconomic developmentsPublic expendituresTransfers from Central GovernmentState aidEmployment and social policiesScience and TechnologyForeign direct investment
Policy area
4 422433
Scale (1 to 5)*
Structural FundsCohesion FundsTotal
Fund
2,87 329,06n.a.d. n.a.d.- -
Funds per inhabitant (103 euros) Portugal = 100
Note: n.a.d. = no available data.
Table 3.2.7.3 - European regional policy, 2000-2006
Impact of support from EU funds on ex-ante divergence from national average: 5.

128

129
4
THE IMPACT OF EC POLICIES ON COHESION
4.1 - TWO REGIONAL CASE STUDIES - POTENTIAL EFFECTS
The contribution of Comunity policies (CP) to cohesion has been subject to increasing a� ention in recent years.
As far as the Portuguese economy is concerned, recent estimates from the Ministério do Planeamento (DPP, 2001) point to an overall additional growth of GDP by 0.4 percentage points due to the CSF II. The study conducted evaluates the macroeconomic impact of the CSF II at the country level, without analysing the regional incidence of the programme. This raises the question as to whether these developments have had diverse impacts on diff erent regions in Portugal.
At the regional level, Cappelen, Castellacci, Fagerberg and Verspagen (2003) suggest that EU regional support had a signifi cant and positive impact on growth performance. The authors argue that the major reform of the structural funds undertaken in 1988 may have succeeded in making EU regional policy more eff ective. However, they also conclude that the economic eff ects of such support are much stronger in developed environments, accompanying policies that improve the competence level of the receiving environments. In contrast, Freitas, Pereira e Torres (2003) found no evidence that eligibility for Objective 1 EU funding has resulted in extra growth, as compared to what would be expected, given regional a� ributes.
A fact that has been pointed out is that CPs diff er in their results, depending on the region and that in some cases diff erent policies contradict each other. The second intermediate Report on Economic and Social Cohesion explicitly recognizes that “the content of these policies should also consider the enormous diversity and the greater territorial imbalances in the extended Union”. The two regions that we focus on, Açores and Algarve, provide a good illustration of the diff erential impact of the Community policy package on regional development.
The aim of these two regional case studies is to examine on the ground the eff ects of CPs on regional development, both in terms of convergence and progress of the region. The goal is not to examine in detail all Community initiatives but rather those that are most relevant for the regions at hand.
The analysis is extensive on issues not directly budget-related, such as the extent to which CPs have contributed to reinforce the capacity of endogenous regional development, namely through their infl uence on local governance and the capability to implement coordinated policy actions aimed at the development of the region as a whole.
130
The analysis and subsequent conclusions are based on discussions with key actors in the region. This includes government offi cials with responsibility for managing relevant Community Programmes, as well as private associations and academics with relevant research experience.
4.2 - REGIONAL CASE STUDY 1: AÇORES
Context and Background
Açores is one of the poorer regions in EU. The economic potential of Açores is largely aff ected by its location. The territory is located in the middle of the Atlantic Ocean. This translates into high transport costs, which aff ect regional competitiveness.
Because the territory is composed of nine islands, spread over an area of 66.000 square kilometres, the domestic market is highly fragmented. The resident population in some islands is small enough to generate natural monopolies. Lack of economies of scale also limits the ability to realise the full benefi ts of self-fi nanced basic infrastructures, such as hospitals, roads, courts and schools. In order to compensate for the ultra-peripheral location, this region has been recipient of considerable transfers from the rest of the country.
The economy of the archipelagos is largely dependent on the public administration and on the fl ow of offi cial (and also private) transfers. The bulk of regional GDP is accounted for by non-tradables, such as government services, public administration, schools, hospitals, courts (which are present in each island), housing construction, commerce, health care, etc.
The most important tradable good in the region is milk. This is a direct consequence of the CAP policy. Fishing had a signifi cant weight in the past, but is now of decreasing importance. The tourism sector has been recently selected as a key sector in the development strategy and has consequently received a signifi cant offi cial impulse. However, the fl ow of tourists into the region is still too low to meet the region’s fi nancing needs. The average hostel’s occupation stands at around 50 per cent, according to the interviewees. There are some concerns as to whether such an emphasis on tourism may be risky due to the climatic conditions of Açores.
The economy of Açores was most aff ected by the 1989 revision of the contract with the United States for the use of the Lages military base. With this revision, the US government stopped paying rent, that had been an important source of resouces for the regional government. Facing a fall in revenues, the regional government accumulated arrears to the rest of the economy, causing a general liquidity problem and a recession in the region. Between 1989 and 1996, the economy of Açores followed a diverging path.
In 1998, a new fi nancial regime for the autonomous regions of Madeira and Açores came into operation (including a newly created cohesion fund). As a consequence, offi cial transfers from the continent rose signifi cantly. Under the new fi nancial framework, the economy of Açores entered a new period of economic growth and convergence.
131
Progress towards cohesion
Growth in Açores has been polarised: universities and training centres are localised in the three main urban centres: Ponta Delgada, Angra do Heroísmo and Horta. Because of agglomeration eff ects and network economies, there is a natural tendency for regional imbalances to increase. Economic policy has tried to off set this tendency, equipping each island with basic infrastructures, such as hospitals, schools, public administration, airports and harbours. This eff ort translates into a dramatic loss of economies of scale.
To assess the impact of policy actions on competitiveness, one needs to abstract from demographic eff ects. In columns (2) and (3) of table 3.1.2 (see subsection 3.1), the relative per capita GVA is broken down into a demographic component (working age population divided by total population) and a policy induced component (GVA per working age person). In Columns (4) and (5), the relative GVA per working age person is broken down into GVA per worker and the employment rate (employed divided by working age population). Figure 3.1.3 (see subsection 3.1) displays the same information depicted in columns (2) and (3) of table 3.1.2, but in terms of changes, from 1990 to 2001.
The y-axis measures the diff erence between the growth rates of GVA per working age person in the region and the country average. The horizontal axis measures the diff erence between the demographic trend in the region and the country average. The dashed line shows the combinations of demographic trends and productivity changes that would allow per capita GVA to grow proportionally to the rest of the country. The graph defi nes four diff erent areas, according to the region’s relative performance vis-à-vis the country average.
The fi gures reveal that Açores enjoyed favourable demography, but that productivity levels diverged from the country average. Since the second eff ect dominated the fi rst, the economy diverged in terms of per capita GVA, from 79 per cent of the country average in 1990 to 71 per cent in 2001.
From 1998 to 2001 the living conditions improved signifi cantly, however. Because of the signifi cantly, however. Because of the signifi cantlylarge subsidies received, the living conditions of the resident population have improved and the benefi ts were reasonably shared across the population. Notwithstanding a general perception that the latest policy package has contributed to improve the citizens’ quality of life in Açores, there is disagreement as far as the impact of specifi c policies on competitiveness is concerned.
In general, the economy is highly dependent on external funding and aff ected by wrong incentives. A policy shi� towards the market would be desirable, to promote competitiveness and self-sustained development. More focused policies and “ge� ing the prices right” are necessary steps to achieve greater effi ciency and a pa� ern of production more in accordance with comparative advantages.
Revising the existing incentives does not mean that the region should receive less fi nancial support. Because of its geographical conditions, it is important for Açores to
132
keep receiving substantial aids. However, progress towards a less distortionary fund allocation would be advisable.
4.2.1 – IMPACT OF SPECIFIC POLICIES
a) Structural Funds and the Cohesion Fund
Açores has benefi � ed from substantial amounts of Structural Funds. Under the CSF II, it was a recipient of 45.372 thousand euros up to the end of 1999. In 1994, the Region was designated as ultra-peripheral, which implies that it will be elegible for Objective 1 funding, irrespectively of its per capita income level. In any case, per capita GDP in Açores is below 75 per cent of the EU average.
The main development plan in Açores is PRODESA (Operational Programme for the Economic and Social Development of Açores), co-fi nanced by the regional government and the European Commission. The plan integrates a signifi cant part of the available structural funds in the region. It covers the construction of public infra-infrastructures, the shaping of the public administration and support for the private sector. Other relevant Community programmes include: REGIS (Community Initiative Programmes for the Development of Ultra-Peripheral Regions), POSEIMA (Programme of specifi c options to address distance and insularity of Madeira and Açores), INTERREG (Interregional Co-operation Programme) and LEADER.
ERDF funding has been of major importance for the region. By supporting the provision of essential infrastructures, this policy has contributed to increase the territory’s competitiveness. The same applies to the Cohesion Fund. ERDF is quite a visible policy. Thanks to signifi cant investments in roads, airports and, to a lesser extent, harbours, mobility within the region and into the region has increased signifi cantly. The development of airport infrastructures was considered fundamental in this process, because it created new opportunities, namely in the tourism sector. Improvements in hospitals, schools, water supply and drainage of urban residuals also had a considerable impact on the citizens’ living conditions, especially outside the main urban centres. The eff ort to spread the infrastructures over the entire territory has led, however, to the loss of economies of scale. The policy has been less generous as far as urban transports are concerned. Insuffi cient support for this industry is giving rise to geographical imbalances in the labour market, especially in the minimum-wage segment where people cannot aff ord to buy a car.
The ESF has a lower fi nancial impact than ERDF, but its eff ect on competitiveness is perceived to be large. Unfortunately, ESF spending in Açores is not proportional to the existing needs. Açores is the European region with the lowest education level. With equity and cohesion concerns, regional governments tried to provide all islands with basic infrastructures, so that each one of the nine islands now boasts a professional school. Despite this, the amount of ESF allocated to Açores is very low, in comparison with other Portuguese regions. The regional government has begun to promote market-oriented training actions based on a survey conducted to discover market needs. More than 90 per cent of the fi rms all over Açores responded. It was reported that all training actions are now following the guidelines identifi ed in this survey, that
133
is, training courses are only approved if they meet local employment needs. Thus far, the existing indications suggest that this change in policy has been positive. However, there are some reported cases of people who, a� er having received specifi c training, were not able to take up jobs because of the lack of an effi cient transport system or because of the cultural characteristics of Azorean people.
In order to raise effi ciency in the allocation of funds, the authorities require a bank collateral in the application process for job creation subsidies. This allows the government to cut the subsidy when the job is closed before the agreed term.
Without question, investment in human capital is of crucial importance in Açores. There is an opportunity given that the population in Açores is very young. More than 50.000 students are registered at school, representing one third of the current working age population. This will impact signifi cantly on the structure of the labour force over the next twelve years. If the authorities are well succeeded in educating the younger people, the competitiveness of the economy may improve signifi cantly. So far, the qualifi cation rate, defi ned as the proportion of workers endowed with a technical course within the total workforce, has risen from 1.4 per cent in 1996 to 5 per cent in 2003. Within three years time this ratio is expected to rise to 10 per cent. The target for 2010 is 25 per cent.
b) Common Agricultural Policy
The CAP has been the dominant source of EU funding and plays a very important role in the economy of Açores. Most of this aid comes through production support. CAP pillar II and agro-tourism initiatives play a limited role in the region, the farmers not being motivated for these dimensions.
Without CAP aids, Açores would suff er a dramatic economic and social problem. As far as economic cohesion is concerned, however, this policy is rather ineff ective: it creates dependency, it gives rise to signifi cant distortions in resource allocation and it has raised signifi cant environmental problems. As it stands, the CAP is more eff ective a tool for social cohesion than a competitiveness-enhancing policy.
Owing to the Açores’ climatic and soil conditions, during the 1990s a regional cluster based on ca� le derivatives (bu� er, cheese, beef and other) has emerged: farmers were induced to engage in ca� le creation. Milk production became and still is the most important sector in Açores. Although some other cultures remain in place (pineapple, garden-beet), farmers were led in the 1990s to expand milk production to benefi t from higher levels of funding. Because of the CAP, the Federation of Farmers became an important political lobby, which has to be heard on any policy subject in Açores.
Since most exploitations are of small scale, CAP aids play an important role in Açores, as far as social cohesion is concerned. CAP aids are well distributed among farmers and over the territory. This contrasts with the general rule of CAP that 80 per cent of the aid goes to 20 per cent of the farmers. Pillar I aids represent a reasonable share of farmer incomes, helping the rural population to remain in situ. The drawback is that the policy has created dependency and is contributing to keeping exploitation sizes small.
134
Due to the existing milk quotas, a plan is now being developed involving farmers and the authorities to promote beef production, under a common umbrella of geographical certifi cation. This may involve some CAP pillar II funding. This plan is based on the recognition that, because of increasing EC regulation, the minimum scale for milk production has risen over the last few years. According to the farmers’ representatives, CAP regulations are driving some small producers out of the market (through anticipated retirements). According to this plan, smaller farmers would be induced to shi� from milk production to beef production. The process of anticipated retirements is also envisaged in order to promote the rescaling of exploitations.
To the extent that aids are proportional to production, they give rise to a distortion, measured by the deviation of the actual production pa� ern with respect to the one that would be achieved by means of the law of comparative advantage. Although the natural conditions in Açores are favourable for milk production, one should note that milk production was not that important before CAP protection schemes were put in place. As in other European regions, it may well be the case that other cultures with higher ex ante profi tability are being neglected because of the Community policy.
The production bias has also impacted negatively on the environment. The excessive use of chemical products (phosphates) in agriculture is contaminating water resources all over the territory and two important lagoons (Sete Cidades and Furnas) are under ecological distress (recall that the Açores tourist bet is based on its natural beauty). A generalised problem of water pollution could thus threat the recent development strategy formulated for the archipelagos.
The decoupling of aids from production is desirable from an effi ciency point of view. However, the Federation of Farmers reacted negatively to the CAP reform. Apparently, farmers fi rst want to obtain a rise in the milk quota, as to increase the total amount of aids received before considering the decoupling option. The farmers also reacted negatively to the modulation mechanism, that is, the progressive reduction of aids for those farmers receiving more than 5.000 euros per annum. Although in Açores most of the exploitations are small-scale, farmers actually receive more than 5.000 euros per annum under a special programme called POSEIMA. If farmers in Açores did not enjoy such a special regime, modulation would result in signifi cant losses within the farming community.
Although this is pure rent-seeking, it should be noted that a signifi cant fraction of farmers is aged and not suited to be transferred to other sectors. Had these subsidies been removed, a dramatic social and economic problem would have emerged in the economy of Açores.
c) Competition Policy
Because of geographical discontinuation, the advent of the internal market had only limited eff ects on the economy of Açores. Firms are partially protected from external competition. Moreover, wherever the local market is not big enough to support a large number of competitors, this translates into local natural monopolies and consumer losses.
To compensate for the costs caused by physical barriers, both direct and indirect taxes
135
in Açores are lower than on mainland Portugal. The reduction in VAT is however uniform across products, thus not depending on the actual transport costs. This gives rise to signifi cant distortions. For example, so� ware industries, which are not aff ected by transport costs, are not surprisingly moving from the continent to Açores, so as to profi t from lower direct and indirect taxes. On the other hand, in industries where transport costs are important (milk, beef), relative prices have moved in the wrong direction.
A main competition problem was identifi ed in connection fl ights. In Açores, airlines are being explored under monopoly or under special arrangements involving the operators. As a consequence, airfares for non-residents are well above market prices. In Açores, where periphery and transport costs are a key issue, such an extra ineffi ciency is rather unwelcome.
d) State Aid
Because of its insularity, the region benefi ts from a wide range of investment-supporting packages. The EC approved a special aid programme for the regional development of Açores called SIDER (Incentive System for Regional Development). With this instrument, the regional government is able to support fi rms operating in a wide range of industries. Its use has led however to signifi cant price distortions. Funds have been distributed over almost all sectors in the economy, including services, housing construction and tourism-related activities.
From a social cohesion point of view, this policy is probably eff ective. However, such a generosity lacks an economic rationale. It is questionable whether fi rms operating in non-tradable sectors like housing construction or street shops should be supported by SIDER. Non-tradables are, by defi nition, isolated from external competition in every economy. Hence, there is no point of these industries being eligible for a subsidy specifi c to insular economies. Moreover, some of these activities only exist because their demand is derived from subsidies a� ributed elsewhere. Tradable sectors, on the contrary, are highly aff ected by transport costs. Unfortunately, the policy does not distinguish these two situations. Rather than spreading the subsidies all over the economy, a more focused policy would be desirable.
e) Environment
Environmental policy has produced relevant eff ects in three main areas:
- the implementation of structural policies has been accompanied by studies evaluating their environmental impact. In general, whenever a negative impact was foreseen, alternative solutions have been proposed, without any particular political or social problem.
- over the last years, the production of urban waste has risen signifi cantly in Açores. A signifi cant amount of ERDF has been used to improve the waste collection system and the drainage of urban liquid residuals. Since the Açores do not have the minimum scale for an incinerator, waste has been exported abroad. This is, of course, an expensive solution, especially because nine islands are involved.
136
- in Açores, air pollution caused by carbon emissions is negligible. However, ca� le creation has led to a fast deterioration of the quality of water sources. At the moment, the authorities are dealing with the problem of excess phosphates in the lagoons of Sete Cidades and Furnas, in São Miguel. This aff ects roughly 60 farmers. The intervention is however restricted to these areas. According to the opinions collected, there is no general approach for dealing with the pollution caused by agriculture in the archipelagos.
In general, environmental protection rules are well accepted in the region. Azoreans perceived environmental policy as having been dominated by specifi c interventions in order to face up to particular problems. The actions undertaken are perceived, however, as prompt and effi cient. On balance, there is no perception that environmental regulations are constraining the region’s growth perspectives. On the contrary, there is an understanding that environmental protection is essential for sustained development.
f) Innovation and Research and Development
Innovation Policies are not signifi cant in Açores. A notable exception is the research undertaken to explore geothermal energy. With ERDF co-fi nancing a geothermal electric generator was built in S. Miguel. Research and development in the region is mostly undertaken by the University of Açores. Excellence has been achieved in the areas of geothermal energy and oceanography.
Biological agriculture is negligible in the region. There is no link between agriculture and regional innovation policy. In general, R&D policies do not have a major impact on the economy of Açores. Firms are not involved in R&D activities and government initiatives became more visible over the last couple of years.
In general, innovation policy is perceived as having a ‘broadly neutral’ eff ect.
g) Common Fisheries Policy (CFP)
Although the weight of fi shing-related activities in GDP is declining, there are still some important fi shermen communities. By contributing to the modernisation of the fl eet and regulating the industry, the CFP had an important role in driving fi shermen’s incomes up to levels comparable to those of other activities. The reduction of the fl eet led however to some early retirements and may have contributed to some long-term unemployment in specifi c communities.
We perceived the fi shing sector as being largely ignored within the Açores community. A general concern is whether the openness of the exclusive fi shing area to other EU countries will threaten the existing fi sh stocks, given that the exclusive ocean area is huge and the Azorean authorities do not have suffi cient means at their disposal to patrol the entire area. For some authorities this problem already exists with respect to some Spanish fi shermen.
h) Transports, energy and telecommunications
Improvements in airport infrastructures on all islands (especially in Ponta Delgada,
137
Angra do Heroísmo and Horta) had a signifi cant impact on the region. Although mobility within the archipelagos has improved, it is still dependent on random factors, such as weather conditions.
As far as energy and water supply is concerned, there is still a lot to be done. For example, it was reported that the existing electricity network and water supply only reach 5 per cent of the farmers.
4.2.2. CO-ORDINATION BETWEEN POLICIES
Despite the large degree of policy interdependency in a small region like Açores, the diff erent programmes are perceived to be implemented in a rather independent (and, in some cases, confl icting) manner. As far as agriculture and tourism are concerned, the natural link via agro-tourism is not being explored.
4.2.3.- GOVERNANCE
The existence of a regional government constitutes an advantage for Açores with respect to other Portuguese regions. However, the administration’s structure is not perceived to be fully adapted to promoting an eff ective intervention. The desirability of greater co-ordination between the regional government and other levels of the administration was referred by almost all of the persons interviewed. It appears, however, that co-ordination problems are now a ma� er of increasing a� ention by the administration.
Access to EC funds has helped the local authorities (as well as private agents) to improve their planning capabilities. As in other regions, the elaboration of PRODESA was preceded by an overall discussion involving key actors in the region, enriching the debate and the understanding of the global problems facing the economy. Because of the eligibility requirements, the policy was also forced to incorporate some concerns (e.g., the environment) that otherwise could have been neglected.
The Federation of Farmers complains about the slow offi cial response to project applications (IFADAP - Institute of Financing and Support for the Development of Agriculture and Fisheries - and the regional government). A usual practice has been to proceed with project implementation prior to approval, using some special credit lines off ered by the banking system. Nevertheless, the risk exists that projects be rejected because of this. This was pointed out as an example of lack of coordination and bad governance.
In general terms, CPs have contributed to improving the planning and management capabilities of the regional administration.
4.2.4 - SUMMARY AND GUIDELINES FOR COMMUNITY ACTION
The economy of Açores is largely dependent on the size of the public administration and on transfers from abroad, such as CAP aids. Without these transfers, the economy would collapse.
138
Transfers are however necessary to compensate for the insularity.
The cohesion fund and the regional structural funds have been tremendously benefi cial for the region, contributing to improving the production capabilities of the region. In general, subsidies are well succeeded in reaching a large share of the population and are relatively well distributed across islands.
However, some of the existing policies and mechanisms (CAP, SIDER) are giving rise to signifi cant market distortions. In some sectors, policies are promoting dependency rather than enhancing competitiveness. “Ge� ing the prices right” should be a ma� er of more a� ention by the regional authorities.
In the following box we present some guidelines for Community action with a view to avoiding the negative impact of Community Policies in Açores.
Box 4.2.1 - Guidelines for Community action
=> “Get the prices right” (changes in the structure of VAT, a special tax regime for transport costs);
=> More sectoral discrimination (tradable sectors, rather than non-tradable sectors);
=> Decouple CAP subsidies from production;
=> Protection of water sources;
=> More a� ention to the public transportation network;
=> Increase competition in connection fl ights;
=> Reinforce training actions;
=> Greater co-ordination between agriculture, tourism and the environment.
139
4. 3 - REGIONAL CASE STUDY: ALGARVE
Context and Background
Algarve is a region with roughly 350.000 inhabitants. Tourism-related activities (including hotels and real state) represent the bulk of regional GDP. In 1998, the number of tourists entering Algarve through Faro airport and Andaluzia exceeded 4.7 million.
Agriculture and fi shing represent roughly 8 per cent of regional GVA and 10 per cent of employment. Manufacturing accounts for less than 5 per cent of regional GVA. Due to tourism, most of the activity is located in the coastal area of the south (Campina).
Progress towards cohesion
Over the last years, the economy of Algarve has performed relatively well. The region has been able to converge towards the country average in terms of per capita GDP and this progress encompassed the coastal as well as the rural areas.
The impulse provided by Community Policies in promoting economic cohesion was perceived to be very positive. The region is now be� er endowed in terms of infrastructures and ability to converge than one decade ago. In general, intervention did not give rise to excessive distortions or dependency.
Special a� ention is needed, however, in regard to two dimensions: human capital and environmental protection.
To assess the impact of policy actions on competitiveness, one should abstract from demographic eff ects. In columns (2) and (3) of table 3.1.2 (see subsection 3.1), the relative per capita GVA is broken down into a demographic component (working age population divided by total population) and a policy induced component (GVA per working age person). In columns (4) and (5), the relative GVA per working age person is broken down into GVA per worker and the employment rate (employment divided by working age population).
Figure 3.1.3 (see subsection 3.1) displays the same information depicted in columns (2) and (3) of table 3.1.2, but in changes, from 1990 to 2001. The y-axis measures the diff erence between the growth rates of GVA per working age person in each region and the country average. The horizontal axis measures the diff erence between the demographic trend of each region and the country average. The dashed line shows the combinations of demographic trends and productivity changes that would allow regional per capita GVA to grow proportionally to the country average. The graph defi nes four diff erent zones, according to the relative performance of the diff erent regions vis-à-vis the country average.
The fi gures reveal that Algarve enjoyed both favourable demography and a fast rise in productivity. This twin advantage translated into fast convergence towards the country average of per capita GDP.
140
4.2.1 – IMPACT OF SPECIFIC POLICIES
a) Structural Funds and the Cohesion Fund
Algarve has received large amounts of Structural Funds, which are managed under a regional programme called PROALGARVE - Algarve Operational Programme in the CSF III - (PROA in CSF II). The cohesion fund has been used mostly for environmental issues. The region also receives direct support from Community initiatives, such as INTERREG and PIC (Programmes of Community Initiative) LEADER + and EQUAL (European Social Fund Initiative).
The fund that was perceived to have had most impact in the region is EDRF. This Fund has been used to improve public infrastructures, such as roads, hospitals, water supply, drainage of urban residuals, etc. Although most funds are spent in the coastal area (Campina), this is also the region where most of the population lives. In proportion of the residential population, the understanding is that investments have been higher in rural areas. EFRD funding is perceived to have impacted positively on living standards and on competitiveness both in rural and urban areas.
The improvement in accessibilities allowed the fl ow of tourists into the region to increase signifi cantly. For example, tourists entering via the Spanish border and/or the airport increased from 2.1 million in 1990 to 4.7 million in 1998. The railways now connect Faro directly with Lisbon. This allows travellers to move from the North of Portugal to the South without changing train. There is a perception, however, that the investment eff ort made in the regional railways system was too low. Since the railroad connects the main cities in Algarve, its improvement could have a positive impact on labour mobility and on traffi c conditions in the main urban centres. The improvement of municipal roads helped people living in the countryside to share in the benefi ts of economic development to the extend that they can aff ord to have a car. People are now able to live in the rural areas of Barrocal and Serra and work on the coast (Campina).
The Portuguese IEFP has been surveying the employers, with the aim to identify training opportunities, rather than to off er courses according to the jobless’ requirements. The results so far have been promising. It was reported, however, that some unemployed, a� er receiving appropriate training, were unable to take jobs outside their residential areas because of the lack of an appropriate public transport system.
In the Algarve region, the labour market is signifi cantly aff ected by seasonality. Since most demand for labour arises in the summer, a large share of the employment created is short-term. A signifi cant share of the workforce engages in summer work, enjoying high monthly wages and benefi � ing from unemployment protection during the winter. The authorities tried to reduce this phenomenon, supporting longer-term employment with training actions during the winter.34 However, only the larger fi rms (those that
34 - Employment policies are implemented through the Plano Nacional de Emprego (PNE), which is designed according to EC guidelines and targets and came into operation in 1999. The implementation of PNE in Algarve is undertaken by three diff erent structures (National Employment Networks). This applies however only to operational purposes, given that there is no regional autonomy in the policy formulation.
141
usually hire long-term) have responded. Small fi rms (the target of the policy) are insisting on hiring only short-term workers.
ESF spending, depending on private bids, is thus highly concentrated in the more polarised regions of Campina. To off set this, a� empts are being made by the national and regional authorities to promote specifi c training actions in the less favoured regions of Barrocal and Serra.
Despite being one of the European regions with a lower level of human capital, ESF spending has been evolving at a slow pace. Although the seasonal nature of the labour market may explain this, it may also refl ect a cultural problem. Remarkably, training actions specifi cally directed at the municipalities’ own staff (accounted for in PROALGARVE) reveal very low spending as well. This pa� ern, in a region with such a low level of human capital should be a ma� er of concern in the future policy formulation.
b) CAP
The CAP policy is administered in the region at two diff erent levels. The bulk of the CAP policy is under the national framework, named AGRO (Agriculture and Rural Development Operational Programme in the CSF III). Pillar II policies, being more linked to the region, were incorporated in PROALGARVE, under the name AGRIS (Generic Assignment of the Measures Regionally Unconcentrated of Agriculture and Rural Development). This includes rural development, diversifi cation, incentives for workmanship, urban interventions in small villages, support for small-scale production, quality development, environmental protection, etc. From a cohesion point of view, this dimension of the CAP is of great importance.
Due to the fact that agriculture in Algarve is predominantly of the Mediterranean type, CAP supports are not as important as in other EU regions. Consequently, CAP aids do not constitute a signifi cant share of farmers’ incomes. Still, farmers in Algarve have benefi � ed from considerable investment supports. Most of the aid is taking the form of investment subsidies, thus contributing to the modernisation of agriculture without giving rise to signifi cant dependency.
The sectors that received help include citrus production, horticulture and forestry (pinewood, cork, eucalyptus). These were and still are some of the most important cultures of the region. The traditional cultures (almonds, fi gs and carobs), are not so dynamic, but have a high social value. Milk production has practically disappeared and the production of cereals is declining every year. Contrary to other regions, in Algarve the CAP has not caused a signifi cant move toward production pa� erns that are contrary to comparative advantage. In this framework, decoupling of supports from production is not likely to cause any signifi cant change.
Under the CAP’s second pillar there has also been some investment in the development of rural areas and supports for production diversifi cation. Biological agriculture and agro-tourism have not yet reached a visible scale in Algarve. However, the bulk of the CAP policy originates in the fi rst pillar.
142
Important from a social point of view is the small-scale production of agricultural derivatives, such as cheese, liqueurs and olives. Although special support programmes were designed for these activities, eligibility requires producers to satisfy a heavy set of consumer protection rules. It has been reported that many small-scale producers prefer to remain on the sidelines, not satisfying the requirements (and in some cases not paying taxes), rather than to benefi t from CAP pillar II aids.
To the extent that the CAP’s fi rst pillar promotes extensive production, it is likely to have a detrimental impact on the environment. In Algarve, some contamination of water resources is likely to be caused by intensive horticulture.
Some of the research projects undertaken in Algarve are related to agriculture. The most signifi cant ones involve the Regional Direction of Agriculture, the University of Algarve and, in some cases, Spanish entities (under INTERREG).
c) State Aid
Subsidies for private business are a� ributed at the national level. Some of these are however accounted for in the regional programme, PROALGARVE. Some of them constitute support for local small-scale investment (fi rms with fewer than 20 workers), information society and PITER - Regional Programme for Tourism Development. These are all co-fi nanced by ERDF.
d) Common Fisheries Policy (CFP)
The Fisheries policy is defi ned at the national level. In regard to implementation, however, there are two levels. The measures accounted for in the national policy framework are called MARE (Fisheries Operational Programme). Those accounted for in PROALGARVE are call MARIS (Generic Assignment for the Measures Regionally Unconcentrated of Fisheries) and include infrastructure development (ERDF) and quality improvement (FIFG). In practice, however, all policy is mediated by the national government. Since the regional director of fi sheries has no autonomy, de-centralisation is only virtual.
From 1994 to 1999, the number of registered fi shermen has declined from 8.200 to 6.800. The same trend is foreseen until 2008. The number of ships has also declined, from 2.900 to 2.300. The fl eet is now more modern and with be� er working and safety conditions than before. In this process, there has been a tendency for the ships’ fi shing capacity to increase. Despite these developments, 30 to 40 per cent of the fl eet is still obsolete.
In general, the implementation of CFP has been perceived as positive for the sector. Fishermen’s incomes have improved and the re-scaling of the fi shing sector has not caused signifi cant social eff ects. Early retirements were well accepted and transfers of workers to other sectors were smooth. However, a problem of false retirements was identifi ed: because pensions are very low, some retired fi shermen are maintaining a fi shing activity, under the umbrella of “sport fi shery”. Since, in Algarve, sport fi shery is not being subject to adequate supervision, this is a problem that needs to be taken into account in the future.
143
Some fi shermen in Algarve were aff ected by the failure of EU negotiations with Morocco. Those who were forced to stop their activity have been supported by diff erent mechanisms in the last few years, but are now facing the threat of an early retirement.
The reduction of the exclusive fi shing area to 12 miles is a ma� er of concern among fi shermen in Algarve. This is because most of the fi shing activity takes place between the coast and within the 20 mile zone. Fishermen claim that the Portuguese government discriminates them. In particular, they claim that the licensing of ships in Portugal obeys to stricter rules than in Spain, giving rise to an unfair competition in terms of fi shing capacity.
e) Environmental Policies
A� er decades of negligence and insuffi cient monitoring, there is now an understanding that environmental protection is crucial for sustained development, particularly in a region where tourism plays such a special role. Those urban areas that have grown chaotically in the past (excess building, lack of green areas) are losing competitiveness to alternative areas where spacial planning and environmental protection are accounted for. This process of “fl ight to quality” is not suffi cient, however, as a disciplinary device. Because of the externalities involved, individual decisions tend not to incorporate the social losses, giving rise to excess building and environmental problems.
The situation has evolved diff erently in the countryside. Up to the 1980s, housing construction has led to a fast deterioration of the rural landscape. In 1990, PROTAL - spacial plan (MA - Environment Ministry) imposed serious restrictions on housing construction in rural areas. According to this plan, housing construction in rural areas was only allowed as a replacement of previous buildings. Restricting the supply, this law has led to a general improvement in housing quality outside the urban centres. At the moment, PROTAL is under revision and there are pressures to make it looser.
Environmental policies have received substantial Community support over the last years, mostly through ERDF and the Cohesion Fund. Remarkably, the bulk of the Cohesion Fund received under CSF II was allocated to environmental policies (improvements in water supply, collection and drainage of waste and urban residuals, etc). Evidence from environmental indicators shows that the policy had a very positive impact.
The policy was enacted by the Regional Direction of Environment. This body has also been involved in the evaluation of the environmental impact of projects that are not usually subject to such a requirement by the EC (small roads, for example).
POLIS (Urban Requalifi cation and Environmental Valuation Programme) is a national initiative aiming at the re-qualifi cation of distressed urban centres. The fi rst wave of projects is being realised in Albufeira and Silves. An extension of the POLIS programme to other municipalities would be of great interest for the region.
A signifi cant part of the territory is now subject to environmental protection, under Reserva Ecológica Nacional, Natura 2000, or other protection schemes. In the areas of special protection (Ria Formosa, Costa Vicentina, Guadiana), the Nature Protection
144
Institute (ICN - Nature Protection Institute) has managed to avoid a further deterioration of environmental conditions.
Despite the progress made, environmental issues should be kept on the top of the policy agenda in the future. The erosion of the coast, a fi nal solution for solid urban residuals, and interventions in the urban centres that have grown chaotically and protection of natural areas are aspects in need for urgent intervention. Given the extreme sensitivity of the region and the economic interests involved, a strict governance system is required.
4.3.2 - CO-ORDINATION BETWEEN POLICIES
During the preparation of the regional operational programme the policy debate was enriched by the participation of key actors in the region. This includes the CCR (Regional Coordination Commissions), the regional directorates representing the national government (agriculture, economy, employment, etc.), the municipalities (AMAL - Algarve Municipalities Association, representing the 17 municipalities of this region), business associations, academics and the Tourism Regional Commission (where both the central government and the municipalities are represented). This debate allowed key actors and government offi cials in the region to become acquainted with the problems identifi ed by each other and to incorporate diff erent solutions in the new programme. A strategic document was prepared, containing the main policy options for the region. A� er the creation of the operational programme, called PROALGARVE, the co-ordination eff ort lost impetus.
In PROALGARVE, two main innovations with respect to PROA were introduced:
• In order to avoid that more dynamic areas absorb the bulk of the fi nancial resources, a special dimension was created called “Territorial Actions”. Territorial actions were introduced to promote a more balanced development across the territory, taking into account the two diff erent dimensions: a coastal area subject to urban pressures (Campina) and the rural periphery (Barrocal and Serra). Although expenditures in territorial actions are evolving at a slower pace than planned, since resources cannot be re-allocated between actions, authorities trust this mechanism to become an eff ective cohesion tool.
• De-centralisation: a� empt to incorporate into the regional plan some spending from national policy. For example, agriculture policy was split into AGRIS (regional) and AGRO (national). The fi sheries policy was split into MARE (national) and MARIS (regional). For the employment policy, the split between policies is less obvious: initiatives for unemployed are under PROALGARVE, while initiatives for youth and job-training actions are kept as a national policy.
In practice, however, the procedures and the decision process for policies contained in the regional plan obey to the same rules as those policies that remain under the national umbrella. In agriculture, for example, AGRIS rules are equal in all Portuguese regions and the fi nal decision is given to the Ministry. This means that, from the co-ordination point of view, the incorporation of national policies in PROALGARVE is li� le more than an accounting change.
145
In general, co-ordination between diff erent levels of government (regional, national, municipalities) is perceived to be defi cient.
Specifi c co-ordination problems were identifi ed at the launch of POLIS. This initiative was to be co-fi nanced by both the European Funds (Cohesion Fund, Sectoral Operational Programs) and the Portuguese Government. The policy was however only formulated a� er the CSF III was on its way. Since the selection and eligibility criteria of POLIS (Programa de Requalifi cação Urbana e Valorização Ambiental) had not been subject to the scrutiny of the EC, negotiations had to be conducted therea� er. This led to a signifi cant delay. Three years a� er the initiative was announced, no physical interventions have yet taken place.
Rural development, electrifi cation of isolated areas, promotion of small-scale activities in areas with low density (cheese, liqueurs, olives, workmanship) involves diff erent funds such as ERDF, CAP/AGRIS, and LEADER. Co-ordination between these initiatives was claimed to be low.
4.3.3 - GOVERNANCE
In Algarve, there is no regional government. The regional development programme is managed by CCR, which has neither executive power nor direct authority over the regional directions or the municipalities. This gives rise to signifi cant accountability and governance problems. Since, in contrast, municipalities have their own political legitimacy, this translates into an excessive weight of municipalities in the decision-making process. Perhaps this explains the excess of symbolic infrastructure and some lack of scale in policy formulation.
During CSF II, Algarve displayed a low spending capability as compared to the rest of the country. This was not so much a problem of regional governance (actually, funds depending on the regional plan were spent at a normal pace), but mostly the failure of regional directorates in driving resources into the region. Since these “national policies” represent the bulk of the budget, PROALGARVE a� empted to resolve the problem incorporating into the regional plan some “national” policies (de-centralisation).
Under INTERREG, cross-border partnerships involving bodies from Algarve, Andaluzia and Alentejo have been supported. Within the current framework, eligibility requirements are stricter than under CSF II: only eff ectively integrated projects are being supported. Two problems were identifi ed in terms of the implementation of this programme. The fi rst is that, contrary to what happens in Spain, in Portugal there are no regional governments. This means that, in some ma� ers, the dialogue takes place between the authorities in Andaluzia and the Portuguese government. On the other hand, some communication problems may have resulted from the fact that Andalusia is economically much larger than Algarve. Notwithstanding, roughly 50 projects supported by INTERREG III are under way.
It was reported, as an example of “bad governance”, that projects submi� ed to PROALGARVE have a faster approval than those supported by national policies.
146
4.3.4 - SUMMARY AND GUIDELINES FOR COMMUNITY ACTION
With no doubt in Algarve CPs have played a crucial role in promoting economic cohesion. Public infrastructures, such as accessibilities, water supply and drainage of urban residuals have been the main vehicles. Greater a� ention should be paid, however, to public transport and in particular to the regional railway system which lacks modernisation. Despite being one of the regions in Europe with the lowest level of human capital, in Algarve ESF spending has evolved at a slow pace. Contrary to other regions, in Algarve the CAP is not leading to signifi cant distortions.
Environmental problems caused by defi cient planning and excess construction are a main concern in Algarve. Although stricter rules are now in place, economic pressures are very strong. A co-ordinated intervention, involving diff erent actors and ministries would be of interest, so as to avoid further damage for the competitiveness of the territory.
In CSF III, an eff ort was made to decentralise some policies. This eff ort gave rise to the formulation of a strategic plan in which many key actors have intervened, enriching the debate. In the implementation phase, however, governance problems related to the absence of a regional authority have emerged. National policies, even when accounted for in PROALGARVE, are subject to government approval and the programme manager has li� le infl uence in the decision process.
In the following box we present some guidelines for Community action with the view to avoiding the negative impact of Community Policies in Algarve.
Stricter environmental protection;raising the eff ectiveness of training actions: market orientation rather than orientation according to preferences of the unemployed;Support for the re-qualifi cation of urban areas; Reinforcement of the authority of the CCR;Improvements in the railways system;Strict control over fi shing;Reduction of offi cial incentives for seasonal unemployment.
Box 4.3.1 - Guidelines for community action
147
5.
CONCLUSIONS
Portugal is a centralised state. In general (with the exception of two autonomous regions), regional authorities’ policy discretion is very limited. Most policies that
take place at the regional level are mere extensions of policies determined nationally which in turn tend not to have an explicit regional dimension.
To a large extent, Portugal features national policies with regional concerns as a consequence and in the moulds of EU policy, in particular according to the requirements of the CSF programmes. There is a good match between national and EU designations of territories for regional and other forms of economic development assistance. The structural funds framework that is widely adopted for national policy and most government spending on promoting economic and social cohesion goes through the CSF. Since the CSF is rather demanding in terms of national contributions, the scope for other national initiatives involving public expenditures is very limited.
Given that some national public expenditures in Portugal are closely tied to EU funding, the regional distribution of CSF funds serves as a useful indicator for the regional incidence of public expenditures. Under the second Community Support Framework, however, regional problems were largely disregarded. This is shown by the fact that the funds per capita for the poorest regions (Açores and Alentejo) were substantially lower than those for the richest regions (Lisboa e Vale do Tejo, Centro and Madeira).
Not surprisingly, the evidence for the period 1995-2000 is of divergence between the Portuguese regions, both in per capita terms and in terms od GVA per worker. Among all Portuguese regions, only Madeira has approached the country average in terms of per capita GDP. Taking a longer time horizon (1990-2001) to avoid the diff erential impact of the business cycle, we observe that only Algarve and Norte have succeded in growing faster than the country average, both in terms of GVA per capita and GVA per working age person. As far as regional convergence is concerned, the overall picture has been disappointing.
Box 5.1 summarises our main conclusions on the impact of national policies on regional (economic and social) cohesion and on the national economy. Column 1 and 2 regard the policy areas and sub-areas under analysis; column 3 lists the main institutions and instruments through which the policy is implemented; column 4 points out whether or not the policy design diff erentiates among regions; columns 5a and 5b summarise the impact of the policy at hand on regional cohesion; column 5a (5b) addresses specifi cally the issue of whether there is a diff erential impact among regions as far as economic (social) cohesion is concerned; column 6 summarises the impact of the policy on the national economy.
148
In general, macroeconomic developments have had a positive impact on cohesion. The regime shi� (to EMU, with the SGP) has doubtlessly created favourable conditions for economic development in the poorer regions. However, the transition to the new regime gave rise to adjustment costs not equally shared by all regions.
It is a common concern to EU member states, including Portugal, to ensure that the level of provision of public goods does not diff er too much between localities. Unfortunately, given the available data, the relative scale of public expenditure in diff erent regions in Portugal cannot be duly assessed. In broad terms, the principle of covering the entire territory with education, health, judicial services, public order, etc., has a competitiveness-enhancing eff ect on the less prosperous regions. This also translates into a signifi cant social-cohesion eff ect, as employment in the public administration tends to be an important source of income in less populated areas. However, those expenditures that are a counterpart of CSF II (1994-1999) did not properly address the need to reduce regional imbalances. It is only under the CSF III (2000-2006) that the ‘regional cohesion problem’ is clearly addressed.
Transfers from the central government include transfers to municipalities and additional transfers to autonomous regions, which are the expression of a specifi c regional policy towards overseas regions. To the extent that the delegation of decision-making results in more effi cient resource allocation, the economic impact of these transfers on cohesion is positive. However, the high discretionary capacity of the regional authorities regarding the use of subsidies to fi rms has translated into important distortions, dampening incentives, reducing effi ciency and creating dependency.
By the same token, state aids may have a potential role regarding social cohesion (preservation of jobs), but are highly ineffi cient, since they distort trade and competition between fi rms, regions and countries and delay structural change (this is especially true for sectoral aid). The evidence is that of excessive concentration on the richest regions, thus acting against social cohesion, and in the autonomous regions, working against economic cohesion.
Labour market regulation in Portugal has been indicated as a major shortcoming that prevents adaptability and structural reform. However, its diff erential impact tends to advance cohesion to the extent that there is more de facto fl exibility in less prosperous regions.
Training actions are of special relevance, as they have a potential productivity-enhancing eff ect. The existing evidence, however, is that, with the exception of Alentejo, training expenditures have not been proportionally higher in the poorer regions.
Social expenditures do have implications for the eff ective distribution of public expenditures between regions, not because the amount spent in any region is determined by regional concerns, but because of the regional distribution of people elegible for social benefi ts. While it is obvious that social policies have a positive impact on reducing regional per capita income disparities, their eff ectiveness depends on the ability of the policy to cover all the territory equitatively. The evidence on unemployment compensations points, however, to a higher coverage rate in the more prosperous regions.
149
Science and technology policy, not having a regional dimension, does not counterbalance the general tendency of the concentration of research activities in the main centres.
Large-scale FDI, with most potential positive externalities, as a tendency, also goes to the most prosperous regions. FDI policies, in turn, have a� empted to take into account a regional dimension. Still, the success of the policy in avoiding concentration in the most developed regions has been negligible.
Larger regional discretion, however, may be worse than centralisation. This is because the potential positive eff ects – higher effi ciency of resource allocation due to proximity of decision power and information advantage – are overcompensated by market distortions and dampened incentives due to a lack of competition.
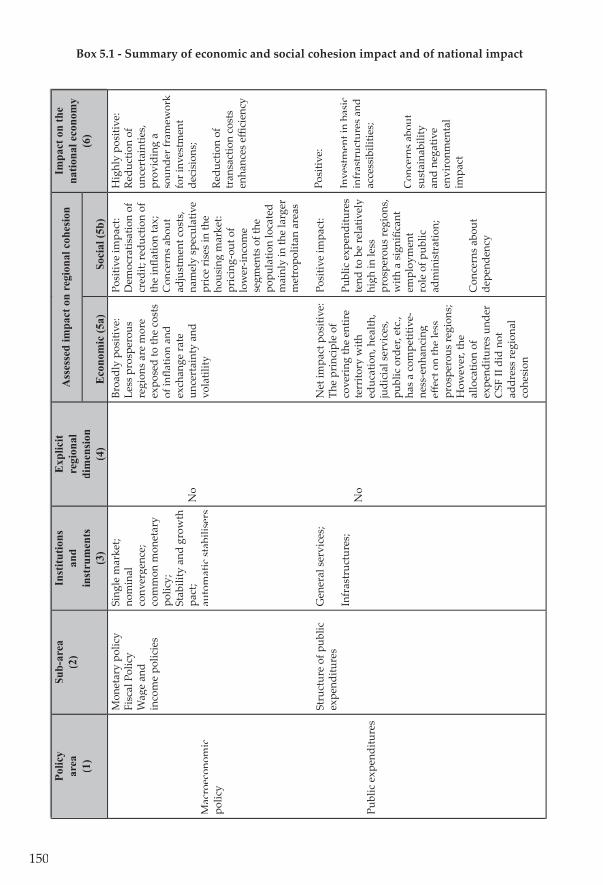
150
Box 5.1 - Summary of economic and social cohesion impact and of national impactPo
licy
area
(1
)
Sub-
area
(2)
Inst
itutio
ns
and
inst
rum
ents
(3)
Exp
licit
regi
onal
di
men
sion
(4
)E
cono
mic
(5a)
Soci
al (5
b)
Impa
ct o
n th
e na
tiona
l eco
nom
y (6
)
Mac
roec
onom
ic
polic
y
Publ
ic e
xpen
ditu
res
Mon
etar
y po
licy
Fisc
al P
olic
yW
age
and
inco
me
polic
ies
Stru
ctur
e of
pub
lic
expe
nditu
res
Sing
le m
arke
t;no
min
al
conv
erge
nce;
co
mm
on m
onet
ary
polic
y;St
abili
ty a
nd g
row
th
pact
; au
tom
atic
sta
bilis
ers
Gen
eral
ser
vice
s;
Infr
astr
uctu
res;
No
No
Broa
dly
posi
tive:
Le
ss p
rosp
erou
s re
gion
s ar
e m
ore
expo
sed
to th
e co
sts
of in
fl atio
n an
d ex
chan
ge ra
teun
cert
aint
y an
d vo
latil
ity
Net
impa
ct p
ositi
ve:
The
prin
cipl
e of
co
veri
ng th
e en
tire
terr
itory
with
ed
ucat
ion,
hea
lth,
judi
cial
ser
vice
s,
publ
ic o
rder
, etc
., ha
s a
com
petit
ive-
ness
-enh
anci
ng
eff e
ct o
n th
e le
ss
pros
pero
us re
gion
s;H
owev
er, t
he
allo
catio
n of
ex
pend
iture
s un
der
CSF
II d
id n
ot
addr
ess
regi
onal
co
hesi
on
Posi
tive
impa
ct:
Dem
ocra
tisat
ion
of
cred
it; re
duct
ion
of
the
infl a
tion
tax;
C
once
rns
abou
t ad
just
men
t cos
ts,
nam
ely
spec
ulat
ive
pric
e ri
ses
in th
e ho
usin
g m
arke
t: pr
icin
g-ou
t of
low
er-in
com
e se
gmen
ts o
f the
po
pula
tion
loca
ted
mai
nly
in th
e la
rger
m
etro
polit
an a
reas
Posi
tive
impa
ct:
Publ
ic e
xpen
ditu
res
tend
to b
e re
lativ
ely
high
in le
ss
pros
pero
us re
gion
s,
with
a s
igni
fi can
t em
ploy
men
t ro
le o
f pub
lic
adm
inis
trat
ion;
Con
cern
s ab
out
depe
nden
cy
Hig
hly
posi
tive:
Redu
ctio
n of
un
cert
aint
ies,
pr
ovid
ing
a so
unde
r fra
mew
ork
for i
nves
tmen
t de
cisi
ons;
Redu
ctio
n of
tr
ansa
ctio
n co
sts
enha
nces
effi
cien
cy
Posi
tive:
Inve
stm
ent i
n ba
sic
infr
astr
uctu
res
and
acce
ssib
ilitie
s;
Con
cern
s ab
out
sust
aina
bilit
y an
d ne
gativ
e en
viro
nmen
tal
impa
ct
Ass
esse
d im
pact
on
regi
onal
coh
esio
n
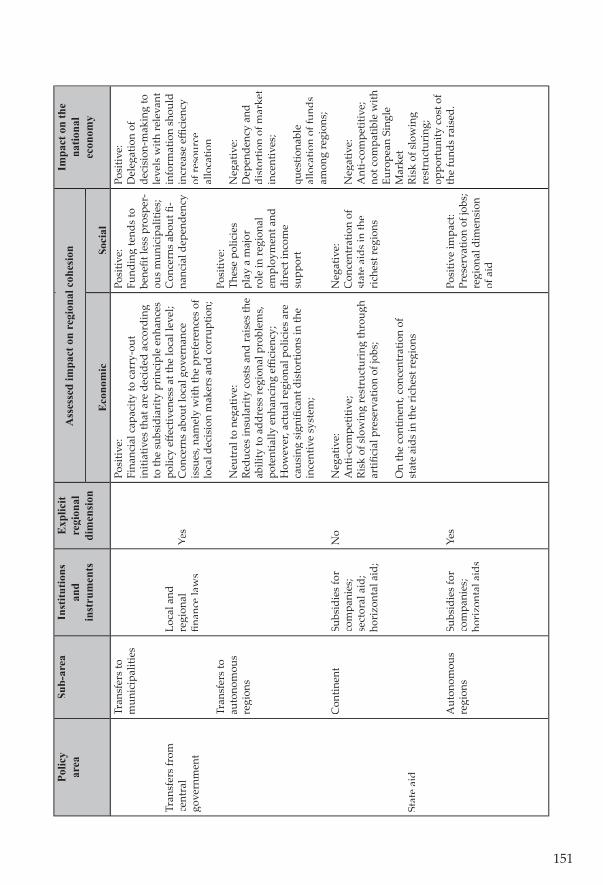
151
Polic
y ar
ea
Sub-
area
Inst
itutio
ns
and
inst
rum
ents
Exp
licit
regi
onal
di
men
sion
E
cono
mic
Soci
al
Impa
ct o
n th
e na
tiona
lec
onom
y
Tran
sfer
s fr
om
cent
ral
gove
rnm
ent
Stat
e ai
d
Tran
sfer
s to
mun
icip
aliti
es
Tran
sfer
s to
au
tono
mou
s re
gion
s
Con
tinen
t
Aut
onom
ous
regi
ons
Loca
l and
re
gion
al
fi nan
ce la
ws
Subs
idie
s fo
r co
mpa
nies
; se
ctor
al a
id;
hori
zont
al a
id;
Subs
idie
s fo
r co
mpa
nies
; ho
rizo
ntal
aid
s
Yes
Yes
Y No
Yes
Posi
tive:
Fina
ncia
l cap
acity
to c
arry
-out
in
itiat
ives
that
are
dec
ided
acc
ordi
ng
to th
e su
bsid
iari
ty p
rinc
iple
enh
ance
s po
licy
eff e
ctiv
enes
s at
the
loca
l lev
el;
Con
cern
s ab
out l
ocal
gov
erna
nce
issu
es, n
amel
y w
ith th
e pr
efer
ence
s of
lo
cal d
ecis
ion
mak
ers
and
corr
uptio
n;
Neu
tral
to n
egat
ive:
Redu
ces
insu
lari
ty c
osts
and
rais
es th
e ab
ility
to a
ddre
ss re
gion
al p
robl
ems,
po
tent
ially
enh
anci
ng e
ffi ci
ency
;H
owev
er, a
ctua
l reg
iona
l pol
icie
s ar
e ca
usin
g si
gnifi
cant
dis
tort
ions
in th
e in
cent
ive
syst
em;
Neg
ativ
e:A
nti-c
ompe
titiv
e;Ri
sk o
f slo
win
g re
stru
ctur
ing
thro
ugh
artifi
cia
l pre
serv
atio
n of
jobs
;
On
the
cont
inen
t, co
ncen
trat
ion
of
stat
e ai
ds in
the
rich
est r
egio
ns
Posi
tive:
Fund
ing
tend
s to
be
nefi t
less
pro
sper
-ou
s m
unic
ipal
ities
;C
once
rns
abou
t fi -
nanc
ial d
epen
denc
y
Posi
tive:
Th
ese
polic
ies
play
a m
ajor
ro
le in
regi
onal
em
ploy
men
t and
di
rect
inco
me
supp
ort
Neg
ativ
e:C
once
ntra
tion
of
stat
e ai
ds in
the
rich
est r
egio
ns
Posi
tive
impa
ct:
Pres
erva
tion
of jo
bs;
regi
onal
dim
ensi
on
of a
id
Posi
tive:
Del
egat
ion
of
deci
sion
-mak
ing
to
leve
ls w
ith re
leva
nt
info
rmat
ion
shou
ld
incr
ease
effi
cien
cy
of re
sour
ce
allo
catio
n
Neg
ativ
e:
Dep
ende
ncy
and
dist
ortio
n of
mar
ket
ince
ntiv
es;
ques
tiona
ble
allo
catio
n of
fund
s am
ong
regi
ons;
Neg
ativ
e:A
nti-c
ompe
titiv
e;
not c
ompa
tible
with
Eu
rope
an S
ingl
e M
arke
tRi
sk o
f slo
win
g re
stru
ctur
ing;
oppo
rtun
ity c
ost o
f th
e fu
nds
rais
ed.
Ass
esse
d im
pact
on
regi
onal
coh
esio
n
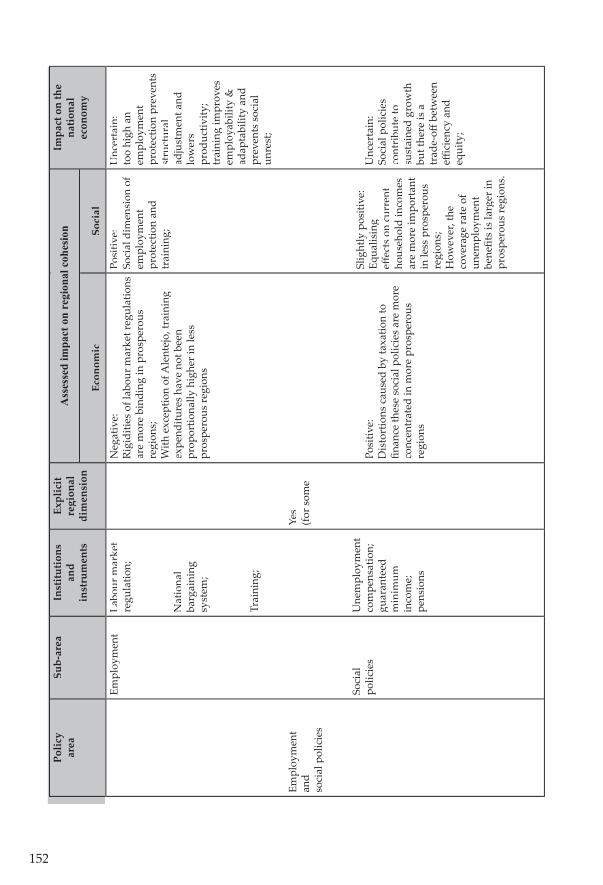
152
Polic
y ar
ea
Sub-
area
Inst
itutio
ns
and
inst
rum
ents
Expl
icit
regi
onal
di
men
sion
Ec
onom
icSo
cial
Impa
ct o
n th
e na
tiona
lec
onom
y
Empl
oym
ent
and
soci
al p
olic
ies
Empl
oym
ent
Soci
al
polic
ies
Labo
ur m
arke
t re
gula
tion;
Nat
iona
l ba
rgai
ning
sy
stem
;
Trai
ning
; Tr
aini
ng;
T Une
mpl
oym
ent
com
pens
atio
n;
guar
ante
ed
min
imum
in
com
e;pe
nsio
ns
Yes
(for s
ome
Neg
ativ
e:
Rigi
ditie
s of
labo
ur m
arke
t reg
ulat
ions
ar
e m
ore
bind
ing
in p
rosp
erou
s re
gion
s;W
ith e
xcep
tion
of A
lent
ejo,
trai
ning
ex
pend
iture
s ha
ve n
ot b
een
prop
ortio
nally
hig
her i
n le
ss
pros
pero
us re
gion
s
Posi
tive:
Dis
tort
ions
cau
sed
by ta
xatio
n to
fi n
ance
thes
e so
cial
pol
icie
s ar
e m
ore
conc
entr
ated
in m
ore
pros
pero
us
regi
ons
Posi
tive:
Soci
al d
imen
sion
of
empl
oym
ent
prot
ectio
n an
d tr
aini
ng;
Slig
htly
pos
itive
:Eq
ualis
ing
eff e
cts
on c
urre
nt
hous
ehol
d in
com
es
are
mor
e im
port
ant
in le
ss p
rosp
erou
s re
gion
s;H
owev
er, t
heco
vera
ge ra
te o
f un
empl
oym
ent
bene
fi ts
is la
rger
in
pros
pero
us re
gion
s.
Unc
erta
in:
too
high
an
empl
oym
ent
prot
ectio
n pr
even
ts
stru
ctur
al
adju
stm
ent a
nd
low
ers
prod
uctiv
ity;
trai
ning
impr
oves
em
ploy
abili
ty &
ad
apta
bilit
y an
d pr
even
ts s
ocia
l un
rest
;
Unc
erta
in:
Soci
al p
olic
ies
cont
ribu
te to
su
stai
ned
grow
th
but t
here
is a
tr
ade-
off b
etw
een
effi c
ienc
y an
d eq
uity
;
Ass
esse
d im
pact
on
regi
onal
coh
esio
n
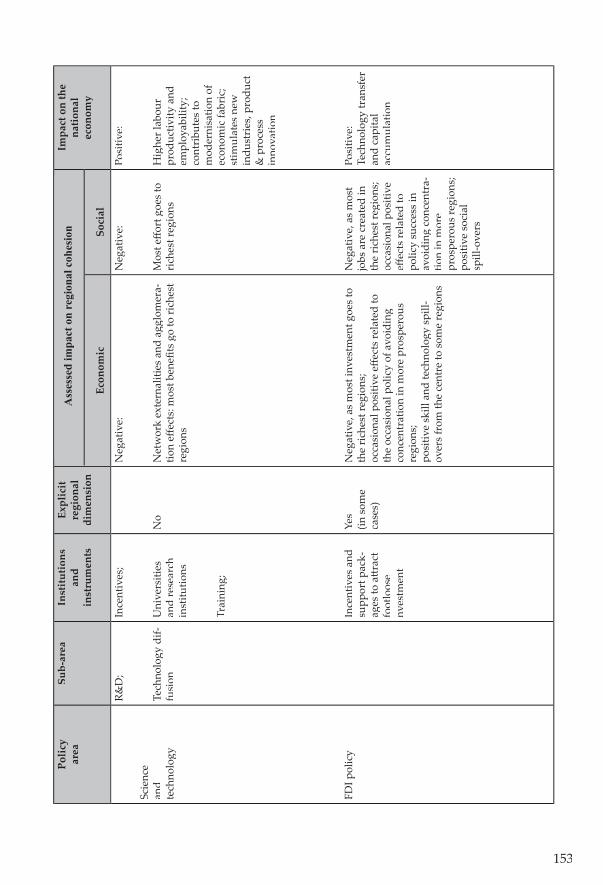
153
Polic
y ar
ea
Sub-
area
Inst
itutio
ns
and
inst
rum
ents
Expl
icit
regi
onal
di
men
sion
Ec
onom
icSo
cial
Impa
ct o
n th
e na
tiona
lec
onom
y
Scie
nce
and
tech
nolo
gy
FDI p
olic
y
R&D
;
Tech
nolo
gy d
if-fu
sion
Ince
ntiv
es;
Uni
vers
ities
an
d re
sear
ch
inst
itutio
ns
Trai
ning
; Tr
aini
ng;
T Ince
ntiv
es a
nd
supp
ort p
ack-
ages
to a
� rac
t fo
otlo
ose
nves
tmen
t
No
Yes
(in s
ome
case
s)
Neg
ativ
e:
Net
wor
k ex
tern
aliti
es a
nd a
gglo
mer
a-tio
n eff
ect
s: m
ost b
enefi
ts g
o to
rich
est
regi
ons
Neg
ativ
e, a
s m
ost i
nves
tmen
t goe
s to
th
e ri
ches
t reg
ions
;oc
casi
onal
pos
itive
eff e
cts
rela
ted
to
the
occa
sion
al p
olic
y of
avo
idin
g co
ncen
trat
ion
in m
ore
pros
pero
us
regi
ons;
posi
tive
skill
and
tech
nolo
gy s
pill-
over
s fr
om th
e ce
ntre
to s
ome
regi
ons
Neg
ativ
e:
Mos
t eff o
rt g
oes
to
rich
est r
egio
ns
Neg
ativ
e, a
s m
ost
jobs
are
cre
ated
in
the
rich
est r
egio
ns;
occa
sion
al p
ositi
ve
eff e
cts
rela
ted
to
polic
y su
cces
s in
av
oidi
ng c
once
ntra
-tio
n in
mor
e pr
ospe
rous
regi
ons;
posi
tive
soci
alsp
ill-o
vers
Posi
tive:
Hig
her l
abou
r pr
oduc
tivity
and
em
ploy
abili
ty;
cont
ribu
tes
to
mod
erni
satio
n of
ec
onom
ic fa
bric
; st
imul
ates
new
in
dust
ries
, pro
duct
&
pro
cess
in
nova
tion
Posi
tive:
Te
chno
logy
tran
sfer
an
d ca
pita
l ac
cum
ulat
ion
Ass
esse
d im
pact
on
regi
onal
coh
esio
n
154
REFERENCES
Articles:
Amorim, C. (2002), “Diff usion of innovations in economies in the periphery-core transition”, Unpublished Ph.D. thesis, Department of Economics, University of Reading.
Ardy, B., Begg, I., Schelkle, W., and F. Torres (2002a), EMU and Cohesion: Theory and Policy, Cascais: Principia.
Ardy, B., Begg, I., Schelkle, W., and F. Torres (2002b), “How will EMU aff ect Cohesion?”, Intereconomics - Review of European Economic Policy, Volume 37, 6, Springer, 300-314, 2002; reprinted in Rolf Caesar, Konrad Lammers and Hans-Eckart Scharrer (eds.), Konvergenz und Divergenz in der Europäischen Union - Empirische Befunde und wirtscha� spolitische Implikationen, Baden-Baden: Nomos Verlagsgesellscha� , 149-85.
Artis, M. and F. Nixson (2001), The Economics of the European Union - policy and analysis, 3rd edition, Oxford: Oxford University Press.
Begg, I., Barry, F., Dupuch, S., Freitas, M. L., Mulas-Granados, C., Mouhoud, M., Viesti, G., Monastiriotis, V., Nicolaides, P., and F. Torres (2004), “The Impact of Member State Policies on Cohesion”, report submi� ed to the DG Regio of the European Commission.
Cappelen A., Castellacci, F., Fagerberg, J. and B. Verspagen (2003), “The Impact of EU Regional Support on Growth and Convergence in the European Union”, Journal of Common Market Studies, 41, 4, 621-44.
Carlino, G. and L. Mills (1993), “Are US regional incomes converging?: a time series analysis”, Journal of Monetary Economics, 32, 335-46.
Farinha, L. and J. Mata (1996), “The Impact of Foreign Direct Investment in the Portuguese Economy”, Banco de Portugal Working Papers. 16/96.
Freitas, M. L. (2002), “Portuguese Economic Growth Re-Examined: an Anti-Fado Manifesto”, Proceedings of a conference organised by the Bank of Portugal on Portuguese Economic Development in the European Context: Determinants and Policies, 33-59.
155
Freitas, M. L., Pereira, F. and F. Torres (2003), “Convergence among EU Regions (1990-2001): Quality of National Institutions and «Objective 1» Status”, Intereconomics, 38(5), September/October, 270-75.
Figueiredo, A. M. (2001), “Uma visão espacial da estratégia e das prioridades de desenvolvimento económico e social para Portugal”, Revista de Prospectiva e Planeamento, 7, 13-41.
Guimarães, P., Figueiredo, O. and D. Woodward (2000), “Agglomeration and the location of Foreign Direct Investment in Portugal”, Journal of Urban Economics, 47, 115-35.
Midelfart-Knarvik, K. H. and H. G. Overman (2002), “Delocation and European Integration – Is structural Spending justifi ed?”, Economic Policy, October, 35, 322-59, October.
Pereira, A. M. and J. M. Andraz (2002), “Public investment in transportation infrastructures and economic performance in Portugal”, Proceedings of a conference organised by the Bank of Portugal on Portuguese Economic Development in the European Context: Determinants and Policies, 85-125.
Ramos, P. N. and A. Rodrigues (2001), “Porque é diferente o PIB per capita das Regiões Portuguesas?”, Cadernos Regionais, Instituto Nacional de Estatística - Direcção Regional do Centro, 13, 5-14
Rodrigues, M. J., Neves, A. and M. M. Godinho (2003), Para uma Política de Inovação em Portugal, Lisboa: Publicações Dom Quixote.
Simões, V. C. (1992), “Impacto do Investimento Directo Estrangeiro na Estrutura Industrial Portuguesa”, Study for programme 5 of PEDIP I (h� p://www.ceso-id.pt/ps_estudos1.htm).
St. Aubyn, M. (2002), “Evaluating the effi ciency in the Portuguese health and education sectors”, Proceedings of a conference organised by the Bank of Portugal on Portuguese Economic Development in the European Context: Determinants and Policies, 253-301.
Tavares, A.T.T. (2001), “Systems, Evolution and Integration: Modelling the Impact of Economic Integration on Multinational Strategies”, Unpublished Ph.D. thesis, Department of Economics, University of Reading.
Williamson, J. (1965), A� er Slavery: The Negro in South Carolina During Reconstruction, 1861-1877, Chapel Hill, North Carolina: University of North Carolina Press.
156
Reports:
Departamento de Prospectiva e Planeamento (2001), O Impacto Macroeconómico do Quadro Comunitário de Apoio 1994 - 1999, Lisboa: Ministério do Planeamento.
European Commission (1996), “First Report on Economic and Social Cohesion”, Commission of the European Communities.
European Comission (2002), “European Innovation Scoreboard”, Technical Paper n. 3, EU Regions, Brussels.
European Commission (2003), Enterprise Policy Scoreboard 2003, Commission Staff Working Paper, Brussels.
European Comission (2004), “A New Partnership for Cohesion: Convergence, Competitiveness and Cooperation”, Third Report on Economic and Social Cohesion, February.
157
ADDITIONAL BIBLIOGRAPHY
Articles:
Almeida, R. (2003), “Local Economic Structure and Growth”, paper presented at the SPIE annual conference, Universidade Nova de Lisboa, June, h� p://www.fe.unl.pt/spie2003/.
Begg, I. (1997), “Reform of the structural Funds a� er 1999”, European Planning Review, 5, 675-89.
Begg, I. and D. Mayes (1993), “Cohesion in the European Community. A key imperative for the 1990’s?”, ’s?”, ’ Regional Science and Urban Economics, 23, 3, 427-48, July.
Boldrin, M. and F. Canova (2001), “Inequality and convergence in Europe’s regions: ’s regions: ’reconsidering European regional policies”, Economic Policy, 32, 207-53.
Bradley, J. (2000), “The impact of CSF on objective 1 countries: 1989-2006”, Regional Policy DG XVI of the European Commission, Luxembourg.
Carvalho, M.F., Castanheira, M.E. and M. Proença (2000), “Distribuição do rendimento e pobreza em Portugal e suas regiões”, Working Document, Departamento de Prospectiva e Planeamento.
Chorincas, J. (2002), “Desenvolvimento económico regional na Europa Comunitária: uma interpretação a partir da análise de clusters”, Revista de Prospectiva e Planeamento, vol. 8, 101-31.
Domingos, E. (1999), “Dinâmica de desenvolvimento espacial – uma abordagem através da distribuição regional das receitas fi scais”, Revista de Prospectiva e Planeamento, vol. 5, 29-47.
Furtado, A. and J. Fermisson (2001), “Evolução do perfi l industrial das regiões Portuguesas no período 1982-1998: diversidade, tendências e implicações”, IV Conferência sobre a Economia Portuguesa Centro de Investigação Sobre Economia Portuguesa.
Marques, A. (2002), “ A política Comunitária de auxílios do Estado e a Coesão Económica e Social”, Europa: Novas Fronteiras, 12, December.
Martin, P. (1998), “Public Policies, Regional Inequalities and Growth”, CEPR Working Paper 1841.
158
Perroux, F. (1955), “Note sur la notion de pôle de croissance”, Economique Appliquée, 1-2: 307-20.
Porto, M. (1993), “A Dimensão Espacial da União Monetária”, separata da publicaçãodo Curso de Estudos Europeus da Faculdade de Direito, A União Europeia.
Porto, M. (1993), “A Integração Comunitária e o Desenvolvimento Regional em Portugal”, Boletim do Centro de Estudos e Formação Autárquica (CEFA), ano I – nº 1
Varejão, J., Carneiro, A. And A. Teixeira (2002), A dinâmica do emprego na região Norte, Porto: Comissão de Coordenação da Região Norte.
Reports:
Almeida, L. T. (ed.) (2002a), “1º Relatório sobre a Caracterização da Região de Lisboa e Vale do Tejo e da Região do Alentejo”, Lisboa: Instituto Superior Técnico da Universidade Técnica de Lisboa, May.
Almeida, L. T. (ed.) (2002b), “2º Relatório sobre a Caracterização e Potencialidades do Sistema Logístico, Transportes e Acessibilidades nas Regiões de Lisboa e Vale do Tejo e Alentejo”, Lisboa: Instituto Superior Técnico da Universidade Técnica de Lisboa, May.
Comissão de Coordenação da Região do Alentejo (2000), Relatório fi nal “PORA - Programa Operacional da Região do Alentejo entre 1994 e 1999”.
Comissão de Coordenação da Região do Algarve (2000a), Algarve 2000-2006: Estratégia de Desenvolvimento do Algarve, December.
Comissão de Coordenação da Região do Algarve (2000b), Algarve 2000-2006: O Algarve em números, December.
Comissão de Coordenação da Região do Algarve (2000c), Algarve 2000-2006: Um retrato do Algarve na Viragem do Século, December.
Comissão de Coordenação da Região do Algarve (2001), Algarve 2000-2006: Programa Operacional do Algarve, December.
Comissão de Coordenação da Região do Algarve (2002), Relatório fi nal de execução “PROA - Programa Operacional do Algarve entre 1994 e 2001”, April.
Comissão de Coordenação da Região Centro (2002), Relatório fi nal “PROCENTRO – Programa Operacional da Região Centro entre 1994 e 1999”, March.
Comissão de Coordenação da Região de Lisboa e Vale do Tejo (2000), Relatório fi nal “PORLVT - Programa Operacional da Região de Lisboa e Vale do Tejo: 1994 -1999”.
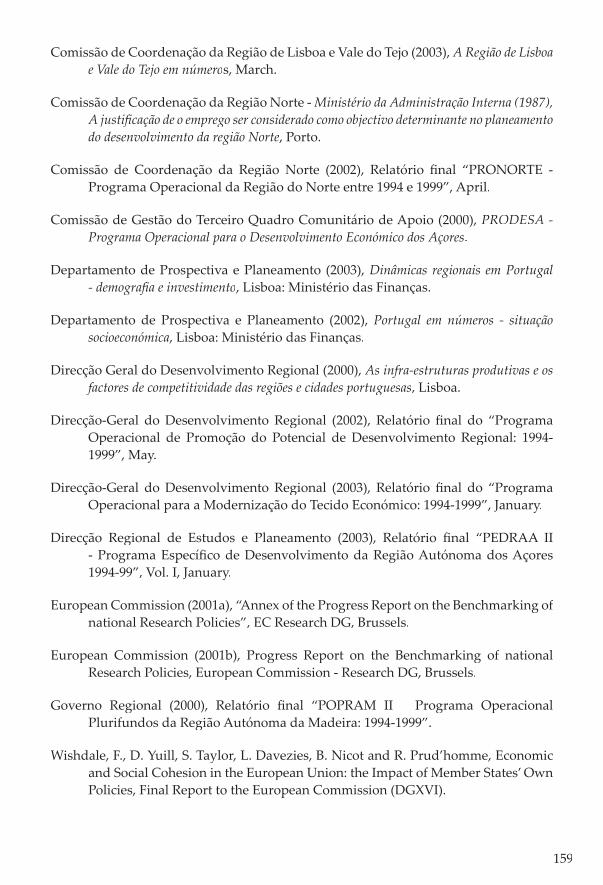
159
Comissão de Coordenação da Região de Lisboa e Vale do Tejo (2003), A Região de Lisboa e Vale do Tejo em números, March.
Comissão de Coordenação da Região Norte - Ministério da Administração Interna (1987), A justifi cação de o emprego ser considerado como objectivo determinante no planeamento do desenvolvimento da região Norte, Porto.
Comissão de Coordenação da Região Norte (2002), Relatório fi nal “PRONORTE - Programa Operacional da Região do Norte entre 1994 e 1999”, April.
Comissão de Gestão do Terceiro Quadro Comunitário de Apoio (2000), PRODESA - Programa Operacional para o Desenvolvimento Económico dos Açores.
Departamento de Prospectiva e Planeamento (2003), Dinâmicas regionais em Portugal - demografi a e investimento, Lisboa: Ministério das Finanças.
Departamento de Prospectiva e Planeamento (2002), Portugal em números - situação socioeconómica, Lisboa: Ministério das Finanças.
Direcção Geral do Desenvolvimento Regional (2000), As infra-estruturas produtivas e os factores de competitividade das regiões e cidades portuguesas, Lisboa.
Direcção-Geral do Desenvolvimento Regional (2002), Relatório fi nal do “Programa Operacional de Promoção do Potencial de Desenvolvimento Regional: 1994-1999”, May.
Direcção-Geral do Desenvolvimento Regional (2003), Relatório fi nal do “Programa Operacional para a Modernização do Tecido Económico: 1994-1999”, January.
Direcção Regional de Estudos e Planeamento (2003), Relatório fi nal “PEDRAA II - Programa Específi co de Desenvolvimento da Região Autónoma dos Açores 1994-99”, Vol. I, January.
European Commission (2001a), “Annex of the Progress Report on the Benchmarking of national Research Policies”, EC Research DG, Brussels.
European Commission (2001b), Progress Report on the Benchmarking of national Research Policies, European Commission - Research DG, Brussels.
Governo Regional (2000), Relatório fi nal “POPRAM II – Programa Operacional Plurifundos da Região Autónoma da Madeira: 1994-1999”.
Wishdale, F., D. Yuill, S. Taylor, L. Davezies, B. Nicot and R. Prud’homme, Economic and Social Cohesion in the European Union: the Impact of Member States’ Own Policies, Final Report to the European Commission (DGXVI).
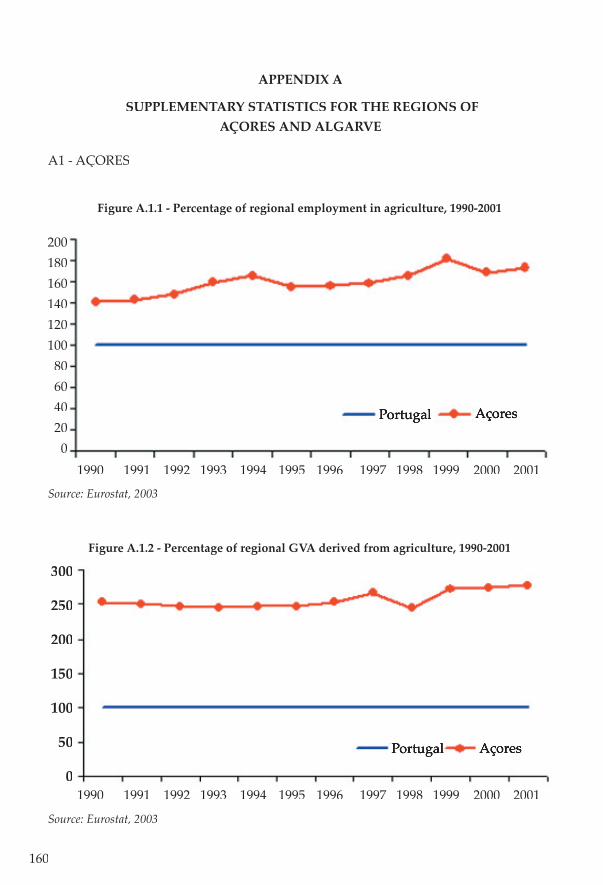
160
APPENDIX A
SUPPLEMENTARY STATISTICS FOR THE REGIONS OF AÇORES AND ALGARVE
Source: Eurostat, 2003
Figure A.1.2 - Percentage of regional GVA derived from agriculture, 1990-2001
Portugal Açores
300
250
200
150
100
50
01990 1991 1992 1993 1994 1995 1996 1997 1998 1999 2000 2001
200180160140120100806040200
1990 1991 1992 1993 1994 1995 1996 1997 1998 1999 2000 2001
Portugal Açores
Source: Eurostat, 2003
Figure A.1.1 - Percentage of regional employment in agriculture, 1990-2001
A1 - AÇORES
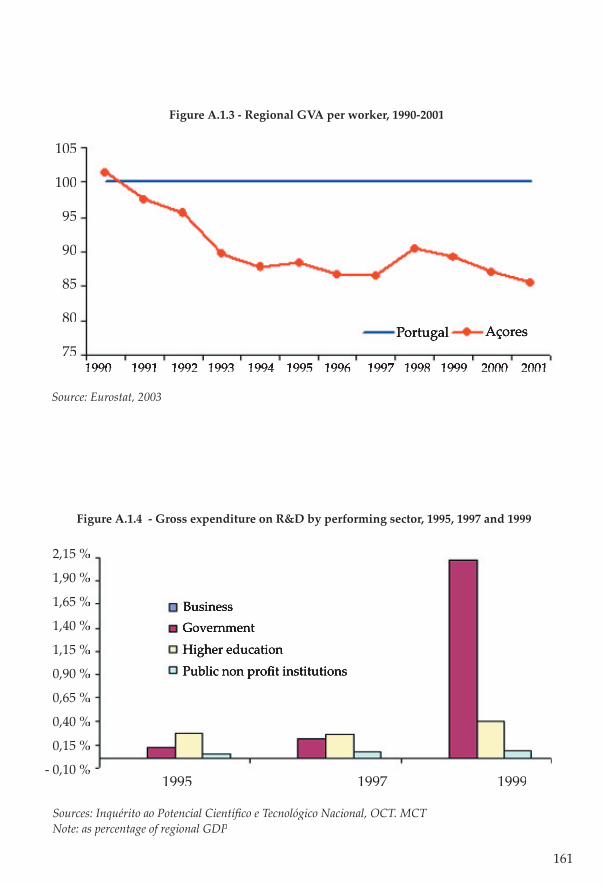
161
Figure A.1.3 - Regional GVA per worker, 1990-2001
Source: Eurostat, 2003
1995 1997 1999
2,15 % 2,15 %
1,90 %1,90 %
1,65 %1,65 %
1,40 %1,40 %
1,15 %1,15 %
0,90 %0,90 %
0,65 %0,65 %
0,40 %0,40 %
0,15 %0,15 %
- 0,10 % - 0,10 %
BusinessGovernment
Higher educationPublic non profi t institutions
Sources: Inquérito ao Potencial Científi co e Tecnológico Nacional, OCT. MCTNote: as percentage of regional GDP
105
100
95
90
85
80
75Portugal Açores
1990 1991 1992 1993 1994 1995 1996 1997 1998 1999 2000 20011990 1991 1992 1993 1994 1995 1996 1997 1998 1999 2000 2001
Figure A.1.4 - Gross expenditure on R&D by performing sector, 1995, 1997 and 1999
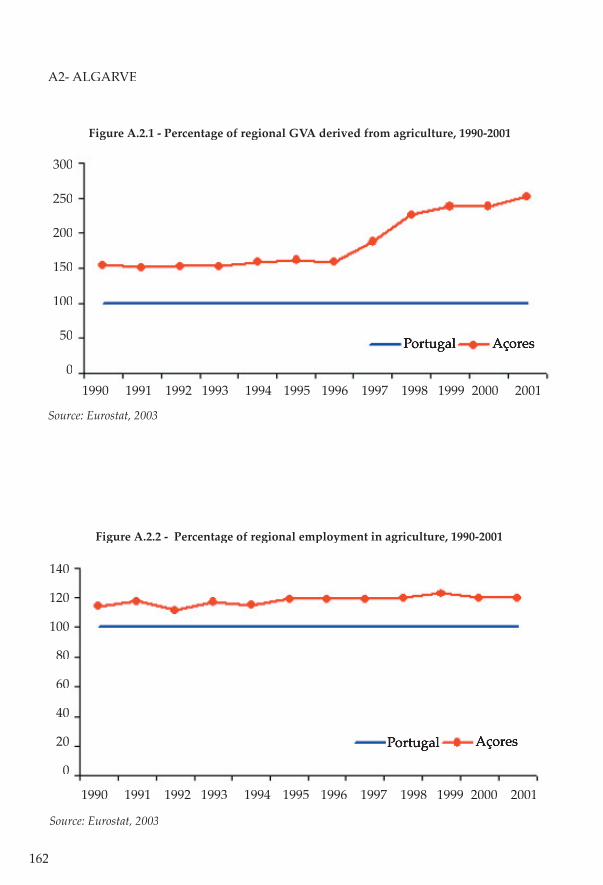
162
A2- ALGARVE
Figure A.2.1 - Percentage of regional GVA derived from agriculture, 1990-2001
300
250
200
150
100
50
0
Portugal Açores
Figure A.2.2 - Percentage of regional employment in agriculture, 1990-2001
1990 1991 1992 1993 1994 1995 1996 1997 1998 1999 2000 2001
Source: Eurostat, 2003
140
120
100
80
60
40
20
0
Portugal Açores
1990 1991 1992 1993 1994 1995 1996 1997 1998 1999 2000 2001
Source: Eurostat, 2003
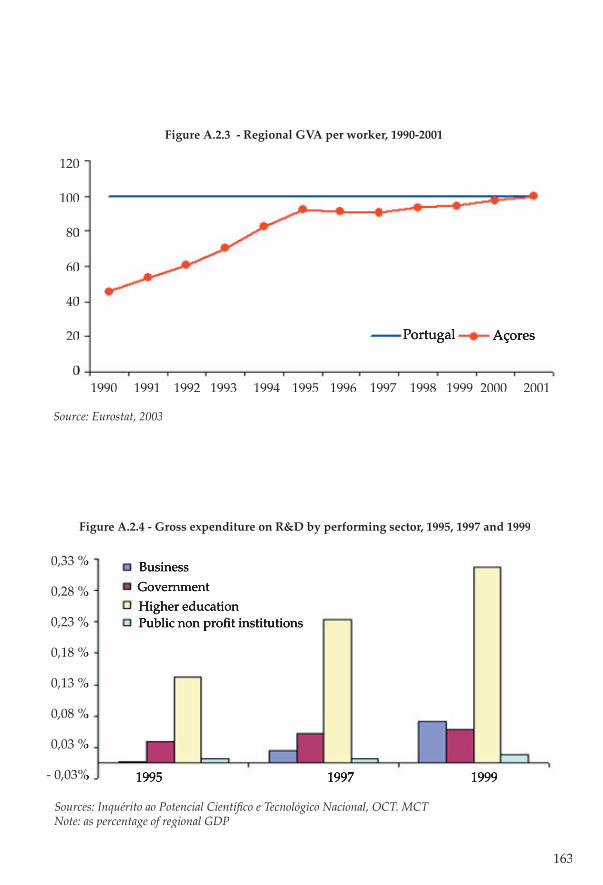
163
Figure A.2.3 - Regional GVA per worker, 1990-2001
Source: Eurostat, 2003
1990 1991 1992 1993 1994 1995 1996 1997 1998 1999 2000 2001
120120
100100
8080
6060
4040
2020
00
Portugal Açores
Figure A.2.4 - Gross expenditure on R&D by performing sector, 1995, 1997 and 1999
1995 1997 19991995 1997 1999
0,33 %0,33 %
0,28 %0,28 %
0,23 %0,23 %
0,18 %0,18 %
0,13 %0,13 %
0,08 %0,08 %
0,03 %0,03 %
- 0,03% %
BusinessGovernmentHigher educationPublic non profi t institutions
Sources: Inquérito ao Potencial Científi co e Tecnológico Nacional, OCT. MCTNote: as percentage of regional GDP
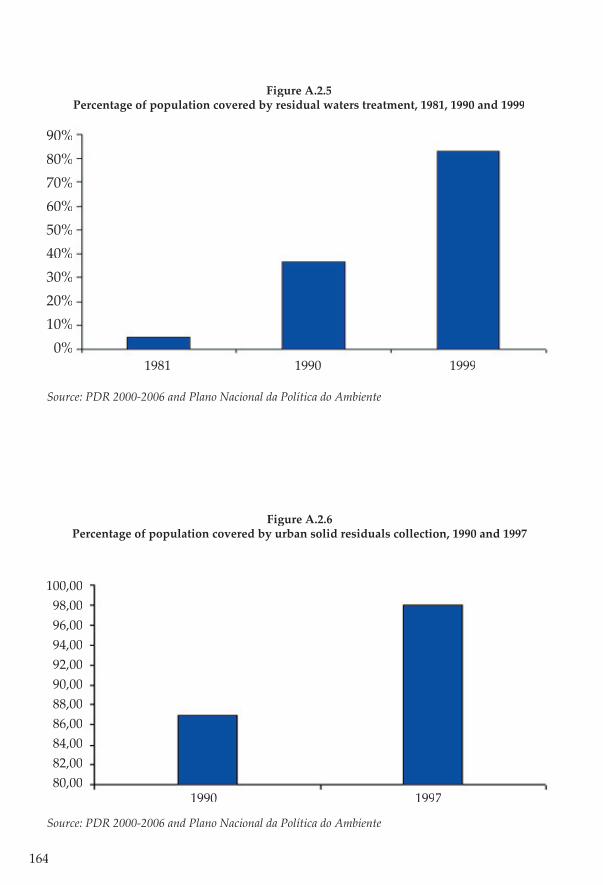
164
1981 1990 1999
90%80%70%60%50%40%30%20%10%0%
Figure A.2.5Percentage of population covered by residual waters treatment, 1981, 1990 and 1999
Source: PDR 2000-2006 and Plano Nacional da Política do Ambiente
Figure A.2.6Percentage of population covered by urban solid residuals collection, 1990 and 1997
1990 1997
100,0098,0096,0094,0092,0090,0088,0086,0084,0082,0080,00
Source: PDR 2000-2006 and Plano Nacional da Política do Ambiente
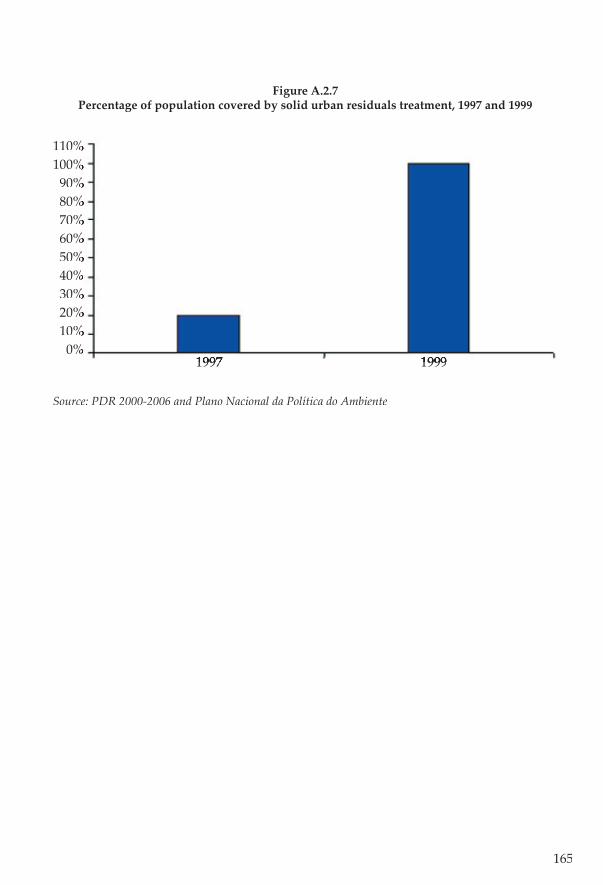
165
Figure A.2.7Percentage of population covered by solid urban residuals treatment, 1997 and 1999
110%110%100%100%90%90%80%80%70%70%60%60%50%50%40%40%30%30%20%20%10%10%0%0%
1997 199 1997 19999
Source: PDR 2000-2006 and Plano Nacional da Política do Ambiente
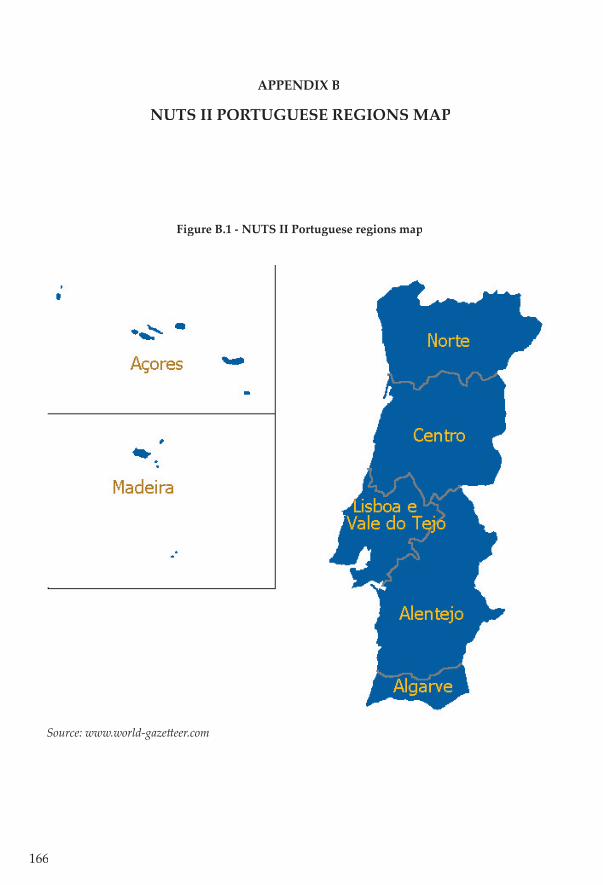
166
APPENDIX B
NUTS II PORTUGUESE REGIONS MAP
Figure B.1 - NUTS II Portuguese regions map
Source: www.world-gaze� eer.com

167
Related Documents