Industry Analysis Report Sterlite Technologies Sumit Arora (FT153107) Section - 3

Cable_transmission wires_ Industry Analysis Report
Aug 15, 2015
Welcome message from author
This document is posted to help you gain knowledge. Please leave a comment to let me know what you think about it! Share it to your friends and learn new things together.
Transcript

Industry
Analysis Report
Sterlite Technologies
Sumit Arora (FT153107) Section - 3

Sterlite Technologies Page 1
Table of Contents 1. Introduction .................................................................................................................................... 2
1. Industry characteristics ................................................................................................................... 2
1.1. Size ...................................................................................................................................... 2
1.2. Year on Year growth (last 5 years) ...................................................................................... 3
1.3. Competitors ........................................................................................................................ 3
1.4. Cost Structure ..................................................................................................................... 4
1.5. Supplier industry characteristics and power ...................................................................... 5
1.6. Buyer power ........................................................................................................................ 5
1.7. Substitutes .......................................................................................................................... 5
2. Macros - PESTEL Analysis ................................................................................................................ 5
2.1. Political ................................................................................................................................ 5
2.2. Economic ............................................................................................................................. 6
2.3. Social factors ....................................................................................................................... 6
2.4. Legal framework ................................................................................................................. 6
2.5. Environments (Green issues) .............................................................................................. 7
3. Peer evaluation ............................................................................................................................... 7
3.1. Products, Solution and Services .......................................................................................... 7
3.2. Market ................................................................................................................................. 8
3.3. Growth ................................................................................................................................ 9
4. Financials ......................................................................................................................................... 9
4.1. Balance Sheet ...................................................................................................................... 9
4.2. P&L .................................................................................................................................... 11
4.3. Cash Flow .......................................................................................................................... 13
4.4. Stock Performance ............................................................................................................ 13
4.5. ROI, Net Profit Margins, Fixed capital/Sales, Export Sales/Total sales, R&D/Sales ........ 14
5. Competitive Advantage ................................................................................................................ 14
6. Porter Five Force Analysis ............................................................................................................. 14
7. References .................................................................................................................................... 15

Sterlite Technologies Page 2
1. Introduction
Cables find its application in sectors like IT, steel, refineries, power, railways, oil & gas etc. The two
major areas of its use are Telecommunication and Power. Power cables are Polyvinyl chloride or
Poly-ethylene coted, whereas the cables for telecommunication industry are based on Poly-
ethylene. India is currently seeing an advent in mobile broadband and data services due to growing
technology adaption. In order to accommodate such demand, more and more providers are shifting
to Optical Fibre due to high speeds that can be achieved. Research has established that Optical Fibre
cables will replace traditional copper and microwave wires in the long run. The demand in Indian
Cable Industry is cyclical and the industry is characterized as uneven with large number of small-
scale cable producers.
In telecom sector, various government initiatives with the focus to bridge digital divide and improve
broadband connectivity has led to significant demand from Optical Fibre Cable Industry. The
National Optical Fiber Network (NOFN) project is one such initiative to extend broadband access to
country’s 250,000 gram panchayats by 2016 which is expected to cost exchequer about US$3.5
billion.
Sterlite Technologies, a sister company of Vedanta Group, is a leading global provider of
transmission solutions for the power and telecom industries with Total revenue of US$ 8Bn
(approx.) and Market capitalization US$ 10Bn (approx.).
Business verticals
Telecom
Power
Infrastructure
Optical cables
Conductors
Smart grids
Sterlite’s offerings enable high bandwidth data transmission and high voltage power transmission.
They have recently bagged orders from leading telecom operators in India and partnering with them
for their 4G rollout across the country. In power segment, Sterlite Technologies is working on several
prestigious power transmission infrastructure projects spanning over 3000Kms across India.
1. Industry characteristics
1.1. Size The size of cable and telecom industry is 8,052.57cr.

Sterlite Technologies Page 3
1.2. Year on Year growth (last 5 years)
Globally, Fiber optical cables used for telecom & broadband segment is
witnessing a CAGR of 5.9%.
1.3. Competitors
Finolex Cables
Shilpi Cable
Vindhya Telelink
Aksh Optifibre
Birla Ericsson
Bhagyanagar India
Surana Telecom
CMI
Paramount Communications
GR Cables
Sterlite Technologies has the market capitalization of Rs 2633.71 cr.
Below is the list of players that are competing with Sterlite Technologies for market
share. Sterlite Technologies has the market share of 33.50% which stands second in the
Cable and Telecom sector just behind Finolex Cables. All others share the remaining
25.94%.
0
5
10
15
20
25
2014 2013 2012 2011 2010
Sales yoy growth (%)
Sales yoy growth (%)

Sterlite Technologies Page 4
Competitor Name Market Cap(Rs. cr)
Market Share
Net Profit (Rs. cr)
Finolex Cables 3,188.79 40.56% 145.27
Shilpi Cable 661.82 8.42% 28.03
Vindhya Telelink 550.77 7.00% 20.86
Aksh Optifibre 293.23 3.73% 26.02
Birla Ericsson 216.15 2.75% 19.24
Bhagyanagar Ind 127.02 1.62% 2.63
Surana Telecom 84.57 1.08% 0.73
CMI 65.16 0.83% 1.66
Paramount Communications 40.07 0.51% -4.64
GR Cables 1.47 0.02% -8.48
Sterlite Technologies 2,633.71 33.50% 50.2
Finolex Cables is most profitable with a profit of Rs. 145.27 cr followed by Sterlite Technologies
and Shilpi Cable with Rs. 50.2 and Rs. 28.03 cr profit respectively.
1.4. Cost Structure
Aksh Optifibre has the highest Net Profit Margin for last two years at 11.43% and 10.79%
suggesting that it might have the lowest cost structure amongst its competitors.
Net Profit Margin(%)
2014 2013 2012 2011 2010
Sterlite Technologies 1.820 1.400 1.590 6.170 10.070
Finolex Cables 8.620 6.330 4.690 4.210 3.540
Vindhya Telelin 4.840 1.650 -5.060 1.830 5.550
Shilpi Cable 2.830 3.980 4.020 5.780 5.700
Aksh Optifibre 11.430 10.790 5.370 -445.290 -132.720
Birla Ericsson 6.570 4.470 -6.230 -6.290 2.270
33.50%
40.56%
8.42%
7.00% 3.73%
2.75%
1.62%
1.08%
0.83%
0.51%
Market Share
Sterlite Technologies
Finolex Cables
Shilpi Cable
Vindhya Telelin
Aksh Optifibre
Birla Ericsson
Bhagyanagar Ind

Sterlite Technologies Page 5
1.5. Supplier industry characteristics and power
The tariff structure is regulated and the industry experience huge buying volume. Incentives are
high and the industry is evolving slowly in the trading market. Thus, supplier power is low.
1.6. Buyer power
The Industry is exposed to the risk of price fluctuation of raw materials (Aluminium & alloys, oil)
& energy resources, etc. Most of the companies in this industry have backward integrated their
operations to produce raw materials used in construction of optical fiber cables. Thus, buyer
power is very low. There are less substitutes and industry enjoys least cost advantage.
1.7. Substitutes
Optical Fiber can be substituted by any disruptive innovation in data transmission techniques
which eliminates expensive infrastructure required as a part to deploy these cables. One such
example is demonstrated by Google with the project named ‘LOON’. The project exploited the
need to provide connectivity to places/terrains/water bodies where laying out optical fibers is
not feasible. Research has been going on to present it to the world as a cheaper and more
reliable option than fiber optic cables.
2. Macros - PESTEL Analysis
2.1. Political
Government is the major customer of the industry and any delay in capex allocation by the government and utility incumbents, could adversely impact the Industry’s’ growth. Almost all the companies under the cable industry has diversified product portfolio with different variants in Power and Telecom transmission cables which provides some insulation by division of risks. To overcome this issue with geographic dependence, many of the companies in this industry have started expanding its foot on the global front. In telecom sector, various government initiatives with the focus to bridge digital divide and improve broadband connectivity has led to significant demand from Optical Fibre Cable Industry. It is an established correlation that GDP growth depends directly on how deeper the internet penetration to the remotest areas of a country is. As per the latest United Nations report, fixed-broadband penetration is around 28% in developed economies, 6% in developing countries and only 0.2% in the least developed countries. This is why Governments of many developing countries across the world, including India, are investing profoundly developing infrastructure to enable broadband in rural areas. The National Optical Fiber Network (NOFN) project is one such initiative to extend broadband access to country’s 250,000 gram panchayats by 2016 which is expected to cost exchequer about US$3.5 billion. Network for Spectrum (NFS) is another project that has been built by BSNL to create a network exclusively for armed forces in three years, which is expected to be used by defence wings to release 150 MhZ of telecom spectrum in critical bands.

Sterlite Technologies Page 6
2.2. Economic
Company has multiple manufacturing facilities in India. The clientele is not limited to Indian
origin but is far-fetched across different parts of the globe. Performance and growth of the
Industry is dependent on the overall health and steadiness of the world economies. Any
downturn in economic condition will have an adverse effect on performance of the Industry.
India lags far behind major world economies in terms of fiber deployments which indicate
significant opportunities for fiber optic players in Indian market. India accounts for more than
17per-cent of world total population. Of 1.4 billion people of the world who have no access to
electricity in the world, India accounts for over 300 million. Whilst Indian economy follows the
growth path, demand for energy has been drastically increasing. This has led to continuous
shortfall across different parts of the country. Current energy production in the country is just
4% against 5% demand of world energy production. Affordability plays the major role in Indian
context.
Energy ( MU) Peak (MW)
Requirements 933741 136193
Availability 837374 118676
Surplus -96367 -17517
Surplus % -10.30% -12.90%
2.3. Social factors
India is the 2nd largest telecom market with 585mn wireless subscribers. Still, it lags in market
penetration which is just 50%, leaving behind enormous potential for growth. With globalization
and rise of SMAC technologies, the need to stay connected has been rising exponentially. High
end applications like IPTV, high definition TV, 3D TV, Online gaming, Video on Demand and many
more such services require high bandwidth. With such increasing dependence on technology
and internet, people are looking for high speed for data transmission and are willing to pay the
price that comes with it. Internet industry has been successful in connecting over 2.3 billion
users and communities virtually. Global IP traffic is expected to show 23% CAGR for 5 year
period (2012-2017). Thus many private companies are upgrading to optical fiber network to
achieve customers’ expectations. There has been spike in demand for optical fibers with
advanced economies like USA, Germany, Japan, Holland, etc that has been spending huge sums
on R&D to build fiber to the node (FTTN) and fiber to the home (FTTH) networks.
2.4. Legal framework
Companies like Sterlite Technologies, Finolex cables, Aksh Optifiber have multiple facilities in
India and has a diversified customer base across the globe. As the result, these companies are
Sterlite Technologies Page 7
subject to federal, local, state, fiscal laws and regulations in each country in which it operates.
These regulatory regimes of a geographic location play a pivotal role in performance of these
companies. Changes to government regulations with respect to import tariffs or export
inducements can sham threat to companies impacted by the same. This has a significant effect
on performance of these companies in the sector. Any pending cases on the companies related
to taxation, excise duty, commercial/legal disputes, custom duty has an adverse effect on
companies’ profitability.
2.5. Environments (Green issues)
Almost all the companies in the industry have started to record and minimize carbon footprint
produced during various manufacturing and operating procedures. A lot of new initiatives were
introduced to promote green practices. Different companies in this sector use different
Environment Management System that take care of various aspects of the environment
associated with health, and safety structure, air quality, air pollution, waste management,
disposal of hazardous waste, recycling and reuse, environment policies, imparting environment
training.
All these above mentioned macro issues were critical to any company working in Cable-Telecom
sector and should be thoroughly reviewed and discussed in all the annual meetings.
3. Peer evaluation
3.1. Products, Solution and Services
Sterlite Technologies
Conductors, OPGW
Power Cables
Optical fiber and Cables
Systems and solutions
Datacom cables
Grid networks
Rods and Accessories
Neural Networks
Vindhya Telelink
Fiber Optic Cables
Copper Cables
Low Voltage Power Cables
Feeder Cables
Speciality cables
Jelly Filled Telecommunication Cables FRP Rod

Sterlite Technologies Page 8
Finolex Cables
Wires and Cables
Optic Fiber
Power Cables
Switches
CFLs
Pipes and Fittings
PVC Designs
PVC sheets
Copper Rods
LED Lightening
Chemicals
Shilpi Cable
Fiber Optic Cables
Radio Frequency cables
Cable Accessories
Aksh Optifibre
Optical Fiber
Optical Fiber Cables
Cable Reinforcement Solutions
iControl (Service)
Pigeon (Service)
Fiber to Home (Service)
Birla Ericsson
Optical and copper telecommunication cables
High Fibre Count Ribbon Cables
Jelly Filled Telephone Cables (JFTC)
Optical Ground Wire (OPGW)
3.2. Market
Most of the companies are into two markets namely:
1) Telecom & Broadband
2) Power
Vindhya Telelinks has been able to maintain its profitability over its peers, but its growth prospects are limited due to narrow product portfolio. Vindhaya Telelinks is into Jelly Filled Telecommunication Cables segment and has recently diversified into Optical Fiber Cable market.
Birla Ericsson has been the first mover into optical fiber cable segment in collaboration with Ericsson Cables AB (now called Ericsson Network Technologies) to manufacture Optical Fiber Cables in 1992. It today produces wide range of products from Ribbon Cable to JFTC and is looking into expanding into FTTx field. Over the years Birla Ericsson has established itself as premium brand of telecommunications cables in India. Aksh Optifibre started manufacturing optical fiber and optical fiber cables in 1994 and has
backward integrated in 1997 to create key raw material for OFC. The facility is supported by hi-
tech infrastructure to manufacture optic fibers for various applications.

Sterlite Technologies Page 9
Finolex is the most diversified company among its peers. It has limited presence in optical fiber
cables in comparison with Aksh Optifibre and Sterlite Technologies. Finolex builds its competitive
strength using economies of scale and maintaining health cash flows.
Shilpi Cables, on the other hand, has minimum products in the market. Its flagship product is
Radio Frequency cables for Telecom Sector. The company is spending heavily in R&D and makes
continuous efforts to innovate better quality products.
Sterlite Technologies enjoys substantial market share across the zinc, Aluminium metals and
copper and has a diversified portfolio. Its major strength is in its huge cash reserve and its
aggressive overseas expansion strategies.
3.3. Growth
4. Financials
4.1. Balance Sheet
Balance Sheet ( in Rs. Cr.)
Sterlite Techno
Finolex Cables
Shilpi Cable
Vindhya Telelin
Aksh Optifibre
Mar '14 Mar '13 Mar '14 Mar '14 Mar '14
Sources Of Funds
Total Share Capital 78.76 30.59 49.32 11.84 74.28
Equity Share Capital
78.76 30.59 49.32 11.84 74.28
Companies/Year 2014 2013 2012 2011 2010
Sterlite Technologies 1.820 1.400 1.590 6.170 10.070
Competitor Company 1 - Finolex Cables 8.620 6.330 4.690 4.210 3.540
Competitor Company 2 - Vindhya Telelin 4.840 1.650 -5.060 1.830 5.550
Competitor Company 3 - Shilpi Cable 2.830 3.980 4.020 5.780 5.700
Competitor Company 4 - Aksh Optifibre 0.570 11.430 10.790 5.370 -445.290
Competitor Company 5 - Birla Ericsson 6.570 4.470 -6.230 -6.290 2.270
Sterlite Technologies Page 10
Share Application Money
0 0 0.96 0 0
Preference Share Capital
0 0 0 0 0
Reserves 1,139.53 893.73 173.05 231.66 282.22
Revaluation Reserves
0 0 0 0 0
Networth 1,218.29 924.32 223.33 243.5 356.5
Secured Loans 1,243.16 143.09 140.21 76.25 75.19
Unsecured Loans 0 19.17 5.47 109 28.64
Total Debt 1,243.16 162.26 145.68 185.25 103.83
Total Liabilities 2,461.45 1,086.58 369.01 428.75 460.33
Application Of Funds
Gross Block 1,672.25 916.38 115.44 161.67 210.89
Less: Accum. Depreciation
666.15 504.27 20.68
107.53 116.55
Net Block 1,006.10 412.11 94.76 54.14 94.34
Capital Work in Progress
16.4 35.73 0.14 4.69 15.5
Investments 433.65 324.09 13.75 117.68 186.72
Inventories 299.41 329.63 141.36 75.8 24.56
Sundry Debtors 671.28 149.65 337.59 262.74 67.86
Cash and Bank Balance
44.12 39.81 40.14 9.76 0.54
Total Current Assets
1,014.81 519.09 519.09 348.3 92.96
Loans and Advances
1,075.36 113.12 53.1 58.84 146.58
Fixed Deposits 0 0 0 0 0
Total CA, Loans & Advances
2,090.17 632.21 572.19 407.14 239.54
Deffered Credit 0 0 0 0 0
Current Liabilities 1,052.24 238.24 300.92 146.99 65.37
Provisions 32.63 79.32 10.89 7.89 10.4

Sterlite Technologies Page 11
Total CL & Provisions
1,084.87 317.56 311.81 154.88 75.77
Net Current Assets
1,005.30 314.65 260.38 252.26 163.77
Miscellaneous Expenses
0 0 0 0 0
Total Assets 2,461.45 1,086.58 369.03 428.77 460.33
Contingent Liabilities
1,739.67 536.65 311.39 110.94 166.39
Book Value (Rs) 30.94 60.44 45.09 205.47 24
4.2. P&L
Profit & Loss account (in Rs. Cr.)
Sterlite Techno
Finolex Cables
Shilpi Cable
Vindhya Telelin
Aksh Optifibre
Mar '14 Mar '13 Mar '14 Mar '14 Mar '14
Income
Sales Turnover 2,726.34 2,270.68 986.03 424.15 220.06
Excise Duty 0 0 0 0 0
Net Sales 2,726.34 2,270.68 986.03 424.15 220.06
Other Income 16.95 1.16 3.33 6.37 14.49
Stock Adjustments
18.05 29.68 8.85 13.04 6.53
Total Income 2,761.34 2,301.52 998.21 443.56 241.08
Expenditure
Raw Materials 1,951.94 1,739.29 861.05 228.83 148.92
Power & Fuel Cost
118.73 40.69 3.32 5.57 5.56
Employee Cost 122.39 84.59 6.19 21.69 15.19

Sterlite Technologies Page 12
Other Manufacturing Expenses
0 0 17.35 113.62 0
Selling and Admin Expenses
0 0 0 0 0
Miscellaneous Expenses
297.04 206.13 13.53 20.39 23.33
Preoperative Exp Capitalised
0 0 0 0 0
Total Expenses 2,490.10 2,070.70 901.44 390.1 193
Operating Profit 254.29 229.66 93.44 47.09 33.59
PBDIT 271.24 230.82 96.77 53.46 48.08
Interest 95.28 13.38 52.03 22.18 7.06
PBDT 175.96 217.44 44.74 31.28 41.02
Depreciation 102.88 46.63 4.88 5.53 14.99
Other Written Off 0 0 0 0 0
Profit Before Tax 73.08 170.81 39.86 25.75 26.03
Extra-ordinary items
0 0 0.04 0 0
PBT (Post Extra-ord Items)
73.08 170.81 39.9 25.75 26.03
Tax 22.88 25.54 11.87 4.88 0
Reported Net Profit
50.2 145.27 28.03 20.86 26.02
Total Value Addition
538.16 331.41 40.39 161.27 44.08
Preference Dividend
0 0 0 0 0
Equity Dividend 11.82 18.35 0 2.37 3.71
Corporate Dividend Tax
2.01 3.03 0 0.4 0.63
Per share data (annualised)

Sterlite Technologies Page 13
Shares in issue (lakhs)
3,938.00 1,529.39 493.16 118.51 1,485.65
Earning Per Share (Rs)
1.27 9.5 5.68 17.6 1.75
Equity Dividend (%)
15 60 0 20 1.25
Book Value (Rs) 30.94 60.44 45.09 205.47 24
4.3. Cash Flow
Shilpi Cable
Vindhya Telelin
Finolex Cables
Sterlite Techno
Aksh Optifibre
Mar '14 Mar '14 Mar '14 Mar '14 Mar '14
12 mths 12 mths 12 mths 12 mths 12 mths
Net Profit Before Tax 39.9 25.75 244.01 50.2 26.02
Net Cash From Operating Activities 42.18 -2.3 222.73 262.64 25.62
Net Cash (used in)/from -16.53 -29.4 -67.17 -407.93 -7.41
Investing Activities
Net Cash (used in)/from Financing Activities
-11.58 29.58 -61.05 79.75 -19.6
Net (decrease)/increase In Cash and Cash Equivalents
14.07 -2.13 94.51 -65.54 -1.39
Opening Cash & Cash Equivalents 26.07 4.76 136.66 93.11 1.93
Closing Cash & Cash Equivalents 40.14 2.63 231.17 27.57 0.54
4.4. Stock Performance
Company Name 1 Year 9 Month 6 Month 3 Month 1 Month 2 Week 1 Week Last Price
Aksh Optifibre 16.05 14.95 15.9 22 20.8 20.85 19.25 19.05
18.69% 27.42% 19.81% -13.41% -8.41% -8.63% -1.04%
Birla Ericsson 12 17.5 27.8 58.7 62.3 69.95 72.45 70.15
484.58% 300.86% 152.34% 19.51% 12.60% 0.29% -3.17%
Finolex Cables 53.6 84.35 113.45 166.85 217.75 231.6 230.6 208.15
288.34% 146.77% 83.47% 24.75% -4.41% -10.13% -9.74%
Shilpi Cable 8.53 11.35 11.4 27.48 40.15 62.9 58.05 63.8
647.95% 462.11% 459.65% 132.17% 58.90% 1.43% 9.91%
Sterlite Techno 19.5 23.85 20.95 64.9 63.3 70.3 65.7 64.35
230.00% 169.81% 207.16% -0.85% 1.66% -8.46% -2.05%
Vindhya Telelin 140 165 151 326 451.3 504.85 474.85 454.95
224.96% 175.73% 201.29% 39.56% 0.81% -9.88% -4.19%

Sterlite Technologies Page 14
4.5. ROI, Net Profit Margins, Fixed capital/Sales, Export
Sales/Total sales, R&D/Sales
5. Competitive Advantage Sterlite Technologies maintains huge cash reserves and has diversified business models. Its
competitive advantage come from the fact that it has enormous experience in commercial power
generation and has experienced and focussed management. Sterlite has world’s low cost
producer advantage and has now been looking aggressively to expand in global marketplace. It
boosts its technological innovations, handling of composite core technologies, in-house
engineering capabilities as a major reason for its competitive advantage. The company looks to
gain advantage from competitive market place, external customers, and even adjacent
industries. Sterlite is the only company, among its peers, that has invested highly in R&D in last 5
years and is successful in providing innovative power solutions to the world. They are pioneer in
development and promotion of HTSL conductors in India which are used to reduce transmission
losses by 30 to 40%. Thus company risk management practices have helped enhance sustainable
competitive advantage.
Sterlite should optimize capacity utilization and fuel mix, look forward to green field projects,
continuously identify opportunities for competitive differentiation, and invest in distribution and
smart grids to maintain its competitive advantage.
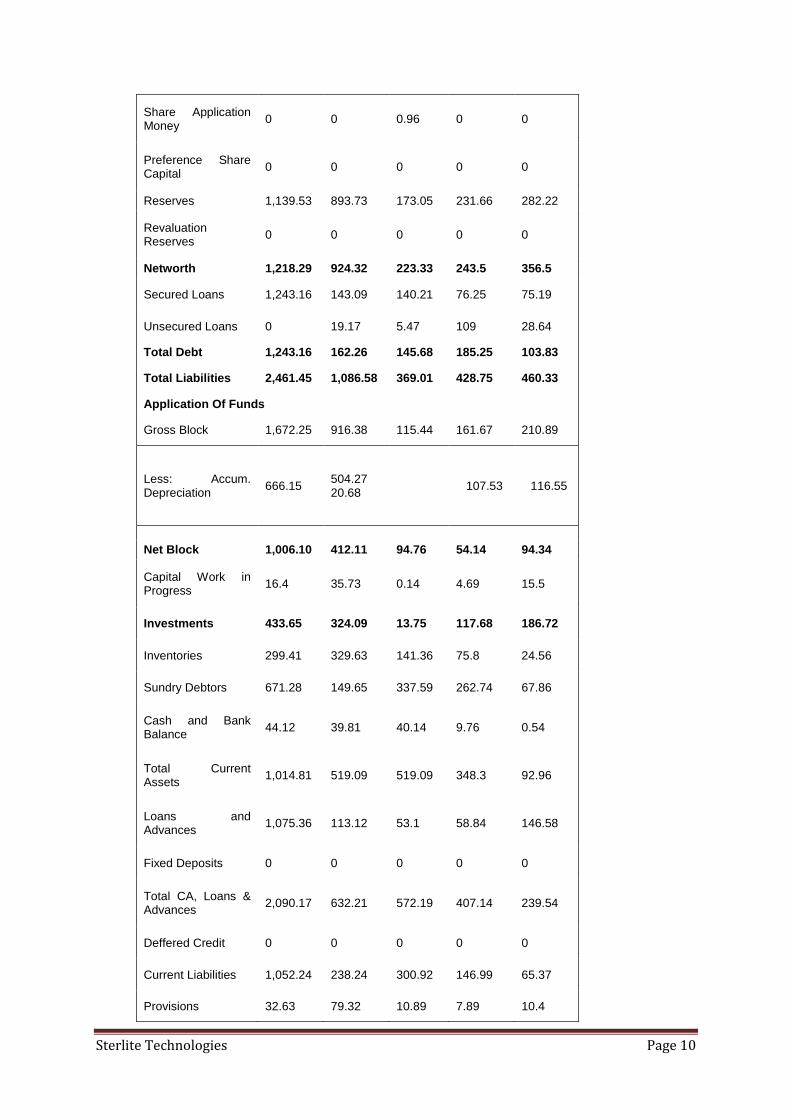
6. Porter Five Force Analysis
Sterlite Technologies is exposed to the risk of price fluctuation of raw materials (Aluminium & alloys,
oil) & energy resources, etc. Sterlite has backward integrated its operations to produce raw
materials used in construction of optical fiber cables. Below is the Porter Five Force Analysis for
Sterlite Technologies:
Companies ROI Net Profit Margin Fixed Capital/Sales(x) Export Sales/Total Sales R&D/Sales
Sterlite Technologies 0.06 1.82 0.57 33.28 0.00308839
Finolex Cables 0.22 8.62 0.65 2.09 0
Vindhya Telelin 0.11 4.84 0.34 9.87 -
Shilpi Cable 0.18 2.83 0.11 12.02 0
Aksh Optifibre 0.07 11.43 0.98 60.37 0
Birla Ericsson 0.30 6.57 0.36 17.13 -
Sterlite Technologies Page 15
7. References
http://www.indiastat.com/table/marketforecast/10143/marketforecastofele
http://www.indiastat.com/table/marketforecast/10143/marketforecastoftel
www.moneycontrol.com
www.livemint.com
http://economictimes.indiatimes.com/markets/live-coverage
http://money.rediff.com/
http://www.sterlitetechnologies.com/

Sterlite Technologies Page 16
http://www.akshoptifibre.com/
http://www.birlaericsson.com/
http://www.finolex.com/
http://www.shilpicables.com/
Related Documents