ACTA CHEMICA IASI, 21_2, 93-106 (2013) DOI: 10.2478/achi-2013-0009 Comparative study on field collected samples of aged silicon rubber composite coatings for high voltage insulators I.V. Tudose, 1,4 M. Suchea, 1,3,4* K. Siderakis, 2,3 E. Thalassinakis, 5 E. Koudoumas 1,3 1 Center of Materials Technology and Photonics School of Applied Technology, Technological Educational Institute of Crete, 71004 Heraklion, Greece 2 Center of Energy and Photovoltaic Systems (CEPS), School of Applied Technology, Technological Educational Institute of Crete, 71004 Heraklion, Greece 3 Electrical Engineering Department, Technological Educational Institute of Crete, Greece 4 “Al.I.Cuza” University of Iasi, 11 Bulevard Carol I, Iasi, 700506, Romania 5 Hellenic Electricity Distribution Network Operator S.A. (HEDNO),Greece Abstract: Pollution of high voltage (HV) insulators is a phenomenon with a considerable impact to the performance of transmission and distribution electrical networks. The use of composite materials and especially Silicone Rubber proved to be an efficient improvement, capable of suppressing the problem and diminishing the flashover probability. As a result ceramic insulators in transmission lines are replaced by insulators with composite housing, either HTV Silicone Rubber or LSR. In the case of HV substations however, the replacement of insulators is rather difficult, due to the complexity of the equipment and the * M. Suchea, e-mail: [email protected]

Welcome message from author
This document is posted to help you gain knowledge. Please leave a comment to let me know what you think about it! Share it to your friends and learn new things together.
Transcript
ACTA CHEMICA IASI, 21_2, 93-106 (2013)
DOI: 10.2478/achi-2013-0009
Comparative study on field collected samples of aged
silicon rubber composite coatings for high voltage
insulators
I.V. Tudose,1,4 M. Suchea,1,3,4* K. Siderakis,2,3 E. Thalassinakis,5
E. Koudoumas1,3 1Center of Materials Technology and Photonics School of Applied
Technology, Technological Educational Institute of Crete, 71004 Heraklion, Greece
2Center of Energy and Photovoltaic Systems (CEPS), School of Applied Technology, Technological Educational Institute of Crete,
71004 Heraklion, Greece 3Electrical Engineering Department, Technological Educational Institute of
Crete, Greece 4“Al.I.Cuza” University of Iasi, 11 Bulevard Carol I, Iasi, 700506, Romania 5Hellenic Electricity Distribution Network Operator S.A. (HEDNO),Greece
Abstract: Pollution of high voltage (HV) insulators is a phenomenon with a
considerable impact to the performance of transmission and distribution electrical
networks. The use of composite materials and especially Silicone Rubber proved
to be an efficient improvement, capable of suppressing the problem and
diminishing the flashover probability. As a result ceramic insulators in
transmission lines are replaced by insulators with composite housing, either HTV
Silicone Rubber or LSR. In the case of HV substations however, the replacement
of insulators is rather difficult, due to the complexity of the equipment and the
* M. Suchea, e-mail: [email protected]
I.V. Tudose and co-workers 94
corresponding financial cost. In this case the application of RTV Silicone Rubber
is an equivalent alternative. The ceramic insulators are covered with a 0.5 mm
RTV SIR coating which provides the advantages of composite insulators on a
ceramic substrate. After installation the possible material lifetime, which is
determined by the service conditions and the material formulation, is of primary
concern. In Crete, a large scale application exists and coatings that exceed a
service period of 10 years are still in operation. The present study focuses on the
structural and morphological characterization of field collected composite
insulators of various ages so that the degradation degree can be correlated with
their service.
Keywords: HV insulators, RTV SIR coatings, aging, characterization.
Introduction
The potential benefits of composite insulators have interested
utilities and equipment manufacturers worldwide since polymeric designs
were first introduced in the 1960s. Lighter in weight and less susceptible to
breakage than glass or porcelain materials, they showed immediate promise
for lowering transportation costs, easing installation and reducing
maintenance. The savings could be especially dramatic in areas with
difficult accessibility. Usually smaller than ceramic insulators, composites
can also reduce tower heights and right-of-way space requirements. In
particular, polymeric materials have been found to drastically reduce the
effects of vandalism on high-voltage insulator. Polymers typically resist
mechanical shock much better than ceramics or glass. Materials testing and
development for HV insulator applications focused on a number of
candidates, including ethylene propylene rubbers (such as EPDM),
polyolefins, polyurethanes, polyethylene, epoxies, silicones and PTFE
(Teflon).1 Water repellency has been a fundamental design parameter,

Comparative study of field collected samples … 95
regardless of the material or specific insulator design. Silicone materials of
various types have been used in electrical service for over 50 years. In fact,
one of the first applications for a silicone was electrical insulation on
aircraft in World War II. In the 1970s, Dow Coming developed a room-
temperature curing elastomer, designed for spray application to porcelain
insulators to reduce insulator maintenance and resist flashovers, particularly
in salt fog environments.1,2 The product is still used today, allowing utilities
to improve the electrical performance of porcelain arrestors without
replacing them. Silicone elastomers for high-voltage insulator applications
are generally high-consistency rubber compounds. Two types of filler are
commonly used: silica is the reinforcement that lends physical strength to
the polymer, while alumina trihydrate (ATH) improves arc resistance. Filler
treatments, pigments and cure agents may also be part of the formulation in
small amounts. The polymer-filler combination is important in silicone
insulators. Processing, physical properties and electrical performance are all
affected by the molecular weight and structure of the polymer, as well as
filler type, size, shape, surface treatment and residual catalyst or
contaminants. In determining the optimum formulation for specific
applications, device manufacturers and silicone suppliers must determine
the best balance of properties, processing characteristics and economic
considerations. Silicone has demonstrated better hydrophobicity and lower
surface energy than many other organic polymers. The surface properties of
silicone are unique, in that it recovers its hydrophobicity between
contamination and/or corona episodes, while other materials progressively
deteriorate. Corona exposure does temporarily increase the wettability of
silicone rubber, a phenomenon associated with an increase in surface
oxygen content, but the water-repellency returns after a period of rest. The
I.V. Tudose and co-workers 96
material's ability to recover its hydrophobicity is thought to result at least in
part from the diffusion of low molecular weight PDMS (polydimethyl-
siloxane) fluid to the surface.3-5 Another phenomenon which affects the
hydrophobic recovery demonstrated by silicone insulators is surface
reorientation. The extreme flexibility of the siloxane chain and the low
molecular forces between methyl groups produce a low glass transition
temperature and a high free volume of PDMS. These conditions readily
permit surface reorientation of silicone rubber, which has the most mobile
surface of all common polymers for HV applications. Existing test standards
for ceramic insulators have not shown good correlation with actual service
experience when applied to composite materials. In particular, it has proven
very difficult to develop test conditions that accurately duplicate material
degradation which occurs during long-term service. In Crete, Greece a large
scale application exists and coatings that exceed a service period of 10 years
are still in operation. The present study focuses on the structural and
morphological characterization of field collected composite insulators of
various ages so that the degradation degree can be correlated with their
service.
Experimental
Various field collected samples with different aging conditions and a
reference virgin sample of SIR HTV were studied using scanning electron
microscopy (SEM), energy dispersive X-ray spectroscopy (EDX) and
attenuated total reflectance (ATR) Fourier transform infrared spectroscopy
(FT-IR). SEM and EDX characterization were performed using a JEOL
JSM 6362LV electron microscope equipped with an EDAX INCA X-act
Oxford Instrument detector. SEM surface characterization was performed in
Comparative study of field collected samples … 97
low vacuum (3-12 Pa) without any sample preparation while EDX
characterization and elemental mapping were performed in high vacuum.
Elemental mapping of the sample surface was also collected at
magnification 10000 and using large acquisition times (more than 80000
counts) for an accurate definition of surface points. The instrument used for
FT-IR characterization was a spectrometer fitted with an ATR module
manufactured by Shimadzu.
The characteristics of samples used for the present study are presented
in Table 1.
Table 1. Characteristics of samples.
Sample denomination Characteristics
SIR 1 Reference virgin SIR HTV
SIR 2, 3, 4, 5 Artificially aged SIR HTV
Dg 1, 2, 3, 4 where 1, 2, 3, 4 stands for
different spatial positioning onto HV
insulator
TR 11, VT PHASE A
CONDITION: OLD
INST DATE: Estimated 2002
Ge 1, 2, 3, 4 where 1, 2, 3, 4 stands for
different spatial positioning onto HV
insulator
TR 11, CT PHASE C
CONDITION: NEW MATERIAL
INST DATE: 02/2009
Gz 1, 2, 3, 4 where 1, 2, 3, 4 stands for
different spatial positioning onto HV
insulator
TR 11, VT PHASE C
CONDITION: WASHED AND
ADDITION OF NEW MATERIAL
COATING (2 LAYERS)
INST DATE: 02/2009
I.V. Tudose and co-workers 98
Results and discussions
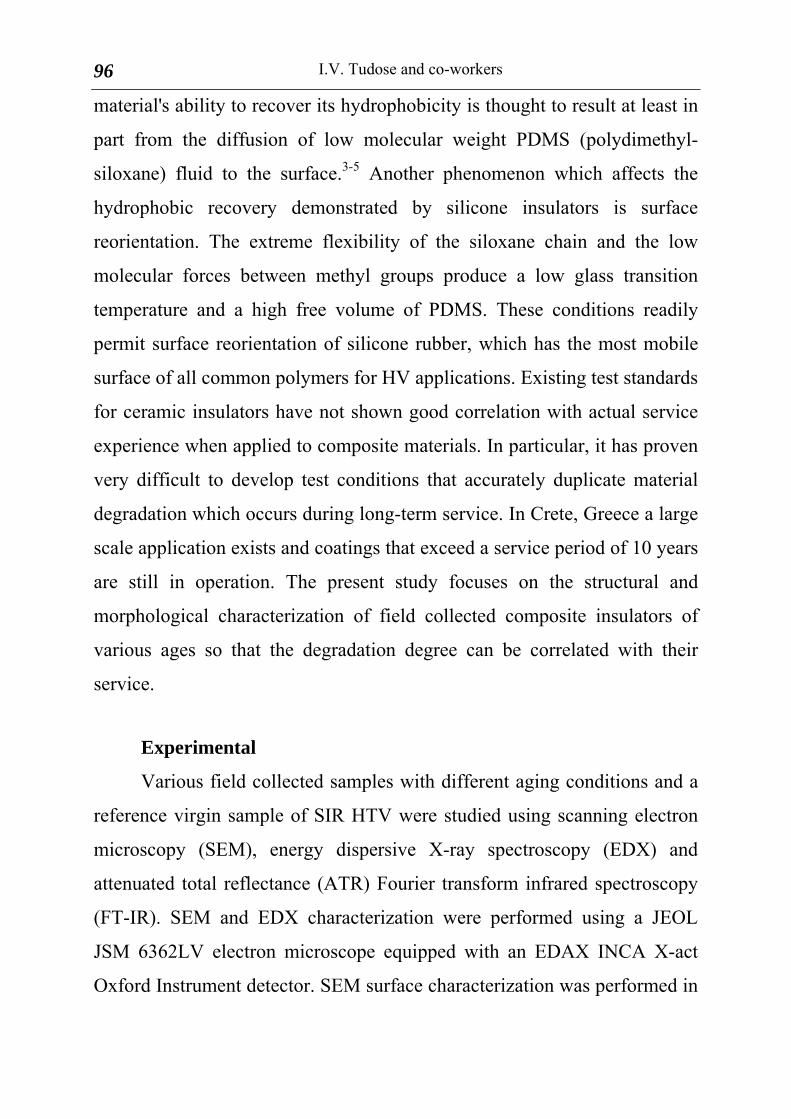
Reference sample: Figure 1 presents surface morphology of a
virgin SIR HTV sample at two different magnifications and electron
acceleration voltages. Higher magnification reveals the filler material
distribution in the silicon rubber matrix.
Figure 1. LV-SEM image of reference SIR sample a. general view ( 500 at low
acceleration voltage 5kV) b. close up evidencing the filler material ( 5000, 20kV).
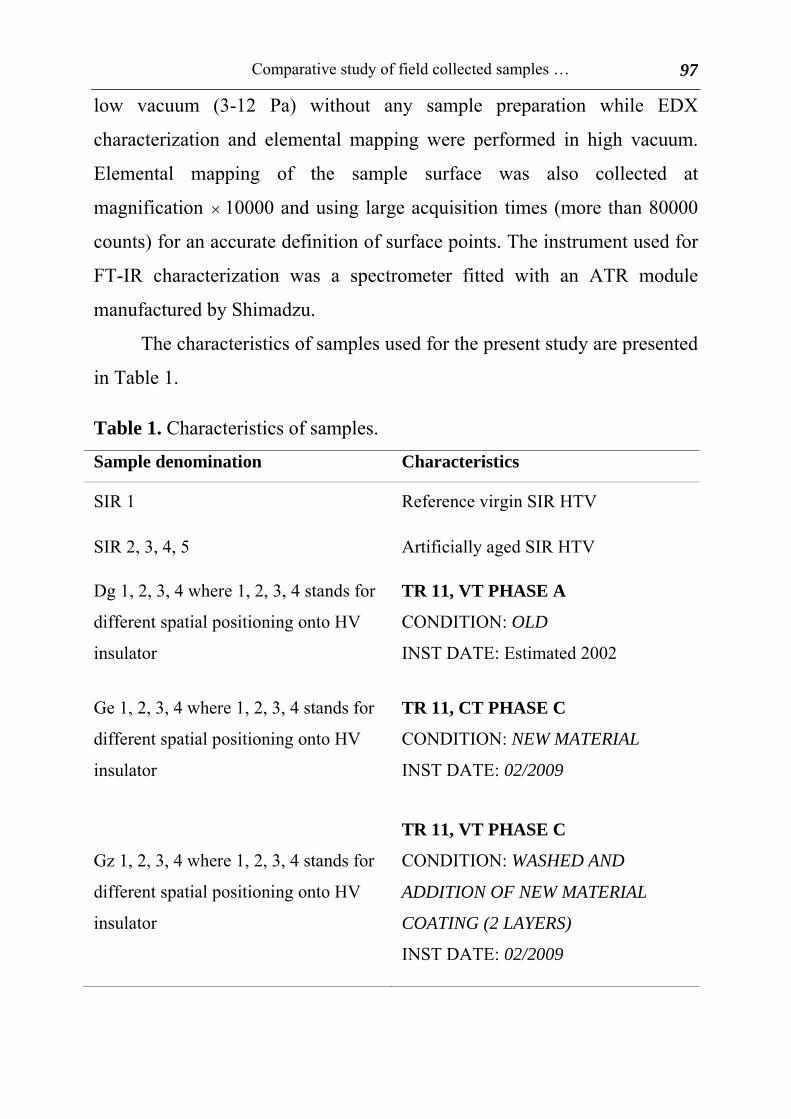
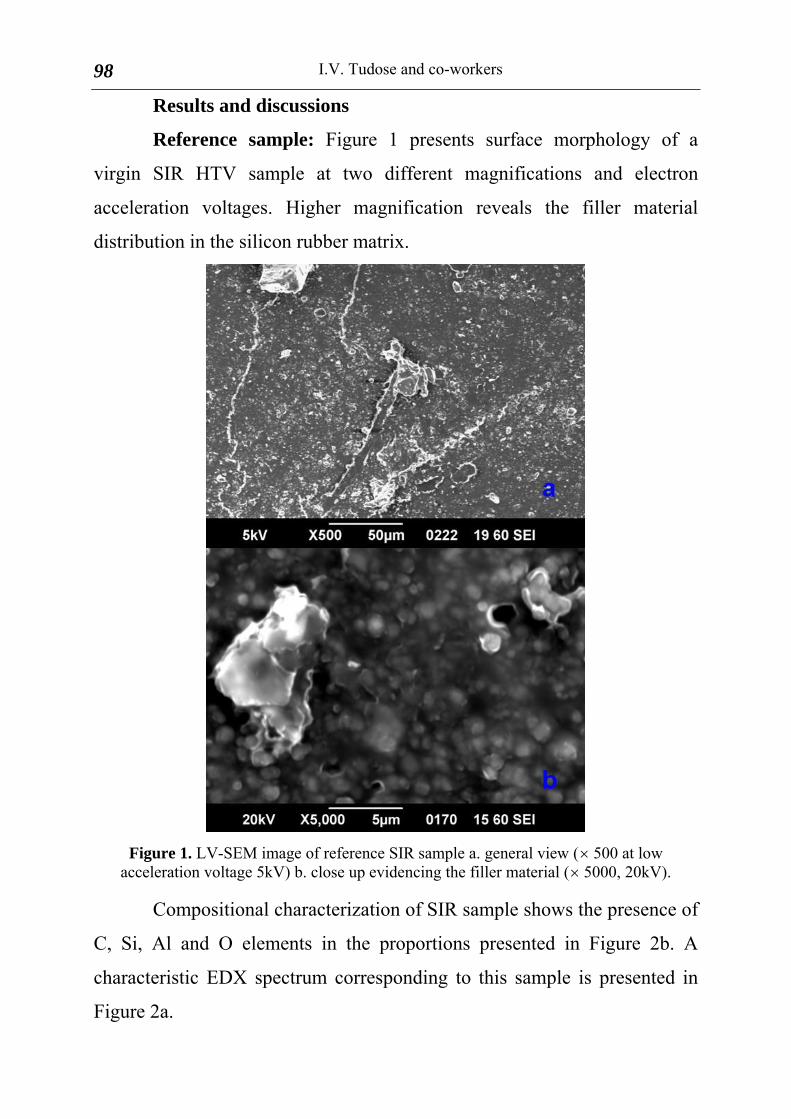
Compositional characterization of SIR sample shows the presence of
C, Si, Al and O elements in the proportions presented in Figure 2b. A
characteristic EDX spectrum corresponding to this sample is presented in
Figure 2a.
Comparative study of field collected samples … 99
Figure 2. Compositional characterization of SIR sample a. EDX spectrum; b. elemental
composition (weight %).
ATR FT-IR characterization was performed for the reference sample
and different artificially aged samples since the target of the study is
monitoring and degradation control. These are used to set-up a reliable
characterization procedure in order to overcome experimental difficulties
due to low control of sample thickness when sampling is done in the field
from the HV outdoor insulators. The absorbance vs. wavenumber (cm-1
)
spectra for five reference samples SIR are presented in Figure 3 and Table 2
together with the area of the peaks for Si-O-Si stretching and Si-CH3
symmetric deformation since these peaks can be correlated with the
backbone of the polymer and its hydrophobic properties respectively. It is
expected that during degradation processes the polymer will suffer methyl
group looses due to oxidation and surface mineralisation and
correspondingly the band at 1261.61 cm-1 will drop in intensity while the
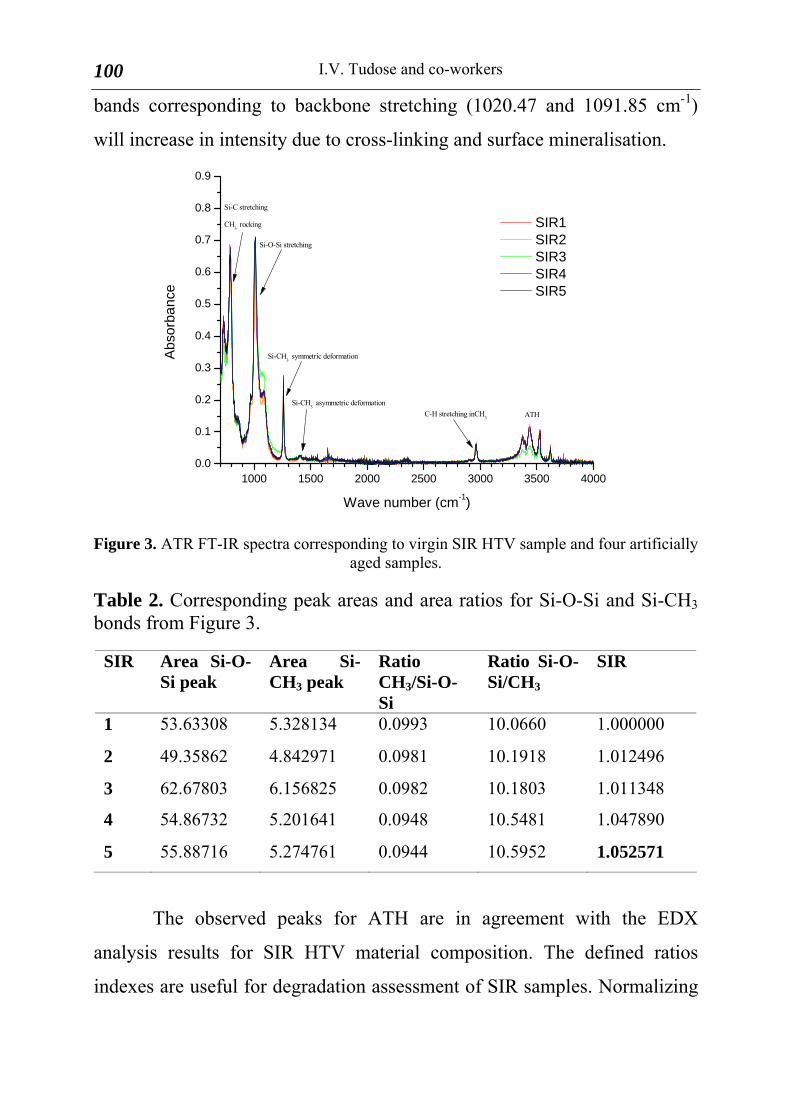
I.V. Tudose and co-workers 100
bands corresponding to backbone stretching (1020.47 and 1091.85 cm-1)
will increase in intensity due to cross-linking and surface mineralisation.
1000 1500 2000 2500 3000 3500 40000.0
0.1
0.2
0.3
0.4
0.5
0.6
0.7
0.8
0.9
ATHC-H stretching inCH3
Si-CH3 asymmetric deformation
Si-CH3 symmetric deformation
Si-O-Si stretching
Si-C stretching
CH3 rocking SIR1
SIR2 SIR3 SIR4 SIR5
Ab
sorb
an
ce
Wave number (cm-1)
Figure 3. ATR FT-IR spectra corresponding to virgin SIR HTV sample and four artificially aged samples.
Table 2. Corresponding peak areas and area ratios for Si-O-Si and Si-CH3 bonds from Figure 3.
SIR Area Si-O-Si peak
Area Si-CH3 peak
Ratio CH3/Si-O-Si
Ratio Si-O-Si/CH3
SIR
1 53.63308 5.328134 0.0993 10.0660 1.000000
2 49.35862 4.842971 0.0981 10.1918 1.012496
3 62.67803 6.156825 0.0982 10.1803 1.011348
4 54.86732 5.201641 0.0948 10.5481 1.047890
5 55.88716 5.274761 0.0944 10.5952 1.052571
The observed peaks for ATH are in agreement with the EDX
analysis results for SIR HTV material composition. The defined ratios
indexes are useful for degradation assessment of SIR samples. Normalizing
Comparative study of field collected samples … 101
the ratio Si-O-Si/CH3 for the samples to the reference sample makes the
results easier to compare.
Since the area of the peaks is directly related to the concentration of
a group in a given material the ratio of two peaks is equal with the ratio of
the absolute quantities of the investigated molecular components. Based on
this we can see how a molecular composition changes during degradation.
In case the polymer is oxidizing the normalized ratio is expected to grow
due to the fact that more Si-O bonds are formed while the methyl groups
transform in other products. In case the backbone of the polymer brakes
forming lower mass products the Si-O peak will drop thus decreasing the
normalized ratio. If a sample has silica as a filling material the results are
difficult to interpret since the lower mass molecules are migrating toward
the surface modifying the ratio in a random fashion. Based on the above, we
may assume that the SIR samples degrade by oxidation.
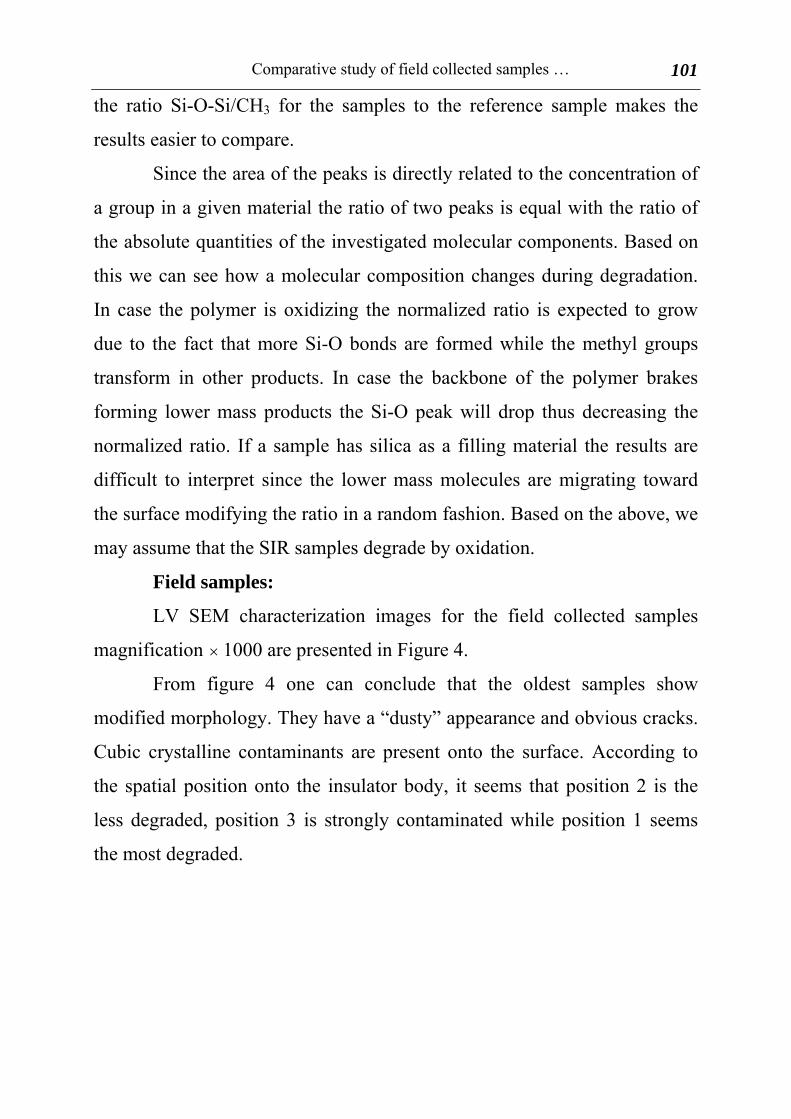
Field samples:
LV SEM characterization images for the field collected samples
magnification 1000 are presented in Figure 4.
From figure 4 one can conclude that the oldest samples show
modified morphology. They have a “dusty” appearance and obvious cracks.
Cubic crystalline contaminants are present onto the surface. According to
the spatial position onto the insulator body, it seems that position 2 is the
less degraded, position 3 is strongly contaminated while position 1 seems
the most degraded.
I.V. Tudose and co-workers 102
Figure 4. SEM images for the various field samples.
EDX analysis showed a very large variation of carbon content in the
samples as well as presence of various contaminants onto surface. The most
common contaminants are NaCl (associated with the presence of sea water
in the atmosphere), S and metals as K, Ti, Fe, V, Mg, Ca associated with the
presence of strong corona discharges. An example of EDX results for the
sample Dg1 are shown in Figures 5 and 6.

Comparative study of field collected samples … 103
Figure 5. EDX spectrum of Dg1 sample and elemental weight distribution.
Figure 6. Elemental mapping of O, Si and Al in the analyzed sample.
I.V. Tudose and co-workers 104
ATR FT-IR analysis of field aged samples was performed and data
processing was done according to the procedure presented for the reference
sample using the defined ratio indexes for degradation assessment of SIR
samples and normalizing the ratio Si-O-Si/CH3 for the samples to the
reference sample. The results are presented in Table 3.
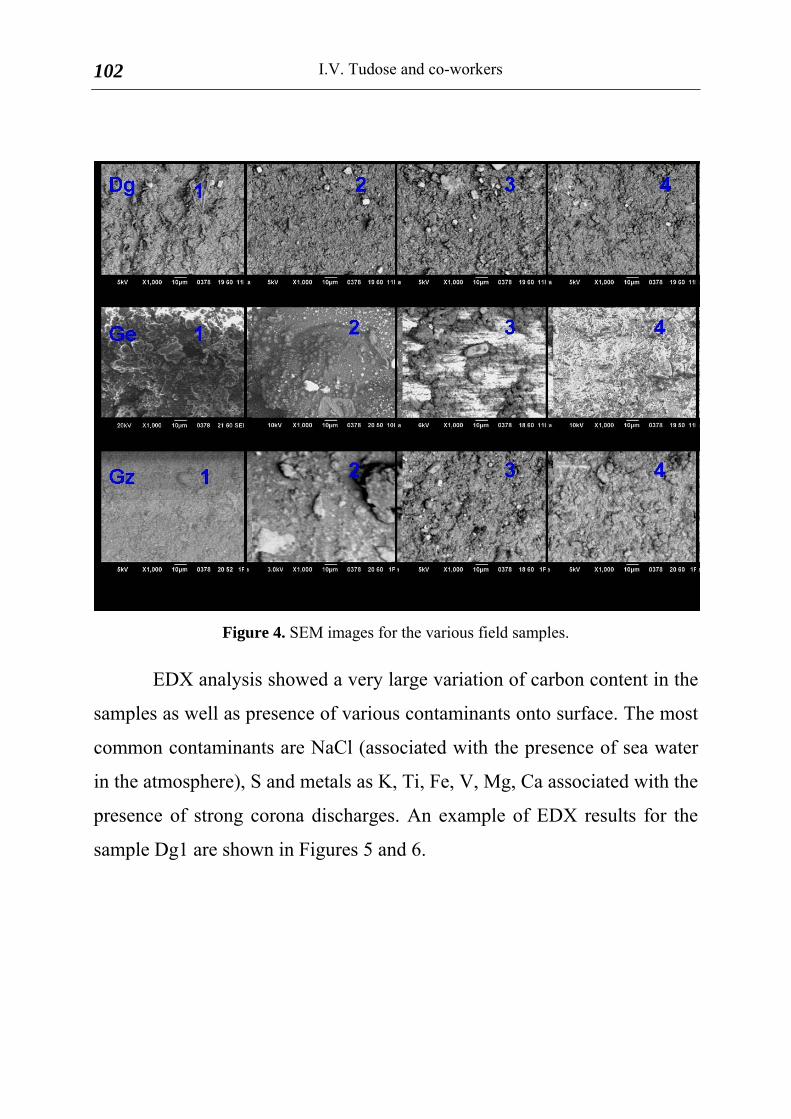
Table 3. Normalized areas ratios for Si-O-Si and Si-CH3 bonds from FT-IR spectra for the field aged samples.
Sample ge1 ge2 ge3 ge4 Si/CH3 14.79 7.95 16.99 13.95 Sample gz1 gz2 gz3 gz4 Si/CH3 21.29 12.15 16.63 18.72 Sample dg1 dg2 dg3 dg4 Si/CH3 38.20 23.49 36.33 31.71
The graphical representation of the normalized ratios as a function
of spatial position onto the insulator surface is presented in Figure 7.
1 2 3 4
8
10
12
14
16
18
20
22
24
26
28
30
32
34
36
38
40
C ge C gz D Dg
Ra
tio S
i-O-S
i/Si-
CH
3
Sample number (position)
Figure 7. Graphical representations of the normalized areas rations for Si-O-Si and Si-CH3
bonds as a function of spatial position.
Comparative study of field collected samples … 105
It is obvious from the above that the variation of normalized areas
rations values fulfils the initial assumptions regarding the normalized areas
rations for Si-O-Si and Si-CH3 bonds as a measure of SIR HTV degradation
and confirms the SEM observations. The oldest and most damaged sample
Dg has the largest corresponding report values. Position 2 onto insulator has
in all samples series the lowest local value while position 1 corresponds to
highest degradation degree.
Conclusions
The present study focused on the structural and morphological
characterization of field collected composite insulators of various ages so
that the degradation degree can be correlated with their service. For this
purpose it was introduced the normalized areas ratios for Si-O-Si and Si-
CH3 bonds as a measure of SIR HTV degradation based on ATR FT-IR
measurements. Experimental results proved that this index is a proper
parameter for the SIR HTV materials aging description.
Acknowledgements
This work was based on the project 11ΣΥΝ_7_1503 which is
implemented through the Operational Program “Competitiveness and
Entrepreneurship”, Action “Cooperation 2011” and is co-financed by the
European Union (European Regional Development Fund) and Greek
national funds (National Strategic Reference Framework 2007 - 2013).
References
1. Hall, J. F. History and bibliography of polymeric insulators for outdoor applications, paper presented at the IEEE/PES Winter Meeting, 1992.
I.V. Tudose and co-workers 106
2. Burnham, J.T. Silicone rubber insulators improve transmission line performance, Transmission and Distribution, August, 1992, pp. 20-25.
3. Kim, S.H.; Cherney, E.A.; R. Hackam The al characteristics of RTV silicone
rubber coatings as a function of filler level. IEEE Trans. Electr. Insul., 1992,
27 (6), 1065–1072.
4. Siderakis, K.; Agoris, D. Performance of RTV SIR coatings installed in coastal
systems. Electr. Power Sys. Res. 2008, 78 (2), 248-254.
5. K. Siderakis, D. Agoris, S. Gubanski, Salt fog evaluation of RTV SIR coatings
with different fillers, IEEE Trans. Power Delivery 2008, 23 (4), 2270-2277.
Related Documents