Using Discrete Event Simulation to Schedule an Efficient and Cost-Effective Patient Round Schedule to Improve Bed Utilisation at the Wards of the HagaZiekenhuis Josh Pearce September 2015 School of Mathematics, Cardiff University A dissertation submitted in partial fulfilment of the requirements for MSc (in Operational Research Applied Statistics and Risk) by taught programme.

Welcome message from author
This document is posted to help you gain knowledge. Please leave a comment to let me know what you think about it! Share it to your friends and learn new things together.
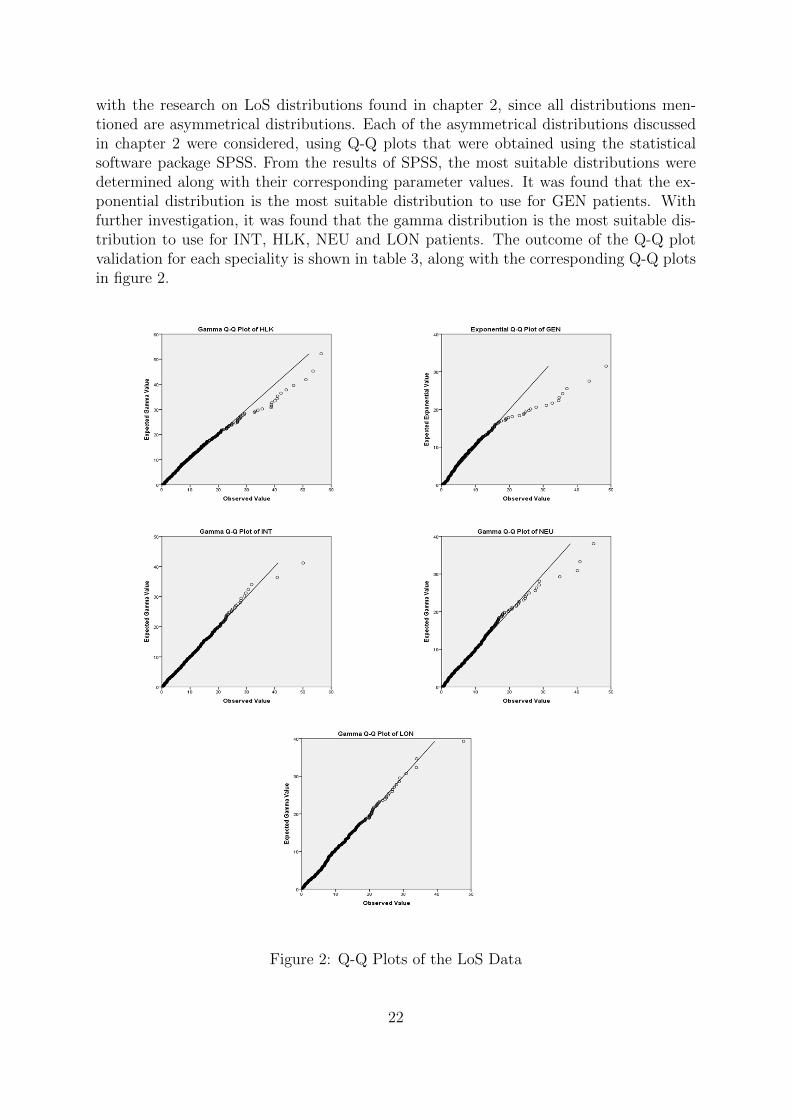
Transcript
Using Discrete Event Simulation toSchedule an Efficient and Cost-EffectivePatient Round Schedule to Improve Bed
Utilisation at the Wards of theHagaZiekenhuis
Josh Pearce
September 2015
School of Mathematics,Cardiff University
A dissertation submitted in partial fulfilment of therequirements for MSc (in Operational Research
Applied Statistics and Risk) by taught programme.

CANDIDATE’S ID NUMBER
CANDIDATE’S SURNAME
Please circle as appropriate
Mr / Miss / Ms/ Mrs / Rev / Dr / Other ……………..........
CANDIDATE’S FULL FORENAMES
DECLARATION
This work has not previously been accepted in substance for any degree and is not concurrently
submitted in candidature for any degree.
Signed ……………………………………………. (candidate) Date …………………………
STATEMENT 1
This dissertation is being submitted in partial fulfilment of the requirements for the degree of
…………………………(insert MA, MSc,MBA, etc, as appropriate)
Signed ……………………………………………. (candidate) Date …………………………
STATEMENT 2
This dissertation is the result of my own independent work/investigation, except where otherwise
stated. Other sources are acknowledged by footnotes giving explicit references. A Bibliography is
appended.
Signed ……………………………………………. (candidate) Date …………………………
STATEMENT 3 – TO BE COMPLETED WHERE THE SECOND COPY OF THE
DISSERTATION IS SUBMITTED IN AN APPROVED ELECTRONIC FORMAT
I confirm that the electronic copy is identical to the bound copy of the dissertation
Signed ……………………………………………. (candidate) Date …………………………
STATEMENT 4
I hereby give consent for my dissertation, if accepted, to be available for photocopying and for inter-
library loan, and for the title and summary to be made available to outside organisations.
Signed ……………………………………………. (candidate) Date …………………………
STATEMENT 5 - BAR ON ACCESS APPROVED
I hereby give consent for my dissertation, if accepted, to be available for photocopying and for inter-
library loans after expiry of a bar on access approved by the Graduate Development Committee.
Signed ……………………………………………. (candidate) Date …………………………

Executive Summary
The rising demand for healthcare puts additional pressure on medical staff to guaranteea sufficient level of care to patients with limited resources. Rather than investing inadditional resources, the purpose of this paper is to construct an Operational Researchmodel that makes an efficient use of the resources in hospital wards. In particular, anefficient and cost-effective patient round schedule will be constructed that utilises bedsin hospital wards. The case study that will be investigated in this paper is the wardsof the HagaZiekenhuis, a hospital located in Den Haag in the Netherlands. This paperwas assigned as a dissertation project whilst studying MSc Operational Research, Ap-plied Statistics & Risk at Cardiff University, as an exchange student at the Universityof Twente. This problem that is addressed in this paper was presented through thecollaboration between the HagaZiekenhuis and the Centre for Healthcare Operations Im-provement & Research (CHOIR) at the University of Twente. This paper was completedunder the supervision of Professor Erwin Hans and Mr Nardo Borgman at the Universityof Twente, with additional support provided from Professor Paul Harper and Dr VincentKnight at Cardiff University.
Patient rounds are scheduled regularly during the week at the HagaZiekenhuis; however,little or no patient rounds are scheduled during weekends. As a result, the wards areovercrowding at the beginning of each week, causing emergency patients that are in needof immediate medical attention to be redirected to another Emergency Department (ED),or placed in a less suitable ward. Both scenarios are negatively impacting the level ofhealthcare provided to emergency patients. This emphasises the importance and benefitsof a well devised patient round schedule, and the arising opportunity to schedule patientrounds regularly during the weekends.
After thorough research of the relevant literature, it appeared that a Discrete Event Sim-ulation (DES) model was the most suitable approach for this paper, due to its capabilityto take into consideration the many complexities that are involved in modelling hospitalwards. Prior to implementing experiments the real-life system with many risk and un-certainty factors, the purpose of this DES model is to obtain a quick, inexpensive modelthat represents the true characteristics of the wards in the HagaZiekenhuis. This modelenables experimentation with patient round schedules, providing a prediction of the bedoccupancy in the wards using the chosen patient round schedule. The DES model wasformulated as a computer programming procedure using the integrated development en-
i

vironment in Delphi XE6. A DES model was constructed to represent the patient flowof emergency patients through 35 general nursing wards at the HagaZiekenhuis over theduration of weekends. So that a full three day period (72 hours) is considered, it is as-sumed that the weekend begins at 12pm on a Friday and finishes at 12pm on a Monday.A dataset provided by the HagaZiekenhuis consists of 10,148 patients that were admittedbetween the beginning of January in 2013 and the end of March in 2014. Only emergencypatients are considered in this paper, since elective patients are rarely scheduled for anappointment during the weekend. The aim of this paper is to provide medical staff witha prediction of the ward occupancy of emergency patients. Based on this prediction,medical staff have an idea of how many beds are available for elective patients, so theycan schedule the appointments accordingly. Each patient in the dataset is categorisedinto one of following five medical specialities: general surgery, gastroenterology, internalmedicine, neurology and pulmonology. For each speciality, distributions are assigned topredict the stochastic nature of the arrival process and the Length of Stay (LoS). Sinceonly emergency patients are considered, a non-homogeneous Poisson arrival is assumedfor all specialities, corresponding to the stochastic nature of emergency arrivals. An ex-ponential distribution is assigned to predict the LoS of gastroenterology patients, and agamma distribution is assigned to predict the LoS of all other specialities. Each of theaforementioned distributions are used as input parameters for the DES model. Usingthe distributions of the arrivals and the LoS, the DES model predicts the bed occupancyin the wards. The fluctuations of the mean bed occupation over the 72 hour period areplotted using Delphi’s graphical user interface. The data over the duration of 2013 isused as input into the DES model. The result of the model is verified and then validatedwith the data in 2014.
The performance measure that is considered in this paper is the number of refused ad-missions into the wards. The DES model predicts the number of refused admissionsbased on the discharge planning that was present in 2013. This prediction is comparedwith the number of refused admissions that occurred with the presence of regular pa-tient rounds during the weekends. The result indicates that scheduling patient roundsduring the weekends significantly reduces the number of refused admissions to the wardsof the HagaZiekenhuis. The result of this paper can be used as encouragement to themedical staff in the HagaZiekenhuis, emphasising the benefit of scheduling patient roundsregularly during the weekends.
Suggested directions for further research that would improve the usability of the DESmodel are summarised in this paper. Patients included in the dataset contain a LoS inthe wards under one minute, which is unrealistic in practice. Observations such as thesewere removed from the dataset, thus reducing the accuracy of the model. Patients in theprovided dataset are strictly categorised into five medical specialities, which overlooksthe fact that patients may have very specific conditions that involve a combination ofmedical specialities. Due to this, the characteristics of patients may be misrepresentedand cause misleading results. A suggested approach to improve the usability of the modelis predicting the outflow of emergency patients from the ED using the Acute AdmissionCycle (AAC), and the outflow of patients from the Operating Room (OR) using the Mas-ter Surgery Schedule (MSS). Applying both the AAC and MSS to the model takes into
ii

consideration both elective and emergency patients, as well as the interaction betweenthe wards, the ED and the OR. Ensuring that sufficient staffing levels are present in thewards to consolidate with patients in not incorporated into the DES model. Consider-ing an analytical stochastic programming approach to obtain optimal staffing levels, inaddition to the DES model, takes into consideration the many complexities of modellinghospital wards, whilst also obtaining optimal staffing levels within the wards. Each ofthe aforementioned problems and suggested solutions should be taken into considerationif future research is implemented to improve the result of this paper.
iii

Acknowledgements
I would like to take this opportunity to thank the many people that have provided mewith support and assistance throughout the duration of this project. I would firstly liketo thank my supervisors at Cardiff University, Professor Paul Harper and Dr VincentKnight, who provided me with constant support and guidance throughout the durationof my Master’s degree, and were always happy to assist me with any problems regardingmy dissertation. I would also like to thank them for providing me with the great oppor-tunity to study in the Netherlands. I would like to thank Mrs Joanna Emery at CardiffUniversity, who has been very helpful organising many of the arrangements necessary totake part in the Erasmus placement. I would also like to thank my supervisors at theUniversity of Twente, Mr Nardo Borgman and Professor Erwin Hans, who have beenextremely helpful throughout the duration of my project. Regardless of their busy sched-ules, they have always been happy to help and instruct me at every opportunity. I amvery grateful for the plethora of advice and suggestions they have provided with regardsto settling in to the Netherlands. I’d also like to thank all of the PhD students andmembers of staff at the Centre for Healthcare Operations Improvement and Research,who were always glad to help at times where I was in need of advice or support. LastlyI would like to express how grateful I am for the constant support and encouragement Ihave received from my family throughout the duration of my Master’s degree.
iv

Contents
Executive Summary . . . . . . . . . . . . . . . . . . . . . . . . . . . . . . . . iiiAcknowledgements . . . . . . . . . . . . . . . . . . . . . . . . . . . . . . . . . ivList of Figures . . . . . . . . . . . . . . . . . . . . . . . . . . . . . . . . . . . . viiList of Tables . . . . . . . . . . . . . . . . . . . . . . . . . . . . . . . . . . . . viiiSummary . . . . . . . . . . . . . . . . . . . . . . . . . . . . . . . . . . . . . . ix
Acronyms x
1 Introduction 11.1 Background . . . . . . . . . . . . . . . . . . . . . . . . . . . . . . . . . . 1
1.1.1 HagaZiekenhuis . . . . . . . . . . . . . . . . . . . . . . . . . . . . 11.1.2 A Brief Description of Relevant Medical Specialities . . . . . . . . 2
1.2 Problem Description . . . . . . . . . . . . . . . . . . . . . . . . . . . . . 31.3 Research Objective & Questions . . . . . . . . . . . . . . . . . . . . . . . 41.4 Dissertation Structure . . . . . . . . . . . . . . . . . . . . . . . . . . . . 5
2 Literature Review 62.1 Introduction . . . . . . . . . . . . . . . . . . . . . . . . . . . . . . . . . . 62.2 The Interaction between Departments . . . . . . . . . . . . . . . . . . . . 72.3 Demand Predictions . . . . . . . . . . . . . . . . . . . . . . . . . . . . . 82.4 Bed Utilisation in Hospital Wards . . . . . . . . . . . . . . . . . . . . . . 92.5 Personnel Planning . . . . . . . . . . . . . . . . . . . . . . . . . . . . . . 122.6 Conclusion . . . . . . . . . . . . . . . . . . . . . . . . . . . . . . . . . . . 13
3 Methodology 143.1 Identifying the Hierarchical Level of the Problem . . . . . . . . . . . . . 143.2 A Comparison of Possible Approaches . . . . . . . . . . . . . . . . . . . . 153.3 Solution Approach . . . . . . . . . . . . . . . . . . . . . . . . . . . . . . 17
4 Data Analysis 184.1 Data Overview . . . . . . . . . . . . . . . . . . . . . . . . . . . . . . . . 184.2 Patient Arrivals & Length of Stay . . . . . . . . . . . . . . . . . . . . . . 194.3 Arrival & Length of Stay Distributions . . . . . . . . . . . . . . . . . . . 214.4 Bed Occupancy . . . . . . . . . . . . . . . . . . . . . . . . . . . . . . . . 23
v
4.5 Discharges During the Weekend . . . . . . . . . . . . . . . . . . . . . . . 264.6 Summary . . . . . . . . . . . . . . . . . . . . . . . . . . . . . . . . . . . 28
5 Simulation Model 295.1 Model Assumptions . . . . . . . . . . . . . . . . . . . . . . . . . . . . . . 295.2 Implementation of the Model . . . . . . . . . . . . . . . . . . . . . . . . 305.3 Explanation of the Program . . . . . . . . . . . . . . . . . . . . . . . . . 325.4 Model Verification . . . . . . . . . . . . . . . . . . . . . . . . . . . . . . 365.5 Model Validation . . . . . . . . . . . . . . . . . . . . . . . . . . . . . . . 365.6 Performance Measure . . . . . . . . . . . . . . . . . . . . . . . . . . . . . 395.7 Synopsis . . . . . . . . . . . . . . . . . . . . . . . . . . . . . . . . . . . . 40
6 Further Research 416.1 Improvements to the Data . . . . . . . . . . . . . . . . . . . . . . . . . . 416.2 Problems With Categorising Patients . . . . . . . . . . . . . . . . . . . . 426.3 Including Elective Patients . . . . . . . . . . . . . . . . . . . . . . . . . . 426.4 Personnel Planning in Hospital Wards . . . . . . . . . . . . . . . . . . . 43
References 46
Appendix 52
vi

List of Figures
1 The HagaZiekenhuis & its Location . . . . . . . . . . . . . . . . . . . . . 1
2 Q-Q Plots of the LoS Data . . . . . . . . . . . . . . . . . . . . . . . . . . 22
3 Mean Bed Occupation Per Hour . . . . . . . . . . . . . . . . . . . . . . . 24
4 A Comparison of Mean Bed Occupation at Different Capacities . . . . . 26
5 Discharges During the Weekends of 2013 . . . . . . . . . . . . . . . . . . 27
6 Model Input File . . . . . . . . . . . . . . . . . . . . . . . . . . . . . . . 33
7 Simulation User Form . . . . . . . . . . . . . . . . . . . . . . . . . . . . 34
8 Bed Occupation User Form . . . . . . . . . . . . . . . . . . . . . . . . . 35
9 Mean Bed Occupancy in 2014 . . . . . . . . . . . . . . . . . . . . . . . . 37
10 Resultant Mean Bed Occupancy . . . . . . . . . . . . . . . . . . . . . . . 38
11 Refused Admissions . . . . . . . . . . . . . . . . . . . . . . . . . . . . . . 40
vii

List of Tables
1 Arrivals Per Day Descriptive Statistics . . . . . . . . . . . . . . . . . . . 19
2 LoS Descriptive Statistics . . . . . . . . . . . . . . . . . . . . . . . . . . 20
3 Q-Q Plot Validation Outcomes . . . . . . . . . . . . . . . . . . . . . . . 23
4 Bed Occupancy Descriptive Statistics . . . . . . . . . . . . . . . . . . . . 23
5 Bed Occupancy Frequency Table . . . . . . . . . . . . . . . . . . . . . . 25
6 Discharge Descriptive Statistics . . . . . . . . . . . . . . . . . . . . . . . 27
7 Model Input Parameters . . . . . . . . . . . . . . . . . . . . . . . . . . . 30
8 Quantitative Validation . . . . . . . . . . . . . . . . . . . . . . . . . . . . 38
9 A Comparison of Bed Occupancy . . . . . . . . . . . . . . . . . . . . . . 39
viii
Summary
Patient rounds are scheduled regularly during the week at the HagaZiekenhuis; however,weekends typically consist of fewer patient rounds. This paper evaluates the impact ofscheduling an efficient patient round schedule, and emphasises the arising opportunity toschedule patient rounds during the weekends.
A Discrete Event Simulation (DES) model is constructed to represent the patient flowof emergency patients through 35 general nursing wards at the HagaZiekenhuis. Thismodel enables experimentation of patient round schedules without the many risks anduncertainty factors that are involved with experimentation on real-life systems. A sampleof patients admitted from January in 2013 until March in 2014 are categorised into fivemedical specialities, and for each of these specialities, a distribution is assigned to predictthe arrival rate and the length of stay in the hospital. These distributions are used asinput parameters to obtain a prediction of the mean bed occupancy in the wards for eachhour over the duration of weekends. Since appointments for elective patients are rarelyscheduled during weekends, only emergency patients are considered in this model. Thepurpose of this paper is provide medical staff at the HagaZiekenhuis with a predictionof the ward occupancy of emergency patients, enabling them to schedule appointmentsfor elective patients accordingly. Data collected in 2013 is used as the input for the DESmodel. The model is verified then validated using the data in 2014.
The performance measure that is considered in this paper is the number of refused ad-missions into the wards. The number of refused admissions in 2013 is predicted, andcompared with the number of refused admissions when regular patient rounds are sched-uled during the weekend. The result indicates that scheduling patient rounds duringweekends significantly reduces the number of refused admissions to the wards of theHagaZiekenhuis.
Suggested directions for further research that would improve the usability of the DESmodel are summarised in this paper. Predicting the outflow of the OR using the MSS,and the ED using the AAC takes into consideration both types of patients, as well as theinteraction between the wards, the ED and the OR. Utilising a stochastic programmingmodel to obtain the optimal staffing levels in the wards in addition to the DES modelwould vastly improve the usability of the result of this paper.
ix

Acronyms
AAC Acute Admission Cycle. ii, 7–9, 44
CoV Coefficient of Variation. 9, 21
DES Discrete Event Simulation. ii, viii, 11, 16–19, 24, 28–33, 35, 37, 42–45
ED Emergency Department. i, ii, 3, 7, 13, 44
GEN Gastroenterology. 18, 21–23, 27–29, 31
GUI Graphical User Interface. 33
HLK General Surgery. 18, 21–23
IFC Inpatient Facility Cycle. 9
ILP Integer Linear Programming. 8, 11
INT Internal Medicine. 18, 19, 21–23, 28
LON Pulmonology. 18, 20–23, 28
LoS Length of Stay. i, ii, 7–10, 13, 15–17, 19–21, 23, 28, 31, 33, 43
MSS Master Surgery Schedule. ii, 7, 9, 44
NEU Neurology. 18, 21–23
x

OR Operating Room. ii, 7, 13, 44
SA Simulated Annealing. 7
SD System Dynamics. 11, 16
xi

Chapter 1
Introduction
1.1 Background
1.1.1 HagaZiekenhuis
HagaZiekenhuis is one of the largest hospitals in the Netherlands, which has a capacityof 611 beds and employs almost 3600 people. HagaZiekenhuis is one of the largest educa-tional hospitals for medical specialists in the country. Three hospitals in the city of DenHaag (also referred to as The Hague) were merged in 2004 to create the HagaZiekenhuis.As a result, HagaZiekenhuis has three main locations, namely Leyweg, Sportlaan andthe Juliana Children’s hospital. Lewyweg is the largest branch of the HagaZiekenhuis,focusing on emergency medical services with the largest Accident and Emergency de-partment in the region. The Sportlaan branch focuses on planned medical treatments.The Juliana Children’s hospital provides services and facilities to children’s care only.The HagaZiekenhuis is displayed in figure 1(a) and the location of Den Haag in theNetherlands is displayed in figure 1(b).
(a) HagaZiekenhuis (b) The Location of Den Haag
Figure 1: The HagaZiekenhuis & its Location
1

1.1.2 A Brief Description of Relevant Medical Specialities
Using the definition of the American Board of Surgery (2015), general surgery is a disci-pline that requires knowledge of a variety of medical conditions that may require surgicaltreatment, including tumours, trauma and affliction of arteries. The Royal College ofSurgeons of England (2015) stated that although general surgeons deal with all kindsof surgical emergencies, they typically specialise on acute abdominal problems. A widerange of medical conditions are treated by general surgeons, including bypass surgery,reconstructive surgery, endoscopic surgery and appendectomies.
Gastroenterology is the medical speciality that concerns conditions affecting the diges-tive system. Several organs and other components of the digestive system are involvedin the digestion of food. Food passes through the gastrointestinal tract, the largest com-ponent of the digestive system, which is made up of the oral cavity, pharynx, esophagus,stomach, small intestines, and large intestines. In addition to the gastrointestinal tract,the digestive system consists of accessory organs that do not have food pass throughthem; however assist the process of digestion. Organs such as teeth, tongue, salivaryglands, liver gallbladder, and pancreas make up the accessory organs of the digestivesystem. Physician specialising in gastroenterology are referred to as gastroenterologists,who provide treatment and care to patients with diseases affecting organs such as thestomach, bowel, pancreas and liver. Medical conditions that are commonly treated bygastroenterologists include hepatitis, irritable bowel syndrome and colitis.
Internal medicine is associated with conditions that affect the internal organs of thebody. An internist is a physician specialising in internal medicine, which are typicallycategorised by their knowledge and skill in diagnosis and treatment. Internists typicallyprovide long-term supervision and comprehensive care in hospitals or outpatient clinics.Internists specialise in many common diseases that affect multiple organs of the body,such as arteriosclerosis, diabetes and cancer (European Federation of Internal Medicine,2015). For this reason, internists are trained to be familiar with conditions affectingmultiple organs.
Neurology is the branch of medicine concerned with the study and treatment of disor-ders of the nervous system, which is a complex, sophisticated system that regulates andcoordinates body activities (University of Rochester Medical Center, 2015). The nervoussystem is typically divided into two categories: the central nervous system, consistingof the brain and spinal cord; and the peripheral nervous system, consisting of nervesoutside of the brain and spinal cord such as the eyes, ears and skin. Neurologists arephysicians who specialise in neurology, which involves treatment of conditions such asstrokes, Alzheimer’s and Parkinson’s. On the website of University of Rochester MedicalCenter (2015) it is noted that neurologists do not perform surgery. If a patient requiressurgery for a medical condition affecting the brain, spinal cord or nerves, they are referredto a neurosurgeon.
2
On the website of the American College of Physicians (2015), pulmonology is defined asthe medical speciality concerned with diseases of the lungs and bronchial tubes, which of-ten involves evaluation of the upper respiratory tract as well as the heart. The respiratorytract is divided into the upper and lower respiratory tract. The upper respiratory tractconsists of the nasal cavity, pharynx and larynx. The lower respiratory tract consists ofthe trachea, primary bronchi and lungs. Pulmonologists are physicians who specialisein diseases and conditions of the respiratory tract, including pneumonia, asthma, tu-berculosis, emphysema, or complicated chest infections (American College of Physicians,2015). Pulmonology is categorised as a subspecialty of internal medicine, and as a result,pulmonologists require knowledge of internal medicine and other specialities in order toobtain certification.
1.2 Problem Description
An elective patient schedules an appointment at a hospital in advance, because they havea condition that is not considered as a medical emergency. Elective patients may needsome time to recover after treatment, during which time they would stay in one of thehospital wards. Emergency patients are unscheduled for an appointment but are in needof medical attention. Emergency patients arrive at the Emergency Department (ED),seeking medical treatment as soon as possible. Emergency patients who need time torecover after receiving treatment are also admitted to one of the hospital wards. As aresult, the wards consist of all types of patients with a plethora of medical conditions.Each ward is designated with a number of beds, a range of staff such as nurses andmedical specialists, and equipment required to carry out procedures tailored to the specificmedical specialities of the staff. To make efficient use of the available resources, the wardsare planned such that patients with similar medical conditions are admitted to similarwards, so that medical specialists can treat conditions they are specialised in with suitableequipment.
During the week there are regular patient rounds where staff members visit the patients inthe wards and, if possible, discharge patients that are ready to leave the wards. Weekendsconsist of fewer patient rounds and, as a result, fewer patients are discharged. Appoint-ments for elective patients are typically scheduled during the week, and rarely duringevenings or weekends. However, emergency patients are still entering the wards throughthe ED during the weekend, often resulting in hospital wards reaching full capacity atthe beginning on the week. At full capacity admission to the wards is halted, causingemergency patients to be diverted to other EDs or less suitable hospital wards. Diversionto another ED increases the time taken for emergency patients to receive medical atten-tion, and diversion to less appropriate wards results in patients receiving treatment fromless appropriate medical staff. Both situations negatively impact the health conditionof emergency patients, which emphasises the importance and benefits of a well devisedpatient round schedule.
3
There is increasing pressure on hospitals to provide a sufficient level of care to patientswith limited resources, including equipment, staff and bed capacity. For many yearsOperational Research has been a solution proposed to minimise hospital expenditures,also enabling an increase in capacity utilisation and an improvement in the efficiency ofservices. Rather than investing in additional hospital ward resources, the objective of thispaper is to construct an Operational Research model that can be used to utilise resourcesas efficiently and effectively as possible at the HagaZiekenhuis. This paper will consider amultitude of useful Operational Research approaches to improve the efficiency of hospitalwards. The selected approach will be chosen due to the suitability of our problem.The selected approach will ensure that resources in the wards are utilised and patientrounds are scheduled efficiently, in hope that future bed blocking at the HagaZiekenhuisis minimised.
1.3 Research Objective & Questions
Based on the description of the problem, the following research objective has been for-mulated:
Rather than investing in additional hospital ward resources, construct an efficient pa-tient round schedule during the weekend using an Operational Research model, so thatresources are utilised and the bed blocking effect at the HagaZiekenhuis is minimised.
In order to obtain this objective, the following research questions must be answered:
1. What are the contributing factors that lead to the congestion of hospital wards?The first step to obtaining the research objective is identifying the causes of con-gestion in hospital wards. The literature review in chapter 2 aims to identify thekey factors that result in overcrowding in hospital wards.
2. What are the current Operational Research approaches considered in literature thatovercome the congestion of hospital wards?When the causes of congestion have been identified, the next step to reach theobjective is identifying the widely used solutions to these problems. The Opera-tional Research models discussed in chapter 2 were selected due to their relevanceto the problem of ward congestion. For each considered model, a comparison ofresults is provided so that the advantages and disadvantages of each technique canbe identified.
3. Which is the most suitable Operational Research model for this particular problem?Chapter 2 emphasises that tailoring models to specific problems significantly im-proves the results. Section 3.2 compares the advantages and disadvantages of Op-erational Research techniques discussed in chapter 2, to decide which technique ismost suitable.
4

4. What key issues should be taken into consideration when implementing this proposedmodel?Negative aspects of the proposed model will be considered when the model is beingselected in section 3.2. Model assumptions are made in subsection 5.1 so that thecomplexity of the model is reduced.
5. What conclusions and future recommendations can be made from the result of theproposed model?The measurement of performance of the implemented model is given in 5.6, andcompared with the initial state of the wards prior to implementing the model.Chapter 6 recommends applicable approaches that would improve the result of themodel.
1.4 Dissertation Structure
This dissertation is organised into six chapters. This chapter gives an introduction tothe problem, and concisely defines the research objectives when solving this problem.This chapter also provides background information relevant to the problem, includingthe hospital that provided data for this paper, and the medical specialities that areincluded in this dataset. Chapter 2 gives a through overview of the available literaturethat is relevant to the problem at hand. This chapter summarises the problems thatmedical staff at hospital wards often face, and the commonly used Operational Researchmethods that overcome said problems. The findings of this review of literature are used tosupplement the ideas and decisions made when solving the problem. Chapter 3 considersthe advantages and disadvantages of each of the Operational Research techniques that arediscussed in the literature review, and selects the most suitable technique to model thewards of the HagaZiekenhuis. The solution approach used to implement the chosen modelis also given in this chapter. Chapter 4 analyses and interprets the provided dataset,and obtains the required input parameters needed to build the model. Using the inputparameters that are determined in chapter 4, chapter 5 describes how to implement theOperational Research model. Assumptions are made in this chapter to reduce the overallcomplexity of the model. This chapter also gives an overview of how to use the computerprogram that is used to implement the model. Once the model has been constructed,the result of the model is verified and validated using previous years’ data. Then theperformance of the model is measured, and compared with the state of the wards priorto implementing the model. To improve the solution of the constructed model, suggestedideas and directions for further research are provided in chapter 6.
5

Chapter 2
Literature Review
2.1 Introduction
Inpatient care refers to care for a patient who is admitted for treatment and stays fora minimum of one night in the hospital (Hulshof et al., 2012). The inpatient care thatis considered in this paper is the care provided at the general nursing wards at theHagaZiekenhuis, hereafter referred to as ”hospital wards”. This review of literature pro-vides an overview of the commonly occurring problems that are present in hospital wards.The approaches summarised in this chapter were carefully selected due to the relevanceof our problem. Much of the problems found in literature are related to the interactionbetween hospital departments, predicting the demand of resources, bed utilisation, andpersonnel planning. Each of these factors concerning hospital wards is addressed in thefollowing sections.
Once these problems are recognised, this review aims to identify commonly applied Op-erational Research techniques that have a useful application to improving the efficiencyof hospital wards. A multitude of Operational Research techniques have been explored,with emphasis on mathematical programming, simulation and queuing theory based tech-niques. The literature that is summarised in this chapter will consist of the applicationsof the aforementioned Operational Research techniques to improve the efficiency of thewards. The purpose of this literature review is to identify the commonly occurring prob-lems present in the wards of hospitals, and the complexities that are involved in modellinghospital wards. Particular attention is paid to the comparison of results for each Oper-ational Research technique, to supplement the decision process when choosing the mostsuitable technique for our particular problem.
6
2.2 The Interaction between Departments
Hospitals are complex systems of healthcare, because action in one department usuallyaffects others, and not always predictably (Black and Pearson, 2002). Vanberkel et al.(2009) provide an extensive review of the relationships between hospital departments.In this paper, it is observed that the operation of both the ED and Operating Room(OR) depend heavily on the available capacity of the downstream inpatient wards, sinceboth services forward their inpatients to wards for ongoing care. For this reason, patientarrivals in inpatient care facilities are mainly determined by the patient outflow of the ORand the ED (Kortbeek et al., 2014). It is highly desirable to apply coordinated planningto inpatient care facilities, since isolation yields suboptimal decision making (Kortbeek,2012). To overcome suboptimal decision making, this subsection provides an overview ofthe interaction between hospital wards, the ED and the OR.
EDs are concerned with the evaluation and initial treatment of acute medical problems,which is usually a medical condition of short duration, rapidly progressive and in needof urgent medical attention. Once a diagnosis is determined, patients with conditionsthat require only short-term care are treated and released, while those with more seriousconditions are diagnosed, medically stabilised, and then are transferred to an inpatienthospital bed for ongoing care (Ganguly et al., 2014). Kortbeek et al. (2015) describe thebasis for the ED outflow prediction using the Acute Admission Cycle (AAC), where anAAC can be defined as a cyclic random arrival process (Kortbeek et al., 2014). Anticipa-tion of the AAC is possible, by statistically predicting the arrival process of emergencypatients that often follows a cyclic pattern (Kortbeek, 2012). This will be discussed inmore detail in section 2.3.
ORs are intended for all types of patients, whether surgery is scheduled for an electivepatient, or an emergency patient that requires unscheduled surgery. After surgery itis sometimes necessary to be transferred to a ward for further ongoing care, until theyrecover and are ready to be discharged from the hospital. Kortbeek et al. (2015) de-scribe the basis for the OR outflow prediction using the Master Surgery Schedule (MSS).According to Kortbeek et al. (2014), a MSS is a cyclic block schedule that allocates op-erating time capacity among patient groups. Much of the available literature concerningMSSs involves some form of mathematical programming. Integer programming is utilisedin Blake et al. (2002) to obtain a MSS, which develops a consistent schedule that min-imises the shortfall between the target OR time and the actual OR time for each surgeonand surgeon type. A cyclic MSS is created in Belien and Demeulemeester (2007), and anumber of mixed integer programming based heuristics and a metaheuristic were solvedto minimise the expected total bed shortage in hospital wards. Van Essen et al. (2014)recognise that the OR schedule is one of the most important factors that influence thebed occupancy at hospital wards. The objective of this paper is to reduce the bed usagein hospital wards by rearranging the OR schedule. The stochastic nature of patients’Length of Stay (LoS) in hospital wards is taken into consideration, and this is incorpo-rated into the objective function of the scheduling problem. Two scheduling approachesare considered in this paper: first, a Simulated Annealing (SA) heuristic approach is
7

considered that takes into consideration the formulation of the objective; second, theobjective function is simplified and the resulting problem is solved using Integer LinearProgramming (ILP). In this particular study ILP approach produces a better solution,which allows the HagaZiekenhuis to reduce the number of beds by almost 20%.
2.3 Demand Predictions
The stochastic nature of patient arrivals and LoS are influential characteristics on thevariability of the operations of inpatient care services (Hulshof et al., 2012). In partic-ular, the workload in hospital wards and the demand for beds is typically influenced bypatient arrivals and LoS. Much of the literature concerning the patient arrival and LoSconsider the assignment of probability distributions to statistically predict the arrivaland LoS processes. This section provides an overview of the probability distributionsthat are commonly used. Other mathematical approaches that take into considerationthe uncertainty and variability of arrivals and LoS are also considered.
Using the AAC that is discussed in section 2.2, acute admissions to hospital wards canbe anticipated by statistically predicting the arrival process of acute patients. A cyclicnon-homogeneous Poisson arrival process is assumed by Kortbeek et al. (2014), corre-sponding to the stochastic nature of emergency arrivals. Elective patients are generallyadmitted during weekdays and hardly during the weekend, which is a possible suggestionwhy the assumption of a Poisson arrival process is not satisfied (De Bruin et al., 2010).However, anticipating elective patient admissions is also possible, since elective patientsare scheduled for an appointment in advance. In Kortbeek et al. (2014) elective patientsare admitted to a hospital ward either the day before or on the day of surgery. A MonteCarlo simulation approach to model patient arrivals is utilised in Mustafee et al. (2013).This paper recognises that an advantage of Monte Carlo simulation is the ability to copewith high levels of uncertainty involved in patient admissions. Mazier et al. (2010) modelinpatient admission scheduling as a stochastic programming problem. Three strategieswere used to solve the stochastic programming problem: using an approximated averagenumber of unknown patients; a service ratio-based strategy; and a Monte Carlo optimi-sation approach. The result found that the Monte Carlo optimisation approach gave thebest result, even with a small sample size, with a good computational time.
Bekker and de Bruin (2010) assume that the LoS of patients at hospital wards is de-scribed by an exponential distribution. Ridge et al. (1998) support this, stating that theexponential curve or a Weibull curve fitting routine are suitable for the LoS of patients.The Weibull curve fitting routine is also utilised in Marazzi et al. (1998), where lognormaland gamma distributions are also used. In addition, Faddy et al. (2009) assigns both thelognormal and gamma distributions to describe the LoS of patients. In summary, the fol-lowing distributions were most commonly considered in literature: exponential; Weibull;lognormal; and gamma. It appears that in practice, the approach to determine the mostsuitable distribution is to tailor said distributions to the particular dataset.
8
The Coefficient of Variation (CoV) is utilised in De Bruin et al. (2010) to measure thevariation of patients’ LoS. The CoV measures the dispersion of a probability distribution,which is defined as:
CoefficientofVariation =StandardDeviation
Mean
A CoV that is less than 1 is considered to have a low variance, and a CoV that is greaterthan 1 is considered to have a high variance. In other words, a mean value less than thestandard deviation suggest a high variation, and a mean value greater than the standarddeviation suggest a low variation. De Bruin et al. (2010) found that all but one hospitalward had a CoV greater than 1, indicating that there is high variability in the LoS ofpatients’ in hospital wards.
Kortbeek et al. (2014) derive demand predictions on an hourly level for several inpatientcare units for both emergency and elective patients, based on a cyclic non-homogeneousPoisson arrival pattern of emergency patients and an MSS block schedule of surgicalpatients. In this paper, three steps are performed to determine the demand predictions:first, the impact of a single patient type in a single cycle (MSS or AAC) is determined;second, the impact of all patient types within a single cycle can be calculated; finally, sincethe MSS and AAC are cyclical, the predictions from the second step are overlapped to findthe overall steady-state impact of the repeating cycles. Once these steps are completed,Kortbeek et al. (2014) combines the workload predictions for elective and emergencypatients to find the probability distributions of the number of recovering patients on eachunique day in the cycle, which is denoted as the Inpatient Facility Cycle (IFC). Thelength of the Inpatient Facility Cycle is the least common multiple of the lengths of theMSS and the AAC.
2.4 Bed Utilisation in Hospital Wards
Hulshof et al. (2012) recognise that the number of occupied beds is a stochastic process,because of the randomness in the number of arrivals and LoS. It is stated in this paperthat a common objective at hospital wards is to dimension the number of beds suchthat occupancy of beds is maximised, while a predetermined performance measure issatisfied. The performance measure used in this paper is the percentage of patients thathave to be rejected for admission due to lack of bed capacity, that is, the admissionrefusal rate. Kortbeek (2012) discuss the necessity of performance measures for inpatientcare delivery, which guarantees care from appropriately skilled nurses to patients withspecific diagnoses, while making an efficient use of scarce resources. The assumptionis made that a high bed occupancy imply efficient use of resources; however, it should
9
be noted that a high bed occupancy may cause congestion in hospital wards (Kortbeek,2012). Hulshof et al. (2012) state that hospitals commonly apply a fixed target occupancylevel (often 85%) by which the required number of beds is calculated, which may resultin excessive delays or rejections. As a result, this paper recommends calculating thedesirable occupancy level as a complex function of the service mix, the number of bedsand the LoS distribution. Hulshof et al. (2012) emphasise that a nonlinear relationshipexists between the number of beds, the mean occupancy level, and the number of patientsthat have to be rejected for admission due to lack of bed capacity.
Shepperd et al. (2013) note that there are three main causes of delayed discharge fromhospital: inadequate patient assessment by healthcare professionals resulting in poor or-ganisation of post-discharge health and social care; the late booking of transport servicesto take patients home, which prevents a timely discharge from hospital; and poor com-munication between the hospital, follow-up care and community service providers. Toovercome this problem, it is mandatory that healthcare professionals construct an effi-cient discharge plan. Discharge planning ensures that patients are discharged from thehospital at an appropriate time, with adequate notice, to reduce the LoS of patients andimprove the coordination of services following discharge from the hospital (Hulshof et al.,2012). Shepperd et al. (2013) state that discharge planning may reduce costs and improvepatient outcomes; for example, influencing both the LoS and the pattern of care by bridg-ing the gap between hospital and home. Shepperd et al. (2013) review the effectivenessof discharge planning in an acute hospital setting. In particular, the paper reviews theeffect of discharge planning on the LoS of patients, the unscheduled readmission rates,and the reduction of costs. The result of this paper found that there was a significantreduction in LoS and readmission rates for those patients who were allocated to dischargeplanning, and also reported a cost saving to the health service from implementing dis-charge planning. Even a small reduction in LoS could free up capacity for subsequentadmissions in a system where there is a shortage of acute hospital beds (Shepperd et al.,2013).
Hulshof et al. (2012) define a bed blocker as a patient whose medical treatment is com-plete but cannot leave the hospital. An overview of the literature regarding bed blockingsince the 1980s is given in Styrborn and Thorslund (1993). This paper considers the bedblocking effect in hospitals in Sweden. According to this paper, medical staff at hospi-tal wards file detailed reports on bed blocking patients, containing information such asadmission date, date when ready for discharge, how long the patient has been consid-ered a bed blocker, and plans regarding future level of care. Calculations concerning theproportion of bed blockers are often measured by the average fraction of beds occupiedby patients whose medical treatment is complete (Vanberkel et al., 2009). Styrborn andThorslund (1993) discovered that the proportion of bed blockers is influenced by the avail-ability of alternative forms of institutional care, such as nursing homes and old people’shomes outside of short-term hospitals. The bed blocking effect is a huge contribution tothe congestion of hospital wards. The consequences of congested wards are considered inHulshof et al. (2012), all of which are a threat to the provided quality of care, including:transferring patients to another hospital; placing patients in less appropriate medicalunits; creating backlogs in emergency rooms or surgical recovery units; and postponing
10

elective admissions to surgery, which negatively impacts the health condition of patients.
Much of the relevant literature considers simulation models to improve bed utilisation inhospital wards. Jun et al. (1999) provide an extensive review of the recent applications ofsimulation to healthcare, followed by the implementation of a Discrete Event Simulation(DES) model. Borgman (2012) defines DES as the creation of a model that represents asystem, which is used to gain a better understanding of the system it represents. DES isused to model systems that can be viewed as a queuing system where individual entitiespass through a series of activities, in between which they wait in queues, where thedurations of the activities are usually sampled from probability distribution functions(Brailsford and Hilton, 2001). When applied to healthcare, Jun et al. (1999) recognisethat DES can be used to forecast the impact of changes in patient flow, examine resourceneeds, and investigate the relationship between model variables. Another application ofDES is utilised in Holm et al. (2013), where a generic model is constructed to representthe patient flow through the wards of a hospital. This approach solves the problem ofallocating beds among hospital wards in order to improve hospital bed utilisation. Thecombination of DES and a greedy heuristic to improve hospital ward utilisation is appliedin Holm et al. (2013). The DES is run where patients flow through the wards, and a log iskept of patients in each bed in each ward. This information is used to produce an outputmatrix. An optimal allocation of beds is calculated offline from the simulation. The resultof this paper is computationally efficient, as it does not require the simulation model tobe re-run for each possible bed allocation scenario. The simulation model constructed inRidge et al. (1998) indicates that a non-linear relationship exists between the number ofbeds, the mean occupancy level, and the number of patients that are transferred due tobed blocking. This model also represents the heavy trade off between the bed occupancyand the number of transfers due to bed blocking. According to Holm et al. (2013), aSystem Dynamics (SD) modelling approach could be considered to improve hospital bedutilisation. This alternative simulation approach considers a continuous flow of patientsthough the wards of the hospital, which is reasonable if the number of patients is largeenough so that the random arrival and departure time of a single patient has a negligibleimpact on the system (Holm et al., 2013).
Many authors consider the application of queuing theory to model hospital wards. Astandard queuing model known as the Erlang loss model is utilised in Bekker and deBruin (2010) to dimension hospital wards, which often accurately describes the numberof patients present at a ward. A thorough review of the Erlang loss model is discussedin De Bruin et al. (2010), which demonstrate that queuing theory can be used to quan-tify the number of refused admissions to a hospital ward. In this paper the Erlang lossmodel is used to describe the inpatient flow, which can be used to determine the numberof required operational beds, and the corresponding annual budgets. In comparison tosimulation and queuing theory, a mathematical programming approach is a less popularapplication to utilise beds in hospital wards. However, some applications obtained suc-cessful results with the use of mathematical programming. For example, Bachouch et al.(2012) apply mathematical programming to manage beds and to plan their use accordingto the demand, taking into consideration both elective and emergency patients. In thispaper, an ILP model is used to minimise the expenditure of hospitals with regards to bed
11
planning in hospital wards.
2.5 Personnel Planning
If medical teams are concentrated at the front end of the admission, then those samestaff cannot also perform the essential tasks of preparing patients for discharge (Blackand Pearson, 2002). As a result, medical staff have less time in the wards to see patientsand their relatives, leading to inefficient communication and poor operation of dischargeprocedures (Black and Pearson, 2002). Therefore, predicting staff workloads at hospitalwards and scheduling staff accordingly is essential for guaranteeing quality of care inan efficient and cost-effective manner (Kortbeek et al., 2015). However, every incidenceof overstaffing is scrutinised during times when cost-containment efforts are required(Kortbeek et al., 2015). Hulshof et al. (2012) recognise that the pressure on healthcareorganisations rises as both demand for healthcare and expenditures are increasing steadily.As a result, healthcare professionals face the challenging task to determine nurse staffinglevels more effectively and efficiently.
Nurse-to-patient ratios are commonly applied when determining staffing levels. In Kort-beek et al. (2015), a nurse-to-patient ratio is defined as the number of patients a nursecan be responsible for at any point in time. In this paper, staffing based on nurse-to-patient ratios are performed in two different ways. The first method sets a legal minimumnurse-to-patient ratio, which is advantageous because it ensures that a consistently highlevel of patient safety is guaranteed. However, as observed by Kortbeek et al. (2015),the stochastic nature of patient arrivals means that there is always a possibility thatall beds are occupied, meaning that all beds need to be continuously staffed. This canoften result in over-staffing, because there is little flexibility to adjust staffing levels tothe predicted patient demand. To overcome this disadvantage, Kortbeek et al. (2015)proposed a second method, where the minimum ratio may be violated, but not too often,or not for too long. Another factor to consider when determining staffing levels is theflexibility of nurses. Using the definitions of Kortbeek et al. (2015), a dedicated nursecan be defined as a nurse with a fixed assignment to a care unit, and a float nurse can bedefined as a nurse with a flexible assignment to a care unit that is decided at the start oftheir shift. Flexible staffing policies are indicated as a powerful concept in reducing therequired number of staff (Hulshof et al., 2012), allowing hospitals to dynamically respondto their fluctuating patient populations (Kortbeek et al., 2015). However, as noted byHulshof et al. (2012), flexible staff can be significantly more expensive.
Fletcher et al. (2007) observed that simulation models can be effective applications, whichtake into account the uncertainty of patient arrival patterns, predict the maximum de-mand levels that staff are expected to handle, and determine the staffing levels required tomeet those demands, whilst also keeping the average waiting time below a certain thresh-old. Although simulation models are useful applications to staff scheduling, much of thecontent found in research considered a mathematical programming approach. In the pa-
12
per of Kortbeek et al. (2015), a stochastic method is introduced that uses hourly bedcensus predictions to derive efficient nurse staffing policies. Mathematical programmingmodels are constructed for both dedicated and flexible nursing staff, which determine thestaffing requirements that guarantee a desired quality of care in the most cost-effectivemanner. A stochastic programming approach is utilised in Gnanlet and Gilland (2009)to find optimal resource levels for two non-homogeneous hospital wards. This paperlooks at how to determine the optimal required resource levels of nursing staff, to meetthe stochastic demand at a minimum cost using two flexibility approaches: demand up-grades; and staffing flexibility. A demand upgrade is where patients are placed in anupgraded ward if there is insufficient space in the most suitable ward (Burger, 2011).Staffing flexibility is discussed previously in this section. Gnanlet and Gilland (2009)discover that flexible staffing proves more beneficial than using demand upgrades, but toobtain optimal results, a combination of both is to be applied.
2.6 Conclusion
The variability in the process of hospital wards is hugely influenced by the outflow of theED and OR. For patients that require additional care after the initial treatment, bothdepartments forward their patients to the wards. As a result, it is difficult to predictthe characteristics of patients who are admitted to the wards. The stochastic natureof the arrival process of patients and their corresponding LoS in the wards is empha-sised in this chapter. To anticipate these patient characteristics, a typical approach isassigning probability distributions to statistically predict the arrival and LoS of patients.A non-homogeneous Poisson distribution is often used to describe the arrival process ofemergency patients, corresponding to the stochastic nature of emergency arrivals. How-ever, this does not necessarily apply to the arrival process of elective patients, since theyare scheduled in advance during weekdays. The probability distributions used to predictthe LoS of patients were not consistent; it proved more beneficial to tailor distributionsto the particular dataset of each study to determine the most suitable distribution. Thenumber of occupied beds in hospital wards is a stochastic process, due to the stochasticnature of the number of arrivals and the LoS. It is desirable to efficiently manage thenumber of occupied beds, to overcome problems that commonly occur in hospital wards,such as congestion and the bed blocking effect. Typical approaches from literature thatare implemented in the aforementioned papers consist of simulation, mathematical pro-gramming or queuing theory models to utilise beds in the wards. Simulation modelsseemed to be particularly adept to modelling the wards of hospitals, since they are capa-ble of capturing much of the common complexities that are involved in modelling hospitalwards.
Now that an overview of the relevant literature has been discussed, we are ready toconsider the problem at hand. This chapter aims to supplement the ideas and decisionsthat are made in the following chapter, where the most suitable Operational Researchmodel for this paper will be selected.
13

Chapter 3
Methodology
A summary of the key successes and findings in literature concerning bed utilisation inhospital wards is given in chapter 2. This highlights the problems that staff in the wardsof hospitals commonly face, and the Operational Research approaches that overcomethese problems. Taking this into consideration, we are now ready to give a more detaileddescription of the problem in comparison the problem description given in section 1.2.The purpose of this chapter is to give a more detailed description of factors that concernout problem, and to determine the most suitable Operational Research approach to solvethe problem. The ideas and results discussed in chapter 2 will be used to supplement theprocess of selecting the most suitable approach.
3.1 Identifying the Hierarchical Level of the Problem
The first step is to identify the hierarchical level of planning that our problem is cate-gorised into. Hierarchical levels of planning in healthcare are commonly divided into 3categories, where one of these categories is divided into two subcategories. The first levelof planning is referred to as the strategic level, which includes planning for the long term.The second level of planning is referred to as the tactical level, where medium term plan-ning decisions are made. The third level of planning is referred to as the operational level,which includes planning for the short term. The operational level is often divided intotwo subcategories, which are the operational online level and the operational offline level.Using the definitions of Hooijsma (2012): the operational offline level is decision makingthat is made for the short term, but still made in advance; and the operational onlinelevel is made for the short term, but made during the process rather than in advance.
14
When considering bed utilisation in hospital wards at the strategic level, Hooijsma (2012)recognises that the aim is to determine how many beds are needed in total. At the tac-tical level beds are allocated between wards and medical specialities, which according toHooijsma (2012), almost never changes. It is also stated in the paper of Hooijsma (2012)that decisions at the tactical level do not concern actual patients. At the operationaloffline level, it is said that patients are assigned to the wards at the same time that theschedules for treatment are made. On the other hand, at the operational online level theschedule changes because of emergencies and variability in LoS. Determining how manybeds are needed for the wards of the HagaZiekenhuis is out of the scope of this paper,therefore the strategic level will not be applicable. The tactical level is not concerned withthe actual patients, and as a result, will also not be applicable for this paper. Since onlyemergency patients are considered in this paper, high variability in the arrival and LoSis expected. Therefore, it seems that the operational online level is the level of decisionmaking that is applicable for this paper.
3.2 A Comparison of Possible Approaches
It is evident from chapter 2 that tailoring models to specific problems can significantlyimprove the usability of the results. So that the usability of the result in this paper ismaximised, this section aims to provide a detailed description of advantages and disad-vantages of the possible Operational Research approaches.
Much of the content found in literature consider a mathematical programming, simulationor queuing theory based approach to overcome the problems concerning bed utilisationin hospital wards. A thorough review of the aforementioned Operational Research tech-niques is given in Vanberkel (2011), where it is noted that although simulation modelsare well equipped to capture the broad scope of complex systems, they typically require agreat deal of time to develop. In comparison, mathematical programming models are ca-pable of optimising for certain objectives, but require a more limited scope in order to besolvable. In addition, it is recognised that queueing theory models are particularly adeptat coping with system variability, but typically employ a more limited scope. Accordingto Ridge et al. (1998), queueing theory can be useful as a means of pre-calculating certainlimiting output values for simulation models. A summary of these techniques is given byVanberkel (2011), concluding that many factors that are included in simulation modelsare ignored in mathematical programming and queueing theory models.
Summarising from section 2.4, it appears that simulation models are the most widelyused Operational Research technique to utilise beds in hospital wards. Both mathemat-ical programming and queueing theory require a limited scope in order to be solvable,however, it is desirable to consider the many complexities that are involved in modellinghospital wards. To avoid excluding important factors when constructing our model, andto take into consideration the complexities involved in modelling hospital wards, thispaper considers a simulation approach.
15

Now that it is decided that a simulation approach will be implemented, we must determinewhich simulation model is the most suitable. Simulation models can be categorised intostatic or dynamic models. Using the definitions of Law (2007): a static simulation modelis a representation of a system at a particular time; and a dynamic simulation model is arepresentation of a system over time. Simulation models are also divided into stochasticand deterministic models. Law (2007) distinguishes between deterministic and stochasticsimulation models, defining a deterministic simulation model as a model without randomcomponents, and a stochastic simulation model as a model that contains at least somerandom input components. Distinguishing between each of this is necessary when decidingwhich simulation model is suitable.
Much of the papers found in literature that use simulation consider a DES or SD approachto model the wards of hospitals. Brailsford and Hilton (2001) provide a comparison ofDES and SD for modelling healthcare systems. In this paper it is noted that both DESand SD have been used widely in healthcare, however, there are fewer applications ofSD. SD is essentially deterministic whereas DES is stochastic (Brailsford and Hilton,2001). Section 2.3 emphasises the stochastic nature of patient arrivals and LoS in thewards. Due to the randomness in the number of patient arrivals and LoS, Hulshof et al.(2012) state that the number of occupied beds is a stochastic process, and these randomeffects will impact the wards differently (Holm et al., 2013). The number of randomcomponents that will need to be considered suggests that a DES model will be the mostsuitable approach to model this particular problem. With further research, it was foundthat Koelling and Schwandt (2005) compare and contrast the use of DES and SD tohealthcare. This paper recognises that DES works well for issues that concern the flowof individual entities through a system, which is typically associated with operationallevel types of problems. In comparison, it is stated that SD models typically representrelationships between system variables, rates of change over time, and explicit feedback,which are more suitable for strategic level types of problems. Therefore, it is clear thata DES approach would be more suitable to model this particular problem. A dynamicDES will be constructed, which represents the patient flow through the wards of theHagaZiekenhuis over the duration of weekends.
Before implementing a DES model, the disadvantages of the approach should first beconsidered. The first disadvantage of simulation in general, as previously stated by Van-berkel (2011), is that simulation models typically take a great deal of time to develop.Another disadvantage of implementing a DES is discussed by Law (2007). Since DESis a stochastic simulation model, each run of a DES model produces estimates of themodel’s true characteristics for a set of input parameters. To overcome this problem,a number of independent runs of the simulation model are required. Providing that ananalytical model is appropriate, Law (2007) states that the model can produce the exacttrue characteristics of the model for a variety of sets of input parameters. Although itdoes not apply for the complex problem considered in this paper, if an analytical modelcan be developed, it will typically be the preferable approach in comparison with a DESmodel.
16

3.3 Solution Approach
Prior to implementing experiments on real-life systems with many risk and uncertaintyfactors, a DES approach will be utilised to obtain a quick, inexpensive model that rep-resents the true characteristics of the wards of the HagaZiekenhuis. This dynamic sim-ulation model will represent the patient flow through the wards of the HagaZiekenhuisover the duration of the weekends. A number of patient round schedules can then beexperimented, without the many risks and uncertainty factors that in involved when ex-perimenting on the real-life system. The impact of the patient round schedule on the bedoccupancy of the wards will be emphasised, and used as encouragement to medical staff toconsider the possibility of implementing weekend patient rounds at the HagaZiekenhuis.
DES models produce estimates of the system’s true characteristics for a set of inputparameters. The input parameters of the model are the arrival process and the LoSof patients. This model will take into consideration the high variability of these char-acteristics, by assigning suitable probability distributions to statistically predict thesecharacteristics. Based on these predictions, the model will be used to determine theexpected bed occupation of the wards.
Elective patients are rarely scheduled for appointments during the weekends. The modelthat will be constructed will represent patient flow during the weekends; therefore, itis assumed that only emergency patients are considered. As discussed in section 2.3,anticipation of elective patient admissions is possible, since they are scheduled for anappointment in advance. This particular paper aims to provide the HagaZiekenhuis witha model that anticipates the stochastic nature of emergency patients and then predictsthe capacity of beds taken by emergency patients. Using this prediction, medical staff atthe HagaZiekenhuis will know how many beds are available for elective patients, who mayschedule the number of appointments for elective patients accordingly. Since no electivepatients are considered, the distinction between elective and emergency patients will notbe relevant for this particular paper.
Currently at the HagaZiekenhuis patient rounds are not scheduled over the weekends, andas a result, are reaching a high capacity in the wards at the beginning on the week. It isexpected that with the presence of patient rounds during weekends, the HagaZiekenhuisexperience much less refused admissions. Therefore, the performance measure for theconstructed DES model will be the number of refused admissions to the wards of theHagaZiekenhuis over the weekend. This is consistent with the performance measure thatis discussed in Hulshof et al. (2012).
17

Chapter 4
Data Analysis
4.1 Data Overview
The data for this project has been provided by the HagaZiekenhuis, consisting of infor-mation on 10,148 patients that were admitted from the beginning of January in 2013until the end of March in 2014. For each of these patients, a record has been kept of thefollowing information: the time and date that they arrived; the time and date that theywere discharged; which medical specialists they were referred to; which hospital ward theywere admitted to; and, if applicable, which ward they were transferred to during theirstay at the HagaZiekenhuis. These patients were admitted to one of 35 wards, consist-ing of 5 different medical specialities, namely General Surgery (HLK), Gastroenterology(GEN), Internal Medicine (INT), Neurology (NEU) and Pulmonology (LON). These arethe abbreviations that are used in the provided dataset from the HagaZiekenhuis. Thereare 2625 HLK patients, 1203 GEN patients, 3029 INT patients, 1920 NEU patients, and1371 LON patients considered in this data set. Kortbeek et al. (2014) recognise thatinpatient care facilities should not only take into account the upstream departments, butalso the interrelationship between care units. For this reason, we will take into consider-ation coordinated planning of patients that belong to all of the aforementioned medicalspecialities and wards included in the dataset.
8215 patients were admitted during the year 2013, and 1933 patients were admitted in2014. For the duration of this section, data analysis will only performed on the data in2013. Using this data, input parameters will be determined for the DES model. Theresults of the model will represent the characteristics of the wards of the HagaZiekenhuisin 2013. Validation of the model using the same data that is input into the modelcauses bias. Therefore, to validate the DES model, the result will be compared to thecharacteristics of the data in 2014.
18
The four statistics looked at in this data analysis are the arrival rate, the LoS of patients,the bed occupancy of the hospital wards, and the time it takes to discharge a patient fromthe wards. A general overview of the arrival and LoS is provided in section 4.2, followed bythe assignment of probability distributions to each of these statistics in section 4.3. Thefluctuation of the bed occupation during the year 2013 is analysed and discussed in section4.4. In section 4.5, the number of discharges during the weekends of 2013 is analysed. Anoverview of the notable results that were found in this section are summarised in section4.6.
4.2 Patient Arrivals & Length of Stay
For consistency, it is desirable to use the same time unit when analysing and manipulatingdata. However, the purpose of this section is simply to provide an overview of the datasetto gain a greater understanding of the data. At this moment in time, measuring thenumber of arrivals and the LoS in days proved to be easier to interpret. Once a DESmodel is utilised later in this paper, the unit of time that will be considered will be hours.
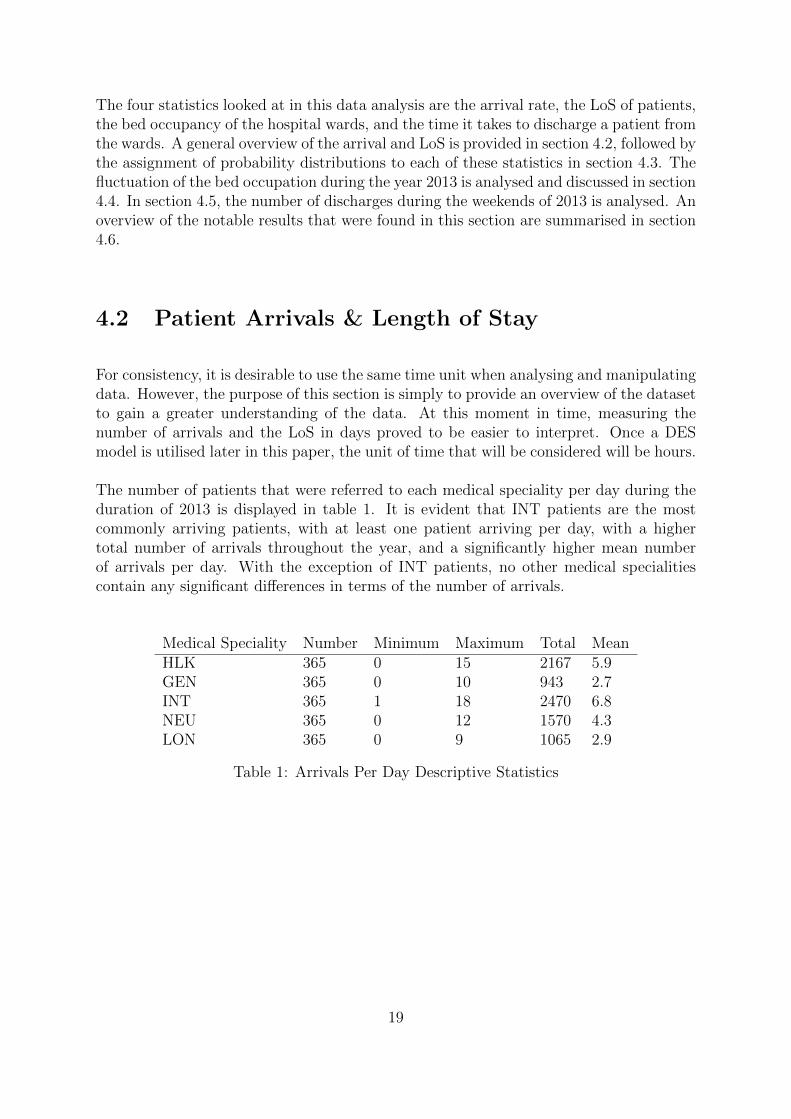
The number of patients that were referred to each medical speciality per day during theduration of 2013 is displayed in table 1. It is evident that INT patients are the mostcommonly arriving patients, with at least one patient arriving per day, with a highertotal number of arrivals throughout the year, and a significantly higher mean numberof arrivals per day. With the exception of INT patients, no other medical specialitiescontain any significant differences in terms of the number of arrivals.
Medical Speciality Number Minimum Maximum Total MeanHLK 365 0 15 2167 5.9GEN 365 0 10 943 2.7INT 365 1 18 2470 6.8NEU 365 0 12 1570 4.3LON 365 0 9 1065 2.9
Table 1: Arrivals Per Day Descriptive Statistics
19

Using the data on arrivals and discharges, the LoS of each patient is calculated using thefollowing formula:
LengthofStay = (DayofDischarge + TimeofDischarge)
− (DayofArrival + TimeofArrival)
The LoS of patients is recorded from the time when a patient is admitted to a warduntil the time that the patient is discharged from that ward. This does not take intoconsideration whether or not patients switch between wards during their stay at theHagaZiekenhuis. Due to this, a modified LoS is introduced which measures the lengthof time a patient stays at the HagaZiekenhuis, rather than the time a patient stays ata certain ward. The LoS that will be considered for the rest of this paper will be themodified LoS.
Table 2 shows descriptive statistics for the LoS in days of patients that were admittedin 2013, for each of the medical specialities. A comparison of the mean suggests thatthe LoS of LON patients is typically longer than other specialities, with approximately6 days spent in hospital as opposed to approximately 4 days in other specialities. Withthe exception of LON, no other medical specialities have any significant differences.
Medical Speciality Minimum Maximum Mean Standard DeviationHLK 0.00005 56.5 3.9 5.5GEN 0.00069 48.6 4.2 4.6INT 0.00014 50.1 4.4 4.7NEU 0.00056 44.8 4.0 4.6LON 0.00005 47.8 5.9 5.3
Table 2: LoS Descriptive Statistics
A problem with the dataset can be easily identified from the result in table 2. Theminimum LoS of a patient for each medial speciality ranges from 4 seconds to 60 seconds,all of which are unrealistic times for an emergency patient to stay in hospital. Resultssuch as these can be considered as mistakes during the data collection process, and as aresult, can be removed replaced with missing values. It should be noted that reducingthe number of observations in the dataset negatively impacts the accuracy of the results.
20
As discussed in chapter 2, the CoV can be used to measure the variability of patients’LoS in the HagaZiekenhuis. Using the values displayed in table 2, we considered the CoVfor each population: the CoV of the HLK LoS equals 1.41; the CoV of the GEN LoSequals 1.09; the CoV of the INT LoS equals 1.06; the CoV of the NEU LoS equals 1.15;and the CoV of the LON LoS equals 0.89. These values suggest that the LoS of patientsexperience high variability in all specialities, with the exception of LON, which has alow variability. From the combination of both the results in table 2 and the CoV, it canbe concluded that the LoS of LON patients is typically longer than other specialities,with little variability. Little variability suggests that it is unlikely that patients who arecategorised into the LON medical speciality have a LoS much different from 6 days.
Summarising from the results of this section, we can conclude that INT patients weremost commonly admitted to the HagaZiekenhuis in comparison with the other medicalspecialities. LON patients typically had a longer LoS in the HagaZiekenhuis, with littlevariability. With the exception of these results, there was no clear indication of significantdifferences between medical specialities. Further investigation of both the arrival and LoSis considered in the following section, where probability distributions are determined foreach medical speciality.
4.3 Arrival & Length of Stay Distributions
Section 2.3 emphasised how highly influential the arrival and LoS of patients are onthe processes of hospital wards. As a consequence, both of these characteristics willimpact the result of our model. To predict the impact of these characteristics, probabilitydistributions are assigned to both the arrival and LoS. Since all of the medical specialitiesare taken into consideration in this paper, a distribution will need to be determined forthe arrival and LoS of each medical speciality. Therefore, the purpose of this section isto determine the most suitable distributions to predict these stochastic characteristics,for each speciality.
Much of the literature selected in chapter 2 that concerns the distribution of patient ar-rivals assume a non-homogeneous Possion arrival process, corresponding to the stochasticnature of emergency arrivals. It is common in practice to assign the Possion distributionto describe a stochastic arrival process. Since only emergency patients are considered inthis dataset, we will assume a non-homogeneous Poisson arrival process for each medicalspeciality.
A number of distributions were assigned to the LoS of patients in the literature discussedin chapter 2, each tailored to their own particular dataset. As a result, it is necessaryto determine the most suitable distribution for patients’ LoS for this particular dataset.Marazzi et al. (1998) recognise that typical LoS distributions are asymmetric and con-tain outliers, and as a result, asymmetrical distributions are more suitable for the LoSdistribution of patients in comparison with symmetrical distributions. This is consistent
21
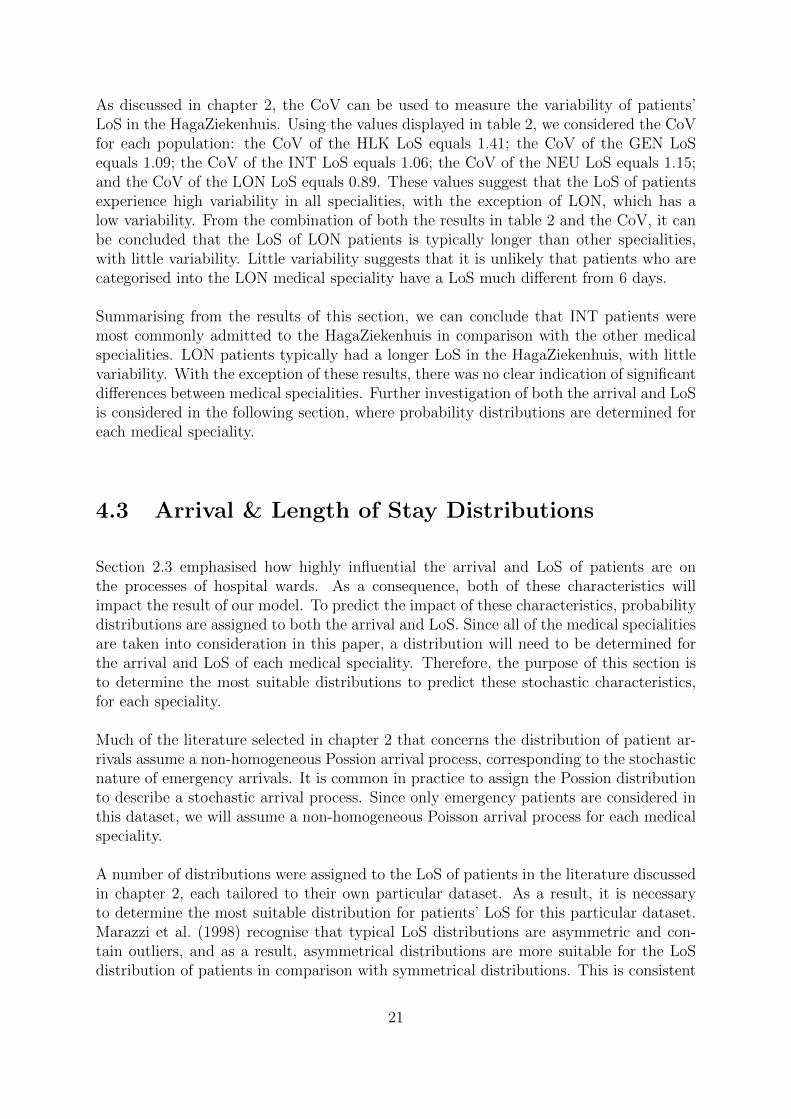
with the research on LoS distributions found in chapter 2, since all distributions men-tioned are asymmetrical distributions. Each of the asymmetrical distributions discussedin chapter 2 were considered, using Q-Q plots that were obtained using the statisticalsoftware package SPSS. From the results of SPSS, the most suitable distributions weredetermined along with their corresponding parameter values. It was found that the ex-ponential distribution is the most suitable distribution to use for GEN patients. Withfurther investigation, it was found that the gamma distribution is the most suitable dis-tribution to use for INT, HLK, NEU and LON patients. The outcome of the Q-Q plotvalidation for each speciality is shown in table 3, along with the corresponding Q-Q plotsin figure 2.
Figure 2: Q-Q Plots of the LoS Data
22

The Q-Q plots of HLK, INT, NEU, and LON patients in figure 2 show a strong linearrelationship with the gamma distribution, since the points lie approximately on the liney=x. The skewed pattern displayed in the GEN Q-Q plot indicates a weaker relationshipwith the exponential distribution. The high variability of the LoS of patients sometimescauses slightly skewed results in practice.
Medical Speciality Distribution Shape ScaleHLK Gamma 0.504 7.692GEN Exponential 0.240INT Gamma 0.903 5NEU Gamma 0.788 5.128LON Gamma 1.241 4.717
Table 3: Q-Q Plot Validation Outcomes
Table 3 is a summary of the results outputted from SPSS. Note that the GEN specialitydoes not have a value for the scale, since exponential distributions do not consist of scaleparameters. The information displayed in table 3 are used as input parameters for theDES model.
4.4 Bed Occupancy
To provide a comparison of the bed occupation for each medical speciality, descriptivestatistics of the bed occupation in 2013 are obtained and displayed in table 4.
Medical Speciality Minimum Maximum Mean Standard DeviationHLK 15 36 22.7 4.6GEN 5 22 13.0 3.6INT 23 49 33.3 6.0NEU 9 31 18.9 4.7LON 11 35 19.9 5.6
Table 4: Bed Occupancy Descriptive Statistics
The result in table 4 indicates that INT patients have a significantly higher mean bedoccupation in comparison with the other medical specialities. This is consistent with theresult in section 4.2, where it is concluded that INT patients are the most commonlyarriving patients. However, INT patients do not have a higher LoS in comparison withother medical specialities. This suggests that the higher mean bed occupation is explainedby the large number of patients being admitted, rather than the patients staying in thewards for longer.
23
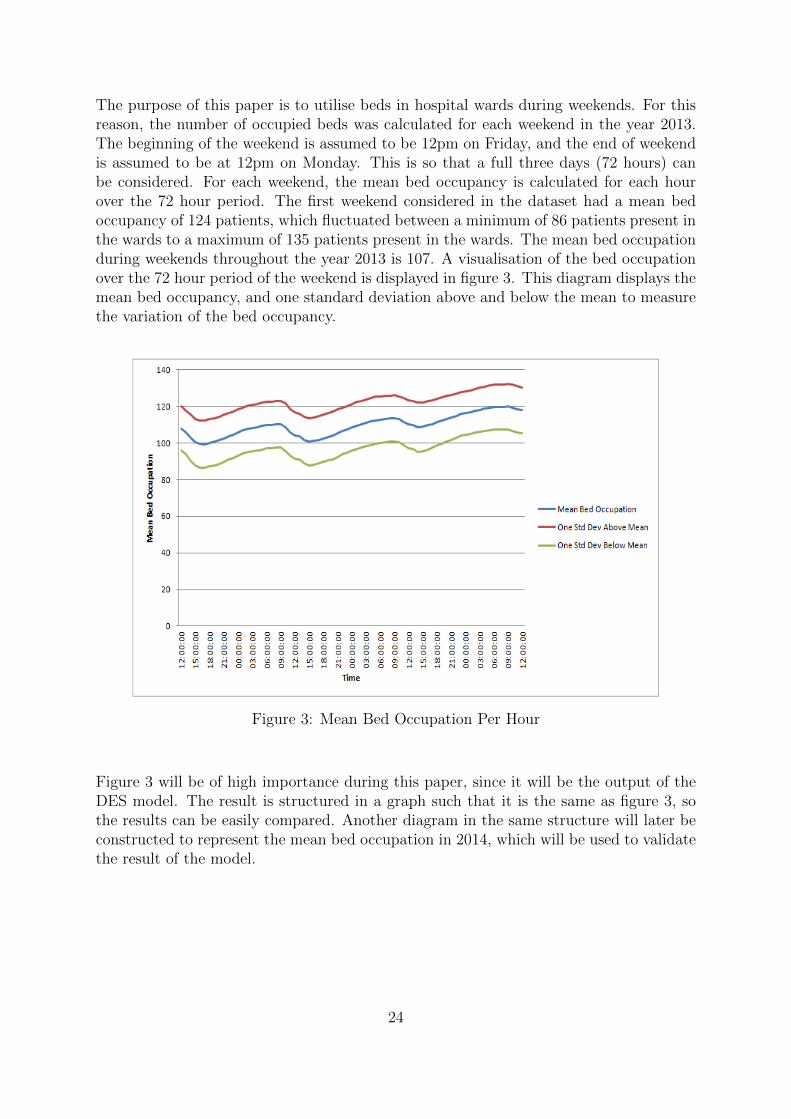
The purpose of this paper is to utilise beds in hospital wards during weekends. For thisreason, the number of occupied beds was calculated for each weekend in the year 2013.The beginning of the weekend is assumed to be 12pm on Friday, and the end of weekendis assumed to be at 12pm on Monday. This is so that a full three days (72 hours) canbe considered. For each weekend, the mean bed occupancy is calculated for each hourover the 72 hour period. The first weekend considered in the dataset had a mean bedoccupancy of 124 patients, which fluctuated between a minimum of 86 patients present inthe wards to a maximum of 135 patients present in the wards. The mean bed occupationduring weekends throughout the year 2013 is 107. A visualisation of the bed occupationover the 72 hour period of the weekend is displayed in figure 3. This diagram displays themean bed occupancy, and one standard deviation above and below the mean to measurethe variation of the bed occupancy.
Figure 3: Mean Bed Occupation Per Hour
Figure 3 will be of high importance during this paper, since it will be the output of theDES model. The result is structured in a graph such that it is the same as figure 3, sothe results can be easily compared. Another diagram in the same structure will later beconstructed to represent the mean bed occupation in 2014, which will be used to validatethe result of the model.
24
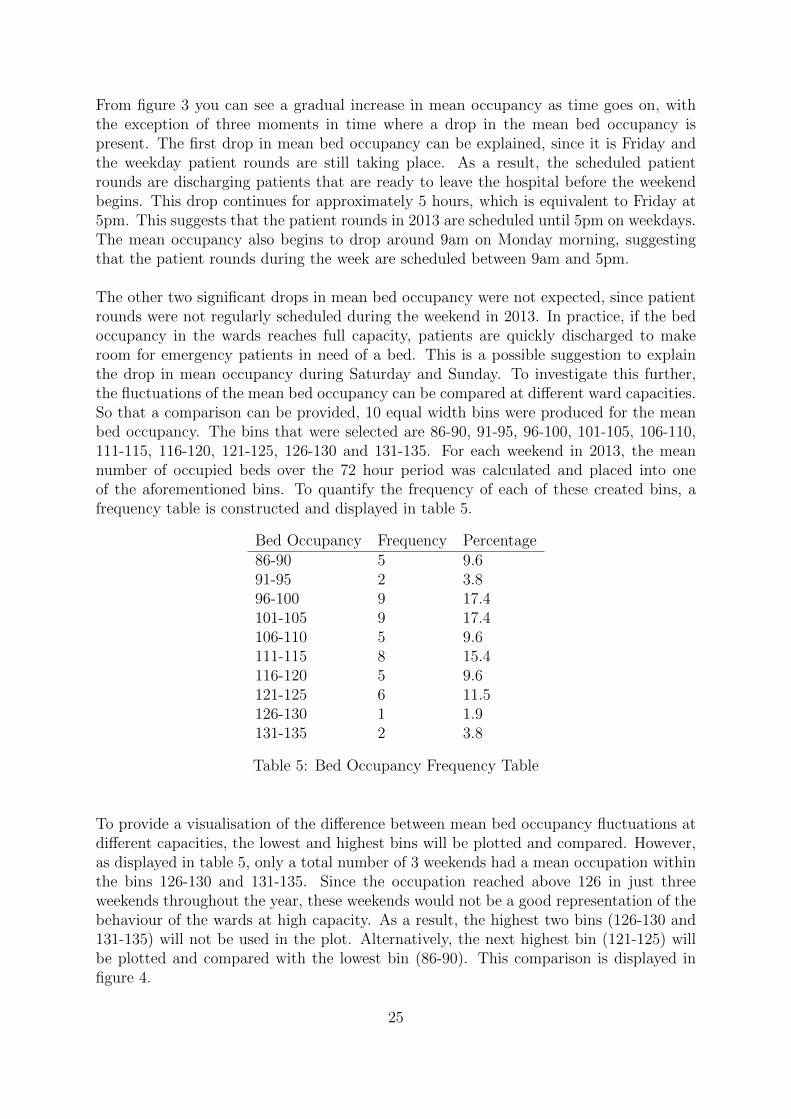
From figure 3 you can see a gradual increase in mean occupancy as time goes on, withthe exception of three moments in time where a drop in the mean bed occupancy ispresent. The first drop in mean bed occupancy can be explained, since it is Friday andthe weekday patient rounds are still taking place. As a result, the scheduled patientrounds are discharging patients that are ready to leave the hospital before the weekendbegins. This drop continues for approximately 5 hours, which is equivalent to Friday at5pm. This suggests that the patient rounds in 2013 are scheduled until 5pm on weekdays.The mean occupancy also begins to drop around 9am on Monday morning, suggestingthat the patient rounds during the week are scheduled between 9am and 5pm.
The other two significant drops in mean bed occupancy were not expected, since patientrounds were not regularly scheduled during the weekend in 2013. In practice, if the bedoccupancy in the wards reaches full capacity, patients are quickly discharged to makeroom for emergency patients in need of a bed. This is a possible suggestion to explainthe drop in mean occupancy during Saturday and Sunday. To investigate this further,the fluctuations of the mean bed occupancy can be compared at different ward capacities.So that a comparison can be provided, 10 equal width bins were produced for the meanbed occupancy. The bins that were selected are 86-90, 91-95, 96-100, 101-105, 106-110,111-115, 116-120, 121-125, 126-130 and 131-135. For each weekend in 2013, the meannumber of occupied beds over the 72 hour period was calculated and placed into oneof the aforementioned bins. To quantify the frequency of each of these created bins, afrequency table is constructed and displayed in table 5.
Bed Occupancy Frequency Percentage86-90 5 9.691-95 2 3.896-100 9 17.4101-105 9 17.4106-110 5 9.6111-115 8 15.4116-120 5 9.6121-125 6 11.5126-130 1 1.9131-135 2 3.8
Table 5: Bed Occupancy Frequency Table
To provide a visualisation of the difference between mean bed occupancy fluctuations atdifferent capacities, the lowest and highest bins will be plotted and compared. However,as displayed in table 5, only a total number of 3 weekends had a mean occupation withinthe bins 126-130 and 131-135. Since the occupation reached above 126 in just threeweekends throughout the year, these weekends would not be a good representation of thebehaviour of the wards at high capacity. As a result, the highest two bins (126-130 and131-135) will not be used in the plot. Alternatively, the next highest bin (121-125) willbe plotted and compared with the lowest bin (86-90). This comparison is displayed infigure 4.
25
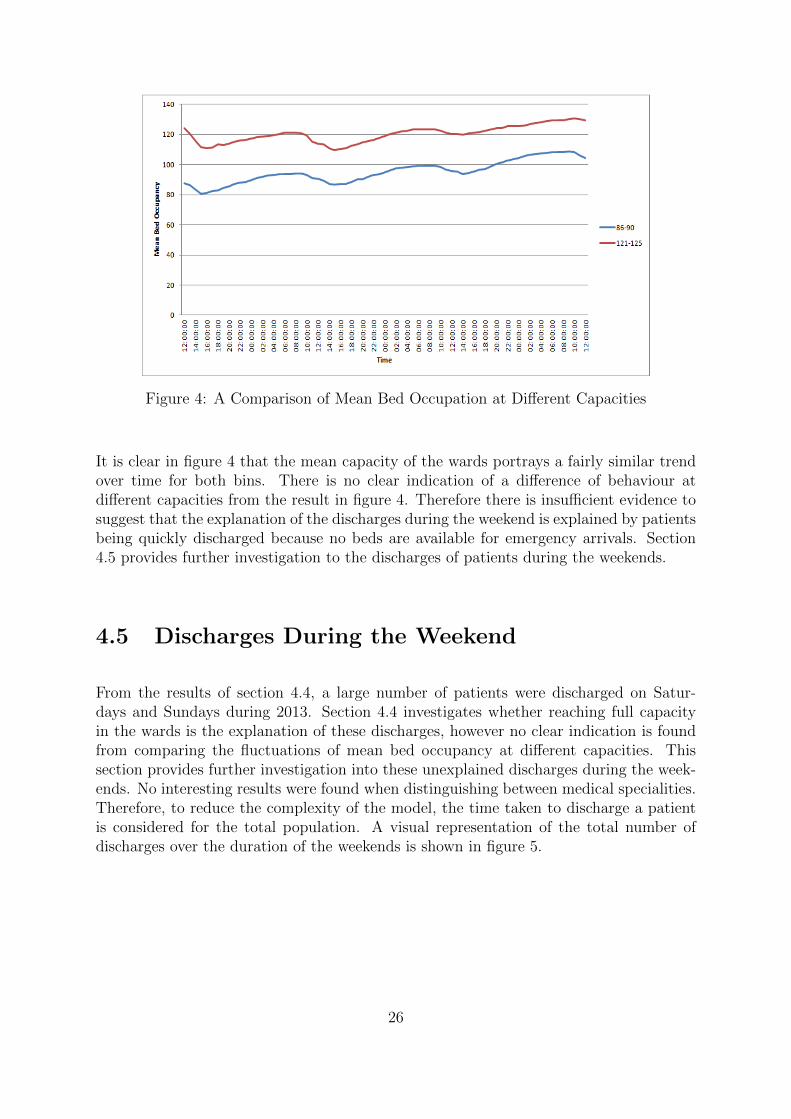
Figure 4: A Comparison of Mean Bed Occupation at Different Capacities
It is clear in figure 4 that the mean capacity of the wards portrays a fairly similar trendover time for both bins. There is no clear indication of a difference of behaviour atdifferent capacities from the result in figure 4. Therefore there is insufficient evidence tosuggest that the explanation of the discharges during the weekend is explained by patientsbeing quickly discharged because no beds are available for emergency arrivals. Section4.5 provides further investigation to the discharges of patients during the weekends.
4.5 Discharges During the Weekend
From the results of section 4.4, a large number of patients were discharged on Satur-days and Sundays during 2013. Section 4.4 investigates whether reaching full capacityin the wards is the explanation of these discharges, however no clear indication is foundfrom comparing the fluctuations of mean bed occupancy at different capacities. Thissection provides further investigation into these unexplained discharges during the week-ends. No interesting results were found when distinguishing between medical specialities.Therefore, to reduce the complexity of the model, the time taken to discharge a patientis considered for the total population. A visual representation of the total number ofdischarges over the duration of the weekends is shown in figure 5.
26
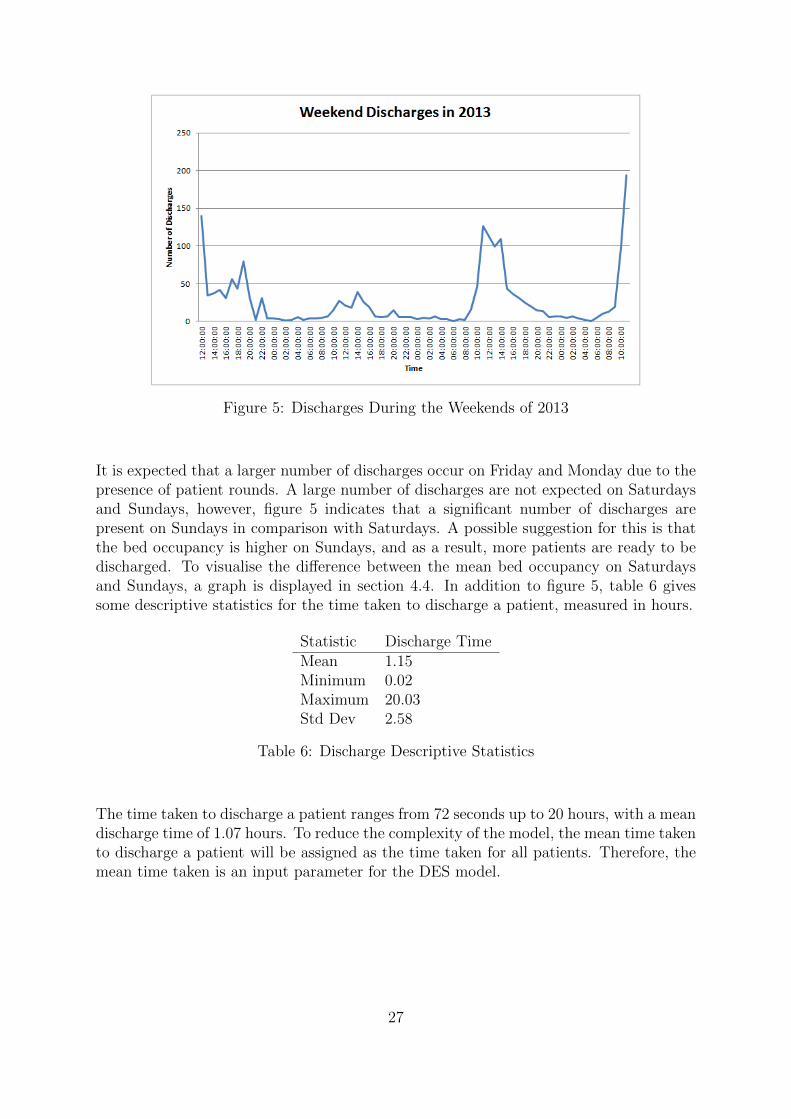
Figure 5: Discharges During the Weekends of 2013
It is expected that a larger number of discharges occur on Friday and Monday due to thepresence of patient rounds. A large number of discharges are not expected on Saturdaysand Sundays, however, figure 5 indicates that a significant number of discharges arepresent on Sundays in comparison with Saturdays. A possible suggestion for this is thatthe bed occupancy is higher on Sundays, and as a result, more patients are ready to bedischarged. To visualise the difference between the mean bed occupancy on Saturdaysand Sundays, a graph is displayed in section 4.4. In addition to figure 5, table 6 givessome descriptive statistics for the time taken to discharge a patient, measured in hours.
Statistic Discharge TimeMean 1.15Minimum 0.02Maximum 20.03Std Dev 2.58
Table 6: Discharge Descriptive Statistics
The time taken to discharge a patient ranges from 72 seconds up to 20 hours, with a meandischarge time of 1.07 hours. To reduce the complexity of the model, the mean time takento discharge a patient will be assigned as the time taken for all patients. Therefore, themean time taken is an input parameter for the DES model.
27

4.6 Summary
This chapter aims to obtain a clear understanding of the dataset provided by theHagaZiekenhuis, and determines the input parameters that are required for the DESmodel. Section 4.1 gives a general overview of the data, aiming to gain a greater un-derstanding of the dataset. Section 4.2 analyses the arrival and LoS of patients foreach medical speciality. In particular, the arrivals per day and the LoS of patients indays is compared between each medical speciality. It was concluded that INT patientswere the most commonly admitted patients to the HagaZiekenhuis, and LON patientstypically stay longer than patients belonging to other medical specialities. Both thearrival rate and LoS are influential characteristics in the variability of the wards. Forthis reason, probability distributions were assigned in section 4.3 for the arrival and LoSof each medical speciality. A non-homogeneous Poisson arrival process is assumed for allspecialities. An exponential distribution is assigned to predict the LoS of GEN patients,and a gamma distribution is assigned to all other specialities. These distributions willbe used as input parameters in the DES model. Section 4.4 provides an overview of thenumber of occupied beds during the year 2013. The bed occupancy was compared foreach medical speciality, discovering that the mean bed occupation for INT is significantlyhigher than other specialities, due to the larger number of patients that are admittedto INT. A comparison is provided of the mean occupancy fluctuations over time for thehighest and lowest mean occupancy levels. No clear indication of significant differenceswas present from this comparison. A graph is produced that represents the fluctuationof the overall mean bed occupancy over the duration of the weekend. The mean bedoccupancy of the wards will be the output of our model. The result of the model can beused to compare with the overall mean bed occupancy results in section 4.4. A closerinspection into the discharges during the weekends of 2013 is provided in section 4.5,where it is observed that many discharges are present over the weekends of 2013 outsideof patient rounds. To reduce the complexity, the mean time taken to discharge a patientis assigned to all patients considered in the model. The mean time taken to discharge apatient will another input parameter for our model.
Now that an understanding of the dataset is provided, and the input parameters havebeen determined, we are now ready to implement the DES model. The following sectionexplains how the model is implemented, along with the assumptions that reduce thecomplexity of implementing the model.
28

Chapter 5
Simulation Model
Now that the dataset of the HagaZiekenhuis has been analysed, we are ready to constructthe DES model. Section 5.1 states the necessary assumptions that are made to reducethe complexity of the model. Section 5.2 determines the input parameters from the dataanalysis, and describes the process of constructing the model. An explanation of theprogram that is used to build the model is discussed in section 5.3. Once a simulationmodel has been built, it is required to verify and validate the model to ensure that itrepresents the true characteristics of the real-life system. The simulation model is verifiedin section 5.4, and validated in section 5.5. The performance of the model is measuredin section 5.6, using the number of refused admissions into the wards as the performancemeasure. A conclusion is made based on the result of the model in section 5.7.
5.1 Model Assumptions
To reduce the model complexity we make the following assumptions:
1. Only emergency patients are considered in the provided dataset, since elective pa-tients are rarely scheduled for appointments during weekends.
2. Patients arrive at the hospital wards according to a non-homogeneous Poisson dis-tribution.
3. The weekend begins at 12pm on a Friday and finishes at 12pm on a Monday.
4. The time between discharges during a patient round is equivalent to the time ittakes to discharge a patient.
29

5.2 Implementation of the Model
The first stage of implementing the model is determining the model input parameters.The data analysis in chapter 4 determines much of the input parameters of the model.The input components of this DES model that can be determined from the dataset areas follows: the medical speciality; the distribution of the arrival rate and LoS of patients;the mean LoS of patients, measured in hours; the shape and scale of the distributionof patients’ LoS; and the arrival rates per hour of each medical speciality. Summarisingfrom the data analysis in chapter 4, the input parameters of the DES model that can beobtained from the dataset are displayed in table 7, with the exception of the arrival rate.It should be noted that an exponential distribution does not contain a scale parameter,which is the reason it has been left blank for GEN in table 7.
Medical Speciality LoS Distribution Mean LoS (Hours) Shape ScaleHLK Gamma 3.9 0.504 7.692GEN Exponential 4.2 0.240INT Gamma 4.4 0.903 5.00NEU Gamma 4.0 0.788 5.128LON Gamma 5.9 1.241 4.717
Table 7: Model Input Parameters
The arrival rate is the number of arrivals per unit of time, in our case measured in hours.The first step to calculate the arrival rate is to produce a 24x7 matrix for each medicalspeciality, representing each hour of the day and each day of the week. The hour andday of arrival for each patient admitted in 2013 is put into this matrix, which counts thenumber of arrivals for each hour and day. For example, a total number of 6 GEN patientswere admitted during the 12:00-12:59 time interval on a Monday. From this matrix, thecorresponding arrival rates are calculated for each medical speciality, representing eachhour of the day and each day of the week. To calculate the arrival rate using the previousexample, since there 52 Mondays in total in 2013, the arrival rate is calculated as 6divided by 52 which is equal to 0.11538. This is calculated for each value of the 24x7matrix. When the start and stop time for the simulation are selected, the correspondingarrival rates for that time can be selected from this arrival rate matrix. From the modelassumptions in section 5.1, the start time of the simulation is at 12pm on Friday and thestop time of the simulation is at 12pm on Monday. Therefore, we select the arrival ratesfrom midday on Friday to midday on Monday. This gives us a total of 72 arrival ratesfor each medical speciality.
The mean time taken to discharge a patient is 1.07 hours, which is assigned as the timetaken to discharge all patients.
Now that all of the input parameters have been obtained, we are ready to implement theDES model. An outline of the DES procedure is displayed in algorithm 1.
30

Algorithm 1 Pseudo Code for the Discrete Event Simulation Procedure
procedure Weekend SimulationCreate initial scenarioInitialise performance measuresfor the number of replications do
Create the starting eventsAdd the first arrival eventwhile not at the end of the simulation time do
Remove event (E) with smallest timestamp (t)Set the simulation time to tExecute the event E
end whileReset the performance measures
end forDispose of the removed events
end procedure
As displayed in algorithm 1, the first step is to create the initial scenario and perfor-mance measures, which are determined using the probability distributions and the inputparameters of the 2013 data. As the system evolves over time, the DES procedure iter-atively executes the next event in time. Using the definition of Law (2007), an event ina DES model is an instantaneous occurrence that may change the state of the system.The events that are considered in this particular model are: the start of the simulation;the end of the simulation; a patient arrival; a patient is treated; and a patient leavesthe hospital. So as the system evolves over time, these events are executed iterativelyuntil the end of the simulation. Once the simulation ends, the performance measures arereinitialised, and the events that were removed are disposed of.
The output of the DES procedure is a prediction of the mean bed occupancy in the wardsover the duration of weekends. To verify that the constructed DES model is an accurateprediction of the bed occupancy, the model will need to be validated with previous years’data to ensure that it has the same characteristics of the system. Since the data in 2013is used as input for the model, comparing it with the results of 2013 would cause a biasedresult. Therefore, the results of the model must be compared with the results of the datain 2014. A graphical representation of the fluctuations of the mean bed occupancy overthe duration of the weekends in 2014 will be provided, such that it is in the same formatas figure 3 displayed in subsection 4.4. Then the DES model will be designed such thatit outputs the mean bed occupancy in the same format as figure 3, so they can be easilycompared. So that numerical values are assigned to the results of the simulation, themodel will also output some descriptive statistics regarding the bed occupancy duringweekends. This will include the mean bed occupancy of patients during the weekend,the minimum occupancy, the maximum occupancy, and the standard deviation of theoccupancy over the duration the simulation. This will allow the results of each run of thesimulation to be easily compared with one another.
31
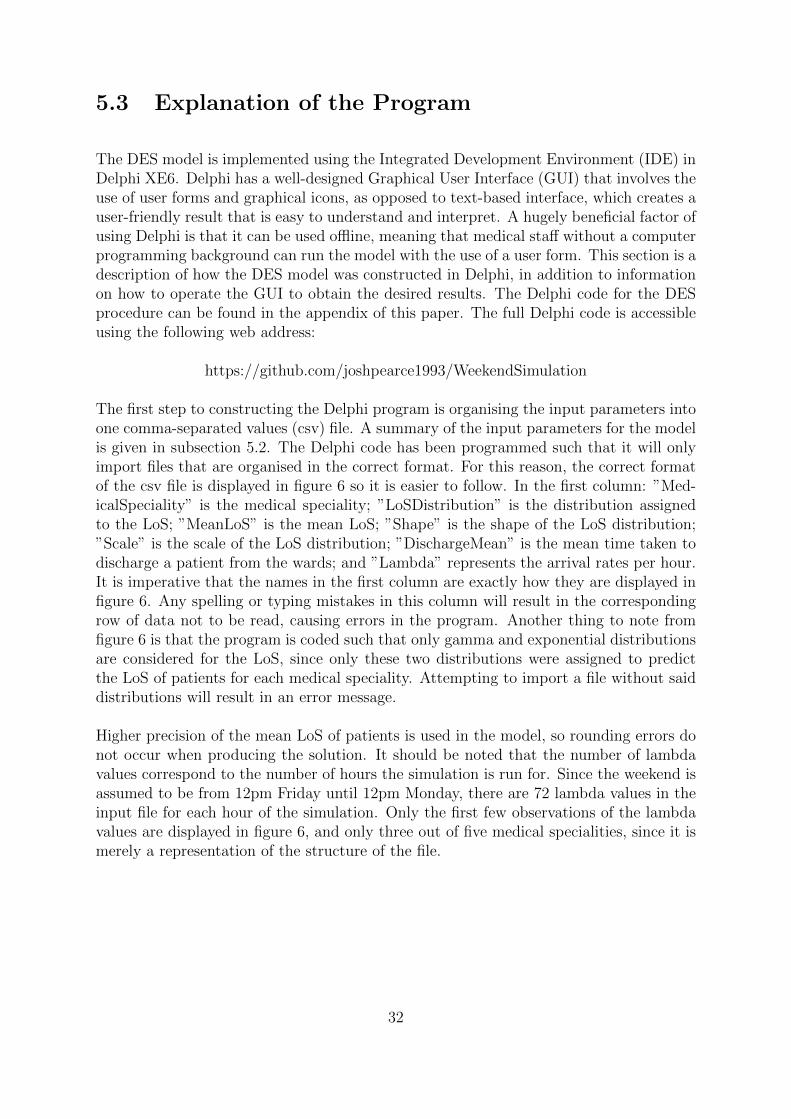
5.3 Explanation of the Program
The DES model is implemented using the Integrated Development Environment (IDE) inDelphi XE6. Delphi has a well-designed Graphical User Interface (GUI) that involves theuse of user forms and graphical icons, as opposed to text-based interface, which creates auser-friendly result that is easy to understand and interpret. A hugely beneficial factor ofusing Delphi is that it can be used offline, meaning that medical staff without a computerprogramming background can run the model with the use of a user form. This section is adescription of how the DES model was constructed in Delphi, in addition to informationon how to operate the GUI to obtain the desired results. The Delphi code for the DESprocedure can be found in the appendix of this paper. The full Delphi code is accessibleusing the following web address:
https://github.com/joshpearce1993/WeekendSimulation
The first step to constructing the Delphi program is organising the input parameters intoone comma-separated values (csv) file. A summary of the input parameters for the modelis given in subsection 5.2. The Delphi code has been programmed such that it will onlyimport files that are organised in the correct format. For this reason, the correct formatof the csv file is displayed in figure 6 so it is easier to follow. In the first column: ”Med-icalSpeciality” is the medical speciality; ”LoSDistribution” is the distribution assignedto the LoS; ”MeanLoS” is the mean LoS; ”Shape” is the shape of the LoS distribution;”Scale” is the scale of the LoS distribution; ”DischargeMean” is the mean time taken todischarge a patient from the wards; and ”Lambda” represents the arrival rates per hour.It is imperative that the names in the first column are exactly how they are displayed infigure 6. Any spelling or typing mistakes in this column will result in the correspondingrow of data not to be read, causing errors in the program. Another thing to note fromfigure 6 is that the program is coded such that only gamma and exponential distributionsare considered for the LoS, since only these two distributions were assigned to predictthe LoS of patients for each medical speciality. Attempting to import a file without saiddistributions will result in an error message.
Higher precision of the mean LoS of patients is used in the model, so rounding errors donot occur when producing the solution. It should be noted that the number of lambdavalues correspond to the number of hours the simulation is run for. Since the weekend isassumed to be from 12pm Friday until 12pm Monday, there are 72 lambda values in theinput file for each hour of the simulation. Only the first few observations of the lambdavalues are displayed in figure 6, and only three out of five medical specialities, since it ismerely a representation of the structure of the file.
32
Figure 6: Model Input File
The user form that is presented to the user before running the program is displayedin figure 7. The input fields consist of the first five edit boxes, whose values can beselected and inputted into the user form by the user. The default values for the inputfields were based on the data analysis of 2013 in subsection 4.4. In 2013 the startingmean occupation was 124 patients, and this fluctuated between 86 and 135 throughoutthe year. Discharges typically occur between 9am and 5pm in the results of the 2013data, and as a result, are set as the default for this program. The number of iterationscorresponds to the number of times the program is repeated. As stated by Law (2007),a stochastic simulation model only produces estimates of the true characteristics of asystem, thus a large number of runs are required. To increase the accuracy, the defaultis set as 1000 independent simulation runs, so a large number of results are produced.The values of the edit boxes are only accepted if integer values are selected. Once theinput fields have been selected, the user must then click the ”Load Input Fields” button.If this button is clicked and non-integer values have been selected for the input fields, anerror message will appear for each of the input values that are not integers. If all inputvalues are integers, the input fields will successfully load.
Once the input fields are loaded, the user is ready to select the patient data. The patientdata is the file containing the input parameters of the model, which must be in the formatof the file in figure 6. Immediately clicking the ”Load Patient Data” button before loadingthe input fields will result in an error message appearing, which prompts the user to loadthe input fields before loading the patient data. Providing the input fields are loaded,clicking the ”Load Patient Data” button will load the default patient data file from figure6. An alternative method is to check the ”Manually Select File” check box, then manuallyselect an input file to load. An error message will appear if the patient data is open withanother program. Providing the input file is in the correct format, and the file isn’t openelsewhere, this file will successfully load. Now that all the input parameters have beeninputted into the model, the program is now ready to run the main DES procedure. When
33
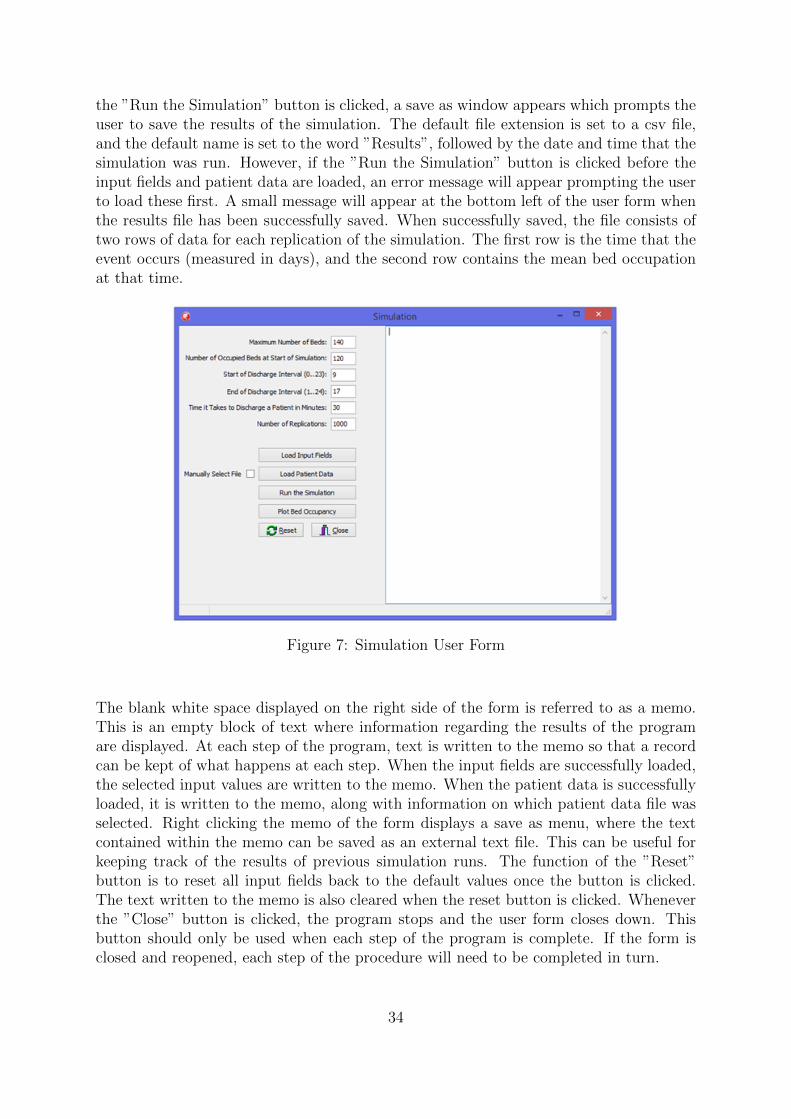
the ”Run the Simulation” button is clicked, a save as window appears which prompts theuser to save the results of the simulation. The default file extension is set to a csv file,and the default name is set to the word ”Results”, followed by the date and time that thesimulation was run. However, if the ”Run the Simulation” button is clicked before theinput fields and patient data are loaded, an error message will appear prompting the userto load these first. A small message will appear at the bottom left of the user form whenthe results file has been successfully saved. When successfully saved, the file consists oftwo rows of data for each replication of the simulation. The first row is the time that theevent occurs (measured in days), and the second row contains the mean bed occupationat that time.
Figure 7: Simulation User Form
The blank white space displayed on the right side of the form is referred to as a memo.This is an empty block of text where information regarding the results of the programare displayed. At each step of the program, text is written to the memo so that a recordcan be kept of what happens at each step. When the input fields are successfully loaded,the selected input values are written to the memo. When the patient data is successfullyloaded, it is written to the memo, along with information on which patient data file wasselected. Right clicking the memo of the form displays a save as menu, where the textcontained within the memo can be saved as an external text file. This can be useful forkeeping track of the results of previous simulation runs. The function of the ”Reset”button is to reset all input fields back to the default values once the button is clicked.The text written to the memo is also cleared when the reset button is clicked. Wheneverthe ”Close” button is clicked, the program stops and the user form closes down. Thisbutton should only be used when each step of the program is complete. If the form isclosed and reopened, each step of the procedure will need to be completed in turn.
34
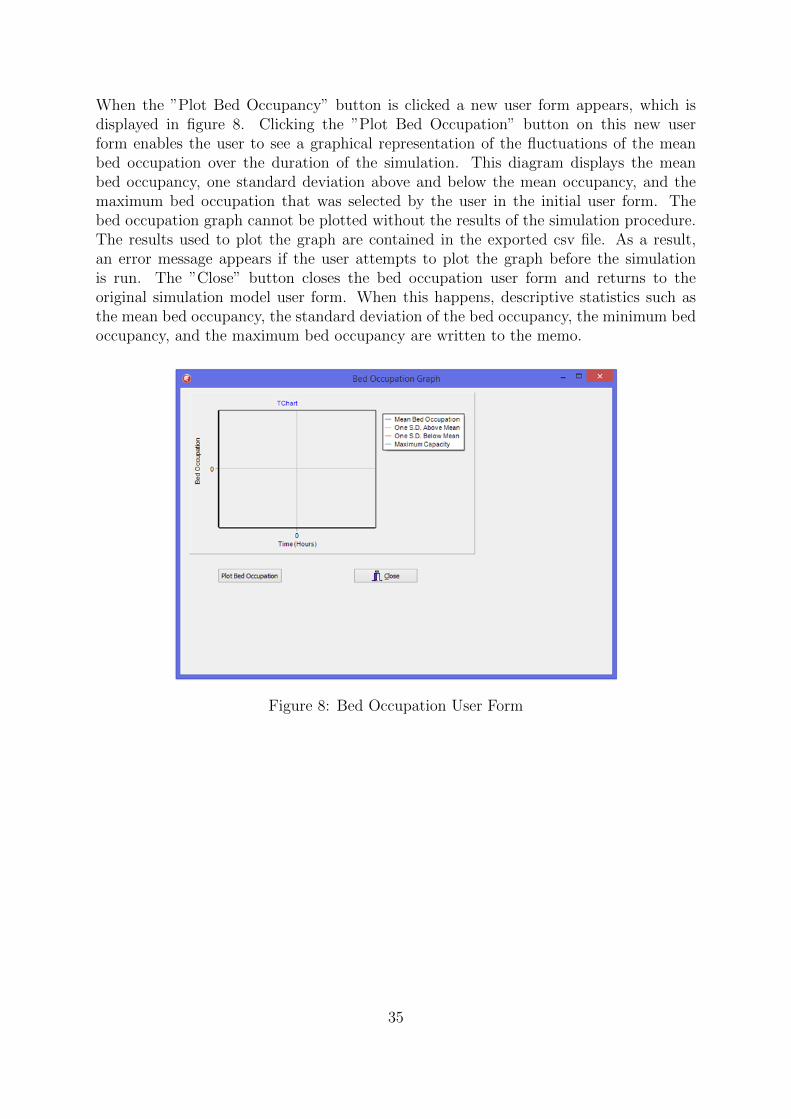
When the ”Plot Bed Occupancy” button is clicked a new user form appears, which isdisplayed in figure 8. Clicking the ”Plot Bed Occupation” button on this new userform enables the user to see a graphical representation of the fluctuations of the meanbed occupation over the duration of the simulation. This diagram displays the meanbed occupancy, one standard deviation above and below the mean occupancy, and themaximum bed occupation that was selected by the user in the initial user form. Thebed occupation graph cannot be plotted without the results of the simulation procedure.The results used to plot the graph are contained in the exported csv file. As a result,an error message appears if the user attempts to plot the graph before the simulationis run. The ”Close” button closes the bed occupation user form and returns to theoriginal simulation model user form. When this happens, descriptive statistics such asthe mean bed occupancy, the standard deviation of the bed occupancy, the minimum bedoccupancy, and the maximum bed occupancy are written to the memo.
Figure 8: Bed Occupation User Form
35

5.4 Model Verification
The following simulation model verification techniques were utilised by Law (2007). Thefirst technique is debugging the program, which is successful in this paper since the finalversion of the Delphi code runs without errors. A second technique to ensuring that morethan one person reviews the simulation model. Both Mr Nardo Borgman and ProfessorErwin Hans from Twente University reviewed the simulation model during the processof implementing the model. Visualising the output of the simulation model with the useof graphical representations is another technique discussed by Law (2007). The outputof the Delphi program is a graphical visualisation of mean bed occupancy in the wardsover the duration of weekends. From this output it can be clearly identified that nounexpected behaviour occurs. To visualise this, a graphical representation of the resultis displayed in the following section of this paper.
5.5 Model Validation
Now that the model is verified, we are ready to validate the simulation model. Whendeveloping a simulation model, model validation is important to ensure that the modelaccurately represents the true characteristics of the real-life system. The data obtainedin 2013 is used as the input for the model. The data obtained in 2014 is used to validatethe model. Law (2007) provides the following six steps to improve the credibility andvalidity of a simulation model:
1. Ensure that a high-quality dataset from a reliable source is used as input for thesimulation model.
2. Maintain regular interaction with employees that have a good understanding of thereal life system.
3. Provide a structured walk-through of the model, and state the assumptions thatwere made.
4. Validate the model using quantitative techniques.
5. Validate the overall output of the simulation model.
6. Validate the model using animation.
Each of these steps will be considered in turn to ensure that the constructed simulationmodel is valid.
36
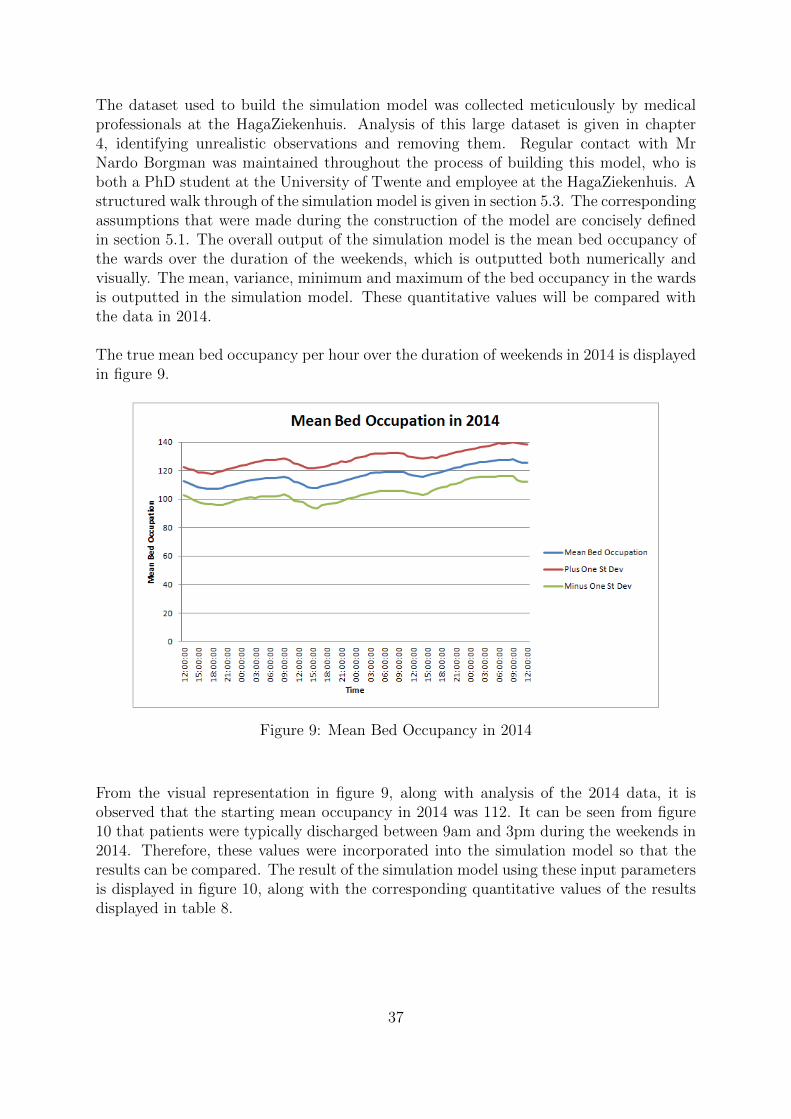
The dataset used to build the simulation model was collected meticulously by medicalprofessionals at the HagaZiekenhuis. Analysis of this large dataset is given in chapter4, identifying unrealistic observations and removing them. Regular contact with MrNardo Borgman was maintained throughout the process of building this model, who isboth a PhD student at the University of Twente and employee at the HagaZiekenhuis. Astructured walk through of the simulation model is given in section 5.3. The correspondingassumptions that were made during the construction of the model are concisely definedin section 5.1. The overall output of the simulation model is the mean bed occupancy ofthe wards over the duration of the weekends, which is outputted both numerically andvisually. The mean, variance, minimum and maximum of the bed occupancy in the wardsis outputted in the simulation model. These quantitative values will be compared withthe data in 2014.
The true mean bed occupancy per hour over the duration of weekends in 2014 is displayedin figure 9.
Figure 9: Mean Bed Occupancy in 2014
From the visual representation in figure 9, along with analysis of the 2014 data, it isobserved that the starting mean occupancy in 2014 was 112. It can be seen from figure10 that patients were typically discharged between 9am and 3pm during the weekends in2014. Therefore, these values were incorporated into the simulation model so that theresults can be compared. The result of the simulation model using these input parametersis displayed in figure 10, along with the corresponding quantitative values of the resultsdisplayed in table 8.
37
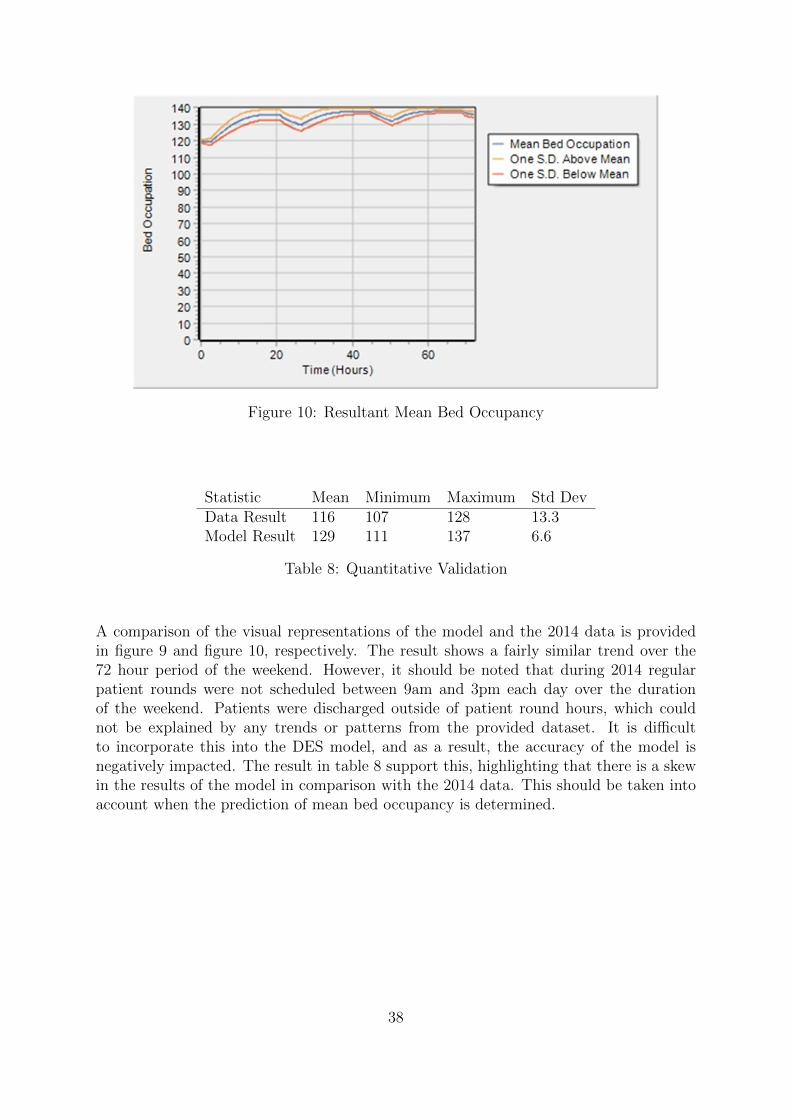
Figure 10: Resultant Mean Bed Occupancy
Statistic Mean Minimum Maximum Std DevData Result 116 107 128 13.3Model Result 129 111 137 6.6
Table 8: Quantitative Validation
A comparison of the visual representations of the model and the 2014 data is providedin figure 9 and figure 10, respectively. The result shows a fairly similar trend over the72 hour period of the weekend. However, it should be noted that during 2014 regularpatient rounds were not scheduled between 9am and 3pm each day over the durationof the weekend. Patients were discharged outside of patient round hours, which couldnot be explained by any trends or patterns from the provided dataset. It is difficultto incorporate this into the DES model, and as a result, the accuracy of the model isnegatively impacted. The result in table 8 support this, highlighting that there is a skewin the results of the model in comparison with the 2014 data. This should be taken intoaccount when the prediction of mean bed occupancy is determined.
38
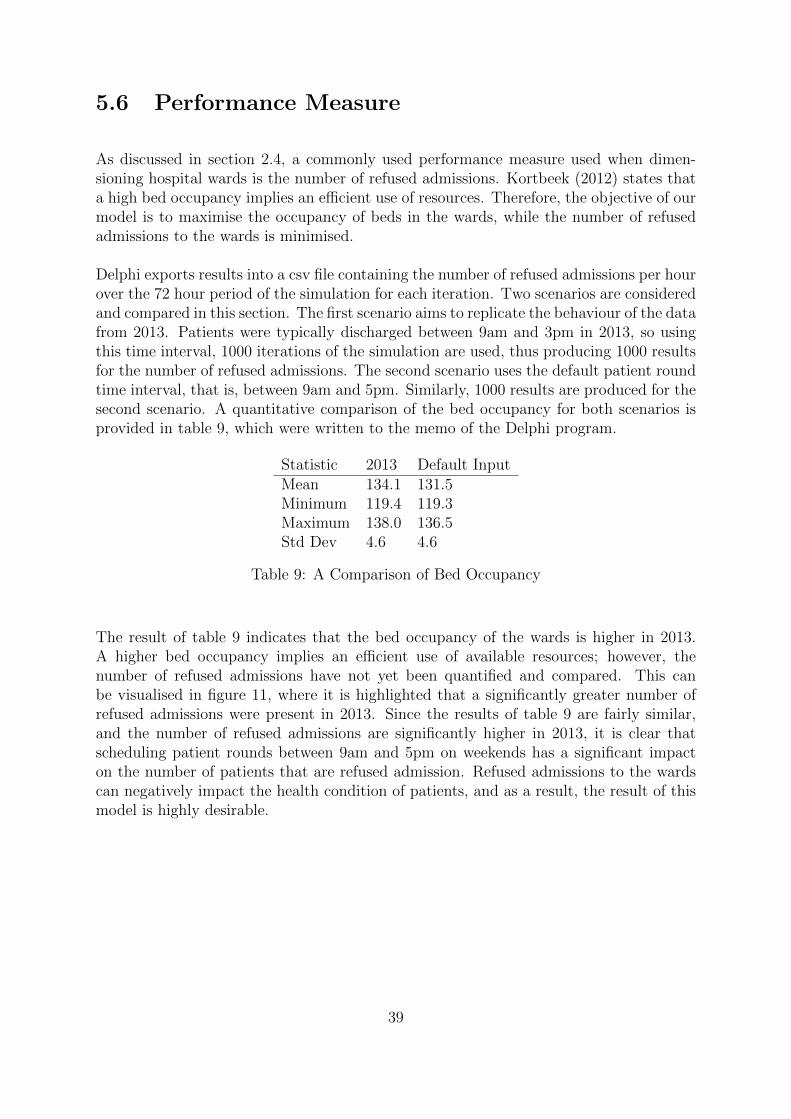
5.6 Performance Measure
As discussed in section 2.4, a commonly used performance measure used when dimen-sioning hospital wards is the number of refused admissions. Kortbeek (2012) states thata high bed occupancy implies an efficient use of resources. Therefore, the objective of ourmodel is to maximise the occupancy of beds in the wards, while the number of refusedadmissions to the wards is minimised.
Delphi exports results into a csv file containing the number of refused admissions per hourover the 72 hour period of the simulation for each iteration. Two scenarios are consideredand compared in this section. The first scenario aims to replicate the behaviour of the datafrom 2013. Patients were typically discharged between 9am and 3pm in 2013, so usingthis time interval, 1000 iterations of the simulation are used, thus producing 1000 resultsfor the number of refused admissions. The second scenario uses the default patient roundtime interval, that is, between 9am and 5pm. Similarly, 1000 results are produced for thesecond scenario. A quantitative comparison of the bed occupancy for both scenarios isprovided in table 9, which were written to the memo of the Delphi program.
Statistic 2013 Default InputMean 134.1 131.5Minimum 119.4 119.3Maximum 138.0 136.5Std Dev 4.6 4.6
Table 9: A Comparison of Bed Occupancy
The result of table 9 indicates that the bed occupancy of the wards is higher in 2013.A higher bed occupancy implies an efficient use of available resources; however, thenumber of refused admissions have not yet been quantified and compared. This canbe visualised in figure 11, where it is highlighted that a significantly greater number ofrefused admissions were present in 2013. Since the results of table 9 are fairly similar,and the number of refused admissions are significantly higher in 2013, it is clear thatscheduling patient rounds between 9am and 5pm on weekends has a significant impacton the number of patients that are refused admission. Refused admissions to the wardscan negatively impact the health condition of patients, and as a result, the result of thismodel is highly desirable.
39

Figure 11: Refused Admissions
5.7 Synopsis
To briefly summarise, this paper models the wards of the HagaZiekenhuis using a DESmodel that is constructed in Delphi XE6. The result of this model emphasises the benefitsof scheduling patient rounds during weekends. The number of refused admissions in theyear 2013 is compared with the number of refused admissions when regular patient roundsare scheduled during weekends. The result of this comparison indicates that a significantlysmaller number of refused admissions occur with the presence of regular patient roundsduring the weekend. This result can be used as encouragement for medical staff at theHagaZiekenhuis to schedule more regular patient rounds during weekends, to make anefficient use of the available ward resources.
40

Chapter 6
Further Research
The result of this paper opens up a plethora of future directions for further research.Assumptions were made and certain factors that affect hospital wards were not consideredto reduce the complexity of the DES model; however, this reduces the usability of theresults. This chapter summarises the suggested approaches that are suitable to improvethe usability of the result of this paper. Section 6.1 provides an overview of the problemswith the dataset provided by the HagaZiekenhuis. Section 6.2 identifies the problemswith categorising patients strictly into one medical speciality, and explains the factorsthat are overlooked. Section 6.3 discusses how elective patients can be incorporated intothe DES model. Section 6.4 addresses the possibilities of personnel planning in the wards.
6.1 Improvements to the Data
It is identified in section 4.2 that the dataset provided by the HagaZiekenhuis containserrors. The minimum LoS of each medical speciality ranges from approximately 4 secondsto 60 seconds, all of which are unrealistic times for an emergency patient to stay inhospital. Errors that are found in datasets are typically made in the data collectionprocess, or where data is inputted into a spreadsheet. Observations that contain errorsare classed as unreliable, and as a result, are removed from the dataset. A larger numberof observations in the dataset produce more accurate results, therefore each observationthat is removed due to the presence of an error reduces the overall accuracy of the result.Ensuring that medical professionals are meticulous during the data collection processwould overcome this problem. However, it is likely in practice for mistakes to be madewhen collecting data for large datasets. An alternative solution to the problem wouldbe increasing the number of observations considered in the population, for example,collecting data for more medical specialities. This solution would decrease the impactthat mistakes have on the accuracy of the results.
41
6.2 Problems With Categorising Patients
Each patient in the provided dataset are categorised into one of the following five medi-cal specialities: general surgery, gastroenterology, internal medicine, neurology and pul-monology. The total population is divided into five subpopulations, one for each special-ity. Distributions are assigned to predict the stochastic characteristics of patients belong-ing to each speciality. However, categorising patients into separate medical specialitiescan sometimes be unrealistic, since there are a plethora of specific medical conditions thatwill involve a combination of the medical specialities considered in this paper. For exam-ple, pulmonology is categorised as a subspeciality of internal medicine. Circumstancessuch as this are realistic in practice, however, are overlooked in this paper. Due to this,the characteristics of patients may be misrepresented and cause misleading results. Thisshould be taken into consideration if future research is implemented to improve the resultof this paper.
6.3 Including Elective Patients
Elective patients are not considered in this paper, since appointments for elective patientsare rarely scheduled during weekends. With use of probability distributions to describethe stochastic nature of emergency patients, the DES model predicts the mean bed oc-cupancy of the wards. Based on this prediction, medical staff can determine the numberof beds available for elective patients, and schedule appointments accordingly. Althoughthis prediction may assist medical staff on scheduling the number of elective appoint-ments, some important factors that reduce the usability of the results are not included.The result of the DES model only models emergency patients that are admitted to thewards after arriving at the ED. Section 2.2 emphasises the desirability of coordinatedplanning when modelling hospital departments, stating that isolating departments yieldssuboptimal results. Therefore, a suggestion for further research is to include the interac-tion between the wards and elective patients admitted from the OR, which is currentlynot included in the model.
Section 2.3 summarises the approaches found in literature that predict the demand ofelective and emergency patients in hospital wards. A common approach to predict thedemand is combining the AAC and the MSS to predict the arrive process of all patientsentering the wards. The admission cycle of emergency patients is predicted using theAAC, and the admission cycle of elective patients being admitted to the wards aftersurgery is predicted using the MSS. Applying this method to the result of this paperwould take into consideration both elective and emergency patients, modelling thesepatients arriving from both the ED and OR. This approach would be a sensible directionto improve the usability of the result of the DES model.
42
6.4 Personnel Planning in Hospital Wards
If medical teams are concentrated at the front end of the admission, then those same staffcannot also perform the essential tasks of preparing patients for discharge (Black andPearson, 2002). As a result, medical staff have less time in the wards to consolidate withpatients, often leading to inefficiencies during the discharge process. The consequences ofdelayed discharge from the wards is emphasised in section 2.5, which highlight the desireto determine nurse staffing levels efficiently and cost-effectively. This would ensure thata sufficient level of staff is available to consolidate with patients and family membersduring the discharge process, thus ensuring that patients are discharged from the wardsin a timely manner.
One approach that could be used to achieve optimal staffing levels is utilised in thepaper of Kortbeek et al. (2015), where a generic analytical approach is constructed thatminimises the staffing levels, whilst also maintaining the required nurse-to-patient ratios.This approach is derived from hourly bed census predictions in the wards. Accordingto Burger (2011), staffing levels are determined based on predictions of the bed census,which is the number of patients present at a ward at a certain time. Based on thisprediction, Kortbeek et al. (2015) utilises a stochastic programming model to obtain theoptimal staffing levels in the wards. The output of our DES model is a prediction of thebed occupancy in the wards per hour, i.e. an hourly bed census prediction of the wards.Thus, expanding on the stochastic programming approach of Kortbeek et al. (2015) wouldensure that optimal staffing levels are achieved within the wards of the HagaZiekenhuis, sothat the expenditures on staffing levels are minimised whilst ensuring that a sufficient levelof staff are present in the wards to consolidate with patients. This approach consists of acombination of both simulation and optimisation, which is often referred to as simulationoptimisation. The objective of simulation optimisation, according to Carson and Maria(1997), is to minimise the use of resources while maximising the information obtainedfrom the simulation experiment. The use of simulation optimisation prevents excludingmany complexities that are involved when modelling hospital wards, whilst also obtainingan optimal use of resources.
43
References
American Board of Surgery (2015). Specialty of General Surgery Defined [Online]. Avail-
able at: http://www.absurgery.org/default.jsp?aboutsurgerydefined (Ac-
cessed: August 7, 2015).
American College of Physicians (2015). Pulmonology [Online]. Available at: https :
/ / www . acponline . org / patients _ families / about _ internal _ medicine /
subspecialties/pulmonology/ (Accessed: August 23, 2015).
Bachouch, R. B., Guinet, A., and Hajri-Gabouj, S. (2012). “An integer linear model
for hospital bed planning”. International Journal of Production Economics 140(2),
pp. 833–843.
Bekker, R. and de Bruin, A. (2010). “Time-dependent analysis for refused admissions in
clinical wards”. Annals of Operations Research 178(1), pp. 45–65.
Belien, J. and Demeulemeester, E. (2007). “Building cyclic master surgery schedules with
leveled resulting bed occupancy”. European Journal of Operational Research 176(2),
pp. 1185–1204.
Black, D. and Pearson, M. (2002). “Average length of stay, delayed discharge, and hospital
congestion: A combination of medical and managerial skills is needed to solve the
problem”. BMJ: British Medical Journal 325(7365), p. 610.
Blake, J. T., Dexter, F., and Donald, J. (2002). “Operating room managers’ use of integer
programming for assigning block time to surgical groups: a case study”. Anesthesia
& Analgesia 94(1), pp. 143–148.
Borgman, N. (2012). “Organizing acute care: logistic optimization of an integrated emer-
gency post using discrete event simulation”. Master’s Thesis. University of Twente.
Brailsford, S. and Hilton, N. (2001). “A comparison of discrete event simulation and
system dynamics for modelling healthcare systems”. In: In: Riley J (ed). Proceedings
of ORAHS 2000. Citeseer.
44

Burger, C. (2011). “Flexible nurse staffing: Determining staffing levels for nursing wards
in the AMC”. Master’s Thesis. University of Twente.
Carson, Y. and Maria, A. (1997). “Simulation optimization: methods and applications”.
In: Proceedings of the 29th conference on Winter simulation. IEEE Computer Society,
pp. 118–126.
De Bruin, A. et al. (2010). “Dimensioning hospital wards using the Erlang loss model”.
Annals of Operations Research 178(1), pp. 23–43.
European Federation of Internal Medicine (2015). What is Internal Medicine? [Online].
Available at: http://www.efim.org/about/what-internal-medicine (Accessed:
August 20, 2015).
Faddy, M., Graves, N., and Pettitt, A. (2009). “Modeling Length of Stay in Hospital
and Other Right Skewed Data: Comparison of Phase-Type, Gamma and Log-Normal
Distributions”. Value in Health 12(2), pp. 309–314.
Fletcher, A. et al. (2007). “The DH accident and emergency department model. A na-
tional generic model used locally”. Journal of the Operational Research Society 58(12),
pp. 1554–1562.
Ganguly, S., Lawrence, S., and Prather, M. (2014). “Emergency Department Staff Plan-
ning to Improve Patient Care and Reduce Costs”. Decision Sciences 45(1), pp. 115–
145.
Gnanlet, A. and Gilland, W. G. (2009). “Sequential and simultaneous decision making for
optimizing health care resource flexibilities”. Decision Sciences 40(2), pp. 295–326.
Holm, L. B., Luras, H., and Dahl, F. A. (2013). “Improving hospital bed utilisation
through simulation and optimisation: with application to a 40% increase in patient
volume in a Norwegian General Hospital”. International journal of medical informatics
82(2), pp. 80–89.
Hooijsma, A. (2012). “Insights in the effects of an admissions schedule on the wards”.
Master’s Thesis. University of Twente.
Hulshof, P. J. et al. (2012). “Taxonomic classification of planning decisions in health care:
a structured review of the state of the art in OR/MS”. Health systems 1(2), pp. 129–
175.
Jun, J., Jacobson, S., and Swisher, J. (1999). “Application of discrete-event simulation in
health care clinics: A survey”. Journal of the operational research society, pp. 109–123.
Koelling, P. and Schwandt, M. J. (2005). “Health systems: a dynamic system-benefits
from system dynamics”. In: Simulation Conference, 2005 Proceedings of the Winter.
IEEE, 7–pp.
45
Kortbeek, N et al. (2015). “Flexible nurse staffing based on hourly bed census predic-
tions”. International journal of production economics 161, pp. 167–180.
Kortbeek, N. (2012). “Quality-driven efficiency in healthcare”. PhD thesis. University of
Twente.
Kortbeek, N. et al. (2014). “Integral resource capacity planning for inpatient care services
based on bed census predictions by hour”. Journal of the Operational Research Society
66(6), pp. 1–16.
Law, A. M. (2007). Simulation modeling and analysis. McGraw-Hill.
Marazzi, A. et al. (1998). “Fitting the distributions of length of stay by parametric
models”. Medical care 36(6), pp. 915–927.
Mazier, A., Xie, X., and Sarazin, M. (2010). “Scheduling inpatient admission under high
demand of emergency patients”. In: Automation Science and Engineering (CASE),
2010 IEEE Conference on. IEEE, pp. 792–797.
Mustafee, N. et al. (2013). “Implementing a Monte-Carlo simulation on admission deci-
sions”. Journal of Enterprise Information Management 26(1/2), pp. 154–164.
Ridge, J. et al. (1998). “Capacity planning for intensive care units”. European journal of
operational research 105(2), pp. 346–355.
Royal College of Surgeons of England (2015). The Surgical Specialties: 1 - General Surgery
[Online]. Available at: https://www.rcseng.ac.uk/media/media-background-
briefings-and-statistics/the-surgical-specialties-1-general-surgery
(Accessed: August 7, 2015).
Shepperd, S. et al. (2013). “Discharge planning from hospital to home”. Cochrane
Database Syst Rev 1.
Styrborn, K. and Thorslund, M. (1993). “‘Bed-blockers’: Delayed discharge of hospital
patients in a nationwide perspective in Sweden”. Health policy 26(2), pp. 155–170.
University of Rochester Medical Center (2015). What is a Neurologist? [Online]. Avail-
able at: https://www.urmc.rochester.edu/highland/departments-centers/
neurology/what-is-a-neurologist.aspx (Accessed: August 20, 2015).
Van Essen, J. T. et al. (2014). “Reducing the number of required beds by rearranging the
OR-schedule”. OR spectrum 36(3), pp. 585–605.
Vanberkel, P. T. et al. (2009). A survey of health care models that encompass multiple
departments [Online]. Available at: http://eprints.eemcs.utwente.nl/15762/01/
memo1903.pdf (Accessed: July 15, 2015).
Vanberkel, P. T. (2011). Interacting hospital departments and uncertain patient flows:
Theoretical models and applications. University of Twente.
46
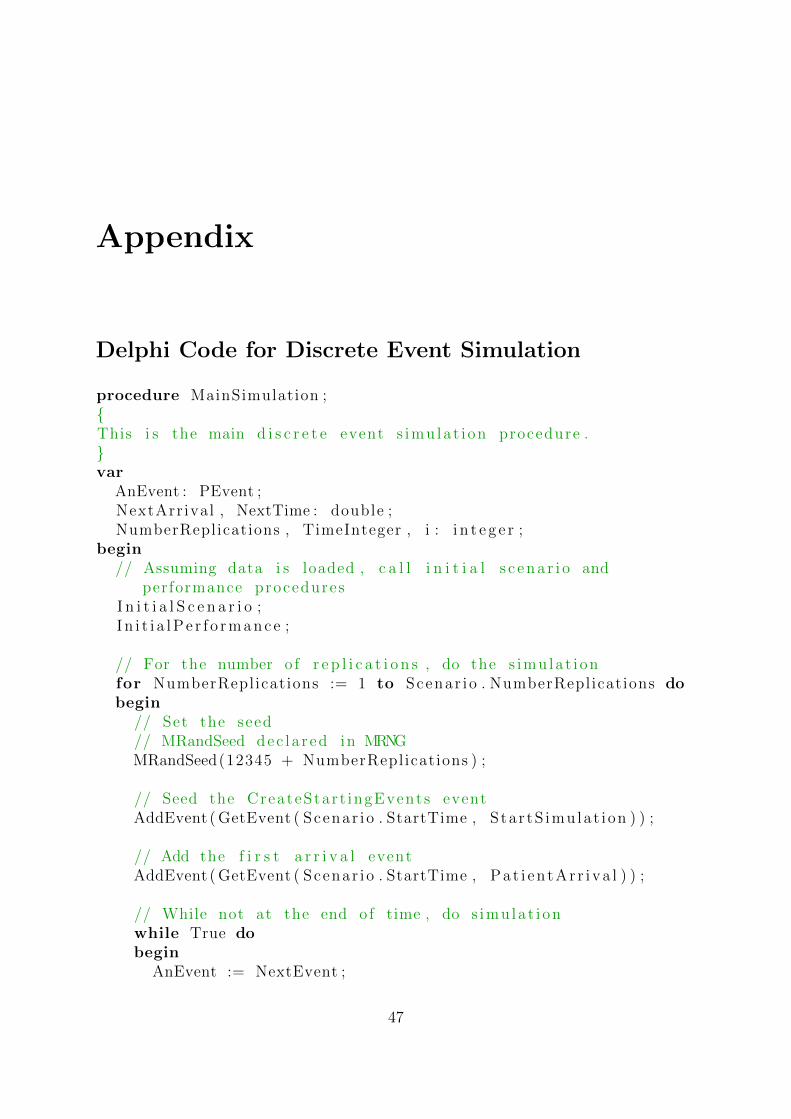
Appendix
Delphi Code for Discrete Event Simulation
procedure MainSimulation ;{This i s the main d i s c r e t e event s imu la t i on procedure .}var
AnEvent : PEvent ;NextArrival , NextTime : double ;NumberReplications , TimeInteger , i : i n t e g e r ;
begin// Assuming data i s loaded , c a l l i n i t i a l s c e n a r i o and
performance proceduresI n i t i a l S c e n a r i o ;I n i t i a l P e r f o r m a n c e ;
// For the number o f r e p l i c a t i o n s , do the s imu la t i onfor NumberReplications := 1 to Scenar io . NumberReplications dobegin
// Set the seed// MRandSeed dec l a r ed in MRNGMRandSeed(12345 + NumberReplications ) ;
// Seed the CreateStart ingEvents eventAddEvent ( GetEvent ( Scenar io . StartTime , Sta r tS imulat i on ) ) ;
// Add the f i r s t a r r i v a l eventAddEvent ( GetEvent ( Scenar io . StartTime , Pa t i en tAr r i va l ) ) ;
// While not at the end o f time , do s imu la t i onwhile True dobegin
AnEvent := NextEvent ;
47

// Temporary checki f ( AnEvent .Time > AnEvent . Next .Time) then
asm int 3end ;
case AnEvent . EventType of
// Star t the s imu la t i onStar tS imula t i on :
begin// Create the seed eventsCreateStart ingEvents ;
end ;
// Stop the s imu la t i onStopSimulat ion :
begin// Save the s imu la t i on dataSaveSimulationData ;// Clear a l l memoryClearSimulat ionData ;// Break the whi le loopbreak ;
end ;
// When a pat i en t a r r i v e sPat i en tAr r i va l :
begin// Check i f the a r r i v a l i s accepted// Account f o r modi f i ed a r r i v a l r a t e in s imu la t i oni f ( CheckArr iva lProbab i l i ty ( AnEvent ) ) thenbegin
// Check the bed occupancyi f ( CheckBedAvai lab i l i ty ) then// I f the re i s space a v a i l a b l e , then beginbegin
// Add a pat i en t to the systemAddPatient ( AnEvent ) ;// Save the a r r i v a l timeMutationOccupancy (AnEvent , Ar r i va l ) ;
endelse// Else , i f the r e i s no space a v a i l ab l e , beginbegin
48
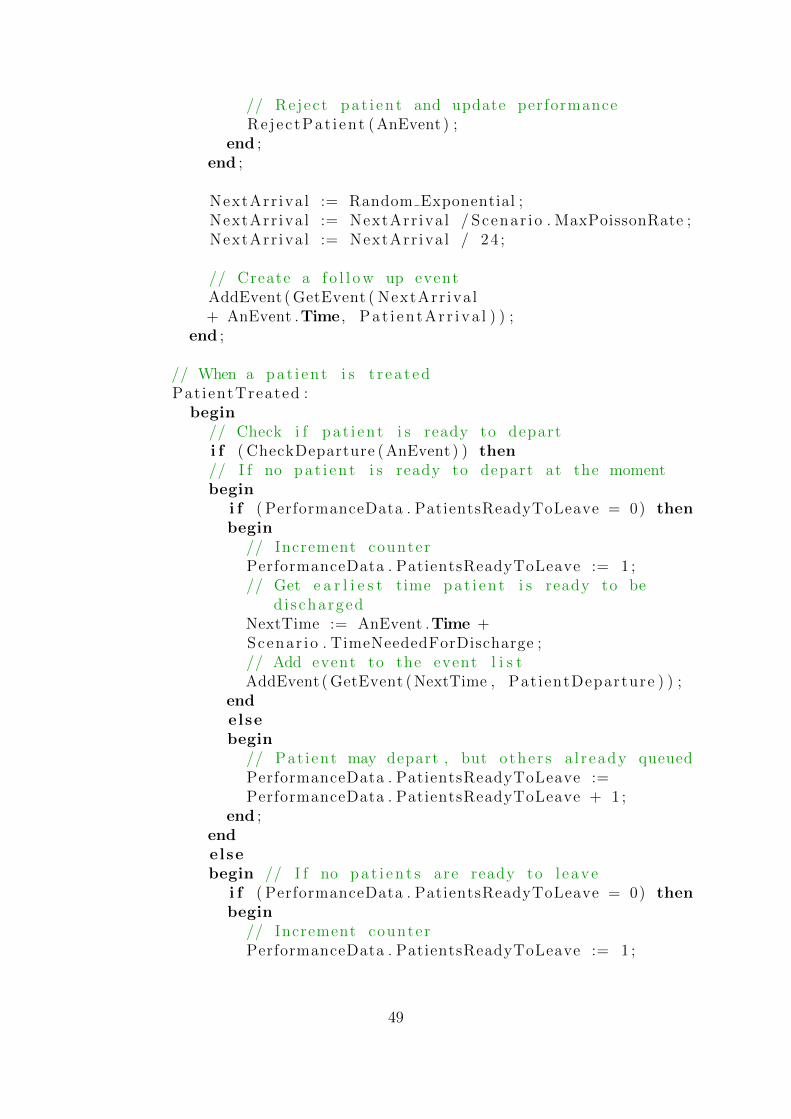
// Reject pa t i en t and update performanceRe jec tPat i ent ( AnEvent ) ;
end ;end ;
NextArr iva l := Random Exponential ;NextArr iva l := NextArr iva l / Scenar io . MaxPoissonRate ;NextArr iva l := NextArr iva l / 24 ;
// Create a f o l l o w up eventAddEvent ( GetEvent ( NextArr iva l+ AnEvent .Time , Pa t i en tAr r i va l ) ) ;
end ;
// When a pat i en t i s t r ea t edPat ientTreated :
begin// Check i f pa t i en t i s ready to departi f ( CheckDeparture ( AnEvent ) ) then// I f no pa t i en t i s ready to depart at the momentbegin
i f ( PerformanceData . PatientsReadyToLeave = 0) thenbegin
// Increment counterPerformanceData . PatientsReadyToLeave := 1 ;// Get e a r l i e s t time pa t i en t i s ready to be
d i schargedNextTime := AnEvent .Time +Scenar io . TimeNeededForDischarge ;// Add event to the event l i s tAddEvent ( GetEvent ( NextTime , Pat ientDeparture ) ) ;
endelsebegin
// Pat ient may depart , but o the r s a l r eady queuedPerformanceData . PatientsReadyToLeave :=PerformanceData . PatientsReadyToLeave + 1 ;
end ;endelsebegin // I f no p a t i e n t s are ready to l eave
i f ( PerformanceData . PatientsReadyToLeave = 0) thenbegin
// Increment counterPerformanceData . PatientsReadyToLeave := 1 ;
49
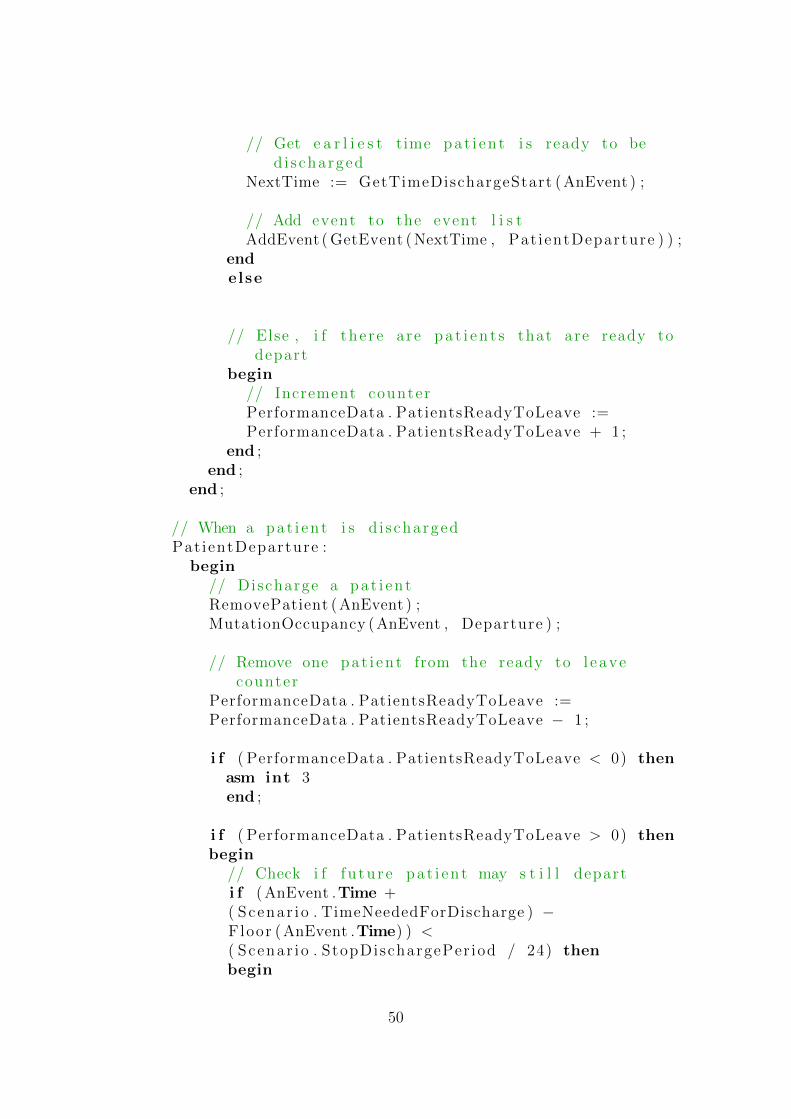
// Get e a r l i e s t time pa t i en t i s ready to bed i scharged
NextTime := GetTimeDischargeStart ( AnEvent ) ;
// Add event to the event l i s tAddEvent ( GetEvent ( NextTime , Pat ientDeparture ) ) ;
endelse
// Else , i f the r e are p a t i e n t s that are ready todepart
begin// Increment counterPerformanceData . PatientsReadyToLeave :=PerformanceData . PatientsReadyToLeave + 1 ;
end ;end ;
end ;
// When a pat i en t i s d i s chargedPat ientDeparture :
begin// Discharge a pa t i en tRemovePatient ( AnEvent ) ;MutationOccupancy (AnEvent , Departure ) ;
// Remove one pa t i en t from the ready to l eavecounter
PerformanceData . PatientsReadyToLeave :=PerformanceData . PatientsReadyToLeave − 1 ;
i f ( PerformanceData . PatientsReadyToLeave < 0) thenasm int 3end ;
i f ( PerformanceData . PatientsReadyToLeave > 0) thenbegin
// Check i f f u tu r e pa t i en t may s t i l l departi f ( AnEvent .Time +( Scenar io . TimeNeededForDischarge ) −Floor ( AnEvent .Time) ) <( Scenar io . StopDischargePer iod / 24) thenbegin
50
AddEvent ( GetEvent ( AnEvent .Time +Scenar io . TimeNeededForDischarge ,Pat ientDeparture ) ) ;
endelse// Else , add event tomorrow at s t a r t o f d i s cha rge
per iodbegin
i f (StrToInt ( FormSimulation . Ed i tStar tDi scharge. Text ) <> 0)
and (StrToInt ( FormSimulation . EditEndDischarge .Text ) <> 0) then
begin// Add event at time today + 1 + s t a r t o f
d i s cha rge per iodAddEvent ( GetEvent ( Floor ( AnEvent .Time) + 1 +( Scenar io . S tar tDi schargePer iod / 24) ,Pat ientDeparture ) ) ;
endelse
for i := TimeInteger toHigh( Scenar io . DischargeTimeArray ) dobegin
i f Scenar io . DischargeTimeArray[ GetIntegerHour ( AnEvent .Time) ] = 1 thenbegin
Scenar io . S tar tDi schargePer iod := i ;break ;
end ;AddEvent ( GetEvent ( GetIntegerHour( AnEvent .Time) +( Scenar io . S tar tDi schargePer iod / 24) ,Pat ientDeparture ) ) ;end ;
end ;end ;
end ;
// Update the performanceUpdatePerformance :
begin// Check the occupat ionPerformanceCheck ( AnEvent ) ;
end ;
51
end ; // End o f case AnEvent . EventType
// Remove eventRemoveEvent ( AnEvent ) ;
end ; // End o f whi l e loop
// Clean up performance data and r e s t a r tI n i t i a l P e r f o r m a n c e ;
end ; // end f o r NumberofRepl icat ions
// Export the output o f the s imu la t i on to a csv f i l eExportSimulationOutput ;
// Export the r e j e c t e d admiss ions data to a csv f i l eExportRejectedAdmissionsData ;
// Dispose o f a l l the de l e t ed eventsClearMemory ( DeletedEventList ) ;
end ;
52
Related Documents