CSR REPORT 2019 Environmental Data Book This book contains supplemental information and data relating to environmental measures for three JFE Group companies, as well as information and data relating to the JFE Group’s recycling business. Please read this book in conjunction with the “JFE Group CSR Report 2019” to gain a more comprehensive understanding of JFE’s environmental initiatives. CONTENTS 01 Scope of Report 02 Organizational Profile JFE Group 03 Status of ISO 14001 Certification / JFE Group’s Environmental Accounting 04 CO 2 Emissions of the JFE Group 05 JFE Group Recycling Businesses 06 JFE Group’s Recycling Business List JFE Steel 07 Material Flow 09 Input Materials / Output Products 10 Recycled Resources / CO 2 Emissions and Energy Consumption 12 Disposed Substances JFE Engineering 22 Input Materials / Output Products 23 CO 2 Emissions and Energy Consumption 24 Technologies to Reduce Environmental Load / Disposed Substances / Management of Chemical Substances 27 Waste Disposal in Each Section and Works JFE Shoji Trade 29 Electricity Consumption and CO 2 Emissions / Input Materials 30 Independent Assurance Statement 31 Comparison with Environmental Reporting Guidelines 2018 (Ministry of the Environment, Japan)

Welcome message from author
This document is posted to help you gain knowledge. Please leave a comment to let me know what you think about it! Share it to your friends and learn new things together.
Transcript

JFE Holdings, Inc.
2-2-3 Uchisaiwaicho, Chiyoda-ku, Tokyo 100-0011, Japanwww.jfe-holdings.co.jp/en
Inquiries:Corporate Planning DepartmentJFE Holdings, Inc.Phone: +81-3-3597-4321Email: [email protected]
CSR REPORT 2019Environmental Data Book
This book contains supplemental information and data relating to environmental measures for three JFE Group companies, as well as information and data relating to the JFE Group’s recycling business. Please read this book in conjunction with the “JFE Group CSR Report 2019” to gain a more comprehensive understanding of JFE’s environmental initiatives.
CONTENTS01 Scope of Report02 Organizational Profile
JFE Group
03 Status of ISO 14001 Certification / JFE Group’s Environmental Accounting04 CO2 Emissions of the JFE Group05 JFE Group Recycling Businesses06 JFE Group’s Recycling Business List
JFE Steel
07 Material Flow09 Input Materials / Output Products10 Recycled Resources / CO2 Emissions and Energy Consumption12 Disposed Substances
JFE Engineering
22 Input Materials / Output Products23 CO2 Emissions and Energy Consumption24 Technologies to Reduce Environmental Load / Disposed Substances / Management of Chemical Substances27 Waste Disposal in Each Section and Works
JFE Shoji Trade
29 Electricity Consumption and CO2 Emissions / Input Materials
30 Independent Assurance Statement31 Comparison with Environmental Reporting Guidelines 2018 (Ministry of the Environment, Japan)

Scope of Report Reporting PeriodFY2018 (April 1, 2018 to March 31, 2019)
Organizations Covered1. JFE Holdings, Inc. and its operating companies:
• JFE Steel Corporation• JFE Engineering Corporation• JFE Shoji Trade Corporation
2. The following items include data from “Major consolidated subsidiaries and equity-method affiliates included in the Scope of Reporting” listed below.Environmental data aggregation scope• Status of ISO 14001 certification• CO2 emissions• Energy consumption (JFE Steel Group, JFE Engineering Group)• SOx, NOx emissions (JFE Steel Group)• Amount of industrial water received (JFE Steel Group)• Water Consumption (JFE Engineering Group)• COD (JFE Steel Group, JFE Engineering Group)• Release or Transfer of PRTR-registered Substances (JFE Steel Group)• VOC emissions (JFE Steel Group)
• JFE Steel GroupJFE Steel Corporation and 30 consolidated subsidiaries (total: 31 companies)
25 domestic companiesJFE MINERAL COMPANY, LTD., Mizushima Ferroalloy Co., Ltd., JFE Material Co., Ltd., CHIBA RIVERMENT AND CEMENT CORP., MIZUSHIMA RIVERMENT CORP., JFE PRECISION CORPORATION, JFE Plastic Resource Corporation, JFE Bars & Shapes Corporation, JFE Metal Products & Engineering Inc., JFE Galvanizing & Coating Co., Ltd., JFE Container Co., Ltd., JFE Welded Pipe Manufacturing Co., Ltd., JFE Steel Pipe Co., Ltd., Galvatex Corporation, JFE Pipe Fitting Mfg. Co., Ltd., JFE Techno-wire Corporation, JFE Kozai Corporation, JFE LOGISTICS CORPORATION, JFE Chemical Corporation, JFE LIFE CORPORATION, GECOSS CORPORATION, JFE ROCKFIBER CORPORATION, JFE KENZAI FENCE CO., LTD., J-Logitec Co., Ltd., K-PLASHEET CORPORATION5 overseas companiesNova Era Silicon, JFE Steel Galvanizing (Thailand) Ltd., Thai Coated Steel Sheet Co., Ltd., Philippine Sinter Corporation, PT.JFE STEEL GALVANIZING INDONESIA
• JFE Engineering GroupJFE Engineering Corporation and 10 domestic consolidated subsidiaries (total: 11 companies)
J&T Recycling Corporation, JFE Environment Service Corporation, NORTHERN JAPAN MACHINERY Corporation, Tohoku Dock Ironworks Corporation, JFE AQUA MACHINE AND SERVICE Corporation, Fujikako, Inc., Asuka Soken Co., Ltd., JFE Pipeline Engineering Corporation, JFE Technos Corporation, J Farm Corporation
• JFE Shoji Trade GroupJFE Shoji Trade Corporation and the following 33 domestic and overseas consolidated subsidiaries (steel-processing companies) (total: 34 companies)
19 domestic subsidiariesJFE Shoji Electrical Steel Co., Ltd.* JFE Shoji Coil Center Corporation, JFE Shoji Kohnan Steel Center Co., Ltd., JFE Shoji Tinplate Center Corporation, Aichi Kanzai Kogyo Corporation, Kyusyu-Tech Corporation, JFE Shoji Kohnan Steel Center Co., Ltd. Shin Nihon Kogyo Corporation, Taisei Kogyo Corporation, Toyo Kinzoku Corporation, Tochigi Shearing Corporation, Naigai Steel Corporation, Nagano Can Corporation, Niigata Steel Corporation, Nihon Jiseizai Kogyo Co., Ltd., Hokuriku Kogyo Corporation, Hokuriku Steel Co., Ltd., Mizushima Steel Corporation, Mizushima Metal Products Corporation*The data was collected as JFE Steel Group before FY2016.14 overseas subsidiariesDongguan JFE Shoji Steel Products Co., Ltd., Guangzhou JFE Shoji Steel Products Co., Ltd., Zhejiang JFE Shoji Steel Products Co., Ltd., Jiangsu JFE Shoji Steel Products Co., Ltd., JFE SHOJI STEEL PHILIPPINES, INC., CENTRAL METALS (THAILAND) LTD., STEEL ALLIANCCE SERVICE CENTER CO., LTD., JFE SHOJI STEEL VIETNAM CO., LTD., JFE SHOJI STEEL HAI PHONG CO., LTD., JFE SHOJI STEEL MALAYSIA SDN. BHD., PT. JFE SHOJI STEEL INDONESIA, JFE SHOJI STEEL INDIA PRIVATE LIMITED, VEST INC., JFE SHOJI STEEL DE MEXICO, S.A. DE C.V.
01 JFE Group CSR REPORT 2019 Environmental Data Book

Organizational Profile
JFE Steel Corporation
• Head office: 2-2-3 Uchisaiwaicho, Chiyoda-ku, Tokyo 100-0011• Phone: +81-3-3597-3111• Net sales (consolidated): 2,830.6 billion yen• Employees (consolidated): 44,975
East Japan Works (Chiba District)1 Kawasaki-cho, Chuo-ku, Chiba-shi, Chiba 260-0835Phone: +81-43-262-2024 Fax: +81-43-262-2967
• Main businessProduction of hot rolled sheets and strips, cold rolled sheets and strips, stainless steel sheets and strips, coated sheets, UOE pipes, iron powders and solvents.
Main Works
West Japan Works (Kurashiki District)1 Mizushima Kawasaki-dori, Kurashiki-shi, Okayama 721-8511Phone : +81-86-447-2020 (main) +81-86-447-2102 (visitor center reception desk) Fax : +81-86-447-2131
• Main businessProduction of hot rolled sheets, cold rolled sheets, coated sheets, electrical sheets, plates, sheet piles, H-shapes, rails, bars, wire rods and UOE pipes.
East Japan Works (Keihin District)1-1 Ohgishima, Kawasaki-ku, Kawasaki-shi, Kanagawa 210-0868Phone: +81-44-322-1111 (main) Fax: +81-44-322-1500
• Main businessProduction of plates, hot rolled sheets, cold rolled sheets, galvanized steel sheets, high-performance steel sheets, seamless steel pipes and welded steel pipes.
West Japan Works (Fukuyama District)1 Kokan-cho, Fukuyama-shi, Hiroshima 721-8510Phone: +81-84-945-3118 Fax: +81-84-945-3808
• Main businessProduction of hot rolled sheets, cold rolled sheets, coated sheets, electrical sheets, plates, sheet piles, H-shapes, rails, bars, wire rods and UOE pipes.
Chita Works1-1 Kawasaki-cho, Handa-shi, Aichi 475-8611Phone (for general): +81-569-24-2101 Fax: +81-569-24-2035
• Main businessProduction of machine structural steel pipes, automotive steel pipes, material pipes, general structural steel pipes and steel pipes for plumbing.
Sendai Works1-6-1 Minato Miyagino-ku, Sendai-shi, Miyagi 983-0001Phone: +81-22-258-5511 Fax: +81-22-258-5540
• Main businessProduction of bars (rounds and bars in coil), wire rods and other products.
■ JFE Steel
JFE Engineering Corporation
• Tokyo head office: Marunouchi Trust Tower North 19F, 1-8-1 Marunouchi, Chiyoda-ku, Tokyo 100-0005• Phone: +81-3-6212-0800 (main) Fax: +81-3-6212-0802• Yokohama head office: 2-1, Suehiro-cho, Tsurumi-ku, Yokohama-shi, Kanagawa 230-8611• Phone: +81-45-505-7435 (main) Fax: +81-45-505-8902 Phone: +81-45-505-8953 (PR)• Net sales (consolidated): 485.8 billion yen• Employees (consolidated): 9,569
Tsurumi Engineering and Manufacturing Center2-1 Suehiro-cho, Tsurumi-ku, Yokohama, Kanagawa 230-8611Phone: +81-45-505-7435 Fax: +81-45-505-8902
• Main businessProduction of engines, shield tunneling machines, boilers and turbines, water facilities.
Main Works
Tsu Works1 Kumozu-kokan-cho, Tsu-shi, Mie 514-0393Phone: +81-59-246-2010 Fax: +81-59-246-2792
• Main businessProduction of steel structures such as bridges, harbor structures and building steel frames.
■ JFE Engineering
JFE Shoji Trade Corporation
• Tokyo head office: Otemachi Financial City North Tower, 1-9-5 Otemachi, Chiyoda-ku, Tokyo 100-8070• Phone: +81-3-5203-5053 Fax: +81-3-5203-5289• Osaka head office: Dojima Avanza, 1-6-20, Dojima, Kita-ku, Osaka-shi, Osaka 530-8318• Phone: +81-6-4795-7000 Fax: +81-6-4795-7400• Net sales (consolidated): 1,125.8 billion yen• Employees (consolidated): 7,498
■ JFE Shoji Trade
Starting with the fiscal year under review, the JFE Group is now reporting under the International Financial Reporting Standards (IFRS) instead of the Japanese Generally Accepted Accounting Principles (JGAAP).
02JFE Group CSR REPORT 2019 Environmental Data Book

◦Environmental Accounting
1990 20000
29.3
323.5
2014 2015 2016 2018
505.4
2017
452.8 466.2 492.9474.9(Billions of yen)
(FY)
300
200
100
400
500
1973 1990 2000
455.1
22.6
383.5
0 2014 2015 2016 2018
708.5
2017
613.4 634.0692.4668.5
(Billions of yen)
(FY)
400
200
600
800
Status of ISO 14001 Certification
JFE Group’s Environmental Accounting
JFE Group
All JFE Steel and JFE Engineering production sites and JFE Shoji Trade domestic business offices have received certification. The status of certification for Group companies are as follows.
List of ISO 14001 Certified Companies (includes certification limited to certain sites of a company)
JFE Steel Corporation
JFE MINERAL COMPANY, LTD. JFE LOGISTICS CORPORATION
Mizushima Ferroalloy Co., Ltd. JFE Techno-Research Corporation (JFE-TEC)*1
JFE Material Co., Ltd. JFE Chemical Corp.
JFE Plastic Resource Corporation JFE Metal Construction Inc.*1
JFE Bars & Shapes Corporation JFE KYOWA YOKI CO. LTD*1
JFE Galvanizing & Coating Co., Ltd. Japan Pail Corporation*1
JFE Container Co., Ltd. JFE SETOUCHI LOGISTICS CORPORATION*1
JFE Welded Pipe Manufacturing Co., Ltd. Guangzhou JFE Steel Sheet Co., Ltd.*2
JFE Pipe Fitting Mfg. Co., Ltd. Thai Coated Steel Sheet Co., Ltd.
DAIWA KOHTAI CO. Ltd*1 Philippine Sinter Corporation
JFE Plant Engineering Co., Ltd.*1
JFE Engineering CorporationJ&T Recycling Corporation Fujikako, Inc.
JFE Aqua Machine and Service Corporation*1 Asuka Soken Co., Ltd.
JFE Shoji Trade Corporation
JFE Shoji Coil Center Corporation JFE Shoji Trade Matech Inc.*1
JFE Shoji Kohnan Steel Center Co., Ltd. Kawasho Foods Corporation*1
Taisei Kogyo Corporation K&I Tubular Corporation*1
Toyo Kinzoku Corporation Tohsen Corporation*1
Naigai Steel Corporation Hoshi Kinzoku Corporation*1
Nihon Jiseizai Kogyo Co., Ltd. Dongguan JFE Shoji Steel Products Co., Ltd.
Hokuriku Steel Co., Ltd. Guangzhou JFE Shoji Steel Products Co., Ltd.
Mizushima Steel Corporation Jiangsu JFE Shoji Steel Products Co., Ltd.
Mizushima Metal Products Corporation Zhejiang JFE Shoji Steel Products Co., Ltd.
JFE Shoji Electrical Steel Co., LTD. JFE SHOJI STEEL PHILIPPINES, INC.
JFE Shoji Usuitakenzai Corporation*1 CENTRAL METALS (Thailand) Ltd.
JFE Shoji Electronics Corporation*1 JFE SHOJI STEEL VIETNAM CO., LTD.
JFE Shoji Pipe & Fitting Trade Corporation*1 JFE SHOJI STEEL HAI PHONG CO., LTD.
JFE Shoji Service Corporation*1 JFE SHOJI STEEL MALAYSIA SDN. BHD.
JFE Shoji Machinery & Materials Corporation*1 PT. JFE SHOJI STEEL INDONESIA
JFE Shoji Trade Steel Construction Materials Corporation*1 JFE SHOJI STEEL DE MEXICO, S.A. DE C.V.
JFE Shoji Terre One Corporation*1 JFE SHOJI STEEL INDIA PVT. LTD.
JFE Shoji Business Support, Inc.*1
*1 Outside the scope of environmental data aggregation *2 Equity method affiliates
Cumulative Investment in Energy Saving Cumulative Investment in Environmental Preservation Measures
03 JFE Group CSR REPORT 2019 Environmental Data Book
JFE S
teelJFE
Sh
oji Trad
eJFE
En
gin
eering
JFE G
rou
p
JFE Group

2014 2015 2016 2017
61.2
6.4
54.8
62.263.2 61.2
6.6
54.6
7.4
54.9
2018
59.6
7.5
52.1
0
40
20
60
80
(Million t-CO2)
(FY)
■ Scope 1 ■ Scope 2
CO2 Emissions of the JFE Group CO2 Emissions of the JFE Group (FY2018)
CO2 Emissions of the JFE Group
JFE Steel JFE Engineering JFE Shoji Trade
59,357 thousand t-CO2 212 thousand t-CO2 36 thousand t-CO2
99.58% 0.36% 0.06%
Breakdown of Environmental Costs
Note: Data cover all investment activities of JFE Steel Corporation and R&D activities of JFE Engineering Corporation.
Main ItemsFY2017 FY2018
Investment (billion yen)
Cost (billion yen)
Investment (billion yen)
Cost (billion yen)
Management Impact monitoring and measurement, and EMS expenses and education 0.2 2.5 0.3 2.7
Global warming countermeasures Saving and efficiently use energy 18.0 27.8 12.4 28.6
Conservation of natural resources
Recycling industrial water 2.8 17.1 2.4 17.8
Recycling and waste management of internally generated materials, etc. 0.09 5.3 1.77 4.8
Environmental protection
Air pollution countermeasures 19.1 35.6 9.9 31.6
Water pollution countermeasures 1.6 9.2 1.8 10.0
Prevention of soil contamination, noise, vibration and subsidences 0.02 0.7 0.00 0.6
Other Charges, etc. – 1.4 – 1.6
R&D Technologies for protecting the environment, saving energy and preventing global warming 1.4 11.7 1.2 12.9
Societal activities Support for nature preservation and forestation, information disclosure, exhibitions and public relations – 0.7 – 0.7
Total 43.3 112.1 29.8 111.3
CO2 Emission Factor for Purchased Electricity in FY2018
• JFE Steel uses the emission factor of the Commitment to a Low Carbon Society of the Japan Iron and Steel Federation for energy purchased in FY2017.
• JFE Steel’s domestic consolidated subsidiaries, the JFE Engineering Group, and the JFE Shoji Trade Group apply the adjusted emission factors of each electric power company for each fiscal year.
• Overseas: based on each country’s GHG protocol
Notes: Data for JFE Steel include CO2 emissions from non-energy sources. Starting with FY2018, data for JFE Steel’s subsidiaries and JFE Engineering’s subsidiary include CO2 emissions from non-energy sources.
Data cover 76 companies, including JFE Steel and 30 major domestic and overseas subsidiaries, JFE Engineering and 10 major domestic subsidiaries, and JFE Shoji Trade and 33 major domestic and overseas subsidiaries.
Scope 3 Emissions of the JFE Group
Coverage: (Categories 1, 2, 3, 4, 5) JFE Steel, 25 JFE Steel domestic subsidiaries, JFE Engineering, and JFE Shoji Trade (Category 6, 7) JFE Steel, 25 JFE Steel domestic subsidiaries, JFE Engineering, 10 JFE Engineering domestic subsidiaries, and JFE Shoji Trade (Category 15) Japan Marine United, and 9 JFE Steel equity-method affiliates (7 domestic and 2 overseas)*Sources: Green Value Chain Platform (Ministry of the Environment) and others
CategoryCO2 Emissions (Thousand t-CO2)
Calculation MethodFY2018
1 Purchased goods and services 13,371 Purchase prices for materials and outsourced work multiplied by CO2 emission factor*
2 Capital goods 1,180 Capital investment cost multiplied by CO2 emission factor*
3 Fuel- and energy-related activities not included in Scope 1 or Scope 2 370 Annual consumption of electricity and steam multiplied by CO2
emission factor*
4 Upstream transportation and delivery 491 Transportation distance stated in reports (based on Energy Saving Act) multiplied by CO2 emission factor*
5 Waste generated in operations 100 Waste volume (by type) multiplied by CO2 emission factor*
6 Business travel 4 Number of employees multiplied by CO2 emission factor*
7 Employee commuting 49 Number of employees multiplied by CO2 emission factor*
15 Investments 1,186Emissions from companies of which more than 20% of their stock is held by the Group, and which are accountable under the Energy Saving Act, multiplied by the stock holding ratio
04JFE Group CSR REPORT 2019 Environmental Data Book
JFE S
teelJFE
Sh
oji Trad
eJFE
En
gin
eering
JFE G
rou
p

Toyama• Rare metal recovery plant for spent catalysts
Kashima• Electric furnace recycling plant
Kurashiki (Mizushima)• Waste gasifying and melting furnace• Waste wood carbonizing facility• Electric furnace recycling plant
Fukuyama• Waste plastic recycling plant• RPF manufacturing plant• Fukuyama plastic material recycling plant• Recycled pallet manufacturing plant• Kiln incinerator• Leachate-controlled landfill• Liquid waste neutralization plant• Refuse-derived fuel (RDF) gasifying power
generation plant (commissioned operation)
Sendai• Plastic packaging-waste sorting and baling plant• Plastic material recycling plant• Fluorescent tube recycling plant• Recycled pallet manufacturing plant• Confidential document disposal plant• Refuse paper and plastic (RPF) manufacturing
plant
Sapporo• Food waste recycling plant
Yokohama• Kiln-stoker incinerator• Kiln-ash melting furnace• Liquid/sludge waste intermediate-treatment plant• Dry cell and battery recycling plant• Solid waste recycling plant• Fluorescent tube recycling plant• Plastic packaging-waste sorting and baling plant• Food waste recycling plant
Chiba• Waste gasifying and melting furnace• Food waste recycling plant
Tokyo• Fluidized bed gasification and melting furnace• Vertical furnace
Kawasaki• Waste plastic recycling plants (Ogishima & Mizue)• Waste PET bottle recycling plant• Kiln-stoker incinerator• Solid waste recycling plant• NF Board™ manufacturing plant• Consumer/office appliance recycling plant
JFE Group Recycling Businesses
Examples of Recycling and Processing (FY2018)
Content Volume
Containers and packaging plastic bought at auction for FY2019 0.10 million tonnes
Waste plastic reused in iron and steelmaking process 0.12 million tonnes
Used fluorescent tubes processed 20 million tubes
Used consumer appliances processed 0.50 million units
Directly used in the iron and steelmaking process: 50 thousand tonnes Recovered gas used as fuel in steelworks: 70 thousand tonnes
05 JFE Group CSR REPORT 2019 Environmental Data Book
JFE S
teelJFE
Sh
oji Trad
eJFE
En
gin
eering
JFE G
rou
p
JFE Group

District Name of the Companies, Plants and Offices Facilities Addresses
Sapporo Sapporo Bio Food Recycle Corporation Food waste recycling plant 45-53 Nakanuma-cho, Higashi-ku, Sapporo-shi, Hokkaido
Sendai
J&T Recycling Corporation Sendai Plant
Rifu Plant
Sendai City plastic packaging waste sorting and baling plantPlastic material recycling plantFluorescent tube recycling plantRecycled pallet manufacturing plantConfidential document disposal plantRPF manufacturing plant
1-6-1 Minato, Miyagino-ku, Sendai-shi, MiyagiSame as aboveSame as aboveSame as aboveSame as above6-5-14 Shirakashi-dai, Rifu-cho, Miyagi-gun, Miyagi
KashimaJFE Bars & Shapes Corporation Electric furnace recycling plant
DC electric arc furnace 7 Minamihama, Kamisu-shi, Ibaraki
ChibaJ&T Recycling Corporation Chiba Recycling Center Chiba Biogas Center
Waste gasifying and melting furnace Food waste recycling plant
1 Kawasaki-cho, Chuo-ku, Chiba-shi, Chiba Same as above
TokyoJ&T Recycling Corporation Tokyo Waterfront Eco Clean Fluidized bed gasification and melting furnace for industrial waste
Vertical furnace for medical wasteOumi 3-chome chisaki, Koto-ku, Tokyo, JapanSame as above
Kawasaki
J&T Recycling Corporation Ohgishima Recycling Plant Kawasaki PET Bottle Recycling Plant Kawasaki Eco Clean
Waste plastic recycling plantWaste PET bottle recycling plantKiln-stoker type incineratorSolid waste recycling plant
10 Ohgishima, Kawasaki-ku, Kawasaki-shi, Kanagawa5-1 Mizue-cho, Kawasaki-ku, Kawasaki-shi, Kanagawa5-73 Ohgi-machi, Kawasaki-ku, Kawasaki-shi, Kanagawa, and othersSame as above
JFE Plastic Resource Corporation Mizue recycling plant NF Board™ plant
Waste plastic recycling plantNF Board™ manufacturing plant
699-23 Mizue-cho, Kawasaki-ku, Kawasaki-shi, Kanagawa, and others5-1 Mizue-cho, Kawasaki-ku, Kawasaki-shi, Kanagawa
JFE URBAN RECYCLE CORPORATION Home Appliance Recycling Plant Consumer/office appliance recycling plant 6-1 Mizue-cho, Kawasaki-ku, Kawasaki-shi, Kanagawa
Yokohama
J&T Recycling Corporation Yokohama Eco Clean (Incinerator)
Chemical works
Tsurumi fluorescent light recycling plant Yokohama Plastics Recycling Plant Kanazawa Recycling Plant
Kiln-stoker incineratorKiln-ash melting furnaceLiquid/sludge waste intermediate treatment plantDry-cell and battery recycling plantFluorescent tube recycling plantYokohama City plastic packaging waste sorting and baling plantSolid waste recycling plant
2-1-5 Suehiro-cho, Tsurumi-ku, Yokohama-shi, Kanagawa, and othersSame as above3-1 Benten-cho, Tsurumi-ku, Yokohama-shi, Kanagawa2-1-8 Suehiro-cho, Tsurumi-ku, Yokohama-shi, KanagawaSame as aboveSame as above1-14-5 Fukuura, Kanazawa-ku, Yokohama-shi, Kanagawa
J Bio Food Recycle Co., Ltd Yokohama Recycle Plant Food waste recycling facility 2-1-5 Suehiro-cho, Tsurumi-ku, Yokohama-shi, Kanagawa
Kurashiki (Mizushima)
Mizushima Eco-Works Co., Ltd. Waste gasifying and melting furnace 1-14-5 Mizushimakawasaki-dori, Kurashiki-shi, Okayama
JFE Environmental Service Corporation Kurashiki Plant Waste wood carbonization plant 1-14-1 Mizushimakawasaki-dori, Kurashiki-shi, Okayama
JFE Bars & Shapes Corporation Electric-furnace recycling plantDC electric arc furnace 1-5-2 Mizushimakawasaki-dori, Kurashiki-shi, Okayama, and others
Fukuyama
JFE Plastic Resource Corporation Fukuyama recycling plant Waste plastic recycling plant 113 Minoki-cho, Fukuyama-shi, Hiroshima
J&T Recycling Corporation Fukuyama RPF Plant Fukuyama PM Recycling Plant Fukuyama Recycled Pallet Plant Fukuyama Incinerator
RPF manufacturing plantPlastic material recycling plantRecycled pallet manufacturing plantKiln incineratorLeachate-controlled landfillLiquid waste neutralization plant
115-1 Minoki-cho, Fukuyama-shi, Hiroshima Same as aboveSame as above1 Kokan-cho, Fukuyama-shi, HiroshimaSame as aboveSame as above
Fukuyama Recycle Power Co., Ltd. Refuse-derived fuel (RDF) gasifying power generation plant (commissioned operation)
107-8 Minoki-cho, Fukuyama-shi, Hiroshima
Toyama JFE Material Corporation Rare metal recovery plant for spent catalysts 2-9-38 Shosei-machi, Imizu-shi, Toyama
JFE Group’s Recycling Business List
JFE Group’s Recycling Business List
06JFE Group CSR REPORT 2019 Environmental Data Book
JFE S
teelJFE
Sh
oji Trad
eJFE
En
gin
eering
JFE G
rou
p

Water recycled
93.5% 3,158 million tonnes
Blast furnace
BF gas
BOF and CC
BOF gas
JFE Group Recycling Processes
Coke oven and sintering plant
Coke oven gas
Recycled
39.3%6.0 million tonnes
Material Flow
Purchased energy
119.6 PJ
• Petroleum-based fuels: 20.9 PJ• Electric power: 98.7 PJ
Industrial water
218 million tonnes
Raw materials for steel production
66.0 million tonnes
• Iron ore: 40.1 million tonnes• Coal: 20.6 million tonnes• Lime: 5.3 million tonnes
Input
JFE Steel
Recycled materials• Steel scrap
1.3 million tonnes
• Waste plastics• Waste PET bottles• Used consumer appliances• Food waste• Used batteries• Dust, sludge, etc.
• Steel scrap (basic oxygen furnace, or BOF)
CO2
• Scope 1
48.9 million tonnes CO2
Total CO2 emissions from energy and non-energy sources
• Scope 2
6.1 million tonnes CO2
Flue gas• SOx
4.1 million Nm3
• NOx
10.5 million Nm3
• Soot and dust
Chemical substances (PRTR)• Released
545 tonnes
• Transferred
2,533 tonnes
Greenhouse gases emitted during transportation (domestic distribution)
• CO2
0.40milliontonnes CO2
Landfill
0.052 million tonnes
07 JFE Group CSR REPORT 2019 Environmental Data Book
JFE S
teelJFE
Sh
oji Trad
eJFE
En
gin
eering
JFE G
rou
p
JFE Steel

Recycled products• NF Board™• PET flakes• Palettes• Recycled resin
Co
mm
un
ity, En
viron
men
t and
So
ciety
Output
Other products• Chemicals• Oxygen• Nitrogen• Hydrogen• Argon
Steel products
26.3 million tonnes(crude steel base)
Energy supply
39.1%
• Power• Fuel gas• Steam
Marine and land civil engineering materials
9.2 million tonnes
• Materials for cement• Roadbed materials• Port and harbor construction
materials• Fertilizer
Reheat furnace Rolling Shipments
Supplied to society
39.1%
Consumed by JFE Steel
60.9%
Effective use of recovered energy
100%
Landfill
0.3%
Output
6.5%
Total water consumption
3,376million tonnes
JFE Steel works to reduce the environmental impact of its iron and steelmaking processes, including through the effective use of resources. The company recycles 93.5% of the water it uses for production and uses 99.7% of its co-products, such as iron-steel slag. In addition, 100% of co-product gas generated during production is reused as fuel for reheating slabs, generating power for internal use and supplying power to the public.
Wastewater
126 million tonnes
3.7 %Evaporation loss
92 million tonnes
2.7 %Recovered energy
for recycling• Byproduct gas• Waste heat recovery
steam• Power generation by
blast furnace (BF) top gas-pressure recovery turbine (TRT)
Effective use of Co-products
99.7%
Supplied to Society
60.4%
Co-products
15.3million tonnes
Slag: 12.4 million tonnesDust: 2.0 million tonnesSludge: 0.7 million tonnesOther: 0.2 million tonnes
Supply Emissions
08JFE Group CSR REPORT 2019 Environmental Data Book
JFE S
teelJFE
Sh
oji Trad
eJFE
En
gin
eering
JFE G
rou
p

Materials for Steel Production
20152014 2016
69
43
206
2018
71
44
226
2017
70
44
216
72
45
216
66
40
215
0
40
20
60
80
100
(Million tonnes)
(FY)
■ Iron ore ■ Coal ■ Lime
Industrial Water
203208220212 218
20152014 2016 2017 20180
150
100
50
200
250
(Million tonnes)
(FY)
Purchased Energy (Electricity and Petroleum-based Energies)
20152014 2016 2017
112
2018
112113
2020
114
21
92 91 93
120
21
99
0
50
100
150
(PJ)
(FY)
■ Electricity ■ Petroleum-based energies
Steel Products Energy Supply Rate for Recovered Energy
28.4 27.4 28.1 28.526.3
2014 2015 2016 2017 20180
20
10
30
40
(Million tonnes)
(FY)
3734 35 35
39
2014 2015 2016 2017 20180
20
10
30
40
(%)
(FY)
Marine & Land Civil Engineering Materials (Usage from Co-products)
15.211.0
72.272.3 75.1
14.611.0
74.3
14.510.8
15.4
11.2
60.415.3
9.2
2014 2015 2016 2017 20180
10
5
15
20
0
40
20
60
80
(Million tonnes) (%)
(FY)
■ Generation volume of co-products■ Utilization volume in the community● Utilization rate in the community
Water Used by JFE Steel Group Subsidiaries
Input Materials
Output Products
Name of Company Amount of Water Used (m3)
JFE Chemical Corp. 5,391,618JFE Bars & Shapes Corporation 4,638,438
JFE Material Co., Ltd. 3,483,462JFE MINERAL COMPANY, LTD. 2,387,229
JFE Galvanizing & Coating Co., Ltd. 1,244,614
JFE PRECISION CORPORATION 844,359
Galvatex Corporation 674,427Mizushima Ferroalloy Co., Ltd. 451,622
JFE LIFE CORPORATION 426,992JFE Container Co., Ltd. 297,120JFE LOGISTICS CORPORATION 102,380
JFE Techno-wire Corporation 100,284
JFE Metal Products & Engineering Inc. 86,193
Name of Company Amount of Water Used (m3)
JFE KENZAI FENCE CO., LTD. 72,909GECOSS CORPORATION 63,658
JFE Welded Pipe Manufacturing Co., Ltd. 59,420
JFE ROCKFIBER CORPORATION 37,890
K-PLASHEET CORPORATION 32,026
JFE Kozai Corporation 26,173JFE Plastic Resource Corporation 17,649
MIZUSHIMA RIVERMENT CORP. 14,988
CHIBA RIVERMENT AND CEMENT CORP. 10,978
JFE Pipe Fitting Mfg. Co., Ltd. 8,820
J-Logitec Co., Ltd. 3,020JFE Steel Pipe Co., Ltd. 1,537
Total 20,477,806
Recycled products
• NF Board™ • PET Flakes • Pallet • Recycled Resin
Other Products
• Chemicals • Oxygen • Nitrogen • Hydrogen • Argon
09 JFE Group CSR REPORT 2019 Environmental Data Book
JFE S
teelJFE
Sh
oji Trad
eJFE
En
gin
eering
JFE G
rou
p
JFE Steel

93.7
3,105
93.9
3,123
93.7 93.5
3,128 3,190
93.5
3,158
2014 2015 2016 2017 20180
5,000
4,000
3,000
2,000
1,000
0
20
40
60
80
100
(Million tonnes)
(FY)
(%)■ Recycling volume (non-consolidated)● Recycling rate (non-consolidated)
Recycled Water
15.2
4.2
27.5
14.6
3.6
24.6
14.5
3.7
15.7
4.2
25.427.5
15.3
6.0
39.3
2014 2015 2016 2017 20180
20
10
30
40
0
20
10
30
40
(Million tonnes) (%)
■ Generation volume■ On-premise recycling volume● On-premise recycling rate
(FY)
Co-products
66 65 65 63 61
2014 2015 2016 2017 20180
20
60
40
80
(%)
(FY)
Recycling Rate for Recovered Energy
Name of Company CO2 Emissions
JFE MINERAL COMPANY, LTD. 1,073,561
JFE Bars & Shapes Corporation 626,108
Mizushima Ferroalloy Co., Ltd. 316,314
JFE Chemical Corp. 266,271
JFE LOGISTICS CORPORATION 172,683
JFE Material Co., Ltd. 75,335JFE Galvanizing & Coating Co., Ltd. 74,329
JFE ROCKFIBER CORPORATION 36,270
JFE Pipe Fitting Mfg. Co., Ltd. 25,129
JFE Plastic Resource Corporation 17,176
MIZUSHIMA RIVERMENT CORP. 12,877
JFE Container Co., Ltd. 11,029
J-Logitec Co., Ltd. 9,900
Galvatex Corporation 8,985JFE Metal Products & Engineering Inc. 8,773
JFE Welded Pipe Manufacturing Co., Ltd. 7,255
JFE Techno-wire Corporation 7,168
JFE PRECISION CORPORATION 6,973
K-PLASHEET CORPORATION 6,262
JFE LIFE CORPORATION 5,227CHIBA RIVERMENT AND CEMENT CORP. 3,813
JFE KENZAI FENCE CO., LTD. 3,794
JFE Steel Pipe Co., Ltd. 3,506
GECOSS CORPORATION 3,212
JFE Kozai Corporation 1,277
5 overseas companies 1,496,529
Total 4,279,756
Name of Company Consumption
JFE Bars & Shapes Corporation 10,971,744
JFE MINERAL COMPANY, LTD. 6,386,031
JFE Chemical Corp. 5,064,276
Mizushima Ferroalloy Co., Ltd. 3,042,647
JFE LOGISTICS CORPORATION 2,495,532JFE Galvanizing & Coating Co., Ltd. 1,474,706
JFE Material Co., Ltd. 1,238,860
JFE ROCKFIBER CORPORATION 529,568
JFE Pipe Fitting Mfg. Co., Ltd. 389,637
JFE Plastic Resource Corporation 389,074
JFE Container Co., Ltd. 228,964JFE Metal Products & Engineering Inc. 219,947
JFE Welded Pipe Manufacturing Co., Ltd. 193,293
Galvatex Corporation 183,565
MIZUSHIMA RIVERMENT CORP. 162,414
JFE Techno-wire Corporation 148,188
J-Logitec Co., Ltd. 144,376
JFE LIFE CORPORATION 140,431CHIBA RIVERMENT AND CEMENT CORP. 138,585
JFE PRECISION CORPORATION 128,170
K-PLASHEET CORPORATION 103,198
JFE KENZAI FENCE CO., LTD. 85,309
JFE Kozai Corporation 84,034
JFE Steel Pipe Co., Ltd. 69,991
GECOSS CORPORATION 65,740
5 overseas companies 20,046,513
Total 54,124,793
CO2 Emissions of JFE Steel Group Subsidiaries (FY2018)
Energy Consumption of JFE Steel Group Subsidiaries (FY2018)
(t-CO2)
◦Status of the JFE Steel Group(GJ)
CO2 Emission Factor for Purchased Electricity in FY2018• JFE Steel uses the emission factor of the Commitment
to a Low Carbon Society of the Japan Iron and Steel Federation for energy purchased in FY2017.
• JFE Steel’s domestic consolidated subsidiaries apply the adjusted emission factors of each electric power company for each fiscal year.
• Overseas: based on each country’s GHG protocol
CO2 Emissions
2014 2015 2016 2017
56.9
63.1 4.5 61.0
58.6 57.0
61.2
58.5
62.1 3.6
4.1 4.2
2018
55.1
59.4
4.3
■ JFE Steel ■ Group companies
0
40
20
60
80
(Million t-CO2)
(FY)
Recycled Resources
CO2 Emissions and Energy Consumption
Data cover JFE Steel, 25 domestic subsidiaries and 5 overseas subsidiaries.Notes: Data for JFE Steel include CO2 emissions from non-energy sources.
Starting with FY2018, data for JFE Steel’s subsidiaries include CO2 emissions from non-energy sources.
The totals do not add up due to rounding.
*25 domestic consolidated subsidiaries of JFE Steel
Group companies*
Recycling volume − − 314 280 289 (Million m3)
Recycling rate − − 91 93 93 (%)
10JFE Group CSR REPORT 2019 Environmental Data Book
JFE S
teelJFE
Sh
oji Trad
eJFE
En
gin
eering
JFE G
rou
p

◦Status of JFE Steel
1990
2.48 -18%1.99
2014
58.3 56.6 55.0
2015
2.01
2016
50.3
4.7
51.5
5.156.6
1.99
2017
50.5
6.155.2
50.5
4.7
1.96
53.2
2.02
2018
47.1
6.1
40
20
60
80
100
(Million t-CO2)
0
2.5
2.0
1.5
1.0
0.5
0
(t-CO₂/t-s)
(FY)
■ Scope 1 ■ Scope 2 ● Unit CO2 emissions from energy sources
-19%
1990
670
28.5
22.7
2014 2015
645
22.9 22.623.2
2016
625
2018
644
22.5
633
2017
609
0
400
200
600
800
0
26
23
29
32
(PJ) (GJ/t-s )
(FY)
■ Energy consumption ● Unit energy consumption
CO2 Emissions from Energy Sources and Unit CO2 Emissions Energy Consumption and Unit Energy Consumption
1990
1.5
1.0
0.5
2.0
2.5
2014 2015
1.94
2016 2017
1.911.85 1.851.85
2018
1.87
0
(Million t-CO2)
(FY)
CO2 Emissions from Non-Energy Sources of JFE Steel
2014 2015
58.6
2016
56.9
2017 2018
57.0 58.555.1
0
40
20
60
80
(Million t-CO2)
(FY)
Total CO2 Emissions from Energy and Non-Energy Sources
Data cover JFE Steel and 11 domestic and overseas subsidiaries, which are specified consigners designated under the Japanese Energy Saving Act.For Others, data up to FY2015 consist of emissions from trucks and railways used by the Group companies, while the scope is expanded to truck, rail and ship from FY2016.
2014 2015
0.47
2016
0.450.11
0.34
2017 2018
0.65
0.32
0.33
0.65
0.28
0.37
0.66
0.26
0.40
0.2
0.4
0.6
0
0.8
(Million t-CO2)
(FY)
■ JFE Steel ■ Others
Greenhouse Gas Emitted During Transportation
Changes in Unit CO2 Emissions and Crude Steel Production vs. FY1990
Changes in Unit Energy Consumption and Crude Steel Production vs. FY1990(%) (%)
2014 2015 2016 2017 2018
Unit Emissions -20 -19 -21 -20 -18
Crude Steel Production 21 16 19 21 12
2014 2015 2016 2017 2018
Unit Emissions -20 -20 -21 -21 -19
Crude Steel Production 21 16 19 21 12
Notes: The CO2 emissions and emission intensity in FY2018 are calculated using the CO2 emission factor for electricity purchased in FY2017 on the Japan Iron and Steel Federation’s Commitment to a Low Carbon Society.
11 JFE Group CSR REPORT 2019 Environmental Data Book
JFE S
teelJFE
Sh
oji Trad
eJFE
En
gin
eering
JFE G
rou
p
JFE Steel

TotalDeliveries
beyond500 km
Deliveriesbeyond500 km
Ship and rail48%
Truck52%
Truck39.8%
Ship and rail91.6%
Ship and rail60.2%
Truck8.4%
◦Atmospheric Emissions
SOx Emissions
2018
4.1
2016
4.5
2017
4.6
1973 1990 2014
3.86.0
36.8
2015
4.0
0
20
10
30
40
(FY)
■ JFE Steel(Million Nm3)
NOx Emissions
2018
10.5
2016
10.9
2017
11.5
1973 1990 2014
10.3
34.6
13.7
2015
10.4
0
20
10
30
40
(FY)
■ JFE Steel(Million Nm3)
Name of Company SOx (Nm3)
JFE Material Co., Ltd. 10,846
JFE Chemical Corp. 8,455
JFE MINERAL COMPANY, LTD. 8,366
JFE Bars & Shapes Corporation 5,362
JFE Galvanizing & Coating Co., Ltd. 1,763
JFE PRECISION CORPORATION 1,148
Mizushima Ferroalloy Co., Ltd. 266
Name of Company SOx (Nm3)
K-PLASHEET CORPORATION 205
JFE Container Co., Ltd. 143
JFE Plastic Resource Corporation 134
CHIBA RIVERMENT AND CEMENT CORP. 60
JFE Metal Products & Engineering Inc. 53
JFE Pipe Fitting Mfg. Co., Ltd. 38
Total 36,839
SOx Emissions of JFE Steel Group Subsidiaries
Name of Company NOx (Nm3)
JFE MINERAL COMPANY, LTD. 52,703
JFE Chemical Corp. 50,265
Mizushima Ferroalloy Co., Ltd. 29,838
JFE Material Co., Ltd. 25,522
JFE Galvanizing & Coating Co., Ltd. 10,650
JFE Bars & Shapes Corporation 9,476
JFE Metal Products & Engineering Inc. 2,050
Name of Company NOx (Nm3)
MIZUSHIMA RIVERMENT CORP. 1,392
Galvatex Corporation 1,110
CHIBA RIVERMENT AND CEMENT CORP. 932
JFE Pipe Fitting Mfg. Co., Ltd. 671
JFE Plastic Resource Corporation 540
JFE PRECISION CORPORATION 187
Total 185,335
NOx Emissions of JFE Steel Group Subsidiaries
Disposed Substances
TotalDeliveries
beyond500 km
Deliveriesbeyond500 km
Ship and rail48%
Truck52%
Truck39.8%
Ship and rail91.6%
Ship and rail60.2%
Truck8.4%
Scope of calculation: All products and half-finished products transported in Japan
Modal Shift Rate (FY2018)
Total Modal Shift Rate in All Industries
Source: Ministry of Land, Infrastructure,
Transport and Tourism
*13 JFE Steel consolidated subsidiaries in Japan.
Group companies* − − − 0.03 0.03 0.05 0.04
*13 JFE Steel consolidated subsidiaries in Japan.
Group companies* − − − 0.24 0.22 0.20 0.19
12JFE Group CSR REPORT 2019 Environmental Data Book
JFE S
teelJFE
Sh
oji Trad
eJFE
En
gin
eering
JFE G
rou
p

◦Discharge into Waterways
Wastewater and Evaporation LossChemical Oxygen Demand (COD)
2014
6.5 6.5
2015
6.3
208
2016
6.3
203
128
75
127
81
2017
6.3
212 220 218
126
86
128
92
126
92
20180
100
200
300
0
2.5
5.0
7.5
(Million tonnes)
(FY)
(%)■ Loss volume ■ Evaporation volume ● Loss rate
3.0
2014 2015
3.1
2016
3.1
2017
3.0
2018
3.3
3.0
4.0
1.0
2.0
0 (FY)
(Tonnes/day) ■ JFE Steel (non-consolidated)
◦Co-product Disposal
Landfill of Co-products and Recycling Rates
99.799.8 99.7 99.7 99.7
0.052
2018
95.6
1990 2014 2015 2016 2017
0.0470.0450.029 0.042
0.48
0
0.3
0.2
0.1
0.4
0.5
90
96
94
92
98
100
(Million tonnes) (%)
(FY)
■ Landfill amount (non-consolidated) ● Recycling rate (non-consolidated)
Target: 99% or higher
Generation of Co-product and Landfill Amount of JFE Steel Group Subsidiaries
Name of CompanyCo-products Generated (tonnes)
Landfill Amount (tonnes)
JFE Bars & Shapes Corporation 207,806 2,270
JFE MINERAL COMPANY, LTD. 204,736 105
Mizushima Ferroalloy Co., Ltd. 129,518 16,729
JFE Material Co., Ltd. 68,122 4,297
JFE Plastic Resource Corporation 43,349 576
JFE Galvanizing & Coating Co., Ltd. 37,736 25
JFE Kozai Corporation 21,767 7
GECOSS CORPORATION 21,589 418
JFE Welded Pipe Manufacturing Co., Ltd. 16,149 86
JFE ROCKFIBER CORPORATION 11,191 3,095
JFE Container Co., Ltd. 7,532 273
JFE Pipe Fitting Mfg. Co., Ltd. 7,371 0
JFE Metal Products & Engineering Inc. 5,135 39
Galvatex Corporation 4,109 640
JFE LOGISTICS CORPORATION 1,783 280
JFE Techno-wire Corporation 1,116 38
CHIBA RIVERMENT AND CEMENT CORP. 860 1
JFE KENZAI FENCE CO., LTD. 789 31
K-PLASHEET CORPORATION 759 1
JFE Chemical Corp. 168 98
JFE LIFE CORPORATION 83 68
MIZUSHIMA RIVERMENT CORP. 8 0
JFE PRECISION CORPORATION 0 0
JFE Steel Pipe Co., Ltd. 0 146
J-Logitec Co., Ltd. 0 10
Total 791,677 29,234
*12 JFE Steel consolidated subsidiaries in Japan.
Group companies* − 0.08 0.13 0.14 0.17
*25 JFE Steel consolidated subsidiaries in Japan.
Group companies*
Recycling rate − − 0.771 0.776 0.539 0.792 (Million
tonnes)
Landfill amount − − − 0.042 0.034 0.029 (Million
tonnes)
13 JFE Group CSR REPORT 2019 Environmental Data Book
JFE S
teelJFE
Sh
oji Trad
eJFE
En
gin
eering
JFE G
rou
p
JFE Steel

Substance No. Substance
Volume Released Volume Transferred
Air Water Area Soil On-premise Landfill Sewer Off-premise
1 Zinc compounds (water-soluble) 0 12 0 0 0 0
15 Acenaphthene 0.028 0 0 0 0 0
31 Antimony and its compounds 0 0.26 0 0 0 18
33 Asbestos 0 0 0 0 0 1.47
53 Ethylbenzene 67 0 0 0 0 19
80 Xylene 136 0 0 0 0 22
83 Cumene 1.1 0 0 0 0 0
87 Chromium and chromium(III) compounds 0.076 0.45 0 7.2 0 1,116
88 Chromium(VI) compounds 0.0018 0.13 0 0 0 0.541
132 Cobalt and its compounds 0 0 0 0 0 0.002
144 Inorganic cyanide compounds (except complex salts and cyanates) 0 5.6 0 0 0 0
185 Dichloropentafluoropropane; HCFC-225 42 0 0 0 0 0
186 Dichloromethane; methylene dichloride 24 0 0 0 0 0
240 Styrene 10 0 0 0 0 0
242 Selenium and its compounds 0 0.17 0 0 0 1.9
243 Dioxins 4.1 0.000003 0 0 0 0
262 Tetrachloroethylene 25 0 0 0 0 0
272 Copper salts (water-soluble, except complex salts) 0 0.067 0 0 0 0
281 Trichloroethylene 1.1 0 0 0 0 0
296 1,2,4-trimethylbenzene 6.9 0 0 0 0 0.11
297 1,3,5-trimethylbenzene 4.2 0 0 0 0 0
300 Toluene 78 0 0 0 0 1.5
302 Naphthalene 1.2 0 0 0 0 0.19
305 Lead compounds 0 0 0 0 0 300
308 Nickel 0.0029 0 0 0 0 90
309 Nickel compounds 0.0089 2.4 0 0 0 52
321 Vanadium compounds 0 0 0 0 0 18
333 Hydrazine 0 0.19 0 0 0 0
340 Biphenyl 0.009 0 0 0 0 0
353 Diethyl phthalate 0 0 0 0 0 1.4
374 Hydrogen fluoride and its water-soluble salts 0 48 0 0 0 23
384 1-bromopropane 2 0 0 0 0 0
392 N-hexane 0.0059 0 0 0 0 0
400 Benzene 17 0 0 0 0 0
405 Boron compounds 0 20 0 0 0 3.9
406 Polychlorinated biphenyls; PCBs 0 0 0 0 0 11
407 Poly(oxyethylene) alkyl ether (alkyl C = 12 - 15) 0 1.6 0 0 0 0
412 Manganese and its compounds 0.0627 26 0 0 0 630
438 Methylnaphthalene 0.033 0 0 0 0 0
453 Molybdenum and its compounds 0.0015 5.8 0 0 0 224
Subtotal 415.69 121.91 0 7.2 0 2,533.35
Total 545 2,533
Substances Reported under PRTR (all Companies) (Tonnes/year, for dioxins: g-TEQ/year)
The total does not include dioxins.
◦Management of Chemical Substances
VOC EmissionsRelease and Transfer of PRTR-registered Substances
2018
761
2000
1,541
-51%
2017
718693
2014 2015
735
2016
696
500
1,000
1,500
2,000
(Tonnes)
0 (FY)
Target: 1,078 tonnes or less
545
2014 2015
2,235
463
2016 2017
3,590
456
2,726
516
2,212
429
2018
2,533
1,000
2,000
3,000
4,000
(Tonnes)■ Amount released into atmosphere and public waterways (non-consolidated)
■ Amount transferred (non-consolidated)
(FY)0
*18 JFE Steel consolidated subsidiaries in Japan.
Group companies*
Amount released − 386 413 381 269 (tonnes)
Amount transferred − 5,048 4,835 6,208 6,643 (tonnes)
14JFE Group CSR REPORT 2019 Environmental Data Book
JFE S
teelJFE
Sh
oji Trad
eJFE
En
gin
eering
JFE G
rou
p

(Tonnes/year, for dioxins: g-TEQ/year) Substances Reported under PRTR (Chiba District of East Japan Works)
Substance No. Substance
Volume Released Volume Transferred
Air Water Area Soil On-premise Landfill Sewer Off-premise
1 Zinc compounds (water-soluble) 0 0.14 0 0 0 0
15 Acenaphthene 0.028 0 0 0 0 0
53 Ethylbenzene 0.29 0 0 0 0 0
80 Xylene 0.62 0 0 0 0 0
87 Chromium and chromium(III) compounds 0 0.3 0 0 0 1,000
88 Chromium(VI) compounds 0 0.13 0 0 0 0.0011
185 Dichloropentafluoropropane; HCFC-225 42 0 0 0 0 0
243 Dioxins 0.031 0 0 0 0 0
272 Copper salts (water-soluble, except complex salts) 0 0.067 0 0 0 0
300 Toluene 2 0 0 0 0 0
302 Naphthalene 0.18 0 0 0 0 0
308 Nickel 0 0 0 0 0 90
309 Nickel compounds 0.002 1.8 0 0 0 18
333 Hydrazine 0 0.19 0 0 0 0
340 Biphenyl 0.009 0 0 0 0 0
374 Hydrogen fluoride and its water-soluble salts 0 39 0 0 0 23
400 Benzene 2.1 0 0 0 0 0
405 Boron compounds 0 6.1 0 0 0 0
406 Polychlorinated biphenyls; PCBs 0 0 0 0 0 4.8
412 Manganese and its compounds 0.0077 0.74 0 0 0 93
438 Methylnaphthalene 0.033 0 0 0 0 0
453 Molybdenum and its compounds 0 2.8 0 0 0 3.5
Subtotal 47.27 51.45 0 0 0 1,232.3
Total 99 1,232.3
The total does not include dioxins.
Substance No. Substance
Volume Released Volume Transferred
Air Water Area Soil On-premise Landfill Sewer Off-premise
53 Ethylbenzene 2 0 0 0 0 1
80 Xylene 5 0 0 0 0 1.6
87 Chromium and chromium(III) compounds 0.022 0 0 0 0 54
88 Chromium(VI) compounds 0.0018 0 0 0 0 0
240 Styrene 0.12 0 0 0 0 0
243 Dioxins 1.6 0 0 0 0 0
300 Toluene 16 0 0 0 0 1.4
302 Naphthalene 0.067 0 0 0 0 0
309 Nickel compounds 0.0022 0 0 0 0 2.9
353 Diethyl phthalate 0 0 0 0 0 1.4
400 Benzene 5.1 0 0 0 0 0
405 Boron compounds 0 2.5 0 0 0 0
406 Polychlorinated biphenyls; PCBs 0 0 0 0 0 6.6
412 Manganese and its compounds 0.011 1.1 0 0 0 210
453 Molybdenum and its compounds 0.0014 1.7 0 0 0 220
Subtotal 28.33 5.3 0 0 0 498.9
Total 34 498.9
(Tonnes/year, for dioxins: g-TEQ/year)Substances Reported under PRTR (Keihin District of East Japan Works)
The total does not include dioxins.
There was no release and transfer of PRTR-registered substances at Nishinomiya District.
15 JFE Group CSR REPORT 2019 Environmental Data Book
JFE S
teelJFE
Sh
oji Trad
eJFE
En
gin
eering
JFE G
rou
p
JFE Steel

Substance No. Substance
Volume Released Volume Transferred
Air Water Area Soil On-premise Landfill Sewer Off-premise
300 Toluene 1.7 0 0 0 0 0
Subtotal 1.7 0 0 0 0 0
Total 1.7 0
Substances Reported under PRTR (Konan District of West Japan Works) (Tonnes/year)
Substance No. Substance
Volume Released Volume Transferred
Air Water Area Soil On-premise Landfill Sewer Off-premise
1 Zinc compounds (water-soluble) 0 9.3 0 0 0 0
31 Antimony and its compounds 0 0.14 0 0 0 0
33 Asbestos 0 0 0 0 0 0.54
53 Ethylbenzene 4 0 0 0 0 0
80 Xylene 6.2 0 0 0 0 0
87 Chromium and chromium(III) compounds 0.0099 0 0 0 0 22
88 Chromium(VI) compounds 0 0 0 0 0 0.54
144 Inorganic cyanide compounds (except complex salts and cyanates) 0 5.6 0 0 0 0
186 Dichloromethane; methylene dichloride 9.9 0 0 0 0 0
242 Selenium and its compounds 0 0.17 0 0 0 1.9
243 Dioxins 0.34 0 0 0 0 0
262 Tetrachloroethylene 1.8 0 0 0 0 0
296 1,2,4-trimethylbenzene 1.9 0 0 0 0 0
300 Toluene 27 0 0 0 0 0
309 Nickel compounds 0.005 0 0 0 0 3.2
400 Benzene 2.4 0 0 0 0 0
405 Boron compounds 0 9.1 0 0 0 1.7
407 Poly(oxyethylene) alkyl ether (alkyl C=12-15) 0 1.6 0 0 0 0
412 Manganese and its compounds 0.023 19 0 0 0 100
453 Molybdenum and its compounds 0 0.82 0 0 0 0
Subtotal 53.24 45.73 0 0 0 129.88
Total 99 129.88
Substances Reported under PRTR (Kurashiki District of West Japan Works) (Tonnes/year, for dioxins: g-TEQ/year)
The total does not include dioxins.
Substances Reported under PRTR (Fukuyama District of West Japan Works)
Substance No. Substance
Volume Released Volume Transferred
Air Water Area Soil On-premise Landfill Sewer Off-premise
1 Zinc compounds (water-soluble) 0 2.2 0 0 0 0
31 Antimony and its compounds 0 0.12 0 0 0 18
33 Asbestos 0 0 0 0 0 0.93
53 Ethylbenzene 30 0 0 0 0 18
80 Xylene 89 0 0 0 0 20
87 Chromium and chromium(III) compounds 0.041 0 0 0 0 28
132 Cobalt and its compounds 0 0 0 0 0 0.002
186 Dichloromethane; methylene dichloride 14 0 0 0 0 0
240 Styrene 1.2 0 0 0 0 0
243 Dioxins 1.4 0 0 0 0 0
262 Tetrachloroethylene 23 0 0 0 0 0
281 Trichloroethylene 1.1 0 0 0 0 0
296 1,2,4-trimethylbenzene 3.6 0 0 0 0 0.11
300 Toluene 24 0 0 0 0 0.058
302 Naphthalene 0.98 0 0 0 0 0.19
305 Lead compounds 0 0 0 0 0 180
308 Nickel 0.0029 0 0 0 0 0
309 Nickel compounds 0 0.55 0 0 0 25
321 Vanadium compounds 0 0 0 0 0 18
374 Hydrogen fluoride and its water-soluble salts 0 8.8 0 0 0 0
400 Benzene 7.4 0 0 0 0 0
405 Boron compounds 0 1.5 0 0 0 1.8
412 Manganese and its compounds 0.021 4.8 0 0 0 140
453 Molybdenum and its compounds 0.0001 0.22 0 0 0 0
Subtotal 194.35 18.19 0 0 0 450.09
Total 213 450.09
(Tonnes/year, for dioxins: g-TEQ/year)
The total does not include dioxins.
16JFE Group CSR REPORT 2019 Environmental Data Book
JFE S
teelJFE
Sh
oji Trad
eJFE
En
gin
eering
JFE G
rou
p

Substance No. Substance
Volume Released Volume Transferred
Air Water Area Soil On-premise Landfill Sewer Off-premise
1 Zinc compounds (water-soluble) 0 0.041 0 0 0 0
53 Ethylbenzene 31 0 0 0 0 0
80 Xylene 35 0 0 0 0 0
83 Cumene 1.1 0 0 0 0 0
87 Chromium and chromium(III) compounds 0 0.15 0 0 0 0.2
240 Styrene 8.8 0 0 0 0 0
296 1,2,4-trimethylbenzene 1.4 0 0 0 0 0
297 1,3,5-trimethylbenzene 4.2 0 0 0 0 0
300 Toluene 7.3 0 0 0 0 0
309 Nickel compounds 0 0.036 0 0 0 2.5
384 1-bromopropane 2 0 0 0 0 0
392 N-hexane 0.0059 0 0 0 0 0
405 Boron compounds 0 0.79 0 0 0 0
412 Manganese and its compounds 0 0.17 0 0 0 12
453 Molybdenum and its compounds 0 0.24 0 0 0 0.078
Subtotal 90.81 1.43 0 0 0 14.78
Total 92 14.78
Substances Reported under PRTR (Chita Works) (Tonnes/year)
Substance No. Substance
Volume Released Volume Transferred
Air Water Area Soil On-premise Landfill Sewer Off-premise
87 Chromium and chromium(III) compounds 0 0 0 7.2 0 12
243 Dioxins 0.71 0 0 0 0 0
305 Lead compounds 0 0 0 0 0 120
412 Manganese and its compounds 0 0 0 0 0 75
Subtotal 0 0 0 7.2 0 207
Total 7.2 207
Substances Reported under PRTR (Sendai Works) (Tonnes/year, for dioxins: g-TEQ/year)
The total does not include dioxins.
17 JFE Group CSR REPORT 2019 Environmental Data Book
JFE S
teelJFE
Sh
oji Trad
eJFE
En
gin
eering
JFE G
rou
p
JFE Steel

Substance No. Substance
Volume Released Volume Transferred
Air Water Area Soil On-premise Landfill Sewer Off-premise
277 Triethylamine 0.89 0 0 0 0 0
349 Phenol 6.5 0 0 0 0 0
411 Formaldehyde 3.7 0 0 0 0 0
Subtotal 11 0 0 0 0 0
Total 11 0
(Tonnes/year)Substances Reported under PRTR (JFE ROCKFIBER CORPORATION)
Substance No. Substance
Volume Released Volume Transferred
Air Water Area Soil On-premise Landfill Sewer Off-premise
87 Chromium and chromium(III) compounds 0 0 0 0 0 3.7
405 Boron compounds 0.008 0 0 0 0 3.2
412 Manganese and its compounds 5.7 0 0 0 0 3,600
Subtotal 5.71 0 0 0 0 3,607
Total 6 3,607
(Tonnes/year)Substances Reported under PRTR (Mizushima Ferroalloy Co., Ltd.)
◦All Substances Reported under PRTR by Group Companies
Substance No. Substance
Volume Released Volume Transferred
Air Water Area Soil On-premise Landfill Sewer Off-premise
1 Zinc compounds (water-soluble) 0 0.028 0 0 0 0
87 Chromium and chromium(III) compounds 0.26 0.042 0 0 0 170
88 Chromium(VI) compounds 0 0.021 0 0 0 0
242 Selenium and its compounds 0 0.1 0 0 0 0
243 Dioxins 0.000034 0.000002 0 0 0 0.00027
305 Lead compounds 0 0.006 0 0 0 0
309 Nickel compounds 0.001 0.028 0 0 0 6.9
321 Vanadium compounds 0.004 0.44 0 0 0 17
374 Hydrogen fluoride and its water-soluble salts 0 0.95 0 0 0 0
405 Boron compounds 0 0.54 0 0 0 0
412 Manganese and its compounds 0 0.67 0 0 0 0
453 Molybdenum and its compounds 0.001 1.7 0 0 0 3.5
Subtotal 0.266 4.53 0 0 0 197
Total 5 197
(Tonnes/year, for dioxins: g-TEQ/year)Substances Reported under PRTR (JFE Material Co., Ltd.)
The total does not include dioxins.
Substance No. Substance
Volume Released Volume Transferred
Air Water Area Soil On-premise Landfill Sewer Off-premise
87 Chromium and chromium(III) compounds 0 0 0 0 0 0.0015
186 Dichloromethane; methylene dichloride 0 0 0 0 0 0.003
308 Nickel 5 0 0 0 0 0.98
453 Molybdenum and its compounds 0 0 0 0 0 0.004
Subtotal 5 0 0 0 0 0.989
Total 5 0.989
(Tonnes/year)Substances Reported under PRTR (JFE PRECISION CORPORATION)
18JFE Group CSR REPORT 2019 Environmental Data Book
JFE S
teelJFE
Sh
oji Trad
eJFE
En
gin
eering
JFE G
rou
p
Substance No. Substance
Volume Released Volume Transferred
Air Water Area Soil On-premise Landfill Sewer Off-premise
53 Ethylbenzene 9.5 0 0 0 0 0
80 Xylene 31.5 0 0 0 0 0
87 Chromium and chromium(III) compounds 0 0 0 0 0 0.66
132 Cobalt and its compounds 0 0 0 0 0 0.15
272 Copper salts (water-soluble, except complex salts) 0 0 0 0 0 0.25
296 1,2,4-trimethylbenzene 9.4 0 0 0 0 0
309 Nickel compounds 0 0 0 0 0 0.36
374 Hydrogen fluoride and its water-soluble salts 0 0 0 0 0 0.5
405 Boron compounds 0 0 0 0 0 4.8
412 Manganese and its compounds 0 0 0 0 0 0.22
Subtotal 50 0 0 0 0 6.94
Total 50 6.94
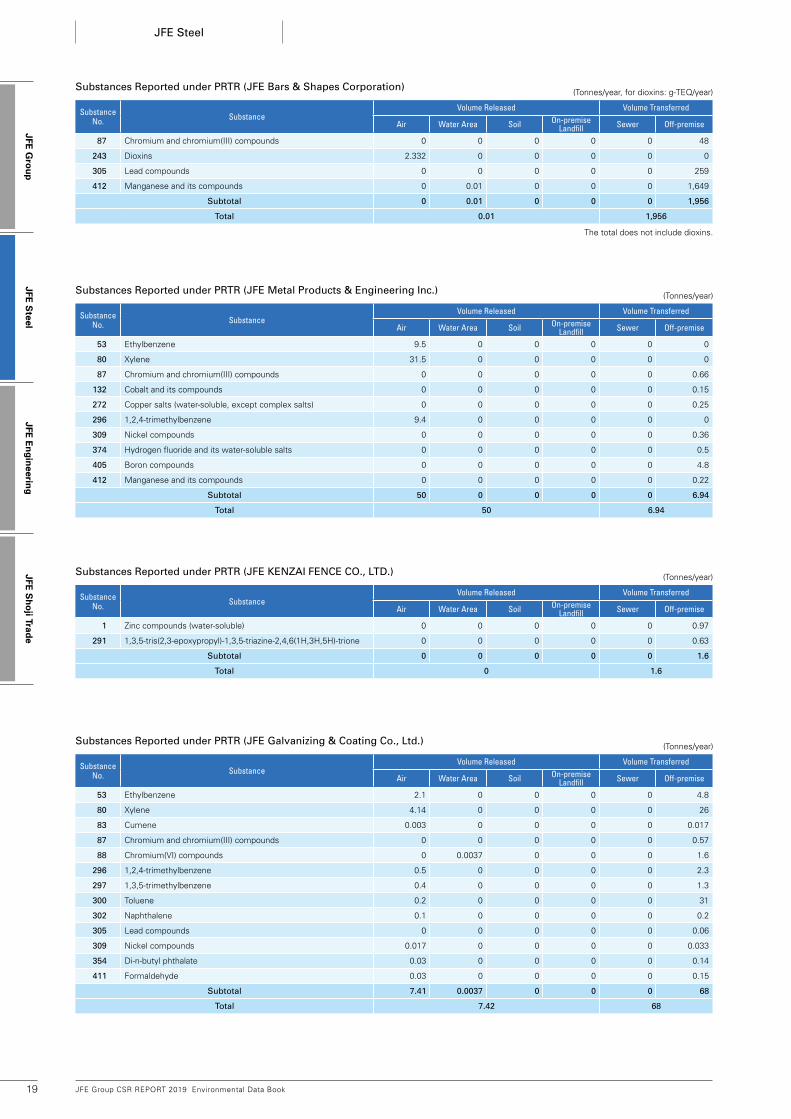
(Tonnes/year)Substances Reported under PRTR (JFE Metal Products & Engineering Inc.)
Substance No. Substance
Volume Released Volume Transferred
Air Water Area Soil On-premise Landfill Sewer Off-premise
1 Zinc compounds (water-soluble) 0 0 0 0 0 0.97
291 1,3,5-tris(2,3-epoxypropyl)-1,3,5-triazine-2,4,6(1H,3H,5H)-trione 0 0 0 0 0 0.63
Subtotal 0 0 0 0 0 1.6
Total 0 1.6
(Tonnes/year)Substances Reported under PRTR (JFE KENZAI FENCE CO., LTD.)
Substance No. Substance
Volume Released Volume Transferred
Air Water Area Soil On-premise Landfill Sewer Off-premise
53 Ethylbenzene 2.1 0 0 0 0 4.8
80 Xylene 4.14 0 0 0 0 26
83 Cumene 0.003 0 0 0 0 0.017
87 Chromium and chromium(III) compounds 0 0 0 0 0 0.57
88 Chromium(VI) compounds 0 0.0037 0 0 0 1.6
296 1,2,4-trimethylbenzene 0.5 0 0 0 0 2.3
297 1,3,5-trimethylbenzene 0.4 0 0 0 0 1.3
300 Toluene 0.2 0 0 0 0 31
302 Naphthalene 0.1 0 0 0 0 0.2
305 Lead compounds 0 0 0 0 0 0.06
309 Nickel compounds 0.017 0 0 0 0 0.033
354 Di-n-butyl phthalate 0.03 0 0 0 0 0.14
411 Formaldehyde 0.03 0 0 0 0 0.15
Subtotal 7.41 0.0037 0 0 0 68
Total 7.42 68
(Tonnes/year)Substances Reported under PRTR (JFE Galvanizing & Coating Co., Ltd.)
Substance No. Substance
Volume Released Volume Transferred
Air Water Area Soil On-premise Landfill Sewer Off-premise
87 Chromium and chromium(III) compounds 0 0 0 0 0 48
243 Dioxins 2.332 0 0 0 0 0
305 Lead compounds 0 0 0 0 0 259
412 Manganese and its compounds 0 0.01 0 0 0 1,649
Subtotal 0 0.01 0 0 0 1,956
Total 0.01 1,956
(Tonnes/year, for dioxins: g-TEQ/year)Substances Reported under PRTR (JFE Bars & Shapes Corporation)
The total does not include dioxins.
19 JFE Group CSR REPORT 2019 Environmental Data Book
JFE S
teelJFE
Sh
oji Trad
eJFE
En
gin
eering
JFE G
rou
p
JFE Steel

Substance No. Substance
Volume Released Volume Transferred
Air Water Area Soil On-premise Landfill Sewer Off-premise
1 Zinc compounds (water-soluble) 0 0.014 0 0 0 0.292
53 Ethylbenzene 41 0 0 0 0 9
80 Xylene 82 0 0 0 0 20
296 1,2,4-trimethylbenzene 20.8 0 0 0 0 3.85
297 1,3,5-trimethylbenzene 4.1 0 0 0 0 0.74
300 Toluene 15.6 0 0 0 0 19
411 Formaldehyde 1.5 0 0 0 0 0.7
Subtotal 164 0.014 0 0 0 54
Total 165 54
(Tonnes/year)Substances Reported under PRTR (JFE Container Co., Ltd.)
Substance No. Substance
Volume Released Volume Transferred
Air Water Area Soil On-premise Landfill Sewer Off-premise
262 Tetrachloroethylene 1.3 0 0 0 0 0
Subtotal 1.3 0 0 0 0 0
Total 1.3 0
(Tonnes/year)Substances Reported under PRTR (JFE Welded Pipe Manufacturing Co., Ltd.)
Substance No. Substance
Volume Released Volume Transferred
Air Water Area Soil On-premise Landfill Sewer Off-premise
80 Xylene 0.1 0 0 0 0 0.1
300 Toluene 0.6 0 0 0 0 0.6
448 Methylenebis(4,1-phenylene) diisocyanate 0 0 0 0 0 0.4
Subtotal 0.7 0 0 0 0 1.1
Total 0.7 1.1
(Tonnes/year)Substances Reported under PRTR (JFE Steel Pipe Co., Ltd.)
Substance No. Substance
Volume Released Volume Transferred
Air Water Area Soil On-premise Landfill Sewer Off-premise
281 Trichloroethylene 8 0 0 0 0 0
Subtotal 8 0 0 0 0 0
Total 8 0
(Tonnes/year)Substances Reported under PRTR (JFE Pipe Fitting Mfg. Co., Ltd.)
Substance No. Substance
Volume Released Volume Transferred
Air Water Area Soil On-premise Landfill Sewer Off-premise
1 Zinc compounds (water-soluble) 0.13 0.018 0 0 0 89
75 Cadmium and its compounds 0.0004 0.0001 0 0 0 0.025
305 Lead compounds 0.028 0.0001 0 0 0 0.4
Subtotal 0.158 0.0182 0 0 0 89
Total 0.177 89
(Tonnes/year)Substances Reported under PRTR (Galvatex Corporation)
20JFE Group CSR REPORT 2019 Environmental Data Book
JFE S
teelJFE
Sh
oji Trad
eJFE
En
gin
eering
JFE G
rou
p

Substance No. Substance
Volume Released Volume Transferred
Air Water Area Soil On-premise Landfill Sewer Off-premise
80 Xylene 0.13 0 0 0 0 3
412 Manganese and its compounds 0.19 0 0 0 0 622
Subtotal 0.32 0 0 0 0 625
Total 0.32 625
(Tonnes/year)Substances Reported under PRTR (GECOSS CORPORATION)
Substance No. Substance
Volume Released Volume Transferred
Air Water Area Soil On-premise Landfill Sewer Off-premise
15 Acenaphthene 0.008 0 0 0 0 0
53 Ethylbenzene 0.497 0 0 0 0 0
80 Xylene 1.17 0 0 0 0 0
81 Quinoline 0.005 0 0 0 0 0
86 Cresol 0.116 0 0 0 0 0
190 Dicyclopentadiene 0.022 0 0 0 0 0
240 Styrene 0.521 0 0 0 0 0
296 1,2,4-trimethylbenzene 0.044 0 0 0 0 0
300 Toluene 1.56 0 0 0 0 0
302 Naphthalene 1.12 0 0 0 0 0
321 Vanadium compounds 0 0 0 0 0 1.12
340 Biphenyl 0.023 0 0 0 0 0
349 Phenol 0.141 0 0 0 0 0
400 Benzene 4.47 0 0 0 0 0.011
438 Methylnaphthalene 0.057 0 0 0 0 0
453 Molybdenum and its compounds 0 0 0 0 0 0.71
Subtotal 9.75 0 0 0 0 1.84
Total 9.75 1.84
(Tonnes/year)Substances Reported under PRTR (JFE Chemical Corp.)
Substance No. Substance
Volume Released Volume Transferred
Air Water Area Soil On-premise Landfill Sewer Off-premise
80 Xylene 0.00001 0 0 0 0 0
300 Toluene 0.042 0 0 0 0 0
308 Nickel 0 0 0 0 0 33
309 Nickel compounds 0 0 0 0 0 0.17
438 Methylnaphthalene 0.0082 0 0 0 0 0
Subtotal 0.0502 0 0 0 0 33
Total 0.0502 33
(Tonnes/year)Substances Reported under PRTR (JFE MINERAL COMPANY, LTD.)
Substance No. Substance
Volume Released Volume Transferred
Air Water Area Soil On-premise Landfill Sewer Off-premise
30 n-alkylbenzenesulfonic acid and its salts 0 0.1 0 0 0 0
Subtotal 0 0.1 0 0 0 0
Total 0.1 0
(Tonnes/year)Substances Reported under PRTR (K-PLASHEET CORPORATION)
Substance No. Substance
Volume Released Volume Transferred
Air Water Area Soil On-premise Landfill Sewer Off-premise
304 Lead 0 0 0 0 0 0.15
Subtotal 0 0 0 0 0 0.15
Total 0 0.15
(Tonnes/year)Substances Reported under PRTR (JFE Techno-wire Corporation)
21 JFE Group CSR REPORT 2019 Environmental Data Book
JFE S
teelJFE
Sh
oji Trad
eJFE
En
gin
eering
JFE G
rou
p
JFE Steel

Name of Company CO2 Emissions
J&T Recycling Corporation 733,862J Farm Corporation 24,028Tohoku Dock Ironworks Corporation 58Fujikako, Inc. 28JFE Environmental Service Corporation 26NORTHERN JAPAN MACHINERY Corporation 6JFE Aqua Machine and Service Corporation 1Total 758,009
Water Used by JFE Engineering Group Subsidiaries (FY2018)
(t)
Raw Materials
2014 2015
54.8
2016
32.9
2017
39.1 41.8
2018
47.3
0
60
40
20
80
(Thousand tonnes)
(FY)
Electricity
2014 2015
28,628
2016
29,217
2017
26,922 26,918
2018
26,794
0
20,000
10,000
30,000
40,000
(MWh)
(FY)
Products
2014 2015
42.0
2016
31.2
2017
36.139.7
2018
44.5
0
40
20
60
(Thousand tonnes)
(FY)
Water
2014 2015
95.8
2016
94.9
2017
94.0 97.0
2018
101.7
0
80
40
120
160
(Thousand tonnes)
(FY)
Heavy Oil, Kerosene, Light Oil and Gasoline
2014 2015
559.5
2016
742.9
2017
768.2
673.0
2018
579.3
0
400
200
600
800
(kl)
(FY)
Input Materials
Output Products
JFE Engineering
22JFE Group CSR REPORT 2019 Environmental Data Book
JFE S
teelJFE
Sh
oji Trad
eJFE
En
gin
eering
JFE G
rou
p

◦Status on Non-consolidated Basis
Energy Consumption and Change in Unit Energy Consumption
2014 20162015
9,474 9,189
97.0 96.2
2017
10,665
92.9
10,960
97.4
2018
10,886
95.4
0
8,000
6,000
4,000
2,000
12,000
10,000
95
100
105
90
85
0
110
(kl) (%)
(FY)
■ Energy Consumption ● Change in Unit Energy Consumption
◦Status as a Group
JFE Engineering’s CO2 Emissions from Energy Sources
20152014
63.7
2016 2017
62.968.2
56.5
2018
66.7
17.5
40.3
8.8
0
75
50
25
100
(Thousand t-CO2)
(FY)
JFEEngineering
Other
J&TRecycling
Name of Company Energy Consumption
JFE Engineering Corporation 421,923J&T Recycling Corporation 745,524J Farm Corporation 46,055Fujikako, Inc. 44,401NORTHERN JAPAN MACHINERY Corporation 19,280Tohoku Dock Ironworks Corporation 17,836Asuka Soken Co., Ltd. 12,216JFE Environmental Service Corporation 11,727JFE Pipeline Engineering Corporation 4,920JFE Technos Corporation 2,815JFE Aqua Machine and Service Corporation 75Total 1,326,772
Energy Consumption of JFE Engineering Group Subsidiaries (FY2018)
Name of Company CO2 Emissions
JFE Engineering Corporation 17,525J&T Recycling Corporation 40,311J Farm Corporation 2,499Fujikako, Inc. 2,208NORTHERN JAPAN MACHINERY Corporation 1,140Tohoku Dock Ironworks Corporation 959JFE Environmental Service Corporation 797Asuka Soken Co., Ltd. 721JFE Pipeline Engineering Corporation 320JFE Technos Corporation 167JFE Aqua Machine and Service Corporation 4Total 66,650
JFE Engineering Group’s CO2 Emissions from Energy Sources (FY2018)
(t-CO2)
(GJ)
CO2 Emissions and Energy Consumption
Data cover CO2 emission from Energy Sources by JFE Engineering and 10 domestic subsidiaries.
23 JFE Group CSR REPORT 2019 Environmental Data Book
JFE S
teelJFE
Sh
oji Trad
eJFE
En
gin
eering
JFE G
rou
p
JFE Engineering

◦Release into Water Area
Wastewater Chemical Oxygen Demand (COD) in Wastewater Released Publicly
2014 2015
156.7
2016
165.4
2017
147.9 140.2
2018
146.0
0
100
50
150
200
(Thousand tonnes)
(FY)
Release and Transfer of PRTR-Registered Substances
2014 2015 2016 2017 2018
28
147
28
96
24
104
28
85
28
87
■ Amount released into atmosphere and public waterways (non-consolidated)■ Amount transferred (non-consolidated)
100
50
150
(Tonnes)
0 (FY)
2016 201720152014 2018
6.85.7 6.0 6.1 5.6
■ Tsu Works
0
20
10
30
(kg/day)
(FY)
Regulation (Tsu)23.1
Contribution to CO2 Emission Reductions by Renewable Energy Plants
Contribution to CO2 Emission Reductions4.12 million t-CO2/year
Other (solar power, biogas engine, etc.): 0.47
Waste power generation: 2.12
Biomass power generation: 1.53
Technologies to Reduce Environmental Load
Disposed Substances
Management of Chemical Substances
Note: This report uses the maximum value of each year.
*4 JFE Engineering consolidated subsidiaries in Japan.
Group companies*
Amount released − − − − 58.4 (tonnes)
Amount transferred − − − − 5.7 (tonnes)
24JFE Group CSR REPORT 2019 Environmental Data Book
JFE S
teelJFE
Sh
oji Trad
eJFE
En
gin
eering
JFE G
rou
p

Substance No. Substance
Volume Released Volume Transferred
Air Water Area Soil On-premise Landfill Sewer Off-premise
53 Ethylbenzene 0.01 0 0 0 0 0
240 Styrene 1.1 0 0 0 0 0.13
300 Toluene 20 0 0 0 0 2.4
355 Bis (2-ethylhexyl) phthalate 0 0 0 0 0 0.13
412 Manganese and its compounds 0 0 0 0 0 0.66
448 Methylenebis(4,1-phenylene) diisocyanate 0 0 0 0 0 0.45
Total
21.1 0 0 0 0 3.8
21.1 3.8
24.9
Substances Reported under PRTR (Yokohama Head Office (former Tsurumi Works)) (Tonnes/year)
Substance No. Substance
Volume Released Volume Transferred
Air Water Area Soil On-premise Landfill Sewer Off-premise
53 Ethylbenzene 32 0 0 0 0 1.7
80 Xylene 59.4 0 0 0 0 3.1
87 Chromium and chromium(III) compounds 0 0 0 0 0 1.4
296 1,2,4-trimethylbenzene 4.6 0 0 0 0 0.24
297 1,3,5-trimethylbenzene 0.63 0 0 0 0 0.033
300 Toluene 29.2 0 0 0 0 1.5
309 Nickel compounds 0 0 0 0 0 3.3
412 Manganese and its compounds 0 0 0 0 0 12.6
Total
125.8 0 0 0 0 23.9
125.8 23.9
149.7
Substances Reported under PRTR (Tsu Works) (Tonnes/year)
Substance No. Substance
Volume Released Volume Transferred
Air Water Area Soil On-premise Landfill Sewer Off-premise
53 Ethylbenzene 32 0 0 0 0 1.7
80 Xylene 59.4 0 0 0 0 3.1
87 Chromium and chromium(III) compounds 0 0 0 0 0 1.4
240 Styrene 1.1 0 0 0 0 0.1
296 1,2,4-trimethylbenzene 4.6 0 0 0 0 0.2
297 1,3,5-trimethylbenzene 0.6 0 0 0 0 0
300 Toluene 49.2 0 0 0 0 3.9
309 Nickel compounds 0 0 0 0 0 3.3
355 Bis (2-ethylhexyl) phthalate 0 0 0 0 0 0.1
412 Manganese and its compounds 0 0 0 0 0 13.3
448 Methylenebis(4,1-phenylene) diisocyanate 0 0 0 0 0 0.5
Total
146.9 0 0 0 0 27.7
146.9 27.7
174.6
Substances Reported under PRTR (all Companies) (Tonnes/year)
25 JFE Group CSR REPORT 2019 Environmental Data Book
JFE S
teelJFE
Sh
oji Trad
eJFE
En
gin
eering
JFE G
rou
p
JFE Engineering

Substances Reported under PRTR (J&T Recycling Corporation)
Substance No. Substance
Volume Released Volume Transferred
Air Water Area Soil On-premise Landfill Sewer Off-premise
243 Dioxins 0.00115 0 0 0 0 3.7
Subtotal 0 0 0 0 0 0
Total 0 0
(Tonnes/year, for dioxins: g-TEQ/year)
The total does not include dioxins.
Substance No. Substance
Volume Released Volume Transferred
Air Water Area Soil On-premise Landfill Sewer Off-premise
240 Styrene 19.1 0 0 0 0 0.75
265 Tetrahydromethylphthalic anhydride 0 0 0 0 0 0.034
415 Methacrylic acid 0.23 0 0 0 0 0.0048
Subtotal 19.3 0 0 0 0 0.8
Total 19.3 0.8
(Tonnes/year)Substances Reported under PRTR (Fujikako, Inc.)
Substance No. Substance
Volume Released Volume Transferred
Air Water Area Soil On-premise Landfill Sewer Off-premise
53 Ethylbenzene 8.9 0 0 0 0 1.6
80 Xylene 14.5 0 0 0 0 2.6
87 Chromium and chromium(III) compounds 0.0021 0 0 0 0 0.051
300 Toluene 3.4 0 0 0 0 0.6
309 Nickel compounds 0.00048 0 0 0 0 0.0043
412 Manganese and its compounds 0.0061 0 0 0 0 0.046
Subtotal 26.8 0 0 0 0 4.9
Total 26.8 4.9
(Tonnes/year)Substances Reported under PRTR (Tohoku Dock Ironworks Corporation)
Substance No. Substance
Volume Released Volume Transferred
Air Water Area Soil On-premise Landfill Sewer Off-premise
53 Ethylbenzene 5.3 0 0 0 0 0
80 Xylene 5.9 0 0 0 0 0
300 Toluene 1.1 0 0 0 0 0
Subtotal 12.3 0 0 0 0 0
Total 12.3 0
(Tonnes/year)Substances Reported under PRTR (NORTHERN JAPAN MACHINERY Corporation)
◦All Substances Reported under PRTR by Group Companies
26JFE Group CSR REPORT 2019 Environmental Data Book
JFE S
teelJFE
Sh
oji Trad
eJFE
En
gin
eering
JFE G
rou
p

Total:132
thousand tonnes
JFE PipelineEngineering: 6.0
JFE Technos: 10.2
JFE Engineering: 109.0
Asuka Soken: 5.5
Other: 0.9
Yokohama Head Office Tsu Works
◦Offices
◦JFE Engineering Group Waste Disposal
2014 2015
230.4
3.15
2016
258.4
3.2
2017 2018
241.7
3.3
357.1
4.3
299.9
4.1
0
100
200
400
300
500
(Tonnes)
(FY)
■ Generation volume ■ Final disposal volume
2014 2015 2016 2017 2018
6.6
86.5
5.3
76.1
6.0
81.8
5.1
79.1
4.7
72.7
0
20
40
80
60
100
(Tonnes)
(FY)
■ Generation volume ■ Final disposal volume
(%)
2014 2015 2016 2017 2018
Recycling rate (targets) 98.0 98.0 98.0 98.0 98.0
Recycling rate (results) 98.5 98.7 98.5 98.7 98.5
(%)
2014 2015 2016 2017 2018
Recycling rate (targets) 92.0 92.0 92.0 92.0 90.0
Recycling rate (results) 87.4 91.5 88.9 89.0 85.2
Waste Disposal in Each Section and Works
27 JFE Group CSR REPORT 2019 Environmental Data Book
JFE S
teelJFE
Sh
oji Trad
eJFE
En
gin
eering
JFE G
rou
p
JFE Engineering

◦Construction Sites
Rubble SludgeIndustrial Wastes, Excluding Rubble and Sludge
2014 2015 2016 2017 2018
78,409.6
297.4
55,652.2
202.9
60,373.2
39.6
56,767.2
414.4
58,824.3
94.4
0
500
20,000
60,000
40,000
80,000
(Tonnes)
(FY)
■ Generation volume ■ Final disposal volume
2015 20162014 2017 2018
198.8
46,765.3
22.6
11,840.0
53.3 98.3
21,814.3
849.1
23,462.8
16,141.7
0
(Tonnes)
(FY)
10,000
20,000
1,000
500
40,000
30,000
50,000■ Generation volume ■ Final disposal volume
2014 2015 2016 2017 2018
1,264.9
8,390.4
826.2 1,401.4
23,230.7
1,103.4
5,853.3
425.0
19,095.7
14,493.9
0
5,000
15,000
10,000
25,000
20,000
(Tonnes) ■ Generation volume ■ Final disposal volume
(FY)
(%)
2014 2015 2016 2017 2018
Recycling rate (targets) 99.5 99.5 99.5 99.5 99.5
Recycling rate (results) 99.6 99.9 99.3 99.8 99.6
(%)
2014 2015 2016 2017 2018
Recycling rate (targets) 95.0 95.0 95.0 95.0 95.0
Recycling rate (results) 99.95 99.5 99.5 96.3 98.8
(%)
2014 2015 2016 2017 2018
Recycling rate (targets) 85.0 85.0 85.0 85.0 85.0
Recycling rate (results) 93.3 91.7 95.0 92.2 91.0
Tsurumi Works Tsu Works
◦Plants
0
100
200
400
500
300
600
2014 2015 2016 2017 2018
506.6
83.2
242.2
80.7
252.1
99.4
443.4
67.0
302.3
70.6
(Tonnes)
(FY)
■ Generation volume ■ Final disposal volume
2014 2015 2016 2017 2018
270.1
532.7
232.6
461.5
274.6
564.2
262.8
529.8
218.4
470.7
0
100
200
400
500
300
600
(Tonnes)
(FY)
■ Generation volume ■ Final disposal volume
(%)
2014 2015 2016 2017 2018
Recycling rate (targets) 58.0 58.0 58.0 55.0 58.0
Recycling rate (results) 57.5 49.8 78.9 61.0 68.7
(%)
2014 2015 2016 2017 2018
Recycling rate (targets) 30.0 31.0 31.0 31.0 31.0
Recycling rate (results) 33.9 34.0 32.5 37.0 32.1
28JFE Group CSR REPORT 2019 Environmental Data Book
JFE S
teelJFE
Sh
oji Trad
eJFE
En
gin
eering
JFE G
rou
p

2001
2,031
-55%
2014 2015
1,022
2016 2017
956
2018
918899915
0
1,500
1,000
500
2,000
2,500
(Thousand kWh)
(FY)
Tokyo 374
Osaka 247Nagoya 34Branch 263
Electric Power Consumption of JFE Shoji Trade
Total:35.6
thousand t-CO2
China:15.6 thousand
Japan:11.1 thousand
North and Central America: 3.5 thousand
Asia: 5.5 thousand
CO2 Emissions of the JFE Shoji Trade Group
The graph shows CO2 emissions from electric power consumption by JFE Shoji Trade and 33 domestic and overseas consolidated subsidiaries (steel-processing companies).
CO2 Emission Factor for Purchased EnergyJapan: unadjusted emission factors of each electric power companyOverseas: based on each country’s GHG protocol
2001
5,570
4,051
712
623184
2014 2015 2016 2017 2018
4,8322,661
372
1,582217
5,232
2,823
524
1,575
310
4,8382,623
610
1,393212
4,9042,614
545
1,440
305
5,1002,674
527
1,591
308
0
4,000
2,000
6,000
8,000
(Boxes)
(FY)
■ Tokyo ■ Osaka ■ Nagoya ■ Branch offices
Total:164,647m³
Asia: 41,130
North and Central America: 14,374
Japan: 42,042China: 67,101
Paper Used (Copier Papers) Water Use of the JFE Shoji Trade Group (m3)
The graph shows water used by JFE Shoji Trade and 33 domestic and overseas steel processing companies.
Electricity Consumption and CO2 Emissions
Input Materials
JFE Shoji Trade
29 JFE Group CSR REPORT 2019 Environmental Data Book
JFE S
teelJFE
Sh
oji Trad
eJFE
En
gin
eering
JFE G
rou
p
JFE Shoji Trade

30JFE Group CSR REPORT 2019 Environmental Data Book
Independent Assurance Statement

Chapter 1: Basic Information of Environmental Reporting
ItemsDescriptions in the CSR Report Environmental
Data Book PagesPages Contents JFE Steel JFE
EngineeringJFE
Shoji Trade
1. Basic requirements for environmental reporting(1) Boundary 1 Editorial Policy 〇 〇 〇 1(2) Reporting period 1 Editorial Policy 〇 〇 〇 1
(3) Reporting standards and guidelines1 Editorial Policy 〇 〇 〇 -Web GRI Standard Index 〇 〇 〇 -
(4) Overview of the environmental report1 Editorial Policy 〇 〇 〇 -Back cover 〇 〇 〇 -
2. Trends in key performance indicators(1) Trends in major performance indicators 15–18 Material CSR Issues of the JFE Group 〇 〇 〇 -
Chapter 2: Items to Be Included in Environmental Reporting
ItemsDescriptions in the CSR Report Environmental
Data Book PagesPages Contents JFE Steel JFE
EngineeringJFE
Shoji Trade
1. Top Management Commitments(1) Top management commitments to
the JFE Group’s response to material environmental issues
3–4 Message from the CEO 〇 〇 〇 -
2. Governance(1) JFE Group governance structure 19–21 CSR Management 〇 〇 〇 -(2) Manager responsible for material
environmental issues 33–34 Environmental Management 〇 〇 〇 -
(3) Roles of the board of directors and board of executive officers in the management of material environmental issues
33 Environmental Management 〇 〇 〇 -
3. Stakeholder Engagement(1) Corporate policies to stakeholders 33 Environmental Management 〇 〇 〇 -
(2) Overview of stakeholder engagement activities conducted in the reporting period
7–10 JFE Group Value Chain 〇 〇 〇 -57 Environmental Communication 〇 〇 〇 -75 Stakeholder Engagement 〇 〇 〇 -
4. Risk Management
(1) Environment-related risk identification, assessment, and management processes
21 CSR Management 〇 〇 〇 -27–32 Special Feature: JFE’s Initiatives on Climate Change 〇 〇 〇 -
(2) Positioning of the above processes in the JFE Group’s overall risk management 21 CSR Management 〇 〇 〇 -
5. Business Model
(1) JFE Group business model5–6 Businesses to Ensure Sustainable Societies 〇 〇 〇 -7–10 JFE Group Value Chain 〇 〇 〇 -
6. Value Chain Management(1) Value chain overview 7–10 JFE Group Value Chain 〇 〇 〇 -(2) Green procurement policy, objectives,
and results35 Environmental Management 〇 〇 〇 -62 Suppliers 〇 〇 -
(3) Status of eco-friendly products and services
45–47 Climate Change Mitigation 〇 〇 〇 -50 Protect global atmosphere and water 〇 -52 Initiatives to Preserve Biodiversity 〇 -54–56 Resource Recycling 〇 〇 〇 5–6
7. Long-term Vision
(1) Long-term vision3–4 Message from the CEO 〇 〇 〇 -25–32 Special Feature: JFE’s Initiatives on Climate Change 〇 〇 〇 -41 Climate Change Mitigation 〇 -
(2) Time period covered by the long-term vision
3–4 Message from the CEO 〇 〇 〇 -25–26, 28 Special Feature: JFE’s Initiatives on Climate Change 〇 〇 〇 -41 Climate Change Mitigation 〇 -
(3) Reasons why that time period was selected
28 Special Feature: JFE’s Initiatives on Climate Change 〇 〇 〇 -41 Climate Change Mitigation 〇 -
8. Strategy
(1) JFE Group business strategy for contributing to the achievement of a sustainable society
3–4 Message from the CEO 〇 〇 〇 -5–6 Businesses to Ensure Sustainable Societies 〇 〇 〇 -13–18 Material CSR Issues of the JFE Group 〇 〇 〇 -25–32 Special Feature: JFE’s Initiatives on Climate Change 〇 〇 -41 Climate Change Mitigation 〇 -
9. Methodology for Identifying Material Environmental Issues
(1) Procedure by which the JFE Group identified its material environmental issues
13–14 Material CSR Issues of the JFE Group 〇 〇 〇 -28 Special Feature: JFE’s Initiatives on Climate Change 〇 〇 -
(2) List of identified material environmental issues
15–18 Material CSR Issues of the JFE Group 〇 〇 〇 -29 Special Feature: JFE’s Initiatives on Climate Change 〇 〇 -
(3) Reasons that the identified environmental issues were judged material
13–14 Material CSR Issues of the JFE Group 〇 〇 〇 -27–32 Special Feature: JFE’s Initiatives on Climate Change 〇 〇 -
(4) Boundaries of the material environmental issues
7–10 JFE Group Value Chain 〇 〇 〇 -13–14 Material CSR Issues of the JFE Group 〇 〇 〇 -28 Special Feature: JFE’s Initiatives on Climate Change 〇 〇 -
Comparison with Environmental Reporting Guidelines 2018(Ministry of the Environment, Japan)
31 JFE Group CSR REPORT 2019 Environmental Data Book

10. JFE Group Material Environmental Issues
(1) Policies and/or action plans
2 JFE Group’s CSR 〇 〇 〇 -7–10 JFE Group Value Chain 〇 〇 〇 -15–18 Material CSR Issues of the JFE Group 〇 〇 〇 -25–26,30–32 Special Feature: JFE’s Initiatives on Climate Change 〇 〇 -
(2) Targets and results of policies/action plans based on performance indicators
15–18 Material CSR Issues of the JFE Group 〇 〇 〇 -23 CSR Management 〇 〇 〇 -
(3) Methodologies used for calculating each performance indicator 13–14 Material CSR Issues of the JFE Group 〇 〇 〇 -
(4) Aggregation scope of data for each performance indicator
1 Editorial Policy 〇 〇 〇 -13–18 Material CSR Issues of the JFE Group 〇 〇 〇 -
(5) Financial impact of risks and opportunities, and calculation methodologies if the financial impact is significant
35–36 Environmental Management 〇 〇 〇 3
(6) Assurance report by an independent third party 78 Independent Assurance Statement 〇 〇 〇 30
Reference: Major Environmental Issues and Their Performance Indicators
ItemsDescriptions in the CSR Report Environmental
Data Book PagesPages Contents JFE Steel JFE
EngineeringJFE
Shoji Trade
1. Climate ChangeGreenhouse Gas Emissions
(1) Scope 1 emissions37–38 Material Flow 〇 〇 7–839–40, 44 Climate Change Mitigation 〇 〇 4, 10–11, 23
(2) Scope 2 emissions37–38 Material Flow 〇 〇 7–839–40, 44 Climate Change Mitigation 〇 〇 〇 4,10–11, 23, 29
(3) Scope 3 emissions37–38 Material Flow 〇 7–839 Climate Change Mitigation 〇 〇 〇 4
Emission Intensity(1) Greenhouse gas emission intensity 40, 45 Climate Change Mitigation 〇 11Energy Usage
(1) Breakdown of energy usage and overall energy usage
37–38 Material Flow 〇 7–8
40, 44 Climate Change Mitigation 〇 Environmental Data Book 〇 11, 23, 29
(2) Renewable energy usage as a percentage of overall energy usage - -
2. Water Resources
(1) Water resource inputs37–38 Material Flow 〇 〇 7–8
53 Resource Recycling 〇 〇 Environmental Data Book 9, 22, 29
(2) Water intensity - -
(3) Water discharge37–38 Material Flow 〇 〇 7–8
- Environmental Data Book
Environmental Data Book 13, 24
(4) Status of water stress 53 Resource Recycling 〇 -3. Biodiversity(1) Impact of business activities on biodiversity 51 Initiatives to Preserve Biodiversity 〇 〇 〇 -(2) Status and extent of the dependency of the
JFE Group’s business activities on biodiversity 51 Initiatives to Preserve Biodiversity 〇 -
(3) Business activities that contribute to biodiversity conservation 51–52 Initiatives to Preserve Biodiversity 〇 〇 -
(4) Status of cooperation with external stakeholders 52 Initiatives to Preserve Biodiversity 〇 〇 〇 -
4. Resource CirculationResource Inputs
(1) Volume of nonrenewable resource inputs37–38 Material Flow 〇 7–8
- Environmental Data Book
Environmental Data Book 9, 22
(2) Volume of renewable resource inputs37–38 Material Flow 〇 7–8
- Environmental Data Book 29
(3) Volume of recycled materials used 37–38 Material Flow 〇 7–8(4) Rate of recycled and reused resources
(= volume of recycled materials used/volume of resource inputs)
37–38 Material Flow 〇 〇 7–8
54 Resource Recycling 〇 〇 9–10, 27–28
Resource Waste
(1) Total production of waste37–38 Material Flow 〇 7–854 Resource Recycling 〇 13, 27–28
(2) Total final disposal volume of waste37–38 Material Flow 〇 〇 7–854 Resource Recycling 〇 〇 13, 27–28
5. Chemical Substances(1) Volume of chemical substances in storage - -
(2) Volume of chemical substance emissions37–38 Material Flow 〇 7–849 Protect the global atmosphere and water 〇 〇 14–21, 24–26
(3) Volume of chemical substances transferred37–38 Material Flow 〇 7–849 Protect the global atmosphere and water 〇 〇 14–21, 24–26
(4) Volume of chemical substances handled (volume used) - -
32JFE Group CSR REPORT 2019 Environmental Data Book

JFE Holdings, Inc.
2-2-3 Uchisaiwaicho, Chiyoda-ku, Tokyo 100-0011, Japanwww.jfe-holdings.co.jp/en
Inquiries:Corporate Planning DepartmentJFE Holdings, Inc.Phone: +81-3-3597-4321Email: [email protected]
CSR REPORT 2019Environmental Data Book
This book contains supplemental information and data relating to environmental measures for three JFE Group companies, as well as information and data relating to the JFE Group’s recycling business. Please read this book in conjunction with the “JFE Group CSR Report 2019” to gain a more comprehensive understanding of JFE’s environmental initiatives.
CONTENTS01 Scope of Report02 Organizational Profile
JFE Group
03 Status of ISO 14001 Certification / JFE Group’s Environmental Accounting04 CO2 Emissions of the JFE Group05 JFE Group Recycling Businesses06 JFE Group’s Recycling Business List
JFE Steel
07 Material Flow09 Input Materials / Output Products10 Recycled Resources / CO2 Emissions and Energy Consumption12 Disposed Substances
JFE Engineering
22 Input Materials / Output Products23 CO2 Emissions and Energy Consumption24 Technologies to Reduce Environmental Load / Disposed Substances / Management of Chemical Substances27 Waste Disposal in Each Section and Works
JFE Shoji Trade
29 Electricity Consumption and CO2 Emissions / Input Materials
30 Independent Assurance Statement31 Comparison with Environmental Reporting Guidelines 2018 (Ministry of the Environment, Japan)
Related Documents


![Transi ation, Report T-A2049-26 · Transi ation, Report T-A2049-26 ",AL r A R I N 1 0 IH AEROSTATIC [EXTERNALLY-PRESSURIZED [o- I' C\, A 0 GAS LUBRICATED] THRUST BEARINGS. 41,u 0](https://static.cupdf.com/doc/110x72/5f75060839be03081e236ba2/transi-ation-report-t-a2049-26-transi-ation-report-t-a2049-26-al-r-a-r.jpg)
![r'r':' . r----- .. -., I - World Bank...r"'r':' . r " o r-----____ .. -., '" THIS REPORT HAS NO]' I BEEN RELEAS~D TQ THE EXECUTIVE DIttECTORS -Rep 0 r t No. EC -98a This report was](https://static.cupdf.com/doc/110x72/60e98f73b2eecb264731e946/rr-r-i-world-bank-rr-r-o-r-.jpg)


