C O V E R S H E E T SEC Registration Number 1 6 3 4 2 C O M P A N Y N A M E S M I N V E S T M E N T S C O R P O R A T I O N A N D S U B S I D I A R I E S PRINCIPAL OFFICE( No. / Street / Barangay / City / Town / Province ) 1 0 t h F l o o r , O n e E - C o m C e n t e r , H a r b o r D r i v e , M a l l o f A s i a C o m p l e x , C B P - 1 A , P a s a y C i t y 1 3 0 0 Form Type Department requiring the report Secondary License Type, If Applicable 1 7 - Q C O M P A N Y I N F O R M A T I O N Company’s Email Address Company’s Telephone Number Mobile Number – 8857-0100 – No. of Stockholders Annual Meeting (Month / Day) Fiscal Year (Month / Day) 1,260 03/31 CONTACT PERSON INFORMATION The designated contact person MUST be an Officer of the Corporation Name of Contact Person Email Address Telephone Number/s Mobile Number Mr. Franklin C. Gomez – 8857-0100 – CONTACT PERSON’s ADDRESS 10 th Floor, One E-Com Center, Harbor Drive, Mall of Asia Complex, CBP-1A, Pasay City 1300 NOTE 1 : In case of death, resignation or cessation of office of the officer designated as contact person, such incident shall be reported to the Commission within thirty (30) calendar days from the occurrence thereof with information and complete contact details of the new contact person designated. 2 : All Boxes must be properly and completely filled-up. Failure to do so shall cause the delay in updating the corporation’s records with the Commission and/or non-receipt of Notice of Deficiencies. Further, non-receipt of Notice of Deficiencies shall not excuse the corporation from liability for its deficiencies.

Welcome message from author
This document is posted to help you gain knowledge. Please leave a comment to let me know what you think about it! Share it to your friends and learn new things together.
Transcript

C O V E R S H E E T
SEC Registration Number
1 6 3 4 2
C O M P A N Y N A M E
S M I N V E S T M E N T S C O R P O R A T I O N A N D
S U B S I D I A R I E S
PRINCIPAL OFFICE( No. / Street / Barangay / City / Town / Province )
1 0 t h F l o o r , O n e E - C o m C e n t e r ,
H a r b o r D r i v e , M a l l o f A s i a C o m
p l e x , C B P - 1 A , P a s a y C i t y 1 3 0 0
Form Type Department requiring the report Secondary License Type, If Applicable
1 7 - Q
C O M P A N Y I N F O R M A T I O N
Company’s Email Address Company’s Telephone Number Mobile Number
– 8857-0100 –
No. of Stockholders Annual Meeting (Month / Day) Fiscal Year (Month / Day)
1,260 03/31
CONTACT PERSON INFORMATION
The designated contact person MUST be an Officer of the Corporation
Name of Contact Person Email Address Telephone Number/s Mobile Number
Mr. Franklin C. Gomez – 8857-0100 –
CONTACT PERSON’s ADDRESS
10th Floor, One E-Com Center, Harbor Drive, Mall of Asia Complex, CBP-1A, Pasay City 1300
NOTE 1 : In case of death, resignation or cessation of office of the officer designated as contact person, such incident shall be reported to the Commission within thirty (30) calendar days from the occurrence thereof with information and complete contact details of the new contact person designated. 2 : All Boxes must be properly and completely filled-up. Failure to do so shall cause the delay in updating the corporation’s records with the Commission and/or non-receipt of Notice of Deficiencies. Further, non-receipt of Notice of Deficiencies shall not excuse the corporation from liability for its deficiencies.
SEC Number 16342
PSE Disclosure Security Code
SM INVESTMENTS CORPORATION (Company’s Full Name)
10th Floor, One E-Com Center, Harbor Drive, Mall of Asia Complex, CBP-IA, Pasay City 1300
(Company’s Address)
8857- 0100 (Telephone Number)
December 31 (Year Ending) (month & day)
SEC Form 17-Q
1st Quarter Report Form Type
Amendment Designation (If applicable)
March 31, 2021 Period Ended Date
(Secondary License Type and File Number)

SECURITIES AND EXCHANGE COMMISSION
SEC FORM 17-Q
QUARTERLY REPORT PURSUANT TO SECTION 17 OF THE SECURITIES REGULATION CODE AND SRC RULE 17(2)(b) THEREUNDER
1. For the quarterly period ended March 31, 2021 2. Commission Identification Number 016342 3. BIR Tax Identification No. 169-020-000 4. Exact name of registrant as specified in its charter SM INVESTMENTS CORPORATION 5. PHILIPPINES Province, Country or other jurisdiction of incorporation or organization 6. Industry Classification Code: (SEC Use Only) 7. 10th Floor, One E-Com Center, Harbor Drive, Mall of Asia Complex, CBP-IA, Pasay City
1300 Address of principal office Postal Code 8. 8857-0100 Registrant's telephone number, including area code 9. Former name, former address, and former fiscal year, if changed since last report. 10. Securities registered pursuant to Sections 8 and 12 of the Code, or Sections 4 and 8 of the
RSA Title of Each Class Number of Shares Amount of Debt Outstanding of Common Stock Outstanding COMMON STOCK P10 PAR VALUE 1,204,582,867 N.A. 11. Are any or all of these securities listed on the Philippine Stock Exchange. Yes [X] No [ ] 12. Indicate by check mark whether the registrant: (a) has filed all reports required to be filed by Section 11 of the Securities Regulation Code
(SRC)and SRC Rule 11(a)-1 thereunder and Sections 26 and 141 of The Corporation Code of the Philippines during the preceding 12 months (or for such shorter period that the registrant was required to file such reports);
Yes [X] No [ ] (b) has been subject to such filing requirements for the past 90 days. Yes [X] No [ ]

TABLE OF CONTENTS PART I – FINANCIAL INFORMATION Item 1. Interim Condensed Consolidated Financial Statements
Interim Consolidated Balance Sheets as at March 31, 2021 (Unaudited),
December 31, 2020 (Audited)
Interim Consolidated Statements of Income for the Three-Month Periods Ended
March 31, 2021 and 2020 (Unaudited)
Interim Consolidated Statements of Changes in Stockholders’ Equity for the
Three-Month Periods Ended March 31, 2021 and 2020 (Unaudited)
Interim Consolidated Statements of Cash Flows for the Three-Month Periods Ended
March 31, 2021 and 2020 (Unaudited)
Notes to Interim Condensed Consolidated Financial Statements Item 2. Management’s Discussion and Analysis of Financial Condition as at March 31, 2021 and December 31, 2020 and Result of Operations for the Three-
Month Periods Ended March 31, 2021 and 2020 Item 3. Aging of Accounts Receivable - Trade as at March 31, 2021 PART II – SIGNATURE

PART I FINANCIAL INFORMATION
Item 1. Interim Condensed Consolidated Financial Statements
SM INVESTMENTS CORPORATION AND SUBSIDIARIES
Interim Condensed Consolidated Financial Statements
as at March 31, 2021 and for the
Three-Month Periods Ended March 31, 2021 and 2020
(with Comparative Audited Consolidated Balance Sheet as at
December 31, 2020)

SM INVESTMENTS CORPORATION AND SUBSIDIARIES
UNAUDITED INTERIM CONSOLIDATED BALANCE SHEET March 31, 2021
With Comparative Audited Figures as at December 31, 2020
(Amounts in Thousands)
March 31,
2021
December 31,
2020
(Unaudited) (Audited)
ASSETS
Current Assets
Cash and cash equivalents (Notes 5 and 22) P=60,411,703 P=78,159,197
Time deposits (Notes 6 and 22) 1,003 31,012
Financial assets at fair value through comprehensive income (FVOCI)
(Notes 7 and 22) 562,050 568,146
Receivables and contract assets (Notes 8 and 22) 60,028,957 60,526,230
Inventories (Note 9) 77,220,685 72,056,045
Other current assets (Notes 10 and 22) 44,217,918 43,170,378
Total Current Assets 242,442,316 254,511,008
Noncurrent Assets
Financial assets at FVOCI - net of current portion (Notes 7 and 22) 24,689,151 27,278,240
Investments in associate companies and joint ventures (Note 11) 299,756,281 296,265,722
Time deposits - net of current portion (Notes 6, 19 and 22) 1,604,447 1,356,442
Property and equipment (Note 12) 26,097,805 26,087,448
Investment properties (Note 13) 440,532,933 435,466,724
Right-of-use assets – net (Note 21) 41,549,226 41,979,029
Intangibles (Note 14) 24,528,018 24,588,503
Deferred tax assets (Note 20) 4,728,490 4,671,969
Other noncurrent assets (Notes 14 and 22) 115,163,163 112,318,650
Total Noncurrent Assets 978,649,514 970,012,727
P=1,221,091,830 P=1,224,523,735
LIABILITIES AND EQUITY
Current Liabilities
Bank loans (Notes 15, 19 and 22) P=18,512,624 P=24,126,000
Accounts payable and other current liabilities (Notes 16 and 22) 135,919,202 149,231,108
Income tax payable 3,494,331 2,649,041
Current portion of long-term debt (Notes 17, 19, 22 and 23) 37,284,685 60,121,438
Dividends payable 3,007,737 3,829,207
Total Current Liabilities 198,218,579 239,956,794
Noncurrent Liabilities
Long-term debt - net of current portion (Notes 17, 19, 22 and 23) 360,219,742 330,731,798
Lease liabilities - net of current portion (Note 21) 28,639,015 28,868,164
Deferred tax liabilities (Note 20) 13,082,483 12,614,979
Tenants’ deposits and others (Notes 22 and 23) 46,201,731 47,624,102
Total Noncurrent Liabilities 448,142,971 419,839,043
Total Liabilities 646,361,550 659,795,837
(Forward)

- 2 -
March 31,
2021
December 31,
2020
(Unaudited) (Audited)
Equity Attributable to Owners of the Parent
Capital stock (Note 18) P=12,045,829 P=12,045,829
Additional paid-in capital 75,823,506 75,823,506
Equity adjustments from common control transactions (5,424,455) (5,424,455)
Cost of Parent common shares held by subsidiaries (25,386) (25,386)
Cumulative translation adjustment 1,059,021 895,922
Net fair value changes on cash flow hedges (1,812,823) (2,741,387)
Net unrealized gain on financial assets at FVOCI 12,144,344 16,506,435
Remeasurement loss on defined benefit asset/obligation (6,066,075) (6,066,075)
Retained earnings (Note 18):
Appropriated 37,000,000 37,000,000
Unappropriated 285,288,769 275,818,556
Total Equity Attributable to Owners of the Parent 410,032,730 403,832,945
Non-controlling Interests 164,697,550 160,894,953
Total Equity 574,730,280 564,727,898
P=1,221,091,830 P=1,224,523,735
See accompanying Notes to Consolidated Financial Statements.

SM INVESTMENTS CORPORATION AND SUBSIDIARIES
UNAUDITED INTERIM CONSOLIDATED STATEMENTS OF INCOME (Amounts in Thousands Except Per Share Data)
Three-Month Periods Ended March 31
2021 2020
(Unaudited) (Unaudited)
REVENUES
Sales:
Merchandise P=68,109,894 P=78,289,599
Real estate 11,749,409 11,293,965
Rent (Note 19) 7,371,952 11,076,148
Equity in net earnings of associate companies and joint ventures 6,145,052 5,298,309
Cinema ticket sales, amusement and others 102,298 955,640
Dividend, management fees and others 3,404,219 4,238,832
96,882,824 111,152,493
COST AND EXPENSES
Cost of sales:
Merchandise (Note 9) 51,213,855 59,434,998
Real estate (Note 13) 5,132,394 4,964,036
Selling, general and administrative expenses 21,897,438 26,550,681
78,243,687 90,949,715
OTHER INCOME (CHARGES)
Interest expense (Note 19) (3,926,078) (4,192,716)
Interest income (Note 19) 502,189 764,626
Gain on fair value changes on derivatives - net (Note 23) 161,408 472
Foreign exchange gain (loss) - net and others (Note 22) 17,038 (10,097)
(3,245,443) (3,437,715)
INCOME BEFORE INCOME TAX 15,393,694 16,765,063
PROVISION FOR INCOME TAX (Note 20)
Current 1,524,651 2,727,400
Deferred 416,079 260,770
1,940,730 2,988,170
NET INCOME P=13,452,964 P=13,776,893
Attributable to
Owners of the Parent P=9,470,213 P=9,007,277
Non-controlling interests 3,982,751 4,769,616
P=13,452,964 P=13,776,893
Basic/Diluted Earnings Per Common Share
Attributable to Owners of the Parent (Note 24) P=7.86 P=7.48
See accompanying Notes to Consolidated Financial Statements.

SM INVESTMENTS CORPORATION AND SUBSIDIARIES
UNAUDITED INTERIM CONSOLIDATED STATEMENTS OF
COMPREHENSIVE INCOME (Amounts in Thousands)
Three-Month Periods Ended March 31
2021 2020
(Unaudited) (Unaudited)
NET INCOME P=13,452,964 P=13,776,893
OTHER COMPREHENSIVE INCOME (LOSS)
Items that will be reclassified to profit or loss in subsequent periods
Share in unrealized loss on financial assets at fair value through other
comprehensive income (FVOCI) of associates (2,168,675) (2,860,183)
Cumulative translation adjustment 218,496 (231,447)
Net fair value changes on cash flow hedges 1,296,935 (184,091)
(653,244) (3,275,721)
Items not to be reclassified to profit or loss in subsequent periods
Net unrealized loss on financial assets at FVOCI (1,149,402) (8,991,818)
Income tax relating to items not to be reclassified to profit
or loss in subsequent periods (1,454,988) (129,618)
(2,604,390) (9,121,436)
TOTAL COMPREHENSIVE INCOME P=10,195,330 P=1,379,736
Attributable to
Owners of the Parent P=6,199,785 (P=1,622,486)
Non-controlling interests 3,995,545 3,002,222
P=10,195,330 P=1,379,736
See accompanying Notes to Consolidated Financial Statements.

SM INVESTMENTS CORPORATION AND SUBSIDIARIES
UNAUDITED INTERIM CONSOLIDATED STATEMENTS OF CHANGES IN EQUITY FOR THE THREE-MONTH PERIODS ENDED MARCH 31, 2021 AND 2020
(Amounts in Thousands Except Per Share Data)
Equity Attributable to Owners of the Parent
Capital Stock
Additional
Paid-in Capital
Equity
Adjustments
from Common
Control
Transactions
Cost of Parent
Common
Shares Held
by Subsidiaries
Cumulative
Translation
Adjustment
Net Fair Value
Changes on Cash
Flow Hedges
Net Unrealized
Gain (Loss) on
Financial Assets
at Fair Value
through other
Comprehensive
Income (FVOCI)
Remeasurement
loss on Defined
Benefit Asset/
Obligation
Appropriated
Retained
Earnings
Unappropriated
Retained
Earnings Total
Non-controlling
Interests
Total
Equity
As at December 31, 2020 P=12,045,829 P=75,823,506 (P=5,424,455) (P=25,386) P=895,922 (P=2,741,387) P=16,506,435 (P=6,066,075) P=37,000,000 P=275,818,556 P=403,832,945 P=160,894,953 P=564,727,898
Net income – – – – – – – – – 9,470,213 9,470,213 3,982,751 13,452,964
Other comprehensive income – – – – 163,099 928,564 (4,362,091) – – – (3,270,428) 12,794 (3,257,634)
Total comprehensive income – – – – 163,099 928,564 (4,362,091) – – 9,470,213 6,199,785 3,995,545 10,195,330
Decrease in previous year’s non-controlling interests – – – – – – – – – – – (192,948) (192,948)
As at March 31, 2021 (Unaudited) P=12,045,829 P=75,823,506 (P=5,424,455) (P=25,386) P=1,059,021 (P=1,812,823) P=12,144,344 (P=6,066,075) P=37,000,000 P=285,288,769 P=410,032,730 P=164,697,550 P=574,730,280
As at December 31, 2019 P=12,045,829 P=75,815,923 (P=5,424,455) (P=25,386) P=1,308,228
(P=1,406,026) P=14,399,640 (P=8,633,269) P=37,000,000 P=257,546,591 P=382,627,075 P=153,524,403 P=536,151,478
Net income – – – – – – – – – 9,007,277 9,007,277 4,769,616 13,776,893
Other comprehensive income – – – – (117,842) 114,874 (10,626,795) – – – (10,629,763) (1,767,394) (12,397,157)
Total comprehensive income – – – – (117,842) 114,874 (10,626,795) – – 9,007,277 (1,622,486) 3,002,222 1,379,736
Increase in previous year’s non-controlling interests – – – – – – – – – – – 702,928 702,928
As at March 31, 2020 (Unaudited) P=12,045,829 P=75,815,923 (P=5,424,455) (P=25,386) P=1,190,386 (P=1,291,152) P=3,772,845 (P=8,633,269) P=37,000,000 P=266,553,868 P=381,004,589 P=157,229,553 P=538,234,142
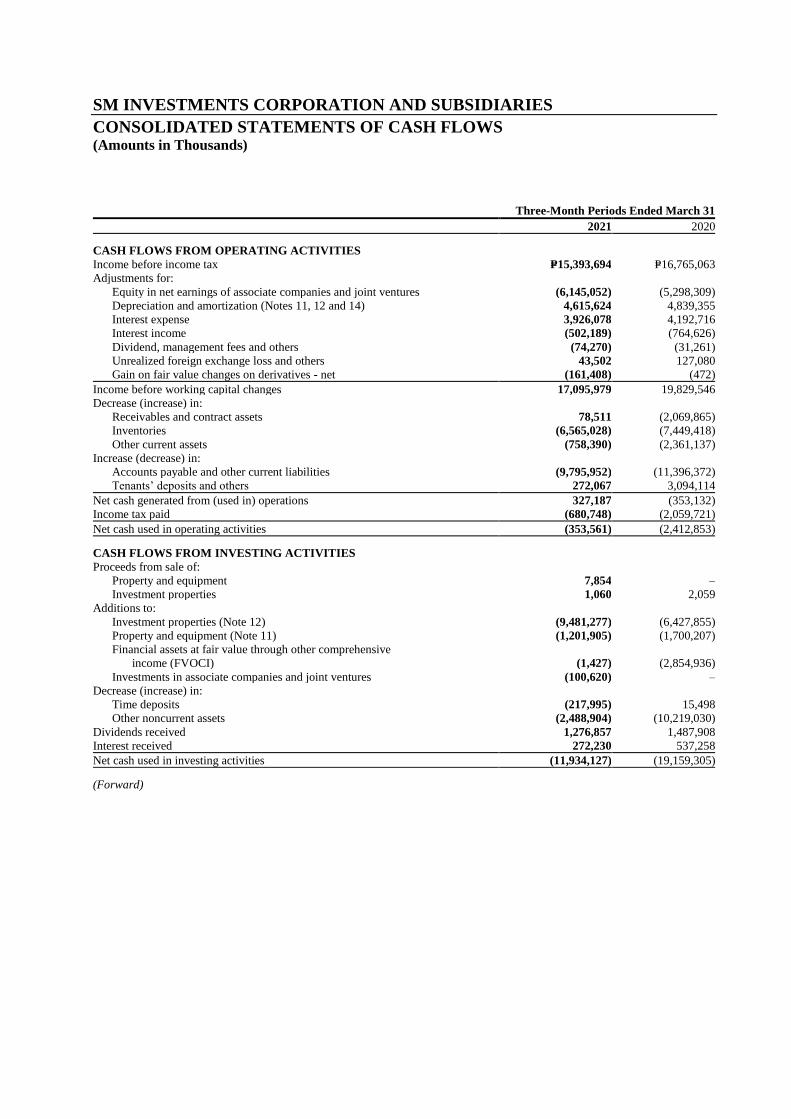
SM INVESTMENTS CORPORATION AND SUBSIDIARIES
CONSOLIDATED STATEMENTS OF CASH FLOWS (Amounts in Thousands)
Three-Month Periods Ended March 31
2021 2020
CASH FLOWS FROM OPERATING ACTIVITIES
Income before income tax P=15,393,694 P=16,765,063
Adjustments for:
Equity in net earnings of associate companies and joint ventures (6,145,052) (5,298,309)
Depreciation and amortization (Notes 11, 12 and 14) 4,615,624 4,839,355
Interest expense 3,926,078 4,192,716
Interest income (502,189) (764,626)
Dividend, management fees and others (74,270) (31,261)
Unrealized foreign exchange loss and others 43,502 127,080
Gain on fair value changes on derivatives - net (161,408) (472)
Income before working capital changes 17,095,979 19,829,546
Decrease (increase) in:
Receivables and contract assets 78,511 (2,069,865)
Inventories (6,565,028) (7,449,418)
Other current assets (758,390) (2,361,137)
Increase (decrease) in:
Accounts payable and other current liabilities (9,795,952) (11,396,372)
Tenants’ deposits and others 272,067 3,094,114
Net cash generated from (used in) operations 327,187 (353,132)
Income tax paid (680,748) (2,059,721)
Net cash used in operating activities (353,561) (2,412,853)
CASH FLOWS FROM INVESTING ACTIVITIES
Proceeds from sale of:
Property and equipment 7,854 –
Investment properties 1,060 2,059
Additions to:
Investment properties (Note 12) (9,481,277) (6,427,855)
Property and equipment (Note 11) (1,201,905) (1,700,207)
Financial assets at fair value through other comprehensive
income (FVOCI) (1,427) (2,854,936)
Investments in associate companies and joint ventures (100,620) –
Decrease (increase) in:
Time deposits (217,995) 15,498
Other noncurrent assets (2,488,904) (10,219,030)
Dividends received 1,276,857 1,487,908
Interest received 272,230 537,258
Net cash used in investing activities (11,934,127) (19,159,305)
(Forward)

- 2 -
Three-Month Periods Ended March 31
2021 2020
CASH FLOWS FROM FINANCING ACTIVITIES
Availments of:
Long-term debt P=40,481,635 P=17,600,412
Bank loans 708,624 28,223,000
Payments of:
Long-term debt (34,592,386) (13,452,316)
Bank loans (6,322,000) (11,202,291)
Lease liabilities (1,480,465) (790,178)
Dividends (821,470) (247,075)
Interest (3,530,783) (3,630,577)
Net cash provided by (used in) financing activities (5,556,845) 16,500,975
NET DECREASE IN CASH
AND CASH EQUIVALENTS (17,844,533) (5,071,183)
EFFECT OF EXCHANGE RATE CHANGES
ON CASH AND CASH EQUIVALENTS 97,039 (313,879)
CASH AND CASH EQUIVALENTS AT BEGINNING
OF PERIOD (Note 5) 78,159,197 76,213,774
CASH AND CASH EQUIVALENTS AT END OF PERIOD (Note 5) P=60,411,703 P=70,828,712
See accompanying Notes to Consolidated Financial Statements.

SM INVESTMENTS CORPORATION AND SUBSIDIARIES
NOTES TO CONSOLIDATED FINANCIAL STATEMENTS
1. Corporate Information
SM Investments Corporation (SMIC or Parent Company) was incorporated in the Philippines on
January 15, 1960. On December 27, 2019, the Philippine Securities and Exchange Commission (SEC)
approved the amendment of the Parent Company’s articles of incorporation changing its corporate life
to perpetual. Its registered office address is 10th Floor, One E-Com Center, Harbor Drive, Mall of Asia
Complex, CBP-1A, Pasay City 1300.
SMIC is one of the largest publicly listed companies in the Philippines with interests in market
leading businesses in retail, banking and property. It also invests in ventures that capture high growth
opportunities in the emerging Philippine economy.
The accompanying interim consolidated financial statements were authorized for issue by the Board
of Directors (BOD), as approved and recommended for approval by the Audit Committee on
May 5, 2021.
2. Basis of Preparation and Statement of Compliance
Basis of Preparation
The interim condensed consolidated financial statements of the Parent Company and its subsidiaries
(the Group) are prepared on a historical cost basis, except for derivative financial instruments and
financial assets at fair value through other comprehensive income (FVOCI) and liabilities which are
measured at fair value. The consolidated financial statements are presented in Philippine Peso, which
is the Parent Company’s functional and presentation currency under Philippine Financial Reporting
Standards (PFRSs). All values are rounded to the nearest thousand Peso except when otherwise
indicated.
The interim condensed consolidated financial statements have been prepared under the going concern
assumption. The Group believes that its businesses would remain relevant despite challenges posed
by the COVID-19 pandemic. Despite the adverse impact of the COVID-19 pandemic on short-term
business results, long-term prospects remain attractive.
The interim condensed consolidated financial statements do not include all the information and
disclosures required in the annual consolidated financial statements, and should be read in
conjunction with the Group’s audited consolidated financial statements as at December 31, 2020.
Basis of Consolidation
The interim condensed consolidated financial statements comprise the financial statements of the
Parent Company and its subsidiaries. As at March 31, 2021, there were no significant changes in the
Parent Company’s ownership interest in its subsidiaries.

- 2 -
Significant Accounting Judgments, Estimates and Assumptions
The preparation of the interim condensed consolidated financial statements requires management to
make judgments, estimates and assumptions that affect the amounts reported in the consolidated
financial statements and accompanying notes. Changes in these estimates and assumptions could
result in outcomes that may require material adjustments to the carrying amounts of the affected
assets or liabilities in the future.
Except as otherwise stated, there were no significant changes in accounting judgments, estimates, and
assumptions that affect the amounts reported in the consolidated financial statements and
accompanying notes.
3. Summary of Significant Accounting Policies, Changes and Improvements
The following new PFRSs became effective beginning January 1, 2021:
▪ Amendments to PFRS 9, PFRS 7, PFRS 4 and PFRS 16, Interest Rate Benchmark Reform –
Phase 2
The amendments provide the following temporary reliefs which address the financial reporting
effects when an interbank offered rate (IBOR) is replaced with an alternative nearly risk-free
interest rate (RFR):
• Practical expedient for changes in the basis for determining the contractual cash flows as
a result of IBOR reform.
• Relief from discontinuing hedging relationships.
• Relief from the separately identifiable requirement when an RFR instrument is
designated as a hedge of a risk component.
The following information shall also be disclosed:
• Nature and extent of risks to which the entity is exposed arising from financial
instruments subject to IBOR reform, and how the entity manages those risks; and
• Progress in completing the transition to alternative benchmark rates, and how the entity is
managing that transition
The amendments are effective for annual reporting periods beginning on or after January 1, 2021,
with retroactive application and without restatement of prior period financial statements.
Effective beginning on or after January 1, 2022
▪ Amendments to PFRS 3, Reference to the Conceptual Framework
The amendments are intended to replace a reference to the Framework for the Preparation and
Presentation of Financial Statements, issued in 1989, with a reference to the Conceptual
Framework for Financial Reporting issued in March 2018 without significantly changing its
requirements. The amendments added an exception to the recognition principle of PFRS 3,
Business Combinations to avoid the issue of potential ‘day 2’gains or losses arising for liabilities
and contingent liabilities that would be within the scope of PAS 37, Provisions, Contingent
Liabilities and Contingent Assets or Philippine Interpretation International Financial Reporting
Interpretations Committee (IFRIC) 21, Levies, if incurred separately.

- 3 -
At the same time, the amendments add a new paragraph to PFRS 3 to clarify that contingent
assets do not qualify for recognition at the acquisition date.
The amendments are effective for annual reporting periods beginning on or after January 1, 2022
with retroactive application.
4. Segment Information
The Group has identified three reportable operating segments as follows: property, retail, and
banking and others.
The property segment is involved in mall, residential and commercial development and hotel and
convention center operations. The mall segment develops, conducts, operates and maintains the
business of modern commercial shopping centers and all businesses related thereto such as the
conduct, operation and maintenance of shopping center spaces for rent, amusement centers and
cinemas within the compound of the shopping centers. The residential and commercial segments are
involved in the development and transformation of major residential, commercial, entertainment and
tourism districts through sustained capital investments in buildings and infrastructure. The hotels and
convention centers segment engages in and carries on the business of hotels and convention centers
and operates and maintains any and all services and facilities incident thereto.
The retail segment is engaged in the retail/wholesale trading of merchandise such as dry goods,
wearing apparels, food and other merchandise.
The banking and others segment primarily includes the operations of the Parent Company which is
engaged in asset management and capital investments as well as its associate companies which
include the banks.
The BOD monitors the operating results of each of its business units for the purpose of making
decisions about resource allocation and performance assessment. Segment performance is evaluated
based on operating profit or loss and is measured consistently with the operating profit or loss in the
consolidated financial statements.
Operating Segment Financial Data
Three-Month Period Ended March 31, 2021 (Unaudited)
Property Retail
Banking
and Others
Eliminations/
Adjustments Consolidated
(In Thousands)
Revenue:
External customers P=19,971,916 P=69,940,961 P=6,969,947 P=– P=96,882,824
Inter-segment 2,306,923 42,371 484,306 (2,833,600) –
P=22,278,839 P=69,983,332 P=7,454,253 (P=2,833,600) P=111,152,493
Segment results:
Income before income tax P=7,906,053 P=2,483,888 P=5,003,753 P=– P=15,393,694
Provision for income tax (1,279,662) (663,189) 2,121 – (1,940,730)
Net income P=6,626,391 P=1,820,699 P=5,005,874 P=– P=13,776,893
Net income attributable to:
Owners of the Parent P=3,238,501 P=1,301,184 P=4,930,528 P=– P=9,470,213
Non-controlling interests 3,387,890 519,515 75,346 – 3,982,751

- 4 -
Three-Month Period Ended March 31, 2020 (Unaudited)
Property Retail Banking
and Others Eliminations/ Adjustments Consolidated
(In Thousands)
Revenue:
External customers P=24,453,291 P=80,927,693 P=5,771,509 P=– P=111,152,493 Inter-segment 3,028,498 – 605,840 (3,634,338) –
P=27,481,789 P=80,927,693 P=6,377,349 (P=3,634,338) P=111,152,493
Segment results: Income before income tax P=10,771,091 P=2,079,521 P=3,914,451 P=– P=16,765,063
Provision for income tax (2,172,200) (745,473) (70,497) – (2,988,170)
Net income P=8,598,891 P=1,334,048 P=3,843,954 P=– P=13,776,893
Net income attributable to:
Owners of the Parent P=4,273,442 P=950,387 P=3,783,448 P=– P=9,007,277
Non-controlling interests 4,325,449 383,661 60,506 – 4,769,616

- 5 -
5. Cash and Cash Equivalents
This account consists of:
March 31,
2021
(Unaudited)
December 31,
2020
(Audited)
(In Thousands)
Cash on hand and in banks (Note 19) P=16,729,358 P=26,603,364
Temporary investments (Note 19) 43,682,345 51,555,833
P=60,411,703 P=78,159,197
Cash in banks earn interest at the respective bank deposit rates. Temporary investments are made for
varying periods of up to three months depending on the immediate cash requirements of the Group.
These investments earn interest at prevailing rates.
6. Time Deposits
This account consists of time deposits as follows:
March 31,
2021
(Unaudited)
December 31,
2020
(Audited)
(In Thousands)
Current P=1,003 P=31,012
Noncurrent 1,604,447 1,356,442
P=1,605,450 P=1,387,454
The time deposits bear interest ranging from 0.3% to 3.8% in 2021 and 0.5% to 1.6% in 2020.
Time deposits with various maturities within one year were used as collateral for some credit lines.

- 6 -
7. Financial Assets at FVOCI
This account consists of:
March 31,
2021
(Unaudited)
December 31,
2020
(Audited)
(In Thousands)
Financial assets at FVOCI: Shares of stock
Listed P=23,532,419 P=26,133,219
Unlisted 1,703,762 1,701,227
Club shares 15,020 11,940
25,251,201 27,846,386
Less current portion 562,050 568,146
Noncurrent portion P=24,689,151 P=27,278,240
8. Receivables and Contract Assets
This account consists of:
March 31,
2021
(Unaudited)
December 31,
2020
(Audited)
(In Thousands)
Trade:
Real estate buyers P=100,502,973 P=97,178,460
Third party tenants 6,254,820 5,868,337
Related party tenants (Note 19) 312,485 972,723
Others 16,598 38,512
Due from related parties (Note 19) 34,680 1,180,589
Management and service fees (Note 19) 2,343,633 2,437,479
Dividends (Note 19) 262,661 732,953
109,727,850 108,409,053
Less allowance for expected credit loss (ECL) 1,066,859 1,066,130
108,660,991 107,342,923
Less noncurrent portion of receivables from
real estate buyers (Note 14) 48,632,034 46,816,693
Current portion P=60,028,957 P=60,526,230 *Includes unbilled revenue from sale of real estate amounting to P=84,115.5 million and P=86,631.4 million as at March 31, 2021 and December 31, 2020, respectively.
Allowance for ECL is provided for receivable from sales of real estate, receivable from tenants and
other receivables which were identified to be impaired based on specific assessment.

- 7 -
9. Inventories
This account consists of:
March 31,
2021
(Unaudited)
December 31,
2020
(Audited)
(In Thousands)
Merchandise inventories - at cost P=30,924,760 P=28,352,564
Land and development - current 33,176,619 34,933,442
Condominium and residential units for sale 13,119,306 8,770,039
P=77,220,685 P=72,056,045
Merchandise Inventories
The movements in this account follow:
March 31,
2021
(Unaudited)
December 31,
2020
(Audited)
(In Thousands)
Balance at beginning of year P=28,352,564 P=33,157,622
Purchases 53,786,051 215,440,140
Total goods available for sale 82,138,615 248,597,762
Less cost of merchandise sales 51,213,855 220,245,198
Balance at end of period P=30,924,760 P=28,352,564
The merchandise inventories are stated at cost as at March 31, 2021 and December 31, 2020.
Land and Development
The movements in “Land and development - current” accounted as real estate inventories follow:
March 31,
2021
(Unaudited)
December 31,
2020
(Audited)
(In Thousands)
Balance at beginning of year P=34,933,442 P=37,935,968
Development cost incurred 5,702,955 18,139,432
Transfer from land and development - noncurrent
(Note 13) 2,023,232 1,830,013
Cost of real estate sold (4,527,056) (18,447,226)
Transfer to condominium and residential units for sale (4,922,631) (4,850,262)
Reclassification and others (33,323) 325,517
Balance at end of period P=33,176,619 P=34,933,442
Land and development includes the cost of land as well as construction cost of ongoing residential
projects.
Included in land and development accounted as real estate inventories are contract fulfillment assets
amounting to P=2,061.1 million and P=1,745.0 million as at March 31, 2021 and December 31, 2020,
respectively, representing the unamortized portion of land cost.

- 8 -
The estimated cost to complete the projects amounted to P=108,743.3 million and P=106,678.6 million
as at March 31, 2021 and December 31, 2020, respectively.
Land and development is stated at cost. There is no allowance for inventory writedown as at March
31, 2021 and December 31, 2020.
Condominium and Residential Units for Sale
The movements in this account follow:
March 31,
2021
(Unaudited)
December 31,
2020
(Audited)
(In Thousands)
Balance at beginning of year P=8,770,039 P=6,026,426
Transfer from land and development 4,922,631 4,850,262
Cost of real estate sold (605,338) (2,136,756)
Repossessed inventories and others 31,974 30,107
Balance at end of period P=13,119,306 P=8,770,039
The condominium and residential units for sale are stated at cost as at March 31, 2021 and December
31, 2020.
10. Other Current Assets
This account consists of:
March 31,
2021
(Unaudited)
December 31,
2020
(Audited)
(In Thousands)
Prepaid taxes and other prepayments P=15,680,227 P=14,249,890
Bonds and deposits 10,152,993 9,983,733
Receivable from banks 5,065,736 5,537,179
Non-trade receivables 3,843,612 4,854,679
Input tax 5,560,887 5,113,251
Accrued interest receivable (Note 19) 418,644 188,685
Escrow fund (Note 19) 194,517 144,209
Uniform and supplies inventory 1,201,645 1,165,786
Derivative assets 52,104 2,747
Others 2,047,553 1,930,219
P=44,217,918 P=43,170,378
11. Investments in Associate Companies and Joint Ventures
The P=3.5 billion increase in this account pertains mainly to equity in earnings, net of share in net
comprehensive loss and dividends of associate companies and joint ventures.
- 9 -
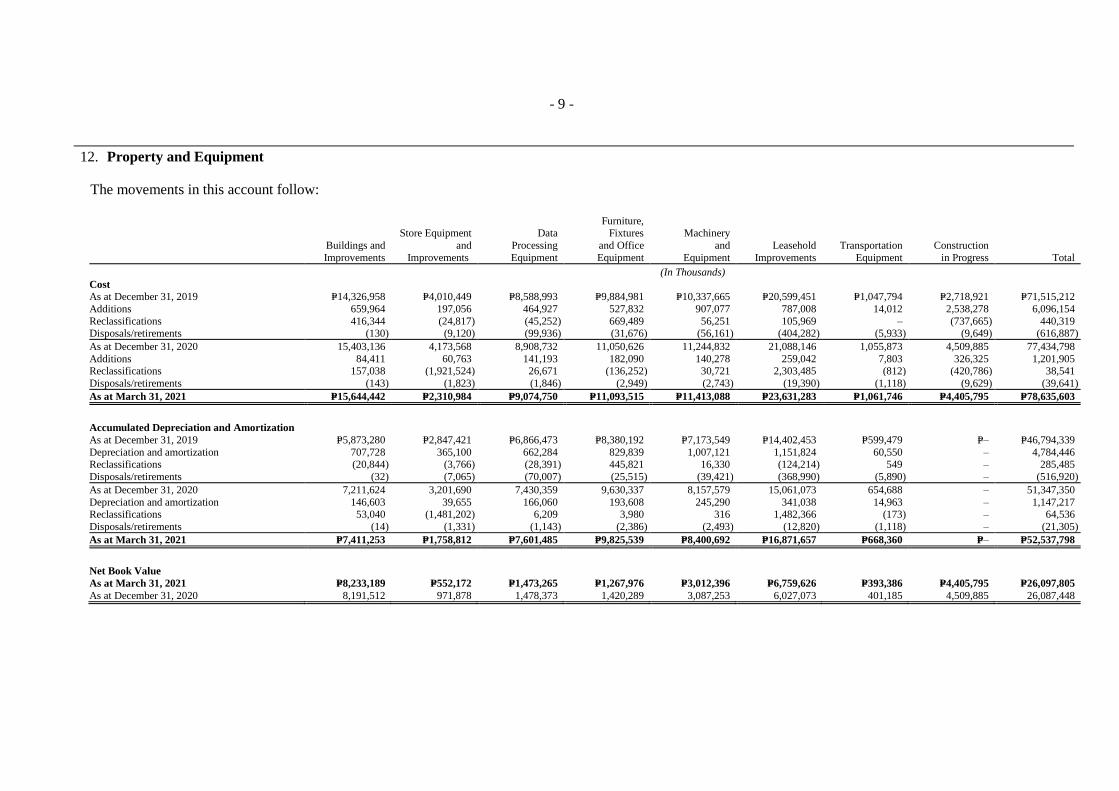
12. Property and Equipment
The movements in this account follow:
Buildings and
Improvements
Store Equipment
and
Improvements
Data
Processing
Equipment
Furniture, Fixtures
and Office
Equipment
Machinery
and
Equipment
Leasehold
Improvements
Transportation
Equipment
Construction
in Progress Total
(In Thousands)
Cost As at December 31, 2019 P=14,326,958 P=4,010,449 P=8,588,993 P=9,884,981 P=10,337,665 P=20,599,451 P=1,047,794 P=2,718,921 P=71,515,212
Additions 659,964 197,056 464,927 527,832 907,077 787,008 14,012 2,538,278 6,096,154
Reclassifications 416,344 (24,817) (45,252) 669,489 56,251 105,969 – (737,665) 440,319 Disposals/retirements (130) (9,120) (99,936) (31,676) (56,161) (404,282) (5,933) (9,649) (616,887)
As at December 31, 2020 15,403,136 4,173,568 8,908,732 11,050,626 11,244,832 21,088,146 1,055,873 4,509,885 77,434,798
Additions 84,411 60,763 141,193 182,090 140,278 259,042 7,803 326,325 1,201,905 Reclassifications 157,038 (1,921,524) 26,671 (136,252) 30,721 2,303,485 (812) (420,786) 38,541
Disposals/retirements (143) (1,823) (1,846) (2,949) (2,743) (19,390) (1,118) (9,629) (39,641)
As at March 31, 2021 P=15,644,442 P=2,310,984 P=9,074,750 P=11,093,515 P=11,413,088 P=23,631,283 P=1,061,746 P=4,405,795 P=78,635,603
Accumulated Depreciation and Amortization
As at December 31, 2019 P=5,873,280 P=2,847,421 P=6,866,473 P=8,380,192 P=7,173,549 P=14,402,453 P=599,479 P=– P=46,794,339
Depreciation and amortization 707,728 365,100 662,284 829,839 1,007,121 1,151,824 60,550 – 4,784,446 Reclassifications (20,844) (3,766) (28,391) 445,821 16,330 (124,214) 549 – 285,485
Disposals/retirements (32) (7,065) (70,007) (25,515) (39,421) (368,990) (5,890) – (516,920)
As at December 31, 2020 7,211,624 3,201,690 7,430,359 9,630,337 8,157,579 15,061,073 654,688 – 51,347,350
Depreciation and amortization 146,603 39,655 166,060 193,608 245,290 341,038 14,963 – 1,147,217 Reclassifications 53,040 (1,481,202) 6,209 3,980 316 1,482,366 (173) – 64,536
Disposals/retirements (14) (1,331) (1,143) (2,386) (2,493) (12,820) (1,118) – (21,305)
As at March 31, 2021 P=7,411,253 P=1,758,812 P=7,601,485 P=9,825,539 P=8,400,692 P=16,871,657 P=668,360 P=– P=52,537,798
Net Book Value
As at March 31, 2021 P=8,233,189 P=552,172 P=1,473,265 P=1,267,976 P=3,012,396 P=6,759,626 P=393,386 P=4,405,795 P=26,097,805
As at December 31, 2020 8,191,512 971,878 1,478,373 1,420,289 3,087,253 6,027,073 401,185 4,509,885 26,087,448

- 10 -
13. Investment Properties
The movements in this account follow:
Land held for
future
development
Land and
Improvements
Buildings
and Leasehold
Improvements
Building Equipment,
Furniture
and Others
Construction
in Progress Total
(In Thousands)
Cost As at December 31, 2019 P=74,946,694 P=75,010,749 P=256,054,842 P=42,705,274 P=54,184,595 P=502,902,154
Additions 6,619,150 3,540,562 2,072,819 1,486,926 24,695,842 38,415,299
Reclassifications (1,830,013) (620,425) 7,509,703 862,027 (7,962,160) (2,040,868) Translation adjustment – 15,655 469,724 37,418 42,657 565,454
Disposals (4,113,632) (44,242) (80) (121,218) – (4,279,172)
As at December 31, 2020 75,622,199 77,902,299 266,107,008 44,970,427 70,960,934 535,562,867 Additions 2,061,837 1,579,797 705,232 193,986 4,940,425 9,481,277
Reclassifications (2,026,973) (1,453,410) 3,433,140 568,000 (2,542,953) (2,022,196)
Translation adjustment – 10,053 247,246 19,428 41,030 317,757 Disposals – – – (16,129) – (16,129)
As at March 31, 2021 P=75,657,063 P=78,038,739 P=270,492,626 P=45,735,712 P=73,399,436 P=543,323,576
Accumulated Depreciation, Amortization
and Impairment Loss
As at December 31, 2019 P=– P=2,366,460 P=60,326,773 P=27,186,924 P=– P=89,880,157
Depreciation and amortization – 251,543 7,589,858 2,358,514 – 10,199,915 Reclassifications – – 735 – – 735
Translation adjustment – 12,180 111,470 25,372 – 149,022
Disposals – (26,301) (8) (107,377) – (133,686)
As at December 31, 2020 – 2,603,882 68,028,828 29,463,433 – 100,096,143 Depreciation and amortization – 70,905 1,898,973 674,352 – 2,644,230
Reclassifications – – (1,474) 1,432 – (42)
Translation adjustment – 5,139 49,923 11,294 – 66,356
Disposals – – (16,044) – (16,044)
As at March 31, 2021 P=– P=2,679,926 P=69,976,250 P=30,134,467 P=– P=102,790,643
Net Book Value As at March 31, 2021 P=75,657,063 P=75,358,813 P=200,516,376 P=15,601,245 P=73,399,436 P=440,532,933
As at December 31, 2020 75,622,199 75,298,417 198,078,180 15,506,994 70,960,934 435,466,724
Construction in progress includes construction costs incurred for new shopping malls, commercial
building and redevelopment of existing malls amounting to P=71,206.3 million and P=70,277.9 million
as at March 31, 2021 and December 31, 2020, respectively.
Interest capitalized to investment properties amounted to P=1,327.5 million and P=3,539.8 million as at
March 31, 2021 and December 31, 2020, respectively. Capitalization rates used range from 3.9% to
4.6% in 2021 and 2.4% to 4.7% in 2020.
The fair value of investment properties is categorized under Level 3 since valuation is based on
unobservable inputs.
The fair value of substantially all investment properties amounting to P=1,350.8 million was
determined by accredited independent appraisers with appropriate qualifications and experience in the
valuation of similar properties in the relevant locations. The fair value represents the price that would
be received to sell the investment properties in an orderly transaction between market participants at
the measurement date.
Management believes that the impact of COVID-19 on the fair value measurement of investment
properties is short-term and temporary.

- 11 -
The Company has no restriction on the realizability of its investment properties and no obligation to
purchase, construct or develop, repair, maintain and/or enhance any of these properties.
14. Intangibles and Other Noncurrent Assets
Intangible Assets
This account consists of:
March 31,
2021
(Unaudited)
December 31,
2020
(Audited)
(In Thousands)
Goodwill P=17,456,168 P=17,456,385
Less accumulated impairment loss 91,620 91,620
Net book value 17,364,548 17,364,765
Trademarks and brand names 7,163,470 7,223,738
P=24,528,018 P=24,588,503
Other Noncurrent Assets
This account consists of:
March 31,
2021
(Unaudited)
December 31,
2020
(Audited)
(In Thousands)
Bonds and deposits P=56,825,719 P=56,259,937
Receivables from real estate buyers (Note 8) 48,632,034 46,816,693
Long-term notes (Notes 19 and 23) 5,066,434 4,999,359
Deferred input VAT 1,878,747 1,804,670
Derivative assets (Note 23) 167,985 –
Land use rights 358,372 353,217
Escrow fund (Note 19) 132,460 132,460
Defined benefit asset 530,990 546,515
Others 1,570,422 1,405,799
P=115,163,163 P=112,318,650
15. Bank Loans
This account consists of Philippine peso and China yuan renminbi denominated loans of Subsidiaries
amounting to P18,512.6 million as at March 31, 2021 and P24,126.0 million as at December 31,
2020. The loans bear fixed interest ranging from 3.1% to 4.0% in 2021 and 2.8% to 5.3% in 2020.

- 12 -
16. Accounts Payable and Other Current Liabilities
This account consists of:
March 31,
2021
(Unaudited)
December 31,
2020
(Audited)
(In Thousands)
Trade P=69,896,617 P=82,599,493
Tenants and customers’ deposits 12,819,542 12,411,589
Accrued expenses 14,065,519 12,713,644
Nontrade 15,134,202 14,474,774
Payable arising from acquisition of land 7,166,882 7,357,422
Payables to government agencies 4,328,031 4,722,145
Accrued interest (Note 19) 3,322,016 3,112,821
Subscriptions payable 2,021,790 2,021,790
Due to related parties (Note 19) 1,435 823,779
Lease liabilities (Note 21) 1,977,980 2,011,714
Gift checks redeemable and others 5,185,188 6,981,937
P=135,919,202 P=149,231,108 *Includes unearned revenue from sale of real estate amounting to P=6,757.5 million and P=7,615.0 million as at March 31, 2021
and December 31, 2020, respectively.
17. Long-term Debt
This account consists of:
Availment Maturity Interest Rate/Term Security
March 31,
2021
(Unaudited)
December 31, 2020
(Audited)
(In Thousands)
Parent Company
U.S. dollar-
denominated
June 10, 2014 -
July 16, 2019
March 28 2022 -
June 28, 2024
Fixed 6.1%; three-
month LIBOR +
margin; semi-annual
and quarterly
Unsecured P=43,053,814
P=42,604,024
Peso-denominated July 16, 2012 - March 17, 2021
January 17, 2021 - March 17, 2028
Fixed 2.9%-6.9%; three-month PHP
BVAL + margin;
semi-annual and
quarterly
Unsecured 83,023,014 79,023,014
Subsidiaries
U.S. dollar-
denominated
March 21, 2016 -
January 29, 2021
January 29, 2021 -
January 25, 2026
LIBOR + spread;
semi-annual and quarterly
Unsecured 50,269,362 49,754,404
China Yuan Renminbi-
denominated
October 16, 2017 October 16, 2022 Fixed - 5.9%
Unsecured 2,575,051 2,559,639
Peso-denominated June 19, 2012 - March 1, 2021
January 29, 2021 - August 7, 2029
Fixed 2.5%-6.5%; BVAL + margin
Unsecured 220,839,430 218,882,964
399,760,671 392,824,045 Less debt issue cost 2,256,244 1,970,809
397,504,427 390,853,236 Less current portion 37,284,685 60,121,438
P=360,219,742 P=330,731,798
BVAL – Bloomberg Valuation
LIBOR – London Interbank Offered Rate

- 13 -
Repayment Schedule
The repayment schedule of long-term debt as at March 31, 2021 follows:
Gross Debt Debt Issue Cost Net
(In Thousands)
Within 1 year P=37,887,433 P=602,748 P=37,284,685
Over 1 year to 5 years 338,410,778 1,597,726 336,813,052
Over 5 years 23,462,460 55,770 23,406,690
P=399,760,671 P=2,256,244 P=397,504,427
Covenants
The long-term debt of the Group is covered with certain covenants including adherence to financial
ratios. As at March 31, 2021and December 31, 2020, the Group is in compliance with the terms of its
debt covenants.
18. Equity
Capital Stock
a. Common stock
Number of Shares
March 31,
2021
(Unaudited)
December 31,
2020
(Audited)
Authorized - P=10 par value per share 2,790,000,000 2,790,000,000
Issued and subscribed 1,204,582,867 1,204,582,867
As at March 31, 2021 and December 31, 2020, the Parent Company is compliant with the
minimum public float as required by the PSE.
The total number of shareholders of the Parent Company is 1,260 and 1,256 as at March 31, 2021
and December 31, 2020, respectively.
b. Redeemable preferred shares
Number of Shares
March 31,
2021
(Unaudited)
December 31,
2020
(Audited)
Authorized - P=10 par value per share 10,000,000 10,000,000
There are no issued and subscribed preferred shares as at March 31, 2021 and
December 31, 2020.

- 14 -
Retained Earnings
▪ Appropriated
Retained earnings appropriated as at March 31, 2021 is intended for the payment of certain long-
term debts and new investments as follows:
Timeline Amount
(In Thousands)
Debt service 2020 - 2023 P=27,000,000
Investments 2020 - 2021 10,000,000
P=37,000,000
▪ Unappropriated
The Parent Company’s cash dividend declaration in 2021 follows:
Declaration Date Record Date Payment Date Per Share Total
(In Thousands)
April 28, 2021 May 13, 2021 May 27, 2021 P=4.25 P=5,119,477
Unappropriated retained earnings include the accumulated equity in net earnings of subsidiaries,
associates and joint ventures amounting to P=264,139.4 million and P=254,371.2 million as at March
31, 2021 and December 31, 2020, respectively, that is not available for distribution until such time
that the Parent Company receives the dividends from the respective subsidiaries, associates and
joint ventures.
19. Related Party Disclosures
Parties are considered to be related if one party has the ability, directly and indirectly, to control the
other party or exercise significant influence over the other party in making financial and operating
decisions. Parties are also considered to be related if they are subject to common control.
The significant transactions with related parties follow:
▪ Rent
The Group has existing lease agreements for office and commercial spaces with related
companies (retail and banking group and other related parties under common stockholders).
▪ Royalty, Management and Service Fees
The Parent Company and SM Retail receive management and service fees from retail entities
under common stockholders for management, consultancy, manpower and other services. In
addition to management and service fees, the Parent Company also receives royalty fees from
certain related parties.

- 15 -
▪ Dividend Income
The Group earns dividend income from certain related parties under common stockholders.
▪ Cash Placements and Loans
The Group has certain bank accounts and cash placements as well as bank loans and debts with
BDO and China Bank. Such accounts earn interest at prevailing market rates.
▪ Notes Receivable
The Group has certain notes receivable from Carmen Copper Corporation (see Notes 14 and 22).
▪ Others
The Group, in the normal course of business, has outstanding receivables from and payables to
related companies which are unsecured and normally settled in cash.
The related party transactions and outstanding balances follow:
Transaction Amount Outstanding Amount
March 31,
2021
March 31,
2020
March 31,
2021
December 31,
2020 Terms Conditions (In Thousands)
Banking Group
Cash placement and investment in
marketable securities
P=46,771,160
P=60,776,796 Interest-bearing
at prevailing rates
Unsecured;
no impairment
Interest receivable 220,463 54,407 – –
Interest income P=305,916 P=495,462 – –
Interest-bearing debt 39,103,391 34,555,640 Interest-bearing Unsecured
Interest payable 69,504 87,662 – –
Interest expense 388,412 1,045,164 – –
Rent receivable 118,161 60,454 Noninterest-bearing Unsecured;
no impairment
Rent income 191,565 184,718 – –
Receivable financed 358,861 2,350,503 – – Without recourse Unsecured
Dividends receivable – 13,462 Noninterest-bearing Unsecured;
no impairment
Bonds and deposits 16,985,500
16,808,050 Interest-bearing
4.5%
Unsecured;
no impairment
Royalty, management and service fee
receivable
8,802 8,077
Noninterest-bearing Unsecured;
no impairment
Royalty, management and service fee
income
9,945 49 – –
Escrow fund 326,977
276,669 Interest-bearing
at prevailing rates
Unsecured;
no impairment
Retail and Other Entities
Rent receivable 194,324 912,269 Noninterest-bearing Unsecured;
no impairment
Rent income 289,167 378,427 – –
Royalty, management and service fee
receivable
2,149,166 2,049,081 Noninterest-bearing Unsecured;
no impairment
Royalty, management and service fee
income
390,117 162,103 – –
(Forward)

- 16 -
Transaction Amount Outstanding Amount
March 31,
2021
March 31,
2020
March 31,
2021
December 31,
2020 Terms Conditions (In Thousands)
Due from related parties P=34,680 P=1,180,589 Noninterest-bearing Unsecured;
no impairment
Due to related parties 1,435 P=823,779 Noninterest-bearing Unsecured
Interest receivable 7,845 7,763 – –
Interest income 85,070 92,391 – –
Dividends receivable 215,000 526,507 Noninterest-bearing Unsecured;
no impairment
Notes receivable 5,066,434
4,999,359 Interest-bearing
5.4% to 7.0%
Unsecured;
no impairment
Terms and Conditions of Transactions with Related Parties
Outstanding balances at yearend are unsecured and are normally settled in cash. The Group did not
make any provision for impairment loss relating to amounts owed by related parties.
20. Income Tax
Deferred tax assets of P=4,728.5 million and P=4,672.0 million as at March 31, 2021 and December 31,
2020, respectively, consist of the tax effects of unrealized gain on intercompany sale of investment
properties, unamortized past service cost and defined benefit liability, provision for doubtful accounts
and others, accrued leases, MCIT, deferred rent expense and NOLCO.
Deferred tax liabilities of P=13,082.5 million and P=12,615.0 million as at March 31, 2021 and
December 31, 2020, respectively, consist of the tax effects of appraisal increment on investment
property, trademarks and brand names, capitalized interest, unrealized gross profit on sale of real
estate, accrued/deferred rent income and unamortized past service cost and defined benefit asset. The
disproportionate relationship between income before income tax and the provision for income tax is
due to various factors such as interest income already subjected to final tax, non-deductible interest
expense, equity in net earnings of associates, and dividend income exempt from tax.
21. Lease Agreements
As Lessor. The Group’s lease agreements with its tenants are generally granted for a term of one to
twenty-five years. Upon inception of the lease agreement, tenants are required to pay certain amounts
of deposits. Tenants likewise pay a fixed monthly rent which is calculated with reference to a fixed
sum per square meter of area leased except for a few tenants which pay either a fixed monthly rent or
a percentage of gross sales, whichever is higher.
As Lessee. The Group leases certain parcels of land where some of its malls are situated as well as
retail store, office spaces and warehouses. The terms of the lease are for periods ranging from ten to
fifty years, renewable for the same period under the same terms and conditions. Rental payments are
generally computed based on a certain percentage of gross rental income or a certain fixed amount,
whichever is higher.
There are also non-cancellable operating lease commitments with lease periods ranging from two to
thirty years, mostly containing renewal options and those that provide for the payment of additional
rental based on a certain percentage of sales of the sub-lessees.

- 17 -
The rollforward analysis of ROU assets follows:
March 31, 2021 (Unaudited)
Land Use Rights
Retail Stores,
Office Spaces and
Warehouses Total
(In Thousands)
Cost
As at beginning of year P=24,343,193 P=23,428,730 P=47,771,923
Additions – 930,674 930,674
Translation adjustment 78,047 – 78,047
Disposals – (761,568) (761,568)
As at end of period 24,421,240 23,597,836 48,019,076
Accumulated Depreciation
and Amortization
As at beginning of year 1,014,825 4,778,069 5,792,894
Depreciation and amortization 125,904 638,005 763,909
Translation adjustment 1,511 – 1,511
Disposals – (88,464) (88,464)
As at end of period 1,142,240 5,327,610 6,469,850
Net Book Value P=23,279,000 P=18,270,226 P=41,549,226
December 31, 2020 (Audited)
Land Use Rights
Retail Stores, Office
Spaces and
Warehouses Total
(In Thousands)
Cost
As at beginning of year P=20,955,223 P=20,291,858 P=41,247,081
Additions 3,276,229 4,175,989 7,452,218
Translation adjustment 111,741 – 111,741
Disposals – (1,039,117) (1,039,117)
As at end of year 24,343,193 23,428,730 47,771,923
Accumulated Depreciation
and Amortization
As at beginning of year 505,171 3,077,734 3,582,905
Depreciation and amortization 504,613 2,566,999 3,071,612
Translation adjustment 5,041 – 5,041
Disposals – (866,664) (866,664)
As at end of year 1,014,825 4,778,069 5,792,894
Net Book Value P=23,328,368 P=18,650,661 P=41,979,029

- 18 -
The rollforward analysis of lease liabilities follows:
March 31,
2021
(Unaudited)
December 31,
2020
(Audited)
(In Thousands)
As at beginning of year P=30,879,878 P=29,134,546
Additions 930,674 4,175,989
Interest expense 464,857 1,874,726
Rent concessions (49,004) (275,102)
Terminations (128,945) (192,237)
Payments (1,480,465) (3,838,044)
As at end of period 30,616,995 30,879,878
Less current portion (Note 16) 1,977,980 2,011,714
Noncurrent portion P=28,639,015 P=28,868,164
The Group has several lease contracts that include extension and termination options. These options
are negotiated by management to provide flexibility in managing the leased assets portfolio.
Management exercises significant judgment in determining whether these extension and termination
options are reasonably certain to be exercised.
Tenants’ deposits amounted to P=22,335.1 million and P=22,551.7 million as at March 31, 2021 and
December 31, 2020, respectively.
22. Financial Risk Management Objectives and Policies
The main risks arising from the Group’s financial instruments follow:
• Interest rate risk. Fixed rate financial instruments are subject to fair value interest rate risk while
floating rate financial instruments are subject to cash flow interest rate risk. Repricing of floating
rate financial instruments is mostly done at intervals of three months or six months.
• Foreign currency risk. The Group’s exposure to foreign currency risk arises as the Parent
Company and SM Prime have investments and debt issuances which are denominated in U.S.
Dollars and China Yuan Renminbi.
• Liquidity risk. Liquidity risk arises from the possibility that the Group may encounter difficulties
in raising funds to meet commitments from financial instruments.
• Credit risk. Refers to the risk that a borrower will default on any type of debt by failing to make
the required payments.
• Equity price risk. The Group’s exposure to equity price risk pertains to its investments in quoted
equity shares which are classified as equity investments at FVOCI in the consolidated balance
sheets. Equity price risk arises from changes in the levels of equity indices and the value of
individual stocks traded in the stock exchange.
The BOD reviews and approves the policies for managing each of these risks.

- 19 -
Interest Rate Risk
The Group’s exposure to market risk for changes in interest rates relates primarily to the Group’s
long-term debt obligations (see Note 17).
The Group maintains a conservative financing strategy and has preference for longer tenor credit with
fixed interest rate that matches the nature of its investments. To manage this mix in a cost-efficient
manner, the Group enters into interest rate swaps and cross-currency swaps in which the Group
agrees to exchange, at specified intervals, the difference between fixed and variable interest amounts
calculated by reference to an agreed notional amount. The interest rate swaps economically hedge the
underlying debt obligations. The cross-currency swaps were designated by the Group under cash
flow hedge accounting.
As at March 31, 2021 and December 31, 2020, after taking into account the effect of the swaps,
approximately 79.3% and 79.8%, respectively of the Group’s borrowings, net of debt issue cost, is
kept at fixed interest rates.
Foreign Currency Risk
The Group aims to reduce foreign currency risks by employing on-balance sheet hedges and
derivatives such as foreign currency swap contracts, foreign cross-currency swaps, foreign currency
call options and non-deliverable forwards.
As at March 31, 2021, the Group’s foreign currency-denominated assets and liabilities amounted to
P=24,500.2 million ($504.8 million) and P=23,392.3 million ($482.0 million), respectively.
As at December 31, 2020, the Group’s foreign currency-denominated assets and liabilities amounted
to P=23,825.9 million ($496.1 million) and P=22,907.2 million ($477.0 million), respectively.
As at March 31, 2021 and December 31, 2020, approximately 22.9% and 22.8%, respectively, of the
Group’s borrowings, net of debt issue cost, are denominated in foreign currency.
The following exchange rates were used in translating foreign currency-denominated assets and
liabilities into Pesos.
March 31,
2021
December 31,
2020
Philippine Peso to U.S. Dollar P=48.53 P=48.02

- 20 -
Liquidity Risk
The Group manages its liquidity to ensure adequate financing of capital expenditures and debt
service. Financing consists of internally generated funds, proceeds from debt and equity issues,
and/or sales of assets.
The Group regularly evaluates its projected and actual cash flow information and assesses conditions
in the financial markets for opportunities to pursue fundraising initiatives including bank loans,
export credit agency-guaranteed facilities, bonds and equity market issues.
Credit Risk
The Group trades only with recognized and creditworthy related and third parties. The Group policy
requires customers who wish to trade on credit terms to undergo credit verification. In addition,
receivable balances are monitored on a regular basis to keep exposure to bad debts at the minimum.
Given the Group’s diverse customer base, it is not exposed to large concentrations of credit risk.
With respect to credit risk arising from the other financial assets of the Group which consist of cash
and cash equivalents, time deposits, and certain derivative instruments, the Group’s credit risk arises
from default of the counterparty, with a maximum exposure equal to the carrying amount of these
instruments.
Receivables from sale of real estate have minimal credit risk and are effectively collateralized by the
respective units sold since title to the real estate properties are not transferred to the buyers until full
payment is made.
As at March 31, 2021 and December 31, 2020, the financial assets, except for some receivables, are
generally viewed by the management as good and collectible considering the credit history of the
counterparties. Past due or impaired financial assets are very minimal in relation to the Group’s total
financial assets.
Equity Price Risk
Management closely monitors the equity securities in its investment portfolio. Material equity
investments within the portfolio are managed on an individual basis and all buy and sell decisions are
approved by management.
Capital Management
The primary objective of the Group’s capital management is to ensure that it maintains a strong credit
rating and healthy capital ratios in order to support its business and maximize shareholder value.
The Group manages its capital structure and makes appropriate adjustments based on changes in
economic conditions. Accordingly, the Group may adjust dividend payments to shareholders, secure
new and/or payoff existing debts, return capital to shareholders or issue new shares.
The Group monitors its capital gearing by maintaining its net debt at no higher than 50% of the sum
of net debt and equity.
The Group’s gearing ratios follow:
March 31,
2021
December 31,
2020
Gross 42% 42%
Net 38% 37%

- 21 -
23. Financial Instruments
The Group’s financial assets and liabilities by category and by class, except for those with carrying
amounts that are reasonable approximations of fair values, follow:
March 31, 2021
Carrying
Value Fair Value
Quoted Prices
in Active
Markets
(Level 1)
Significant
Observable
Inputs
(Level 2)
Significant
Unobservable
Inputs
(Level 3)
(In Thousands)
Assets Measured at Fair Value
Financial assets at FVOCI
Listed shares of stock P=23,532,419 P=23,532,419 P=23,532,419 P=– P=–
Unlisted shares of stock 1,703,762 1,703,762 – – 1,703,762
Club shares 15,020 15,020 – 15,020 –
Derivative assets 220,089 220,089 – 220,089 –
25,471,290 25,471,290 23,532,419 235,109 1,703,762
Assets for which Fair Values are Disclosed
Time deposits - noncurrent portion 1,604,447 1,604,447 – 1,604,447 –
Other noncurrent assets:
Bonds and deposits 16,985,500 19,114,150 – – 19,114,150
Long-term notes 5,066,434 6,024,495 – – 6,024,495
23,656,381 26,743,092 – 1,604,447 25,138,645
P=49,127,671 P=52,214,382 P=23,532,419 P=1,839,556 P=26,842,407
Liabilities Measured at Fair Value
Derivative liabilities P=4,219,679 P=4,219,679 P=– P=4,219,679 P=–
Liabilities for which Fair Values are Disclosed
Long-term debt (noncurrent portion and net of
unamortized debt issue cost) 360,219,742 365,997,057 – – 365,997,057
Lease liabilities - noncurrent portion 28,639,015 30,515,845 – – 30,515,845
Tenants’ deposits and others* 30,984,719 28,791,686 – – 28,791,686
419,843,476 425,304,588 – – 425,304,588
P=424,063,155 P=429,524,267 P=– P=4,219,679 P=425,304,588
*Excluding nonfinancial liabilities amounting to P=9,107.9 million.
December 31, 2020
Carrying
Value Fair Value
Quoted Prices
in Active
Markets
(Level 1)
Significant
Observable
Inputs
(Level 2)
Significant
Unobservable
Inputs
(Level 3)
(In Thousands)
Assets Measured at Fair Value
Financial assets at FVOCI
Listed shares of stock P=26,133,219 P=26,133,219 P=26,133,219 P=– P=–
Unlisted shares of stock 1,701,227 1,701,227 – – 1,701,227
Club shares 11,940 11,940 – 11,940 –
Derivative assets 2,747 2,747 – 2,747 –
27,849,133 27,849,133 26,133,219 14,687 1,701,227
Assets for which Fair Values are Disclosed
Time deposits - noncurrent portion 1,356,442 1,356,442 – 1,356,442 –
Other noncurrent assets:
Bonds and deposits 16,808,050 19,271,918 – – 19,271,918
Long-term notes 4,999,359 6,068,924 – – 6,068,924
23,163,851 26,697,284 – 1,356,442 25,340,842
P=51,012,984 P=54,546,417 P=26,133,219 P=1,371,129 P=27,042,069
Liabilities Measured at Fair Value
Derivative liabilities P=6,125,125 P=6,125,125 P=– P=6,125,125 P=–
Liabilities for which Fair Values are Disclosed
Long-term debt (noncurrent portion and net of
unamortized debt issue cost) 330,731,798 332,475,152 – – 332,475,152
Lease liabilities - noncurrent portion 28,868,164 30,776,929 – – 30,776,929
Tenants’ deposits and others* 30,947,183 28,784,888 – – 28,784,888
390,547,145 392,036,969 – – 392,036,969
P=396,672,270 P=398,162,094 P=– P=6,125,125 P=392,036,969
*Excluding nonfinancial liabilities amounting to P=8,806.2 million.
There were no transfers into and out of Levels 1, 2 and 3 fair value measurements as at
March 31, 2021 and December 31, 2020.

- 22 -
Derivative Instruments Accounted for as Cash Flow Hedges
As at March 31, 2021, the Parent Company and SM Prime have outstanding arrangements to hedge
both foreign currency and interest rate exposure on its foreign currency-denominated debt. Details
follow:
Cross-currency swaps:
Notional Amount
(In US$) (In PhP=) (In CN¥) Principal Fair Value Receive Pay US$:PhP= US$:CN¥ Maturity
(In Thousands)
Parent:
$53,000 P=2,761,300 P=2,572,090 (P=304,685) LIBOR + spread 5.3% P=52.10 March 6, 2023
100,000 5,210,000 4,853,000 (691,031) LIBOR + spread 5.9% 52.10 April 16, 2023
56,159 3,000,000 2,725,384 (500,765) LIBOR + spread 6.1% 53.42 July 26, 2023
100,000 5,140,000 4,853,000 (570,812) LIBOR + spread 5.5% 51.40 June 28, 2024
100,000 5,115,000 4,853,000 (537,229) LIBOR + spread 5.4% 51.15 June 28, 2024
SM Prime:
50,000 2,666,500 2,426,500 (413,311) LIBOR + spread 6.4% 53.33 June 14, 2023
60,000 3,199,200 2,911,800 (500,702) LIBOR + spread 6.4% 53.32 June 14, 2023
100,000 4,827,000 4,853,000 21,724 LIBOR + spread 3.3% 48.27 September 30, 2022
75,000 3,639,000 3,639,750 62,455 LIBOR + spread 3.6% - 3.7% 48.52 April 5, 2024
75,000 3,637,500 3,639,750 63,332 LIBOR + spread 3.6% - 3.7% 48.50 April 5, 2024
25,000 ¥172,100 1,213,250 (86,314) LIBOR + spread 5.4% ¥6.884 March 27, 2022
25,000 172,300 1,213,250 (83,749) LIBOR + spread 5.4% 6.892 March 27, 2022
50,000 327,315 2,426,500 (40,729) LIBOR + spread 5.0% 6.546 June 30, 2022
50,000 335,940 2,426,500 (89,037) LIBOR + spread 4.0% 6.719 February 28, 2024
50,000 335,725 2,426,500 (73,702) LIBOR + spread 3.9% 6.715 February 28, 2024
50,000 335,750 2,426,500 (89,077) LIBOR + spread 3.9% 6.715 February 28, 2024
50,000 334,400 2,426,500 (90,895) LIBOR + spread 3.9% 6.688 February 28, 2024
50,000 335,750 2,426,500 (86,590) LIBOR + spread 3.9% 6.715 February 28, 2024
36,000 241,643 1,747,080 (61,052) LIBOR + spread 3.9% 6.712 February 28, 2024
Principal only swap:
Notional Amount Principal Fair Value Rate
US$:CN¥ Maturity
(In Thousands)
SM Prime $270,000 P=12,981,635 P=72,579 4.62%
¥6.459 January 23, 2026
As the terms of the swaps have been negotiated to match the terms of the hedged loans and advances,
the hedges are assessed to be highly effective.
24. EPS Computation
March 31,
2021
(Unaudited)
March 31,
2020
(Unaudited)
(In Thousands Except Per Share Data)
Net income attributable to owners of the Parent (a) P=9,470,213 P=9,007,277
Weighted average number of common shares outstanding (b) 1,204,583 1,204,583
EPS (a/b) P=7.86 P=7.48

- 23 -
PART 1 FINANCIAL INFORMATION
Management’s Discussion and Analysis or Plan of Operation
Results of Operation
For the Three Months Ended March 31, 2021 and 2020
(amounts in billion pesos)
Ytd
March
2021
(Unaudited)
Ytd
March
2020
(Unaudited)
%
Change
Revenues P 96.9 P 111.2 -12.8%
Cost and Expenses 78.2 91.0 -14.0%
Income from Operations 18.7 20.2 -7.7%
Other Charges 3.3 3.4 -5.6%
Provision for Income Tax 1.9 3.0 -35.1%
Net Income After Tax 13.5 13.8 -2.4%
Non-controlling Interests 4.0 4.8 -16.5%
Net Income Attributable to
Owners of the Parent
P 9.5
P 9.0
5.1%
For Ytd March 2021, SM Investments Corporation and Subsidiaries (the Group) reported lower Net
Income Attributable to Owners of the Parent at P9.5 billion and Revenues at P96.9 billion, compared to
the same period in 2020.
Banking accounted for 54% of net income from core businesses, followed by Property at 33% and Retail
at 13%.
Retail
For Ytd March 2021, SM Retail reported Revenues of P70.0 billion, 13.5% lower compared to the same
period in 2020 which is considered to be a “pre-pandemic” period. Ytd March 2020 revenues also reflect
the effect of pantry loading when customers were buying in advance of the anticipated lockdown .
Despite the drop in revenues, SM Retail generated P1.6 billion of net income for Ytd March 2021,
36.0% higher than Ytd March 2020. This is attributable to the following:
• Improved gross margins resulting from better mix of products sold, lesser sales promotions and
higher level of support from partner suppliers.
• Intensive cost management initiatives and streamlining of operations. Noteworthy is the
significant reduction in electricity costs as the Food Group shifted to more energy efficient lighting
and refrigeration systems.
• Rent concessions received from various lessors.

- 24 -
Property
For Ytd March 2021, SM Prime reported lower Revenues of P20.8 billion Net income of P6.5 billion,
19% and 22% lower compared to the same period in 2020, respectively.
SM Prime’s Philippine malls business reported Revenues of P5.9 billion, 10% higher than Ytd March 2020,
with Rent income growing 14% to P5.6 billion. SM Prime continues to grant rent concessions to its
tenants in the first three months of 2021.
SM Prime’s residential business, led by SM Development Corporation (SMDC), reported a 5% growth in
Revenues for Ytd March 2021 to P11.9 billion and 31% growth in reservation sales to P32.4 billion relative
to the multiple projects that were launched in 2021.
Banking
For Ytd March 2021, BDO reported a Net income of P10.4 billion, 19% higher compared to the same
period in 2020. This is primarily due to the robust performance of its service fee businesses that
compensated for the weak demands for loans.
In the same period, China Bank reported a Net income of P3.6 billion at 61% growth. Net interest income
grew 16% to P9.2 billion due to the 52% drop in interest expense reflecting lower cost of funding. This
was supplemented by the three-fold growth in fee-based income to P3.6 billion, driven by strong trading
and securities gains of P2.2 billion.
Profit & Loss Statement - Account Analysis
Merchandise Sales, which decreased by 13.0% to P68.1 billion from P78.3 billion in 2020, accounted for
70% of total revenues in 2021. Ytd March 2020 Revenues reflect the abnormally high purchase volumes
by customers in the last two weeks of March relative to the scheduled community lockdowns in the
succeeding months whereas Ytd March 2021 revenues reflect normal pandemic purchase volumes as the
customers have already adjusted to the norms of a pandemic environment.
As of March 31, 2021, SM Retail had 3,035 stores in operation. Its stores portfolio include 66 SM Stores,
59 SM Supermarkets, 213 Savemore stores, 52 SM Hypermarkets, 71 WalterMart stores, 1,044 Alfamart
stores, and 1,530 Specialty stores.
Real Estate Sales increased by 4.0% to P11.7 billion from P11.3 billion in 2020. The increase is attributable
to sales take-up and construction accomplishments of ongoing projects including Shore 3, Bloom, Vine,
Fame, Style and Glam as well as various Ready-For-Occupancy (RFO) projects, particularly those located
in Mandaluyong and Pasay. Revenues are recognized based on percentage of completion.
Rent Revenue, derived mainly from the mall operations of SM Prime, decreased by 33.4% to P7.4 billion
from P11.1 billion in 2020. The decrease is due to lesser mall tenants in operation in 2021 than in 2020
which was for the most part, operating on pre-pandemic terms.

- 25 -
As of March 31, 2021, SM Prime had 76 malls in the Philippines with total GFA of
8.6 million square meters and 7 malls in China with total GFA of 1.3 million square meters.
Equity in Net Earnings of Associate Companies and Joint Ventures increased by 16.0% to
P6.1 billion from P5.3 billion in 2020 mainly representing the increase in net income of bank associates.
Cinema Ticket Sales, Amusement and Others decreased by 89.3% to P0.1 billion from
P1.0 billion in 2020. This is attributable to the strict restrictions in the operation of cinemas and other
leisure areas as mandated by the government throughout Ytd March 2021 whereas Ytd March 2020 was
for the most part, operating on pre-pandemic terms.
Dividends, Management Fees and Others decreased 19.7% to P3.4 billion from P4.2 billion in 2020. This
is attributable to the decrease in royalty, management and service fees and other revenues due to relative
reduction in sales of the retail stores. Other revenues comprise mainly of promotional activities highlighting
products, commission from bills payment, prepaid cards and show tickets, advertising income and
sponsorship revenues, food and beverage income of the Hotel Group.
Selling, General and Administrative Expenses decreased by 17.5% to P21.9 billion from
P26.6 billion in 2020 due mainly to the scaled-down operation of certain retail stores and malls and efforts
to control costs through rationalization of operations.
Income from Operations decreased by 7.7% to P18.6 billion from P20.2 billion in 2020. Operating Margin
and Net Margin is at 19.2% and 13.9%, respectively.
Other Charges (net) decreased by 5.6% to P3.3 billion from P3.4 billion in 2020. Interest Expense
decreased by 6.4% to P3.9 billion from P4.2 billion in 2020 due mainly to lower interest rates and lower
average outstanding balance of interest-bearing debt . Interest Income decreased by 34.3% to P0.5 billion
from P0.8 billion in 2020 due mainly to lower average balance of cash and time deposits.
Provision for Income Tax decreased by 35.1% to P1.9 billion from P3.0 billion in 2020 due mainly to lower
taxable income and tax rates relative to Corporate Recovery and Tax Incentives for Enterprises Act
(CREATE) that was signed into law by the President of the Republic of the Philippines on March 26, 2021,
which provides for the retroactive application to July 01, 2020 of the lower corporate income tax rate. The
effective income tax rate is 12.6% in 2021 compared to 17.8% in 2020.
Non-controlling interests decreased by 16.5% to P4.0 billion from P4.8 billion in 2020 due mainly to the
decrease in net income of partly-owned subsidiaries.

- 26 -
Financial Position
As at March 31, 2021 and December 31, 2020
(amounts in billion pesos)
03 / 31 / 2021
(Unaudited)
12 / 31 / 2020
(Unaudited)
% Change
Current Assets P 242.4 P 254.5 -4.7%
Noncurrent Assets 978.7 970.0 0.9%
Total Assets P 1,221.1 P 1,224.5 -0.3%
Current Liabilities P 198.2 P 240.0 -17.4%
Noncurrent Liabilities 448.2 419.8 6.7%
Total Liabilities 646.4 659.8 -2.0%
Total Equity 574.7 564.7 1.8%
Total Liabilities and
Equity
P 1,221.1
P 1,224.5
-0.3%
Total Assets decreased by 0.3% to P1,221.1 billion from P1,224.5 billion in 2020. Likewise, total Liabilities
decreased by 2.0% to P646.4 billion from P659.8 billion in 2020.
Current Assets
Current Assets decreased by 4.7% to P242.4 billion from P254.5 billion in 2020.
Cash and Cash Equivalents decreased by 22.7% to P60.4 billion from P78.2 billion in 2020 due mainly to
payments for trade, investments, capital expenditures and debt servicing.
Inventories increased by 7.2% to P77.2 billion from P72.1 billion resulting from the
P2.6 billion increase in merchandise inventory and P4.3 billion increase in condominium and residential
units for sale partly offset by the P1.8 billion decrease in land and development - current. The net increase
in real estate inventories is attributable to construction accomplishments during the period, net of cost of
sold units.
Other Current Assets increased by 2.4% to P44.2 billion from P43.2 billion in 2020 due mainly to higher
prepaid taxes.
Noncurrent Assets
Noncurrent Assets increased by 0.9% to P978.7 billion from P970.0 billion in 2020.
Financial assets at FVOCI - net of current portion decreased by 9.5% to P24.7 billion from P27.3 billion
due mainly to lower market values in 2021.
Investments in Associate Companies and Joint Ventures increased by 1.2% to
P299.8 billion from P296.3 billion in 2020. The increase mainly represents the equity in net earnings of
the Group’s associate companies of P6.1 billion, particularly from banking, partly offset by P0.7 billion
dividends and P2.0 billion share in the comprehensive income of its associate companies.

- 27 -
Investment Properties increased by 1.2% to P440.5 billion from P435.5 billion in 2020 due mainly to land
banking and ongoing new mall projects and commercial building construction as well as the redevelopment
of SM Mall of Asia and other existing malls.
Other Noncurrent Assets increased by 2.5% to P115.2 billion from P112.3 billion in 2020 due mainly to the
increase in receivable from real estate buyers.
Liabilities
Interest-bearing debt Bank Loans remained relatively flat at P416 billion from P415 billion in 2020.
Accounts Payable and Other Current Liabilities decreased by 8.9% to P135.9 billion from
P149.2 billion in 2020 due mainly to settlement of trade payables.
Dividends Payable decreased by 21.5% to P3.0 billion from P3.8 billion in 2020. This represents dividends
due to minority stockholders of certain subsidiaries.
Deferred tax liabilities increased by 3.7% to P13.1 billion from P12.6 billion in 2020 due mainly to
unrealized gross profit on sale of real estate for income tax purposes.
Equity
Total Equity increased by 1.8% to P574.7 billion from P564.7 billion in 2020.
Equity Attributable to Owners of the Parent increased by 1.5% to P410.0 billion from
P403.8 billion in 2020. This increase resulted mainly from the P9.5 billion net income for Ytd March 2021
reflected in Retained earnings and Net Fair value Changes on Cash Flow Hedges which decreased to
P1.8 billion from P2.7 billion in 2020. These were partly offset by the 26.4% decrease in Net Unrealized
Gain on Financial Assets to P12.1 billion from P16.5 billion in 2020 due to lower market valuation of
certain investments.
Non-controlling Interests increased by 2.4% to P164.7 billion from P160.9 billion in 2020 due mainly to
the increase in net assets of subsidiaries that are not wholly owned.

- 28 -
Impact of COVID-19 to the Group’s operations
Ytd March 2021 is a full quarter reflecting pandemic business conditions whereas Ytd March 2020 is
considered to be a pre-pandemic period considering that the first community quarantine was imposed in the
2nd half of March 2020.
For Ytd March 2021, there was a lower number of mall tenants in operation and generally lower sales
generated by the Retail Group stores. SM Prime also granted rent concessions for all three months of 2021.
COVID-19 did not have any significant impact on SM Prime’s offices business since its primary tenants
are business process outsourcing (BPO) offices which were allowed by the Philippine’s Inter-Agency Task
Force (IATF) to continue to have normal operations throughout the quarantine period.
SM Prime’s residential business has made adjustments to its construction and sales operations to align with
the pandemic related restrictions that allowed it to report higher real estate sales and reservation sales in
2021. The credit quality of receivables is maintained and remain within reasonable levels.
The operations of SM Prime’s hotel business continue to be at reduced levels.
BDO and China Bank both reported growth in earnings in Ytd March 2021 which is for the most part
attributable to lower interest expense and higher income from fee-based services, despite booking of higher
loan provisions compared to Ytd March 2020.

- 29 -
Key Performance Indicators As at March 31, 2021 and 2020 and December 31, 2020 The key financial ratios of the Group follow:
03 / 31 / 2021
(Unaudited)
12 / 31 / 2020
(Audited)
Current Ratio 1.2 1.1
Acid Test Ratio 0.6 0.6
Solvency Ratio 8.1% 8.0%
Asset to Equity 2.1 2.2
Debt - Equity Ratios:
On Gross Basis 42 : 58 42 : 58
On Net Basis 38 : 62 37 : 63
Return on Equity 6.0% 6.0%
Return on Assets 2.9% 2.9%
Ytd Mar. 2021
(Unaudited)
Ytd Mar. 2020
(Unaudited)
Revenue Growth -12.8% 1.9%
Net Margin 13.9% 12.4%
Net Income Growth 5.1% -15.7%
EBITDA (In Billions of Pesos) 23.3B 25.0B
Interest Cover 5.9x 6.0x
Current Ratio increased to 1.2 from 1.1 in 2020 due mainly to the 4.7% decrease in Current Assets vs.
17.4% decrease in Current Liabilities.
Solvency Ratio increased to 8.1% from 8.0% in 2020 due mainly to the 1.0% decrease in Net income after
tax and depreciation vs. 2.0% decrease in Total Liabilities.
Asset to Equity Ratio decreased to 2.1 from 2.2 in 2020 due mainly to the 0.3% decrease in Total Assets
compared to 1.8% increase in Total Equity.
Net Debt - Equity Ratio increased to 38:62 from 37:63 in 2020 due mainly to the 0.3% increase in gross
debt and a 22.0% decrease in cash and cash equivalents.
Revenue Growth decreased to -12.8% from 1.9% in 2020 due mainly to the significant drop in merchandise
sales, rental revenues and cinema ticket sales, amusement and others. 1Q-2020 is considered mostly “pre-
pandemic” since the community lockdowns started only in the 2nd half of March 2020.
Net Margin and Net Income Growth increased to 13.9% and 5.1% from 12.4% and -15.7%, respectively.
Profitability improved in 2021 due to intensive cost management and streamlining of operations for
efficiency.
EBITDA decreased by 7.1% due mainly to the P1.6 billion decrease in income from operations and
P0.2 billion decrease in depreciation. Interest Cover decreased to 5.9x from 6.0x in 2020 due to the 7.1% decrease in EBITDA vs. only 6.4% decrease in interest expense.

- 30 -
The manner by which the Group calculates the foregoing indicators is as follows: 1. Current Ratio Current Assets
Current Liabilities
2. Acid Test Ratio Current Assets less Inventories and Other Current Assets Current Liabilities
3. Solvency Ratio Net Income After Tax + Depreciation and Amortization
Total Liabilities
4. Asset to Equity Ratio Total Assets Total Equity
5. Debt – Equity Ratio
a. Gross Basis Total Interest-bearing Debt
Total Equity + Total Interest-bearing Debt
b. Net Basis Total Interest-bearing Debt less Cash and Cash Equivalents (excluding Cash on Hand), Time Deposits, Investment in Bonds Total Equity + Total Interest-bearing Debt less Cash and Cash Equivalents (excluding Cash on Hand), Time Deposits, Investments in Bonds
6. Revenue Growth Total Revenues (Current Period) - 1 Total Revenues (Prior Period)
7. Net Margin Net Income After Tax
Total Revenues
8. Net Income Growth Net Income Attributable to Owners of the Parent (Current Period) - 1 Net Income Attributable to Owners of the Parent (Prior Period)
9. Return on Equity Net Income Attributable to Owners of the Parent Average Equity Attributable to Owners of the Parent
10. Return on Assets Net Income after Tax
Total Assets
11. EBITDA Income from Operations + Depreciation & Amortization
12. Interest Cover EBITDA
Interest Expense

- 31 -
Expansion Plans / Prospects in 2021
For the rest of 2021, expansion and construction of malls, residential and commercial properties will
continue.
We plan to open new retail stores across our various formats mainly in the Food Group, and selectively in
the Non-Food Group.
We will pursue investments in new ventures as opportunities arise.

- 32 -
PART I FINANCIAL INFORMATION
Item 3. Aging of Accounts Receivable - Trade
As of March 31, 2021
(in Thousands)
Receivable from tenants
Third party P 6,254,820
Related party 312,485
Receivable from real estate buyers
- net of noncurrent portion 51,870,939
Other trade receivables 16,598
Total P 58,454,842
Aging:
Neither past due nor impaired P 49,938,674
31-90 days 1,591,880
91-120 days 510,112
Over 120 days 5,347,317
Impaired 1,066,859
Total P 58,454,842

- 33 -
PART II - SIGNATURE
Pursuant to the requirements of the Securities Regulation Code, the issuer has duly caused this report to be
signed on its behalf by the undersigned thereunto duly authorized.
Registrant: SM INVESTMENTS CORPORATION
__________________________ Date: ____________ Franklin C. Gomez Senior Vice President – Finance Corporate Information Officer
05-12-2021
Related Documents