c' Hydrochemical Facies and Ground-Water Flow Patterns in Northern Part of Atlantic Coastal Plain GEOLOGICAL SURVEY PROFESSIONAL PAPER 498- A

Welcome message from author
This document is posted to help you gain knowledge. Please leave a comment to let me know what you think about it! Share it to your friends and learn new things together.
Transcript

c'
Hydrochemical Facies and
Ground-Water Flow
Patterns in Northern Part
of Atlantic Coastal Plain
GEOLOGICAL SURVEY PROFESSIONAL PAPER 498- A

Hydrochemical Facies and
Ground-Water Flow
Patterns in Northern Part
of Atlantic Coastal Plain By WILLIAM BACK
HYDROLOGY OF AQUIFER SYSTEMS
GEOLOGICAL SURVEY PROFESSIONAL PAPER 498-A
UNITED STATES GOVERNMENT PRINTING OFFICE, WASHINGTON: 1966
DEPARTMENT OF THE INTERIOR
DONALD PAUL HODEL, Secretary
U.S. GEOLOGICAL SURVEY
Dallas L. Peck, Director
Any use of trade names in this publication is for descriptive purposes only and does not imply endorsement by the U.S. Geological Survey
First printing 1966 Second printing 1988
For sale by the Books and Open-File Reports Section, U.S. Geological Survey
Federal Center, Box 25425, Denver, CO 80225

CONTENTS
Page Page
Abstract------------~------------------------------ A 1 Hydrochemical facies-Continued In troduction ______________________________________ _ 1 Occurrence of hydrochemical facies-Continued Geology __________________________________________ _ 2 Cretaceous sediments _______________________ _ A 15
22 31
Relation of salt water to fresh water _________________ _ 2 Eocene formations ____________________ -- ___ _ Factors affecting position of the salt-water body ___ _ 2 Miocene formations __________________ --- ___ _ Factors affecting occurrence of salt water _________ _ 9 Spatial distribution and origin of hydrochemical
Ground-water flow patterns _________________________ _ 9 facies ______________________ ---- _____ ----- __ -_ 37 37 38 39 40 41
Hydrochemical facies _______________________________ _ 11 Concentration of dissolved solids _____________ _ Defintiion _____________________________________ _ 11 Cation facies __________________________ _ Procedures and mapping techniques ______________ _ 14 Anion facies ___________________________ _
Occurrence of hydrochemical facies within strati- Summary and conclusions ___________________________ _ graphic units ________________________________ _ 15 Selected references _________________________________ _
PLATE FIGURE
ILLUSTRATIONS Page
1. Fence diagrams of the northern part of Atlantic Coastal Plain _____________________________________ In pocket 1. Index map of part of the northern Atlantic Coastal Plain showing location of cross sections in the fence dia-
grams______________________________________________________________________________________ A3 2. Map showing the relation of topography to salt- and fresh-water interfaces______________________________ 7 3. Map showing general pattern of ground-water flow in the Cretaceous sediments_________________________ 10 4. Sections showing the vertical component of the major ground-water flow________________________________ 12
5-18. Water-analysis diagrams: 5. Hydrochemical facies, in percent of total equivalents per million_______________________________ 14 6. Cretaceous formations in Virginia_ _ _ _ _ _ _ _ _ _ _ _ _ _ _ _ _ _ _ _ _ _ _ _ _ _ _ _ _ _ _ _ _ _ _ _ _ _ _ _ _ _ _ _ _ _ _ _ _ _ _ _ _ _ _ _ _ _ 16 7. Mattaponi Formation in Virginia___________________________________________________________ 18 8. Cretaceous formations in Maryland_________________________________________________________ 20 9. Magothy and Raritan Formations in New Jersey_____________________________________________ 22
10. Selected Cretaceous formations in New Jersey_ _ _ _ _ _ _ _ _ _ _ _ _ _ _ _ _ _ _ _ _ _ _ _ _ _ _ _ _ _ _ _ _ _ _ _ _ _ _ _ _ _ _ _ _ _ _ 24 11. Englishtown and Vincentown Formations in New Jersey______________________________________ 26 12. Eocene formations in Virginia______________________________________________________________ 28 13. Aquia Greensand in Maryland_____________________________________________________________ 29 14. Selected Eocene formations in Maryland____________________________________________________ 30 15. Miocene formations in Virginia_ _ _ _ _ _ _ _ _ _ _ _ _ _ _ _ _ _ _ _ _ _ _ _ _ _ _ _ _ _ _ _ _ _ _ _ _ _ _ _ _ _ _ _ _ _ _ _ _ _ _ _ _ _ _ _ _ _ _ _ 32 16. Miocene formations in Maryland___________________________________________________________ 33 17. Kirkwood Formation in New Jersey________________________________________________________ 34 18. Cohansey Sand in New Jersey_____________________________________________________________ 36
III

IV CONTENTS
TABLES
Page
TABLE 1. Stratigraphic units of the northern part of the Coastal Plain_______________________________________________ A 4 2. Classification of hydrochemical facies____________________________________________________________________ 13
3-15. Analyses of water from-3. Undifferentiated Cretaceous formations in Virginia_________________________________________________ 17 4. Mattaponi Formation in Virginia_________________________________________________________________ 19 5. Cretaceous formations in Maryland_______________________________________________________________ 21 6. Magothy and Raritan Formations in New Jersey_______________ _ _ _ _ _ _ _ _ _ _ _ _ _ _ _ _ _ _ _ _ _ _ _ _ _ _ _ _ _ _ _ _ _ _ _ _ 23 7. Selected Cretaceous formations in New Jersey_____________________________________________________ 23 8. Englishtown and Vincentown Formations in New Jersey____________________________________________ 25 9. Eocene formations in Virginia____________________________________________________________________ 25
10. Aquia Greensand in Maryland___________________________________________________________________ 27 11. Selected Eocene formations in Maryland__________________________________________________________ 27 12. Miocene formations in Virginia_ _ _ _ _ _ _ _ _ _ _ _ _ _ _ _ _ _ _ _ _ _ _ _ _ _ _ _ _ _ _ _ _ _ _ _ _ _ _ _ _ _ _ _ _ _ _ _ _ _ _ _ _ _ _ _ _ _ _ _ _ _ _ _ _ _ 31 13. Miocene formations in Maryland_________________________________________________________________ 35 14. Kirkwood Formation in New Jersey______________________________________________________________ 35 15. Cohansey Sand in New Jersey___________________________________________________________________ 37

HYDROLOGY OF AQUIFER SYSTEMS
HYDROCHEMICAL FACIES AND GROUND-WATER FLOW PATTERNS IN NORTHERN PART OF ATLANTIC COASTAL PLAIN
By wILLIAM BACK
ABSTRACT
The part of the Atlantic Coastal Plain that extends from New Jersey through Virginia was selected as a suitable field model in which to study the relationships between geology, hydrology, and chemical character of ground water. The ground-water flow pattern is the principal hydrologic control on the chemical character of the water. Within the Coastal Plain sediments, the proportions of clay, glauconitic sand, and calcareous material are the principal lithologic controls over the chemistry of the water.
A subsurface body of salt water extends from southern New Jersey through southern Virginia and occupies the deposits deeper than about 500 feet below land surface in the eastern part of the Coastal Plain. The position of its top is determined by the relative head, which in turn is influenced by topography, drainage density, and the thickness and permeability of the Coastal Plain sediments.
Hydrochemical facies is a term used in this paper to denote the diagnostic chemical aspect of ground-water solutions occurring in hydrologic systems. The facies reflect the response of chemical processes operating within the lithologic framework and also the pattern of flow of the water. The distribution of these facies is shown in trilinear diagrams and isometric fence diagrams and on maps showing isopleths of chemical constituents within certain formations. The occurrence of the various facies within one formation or within a group of formations of uniform mineralogy indicates that the ground-water flow through the aquifer system modifies the distribution of the facies.
Flow patterns of fresh ground water shown on maps and in cross sections have been deduced from available water-level data. These patterns are controlled by the distribution of the higher landmasses and by the depth to either bedrock or to the salt-water interface. The mapping of hydrochemical facies shows that at shallow depths within the Coastal Plain (less than about 200 ft) the calcium-magnesium cation facies generally predominates. The bicarbonate anion facies occurs within more of the shallow Coastal Plain sediments than does the sulfate or the chloride facies. In deeper formations, the sodium chloride character predominates. The lower dissolved-solids content of the ground water in New .Jersey indicates less upward ·vertical leakage than in Maryland and Virginia, where the shallow formations contain solutions of higher concentration.
INTRODUCTION
The science of chemical geohydrology in the United States has for many years received little attention, not only in comparison with the general field of groundwater hydrology, but also in comparison with the broad field of geochemistry. Of the geochemical cycle of the elements the part that has been studied least is that in which the circulation of ground water modifies the concentration and distribution of chemical constituents within particular environments of the earth's crust. Most of the interpretative reports prepared in this country that pertain to the hydrosphere has been restricted to the fields of oceanography, potamology, and limnology.
Although the amount of water stored in and circulating through the rocks is but a small percentage of the total water of the earth, it is this water that is largely responsible for both the chemical character and quantity of dissolved solids carried to the oceans by streams. This paper and certain succeeding papers in this series are concerned with this part of the geochemical cycle.
Interest in the geochemistry of ground water has been gradually increasing during the past several years. One factor that has contributed to this renewed and increased interest is the realization of the significance of ground-water circulation in the occurrence of uranium minerals in the Colorado Plateau. Another significant factor has been the realization that hydrochemical features of a basin may reflect the hydrodynamics of petroleum accumulation.
The primary purpose of the study reported here is to relate the chemical character of ground water to the geologic and hydrologic environment. The identification and emphasis of these interrelations should provide a firm basis for future study, which will be useful in improving data-collection programs and enabling more effective utilization of our water supplies. This
Al

A2 HYDROLOGY OF AQIDFER SYSTEMS
report is largely a description and presentation of the chemistry of ground water in the Coastal Plain portions of Virginia, Maryland, Delaware, and New Jersey. The Atlantic Coastal Plain was selected for study because of its diverse geology and the large amount of information available from previous ground-water investigations. The geology and hydrology are known in broad general terms but not in detail, whereas the chemistry of the water is known in detail for some areas but its regional setting is not well understood. The major stratigraphic units and their gross lithology are known, but detailed knowledge of their mineralogy is usually lacking. Generalized piezometric maps are available for some areas, but the movement of ground water in many areas is only poorly understood.
In any area the main factors that control the chemical character of ground water are the climate and vegetative cover, the mineral composition and physical properties of the rocks and soil through which the water circulates, and the relief of the land surface. Humid climate (precipitation about 45 in. per yr) is characteristic throughout this part of the Coastal Plain and is not discussed in this paper. Other factors that affect the chemistry of the water are physical and chemical character of the soils through which the water percolates and the activity of microorganisms.
The controls on the chemistry of the water considered in this paper are the physical properties and mineralogic composition of the sediments and the movement of ground water. The biochemical effect of microorganisms is not sufficiently understood to be considered in this type of study. The influence of the soils on the chemistry of the water is also beyond the scope of the present study.
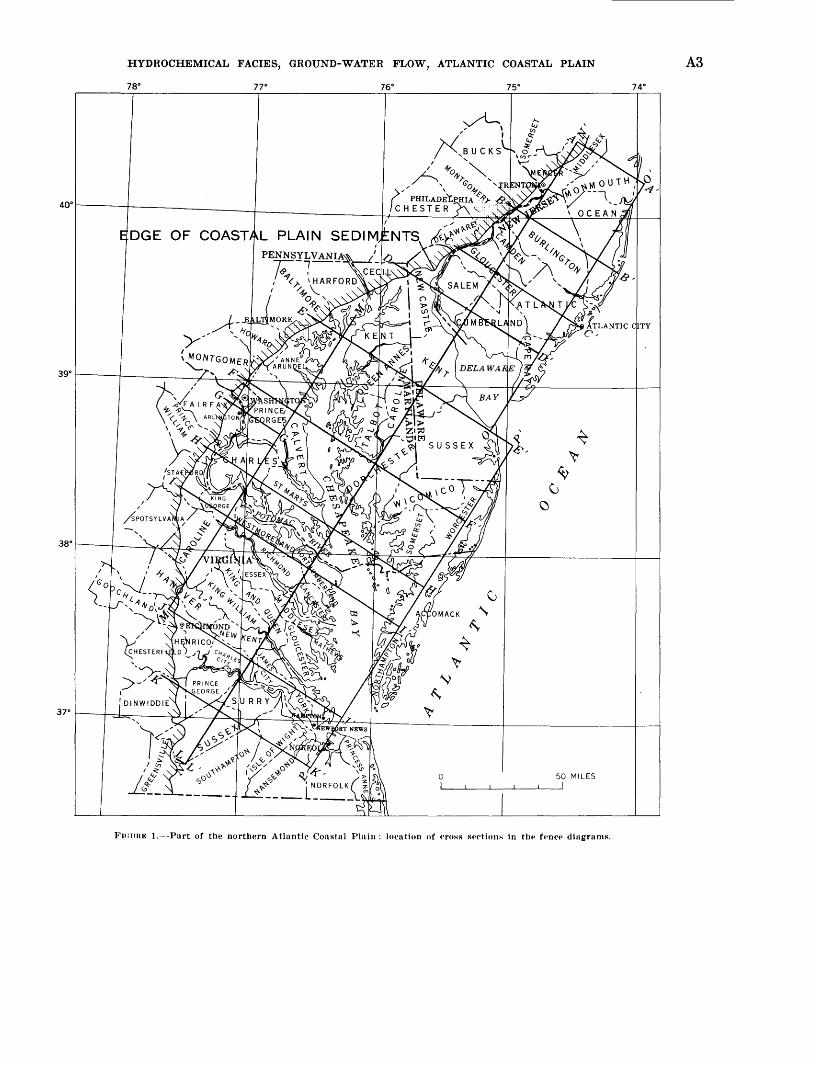
The area of the Coastal Plain reported herein extends from southern Virginia northward through New Jersey as shown in figure 1. It is approximately 300 miles long and ranges in width from about 30 to 110 miles.
More than 3,000 chemical analyses were studied during this investigation; however, only about 200 are shown on the fence diagrams. Among the analyses generally not used were partial analyses and analyses in which sodium and potassium were determined by difference. Where replicate analyses were available, the most nearly representative analysis is shown on the fence diagram. Where the location of the source of the sample was unknown, the analysis could not be used.
The data used for this study were obtained from published reports of the U.S. Geological Survey in cooperation with State water agencies, and from the unpublished-data files in the district offices in each State.
I am grateful to E. G. Otton, P. M. Brown, Allen Sinnott, H. C. Barksdale, and W. C. Rasmussen for making these data available and particularly to R. R. Bennett for his many helpful discussions.
GEOLOGY
The Coastal Plain is underlain by a wedge of sediments ranging in age from Cretaceous to Recent and consisting primarily of sand, silt, and clay, with minor amounts of gravel overlying the pre-Cretaceous bedrock. Several studies of the geology of Coastal Plain were used in the preparation of this paper for information on stratigraphic correlation and lithologic character of sediments. Although the stratigraphic relationships are fairly well understood, little detailed information is available on the mineralogy of the Coastal Plain sediments. The major stratigraphic units are summarized in table 1 from the extensive literature of the geology of the Coastal Plain (among which are Anderson and others, 1948; Bennett and Meyer, 1952; Cederstrom 1943b; Groot, 1955; Johnson and Richards, 1952; Owens and Minard, 1960; Richards, 1945, 1948; Spangler and Peterson, 1950).
The lithologic properties that most greatly affect the chemistry of the water are shown on plate 1A. The sediments are divided into those deposits predominantly of continental origin and those deposits predominantly of marine origin. A fourfold subdivision of these two rna j or units is made on the basis of the percentage of clay within each sequence. The units are further differentiated as to the presence of greensand (glauconitic sand) or calcareous material. The percentage of clay and the presence or absence of greensand and calcareous sediments are believed to be the dominant controls on the chemistry of the water. Although the percentages of clay as shown in this illustration are approximate, the general relationships and the relative amounts of clay, greensand, and calcareous sediments are representative of the regional variations.
RELATION OF SALT WATER TO FRESH WATER
FACTORS AFFECTING POSITroN OF THE SALT-WATER BODY
Figure 2 shows the generalized topography of the Coastal Plain. The highest parts of the Coastal Plain are near the Fall Zone. However, two landmasses not connected with the Fall Zone are in southern Maryland and in northern New Jersey, where the altitude is about 300 feet. As can be seen in figure 2 the altitude of most of the eastern part of the Coastal Plain, including the Eastern Shore of Maryland and most of Delaware, is less than 100 feet and is generally less than 50 feet.
HYDROCHEMICAL FACIES, GROUND-WATER FLOW, ATLANTIC COASTAL PLAIN
DGE OF COAST
"Y ~
(J
' ~
~ '\"
TY
37•r--r~~~~~~~~~~~~~~--~'\"~ ____ _J ____________ _L_J
0 50 MILES
FJ(:lTHE 1.-Part of the northern Atlantic Coastal Plain: location of ero~s st>ction;; in tht> fpnct> diagrams.
A3

A4 HYDROLOGY OF AQUIFER SYSTEMS
TABLE !.-Stratigraphic units of the northern part of the Coastal Plain
Virginia Southern Maryland Delmar Peninsula New Jersey
Alluvium, Qal, sand and gravel, chiefly beach deposits (of wind and wave origin) and channel deposits (of fluvial origin) and smaller amounts of marsh and lagoon deposits, dunes, bay-mount bars and spits. ·
Columbia group, Qdu, 0-60 ft, clay and Lowland deposits, Qdu, 0-150 ft, sand, sand; fluvial and marine; the higher, gravel, sandy clay, and clay; fluvial westerly terraces arc of continental ori- and marine. gin; the lower, easterly terraces are of marine origin.
Yorktown Formation, Ty, sandy and very fossiliferous.
St. Marys Formation,Tsm, consists largely of tough, blue or gray clay.
Calvert Formation, Tcv, diatomaceous and sandy but less fossiliferous than the Yorktown Formation.
Chickahominy Formation, Tcy, 0-80 ft, consists of gray marl beds containing subordinate glauconite and pyrite. Highly foraminiferal; marine; known from well cuttings only (Eocene).
Nanjemoy Formation, Tn, gray marl, glauconite and quartz sand, and thin limestone beds. Includes pink Marlboro Clay Member at base (Eocene).
Upland deposits, 0-55 ft, irregularly stratified cobbles, gravel, sand, and clay lenses; fluvial and marine (Pliocene and Pleistocene).
St. Marys Formation, Tsm, 0-50 ft, sand, clayey sand, and blue clay; marine (Miocene).
Choptank Formation, Tck, 20-105 ft, fine sand, sandy clay, and sand containing fossiliferous layers; marine (Miocene).
Calvert Formation, Tcv, 20-180 ft, sandy clay and fine sand, fossiliferous, contains diatomaceous earth; marine (Miocene).
Piney Point Formation, Tpp, 0-60 ft, sand, slightly glauconitic, containing intercalated "rock" layers (Miocene).
Nanjemoy Formation, Tn, 40-240 ft, glauconitic sand containing clay layers. Basal part is red or gray clay lEocene).
Columbia Group, Qdu, 0-150 ft, unconsolidated lenticular deposits of buff sand and silt, and small amounts of gravel and clay; fluvial and marine; deposits occur as stratified drift containing a few erratic boulders, stabilized dunes, marsh mud, crossbedded channel fill, well· sorted beach sand. Disconformable lower boundary.
Brandywine, Bryn Mawr, and Beacon Hill Gravels, 0-70 ft, slightly cemented red, orange, and brown gravelly sand. Locally in bard ledges a few inches to 2 ft thick, usually at the base of the formation. Chiefly channel fill. Disconformable lower boundary (Pliocene and Pleistocene).
Yorktown Formation Ty, and Cohansey Sand, Tch, 0-150 ft, gray sand and gray or blue clayey silt; the sands are predominantly fine to medium grained; coarse sand, grit, or fine gravel present in minor amounts. Black sand, green sand, and snell beds are reported locally. The clayey silt is occasionally brown or green. Estuarine and marine. Disconformable lower boundary.
St. Marys Formation, Tsm, 0-200 ft, predominantly clayey silt and silty clay, also very fine sand, shells and Foraminifera; marine; conformable lower boundary (Miocene).
Choptank Formation, Tck, 0-260 ft, gray and brown sand and clay containing shell marl and Foraminifera; marine; conformable lower boundary (Miocene).
Calvert Formation, Tcv, 15-680 ft, gray diatomaceous silt and clay containing lenses and thin sheets of gray sand, shell beds, and Foraminifera; marine (Miocene).
Chickahominy Formation, Tcy, 80-170 ft, brown glauconitic clay. Aquiclude (Eocene).
Piney Point Formation, Tpp, 0-220 ft, a white quartz sand and glauconitic greensand grading into brown shales; marine; contains foraminifera. Conformable lower boundary (Eocene).
Nanjemoy Formation, Tn, 0-295 ft, blackish-green highly glauconitic sand, silt, and clay. Conformable lower boundary; marine (Eocene).
Cape May Formation, Qcm, 0-200 ft, buff to brown poorly to well-sorted unconsolidated gravel, sand, silt, and clay in filled valleys and broad alluvial terraces; fluvial and marine (Pleistocene).
Beacon Hill and Bryn Mawr Gravels, 0-20 ft, iron-stained gravel and sand composed of residually weathered quartz, chert, and quartzite; caps a few hills as remmants of a once extensive alluvial plain. Semiconsolidated permeable deposits chiefly above the water table. Transmits water to underlying aquifers (Pliocene and Pleistocene).
Cohansey Sand, Tch, 0-270 ft, coarse to fine quartz sand and lenses of silt and clay; estuarine and deltaic; possibly marine downdip toward the-ocean; loosely consolidated thick permeable aquifer. Chiefly unconfined; receives direct recharge. Locally artesian (Miocene? and Pliocene?).
Kirkwood Formation,Tkw, 0-600 ft, gray and brown clay, silt and fine micaceous quartz sand; estuarine and marine (Miocene).
Piney Point Formation, Tpp 0-60 ft, coarse to fine glauconitic sand and greenish clay; marine; contains fossils of Jackson age (Eocene).
Snark River Marl, Tsr, 0-25 ft, fine glauconite and light-colored clay; marine (Eocene).
Manasquan Formation, Tmq, 0-25 ft, fine glauconitic sand interbedded with greenishwhite clay; marine; a leaky aquiclude (Eocene).
HYDROCHEMICAL FACIES, GROUND-WATER FLOW, ATLANTIC COASTAL PLAIN
TABLE !.-Stratigraphic units of the northern part of the Coastal Plain-Continued
A5
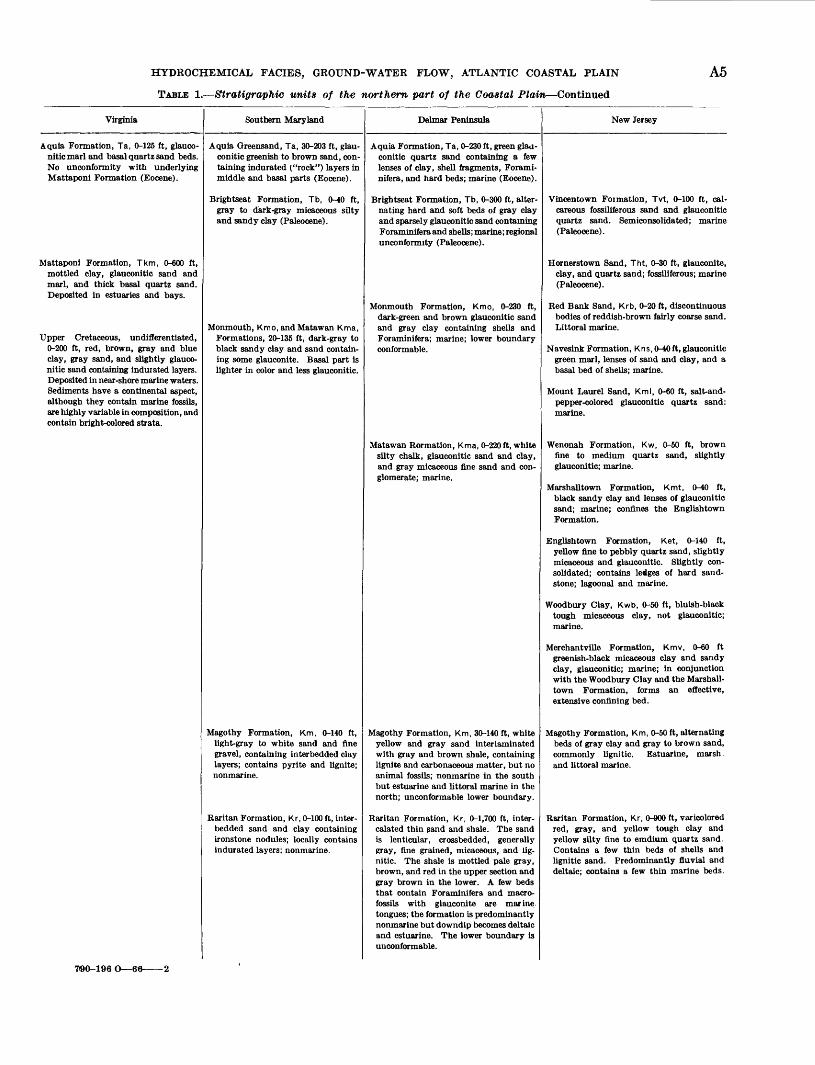
Virginia Southern Maryland
Aquia Formation, Ta, 0--125 ft, glauco- Aquia Greensand, Ta, 30-203 ft, glau-nitic marl and basal quartz sand beds. conitic greenish to brown sand, con-No unconformity with underlying taining indurated ("rock") layers in Mattaponi Formation (Eocene). middle and basal parts (Eocene).
Mattaponi Formation, Tkm, <HiOO ft, mottled clay, glauconitic sand and marl, and thick basal quartz sand. Deposited in estuaries and bays.
Upper Cretaceous, undifferentiated, 0--200 ft, red, brown, gray and blue clay, gray sand, and slightly glauconitic sand containing indurated layers. Deposited in near-shore marine waters. Sediments have a continental aspect, although they contain marine fossils, are highly variable in composition, and contain bright-colored strata.
7190-196 0-66---2
Brightseat Formation, Tb, 0-40 ft, gray to dark-gray micaceous silty and sandy clay (Paleocene).
Monmouth, Kmo, and Matawan Kma, Formations, 20-135 ft, dark-gray to black sandy clay and sand containing some glauconite. Basal part is lighter in color and less glauconitic.
Magothy Formation, Km, 0--140 ft, light-gray to white sand and fine gravel, containing interbedded clay layers; contains pyrite and lignite; nonmarine.
Raritan Formation, Kr, 0-100 ft, interbedded sand and clay containing ironstone nodules; locally contains indurated layers; nonmarine.
Delmar Peninsula
A quia Formation, Ta, 0--230 ft, green gl8olconitic quartz sand containing a few lenses of clay, shell fragments, Foraminifera, and hard beds; marine (Eocene).
Brightseat Formation, Tb, 0--300 ft, alternating hard and soft beds of gray clay and sparsely glauconitic sand con taming Foraminifera and shells; marine; regional unconformity (Paleocene).
Monmouth Formation, Kmo, 0--230 ft, dark-green and brown glauconitic sand and gray clay containing shells and Foraminifera; marine; lower boundary conformable.
Matawan Rormation, Kma, 0-220 ft, white silty chalk, glauconitic sand and clay, and gray micaceous fine sand and conglomerate; marine.
Magothy Formation, Km, 30--140 ft, white yellow and gray sand interlaminated with gray and brown shale, containing lignite and carbonaceous matter, but no animal fossils; nonmarine in the south but estuarine and littoral marine in the north; unconformable lower boundary.
Raritan Formation, Kr, 0-1,700 ft, intercalated thin ;>and and shale. The sand is lenticular, crossbedded, generally gray, fine grained, micaceous, and lignitic. The shale is mottled pale gray, brown, and red in the upper section and gray brown in the lower. A few beds that contain Foraminifera and macrofossils with glauconite are marine_tongues; the formation is predominantly nonmarine but downdip becomes deltaic and estuarine. The lower bonndary is unconformable.
New Jersey
Vincentown F01mation, Tvt, 0--100 ft, calcareous fossiliferous sand and glauconitic quartz sand. Semiconsolidated; marine (Paleocene).
Hornerstown Sand, Tht, 0--30 ft, glauconite, clay, and quartz sand; fossiliferous; marine (Paleocene).
Red Bank Sand, Krb, 0-20 ft, discontinuous bodies of reddish-brown fairly coarse sand. Littoral marine.
Navesink Formation, Kns, 0--40 ft, glauconitic green marl, lenses of sand and clay, and a basal bed of shells; marine.
Monnt Laurel Sand, Kml, 0-60 ft, salt-andpepper-colored glauconitic quartz sand: marine.
Wenonah Formation, Kw, 0--50 ft, brown fine to medium quartz sand, slightly glauconitic; marine.
Marshalltown Formation, Kmt, 0--40 ft, black sandy clay and lenses of glauconitic sand; marine; confines the Englishtown Formation.
Englishtown Formation, Ket, 0--140 ft, yellow fine to pebbly quartz sand, slightly micaceous and glauconitic. Slightly consolidated; contains leages of hard sandstone; lagoonal and marine.
Woodbury Clay, Kwb, 0--50 ft, bluish-black tough micaceous clay, not glauconitic; marine.
Merchantville Formation, Kmv, o-60 ft greenish-black micaceous clay and sandy clay, glauconitic; marine; in conjnnction with the Woodbury Clay and the Marshalltown Formation, forms an effective, extensive confining bed.
Magothy Formation, Km, 0--50 ft, alternating beds of gray clay and gray to brown sand, commonly lignitic. Estuarine, marshand littoral marine.
Raritan Formation, Kr, 0--900 ft, varicolored red, gray, and yellow tough clay and yellow silty fine to emdium quartz sand. Contains a few thin beds of shells and lignitic sand. Predominantly fluvial and deltaic; contains a few thin marine beds.
A6 HYDROLOGY OF AQUIFER SYSTEMS
TABLE !.-Stratigraphic units of the northern part of the Coastal Plain-Continued
Virginia
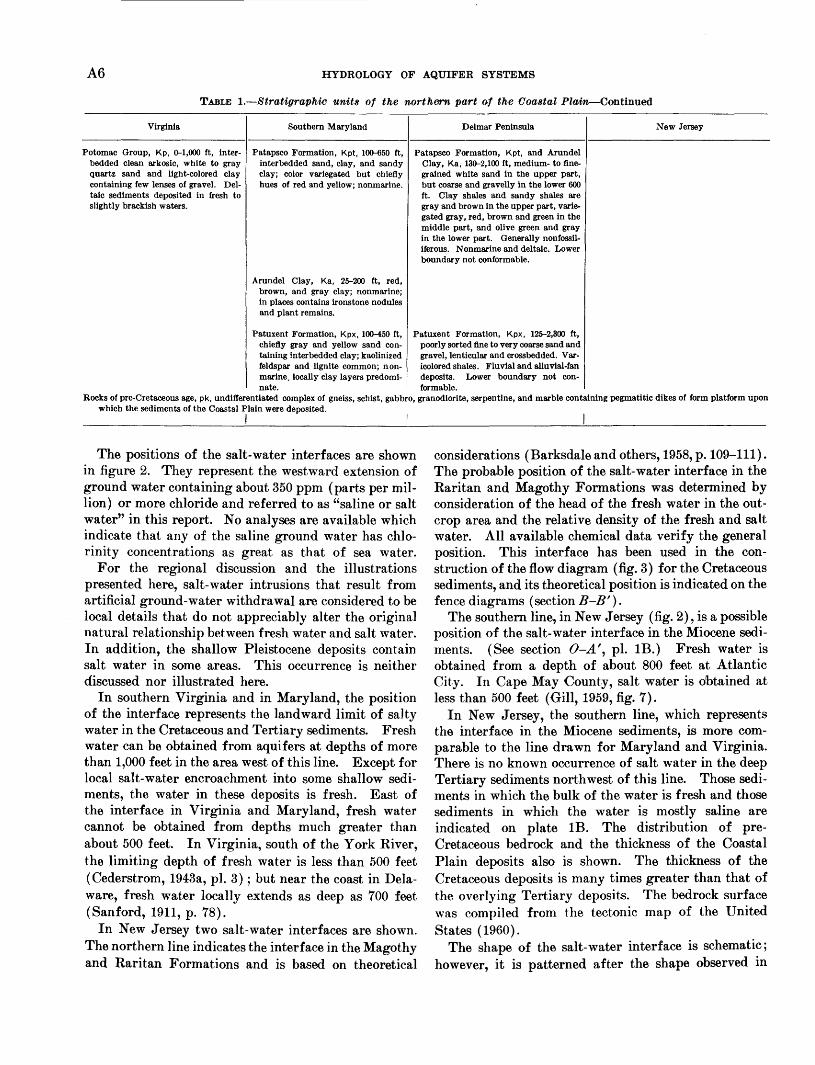
Potomac Group, Kp, (}-1,000 ft, interbedded clean arkosic, white to gray quartz sand and light-colored clay containing few lenses of gravel. Deltaic sediments deposited in fresh to slightly brackish waters.
Southern Maryland
Patapsco Formation, Kpt, 1oo-650 ft, interbedded sand, clay, and sandy clay; color variegated but chiefly hues of red and yellow; nonmarine.
Arundel Clay, Ka, 25-200 ft, red, brown, and gray clay; nonmarine; in places contains ironstone nodules and plant remains.
Delmar Peninsula
Patapsco Formation, Kpt, and Arundel Clay, Ka, 13(}-2,100 rt, medium- to finegrained white sand in the upper part, but coarse and gravelly in the lower 600 ft. Clay shales and sandy shales are gray and brown in the upper part, variegated gray, red, brown and green in the middle part, and olive green and gray in the lower part. Generally nonfossiliferous. Nonmarine and deltaic. Lower boundary not conformable.
New Jersey
Patuxent Formation, Kpx, 100-450 ft, Patuxent Formation, Kpx, 125-2,300 ft, chiefly gray and yellow sand con- poorly sorted fine to very coarse sand and taining interbedded clay; kaolinized gravel, lenticular and crossbedded. Var-feldspar and lignite common; non- icolored shales. Fluvial and alluvial-fan marine, locally clay layers predomi- deposits. Lower boundary not con-nate. formable.
Rocks of pre-Cretaceous age, pk, undifferentiated complex of gneiss, schist, gabbro, granodiorite, serpentine, and marble containing pegmatitic dikes of form platform upon which the sediments of the Coastal Plain were deposited.
j
The positions of the salt-water interfaces are shown in figure 2. They represent the westward extension of ground water containing about 350 ppm (parts per million) or more chloride and referred to as "saline or salt water" in this report. No analyses are available which indicate that any of the saline ground water has chlorinity concentrations as great as that of sea water.
For the regional discussion and the illustrations presented here, salt-water intrusions that result from artificial ground-water withdrawal are considered to be local details that do not appreciably alter the original natural relationship between fresh water and salt water. In addition, the shallow Pleistocene deposits contain salt water in some areas. This occurrence is neither discussed nor illustrated here.
In southern Virginia and in Maryland, the position of the interface represents the landward limit of salty water in the Cretaceous and Tertiary sediments. Fre.sh water can be obtained from aquifers at depths of more than 1,000 feet in the area west of this line. Except for local salt-water encroachment into some shallow sediments, the water in these deposits is fresh. East of the interface in Virginia and Maryland, fresh water cannot be obtained from depths much greater than about 500 feet. In Virginia, south of the York River, the limiting depth of fresh water is less than 500 feet ( Cederstrom, 1943a, pl. 3) ; but near the coast in Delaware, fresh water locally extends as deep as 700 feet (Sanford, 1911, p. 78).
In New Jersey two salt-water interfaces are shown. The northern line indicates the interface in the Magothy and Raritan Formations and is based on theoretical
considerations (Barksdale and others, 1958, p. 109-111). The probable position of the salt-water interface in the Raritan and Magothy Formations was determined by consideration of the head of the fresh water in the outcrop area and the relative density of the fresh and salt water. All availa;ble chemical data verify the general position. This interface has been used in the construction of the flow diagram (fig. 3) for the Cretaceous sediments, and its theoretical position is indicated on the fence diagrams (section B-B').
The southern line, in New Jersey (fig. 2), is a possible position of the salt-water interface in the Miocene sediments. (See section 0-A', pl. lB.) Fresh water is obtained from a depth of about 800 feet at Atlantic City. In Cape M·ay County, salt W8iter is obtained at less than 500 feet (Gill, 1959, fig. 7).
In New Jersey, the southern line, which represents the interface in the Miocene sediments, is more comparable to the line drawn for Mary land and Virginia. There is no known occurrence of salt water in the deep Tertiary sediments northwest of this line. Those sediments in which the bulk of the water is fresh and those sediments in which the water is mostly saline are indicated on plate lB. The distribution of preCretaceous bedrock and the thickness of the Coastal Plain deposits also is shown. The thickness of the Cretaceous deposits is many times greater than that of the overlying Tertiary deposits. The bedrock surface was compiled from the tectonic map of the United States ( 1960).
The shape of the salt-water interface is schematic; however, it is patterned after the shape observed in

HYDROCHEMICAL FACIES, GROUND-WATE-R FLOW, ATLANTIC COASTAL PLAIN
EXPLANATION
D 0-100
~ ~ 100-200 --200-300 >300
Altitude in feet
Interface between the fresh water and salt water (350 ppm Cl) for the Cretaceous sediments. In New Jersey the interface is shown for the Raritan-Magothy Formations
Interface between the fresh water and salt water (350 ppm Cl) in the Tertiary sediments Landward from these interfaces, fresh
water can be produced from depths as great as 1000 feet. Seaward from these interfaces, salt water can be produced from depths of less than about 500 feet and fresh water does not exist at depths greater than about 500 feet for the stratigraphic sequence as indicated
A7
FIGURE 2.-Map showing the relation of topography to landward extent of salt- and fresh-water interfaces in the Cretaceous and Tertiary deposits.

A8 HYDROLOGY OF AQUIFER SYSTEMS
areas of salt-water encroachment into aquifers (Kohout, 1960, fig. 3) or after the shape identified in tidal estuaries. From plate 1B it is seen that probably 80 percent of the Cretaceous and Tertiary section of the Coastal Plain contains saline ground water. This constitutes a large potential source of supply in case fresh ground-water supplies may not be adequate for future demands (Krieger and others, 1957, p. 34).
Several factors determine the positions of salt-waterfresh-water interfaces in coastal a,.reas. A major control is the distribution of fresh-water head in the recharge and discharge areas. The fresh-water head is influenced by topography, thickness of sediments, amount of recharge and discharge, and vertical and horizontal changes in permeability.
The relationship of several factors that determine the position of fresh-water-salt-water interfaces in coastal aquifers can be seen from a statement of Darcy's law:
oh q=P oD
Piezometric
(1)
where q=rate of :flow of water through a unit cross-sectional area
of porous rna terial P=permeability of porous material 'Oh/OD=rate of head change along the :flow path;
and from the Ghyben-Herzberg principle:
h=(S-l)H (2)
where h=head of fresh water above sea level S=density of salt water H =depth of salt water below sea level.
On the basis of the two preceding statements and certain idealized conditions, Harder and others (1953, p. 44) derived the following equations to express the relation of these factors to the length ( L) of the saltwater wedge:
p M2 q=2 (S-1) L (3)
L=f._ (S-1) M2
(4) 2 q
Where M is the thickness of the aquifer. The terminology is illustrated in the accompanying diagram (after Harder and others, 1953 p. 7).
surface ____________ t h =(5-l!_H __________ -~--"':::? __ _
Confining
H
{q) Flow of fresh water Aquifer M
Equation 4 expresses the length of· the salt-water wedge as a function of permeability, flow of fresh water, relative densities of the two fluids, thickness of sediments, and fresh-water head, assuming the following conditions: 1. Steady-state flow. 2. A horizontal confined aquifer discharging only at
the submarine outcrop. 3. Absence of tidal fluctuations. 4. No salt-water circulation due to dispersion or dif
fusion. From equation 4 and the diagram it can be seen that
the length of the salt-water wedge is directly proportional to the permeability and thickness of the sediments and that it varies inversely with fresh-water head and quantity of flow. By the integration steps of the deriva· tion the terms related to head have been combined with
beds
the density and thi,ckness terms. However, it is obvious from the diagram that a decrease in fresh-water head (h) will cause a corresponding decrease in depth of salt water below sea level (H), which has the effect of increasing the length of salt-water wedge.
These general relationships are shown on plate 1B and in figure 2. For example, the salt-water interface in the Miocene sediments in New Jersey is farther seaward than the interface in the Cretaceous formations because the head in the recharge area of the Miocene sediments is higher than in the recharge area of the Cretaceous formation at low altitudes along the Fall Zone. The interface in the sediments of Miocene age is farther seaward than the extent of most of the fences shown on plate 1B; however, the relative position of the two interfaces is shown in section 0-A.
In Delaware and in northern Maryland (section
HYDROCHEMICAL FACIES, GROUND-WATER FLOW, ATLANTIC COASTAL PLAIN A9
E-E') the salt-water interface is close to the Fall Zone primarily because of the absence of highlands near the outcrop area and the lower heads in the aquifers. One of the highest outcrop areas ( alt, 175 ft) of the Cretaceous formations is northest of Washington. The Cretaceous sediments and the overlying sediments also receive recharge in a highland area southeast of Washington. The existence of these high land masses and of the highland region along the northern neck of Virginia, between the Rappahannock and Potomac Rivers, allows the fresh-water head to become high enough to maintain the salt-water interface at a distance from the Fall Zone (section G-G') greater than that to the north (section F -F', pl. 1B).
In the central part of Virginia along the Fall Zone, the altitude on the surface of the Coastal Plain sediments is approximately 175 feet, which is about the same as that of the recharge area in Maryland. However, the streams have much wider flood plains and the uplands are more deeply dissected. This advanced stage of erosion facilitates the discharge of ground water locally and prevents formation of high freshwater heads under the Coastal Plain. Because of these fresh-water heads fresh water and salt water are balanced in an area closer to the Fall Zone (section I -I', pl.1B).
Because of the mutually interrelated effects of permeability and thickness of sediments on the distribution of head and quantity of water flow, generaHzation concerning their relative significance in det~rmining the position of the salt-water wedge cannot be made within the scope of this study.
In view of the preceding relationships, an obvious conclusion is that in a region of uniform rainfall the position of the salt-water-fresh-water interface in controlled primarily by the topography of the region, the extent of erosion, relative thickness of sediments, and the permeability of material in the beds within the area of ground-water flow.
FACTORS AFFECTING OCCURRENCE OF SALT WATER
Saline water may accumulate in geologic formations by any of the following processes: Retention of ions from salt water trapped at the time of deposition; intrusion of salt water after deposition due to change in sea level or in discharge; solution of minerals and concentration of the constituents by filtration by the clays; and recharge by atmospheric precipitation containing lOllS.
An objection to the hypothesis that the deep salt water is the original water in which the sediments were deposited is that salt water occurs in the Potomac group of fresh- water origin, as at Chestertown, Md., and at
Salem, N.J. Salt water in some of the ma.rine formations may be in part residual water or ions that have not been completely flushed by fresh water. However, owing to postdepositional chemical reactions, the original chemical character of the water or its source in time or space cannot be determined from the present chemistry of the water (Chaves, 1960, p. 369).
The presence of salt water may also be partly due to entrance of sea water during the Tertiary and Pleistocene submergence of the Coastal Plain. Sanford ( 1911, p. 82--83) stated this idea as follows:
In periods of elevrution underground circulation has been quickened and fresh water has gradually leached marine deposits and forced out any original sea water. In periods of depression the outcrops of fresh-water bearing beds have been saturated by sea water and blanketed by marine deposits. Another period of elevation has started fresh water down the dip, displacing sea water, leaching marine deposits, and forcing the salt but freshening solutions into the underlying beds. Thus, a bed that originally was a fresh-water deposit may have been repeatedly invaded by salt water from albove and the present salinity of the water in a particular area is to be regarded a'S connected with the last in'\"asion of salt water rather than witlh any sea water imprisoned in the beds at the time of deposition.
Some of the deep salt water may also be due to solution of minerals and to the concentration of ions by filtration by the clays. Although no analyses are available for this part of the Coastal Plain, on the basis of work done in other areas (Spangler, 1950, p. 106; Meents and others, 1952, figs. 4-13) the deeper water (below 1,500-2,000 ft), certainly is more concentrated than sea water. The specific processes involved are not sufficiently understood to satisfactorily explain the origin of brines. The dominant controls thus far identified are the relative solubilities cf minerals in concentrated solutions and the effect of clays undergoing compaction and ion exchange. The membrane properties of clays may, as has been postulated by several workers (de Sitter, 1947; Bredehoeft and others, 1963), lead to the exclusion of ions from water flowing across a membrane. That is, where the clays act as semipermeable membranes the water moves through and is discharged while the ions remain behind and are concentrated.
GROUND-WATER FLOW PATTERNS
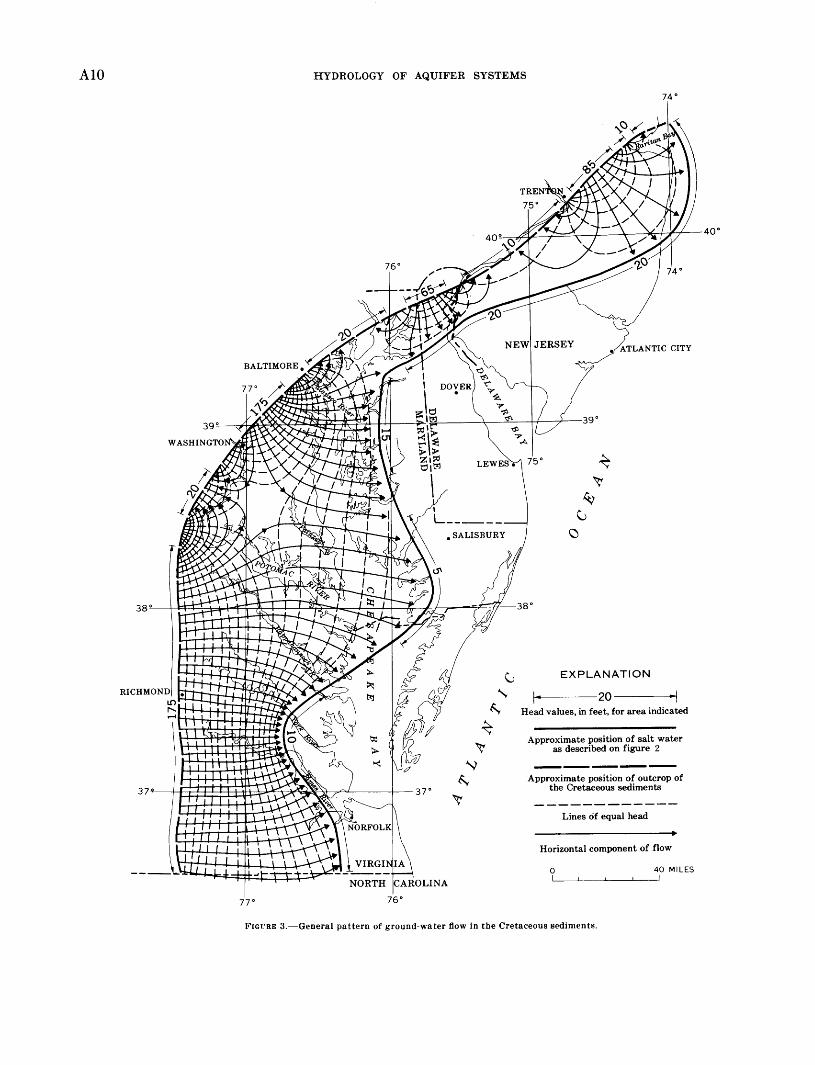
A generalized ground-water flow pattern for the Cretaceous sediments of the Coastal Plain is shown in figure 3. The western boundary of the flow patterns was established along the outcrop of the sediments near the Fall Zone and the eastern boundary along the saltwa~er interface in the Cretaceous deposits. The numbers along these boundaries represent head values. They were obtained in the outcrop area by measurement of water levels; along the salt-water interface they were
AIO HYDROLOGY OF AQUIFER SYSTEMS
EXPLANATION
~-------20--------~
Head values, in feet, for area indicated
Approximate position of salt water as described on figure 2
---------Approximate position of outcrop of the Cretaceous sediments
Lines of equal head
Horizontal component of flow
0 40 MILES
FIGl'RE 3.-General pattern of ground-water flow in the Cretaceous sediments.

HYDROCHEMICAL FACIES, GROUND-WATE-R FLOW, ATLANTIC COASTAL PLAIN All
obtained from historic records that indicate the approximate altitudes of the peizometric surface as defined by flowing wells in those areas. Because the maximum height to which the water would rise was not measured, these are minimum head values for defining the original natural conditions.
In drawing and in analyzing the pattern of groundwater flow, the salt-water interface was treated as an impermeable boundary-that is, as a limiting flow line. By definition no fresh water can cross this boundary. If fresh water could move into the salt water, the effects would be dilution of the salt water and migration of its boundary. Therefore, in effect the salt-water interface marks the limit of hodzontal flow of the fresh water.
The flow pattern was drawn by using an electric analog model in which head values are simulated by electrical potentials (voltage) applied to a sheet of graphite-coated paper having uniform resistance. After building the model the electrica] potential was contoured between the boundaries to describe the configuration of the piezometric surface. Flow lines were sketched in orthogonally to the equipotential contours to form rough squares, according to standard procedures for constructing flow nets (Casagrande, 1937). However, owing to the lack of data, primarily values for natural discharge of ground water, this illustration is not a rigorous flow net and cannot be used for quantitative studies of aquifer transmissibility and rates of water movement. In constructing the model it was not possible to take into account the amount of upward vertical leakage. Hence, this flow pattern shows the direction of ground-water movement in the Coastal Plain as if there were no upward vertical leakage. This is not to imply that the major ground-water discharge of the Coastal Plain sediments is not upward into the overlying sediments but only that the flow pattern is shown for two dimensions. The vertical movement of ground water is shown in figure 4.
This method of construction, however, is adequate to demonstrate important general features of groundwater movement. The recharge areas of the Cretaceous sediments are evidently in New Jersey, Delaware, the area between \V ashington and Baltimore, the high area of southern Maryland, and along the Fall Zone in Virginia. The areas of discharge in the outcrop area are indicated by the flow lines and by the low-head values.
In New Jersey this flow pattern is quite similar to that for the ~Iagothy and Raritan Formations. The errors introdueed into the flow pattern owing to laek of modeling for upward vertical discharge are small for the New Jersey area. Upward vertieal leakage is not a major factor in New Jersey owing to the high
head in the overlying Tertiary sediments. The water is discharged into the Raritan Bay area, along the Delaware River, and perhaps eastward from the coast through submarine springs.
It is evident that the outcrop area of artesian aquifers can function either as a discharge area or as a recharge area. This, of eourse, demonstrates that the water moves updip (that is, to the west or n6rthwest) in many parts of the Coastal Plain.
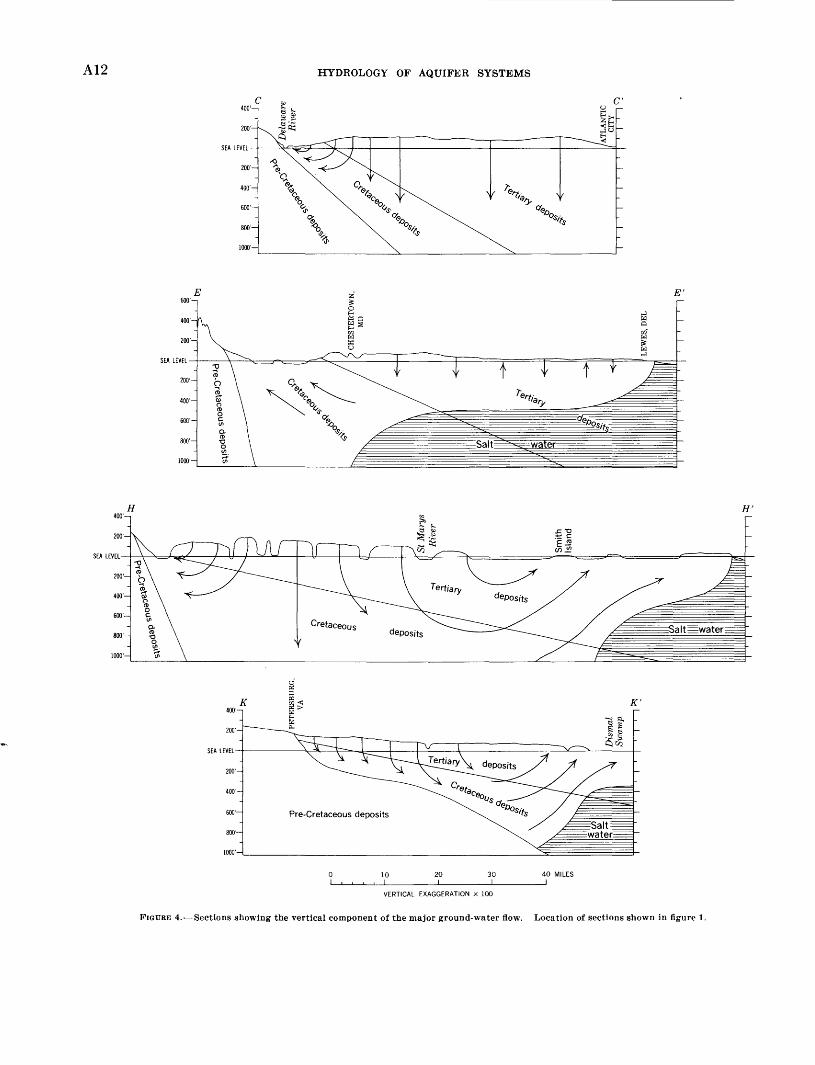
Figure 4 shows relation of topography to the generalized flow pattern in four selected cr?SS sections. The direction of movement is based on the interpretation of piezometric surface shown in figure 3 and other waterlevel maps and measurements made for local areas. Some of the water that is shown in section E-E' as being discharged updip has moved laterally southward from the recharge areas in New Jersey and northern Delaware. Some of it has been recharged through the Tertiary sediments of the central part of Del a ware. The cross section H-H' shows that mueh more of the water is discharged updip to the west and some flows uwpard to the east over the salt-water interface. In southern Virginia the ground-water flow is restricted by the shallow bedrock and by the proximity of the salt water.
Throughout much of the eastern part of the Coastal Plain the rechange is from the local rainfall. The major movement of ground water during wet periods is primarily downward to the water table; during dry periods it is upward. Of course, the ground water is discharged locally into many streams and estuaries. The water that is locally recharged and discharged has little effect on the overall chemistry of the water with the possible exception of dilution in the upper beds.
HYDROCHEMICAL FACIES
DEFINITION
The concept of hydrochemical facies has been used ( Seaber, 1962; Morgan and Winner, 1962; and Back, 1960) to denote the diagnostie chemical character of water solutions in hydrologie systems. The facies reflect the effects of chemical processes oceurring between the minerals within the lithologic framework and the ground water. The flow patterns modify the facies and control their distribution. This definition of hydroehemical faeies is a paraphrase of the definition of sedimentary facies given by Moore (1949, p. 8) : "sedimentary facies are areally segregated parts of differing nature belonging to any genetieally related body of sedimentary deposits."
The term "geoehemieal faeies" has been used by Teodorovich (1949) and Pustalov (1932, 1954) to define different sedimentary environments by means of
A12
K 400'
200'
200'
400'
600'
800'
HYDROLOGY OF AQUIFER SYSTEMS
K'
Pre-Cretaceous deposits
10 20 30 40 MILES
VERTICAL EXAGGERATION X 100
FIGURE 4.-Sectlons showing the vertical component of the major ground-water flow. Location of sections shown in figure 1.
HYDROCHEMICAL FACIES, GROUND-WATE.R FLOW, ATLANTIC COASTAL PLAIN A13
specific mineral indicators of oxidation-reduction potentials and pH. Adams and Weaver (1958) proposed that "geochemical facies" of sedimentary rocks be defined in terms of the thorium-uranium ratio. Keith and Degens ( 1959, p. 40) used the term "chemofacies" to designate all the chemical elements that are collected, precipitated, or adsorbed from the aqueous environment, or fixed by chemical reactions in the bottom muds, as a basis for differentiating between marine and freshwater sediments.
The term "hydrochemical facies" was used previously by Chebotarev ( 1955, p. 199) for a column heading in a table; however, he did not define the term and used it only to indicate concentration of dissolved solids-that is, low-saline facies, transitional-saline facies, and highsaline facies.
Many Russian scientists have contributed to formulation of the "principle of hydrochemical zones." The concept of hydrochemical facies, as used in this report, is a refinement of this approach and can be considered, in part, as subdivision of major zones. According to the usage by some Russians, hydrochemical zones cover large regions and are segregated according to the predominant anion. For instance, the European part of the Soviet Union is segregated into five hydrochemical zones (Garmonov, 1958). The zone (1) of hydrocarbonate (bicarbonate )-siliceous water coincides with the soil-tundra zone, where the average yearly temperature is 0°C. This water is low in dissolved solids. The zone (2) of hydrocarbonate (bicarbonate)-calcium water covers an extensive area in which there are many different geologic deposits, most of which contain calcareous materials. Sulfate and chloride occur in the southern part. Cation exchange also results in the creation of hydrocarbonate-sodium water in this zone. The zone ( 3) of sulfate and chloride-sulfate water roughly coincides with the central and southern parts of the steppes and is characterized by a predominance of evaporation over precipitation. Calcium is the dominant cation. The zone ( 4) of chloride water occurs in the area of the Black Sea lowland and in the northern part of the Crimean peninsula ; a second area is the Caspian lowland. The first area contains saliferous soils, salt licks, and salt marshes. The Caspian lowland is an area of desert and semidesert in which the water is the chloride-magnesium-sodium type. Zone ( 5), in which the water has a low content of dissolved solids of the hydrocarbonate-calcium type, is in the mountainous regions of the Crimea and the Caucasus.
In addition to the geographic hydrochemical zones, several scientists (Kamensky, 1958, p. 285; (Chsbotarev, 1955, p. 200) have discussed three vertical hydrodynamic zones that are characterized by certain chemi-
790-196 ().-6&-----3
cal types of water. The uppermost zone is characterized by a high degree of water circulation and wellleached rocks and sediments. The water is of the hicarbonate type and has a low dissolved-solids content. In the intermediate zone water circulates less, the dissolved-solids content is higher, and the water is of the sulfate type. The lowermost hydrodynamic zone is a "stagnant" regime in which rocks are unleached and the water is highly mineralized and primarily of the chloride-sodium type.
The hydrodynamic zones have been subdivided within the hydrochemical zones by the Russians to produce hydrogeochemical zones. The following vertical succession of hydrogeochemical zones was established by Kravtzov in the coal-bearing measures of the Donetz basin (Kamensky, 1958, p. 285): Hydrocarbonate (bicarbonate) -calci urn water, hydrocarbonate-sulfate-sodium mixed water, sulfate-sodium water hydrocarbonate-sodium water, hydrocarbonate-chloride-s o d i u m water, and possibly a zone of highly mineralized chloride-sodium w a t e r. The term ~'hydrogeochemical
zones" is used to emphasize the relationship between the chemistry and movement of water.
The term "hydrochemical facies" includes all the concepts signified by hydrochemical zones, hydrochemical microzones, hydrodynamic zones, and hydrogeochemical zones. Accordingly, one term can be used instead of four.
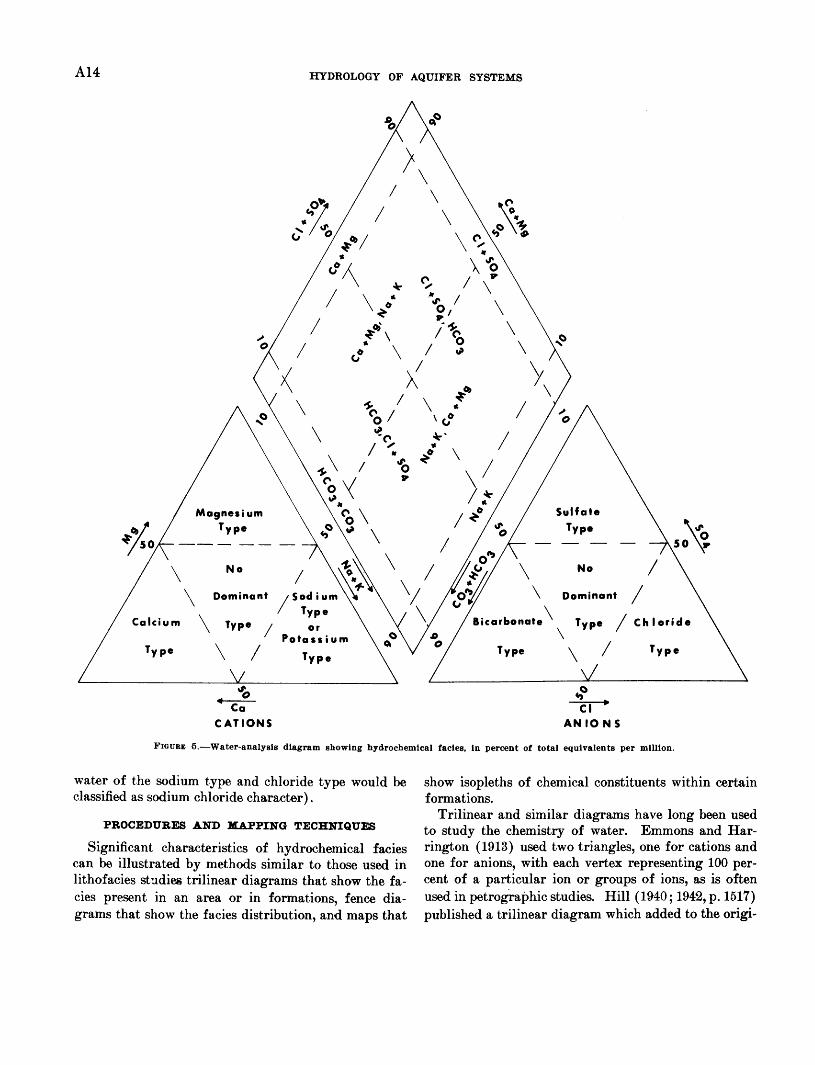
The terminology used to designate the hydrochemical facies of the Atlantic Coastal Plain (Back, 1961b) is shown in figure 5 and in table 2. A further refinement is used here to subdivide a particular facies into a chemical type of water on the basis of the dominant ion within the facies. For example, water showing the calcium-magnesium facies may be of either the calcium type or the magnesium type. On the other hand, either the facies or the type may be combined to designate the overall chemical character of the water (for example,
TABLE 2.-Classijication of hydrochemical facies of the Atlantic · Coastal Plain "
Percentage of constituents, in equivalents per million
Cation facies: Calcium-magnesium ______ _ Calcium-sodium __________ _ Sodium-calcium ___________ _ Sodium-potassium ________ _
Anion facies:
90-100 50-00 to-50 o-10
0<10 10<50 50<00 90-- 100
Bicarbonate ___ ------------ ____________ ------------Bicarbonate-chloride sul-
fate ______________________ ------------------------C hloride-sulfate-bicar-
bonate _______ ------------ ------------ ------------Chloride-sulfate _______________ --------- ------------
o Modified from Back (1961b, p. D-381). ~ May include some N 03 and F.
- 90--100 0<10
50-00 10<50
1G-50 50<00 o-10 90--100
A14 HYDROLOGY OF AQUIFER SYSTEMS
\
Magnesium Type
No / ~~ \ Dominant /Sodium\~
Type Calcium \ T ype / or
Potassium Type \ I Type
"'o ~ CATIONS
Sulfate
Type
No
.,o ~
AN 10 N S
Chloride
Type
FIGURE 5.-Water-analysis diagram showing hydrochemical facies, in percent of total equivalents per million.
water of the sodium type and chloride type would be classified as sodium chloride character).
PROCEDURES AND :HAPPING TECHNIQUES
Significant characteristics of hydrochemical facies can be illustrated by methods similar to those used in lithofacies st-:.~di~ trilinear diagrams that show the facies present in an area or in formations, fence diagrams that show the facies distribution, and maps that
show isopleths of chemical constituents within certain formations.
Trilinear and similar diagrams have long been used to study the chemistry of water. Emmons and Harrington ( 1913) used two triangles, one for cations and one for anions, with each vertex representing 100 percent of a particular ion or groups of ions, as is often used in petrographic studies. Hill ( 1940; 1942, p. 1517) published a trilinear diagram which added to the origi-

HYDROCHEMICAL FACIES, GROUND-WATER FLOW, ATLANTIC COASTAL PLAIN A15
nal two triangles a diamond-shaped area in which the two points plotted in the triangles are projected into the diamond and are plotted as a single point. Piper ( 1944) independently developed a similar diagram that has undergone minor changes and is used in this and other recent papers.
Trilinear diagrams were used in this study as the first step in the classification of the hydrochemical facies present. They were used to determine in which stratigraphic units waters were sufficiently close in composition to assume hydrologic connection between stratigraphic units to permit study as a hydrochemical unit. Therefore, the analyses were converted from parts per million to equivalents per million, and the percentages of equivalents were computed and were plotted. Because only a limited number of analyses can be plotted on any one diagram, the analyses were divided: first by States, second by formation or groups of age-related formations, and third by county boundaries.
Isometric fence diagrams (Back, 1961b) were selected as the most effective means of illustrating the geographic and stratigraphic distribution of the hydrochemical facies. A base-fence diagram was prepared to show the topography in cross section and the stratigraphic units from land surface. to 1,000 feet below sea level. Twelve parallel cross sections trending nearly perpendicular to the strike of formations were arbitrarily selected. Then, 3 northwest-trending longitudinal sections perpendicular to the 12 lateral sections were prepared. The location of wells from which water analyses were used in this study is shown on the fence diagrams. Most of these wells are within 5 miles of the particular cross section to which they are projected. The true altitude of the well top was plotted; hence, on the fence di~grams the well top may not coincide with the land surface shown.
The concentrations or percentages of the constituents selected as being most informative were: Sodium and potassium as percentage of total cations, in equ1valents per million (cation facies) ; bicarbonate and carbonate (where present) as percentage of total anions, in equivalents per million (anion facies), sum of determined constituents, in equivalents per million; concentration of the chloride ion, in parts per million; and concentration of the bicarbonate ion, in parts per million.
OCCURRENCE OF HYDROCHEMICAL FACIES WITHIN STRATIGRAPHIC UNITS
CRETACEOUS SEDIMENTS
The hydrochemical facies of the undifferentiated Cretaceous formations in Virginia, as plotted in figure
6, show that the sodium and bicarbonate facies are dominant in most of the area. The water from the counties along the Fall Zone is of a mixed character. Two analyses from N ansemond County (53, 54) show the presence of saline water. Typical analyses of water from the Cretaceous formations are shown in table 3. The index numbers in all the tables refer the analyses to the corresponding trilinear water-analyses diagrams. The well numbers given in the tables refer the analyses to the fence diagrams.
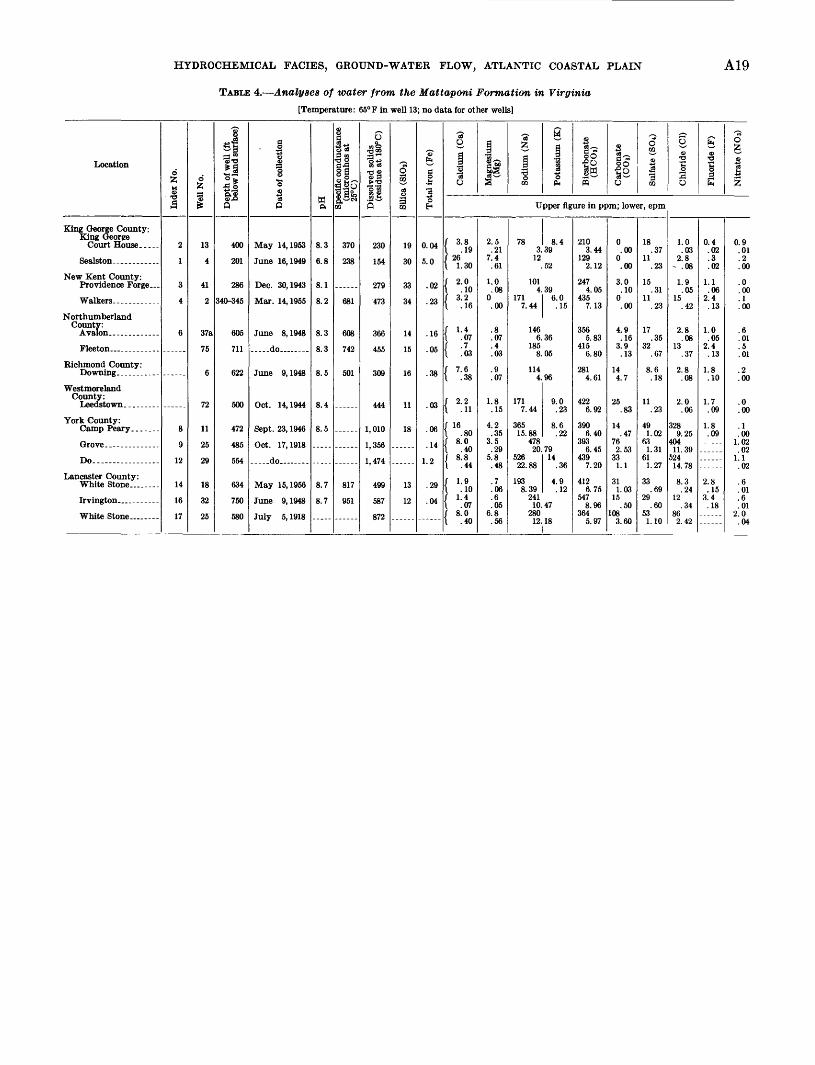
The hydrochemical facies of the Mattaponi Formation of Cretaceous and Paleocene age in Virginia are shown in figure 7. As in the Cretaceous formations, the sodium and bicarbonate are the major cation and anion facies. The one analysis reflecting the calciumsodium facies is of water near the Fall Zone. The samples from York County indicate the saline character of the water in the Mattaponi Formation in that area.
Typical analyses are given in table 4. The hydrochemical facies of Cretaceous formations in
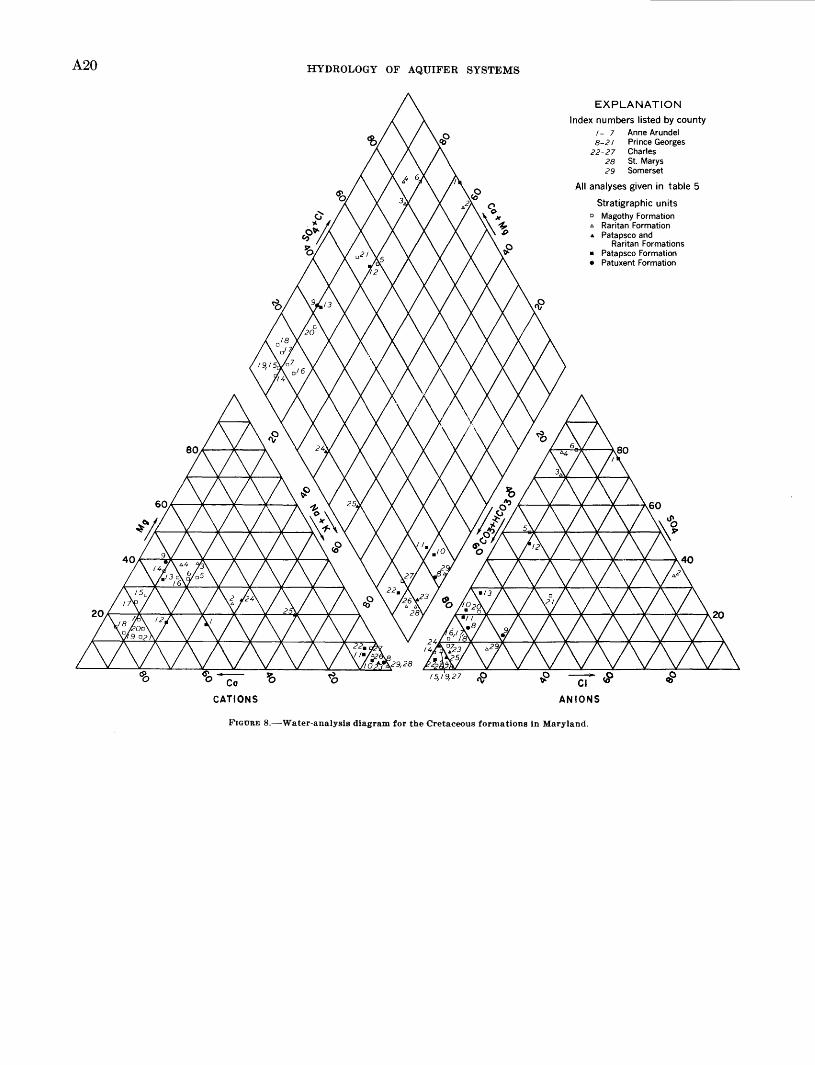
Mary land, as plotted in figure 8, shows that the water from these formations represents al1 major types. Some individual formations within the Cretaceous System contain the full range of facies. Selected analyses of water (table 5) show the range of concentration of ions in the areas where the Cretaceous formations are used extensively as aquifers. The trilinear diagram (fig. 8) shows that most of the water from Anne Arundel and Prince Georges Counties, in the higher piezometric area, is primarily of the calcium type. The availability of calcareous material determines whether the anion facies is of the sulfate or bicarbonate type. On the Eastern Shore, downgradient, the water has the sodium bicarbonate character.
The wide variability of the hydrochemical facies in the Raritan and Magothy Formations in New Jersey is shown in figure 9. Representative analyses are given in table 6. In the area of the piezometric high of Mercer and Middlesex Counties, the water is primarily of the calcium-magnesium and chloride-sulfate facies. Downgradient in the general discharge area along the Delaware River in Camden and Gloucester Counties the bicarbonate facies is dominant. The increase in bicarbonate may be due to the solution of calcareous material in the Tertiary sediments underlying the piezometric high to the east. The water from Salem County and parts of Gloucester County is of the sodium type primarily owing to the ion-exchange process and to presence of salt water from the river and from the extensive body of saline ground water.

A16 HYDROLOGY OF AQUIFER SYSTEMS
CATIONS
EXPLANATION
Index numbers listed by county 1- 8 Spotsylvania
9 Stafford 10-13 14-16 17, 18 19-23 24,25
26 27-30 31-34 35-37 38-41 42-47 48-54 55, 56
Henrico Westmoreland Richmond Sussex Hanover King and Queen Prince George Southampton Surrey Northumberland Isle of Wight Nansemond New Kent
Bold numbers refer to analyses given in table 3
ANIONS
FIGURE 6.-·Water-analysis diagram for the Cretaceous formations in Virginia.

Location
Hanover County: Hanover Court House ____________
Eastern View Farm_
Henrico County: Oak Hill Develop-
ment_ ____________
Sandston ___________
Nansemond County: Chuckatuck ________
Cypress ____________
Suffolk City ________
Prince George County: Brandon ___________
Burrowsville _______
Hopewell ___________
Prince George Court House _____
New Kent County: Walkers __ ----------
Do _____________
Stafford County: Fredericksburg _____
Sussex County: Wakefield ___________
Waverly------------
Jarratt _____________
Westmoreland County: Montross_----------
HYDROCHEMICAL FACIES, GROUND-WATER FLOW, ATLANTIC COASTAL PLAIN
TABLE 3.-Analyses of water from the undif!erentiated Cretaceous formations in Virginia [Temperature: In wells 4, 6, and 87--69°, 65°, and 49°F, respectively; no data for other wells]
~ 8 6' <i <i g = s ·.e'! Q ~~ ~~ 8 ~ ~ ~
.:!,...... s ~!3 £ Q) = ... =., ~ :liD = ... e ~ ~ ....... ~ ] oO ~~
~'0 ~ '00 0~ .oo oo
~~ :a s::.c: .,..:~ 0 ·a ~:i .~~ .oo 0 8§ '0~
~ -; :0 ~'-' 0 u ~= § .:I'-' 0 0 z 01:1: 'a u.., ....... 1>'0 0 ::s fl.) 1=4 ~ 0 ~ z .do ~~0 '0~ ~ -; ~ s u so
0 ~ s .e'! '3 fl.)
~ ~:8 !l~ 0 o! III 8.'-'~ = Upper figure in ppm; lower, epm .9 Et; A A Q. fl.) A fl.) 8 -- --------
{41 12 28 210 0 7.0 25 19 154 Dec. 31,1943 7.9 ------ 224 8.0 2.6 2.05 .96 1.22 3. 44 .00 .16
.64 { . 7 .2 76 169 3.9 16 24 34 366 June 26, 1945 8.2 214 532 ------ .04 .02 3.30 2. 77 .13 .33
{ 25 12 19 175 0 5.5 13 12 291 Nov. 6,1947 ----- ------ 173 26 .11 1. 25 .96 .83 2.87 .00 .11
{ ~.45 10 22 183 0 7. 9 10 29 272 Dec. 30,1943 7. 7 ------ 200 44 .03 .80 .96 3.00 .00 .16
{ 1. 2 . 7 174 6.4 406 20 3.8 48 1 580 Aug. 4, 1939 ----- ------ 439 17 .05 .06 .06 7. 57 ------- 6.66 .67 .08
{ 2.3 3.3 311 12 707 34 16 49 115 420 _____ do ________ ----- ------ 782 9.9 .07 .12 .27 13.53 . 31 11.59 1.13 .33
{ .8 .0 190 6.8 468 0 7. 5 52 4 673 July 28,1954 8. 3 783 484 16 .09 .04 .00 8.26 .17 7.67 .00 .16
{ 1. 9 . 5 83 4.6 221 0 5.2 28 40 405 Oct. 3,1939 ----- ------ 240 38 .03 .09 .04 3.61 .12 3.62 .00 .11
{ ~.90 10 15 19 222 0 3.3 27 48 126 _____ do ________
----- ------ 219 31 . 25 .82 .65 . 49 3.65 .00 .07
{ ~.20 5.1 17 4. 5 180 0 8.4 30 23 156 June 29, 1939 ----- ------ 213 37 .09 .42 . 74 . 12 2. 96 .00 .18
{ 69 3.1 3. 7 2.0 225 0 6.0 29 53 129 July 14,1939 ----- ------ 225 26 2.37 3.44 .26 .16 .05 3. 70 .00 .13
{ 3.6 0 210 5.8 479 0 13 55 3 440-445 Mar. 14,1955 8.1 802 541 35 .44 .18 .00 9.13 .15 7.85 .00 . 27
{ 4.8 0 310 5.0 588 0 31 56 4 615-625 _____ do ________ 8.1 1,270 800 35 .49 .24 .00 13.48 .13 9.64 .00 .65
{ 13 5.5 5.4 64 0 11 9 11 1,102 Sept. 23, 1953 6.8 132 __ .., ____
------ 15 .65 .45 . 24 1.05 .00 .23
{ 12 4.8 61 210 0 3.0 22 87 230 Nov. 26,1937 ----- ------ 209 18 .08 .60 .39 2.65 3.44 .00 .06
{ ~.89 10 14 244 0 6.0 21 79 240 _____ do ________
----- ------ 245 37 .03 .82 . 61 4.00 .00 .13
{ 8.4 2. 7 9.8 14 60 0 9.6 23 132 98 Apr. 19,1938 ----- ------ 120 30 8. 9 .24 .22 . 43 .36 .98 .00 .20
{ 1. 6 .4 130 3.9 299 14 7.5 15 6 648 May 20,1953 8.5 529 328 19 .04 .08 .03 5.65 .10 4.00 . 47 .16
8 ~ '0 ·~ ~ 0
23 .65
2.8 .08
2.0 .06
2. 4 . 07
8. 2 .23
26 . 73
12 .34
5.8 .16
3.0 .08
9. 5 . 27
2. 2 .06
33 .93
118 3.33
.8
.05
2. 2 .06
2. 9 .08
8.1 .23
2.6 .07
§: ~ '0 ·~ .e -~
0.1 .01 .6 .03
.3
.02
.0
.00
3. 5 . 18
6.4 .34
5.0 .26
. 7
.04
.4
.02
.4
.02
.o
.00
2.4 .13
2.8 .15
.1
.01
.0
.00
. 2
. 01
.0
.00
2. 4 .13
A17
0 ~ ~ ~ z
0.0 .00 .2 .00
.2
.00
. 1
.00
.58 ------
2. 5 .04 .5 . 01
. 15
.00 1.1 .02 .10 .00
.0
.00
.1
.00
.1
.00
.2
.00
1.9 .03
2.0 03 98 2 .0
2.3 04

Al8 HYDROLOGY OF AQUIFER SYSTEMS
CATIONS
EXPLANATION
Index numbers listed by county
I, 2 King George 3, 4 New Kent
5 King William 6 Northumberland
7-13 York /4-19 Lancaster
Bold numbers refer to analyses given in table 4
ANJONS
FIGURE 7.-Water-analysis diagram for the Mattaponi Formation in Virginia.
Location
King George County: King Geor![e
Court House _____
Sealston ____________
New Kent County: Providence Forge ___
Walkers ____________
Northumberland
c~~!f~n _____________
Fleeton _____________
Richmond County: Downing _________ --
Westmoreland County:
Leedstown _________
York County: Camp Peary _______
Grove.-------------
Do.----------------
Lancaster County: White Stone ________
Irvington ___________
White Stone ________
HYDROCHEMICAL FACIES, GROUND-WATER FLOW, ATLANTIC COASTAL PLAIN
0 0 z
~ z ~ '0 .s ~ --
2 13
1 4
3 41
4 2
6 37a
------ 75
------ 6
------ 72
8 11
9 25
12 29
14 18
16 32
17 25
TABLE 4.-Analyses of water from the Mattaponi Formation in Virginia
[Temperature: 65°F in well13; no data for other wells]
J 8 6 os os § = s :;!3 ~ ~<oj "'~ s ~ ~ ~ ~~ -oao 'G)
~ oO ...... rn :Srn -- e gj..-. -~ ~ Q)-o
~ '00 '0+> =I>Q ..co
~d =-= "'"' 0 Q I>Q~ ~~ -.!!! g~ ~~ 6 <a '0 0 § ~--- 0 -----0~ '0 Q tl ....... 1>'0 .!::: 0 00 ~ r:Q .S.s s s.-o '01il "' <a ,:loG) Q so rnQ) ~ G),.Q "' 4S!l!:!.
0 s ~ ~~ s oo ..co
I .a
~--- '3 0 00
III 8.---~ :;:I 0 Upper figure in ppm; lower, epm 0 0 ,::1. 00 0 00 E-<
------
I 19 0.04 { 3.8 2.5 78 8.4 210 0 18 400 May 14,1953 8.3 370 230 .19 . 21 3.39 3.44 .00 .37 30 5.0 { 26 7.4 12 129 0 11 201 June 16, 1949 6.8 238 154 1. 30 . 61 .52 2.12 .00 .23
279 33 .02 { 2.0 1.0 101 247 3.0 15 286 Dec. 30, 1943 8.1 ------ .10 .08 4.39 4.05 .10 .31 34 .23 { 3.2 0 171 I 6.0 435 0 11 340-345 Mar. 14,1955 8.2 681 473 . 16 .00 7.44 .15 7.13 .00 .23
14 .16 { 1.4 .8 146 356 4.9 17 605 June 8,1948 8.3 608 366 .07 .CYT 6.36 5.83 .16 .35 15 .05 { . 7 .4 185 415 3.9 32 711 _____ do ________ 8.3 742 455 .03 .03 8.05 6.80 .13 .67
309 16 .38 { 7.6 .9 114 281 14 8.6 622 June 9,1948 8.5 501 .38 .CYT 4.96 4. 61 4. 7 .18
11 .03 { 2.2 1. 8 171 9.0 422 25 11 500 Oct. 14,1944 8.4 ------ 444 .11 .15 7.44 .23 6.92 .83 .23
18 .06 { 16 4.2 365 8.6 390 14 49 472 Sept. 23, 1946 8.5 ------ 1,010 .80 .35 15.88 .22 6.40 . 47 1.02 .14 { 8.0 3. 5 478 393 76 63 485 Oct. 17, 1918 ----- ------ 1,356 ------ .40 .29 20.79 6.45 2.53 1. 31
1.2 { 8.8 5.8 W6 IH 439 33 61 554 _____ do ________ ----- ------ 1, 474 ------ .44 .48 22.88 .36 7.20 1.1 1. 27
13 .29 { 1.9 . 7 193 4. 9 412 31 33 634 May 15,1956 8. 7 817 499 .10 .06 8.39 .12 6. 75 1.03 . 69 12 .04 { 1.4 .6 241 547 15 29 750 June 9,1948 8. 7 951 587 .CYT .05 10.47 8.96 .50 .60
------ { 8.0 6.8 280 364 11)1 53 580 July 5,1918 ----- ------ 872 ------ .40 .56 12.18 5.97 3.60 1.10 I
A19
s g ~ ~ Q) G)
:9 ~ $ ~ ~ "' b :a ::::1
~ z 0
1.0 0.4 0.9 .03 .02 .01
2.8 .3 .2 - .08 .02 .00
1.9 1.1 .0 .05 .06 .00
15 2.4 . 1 . 42 . 13 .00
2.8 1.0 .6 .I)! .05 .01
13 2.4 .5 .37 .13 .01
2.8 1.8 .2 .08 .10 .00
2.0 1.7 .0 .06 .09 .00
328 1.8 . 1 9.25 .09 .00
404 ------ 1. 02 11.39 ------ .02
524 ------ 1.1 14.78 ------ .02
8.3 2.8 .6 .24 .15 .01
12 3.4 .6 .34 .18 .01
86 ------ 2.0 2.42 ------ 04
A20 HYDROLOGY OF AQUIFER SYSTEMS
~-0 Ca
15,19,27
CATIONS
EXPLANATION
Index numbers listed by county 1- 7 8-21
22-27 28 29
Anne Arundel Prince Georges Charles St. Marys Somerset
All analyses given in table 5
Stratigraphic units o Magothy Formation "' Raritan Formation ... Patapsco and
Raritan Formations • Patapsco Formation • Patuxent Formation
ANIONS
FIGURE 8.-Water-analysis diagram for the Cretaceous formations in Maryland.

HYDROCHEMICAL FACIES, GROUND-WATE.R FLOW, ATLANTIC COASTAL PLAIN
TABLE 5.-AnaZyses of water from the Cretaceous formations in Maryland
[Location: The last well listed here is at Crisfield; the location of all the others is indicated on pl. 15 of Otton, E. G. (1955). Geologic formation: Kpt, Patapsco Formation; Kr, Raritan Formation; Km, Magothy Formation; Kpx, Patuxent Formation]
.. 8 s:: 8 p Iii' Iii' g 8 §: s:: .! 0 ~~ ~ ~
~ ~-;;; .,o 8 ~ e ~ ~";:;' .! ~ ~ -aoo -;- ~";:;' Q;) Q;)
="' ~ ="' ·-'"' 5 i ~ ....... ~ I oO
.! "0 "0 Q;) ~ "00 'i-a; i~ oo
~ ] !:~ = =-'= 0 i~ .co s 0 g -;;; gs "'Q;) s:: :a ..... '3 i Q;)= § _g 0
_ ..... z 0 0~ - ~ r.>~6 ~i 0 ~ 00 ll. lt1 0 00 0 ~ .... z -'=o 0 Sao 5 .a Q;)
::a g.:! ~ s s §. ..... ~ [§.l .. 0 "0 "' Q;) ~ Ci'-' = Upper figure in ppm; lower, epm .:I ~ A A 8 0. 00 00 8
------54 34 9 2. 5 { 1.8 0.6 1.3 1.6 0 ------ 9 2 0 1 AA-Bf2 ___ 318 Kpt May 1,1951 58 4.1 .09 .05 .06 .04 .00 ------ .19 .06 .00
114 2.8 .35 { 6.2 2.3 6.1 1. 4 2 ------ 14 7 .2 2 AA-Be4L 67 Kpt-Kr Apr. 16,1946 56 4. 7 75 . 31 .19 .26 .04 .03 ------ .29 .20 .01 5.3 86 53 6.2 30 { 6.30
3.6 2.2 1.4 10 ------ 26 1.8 .3 3 AA-CeL_ 213 Kpt-Kr Apr. 1,1946 ---- .30 .10 .04 .16 ------ .54 .05 .02 Anne Arundel 7.6 19 { 7.9 3.8 1. 5 1.7 9 ------ 32 1.2 .2 4 AA-DflL 600 Kpt-Kr Mar. 20,1945 ---- 5.2 ------ 66 .39 .31 .07 .04 .15 .67 .03 .01 County. ------
{ 7.8 3.5 2.1 2. 7 21 ------ 20 2 .3 5 AA-Ce46__ 00 Km May 8,1946 57 5.6 95 62 13 11 .39 .29 .09 .09 .34 ------ .42 .06 .02 83 9.1 21 { 6.2 2.5 1.8 1.8 5 ------ 25 1.5 .3 6 AA-Cfll __ 95 Km Apr. 16,1946 ---- 4.9 55 .31 . 21 .08 .05 .08 ------ .52 .04 .02
342 17 1. 2 {sg.50 7. 7 4.2 7.2 100 ------ 15 2.5 .1 7 AA-Ed8 __ 265 Km June 28,1946 ---- 7.2 209 .63 .18 .18 3.09 ------ . 31 .07 .01 411 19 1.9 { 5.9 3.5 88 7.6 265 ------ 7.5 .5 .9 22 Ch-Cc5 ___ 274 Kpt Apr. 2,1952 ---- 7.9 265 .29 .29 3.83 .19 4.34 ------ .16 . 01 .05 365 19 .98 { 1. 4 1. 2 85 4.0 216 ------ 16 2. 4 . 7 23 Ch-DdlO_ 414 Kpt-Kr Mar. 7,1951 ---- 8.2 245 .07 .10 3.69 .10 3.54 ------ .33 .07 .04 268 158 11 . 73 e~ 8.3 20 11 165 ------ 11 .9 .3
Charles 24 Ch-Cf9 ___ 679 Kpt-Kr Apr. 17,1952 ---- 7. 5 1.05 .68 .87 .28 2. 70 ------ .23 .03 .02 County. 371 244 32 1.8 e5 9.4 54 7.6 229 ------ 9 6.8 .1
25 Ch-DaL_ 210 Kpt-Kr Mar. 20,1951 ---- 7.4 . 75 . 77 2.35 .20 3. 76 ------ .19 .19 .01 13 .00 { 3.4 1.6 68 5. 7 188 ------ 8. 5 2.2 .3 26 Ch-Eel8 __ 300 Kr Jan. 27,1947 ---- 8.6 327 204 .17 .13 2.00 .15 3.08 ------ .18 .06 .02 16 .48 { 5.9 2.4 70 8.6 210 ------ 13 1. 2 .5
27 Ch-Bcl2 __ 234 Km Mar. 28,1950 ---- 7.8 357 224 .29 .20 3.04 .22 3.44 ------ . 27 .03 .03 24 .19 { 1.2 .1 60 .8 132 ------ 20 4. 5 .1
8 PG-Ebl __ 603 Kpx Mar. 28,1949 52 8.0 255 180 .06 .01 2.65 .02 2.16 ------ .42 .01 .13 10 10 { 8.8 3.9 1. 5 1.9 39 ------ 5. 9 3.8 .0
9 PG-Dd17_ 214 Kpx Apr. 18, 1951 ---- 6.6 95 58 .44 .32 .07 .05 .54 ------ .12 .11 .00 32 . 59 { 2.8 1 6 .6 130 ------ 28 1. 5 .3 10 PG-Fb7 __ 263 Kpt Mar. 31, 1949 60 8.1 265 209 .14 .08 2.61 .02 2.13 ------ .58 .04 .02 13 .95 { 3.4 1.6 50 4.8 123 ------ 24 1. 5 .1 11 PG-Ec26_ 324 Kpt Mar. 31,1952 ---- 7.8 246 157 .17 .13 2.17 .12 2.02 ------ .50 .04 .01
{ 7.6 1. 2 1.6 1.8 17 ------ 14 2 .2 12 PG-Cf25 __ 398 Kpt Apr. 17,1952 ---- 5.9 69 60 22 10 .38 .10 .07 .05 .28 ------ .29 .06 .01
{~.00 6.8 3.5 2.6 73 22 2.4 .1 13 PG-Cel8_ 464 Kpt Nov. 4,1949 58 6.5 177 911 7.6 1.8 .56 .15 .07 1.20 ------ .46 .07 .01
12 .83 {ay.95 15 4.9 5.5 203 ------ 9.2 1.4 .1 Prince 14 PG-Fd32_ 400 Km Apr. 17,1952 ---- 7.8 320 184 1. 23 . 21 .14 3.33 ------ .19 .04 .01
Georges {~. 75
8.6 2. 7 4.8 153 ------ 9.6 1.8 .2 County. 15 PG-Fd10_ 366 Km Apr. 14,1952 ---- 7.9 254 149 16 .28 .71 .12 .12 2.51 ------ .20 .05 .01
1.8 {~.45 11 4.2 9. 2 147 ------ 13 1. 2 .3 16 PG-Fc1L 150 Km Apr. 13,1950 54 7. 7 263 149 13 .91 .18 .24 2.41 ------ .27 .03 .02
13 . 21 e7 7.9 3.4 1. 2 158 ------ 13 1. 5 .2 17 PG-Fd6 __ 404 Km Mar. 25,1949 60 7. 7 285 169 1.85 .65 .15 .03 2. 59 ------ .27 .04 .01
{ag.w 6. 7 3.1 1.7 192 ------ 18 2 .3 18 PG-Ef5 ___ 226 Km Apr. 15,1946 ---- 7. 5 33 210 25 .31 .55 .13 .04 3.15 ------ .37 .06 .02
{liiJ.50 5.2 5 1.9 178 ------ 10 2.1 .2
19 PG-Ef3 ___ 366 Km June 6,1949 ---- 6.9 307 183 15 14 .43 .22 .05 2.92 ------ . 21 .06 .01
e7 2 3.1 1 58 ------ 13 2.5 .1 20 PG-Cf2 ___ 171 Km Mar. 22, 1949 57 6.5 132 128 45 12.7 .85 .16 .13 .03 .95 ------ .27 .07 .01
{21 2 3.4 2.1 40 ------ 18 12 .1 21 PG-Ce17 _ 118 Km Nov. 4,1949 59 7.5 149 108 4.4 .32 1.05 .16 .15 .05 .66 ------ .38 .34 .00
St. Mary11 }28 { 1.05
. 7 70 3.5 176 ------ 7. 7 2.8 .6 STM-Ef4_ 661 Kr Ian. 16,1947 67 8.4 308 192 13 .31 .06 3.05 .09 2.00 .20 .16 .08 .03 County.
{ .5 1.2 294 3 586 12 51 70 2.2 Somerset }29 Som-Ec3-- 1,076 Km Oct. 19,1951 79 8.5 1,160 732 14 .12 .03 .10 12.79 .08 9.61 .40 1.06 1.97 .12 County.
A21
8 e Q;)
-;;; ~ z
0.2 .()()
21 .34 . 1 .00 .o .00 .o .00 .o .00
1. 5 .02 .8 .01 .4 .01 .5 .01 .8 .01 .3 . 01 .7 .01
1. 6 .03 .5 .01
1.1 .02 .8 .01 .1 .oo .1 .00 .5 .01 .3 . 01 .6 .01
1.8 .03 .2 .00 .2 .00 .8 .01
1.4 .02 .2 .00
1.3 .02

A22 HYDROLOGY OF AQUIFER SYSTEMS
CATIONS
EXPLANATION Index numbers listed by county
1-15 Salem 16-44 Gloucester 45-49 Mercer 50-54 Middlesex 55-85 Camden 86-91 Monmouth 93-97 Burlington
Bold numbers refer to analyses given in table 6
ANIONS
FIGURE 9.-Water-analysts diagram for the Magotby and Raritan Formations in New Jersey.
Although the sulfate and chloride contents of the water in the Raritan and Magothy Formations of New Jersey are not appreciably different from those in the formations farther to the south, the extremely low content of the bicarbonate ion permits the development of the chloride-bicarbonate and the bicarbonate-chloride facies.
Figure 10 shows that water from the Red Bank Sand, Mount Laurel Sand, and Wenonah Formation is primarily of the calcium bicarbonate character. Typical analyses are given in table 7. ·
Hydrochemical facies of the Englishtown and Vincentown Formations of Paleocene age, shown in figure 11 and table 8, are similar to those of the Mount Laurel
Formation and Wenonah Sand. Seaber (1962) has done detailed mapping of the hydrochemical facies in the Englishtown Formation.
EOCENE FORMATIONS
The water from the Eocene formations in Virginia, as shown in figure 12 and table 9, is almost entirely of the sodium bicarbonate character. A few analyses show the sodium-calcium bicarbonate character.
The hydrochemical facies of the Aquia Greensand (fig. 13) and the other aquifers of Eocene age (fig. 14) in Mary land are predominantly bicarbonate. Tables 10 and 11 show the decrease in calcium and magnesium with the corresponding increase in sodium in the water

Location
Burlington County: Beverly _____________
Burlington __________
Florence ____________
Mt. Holly __________
Stevens Station. ____ Camden County:
Haddon Heights ____
Runnemede. _______ Gloucester County:
Gibbstown. ________
Glassboro ___________
Mullica HilL _______ Mercer County:
Bordentown. _______
Hamilton Square ___
Hightstown _________ Middlesex County:
Browntown _________
Do __________________
Old Bridge _________
Runyon .. __________ Monmouth County:
Asbury Park _______
Fort Hancock _______ Salem County:
Salem _______________
Location 0 z ~ G)
HYDROCHEMICAL FACIES, GROUND-WATE-R FLOW, ATLANTIC COASTAL PLAIN
TABLE 6.-A.nalyses of water from the Magothy and Raritan Formations in New Jersey
8 8 6 '2 '2 g d .s 0 s d ~ ~<;;; "'~ s ~ e E1 s ~!3 ~ ~ :5! .... 'Q)
-~ j ~~
~~ ~
-"' .§~ § oO "'W't:l
u Q)
~~ e ~bii .oo oo s ll:d ~ !3 =s 5 ~::s .~S .oo s
0 -.! <;;; 't:IQ) d <a ;e :a--- :; 0 u 80 Q)::l § .g OS'-' 0 0 z 0!1: 0 t u ......... 1>'1:1 0 ::s tf.l ~ ~ 0 tf.l
~ z -5.s Q, <dUO 3 Q) = s E1 -a-s~ ~ 1l 2-ll '1:1 Q) OS Q) ~ 8.'-'C'I ~ 0 Upper figure in ppm; lower, epm .5 Et; ~ ~ E-< Q, tf.l ~ E-<
{11
95
93
96
94
67
56
34
20
19
48
49
45
53
54
52 a
51
90
91
5
-------- --
0 z
July 3,1953 6.9 216 145 9.4 0.00 {12 10 10 3.6 34 B9 57 ---- .60 .82 .44 .09 .56
May 24,1951 7.2 318 203 10 2. 0 e3 10 14 10 88 B4 86 55 1.15 .82 . 61 .26 1. 44
3,1951 7.1 112 84 12 .03 { 8.0 4.4 4.8 1.4 8 Bl 120 May 55 .40 .36 .21 .04 .13
May 24,1951 7.9 190 113 9. 8 .68 { .26 4. 6 3.2 6.3 98 B6 385 58 1.30 .38 . 14 .16 1. 61
5. 6 49.1 41 12 .71 { 3.6 1. 5 2.8 .5 3 B2 150 May 3,1951 55 .18 .12 .12 . 01 .05
Dec. 23,1949 7.4 228 131 9.6 .64 {zr. 35 6.1 6.2 8.0 98
C2 267 ---- . 50 .27 . 21 1. 61
7.5 109 8.8 .16 {19 4.2 11 6.6 87 C3 318 __ .do __________ ---- 186 .95 .35 .48 .17 1.43
Aug. 20, 1951 56 5.8 373 208 10 .15 { 7.8 5.0 54 2.9 5 03 105 .39 .41 2.35 .07 .08
7,1951 65 8.1. 515 315 12 .11 { 3.0 1.0 18 4.6 292 GI 630 May .15 .08 5.13 .12 4. 79
Dec. 21,1950 58 8.2 967 538 9. 7 1.4 { 9. 2 2.4 196 8.1 323 02 263 .46 .20 . 52 . 21 5.29
4. 5 53.2 27 7. 7 . 28 { 1. 6 .8 2. 7 .9 0 M2 85 Sept. 26, 1949 54 .08 .07 .12 .02 .00
M4 228 May 4,1950 ---- 5.4 34.3 28 6.5 . 15 { 1.8 .7 2. 5 .9 5 .09 .06 .11 .02 .08
Sept. 26, 1949 5. 6 38.3 27 9.3 4.1 { 2. 2 1.2 2.3 1.0 8 M1 205 ---- .11 .10 .10 .03 .13
27 2.0 34 { 2. 9 1.5 2.8 .4 12 Mx3 ------ Apr. 18,1933 ---- ----- ------- .14 .12 .12 . 01 .20
50 1.1 106.9 { 6. 2 3.3 3.0 5. 1 30 Mx4 117 June 6,1941 -- ------- ------- . 31 .28 .13 .13 .49
4. 8 22 7.1 3.2 { 1. 0 .9 1.9 .8 --------Mx2 ------ Nov. 13,1942 ---- ------- . 05 .07 .08 .02 .02
38 8.0 4.4 { 2. 9 .9 5.0 6. I Mxl 260 July 18,1923 ---- ----- ------- .14 .07 . 22 .10
Mol 1,135 Nov. 13, 19"24 ---- ----- ------- 66 5.5 8.1 { ------ ------- 6.2 37 .27 . 61
5. 5 115 8.2 22 { 8. 9 2. 5 7.5 12 Mo2 481 Mar. 20,1948 ---- 66 .44 . 21 .33 . 20
7. 6 654 5.4 2.1 {12 1.4 116 I 4. 9 129
S1 320 Apr. 26,1956 53 346 .60 . 12 5. 05 .13 2.11
TABLE 7.-A.nalyses of water from selected Cretaceous formatiom in New Jersey
[Geologic formation: Kmw, Wenonah Formation and Mount Laurel Sand; Krb, Red Bank Sand]
8 d 8 6 "2 '2 §
s 0 d E d s E1 $
~!3 ~ :3 ~<;;; fll'b e ~ OS..-..
'1:100 'Q) .E! d"
-"' fl u Q) ::s..,
_ .... e ~ ~bij § ]
oO "'W't:l ~ '1:10 c; ... .oo li:d .g B s;::.c Ulos 0 ·s =::s :a=: -.!
0 8§ ~~ d <a ~--- ;e
.~-u u OS § 0 0 0 0!1: "ijQ 0 !. u ......... !::: 0 ::s tf.l ~ ~
:5.9 ~-~0 .........
'* s- Ofll
~ 3 Q,G) E1
0 40 0 .83 0 38 0 . 79 0 14 0 .29 0 15 0 . 31 0 14 0 .29 0 29 0 .60 0 20 0 .42 0 12 0 . 25 0 6.2 0 .13 0 6. 5 0 . 14 0 11 0 .23 0 2. 0 0 .04 0 6. 2 0 .13 0 1.4 0 .03 0 1.3 0 .03
---- 8.1 ---- .17
0 11 0 . 23 0 15 0 . 31 0 13 0 . 27 0 1.8 0 .04
0 $ ~ ~~ $ oo -eo s
"3 OS'-' 0 tf.l
8 Q)
'1:1
~ 0
12 .34
20 .56
8.0 .23
1.2 .03
3.2 .10
1.6 .05
1.6 .05
96 2. 71
19 .54
140 . 95
2.5 .07 2.8 .08
2.4 .07
6.0 .17
4.2 .12
2.6 .07
3. 0 .08
4. 0 .11
18 . 51
131 3. 69
8 G)
'1:1 -~
:a 0
~ ~g~ -~~ '1:1 G).0 G) "' G) :I: ;j 0
.5 Et; ~ 0 ~ E-< c. tf.l ~ E-< Upper figure in ppm; lower, epm
------- ------------Burlington County:
7. 7 109 11 0.30 {21 5.4 3.3 8.4 107 0 4. 5 2. 2 Browns Mills ___ 5 B17 279 Kmw June 4, 1951 59 187 1. 05 .44 . 14 . 21 1. 75 ------ .09 .82
8.1 115 13 .28 {22 5. 7 5. 3 8.5 Ill 0 5. 0 2. 0 Vincentown _____ 4 Bl8 150 Kmw June 21, 1951 57 192 1.10 .47 .23 .22 1.82 ------ .10 .06
Camden County: 7.9 103 15 .11 {24 2. 7 2.4 3. 5 86 0 9. 0 1.8
Clementon ______ 14 C1 280 Kmw Apr. 24, 1951 60 163 1.19 . 22 .10 .09 1. 41 ------ . 19 . 05
Monmouth County: 7.8 130 14 .15 {~.40 6.1 8.4 107 0 16 5.8
Belmar __________ 9a Mo6 452 Kmw Aug. 8, 1951 54 210 . 50 . 21 1. 75 ------ . 33 . 16
131 10 . 47 {~.80 2.8 9. 0 116 0 12 5. 5 Eatontown ______ 9 Mo7 ------ Krb Mar. 20, 1947 54 7.4 229 .23 .39 1.90 ------ . 25 .16
Salem County: 30 10 2. 2 {23 3.8 9. 7 13.0 56 0 40 6.6
Salem ___________ 10 S6 135 Kmw Doo. 21, 1950 I 48 7. 4 217 ]. 15 . 31 . 42 . 08 . 92 ------ .83 .19
.71 { 58 12 159 0 . 28 7. 7 Do __________ 13 S7 ------ Kmw Sept. 15,1952 ------ 7. 9 305 ------ ----- 2. 87 .54 2. 61 ------ . 58 .32
I I
A23
g s e Q) '1:1 .s "§ OS
.E! b z ~
0.0 13 .00 .21 .2 5. 9 .01 .10 .0 21 .00 .34 . 1 .6 . 01 . 01 .0 .8 .00 . 01 .2 .6 . 01 . 01 .3 .5 .02 . 01 .0 6.2 .00 .10
1.6 .7 .08 .01
1.4 .8 .07 . 01 .0 . 1 .00 .00 .0 7.2 .00 .12 . 1 .1 . 01 .00
------ . 1 ------ .00
.4 11
.02 .18
.0 .0
.00 .00 ------ ------------ ------------ ------------ ------
.0 .0
.00 .00
.3 .0
.02 .00
g 0 e Q) '1:1 .s "§ ~ ::s ~ z
0. 0 I
0.9 .00 . 14 . 1 .0 .01 .00
. 1 .3
.01 . 01
. 1 .6
.01 . 01
.2 ,"o
. 01 .00
. 1 . 7
.01 .01 ------ .3 ------ .01
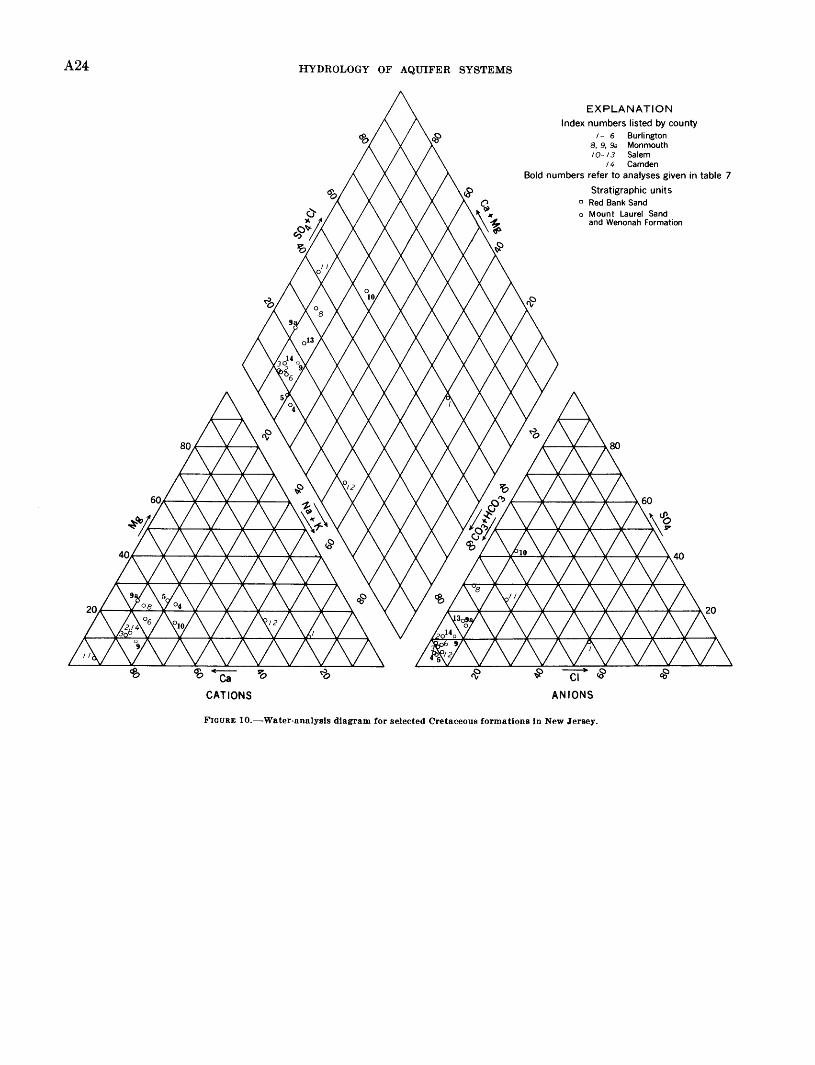
A24 HYDROLOGY OF AQUIFER SYSTEMS
CATIONS
EXPLANATION
Index numbers listed by county 1- 6 Burlington
8, 9, 9a Monmouth 10-13 Salem
14 Camden Bold numbers refer to analyses given in table 7
Stratigraphic units o Red Bank Sand o Mount Laurel Sand
and Wenonah Formation
ANJONS
FIGURE 10.-Water-analysis diagram for selected Cretaceous formations in New Jersey.

HYDROCHEMICAL FACIES, GROUND-WATEH FLOW, ATLANTIC COASTAL PLAIN
TABLE B.-Analyses of water from the EngUshtown and Vincentown Formations in New Jersey
[Geologic formation: Ket, Englishtown Formation; Tvt, Vincentown Formation]
Location 0 z ..s Q)
00 c ~
Burlington County: Marlton _________ 1
Pemberton ______ 5 Do __________ 10
Smithville ______ . 4
Monmouth County: Asbury Park ____ 17a
Avon by the Sea.
17b
Fort Monmouth_ 15
Ocean County: Mantoloking __ ._ 18a
Salem County: Alloway _________ 24
Quinton __ ------ 23
Location
Hanover County: Ellerson_ ------------
Henrico County: Bottoms Bridge ______
San Rafael Court_ ___
King and Queen County: Shackelfords Fork ___
Lancaster County: Lively---------------
Northumberland County:
Lewisetta _____ . _-.-.-
Westmoreland County: Kinsale ______________
0 z ~ ~
--
B16
B13
B14
B15
Mo3
Mo4
Mo5
01
S5
S4
0 z ..s Q)
00 c ~
1 8 6 Q)'
'2 g = r;;- = e s '2 ~ 5 ~ c ~~ Ul~ a e a «1.-.. Q)
~~ ~ c .... ~ ~ ooao 0
-~ . ::! ::I C"'
~~ _.rn
~ ::Srn .........
.!:I ~bii a oO Q) ooo -o .... 1 .oo ~ 'Woo i ~ c..c= rn«< 0 3 ~;::!1 .::! -~~ oo .a 1!1:!::
~~---.oo
-.:'!! -g~ § 0 a; «<'-' 00 0 :a--- '3 -Q 0 01!1: 0 !. 1>00 E-< 0 ;::!1 r:n ~ r:Q 0 r:n .S.s 0
~ ~-§~ crtil «< '0 a U}Q)
~ Q,Q) .~!:!. Q),O Q) Q) ~ ~---~ Upper figure in ppm; lower, epm ~ 0 ~ E-< Q, r:n ~ iii
-- ----
Ket Mar. 22,1951 56 8. 2 251 166 27 0. 45 {43 4.0 2. 2 5. 7 149 0 7.0 260 2.14 .33 .10 .15 2.44 ------ .15
300 Ket May 28,1951 56 7.8 253 156 16 .16 {~.20 3.0 2.2 4.3 153 0 5.0 . 25 .10 .11 2. 51 0 .10
392 Ket Apr. 23,1956 58 8.0 196 118 9. 7 { .02 27 4.6 2. 7 7.4 112 0 6. 4 .00 1. 35 .38 .12 .19 1. 84 0 .13
110 Ket June 4,1951 61 7.4 134 101 27 3.0 {~.00 1.6 1. 8 4.3 67 0 7.2 .13 .08 .11 1.10 0 .15
Ket Nov. 13,1924 124 9. 5 1. 7 e6 5.4 8.3 85 0 25 600 ------ ----- ------ 1.30 .44 .36 1.39 ------ . 52 Ket Nov. 12, 1924 138 11 .10 e2 7. 2 9.4 100 0 32
------ ------ ----- ------ 1.60 . 59 . 41 1.64 0 .67 1. 5 {~.90 3.0 4.9 121 0 8.6 325 Ket Apr. 9,1953 58 7.3 228 ------ ----- .25 1.98 0 .18 ------------
Sept. 1,1955 69 7. 7 250 .39 ------{ 39 140 0 14 ------ Ket ------ ----- ------- 1.69 2. 29 0 .29
156 Tvt Apr. 26,1956 53 8.0 327 200 12 .15 {36 12 9.0 6.9 170 0 30 1.80 .99 .39 .17 2. 79 0 .63
133 Tvt Dec. 21,1950 7.6 390 254 36 1.9 {sg.99 8. 7 7.4 4.9 212 0 24 ------ • 72 .32 .13 3.47 0 .50
TABLE 9.-Analyses of water from the Eocene formations in Virginia [Geologic formation: Ta, Aquia Formation; Tn, Nanjemoy Formation; Tcy, Chickahominy Formation]
1 ~ 8 6 I '2 '2
g c ~ 0 = ~ .... 0 s ~ e a ~ ~~ 0 ~fil "'"" ~ ~
QcO Q)' § j = ... ~~ ,....rn
~ ::Srn .........
'i a oO 'Woo i 000 '0+> e .oo oo ~
~~ c..c= rno:l 0 -a ~bli .::! :a~ .oo .!
~~--- ~~ c a; 00 -~.._, :a--- '3 0 Q § 0 «1)1 0 0
01!1: '6D - .!:I 0 )1__. r:n ~ r:Q 0 r:n z .S.s 0 0 !fL~o QCil ~ "' a; = Q,Q) '0 ~=~ -~~ -~ Q) Q),O Q) ~ c.---~ ::::1 ~
~ ~ 0 ~ ~ E-< Upper figure in ppm; lower, epm Q, r:n r:n ---- ------- - -
I Ta Nov. 7, 1947 __ 7.3 222 17 0.11 {~.50 14 36 230 0 14 3 24 142 ------ 1.12 1. 57 3. 77 .00 .29
Ta Oct. 28, 1947 __ 8.1 167 16 18 { 6. 7 2.3 57 136 14 8.1 5 35 268 ------ .33 .18 2.48 2. 23 .47 .17 ·.
{26.30 11 24 177 0 13 4 22 181 Ta Dec. 1943 _____ 7.9 ------ 183 26 .03 .88 1.04 2.90 .00 . 27
Tn May 18, 1948 .. 8. 4 429 267 23 .19 { 4.8 1. 4 94 241 5.9 7.6 7 45a 320 .24 .12 4.09 3.95 .20 .16
Tcy June 9, 1948 __ 8.4 634 400 25 .83 { 5.2 2.4 148 374 9.8 11 19 3 365 .26 .20 6.45 6.13 .33 .23
July 5, 1918 ___ 31 .67 { 5.0 6. 7 107 180 60 -------15 16a 325 ------ ------ ------ -----· .25 . 55 4. 65 2.95 2.00 .16
May 1946 _____ 7.8 212 45 .05 e4 5.8 49 182 0 11 9 65 280 ------ ------ . 70 .48 2.13 2.98 .00 .23
A25
s 6 ~ e Q) Q)
::! ::! Q)
~ !S ~ !3 :a ::I
r;:; z 0
2.6 0.4 0.3 .07 .00 .01
3.4 .1 .3 .09 . 01 • 01
2. 2 .1 .9 .06 .01 .02
2.2 .2 .2 .06 .00 .00
2.0 ------ -----.06 ------ -----
4.0 ------ -----.11 ------ -----
6.8 ------ .1 .19 ------ .00
1. 5 ------ 1. 5 .04 ------ .02
3.0 .3 .0 .09 .02 .00
5.6 .4 . 7 .16 .02 . 01
§ 0 ~ e Q) Q) 00 ::! ! -~ !S :a ::I
r;:; z 0
4 0.2 0. 7 .11 . 01 .0
4 4 . 5 .11 .02 .0
2. 1 .0 .0 .06 .oo 00
2.5 1.0 1.0 .07 .05 05
4.0 1.8 .6 .11 .10 .0
3.5 ------ ------.20 ------ -----
1.8 .5 .1 .05 .03 00
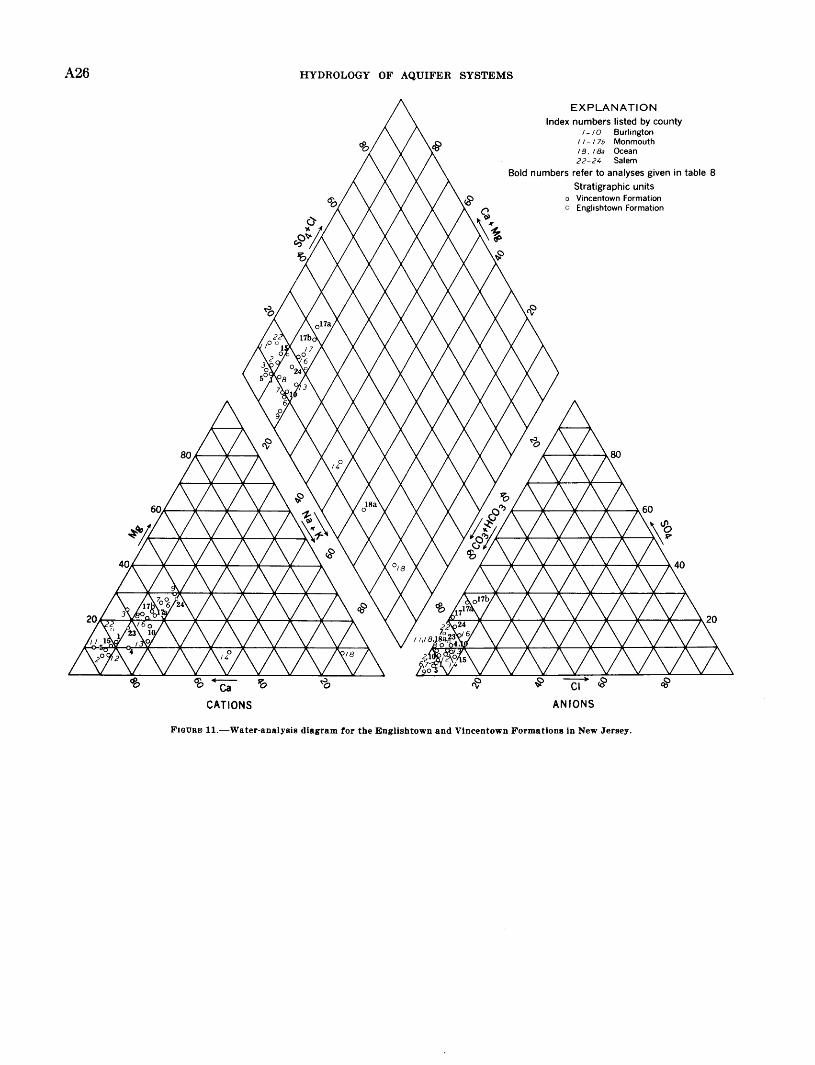
A26
-Ca
CATIONS
HYDROLOGY OF AQUIFER SYSTEMS
EXPLANATION
Index numbers listed by county 1- 1 o Burlington
1 1- 1 7b Monmouth 18, IBa Ocean 22-24 Salem
Bold numbers refer to analyses given in table 8 Stratigraphic units
o Vincentown Formation o Englishtown Formation
ANJONS
FIGURFJ 11.-Water-analysis diagram for the Englishtown and Vincentown Formations in New Jersey.
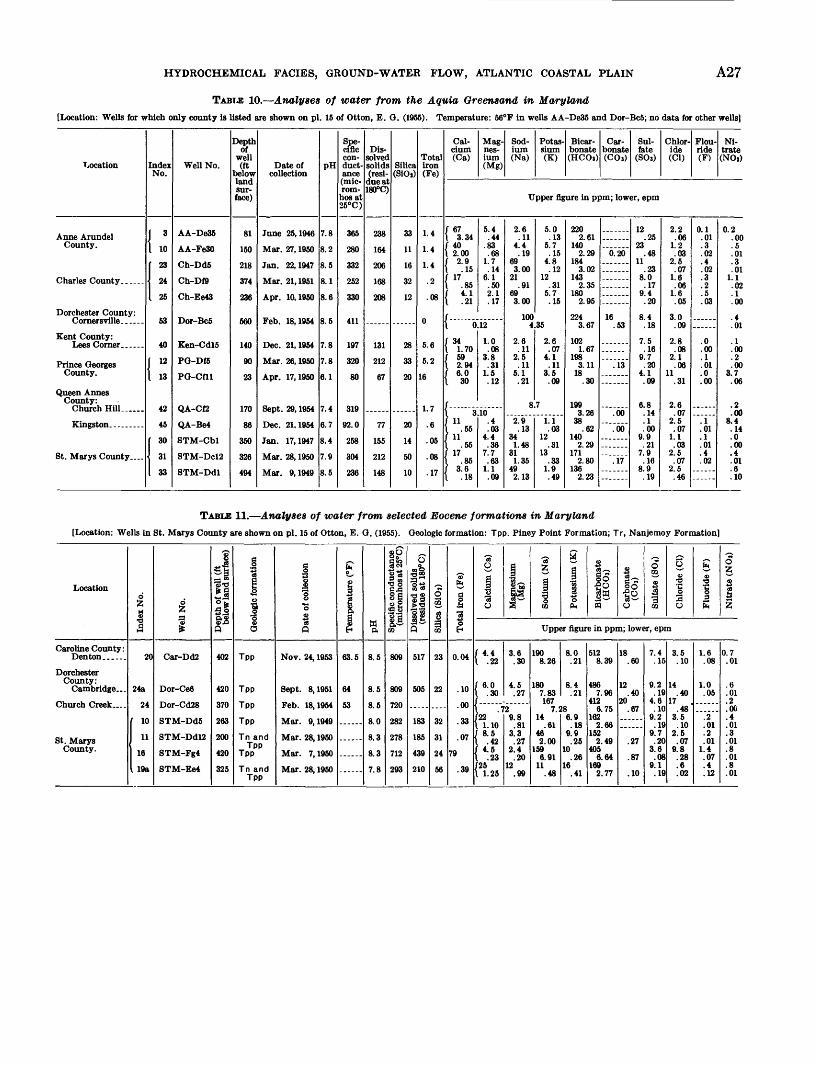
HYDROCHEMICAL FACIES, GROUND-WATER FLOW, ATLANTIC COASTAL PLAIN A27
TABLE 10.-A.naZyses of water from the A. quia Greensand in M aryZand
[Location: Wells for which only county is listed are shown on pl. 15 of Otton, E. 0. (1955). Temperature: 56°F in wells AA-De35 and Dor-Bc5; no data for other wells]
Depth Spe- Cal- Mag- Sod- Potas- Blear- Car- Sul- Chlor- Flou- Ni-of ciftc Dis- cium nes- ium sium bonate bonate fate ide ride trate
well con- solved Total (Ca) ium (Na) {K) (HCOa) (CO a) (SOa) (Cl) (F) (NOs) T,ocation Index Well No. (ft Date of pH duct- solids Silica iron (Mg)
No. below collection ance (resi- (Si01) (Fe) land (mic- due at sur- rom- 1!KI"C) face) hos at Upper figure in ppm; lower, epm
25°C) ------
{ 3 AA-De35 81 June 25, 11K6 7.8 365 238 33 1.4 { 67 5.4 2.6 5.0 220 ------- 12 2.2 0.1 0.2 Anne Arundel 3.34 .44 .11 .13 2.61 ------- .25 .06 .01 .00
County. 10 AA-Fe30 150 Mar. 27, 1950 8.2 280 164 11 1.4 { ~00 .83 4.4 5. 7 140 ------- 23 1. 2 .3 . 5 .68 .19 .15 2.29 0.20 .48 .03 .02 .01
c""'"" County _____ -l 23 Ch-Dd5 218 Jan. 22,1947 8.5 332 206 16 1.4 { 2.9 1.7 69 4.8 184 ------- 11 2.5 .4 .3
.15 .14 3.00 .12 3.02 ------- .23 .07 .02 . 01 2f Ch-Df9 374 Mar. 21, 1951 8.1 252 168 32 .2 { 17 6.1 21 12 143 ------- 8.0 1.6 .3 1.1
.85 .50 . 91 .31 2.35 ------- .17 .06 .2 .02 25 Ch-Ee43 236 Apr. 10,1950 8.6 330 208 12 .08 { 4.1 2.1 69 5. 7 180 ------- 9.4 1.6 .5 .1
.21 .17 3.00 .15 2.95 ------- .20 .05 .03 .00 Dorchester County: { ------oj2 ____ 100 224 16 8.4 3.0 ------ .4 Cornersville ______ 53 Dor-Bc5 560 Feb. 18,1954 8.5 411 ------ ------ 0 4.35 3.67 .53 .18 .09 .01 ------Kent County:
{ ~.70 1.0 2.6 2.6 102 ------- 7.5 2.8 .0 .1 Lees Corner ______ 40 Ken-Cd15 140 Dec. 21, 1954 7.8 197 131 28 5.6 .08 .11 .07 1. 67 .16 .08 .00 .00 ------
{ 12 PO-Df5 90 Mar. 26, 1950 7.8 320 212 33 5.2 { 59 3.8 2.5 4.1 198 ------- 9. 7 2.1 .1 .2 Prince Georges 2.94 .31 .11 .11 3.11 .13 .20 .06 .01 .oo
County. 13 PO-Cnl 23 Apr. 17, 1950 6.1 80 67 20 16 { 6.0 1.5 5.1 3.5 18 ------- 4.1 11 .0 3. 7 30 .12 .21 .09 .30 ------- .09 .31 .00 .06
Queen Annes County:
1. 7 { ------3~iii ____ 8.7 199 ------- 6.8 2.6 ------ .2 Church HilL ____ 42 QA-Cf2 170 Sept. 29,1954 7.4 319 ------ ------ 3.26 .00 .14 .07 .00 --------------- ------Kingston __ ------- 45 QA-Be4 86 Dec. 21. 1954 6. 7 92.0 77 20 .6 {11 .4 2.9 1.1 38 ------- .1 2.5 .1 8.4
.55 .03 .13 .03 .62 .00 .00 .07 .01 .14
St. Muys County ... -j 30 STM-Cb1 350 Jan. 17,1947 8.4 258 155 14 .05 {11 4.4 34 12 140 ------- 9.9 1.1 .1 .0
.55 .36 1.48 .31 2.29 ------- . 21 .03 .01 .00 31 STM-Dc12 326 Mar. 28, 1950 7.9 304 212 50 .08 { 17 7. 7 31 13 171 ------- 7.9 2.5 .4 .4
.85 .63 1.35 .33 2.80 .17 .16 .07 .02 .01 33 STM-Dd1 494 Mar. 9,1949 8.5 236 148 10 .17 { 3.6 1.1 49 1.9 136 ------- 8.9 2.5 ------ .6
.18 .09 2.13 .49 2.23 ------- .19 .46 ------ .10
TABLE 11.-AnaZyses of water from selected Eocene formations in Maryland
[Location: Wells in St. Marys County are shown on pl. 15 of Otton, E. 0. (1955). Geologic formation: Tpp. Piney Point Formation; Tr, Nanjemoy Formation)
~J 56 6 "2 I ~ "2 g 8 0 ~ ~ ~ a~ <IJ~ s ~ ~
~ ~
0 ~ ~ ::::::.!3 ~-; Oil.--~ ~ :;:! ... Qi'
-~ ~ ...
~~ cP cP :a.; ~ .a~ 13--- ~
oO '0 ell j i i-; e 'Fil .OC,.) ~ '0
Location ~.d i~ ~ oo ~ '§ -;
0 ~a .S! 8 ga '0~ 0 g (,)
~ -~~ .oo !! ~ -o-; u §_ -; 0 ~ ..... '3 .d .E! z ~ - ~
uO ~'0 .~ C) ::it rl.l ~lot IXl C) rl.l C) ~ z ~ .do 0 cc=~ l! -; cP = ~! '0 ! ~ -a·s 5 '0 ~ ::1 0 ~ ~
ell !, ..... iS._.. Upper figure in ppm; lower, epm 1-4 A 0 A E-t Q, rl.l rl.l E-t ---
Caroline County: 20 {4.4 3.6 190 8.0 512 18 7.4 3.5 1.6 0. 7 Denton ______ Car-Dd2 402 Tpp Nov. 24,1953 63.5 8.5 809 517 23 0.04 .22 .30 8.26 .21 8.39 .60 .15 .10 .08 .01
Dorchester County:
{ 6.0 4.5 180 8.4 486 12 9.2 14 1.0 .6 Cambridge ___ 24a Dor-Ce6 420 Tpp Sept. 8,1951 64 8.5 809 505 22 .10 .30 .27 7.83 .21 7.96 .40 .19 .40 .05 .01 Church Creek ____ 24 Dor-Cd28 370 Tpp Feb. 18,1954 53 8.5 720 .00 ------ ------ 167 412 20 4.6 17 ------ .2 ----- ---- .72 7.28 6. 75 .67 .10 .48 ------ .00
10 STM-Dd5 263 Tpp Mar. 9,1949 8.0 282 183 32 .33 22 9.8 14 6.9 162 ------ 9.2 3.5 .2 .4 ---·-- 1.10 .81 .61 .18 2.66 ·----- .19 .10 .01 .01
{ 11 STM-Dd12 200 Tn and Mar. 28,1950 8.3 278 185 31 .07 8. 5 3.3 46 9.9 152 9. 7 2.5 .2 .3
St. Marys .................. .42 .27 2.00 .25 2.49 .27 .20 .07 .01 .01 County. Tpp
{ 4.5 2.4 159 10 405 3.6 9.8 1.4 .8 16 STM-Fg4 420 Tpp Mar. 7,1950 ------ 8.3 712 439 24 79 ~: .23 .20 6.91 .26 6.64 .87 .08 .28 .07 .01
19a STM-Ee4 325 Tn and Mar. 28, 1950 7.8 293 210 56 .39 25 12 11 16 169 9.1 .6 .4 .8 Tpp
------ ~ 1.25 .99 .48 .41 2. 77 .10 .19 .02 .12 .01
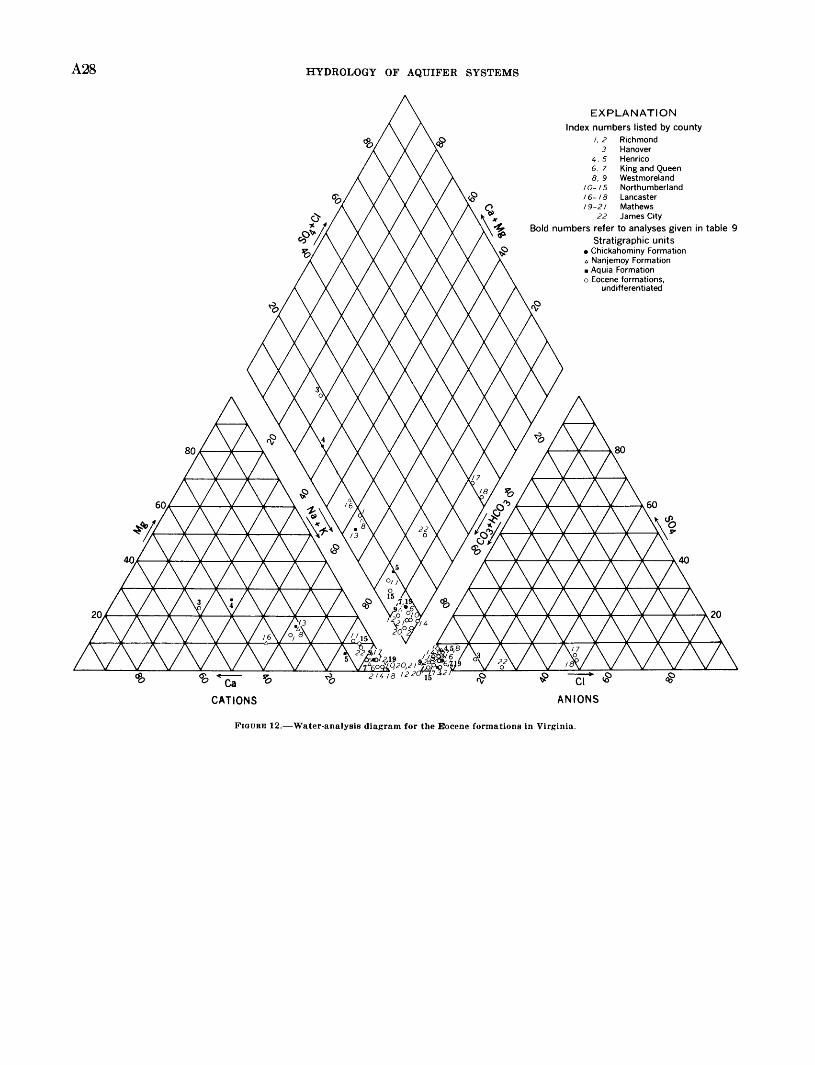
A28 HYDROLOGY OF AQUIFER SYSTEMS
CATIONS
EXPLANATION
Index numbers listed by county I, 2
3 4, 5 6, 7
8, 9 10-15
Richmond Hanover Henrico King and Queen Westmoreland Northumberland
16- 18 Lancaster 1 9-2 1 Mathews
2 2 James City
Bold numbers refer to analyses given in table 9 Stratigraphic units
• Chickahominy Formation c. Nanjemoy Formation • Aquia Formation o Eocene formations,
undifferentiated
ANIONS
FIGURE 12.-Water-analysis diagram for the Eocene formations in Virginia.
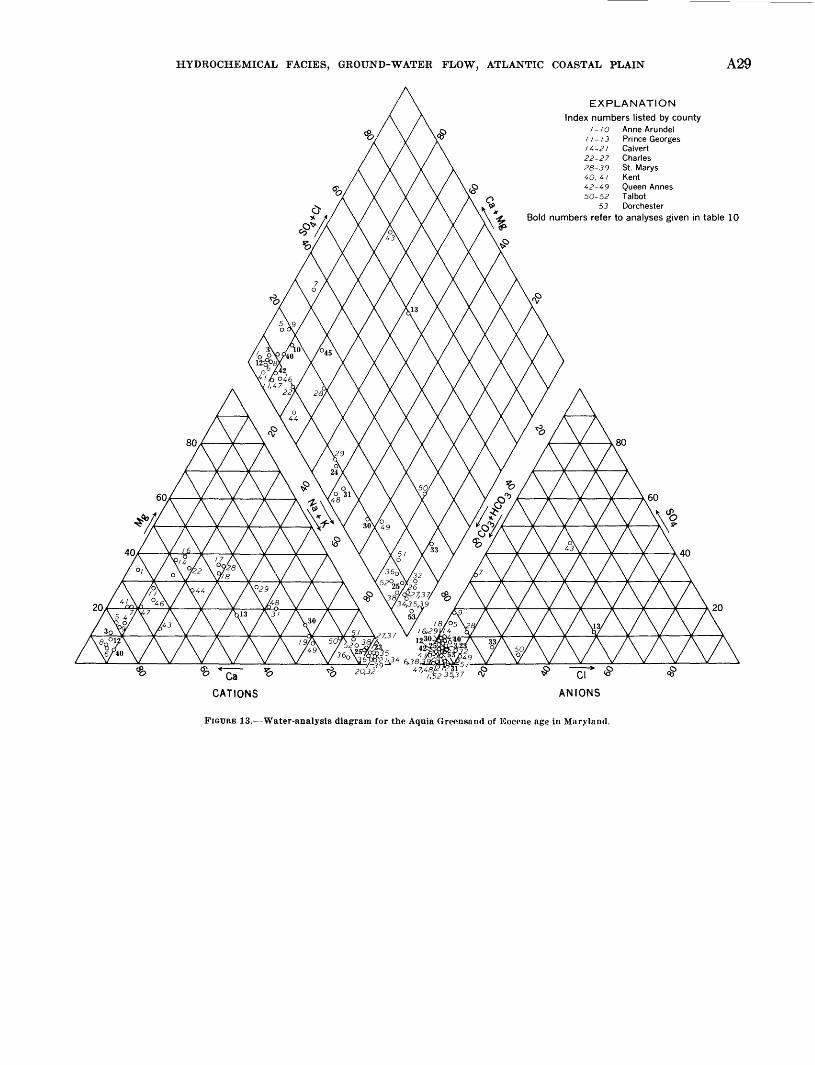
HYDROCHEMICAL FACIES, GROUND-WATEH FLOW, ATLANTIC COASTAL PLAIN
EXPLANATION
Index numbers listed by county 1-10 Anne Arundel
I 1-13 Pri nee Georges 14-21 Calvert 22-27 Charles 28-39 St. Marys 40,4/ Kent 42-49 Queen Annes 50-52 Talbot
53 Dorchester
A29
Bold numbers refer to analyses given in table 10
CATIONS ANIONS
FIGURE 13.-Water-analysis diagram for the Aquia Greensand of Eocene age in Maryland.
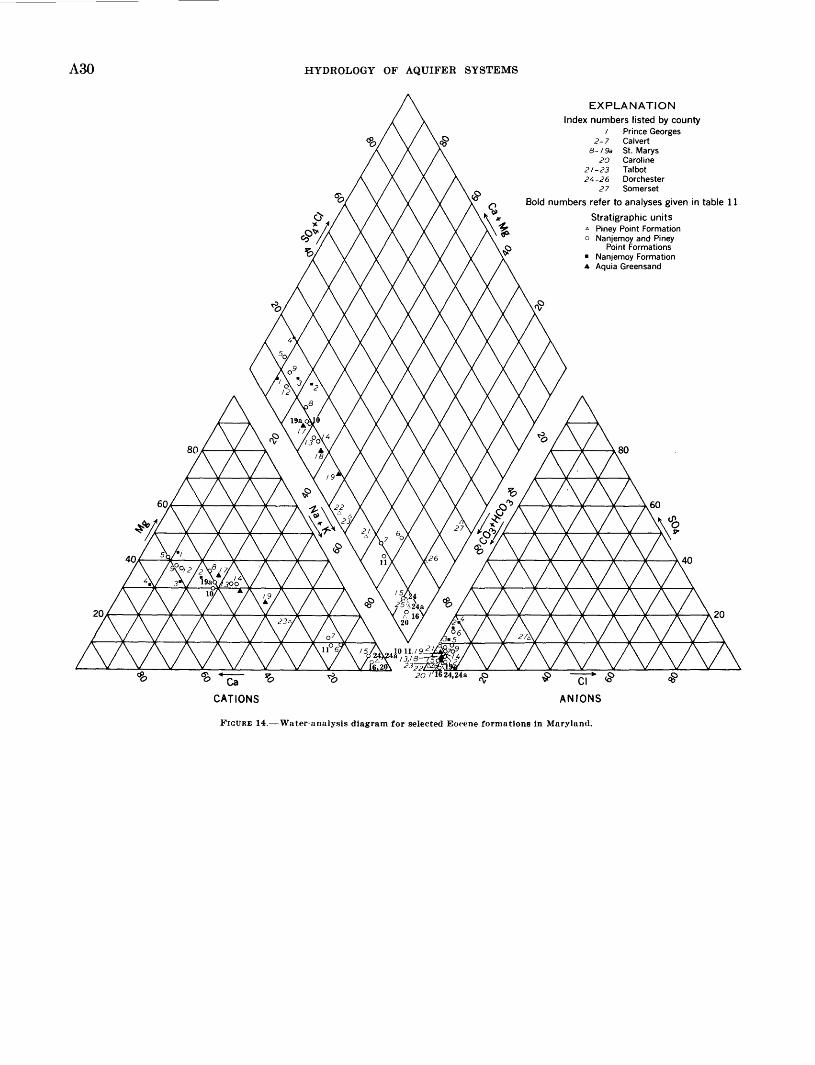
A30 HYDROLOGY OF AQUIFER SYSTEMS
CATIONS
EXPLANATION Index numbers listed by county
1 Prince Georges 2-7 Calvert
8- I 9a St. Marys 20 Caroline
21-23 Talbot 24-26 Dorchester
27 Somerset
Bold numbers refer to analyses given in table 11
Stratigraphic units "' Piney Point Formation o Nanjemoy and Piney
Point Formations • Nanjemoy Formation • Aquia Greensand
ANfONS
l<'IGURE 14.-Water-analysis diagram for selected Eo<"ene formations in Maryland.
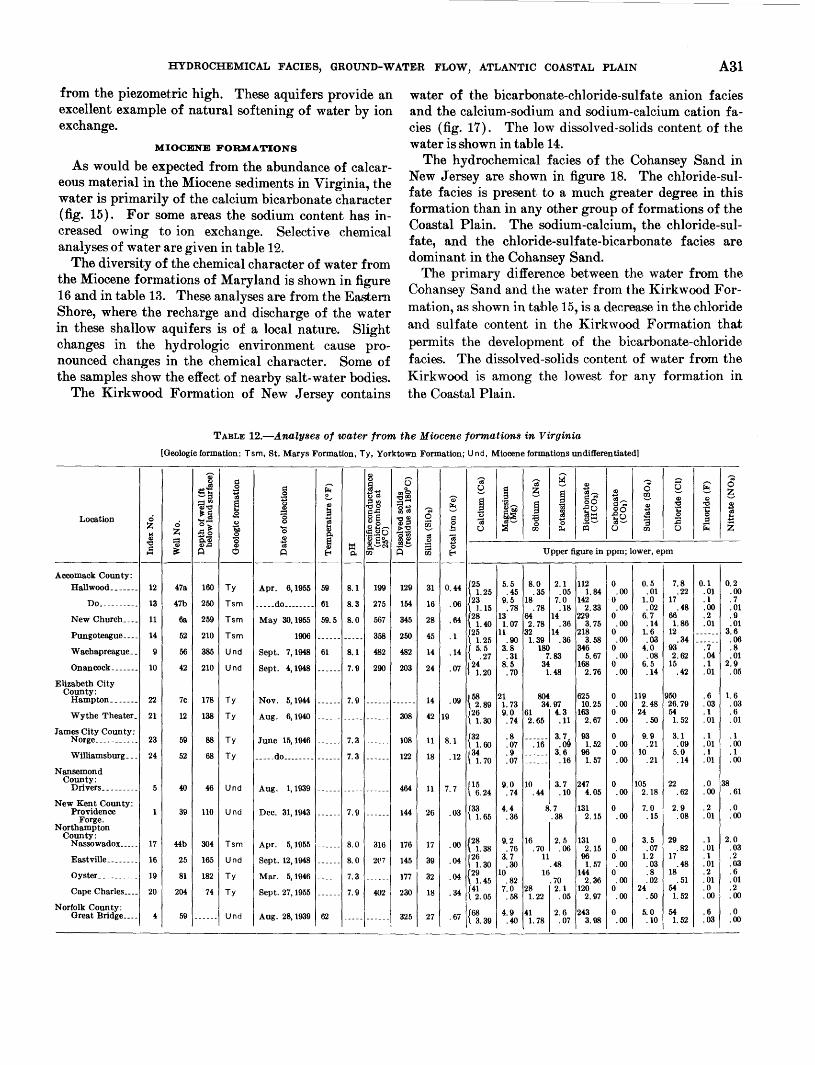
HYDROCHEMICAL FACIES, GROUND-WATE.ft FLOW, ATLANTIC COASTAL PLAIN A31
from the piezometric high. These aquifers provide an water of the bicarbonate-chloride-sulfate anion facies excellent example of natural softening of water by ion and the calcium-sodium and sodium-calcium cation fa-exchange. cies (fig. 17). The low dissolved-solids content of the
MIOCENE FORMATIONS water is shown in table 14. As would be expected from the abundance of calcar- The hydrochemical facies of the Cohansey Sand in
eous material in the Miocene sediments in Virginia the New Jersey are shown in figure 18. The chloride-suiwater is primarily of the calcium bicarbonate char~cter fate facies is present to a much greater degree in this (fig. 15). For some areas the sodium content has in- formation than in any other group of formations of the creased owing to ion exchange. Selective chemical Coastal Plain. The sodium-calcium, the chloride-suianalyses of water are given in table 12. fate, and the chloride-sulfate-bicarbonate facies are
The diversity of the chemical character of water from dominant in the Cohansey Sand. the Miocene formations of Maryland is shown in figure The primary difference between the water from the 16 and in table 13. These analyses are from the Eastern Cohansey Sand and the water from the Kirkwood ForShore, where the recharge and discharge of the water mation, as shown in table 15, is a decrease in the chloride in these shallow aquifers is of a local nature. Slight and sulfate content in the Kirkwood Formation that changes in the hydrologic environment cause pro- permits the development of the bicarbonate-chloride nounced changes in the chemical character. Some of facies. The dissolved-solids content of water from the the samples show the effect of nearby salt-water bodies. Kirkwood is among the lowest for any formation in
The Kirkwood Formation of New Jersey contains the Coastal Plain.
TABLE 12.-A.naZyses of water from the Miocene formations in Virginia
{Geologic formation: Tsm, St. Marys Formation, Ty, Yorktown Formation; Und, Miocene formations undifferentiated]
G) 8 6 g 0 s:: '2 '2 0 .! ~ s:: t a .. 8 .£ 0 s g
~~ ~ ~"' "''b -~ e ~ ~~ .£ e -oao G) ~ ="' ~ :::lrtl .........
~ § oO ~~ <I) <I)
;-g <I) <I) '00 '0+> 5 ~bi) 1 .£ '0 '0 .£
.s = 3 s::..c:: "'"' 0 ..oo oo -~ ~
Location 0 '0.!! 0 8§ "g~ .:: a~ ;e .~t:! ~0 .! "' z 0 0 0 "' § 0 a; "'~ "0 :3 ~ .E! !::
~~ '61! '0 ~ ~ 0 "'~ z z o ......... 1>'0 .!:l 0 00 p., jl:l 0 00 0 ~
s 0 Po ~~~ 'O"ril = p,Q) '0 .£ "' a; '0 <I) <D..O <I) "'
a ~ ~~"' ]~ -~ "0 .:: a: A
<I)
~ ...... 0 A E-< Po 00 A E-< Upper figure in ppm; lower, epm
---- - ------
Accomack County: Hallwood _______ 12 47a 160 Ty Apr. 6,1955 59 8.1 199 129 31 0.44 {25 5.5 8.0 2.1 112 0 0. 5 7.8 0.1 0.2
1.25 .45 .35 .05 1. 84 .00 .01 .22 .01 .00 Do __________ 13 47b 250 Tsm _____ do ________ 61 8.3 275 154 16 .06 {23 9.5 18 7.0 142 0 1.0 17 . 1 .7
l.15 . 78 . 78 .18 2.33 .00 .02 .48 .00 .01 New Church ____ 11 6a 259 Tsm May 30,1955 59.5 8.0 567 345 28 .64 {28 13 64 14 229 0 6. 7 66 .2 .9
1.40 1. 07 2. 78 .36 3. 75 .00 .14 1.86 .01 .01 Pungoteague ____ 14 52 210 Tsm 1906 ------ 358 250 45 .1 e5 11 32 14 218 0 1.6 12 ------ 3.6
----- 1.25 .90 1. 39 .36 3.58 .00 .03 .34 .06 ------Wachapreague __ 9 56 385 Und Sept. 7,1948 61 8.1 482 482 14 .14 { 5. 5 3.8 180 346 0 4.0 93 . 7 .8
.27 .31 7.83 5.67 .00 .08 2.62 .04 .01 Onancock _______ 10 42 210 Und Sept. 4,1948 ------ 7.9 290 203 24 .07 {24 8. 5 34 168 0 6. 5 15 .1 2.9
1.20 . 70 1.48 2. 76 .00 .14 .42 .01 .05 Elizabeth City
County: Hampton _______ 22 7c 178 Ty Nov. 5,1944 ------ 7.9 ------ 14 .09 t~.89 21 804 625 0 119 950 .6 1.6
------ 1. 73 34.97 10.25 .00 2.48 26.79 .03 .03 Wythe Theater_ 21 12 138 Ty Aug. 6,1940 ------ ----- 308 42 19 e6 9.0 61 4.3 163 0 24 54 .1 .6
------ 1.30 . 74 2.65 .11 2.67 .00 .50 1. 52 . 01 . 01 James City County; Norge ___________ 23 59 88 Ty June 15, 1946 ------ 7.3 108 11 8.1 {32 .8 ------ 3. 7, 93 0 9.9 3.1 . 1 .1
------ 1.60 .07 .16 .09 1. 52 .00 .21 .09 .01 .00 Williamsburg ___ 24 52 68 Ty _____ do ________
------ 7.3 122 18 .12 {34 .9 ------ 3. 6 96 0 10 5.0 .1 .1 ------ 1. 70 .07 .16 1. 57 .00 . 21 .14 . 01 .00 ------
Na.nsemond County:
Drivers _________ 5 40 46 Und Aug. 1,1939 ------ ----- 464 11 7. 7 { 15 9.0 10 ,3. 7 247 0 105 22 .0 38 ------ 6.24 . 74 .44 .10 4.05 .00 2.18 .62 .00 . 61
New Kent County: Providence 1 39 110 Und Dec. 31, 1943 ------ 7.9 144 26 .03 e3 4.4 8. 7 131 0 7. 0 2. 9 .2 .0
Forge. ------ 1. 65 .36 .38 2.15 .00 .15 .08 .01 .00
Northampton County:
Nassawadox _____ 17 44b 304 Tsm Apr. 5,1955 ------ 8.0 316 176 17 .00 e8 9.2 16 12.5 131 0 3. 5 29 .1 2.0 1.38 . 76 . 70 .06 2.15 .00 .07 .82 .01 .03
Eastville ________ 16 25 165 Und Sept. 12,1948 ------ 8.0 2(17 145 39 .04 {26 3. 7 11 96 0 1.2 17 . 1 .2 1.30 .30 .48 1. 57 .00 .03 .48 .01 .03
Oyster __________ 19 81 182 Ty Mar. 5,1946 ------ 7.3 177 32 .04 {29 10 16 144 0 .8 18 .2 .6 ------ 1.45 .82 . 70 2.36 .00 .02 . 51 . 01 . 01
Cape Charles ____ 20 204 74 Ty Sept. 27, 1955 ------ 7.9 402 230 18 .34 e1 7.0 28 2.1 120 0 24 54 .0 .2 2.05 .58 1.22 .05 2. 97 .00 .50 1. 52 .00 .00
orfolk Conn ty:
------1 .67[{~.39 Great Bridge ____ 4 59 Und Aug. 28,1939 62 ----- 325 27 4.9 41 2.6 243 0 5.0 54 .6 .0 ------ .40 1. 78 .07 3.98 .00 .10 1. 52 .03 .00
N

A32 HYDROLOGY OF AQUIFER SYSTEMS
EXPLANATION Index numbers listed by county
I New Kent 2, 3 Richmond
4 Norfolk 5 Nansemond 6 York 7 Princess Anne
8-14 Accomack 15-20 Northampton 21, 22 *Elizabeth City 23, 24 James City 25-27 Mathews
Bold numbers refer to analyses given in table 12 Stratigraphic units
.o. Yorktown Formation • St. Marys Formation o Miocene formations,
undifferentiated ~ *Now a part of independent city of Hampton
ANIONS
FJGURI!l 15.-.Water-analysis diagram for the Miocene formations in VIrginia.
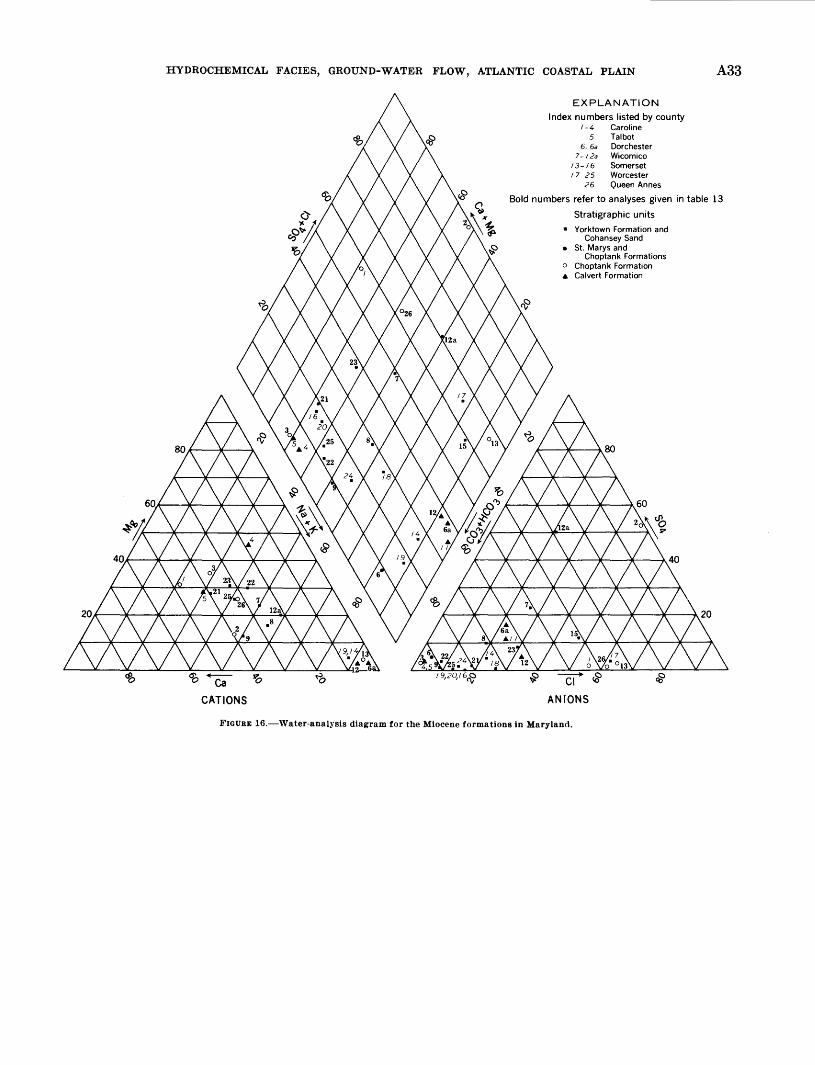
HYDROCHEMICAL FACIES, GROUND-WATE.R FLOW, ATLANTIC COASTAL PLAIN A33
CATIONS
EXPLANATION
Index numbers listed by county I -4 Caroline
5 Talbot 6, 6a Dorchester
7- 1 2a Wicomico 1 3- 1 6 Somerset 17-25 Worcester
.26 Queen Annes
Bold numbers refer to analyses given in table 13
Stratigraphic units
• Yorktown Formation and Cohansey Sand
• St. Marys and Choptank Formations
o Choptank Formation • Calvert Formation
ANJONS
FIGURE 16.-Water-analysis diagram for the Miocene formations in Maryland.
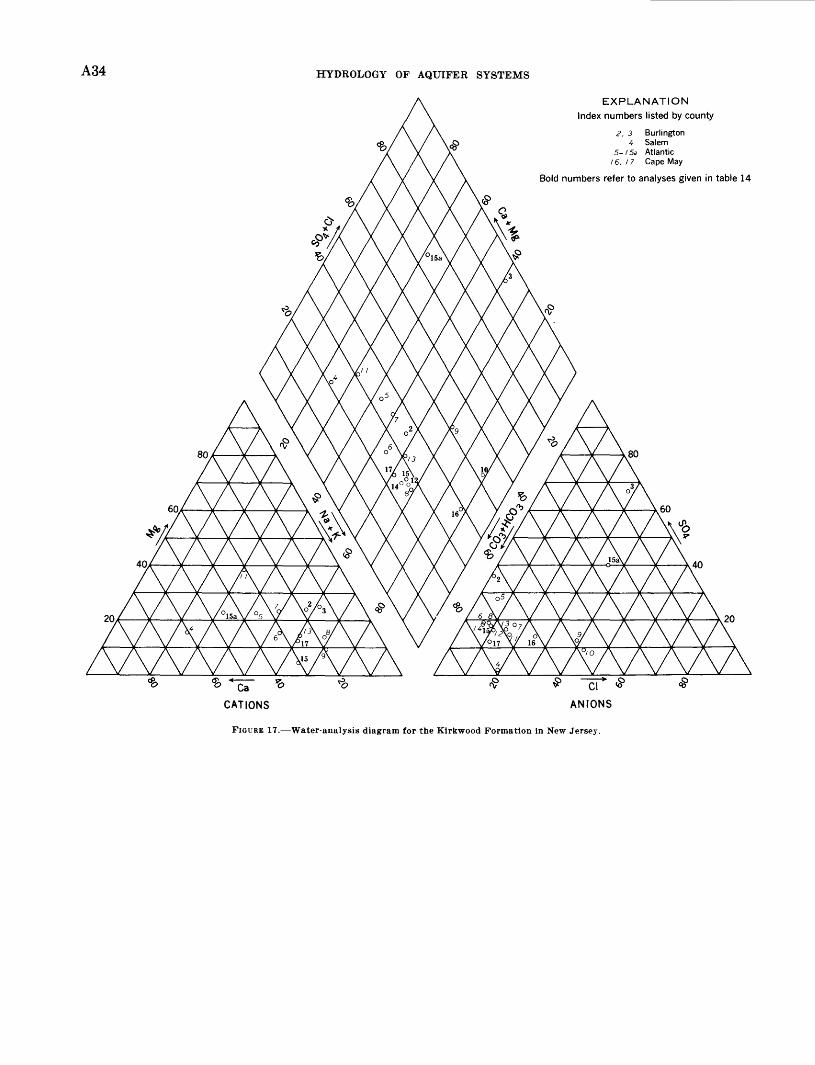
A34 HYDROLOGY OF AQUIFER SYSTEMS
CATIONS
EXPLANATION
Index numbers listed by county
2, 3 Burlington 4 Salem
5- 1 Sa Atlantic 16, 1 7 Cape May
Bold numbers refer to analyses given in table 14
ANJONS
FIGURE 17.-Water-analysis diagram for the Kirkwood Formation in New Jersey.

HYDROCHEMICAL FACIES, GROUND-WATE-R FLOW, ATLANTIC COASTAL PLAIN A35
TABLE 13.-A.naZyses of water from the Miocene formations in Maryland
[Geologic formation: Tck, Cboptank Formation; Tsm, St. Marys I:o'ormation; Tcv, Calvert Formation; Ty, Yorktown Formation; Tch, Cobansey Sand]
8 d 8 6 '2 I '2 g s g 0 d ~ 0 .E! ~ d t ~"a; fll~ s -~ b ~ b b~ ~ § os ....... ~ "' 'COO Q) t::-
~~ Cl) Cl) -"' s ::S<Il ......... e s ~bl s 1
oO :g 'C 'C ~ ~'I:! ~ ~ '1:!_8 -c .... ::s .oo oo ~ ·~ Location !il:d ds "'"' 0 "ES ~~ ::s t;!::J:l .oo .E! "' a '0 "CCI) d :a :c ::s b ci
0 -!! () () "a; 80 CI)::;S § 0 -; 0 0 ~'-" t;;___. :3 ~ z z 0!:1: "6Q 0 !. () ........... P.'C -~ 0 ~ 00 ~ jl:l 0 00 0 z -5.2 0 <i:lc>O 'OUJ "' ~
~ CS"§~ ~ Cl) :w ~CI) '0 s fllCI)
~ 'C <1),0 Cl) Cl) :Il ~'-"C'-1 .!1~ 0 Upper figure in ppm; lower, epm .s
== 0 0 0 ~ ~ 00 0 00 ~
- -----Caroline County:
344 244 1:2 0. 17 e8 17 19 9.4 224 0 5.2 0.6 0. 5 0.9 Choptank __________ 3 Car-Fb24 150 Tck Mar. 8,1955 57 8.0 1. 40 1.40 .83 .24 3. 67 .00 .11 .02 .03 .02 94.4 65 14 .03 { 5. 2 1.0 5. 2 2.6 .4 0 18 4.9 .3 11 Williston ___________ 2 Car-Ecl4 165 Tck ____ do ________ 58 4.6 .26 .08 .23 .07 . 01 .00 .38 .14 .02 .18
Dorchester County: 8.4 530 .05 {---~.-o4---- 111 300 14 13 7. 0 ---- .8 Linkwood __________ 6 Dor-cf8 189 Tsm-Tck Feb. 19, 1954 55 ------ ---- -------- ----- 4. 92 .47 . 27 . 20 . 01
2,030 1, 270 55 3. 0 { 9. 0 6. 2 438 14 804 8 163 170 1.0 .5 Vienna _____________ 6a Dor-Dh7 305 Tcv Dec. 9,1952 ---- 8.5 .45 . 51 19. O.'i .36 13.19 .27 3.39 4. 79 .05 .01 Queen Annes County:
87 76 18 .04 { 5. 7 2.8 7. 5 1. 4 20 ----- .6 8. 9 .1 18 Price ____ ----------- 26 Qa-Cf5 50 Tck Sept. 29, 1954 ---- 6.9 .28 .23 .33 .04 .33 . 01 . 25 . 01 .29 Somerset County:
7.6 5, 780 3, 550 58 .17 {31 31 1,260 45 1, 200 0 62 1,360 .7 .7 Crisfield_---------- 13 Som-Ec33 362 Tck Dec. 8,1952 ---- 1. 55 2.55 54.79 1. 15 19.67 .00 1. 29 38.36 .04 .01 Wicomico County:
302 186 218.3 {~.15 4. 7 35 4. 7 171 0 1. 0 9. 5 .0 .3 Fruitland __________ 9 Wic-De30 255 Ty-Tch Jan. 10, 1951 ---- 7.2 .39 1. 52 .12 2.80 .00 .02 . 27 .00 .01 8.0 1,160 734 54 .16 p2 4.6 245 12 444 0 24 135 1.0 1. 2 Mardela Spring ____ 12 Wic-Bd11 315 Tck Nov. 4,1952 ---- .60 .38 10.65 . 31 7. 28 .00 .50 3.81 .05 .02 6.3 90.3 88 39 .19 { 4. 2 2. 3 8.8 1.0 25 0 9. 0 7.4 . 1 .3
Salisbury---------- 7 Wic-Df25 86 Ty-Tch Sept. 15, 1950 ---- . 21 .19 .38 .03 .41 .00 .19 . 21 . 01 .01 5.3 51.3 52 23 3.6 { 1. 9 1.1 5.0 1.6 8 0 11 3. 2 . 1 .0 Do ____________ 12a Wic-Ce21 130 Ty.Tch Mar. 4,1948 ---- .10 .09 . 22 .04 .13 .00 .23 .09 . 01 .00 7.1 63.8 69 32 5.0 { 3.2 1. 2 7.3 1. 0 27 0 3. 0 3. 5 .3 .2 (!) ____________ ------ 8 Wic-Bhl4 122 Ty.Tch Aug. 15, 1950 ---- .Ie .10 .32 .03 .44 .00 .06 .10 .02 .00
Worcester County: 59 7.8 330 208 34 .09 p9 13 26 12 202 0 5. 2 10 . 0 .7 Girdletree .. ________ 22 Wor-Ed8 181 Ty-Tch Nov. 5,1952 .95 1. 07 1.13 .31 3.31 .00 .11 .28 .00 .01
434 260 24 2.9 r 16 27 12 226 0 2. 0 30 . 1 .1 Ocean City ________ 21 Wor-Bhl 285 Ty-Tch Dec. 12, 1951 ---- 7.2 1.85 1.32 1.17 .31 3. 70 .00 .04 .85 .01 .00 413 260 281.3 ~.45 14 36 10 229 . 0 20 .1 . 7 Do _____________ 25 Wor-Bh8 185 Ty-Tch Dec. 17, 1951 ---- 7.8 1.15 1. 57 .26 3. 75 .00 .00 . 56 .01 . 01
59 339 206 29 6. 0 {~.10 13 25 4.3 138 0 15 35 1.2 . 7 Pocomoke __________ 23 Wor-Fb9 104 Ty-Tch Nov. 4, 1952 7. 5 1. 07 1.09 .11 2.26 .00 . 31 .99 .06 .01 6.8 241 2.4 {- ---io4 ____ 31 123 0 1.2 12 ---- 1. 2
(1)--- -------------- 15 Wor-Ce2 210 Ty-Tch Aug. 31, 1953 ---- ------ ---- ________ , ___ -- 2.02 .00 .03 .34 ---- .02 I
t See Rasmussen and others (1957b, pl. 8).
TABLE 14.-AnaZyses of water from the Kirkwood Formation in New Jersey
8 8 Q) '2 § 0 d 6 e '2 ~ 0 s g .E!
~ r; ~"a;
0 s s b s ~.-;;- ~ b ~a fll0 d ~ !!.... "COO 0 s .E! ::s oO ~~
Cl) Cl)
-"' Cl) ::S<Il _ ....
!:: ~bQ -~ ~ ~ 'C 'C
~ '"a'C Cl) 'CO i<ai ::s .oo oo -~ ·~ Location !:l:d :g l3 d.d 0 ~ ~ Q~ .~e .oo .E! b ci "a; 8~ l~ 'C 0 t;;___. :3 :c ::s -!! §. 0 "''"" 0 ~ z z 0 OIS: - ! () ... ,..... ~ 0 ~ 00 ~ jl:l 0 00 0
H z .do 0 <i:lc>O ~i "' Cl) = o.-a $ ~ -as~ :S 'C
~ <1),0 "' til :g,___.c:-1 ~b
Upper figure in ppm; lower, epm d 0 1-4 0 0 ~ ~ 00 00
--- -------Atlantic County:
34 {0.16 8.2 0.8 18 ,2. 8 65 0 12 3.4 0.1 0.5 Atlantic City _____ 15 Al 810 Apr. 17, 11156 66 7.8 140 115 .01 . 41 .07 . 78 .08 1.07 0 .25 .1 .01 . 01
85 40 2.0 { 5.0 1.6 3.9 7.2 0 9.4 6.0 ------ -----Egg Harbor City_ 158 A2 443 Aug. 18, 1925 ------ ------ -------- .25 .13 .17 .12 0 .20 .17 ------ -----Burlington County:
49 .10 { .8 .II 2.9 2.2 1 0 10 3.1 .0 .1 Harrisville. _______ 3 B5 350 Aug. 14, 11151 56 4. 7 48.8 26 .04 .07 .13 .06 .02 0 .20 .09 .00 .00 .32 { 1.0 .8 2.5 2.0 2 0 7.0 3.6 .0 .2 New Gretna ______ 2 B7 232 _____ do ________ 56 4. 7 47.1 54 32 .05 .07 .11 .05 .03 0 .15 .10 .00 .00
Cape May County: 245 27 .11 {11 3.1 29 97 0 12 8.0 ------ . 8 Ocean City _______ 17 CM5 ------ May 27,1952 ------ 7.5 ------ .55 .26 1.26 1.59 0 .25 .23 ------ .01 337 .20 fig e28 0 23 30 ------ 1.0 Stone Harbor----- 16 CM6 966 Sept. 1, 1955 ------ 7.9 ------ ------ -------- ------ 2.10 0 .48 .85 ------ .02
I

A36 HYDROLOGY OF AQUIFER SYSTEMS
CATIONS
EXPLANATION
Index numbers listed by county
/-4 5-26
27 28-32 33,34 35-43
44
Gloucester Atlantic Camden Cape May Salem Burlington Cumberland
Bold numbers refer to analyses given in table 15
ANIONS
FIGURE 18.-Water-analysis diagram for the Cobansey Sand in New Jersey.

HYDROCHEMICAL FACIES, GROUND-WATEH FLOW, ATLANTIC COASTAL PLAIN A37
TABLE 15.-Analyses ot water from the Oohansey Sand in New Jersey
8 Q)
6 0 = s 0 6 ~ ~~ 5!3 ..,o ~ -ooo _.., :g ::loo ..........
"W'tl Q) 't)O ~~ $ E Location !I=S:: s::.r: '0 0
0 -~ 0 "' 8~ 't)G:> G) ::::I z 0!1= '0 ~ o ........ l>'tl z :5.9 !E.SO ~ c:lo ......... ooo Q) :::::= c:l.Q) ~ 'tl a os~
!.'-'C\1 ooQ) -~~ Q) Q),C Q) :Il .s ~ ~ ~ E-- c:lo 00 ~
---- ------Atlantic County:
Atlantic City _____ 16 A4 200 Sept. 5,1933 ------ ------ -------- 43
Do ____________ 21 A5 225 Aug. 30,1955 63 4.6 53.5 ------
Pleasantville ______ 19 A6 100 Sept. 6,1933 ------ ------ -------- 54
Somers Point _____ 20 A3 ------ Sept. 3,1953 58 5.6 55.7 ------Burlington County:
Chatsworth _______ 38 B10 80 Lebanon State
May 2,1951 59 6.9 46.3 44
Forest __________ 37 B12 80 Aug. 8,1951 54 6. 7 16.2 13
New Gretna ______ 43 B8 31 Aug. 14,1951 56 5.0 79.1 26
New Lisbon ______ 35 Cape May County:
B11 40 Aug. 8,1951 68 5. 2 42.6 25
Cape May ________ 29 CM2 330 Aug. 31, 1955 67 7. 2 277 ------
North Wildwood_ 32 CM3 310 Oct. 16,1952 59 7.4 718 412
Nummytown _____ 32a CM1 ------ Sept. 1,1954 59.5 7. 2 182 ------Cumberland County:
Seabrook _________ 44 Cul 30 May 9,1950 ------ 7. 1 64 39 Gloucester County:
Clayton __________ 1 G4 100 Apr. 23,1951 56 5. 2 174 121
Newfield __________ 4 G7 147 _____ do ________ 55 6.4 33.6 25
Williamstown _____ 2 G5 95 _____ do ________ ------ 4.9 141 98
Do ____________ 3 G6 130 _____ do ________ 55 4. 8 89.2 66 Salem County:
Elmer ____________ 33 S2 63 Mar. 15,1951 ------ 4. 7 140 105 Parvin State
Park ____________ 34 S3 105 Apr. 27,1956 51 6.0
SPATIAL DISTRIBUTION AND ORIGIN OF HYDROCHEMICAL FACIES
CONCENTRATION OF DISSOLVED SOLIDS
40.3
'I'he primary controls on the dissolved -solids content of ground water are the chemical character of the water as it enters the zone of saturation; the distribution, solubility, and adsorption capac;ity of the minerals in the deposits; the porosity and permeability of rocks; and the flow path of the water.
On the basis of the assumptions that chemical equilibriuin has not been attained between the water and the minerals and that an excess of soluble material is available, the dissolved-solids content of the water increases and the chemical system tends to move closer to equilibrium as the flow path lengthens. A constant volume of water and a decrease in grain size of soluble material will result in a higher dissolved-solids content along a particular flow path. An increase in concentration due to smaller grain size results from two different effects: ( 1) the smaller grains of any soluble material will go into solution more readily than coarse grai 'lS of the same material, and ( 2) the smaller grain size causes a decrease in permeability that requires a longer residence time to traverse the same flow distance. Therefore, in an area of fine-grained material containing
61
co g ~ 0 co ~ 0 ~ ~ ~ e s ~ e .,,.....
~ ~ ::I S::"' ~";:;
Q) Q)
·~ ~ oO
~ 'tl ~ e ~bi; 1 .co ~ -~ oo
~ 0 ~~ li!:;Il -Eo s s:: -.; 'tl ~'-' '3 :a ::I §. 0 "''-' 0 0 0:1'-' r; z !:: 0 ~ rn ~ IXl 0 00 0
-.; "' 0
~ ~ Upper figure in ppm; lower, epm E--
1.07 { 1. 2 1 o. 7 3.3 11.2 0 0 12 5. 0 ------ 0 16 .06 .06 .14 .03 0 0 .25 .14 ------ .00
1.3 { --- 6.0 1 0 10 5.5 ------ .1 ------ .12 .26 .02 0 . 21 .16 . 01
.02 { 2.0 ,2.9 9.0 ,1.0 2.0 0 5.4 13 ====== 15 6.2 .10 .24 .39 .03 .03 0 .11 .37 ------ .24
{ --- 6. 7 6 0 2.4 10 ------ 1.3 ------ .03 .16 .29 .10 0 .05 .28 ------ .02
{ 5.2 .0 5.0 .3 10 0 .0 3.2 1. 9 1.9 6.0 .17 .27 .00 .22 .08 .16 0 .00 .09 .10 .03
{ .2 . 7 1. 8 .3 7 0 .0 2.9 .0 .1 4.1 .32 . 01 .06 .08 . 01 .12 0 .0 .08 .00 .01
{ 1.3 1.9 2.4 . 7 3 0 4.5 8.2 .0 .3 4.3 .12 .07 .16 .10 .02 .04 0 .09 .23 .00 . 01
{ 1.9 1.1 2. 2 .6 2 0 8. 5 4.6 .0 .3 3. 7 .59 .10 .09 .10 .02 .03 0 .18 .13 .00 . 01
.94 ------ { 42 128 0 3.2 20 ------ 1.4 ------ 1.83 2.10 0 .07 .56 ------ 02
{ 24 17 81 112 146 0 23 139 .2 1.0 37 1.1 1. 20 1. 40 3. 52 . 31 2.39 0 . 48 3.92 • 01 02
------ { 11 84 0 7.0 12 ------ 1.0 ------ . 20 -------- .48 1. 38 0 .15 .34 ------ 02
{ 6.6 3.9 1. 5 .7 35 0 3.3 2. 5 .0 1.2 2.0 5. 2 .33 .32 .07 .02 .57 0 .07 .07 .00 00
{ 4.6 4.0 21 6. 2 7 0 12 18 . 01 50 7.9 .02 .23 .33 . 91 .17 .11 ---- . 25 . 51 .01 . 8
{ 1.2 .8 2. 7 .4 5 0 1.0 4.2 .0 5.0 5.5 . 01 .06 .07 .12 . 01 .08 0 .02 .12 .00 09
{ 3.6 5.1 9.8 2. 7 4 0 1.0 13 .1 41 7. 7 .03 .18 .42 .43 .07 .07 0 .02 .37 .01 66
{ 2.6 3.1 6.2 1. 5 1 0 . 8 5.4 .o 32 8.2 .03 .13 .26 .27 .04 .02 0 .02 .15 .oo .5
{ 5.6 5.4 8.1 3.6 1 0 5. 5 13 . 0 44 8.2 .08 .28 .44 .35 .09 .02 0 .12 .37 .00 .7 0
I{ 2.3 .4 7.4 5.2 11 0 19 3.0 .2 1.2 22 1. 5 .12 .03 . 24 .19 .18 0 .40 .09 .01 00
abundant soluble minerals, we would expect the water to have higher dissolved-solids content closer to the recharge area than it would have in an area of coarser sediments containing less soluble material.
In addition, the dissolved-solids content of water in any area increases when water from a different source, containing more dissolved ions, is introduced either by sea-water intrusion or by seepage of deeper brines.
The effects of these controls can be seen on plate 10, which shows the distribution of the dissolved-solids calculated from the determined constituents, in equi valents per million. ~or example, ground water in the near-surface formations and in the recharge areas has a low dissolved-solids content because of the shorter travel path of the water in the aquifers and the prior leaching of soluble material. In southern Maryland (section F -F') the dissolved -solids content of the water gradually increases as the water in the Cretaceous sediments moves southeastward from the area of recharge.
Between the recharge and discharge areas of New Jersey (fig. 2, 3) , the dissolved-solids content of the water generally is much lower than that in Maryland and Delaware. This probably reflects a smaller amount of soluble material and a shorter travel path. The lithologic fence diagram (pl. 1A) shows less finegrained material in New Jersey than in the area to the
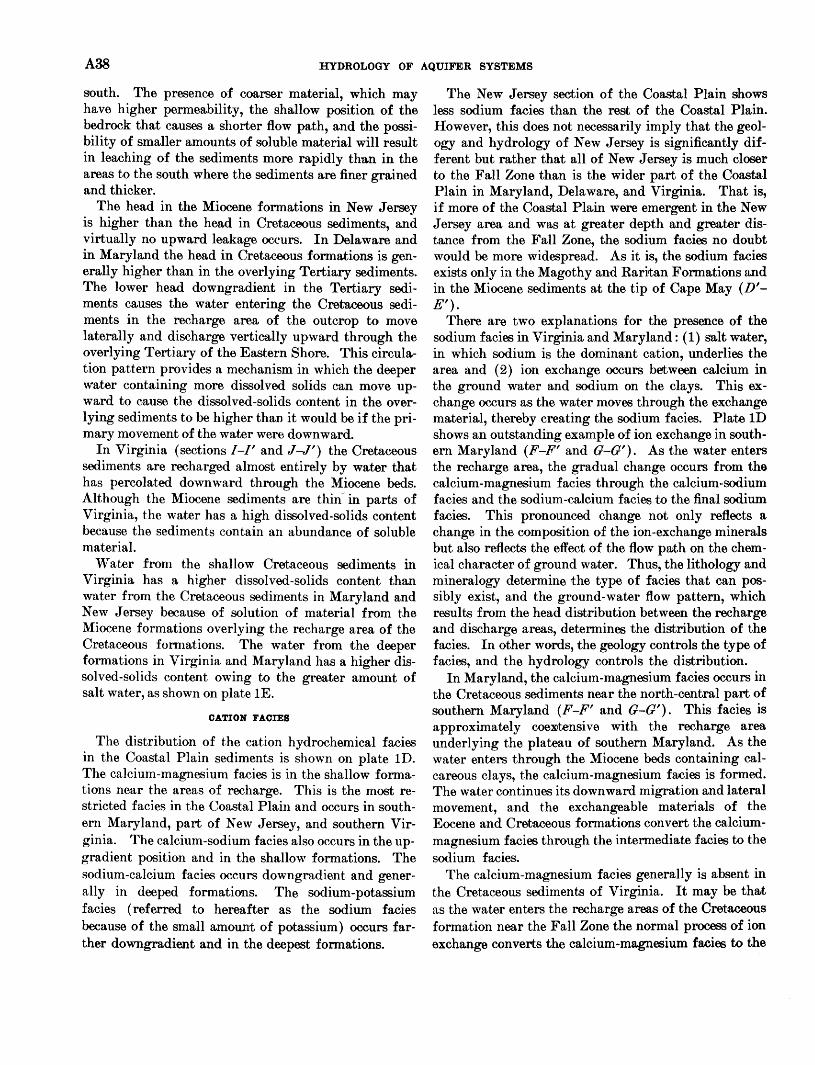
A38 HYDROLOGY OF AQUIFER SYSTEMS
south. The presence of coarser material, which may have higher permeability, the shallow position of the bedrock that causes a shorter flow path, and the possibility of smaller amounts of soluble material will result in leaching of the sediments more rapidly than in the areas to the south where the sediments are finer grained and thicker.
The head in the Miocene fonnations in New Jersey is higher than the head in Cretaceous sediments, and virtually no upward leakage occurs. In Delaware and in Maryland the head in Cretaceous formations is generally higher than in the overlying Tertiary sediments. The lower head downgradient in the Tertiary sediments causes the water entering the Cretaceous sediments in the recharge area of the outcrop to move laterally and discharge vertically upward through the overlying Tertiary of the Eastern Shore. This circulation pattern provides a mechanism in which the deeper water containing more dissolved solids can move upward to cause the dissolved-solids content in the overlying sediments to be higher than it would be if the primary movement of the water were downward.
In Virginia (sections/-/' and J-J') the Cretaceous sediments are recharged almost entirely by water that has percolated downwa.rd through the Miocene beds. Although the Miocene sediments are thin~ in parts of Virginia, the water has a high dissolved-solids content because the sediments contain an abundance of soluble material.
Water from the shallow Cretaceous sediments in Virginia has a higher dissolved-solids content than water from the Cretaceous sediments in Maryland and New Jersey because of solution of material from the Miocene formations overlying the recharge area of the Cretaceous formations. The water from the deeper formations in Virginia and Maryland has a higher dissolved-solids content owing to the greater amount of salt water, as shown on plate lE.
CATION FACIES
The distribution of the cation hydrochemical facies in the Coastal Plain sediments is shown on plate lD. The calcium-magnesium facies is in the shallow formations near the areas of recharge. This is the most restricted facies in the Coastal Plain and occurs in southern Mary land, part of New Jersey, and southern Virginia. The calcium-sodium facies also occurs in the upgradient position and in the shallow formations. The sodium-calcium facies occurs downgradient and generally in deeped formations. The sodium-potassium facies (referred to hereafter as the sodium facies because of the small amount of potassium) occurs farther downgradient and in the deepest formations.
The New Jersey section of the Coastal Plain shows less sodium facies than the rest of the Coastal Plain. However, this does not necessarily imply that the geology and hydrology of New Jersey is significantly different but rather that all of New Jersey is much closer to the Fall Zone than is the wider part of the Coastal Plain in Maryland, Delaware, and Virginia. That is, if more of the Coastal Plain were emergent in the New Jersey area and was at greater depth and greater distance from the Fall Zone, the sodium facies no doubt would be more widespread. As it is, the sodium facies exists only in the Magothy and Raritan Formations and in the Miocene sediments at the tip of Cape May (D'E').
There are two explanations for the presence of the sodium facies in Virginia and Maryland: (1) salt water, in which sodium is the dominant cation, underlies the area and ( 2) ion exchange occurs between calcium in the ground water and sodium on the clays. This exchange occurs as the water moves through the exchange material, thereby creating the sodium facies. Plate lD shows an outstanding example of ion exchange in southern Maryland (F-F' and G-G'). As t.he water enters the recharge area, the gradual change occurs from the calcium-magnesium facies through the calcium-sodium facies and the sodium-calcium facies to the final sodium facies. This pronounced change not only reflects a change in the composition of the ion-exchange minerals but also reflects the effect of the flow pB~th on the chemical character of ground water. Thus, the lithology and mineralogy determine the type of facies that can possibly exist, and the ground-water flow pattern, which results from the head distribution between the recharge and discharge areas, determines the distribution of the facies. In other words, the geology controls the type of facies, and the hydrology controls the distribution.
In Maryland, the calcium-magnesium facies occurs in the Cretaceous sediments near the north-central part of southern Maryland (F -F' and G-G'). This facies is approximately coex1tensive with the recharge area underlying the plateau of southern Maryland. As the water enters through the Miocene beds containing calcareous clays, the calcium-magnesium facies is formed. The water continues its downward migration and lateral movement, and the exchangeable materials of the Eocene and Cretaceous formations convert the calciummagnesium facies through the intermediate facies to the socli urn facies.
The calcium-magnesium facies generally is absent in the Cretaceous sediments of Virginia. It may be th81t as the water enters the recharge areas of the Cretaceous formation near the Fall Zone the normal process of ion exchange converts the calcium-magnesium facies to the

HYDROCHEMICAL FACIES, GROUND-WATER FLOW, ATLANTIC COASTAL PLAIN A39
sodium facies in a shorter distance than in Maryland. Another possible explanation is that there are more sodium ions from sea water near the Fall Zone (/-/') in Virginia than near the Fall Zone in southern Maryland. Plate 1E shows more chloride in Virginia than in Maryland (G-G'), which would tend to support the last suggestion.
The calcium-sodium facies is present in the area between Washington and Baltimore (north part of section M-M'). It owes its existence there not to the ion-exchange process but to the lack of calcareous sediments, which, if present, would create the calcium-magnesium facies in the outcrop area of the Cretaceous formations.
ANION FACIES
The occurrence and distribution of the anion facies are determined by the relative concentration of bicarbonate, chloride, and sulfate ions. In most of the water to a depth of about 1,000 feet, the bicarbonate ion makes up more than 50 percent of the total anions, and accounts for the existence of the bicarbonate facies and the bicarbonate-chloride-sulfate facies. A few areas exist in which the chloride and the sulfate ions, as computed on a percentage basis, are the dominant anions. The distribution of the anion facies was studied by construction of fence diagrams showing the chloride- and bicarbonate-ion contents, in parts per million, and percentage of the bicarbonate plus carbonate ions. The concentration of the sulfate content was not plotted because of its low values and its rather uniform distribution.
Plate 1E is a fence diagram showing the concentration of chloride ions in ground water in the uppermost 1,000 feet of the Coastal Plain sediments. Much of the water contains less than 5 ppm chloride, and all the ground water except that associated with the deep salt water (pl. 1B) contains less than 25 ppm chloride. The salt water along the eastern part of the Coastal Plain is identified by the high chloride content. The chloride content shown for most of the Pleistocene sediments is not necessarily valid. Because the shallow sediments are contaminated by sewage effluent and by industrial wastes the distribution of chloride is erratic. Part of the chloride in the shallow sediments along the coast may be due to atmospheric precipitation of salts from the ocean.
In Maryland and Virginia (sections south of E-E') the chloride content ranges from 0 to 5 ppm in the shallow sediments close to the Fall Zone. The content ranges from 5 to 25 ppm at greater depth and clo~r to the coast. This is due to the effect of normal solution of the minerals and to removal of residual adsorped ions as the water enters the high topographic areas and
moves downgradient. The higher chloride content near the surface along the coast represents part of the body of salt water that extends from the deeper sediments to the present ocean.
The distribution of the bicarbonate ion in ground water of the Coastal Plain is shown on plate 1F. The values plotted are the results of bicarbonate determinations made in the laboratory. Water's bicarbonate content is controlled by its pH and temperature, the partial pressure of carbon dioxide, and the minerals it contacts. The values of pH and bicarbonate content of water obtained in laboratory measurements are known to be different from the values of these properties of the water in the aquifer, and laboratory determinations cannot be used in detailed studies. However analytical error probably does not detract from the validity of the regional relationships shown on plate 1, FandG.
In the shallow formations and in the areas of recharge, the bicarbonate content is low. As the water moves down through the calcareous sediments of the Miocene series and through some of the Eocene beds, the bicarbonate content increases. This relation is illustrated for southern Maryland in section F -F', where, near Silver Spring, the bicarbonate content is less than 100 ppm because the water enters the recharge area of the Cretaceous and Eocene sediments without passing through the Miocene beds. Farther downdip, the water enters the underlying formations through the Miocene beds, and the bicarbonate content has increased. Also, as i1lustrated (pl. lF, section G-G'), the bicarbonate content has increased to more than 100 ppm in the discharge area, where the Miocene beds crop out.
In Virginia (section /-/' and others to the south) where the Cretaceous formations are recharged almost entirely by water that has passed through the Miocene beds, the bicarbonate content is relatively high, more than 200 ppm. The bicarbonate content of water in all formations in New Jersey, except the Magothy and the Raritan, is the lowest for most of the rest of the Coastal Plain. The Miocene formations in New Jersey contain less calcareous material than the Miocene formations in Virginia and Delaware. The primary souree of calcareous material in Miocene sediments in New Jersey is from the beds at the base of the Kirkwood Formation. The other source of calcareous material is in the Honerstown Sand of Cretaceous age.
The area in which water has the highest bicarbonate content is associated with the area in which salt water exists. This is not merely owing to mixing of the fresh water with the salt water, because sea water has a bicarbonate content of only 140 ppm. Foster ( 1950) studied the occurrence of bicarbonate-rich ground water
A40 HYDROLOGY OF AQUIFER SYSTEMS
in the Atlantic and Gulf Coastal Plains by a series of laboratory experiments in which water percolated through lignite, then calcite, and finally an ionexchange material. Analyses of the leachate closely resembled those of natural ground water; both had the sodium bicarbonate character. The water cannot attain equilibrium with the calcareous material because of the exchange of the calcium ion in solution with the sodium ion on the exchangeable material; the result is a continuous increase of bicarbonate.
Mapping of the hydrochemical facies during the present study suggests that this process may be more pronounced in the area containing salt water. The areas of high -bicarbonate water (pl. 1F) are virtually the same as the areas of high-chloride water (pl. 1E) and water containing a high percentage of sodium (pl. 1D) . The correlation of high bicarbonate and high sodium is due in part to the greater solubility of calcareous material in salt water than in fresh water. The greater solubility and removal of calcium ions permits the buildup of bicarbonate ions far in excess of the concentration observed for water from limestone areas. Most water from limestone areas would have bicarbonate concentration ranging from about 150 to 300 ppm. For this part of the Coastal Plain, many analyses show more than 500 ppm; the highest show 1,200 ppm. To determine if the water containing 1,200 ppm bicarbonate was saturated with respect to calcite, the analyses (Somerset County, Md., Ec-33) were used to calculate the departure from equilibrium, as described previously (Back, 1960). The amount of bicarbonate that would be required for the water to be in equilibrium with calcite is about 4,000 ppm, as compared with the analyzed value of 1,200 ppm. Therefore, even with this high bicarbonate content the water is still capable of dissolving more calcareous material.
SUMMARY AND CONCLUSIONS
This study demonstrates a method by which the geohydrologic significance of the chemical character of water may be emphasized. The chemistry of ground water is controlled entirely by the lithology of the deposits through which the water flows and by the orientation of the flow path within the geologic framework. The flow path is determined by the permeability of the sediments and the boundaries of the hydrologic system. To establish the boundaries of the hydrologic system of this part of the Coastal Plain, a study must be made of the geomorphic controls on the creation of fresh-water head, the thickness of the sediments overlying the less permeable crystalline rocks, and the position of the fresh-water-salt-water interface.
The deep salt water that had been identified in many parts of the Coastal Plain is shown to be one continuous water body. Its position is determined by the relative head distribution in the fresh water and in the salt water. The head distribution is influenced by the topographic position of the landmasses, the thickness and the permeability of the Coastal Plain sediments, and the geomorphic development of the Coastal Plain. The genesis of the salt water is known to be due to one or more of the following processes: Retention of ions from the marine water in which the sediments were deposited; entrance of salt water after deposition; concentration of ions through common solution processes; and selective concentration, with the clays acting as semipermeable membranes.
The three-dimensional aspect of hydrochemical facies can be illustrated effectively by fence diagrams. The calcium-magnesium facies are in the areas of higher head, and the sodium facies are in areas of lower head. The sodium facies result from an ion-exchange process with sodium-bearing exchange material and from the presence of salt water. Areal differences of chemical character of water can occur without a change in the type of aquifer material. The lithology and mineralogy determine the type of facies that can possibly exist, and the ground-water flow pattern determines the distribution of the facies.
The regional flow pattern constructed by use of available head data in the outcrop areas and along the saltwater interface was substantiated by mapping the hydrochemical data. The chemical and hydrologic data provide a convincing example of the outcrop area of an artesian aquifer functioning equally well as either a discharge or recharge area. Depending on the head, distribution of the water can move updip as readily as it can move downdip.
The existence of hydrochemical facies indicates a close relationship between the hydrologic processes and the aquifer material. More regional studies of the field relationships among ground-water movement, mineralogy of the geologic formations, and the chemical character of ground water are needed. Such studies could do the following: Test the techniques and feasibility of hydrochemical mapping, describe the field relationships as a basis for identification of the more significant chemical processes, identify areas suitable for the study of selected geochemical processes, emphasize the need for more thorough collection of valid data, and clarify the role that ground water plays in the geochemical cycle of the elements.
HYDROCHEMICAL FACIES, GROUND-WATE•R FLOW, ATLANTIC COASTAL PLAIN A41
SELECTED REFERENCES Adams, J. A. S., and Weaver, C. E., 1958, Thorium-to-uranium
ratios as indicators of sedimentary processes--example of concept of geochemical facies : Am. Assoc. Petroleum Geologists Bull., v. 42, no. 2, p. 387-430.
Anden;;on, J. L., and others, 1948, Cretaceous and Tertiary subsurface geology: Maryland Dept. Geology, Mines, and Water Resources Bull. No. 2, 456 p.
Back, William, 1960, Origin, of hydrochemical facies of ground water in the Atlantic C'oastal Plain, in Internat. Geol. Cong., Geochemical cycles: Internat. Geol. Cong., 21st Copenhagen 1960, Proc., pt. 1, p. 87-95.
---1961a, Calcium carbonate saturation in ground water, from routine analyses: U.S. Geol. Survey Water-Supply Paper 1535-D, p. D1-D14.
---1961b, Techniques for mapping of hydrochemical facies, in Short papers in the geologic and hydrologic sciences: U.S. Geol. Survey Prof. Paper 424-D, p. D380-D382.
Barksdale, H. C., Greenman, D. W., and others, 1958, Groundwater resources in the tri-state region adjacent to the lower Delaware River [Del.-N.J.-Pa.]: New Jersey Div. Water Policy and Supply Spec. Rept. 13, 190 p.
Bennett, R. R., and Meyer, R. R., 1952, Geology and groundwater resources of the Baltimore area : Maryland Dept. Geology, Mines, and Water Resources Bull. 4, 559 p.
Bredehoeft, J. D., Blyth, C. R., White, W. A., and Maxey, G. B., 1963, Possible mechanism for concentration of brines in subsurface formations : Am. Assoc. Petro leu~ Geologists Bull, v. 47, no. 2, p. 257-269.
Buchan, Stevenson, 1958, Variations in mineral content of S'Qme ground waters: Soc. for Water Treatment and Examination Proc., v. 7.
Casagrande, Arthur, 1937, Seepage through dams: New England Water Works Assoc., v. 51, no. 2. (Also in Contributions to soil mechanics 1925-1940: Boston Soc. Civil Engineers, 1940, p. 295-336. )
Cederstrom, D. J., 1943a, Chloride in ground water in the Coastal Plain of Virginia : Virginia Geol. Survey Bull. 58, 36p.
---1943b, Geology and ground water resources of the Coastal Plain in southeastern Virginia : Virginia Geol. Survey Bull. 63,384 p.
--- 1946, Genesis of ground water of the Coastal Plain in southeastern Virginia: Econ. Geology, v. 41, no. 3, p. 21S-245.
Chaves, K. E., 1960, Evidence on history of sea water from chemistry of deeper subsurface waters of ancient basins: Am. Assoc. Petroleum Geologists Bull., v. 44, no. 3, p. 357-370.
Chebotarev, I. I., 1955, Metamorphism of natural waters in the crust of weathering: Geochim. et Cosmochim. Acta, v. 8, pt. 1, p. 22-48 ; pt. 2, p. 137-170 ; pt. 3, p. 19S-212.
Clark, W. B., Mathews, E. B., and Berry, E. W., 1918, The surface and underground water resources of Maryland, including Delaware and the District of Columbia: Maryland Geol. Survey Spec. Pub., v. 10, pt. 2, p. 169--553.
Emmons, W. H., and Harl"ington, G. L., 1913, A comparison of waters of mines and of springs : Econ. Geology, v. 8, p. 653-669.
Foster, M. D., 1950, The origin of high sodium bicarbonate waters in the Atlantic and Gulf Coastal Plains: Geochim. et Cosmochim. Acta, v. 1, p. 33-48.
Garmonov, I. V., 1958, Fundamental principles of hydrochemical zoning of underground waters in the European part of the Soviet Union: Symposium of Ground Water Proc., 1955, Pub. 4, p. 293-302, Calcutta.
Gill, H. E., 1959, Geology and ground-water resources of the Oape May peninsula, lower Cape May County, New Jersey: New Jersey Div. Water Policy and Supply Rept. 1, 19 p.
Groot, J. J., 1955, Sedimentary petrology of the Cretaceous sediments of Northern Delaware in relation to paleographic problems: Delaware Geol. Survey Bull. 5, p. 157.
Harder, J. A., and others, 1953, Final report on sea water intrusion: OaUfornia Univ. Sani·tary Eng. Research Lab., 50 p.
Hill, R. A., 1940, Geochemical patterns in Coachella Valley, OaJiif. : Am. Geophys. Union Trans., v. 21, p. 46-49.
---1942, Salts in irrigation water. Am. Soc. Oivil Engineers Trans., no. 2165, Bull. 107, p. 147S-1518.
Johnson, M. E., and Richards, H. G., 1952, Stratigraphy of Coastal Plain in New Jersey: Am. Assoc. Petroleum Geologists Bull., v. 36, no. 11, p. 2150-2160.
Kamensky, G. N., 1958, Hydrochemica•l zoning in the distribution of underground water: Symposium of Ground Water Proc., 1955, Pub. 4, p. 281-292, Calcutta.
Kartsev, A. A., 'l'abasaranskii, A. A., Subbota, M. L., and Mog.ilevskii, G. A., 1954, Geochemical methods of prospecting and exploration for petroleum and natural gas: English translation ed. by 'Vitherspoon, P. A., and Romey, W. D., 1959, Oalifornia Ulliiv. Press, 349 p.
Keith, M. L., and Degens, E. T., 1959, Geochemical indicators of marine and fresh-water sediments, in Abelson, P. H., ed., Researches in geochemistry : New York, John Wiley &
Sons, p. 3S-61. Kohout, F. A., 1960, Cyclic :How of salt water in the Biscayne
aquifer of southeastern Florida: Jour. Geophys. Research, V; 65, no. 7, p. 2133-2141.
Krieger, R. A., Hatchett, J. L., and Poole, J. L., 1957, Preliminary survey of the saline-water resources of the United States: U.S. Geol. Survey Water-Supply Paper 1374, 172 p.
Meents, W. F., Bell, A. H., Rees, 0. W., and Tilbury, W. G., 1952, Illinois ooHield brines, their geologic occurrence and chemical composition : Illinois State Geol. Survey Petroleum Bull. 66, 38 p.
Moore, R. C., 1949, Meaning of facies: Geol. Soc. America Mem.
39,34 p. Morgan, C. 0., and Winner, M. D., Jr., 1962, Hydrochemical
facies in the "400-foot" and "600-foot" sands of the Baton Rouge area, Louisiana, in Short papers in geology hydrology, and topography: U.S. Geol. Survey Prof. Paper 450-B, p.
B120-B121. Otton, E. G., 1955, Ground-water resources of the Southern
Maryland coastal plain : Maryland Dept. Geol., Mines, and
Water Resources Bull. 15, 347 p. Owens, J. P., and Minard, J. P., 1960, The geology of the north
central part of the New Jersey coastal plain, in Am. Assoc. Petroleum Geologists and Soc. Econ. Paleontologists and Mineralogists Guidebook 1, 1960 ann. convention : 45 p.
Piper, A. M., 1944, A gmphlc procedure in the geochemical interpretation of water analyses: A::n. Geophys. Union Trans.,
v. 25, p. 914-923.
A42 HYDROLOGY OF AQUIFER SYSTEMS
Pustovalov, L. V., 1933, Geochemical facies and their meaning in general and economical geology, in Problems Geology U.S.S.R.: v.1, no.l, p. 57-80.
--- 1954, The genesis of sedimentary rocks: Internat. Geol. Cong., 19th, Algiers 1952, Comptes rendus, sec. 13, pt. 13, p. 171-192.
Rasmussen, W. C., Groot, .J. J., and others, 1957a, The water resources of northern Delaware: Delaware Geol, Survey Bull., v. 1, no. 6, 223 p.
Rasmussen, W. C., Slaughter, T. H., Hulme, A. E., and Murphy, J. J., 1957b, The water resources of Caroline, Dorchester, and Talbot Counties: Maryland Dept. Geology, Mines, and Water Resources Bull. 18, 465 p.
Renick, B. Coleman, 1929, Geology and ground-water resources of central and southern Rosebud County, Montana: U.S. Geol. Survey Water-Supply Paper 600, 140 p.
Revelle, Roger, 1941, Criteria for recognition of sea water in ground waters: Am. Geophys. Union Trans., v. 22, p. 593.
Richards, H. G., 1945, Subsurface stratigraphy of the Atlantic Coastal Plain between New Jersey and Georgia : Am. Assoc. Petroleum Geologists Bull., v. 29, no. 7, p. 885-955.
--- 1948, Studies on the subsurface geology and paleontology of the Atlantic Coastal Plain: Acad. Nat. Sci. Philadelphia Proc., v. 100, p. 39-76.
Sanford, Samuel, 1911, Saline artesian waters of the Atlantic Coastal Plain, in Fuller, M. L., and others, Undergroundwater papers, 1910: U.S. Geol. Survey Water-Supply Paper 258, p. 75-86.
Schoeller, Henri, 1955, Geochemie des eaux souterraines: Rev. de l'Institut Francais du Petrole et Annales des Combustibles Liquides, v. 10, no. 3, p. 181-213, v. 10, no. 4, p. 219-246.
--- 1956, Geochemie des eaux souterraines : Soc. des Eds. Extrait de Ia Rev. de l'Institut Francais du Petrole et Annales des CQmbustibles Liquides, nos. de mars, avril, juillet, aoO.t, p. 213.
Seaber, P. R., 1962. Cation hydrochemical facies of ground water in the Englishtown Formation, New Jersey, in Short papers in geology, hydrology, and topography: U.S. Geol~ Survey Prof. Paper 450-B, p. Bl24-B126.
Sitter, L. U. de, 1947, Diagenesis of oil-field brines: Am. Assoc. Petroleum Geologists Bull., v. 31, no. 11, p. 2030-2040.
Spangler, W. B., 1950, Subsurface geology of Atlantic Coastal Plain of North Carolina : Am. Assoc. Petroleum Geologists Bull., v. 34, no. 1, p. 100-132.
Spangler, W. B., and Peterson, J. J., 1950, Subsurface geology of Atlantic Coastal Plain in New Jersey, Delaware, Maryland, and Virginia : Am. Assoc. Petroleum Geologists Bull., v. 34, no. 1, 99 p.
Teodorovich, G. 1., 1949, Siderite geochemical facies of seas and saline waters in general as oil-producing: Doklady Akad. Nauk SSSR, v. 69, no. 2, p. 227-230 (see rev. by Chilingar, G. V.). (Also in Am. Assoc. Petroleum Geologists Bull., v. 39, no. 5, p. 762-770.)
Ward, L. K., 1946, The occurrence, composition testing and utilization of underground water in South Australia and the search for further supplies : South Australia Geol. Survey Bull. 23, 281 p., Adelaide.
*U.S. GOVERNMENT PRINTING OFFICE: 1988 0-227-224


Related Documents