Pergamon Soil Biol. Biochem. Vol. 28, No. 7, 923-932, 1996 pp. Copyright 0 1996 Elsevier Science Ltd PII: soo38-0717(%)ooo66-1 Printed in Great Britain. All rights reserved 0038-0717/96 $15.00 + 0.00 C AND N MINERALIZATION IN AN ACID FOREST SOIL ALONG A GAP-STAND GRADIENT J. BAUHUS* Forest Ecosystems Research Centre, University of Giittingen, Institute of Silviculture and Forest Ecology, Biisgenweg 1, 37077 Gijttingen, Germany (Accepted 26 January 1996) Summary-Using aerobic long-term incubations of 174 days, carbon and nitrogen mineralization, pools of potentially mineralizable C and N, microbial C and N, and leaching of organic CaCl,-extractable C and N were determined in forest floor material (OF and 0,) and mineral soil (O-S cm) collected along a gap-stand gradient. Sample locations were the centre of gaps, the northern part of gaps, the northern edge between gaps and stand, and a mature European beech stand. Conditions changed along the gradient in (a) soil moisture, which was highest in the gap centre, (b) soil temperature, which was elevated in the northern part of the gap and at the northern edge, and (c) active tree roots, which were absent from the gap centre and the northern part. Samples were collected 21 months after gaps (30 m dia) had been created. Because N mineralization in the field during the first year after gap creation was higher in the gap than in the stand but lower in the second year, it was hypothesized that mineralizable substrate had been partially depleted under gap conditions. No differences were found between the gap and the stand in forest floor mass, or forest floor and mineral soil C and N concentrations. In the forest floor, C and N mineralization, and consequently the potentially mineralizable C and N, as derived from first order mineralization kinetics, decreased in the order stand > northern edge > gap centre > gap north. Amounts mineralized were 1053, 861, 761 and 610 g N g-’ and 24.4, 22.6, 22.5 and 20.2 mg C g-’ respectively. In mineral soil, these values were highest in the gap centre. A substantial decrease in microbial biomass occurred in samples from tLe gap centre during incubation. Other samples showed no marked decrease in microbial biomass during incubation. In the forest floor a shorter turnover time of mineralizable N was observed for gap locations, whereas the turnover of mineralizable C was slower in the northern part of the gap and the northern edge. This suggests that potentially-mineralizable pools of C and N were affected differently by either rooting, moisture or temperature. Similar turnover times (4-1 I weeks) for potentially-mineralizable N in both forest floor and mineral soil suggested similar sources of mineralized N. Potentially-mineralizable C consisted of more recalcitrant fractions in mineral soil than in forest floor. Nitrogen immobilization in the form of CaCI,-extractable organic compounds was unimportant in this soil. Organic N (N,,,) in CaC12-leachates was 412% of mineral N. Kinetic parameters indicated that N mineralization in the second year after gaps had been created was lower in the gaps, because mineralizable C and N pools had decreased. Copyright 0 1996 Elsevier Science Ltd INTRODUCTION The quality of soil organic matter (SOM) and the way it is affected by management practices has been the focus of many studies (e.g. Burger and Pritchett, 1984; Bonde and Rosswall, 1987). Also the way SOM quality may change under different climatic con- ditions is of considerable interest for assessing the effects of climate change (Anderson, 1991). It is of particular interest to see how long increased decomposition rates under elevated temperatures can be maintained (Peterjohn et al., 1994). Conceptually, SOM has been divided into com- partments of different decomposability. Three func- tional fractions, labile (active), slow and recalcitrant (passive) have been widely used to describe decomposition dynamics (Paul and Juma, 1981; Parton et al., 1987a; Verberne et al., 1990). These fractions do not correspond to any part of the SOM *Present address: Australian National University, Depart- ment of Forestry, Canberra ACT 0200, Australia. that can be readily determined by means of extraction. An active SOM pool contains soil microbial biomass and other non-microbial labile C. This labile pool is of particular interest, because it is thought to respond most rapidly to physical and chemical changes in the soil environment and because its contribution to nutrient fluxes is proportionally much higher than that of slow and passive SOM pools. One way to estimate the active SOM fraction is the long-term incubation technique (Stanford and Smith, 1972) through which a measure of potentially- mineralizable C and N can be obtained. This aerobic incubation-leaching technique for determining the kinetics of C and N transformations has been used for forest soils by Burger and Pritchett (1984), Fyles and McGill (1987), Ellert and Bettany (1992) and Zak et al. (1993). Monitoring microbial biomass during the incubation can further help our understanding of mineralization processes (Robertson et al., 1988). I investigated the way in which pools of potentially-mineralizable C and N in forest floor and SBB B/?-D 923

Welcome message from author
This document is posted to help you gain knowledge. Please leave a comment to let me know what you think about it! Share it to your friends and learn new things together.
Transcript
Pergamon Soil Biol. Biochem. Vol. 28, No. 7, 923-932, 1996 pp.
Copyright 0 1996 Elsevier Science Ltd
PII: soo38-0717(%)ooo66-1 Printed in Great Britain. All rights reserved
0038-0717/96 $15.00 + 0.00
C AND N MINERALIZATION IN AN ACID FOREST SOIL ALONG A GAP-STAND GRADIENT
J. BAUHUS* Forest Ecosystems Research Centre, University of Giittingen, Institute of Silviculture and Forest
Ecology, Biisgenweg 1, 37077 Gijttingen, Germany
(Accepted 26 January 1996)
Summary-Using aerobic long-term incubations of 174 days, carbon and nitrogen mineralization, pools of potentially mineralizable C and N, microbial C and N, and leaching of organic CaCl,-extractable C and N were determined in forest floor material (OF and 0,) and mineral soil (O-S cm) collected along a gap-stand gradient. Sample locations were the centre of gaps, the northern part of gaps, the northern edge between gaps and stand, and a mature European beech stand. Conditions changed along the gradient in (a) soil moisture, which was highest in the gap centre, (b) soil temperature, which was elevated in the northern part of the gap and at the northern edge, and (c) active tree roots, which were absent from the gap centre and the northern part. Samples were collected 21 months after gaps (30 m dia) had been created. Because N mineralization in the field during the first year after gap creation was higher in the gap than in the stand but lower in the second year, it was hypothesized that mineralizable substrate had been partially depleted under gap conditions. No differences were found between the gap and the stand in forest floor mass, or forest floor and mineral soil C and N concentrations. In the forest floor, C and N mineralization, and consequently the potentially mineralizable C and N, as derived from first order mineralization kinetics, decreased in the order stand > northern edge > gap centre > gap north. Amounts mineralized were 1053, 861, 761 and 610 g N g-’ and 24.4, 22.6, 22.5 and 20.2 mg C g-’ respectively. In mineral soil, these values were highest in the gap centre. A substantial decrease in microbial biomass occurred in samples from tLe gap centre during incubation. Other samples showed no marked decrease in microbial biomass during incubation. In the forest floor a shorter turnover time of mineralizable N was observed for gap locations, whereas the turnover of mineralizable C was slower in the northern part of the gap and the northern edge. This suggests that potentially-mineralizable pools of C and N were affected differently by either rooting, moisture or temperature. Similar turnover times (4-1 I weeks) for potentially-mineralizable N in both forest floor and mineral soil suggested similar sources of mineralized N. Potentially-mineralizable C consisted of more recalcitrant fractions in mineral soil than in forest floor. Nitrogen immobilization in the form of CaCI,-extractable organic compounds was unimportant in this soil. Organic N (N,,,) in CaC12-leachates was 412% of mineral N. Kinetic parameters indicated that N mineralization in the second year after gaps had been created was lower in the gaps, because mineralizable C and N pools had decreased. Copyright 0 1996 Elsevier Science Ltd
INTRODUCTION
The quality of soil organic matter (SOM) and the way it is affected by management practices has been the focus of many studies (e.g. Burger and Pritchett, 1984; Bonde and Rosswall, 1987). Also the way SOM quality may change under different climatic con- ditions is of considerable interest for assessing the effects of climate change (Anderson, 1991). It is of particular interest to see how long increased decomposition rates under elevated temperatures can be maintained (Peterjohn et al., 1994).
Conceptually, SOM has been divided into com- partments of different decomposability. Three func- tional fractions, labile (active), slow and recalcitrant (passive) have been widely used to describe decomposition dynamics (Paul and Juma, 1981; Parton et al., 1987a; Verberne et al., 1990). These fractions do not correspond to any part of the SOM
*Present address: Australian National University, Depart- ment of Forestry, Canberra ACT 0200, Australia.
that can be readily determined by means of extraction. An active SOM pool contains soil microbial biomass and other non-microbial labile C. This labile pool is of particular interest, because it is thought to respond most rapidly to physical and chemical changes in the soil environment and because its contribution to nutrient fluxes is proportionally much higher than that of slow and passive SOM pools. One way to estimate the active SOM fraction is the long-term incubation technique (Stanford and Smith, 1972) through which a measure of potentially- mineralizable C and N can be obtained. This aerobic incubation-leaching technique for determining the kinetics of C and N transformations has been used for forest soils by Burger and Pritchett (1984), Fyles and McGill (1987), Ellert and Bettany (1992) and Zak et al. (1993). Monitoring microbial biomass during the incubation can further help our understanding of mineralization processes (Robertson et al., 1988).
I investigated the way in which pools of potentially-mineralizable C and N in forest floor and
SBB B/?-D 923
924 J. Bauhus
surface mineral soil changed along a gradient from the centre of canopy gaps into the adjacent beech forest stand. This gradient reflected both varying micro-climatic conditions and different amounts of rooting because there were no roots growing at the centre of the gaps (Bauhus, 1994). Thus different C inputs from roots can be expected. The study was based on the finding that in situ N mineralization during the growing season of the initial year after gaps had been created was significantly higher in gaps (7.7 g mm’) than in the mature forest (5.3 g m-‘). In the second year, however, N mineralization in gaps was substantially lower (5.3 g mm’) than in the surrounding forest (9.0 g m _ ‘) (Bauhus and Barthel, 1995). These differences could only be explained to a small extent by higher N?O losses from gaps (Brumme, 1995). Thus it was hypothesized that during the initial year after gap creation decompo- sition had accelerated and the pool of readily-miner- alizable SOM had decreased. Mineralization consequently declined in gaps the following year. If this were true, pools of mineralizable C and N in the second year would be smaller in gaps than in the adjacent forest.
MATERIALS AND METHODS
Field site
The soil and forest floor material were collected from a field site located in a mature beech forest in the Solling area, Lower Saxony, Germany. It is an intensively researched IBP-site described in more detail by Ellenberg et al. (1986) and Matzner (1989). The soil was a silty loam (20% sand, 60% silt, 20% clay) and the soil type was podzolic brown earth (O-5 cm: pH,cao2, = 2.88, C% = 5.7, N% = 0.3, CEC = 138 pmol IE g- ‘). The forest floor was a typical mor (0,~layer: 670 g m- ‘, PH,~.~,,, = 3.71, C-to-N = 24: OF-layer: 3690 g m -‘, pH,,,,,,, = 3.31, C-to-N = 22; O,-layer: 3390 g m-‘, pH,c,c,,, = 2.96, C-to-N = 22). The gap experiment is described by Bauhus and Bartsch (1995). Four gaps, 30 m dia, had been cut after leaf fall in October 1989. Two of the gaps received dolomite equivalent to 3 t ha-‘, whereas the other two remained untreated. All logs and branches were removed from gaps.
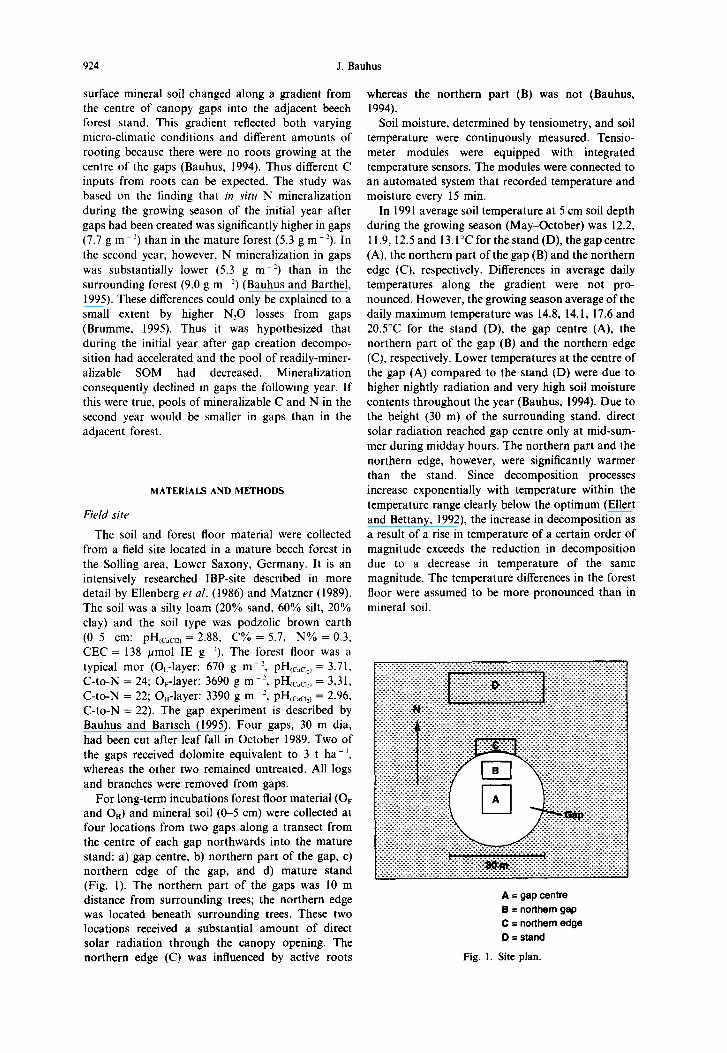
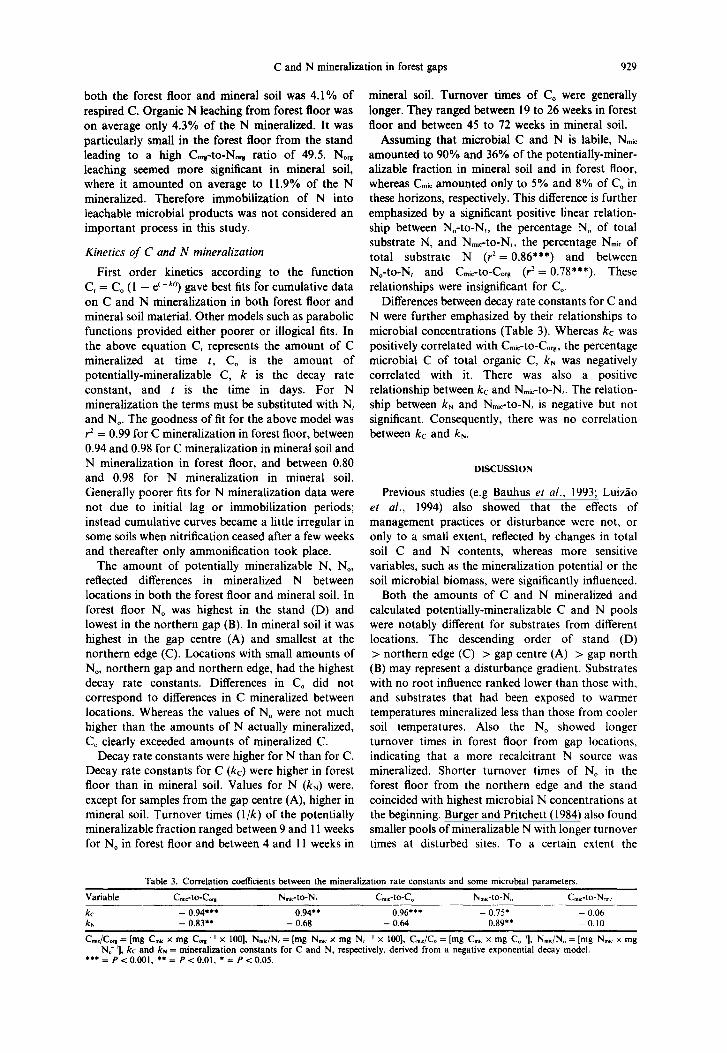
For long-term incubations forest floor material (Or and 0,) and mineral soil (&5 cm) were collected at four locations from two gaps along a transect from the centre of each gap northwards into the mature stand: a) gap centre, b) northern part of the gap, c) northern edge of the gap, and d) mature stand (Fig. 1). The northern part of the gaps was 10 m distance from surrounding trees; the northern edge was located beneath surrounding trees. These two locations received a substantial amount of direct solar radiation through the canopy opening. The northern edge (C) was influenced by active roots
whereas the northern part (B) was not (Bauhus, 1994).
Soil moisture, determined by tensiometry, and soil temperature were continuously measured. Tensio- meter modules were equipped with integrated temperature sensors. The modules were connected to an automated system that recorded temperature and moisture every 15 min.
In 1991 average soil temperature at 5 cm soil depth during the growing season (May-October) was 12.2, 11.9, 12.5 and 13.l”C for the stand (D), the gap centre (A), the northern part of the gap (B) and the northern edge (C), respectively. Differences in average daily temperatures along the gradient were not pro- nounced. However, the growing season average of the daily maximum temperature was 14.8, 14.1, 17.6 and 20.5”C for the stand (D), the gap centre (A), the northern part of the gap (B) and the northern edge (C), respectively. Lower temperatures at the centre of the gap (A) compared to the stand (D) were due to higher nightly radiation and very high soil moisture contents throughout the year (Bauhus, 1994). Due to the height (30 m) of the surrounding stand, direct solar radiation reached gap centre only at mid-sum- mer during midday hours. The northern part and the northern edge, however, were significantly warmer than the stand. Since decomposition processes increase exponentially with temperature within the temperature range clearly below the optimum (Ellert and Bettany, 1992), the increase in decomposition as a result of a rise in temperature of a certain order of magnitude exceeds the reduction in decomposition due to a decrease in temperature of the same magnitude. The temperature differences in the forest floor were assumed to be more pronounced than in mineral soil.
A = gap centre B = northern gap C = northern edge D = stand
Fig. I. Site plan.
C and N mineralization in forest gaps 925
100 T -.--.’ stand (D)
:- - gap centre (A) D I : ---- northern edge (C)
._..... northern gap (6)
155 176 196 217 234 252 269 207 304 322
days in 1991
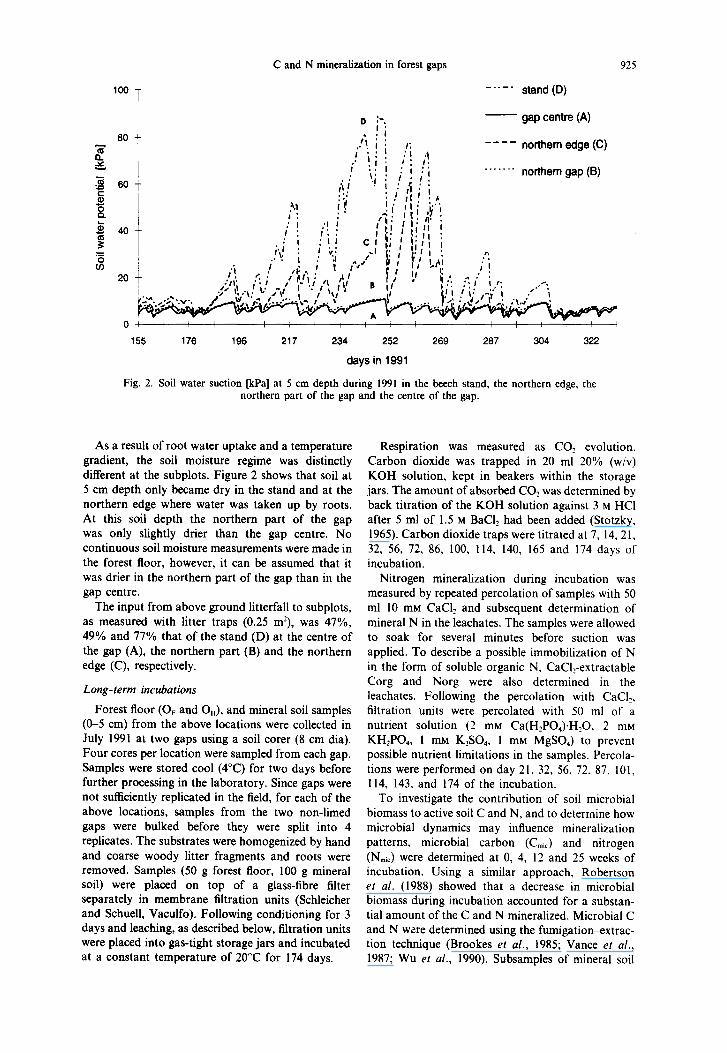
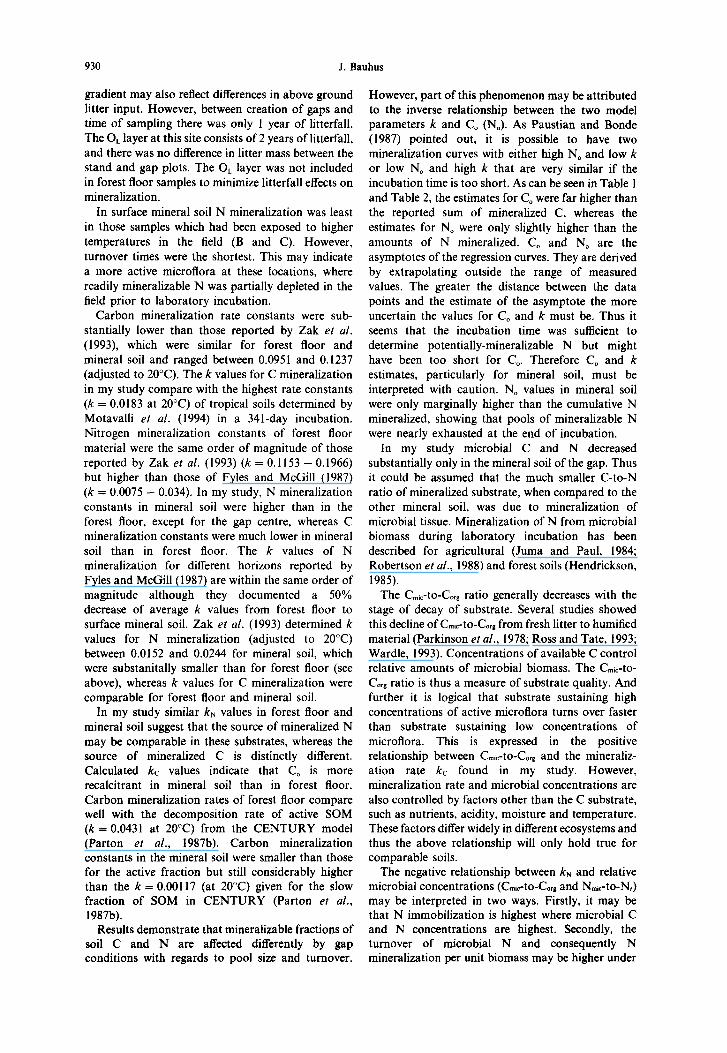
Fig. 2. Soil water suction [kPa] at 5 cm depth during 1991 in the beech stand, the northern edge, the northern part of the gap and the centre of the gap.
As a result of root water uptake and a temperature gradient, the soil moisture regime was distinctly different at the subplots. Figure 2 shows that soil at 5 cm depth only became dry in the stand and at the northern edge where water was taken up by roots. At this soil depth the northern part of the gap was only slightly drier than the gap centre. No continuous soil moisture measurements were made in the forest floor, however, it can be assumed that it was drier in the northern part of the gap than in the gap centre.
The input from above ground litterfall to subplots, as measured with litter traps (0.25 m’), was 47%, 49% and 77% that of the stand (D) at the centre of the gap (A), the northern part (B) and the northern edge (C), respectively.
Long-term incubations
Forest floor (0, and O,), and mineral soil samples (O-S cm) from the above locations were collected in July 1991 at two gaps using a soil corer (8 cm dia). Four cores per location were sampled from each gap. Samples were stored cool (4°C) for two days before further processing in the laboratory. Since gaps were not sufficiently replicated in the field, for each of the above locations, samples from the two non-limed gaps were bulked before they were split into 4 replicates. The substrates were homogenized by hand and coarse woody litter fragments and roots were removed. Samples (50 g forest floor, 100 g mineral soil) were placed on top of a glass-fibre filter separately in membrane filtration units (Schleicher and Schuell, Vaculfo). Following conditioning for 3 days and leaching, as described below, filtration units were placed into gas-tight storage jars and incubated at a constant temperature of 20°C for 174 days.
Respiration was measured as COZ evolution. Carbon dioxide was trapped in 20 ml 20% (w/v) KOH solution, kept in beakers within the storage jars. The amount of absorbed COz was determined by back titration of the KOH solution against 3 M HCI after 5 ml of 1.5 M BaCI, had been added (Stotzky, 1965). Carbon dioxide traps were titrated at 7, 14, 21, 32, 56, 72, 86, 100, 114, 140, 165 and 174 days of incubation.
Nitrogen mineralization during incubation was measured by repeated percolation of samples with 50 ml 10 mM CaCl, and subsequent determination of mineral N in the leachates. The samples were allowed to soak for several minutes before suction was applied. To describe a possible immobilization of N in the form of soluble organic N, CaCl,-extractable Corg and Norg were also determined in the leachates. Following the percolation with CaCL, filtration units were percolated with 50 ml of a nutrient solution (2 mM Ca(H,PO,).HIO, 2 mM KH2P04, 1 mM K$O,, 1 mM MgSO,) to prevent possible nutrient limitations in the samples. Percola- tions were performed on day 21, 32, 56, 72, 87. 101, 114, 143, and 174 of the incubation.
To investigate the contribution of soil microbial biomass to active soil C and N, and to determine how microbial dynamics may influence mineralization patterns, microbial carbon (C,,,) and nitrogen (N,i,) were determined at 0, 4, 12 and 25 weeks of incubation. Using a similar approach, Robertson et al. (1988) showed that a decrease in microbial biomass during incubation accounted for a substan- tial amount of the C and N mineralized. Microbial C and N were determined using the fumigation+xtrac- tion technique (Brookes et al., 1985; Vance et al., 1987; Wu et al., 1990). Subsamples of mineral soil
(10 g) and forest floor (5 g) were fumigated with ethanol-free chloroform for 24 h. Fumigated and control samples underwent extraction for 1 h with 50 ml 0.5 M K$O,. The extract was filtered (Whatman No.1) and kept frozen until analysis. For determi- nation of Corgr K,SO, extracts were diluted (1: 1) with a 5% sodium polyphosphate solution (pH 2) prior to freezing. A k-factor of 0.45 was employed for both microbial C and N.
Carbon and nitrogen concentrations and pH were determined for the OL, OF, and OH horizons, and mineral soil (&I, 1-2, 2-5, and 5-10 cm depth) from the gap, and from the stand. These samples consisted of 4 replicates from both the gap and the stand, bulked from 24 single samples.
Chemical analysis
Ammonium, nitrate and organic N concentrations in CaCl, and in K2S04 extracts were determined calorimetrically in a continuous flow system (Skalar). Organic N undergoes UV digestion in this system. Organic carbon in CaCl, leachates was measured with an automatic carbon analyzer (Beckmann). Organic C in KSO, extracts was measured by an automated persulfate oxidation procedure, using a Dohrmann DC 80 automatic organic C analyzer.
C and N concentrations of forest floor and mineral soil substrate were measured using an automated C/N analyzer (Perkin Elmer). Sample pH (l:I, sample : HzO) was determined using a glass electrode.
Calculations and statistics
To compare mineralization rate constants with those of other studies, it was necessary to adjust the temperatures at which these constants were derived. Assuming a Q10 value of 2 for both C and N mineralization (Stanford et al., 1973), the following formula was used to adjust mineralization rate constants to 20°C (Burger and Pritchett, 1984):
where kz is the desired mineralization rate constant for the temperature T2, and k, is the known mineralization rate constant determined at tempera- ture T,. The Q 10 or2 II baxd on W”‘l Ha*‘r ruk sayng that fix rate of bloiaglcal processes doubles with an increase in temperature of 10°C. This applies of course only to the temperature range below the optimum of the process. To derive comparable k-values from the two-component model of Motavalli et al. (1994), data were generated with the two-component model to which a single component first order model was fitted.
Differences between treatments were tested by ANOVA and Tukey’s pairwise comparison (P < 0.05) with the SYSTAT package (Systat Inc., 1992). Non-linear functions for the cumulative C and N mineralization data were calculated as regressions for all four replicates using the NLIN procedure in the SAS package (SAS Institute Inc., 1987).
RESULTS
Twenty-one months after gap creation no differ- ences were found in the mass, C and N content, and pH of forest floor horizons and mineral soil layers between the gap and the stand. Therefore these data are not presented. The fact that there was no difference between amounts of forest floor material, especially in the O,-layer, despite a decreased above- ground litter input in gaps may be attributed to horizontal movement of freshly fallen litter by wind and generally high variability of forest floor mass.
C and N mineralization
Results of the long-term laboratory incubation are presented in Table 1 and Fig. 3 for forest floor and in Table 2 and Fig. 4 for mineral soil. Carbon and nitrogen mineralization, microbial C and N concen- trations, and C,, and N,, leaching were higher in the forest floor than in mineral soil. Highest amounts of C and N were mineralized in forest floor of the
926 J. Bauhus
Table 1. Sums of mineralized C and N, ratios of mineralized C and N, sums of leached organic C and N, ratios of leached organic C and N, and potentially mineralizable C and N and their mineralization constants for forest floor material from different locations along the
gap-stand gradient
Variable Gap centre Northern gap Northern edge Stand
CC%C [mg g - ‘I 22.5 ‘(0.6) 20.2 d(O.8) 22.6 ‘(0.8) 24.4 “(1.1)
EN.,. [g g - ‘I 761 ‘(46) 610 ‘(20) 861 Yll) 1053 “(91) C.,.-to-N,,. 29.6 (2.1) 33.1 (2.1) 26.2 (1.0) 23.2 (2.1)
CC., [g g - ‘I 884 ‘(19) 778 Y50) 1023 “(60) 733 Y61) EN., Ig g - ‘1 41.0 b(4.7) 29.8 ‘(3.6) 47.9 “(9.7) 14.8 ‘(6.2) C.,,-to-No,* 21.5 b(2.9) 26.1 b(2.6) 21.4 b(3.3) 49.5 ‘(24.3) C0 [mg s’l 31.0 33.2 31.6 36.8
kc [wk - ‘1 0.0519 0.0379 0.0371 0.0437 Co [g s-‘I 859 676 919 1115 k,, [wk - ‘1 0.0882 0.0938 0.112 0.1127
C. and N. = potentially mineralizable C and N, respectively, as determined in long-term incubations. kc and kN = mineralization constants for C and N, respectively, derived from a negative exponential decay model. Significant differences
between gap locations are indicated by different letters; from Tukeys pairwise comparison (P < 0.05).
C and N mineralization in forest gaps 921
.__ 4500 1 b) Cmic in forest floor -e- gap centre (A)
--t- northern gap (B)
+ northern edge (C)
-o- stand P)
2000-
6 3; 101 1;4 days
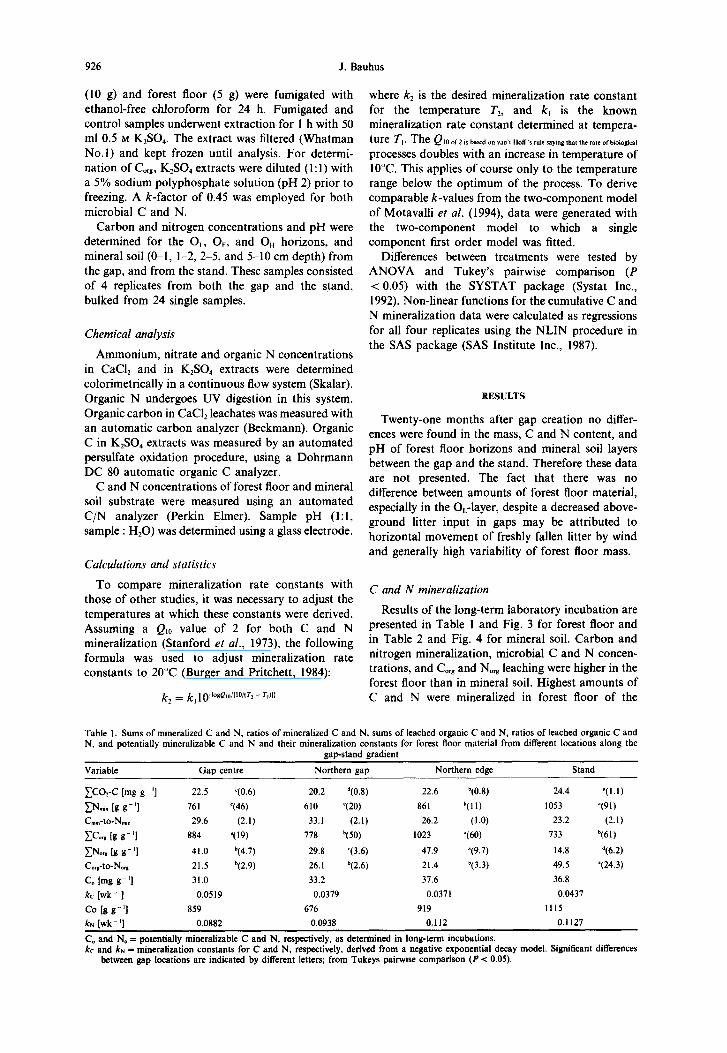
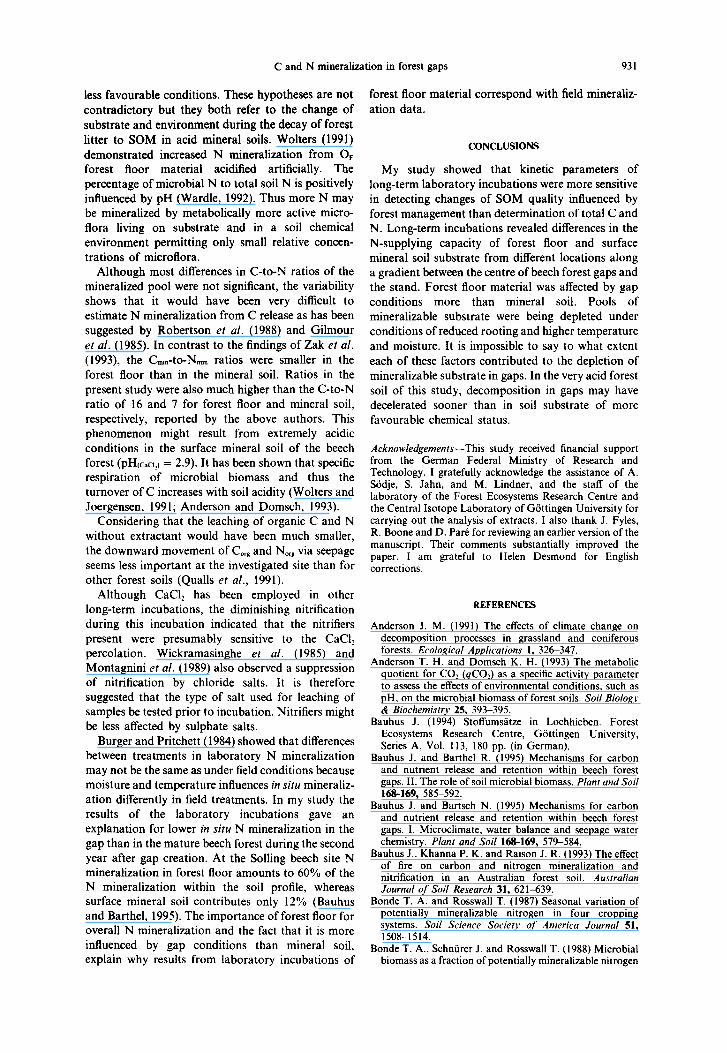
Fig. 3. Dynamics of N,,, (a) and C,, (b) during long-term incubation of forest floor substrate. Significant differences between locations are marked with different letters; from Tukeys pairwise
comparison (P < 0.05).
mature stand. In forest floor the sum of mineralized (C). Thus it took a different order than in the forest C and N declined in the order stand (D) > northern floor. edge (C) > gap centre (A) > northern gap (B). The ratio of mineralized C-to-N was higher in
Carbon mineralization in mineral soil was not mineral soil than in forest floor. There was no significantly different between locations. Amounts of difference in the ratio of mineralized C-to-N mineralized N were highest in the gap centre (A) and (C,,,-to-N,,.) between the locations for the forest least in the northern gap (B) and at the northern edge floor, whereas for the mineral soil this ratio was
Table 2. Sums of mineralized C and N, ratios of mineralized C and N. sums of leached organic C and N. ratios of leached organic C and N, and potentially mineralizable C and N and their mineralization constants for surface mineral soil material from different locations along
the gap-stand gradient
Variable Gap centre Northern gap Northern edge Stand
EC%C lmg g - ‘I 2.33 (0.08) 1.88 (0.17) 1.75
,YNmtn I8 8 _ ‘I 48.1 ‘(1.3) 19.2 “(1.0) 18.0
G.-to-N.,. 48.4 “(2.6) 91.9 b(6.9) 97.2
CC., L8 g- ‘1 95.0 (3.7) 86.9 (1.4) 80.7
ENon Lx 8 - ‘I 3.1 (0.18) 3.1 (0.04) 2.6
C&o-N.,, 21.5 (2.9) 26. I (2.6) 21.4
C. Im8 8- ‘I 6.19 4.45 6.01
kc [wk-'1 0.0190 0.022 I 0.0138
N. tg 8-‘I 53.7 19.3 18.2
(0.16) 2.32 (0.18)
“(1.6) 25.3 “h(91)
D(l5.5) 91.7 “(8.6)
(2.9) 102.1 (2.0) (0.09) 2.1 (0.13) (3.3) 49.5 (24.3)
5.44 0.0223 25.9
kN [wk - ‘1 0.0924 0.2604 0.2205 0.1631
C. and N. = potentially mineralizable C and N, respectively, as determined in long-term incubations. kc and kN = mineralization constants for C and N, respectively, derived from a negative exponential decay model. Significant differences between gap locations are indicated by different letters; from Tukeys pairwise comparison (P < 0.05).
928 J. Bauhus
70 a) Nmic in mineral soil
1 T 60-
600
-1
b) Cmic in mineral soil -o- gapcentre (A)
o’ 0 32 101 174
days
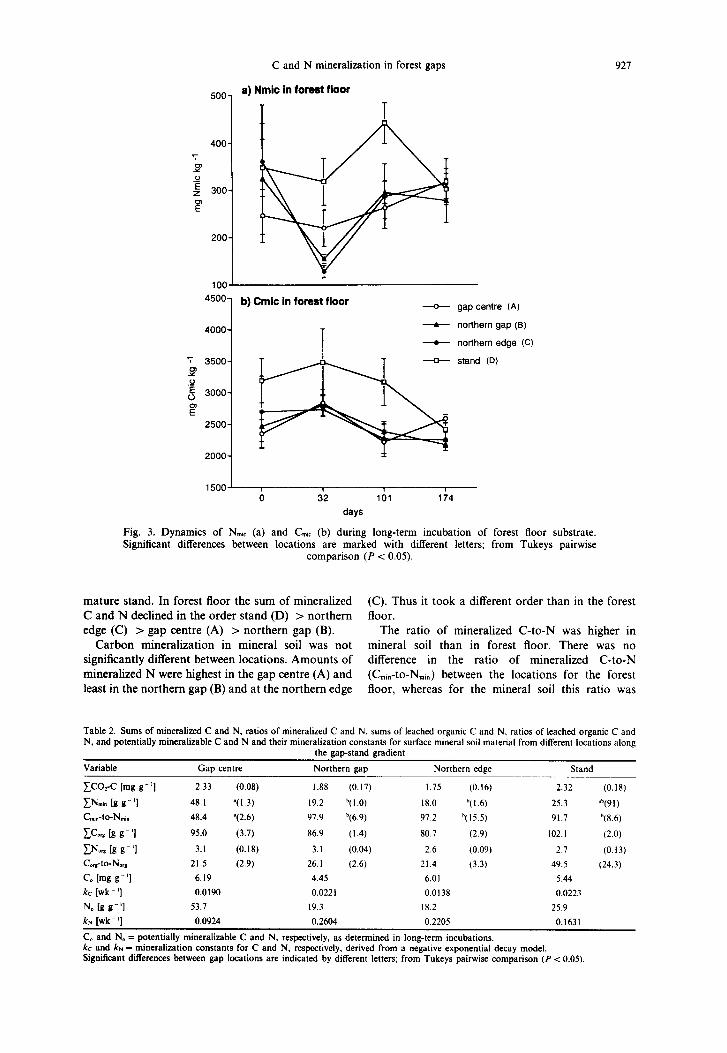
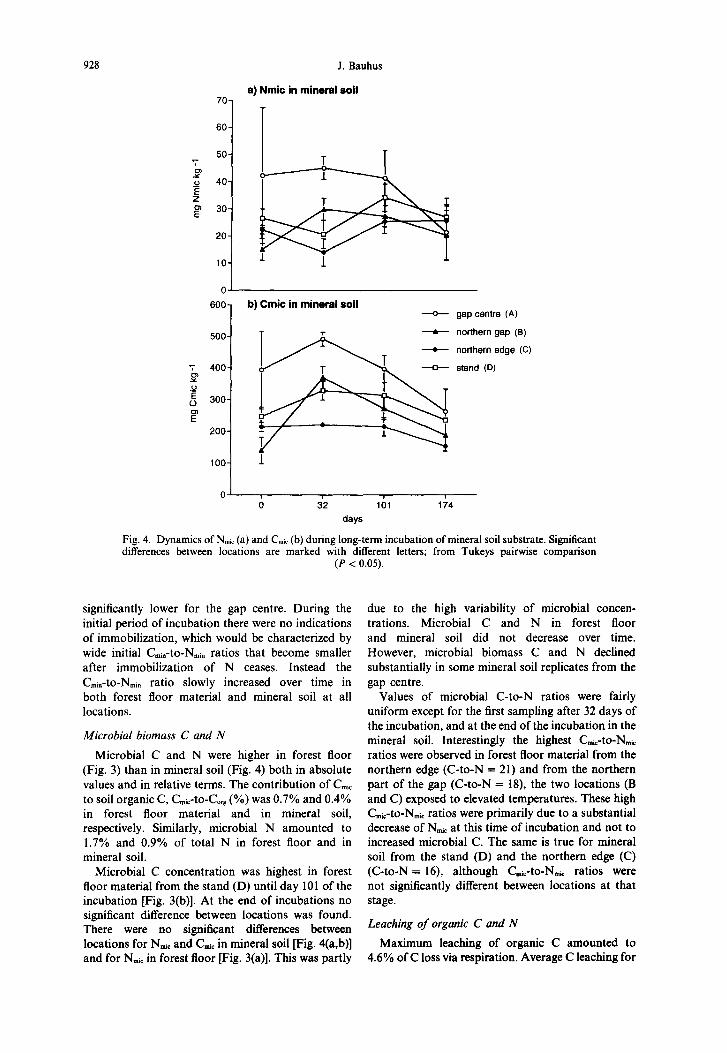
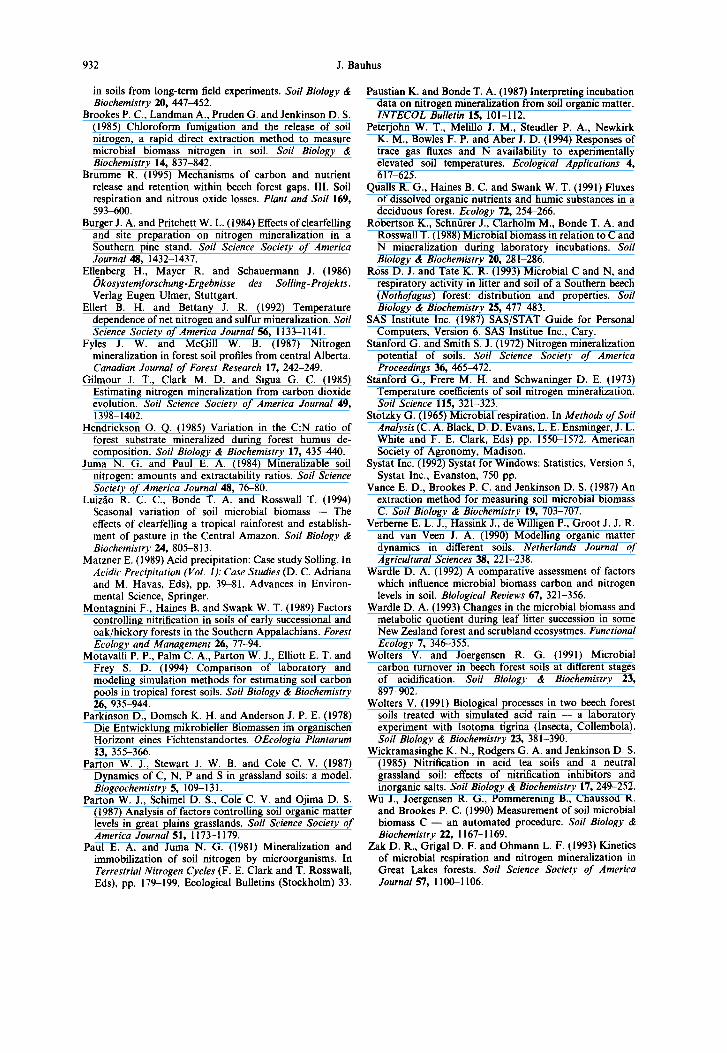
Fig. 4. Dynamics of N,,, (a) and C,, (b) during long-term incubation of mineral soil substrate. Significant differences between locations are marked with different letters; from Tukeys pairwise comparison
(P < 0.05).
significantly lower for the gap centre. During the initial period of incubation there were no indications of immobilization, which would be characterized by wide initial &“-to-N,,. ratios that become smaller after immobilization of N ceases. Instead the C,i”-tO-N,i, ratio slowly increased over time in both forest floor material and mineral soil at all locations.
Microbial biomass C and N
Microbial C and N were higher in forest floor (Fig. 3) than in mineral soil (Fig. 4) both in absolute values and in relative terms. The contribution of C,,c to soil organic C, Cmrc-to-& (%) was 0.7% and 0.4% in forest floor material and in mineral soil, respectively. Similarly, microbial N amounted to 1.7% and 0.9% of total N in forest floor and in mineral soil.
Microbial C concentration was highest in forest floor material from the stand (D) until day 101 of the incubation [Fig. 3(b)]. At the end of incubations no significant difference between locations was found. There were no significant differences between locations for Ntic and C,i, in mineral soil [Fig. 4(a,b)] and for N,t in forest floor [Fig. 3(a)]. This was partly
due to the high variability of microbial concen- trations. Microbial C and N in forest floor and mineral soil did not decrease over time. However, microbial biomass C and N declined substantially in some mineral soil replicates from the gap centre.
Values of microbial C-to-N ratios were fairly uniform except for the first sampling after 32 days of the incubation, and at the end of the incubation in the mineral soil. Interestingly the highest C,,-to-N,, ratios were observed in forest floor material from the northern edge (C-to-N = 21) and from the northern part of the gap (C-to-N = 18), the two locations (B and C) exposed to elevated temperatures. These high C,i,-to-N,k ratios were primarily due to a substantial decrease of N, at this time of incubation and not to increased microbial C. The same is true for mineral soil from the stand (D) and the northern edge (C) (C-to-N = 16), although &-to-N, ratios were not significantly different between locations at that stage.
Leaching of organic C and N
Maximum leaching of organic C amounted to 4.6% of C loss via respiration. Average C leaching for
C and N mineralization in forest gaps 929
both the forest floor and mineral soil was 4.1% of respired C. Organic N leaching from forest floor was on average only 4.3% of the N mineralized. It was particularly small in the forest floor from the stand leading to a high Corr-to-Nor* ratio of 49.5. Nor8 leaching seemed more significant in mineral soil, where it amounted on average to 11.9% of the N mineralized. Therefore immobilization of N into leachable microbial products was not considered an important process in this study.
Kinetics of C and N mineralization
First order kinetics according to the function C, = C, (1 - e’ - “I) gave best fits for cumulative data on C and N mineralization in both forest floor and mineral soil material. Other models such as parabolic functions provided either poorer or illogical fits. In the above equation C, represents the amount of C mineralized at time t, C, is the amount of potentially-mineralizable C, k is the decay rate constant, and t is the time in days. For N mineralization the terms must be substituted with N, and N,. The goodness of fit for the above model was r* = 0.99 for C mineralization in forest floor, between 0.94 and 0.98 for C mineralization in mineral soil and N mineralization in forest floor, and between 0.80 and 0.98 for N mineralization in mineral soil. Generally poorer fits for N mineralization data were not due to initial lag or immobilization periods; instead cumulative curves became a little irregular in some soils when nitrification ceased after a few weeks and thereafter only ammonification took place.
The amount of potentially mineralizable N, N,, reflected differences in mineralized N between locations in both the forest floor and mineral soil. In forest floor N, was highest in the stand (D) and lowest in the northern gap (B). In mineral soil it was highest in the gap centre (A) and smallest at the northern edge (C). Locations with small amounts of N,, northern gap and northern edge, had the highest decay rate constants. Differences in C, did not correspond to differences in C mineralized between locations. Whereas the values of N, were not much higher than the amounts of N actually mineralized, C, clearly exceeded amounts of mineralized C.
Decay rate constants were higher for N than for C. Decay rate constants for C (kc) were higher in forest floor than in mineral soil. Values for N (kN) were, except for samples from the gap centre (A), higher in mineral soil. Turnover times (l/k) of the potentially mineralizable fraction ranged between 9 and 11 weeks for N, in forest floor and between 4 and 11 weeks in
mineral soil. Turnover times of C, were generally longer. They ranged between 19 to 26 weeks in forest floor and between 45 to 72 weeks in mineral soil.
Assuming that microbial C and N is labile, N,i, amounted to 90% and 36% of the potentially-miner- alizable fraction in mineral soil and in forest floor, whereas Cmic amounted only to 5% and 8% of C, in these horizons, respectively. This difference is further emphasized by a significant positive linear relation- ship between N,-to-N,, the percentage N, of total substrate N, and N,,,-to-N,, the percentage N,,, of total substrate N (8 = 0.86***) and between N,-to-N, and Cme-to-& (r’ = 0.78***). These relationships were insignificant for C,.
Differences between decay rate constants for C and N were further emphasized by their relationships to microbial concentrations (Table 3). Whereas kc was positively correlated with Cmr-to-&, the percentage microbial C of total organic C, kN was negatively correlated with it. There was also a positive relationship between kc and N,,-to-N,. The relation- ship between kN and N,,,-to-N, is negative but not significant. Consequently, there was no correlation between kc and kN.
DISCUSSION
Previous studies (e.g Bauhus et al., 1993; Luizao et al., 1994) also showed that the effects of management practices or disturbance were not, or only to a small extent, reflected by changes in total soil C and N contents, whereas more sensitive variables, such as the mineralization potential or the soil microbial biomass, were significantly influenced.
Both the amounts of C and N mineralized and calculated potentially-mineralizable C and N pools were notably different for substrates from different locations. The descending order of stand (D) > northern edge (C) > gap centre (A) > gap north (B) may represent a disturbance gradient. Substrates with no root influence ranked lower than those with, and substrates that had been exposed to warmer temperatures mineralized less than those from cooler soil temperatures. Also the N, showed longer turnover times in forest floor from gap locations, indicating that a more recalcitrant N source was mineralized. Shorter turnover times of N, in the forest floor from the northern edge and the stand coincided with highest microbial N concentrations at the beginning. Burger and Pritchett (1984) also found smaller pools of mineralizable N with longer turnover times at disturbed sites. To a certain extent the
Table 3. Correlation coefficients between the mineralization rate constants and some microbial parameters.
Variable Cln,,-to-C”,. N,,,-to-N, C,,,-to-c.. N.,,,-to-N., C,,,-to-N,,,
kc - 0.94*** 0.94’. 0.9v** - 0.75’ - 0.06 kN - 0.83** - 0.68 - 0.64 0.89** - 0.10
C,,,/C4 = [mg C,, x mg C.,- ’ x loo], N,./N, = [mg N,,, x mg N; ’ x IOO]. C&2, = [me C,,, x mg C; ‘1. N&N, = [mg I%,, x mg No- ‘1, kc and kN = mineralization constants for C and N, respectively. derived from a negative exponential decay model.
*** = P < 0.001, ** = P < 0.01, ??= P < 0.05.
930 J. Bauhus
gradient may also reflect differences in above ground litter input. However, between creation of gaps and time of sampling there was only I year of litterfall. The Or layer at this site consists of 2 years of litterfall, and there was no difference in litter mass between the stand and gap plots. The OL layer was not included in forest floor samples to minimize litterfall effects on mineralization.
In surface mineral soil N mineralization was least in those samples which had been exposed to higher temperatures in the field (B and C). However, turnover times were the shortest. This may indicate a more active microflora at these locations, where readily mineralizable N was partially depleted in the field prior to laboratory incubation.
Carbon mineralization rate constants were sub- stantially lower than those reported by Zak er al. (1993), which were similar for forest floor and mineral soil and ranged between 0.0951 and 0.1237 (adjusted to 20°C). The k values for C mineralization in my study compare with the highest rate constants (k = 0.0183 at 20°C) of tropical soils determined by Motavalli et al. (1994) in a 341-day incubation. Nitrogen mineralization constants of forest floor material were the same order of magnitude of those reported by Zak et al. (1993) (k = 0.1153 - 0.1966) but higher than those of Fyles and McGill (1987) (k = 0.0075 - 0.034). In my study, N mineralization constants in mineral soil were higher than in the forest floor, except for the gap centre, whereas C mineralization constants were much lower in mineral soil than in forest floor. The k values of N mineralization for different horizons reported by Fyles and McGill (1987) are within the same order of magnitude although they documented a 50% decrease of average k values from forest floor to surface mineral soil. Zak et al. (1993) determined k values for N mineralization (adjusted to 20°C) between 0.0152 and 0.0244 for mineral soil, which were substanitally smaller than for forest floor (see above), whereas k values for C mineralization were comparable for forest floor and mineral soil.
In my study similar kN values in forest floor and mineral soil suggest that the source of mineralized N may be comparable in these substrates, whereas the source of mineralized C is distinctly different. Calculated kc values indicate that C, is more recalcitrant in mineral soil than in forest floor. Carbon mineralization rates of forest floor compare well with the decomposition rate of active SOM (k = 0.0431 at 20°C) from the CENTURY model (Parton et al., 1987b). Carbon mineralization constants in the mineral soil were smaller than those for the active fraction but still considerably higher than the k = 0.00117 (at 20°C) given for the slow fraction of SOM in CENTURY (Parton et al., 1987b).
Results demonstrate that mineralizable fractions of soil C and N are affected differently by gap conditions with regards to pool size and turnover.
However, part of this phenomenon may be attributed to the inverse relationship between the two model parameters k and C, (N,). As Paustian and Bonde (1987) pointed out, it is possible to have two mineralization curves with either high N, and low k or low N, and high k that are very similar if the incubation time is too short. As can be seen in Table 1 and Table 2, the estimates for C, were far higher than the reported sum of mineralized C, whereas the estimates for N, were only slightly higher than the amounts of N mineralized. C, and N, are the asymptotes of the regression curves. They are derived by extrapolating outside the range of measured values. The greater the distance between the data points and the estimate of the asymptote the more uncertain the values for C, and k must be. Thus it seems that the incubation time was sufficient to determine potentially-mineralizable N but might have been too short for C,. Therefore C, and k estimates, particularly for mineral soil, must be interpreted with caution. N, values in mineral soil were only marginally higher than the cumulative N mineralized, showing that pools of mineralizable N were nearly exhausted at the end of incubation.
In my study microbial C and N decreased substantially only in the mineral soil of the gap. Thus it could be assumed that the much smaller C-to-N ratio of mineralized substrate, when compared to the other mineral soil, was due to mineralization of microbial tissue. Mineralization of N from microbial biomass during laboratory incubation has been described for agricultural (Juma and Paul, 1984; Robertson et al., 1988) and forest soils (Hendrickson, 1985).
The Cmic-to-C&g ratio generally decreases with the stage of decay of substrate. Several studies showed this decline of Cmr-to-Corg from fresh litter to humified material (Parkinson et al., 1978; Ross and Tate, 1993; Wardle, 1993). Concentrations of available C control relative amounts of microbial biomass. The Cmic-to- Cor8 ratio is thus a measure of substrate quality. And further it is logical that substrate sustaining high concentrations of active microflora turns over faster than substrate sustaining low concentrations of microflora. This is expressed in the positive relationship between CL-to-& and the mineraliz- ation rate kc found in my study. However, mineralization rate and microbial concentrations are also controlled by factors other than the C substrate, such as nutrients, acidity, moisture and temperature. These factors differ widely in different ecosystems and thus the above relationship will only hold true for comparable soils.
The negative relationship between kN and relative microbial concentrations (Cmr-to-Corg and N+to-N,) may be interpreted in two ways. Firstly, it may be that N immobilization is highest where microbial C and N concentrations are highest. Secondly, the turnover of microbial N and consequently N mineralization per unit biomass may be higher under
C and N mineralization in forest gaps 931
less favourable conditions. These hypotheses are not contradictory but they both refer to the change of substrate and environment during the decay of forest litter to SOM in acid mineral soils. Wolters (1991) demonstrated increased N mineralization from 0, forest floor material acidified artificially. The percentage of microbial N to total soil N is positively influenced by pH (Wardle, 1992). Thus more N may be mineralized by metabolically more active micro- flora living on substrate and in a soil chemical environment permitting only small relative concen- trations of microflora.
Although most differences in C-to-N ratios of the mineralized pool were not significant, the variability shows that it would have been very difficult to estimate N mineralization from C release as has been suggested by Robertson et al. (1988) and Gilmour et al. (1985). In contrast to the findings of Zak et al. (1993), the &in-to-N,,. ratios were smaller in the forest floor than in the mineral soil. Ratios in the present study were also much higher than the C-to-N ratio of 16 and 7 for forest floor and mineral soil, respectively, reported by the above authors. This phenomenon might result from extremely acidic conditions in the surface mineral soil of the beech forest (pH,c,,~,, = 2.9). It has been shown that specific respiration of microbial biomass and thus the turnover of C increases with soil acidity (Wolters and Joergensen, 1991; Anderson and Domsch, 1993).
Considering that the leaching of organic C and N without extractant would have been much smaller, the downward movement of Corg and Nore via seepage seems less important at the investigated site than for other forest soils (Qualls et al., 1991).
Although CaCI, has been employed in other long-term incubations, the diminishing nitrification during this incubation indicated that the nitrifiers present were presumably sensitive to the CaCI, percolation. Wickramasinghe et al. (1985) and Montagnini et al. (1989) also observed a suppression of nitrification by chloride salts. It is therefore suggested that the type of salt used for leaching of samples be tested prior to incubation. Nitrifiers might be less affected by sulphate salts.
Burger and Pritchett (1984) showed that differences between treatments in laboratory N mineralization may not be the same as under field conditions because moisture and temperature influences in situ mineraliz- ation differently in field treatments. In my study the results of the laboratory incubations gave an explanation for lower in situ N mineralization in the gap than in the mature beech forest during the second year after gap creation. At the Solling beech site N mineralization in forest floor amounts to 60% of the N mineralization within the soil profile, whereas surface mineral soil contributes only 12% (Bauhus and Barthel, 1995). The importance of forest floor for overall N mineralization and the fact that it is more influenced by gap conditions than mineral soil, explain why results from laboratory incubations of
forest floor material correspond with field mineraliz- ation data.
CONCLUSIONS
My study showed that kinetic parameters of long-term laboratory incubations were more sensitive in detecting changes of SOM quality influenced by forest management than determination of total C and N. Long-term incubations revealed differences in the N-supplying capacity of forest floor and surface mineral soil substrate from different locations along a gradient between the centre of beech forest gaps and the stand. Forest floor material was affected by gap conditions more than mineral soil. Pools of mineralizable substrate were being depleted under conditions of reduced rooting and higher temperature and moisture. It is impossible to say to what extent each of these factors contributed to the depletion of mineralizable substrate in gaps. In the very acid forest soil of this study, decomposition in gaps may have decelerated sooner than in soil substrate of more favourable chemical status.
Acknowledgemenrs-This study received financial support from the German Federal Ministry of Research and Technology. I gratefully acknowledge the assistance of A. SBdje, S. Jahn, and M. Lindner, and the staff of the laboratory of the Forest Ecosystems Research Centre and the Central Isotope Laboratory of Gijttingen University for carrying out the analysis of extracts. I also thank J. Fyles, R. Boone and D. Part for reviewing an earlier version of the manuscript. Their comments substantially improved the paper. I am grateful to Helen Desmond for English corrections.
REFERENCES
Anderson J. M. (1991) The effects of climate change on decomposition processes in grassland and coniferous forests. Ecological Applications 1, 326341.
Anderson T. H. and Domsch K. H. (1993) The metabolic quotient for CO? (qCO?) as a specific activity parameter to assess the effects of environmental conditions, such as pH, on the microbial biomass of forest soils. Soil Biolog> & Biochemisrry 25, 393-395.
Bauhus J. (1994) StoffumsSitze in Lochhieben. Forest Ecosystems Research Centre, Giittingen University, Series A, Vol. 113, 180 pp. (in German).
Bauhus J. and Barthel R. (1995) Mechanisms for carbon and nutrient release and retention within beech forest gaps. II. The role of soil microbial biomass. Plant and Soil 168-169, 585-592.
Bauhus J. and Bartsch N. (1995) Mechanisms for carbon and nutrient release and retention within beech forest gaps. I. Microclimate, water balance and seepage water chemistry. Plant and Soil 168-169, 579-584.
Bauhus J., Khanna P. K. and Raison J. R. (1993) The effect of fire on carbon and nitrogen mineralization and nitrification in an Australian forest soil. Australian Journal of Soil Research 31, 621-639.
Bonde T. A. and Rosswall T. (1987) Seasonal variation of potentially mineralizable nitrogen in four cropping systems. Soil Science S0cief.v of America Journal 51, 1508-1514.
Bonde T. A., Schniirer J. and Rosswall T. (1988) Microbial biomass as a fraction of potentially mineralizable nitrogen
932 J. Ba
in soils from long-term field experiments. Soil Biology & Biochemistry 20, 441452.
Brookes P. C., Landman A., Pruden G. and Jenkinson D. S. (1985) Chloroform fumigation and the release of soil nitrogen, a rapid direct extraction method to measure microbial biomass nitrogen in soil. Soil Biology & Biochemisrry 14, 837-842.
Brumme R. (1995) Mechanisms of carbon and nutrient release and retention within beech forest gaps. III. Soil respiration and nitrous oxide losses. Plant and Soil 169, 593-600.
Burger J. A. and Pritchett W. L. (1984) Effects of clearfelling and site preparation on nitrogen mineralization in a Southern pine stand. Soil Science Society of America Journal 48, 1432-1437.
Ellenberg H., Mayer R. and Schauermann J. (1986) iikosystemforschung-Ergebnisse des Solling-Projekrs. Verlag Eugen Ulmer, Stuttgart.
Ellert B. H. and Bettany J. R. (1992) Temperature dependence of net nitrogen and sulfur mineralization. Soil Science Society of America Journal 56, I 133-l 141.
Fyles J. W. and McGill W. B. (1987) Nitrogen mineralization in forest soil profiles from central Alberta. Canadian Journal of Fores1 Research 17, 242-249.
Gilmour J. T., Clark M. D. and Sigua G. C. (1985) Estimating nitrogen mineralization from carbon dioxide evolution. Soil Science Society of America Journal 49, 1398-1402.
Hendrickson 0. Q. (1985) Variation in the C:N ratio of forest substrate mineralized during forest humus de- composition. Soil Biology & Biochemistry 17, 435-440.
Juma N. G. and Paul E. A. (1984) Mineralizable soil nitrogen: amounts and extractability ratios. Soil Science Society of America Journal 48, 7680.
Luizao R. C. C., Bonde T. A. and Rosswall T. (1994) Seasonal variation of soil microbial biomass - The effects of clearfelling a tropical rainforest and establish- ment of pasture in the Central Amazon. Soil Biology & Biochemistry 24, 805-8 13.
Matzner E. (1989) Acid precipitation: Case study Soiling. In Acidic Precipitation (Vol. I): Case Studies (D. C. Adriana and M. Havas, Eds), pp. 39-81. Advances in Environ- mental Science, Springer.
Montagnini F., Haines B. and Swank W. T. (1989) Factors controlling nitrification in soils of early successional and oak/hickory forests in the Southern Appalachians. Forest Ecologv and Management 26, 17-94.
Motavalh P. P.. Palm C. A.. Parton W. J.. Elliott E. T. and Frey S. D.’ (1994) Comparison of’ laboratory and modeling simulation methods for estimating soil carbon pools in tropical forest soils. Soil Biology & Biochemistry 26, 935-944.
Parkinson D., Domsch K. H. and Anderson J. P. E. (1978) Die Entwicklung mikrobieller Biomassen im organischen Horizont eines Fichtenstandortes. OEcologiu Planrarum 13, 355-366.
Parton W. J., Stewart J. W. B. and Cole C. V. (1987) Dvnamics of C. N. P and S in grassland soils: a model. Biogeochemisiry 5,’ 109-l 3 1. -
Parton W. J., Schimel D. S., Cole C. V. and Ojima D. S. (1987) Analysis of factors controlling soil organic matter levels in great plains grasslands. Soil Science Sociery of America Journal 51, 1173-l 179.
Wolters V. (1991) Biological processes in two beech forest soils treated with simulated acid rain - a laboratory experiment with Isotoma tigrina (Insecta, Collembola). Soil Biology & Biochemistry 23, 381-390.
Wickramasinghe K. N., Rodgers G. A. and Jenkinson D. S. (1985) Nitrification in acid tea soils and a neutral grassland soil: effects of nitrification inhibitors and inorganic salts. Soil Biology & Biochemistry 17, 249-252.
Wu J.. Joeraensen R. G.. Pommerenina B., Chaussod R. and ‘Brookes P. C. (1990) Measurement of soil microbial biomass C - an automated procedure. Soil Biology & Biochemistry 22, 1167-l 169.
Paul E. A. and Juma N. G. (1981) Mineralization and Zak D. R., Grigal D. F. and Ohmann L. F. (1993) Kinetics immobilization of soil nitrogen by microorganisms. In of microbial respiration and nitrogen mineralization in Terrestrial Nitrogen Cycles (F. E. Clark and T. Rosswall, Great Lakes forests. Soil Science Society of America Eds), pp. 179-199. Ecological Bulletins (Stockholm) 33. Journal 57, 1 IO&l 106.
Paustian K. and Bonde T. A. (1987) Interpreting incubation data on nitrogen mineralization from soil organic matter. INTECOL Bulletin 15, 101-l 12.
Peterjohn W. T., Melillo J. M., Steudler P. A., Newkirk K. M., Bowles F. P. and Aber J. D. (1994) Responses of trace gas fluxes and N availability to experimentally elevated soil temperatures. Ecological Applications 4, 617-625.
Quails R. G., Haines B. C. and Swank W. T. (1991) Fluxes of dissolved organic nutrients and humic substances in a deciduous forest. Ecology 72, 254266.
Robertson K., Schntirer J., Clarholm M., Bonde T. A. and Rosswall T. (1988) Microbial biomass in relation to C and N mineralization during laboratory incubations. Soil Biology & Biochemistry 20, 281-286.
Ross D. J. and Tate K. R. (1993) Microbial C and N, and respiratory activity in litter and soil of a Southern beech (Nothofagus) forest: distribution and properties. Soil Biology & Biochemistry 25, 477483.
SAS Institute Inc. (1987) SAS/STAT Guide for Personal Computers, Version 6. SAS Institue Inc., Cary.
Stanford G. and Smith S. J. (1972) Nitrogen mineralization potential of soils. Soil Science Society of America Proceedings 36, 465-472.
Stanford G., Frere M. H. and Schwaninger D. E. (1973) Temperature coefficients of soil nitrogen mineralization. Soil Science 115, 321-323.
Stotzky G. (1965) Microbial respiration. In Methods of Soil Analysis (C. A. Black, D. D. Evans, L. E. Ensminger, J. L. White and F. E. Clark, Eds) pp. 155&1572. American Society of Agronomy, Madison.
Systat Inc. (1992) Systat for Windows: Statistics. Version 5, _ Systat Inc., Evanston, 750 pp.
Vance E. D.. Brookes P. C. and Jenkinson D. S. (1987) An extraction method for measuring soil microbial biomass C. Soil Biology & Biochemistry i9, 703-707.
Verberne E. L. J.. Hassink J.. de Willieen P.. Groot J. J. R. and van Veen J. A. (1990) Mod&ing organic matter dynamics in different soils. Netherlands Journal of Agricultural Sciences 38, 221-238.
Wardle D. A. (1992) A comparative assessment of factors which influence microbial biomass carbon and nitrogen levels in soil. Biological Reviews 67, 321-356.
Wardle D. A. (1993) Changes in the microbial biomass and metabolic quotient during leaf litter succession in some New Zealand forest and scrubland ecosystmes. Functional Ecology 7, 346-355.
Wolters V. and Joergensen R. G. (1991) Microbial carbon turnover in beech forest soils at different stages of acidification. Soil Biology & Biochemistry 23, 897-902.
Related Documents