INTERCITY BUS SERVICE IN VIRGINIA by Gary R. Allen Research Scientist Eugene D. Arnold, Jr. Research Scientist and Lester A. Hoel Faculty Research Scientist (The opinions, findings, and conclusions expressed in this report are those of the authors and not necessarily those of the sponsoring agencies.) Virginia Highway & Transportation Research Council (A Cooperative Organization Sponsored Jointly by the Virginia Department of Highways & Transportation and the University of Virginia) In Cooperation with the U. S. Department of Transportation Federal Highway Administration Charlottesville, Virginia August 1981 VHTRC 82-R8

Welcome message from author
This document is posted to help you gain knowledge. Please leave a comment to let me know what you think about it! Share it to your friends and learn new things together.
Transcript
INTERCITY BUS SERVICE IN VIRGINIA
by
Gary R. Allen Research Scientist
Eugene D. Arnold, Jr. Research Scientist
and
Lester A. Hoel Faculty Research Scientist
(The opinions, findings, and conclusions expressed in this report are those of the authors and not necessarily those of
the sponsoring agencies.)
Virginia Highway & Transportation Research Council (A Cooperative Organization Sponsored Jointly by the Virginia
Department of Highways & Transportation and the University of Virginia)
In Cooperation with the U. S. Department of Transportation Federal Highway Administration
Charlottesville, Virginia
August 1981 VHTRC 82-R8

TRANSPORTATION PLANNING RESEARCH ADVISORY COHHITTEE
MR. R. C. LOCKWOOD, Chairman, Transportation Planning Engineer,VDH&T
MR. E. D. ARNOLD, JR., Research Scientist, VH&TRC
MR. D. W. BERG, Assistant Public Transportation Engineer, VDH&T
MR. G. W. BROWN, Assistant City Manager, City of Martinsvi!ie, City Hall
HR. G. R. CONNER, Assistant Rail Div. Admin., VDH&T
DR. DONALD R. DREW, Prof of Civil Engineering, VPI $ SU
MR. JAMES C. ECHOLS, Executive Director, Tidewater Transp Commission
MR. TOM FAULKNER, JR., Civil Engineering Department, V.M.I.
MR. D. R. GEHR, Northern Virginia Division Administrator, VDH&T
MR. J. N. HUMMEL, Chief, Planning & Engineering Division, Arlington Department of Public Works
MR. D. E. KEiTH, Northern Virginia•Division Administrator, VDH&T
MR. J. D. PAULUS, Planner I, Transportation Peninsula Planning District Comm.
MR. J. K. SKEENS, Assistant Urban Engineer, VDH&T
MR. F. L. TODD, Assist Planning & Research Engineer, FRWA
ii

TABLE OF CONTENTS
ABSTRACT--
ACKNOWLEDGEMENTS
FINDINGS AND CONCLUSIONS
National Perspective Virginia Perspective---
RECOMMENDATIONS
INTRODUCTION---
PURPOSE AND SCOPE
NATIONAL INTERCITY BUS INDUSTRY---
Current Status of the Intercity Bus Ridership Profile Industry Profile--- Services Provided Carrier Profitability---
Intercity Bus Regulation Entry and Exit Control Rate Regulation Service Standards Vehicle Performance
Federal Programs Capital and Operating Support Tax Cred •ts- Requirements for Programs
Issues in Regulatory Reform
Industry
STUDIES AND PROGRAMS IN 0THER. STATES
Studies Conducted in Assistance Programs
California Michigan
Other States in Other States
Minnesota New York Pennsylvania Oregon North Dakota Alaska Washington West Virginia Summary of States' Assistance Programs
Page
vii
ix
x
xv
3 3 5 6 7 9 9
I! 12 12 12 12 13 14 14
17
!7 18 18 18 19 19 20 2O 20 2O 20 21 21
iii

TABLE OF CONTENTS (cont.)
Page
VIRGiNiA INTERC!TY BUS INDUSTRY 22
Definition of the intercity Bus Industry in Virginia-- 22 Regulation of the intercity Bus Industry by the State of Virginia 25
Rules and Regulations 25 Regulatory Environment in Virginia 28
Fees and Taxes Imposed on the Intercity Bus Industry by the State 30
Fuel Tax--- 31 Sales and Use Tax 31 Motor Vehicle Titling Fee 31 Motor Vehicle License Fee 31 Rolling Stock Tax 31 Special Revenue Tax 32 State Franchise Tax 32 Income Tax- 32 Filing Fees 32
Characteristics of the Intercity Bus Industry in Virginia 32
Fleet Size and Average Age 32 Service and Operating Characteristics 34 Bus Stations and Terminals 45
Financial Review- 48 Entry, Exit, and Market Stability 48 Gross Receipts and Market Shares 48 Operating Ratios, Rates of Return, and Implications
for the Future 52 Internal Cross-Subsidies and Regular-Route
Operations 57
POLICY SCENARIOS RELATING TO VIRGINIA'S INTERCITY BUS INDUSTRY
The No-Action Alternative- Economic Regulatory Reform-
The Rationale for Reform- Expected Impacts of Regulatory Reform
Assistance Provider-Side Subsidies- User Subsidies-
Concluding Remarks
REFERENCES
62.
62 63 64 67 68 69 71 72
73
APPENDIX REGULAR-ROUTE INTERCiTY SERVICES PROVIDED BY SMALL CARRIERS A-I
iv

ABSTRACT
The intercity bus industry in Virginia was examined to gain information on the status of the industry and to determine the likely impacts of state policy options relating to assistance and deregulation on the industry. The national intercity bus industry and other states' studies of and programs for the in- dustry were also examined. Information concerning Virginia's regulation of the industry, state-imposed fees and taxes on the industry, and operating and financial characteristics of the industry was collected. Conclusions regarding the industry were developed, and recommendations regarding Virginia's response to industry problems and issues were made.


ACKNOWLEDGEMENTS
A number of individuals were helpful to the authors during the course of this study. Thanks go to B. H. Conner and L. H. Hughes of the Virginia Division of Motor Vehicles; to S. C. Burruss, W. S. Fulcher, D. S. McPherson, S. E. Nunnally, and A. J. Stewart of the Virginia State Corporation Commission• to the intercity bus owners and operators; to W. E. Chadwell, Jr., President of the Virginia Bus Association; to M. D. Kidd and C. M. Badger of the Virginia Department of Highways and Trans- portation; to Susan Kane and Jan Kennedy for patience in typing and correcting; and to Harry Craft and his staff. A very special acknowledgment is extended to Sharon Crowe!l for her role in data preparation, literature review, and constructive criticism of early drafts of this report.
vii


FINDINGS AND CONCLUSIONS
National Per sp.ective i. Until ten years ago the intercity bus industry was
financially sound. More recently, however, ridership and revenues have fallen to the point where service on
many scheduled routes is no longer profitable.
2. The typical intercity bus passenger can be classified as "transportation disadvantaged;" that is, he rides the bus because alternative modes are unavailable or too costly. These passengers are from .low income groups such as students, people in the armed forces, the unemployed, minorities, retirees, and unskilled workers.
3. The two major carriers, Greyhound and Trailways, account for 75% of regular-route passenger revenue. Nevertheless, the smaller companies operate more total bus miles, carry more passengers, and collect more charter revenue than these dominant carriers.
4. The regulations governing exit, entry, and fares under which the bus industry has operated since 1935 have served to maintain a monopoly position for the major carriers. These regulations have discouraged competition and limited the number of new entries into the market, and they have not been revised to respond to changing marketing conditions.
5. While the Interstate Commerce Commission (ICC) has relaxed entry controls in the charter market in recent years, the existence of regulations is sufficient to cause many carriers to maintain unprofitable regular routes.
6. There is little likelihood of federal subsidies for inter- city bus transportation in the near future. One federal program, Section 18, has been used to assist intercity bus carriers in rural areas, but two programs intended specifi- cally to support intercity buses, Sections 21 and 22, have not received appropriation. Aside from the requirements relating to labor protection and accessibility that accepting subsidies would require, the present mood of Congress and the Reagan administration are not conducive to transit subsidies.
7. While the bus industry is the last transport mode to remain regulated, deregulation on the national level is a strong possibility in the next few years. Two bills have been intro- duced that would begin the process, one sponsored by the ICC and the other by the American Bus Association. Deregulation
ix

at the state level has occurred in one state, Florida, and the results appear promising. In both the air and trucking cases, states' regulatory powers have been pre- empted, and this is also included in legislation proposed for buses.
8. Twelve states have completed studies of the intercity bus industry. Areas in which state action was recommended included (I) marketing and promotion; (2) subsidy through tax exemptions or lower fares for low-income citizens; (3) facility construction, such as park and ride lots, passenger shelters, and terminals; and (4) coordination of bus procedures and integration with social service agencies.
9. There is strong and growing interest at the state level in developing financial and technical programs to support inter- city bus service to small urban and to rural areas. Ten states have assistance programs. These programs include promotional assistance in Oregon, operating subsidies in Pennsylvania, and operating and capital assistance in Michigan, which has the most extensive program. The Michigan Department of State Highways and Transportation administered over $15.5 million in state funds in FY 1980 for bus capital equipment, bus operating assistance, service development, fare reduction, and passenger terminal facilities programs.
Virginia Perspec..tive i. There are 28 intercity bus companies in Virginia, two of
which furnish charter service only. These 28 are companies certificated by the State Corporation Commission (SCC). Other carriers, such as taxi operations, airport limousine services, and certain trransit operators, are certificated as well, and these were excluded in this study. A considerab! number of carriers are .no% required to obtain SCC certifica- tion, although they often compete with SCC-regulated carriers. Major types of regulatory control pertain to market entry, market exit, establishing fares, safety and insurance re- quirements, and schedules.
2. Although there has been some confusion among the carriers regarding the matter, the SCC cannot deny a certificate solely on the ground that the applicant may render charter service originating at the same point as another carrier, nor is providing regular-route service a prerequisite to obtaining a charter certificate.
3. A concern of significance expressed by the SCC regarding state regulations is the fact that amendments to Section 56-274 of the Code of Virginia are creating significant amounts of non-regulated competitive transportation ser- vices for the regulated carriers and resulting in an erosion of the regulatory authority of the SCC.
4. Carrier officials argue that many of the above competitors are being subsidized through various government programs; however, in many cases government-subsidized operators have entered the market because private carriers did not and would not provide particular services. In addition, carrier officials noted that too frequently the SCC bases decisions on the statements of very few concerned individuals.
5. Regarding regulatory reform at the federal level, the SCC does not oppose reform; nevertheless, the Commission is con- cerned with the public's welfare and would most likely be very concerned about state regulatory reform. The carriers, for the most part, are not opposed to regulatory reform limited to relaxing economic controls.
6. While the intercity bus industry is liable for certain taxes and fees, these represent a relatively small portion of variable costs.
7. Excluding Greyhound and the three large companies associated with Trailways, Virginia carriers increased the bus fleet from 248 in 1976 to 405 in 1980, largely due to an increase in charter demand. While the fleet age fell from 15.0 to 13.5 years during this period, Virginia-based carriers operated bus fleets significantly older than the recommended maximum of 7.5 years.
8. The intercity bus industry in Virginia has not been stable. Although 25 of 28 carriers were in business in 1975, only 3 have entered the market and i0 have cancelled their certificates in the interim.
9. Notwithstanding the market instability, bus service in Virginia, although reduced since 1968, is extensive. For example, 40 of 41 cities have service; 131 of 187 towns re- ceive service; and many of the census-designated "places" receive service.
i0. Unprofitable regular-route service has been maintained by some carriers in order to retain exemption from local property taxes, to maintain charter rights, to conform to SCC rulings disallowing abandonment, to maintain feeder service, to ward off competition, or as an obligation to transit-dependent riders.
xi

ii. Annually, Greyhound and Trailways provide 86% of the 28 million scheduled bus miles in Virginia. Nevertheless, bus miles traveled annually are insignificant in comparison to total vehicle miles of travel in Virginia. In fact, the 28 million bus miles per year is about one-half of the ve- hicle miles per day on Virginia interstate and primary high- ways. While the 24 smaller carriers in Virginia supply 14% of the regularly scheduled service, the majority of this, 74%, is provided by the urban-suburban commuter carriers.
12. Since 1975, regular-route-bus miles have generally declined while charter-bus miles have increased substantially. While some routes have been abandoned, carriers have responded to declining regular-route demand by reducing service levels.
13. Regarding ridership, regular-route ridership has declined since 1975, with the carriers providing traditional inter- city, fixed-route service being more susceptible to the decline than those providing commuter services. Based on ridership data available, the small carriers providing traditional intercity regular-route service, as opposed to commuter service, transport relatively few passengers. Ac- cordingly, in most cases route abandonment does not have significant impacts on mobility.
14. Between 1976 and 1980, constant dollar earnings fell by a total of $i million for Virginia operations. Because ap- proximately 60% of the companies suffered losses in real revenue andbecause.operating costs rose more rapidly than the consumer price index, it is reasonable to conclude that profit margins were lower in 1980 than they were in 1976.
15. As is true nationally, Greyhound and Trailways dominate the Virginia bus market. Together, these firms generate about 77% of total bus revenue.
16. The type of service sup•lged is largely related to the size of the company. Specifically, regular-route operations are
a prime revenue source for only Class i carriers (earnings greater than $3 million annually); smaller carriers depend largely on charter revenues and receive only 18.9% of their earnings from regular-route service.
17. Differences in operating ratios (operating expenses as a percentage of operating revenue) show that costs per bus mile are significantly lower for smaller carriers as compared to Class i carriers.
xii

18. Standard measures of financial performance, including operating ratios and rates of return on investment, strongly support the hypothesis that the intercity bus industry is not an attractive investment. Despite this fact, some companies continue to operate but can be expected to cease operations at such time that a signifi- cant reinvestment in the fleet is required.
19. Class Ii carriers (earningsbetween $I million and $3 million) and Class Iii carriers (earnings less than $i million) have in many instances reduced regular-route operations to mere token service and appear to operate only to satisfy regulatory requirements. Quick-Livick, for example, supplied only 6.4% of its total bus miles as regular-route service.
20. The data show overwhelmingly that regular-route operations are unprofitable and are being cross subsidized by charter operations. The range of losses is between $0.06 and $0.99 per mile on regular routes, and total losses in 1979 were $2.2 million. Even though urban-suburban carriers operate in the commuter market where demand is relatively more strong than in rural areas, 80% of these companies supply charter service as well.
21. Although there are significant cross subsidies between charter and regular-route operations, the lifting of entry and exit controls will not precipitate a mass exodus from regular routes. While Class II and Class !II carriers will drop some rural routes, others will be maintained because of the need to maintain feeder routes, to qualify for federal fuel tax exemption, and to maintain certain state tax exemptions.
22. Assuming that regulatory reform occurs at the federal level, the Department must analyze three general policy scenarios: (i) maintenance of the current state regulations; (2) de- regulation at the state level and complete noninterference with the market to determine the supply of bus service; and (3) deregulation at the state level, but with the Department examining the provision of assistance as an enticement to carriers to provide regular-route service.
23. Because the no-action alternative in the context of federal deregulation frustrates the benefits of allowing the market to operate and will not ensure regular-route service, it is an inadequate policy for dealing with the changing inter- city bus industry.
xiii

24. Regulatory reform at the state level in conjunction with reformat at the federal level is the most desirable policy with respect to the financial health of the bus industry and the efficient provision of transportation service. While regulatory control has been exercised largely to maintain regular routes through a cross subsidy technique, this fact isn't sufficient cause to maintain entry and exit controls.
25. Experience with regulatory reform of the bus industry in Florida and with the trucking industry in general are en- couraging support for the expectation that under deregula- tion in the bus industry, markets will expand, prices will fall, and efficiency will increase.
26. No economic arguments will support subsidies to cure the problems of Virginia's intercity bus industry. While other arguments based on mobility can be offered, these are extremely weak and are overshadowed by the case for allowing the market to work.
xiv

RECOMMENDATIONS
A. While declining in profitability and ridership, the inter- city bus industry represents an important element of the total public transportation services in the state. Accord- ingly, the following is recommended.
i. In future actions of the Virginia Department of Highways and Transportation, consideration should be given to these private carriers in terms of impacts that new policies and programs might have on the financial condition of the industry.
2. The intercity bus industry should continue to be recognized as one of the service providers available to furnish rural and intercity trans- portation within the state. The nrivate sector should be allowed the freedom to exercise the power of the market to provide efficient trans- portation services, and the Department should incorporate this resource into its long-range plans for statewide public transportation.
3. When deemed in the public interest by local government, private carriers should be con- sidered as eligible recipients of public support.
B. The intercity bus industry is the only mode that is presently regulated at the federal level by the iCC and at the state level by the SCC. Proposals to deregulate the industry at the federal level would eliminate entry, exit, and rate control and permit market forces to act. In the likely event of national deregulation, the following is recom- mended.
i. If proposals for state regulatory reform are made, the Departmen{ should strongly support them, thus acting in a consistent manner with federal requirements. The arguments for de- regulation are persuasive, and this action will allow carriers to be responsive to changes in market conditions.
2. In the event of state deregulation, the Depart- ment should assist localities in monitoring the effects on existing routes, schedules, and rider- ship, and. should develop criteria for determining whether any losses in service significantly impact mobility.
XV

3. The Department should continue to encourage private carriers to furnish those transporta- tion services that they can efficiently provide through the market mechanism.
4. If, based on previously established criteria, assistance programs are considered to maintain routes that are to be discontinued, the Depart- ment should develop requirements for levels of service to be provided, consider only assistance mechanisms that are inexpensive to .administer, provide incentives for furnishing productive and efficient service, and maintain the active par- ticipation of local government in the decision process.
C. The Virginia intercity bus industry is fragmented and un- profitable. Consistent with the responsibilities of the Public Transportation Division as described in Section 33.1-3918 of the Code of Virginia, there are several ways in which the Department can help the industry in supplying services to the citizens of the Commonwealth. Accordingly, it is recommended that the following be considered for implementation.
i. Assistance in marketing and promotion, including such things as preparation of statewide maps and schedules showing bus stops, routes and shelters; public service announcements promoting the idea of energy conservation as a result of travel by bus; provision of park and ride lots, particularly for urban and suburban lines; and coordination with social service agencies.
2. That the planning district commissions and other appropriate local government officials be informed of the results of this study, and that they be en- couraged to maintain" clnse contact with the private bus operators in their localities as they further develop their transportation plans and programs.
D. Tax credits and exemptions beyond those implemented by the General Assembly in 1978 do not appear warranted; therefore, it is recommended that no action be taken in this area.
xvi

iNTERCITY BUS SERVICE IN VIRGINIA
by
Gary R. Allen Research Scientist
Eugene D. Arnold, Jr. Research Scientist
and
Lester A. Hoel Faculty Research Scientist
INTRODUCTION
Nationwide, the intercity bus industry consists of approxi- mately 1,150 privately owned and operated companies that operate some 20,500 buses over 280,000 miles (450,800 km) of scheduled routes•and provide service to approximately 16,000 places.(1) Until very recently, the industry had been profitable and had received no financial assistance from government. Consequently, governmental officials and planners had largely ignored it.
The decline in profitability has caused carriers to shift resources away from conventional regular-route operations to more profitable charter operations, thus creating cross subsidies be- tween charter and regular routes. As a consequence of this shift, intercity service has been reduced; in some instances, eliminated. Further, travel by bus represents the most energy-efficient means of common carrier, intercity passenger transportation. Reductions in service,however, are not consistent with the current nationwide interest and concern with energy conservation and the transporta- tion needs in rural areas and small communities.
In recognition of the declining state of regular-route inter- city bus service, both the federal and state governments have passed legislation authorizing assistance programs. Among the earliest was the Energy Tax Act of 1978,(2) which exempts privately owned bus companies from payment of federal excise taxes on new buses and bus parts and provides for the rebate of federal taxes on diesel fuel. In addition, Section 22 of the Surface Transporta- tion Act of 1978 authorized but did not appropriate $30 million annually through FY 1982(2) for operating assistance to preserve or enhance intercity bus service in nonurbanized areas. As a part of the Section 18 program, financial assistance has been made available to intercity buses. (2) Several states also have inter- city bus programs, namely, New York, Michigan, Pennsylvania, California, and New Jersey. In Virginia, assistance has been pro- vided by the repeal of the gross receipts tax and by the quarterly refznding of the ll¢-per-gallon fuel tax.

Interest in the financial health of the intercity bus indus- try has not been limited to assistance programs. Following the trend in Congress toward less government intervention in commerce, H.R. 7677, placed before Congress June 25, 1980, and concentrating on entry, exit, and rate making reform, proposes to deregulate the intercity bus industry.
In light of these changes affecting the industry, Virginia is faced with decisions regarding assistance programs and future regu- lation of the industry. Consequently, a study of Virginia's inter- city bus industry was required, and this report describes that investigation.
PURPOSE AND SCOPE
The primary purpose of the study was to examine the intercity bus industry in Virginia so as to (!) obtain information on the status of the industry in Virginia, and (2) determine the likely impacts of state policy options relating to assistance and de- regulation on the industry and mobility in rural areas.
The scope of the study was limited to a review of the litera- ture, an examination of intercity bus programs in other states, collection of available data about the carriers in Virginia, and telephone discussions with officials of 19 carriers operating in Virginia. The telephone discussions concerned (!) problems facing the industry, (2) why regular routes are maintained, (3) operating ratios, (4) ridership trends• and (5) opinions as to what the state can do to mitigate the problems. The information obtained from these conversations is incorporated as appropriate throughout the report, rather than being presented separa-tely.
Information gathered from the above activities is presented under the headings of the national intercity bus industry, studies and programs in other states, the Virginia intercity bus industry, and policy options relating to V±rginia's intercity bus industry.
NATIONAL INTERCITY BUS INDUSTRY
The purpose of this section is to review and summarize the current literature regarding the intercity bus industry, which includes information concerning the industry's history, curren•: condition, and existing and proposed regulation. This informa- tion is important in placing Virginia's bus industry in proper

perspective and in understanding the role of the Interstate Commerce Commission (ICC) in regulating interstatebuses that serve the state. The report first describes the current status of the intercity bus industry in terms of its ridership, industry profile, services provided, and carrier profitability. Intercity bus regulation is discussed for entry and exit control, rates, service standards, and vehicle performance. Information con- cerning federal programs for capital and operating support and tax credits is presented. Finally, issues in regulatory reform are discussed.
Current Status of the Intercity Bus Industry
Ridership .Profile The intercity bus industry represents the most ubiquitous
form of intercity transportation, furnishing scheduled service between approximately 15,000 towns and cities, and 50,000 flag stops throughout the United States. More than 14,000 of the communities with bus service have no other public transportation options.(3) For many rural communities, bus service represents the sole source of public transportation and thus is essential for citizens who do not own or have access to an auto. For others it potentially represents an energy-saving alternative, and during recent severe petroleum shortages ridership on intercity buses has, in fact, increased.
Intercity buses carry more passengers than any other form of domestic passenger transportation. In 1979 intercity buses carried approximately 360 million passengers, a number greater than that carried by air and rail combined (the airlines served 295 million and Amtrak 21.5 million). (I) This figure dropped steadily during the past decade from 401 million in 1970 to a low of 332 million in 1977. In 1978 and 1979 the bus industry experienced increases in passengers carried.(1) From 1970 to 1979 intercity bus revenues grew only 6.7% annually, whereas airline passenger revenues grew by 15.4%.(4) Although these numbers reflect an apparently im- pressive market, the figures for passenger miles are considerably diminished. In 1979, domestic air transportation accounted for approximately 84% of intercity passenger miles, compared with 11% for buses and 5% for rail.(4)
The bus industry serves shorter trips than does air, and carries a declining share of the market as trip length increases. In 1979 the average trip lengths were 723 miles (1164 km) for air and 76 miles (122 km) for the bus. The bus trip length was 123

(4)* miles (198-km) for Class i carriers. Thus it would appear that intercity bus transportation is a vital service to cities and towns without other forms of public transportation and that it provides transportation between localities where there is a demand for intercity public transportation because sufficient automobiles are not available or there is a petroleum shortage.
Although intercity buses represent the only available public transportation alternative in approximately 14,000 cities and towns, the low levels of service provided in terms of the number of scheduled stops per day, the numbers of destinations served, lengthy travel time, and inconvenience of arrivals and departures often makes the bus as the mode of last resort. Most people liv- ing in these areas travel by auto, van, or truck. For example, in 1979 only 1.7% of the total passenger miles in the nation were attributed to intercity buses in contrast to 83.7% by private auto.(o4) The trend in the national intercity bus industry's market has been steadily dropping to its present low from a rate of 4.5% in 1950, although a temporary and minor halt in the decline was recorded for a brief period during the 1974 oil crisis, when passenger miles increased from 2.0% to 2.2% between 1973 and 1974. (5)
The present status of intercity bus transportation is the result of changes that have occurred in the United States during the past several decades. Among these are the jet age in air transportation, the construction of the interstate highway system, growth of suburbs, population decline in rural areas, and the steady rise in auto ownership and licensed drivers. Historically, bus fares have been lower than those for other travel modes, but this gap is narrowing. Per passenger mile costs are considerably lower by bus than by auto; however, total bus fare costs increase with each additional traveling member of a family or group, where- as total auto costs remain fixed regardless of the number of passengers. Further advantages of convenience, comfort and space for luggage also favor the auto over the bus.
!ntercity bus transporta•io• is primarily a mode used by the so-called transportation disadvantaged, those who for one reason
or other, do not have an auto available to them or cannot afford
*Class I carriers are defined as those having operating revenues in excess of $3 million annually. Class ii carriers have operating revenues between $I and $3 million annually, and Class !i! have annual revenues less than $! million annually.(2)

to drive or to fly. These people tend to be individuals from groups who on average have little or no income, such as students, the unemployed, housewives, retirees, minorities and unskilled workers. Various surveys have confirmed this passenger profile. The U. S. Census of Transportation reported that almost 50% of intercity bus riders are younger than 18 or older than 65. The Wisconsin survey showed that 30% of bus riders are students and 5% are unemployed. The U. S. survey also reported that 80% of ridership by bus had an income below $i0,000 compared with 36% by rail, 20% by air, and 35% by auto. Some intercity bus travel is by persons who could travel another way, yet most trips are for nonbusiness reasons.
(5)
Intercity bus transportation has lost a considerable portion of its market to other cost-competitive modes. Buses are slower and more inconvenient and for this reason travelers who place a premium on time, such as those making business-related trips, seldom travel by bus. As a mode serving a declining market com- prised mainly of the poorer segment of society, the industry's revenue has fallen while operating costs, inflation, and interest rates continue to rise. This cycle of reduced ridership followed by reduced standards of service affects only a small segment of society those least able to pay. The implications for the state and the nation, in terms of the future of this mode, may require actions such as changes in laws related to taxation and regulation as well as direct public support, if bus travel is to survive.
Industry Profile
!ntercity bus service is provided by privately owned carriers operated for profit under government regulation. Until recently, the intercity bus industry had been economically sound with little need for financial assistance. In contrast, the U. S. passenger railroad systems, which went bankrupt in the 70's, had received substantial operating capital to remain in service.
In the United States there are approximately 1,000 companies furnishing intercity bus service. Of these, Greyhound and Trail- ways represent approximately 75% of regular-route passenger revenues. The Greyhound corporation is the larger carrier with over twice the annual revenue of Trailways. Many smaller companies service many of the towns and villages within a state and these routes act as feeders to the larger carriers. (3)
This highly diversified industry represents a wide spectrum in terms of total revenues. 0nly 46 carriers, those designated Class !, earn more than $3 million annually. The Trailways corporation in 1979 owned 14 Class ! carriers and had a network

of 35 independent affiliates operating jointly as a system for purposes of marketing, ticketing, and joint use of termina!s.(4) The fleets of the major intercity carriers consist of 4,000 Grey- hound and 2,150 Trailways buses. The third largest carrier in the United States is Carolina Coach, an affiliate of Trailways and owns 200 coaches. Some companies own fewer than 5 vehicles. In terms of revenue, Greyhound accounts for 60% and Trailways 22% of the industry total.(3)
Capital requirements of the intercity bus industry range from a fleet of new buses and downtown terminals to a few used coaches using gas stations and grocery stores as stops. 0nly the larger carriers have heavy investments in fixed facilities. The Grey- hound and Trailways stations are .• familiar sight in the downtown of most cities. Many are located in rundown neighborhoods, which tends to reinforce the image of intercity bus transportation as the system for the poor. Although there is a nationwide network of intercity terminals connecting large and medium-size cities, it has limited value as most intercity bus trips are short and few of the terminals have frequent, directly-connected routes and schedules.
Services Provided
Intercity bus companies offer three types of service: regular- route, package express, and charter. While the present study was concerned primarily with the intercity passenger market, it is often these secondary services that provide the basic revenue to permit the operation to continue.
In small rural areas, there may be a single bus company that serves as a feeder to larger population centers. This service may be as infrequent as once a day and may represent the only non- auto alternative for people in these areas. In terms of the in- come produced, these companies are likely to rely on charter business for the bulk of their revenue.
Community population is a principal indicator of the avail- ability of regular-route service, although other factors affect the amount of service provided. In New York State bus service standards call for 7 buses per week in towns between 3,000 and 5,000.(3) However, population alone will not assure bus service, because the availability of service depends on the location of the community as well. Accessibility to an interstate highway and location on a national through route tend to favor added service.
While intercity regular-route service is declining for most carriers, other revenue sources are on the increase. Between 1969 and 1979 the percentage of total operating revenue of Class I car- riers derived from regular-route service declined by 5.4%, from 71.4% to 66.0%, while charter services increased by 4.1%, from ii 1% to 15.2%. Package express rep• ented 13 3% of revenues in 19•9
but increased to 15.9% by 1979. (±?
Only about 15% of the total operating revenue earned by Class I carriers is derived from charter services, whereas for smaller bus companies this figure .rises to 70%. On the other hand, charters accounted for only 10.9% of Greyhound and 17.3% of Trailways in- come.
(3) Clearly, from a profit motive viewpoint of small companies operating in rural areas, it would make economic sense not to carry regularly scheduled passenger traffic. In the absence of regula- tion or tax incentives, many regular routes which are financial losers would be abandoned. On the other hand, the major carriers derive a substantial portion of their income from regular-route service and could find it profitable to continue many of their services. Generally, charters have a lower unit cost than regular- route service because of their larger average passenger loads. Al- though average trip lengths on charters are greater than for regular service, charter fares can be less than that for a comparable ride on a regularly scheduled bus line because of this higher load factor. Charter service represents an expanding market for intercity bus carriers and its popularity can be expected to increase. The bene- fits of special-purpose group trips from smaller cities to larger areas that offer commerc!al, entertainment, and cultural activ•t •_leS should accelerate as energy costs continue to rise.
Package express is available between towns and cities served by regular-route buses. For those locations where this service exists, it can be an inexpensive and relatively fast means of moving small-sized parcels. If pickup and delivery is between terminals and the trip length is relatively short, the level of service is high. For these reasons parcel delivery has become a lucrative addition to the intercity bus business, entailing a relatively low marginal investment for the income received. Parcel delivery is also offered by other competing organizations such as United Parcel, Federal Express, and the U. S. Postal Service, which have fewer restrictions on the size and weight of cargo and servea greater number of areas.
Carrier Profitability Carrier profitability is measured by a firm's operating ratio,
which is operating expenses as a percentage of operating revenues.
(For example, if annual operating expenses are $90,000 and annual operating revenues are $i00,000, the operating ratio is 90%.) As the operating ratio increases, the return on investment and return on the stockholders' equity usually decline. Between 1967 and 1971 the operating ratio of the intercity bus industry was rela- tively constant at about 88%, a rate that the bus industry has claimed is necessary for a company to remain profitable.(6) In the years 1971 through 76, the ratio steadily increased to 95.5% and has hovered there since. It has been estimated that in 1981 the operating ratio will be 99.3%, if present fares are maintained but would be 94.6% if an 8.5% fare increase is placed into effect. 16"
Carrier profitability is dependent on factors related to both the supply and demand sides of bus transportation. Costs of sup- plying bus transportation have been steadily increasing due to rising costs of capital, labor, and fuel. The cost of new buses has increased from $65,000 in 1970 to $138,000 in 1981.(6) Fuel costs have also dramatically increased by over 300% during this period. While the inflation rate prior to 1977 was about 5% it mncreased to 9% in 1978 and by 1980 was running between 12% and 20% per year. (6) Labor cost represents the largest expense for bus companies, accounting for about 60% of the operating costs for Class ! carriers.(3) Union contracts have generally called for cost-of-living increases geared to the rate of inflation. Overall, bus operating expenses increased an average of 6.25% per year be- tween 1968 and 1978, but this rate was higher than average during the latter part of this decade.
Revenues from intercity passenger service obviously have not kept pace with rising costs. A decline in bus ridership and low fares are the primary factors contributing to the continuing dis- parity between operating costs and revenues. The decline in rider- ship is directly related to the operating ratio, for each 2% de- crease in passengers there is a corresponding 1.5% increase in the operating ratio.(6) Increases in bus fares have not been timely because of delays in approval by regulatory agencies, and this has contributed somewhat to lower revenues. The more dramatic factor, however, has been the.de<line in ridership. In 1969, Class ! carriers accounted for 178 million revenue •ssengers and by !97• this figure was reduced to only 133 million• I The reasons for declining bus ridership are many, and include some competition from government subsidized Amtrak and the deregulated air!ines{ higher fares, which have a greater effect on the typically lower income •us rider; and the loss of sub-markets such as a lower student population and smaller-sized standing army.
The sporadic surges in bus riderships during periods of energy shortage have not been sufficient to negate the steady erosion of the patronage of the intercity bus transportation industry. At

present, the major carriers are barely holding their own, sub- sidized in part by revenues from charter and package services. With the exception of major routes connecting the north and south or the east and west, many interstate bus routes, especially those serving rural areas and as feeders, are being maintained at a loss of mQney. While the average operating ratio of 95% indi- cates that the major carriers are surviving, many smaller bus companies have exceeded an operating ratio of 100% and are destined to go out of business.
It is difficult to be optimistic about the future profit- ability of the intercity bus industry. Energy costs can be ex- pected to increase in the next decade and the costs of furnishing bus transportation will reflect this increase. It is unreasonable to expect a reversal of the decline in bus ridership as autos be- come more fuel-efficient and as bus companies are forced to raise their fares. On the other hand, charter service and other special arrangements, together with package delivery, should increase and furnish a significant portion of the industry an opportunity for growth.
Interci.ty Bus Re.•u!ation Intercity bus carriers have been regulated by the federal
government since 1935, when the Motor Carrier Act became law. Since then, the ICC has had the authority to approve requests by carriers for system changes such as adding new routes, abandoning existing service, and initiating fare increases and charter and package services. Until recently, airline, trucking, and rail- road companies were under similar federal control. The bus in- dustry is now the last intercity transportation mode to beregu- lated.
The process required to have a request for a system change granted is an adversary proceeding in which the request may be challenged by parties who could be damaged if the change were granted. Each side presents its•case and a ruling is made. For example, if a carrier wishes to establish new service it may be challenged by another carrier who is already supplying similar service. If a fare increase is proposed, it could be challenged by consumer groups. Other federal agencies also regulate the industry.
Entry and Exit Control
Freedom to offer new interstate service is severely restricted under present laws and iCC rules. Requests to add service must

demonstrate that the service is in response to a public need or demand, that the demand cannot be adequately met by existing car- rier services, and that the new service will not economically harm existing carriers. The ICC does consider if the benefits of the service will outweigh its costs. Since most interstate bus routes were in place prior to the passage of the Motor Carrier Act, the effect of regulation in general has been to maintain the competitive position of the major companies Greyhound and Trailways and local carriers. Entry regulations havemain tained the monopoly position of the major carriers on individual routes, have prevented entry of either carrier into the market of its competitor, and have severely limited the entry of new carriers.
Although the ICC regulations do permit entry if it can be shown that the advantages to the public outweigh the disadvantages to the existing carrier, the practical result has been that of the few new companies that have applied for entry, most have been de- nied. The application process is lengthy, costly, and time-con- suming with the burden of proof being placed, until recently, on the applicant. Accordingly, there has been little incentive for new entry into the field.
The ICC also regulates the entry of intercity charter services. Normally, regular-route carriers are also permitted to offer charter services within their territory. In fact, prior to 1967 these and other incidental services were granted as part of a route approval. The linkage of regular and charter service approval has caused many small carriers to retain minimal regular-route service at a loss in order to retain charter rights. However, recent rulings indicate that this may no longer be necessary and that intercity bus companies will be able to abandon their unprofitable fixed routes while retaining the more lucrative charter services. Never- theless, the regulatory environment still exists, causing many carriers to maintain regular routes until well-publicized reform removes their doubt regarding the link between regular-route serv- ice and charter certification.
The operating rights for regular-route service granted by the iCC contain the provision tha-c the carrier may also apply for the right to offer charter and package express service. However, in the past the regular-route service was viewed as primary, and the ICC ruled that as a minimum a carrier had to furnish service once
per week in order to retain charter rights. More recently the ICC has ruled that nonscheduled weekly service does not constitute sufficient commitment to warrant maintaining a certificate which included charter rights. However, if the carrier has agreed to cancel its regular-route certificate, it has granted the right
i0

to furnish charter service. Rulings of this type have tended to decouple regular-route authority from charter-service authority with the result that small carmiers should not have to maintain the fiction of p•roviding regular-route service in order to retain charter rights.
The level of enforcement of ICC regulations has not been high, especially with respect to services provided by small car- riers and charters. The number of charter applications has been substantially greater than for fixed-route services.
The approval of package service is usually made in connection with a regular-route application, provided transport of the parcels is an incidental service and they are carried in the same vehicles as the passengers. Package servmce is considered by the ICC as incidental and thus subordinate to passenger safety, comfort, and convenience. For example, an attached trailer was disapproved by the !CC because it implied that passenger service would be sub- ordinated to parcel delivery. Other items of parcel regulation include package size and weight and charges.( 7
Requests by a carrier to abandon service are uncommon, be- cause the carriers are not obligated to maintain a specified levei of service but can adjust their transportation supply to conform with passenger demand. Thus, if ridership is declining a carrier may restrict the frequency of daily bus departures. Scheduling is not carefully monitored although it is conceivable that if passengers complained to the iCC subsequent investigation might result in findings which would require the carrier to restore service. In practice, however, many existing certificated routes are either inactive or furnish minimal service.
Rate Regulation
The control of fare structures and rate increases is also a responsibility of the !CC. Normally a request for a fare increase must be filed at least 30 days in advance of its effective date. Rate requests may be filed as a group and submitted through the industry's rate bureau. The two largest carriers must petition separately, although the rate requests are not examined on a route basis nor do they necessarily relate directly to the costs for individual companies. The ICC guidelines for rate increases are based on average operating ratios and require that fares be as low as is consistent with providing satisfactory service and that they be nondiscriminatory.
!i

The rate bureau structure, which is permitted under the Reed-Bulwinkle Amendment (1948), has operated with little chal- lenge by the !CC until recently. Prior to the early 1970's, rate requests based on an operating ratio of 85%, were routinely proved with little investigation or challenge. More recently, -the iCC has permitted carriers to offer promotional fares in order to compete with other intercity services. Quick response actions of this type are not typical of the industry and could have implications on established procedures for setting fares.
Service Standards
Although the principal regulatory activities of the ICC deal with route certification and rates, there have been attempts to regulate the level of service provided by the carriers to inter- city bus passengers. Subsequent to an extensive study of the adequacy of intercity bus services, in 1977 the ICC issued a set of rules governing ticketing, information services, baggage ser- vices, terminals, facilities for the handicapped, and equipment. Many of the standards were viewed by the bus industry as very costly. As a result, they have not been enforced.
Vehicle Performance
The federal government maintains additional control over the intercity bus industry by regulation of bus performance specifica- tions. These include limitations on the size and weight of buses using the interstate highway system, safety inspection and safety equipment on board buses, motor vehicle safety and emission stand- ards for new buses, and noise standards for all buses. The agencies responsible for setting and enforcing vehicle performance standards are the U. S. Department of Transnortation (DOT); Federal Highway Administration (FHWA), Bureau of Motor Carrier Safety; and the Environmental Protection Agency (EPA). •
F_edera! .Prosr.ams C.apital and 0pe.•r.ating Support
At the present time the federal government does not provide capital or operating funds for i•ntercity bus transportatJ_on, and it does not appear likely that federal subsidy programs will be provided in the near future. There are three federal support programs that could be used for these purposes. 0nly one (Section 18) has had funds appropriated for intercity service. Two other programs (Sections 21 and 22) have been enacted to support inter- city bus service but Congress has not yet appropriated funds for these programs.(2)

Section 18 of the Urban Mass Transportation Assistance Act provides a grant program for rural and small urban community transportation.* The program, which is administered by the FHWA, may be used to provide capital and operating as- sistance to state agencies, local public bodies, nonprofit organizations, and operators of public transportation services. To be eligible for Section 18 funding, a project must be part of a state sanctioned program of public transportation service projects. The Congress appropriated $75 million for fiscal year 1979. Most projects that have been funded relate to social ser- vice and local access objectives, and only a small part of the funds have been used for intercity transportation service. Sec- tion 18 furnishes assistance to a broad range of rural and small urban area transportation programs, but permits state and local officials to determine program priorities and to establish the relative importance for competing uses of limited resources. Prior to the Section 18 program, rural transportation support was available through the Urban Mass Transportation Administration (UMTA) Section 3 Capital Assistance Program, UMTA Section 16 Capi- tal Assistance Program,and FHWA Section 147 Rural Public Trans- portation Demonstration Program. By 1978, the UMTA programs accounted for $44 million in support for rura!•transportation and the FHWA program funded over a hundred 2-year demonstration proj- ects costing $25 million. The Section 147 program was the only one of the three that funded intercity projects. (2)
The Surface Transportation Assistance Act of 1978 authorized Section 21. This granted $40 million annually for grants to states and other agencies for facilities aiding the intermodal use of intercity buses, with 80% of the funds to be federal and 20% state matching. Section 22 of the same act authorized $30 million annually for up to 50% of the net cost of state and local govern- ment purchase of service agreements with private intercity bus companies for service to rural areas and small urban communities. Funds for these programs have not been forthcoming from Congress. (2) These programs are expected to be eliminated in the Reagan adminis- tration's 1982 budget.
Tax Credits
Another source of federal support for the intercity bus in- dustry is tax credits and exemptions from certain tax payments. Prior to 1978, the federal tax rate on new buses and bus parts was 10% of the manufacturer's sales price. This tax and the federal tax on motor fuel, oil, and tires was repealed in 1978, resulting in an estimated annual benefit of approximately $17 million or 30% of the industry's net operating revenue after taxes.(•)
*Administration proposals indicate that this program may be dis- continued for operating subsidies and that Sections 21 and 22 will be eliminated.
13

Requirements for Programs
The granting of federal operating or capital assistance carries with it certain obligations on the part of the recipient. If a carrier receives a direct subsidy there are stipulated re- porting requirements dealing with financial and operating state- ments as stated in Section 15 of the UMTA Act. Furthermore, a carrier who receives federal assistance must abide by labor pro- tection requirements of Section i3(c) in the UMTA Act and pro- visions for the handicapped as described in Section 504 of the Rehabilitation Act.(2)
Section 13(c) protects current employees against financial harm that would result from subsidies to public carriers. If nec- essary, the carrier would have the obligation to compensate an employee for loss of employment, or to retrain or reemploy him on another carrier.
Section 504 requires that public transportation services be accessible to the handicapped. In urban transportation, where federal assistance is commonplace, considerable controversy has been generated and expense incurred in an effort to redesign buses and retrofit terminals to accommodate wheelchairs• Presently, intercity bus services are not designed to accommodate the handi- capped in wheelchairs.
In summary, it is quite unlikely that many bus companies would be able to conform to either the labor protection or accessi- bility requirements in order to qualify for federal assistance. Should these subsidies become essential, some means of relaxing these regulations would be necessary so that the subsidy program would be practical.
Issues i•..Resulatory Reform
The intercity bus industry is the last of the major modal carriers to remain regulated, and in light of its recent problems there has been considerable discussion concerning the benefits that might accrue if intercity bus service became deregulated.
The goals of deregulation are to provide improved service for transportation users, to assure a financially healthy industry, and to promote efficiency in the use of energy, labor, and capital equipment. The supporters of deregulation are those who perceive a direct benefit from the subsequent increased competition, par- ticularly consumers and large carriers. The detractors of de- regulation are those carriers who believe that they will be driven out of their present markets by Greyhound if left unprotected. Thus, while deregulation of intercity bus transportation would, in theory, put market forces to work and possibly stimulate innovation in bus service, serious damage to existing carriers is predicted,
*A recent change in DOT regulations regarding Section 504 has signif- icantly reduced the impacts of the accessibility requirements. See Federal Register, Vo!. 46, No. 138, July 20, !981,.pg. 37488.
14

because of the peculiar nature of the bus industry. The contrast with the trucking industry, now deregulated, is striking. While there are 17,000 ICC regulated trucking firms, no truck company dominates the industry, whereas the 750 ICC regulated bus companies are dominated by Greyhound, which accounts for 65% of passenger revenues.(8)
Similar forecasts of gloom following deregulation were made during the debate about airline deregulation. Small carriers claimed that they would be forced out of business, some claimed that services would be diminished for small comm•unities, and others feared rate wars that would reduce profits and eliminate service. Now that the airlines have been deregulated, changes have, in fact, occurred; but the dire forecasts do not seem to have materialized, and there is evidence of new entrepreneurship in the airline in- dustry. The simple fact is that without additional data and in- formation about the results of deregulation, the actual effects on service, ridership, cost, and profits will not be known.
One state, Florida, has deregulated its intercity bus industry and the results there appear promising. Where major carriers are cancelling routes, smaller companies (now not required to file a certificate) with lower cost patterns are moving in. Innovative price and service packages are being tried and service is being expanded bYsbg• • major carriers (Trailways and Greyhound) and smaller one While there may be special reasons for the apparent success of deregulation in Florida, the results there are encouraging.
There are proposals for deregulating the intercity bus industry, one sponsored by the American Bus Association and the other proposed by the iCC. Both bills are concerned solely with economic de- regulations that is, entry, exit, fares, and financial fitness and both bills contain preemption provisions at the state ievel.(•,9) The regulation of bus safety and environmental controls is not at issue.
Proposals for deregulating the motor carrier industry reflect the viewpoints that have surfaced on this issue. On the:<one hand, proponents of complete deregulation see a viable and competitive industry created in which the public is the beneficiary of market forces that will create new services at lower prices. On the other hand, detractors of deregulation fear the effects of competition, especially from the large carriers, and others predict expensive duplication of services or loss of services to small communities where patronage is low.
15
The proposal of the ICC (the Motor Bus Act of 1981) goes furthest toward total deregulation and reflects the viewpoint of this agency that market forces should be allowed to further vitalize the industry and encourage responsiveness to changing needs. The iCC proposal would allow entry if the applicant can demonstrate that there is • demand for the service and would pre- empt all state authority regarding discontinuance of services and scheduling. Furthermore, net fare increases could not vary by more than 10% of the prior year's level and net fare decreases by more than 20%. Joint consideration of single-line fares would be forbidden and minimum insurance would be $1,500,000, unless a lower amount (minimum $750,000) were •pproved by the Secretary of Trans- portation.
The proposal of the American Bus Association (Bus Regulatory Modernization and Improvement Act) does not go as far as the ICC Act, and proposes liberalizing entry controls consistent with public convenience and necessity and preempts state authority for exit. Fare increases would be determined by •a standard fare level ad- justed for inflation with a limit on the downward fare level of 20% below standard industry fares. Increases or decreases beyond this range would be subject to review and joint consideration of single-line bus fares would be permitted. The minimum insurance coverage would be raised to $2,000,000.
A compromise deregulation proposal would allow free market entry and exit to all carriers with less than 15% of the national market. This modification would protect the small carriers from being forced out of the market and encourage competition and im- proved service.
In summary, there appears to be a consensus that deregulation of the intercity bus industry should take place. This would in- clude allowing free entry and exit and flexibility in establishing fares. Based on early returns from the airline industry and the state of Florida, it would appear that overall such changes have been beneficial.
Many of the positive effects of deregulation at the national level will be nullified if states maintain their current regula- tory controls. Federal legislation deregulating the trucking industry included sections ensuring state alignment with the national deregulation, and while the ICC bill mentioned above pro- poses the same, states have raised the question of stares' rights as it pertains to preemption. Therefore, the policy section of this report analyzes the question of whether the state should pursue deregulation if regulatory reform occurs at the federal level.
16

STUDIES AND PROGRAMS IN OTHER STATES
Other states have preceded Virginia in conducting studies and providing assistance to the intercity bus industry. Most of the findings, conclusions, and recommendations of the studies pertain specifically to the state being studied; however, some of the recommendations may be applicable in Virginia. Likewise, proposed and ongoing assistance programs may be of value in evaluating potential programs in Virginia. Accordingly, this section summarizes applicable information from the intercity bus studies and assistance programs of other states.
Studies Conducted in Other States
Studies of the intercity bus industry by twelve other states were reviewed in this investigation,(7,10-20] the most recent being those from Georgia, North Carolina, Texas, South Carolina, and Massachusetts. Most were similar in purpose and scope to this ef- fort, and most experienced similar problems in collec<ing data. Several of the studies resulted in findings or recommendations that can be generally applied to the intercity bus industry, and these are summarized below.
.i. Exempt buses from paying tolls.
2. Conduct an annual joint bus purchase program. 3. Construct park and ride lots at interstate
interchanges located in urban area fringes. 4. Develop a public transportation map for the
state, possibly in conjunction with a booklet giving each carrier's schedule.
5. Undertake a statewide marketing and advertising campaign to encourage use of buses because of their relative low cost and potential for energy savings.
6. Develop a centralized •nformation system, possibly
with a toll-free telephone number.
7. Install passenger shelters at key stops. 8. Develop a statewide system of needed intercity bus
routes, establish service standards, and subsidize as required to implement and maintain the system.
9. Subsidize fares for low-income persons.
i0. Ensure accessibility for the elderly and handicapped.
17
ii. Coordinate services of transit systems and other social service operations with inter- city buses.
12. Develop a program for improving terminals and fleets.
Assistance Pro.•ram•s .in. Other States
Several states have ongoing or proposed assistance programs for the intercity bus industry. The following paragraphs summarize the most comprehensive programs by state. Most of the information is contained in a technical memorandum prepared for National Co- operative Highway Research Program Project 8-25(21) and subsequently in a paper presented at the 1981 annual meeting of the Transporta- tion Research Board. (22) The reader should refer to these documents for further detail.
California
The state of California has budgeted $I million in FY 1981 for operating assistance to support the continuation and development of intercity bus service. The program, which is administered by the California DOT, is intended to offset operating losses incurred by carriers which increase the frequency of existing services, add new services, or increase access to other transportation systems. Based on qualitative criteria, I0 projects have been selected for funding.
Michigan
Currentl•, the Michigan Department of State Highways and Transportation administers the most extensive assistance program in the country, with funding being provided in three programs the Intercity Bus Capital Equipment Program, the intercity Bus Operating Assistance Program, and the intercity Passenger Terminal Facilities Program. For FY 1980 the budgeted amounts in state monies were $4,311,000, $3,234,200, and $8,015,000, respectively, for the three programs. All funding is provided by the state.
Under the Capital Equipment Program, vehicles are procured by the state and made available to the carriers on an i•terest-free loan basis. The loan must be repaid within six years, and the ve- hicle must be operated at least 150 miles per day in regularly scheduled service.
18

The Operating Assistance Program actually consists of two programs a Service Development Program and a Fare Reduction Program. Projects eligible for the former include those that introduce new service, reinstate discontinued service, expand• service, and continue service subject to abandonment. The subsidy is based on eligible operating costs minus revenues. The fare program is intended to stimulate ridership and in- crease revenues by fare reductions of no more than one-third. Financial assistance is provided to guarantee revenues up to an amount required to maintain the operating ratio existing before fares were reduced.
The Terminal Facilities Program is designed to develop and improve terminal facilities, including the conversion of an existing building to an intercity terminal, the expansion of a single-mode terminal, and the renovation of a facility. Carriers requesting assistance must provide service consisting of at least three round trips to the city, town, or place in question. Fa- cilities resulting from the program are designed to be self- sufficient from an operating cost standpoint.
Minnesota
The Office of Transit Administration administers an operating assistance program intended to promote the continuation of bus service to small communities. The subsidy, which covers operating losses, is based on cost-per-mile or cost-per hour rates determined for each project. In FY 1980 the subsidy amounted to approximately $562,000. Under the program, after a period of one or two years the operating assistance will be allocated between the state and local communities served on a two-thirds, one-third basis. Rider- ship or vehicle-mile goals must be met to ensure continuation of the subsidy. Local communities have been reluctant to provide their share after the initial subsidy period.
New York
Intercity carriers who are successful in obtaining local (county) aid are eligible for additional assistance from the New York State DOT. In 1978 approximately 25 intercity bus companies received assistance. The supplemental state assistance was granted based on the formula of 1.4 cents per passenger plus 9 cents per vehicle mile (6 cents per vehicle kilometer). In FY 1980, inter- city bus companies received $1.9 million, and it is estimated that the carriers will receive $4 million in FY 1981. Intercity bus companies are eligible for section 18 funds. It has been suggested that intercity carriers be exempted from local sponsorship, slnce many regular routes cross several counties in one run.
19
P•nnsylvania
The Pennsylvania•DOT administers an intercity bus assistance program, with maintenance of existing routes and levels of ser- vice as its main priority. To date, only operating assistance has been provided. In FY 1980, $527,000 of state money were allocated to 16 purchase-of-service contracts, which amounted to two-thirds of the operating deficits. Certain capital im- provement projects are also eligible for funding on a 50% state 50% carrier basis. A total of $900,000 has been budgeted for intercity bus assistance for the current fiscal year. If local financial support can be obtained, projects are eligible for Section 18 funds.
.Oregon
In 1977 the Oregon legislature defeated a bill to subsidize intercity bus carriers. Accordingly, the Oregon DOT shifted its focus from the carrier to the passenger. In order to encourage and facilitate bus usage, an $80,000-program was approved in 1978 for constructing six shelters, placing informational signs on highways directing motorists to the stops, instituting a rural bus service demonstration, publishing and distributing a trip guide, and planning a new multimodal terminal in Portland. Thus, subsidy to the industry is handled through a program aimed at increasing ridership.
North Dakota
North Dakota is subsidizing the intercity bus industry with Section 18 funds administered by the State Highway Department. Two projects are under way or planned• one to provide capital assist- ance and one to provide operating assistance.
Alaska
The Alaska DOT is commi•edto utilizing Section 18 funds for intercity bus carriers. State involvement to date has been in capital funding for the purchase of equipment for one route.
Washington The Washington State DOT accepts applications from intercity
bus carriers for operating or capital assistance under Section 18.
2O

The state requires that new services funded under Section 18 cannot cross more than three counties and must provide at least two round trips daily, and that equipment purchased can be used only on routes subsidized by such funds.
West Vir$inia
The West Virginia Trip Remunerative Incentive Program (TRIP), administered through the Department of Welfare, is a user-side subsidy program for which the intercity bus is an eligible mode. Discounted tickets, which can be redeemed at full value as fare payment on several modes of transportation including intercity buses, are provided to low-mobility groups. Part of the Section 18 monies have been allocated to TRIP. West Virginia is also con- sidering applications from intercity carriers for Section 18 monies.
S.um•..a,,ry of States' Assistan, ce P.rograms
The technical memorandum prepared for National Cooperative Highway Research Program Project 8-25 presents an excellent summary of the assistance programs just described. (21) The major points in that summary are listed below.
i. There is a strong and growing interest at the state level in developing financial and technical programs to support the operation of intercity bus service to small urban and rural areas.
2. State programs range from promotional assistance to operating subsidy programs to operating and capital cost subsidy programs.
3. Most of the state programs are in their early stages of development, with highway or transporta- tion departments generally still trying to get their programs funded and implemented. As a consequence, very little analysis of the programs has been undertaken.
4. Most programs are focusing on maintaining service on exmsting routes, particularly those subject to abandonment, and on implementing limited service improvements in corridors that appear to be under- served.
5. States have frequently relied on the carriers to propose routes that should be subsidized, and then have applied a set of qualitative criteria in evaluating proposals.
2!

6. Large-scale travel surveys or patronage forecasting analyses have not been undertaken, nor does there appear to be a strong interest in developing and applying such procedures. Readily available data have been used to evaluate routes for inclusion in subsidy programs.
7. Most subsidized carriers are required to submit regular progress reports to enable the state to monitor and •mprove the subsidy•program.
8. Most assistance programs utilize state funds; however, several states are attempting to use Section 18 funds.
9. The state transportation agencies are coordinating their programs with the state regulatory agencies, and no serious problems have developed.
i0. There are notable differences in eligibility require- ments and selection criteria among the state programs.
VIRGINIA i mm N•RCITY BUS INDUSTRY
This section of the report summarizes available information on Virginia's regulation of the intercity bus industry; the state fees and taxes imposed on the industry; the characteristics of the industry, including fleet size and average age, stability, routes, level of servioe, ridership, and terminals; and financial condi- tions.
Definition of the int.ercit.[ Bus Ind..u..s.tr • in Virginia
For purposes of this study, the companies comprising the intercity bus industry in Virginia have been selected according to a regulatory definition. State law requires that any common carrier by motor vehicle engaging in intrastate operation on any highway within the state must obtain a certificate of public convenience and necessity from the SCC. Anyone or any company providing passenger service to the general public for compensation over regular or irregular routes is certified as a common carrier of passengers by motor vehicle. This category of certificate in- cludes certain taxi operations, airport limousine services, and certain urban transit operations. If companies providing these three services are deleted, the resul•ant list of carriers thus certified comprises the intercity bus industry in Virginia as discussed in this report. This list is shown in Table I.
22

Table i
Virginia's Intercity Bus Industry
Company Chart er I CC Certificate (Va.) Certificate
Abbott Bus Lines
Allen, C. J.
Appalachian Coach Co.
Atlantic Greyhound Lines
Bon Air Transit Co.
Bristol-Jenkins Bus Lines
Carolina Coach Co. (a)
Cavalier Transportation Co.
Chesapeake & Northern Trans. Corp. Colonial Transit Co.
(a) Dominion Trailways D & M Bus Co.
Intercity Bus Lines
James River Bus Lines
McCrickard Bus Line
Mechanicsville Bus Line (b)
Newton Bus Service
Nooney Bus Lines (c) Payne Bus Service
Quick-Livick Inc.
Safety Transit Lines
Scottsville Bus Lines
Tara Lines (a) Trailways Tennessee Lines
(c) Twin State Coach Lines
Virginia Dare Trans. Co. (a) Virginia Stage Lines
Winn Bus Lines
X X
X
X X
X X
X
X X
X
X X
X
X X
X X
X
X X
X X
(a) Member, National Trailways Bus System (b)IcC Charter authority through another company (C) Currently providing charter services only in Virginia
23
Urban-Suburban Bus Line
X
X
X
X
X

All the carriers listed should provide some regular fixed-route, scheduled service between towns or cities in Virginia; however, two carriers, Payne and Twin State, are providing only charter service.
Most of the carriers also possess a charter certificate from the SCC, and many have a certificate from the ICC. It is noted that many companies holding only a charter certificate from the SCC were not included in this study. Also, several of the carriers qualified for the common carrier of passengers' certificate as an urban-suburban bus line, which is defined in Section 56-281 of the Code of Virginia as a bus line the majority of whose passengers use the bus for traveling a distance of not greater than 40 miles (64 km) daily one-way between their homes and their places of work, shopping areas, or schools. Companies with this status have certain benefits which are discussed later in the report. Finally, 4 carriers are members of the National Trailways Bus System. Virginia Stage and Trailways Tennes°see are both subsidiaries of Trailways, Incorporated, whereas Dominion and Carolina Coach are independent members.
Section 56-274 of the Code of Virginia describes several types of passenger transportation operations which do not require SCC certification and which, therefore, are not considered in this report. Recognition of these excluded operations is important be- cause they often compete with the carriers being considered. The following briefly describes these operations.
Transportation of school children and teachers.
2. Transportation of hotel patronage to and from local common carrier stations when the vehicles are owned or operated by or on behalf of the hotel.
3. Transportation of bona fide employees directly to and from the factories, plants, offices or other places of like nature where they are employed.
4. Transportation of not more than 15 passengers in addition to the driv•r•• if engaged in a sharemthe- ride undertaking and sharing not more than the expenses of operation of the vehicle, such expenses to include regular payments toward a capital re-
covery fund or used to pay for leasing the vehicle.
5. Transportation of nassengers within the corporate limits of incorpo•ated cities or towns, and within the boundaries of such cities or towns and adjacent counties, where the vehicles are being operated by such county or pursuant to a contract with the board of supervisors of such county.
2 4

6. Transportation of passengers by vehicles under exclusive regulatory control of a transportation district commission.
7. Transportation provided by minibuses controlled and operated by a bona fide nonprofit corporation or a tax-exempt organization to elderly, handi- capped, or disadvantaged members of the community served by such organization or to members of such organization, provided that such minibuses are not operated over the same or an adjacent route and on
a similar schedule as a holder of a certificate of public convenience and necessity or as a public transportation authority.
Resulation of the Intercity Bus Industry..b.y the State of Vir$inii
As indicated previously, the intercity bus industry in Vir- ginia, with certain exceptions, consists of those companies cer- tified by the SCC as common carriers of passengers by motor vehicle. Accordingly, all carriers within the scope of this study are regu- lated by the SCC, which receives this authority from Chapter 12, entitled "Motor Vehicle Carriers Generally"; Title 56, entitled "Public Service Companies", of the Code of Virginia. Many of the bus companies provide service outside the state and are, therefore, also regulated by the ICC, the U. S. DOT, and the EPA as previously described.
•qles and R,9$ulations Following is a summary of the major regulations described in
the aforementioned section of the code.
Entry Control
Entry to the intercity bus market is obviously controlled by the necessity of obtaining a certificate of public convenience and necessity from the SCC. In determining whether a certificate shall be granted, the Commission may, •among other things, consider the present transportation facilities over the proposed route, the volume of traffic over the proposed route, the financial condition of the applicant, and the condition of the highway over the pro- posed route. If an existing carrier holds a certificate for the proposed route, the applicant must prove that existing service is inadequate to the requirements of public necessity and convenience.
25

Further, the existing certificate holder must be given reasonable time and opportunity to remedy the inadequacies before a new cer- tificate is issued. There are no formal guidelines for determining what constitutes adequate service; each application is evaluated in light of its own circumstances. The transportation of passen- gers by an urban-suburban bus line is not judged to be an operation over the route of a certified carrier and ms, therefore, not sub- ject to the requirements regarding the adequacy of existing ser- vice.
Most of the intercity carriers also have charter certificates from the SCC. In reviewing an application for a charter certifi- cate, the Commission must consider the character of the applicant, the kind and location of the equipment the applicant proposes to use, and the current availability of charter transportation. The Commission should place restrictions on such certificates as may be reasonably necessary to protect any existing motor carriers, including those certified as ccmmon carriers of passengers; i.e., those providing regular-route service. On the other hand, the Commission cannot deny a certificate solely on the ground that the applicant may render charter service originating at the same point or points as service by another carrier. The above provides the only regulatory link between regular-route and charter ser- vices, and indicate clearly that regular-route service is not a prerequisite to charter service. In fact, many companies in Vir- ginia have charter certificates on!y.
Exit Control
Fixed-route service cannot be abandoned without permission of the SCC and on such terms as the SCC may prescribe. Likewise, certificates cannot be sold, transferred, or leased to another carrier unless authorized by the Commission. The SCC usually approves requests for abandonments, unless objections are received from the public. Generally,if a company applies for abandonment of part of its certified services, and objections are received, then the Commission tries to •rb•trate compromises to the point of requiring services. On the other hand, if a carrier proposes to abandon all certified services, then the SCC does not force the carrier to maintain an unprofitable operation.
Fares
Fares and rates charged for passenger and property transporta- tion by common carriers must be approved by the Commission. In exercising this power to prescribe just and reasonable rates, the Commission must consider, among other factors, the inherent ad- vantages of such transportation, the effect of rates upon the
26

movement of traffic, the public's need for adequate and efficient transportation service at the lowest cost consistent with the furnishing of such service, and the need for sufficient revenues to enable the carriers under honest, economical, and efficient management to provide such service. Current fare schedules must be filed with the SCC and posted for public inspection. It
.•is the Commission's opinion that the market will generally govern the fares; that is, carriers must set fares in view of the demand and the competition. Accordingly, unless complaints are received, the SCC usually approves requests for fare and rate changes.
Schedules
Changes in schedules or services cannot be made without ap- proval of the SCC. Again, the Commission normally accepts such changes unless objections or complaints are received. Copies of the current schedule must be filed with the SCC, posted in a conspicuous place for public inspection at each station or ticket agency, and kept by each operator or driver. A provision in the code does allow occasional'deviations from authorized routes if approved by the Commission.
Miscellaneous
The following miscellaneous regulations are imposed by the SCC.
I. Each carrier must file and keep current evidence of liability and property damage insurance, or surety bond or other guarantee of responsibility, covering each motor vehicle.
2. The Commission may authorize the transportation of passengers and property in the same vehicle, including passenger baggage, newspapers, and express parcels weighing not more th•n $00 pounds (45 kg). The authorization is granted if so requested in the application for a certificate.
3. Each vehicle used by the common carrier must be registered with the SCC through the annual procure- ment of a warrant, which is carried in the vehicle, and a decal or sticker, which is displayed on the vehicle.
4. Every common carrier must establish reasonable through routes with other carriers along with the necessary joint operations pertaining to fares, ticketing, baggage handling, etc. This regulation has been applied only where practical.
27

5. Every motor vehicle should be maintained in a safe, comfortable, and sanitary condition at all times, and be subject to inspection by the Commission or duly authorized representatives. Specific rules include requirements as to drivers, fueling, stowing baggage, interior lighting, standees, aisle seats, emergency exits, first-aid kits, fire extinguishers, and smoking. Waiting rooms, rest rooms, and other public facilities must be kept in good and sanitary condition.
6. Every common carrier should display its name on both sides of its vehicles used for transporting passengers, such name to be readily legible from a distance of 50 feet (15 m).
R.e.•ulatory Environment in Virginia
Problems and concerns with the existing regulations in Virginia have been determined through discussions with carrier and SCC officials. A key issue is that over th• last several years, amendments to Section 56-27• of the Code have partially or totally exempted more and more transportation operations from regulatory control. The SCC views these amendments as a gradual erosion of the state's regulatory control, which results in the situation whereby the SCC simply can no longer control the inter- city bus market and competition to the existing certified car- riers. For example, relatively recent amendments which exempt vehicles operated by transportation districts, by share-the-ride undertakings, by county-sponsored transportation, and by employee haulers are indeed creating significant amounts of competitive transportation services.
Carrier officials echo the SCC coneerns plus point out that
many of these competitors are receiving government subsidies. Examples include services provided by transportation districts; services provided to the elderly, handicapped, and other special groups by private, nonprofit organizations; and services to sub- urban residents provided by urban transit companies. Many of these operations are potential market areas for the intercity carriers, and in some instances actually derive ridership from existing intercity carrier markers. On the other hand, carriers have often opted not to pursue these potential markets, and government subsi- dized operations have been forced into the market.
Several company officials stated that regular-route service is maintained in order to retain lucrative charter rights. As the authors indicated previously, however, there is no connection
28

between the two services in the state regulations, and recent rulings by the ICC have essentially decoupled regular-route and charter authority for interstate operations. Apparently, the carriers are simply unaware of this situation.
Another concern expressed by several carrier officials was that the SCC overreacts to complaints, and, in fact, frequently bases decisions on the concerns of very few. This view contrasts with the SCC feeling that it is very lenient and generally "regu- lates" only when complaints are received from the public.
Other problems or complaints mentioned by the carriers are summarized below.
i. Unregulated "gypsy" operations hurt business and threaten the industry's image due to the lower quality of service. (It is speculated that this concern related mostly to charter operations.)
2. Some carriers are not complying with state regu- lations regarding company identification on their vehicles.
3. Regulation among the states,as well as regulation between the state and the federal government, is inconsistent.
4. Vehicles titled in Virginia must be inspected in this state; inspections in other states are not accepted.
5. Keeping track of warrant cards is difficult. A computer system such as used by police for license tag identification could be employed.
6. Both the SCC and !CC grant charter rights too frequently. This is especially detrimental to common carriers who cross-subsidize regular route service with revenue from charter service.
Another consideration regarding regulation in Virginia is SCC and carrier feelings on the proposed regulatory reform at the federal level. Again, discussions with carrier and SCC officials form the basis for this information.
As indicated in the earlier discussion on the rules and regu- lations, there appears to be minimal regulation of the intercity bus industry by the SCC, which implies that the Commission does
29

not oppose deregulation. On the other hand, the SCC is very much concerned with the public's welfare, which is indicated by its concern over the increased exemptions in Section 56-274 and by the fact that consideration is given to individual complaints. Therefore, it is speculated that the SCC will, in fact, be most concerned, especially with respect to concurrent or subsequent state deregulation. Also, it is noted that the SCC's tax col- lection efforts will greatly increase with an influx of operators. In the extreme case of carriers no longer being required to even register, then the entire tax collection procedures may need modification.
Opinions from Virginia intercity carrier officials as to the effects of the proposed national deregulation ranged from an "en- hancement of service quality" to "no effect" to "would go out of business". Generally, most were not opposed to deregulation; how- ever, there was a concern that many unqualified operators with inadequate equipment would begin operation, which could potentially result in a bad image for the industry. It was noted that the small companies would be hurt most by an influx of carriers. Large companies, on the other hand, would compete for profitable routes. The need for maintaining •he existing safety regulations was rec- ognized. Other specific comments included the fact that paperwork should decrease and that companies may have trouble securing loans due to the uncertainty of the industry. Finally, one official noted that increased competition for charter business may lead to the abandonment of unprofitable regular-route service. In other •words, decreased revenues from charter business would no longer allow the subsidy of regular-route service.
In view of the earlier discussion relating carriers' concerns and problems with existing regulations, especially the coupling of charter and regular-route authority, it is surprising that only one carrier noted that regular routes may be abandoned. As will be shown later in the financial analysis; however, much of the regular-route service will be subject to abandonment.
Fees and Taxes !m osed on the Intercity Bus Industry
In addition to regulations, the state imposes fees and taxes on the industry, and following is a list of the fees and taxes naid BY carriers. An earlier report analyzed these in more de- tail,- •3) and concluded that the taxes represent a r•!atively• small portion of the companies' variable costs. Hence, relief from these taxes and fees would not likely forestall demand- occasioned trends in service reductions.
3O

Fuel Tax
The fuel tax of $0.Ii per gallon ($0.03 per liter) levied by the Commonwealth and collected by the Division of Motor Ve- hicles (DMV) is paid by the carriers; however, these taxes are refunded, upon request, for regular-route operations.
Sales and Use Tax
A 2% sales tax on vehicle purchases is paid by the carriers to the DMV. Vehicles having seats for more than 7 passengers which are sold or leased to urban-suburban bus lines are exempt from this tax.
Motor Veh.icle Ti,t.,.!ing.,F.e e
Carriers pay a fee of $7 to the DMV to record and issue an original certificate of title for each of their vehicles.
Motor Vehicle License Fee
An annual registration and licensing fee based on vehicle weight is paid by the carriers to the DMV for each vehicle. Vir- ginla is a member of the International Registration Plan (IRP) which governs the distribution of registration fee receipts for interstate carriers among 23 member states. These receipts are prorated based on the proportion of the vehicle's total annual mileage accumulated in each state. For example, if a carrier registered in North Carolina accumulated 60% of its annual mileage in Virginia, then Virginia would receive 60% of the registration fee. Buses registered in non-IRP states pay no Virginia fees, regardless of the amount of travel on Virginia highways.
Rolling Stock Tax
Each carrier is required to pay annually to the SCC a tax of 1% of the assessed full value of its total rolling stock. This tax is in lieu of local property taxes and is distributed back to localities in which the carrier operates based on the proportion of bus miles traveled in each locality. Interstate carriers pay a reduced tax based on the percentage of total miles traveled in Virginia.
31

Special Revenue Tax
A special tax of 0.2% of the gross receipts earned on operations wholly within the state is paid annually by the carriers to the SCC. Urban-suburban bus lines are exempt from this tax.
State Franchise Tax
Carriers organized as corporations must pay an annual cor- poration franchise tax based on their authorized maximum capital stock.
Income Tax
Motor carriers are liable for state income taxes and must apportion their net income to this state by the ratio of intra- state bus miles to total bus miles.
Filing Fees
Every applicant for a certificate or transfer of a certificate of public convenience and necessity must pay a filing fee of $50 to the SCC.
Each vehicle used by the common carrier must be registered annually with the SCC at a filing fee of $i.
Characteristics of the Interci•y Bus Industry in Virginia
To the extent that data were available, the research team developed information on the intercity bus industry in Virginia. This section presents that information.
Fleet Size and Avera•> A@>
Table 2 presents fleet data contained in the SCC's rolling stock tax records. Data for Greyhound Lines and the three large Trai!ways companies in Virginia are not included; however, other sources indicate that the average age of the vehicles ame 5.7 and 6.0 years, respectively. The fleet reported to the SCC is used for both regular-route and charter service.
32


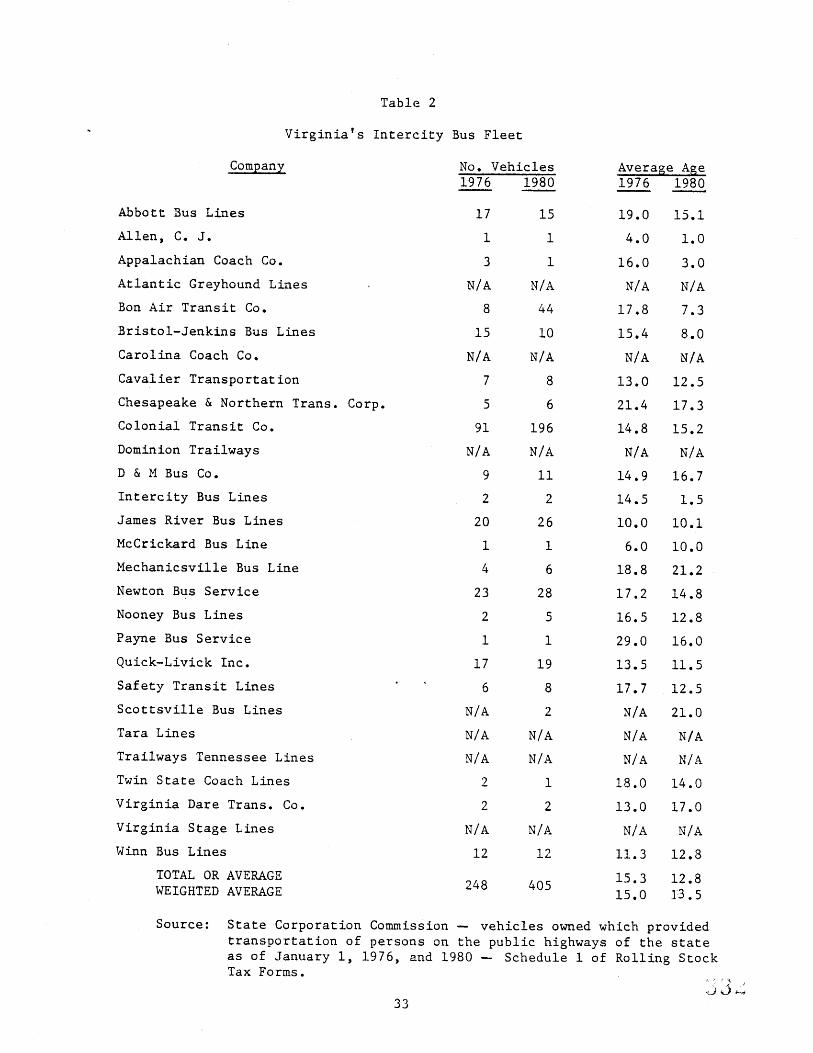
Table 2
Virginia's Intercity Bus Fleet
Company No. Vehicles Average Age 1976 1980 1976 1980
17 15 19.0 15.1
1 1 4.0 1.0
3 1 16.0 3.0
N/A N/A N/A N/A
8 44 17.8 7.3
15 I0 15.4 8.0
N/A N/A N/A N/A 7 8 13.0 12.5
5 6 21.4 17.3
91 196 14.8 15.2
N/A N/A N/A N/A 9 ii 14.9 16.7
2 2 14.5 1.5
20 26 I0.0 i0.i
i i 6.0 I0.0
4 6 18.8 21.2
23 28 17.2 14.8
2 5 16.5 12.8
I i 29.0 16.0
17 19 13.5 11.5
6 8 17.7 12.5
N/A 2 N/A 21.0
N/A N/A N/A N/A N/A N/A N/A N/A
2 I 18.0 14.0
2 2 13.0 17.0
N/A N/A N/A N/A
12 12 11.3 12.8
15.3 12.8 248 405 15.0 I•3.5
Abbott Bus Lines
Allen, C. J.
Appalachian Coach Co.
Atlantic Greyhound Lines
Bon Air Transit Co.
Bristol-Jenkins Bus Lines
Carolina Coach Co.
Cavalier Transportat ion
Chesapeake & Northern Trans. Corp. Colonial Transit Co.
Dominion Trailways D & M Bus Co.
Intercity Bus Lines
James River Bus Lines
McCrickard Bus Line
Mechanicsville Bus Line
Newton Bus Service
Nooney Bus Lines
Payne Bus Service
Quick-Livick Inc.
Safety Transit Lines
Scottsville Bus Lines
Tara Lines
Trailways Tennessee Lines
Twin State Coach Lines
Virginia Dare Trans. Co.
Virginia Stage Lines
Winn Bus Lines
TOTAL OR AVERAGE WEIGHTED AVERAGE
Source: State Corporation Commission vehicles owned which provided transportation of persons on the public highways of the state as of January i, 1976, and 1980 Schedule 1 of Rolling Stock Tax Forms.
33

As of January i, 1980, the small intercity bus carriers in Virginia, with the exception of two small new companies (Dominion Trai!ways and Tara Lines), maintained a fleet of 405 vehicles for both regular-route and charter service. The fleet size had increased by 157 vehicles since 1976, with only four companies reporting a decrease in fleet. The aver-
age fleet contained vehicles with an average age of 12.3 years, a decrease of 3.0 years from the 1976 average age. It is noted that three companies Bristol-Jenkins, Appalachian Coach, and Intercity Bus had had large decreases in the average age of their fleets since 1976 due to a significant changeover to vans. The weighted average, or average age of a vehicle in the state- wide fleet, had decreased slightly from 15.0 to 13.5 years.
The significant increase in fleet size of the small carriers is indicative of prosperity and growth; however, as presented elsewhere, this increase was due to a demand for charter service, not regular-route service. Since the average age of the fleets declined very little between 1976 and 1980, it is obvious that second-hand equipment made up the majority of the recent pur- chases, and that the average age was still significantly above the recommended maximum of 7.5 years. The Greyhound and Trailways vehicles were much newer and more in line with acceptable stand- ards.
Service and 0peratin• Cha.racteristics As listed previously in Table i, there are 26 certified common
carriers providing the state with scheduled intercity passenger service. This does not include the two companies which currently provide only charter service. Statistics presented later in this section show the domination of Greyhound and Trailways in the market. Twenty-five of these 28 carriers were in existence in 1975; however, the industry has not been particularly stable since then. Since 1975, a total of 3 carriers have entered the Virginia market, whereas i0 have cancelled their certificates. Many of the companies which abandoned regular-route service were either ab- sorbed or forced out by expanding urban-area transit systems.
Routes
Figures i through 4 depict the routes traveled by the 26 car- riers providing scheduled services in the state. The first three figures show the routes and majority of places served by Greyhound, the National Trai!ways Bus System, and the remaining independent carriers, respectively. The routes from the first three figures are combined in Figure 4 to depict the statewide coverage.
34

It is speculative at best to review a coverage map and recommend service improvements without a detailed passenger- demand analysis, which is beyond the scope of this study. The Department of Highways and Transportation has developed a net- work of interstate and arterial highways that is intended to provide high-speed, safe travel between major points in Vir- ginia. To the extent that this network represents significant travel-demand corridors, the intercity bus route network can be compared with these corridors for an estimate of the adequacy of coverage of intercity bus service. Table 3 lists those corri- dors of the .interstate and arterial highway network in which intercity buses do not operate, as well as their lengths and the range of average daily traffic found on links along the corridor. This table suggests that 290 miles (467 km) of unserved corridors, or 10% of the interstate and arterial network, represent a minimum need for service expansion; however, there are many other factors to consider before recommending bus service in any of these corri- dors. For example, employee haulers or other exempted carriers may already operate in a corridor. Other high demand corridors not included in the interstate and arterial network may also warrant bus service.
Table 3
Corridors in the Interstate and Arterial Network Not Served by Intercity Bus
(a) Corridor Via Route Mileage 1979 ADT Range
Winchester W. Virginia Line 522 Claypool Hill Kentucky Line 460 Crewe-Blackstone 460 Reedviile Warsaw 360 Ruckersville Harrisonburg 3.3 New Market Warrenton 211 Front Royal Strasburg (1-81) 1-66 Opai Fredericksburg 1"7 Dahlgren Carmel Church (1-95) 301/207
25 2,900- 9,100 46 2,650-13,400 i0 2,700 34 2,050- 4,950 40 2,800- 9,450 58 2,200- 8,900 i0 3,500 26 5,250- 6,600 41 4,200- 8,000
(a) From Average Dai.ly Traffic Volumes on Interstate Arteri•! and.•rimary Roads, Virginia Department of Highways and Transportation, 1979.
Note: i mile 1.61 kilometers.
39

Forty of the 41 independent Virginia cities have scheduled service. The exception is the city of Poquoson, which receives no direct service; however, the nearby cities of Hampton and Newport News are well served. Likewise, 131 (70%) of the 187 towns receive at least some service, and many of the census- designated places are also located on bus routes.
According to records at the main office of the American Bus Association, 420 points in Virginia were receiving intercity bus service in 1980. The number of points served had decreased by 24% from 550 in 1968. These statistics were taken from Russell's Official National Motor Coach Guide, which does not contain information from all carriers in virginia; however, the numbers are indicative of the trend of decreasing service seen nationwide.
From records at the SCC, mileage tables showing distances between points of service, and, in a few cases, estimates derived from scaling distances from a map, data on miles of highway served were developed. These statistics are given in Table 4. Approxi- mately 5,000 miles (8,050 km) of Virginia highway are served by the intercity bus industry, with Greyhound and Trailways providing 63% of the mileage. This compares with the approximately 8,800 miles (14,168 km) in the interstate and primary highway systems.
A review of data from the SCC indicates that relatively few routes have been dropped by the existing small carriers since 19'75. The Appalachian Coach Company abandoned a Galax to Boone, N.C. run; Scottsvi!le Bus Lines dropped its Scottsville to Farm- vi!le service; the intercity Bus Line quit operating its Roanoke to Lynchburg to Lexington run; the Chesapeake and Northern Trans- portation Company discontinued its Virginia Beach to Norfolk ser- vice; and the D & M Bus Company cancelled its service between Lynchburg and Durham, N.C. On the other hand, two companies added routes Quick-Livick added the Waynesboro to Front Royal service while Bon Air Transit initiated the Ashland to Richmond service.
Table 4
Miles of Virginia Highway Served
C omp any
Greyhound National Trailways Bus System (NTBS) Remaining carriers
TOTAL
Duplicated by Greyhound and NTBS
Net miles of highway served
Note: I mile 1.61 kilometer
4O
Miles Served
2,150 1,660 i•850 5,660 -650
5,010

Most company officials indicate that their regular-route service is unprofitable and cite several reasons why the service is maintained. As a common carrier of passengers, the companies pay a rolling stock tax to the SCC in lieu of local property taxes, which are typically much higher. Also, urban-suburban lines are exempt from certain taxes. Many routes are not discontinued be- cause of state and federal regulations; that is, either the SCC does not allow abandonment or charter rights may be lost. Some services are kept as feeder routes to maln-line routes, or to simply keep competitors from running the service. Finally, several carriers continue service because they feel an obligation to their transit-dependent riders.
Levels of Service
Whereas miles of highway served and points and places served are important considerations, schedules and bus miles traveled are more important indicators of the degree or level of service being provided. Table 5 presents a brief outline of the service and schedule of the small carriers, and detailed descriptions are included in the Appendix. Schedules for the three large Trailways carriers and Greyhound are not included, because they are more readily available than those of the small carriers and because they are prone to frequent revision. Six carriers operate ex- clusively in the relatively-short-distance-work trip (commuting) market, 13 provide more traditional intercity service, and 2 provide some of both types of service. Much of the intercity service is very !imited. It is noted from the schedules in the Appendix that several of the small carriers interline with Trail- ways and Greyhound.
The most current statistics for bus miles of travel are summarized in Table 6. Of the 28 million scheduled bus miles (45 million km) traveled in Virginia, the National Trailways Bus Sys- tem provided approximately 36%, Greyhound approximately 50%, and the small carriers approximatgly.14%. If the 2.9 million bus miles (4.7 million km) traveled by the six companies providing strictly commuter service is subtracted, then Greyhound and Trail- ways provide approximately 96% of the traditional intercity service. It is interesting to compare the 28 million bus miles (45 million km) traveled annually to the average of 58.5 million vehicle miles (94.2 million km) traveled daily by all modes on the interstate and primary highway systems in Virginia in 1979.
41

Carrier Type of Service
Abbott Intercity Allen, C.J. Unknown Appalachian Intercity Bon Air Commuter
Bristol-Jenkins Intercity
Cavalier Intercity Chesapeake &
Northern Commuter Colonial commuter
Dominion Intercity D & M Interclty
Intercity Bus Intercity
James River Intercity
Table 5
Service Provided by Small Carriers
Termini Schedule
Roanoke-New Castle Rte. 882/703-Martinsville Roanoke-Galax Bon Air-Richmond Ashland-Richmond Routes cover Abingdon, Bristol,
Norton, and surrounding areas
Hartfield-Richmond
2 trips every Tuesday Unknown 2 trips daily Various trips M-F Various trips M-F Various trips M-F
trip M,W,F
Portsmouth-Newport News Fredericksburg-D.C. Corridor & to Dahigren Bristol-Biuefield Danville-Durham, N.C. Danville-Martinsville Roanoke-Martinsville Roanoke-Covlngton Richmond-Lawrenceville Richmond-lrvington Richmond-Buckingham Rte. 844/41-Danville Richmond-Mechanicsville Mathews/Gloucester-Newport News
2 trips M-F Various trips M-F
McCrickard Commuter Mechanicsville Commuter Newton Commuter Nooney Intercity Quick-Livick Intercity Staunton-Charles Town,W.Va. i trip every Mon.
Waynesboro-Front Royal I trip M-F Safety Intercity Martinsville-Greensboro, N.C. i trip M-F
Commuter Danville-Eden, N.C. 2 trips M-F Scottsville Intercity Fork Union-Charlottesville i trip weekends Tara Intercity Winchester-D.C. Various trips daily
Commuter Rte. 610/612-D.C. Various trips M-F Virginia Dare Intercity Norfolk-Manteo, N.C. 3 trips daily Winn Intercity Richmond-Charlottesville i trip M-F
I trip daily 2 trips daily 3 trips M-Sat. i trip M-Sat. 2 trips M-Sat. Various trips daily i trip M-F I trip M-F 3 trips M-F Various trips M-Sat. 8 trips M-F
Lawrenceville-Roanoke Rapids,N.C. i trip every Sat.
Complete statistics on charter-bus miles are not available; however, it is obvious from the given data that charter mileage is a significant part of the companies' business. Of the small companies for which the information is known, only Colonial Transit, Virginia Dare, and C. J. Allen operate more scheduled-bus miles than charter-bus miles. In most instances the charter mileage is many times greater than the regular-route mileage. On the other hand, charter mileage for the four large companies ranges from 9% to 18% of the carriers' total mileage.
Comprehensive trend data are not available, as historical bus miles of travel are incomplete or unreliable. A review of the data, however, indicates a general pattern of declining regular- route mileage coupled with increasing charter mileage since 1975. Thus, while some routes have been abandoned, most carriers are responding to declining demands by reducing service.
42

Table 6
Bus Miles Traveled in 1979 by the Virginia Intercity Bus Industry
Company
Abbott Bus Lines
Allen, C. J.
Appalachian Coach Co. (a)
Atlantic Greyhound Lines
Bon Air Transit Co.
Bristol-Jenkins Bus Lines
Carolina Coach Co. (a)
Cavalier Transportation Co.
Chesapeake & Northern Trans. Corp. Colonial Transit Co.
Dominion Trailways D & M Bus Co.
Intercity Bus Lines
James River Bus Lines
McCrickard Bus Line
Mechanicsville Bus Line
Newton Bus Service
Nooney Bus Lines
Payne Bus Service
Quick-Livick Inc.
Safety Transit Lines
Scottsville Bus Lines
Tara Lines (a) Trailways Tennessee Lines
Twin State Coach Lines
Virginia Dare Trans. Co.
Virginia Stage Lines (a)
Winn Bus Lines
TOTAL
Regular-Route Regular-Route Charter/Special Mileage-Va. Mileage-Total Services Mileage
6,240 6,240 530,400 15,000 15,000 0
122,640 122,640 Unk.
13,812,467 382,979,849 (b) 52,860,473 75,150 75,150 Unk.
196,610 229,671 Unk.
3,498,699 11,507,268 2,465,820 23,584 23,584 300,258 74,796 74,796 Unk.
2,338,215 (c) 2,380,215 565,614 NOT-IN-BUSINESS-IN-1979
139,280 (c) 209,360 220,672 104,529 104,529 Unk.
221,916 221,916 987,758 40,000 40,000 0
50,931 50,931 Unk.
292,000 292,000 Unk.
2,080 (c) 3,536 (c) 35,290 0 0 Unk.
62,658 63,918 908,765 23,000 (c) 73,060 221,521 2,516 2,516 Unk.
NOT-IN-BUSINESS-IN-1979
656,967 7,408,061 1,205,135 960 3,840 Unk.
50,232 239,667 0
5,975,031 6,091,858 594,967 I00•696 100,696 429,467
27,886,198
(a) 1980 mileages (b) Mileage as reported by Greyhound Lines nationwide (c) Estimate based on schedule and route miles
Source: Interstate Commerce Commission and State Corporation Commission
43
Note: 1 mile 1.61 kilometers

Ridership
Ridership as reported by several of the small carriers is given in Table 7, and the importance of charter business for most companies is again noted. In the worst case situation in which all regular-route service is abandoned by the shown com- panies, a minimum of approximately i million annual passenger trips will no longer be provided. The number of persons affected will be considerably less, especially since the 900,000 passenger trips provided by Colonial Transit are for commuting; that is, one person may make i0 co•uting trips per week.
Carrier officials were &sked in the telephone calls about the trendin regular-route and charter ridership since 1976. Of the 17 small companies responding, 9 reported a decreasing regular- route ridership, 6 reported an increasing ridership, and 2 reported ridership to be about the same. Four of the 7 companies providing commuter services reported an increase in ridership, whereas only 3 of the 12 carriers providing traditional intercity service re- ported an increase. Thus, the overall trend has been one of de- clining regular-route ridership, with the carriers providing tra- ditional intercity service being more susceptible to this trend than those providing commuter services. On the other hand, 14 of 16 responding carriers reported an increase in charter rider- ship over the same period.
The most recent ridership statistics for the 4 large companies operating in Virginia are presented in Table 8. The number •of charter passengers ranges from 4% to 16% of total ridership, which significantly contrasts with the ridership characteristics of the small carriers. Passenger mile, average load, and average trip length statistics are provided for informational purposes; how- ever, no Comparable data are available for the small companies. It is reasonable to assume that the ridership trends discussed earlier in the report for the Class I carriers are applicable to these 4 carriers.
Table 7
1979 Passenger Statistics for Selected Small Carriers
Company Regular-Route Charter Passengers Passengers
Cavalier 1,115 218,225 Colonial 904,550 155,820 D & M 57,821 31,052 James River 38,739 68,542 Quick-Livick 2,997 138,990 Safety 10,137 17,000 Virginia Dare 32,715 0 Winn 13,208 40,689
Source: ICC Motor Carrier Annual Report Form MP-2.
44

Table 8
1980 Passenger Statistics for Greyhound and Tra±lways
Greyhound Virginia Carolina Trailways Sta$.e Coach Tennessee
Reg.-Rt. Revenue Pass. Charter Pass. Reg.-Rt. Pass. Miles Reg..-Rt, Pass./Bus
(Avg. Load) Reg. -Rt. Avg. Trip
Length (Miles)
52,326,742 1,139,769 2,450,775 773,811 9,729,774 43,013 210,809 77,921
597,704,311 128,244,765 214,926,178 95,319,657
22.2 21.1 18.7 12.9
162.8 112.5 87.7 123.2
Source: ICC Motor Carrier Annual Report Form MP-I.
Note: i mile 1.61 kilometers.
Bus Stations and Terminals
Very little information is readily available concerning bus stations and terminals in Virginia. Russell's Official National Motor Coach Guide provides a list of stations of the bus lines appearing in the guide in cities with a population of 15,000 or over. Also, telephone books from throughout the state were re- viewed and a further list of stations was compiled. Tables 9 and i0 provide lists of the stations found in these two sources.
Most stations appear to be operated•by Greyhound and Trail- ways, with the smaller companies using them as appropriate. In many cases both Trailways and Greyhound use the same station or have separate terminals in the same building. It was also found that restaurants, diners, service stations, taxi stands, drug stores, and several other miscellaneous retail stores were listed in telephone books as stations or ticket agencies.
Table 9
Bus Depots, Stations, and Terminals in Virginia Cities with a Population of 15,000 or More
Location Name Serves
Alexandria Bluefield Bluefield
Greyhound Bus Station Greyhound Bus Station Trailways, Inc. Depot
Greyhound Lines Greyhound Lines Dominion Trailways Trailways, Inc.
45

Table 9 (cont.)
Location Name Serves
Bristol Bristol Trailways Terminal
Bristol Greyhound Terminal
Charlottesville Charlottesville Bus Center
Danville
Danville
Greyhound Bus Station
Trailways, Inc. Terminal
Fairfax Fort Eustis Fredericksburg
Hampton Harrisonburg Lynchburg Lynchburg Mart insville
Newport News Norfolk
Norfolk Petersburg Petersburg
Portsmouth Portsmouth Richmond
Richmond
Roanoke
Ro ano ke
Springfield Springfield Staunton
Suffolk
Trailways, Inc. Depot Greyhound Terminal Bus Terminal
Dominion Trailways Bristol-Jenkins Bus Lines Trailways, Inc. Bristol-Jenkins Bus Lines Greyhound Lines Winn Bus Lines Trailways, Inc. D & M Bus Company Greyhound Lines Carolina Coach Safety Transit Trailways, Inc. Trailways, Inc. Greyhound Lines Greyhound Lines Trailways, Inc.
Hampton Gre]Thound Bus Terminal Greyhound Lines Greyhound Bus Terminal Greyhound Lines Greyhound Bus Terminal Trailways, Inc. Bus Center Bus Station
Greyhound Terminal Carolina Trailways Terminal
Greyhound Terminal Carolina Trailways Station Greyhound Bus Terminal
Carolina Trailways Station Greyhound Terminal Trailways Bus Terminal, Inc.
Greyhound Terminal
Trailways, Inc. Bus Terminal
Greyhound Bus Terminal
Trailways, Inc. Terminal Greyhound Bus Terminal Greyhound Bus Terminal
Union Bus Depot
Greyhound Lines Trailways, Inc. D & M Bus Company Safety Transit Greyhound Lines Greyhound Lines Va. Dare Transportation Co. Carolina Coach Greyhound Lines Carolina Coach James River Bus Lines Greyhound Lines Carolina Coach Greyhound Lines W±nn Bus Lines Cavalier Transportation Carolina Coach Trailways, Inc. James River Bus Lines Greyhound Lines Appalachian Coach Trailways, Inc. Intercity Bus Lines Greyhound Lines Trailways, Inc. Greyhound Lines Greyhound Lines Trailways, Inc. Carolina Coach Greyhound Lines

Table 9 (cont.)
Location Name Serves
Virginia Beach Carolina Trailways, Agency Virginia Beach Greyhound Agency Washington, D.C. Trailways, Inc. Terminal
Washington, D.C. Greyhound Terminal
Waynesboro Winchester .Woodbridge
Trailways Agency Greyhound Bus Terminal Greyhound Agency
Carolina Coach Greyhound Lines Carolina Coach Trailways, Inc. Colonial Transit Greyhound Lines Trailways, Inc. Greyhound Lines Greyhound Lines
Source: The Official Bus Guide, Part 2, Russell's Guides, Inc., Volume 53, Number 3, December 1980.
Table i0
Cities of Less Than 15,000 Population in Virginia That Have Bus Stations
Greyhound Station Join t G•eyhound/Trailways Station
Keysville South Hill Farmville Lexington South Boston Radford Warsaw (also James River) Marion Wytheville Williamsburg Harrisonburg Lawrenceville (also James River) Covington (also Intercity) Clifton Forge (also Intercity)
Abingdon (also Bristol-Jenkins) Christiansburg Emporia
Bristol-Jenkins Bus Line
Norton
Trailways Station
Aitavista Blacksburg Warrenton Culpeper Bedford Manassas
47

Financial Review
In the private sector, of which the Virginia intercity bus industry is a part, market performance determines the longevity and types of services firms offer. Therefore, to the extent that one can examine market performance indicators, a judgement can be made about the health of an industry and the likelihood of successful performance in the future. Among appropriate performance indicators for the bus industry are revenue and profit levels, historical changes in fares, operating ratios, rate of return on investment, and revenue by type of service provided.(14) Among other indicators of performance are less specific parameters such as entry and exit patterns and internal cross-subsidy patterns.
•tr, y•,E, xi,•,,and Market Stability
In the general sense, a firm's economic stability is measured by longevity whether it continues to operate. Furthermore, a strong market demand is usually accompanied by the entry of new firms into the industry and new capital formation. As was noted above, of the 28 intercity bus firms operating in the state in 1981, 25 were in operation in 1975. However, only three new companies entered between 1975 and 1981 while i0 companies exited the industry during the period. Thus, the industry has not been strong enough to hold its new entrants, nor can it be described as a growing industry. An examination of more specific performance characteristics will help provide an understanding of the lack of growth of the industry.
Gross Receipts a• Market Shares
Because of relatively low .capital requirements, one would expectthat even under SCC regulatory control, entry would be frequent. Low capital requirements, however, are not sufficient to explain exit patterns. The trend of constant dollar gross receipts earned in Virginia operations* for selected bus companies shows, however, that as compared to 1976, 8 of 14 (57%) of those companies for which data were available earned less in 1980. This fact, coupled with operating costs, which have risen more rapidly than the consumer price index for•the same period, (24) suggests that even for well-established companies, profit margins in 1980 were most likely lower than in 1976. In fact, constant dollar earnings were down for Virginia operations by approximately $i million. (See Table ii.)
*Virginia operations reflect only routes with termini in the state.
48

0
0
0

While entering the intercity market may be relatively easy, capturing an increasing share of the market is difficult. Table 12 shows that for those companies registered with the ICC for which complete data were available, between 1976 and 1980 the distribution of transportation revenue was fairly stable. More specifically, only 4 companies gained in market share compared to 1976, while 3 lost a• small portion of the market. The others showed no change. The lack of any significant redistri- bution of market shares can be largely explained by two factors: (i) the overwhelming dominance of the market by Greyhound, Carolina Coach, and Virginia Stage, which together generate about 77% of the revenue; and (2) the fact that the granting of ICC-SCC operating authority effectively establishes a monopoly for the carrier over the routes designated by the regulatory agency.
Table 12
Market Share of Gross Receipts
Company 19 7 6 19 8 0 Percentage Percent age
Greyhound 44.00 49.00 Appalachian I. 00 i. 00 Carolina Coach 8.00 8.00 Trailways Tennessee I. 00 i 00 Virginia Stage 28.00 20.00 Abbott 2.00 i. 00 Allen, C.J. 0.05 0.04 Bristol-Jenkins 0.08 i. 00 Cavalier i. 00 i. 00 D & M 0 2.00 James River 7.00 5.00 Quick-Livick 5.00 7.00 Safety i. 00 i. 00 Winn "2. O0 2. O0
Source: State Corporation Commission
5O

Demand Patterns
Examining gross revenue data alone does not reveal that bus companies provide very specialized types of services and that the size of the company is largely related to the type of service offered. Consider the data on revenue by type of service presented in Table 13. The companies have been stratified by the iCC designations of Class ! carriers, Class !I carriers, and Class !II carriers. Two interesting conclusions can be drawn. First, even when one excludes Greyhound from the analysis, regular- route operations are a prime source of revenue for only the Class ! carriers. Secondly, both Class II and Class I!! carriers depend heavily upon charter and other revenue to remain in operation. Furthermore, with the exception of the Bristol-Jenkins Bus Company, no Class !I or Class III carrier earned as much as 50% of its revenue from regular-route operations. The average earned for such companies was 18.9% of the total revenue. Obviously, the Class !I and Class Iii carriers are not supplying regular-route service as a primary output in Virginia, even though three of the independent carriers generate more than 25% of revenue from regular routes. In fact, such service is of little importance to them, largely because demand is too low.
Table 13
Distribution of Revenue by Type of Service
(a) Regular-Route, Class I Percent
Trailways Tennessee Virginia Stage Carolina Coach
(b) Class II
Charter/Special/Package, Percent
James River Colonial
(c) Class III
53 47 79 21 71 29
9 91 4.9 51
Safety 14 86 Quick-Livick 12 88 Cavalier i 99 Abbott 0 i00 Bristol-Jenkins 90 i0 Nooney 5 95 Virginia Dare 48 52 D & M 28 72 Winn 4 96
(a) Operating Revenue Average $17.6 million (b) Operating Revenue Average $ 1.2 million (C) Operating Revenue Average $ 0.42 million
Source: ICC Motor Carrier Annual Report Forms MP-I and MP-2.
51

Operating Ratios, Rates of Return• and Implications for the Future
To this point in the discussion, the analysis has emphasized revenue. However, an examination of cost data is required to more accurately describe the industry.
The most frequently used measure of performance for the bus industry is the operating ratio. The ratios presented in Table 14 were developed from the ICC annual reports the carriers filed for 1979 and 1980.* It is clear from these ratios that there are significant differences in the cost struetures of the firms com- pr!sing the Virginia intercity bus industry. This fact is not at all surprising when one recognizes that some firms pay their drivers union wages, as in the case of some of the Class I carriers, while Class !I and !!! carriers do not; some firms purchase only new coaches, while other (usually Class I! and Class III) purchase older coaches with rebuilt engines; and, finally, the management structure of Class i carriers tends to be comparable to that of large corporations, while the structures of the Class II and !Ii carriers are best compared with small businesses and family-owned proprietorships where overhead is lower.
The National Bus Traffic Association argues that operating ratios greater than about 88% are much too high to attract cap•tai and maintain a viable operation. (24) While for Class I carriers with corporate management, structures, an 88% ratio may be too high, it is not clear that one can appraise the financial viability of carriers based solely upon a comparison of their operating ratios with that target ratio. Nevertheless, the operating ratio for a number of the carriers for which data are presented in Table 14 is greater than 90%, and this suggests that gross profits before taxes may not be high enough to provide an adequate rate of re-
turn while simultaneously providing enough funds to maintain a marketable bus fleet.
In addition to the •pe•a_•ng• t ratio, two other performance measures were examined: (i) the rate of return on net investment as defined by the !CC, and (2• the rate of return on opportunity capital as defined by the writers. Both rates are designed to allow comparison with rates of return which might be earned in comparably risky endeavors. If rates are significantly lower for investment in the bus industry than for opportunities available elsewhere, the financial viability of the companies beccmes ques- tionable It is interest •r•g to note that a comparison of the operating ratio with net return on investment shows that a low operating ratio does not necessarily imply a high rate of return.
*No financial data are available for solely intrastate urban- suburban bus lines.
52

Table 14
Rate of Return on Net Investment and Operating Ratio as of December 31, 1979
(a) Company Rate of Return (Loss) Operating Ratio
Abbott 0.570 0.860
Bristol-Jenkins "(0.410) 1.080
Nooney N/A 1.040
James River 0.073 0.700
Virginia Dare 0.075 0.980
Quick-Livick 0.050 0.940
Safety 0.161 0.870
Colonial (0.176) 1.210
D & M 0.034 0.960
Cavalier (Q.075) 0.990
Winn 0.163 0.900 1979 1980 Greyhound(b) N/• 0.943 0.949
(b) Virginia Stage 0.330 0.948 0.899 (b) Trailways Tennessee 0.060 1.110 0.949
(b) Carolina Coach 0.250 0.820 0.814
(a) Expenses ÷ revenues
(b) 1980 Data
Note: The net investment is the net value of the operating property plus working capital, where the net operating property is fixed assets less reserve for depreciation and amortization, and the working capital is cash and accounts receivable minus current liabilities. (24)
Source: .ICC Motor Carrier Annual Report Forms MP-I and MP-2.
53

For example, in 1979 the Winn Bus Line had an operating ratio of 0.90 but its return on net investment was 0.163 (16.3%). For the same year, the James River Bus Line had a ratio of expenses to revenues of 0.70, but its rate of return on net investment was only 0.0735, less than half that of Winn. Note also that for small companies that are not heavily capitalized, as in the case of Bristol-Jenkins, a relatively small expense overrun can result in a large rate of loss on capital.
As a second performance measure, the writer examined net revenue after corporate tax as a percentage of opportunity capital, with opportunity capital being defined here as current assets and revenue equipment less depreciation expense plus intangible prop- erty minus total current liabilities. As a practical matter, this figure reflects that sum of money which could be invested else- where should the company liquidate; thus, the rate of return on opportunity capital represents a comparison to rates of return foregone in other types of investments.
In Table 15, the net rates of return and gross rates of turn on opportunity capital are shown. For those Virginia based firms earning a positive return in 1979, the average net rate of return on investment was 7.4%. Three companies, however, had nega- tive net rates of return for that year which resulted in total losses of $570,385 on a total opportunity capital investment of $2,283,998. The average rate of loss was, therefore, 25%. Ob- viously, in the longer run a continuation of such losses would necessitate the firms' ceasing business. Nevertheless, these firms were still operating as of May 1981.
As for a comparison with rates of return in other types of investment, clearly the rates, with the exception of those for the Abbo•Lines and Virginia Stage, are not as high as current short- or long-term money market rates or bond rates. Corporate profits of between 2.83% of investment (D & M) and 10.5% of in- vestment net of the corporate tax (Winn Bus Lines) are certainly not exorbitant in light of the fact that stock earnings for some transportation firms listed on the New York Stock Exchange, such as Overnight Trucking, are currently about 1/7 of the price of the stock, or roughly 14.3%. Even though such earnings are gross of tax •or the investor, net bus industry returns on opportunity capital do not approximate bond rates, money market rates, or quarterly yields of some of the best transportation stocks. Net returns on net investment as defined by the !CC (Table 14) do, however, compare favorably with other rates for five companies. For Abbot•, Safety Transit, Winn, Virginia Stage, and Carolina Coach the rates range from 0.16 to 0.57.
54

Company
Abbott
Bristol-Jenkins
Nooney James River
Virginia Dare
Quick-Livick
Safety Colonial
D &M
Cavalier
Winn
Virginia Stage Trailways Tennessee
Carolina Coach
Avg.
Table 15
Rate of Return on Opportunity Capital
Gross Rate Return Opportunity Before Tax Capital
30.6% $ 65,590 ÷ $ 216,816 (17.0%) (45,715) ÷ 268,284
N/A N/A N/A
5.2% 75,906 ÷ 1,576,791 8.1% 3,314 + 47,065 4.0% 24,814 • 615,039 9.3% 16,013 = 172,443
(31.8%) (509,707) ÷ 1,603,071 3.0% 7,850 + 277,437
(3.6%) (14,963) ÷ 412,643 11.9% 71,289 + 673,331 N/A 1,426,058 + 6,848,378 N/A 174,070 + 5,894,139 N/A 3.•229•762 ÷ 23•916.•828
4,528,281 ÷ 42,522,265
Note: The rate of return on opportunity capital is defined as follows:
Opportunity capital (current assets) (revenue equipment less depreciation) + (intangible property) (total current liabilities), and
Return Net income after corporate tax.
Source: ICC Motor Carrier Annual Report Forms MP-I and MP-2.
Net Rate
30.0%
(17.0%) N/A
4.8%
7.01%
4.0%
9.3%
(31.8%)
2.8%
(3.6%)
10.5%
20.8%
2.9%
13.5%
i0.6%
55

These rates, however, can be somewhat misleading in at least two ways. First and most importantly, depreciation ex-
pense as reported on the income statements of the ICC annual reports is based on original cost (of revenue equipment in particular) rather than replacement cost. (24) Thus, depre- ciation expense for the rapidly increasing cost of replacement buses is being severely understated and net operating revenue is being overstated on the companies' income statement. For example, Abbott Bus Lines, Inc. showed only $45,000 in depre- ciation expense on its income statement for 1979; this being based on the original cost of its fleet, made up of vehicles having an average age of 15 years. With 12 buses of its fleet of 15 being 15 years of age or older, the company is in the position of needing to replace the fleet. However, if the company were to have purchased one 12-year-old bus in 1980, the cost would have exceeded the entire depreciation expense, and bythe following year the average fleet age would have risen above 15 years. If, on the other hand, the company had wished to. purchase a new vehicle without borrowing to do so, the entire depreciation expense plus all net income after corporate tax would have been required. Thus, the company cannot be viewed as
one in which suitable profits were earned and revenues were high enough to maintain attractive revenue equipment, even though from the income statement it appears that an attractive profit was earned. In short, profits as shown on income statements for many companies tend to include a return of the capital of the company to the owners, rather than a profit over and above the cost of maintaining the capital and operating assets at a constant or in- creasing level.
Secondly, most of the intercity bus companies for which fi- nancial data were available are organized as legal corporations. However, the principal owners are often paid salaries as employees of the corporation and to that extent the rates of return are some- what misstated as depicted in Tables 14 and 15. No estimate can be made, however, of the level of or extent to which such salaries are paid or the direction in •hi•h the rates are misstated.
While the conclusion that the intercity bus industry is not an attractive endeavor financially does appear warranted based upon rates of returns and operating ratios, an interesting contradiction appears. Of the companies shown in Tables 14 and 15 for which fleet age data were available, 7 reduced the average age of their fleets between 1976 and 1980 and 5 of the 7 increased the size of their fleets. Still, these companies may have done so in anticipation of a growing charter market. Furthermore, because of the relatively small size of fleets, the purchase of one
56

relatively new bus for a fleet whose average is greater than that fleet size will cause the fleet age to fall, but such an occurrence should not necessarily lead one to conclude that the company is undergoing a significant upgrade in the attractiveness of its fleet°
Thus, on balance, the rates of return are relatively low, particularly in light of the understatements of depreciation ex-
pense. Nevertheless, one must recognize that small bus companies are similar to many other firms that comprise oligopolistic and monopolistically competitive industries. In particular, their rates of return tend to be low •nd the companies tend to look "sick" in terms of typical measurements of financial performance, but the entrepreneurs continue to operate rather than work for someone else• 0nly a weak case can be argued, however, that the bus industry, particularly the small operators, will in the long run continue to operate with declining rates of return and operating ratios ap- proaching 100%. But it is anticipated that regulatory reform may significantly mitigate the problems faced by the industry.
Internal Cross-Subsidies and R•.gular-Route Opera.ti0ns Aside from the question of overall financial performance, the
question of whether or not regular fixed-route service will be continued under regulatory reform is of primary concern to policy makers. Currently, both the ICC and the SCC exercise some control over dropping regular fixed-route service. While it has been shown elsewhere In the report that Class i carriers (Greyhound, Virginia Stage, Carolina Coach, and Trailways Tennessee Lines) generate significant portions of their total revenue from regular- route service and are, in fact, supplying most fixed-route service in Virginia, Class II and Class I!I carriers have in many instances reduced their regular-route operations to mere token service and appear to operate only to satisfy regulatory requirements. Abbott Bus Lines, for example, supplies only 1.16% of its total bus mileage in regular routes, while Quick-Livick supplies in regular- route service only 6.4% of its total bus miles.
While sufficient data were not available to allow estimations of revenues and costs on a route basis, the ICC MP reports did allow estimation of the extent to which regular-route operations are being underwritten by the charter and package operations of the carriers. Table 16 presents these estimates of internal cross- subsidies for the year ending December 31, 1979. The data show overwhelmingly that the carriers are operating unprofitably on many regular routes in Virginia. A comparison of 1979 costs per bus mile of operation with revenue generated per regular-route bus mile operated shows a range of losses of between $0.06 per mile and $0.99 per mile. Only one of those companies listed
57

made a •profit on its regular-route operation and its operating ratio was a discomforting 9•.9%. Total losses on approximately 13.2 million bus miles operated was $2,194,151, of which almost 32% came from the Class I carriers those carriers supplying most regular-route service. The reader is cautioned that these data reflect none of the operations of the solely intrastate urban-suburban carriers, and therefore cannot be used as an indication of the financial performance of their regular-route operations. Initially, one might expect that, in general, the urban-suburban lines would tend to have more profitable routes than the carriers listed in Table 16, because they choose to acquire a status that restricts them to a very specialized short- haul market of a 40-mile one-way trip. In fact, three of the urban-suburban carriers indicated in interviews that they main- tained their regular routes because they are profitable; however, four companies stated that they lost money on regular routes and maintained them in order to keep ICC charter authority and ob- tain certain tax advantages. This latter answer suggests that the performance of the urban-suburban lines may be little better on regular-route operations than is the case of those carriers for which financial data are available. The implication that charter operations are subsidizing regular routes even for the urban-suburban lines is strengthened by the fact that 80% of the companies with urban-suburban status have charter certification as well.
The data presented on the extent of the cross-subsidy in Table 16 and the significant differences in charter and regular- route revenue generated per mile of operation shown in Table 17 suggest that, for the most part, regular-route operations do not pay their share of cost when viewed on an interstate basis. This fact notwithstanding, it is premature to expect all regular- route service to cease were the ICC and SCC to lift entry and exit controls. Several arguments can be made in support of this statement. First, because the Class I carriers supply regional markets they by necessity will maintain some unprofitable feeder routes for their larger markets. Secondly, as long as the federal fuel tax exemption is predicated'on a company's supplying regular fixed-route service, comnanies largely in the charter business have an incentive to maintain some regular-route service. Thirdly, as long as those companies that obtain urban-suburban status con- tinue to be exempt from local property taxes, motor vehicle sales taxes, special gross receipts taxes levied by the SCC, and rolling stock taxes as they are under current state statutes, they will have an incentive to operate some fixed-route service. Finally, as long as those companies classified as common carriers of passengers are allowed to pay a rolling stock tax to the SCC in lieu of significantly higher local property taxes to the localities in which they are domiciled• and are exempted from state gas taxes if they operate regular rcutes, they will have an incentive to offer some regular service.
58

Table 16
Extent of Cross-Subsidy for Year Ending December 31, 1979
Company Cost/Mile Regular-Route Rev./Mile
Abbott $0.74
Bristol-Jenkins
Nooney $0.18
James River $0.74 (-0.24)(a) $0.50
Virginia Dare $0.76 (-0.40) $0.36
Quick-Livick $0.76 (-0.62) $0.14
Safety $1.02 (-0.36) $0.66
Colonial $1.03 (-0.52) $0.51
D & M $0.88 (-0.34) $0.54
Cavalier $1.05 (-0.96) $0.09
Winn $1.30 (-0.99) $0.31
Virginia Stage $1.72 (-0.06) $1.66
Carolina Coach $1.51 (0.08) $1.59
Trailways Tennessee $1.55 (-0.55) $i.00
Losses on Losses on All Reg. Routes Va. Re•. Routes
$ 56,435 $ 56,435 $ 93,163 $ 20,092 $ 40,183 $ 38,847 $ 25,990 $ 8,280 $1,227,753 $1,203,197 $ 71,853 $ 47,355 $ 22,752 $ 22,640 $ 99,416 $ 99,416 $ 348,297 $ 341,331
0 0
$4,060,957 $ 356•558
$2,194,151 (b)
(a)Figures in parentheses show revenue minus cost per mile.
(b) Avg. loss per mile $0.17 on regular routes.
59

Table 17
Charter and Regular-Route Revenue Per Bus Mile, Year Ending December 31, 1979
Company Revenue Per Bus•Mile Charter Regular•Route
Abbott $ 0.87 N/A
Bristol-Jenkins N/A $1.71
Nooney 0.16 N/A
James River 1.14 0.50
Virginia Dare 0 0.36
Quick-Livick 0.82 0.14
Safety 1.15 0.66
Colonial 2.12 0.41
D & M 1.28 0.54
Cavalier 1.11 0.08
Winn 1.16 0.31
Virginia Stage (a) 1.74 1.66
(a) Trailways Tennessee 1.76 1.00
Carolina Coach •a• 1.52 1.59
(a) Figures for year ending December 31, 1980.
60

The strength of the current financial incentives may not be as important, however, as are the regulatory bodies at main- taining the current regular-route service, particularly f•or the Class II and Class II! carriers. Consider the data shown in Table 18.• Assume that each company could drop all regular routes with- out compromising its charter and ICC authority, and ask whether the financial incentive from tax breaks for maintaining regular routes is enough to force the company to supply that service. Columns 3 and 4 of the table present estimates as of December 31, 1979, of what the company would have paid in extra taxes had it not maintained regular-route service. A comparison of the sum of columns 3 and 4 with column 5, losses on regular routes, shows that losses always exceed estimated tax incentive savings. Thus, in the absence of regulation it would be expected that some amount of regular-route service would be dropped by state- based Class Ii and Class Iii carriers, particularly in sparsely populated rural areas. The next section of the report discusses the importance of this expectation to policy.
Table 18
Comparison Between Tax Reductions and Regular-Route Losses for 1979 Tax Year
Company Tax Rate/S100 Assessed Potential Potential Losses on for Domicile Value of Gas Tax Property Reg• Route
Locality Rolling Stock Savings Taxes Va. (-.i000)• a)
Abbott $3.75 $ 344,900 $ 155
Bristol-Jenkins 4.00 143,371 4,902 James River 3.59 907,046 5,522 Quick-Livick 4.00 456,183 1,564 Colonial 4.00 1,284,540 58,193 D & M 3.00 118,980 3,468 Cavalier 3.59 203,780 640
Winn 3.59 356,650 2,516
$12,933.75 $ N/A
5,734.84 N/A
32,562.95 56•435 18,247.32 32,847 51,381.60 1,1203,197 3,569.40 47,355 7,315.70 22,640
12,803.73 99,416
(a) There is no exemption for federal fuel tax unless the amount is greater than $I,000.
61

POLICY SCENARIOS RELATING TO VIRGINIA'S !NTERCITY BUS INDUSTRY
As has been noted in the previous sections, there is ample reason to expect the intercity bus industry to be the next target of regulatory reform by the !CC. At least two facts point to this expectation. First, and foremost, the bus industry is the only transport supplier that has yet to undergo regulatory reform. Secondly, the Reagan administration has consistently supported the market mechanism and has been an advocate of reducing regu- latory influences on the market. Given this move toward federal regulatory reform, there arises a potential for altering the relationship between the Department and those companies comprising the Virginia bus industry. In particular, the reader will recall that the financial status of the industry suggests strongly that in the absence of economic regulation, a number of regular routes will be dropped by Class !I and Class Iii carriers. If the De- partment is to fulfill its mission of the safe and efficient movement of people and goods throughout the Commonwealth, it must be prepared to address the results of economic regulatory reform at the federal level.
Assuming that regulatory reform occurs at the federal level, there are three general policy scenarios the Department must analyze Under the first, the status quo is maintained. Under the second, economic deregulation occurs at the state level and the market de- termines the supply of intercity bus service. Under the third, economic deregulation occurs at both the federal and state levels and the Department examines the provision of assistance as an en- ticement to the carriers to provide regular-route service.
In this section, these policy scenarios are examined in de- tail, with emphasis on both their theoretical and practical appli- cability to Virginia's intercity bus industry.
The No-Action Alternative
The no-action alternative at the state level simply assumes that present policy and programs will remain intact, and that they will be capable of responding to the changing financial condition of the industry and to economic deregulation at the federal level. This scenario becomes moot in the event of federal preemption. Table 5 shows that Class II and Class III carriers are operating relatively few interstate regular routes requiring ICC certifica- tion. Several of these profitable routes, e.g., those provided by Virginia Dare, would probably be maintained; however, the others would most likely be dropped. Class i carriers would still
62
maintain many routes. The companies operating intrastate routes, on the other hand, would continue to be regulated by the SCC and the token service currently being supplied would either be main- tained because of the SCC regulations or the carriers would, in fact, relinquish their regularmroute certification. The latter occurrence is indeed likely for many routes because the ability to cross-subsidize from charter operations to regular routes will become increasingly difficult as costs per bus mile in- crease and as charter fares fall because of the lifting of ICC regulations on entry into the lucrative interstate charter market.* Thus, competition will most likely reduce the ability of carriers to cross-subsidize unprofitable regular routes from charter operations, and the financial incentive to relinquish un- profitable regular-route intrastate certification will become stronger even in the absence of regulatory reform at the state level.
The net effect of the no-action alternative is that it tends to frustrate any benefits which might result from easing entry controls in interstate markets, and yet maintaining exit controls at the state level will not guarantee service on regular routes because the cross-subsidy will continue to be eroded through exempt and gypsy carriers. The no-action alternative is, there- fore, an inadequate policy for dealing with the changing environ- ment of the intercity bus industry.
Economic Regulatory Reform
The second policy scenario that Virginia should analyze in light of the move toward economic deregulation at the federal level is that of regulatory reform at the state level. It was noted above that while the SCC doesn't (in the view of the SCC staff) heavily regulate the Virginia bus industry, it does more than simply express concern about maintaining service. In fact, the carrlers commented in interviews that the SCC was significantly influenced in abandonment hearings by the statements of individuals who used the service of unprofitable routes only infrequently; often,argued the carriers, the SCC refuses an abandonment because a few oppose it, but when the service is offered, no one rides.
*Section 56-338.51 of the Code of Virginia exempts companies supplying interstate charter service from SCC control.
63

The Rationale for Reform
Regulatory reform should be considered by Virginia for several reasons. First, in the event that the reform of inter- state regulations becomes a reality, there will immediately be glaring inconsistencies between federal and state laws pertaining to the carriers. Second, it has been argued above that the no- action alternative in the context of federal regulation is not a rational policy, because it will not necessarily maintain regular- route service. Third, regulation of the industry may not be con- sistent With the Department's role in moving the most people in the most efficient manner. For example, regular-route service often maintained in the regulatory environment has poor load factors and thus is inefficient. But the charter market, which will benefit from-competition is exemplary of highly efficient transport because of high load factors. Fourth, and most important, one cannot support the case for maintaining regulation of the in- dustry on the basis of accepted economic principles. These prin- ciples are (I) the natural monopoly case; (2) the ruinous compe- tition case, and (3) the internal cross-subsidy case.
Natural Monopoly Case
The standard theory with respect to the natural monopoly case argues that regulation is necessary to restrict entry to avoid competition that might bring about reductions in the quality of service. This natural monopoly case is characterized by de- clining unit costs with increases in quantity of output resulting from large capital investment requirements. Alternatively, the firm is characterized by large economics of scale, and has large fixed cost• relative to variable costs. As Allen has argued elsewhere, 25) in such cases, marginal costs decline as output increases, and will be lower than average costs. If entry controls are not exercised, competition will force firms to set prices equal to marginal costs (below average costs) and total revenues won't cover total costs. Thus, there will be an incentive to allow the quality of service to be reduced• The regulator thus enters the picture, sets prices, grants a monopoly, takes advantage of the economy of scale, and requires a certain level of service.
While electric power companies clearly fall into this natural monopoly case, and thus should be regulated, one cannot clearly establish that the bus industry can be so classified. The most pressing question is, of course, the one of economies of scale, and while the literature suggests•{ very weak case, the jury is not yet in. Nevertheless, Fravei.has shown that there are con- stant returns to scale for the Class I carriers when all services are considered under the outnut measure, bus miles. (26) While it
64

is unlikely that the natural monopoly case can provide support for continued economic r.egulation of the bus industry, further investigation is required to entirely dismiss it.
Ruinous Competition
This case exists where ease of entry and an absence of economies of scale result in many competitors entering the in- dustry. Excess capacity results, firms are unprofitable, and prices fall below costs. Then, firms allow service to deteriorate and excess capacity to be reduced, which drives prices up and attracts new competitors. A cyclical pattern emerges, and con- sumers do not know what to expect either in terms of price or service levels.(7)
While both ease of entry and long periods of excess capacity are required in this case, long periods of excess capacity can be sustained only if fixed costs are extremely high relative to vari- able costs. Data on Virginia carriers will not support the ex- istence of a high ratio of fixed to variable costs, thus the case of expecting ruinous competition cannot be exercised to sup- port entry and exist controls for the intercity bus industry in Virginia.
While the conditions which lead to ruinous competition will not support regulatory control for the bus industry, a related argument offered by small carriers is that under decontrol, Grey- hound will wield enough monopoly power to completely void their efforts in the market. It is difficult, however, to justify this argument because it falls into the category of unfair competition, not ruinous competition; and, instances of unfair competition, if they were to occur, are best dealt with by existing antitrust legislation, not economic regulation.
Internal Cross-Subsidies
Of the three arguments for regulating economic activity, possibly the most compelling as it relates to the intercity bus industry is that of the internal cross-subsidy.(7) Data presented in the financial section above show that regular-route operations in Virginia are significantly subsidized by charter and package revenues; in other words, regular-route revenues do not cover the costs of operating regular routes but profit margins on other operations allow companies to continue regular routes. Regula- tion is used in this case as a way of providing services in greater quantities and at lower prices than would be the case in a free
65

market. In fact, instead of the public being taxed to provide a subsidy to unprofitable services, firms are forced, through regu- latory controls on entry andexit, to provide an internal subsidy from profitable operations to unprofitable ones. As alluded to in the discussion of the no-action alternative, regulatory controls on entry grant the firm a monopoly on the provision of services to a market, and for those services where demand is sufficient to provide a profit in the absence of regulation, entry controls will create excess profits that can be used to subsidize the provision of unprofitable services the regulatory body deems de- sirable.
While cross-subsidies ha'•le been pervasive in the service in- dustries, such as the airlines and railroads, the policy is some- what unpalatable from the standpoint of public finance. The re- sult of the cross-subsidy is to provide service the market would not otherwise provide. Nevertheless, in the majority of cases, the traditional mechanism of providing such service, as in the case of defense, is to have the government supply the goods and pay for it by taxes. The regulations are thus like a tax; how- ever, even though the goal of regulatory control is the provision of service, the amount of the tax is not well defined,, nor is it clear whether the poor are subsidizing the poor, the wealthy the poor, or the poor the wealthy.
As the general theory of cross-subsidies relates to the inter- city bus industry in Virginia, it appears that regulatory control has been exercised largely to maintain regular routes via the cross- subsidy technique. This fact is not sufficient, however, to main- tain entry and exit controls, * even though the cross-subsidy case is the strongest reason for maintaining controls. The case for dropping entry and exit controls and for regulatory reform be- comes clearest when one recognizes that the major conditions necessary for the maintenance of internal cross-subsidies are quickly being eroded.
The first condition is that the regulatory body must guarantee monopolies in markets where d•ma£d is strong. Historically, this has been done through control over the granting of operating au- thority; however, it was noted earlier in the report that the ICC has significantly reduced its control over the regular-route operatlons of Class !I and Class I!I carriers and has concurrently relaxed scrutiny over charzer-operating authority. Perhaps of more importance to the Virginia industry is the fact that while companies registered with the SCC are regulated, a significant number of group-passenger-carrier classifications supplying
*For a similar argument elsewhere, see Reference 7, p. i0-i0.
66

services of a competing nature are exempted from SCC regulations under Section 56-274 of the Code of Virginia. In addition, there are over i00 firms in operation which supply only charter service, the type of service for which there traditionally has been the strongest demand. It is obvious, then, that the monopoly position of the Virginia intercity bus industry is being eroded and, conse- quently, that the source of the cross-subsidy to regular routes is disappearing.
The second condition being eroded is that the profits earned in the protected markets must be used to provide the unprofitable service. The reader will recall that the levels of service (both in terms of routes covered and number of trips) have been declining significantly in favor of a move toward the supply of more charter service. This trend is a clear signal that the companies aren't being forced to maintain regular routes at high levels of service.
Thus, because•the strength of the internal cross-subsidy scheme is being rapidly eroded, it cannot be offered as an argu- ment against regulatory reform.
Expected Impacts of Regu•atoFY Reform
To aid in predicting the effects deregulation may have upon the Virginia intercity bus industry, it is helpful to look at the experience of other transportation industries and other states with deregulation.
Although the initial boom that followed the deregulation of the airlines is appearing to slow down, overall the results of de- regulation appear to have been healthy for the airline industry, especially for small carriers. It is very difficult to compare the two modes, however. Airlines have a much higher ratio of fixed to variable costs, and airline passengers possess a higher price elasticity of demand than do bus passengers.
Comparisons between the intercity bus and the trucking indus- tries are a bit more realistic. Both industries are characterized by relatively low fixed costs and fairly inelastic demands, and both have capital that can be transferred easily from one firm to another. As noted above, these traits have been described by proponents of trucking deregulation as •ng antithetical to "ruinous" or "destructive" competition, instead, they argue that industries exhibiting these three characteristics will achieve lower prices, increased efficiency, and expanding markets from economic deregulation.
67

Perhaps the best predictor of how the Virginia industry might react to deregulation is the experience Florida has had with economic deregulation of the intercity bus industry. The state abolished regulatory controls (with the exception of safety, weight requirements, etc.)•on July i, 1980. Since that time, there has been a marked loss of regular-route service to some
areas, but for the most part these were areas with insufficient demand, where a declining level of service had been taking place for some
time.(8) In addition, some new, small carriers have entered the industry and are picking up some of the abandoned routes.(27) New charter operations have started as well. Most importantly, every bus company has initiated or planned a major expansion of its operations since deregulation was
initiated•(8) The state hopes that the ability of bus companies to experiment with fares and schedules will prevent a "jump in-pull out" situ- ation. (8) In addition to route changes, Trailways has responded to deregulation by reducing fares on some routes and by offering children's and senior citizens' discounts.(27)
The case for regulatory reform is quite strong and, while identification of those services which will be dropped can only be general, it is clear that the market will mobilize the resources of the industry toward providing •those transportation services it can provide more efficiently than any other mode.
Assistance
A third major policy scenario which should be addressed in the context of regulatory reform is that of some form of assistance, or in the economics jargon, subsidy. Consideration of this option nevertheless does not indicate its acceptance as desirable. The literature presents arguments on both sides, and while economic theory can be brought to bear, (25) the choice for assistance is most often determined through the political framework,(8) as has been the case for aid to transit. Allen has argued elsewhere that there are only two economically justifiable arguments for subsidy to public transport. (25) The. first, which the authors have argued doesn't hold for the intercity bus industry, is that there must be significant economies of scale. The second is that subsidies will lead to significant •ductions in externalities such as pollution and congestion. <2 • For the rural areas in danger of losing regular-route service, this argument doesn't hold either. Thus, on economic grounds, subsidies to the intercity bus companies to maintain existing regular routes cannot be justified.
68

There are other arguments, however, relating to national energy goals and to mobility for all groups which can be raised in support of subsidizing regular routes that otherwise would be dropped. For example, while it has been argued that the bus is the most efficient form of intercity travel, (8) this is true only for trips of certain length and for buses operating over routes having significant passenger demand. The fact, in the opinion of the authors, which is overlooked is that charter operations, which require no subsidies, are already consistent with energy conserva- tion goals in the sense of supplying significant numbers of passen- ger miles at low expenditures of energy. While some propose that subsidies are justified because of artificially low fares brought on by operating subsidies to competitors such as the airlines and the railroads,(3) this argument is weakened significantly by the fact that for trips normally supplied by bus (those less than 200 miles), the biggest competitor is the automobile, which receives no operating subsidy.
Notwithstanding the fact that the case for subsidy is weak, various assistance and subsidy schemes should be described for three reasons. First, a precedent for subsidy programs has been established through the eligibility of private intercity carriers for monies being distributed by the states through the Section 18 formula grant program.(7) Secondly, Sections 21 and 22 of the UMTA Act, although unfunded, provide for both assistance and operating subsidies for the operation of terminals. Thirdly, and most importantly, given that there may be some cross-subsidy by the carriers under deregulation for regular routes that are marginally profitable in order to partially cover capacity costs for charter operations, certain purchase of service agreements or subsidy formulas may be useful to enhance service and induce greater patronage of those relatively high demand regular routes. Descriptions of subsidy and assistance mechanisms follow.
Provider-Side Subsidies
Provider-side subsidies are•supply-side grants which effec- tively reduce the cost of supplying a particular level of output. These can be classified as deficit subsidies, input subsidies, and output subsidies.
Deficit Subsidies
This is the traditional method of subsidization, where the difference between the cost of providing a certain service and the revenue accruing from such servmce is compensated for through a
69

subsidy. Deficit subsidies have been used so frequently because they are easy to administer and because, unlike other capital- oriented subsidies, they allow the operator to experiment with innovative administrative and scheduling techniques (as will be discussed below). (25) This type of subsidy has been criticized, however, for several reasons. First, it is difficult to determine what routes are "worth'" of subsidization when so little is known of passenger
demand.-2•) Secondly, this method does not encourage
carriers to become more cost effective because nothing is gained by being efficient. Finally, the subsidizing body has little, if any, control over the administrative and operating practices of the recipient.(25,28)
Output Subsidies
A second provider-side subsidy is the output subsidy. Such aid is granted on units of a certain output produced by the car- riers. For example, a company might receive aid for every route mile or every passenger mile traveled. This form of subsidy pro- vides more incentive than the previously discussed types, because the amount of subsidy received is directly linked to the perform- ance of the carrier. This advantage is substantially offset by the difficulty and high cost of administering the subsidy, even though the grant agency can induce the carrier to increase the most desirable output.(25)
Input Subsidies
Among the most attractive alternatives the state could pursue is that of providing input subsidies. In contrast to the types of subsidies discussed in the previous sections, these concentrate upon reducfng the overhead costs for bus companies. Therefore, the incentive for minimizing costs in other areas is left intact. Because so much of the J.ndustry's purchases are capital-intensive, this kind of subsidy can be o• considerable aid.(25) Its drawback is that it may encourage companies to acquire more of the subsi- dized good than they actually need, whiSe their supply of non- subsidized goods may remain inadequate.(28) A discussion of various types of this subsidy follows.
Terminals. Terminals represent the largest category of expenses that a regular-route carrier must bear. As available revenues decline, so does the amount of money that can go into terminal upkeep. Obviously, the condition of a terminal is not an absolutely essential factor in the provision of service; however,
7O
the perception of unsafe and unsanitary terminals may deter potential passengers from using the bus. (7) Aid to improve terminals, then, especially if such action includes linking the bus terminal to another mode as well, may help bus companies attract and retain riders.
Bus Loan Programs. The cost of a new bus continues to sky- rocket, and •he pur•chase of a bus represents a major and often necessary expense. Lower maintenance costs, and again the attrac- tion value of a shiny new bus to potential passengers, are bene- fits companies gain through the acquisition of a new bus. However, it is likely that if a company is involved in both charter and regular-route service, a new bus will be used for long trips and the older ones will be used close to home to reduce the company's overall cost per mile. (7) This subsidy may be of questionable value, then, in upgrading regular-route service.
Tax Rel•ef. Granting carriers relief from state-imposed taxes represents a third type of input subsidy. The state has already moved in this direction through the removal of the gaso- line tax and the gross receipts tax. The removal of other taxes imposed through the DMV and SCC would provide minimal help.
Marketing. Marketing represents the least expensive and yet is among the most productive means through which to increase the demand for intercity bus service. By making potential passengers aware of the services being offered, companies can hope to in- crease their passenger loads, (7) drawing particularly from the relatively short trip auto mode. Financial aid by the state in this endeavor should prove to be worthwhile while costing very little.
User Subsidies
Unlike provider subsidies, user subsidies are offered to potential users of bus service. Usually, groups targeted for such a program, the handicapped Or the elderly, for example, are allowed to purchase bus transportation at below cost. Some argue that reducing the orice will potentially generate new demand as well as
precipitat• some modal shift to the bus. (28) In the long
run, then, this type of subsidy may increase total revenues. At the same time, it requires that the bus companies maintain satis- factory performance, as they must attract and retain new passen- gers. (•) The likelihood that this chain of events would actually occur as the result of user subsidies is significantly reduced when one recognizes that the price elasticity of demand is not likely to significantly impact individuals in targeted user-subsidy groups.
71
Conc!udin$ Remarks
Thus, what is to be conlcuded about the use of subsidies and assistance as • policy consideration? Briefly, a subsidy is not attractive except as a last resort; regulatory reform is much more desirable as a first-policy option. Only after the specific impacts of regulatory reform are ascertained should any move toward subsidy be considered, and then care should be exer- cised to assure that the subsidy technique is cost-effective in providing the output desired. Low cost assistance options in- clude marketing programs to heighten the awareness of the general public to the advantages of intercity bus service, technical assistance regarding management and maintenance techniques, and working with localities to fully take advantage of the potential for purchase of service agreements with existing carriers to supply desirable transportation services.
72

REFERENCES
i. America's Most Fuel Efficient Passenger Transportation Service, A Report from the American Bus Association, 1980.
2. Intercity Bus Service in Small Communities, U.S. Department of Transportation, Washington, D.C., January 1980.
3. "The Intercity Bus Industry: Issues and Problems", background paper for the Conference on Intercity Bus Transportation, National Academy of Sciences, Washington, D.C., September 22-24, 1980.
4. Deregulation pf the •ter.city Bus Industry, Management Analysis Center, Inc., Washington, D.C., January 1981.
5. The !ntercity Bus Industry A Preliminary Study, Interstate Commerce Commission, Bureau of Economics, Washington, D.C., May 1978.
6. Increased Bus Passenger Fares and Express Rates• Nationwide .1981; Statements in Support of Proposed Increases of 8.5% in Interstate Passenger Fares and Express Rates, Statements of President• •Chairman, and Counsel of the National Bus Traffic Association, •C., Volume I, Filed with the Interstate Commerce Commission, January 15, 1981.
7. Fravel, Frederick D., North Carolina Intercity Bus Study, North Carolina Department of Transportation, Public Transportation Division, September 1979.
8. Proceedings: Conference on Intercity Bus Transportation, prepared by the Transportation Research Board for the Urban Mass Transportation Administration and the Interstate Commerce Commission, December 1980.
9. Comparative Analysis of Existing and Proposed Laws Regu$.atin $ Motor Carriers of Passengers., American Bus Association, September 18, 1980.
i0. Moskaluk, M. John, James R. Marks, and Stephen Dickerson, Georgia Intercity Bus System Evaluation, prepared by EcQnomic Development Laboratory, Engineering Experiment Station, Georgia Institute of Technology and Comsis Corporation for the Georgia Department of Transportation, GDOT Research Project No. 7801, February 1980.
ii. Carstens, R. L., K. A. Brewer, S. L. Ring, and J. D. Grove, Intercity Passenger Carrier Improvement Study, prepared by the Engineering Research Institute, Iowa State University for the Iowa Department of Transportation, Project 1255, August 1977.
12. Intercity Bus Transportation in Wisconsin, Volume I: Service and Operating Characteristics, Volume II: User Characteristics, Volume III: Federal and State Regulations, Plans and Programs, Volume IV: Future Demand for Service• Volume V: Bibliography, Volume VI: Summary and Recommendations, Division of Planning, Wisconsin Department of Transportation, December 1977.

REFERENCES, continued
13. Intercity Bus Transportation in Ore•0n, Preliminary Report, and Oregon Intercity Bus PassenBer Study, Planning Section, Oregon Department of Transportation, February 1975 and December 1976, respectively.
14. Michigan Intercity Bus StNdy Phase I Inventory and Analysis Ridership and Travel Characteristics, Mass Transportation Planning Section, Michigan Department of State Highways and Transportation, November 1977.
15. State Intercity Bus Plan, California Department of Transportation: (I) Dean, Donald L., and Sally A. Marston, Index of Cities, Towns and Places Served by Intercity Bus Systems or Other Transit Services, CA-09-8005, Working Paper, April 1980; and (2) Coop, Leigh Ao, and Cyrin S. Kwong, Intercity Bus Stations, CA-09-8005, Working Paper, September 1980.
16. A Study to Develop Policy Recommendations Designed to Upgrade Intercity Bus Service in Massachusetts, prepared by TRAMCO, Inc., for the Executive Office of Transportation and Construction, Commonwealth of Massachusetts, April 1980.
17. Plans for Public Transportation in Texas, State Department of Highways and Public Transportation, November 1980.
18. Nebraska Public Transit Stud X I, Office of Planning and Programming, State of Nebraska, February 1974.
19. South Carolina Inter•ity Bus Plan and Program, prepared by Carter, Goble, Roberts, Inc., for the Office of the Governor, Division of Economic Development and Transportation, February 1980.
20. Davis, Frank W., Jr., Intercit¥ Bus Transport" The Tennessee Experienc e College of Business Administration, The University of Tennessee, Knoxville, Tennessee, November 1974.
21. Task 1 Research Findings for Intercity Bus Transportation Planning Study., Technical Memorandum prepared for NCHRP Project 8-25 by Peat, Mar•ick, Mitchell & Co., in association with Ecosometrics, Inc., July 3, 1980.
22. DiRenzo, John F., Mark S. Jelavich, and Marie L. Stoess, "Survey of State Operating Assistance Programs for the Intercity Bus Industry", a paper presented at the annual meeting of the Transportation Research Board, January 1981.
23. Allen, Gary R., An Analysis of State Imposed Taxes and Fees on Motor Carriers
of Passengers, Virginia Highway and Transportation Research Council, VHTRC 80-R Charlottesville, Virginia, October 1979.
24. Increased Bus Passenger Fares and Express Rates, Nationwide•. 1981; Summaries an
Statements in Support of Proposed Increases of 8.5% in Interstate Passenger Fares and Express Rates; Verified Statements of Study Carriers, Volume III, filed with the Interstate Commerce Commission, January 15, 1981.

REFERENCES, continued.
25. Allen, Gary R.,"An Analysis of Subsidy Issues in Public Transportation", Traffic Quarterly, Eno Foundation for Transportation, October 1976.
26. Fravel, Frederic D., "Returns to Scale in the U.S. Intercity Bus Industry", Proceedings Nineteenth Annual Meetin$ of the Transportation Research Forum, Volume XIX, Number I, 1978.
27. Portz, H. Craig, "Deregulation of Florida's Inter-City Buses", paper presented at the TRB Conference on State and Regional Roles in Public "Surface Transpor- tation, Cambridge, Massachusetts, August 18, 1980.
28. Schneider, Norman R., "New York State's Approach to Identifying Intercity Bus Service and Facility Needs", paper presented at the Fifty-Ninth Annual Meeting of the Transportation Research Board, Washington, D.C., January 21, 1980.


APP ENDIX
REGULAR-ROUTE INTERCiTY SERVICES PROVIDED BY SMALL CARRIERS
i. Abbott Bus Lines, Inc. 1703 Granby Street Rt. I, Box 180 Roanoke, Virginia 24012 (703)343-1133
Abbott Bus Lines provides 2 roundtrips between Roanoke and New Castle every Tuesday via Routes 419, ii, and 311; leaving Roanoke around 8:00 a.m. and 3:30 p.m.
2. Allen, C. J. Rte. 2, Box 453 Danville, Virginia 24541
Mr. Allen operates a route from the intersection of Routes 882 and 703 east of Martinsville to Martinsville via Routes 882, 844, 851, 855, and 58.
3. McCrickard Bus Line Box 94 Callands, Virginia 24530 (804) 724-4130
McCrickard Bus Lines provides 3 roundtripsa day, Monday through Friday, between the intersection of Routes 844/41 and Dan River Mills in Danville via Routes 844, 750, and 58. The runs begin at 6:30 a.m., 2:30 p.m., and 10:30 p.m., and carry workers to the 3 shifts at the mill and then pick up workers returning home.
4. Cavalier Transportation Company 1621 N. 28th Street Richmond, Virginia 23223 (804)649-1019
Cavalier Transportation operates 1 roundtrip on Monday, Wednesday, and Friday between Hartfield (leaves 7:30 a.m., returns 7:15 p.m.) and Richmond (arrives I0:00 a.m., leaves 5:00 p.m.) via Routes 3, 198, 17, 14, 33, 249, and 60. Intermediate communities served include Mathews, Gloucester, Adner, West Point, New Kent, Bottoms Bridge, and Sandston.
A-I

5. Chesapeake and Northern Transportation Company 5604 Capelle Road Portsmouth, Virginia 23703 (804)483-3672
Chesapeake and Northern provides 2 round trips Monday through Friday, leaving at 5:30 a.m. and returning at 5:30 p.m., one between Chesapeake (just south of Portsmouth) and the Newport News Shipyards and one between Portsmouth and the Shipyards, both basically via Route 17.
6. Nooney Bus Lines 1017 Jefferson Street Roanoke Rapids, North Carolina 27870 (919)537-4945
Nooney Bus Lines operates i roundtripsevery Saturday between Roanoke Rapids (leaves 10:30 a.m., returns 12:15 p.m.) and Lawrenceville (arrives 11:15 a.m., leaves 11:30 a.m.) via Route 46.
7. Payne Bus Service Rt. I, Box 122 Beaverdam, Virginia 23015 (804)448-2930
Payne Bus Service currently provides only charter services in the
state.
8. Twin State Coach Lines P. O. Box 826 Bristol, Virginia 24201 (703)466-5343
Twin State Coach currently provides onl• charter services in the
state.
9. Scottsville Bus Lines P. O. Box 355 Scottsville, Virginia 24590 (804)286-3101
Scottsville Bus Lines operates one route between Charlottesville and Fork Union via Routes 6 and 20 from September 15 to May i. Ser-•ice is pri- marily for the benefit of Fork Union Military Academy, with a bus leaving Fork Union Friday evening and returning from Charlottesville on Sunday.

I0. Tara Lines 27C Beaver Lodge Stafford, Virginia 22554 (202)695-1220
Tara Lines operates 2 round trips Monday through Saturday between Winchester and Washington via Route 7. Buses leave the termini simul- taneously at 8:30 a.m. and 3:00 p.m. Intermediate stops include Berryville, Purcellville, Leesburg, and Falls Church. On Sundays only i bus leaves Winchester at 8:30 a.m. and departs from Washington at 3:00 p.m. Commuter service on Monday through Friday is also provided from the intersection of Routes 610 and 612 in Stafford County south of Quantico Marine Reservation over Route 610 to 1-95 and into Washington.
ii. Newton Bus Service Rte. l, Box 8D Gloucester, Virginia 23061 (804)693-2284
Newton Bus Service provides 8 round •ips Monday through Friday between the Mathews-Gloucester area and the Newport News Shipyards, leaving in the a.m. and returning in the p.m., via Routes 14 and 17. Employee-haul service is also provided between other locations in addition to the regular- route service.
12. Bon Air Transit c/o Virginia Overland P. O. Box 328 Petersburg, Virginia 23803 (804)748-4444
NOTE: Monday through Friday via Routes 60 and 147 from Chesterfield County and Route I from Ashland. Changes to the Chesterfield County run are being considered. See next 2 pages for schedules.
A-3

u•QC)
o 0
z
z
0
0••0•
O:
zo
A-4

Zone I Richmond Zone 4 Henrico Zone 5 Hanover
FARES
The fares vary from $I.00 to $2.25 depending on the zone. Fares are payable on the bus. Cash only and correct change please.
PASSES:
Monthly passes are available at $30 $40 $50 per month depending on the zone.
LEAVES
AS}•AND 6:45 AM RICHMOND 7:45 AM ASHLAND 9:00 AM
LEAVES
RICHMOND 3:00 PM ASHLAND 4:15 RICHMOND 5:30
The bus leaves from the Ashland Train Station and then travels along Greenwood Rd., Mountain Rd., Brook Rd., Lombardy St. and then East on Broad St. to 10th and Capitol Sis.
The bus leaves 10th & Capitol Sis. in Richmond traveling back along the same route to the Train Station in Ashland.
The bus may be flagged at any safe location.
FOR MORE INFORMATION CALL:
Virginia Overland 266-1111
A-5

13. Mechanicsville Bus Line Route i, Box 648 Mechanicsville, Virginia 23111 (804) 746-8332
MECHANICSVILLE BUS LINE, INC.
H. E. HUBBARD 746-8332 OWNER
BUS SCHEDULE
ISSUED: Effective January 15, 1979
MONDAY THRU FRIDAY
Schedule #3 cancels Mechanicsville Bus Line, Inc., schedule #2
All Schedules to and from Richmond via 1-64
Lv: Lv: Lv: Lv: Lv: Lv: Lv: Cherrydale Hanover Un. Va. Springdale & Blair's Cen. Gdn. 8th &
Village Bank Henrico Plaza Drug School Broad St.
6:00 AM 6:02 AM 6:05 AM 6:10 A•,i 6:22 AM 6:35 AM 6:45 AM 7:10 AM 7:18 AM 7:30 AM 7:40 AM*
8:00 AM 8:15 AM 8:20 •M 8:25 AM 8:40 AM 8:50 A•* 9:10 AM 9:12 AM 9:30AM 9:35 AM 9:40 AM 9:50 A•M I0:00 AM*
1:45 PM 1:48 PM 1:55 PM 2:00 PM 2:05 PM 2:15 PM 2:30 PM* 3:00 PM 3:03 PM 3:30 PM 3:35 PM 3:40 PM 3:50 PM 4:05 PM
4:35 PM 4:36 PM 4:50 PM 5:25 PM 5:26 PM 5:45 PM*
*Will return throuBh Mechanicsville
SATURDAY
All Schedules to and from Richmond via 1-64
Lv Lv Lv Lv Lv Lv Lv Cherryda!e Hanover Un. Va. Springdale & Blair's Cen. Gdn. 8th &
Village Bank Henrico Plaza Drug School Broad St.
8:00 AM 8:03 AM 8:15 A•I 8:20 AM 8:28 AM 8:40 A•I 8:50 •<* 9:25 AM 9:35 AM 9:40 AM 9:50 •M !0:00 •M*
1:45 PM 1:48 PM 1:55 PM 2:00 PM 2:05 PM 2:15 PM 2:30 PM* 5"15 PM 5:18 PM 5:25 PM 5:30 PM 5:45 PM*
*Will return through Mechanicsville
NOTE: No service on Sunday or on the dates observed for the following: New Year's Day, Memorial Day, Independence Day, Labor Day, Thanksg•v•n and Christmas.

14. Dominion Trailways P. 0. Box 821 Abingdon, Virginia 742 i0. (703)343-9799
NOTE: Daily, via Routes 460 and 19. Claypool Hill to Hunt- ington run currently not operating.
Dominion Trailways BECKLEY BLUEFIELD BRISTOL
CHARLESTON KNOXVILLE
READ DOWN (ET) READ UP 315 < SCNEOUL£ Nos. •'- 310
BA
30 Lv Cleveland, Okt• (310)GL • •$•
• 55 Can•on, Ohio 3• • PH¢sbur#k, P= I# 2$
15 •a•les[on, •.Va 3# • G=ul¢• Bridle •
35 • Beek/eg W.V= GL Lv •$
Beaver • Hinton [
1 Pipestem State Park 1 • Athens /
810 #5]•Prigceton, W.VI DLE.._Lv• ##1 ___• .__.• •' L, P,•,,,. W.• (••)•l .• • • __.l_•._.
•10 451Lv•Princeton, W.Va..: DLL:.. •',S •# •11 IOI•6BLUEFIELD, W VA. DL• Lv•81/ 3$[
•_•• •__•-
zz 4S• •, i•et Zz ZS] a•,t •
$0 Wel•k ##l os gv.•).• zs •s] •,v•t•¢ zs] e¢• BlueJield, W.Ve •! Lv• 3#]
ZZ ZS• •kt, V• Z•I I#• • Blueflel•, W.Va •1 Lv I$•
II 05 Wyt•e•ille Va • 11 •5;• Blue/ield, W.V• GL Lv• •:' -----• • 30•v•BLUEF•E•D, W.VA...._• DLL._•• 1•
Bluefield,. Va •]]•[ $•rm gwlle • • 6T•xw•wlL ii •5•
Pou•ing Mill
2• • •-••• 711111
C•=-• F• • I I •z•,.• • I • i• Cf•H•H. F• • Lvl J
j-•Nose•ale 55• 6•.•go• ii •
Mamso•v lie
•;•msxoL, v•,-• O•L.._L•J •0 •0• Lv
C
$#• •no•/&. T•,n •0• 30 • •H•e, C• Lv• •
15J •ehnzen •I•Y,T• 10• •. •i• Azhe•ille, N.= Lv 15•
• S•t=•s,$.C. •0 C•ium&i• •0• • FI• i. • •m•
H 4• • MI•LFf• Lv I0 •;
Explanation of Reference Marks
q--Agency station handling inbound f--Flag stop. prepaid express only. D--Discharge only.
.i--Agency station handling tickets, •]--Consult agen• for schedule Daggage, prepaid and collect ex-
formation this route. press (no C.O.D.'s). (ET)--Eastern Time.
(CT)--Central Time. '--Agency station handling prepaid BRI--Blue Ridge Trailways. and collect express (no C.O.D.'s). DLk--Oominion Trailways. Oly--Oaily. GL org--Greyhound Lines, Inc. Fr,--Friday only. TWl--.T/ailways, Inc.
or Sat.--Saturday only. B•.--Bluefield-Asheville.
A-7

15. D & M Bus Company 130 Carolyn Court Danville, Virginia 24541 (804)792-1316
NOTE: Via Route 58 to Martins- ville and Routes 58 and 62 to Durham.
D. & M. Bus Company E. H. Stephens, President 130 Carolyn Court, Danville, Va. 24541
DANVILLE--DURHAM READDOWN 3538 READ
Folder 9-&-76 --!- t-•-•i T•! •.,,o• .TW ,._. •" 1-•--•!--•--- ------- ------T---
;•;- :':..I • #• L• Z•,•,,• (7•)_ • Z=• T. #•} • •si u •=,,a•,. v, vwL._ L, •==
•10 30! Milton N.C 10• 05[ 3 • 10 • Semo;• 051 • 4 •10 • "Roxbor•: •.•.•._ ]12 •i •]
1• 11 10 Helena R• •12 35 •l • 1•11 15• Rougemont Road 11• •0• 25•
• 4 4Sizz 45'u=Bu¢h=m, N.¢ =ve_. Lv •12 • •'-
::::L::::.• #=:#Z •=; • •=•,•t•, •.C ¢¢¢.__ L• •U •0• •
DANVILLE--MARTINS¥1LLE READ DOWN -•_l•-i• -• READ UP
ESuH IEScH (SuH 5-I-BO •ESuH •ESuH ESuH
• 8• • •.. •{I
• 40 RigginsGate •0 •[ •1 Bachelor's H•I.. • 9 •1 •l
401 40 45 Brosville •5¢ 45 5•1 • 4• • West Fork • •0• 45•
45518•016•1 Axton •6•19•1•1 15i •0] 101• •l•lnlville, VI, L•[ 6 •l •51 •1
Connections in Martinsville, for Rocky Mount, Roanoke and all points west. Cennectlens in Danville, for Norfolk, Richmond, Lynchburg and all points
north. Greensboro, Durham, Burlington, Raleigh & all points south. E•H--Daily except Saturday, Sunday and Monday. ESa--Daily except Saturday. ESuH--Daily except Sundays and Holidays. EM--Daily except Monday. CCC--Carolina Trailways. DVM--D & M Bus Company. TWI--Trailways, Inc.
16. Quick-Livick, Inc. 708 C Street Staunton, Virginia 24401 (703)886-6297
NOTE: Front Royal run via Route 340. Quick- Livick also provides round trips every Monday (except holidays) between Staunton and Charles Town, West Virginia, via Routes 250, 42, 623, 55, 628, ii, and 761 into West Virginia out of Winchester. The bus leaves Staunton at 7:30 a.m., arrives Charles Town at 10:45 a.m., leaves Charles Town at 11:15 aom., and arrives back in Staunton at 2:30 p.m.
WASHINGTON WAYNESBORO ROYAL
DN 7971 403 No. VSL No.. 4,36
B•H BsH Folder
Track L•,WASHIN6TON, 8.C TWIlr :) 1.
00. Falls Church, Va i) 4(
301 Centreville 1[ 11f471 Gainesville •) lf52
Haymarket The Plains i• 3{ 101 "Marsl•all
45 •r'Front Royal TWI Lv !) 1• O01Lv'Front Royal QLI•r i 12f4[
Befltonville 135i "Luray •12 1l
51Y, Stanley !1 5! 0•! "Shenandoah 11 1•i Elkton 11 3i • Grottoes !) 11 9! 00 •r'Waynesboro, Va QLI Lv :) 10 4!
Z•tLv I,Y,,1YNE..SBORO (1Q65).._TWlJr tO ,l•i •" .ST,4UNTOIV, VA TWI Lv I0 2.
708 C Street Staunton, Va. 2•401 *--Full service agency station.
Qr F•sH--Daily except Saturdays, Sundays an• Holidays.
A-8

17. Safety Transit Lines 619 Bridge Street Eden, North Carolina (919)623-2434
27288
NOTE: Martinsville run via Routes 87 and 220; Danville run via Routes 29 and 700. Safety Transit has applied to the North Carolina Utilities Commission and the Virginia State Corporation Commission for a reduction in service to 1 round t•ip every Wednesday between Eden and Danville and Eden and Martinsville. This change may be in effect as of the date of publication of this report.
MARTINSVILLE- GREENSBORO/BURLINGTON DANVILLE-EDEN
Operated by R. READ DOWN
Fri only [ssH
30
)2 15 )9 20
e550 )950
)1020 •_ •
e6 15 e7 •
)4 0097x45! )4 10 )7z55• )4 30 )8x151 )5 O0 )8x45i
H. Gauldin, d/b/a Safety Transit Lines, Eden, NC 7 3 1 9 REAO uP Fri
10-29-78 EssH EssH only
At Matlinsoille, VA GL Lv 20• O$i
,•.•oy. v, • •s'- •N•, N• kv )8 k•g•, • lr )• •e• •5
M•yo6an ) •M•6ison •._. )1 • Summerfiela •/•:'222
• ••, • k• )12• •ei6g•ille
DANVILLE--EDeN •sH [•sH Lv$DANVILLE, VA ST•_ •r :)•40 )• 4•i
$choolfiel•, VA )?x30 )3 •5• Ma•fiel•, NC )?xI0 )3 •5
bSEDEN, NC STL... Lv )6•40.)2 45
EssH )--Daily except Saturdays, Sundays and holidays. Fri e--Fridays only. x--l'.hese trips will not operate during periods wl•en Dan River Mills are not
full operation. 5--Agency station handling Tickets, Baggage, Prepaid and Collect Express,
but C.O.D. Express.
18. Intercity Bus Lines Route 1, Box 316 Roanoke, Virginia 24012 (703)342-6419
NOTE: Via Routes 220, ii, and 1-64
Intercity Bus Lines, Inc. ROANOKE--ROCKY MOUNT--,
," ROANOKE--FINCASTLE-- MARTiNSVlLLE EAGLE ROCK--CLIFTON FORGE--
D N• ----•-•--•---- •-U P COVINGTON
t? 50 8oones Mill •1030 f8 I0: •o•ky Mo• f1010 •6 • 1.15• Hollins •: Cassell'sStore Cloverdale
Sydnorsville Daleville Jones' Store Henry Road f.. Oak Level BassettRoad t Collinsville
t9 00 •r__MARTINSVIL_L_E.,.VA.__Lv f9 •_0 "•9 15 Lv ,•v'/arlinsvalle, Va DVMAr :'1010 Ar Danville, Va. (3539)Lv "•,•, 10i •0 •0 Lv Danville, Va (3•2•)•r •! 4! • q,•, •.f.:--•=--•v•
Amsterdam f Trinity
15 !130' Fin©astiR 501 Lower Catawba_.
i!40 Eagle Rock • Gala
f f Lick Run Iron Gate
55.1210 Clifton Forge.•._ 1(] 1•0. M COVINGTON Lv 1250 72(
7• • L•-C•/.•0., •)• 1150 55 •r C•arleslon, WVa.GLLv 20
ESu t--Daily except Sunday. DVM--D & M Bus Company. ESuH 0--Daily except Sunday and GL-Greyhound Lines, Inc. Holiday.

19. Bristol-Jenkins Bus Line 408 E. Mary Street P. O. Box 59 Bristol, Virginia 24201 (703)669-7351
NOTE: Via Routes 58, 23, I!, and 421.
D. S. Francis, President
BIIIST OL--NORTON--JKNK INS--HARLAN--MI D OLESBORO
BRISTOL-JENKINS BUS LINE, INC.
EtsH--Daily except Saturdays, Sundays and Holidays. IBN--BristoI-Ha rlan. BM--Bristo|-M id dlesboro. BJe--B ristoI-J n kin s. BN•- B.ristpI- .N o rto.n- Big. S.t° ne GaiP.° "--ARency station to which baggage may D.e cn.ecKeo and to wnucn prepa Q,
collect and C.O.D. express may be shippeo. t--Station having drop-off service for prepaid express only. BJ•BristoI-Jenk=ns Bus Line, Inc. GI.--Greyhound Lines, Inc. --Daily. (ET)--Eastern Time. e--Change buses,
Bristol, Virginia
To Pikevilte. Ky. 7979
_/"• Plnevilll
gy. P•i
/ •" To R•oke. Va.
T0 Knoxvdle, Tenn. 350 ]*'+"
To Knoxvimle, !•n. 215 •To
Ashevi(b,
BRISTOL" JENKINS ROUTE CONNECTING CARRIERS
BRISTOL--GATE CITY--KINGSPOIIT--NORTON--BIG STON• GAP-- HARLAN--MI DDLESBOI•O
READ DOWN
BI• BJe •m
31 8001 3• 835 3• 900 3• 9• 4' 925 4• 945 sl •oo5{ "• S', zois/ $, 10 4@ 9 1( 61 93(
S• 12•
3032 •.-15--7B (ET)
•rlitel, Va.-T-•o•nnn. b Trailways Term tv Greyhound Term
Blountville APKInIsFect, Term- L• Lv•KIn•rt, Term, k" "Gate City, Ve -Duffield
JPIII Illnt GII•. I.?lll Ste.e •lp
Appalachia Norton
•, ¢oe•urn L•
L?IlI $1ene •=,ll •Pennin•'on •p Lv=Penninston Gap, Ve •r'H=rl•, Ky Lv
I•Pe•ninlt•m •p, Va -Jonesviile •Ewing, Va
•PMidd|e•ll•ro, Ky I.•
READ UP EssH EssH• SM BH
lO 301 •x
I0 051 9 401
9 20i 6 855 8__•!'..'2"__ •3otn 3o S•0] 825:1125 •5• 00110• 4
T 4O I0 901 T-• +.--+.: -•0-- 800 44•__
7 40 7 10 6 4s .":.".): ::"
20. Appalachian Coach Company 121 Baldwin Circle Lynchburg, Virginia 24502 (804)525-1724
NOTE: Seven days/week via Route 221.
ROANOKE--GALAX DOWN Appalachian Coach Company! UP
Folder '='•
103Oi L-• N¢----w- Yor/b----•. Y.-----.- _•(Tg0•) •4 30• Lv W=+hin•o•, •7 • Lv Chotlo+•¢+++l/+
+o', •,• •
• •.•.,
•+12• Bent Mountain • • 05
52•1217+ Check 10112551 =FIo•d
03+3 03 3731 10, DuEsDur 55•1 • •1 • Woodl•wn 15 50• •'GALAX, VA A•CLv
A-IO

21. James River Bus Lines I017 W. Graham Rd. Richmond, Virginia 23220 (804)321-7661
NOTE: Richmond to Buckingham via Routes 6, 15, and 60 Richmond to Irvington via Routes 200, 3, and 360 Richmond to Lawrenceville via Routes 95, I0, 36, I and 46 Richmond to Clarksville via Routes 58, 92, 49, 40, 460, and 95
JAMES RIVER BUS LINES L. Woodrow Story, President I017 West Graham Road Richmond, Virginia 23220
ALL Trips operate daily except Saturday, Sunday and Holidays unless otherwise noted.
R C H MON D-- H OPk'WELL--pLrTEItSBURG--BLACKSTONE RICHMON D--TAPPAHANNOCK-- RICHMOND--FORK UNION-- CLA RKSVI LL£--LAWRENCEVI LLE WARSAW--I RVINGTON BUCKINGHAM READ DOWN 5-1-79 READ UP DOWN 3-11-78 UP READ DOWN 3-5-79 READ P --T•T-_• •-•"-7"•, U
,su.,•=.t •.=. •U•I• me •.=. sat .,.,, •.'uu/ ,,,,, •, •,• 2808
5 15 15 30( Lv'Richmond, Va R4r 9 05,11 15 11 •.5 5 O0 •--• !•-- --I• ;-•i--
•19 •.•1 .• •ug. ,•e.woou..: J•tlO •,btZu •:) '=A)! [a.ey' s •tore 10 35! I• 05 Lv Forrest Tavern.. Lv 10
,•^1 _o• "-"• 0• zLively 55f ?_•1 • L• Gold H I• k•/ a 50! /zu zMc•enney ( l• ! D *A
.__.l 11 Lancaster 50, 21] Lv av dson Lv 6 35 Iberta 00I 23 Kdmarnock 40 30 7Z Lv Alpha Lv 45 , ,
"--Agency to which baggage may be checked Sun--Sunday only, and to which prepaid and collect and C.O.D. •$H--Daily except Saturday, Sunday & Holidays. may be shipped, f--Flag stop. z--•x•ress aEency only. No tickets or checked •=li•=yt; New Year's, Memorial Day, Fourth of
I ;llti•th•i.=r=L=¢=l u•a8•. July. Labor Day ThanksEivinE & Christmas I
•a[.--•a[uroay only. I
22. Winn Bus Lines 909 N. 17th Street Richmond, Virginia 23219 (804)644-9466
NOTE: Monday through Friday except holidays via Routes 33, 22, and 250.
CHARLOTTESVILLE-- LOUISA-- RICHMOND READ DOWN Winn Bus Lines• Inc. IREAD UP
)• Lv'CHARLOTTESVILL£, VA •r )4 20 )4 55 Shadwell )4 10
Cobham )3 57 Boswell Tavern )3 50
)5 O8 )5 151 ,)5 25t Trevillians t)$ 401 )5 301 zLouisa )3 35] ;)5 40 Mineral )$ 25 •6f05[ Cuckoo
Montpelier 08 "•;=_" Farrington k-'RICHMOND, VA Lv )•) lS -;2;;
"--Full service agency station. z--Express aRency only.
A-If

23. Virginia Dare Transportation Manteo, North Carolina 27954 (919)473-2684
NOTE: Daily via Route 168 into North Carolina.
NORFOLK---MANTEO ENGELHARD
Opiated by Vir|inia Dare Transp•tation Coenpany, Inc., Mante•, NC
READ DOWN •'• • •'tia READ
•I0 • 2 30 Ii 15• Lv Philadelphia, PA (7•)CCC• Jetle ZSIIO 1• 9 2• 251 • N, dolk, VA.., CCCLv• 3o •
6 •12 •] 6•1 Chesapeake, VA(CitvHall) 571 1•1 • 101 6 40• Moyock, NC • •1 • •1 6 •t zSligo • •1 • •: • Camden 11• •
7 10 •. 151b'ElitaMth City L• 05 1 •S• 10 45, 15]Lv*EIl=abethClty •l 7•] •$
18 • • Camden 6• 3$[ • • • Currituck &t 101 • 2 10 40• Barco 6 • •1 • 15 ? 451 CoinjocR 6 31112 •
7• 227 757 Grandy 6•1243• • 759 2• 8• PowellsPoint 6 121234•
8• 2 • 15 Point Harbor 6•1225• 16 2 • 2#! Kitty Hawk 5 • 12 16 • ] • • Kill Devil Hills 5 • 12 10 • 8• 3 10 •840] ,•ag• Head 5 4312 • 50 3 • /9 • b ma•t•, N¢ L• • 11 451
• • 55• Nags Head • ._., 10 • • Ha•as •
• Lv
i0 45• N•R•ra• =
• °12 •I • Oerac•e, N¢ • Lv
9 •I L• mant•,•C = •
I0 • Stumpy Point I0 • • lnplh•rd, NC / VltL•
z--Agency station handlin R Express only including C.O.D. Express. •--Daily except Sundays and Holidays. CCC--Via Carolina Traitways. YDT--Virginia Dare Transportation.
24. Colonial Transit Company P. O. Box 508 Fredericksburg, Virginia (703)494-8169
NOTE: See next 4 pages.
22401
All trips operate daily ,',nless.otherwlse noted.
AM--Light Face. PM•BoId Face.
A-12

COLONIAL TRP•NSIT CO.,
GREATER FREDERICKSBURG
TO
WASHINGTON, D.C. and DAHLGREN WEAPONS LAB
COMMUTER SCHEDULES {Effective February I, 1981)
371-51•3 METRO: 550-7884
GENERAL INFORMATION
SCHEDULES Schedules g¢inted this timetable sut•iect chanqe. Colonial Tran•t •.. r•ntible timeta•l• dam•e from
failure •nn•ions. Pa•e•e• d•ign• •hle•d guafante• tragic, weather,
OeVO• •rrier's
TICKETS Pa•angers purchase round-rag, •cke¢s
SEATING •inl flr• basis wit•u[ r•ar• cotor, creW, origin.
TARIFF REGu•TIoNS •loniat Transit •., In• fil• tariff r•ula¢io• a• tim(tat(one
P•RKING All •arking •atron's ri•. Det•nat• Dar•i• for dn•i•
Smoki• p•hibi•
COACH DESIGNATIONS: •erving Federal Triangle •outhwe•t Malt. S•ing Fo•y Bosom. and Streets 2•h •o/•r,• including
i•t•. The fir•
•own (Sta•ord CounwJ Wo•t (Orange •u•)
Flag StooOnly
WASHINGTON.
WA•I•TON.
F•
Mornin•e Li•I
WASHINGTON, 6VO.....• YT...•
P•nwlvan•
Pe•W•,•
Gree•l
A-13

COLONIAL TRANSI'T CO., INC.
PRINCE Wl LLIAM COUNTY TO
NORTHEfLN VIRGINIA
COMMUTER SCHEDULES [Effective An•l
x21__._# K2.•2 K2• K2._• K3• K3• K3• K12• K13• C2• •30•
GENERAL INFORMATION
•
•l't
C23# ARRIVAL•
CRYSTAL
A• K• K2•
K--,I• 'ARRIVAU' v•.m' CO.:' K22 K• K31@' '•1• XC)•
OCCO•UAN/WOODeR
A-14

A-15

TO
WA•HTNGTON, D.C.
COMMUTER SCHEDULES (Effective Janua,"y 19, •H
COLONIAL TR.•NSIT CO., INC. WASH.,
LA•KE R•DG E/OC OQU At•/Db •'M R.I• S/TRL•G L•
Br,•e
Torri•On
INFORMATION
aam• F•ehe¢•oneS•o•C•r.
•32
Sho•
Torrln•lon
Plrk,•
Y4• • Y4• 64• G4• O• O3• O3• •4• 83• WK4• OCCOQUAN•B•mGE•.S,
Flig
A-16
Related Documents