United Nations Statistical Commission ESA/STAT/AC.193/1 United Nations Statistics Division Instituto Nacional de Estadística y Geografía de México November 2009 _____________________________________________________________________________ Meeting of the Friends of the Chair of the United Nations Statistical Commission on Statistical Indicators on Violence against Women 9 - 11 December 2009 Aguascalientes, Mexico Methodological Overview of Surveys on Violence against Women 1 By United Nations Statistics Division 2 1 Issued without formal editing. 2 This paper is edited and finalized by Srdjan Mrkić of the United Nations Statistics Division based on the research and first draft by Ms. Bosiljka Djikanović acting as a consultant to the United Nations Statistics Division.

Welcome message from author
This document is posted to help you gain knowledge. Please leave a comment to let me know what you think about it! Share it to your friends and learn new things together.
Transcript

United Nations Statistical Commission ESA/STAT/AC.193/1 United Nations Statistics Division Instituto Nacional de Estadística y Geografía de México November 2009 _____________________________________________________________________________ Meeting of the Friends of the Chair of the United Nations Statistical Commission on Statistical Indicators on Violence against Women 9 - 11 December 2009 A
guascalientes, Mexico
Methodological Overview of Surveys on Violence against Women1
By United Nations Statistics Division2
1 Issued without formal editing. 2 This paper is edited and finalized by Srdjan Mrkić of the United Nations Statistics Division based on the research and first draft by Ms. Bosiljka Djikanović acting as a consultant to the United Nations Statistics Division.

Introduction 1. Recognizing that violence against women represents an omni-present and extremely hurtful
phenomenon in the contemporary world, the United Nations General Assembly adopted a set of resolutions calling on governments to undertake all necessary activities and measures to eradicate these practices. This highest representative body also requested the UN Secretariat to work on adequate tools for measuring the prevalence and incidence of violence against women and to develop universal standards and definitions in that respect. The UN General Assembly specifically requested that the United Nations Statistical Commission, as the apex body of the international statistical system, identifies and defines statistical indicators on violence against women. Consequently, the UN Statistical Commission established the group of countries acting as Friends of the Chair and entrusted it with developing the indicators and other methodological standards for implementation in national statistical systems.
2. Under this mandate, the Friends of the Chair submitted a report to the UN Statistical Commission at
its 40th session in February 2009 consisting of an interim set of statistical indicators3. The UN Statistical Commission requested the Friends of the Chair to continue their work towards establishing indicators and accompanying guidelines for developing statistical surveys on violence against women.
3. In order to comply with this request, the United Nations Statistics Division, acting as the secretariat
of the Friends of the Chair, undertook a methodological overview of surveys on violence against women that were conducted in the recent years. The major goal of the overview is to assess the extent of applicability of the interim set of indicators in the representative corps of conducted survey on violence against women. Even more specifically, the purpose is to evaluate whether these surveys were able to provide statistics as requested by the interim set of indicators. The findings are designed to guide the further work of the Friends of the Chair in developing more specific recommendations in terms of classification of different forms of violence, severity, frequency, relationship to the offender and so forth.
4. Hence, the starting point of this analysis is the interim set of indicators, defined as follows:
a) Total and age-specific rate of women subjected to physical violence in the last 12 months by severity of violence, relationship to the perpetrator(s) and frequency
b) Total and age-specific rate of women subjected to physical violence during lifetime by severity of violence, relationship to the perpetrator(s) and frequency
c) Total and age-specific rate of women subjected to sexual violence in the last 12 months by relationship to the perpetrator(s) and frequency
d) Total and age-specific rate of women subjected to sexual violence during lifetime by relationship to the perpetrator(s) and frequency
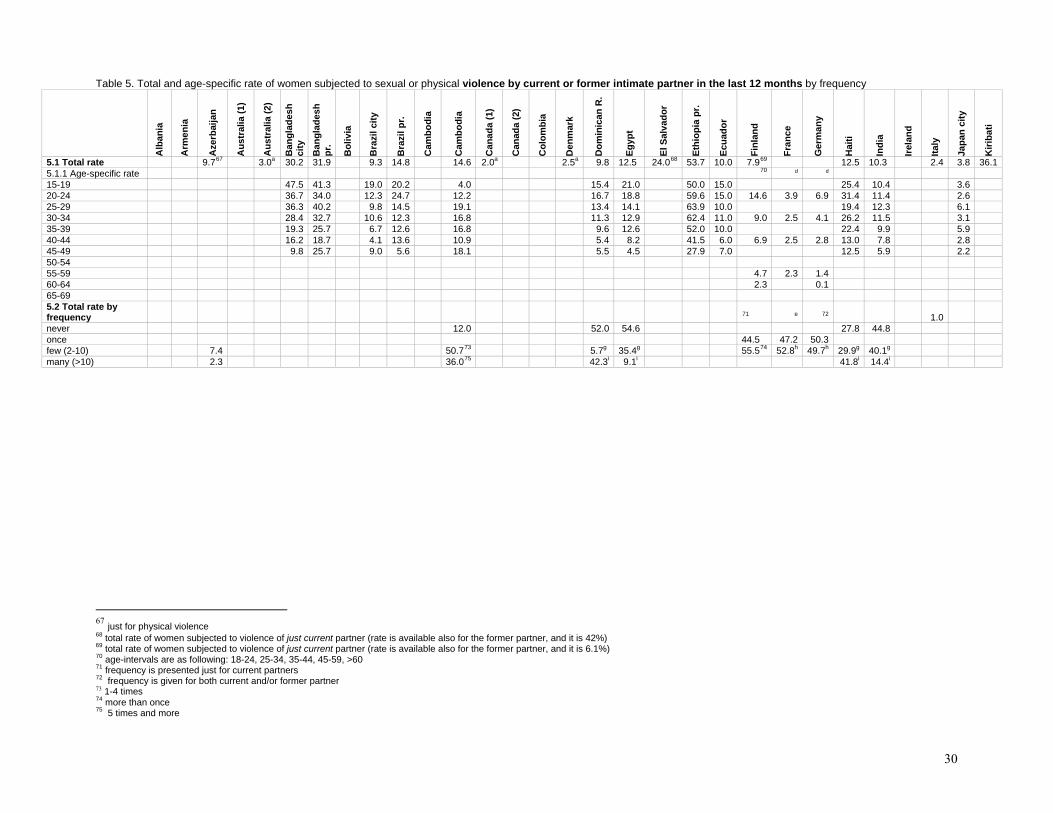
e) Total and age-specific rate of women subjected to sexual or physical violence by current or former intimate partner in the last 12 months by frequency
f) Total and age-specific rate of women subjected to sexual or physical violence by current or former intimate partner during lifetime by frequency
3 The full text of the report is available as the document number E/CN.3/2009/13 submitted to the Fortieth Session of the United Nations Statistical Commission and (in all official United Nations languages) also at: http://unstats.un.org/unsd/statcom/doc09/2009-13-GenderStats-E.pdf.
2

The definition of terms is as follows:
(a) Total rate: Proportion of women aged 15 years and over subjected to physical/sexual violence over the total number of women aged 15 years and over. This rate may be presented as a fraction (e.g. 1 out of 10) or as a percentage (e.g. 10 per cent of total)
(b) Age-specific rate: Proportion of women of a certain age subjected to physical/sexual violence over the total number of women of the same age (5-year age groups starting at 15 years of age). This rate may be presented as a fraction (e.g. 1 out of 10) or as a percentage (e.g. 10 per cent of total).
(c) Total and specific rates for intimate partner violence: Proportion of women aged 15 and over subjected to physical or sexual violence by current or former partner over the total number of women aged 15 and over who have or had an intimate partner.
5. This paper is organized in two parts and the accompanying annexes. Overall characteristics and
descriptions of the included surveys, i.e. similarities and differences in methodologies applied to collect the relevant information, are elaborated in the first part. The second part discusses the availability of these indicators in terms of total rates, age intervals, definitions of severity of violence, type of perpetrators, and frequencies of violent acts.
6. For this overview 59 nationally representative surveys were identified, coming from 49 countries4. It
has to be clearly emphasized that this list is not exhaustive: there are national surveys that were conducted but not covered in this overview. Some of the surveys conducted under the project International Violence against Women Survey hosted by the European Institute for Crime Prevention and Control, affiliated with the United Nations (HEUNI) are not represented here. This is primarily the consequence of the fact that the availability of data from these not included surveys and the timetable for the production of this overview did not coincide. However, it is expected that the sample that is used for this overview is highly representative and provides solid ground for discussions and conclusions.
7. All statistics pertaining to the interim set of indicators as described above were extracted from the
surveys – where available - and are displayed in tables 1 through 6 at the end of this overview. Overall availability of proposed indicators is summarized and presented in percentages5, while the description of availability of individual indicators is provided in the second part.
1. Methods of collection
8. The report of the Friends of the Chair submitted to and adopted by the United Nations Statistical Commission in February 2009 points to a separate, dedicated statistical surveys on violence against women developed within the national statistical system as the optimal vehicle for collecting accurate and reliable statistics on this phenomenon. It also mentions a possibility of using a module attached to some other statistical survey as an alternative, in case the first option is not feasible. In this overview, a number of national separate and dedicated statistical surveys are taken into account, such as those conducted by Armenia, Australia6, Cambodia7, Canada8, Denmark, Ecuador, Finland, France, Germany, Ireland, Italy, Lithuania, Mexico9, Norway, Poland, Republic of Korea, Romania,
4 The list of countries and sources is presented in Annex A. 5 See Annex B. 6 Included are results from two surveys. 7 Included are results from two surveys. 8 Included are results from two surveys. 9 Mexico conducted two dedicated violence against women surveys, in 2003 and 2006. Included in this overview is only the more recent one, due to language barrier.
3
Slovakia, Sweden, United Kingdom and United States of America. An attached module to the national demographic and health survey was used for collection of statistics on violence against women in Albania, Bolivia, El Salvador, Moldova and Paraguay.
9. Included in this overview are ten countries10 that used the World Health Organization Violence
against Women (WHO-VAW) methodology, as a part of the WHO Multi-country study on Women’s Health and Domestic Violence. In five of these countries11 the survey was conducted in both the Capital (or another large city) and in the province, and these results from both the large city and the province are included in this report. In addition, four countries12 directly applied the WHO-VAW methodology on a nationally representative population sample, and these are included in this report as well.
10. Another ten countries13 applied Demographic and Health Survey (DHS) methodology and module;
their results are mutually comparable and included in this overview. 11. One nationally representative study (Russia) attempted to assess violence based on the family as a
unit of enumeration, and questions regarding violence were asked in an impersonal way. Respondents (both women and men) answered whether certain violent acts happened in their own family, but it was not specified to whom (the victim), and by whom (the perpetrator). Consequently, this survey did not prove to be a valid source for extracting the data on indicators as defined by the interim set.
1.1. Age groups 12. As already well documented, the age of the woman victimized by violence is crucial information
necessary for assessing the scope and impacts of this phenomenon. Consequently, all the indicators are requesting the relevant statistics to be disaggregated by 5-year age groups. The findings indicate that the delineation of age groups varied between different surveys. In most cases 5-year age groups were used for presentation and analysis of the results, pursuant to the Friends of the Chair report. However, in several surveys, 10-year age groups were used, while a few of them combined 5- and 10-year intervals. Some surveys have also disaggregated the youngest age group, up to 20, to smaller that 5-year age groups (either presenting data by single years of age or by some combination of 2- or 3-year age groups. It indicates that designers of these surveys recognized women’s age as an important risk factor for experiencing violence, and young women as the most vulnerable group. Wherever information of age of victimized women was available, irrespective of the age classification applied, they have been presented in this overview, followed by an explanatory footnote.
1.2. Severity of violence 13. When it comes to severity, two major approaches can be distinguished. The first assessment of the
severity of perpetrated violence against women is based on the characteristics and the existence of physical injuries themselves. More specifically, in terms of whether the violence resulted in some form of injury and if so, how severe the injury was. The second approach was based on the nature of violent acts themselves, placing them in either “moderate” or “severe” acts.
10 Bangladesh, Brazil, Ethiopia, Japan, Namibia, Peru, Samoa, Serbia, Tanzania, and Thailand. 11 Bangladesh, Brazil, Peru, Tanzania, and Thailand. 12 Maldives, Kiribati, Solomon Islands, and Turkey. 13 Azerbaijan, Cambodia, Colombia, Dominican Republic, Egypt, Haiti, India, Nicaragua, Peru, and Zambia.
4

14. In WHO-VAW survey, women were considered to have suffered severe violence if they have experienced at least one of the following acts: being hit with a fist or something else, kicked, dragged, beaten up, burnt on purpose, threatened with or had a weapon used against them. Severe violence may also include moderate acts that escalated into more severe ones. Women are considered to have suffered moderate violence if they have been slapped, pushed, shoved or had something thrown at them. Moderate violence excludes any of the acts categorized as severe violence.
15. In DHS surveys, “moderate” violence is considered as an incidence where a woman experienced at
least one act of the following: (a) being pushed, shaken, or thrown something at her, (b) being slapped or arm-twisted, (c) punched with a fist or something that could hurt, (d) bitten, and (e) kicked or dragged. Severe violence is considered if someone did at least one act of the following to women: (f) tried to strangle or burn her, (g) threaten her with a knife, gun, or other type of weapon, and (h) attacked her with a knife, gun or other type of weapon.
16. In the US survey, for example, there are two options of severity of violence: simple assault, and aggravated assault. In other countries the survey relied on women’s own estimation and perception of severity of experienced violence.
17. Figures on severity of experienced violence presented below are, most often, related to violence
performed by an intimate partner, if not indicated differently.
1.3. Relationship to the perpetrator(s) 18. Most of the surveys recognized and measured violence perpetuated by an intimate partner, current
or former one, as the only perpetrator. Several surveys have also distinguished between former and current partner, recognizing that women are the most in danger of their former partners, or when being in the process of separation. If not indicated differently, total rate by the relationship to the intimate partner as a perpetrator is presented as a proportion of ever-partnered or ever-married women who experienced physical/sexual intimate partner violence, during the lifetime/last twelve months.
19. Some surveys have “other than intimate partner” as a single category. In other cases, categories
included “family member”, at times further distinction of members being whether male or female; father/stepfather; mother/stepmother; sister/brother; daughter/son; and also father in law and mother in law. Other categories included friends or neighbors; professional caregivers or helpers; colleagues at work or school; casual acquaintances, and unknown persons (strangers). In two surveys, boyfriend as a perpetrator was also considered as a separate category.
1.4. Frequency 20. Frequency was not uniformly assessed as well. WHO-VAW method considered three categories of
frequencies of violent acts: once, a few times, and many times. However, different surveys defined it in a different way. In presenting the findings for each set of indicators, the availability of statistics on frequency is provided as well as additional elaboration of modalities.
2. Indicators on Violence against Women 21. These indicators have been presented in Tables 1 to 6, and their description is elaborated in
paragraphs below.
5
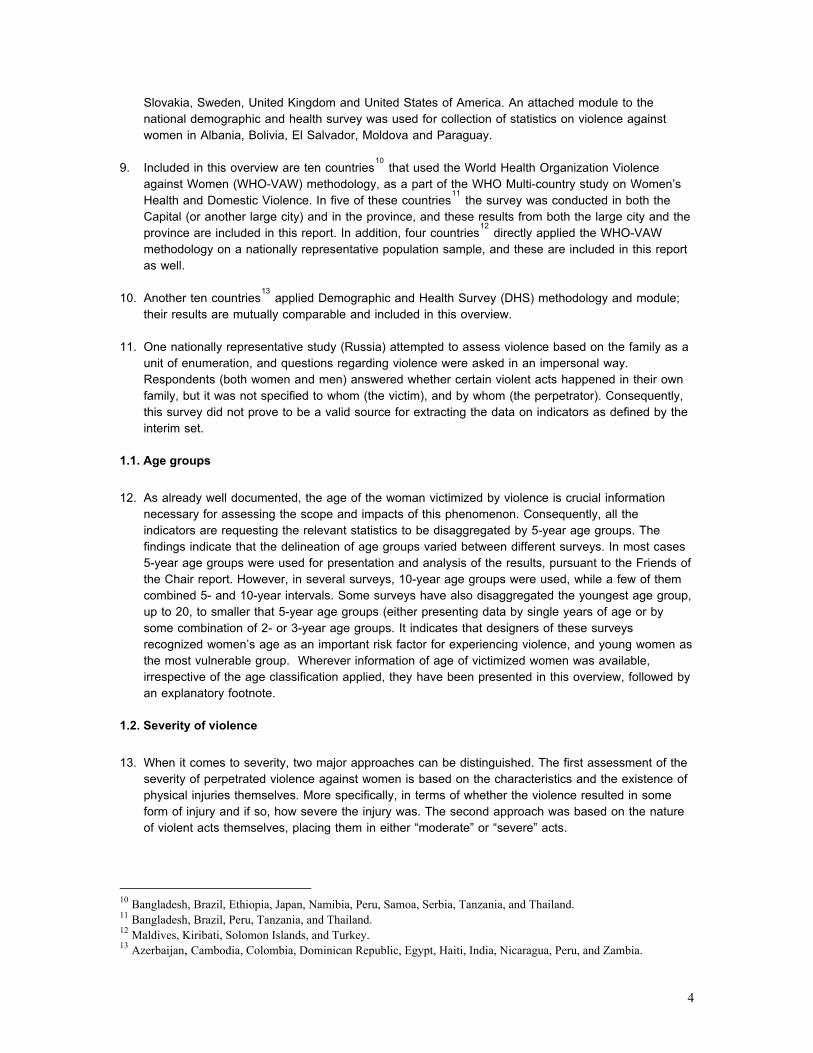
2.1 Total and age-specific rate of women subjected to physical violence in the last 12 months by severity of violence, relationship to the perpetrator(s) and frequency 22. Availability of this indicator in nationally
representative surveys is presented in Table 1 and Figure 1, as well as its disaggregation by severity, relationship to the perpetrator(s), and frequency.
Figure 1. Availability of statistics on physical violence against women in the last 12 months by
indicator components
0
20
40
60
80
100
Total rate Age-specificrate
Total rate byseverity
Total rate byrelationship
Total rate byfrequency
Per
cent
Total rate 23. Total rate of women subjected to
physical violence in last 12 months was available in ten surveys (17%). In one national survey, that figure encompassed total violence, not just physical, and therefore, it could be an overestimate, which has to be taken into account when comparing indicators themselves.
Age-specific rate 24. Further disaggregation for age groups was available for just three surveys, but in 10-year age
groups. In one of them, age specific rate was not calculated for the total number of interviewed women in each age group; instead, it presents a simple breakdown of the total rate, by age groups. Presenting data in such a way limits comparisons with standard age-specific rates, coming from other surveys.
25. However, standard age-specific rate was available in another fifteen surveys as well, although total
rate was not presented. These rates were coming from WHO-VAW Multi-country surveys. Severity 26. Disaggregation by severity of physical violence suffered by women in the past 12 months was
available in less than half of the considered surveys (27 or 44%). Categories “moderate” and “severe” were provided in 24 surveys, while acquired injuries, as an indicator of severity of violence, were presented in four surveys.
Relationship to the perpetrator 27. Relationship to the perpetrator, distinguished for at least an intimate partner, was available in almost
two thirds of the surveys (38 or 63%). Out of these 38, 30 mentioned just an intimate partner as a perpetrator, while the rest (eight) of the surveys considered other categories of perpetrators. If not indicated differently, total rate by the relationship to the intimate partner as a perpetrator is presented as a proportion of ever-partnered or ever-married women who experienced intimate partner violence during the last twelve months.
6

Frequency 28. The information on frequency of women subjected to physical violence in the last 12 months was
available in just two surveys (3%), but disaggregated by either severity or age group, and therefore, their values have not been presented in Table 1.
2.2 Total and age-specific rate of women subjected to physical violence during lifetime by severity of violence, relationship to the perpetrator(s) and frequency 29. Availability of this indicator in nationally
representative surveys is presented in Table 2, as well as its disaggregation by severity, relationship to the perpetrator(s), and frequency.
Figure 2. Availability of statistics on physical violence against women during lifetime by indicator
components
0
20
40
60
80
100
Total rate Age-specificrate
Total rate byseverity
Total rate byrelationship
Total rate byfrequency
Per
cent
Total rate 30. Total rate of women subjected to physical
violence during lifetime was retrieved from 30 surveys (50%). There is possible overestimation of the total rate which comes from the one national survey, since it presents both physical and sexual violence. The total rate from another survey is also of the vague quality, since women were asked for experience with violence in their families, but not directly whether it happened to them.
Age-specific rate 31. Disaggregation of rates for age groups was available in 17 surveys (29%), although in seven of
them, the total rate was not available; these were coming from WHO-VAW Multi-country surveys. Severity 32. Disaggregation by severity of lifetime physical violence against women was available in two thirds of
the considered surveys – in 39 surveys (66%). Both categories “moderate” and “severe” were considered in 28 surveys, while acquired injuries, as the single indicator of severity of violence, were presented in 5 surveys.
Relationship to the perpetrator 33. Statistics on relationship to the perpetrator(s), for at least one and the most common category -
current or former intimate partner - was available in a significant majority the surveys, i.e. 49 surveys (83%). In general, total rate of women subjected to physical violence by the intimate partner as a perpetrator is presented as a proportion of ever-partnered or ever-married women who experienced physical intimate partner violence during their lifetime. In two surveys, this rate is a proportion of women who experienced physical violence starting from age 15; in one survey, it is a proportion of women who experienced moderate (and severe) abuse, while in another one, the rate referred to the last five years, not the lifetime.
7

34. Six surveys recognized and separately measured intimate partner violence perpetuated by current partner and former partner. Further disaggregation by perpetrators other than intimate partner was available in fifteen surveys.
Frequency 35. Frequency of different acts of physical violence against women was available in just six surveys
(10%). In two of them, data are disaggregated by either severity of violent acts, or age group, and, therefore, their values have not been presented in Table 2. In three surveys, data on frequency are available, but just among women who experienced violence by perpetrators other than intimate partners. In one survey, frequency statistics are available, although the question itself is unclear and imprecise; the indicator is noted in Table 2, under an assumption that women are the victims of the violent acts happening in their families. It could be implied that generating statistics on frequency in this manner refers primarily (or exclusively) to intimate partner violence, although that is not completely clear.
36. This practically means that none of the surveys provided reliable data of frequency of physical
violence against women during their lifetime, no matter of perpetrator. All six generated values have their own limitations and they are not mutually comparable.
2.3 Total and age-specific rate of women subjected to sexual violence in the last 12 months by relationship to the perpetrator(s) and frequency 37. Availability of this indicator from
nationally representative surveys is presented in Table 3, as well as its disaggregation by relationship to the perpetrator(s) and frequency.
Figure 3. Availability of statistics on sexual violence against women in the last 12 months by indicator
components
0
20
40
60
80
100
Total rate Age-specific rate Total rate byrelationship
Total rate byfrequency
Per
cent
Total rate 38. Total rate was retrieved from just eight
surveys (13%). For one of them, it is not clear whether available rate presensexual violence by all perpetrators, or just by an intimate partner.
ts
Age-specific rate 39. Disaggregation by age groups was available in one third of the surveys – in 20 surveys (34%). Five
years age groups, as proposed by the friends of the Chair, were available in 15 surveys, while at the other five, a combination of 5-year and 10-year intervals was presented.
Relationship to the perpetrator 40. Information on the relationship to the perpetrator was generated in 38 surveys (64%), for at least
whether the violence was perpetrated by the intimate partner. For the other, non-partner perpetrators, out of these 38 surveys, data were available in just four of them. One survey made distinction between current and former intimate partners as perpetrators of violence.
8

Frequency 41. Frequency of this act was available in just one survey, and it refers to a spouse (intimate partner) as
a perpetrator. 42. This practically means that frequency is largely missing for this indicator as well.
2.4 Total and age-specific rate of women subjected to sexual violence during lifetime by relationship to the perpetrator(s) and frequency 43. Availability of this indicator in nationally
representative surveys is presented in Table 4, as well as its disaggregation by relationship to the perpetrator(s) and frequency.
Total rate 44. This indicator was retrieved from 20% of
the surveys (12 out of 59 surveys). Age-specific rate 45. Age-specific rate was available for 18
surveys (29%). Five years age groups, as proposed by the friends of the Chair, were available in 16 surveys. In four surveys (four), statistics by 5-year age groups were available only for violence perpetrated by the intimate partner.
Figure 4. Availability of statistics on sexual violence against women during lifetime by indicator
components
0
20
40
60
80
100
Total rate Age-specific rate Total rate byrelationship
Total rate byfrequency
Per
cent
Relationship to the perpetrator 46. Information on the relationship to the perpetrator was available for 42 surveys (71%), where at least
an intimate partner was distinguished as a perpetrator. A few surveys distinguished violence perpetuated by current and former partners. In 28 surveys information on the relationship to the perpetrator, in addition to an intimate partner, includes data for other categories of perpetrators of sexual violence as well.
Frequency 47. Frequency of this act was available in just 4 surveys (6%). In three of them, frequency is broken
down in just two groups (1-2 times, and three and more times), exclusively for non-intimate partner violence. Hence, this indicator is also largely missing.
2.5 Total and age-specific rate of women subjected to sexual or physical violence by current or former intimate partner in the last 12 months by frequency 48. Availability of this indicator in nationally representative surveys is presented in Table 5, as well as its
disaggregation by age and frequency.
9
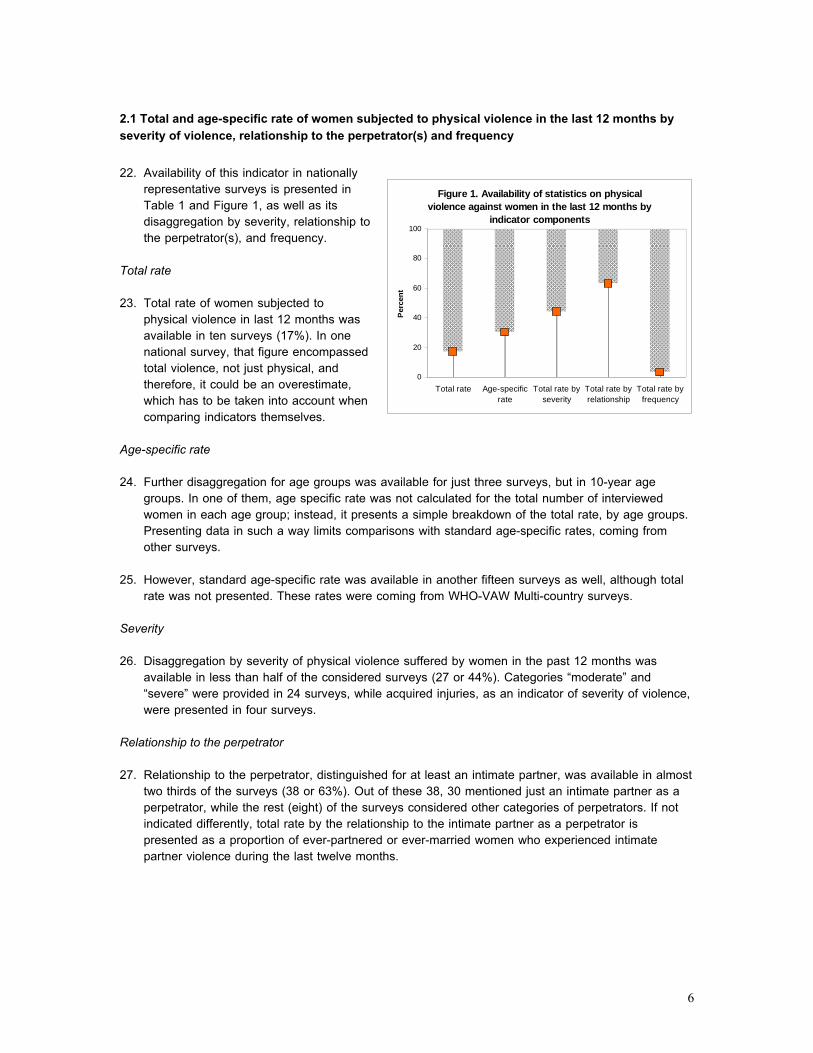
Total rate 49. In the process of developing this methodological overview it became apparent that the last two set
of indicators – intimate partner violence –pose methodological challenges. The first one, also recognized in the report of the Friends of the Chair, is that these two indicators overlap with the first four, since they are a subset of the former. This may confuse the developers of statistical instruments for measuring violence against women.
50. In addition, the way these two indicators
are defined - as either physical OR sexual violence, performed by an intimate partner – would imply that one form of violence excludes the other. For example, analysts and compilers of results might be unsure whether to add all the occurrences of both physical and sexual violence suffered by a woman or to focus on the one with most incidences. Physical violence by intimate partner is much more frequent than sexual violence; therefore applying the definition as it stands might underestimate occurrences of sexual violence. Sexual violence in many cases appears along with physical violence, i.e. overlap with it.
Figure 5. Availability of statistics on sexual or physical by current or former intimate partner in the last 12 months and during lifetime by indicator
components
0
20
40
60
80
100
Total rate Age-specific
rate
Total rateby
frequency
Total rate Age-specific
rate
Total rateby
frequencyPe
rcen
t
51. Consequently, this indicator and the accompanying rate can be defined as physical AND/OR sexual
violence, among ever-partnered women. Some national surveys considered this comprehensive indicator, which is the case when WHO-VAW method was applied. When indicator concerns just physical violence, it was indicated in footnotes to Table 5.
52. Total rate of women subjected to intimate partner violence in the last 12 months was available from
62 surveys (63%). Four of them considered just physical violence, and therefore, such a figure could be underestimated because data for sexual violence are missing.
Age-specific rate 53. Further disaggregation by age groups of women suffering violence was available for less than half
of surveys – 29 surveys (49%). Five years age groups, as proposed by the Friends of the Chair, were available in 23 surveys, while for the rest of them, different combinations of age intervals were presented.
Frequency 54. Frequency of this act was available in thirteen surveys, or 22%.
2.6 Total and age-specific rate of women subjected to sexual or physical violence by current or former intimate partner during lifetime by frequency 55. Availability of this indicator in nationally representative surveys is presented in Table 6, as well as its
disaggregation by age and frequency.
10

Total rate 56. This indicator was retrieved from more than three quarters of the surveys – 46 surveys (78%, Table
6). As mentioned above, indicator proposed in this way might be missing certain number of women who experienced both sexual and physical intimate partner violence during their lifetime, and therefore, in certain cases (indicated in the footnotes) this indicator is underestimated.
Age-specific rate 57. Further disaggregation for age groups was available for more than half of the surveys – 31 surveys
(53%). Five years age groups, as proposed by the friends of the Chair, were available in 26 surveys, while for the rest of the surveys (five), different combinations of age groups were presented.
Frequency 58. Frequency of this act was available in just three surveys (5%). Concluding remarks 59. Statistics for only one indicator – women experiencing physical violence during lifetime by
relationship to the perpetrator - were generated by over 80% of the total number of surveys subjected to this analysis. And even for that indicator the list of relationship in most cases included current or former intimate partner, not the fully developed list of different relationships. Data for all the other indicators were generated by a fewer number of surveys. It is especially telling to note the very low number of surveys that were generating information on frequency of violence against women for all forms violence.
60. The relationship to the perpetrator of violence against women was one of the major focuses of all
the surveys. It is necessary to note that the classification of perpetrators in most cases stopped at the intimate partner (current or former) and in cases where it was extended, it differed significantly from one survey to the other.
61. The relative lack of the availability of the total rate of women subjected to physical violence in the
last 12 months and during lifetime (17% and 50%, respectively) and sexual violence in the last 12 months and during lifetime (14% and 20%, respectively) points to the need to further investigate the type of methodological obstacles that prevented such computations. Similarly, the availability of statistics on age-specific rates for both physical and sexual violence was available in about one-third of the surveys and this also calls for additional technical analysis on the computation of rates.
62. It appears that the last two indicators of the interim set – physical or sexual violence by current of
former immediate partner in the last 12 months and during lifetime – need to be revisited. The first conclusion is that they should be reformulated in the line of including the and/or qualifier, replacing just the or.
63. More substantially, these two indicators differ from the first four only by the fact that both physical
and sexual violence are added together and that the denominator for the rates refers to ever-partnered women only – not to the total number of women in 5-year age groups. The fact that they are essentially redundant with the first four appears to generate confusion in applying the interim set of indicators. This overview found that even for the first four indicators the denominator is more
11

often than not the total number of ever-partnered women when age-specific rates of women subjected to violence are calculated.
64. Furthermore, given the ongoing discussion that the definition of the intimate partner should not be
limited only to a partner in sexual intercourse, but could also be extended to a non-sexual relationship – boyfriend, for example – raises the questions how significant is the difference between the number of ever-partnered women and the total number of women in each age group. It can be expected that the differences might be somewhat significant in very early ages under consideration – 15 and 16; the broader definition of intimate partner would certainly decrease these differences to the minimum in older ages – implying that almost all women over 18 were in some kind of relationship that falls within the category of intimate.
65. The variability of the capacities of surveys for measuring violence against women included in this
overview to generate indicators as defined in the report of the Friends of the Chair points to the need to move beyond indicators and to define and develop a set of classifications of violence, severity of violence, definition and classification of relationship to the perpetrator, and frequency; the need to develop international guidelines that will provide a sound and comprehensive methodological package for instituting violence against women statistical surveys in national statistical systems; and the need to follow-up these activities with training and capacity-building.
12

ANNEX A. List of the countries and sources
Country Source
ALBANIA Reproductive Health Survey
ARMENIA WRC 2007 Domestic Violence and Abuse of Women in Armenia, May 2007
AZERBAIJAN Demographic and Health Survey 2006, module on domestic violence
AUSTRALIA (1) Personal safety 2005. Australian Bureau of Statistics.
AUSTRALIA (2) International Violence Against Women Survey (IVAWS) - Australian component, 2003
BANGLADESH –
city and province
WHO Multi-country Study on Women's Health and Domestic Violence against Women. Initial results in prevalence, health outcomes and women's responses. Garcia-Moreno C, Jansen HAFM, Ellsberg M, Heise L, Watts C. World Health Organization, 2005
BOLIVIA Instituto Nacional De Estadistica, Encuesta Nacional de Demografia y Salud, 2003
BRAZIL –
city and province
WHO Multi-country Study on Women's Health and Domestic Violence against Women. Initial results in prevalence, health outcomes and women's responses. Garcia-Moreno C, Jansen HAFM, Ellsberg M, Heise L, Watts C. World Health Organization, 2005
CAMBODIA (1) Violence against women. A baseline survey. Cambodia Final Report, 2005
CAMBODIA (2) Kishor, Sunita and Kiersten Johnson. Profiling Domestic Violence – A Multi-Country Study. Calverton, Maryland: ORC Macro, 2004
CANADA (1) Measuring Violence Against Women: Statistical Trends, 2006
CANADA (2) General Social Survey on Victimization - Violence Against Women module, 2004
COLOMBIA Kishor, Sunita and Kiersten Johnson. Profiling Domestic Violence – A Multi-Country Study. Calverton, Maryland: ORC Macro, 2004
DENMARK
Men's violence against women. Extent, characteristics ad the measures against violence - 2007. English Summary. Minister for Gender Equality National Institute of Public Health, Denmark, National Health Survey, 2000
DOMINICAN REPUBLIC Kishor, Sunita and Kiersten Johnson. Profiling Domestic Violence – A Multi-Country Study. Calverton, Maryland: ORC Macro, 2004
13

EGYPT Kishor, Sunita and Kiersten Johnson. Profiling Domestic Violence – A Multi-Country Study. Calverton, Maryland: ORC Macro, 2004
EL SALVADOR Encuesta Nacional de salud Familiar, FESAL 2002/03
ETHIOPIA - province
WHO Multi-country Study on Women's Health and Domestic Violence against Women. Initial results in prevalence, health outcomes and women's responses. Garcia-Moreno C, Jansen HAFM, Ellsberg M, Heise L, Watts C. World Health Organization, 2005
ECUADOR Available at www.cepar.org.ec/endemain_04/nuevo06/violencia/violencia_m.htm
FINLAND
Minna Piispa, Markku Heiskanen, summary Juha Kääriäinen & Reino Sirén National Research Institute of Legal Policy Publication No. 225 The European Institute for Crime Prevention and Publication Series No. 51. Control, affiliated with the United Nations (HEUNI) Helsinki 2006 VIOLENCE AGAINST WOMEN IN FINLAND, and also
CAHRV project: Comparative reanalysis of prevalence of violence against women and health impact data in Europe – obstacles and possible solutions, December 2006 (the report was prepared within the Co-ordination Action on Human Rights Violations (CAHRV) and funded through the European Commission, 6th Framework Programme, Project No. 506348)
FRANCE
Dominique Fougeyrollas-Schwebel. Violence against women in France: the context, findings and impact of the Enveff survey? CNRS-IRIS-CREDEP Universit´e Paris Dauphine, France. Published in Statistical Journal of the United Nations ECE 22 (2005) 289–300 289 IOS Press, and also
CAHRV project: Comparative reanalysis of prevalence of violence against women and health impact data in Europe – obstacles and possible solutions, December 2006 (the report was prepared within the Co-ordination Action on Human Rights Violations (CAHRV) and funded through the European Commission, 6th Framework Programme, Project No. 506348)
GERMANY
Health, Well-Being and Personal Safety of Women in Germany. A representative Study of Violence against Women in Germany, comissioned by the Federal Ministry for Families, Senior Citizens, Women and Youth
HAITI Kishor, Sunita and Kiersten Johnson. Profiling Domestic Violence – A Multi-Country Study. Calverton, Maryland: ORC Macro, 2004
INDIA Kishor, Sunita and Kiersten Johnson. Profiling Domestic Violence – A Multi-Country Study. Calverton, Maryland: ORC Macro, 2004
IRELAND
Domestic Abuse of Women and Men in Ireland Report on the National Study of Domestic Abuse From the National Crime Council in association with the Economic and Social Research Institute. © National Crime Council 2005. Designed and Printed by First Impression July, 2005
14

ITALY
Violence and abuses against women inside and outside family, ISTAT, 2006, also
Measuring violence: indicators from the Italian violence against women surveys. Submittet by ISTAT, Ms Maria Giuseppina Muratore. Expert Group Meeting on indicators to measure violence against women, Geneva, 8-10 October 2007
JAPAN - city
WHO Multi-country Study on Women's Health and Domestic Violence against Women. Initial results in prevalence, health outcomes and women's responses. Garcia-Moreno C, Jansen HAFM, Ellsberg M, Heise L, Watts C. World Health Organization, 2005
KIRIBATI Kiribati family health and support study: a study on violence against women and children, 2008
KOREA
Violence against women in Koreaand its indicators. Invited paper, prepared by Whasoon Byun, Korean Women’s Development Institute. Expert Group Meeting on indicators to measure violence against women, Geneva, 8-10 October 2007
LITHVANIA
CAHRV project: Comparative reanalysis of prevalence of violence against women and health impact data in Europe – obstacles and possible solutions, December 2006. (the report was prepared within the Co-ordination Action on Human Rights Violations (CAHRV) and funded through the European Commission, 6th Framework Programme, Project No. 506348.
MALDIVES
The Maldives Study on Women's Health and Life Experiences. Initial results on prevalence, health outcomes and women's responses to violence. Author: Emma Fulu
MEXICO
ENDIREH-2006’S achievements and limitations in determining indicators for measuring violence against women in Mexico. Invited paper. Submitted by Mexico, prepared by Eva Gisela Ramirez. Expert Group Meeting on indicators to measure violence against women, Geneva, 8-10 October 2007
MOLDOVA Demographic health survey (DHS), 2005
NAMIBIA - city
WHO Multi-country Study on Women's Health and Domestic Violence against Women. Initial results in prevalence, health outcomes and women's responses. Garcia-Moreno C, Jansen HAFM, Ellsberg M, Heise L, Watts C. World Health Organization, 2005
NIKARAGUA Kishor, Sunita and Kiersten Johnson. Profiling Domestic Violence – A Multi-Country Study. Calverton, Maryland: ORC Macro, 2004
NORWAY
Thomas Haaland, Sten-Erik Clausen and Berit Schei Couple Violence - different perspectives. Results from the first national survey in Norway. NIBR Report: 2005:3
PARAGUAY Encuesta nacional de demografía y salud sexual y reproductiva endssr 2004
15

PERU
Kishor, Sunita and Kiersten Johnson. 2004. Profiling Domestic Violence – A Multi-Country Study. Calverton, Maryland: ORC Macro.
PERU –
city and province
WHO Multi-country Study on Women's Health and Domestic Violence against Women. Initial results in prevalence, health outcomes and women's responses. Garcia-Moreno C, Jansen HAFM, Ellsberg M, Heise L, Watts C. World Health Organization, 2005
POLAND
Beata Gruszczyńska, Przemoc wobec kobiet w Polsce. Aspekty prawnokryminologiczne, Oficyna Wolters Kluwer, Warszawa 2007. Survey on Violence Against Women in Poland. Key Findings.
ROMANIA VIOLENłA DOMESTICĂ ÎN ROMÂNIA. Ancheta Sociologica La Nivel National, Martie – Aprilie 2008
RUSSIA Violence in family. Moscow, June - Decembre 2006
SAMOA
WHO Multi-country Study on Women's Health and Domestic Violence against Women. Initial results in prevalence, health outcomes and women's responses. Garcia-Moreno C, Jansen HAFM, Ellsberg M, Heise L, Watts C. World Health Organization, 2005
SERBIA - city
WHO Multi-country Study on Women's Health and Domestic Violence against Women. Initial results in prevalence, health outcomes and women's responses. Garcia-Moreno C, Jansen HAFM, Ellsberg M, Heise L, Watts C. World Health Organization, 2005
SLOVAKIA Representative Research on Prevalence and experience of Women with Violence against Women [VAW] in Slovakia. Bratislava, May 2008
SOLOMON ISLANDS
Solomon Islands Family Health and Safety Study: A study on violence against women and children. Report prepared by the Secretariat of the Pacific Community for Ministry of Women, Youth & Children’s Affairs, 2009
SPAIN
Macro-survey regarding violence against women http://www.migualdad.es/violencia-mujer/estadistica.html this link is broken, data are not the part of the report
SWITZERLAND Delivery of the report pending
SWEDEN (1)
CAHRV project: Comparative reanalysis of prevalence of violence against women and health impact data in Europe – obstacles and possible solutions, December 2006 (the report was prepared within the Co-ordination Action on Human Rights Violations (CAHRV) and funded through the European Commission, 6th Framework Programme, Project No. 506348)
16

SWEDEN (2) Partner violence against women and men. A summary of report 2009:12.
THAILAND –
city and province
WHO Multi-country Study on Women's Health and Domestic Violence against Women. Initial results in prevalence, health outcomes and women's responses. Garcia-Moreno C, Jansen HAFM, Ellsberg M, Heise L, Watts C. World Health Organization, 2005
UNITED REPUBLIC OF TANZANIA –
city and province
WHO Multi-country Study on Women's Health and Domestic Violence against Women. Initial results in prevalence, health outcomes and women's responses. Garcia-Moreno C, Jansen HAFM, Ellsberg M, Heise L, Watts C. World Health Organization, 2005
TURKEY National Research on Domestic Violence Against Women in Turkey. Ankara, January 2009
UNITED KINDGDOM
Homicides, Firearm Offences and Intimate Violence 2006/07, 3rd edition (Supplementary Volume 2 to Crime in England and Wales 2006/07) David Povey (Ed.), Kathryn Coleman, Peter Kaiza, Jacqueline Hoare and Krista Jansson
UNITED STATES OF AMERICA
National Crime Victimization Survey (NCVS). U.S. Department of Justice. Office of Justice Programs. Bureau of Justice Statistics. Intimate partner violence in the U.S., 2005
ZAMBIA Kishor, Sunita and Kiersten Johnson. Profiling Domestic Violence – A Multi-Country Study. Calverton, Maryland: ORC Macro, 2004
17

ANNEX B. Availability of indicators proposed by Friends of Chair (1-6) 1. Total and age-specific rate of women subjected to physical violence in the last 12 months by severity of violence, relationship to the perpetrator(s) and frequency
Availability / total number of surveys
%
1.1 Total rate 10/59 17 1.1.1. Age-specific rate 18/59 30 1.2. Total rate by severity 27/59 44 1.3. Total rate by relationship to perpetrator 38/59 63 1.4. Total rate by frequency 2/59 3
2. Total and age-specific rate of women subjected to physical violence during lifetime by severity of violence, relationship to the perpetrator(s) and frequency
Availability / total number of surveys
%
2.1 Total rate 30/59 50 2.1.1. Age-specific rate 17/59 29 2.2. Total rate by severity 39/59 66 2.3. Total rate by relationship to perpetrator 49/59 83 2.4. Total rate by frequency 6/59 10
3. Total and age-specific rate of women subjected to sexual violence in the last 12 months by relationship to the perpetrator(s) and frequency
Availability / total number of surveys
%
3.1 Total rate 8/59 14 3.1.1. Age-specific rate 20/59 34 3.2. Total rate by relationship to perpetrator 38/59 64 3.3. Total rate by frequency 1/59 2
4. Total and age-specific rate of women subjected to sexual violence during lifetime by relationship to the perpetrator(s) and frequency
Availability / total number of surveys
%
4.1 Total rate 12/59 20 4.1.1. Age-specific rate 18/59 30 4.2. Total rate by relationship to perpetrator 42/59 71 4.3. Total rate by frequency 4/59 7
5. Total and age-specific rate of women subjected to sexual or physical violence by current or former intimate partner in the last 12 months by frequency
Availability / total number of surveys
%
5.1 Total rate 38/59 63 5.1.1. Age-specific rate 29/59 49 5.2. Total rate by frequency 13/59 22
18

19
6. Total and age-specific rate of women subjected to sexual or physical violence by current or former intimate partner during lifetime by frequency
Availability / total number of surveys
%
6.1 Total rate 46/59 78 6.1.1. Age-specific rate 31/59 52 6.2. Total rate by frequency 3/59 5

TABLES Table 1. Total and age-specific rate of women subjected to physical violence in the last 12 months by severity of violence, relationship to the perpetrator(s) and frequency
Alb
ania
Arm
enia
#
Aze
rbai
jan
Aus
tral
ia (1
)
Aus
tral
ia (2
)
Ban
glad
esh
city
Ban
glad
esh
pr.
Bol
ivia
Bra
zil c
ity
Cam
bodi
a (1
)
Cam
bodi
a (2
)
Can
ada
(1)
Can
ada
(2)
Col
ombi
a
Den
mar
k
Dom
inic
an R
.
Egyp
t
El S
alva
dor
Ethi
opia
pr.
Ecua
dor
Finl
and
Fran
ce
Ger
man
y
Hai
ti
Indi
a
Irela
nd
Italy
Japa
n ci
ty
Kiri
bati
1.1 Total rate 4.5 8.0 4.7 8.0 3.7 11.614 2.7 1.1.1 Age-specific rate 15 16 17 15-19 36.4 19.3 19.0 13,0 20.7 0.0 20-24 26.3 23.7 18.9 12.3 32.9 7.0 1.7 25-29 25.9 18.5 8.7 7.4 34.7 5.0 30-34 27.5 15.5 17.9 9.2 34.5 4.0 2.7 35-39 9.0 12.9 5.6 4.5 27.8 5.5 40-44 20.8 6.9 9.3 2.7 22.5 2.5 2.4 45-49 2.4 9.2 8.1 3.4 14.7 1.3 50-54 15.3 1.3 55-59 10.1 1.1 60-64 0.7 1.1 65-6 9 . 0 3 70-7 4 1.2 Total rate by severity acquired injuries (consequences) 39.7
4.018 14.019
moderate (by type) 8.7 6.5 5.0 14.0 39.7 1.8 17.8 7.4 11.7 2.4 severe (by type) 17.3 9.3 3.3 3.4 10.4 5.0 6.1 21.6 3.2 1.4 0.7 1.3 Total rate by relationship to the perpetrator(s) yes20 intimate partner (current or former) 30.5 3.0 19.0 15.8 8.3 15.4 2.0 2.5 11.0 12.5 7.0 29.0 10.0 6.3 21.0 10.3 1.7 3.1 other than intimate partner: 4.0 1.3 1.1 family memb er 36. 8 0.2 friends, neighbours 36.8 0.2 work or school 20.5 0.1 professional caregivers or helpers 20. 5 casual acquaintances 20.5 0.3 unknown person (stranger) 21.9 2.0 0.4 1.4 Total rate by frequency yesg yes21 on ce few (2-1 0) many (>1 0)
# Confidentiality of study is compromised since 16% of the interviews were conducted in a presence of someone else than woman
14 not just physical, but total violence last 12 months is given here, and therefore, perhaps overestimated figure 15 age-intervals are following: 18-24, 25-34, 35-44, 45-54, and >55, sum up 100% 16age-intervals are given as following: 16-20, 21-30, 31-40, 41-50, and 51-60 17 age-intervals are given as following: 16-24, 25-34, 35-44, 45-54, 55-64, and 65-69 18 injuries ended in emergency room 19 severity of intimate partner violence, rate is given among ever-partnered women 20 available, but just segregated by severity (moderate/severe), and therefore, is not presented here 21 available, but just segregated by age-groups

Table 1. Total and age-specific rate of women subjected to physical violence in the last 12 months by severity of violence, relationship to the perpetrator(s) and frequency (cont’d)
Lith
uani
a
Mal
dive
s
Mex
ico
Mol
dova
Nam
ibia
city
Nic
arag
ua
Nor
way
Para
guay
Peru
Peru
city
Peru
pr.
Pola
nd
Rom
ania
Rus
sia
Sam
oa
Serb
ia c
ity
Slov
akia
Solo
mon
Is.
Swed
en (1
)
Swed
en (2
)
Tanz
ania
city
Tanz
ania
pr.
Thai
land
city
Thai
land
pr.
Turk
ey
Kor
ea
UK
USA
Zam
bia
1.1 Total rate 16. 7 4. .4 4 7 1.1.1 Age-specific rate 15-19 20.0 33.9 30.9 28.0 14.3 16.1 25.5 25.9 32.1 20-24 22.5 25.7 32.7 27.6 6.1 21.9 22.5 12.4 22.6 25-29 11.4 20.9 26.5 22.5 2.3 19.0 20.9 10.8 11.3 30-34 14.7 17.5 23.7 16.8 3.2 13.9 19.2 7.7 14.9 35-39 16.5 8.0 25.8 16.4 2.6 10.2 14.1 5.6 14.8 40-44 13.0 18.8 19.1 7.8 1.4 6.9 7.6 7.7 6.5 45-49 16.3 4.2 15.6 13.3 2.2 2.7 12.7 1.5 11.8 50-5 4 55-5 9 60-6 4 65-6 9 70-7 4 1.2 Total rate by severity acquired injuries (consequences) 38.5
moderate (by type) 5.3 11.8 7.4 3.8 5.6 1.6 6.4 8.0 2.8 5.1 1.9 2.822 severe (by type) 10.6 4.0 9.6 21.0 12.3 1.6 8.3 10.7 5.1 8.3 1.8 0.723 1.3 Total rate by relationship to the perpetrator(s)
24
intimate partner (current or former) 5.7 15.9 13.2 6,6 16.9 24.8 17.9 3.2 14.8 18.7 7.9 13.4 10.0 3.4 4.2 26.5other than intimate partner: 2.9 family member 2.4 1.9 1.7 friends, neighbours 7. 0 work or school 1.6 professional caregivers or helpers
casual acquaintances unknown person (stranger) 6 .5 1.4 Total rate by frequency on ce few (2-1 0) many (>1 0)
22 simple assault 23 aggravated assault 24 average annual rate per 1,000 persons (female) age 12 or older, by perpetrator
21

Table 2. Total and age-specific rate of women subjected to physical violence during lifetime by severity of violence, relationship to the perpetrator(s) and frequency
Alb
ania
Arm
enia
#
Aze
rbai
jan
Aus
tral
ia (1
)
Aus
tral
ia (2
)
Ban
glad
esh
city
Ban
glad
esh
pr.
Bol
ivia
Bra
zil c
ity
Bra
zil p
r.
Cam
bodi
a (1
)
Cam
bodi
a (2
)
Can
ada
(1)
Can
ada
(2)
Col
ombi
a
Den
mar
k
Dom
inic
an R
.
Egyp
t
El S
alva
dor
Ethi
opia
pr.
Ecua
dor
Finl
and
Fran
ce
Ger
man
y
Hai
ti
Indi
a
Irela
nd
Italy
Japa
n ci
ty
Kiri
bati
2.1 Total rate 8.2 13.3 48.0 23.4 41.0 23.9 35.0 43.5 37.0 35.2 21.025 18.8
2.1.1 Age-specific rate 26 27 15-19 8.6 44.9 25.7 24.1 27.0 22.8 3.6 20-24 10.8 40.0 34.0 21.5 36.0 42.0 19.0 10.4 25-29 14.9 47.0 48.6 28.3 30.5 49.5 12.2 30-34 39.6 45.6 26.8 31.5 56.9 23.9 13.8 35-39 15.1 34.3 44.8 28.6 40.7 50.0 16.5 40-44 32.3 39.3 24.3 37.7 49.7 21.4 11.8 45-49 15.4 25.6 43.1 36.0 29.6 44.1 11.9 50- 54 . 19 1 55- 59 60- 64 . 14 0 65- 69 6 9. 2.2 Total rate by severity 28 29 30 f acquired injuries 41.4 38.0 54.1 50.0 19.0 37.0 79.1 60.7 18.9 8.0 52.0 moderate 27.0 21.0 22.3 37.3 11.7 13.7 15.9 51.0 39.7 17.8 13.3 16.6 9.2 14.4
severe 12.0 18.7 19.4 14.9 15.5 20.0 3.9 49.0 10.4 6.1 35.4 4.2 1.4 29.731 3.8 45.6
2.3 Total rate by relationship to the perpetrator(s)
intimate partner (current or former) 83.932
50.7
33 31.0 39.7 41.7 52.3 27.2 33.8 22.5 16.4 7,034 44.1 22.3 34.4 24.0 48.7 31.0 22.8 28.8 18.9 12.0 12.9 60.0 Intimate partner – current 50.2i 6.9 i 17 .0 Intimate partner - former 18.5i 44.1i 4 . 4 7 other than intimate partner: 27.0 17.4 10.7 20.9 13.0 4.9 12.0 0.5 9.8 4.7 11.0 family member 84.2 71.3 75.5 75.0 72.5 0.3 1.7 68.8 family member male 2.5 h 32.6 i .1 19 family member female 38.4 i .3 26
father/stepfather 10.6i 86.035 .4 29
mother/stepmother 23.8i sister/brother 9.2i 0 .5 daughter/son 1.1 h 0.1i friends, neighbours 0.3 0.1 1.6 work or school 0.3i 0 .0 .2 .8 .8 0 0 9 professional caregivers or helpe r .0s 0 casual acquaintances 17.9 29.9 20.0 8.3 16.1 0.1 2.6 26.6 boyfriend 4.4 h unknown person (stranger) 14.9 i 13.0 0.4 0.0 8.6 6.3 0.1 2.0 0.2 3.6 18.8 13.4 mother in law 19h 1.6i 1.036 father in law 7.0 h 0.0 i
others 0.5 i 11.537 1.1 7.9 7.8 14.6 14.1 0.3 0.0
2.4 Total rate by frequency yes38
yes39 40
25 Sample includes only ever-married women 26 age intervals are in a five-year groups, except 30-39 and 40-49 age groups 27 age-intervals are given as following: 16-24, 25-34, 35-44, 45-54, 55-64, and 65-69 (Italy) 28 indicators of different types of each violent acts are available, but they are not presented as moderate or severe, and therefore, not typed into the matrix. 29 severity of violent acts among all women who experienced violence, summed up 100% 30 injuries in the most severe violent situation, the question were “Did your partner’s violence caused injuries to you?” 31 severity of violence is assessed by perpetrators (their perceptions), but also by acts of violence and by perpetrators, whereas total rate is not given 32 among women who experienced moderate physical abuse (rate is also available among women who experienced severe physical abuse) 33 among women who experienced physical violence as of age of 15 34 rate is given for the last five years, not a lifetime 35 Both mother and father (parents) 36 Both mother and father in law (parents in law) 37 category ”others” comprise the following: acquaintance or neighbour, counsellor or psychologist or psychiatrist, ex-boyfriend or girlfriend, doctor, teacher, minister or priest or clergy, prison officer and other known person.
22

23
ce on few (2-1 0) .6 54 many (>1 0) .8 43
# Confidentiality of study is compromised since 16% of the interviews were conducted in a presence of someone else than woman
38 frequency is available but just when segregated by each violent act in the group of moderate/severe abuse 39 frequency (sometimes/often) is available but just when segregated by age-groups 40 among all women experienced non-IPV
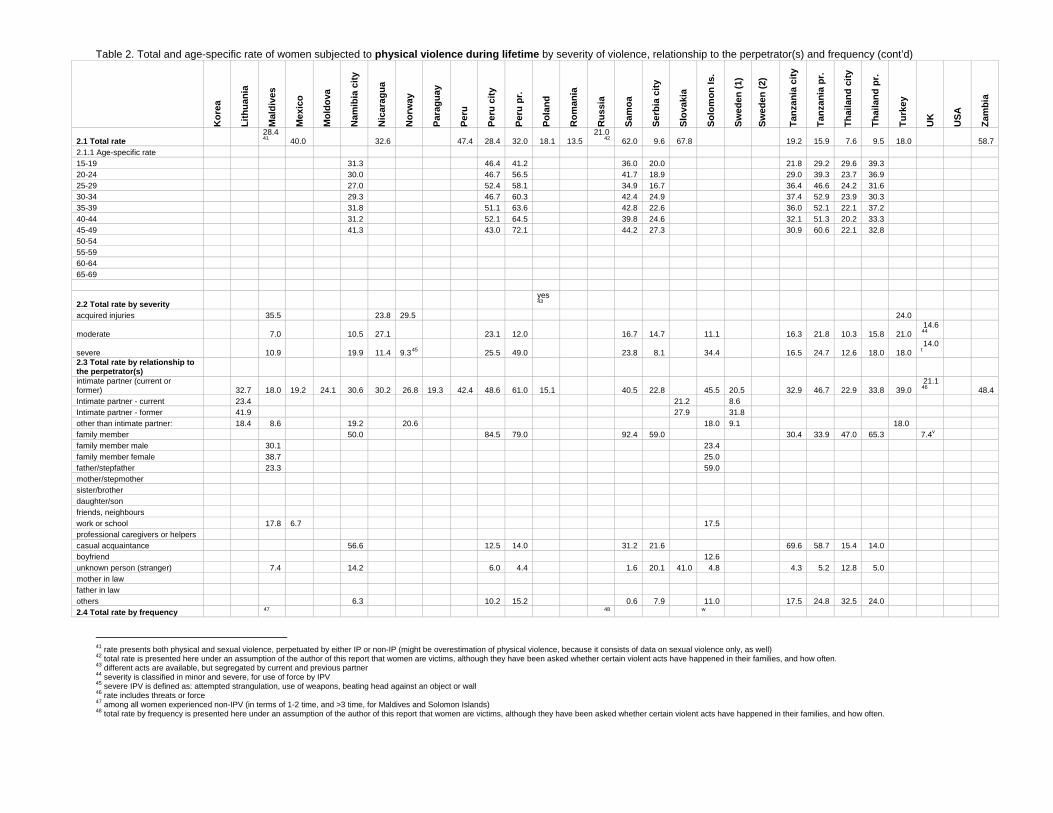
Table 2. Total and age-specific rate of women subjected to physical violence during lifetime by severity of violence, relationship to the perpetrator(s) and frequency (cont’d)
Kor
ea
Lith
uani
a
Mal
dive
s
Mex
ico
Mol
dova
Nam
ibia
city
Nic
arag
ua
Nor
way
Para
guay
Peru
Peru
city
Peru
pr.
Pola
nd
Rom
ania
Rus
sia
Sam
oa
Serb
ia c
ity
Slov
akia
Solo
mon
Is.
Swed
en (1
)
Swed
en (2
)
Tanz
ania
city
Tanz
ania
pr.
Thai
land
city
Thai
land
pr.
Turk
ey
UK
USA
Zam
bia
2.1 Total rate 28.441 40.0 32.6 47.4 28.4 32.0 18.1 13.5
21.042 62.0 9.6 67.8
19.2 15.9 7.6 9.5 18.0 58.7
2.1.1 Age-specific rate 15-19 31.3 46.4 41.2 36.0 20.0 21.8 29.2 29.6 39.3 20-24 30.0 46.7 56.5 41.7 18.9 29.0 39.3 23.7 36.9 25-29 27.0 52.4 58.1 34.9 16.7 36.4 46.6 24.2 31.6 30-34 29.3 46.7 60.3 42.4 24.9 37.4 52.9 23.9 30.3 35-39 31.8 51.1 63.6 42.8 22.6 36.0 52.1 22.1 37.2 40-44 31.2 52.1 64.5 39.8 24.6 32.1 51.3 20.2 33.3 45-49 41.3 43.0 72.1 44.2 27.3 30.9 60.6 22.1 32.8 50- 54 55- 59 60- 64 65- 69
2.2 Total rate by severity yes43
acquired injuries 35.5 23.8 29.5 24.0
moderate 7.0 10.5 27.1 23.1 12.0 16.7 14.7 11.1
16.3 21.8 10.3 15.8 21.0 14.644
severe 10.9 19.9 11.4 9.345 25.5 49.0 23.8 8.1 34.4
16.5 24.7 12.6 18.0 18.0 14.0t
2.3 Total rate by relationship to the perpetrator(s)
intimate partner (current or former) 32.7 18.0 19.2 24.1 30.6 30.2 26.8 19.3 42.4 48.6 61.0 15.1 40.5 22.8 45.5 20.5
32.9 46.7 22.9 33.8 39.0
21.146 48.4
Intimate partner - current 23.4 21.2 8.6 Intimate partner - former 41.9 27.9 31.8 other than intimate partner: 18.4 8.6 19.2 20.6 18.0 9.1 18.0 family member 50.0 84.5 79.0 92.4 59.0 30.4 33.9 47.0 65.3 7.4v family member male 30.1 23.4 family member female 38.7 25.0 father/stepfather 23.3 59.0 mother/stepmoth er sister/brot her daughter/son friends, neighbou rs work or school 17.8 6.7 17.5 professional caregivers or helpe r s casual acquaintance 56.6 12.5 14.0 31.2 21.6 69.6 58.7 15.4 14.0 boyfrie nd 12 .6 unknown person (stranger) 7.4 14.2 6.0 4.4 1.6 20.1 41.0 4.8 4.3 5.2 12.8 5.0 mother in l aw father in l aw others 6.3 10.2 15.2 0.6 7.9 11.0 17.5 24.8 32.5 24.0 2.4 Total rate by frequency 47 48 w
41 rate presents both physical and sexual violence, perpetuated by either IP or non-IP (might be overestimation of physical violence, because it consists of data on sexual violence only, as well) 42 total rate is presented here under an assumption of the author of this report that women are victims, although they have been asked whether certain violent acts have happened in their families, and how often. 43 different acts are available, but segregated by current and previous partner 44 severity is classified in minor and severe, for use of force by IPV 45 severe IPV is defined as: attempted strangulation, use of weapons, beating head against an object or wall 46 rate includes threats or force 47 among all women experienced non-IPV (in terms of 1-2 time, and >3 time, for Maldives and Solomon Islands) 48 total rate by frequency is presented here under an assumption of the author of this report that women are victims, although they have been asked whether certain violent acts have happened in their families, and how often.

25
ce on 17 .0 39 .0 few (2-10) 35.6 4.0 61.0 many (>10) 64.4

26
Table 3. Total and age-specific rate of women subjected to sexual violence in the last 12 months by relationship to the perpetrator(s) and frequency
Alb
ania
Arm
enia
Aze
rbai
jan
Aus
tral
ia (1
)
Aus
tral
ia (2
)
Ban
glad
esh
city
Ban
glad
esh
pr.
Bol
ivia
Bra
zil c
ity
Bra
zil p
r.
Cam
bodi
a (1
)
Cam
bodi
a (2
)
Can
ada
(1)
Can
ada
(2)
Col
ombi
a
Den
mar
k
Dom
inic
an R
.
Egyp
t
El S
alva
dor
Ethi
opia
pr.
Ecua
dor
Finl
and
Fran
ce
Ger
man
y
Hai
ti
Indi
a
Irela
nd
Italy
Japa
n ci
ty
Kiri
bati
3.1 Total rate 1.549 1.6 4.0 3.0 4.7 3.5 3.1.1 Age-specific rate 50 51 52 15-19 30.5 32.1 3.4 7.9 2.0 46.7 53 3,654 20-24 30.7 24.4 27.4 0.8 8.4 6.0 47.6 12.0 1.7 25-29 22.0 31.2 4.0 4.3 0.8 54.2 1.7 30-34 29.8 21.2 22.8 2.8 3.4 3.0 51.8 4.9 0.0 0.8 35-39 12.7 21.0 3.4 7.5 0.3 42.6 1.6 40-44 24.6 13.1 12.0 2.0 5.2 2.0 33. . 98 2 2 0. 45-49 14.9 7.3 19.3 2.7 2.8 0.4 21.6 1.3 50-5 4 0 . 1. 1 6 55-5 9 0. 3 60-6 4 . 0 9 65-6 9 . 0 5 0.5 3.2 Total rate by relationship to the perpetrator(s) intimate partner (current or former) 2.0 1.0 30.2 24.2 2.8 5.6 3.2 3.0 3.0 1.2 4.2 3.0 44.4 4.0 1.1 14.8 1.0 2.6 12.7 Intimate partner - current one 2.0 Intimate partner - former one 1.6 other than intimate partner: 2. 8 .6 2 family memb er 0.0 friends, neighbours 0.3 work or school 0.2 professional caregivers or helpers casual acquaintance s . 0 5 unknown person 1.0 1.7 3.3 Total rate by frequency 55 on ce few (2-1 0) 3 1. many (>1 0) 6 0.
49 it is not clear whether available rate presents physical violence by all, or just by an intimate partner 50 age-intervals are given as following: 18-24, 25-34, 35-44, and >45, sum up 100% 51 age-intervals are given as following: 15-24, 25-34, 35-44, and 45-54 52 age-intervals are given as following: 16-20, 21-30, 31-40, 41-50, and 51-60 53 age-intervals are given as following: 16-24, 25-34, 35-44, 45-54, 55-64, and 65-69 54 first age group is 18-19 years 55 frequencies of current sexual violence are given just for spouse as a perpetrator

27
Table 3. Total and age-specific rate of women subjected to sexual violence in the last 12 months by relationship to the perpetrator(s) and frequency (cont’d)
Kor
ea
Lith
uani
a
Mal
dive
s
Mex
ico
Mol
dova
Nam
ibia
city
Nic
arag
ua
Nor
way
Para
guay
Peru
Peru
city
Peru
pr.
Pola
nd
Rom
ania
Rus
sia
Sam
oa
Serb
ia c
ity
Slov
akia
Solo
mon
Is.
Swed
en (1
)
Swed
en (2
)
Tanz
ania
city
Tanz
ania
pr.
Thai
land
city
Thai
land
pr.
Turk
ey
UK
USA
Zam
bia
3.1 Total rate 0.9 .0 5 3.1.1 Age-specific rate 15-19 16.3 19.6 27.9 20.0 2.9 11.3 23.6 29.6 25.0 20-24 10.4 8.6 27.1 12.8 0.6 16.8 20.2 22.7 21.4 25-29 6.6 8.0 24.0 13.3 0.0 15.4 22.1 21.0 17.3 30-34 8.7 7.4 24.4 10.5 1.6 12.6 16.8 18.1 12.6 35-39 11.1 4.0 24.4 13.6 1.0 12.9 14.1 17.5 16.6 40-44 5.2 4.9 15.9 6.6 1.9 8.8 12.6 14.2 13.4 45-49 9.6 4.9 16.8 8.3 0.9 2.7 9.9 6.9 14.4 50-5 4 55-5 9 60-6 4 65-6 9 3.2 Total rate by relationship to the perpetrator(s)
intimate partner (current or former) 2.0 9.1 3.9 2.6 7.1 22.9 11.5 1.1 0.7 12.8 18.3 17.1 15.6 7.0 0.456 3.9
other than intimate partner: 2.9 family memb er friends, neighbours work or school 2.6 professional caregivers or helpers casual acquaintances unknown person 3.3 Total rate by frequency on ce few (2-1 0) many (>1 0)
56 rape/sexual assault

28
Table 4. Total and age-specific rate of women subjected to sexual violence during lifetime by relationship to the perpetrator(s) and frequency
Alb
ania
Arm
enia
Aze
rbai
jan
Aus
tral
ia (1
)
Aus
tral
ia (2
)
Ban
glad
esh
city
Ban
glad
esh
pr.
Bol
ivia
Bra
zil c
ity
Bra
zil p
r.
Cam
bodi
a
Cam
bodi
a
Can
ada
(1)
Can
ada
(2)
Col
ombi
a
Den
mar
k
Dom
inic
an R
.
Egyp
t
El S
alva
dor
Ethi
opia
pr.
Ecua
dor
Finl
and
Fran
ce
Ger
man
y
Hai
ti
Indi
a
Irela
nd
Italy
Japa
n ci
ty
Kiri
bati
4.1 Total rate 2.9 4.0 34.0 9.6 4.3 13.0 23.7 4.1.1 Age-specific rate 57 a 58 15-19 0.4 42.4 48.6 6.9 11.2 56.5 3.6 20-24 3.0 40.4 47.6 4.6 13.5 53.1 25.4 7.0 25-29 4.7 38.1 54.3 12.1 10.2 66.4 6.1 30-34 39.2 50.2 10.6 13.8 63.1 27.4 5.7 35-39 5.159 30.7 47.1 11.2 18.6 57.7 5.5 40-44 38.5 45.3 10.1 22.1 55.2 26.3 4.7 45-49 4.860 23.2 53.2 12.6 10.2 47.1 8.9 50-5 4 . 23 3 55-5 9 60-6 4 . 20 3 65-6 9 . 15 1 4.2 Total rate by relationship to the perpetrator(s) 61 intimate partner (current or former) 2.9 12.0 37.4 49.7 15.2 10.1 14.3 3.6 16,062 11.0 6.4 12.0 58.6 63.0 11.5 7.7 17.0 6.1 6.2 46.1 intimate partner - current 5.0 Intimate partner - former 17.6 others than intimate partner: 7.6 0.5 6.8 4.6 0.3 19.0 49.3 20.4 3.5 10.0 family member 8.2 13.8 13.2 10.1 0.5 2.1 family member male 14.0 6.9 family member fema le .4 3 father/stepfather 5.0 2.3 friends, neighbours 25.0 19.8 1.7 work or school 11.8 2.1 20.7 professional caregivers or helpers 3.8 casual acquaintances 15.6 48.8 54.4 22.3 4.3 45.8 boyfriend unknown person (stranger) 11.0 78.7 28.8 17.6 13.0 14.5 13.4 60.4 34.5 others 4.1 15.0 16.2 9.0 0.2 2.1 39,1 4.3 Total rate by frequency on ce few (2-1 0) 69.563 many (>1 0) 29.964
57 segregation by age (10 years intervals) is given, but by intimate partner (current and/or former partner) 58 age-intervals are given as following: 16-24, 25-34, 35-44, 45-54, 55-64, and 65-69 59 age intervals 30-39 60 age interval 40-49 61 This rate is segregated for penetration, and other forms of sexual violence, by different perpetrators. Here are presented higher rates from either first or second subgroup of sexual violence. Therefore, percentages exceed 100 62 in a last 5 years, not lifetime 63 1-2 time, non-IPV (with >3 time, sum up 100% ) 64 >3 time, non-IPV (with previous 1-2 time, sum up 100%)

29
Kor
ea
Lith
uani
a
Mal
dive
s
Mex
ico
Mol
dova
Nam
ibia
city
Nic
arag
ua
Nor
way
Para
guay
Peru
Peru
city
Peru
pr.
Pola
nd
Rom
ania
Rus
sia
Sam
oa
Serb
ia c
ity
Slov
akia
Solo
mon
Is.
Swed
en (1
)
Swed
en (2
)
Tanz
ania
city
Tanz
ania
pr.
Thai
land
city
Thai
land
pr.
Turk
ey
UK
USA
Zam
bia
4.1 Total rate 43.7 4.6 2.5 6.0 10.6 4.1.1 Age-specific rate a a 15-19 21.3 23.2 35.3 28.0 5.7 16.1 31.1 29.6 28.6 20-24 17.9 18.4 42.1 19.9 3.6 22.6 30.5 34.0 34.5 25-29 14.5 24.6 40.9 18.5 4.6 26.2 33.7 35.7 27.8 30-34 14.3 19.2 48.5 16.4 9.7 26.2 28.8 30.9 24.0 35-39 18.3 24.3 50.9 22.0 6.2 23.7 30.1 28.4 31.8 40-44 14.3 23.6 48.9 18.7 4.3 21.4 27.7 26.8 29.0 45-49 19.2 26.1 54.7 21.7 8.6 17.3 29.6 24.4 28.2 50-5 4 55-5 9 60-6 4 65-6 9 4.2 Total rate by relationship to the perpetrator(s) 0.1
intimate partner (current or former) 7.5 6.7 9.0 4.1 16.5 10.2 7.6 22.5 46.7 5.1 19.5 6.3 54.7 6.2
23.0 30.7 29.9 28.9 15.0 5.1
intimate partner - current 2.9 1.4 Intimate partner - former 12.4 11.1 others than intimate partner: 17.3 6.2 16.6 6.4 24.8 10.3 11.3 3.9 18.0 13.4 11.5 9.4 6.1 2.6 3.0 family member 6.3 15.2 9.7 0.8 10.3 3.6 11.5 4.4 2.1 12.1 family member male 17.1 8.5 family member fema le 1 .7 0.0 father/stepfather 4.3 0.0 friends, neighbours
13.0 work or school 49,665 1.8 2.666 24.1 professional caregivers or helpers
casual acquaintances 66.7 40.0 47.3 7.4 58.6 41.1 48.8 45.2 31.9 36.4 boyfriend 47.7 unknown person (stranger) 35.0 24.0 29.7 26.1 5.1 24.1 42.9 26.8 24.9 25.9 46.8 18.2 others 5.2 24.1 24.2 12.5 7.5 17.9 23.9 22.0 27.4 24.5 39.4 4.3 Total rate by frequency on ce few (2-10) 38.5g 4.0 43. g 0 many (>10) 61.5h 2.0 57. h 0
Table 4. Total and age-specific rate of women subjected to sexual violence during lifetime by relationship to the perpetrator(s) and frequency (cont’d)
65 This category embrace the following: teacher, friend of family, work colleague 66 Category summed up of the following perpetrators: teacher or professor (0.7%) and employer or the boss (1.9%)
30
Table 5. Total and age-specific rate of women subjected to sexual or physical violence by current or former intimate partner in the last 12 months by frequency A
lban
ia
Arm
enia
Aze
rbai
jan
Aus
tral
ia (1
)
Aus
tral
ia (2
)
Ban
glad
esh
city
Ban
glad
esh
pr.
Bol
ivia
Bra
zil c
ity
Bra
zil p
r.
Cam
bodi
a
Cam
bodi
a
Can
ada
(1)
Can
ada
(2)
Col
ombi
a
Den
mar
k
Dom
inic
an R
.
Egyp
t
El S
alva
dor
Ethi
opia
pr.
Ecua
dor
Finl
and
Fran
ce
Ger
man
y
Hai
ti
Indi
a
Irela
nd
Italy
Japa
n ci
ty
Kiri
bati
5.1 Total rate 9.767 3.0a 30.2 31.9 9.3 14.8 14.6 2.0a 2.5a 9.8 12.5 24.068 53.7 10.0 7.969 12.5 10.3 2.4 3.8 36.1 5.1.1 Age-specific rate 70 d d 15-19 47.5 41.3 19.0 20.2 4.0 15.4 21.0 50.0 15.0 25.4 10.4 3.6 20-24 36.7 34.0 12.3 24.7 12.2 16.7 18.8 59.6 15.0 14.6 3.9 6.9 31.4 11.4 2.6 25-29 36.3 40.2 9.8 14.5 19.1 13.4 14.1 63.9 10.0 19.4 12.3 6.1 30-34 28.4 32.7 10.6 12.3 16.8 11.3 12.9 62.4 11.0 9.0 2.5 4.1 26.2 11.5 3.1 35-39 19.3 25.7 6.7 12.6 16.8 9.6 12.6 52.0 10.0 22.4 9.9 5.9 40-44 16.2 18.7 4.1 13.6 10.9 5.4 8.2 41.5 6.0 6.9 2.5 2.8 13.0 7.8 2.8 45-49 9.8 25.7 9.0 5.6 18.1 5.5 4.5 27.9 7.0 12.5 5.9 2.2 50-54 55-59 4.7 2.3 1.4 60-64 2.3 0.1 65-69 5.2 Total rate by frequency 71 e 72 1.0 never 12.0 52.0 54.6 27.8 44.8 once 44.5 47.2 50.3 few (2-10) 7.4 50.773 5.7g 35.4g 55.574 52.8h 49.7h 29.9g 40.1g many (>10) 2.3 36.075 42.3i 9.1i 41.8i 14.4i
67 just for physical violence 68 total rate of women subjected to violence of just current partner (rate is available also for the former partner, and it is 42%) 69 total rate of women subjected to violence of just current partner (rate is available also for the former partner, and it is 6.1%) 70 age-intervals are as following: 18-24, 25-34, 35-44, 45-59, >60 71 frequency is presented just for current partners 72 frequency is given for both current and/or former partner 73 1-4 times 74 more than once 75 5 times and more

31
Table 5. Total and age-specific rate of women subjected to sexual or physical violence by current or former intimate partner in the last 12 months by frequency (cont’d)
Kor
ea
Lith
uani
a
Mal
dive
s
Mex
ico
Mol
dova
Nam
ibia
city
Nic
arag
ua
Nor
way
Para
guay
Peru
Peru
city
Peru
pr.
Pola
nd
Rom
ania
Rus
sia
Sam
oa
Serb
ia c
ity
Slov
akia
Solo
mon
Is.
Swed
en (1
)
Swed
en (2
)
Tanz
ania
city
Tanz
ania
pr.
Thai
land
city
Thai
land
pr.
Turk
ey
UK
USA
Zam
bia
5.1 Total rate 6.4 19.5 11.9 6.6 19.2 34.2 2.4 3.7 12.2 41.8 1.2 21.5 29.1 21.3 22.9 5.9 4.2 26.5 5.1.1 Age-specific rate b 15-19 27.5 18.2 41.1 48.5 36.0 14.3 22.6 36.8 44.4 39.3 21.0 6.376 33.320-24 25.8 15.7 27.6 43.9 33.3 6.1 4.7 30.3 32.1 29.9 31.0 11.3 35.325-29 14.9 13.9 22.5 35.5 26.1 2.3 25.6 34.0 27.4 22.6 16.0 29.730-34 18.5 13.8 19.7 33.6 20.6 4.3 4.4 20.0 28.8 21.6 21.1 8.1 24.235-39 20.0 10.9 9.7 34.6 21.6 3.1 19.4 21.5 19.6 26.5 13.0 19.840-44 14.9 11.5 19.4 25.8 12.0 2.4 4.6 13.2 17.6 19.1 17.7 16.645-49 19.2 6.7 7.7 23.5 17.5 2.6 3.6 21.1 7.6 20.0 8.0 4.477 15.850-5 4 55-59 4.7 60-64 5.2 1.378 65-6 9 5.2 Total rate by frequency
never 57.9 53.9once 63.6 38. 0 few (2-10) 10.8g 36. h4 39.079 41.8g
many (>10) 29.3i 23.080 4.3i
76 for age interval 16-19 years 77 for age interval 35-49 78 for age interval 50-64 79 2 - 5 times 80 6 times and more

32
Table 6. Total and age-specific rate of women subjected to sexual or physical violence by current or former intimate partner during lifetime by frequency
Alb
ania
Arm
enia
Aze
rbai
jan
Aus
tral
ia (1
)
Aus
tral
ia (2
)
Ban
glad
esh
city
Ban
glad
esh
pr.
Bol
ivia
Bra
zil c
ity
Bra
zil p
r.
Cam
bodi
a (1
) C
ambo
dia
(2)
Can
ada
(1)
Can
ada
(2)
Col
ombi
a
Den
mar
k
Dom
inic
an R
.
Egyp
t
El S
alva
dor
Ethi
opia
pr.
Ecua
dor
Finl
and
Fran
ce
Ger
man
y
Hai
ti
Indi
a
Irela
nd
Italy
Japa
n ci
ty
Kiri
bati
6.1 Total rate
12.881
31.082 53.4 61.7 53.3 28.9 36.9 22.5 17.5
7.083 44.1 22.3 34.4 7.0 70.9 31 29.9 25.0 28.8 18.9 14.3 15.4 68.0
6.1.1 Age-specific rate 84 d 15-19 13.6 58.5 53.2 24.1 27.0 4.0 38.5 19.6 28.7 59.8 22.0 0.3 0.1 7.1 20-24 11.3 55.9 53.3 22.3 38.8 13.7 43.4 25.7 34.1 67.4 29.0 25.7 28.9 0.3 0.2 13.0 25-29 14.5 57.3 68.1 29.5 32.8 21.4 42.9 24.5 34.4 75.9 29.0 0.3 0.2 13.8 30-34 13.8 55.0 66.5 29.6 35.5 19.4 43.8 23.2 37.1 77.1 32.0 28.6 30.7 0.3 0.2 16.5 35-39 13.8 49.4 62.9 29.8 45.2 18.3 45.3 21.7 36.3 70.5 37.0 0.3 0.2 18.1 40-44 13.5 47.7 57.3 27.7 42.2 12.7 43.3 23.3 33.2 67.6 29.0 27.4 28.0 0.2 0.2 14.2 45-49 13.5 34.1 62.4 37.8 31.5 22.1 48.0 15.7 31.7 61.3 32.0 0.4 0.2 15.6 50-54 55-59 27 .7 .4 25 60-64 14 .3 .1 13 65-69 6.2 Total rate by frequency once 32 .4 .0 31
few (2-10) 67.685 36 .0
many (>10) 33 .0
81 just for physical violence 82 total rate of women subjected to violence of just current partner 83 For the last five years. not a lifetime period 84 age-intervals are as following: 18-24. 25-34. 35-44. 45-59. >60 85 more than once

33
Table 6. Total and age-specific rate of women subjected to sexual or physical violence by current or former intimate partner during lifetime by frequency (cont’d)
Kor
ea
Lith
uani
a
Mal
dive
s
Mex
ico
Mol
dova
Nam
ibia
city
Nic
arag
ua
Nor
way
Para
guay
Peru
Peru
city
Peru
pr.
Pola
nd
Rom
ania
Rus
sia
Sam
oa
Serb
ia c
ity
Slov
akia
Solo
mon
Is.
Swed
en (1
)
Swed
en (2
)
Tanz
ania
city
Tanz
ania
pr.
Thai
land
city
Thai
land
pr.
Turk
ey
UK
USA
Zam
bia
6.1 Total rate 37.6 19.5 23.4 24.6 35.9 30.2 26.8 19.3 51.2 69.0 46.1 23.7 27.9 21.7 21.4 41.3 55.9 41.1 47.4 42.0 28.886 48.4 6.1.1 Age-specific rate d d 87 15-19 42.5 18.0 0.3 53.6 60.3 52.0 20.0 29.8 44.3 48.1 50.0 38.4 20-24 22.7 35.8 19.9 0.4 50.0 67.8 46.8 18.9 20.3 39.4 48.9 44.3 52.4 35.0 49.3 25-29 32.5 20.1 0.4 55.1 63.9 39.8 18.5 45.5 58.0 46.5 45.9 53.2 30-34 30.8 34.3 20.5 0.4 49.3 69.5 45.8 25.9 19.5 44.3 62.0 42.1 39.4 39.0 48.5 35-39 35.7 16.8 0.4 51.1 71.7 48.4 23.7 46.2 56.4 41.2 54.3 46.4 40-44 33.3 36.4 19.6 0.5 54.2 70.9 48.8 26.1 21.1 39.6 58.8 36.6 47.8 42.0 50.0 45-49 44.2 0.4 46.5 76.0 49.2 27.7 34.5 64.8 35.1 44.6 48.0 44.0 50-5 4 55-59 44.5 20.8 60-64 29.6 17.1 65-6 9 6.2 Total rate by frequency
on ce 32. 0 few (2-1 0) 44. 0 many (>1 0) 24. 0
86 includes non-physical abuse (emotional. financial). threats; force; sexual assault or stalking 87 age intervals as following: 15-24. 25-34. 35-44. and 45-49
Related Documents