© Copyright 2017 National Council on Compensation Insurance, Inc. All Rights Reserved. By the Numbers: Opioid Use in Nevada Presented by: Raji Chadarevian, Manager & Associate Actuary, NCCI Susan Schulte, Department of Labor Focus Lead, NCCI August 25, 2017

Welcome message from author
This document is posted to help you gain knowledge. Please leave a comment to let me know what you think about it! Share it to your friends and learn new things together.
Transcript

© Copyright 2017 National Council on Compensation Insurance, Inc. All Rights Reserved.
By the Numbers:Opioid Use in NevadaPresented by:Raji Chadarevian, Manager & Associate Actuary, NCCISusan Schulte, Department of Labor Focus Lead, NCCI
August 25, 2017

© Copyright 2017 National Council on Compensation Insurance, Inc. All Rights Reserved.
DISCLAIMER
The views and opinions expressed in the written materials and inany of the presentations at this conference are those of thepresenter and do not necessarily reflect the official policy orposition of the Department of Business and Industry, Division ofIndustrial Relations. The Division does not warranty thematerials’ completeness or accuracy.
2

© Copyright 2017 National Council on Compensation Insurance, Inc. All Rights Reserved.
Agenda
Overview of Nevada’s Medical
Data Report
Take a closer look at prescription
drugs
Dive deeper into opioids
3

© Copyright 2017 National Council on Compensation Insurance, Inc. All Rights Reserved.
Workers Compensation (WC) Average Medical Lost-Time Claim Severity
Private Carriers and State Funds—NCCI States
p Preliminary based on data valued as of 12/31/2016Source: NCCI’s Financial Call data, developed to ultimate, excludes high-deductible policies; based on data through 12/31/2015Values displayed reflect the methodology underlying the most recent rate/loss cost filingIncludes all states where NCCI provides ratemaking services; WV is excluded through 2007
$27.7
$29.1
-1.4%+5%
5
10
15
20
25
30
35
95 96 97 98 99 00 01 02 03 04 05 06 07 08 09 10 11 12 13 14 15 16p
Severity ($ Thousands)
Accident Year
Medical costs were growing—almost 60% of the total claim cost Average medical cost per lost-time claim increased:
1995: $8,900 to 2016: $29,100 Average medical share of claim grew
1985: 45% to 2015: 58%
4

© Copyright 2017 National Council on Compensation Insurance, Inc. All Rights Reserved.
WC Average Medical Lost-Time Claim SeverityAverage Annual Change 2011–2015, Private Carriers and State Funds—NCCI States
Source: NCCI’s Financial Call data, developed to ultimate, excludes high-deductible policies; based on data through 12/31/2015Values displayed reflect the methodology underlying the most recent rate/loss cost filingIncludes all states where NCCI provides ratemaking services
+10%
–10%
5

© Copyright 2017 National Council on Compensation Insurance, Inc. All Rights Reserved.
Medical Cost Containment: Prices
6
© Copyright 2017 National Council on Compensation Insurance, Inc. All Rights Reserved.
Medical Share of Total Benefit Costs
Source: NCCI Medical Data Call, Service Year 2015 Countrywide includes data for the following states: AK, AL, AR, AZ, CO, CT, DC, FL, GA, HI, IA, ID, IL, IN, KS, KY, LA, MD, ME, MO, MS, MT, NC, NE, NH, NM, NV, OK, OR, RI, SC, SD, TN, UT, VA, VT, and WV
51%
50%
47%
49%
52%
53%
55%
54%
55%
52%56
%
56%
56%
57%
57%
58%
58%
58%
58%
58%
0%
10%
20%
30%
40%
50%
60%
70%
2006 2007 2008 2009 2010 2011 2012 2013 2014 2015
Perc
ent
Accident Year
Nevada Countrywide
7

© Copyright 2017 National Council on Compensation Insurance, Inc. All Rights Reserved.
Why NCCI Collects Medical Data
State regulators were asking why the medical costs were increasing Searching for information on cost containment measures and
their effectiveness (e.g., fee schedules)
NCCI didn’t have sufficient data to address the rising medical costs
NCCI began collecting Medical data the latter part of 2010 (test data)
The first Medical Data Report was created at the end of 2012 to assist states in understanding the medical cost drivers in workers compensation claims
8

© Copyright 2017 National Council on Compensation Insurance, Inc. All Rights Reserved.
Medical Data Reports A standard report was developed providing the same information for each
state
Data in this presentation represents medical transactions for Service Year 2015 Medical services delivered from January 1, 2015, to December 31,
2015
Insurance carriers must report if they write at least 1% of the market share in any one state for which NCCI is the advisory organization
Data is reported under the jurisdiction state—the state under whose WC Act the injured worker’s benefits are being paid
Medical transactions must continue to be reported until the transactions no longer occur The claim is closed or 30 years from the accident date
9
© Copyright 2017 National Council on Compensation Insurance, Inc. All Rights Reserved.
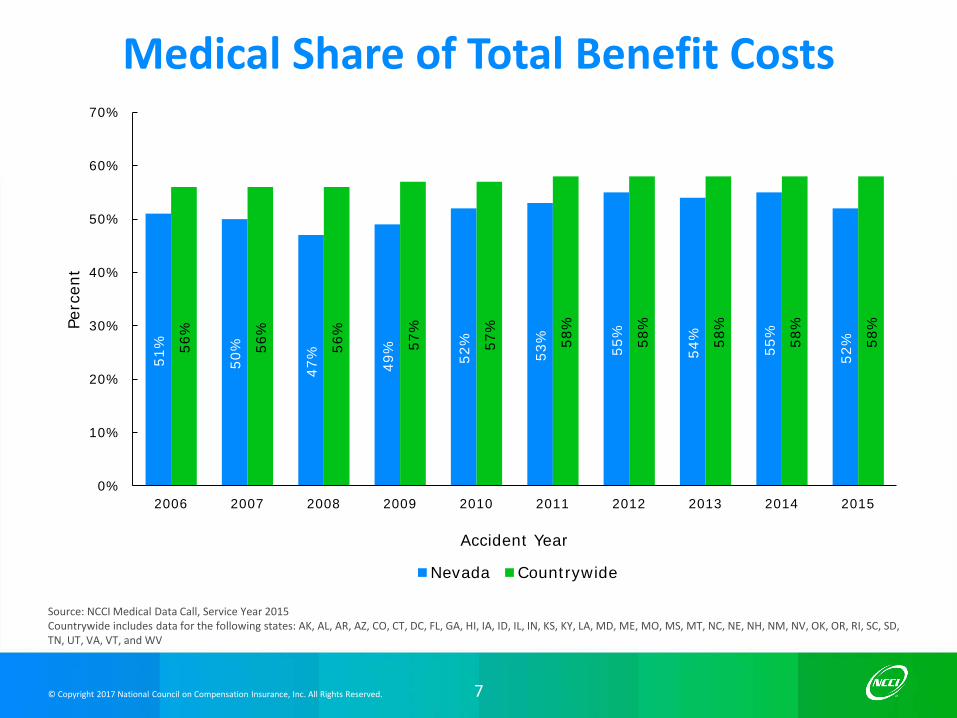
Medical Data Reports
Wherever possible, standard industry codes are used because they provide a clear definition of the data, increase efficiency of computer systems, and improve the accuracy and quality of the data
Lump-sum settlements are not required to be reported
Self-insured data is not included
10

© Copyright 2017 National Council on Compensation Insurance, Inc. All Rights Reserved.
Medical Payments Distribution
Distribution of medical payments by type of service Provides insight into the growth in medical benefits
Payments are categorized based on a combination of procedure code, place of service, and taxonomy code Drugs Durable Medical Equipment (DME), Supplies, and Implants Other—home health, transportation, vision, and dental Physicians Hospital Outpatient Hospital Inpatient Ambulatory Surgical Centers (ASC)
11

© Copyright 2017 National Council on Compensation Insurance, Inc. All Rights Reserved.
Physicians, 54%
Hospital Outpatient, 9%
Hospital Inpatient, 7%
Ambulatory Surgical Centers,
3%
Drugs, 13%
DME, Supplies & Implants, 8%
Other, 6%
Nevada
Nevada Distribution of Medical Payments
Source: NCCI Medical Data Call, Service Year 2015
12

© Copyright 2017 National Council on Compensation Insurance, Inc. All Rights Reserved.
Medical Payments Distribution
Source: NCCI Medical Data Call, Service Year 2015Region includes AZ, CO, NM, and UT. Countrywide includes data for the following states: AK, AL, AR, AZ, CO, CT, DC, FL, GA, HI, IA, ID, IL, IN, KS, KY, LA, MD, ME, MO, MS, MT, NC, NE, NH, NM, NV, OK, OR, RI, SC, SD, TN, UT, VA, VT, and WV
13

© Copyright 2017 National Council on Compensation Insurance, Inc. All Rights Reserved.
Prescription Drugs
Drugs are identified by a national drug code (NDC)
Drug information contained in the Medical Data Report are for drugs with an NDC, whether the drugs are provided in a pharmacy, physician’s office, hospital, or other place of service
Drugs make up 13% of the total medical costs in Nevada Region—11% Countrywide—11%
14

© Copyright 2017 National Council on Compensation Insurance, Inc. All Rights Reserved.
Nevada—Prescription Drugs
Information provided in the Medical Data Report includes the top 10 drugs listed by the amount paid and by prescription counts.
Name of the drug
Brand name or generic
Category of drug (muscle relaxant, analgesic, etc.)
Percentage of total drug payments
Price per unit for the state, region, and the countrywide (CW) average
15
© Copyright 2017 National Council on Compensation Insurance, Inc. All Rights Reserved.
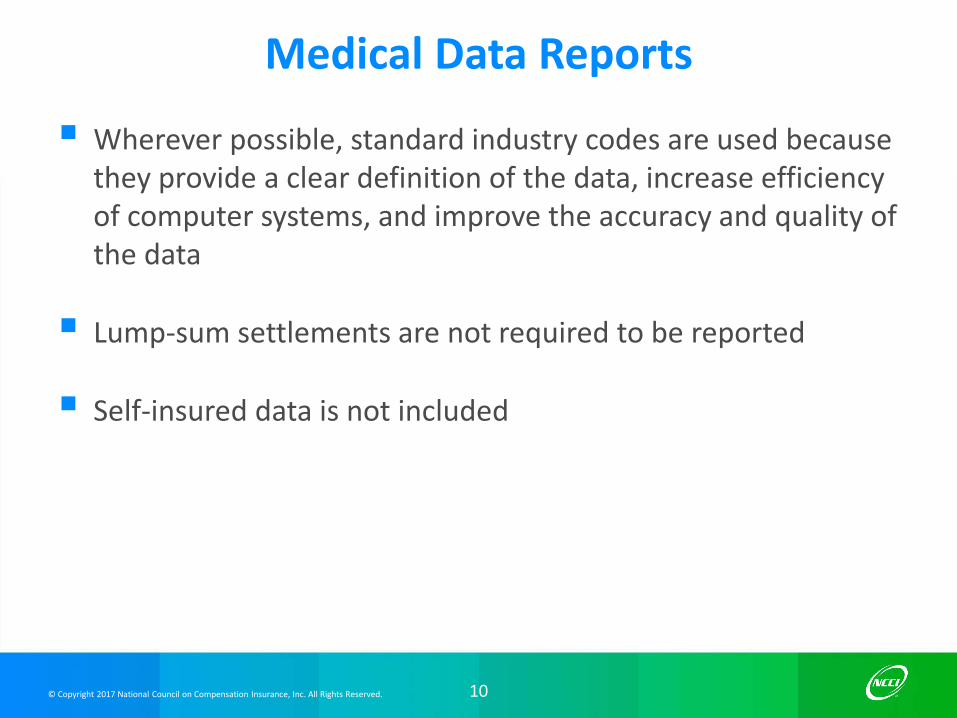
Nevada—Paid Amount
Name of DrugType B/G Category
% of Drug Payments
PPU Nevada
PPU Region
PPU Countrywide
Oxycontin® B Analgesics/Antipyretics 6.7% $9.00 $7.47 $7.76
Oxycodone HCl-Acetaminophen G Analgesics/Antipyretics 6.2% $1.97 $1.63 $1.83
Lyrica® B Miscellaneous Central Nervous System Agents 5.5% $5.38 $5.43 $5.54
Hydrocodone Bitartrate-Acetaminophen
G Analgesics/Antipyretics 3.6% $0.60 $0.60 $0.61
Oxycodone HCl G Analgesics/Antipyretics 3.3% $1.25 $1.12 $1.15
Gabapentin G Anticonvulsants 3.2% $1.06 $1.19 $1.25
Lidocaine GAntipruritics/Local Anesthesia, Skin/Mucous Membrane
3.0% $6.16 $6.54 $7.08
Morphine Sulfate G Analgesics/Antipyretics 2.4% $2.07 $2.71 $2.42
Opana ER® B Analgesics/Antipyretics 1.8% $9.71 $9.41 $9.91
Duloxetine HCl G Psychotherapeutic Agents 1.7% $4.59 $5.29 $5.41
Top 10 Workers Compensation Drugs in Nevada by Amount Paid
Source: NCCI Medical Data Call, Service Year 2015Region includes AZ, CO, NM, and UT. Countrywide includes data for the following states: AK, AL, AR, AZ, CO, CT, DC, FL, GA, HI, IA, ID, IL, IN, KS, KY, LA, MD, ME, MO, MS, MT, NC, NE, NH, NM, NV, OK, OR, RI, SC, SD, TN, UT, VA, VT, and WV
16
© Copyright 2017 National Council on Compensation Insurance, Inc. All Rights Reserved.
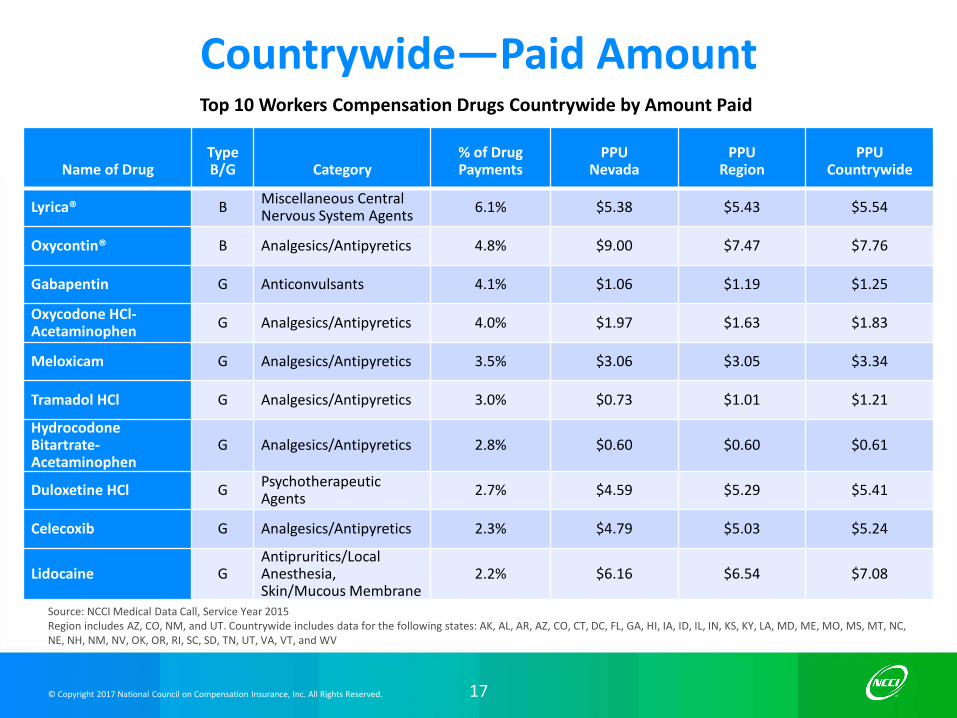
Countrywide—Paid Amount
Source: NCCI Medical Data Call, Service Year 2015Region includes AZ, CO, NM, and UT. Countrywide includes data for the following states: AK, AL, AR, AZ, CO, CT, DC, FL, GA, HI, IA, ID, IL, IN, KS, KY, LA, MD, ME, MO, MS, MT, NC, NE, NH, NM, NV, OK, OR, RI, SC, SD, TN, UT, VA, VT, and WV
Name of DrugType B/G Category
% of Drug Payments
PPU Nevada
PPU Region
PPU Countrywide
Lyrica® B Miscellaneous Central Nervous System Agents 6.1% $5.38 $5.43 $5.54
Oxycontin® B Analgesics/Antipyretics 4.8% $9.00 $7.47 $7.76
Gabapentin G Anticonvulsants 4.1% $1.06 $1.19 $1.25
Oxycodone HCl-Acetaminophen G Analgesics/Antipyretics 4.0% $1.97 $1.63 $1.83
Meloxicam G Analgesics/Antipyretics 3.5% $3.06 $3.05 $3.34
Tramadol HCl G Analgesics/Antipyretics 3.0% $0.73 $1.01 $1.21
Hydrocodone Bitartrate-Acetaminophen
G Analgesics/Antipyretics 2.8% $0.60 $0.60 $0.61
Duloxetine HCl G Psychotherapeutic Agents 2.7% $4.59 $5.29 $5.41
Celecoxib G Analgesics/Antipyretics 2.3% $4.79 $5.03 $5.24
Lidocaine GAntipruritics/Local Anesthesia, Skin/Mucous Membrane
2.2% $6.16 $6.54 $7.08
Top 10 Workers Compensation Drugs Countrywide by Amount Paid
17
© Copyright 2017 National Council on Compensation Insurance, Inc. All Rights Reserved.
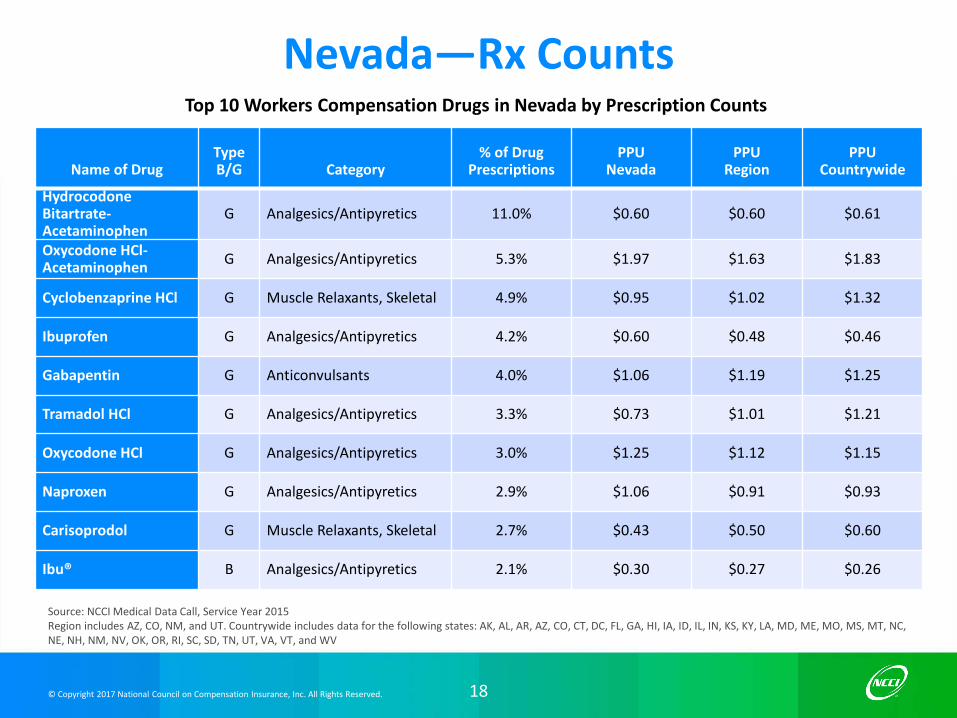
Nevada—Rx Counts
Name of DrugType B/G Category
% of Drug Prescriptions
PPU Nevada
PPU Region
PPUCountrywide
Hydrocodone Bitartrate-Acetaminophen
G Analgesics/Antipyretics 11.0% $0.60 $0.60 $0.61
Oxycodone HCl-Acetaminophen G Analgesics/Antipyretics 5.3% $1.97 $1.63 $1.83
Cyclobenzaprine HCl G Muscle Relaxants, Skeletal 4.9% $0.95 $1.02 $1.32
Ibuprofen G Analgesics/Antipyretics 4.2% $0.60 $0.48 $0.46
Gabapentin G Anticonvulsants 4.0% $1.06 $1.19 $1.25
Tramadol HCl G Analgesics/Antipyretics 3.3% $0.73 $1.01 $1.21
Oxycodone HCl G Analgesics/Antipyretics 3.0% $1.25 $1.12 $1.15
Naproxen G Analgesics/Antipyretics 2.9% $1.06 $0.91 $0.93
Carisoprodol G Muscle Relaxants, Skeletal 2.7% $0.43 $0.50 $0.60
Ibu® B Analgesics/Antipyretics 2.1% $0.30 $0.27 $0.26
Top 10 Workers Compensation Drugs in Nevada by Prescription Counts
Source: NCCI Medical Data Call, Service Year 2015Region includes AZ, CO, NM, and UT. Countrywide includes data for the following states: AK, AL, AR, AZ, CO, CT, DC, FL, GA, HI, IA, ID, IL, IN, KS, KY, LA, MD, ME, MO, MS, MT, NC, NE, NH, NM, NV, OK, OR, RI, SC, SD, TN, UT, VA, VT, and WV
18

© Copyright 2017 National Council on Compensation Insurance, Inc. All Rights Reserved.
Countrywide—Rx Counts
Name of DrugType B/G Category
% of Drug Prescriptions
PPU Nevada
PPU Region
PPUCountrywide
Hydrocodone Bitartrate-Acetaminophen
G Analgesics/Antipyretics 10.4% $0.60 $0.60 $0.61
Tramadol HCl G Analgesics/Antipyretics 5.3% $0.73 $1.01 $1.21
Cyclobenzaprine HCl G Muscle Relaxants, Skeletal 5.0% $0.95 $1.02 $1.32
Oxycodone HCl-Acetaminophen G Analgesics/Antipyretics 4.7% $1.97 $1.63 $1.83
Gabapentin G Anticonvulsants 4.5% $1.06 $1.19 $1.25
Meloxicam G Analgesics/Antipyretics 3.9% $3.06 $3.05 $3.34
Ibuprofen G Analgesics/Antipyretics 3.8% $0.60 $0.48 $0.46
Oxycodone HCl G Analgesics/Antipyretics 2.6% $1.25 $1.12 $1.15
Naproxen G Analgesics/Antipyretics 2.3% $1.06 $0.91 $0.93
Lyrica® B Miscellaneous Central Nervous System Agents 2.1% $5.38 $5.43 $5.54
Top 10 Workers Compensation Drugs Countrywide by Prescription Counts
Source: NCCI Medical Data Call, Service Year 2015Region includes AZ, CO, NM, and UT. Countrywide includes data for the following states: AK, AL, AR, AZ, CO, CT, DC, FL, GA, HI, IA, ID, IL, IN, KS, KY, LA, MD, ME, MO, MS, MT, NC, NE, NH, NM, NV, OK, OR, RI, SC, SD, TN, UT, VA, VT, and WV
19
© Copyright 2017 National Council on Compensation Insurance, Inc. All Rights Reserved.
Schedule Drugs
Drugs are grouped into five different schedules depending on certain qualifications, including the drug’s medical use and potential for abuse
Schedule V drugs have the lowest potential for abuse (some cough medicines that contain small amounts of codeine) while Schedule I drugs are basically illegal (no prescriptions may be written for the drug; e.g., heroin)
20

© Copyright 2017 National Council on Compensation Insurance, Inc. All Rights Reserved.
$21.1M (25%)
$2.3M (3%)
$6.4M (8%)
$5.6M (7%)
$48.9M (57%)
Region
Schedule 2 Schedule 3 Schedule 4 Schedule 5 Non - Controlled
$156.5M (23%)
$13.2M (2%)
$48.1M (7%)
$42.5M (6%)
$416.7M (62%)
Countrywide
Schedule 2 Schedule 3 Schedule 4 Schedule 5 Non - Controlled
$3.8M (34%)
$0.3M (2%)
$0.6M (6%)
$0.6M (6%)
$5.9M (52%)
Nevada
Schedule 2 Schedule 3 Schedule 4 Schedule 5 Non - Controlled
Schedule Drugs
Source: NCCI Medical Data Call, Service Year 2015Region includes AZ, CO, NM, and UT; Countrywide includes data for the following states: AK, AL, AR, AZ, CO, CT, DC, FL, GA, HI, IA, ID, IL, IN, KS, KY, LA, MD, ME, MO, MS, MT, NC, NE, NH, NM, NV, OK, OR, RI, SC, SD, TN, UT, VA, VT, and WV
The Medical Data Report contains charts that show the distribution of prescription drug costs by Controlled Substance Act schedule.
21
© Copyright 2017 National Council on Compensation Insurance, Inc. All Rights Reserved.
Opioid Use in Nevada

© Copyright 2017 National Council on Compensation Insurance, Inc. All Rights Reserved.
Opioid Use in Nevada
• Opioids and Workers CompensationNevada Laws
• Utilization Trends• Cost Trends
Current Opioid Statistics
• Opioids and Benzodiazepines (Benzos)Concurrent Usage
• Trends in “heavy” usersMorphine Milligram Equivalents
23

© Copyright 2017 National Council on Compensation Insurance, Inc. All Rights Reserved.
Nevada Laws: Opioid Controls
Several characteristics of Nevada’s opioid prescribing laws:
Nevada does not limit the quantity that a practitioner can prescribe for CII prescriptions or for any drug
Nevada State Board of Nursing follows the CDC Guideline for Prescribing Opioids for Chronic Pain
Nevada was one of seven states selected to participate in the 2014 Prescription Drug Abuse Reduction Policy Academy Nevada established a taskforce to research prescription
drug abuse in September 2014
24

© Copyright 2017 National Council on Compensation Insurance, Inc. All Rights Reserved.
Nevada Laws: Opioid Controls
Nevada’s fight against the epidemic was changed in 2015 when the governor signed SB 459.
This act addressed physician education, Prescription Drug Monitoring Program (PDMP) utilization, Good Samaritan Immunity Laws, and access to the life-saving drug Naloxone
The Nevada PDMP is a database used by pharmacists and doctors to keep track of patients who are prescribed controlled substances
The PDMP helps dispensers identify recipients who may be “doctor shopping” or otherwise cheating the system
25

© Copyright 2017 National Council on Compensation Insurance, Inc. All Rights Reserved.
Current Opioid Statistics

© Copyright 2017 National Council on Compensation Insurance, Inc. All Rights Reserved.
Drug Overdose Death Rates by State in 2015
Source: https://www.cdc.gov/drugoverdose/data/statedeaths.html
Rate per 100,000 people(age-adjusted)
27

© Copyright 2017 National Council on Compensation Insurance, Inc. All Rights Reserved.
Nevada Opioid Deaths in 2013
Source: Substance Abuse Prevention and Treatment Agency (SAPTA), Nevada Division of Public and Behavioral Health http://dpbh.nv.gov/uploadedFiles/dpbhnvgov/content/Programs/ClinicalSAPTA/Docs/Opioid Deaths Inforgraphic.pdf
Home, 63%
Out-Patient, ER or Trauma
Center, 12%
Inpatient, 8%
Nursing Homes and Other
Patient Care, 1%
Other, 16%
Location of Pronouncementof Death
Accident84%
Suicide11%
Homicide1%
Unknown4%
Manner ofDeath
28

© Copyright 2017 National Council on Compensation Insurance, Inc. All Rights Reserved. 29
Prescription Drug Misuse in Nevada in 2013
Nevada has some of the highest rates of prescription painkillers sold and drug overdose deaths per capita.
2nd highest for hydrocodone (e.g., Vicodin and Lortab)
2nd highest for oxycodone (e.g., Percodan and Percocet)
4th highest for methadone
7th highest for codeine
4th highest drug overdose mortality
Source: Substance Abuse Prevention and Treatment Agency (SAPTA), Nevada Division of Public and Behavioral Health http://dpbh.nv.gov/uploadedFiles/dpbhnvgov/content/Programs/ClinicalSAPTA/Docs/PD Infographic x2.pdf

© Copyright 2017 National Council on Compensation Insurance, Inc. All Rights Reserved.
Current Opioid StatisticsWorkers Compensation

© Copyright 2017 National Council on Compensation Insurance, Inc. All Rights Reserved.
Current Drug Statistics
Source: NCCI Medical Data Call
Nevada Service Year 2015 All Rx Claims
Number of Claimants 11,865
Number of Scripts 82,996
Average Scripts per Claim 7
Paid Amount—All Rx’s $ 11,312,059
Average Rx Paid per Claim $ 953
An Rx claim is a workers compensation claim with at least one prescription drug in the corresponding year
31

© Copyright 2017 National Council on Compensation Insurance, Inc. All Rights Reserved.
Current Opioid Statistics
Source: NCCI Medical Data Call
NevadaService Year 2015
Opioid Claims
Number of Claimants 5,586
Number of Scripts—Opioids 25,672
Average Opioid Scripts per Claim 5
Paid Amount—Opioids $ 3,928,397
Average Opioid Paid per Claim $ 703
A claim is classified as an “Opioid Claim” if the claimant received at least one opioid script in the service year
Those who have received at least one opioid and at least one benzo will be referred to as “Opioid Claims With Benzos” further on in this report
NCCI Proprietary and Confidential - Not For Distribution
32

© Copyright 2017 National Council on Compensation Insurance, Inc. All Rights Reserved.
Nevada—Opioid Paid Amount
Name of Opioid DrugType B/G
% of Drug Payments
PPU Nevada
PPU Region
PPU Countrywide
Oxycontin® B 6.7% $9.00 $7.47 $7.76
Oxycodone HCl-Acetaminophen G 6.2% $1.97 $1.63 $1.83
Hydrocodone Bitartrate-Acetaminophen
G 3.6% $0.60 $0.60 $0.61
Oxycodone HCl G 3.3% $1.25 $1.12 $1.15
Morphine Sulfate G 2.4% $2.07 $2.71 $2.42
Opana ER® B 1.8% $9.71 $9.41 $9.91
Percocet® B 1.5% $12.59 $11.36 $12.10
Oral Transmucosal Fentanyl Citrate G 1.3% $19.55 $22.16 $20.40
Tramadol HCl G 1.2% $0.73 $1.01 $1.21
Fentanyl G 0.9% $23.55 $23.61 $21.62
Top 10 Workers Compensation Opioid Drugs in Nevada by Amount Paid
Source: NCCI Medical Data Call, Service Year 2015Region includes AZ, CO, NM, and UT. Countrywide includes data for the following states: AK, AL, AR, AZ, CO, CT, DC, FL, GA, HI, IA, ID, IL, IN, KS, KY, LA, MD, ME, MO, MS, MT, NC, NE, NH, NM, NV, OK, OR, RI, SC, SD, TN, UT, VA, VT, and WV
33

© Copyright 2017 National Council on Compensation Insurance, Inc. All Rights Reserved.
Nevada—Opioid Rx Counts
Name of Opioid DrugType B/G
% of Drug Prescriptions
PPU Nevada
PPU Region
PPU Countrywide
Hydrocodone Bitartrate-Acetaminophen G 11.0% $0.60 $0.60 $0.61
Oxycodone HCl-Acetaminophen G 5.3% $1.97 $1.63 $1.83
Tramadol HCl G 3.3% $0.73 $1.01 $1.21
Oxycodone HCl G 3.0% $1.25 $1.12 $1.15
Morphine Sulfate G 2.0% $2.07 $2.71 $2.42
Oxycontin® B 1.3% $9.00 $7.47 $7.76
Methadone HCl G 1.0% $0.22 $0.23 $0.26
Acetaminophen-Codeine Phosphate G 0.5% $0.39 $0.44 $0.43
Hydromorphone HCl G 0.5% $1.09 $1.17 $2.29
Opana ER® B 0.4% $9.71 $9.41 $9.91
Top 10 Workers Compensation Opioid Drugs in Nevada by Prescription Counts
Source: NCCI Medical Data Call, Service Year 2015Region includes AZ, CO, NM, and UT. Countrywide includes data for the following states: AK, AL, AR, AZ, CO, CT, DC, FL, GA, HI, IA, ID, IL, IN, KS, KY, LA, MD, ME, MO, MS, MT, NC, NE, NH, NM, NV, OK, OR, RI, SC, SD, TN, UT, VA, VT, and WV
34

© Copyright 2017 National Council on Compensation Insurance, Inc. All Rights Reserved.
60% 20% 4% 3% 12%
Distribution of Opioid Scripts by Claim Maturity
<= 1 2-5 6-10 11-15 16+
Current Opioid Statistics
Source: NCCI Medical Data Call, Service Year 2015
Note: Maturity refers to the numbers of years subsequent to the injury.
35

© Copyright 2017 National Council on Compensation Insurance, Inc. All Rights Reserved.
Current Opioid Statistics
Source: NCCI Medical Data Call
Opioid Claims Without Benzos,
43%
Opioid Claims With Benzos, 4%
Other, 53%
Claim Distribution—Service Year 2015
36

© Copyright 2017 National Council on Compensation Insurance, Inc. All Rights Reserved.
Opioid Utilization Trends
Source: NCCI Medical Data Call
58% 56%53% 54%51% 53%
50% 50%47% 46%
Nevada Region
Share of Drug Claims With at Least One Opioid ScriptBy Service Year
2011 2012 2013 2014 2015
Note: The Region contains the states of AZ, CO, NM, and UT.
37

© Copyright 2017 National Council on Compensation Insurance, Inc. All Rights Reserved.
Opioid Utilization Trends
Source: NCCI Medical Data Call
Service Year 2015Opioid Claims All Rx Claims
Nevada Region Nevada Region
Average Number of Opioid Scripts 4.6 4.2 2.2 1.9
Average Number of Non-Opioid Scripts 6.6 6.3 4.8 4.6
Average Number of Scripts 11.2 10.5 7.0 6.6
Note: The Region contains the states of AZ, CO, NM, and UT.
38

© Copyright 2017 National Council on Compensation Insurance, Inc. All Rights Reserved.
Opioid Utilization Trends
Source: NCCI Medical Data Call
5.6
4.6 5.3
4.4 4.7 4.3
4.8 4.3 4.6
4.2
Nevada Region
Average Number of Opioid Scripts per Opioid ClaimBy Service Year
2011 2012 2013 2014 2015
Note: The Region contains the states of AZ, CO, NM, and UT.
39

© Copyright 2017 National Council on Compensation Insurance, Inc. All Rights Reserved.
Opioid Utilization Trends
Source: NCCI Medical Data Call
36%
34%33%
32%31%
Service Year
Opioid Share of Total Scripts—Nevada2011 2012 2013 2014 2015
40

© Copyright 2017 National Council on Compensation Insurance, Inc. All Rights Reserved.
Opioid Cost Trends
Source: NCCI Medical Data Call
42%38%
34% 35% 35%
Service Year
Opioid Share of Total Rx’s Paid—Nevada2011 2012 2013 2014 2015
41

© Copyright 2017 National Council on Compensation Insurance, Inc. All Rights Reserved.
Opioid Cost Trends
Source: NCCI Medical Data Call
$800
$473
$701
$441
$611
$441
$703
$546
$703 $576
Nevada Region
Average Opioid Paid per Opioid Claim by Service Year
2011 2012 2013 2014 2015
Note: The Region contains the states of AZ, CO, NM, and UT.
42

© Copyright 2017 National Council on Compensation Insurance, Inc. All Rights Reserved.
Concurrent Usage of Opioids and Benzodiazepines

© Copyright 2017 National Council on Compensation Insurance, Inc. All Rights Reserved. 44
Concurrent Use of Opioids and Benzos
According to a report published by the British Medical Journal (BMJ) “benzodiazepines enhance the effects of opioid painkillers, which means this drug combination has a high potential for abuse.”
“The BMJ study found that, of 2,400 veterans in the study’s population who died because of a drug overdose while taking opioid painkiller prescriptions, 49 percent had been concurrently prescribed benzodiazepines.”
Source: http://americanaddictioncenters.org/prescription-drugs/dangers-of-mixing/

© Copyright 2017 National Council on Compensation Insurance, Inc. All Rights Reserved.
Concurrent Use of Opioids and Benzos
Source: NCCI Medical Data Call
Service Year 2015Opioid Claims No Benzos Opioid Claims With Benzos
Nevada Region Nevada Region
Average Number of Opioid Scripts 4.2 3.8 10.0 8.7
Average Number of Non-Opioid Scripts 5.3 5.2 22.4 18.9
Average Number of Scripts 9.4 9.0 32.5 27.6
Note: The Region contains the states of AZ, CO, NM, and UT.
45

© Copyright 2017 National Council on Compensation Insurance, Inc. All Rights Reserved.
Concurrent Use of Opioids and Benzos
Source: NCCI Medical Data Call
22%20%
16% 17%
Nevada Region
Share of Opioid Scripts for Opioid Claims With Benzos
2011 2012 2013 2014 2015
In both Nevada and the region, 4% of prescription drug claimants received at least one opioid and at least one benzo
In Nevada, during 2015, 16% of opioid scripts went to the 4% of claimants that were prescribed both an opioid and a benzo
Note: The Region contains the states of AZ, CO, NM, and UT.
46

© Copyright 2017 National Council on Compensation Insurance, Inc. All Rights Reserved.
Morphine Milligram Equivalents

© Copyright 2017 National Council on Compensation Insurance, Inc. All Rights Reserved.
MME? If you google “MME,” you get
just under 100 million results Here are the top three: Midwest Motor Express French for “Mrs.” Membrane
Metalloendopeptidase, a gene If you google “MME drugs,” you
get just under 400 thousand results
First among them: MME (psychedelic)—Wikipedia 2,4-dimethoxy-5-
ethoxyamphetamine
48

© Copyright 2017 National Council on Compensation Insurance, Inc. All Rights Reserved.
MME Opioids
Morphine
Milligram
EquivalentsFor example,
Fentanyl patch(mcg/hr)
2.4
Codeine(mg/day)
0.15
Oxycodone(mg/day)
1.5
The Centers for Disease Control and Prevention(CDC) provides a way to convert daily, or hourly,doses of opioids to an equivalent daily dose ofmorphine by assigning a conversion factor toeach type of drug
Source: https://www.cdc.gov/drugoverdose/pdf/calculating_total_daily_dose-a.pdf
49

© Copyright 2017 National Council on Compensation Insurance, Inc. All Rights Reserved.
Morphine Milligram EquivalentsOpioid Use in Nevada
Source: NCCI Medical Data Call
2,0101,896
1,7381,624 1,650
Service Year
Average MMEper Opioid Script
2011 2012 2013 2014 2015
5.65.3
4.7 4.8 4.6
Service Year
Average Opioid Scripts per Opioid Claim
2011 2012 2013 2014 2015
Note: The average MME per opioid script has been falling, as well as the average number of opioid scripts per claim.However, the average MME per opioid script increased in SY 2015 (though still below the SY 2013 average).
50

© Copyright 2017 National Council on Compensation Insurance, Inc. All Rights Reserved.
Morphine Milligram EquivalentsOpioid Use in Nevada
Source: NCCI Medical Data Call
11,2899,995
8,256 7,732 7,585
Service Year
Average Yearly MME per Opioid Claim
2011 2012 2013 2014 2015
This chart shows the average yearly amount of MME prescribed to a claimant with at least one opioid Rx
From 2011 to 2015, there has been a 33% drop in the yearly MME-per-opioid claim
51

© Copyright 2017 National Council on Compensation Insurance, Inc. All Rights Reserved.
Morphine Milligram EquivalentsOpioid Use in Nevada
Source: NCCI Medical Data Call
The top 20% of claims in Nevada included about 93% of the total MME prescribed during Service Year 2015.
80.3%
12.6%
3.6%
1.5%2.0%
Distribution of MME by Claim Quintile
90%–100% 80%–90% 70%–80% 60%–70% 60% and Below
52

© Copyright 2017 National Council on Compensation Insurance, Inc. All Rights Reserved. 53
Morphine Milligram EquivalentsOpioid Use in Nevada
A claimant who consumed 100 MME per day for each day of the year would have a yearly MME consumption of 36,500
For service year 2015, average “heavy users" were prescribed about 1.7 times more the MME of such a user
Source: NCCI Medical Data Call
90,58080,619
67,272 62,148 60,831
2,492 2,175 1,739 1,679 1,664
2011 2012 2013 2014 2015
Service Year
Average Yearly MME Prescribed per Opioid Claim
Top 10% Bottom 90%

© Copyright 2017 National Council on Compensation Insurance, Inc. All Rights Reserved.
Concluding Remarks
Opioid use in Nevada’s workers compensation system is on a mild decline•The share of claims with an opioid
continues to decrease•The number of opioid prescriptions per
opioid claim is also declining
Nevada’s opioidpaid-per-opioid claim hasbeen slowly convergingto what the region pays
Roughly one in five opioidscripts goes to the 4% of
claimants who were concurrently prescribed both
an opioid and a benzo
From 2011 to 2015,there has been a33% drop in the
MME-per-opioid claim
NCCI Proprietary and Confidential - Not For Distribution
54

© Copyright 2017 National Council on Compensation Insurance, Inc. All Rights Reserved.
Related Documents


![Non-opioid & Opioid IV Anesthetics Copy [Compatibility Mode]](https://static.cupdf.com/doc/110x72/55cf8c8a5503462b138d78d4/non-opioid-opioid-iv-anesthetics-copy-compatibility-mode.jpg)