Feedstock and Biodiesel Characteristics Report By Shannon D. Sanford*, James Matthew White, Parag S. Shah, Claudia Wee, Marlen A. Valverde, and Glen R. Meier Publication Date: November 17th, 2009 Renewable Energy Group ® 416 S. Bell Avenue P.O. Box 888 Ames, IA 50010-0888 * Corresponding author. Tel.: +1 515 239 8175. E-mail address: [email protected] (Shannon Sanford). Please cite this article in press as: Sanford, S.D., et al., “Feedstock and Biodiesel Characteristics Report,” Renewable Energy Group, Inc., www.regfuel.com (2009).

Welcome message from author
This document is posted to help you gain knowledge. Please leave a comment to let me know what you think about it! Share it to your friends and learn new things together.
Transcript

Feedstock and Biodiesel Characteristics Report
By Shannon D. Sanford*, James Matthew White, Parag S. Shah,
Claudia Wee, Marlen A. Valverde, and Glen R. Meier
Publication Date: November 17th, 2009
Renewable Energy Group® 416 S. Bell Avenue
P.O. Box 888 Ames, IA 50010-0888
* Corresponding author. Tel.: +1 515 239 8175. E-mail address: [email protected] (Shannon Sanford). Please cite this article in press as: Sanford, S.D., et al., “Feedstock and Biodiesel Characteristics Report,” Renewable Energy Group, Inc., www.regfuel.com (2009).
© 2010 Renewable Energy Group, Inc. All Rights Reserved Page 2 of 136
Table of Contents
1! Executive Summary .................................................................................................. 5!
2! Disclaimer .................................................................................................................. 6!
3! Feedstock Sources ..................................................................................................... 7!
4! Feedstock Testing .................................................................................................... 11!4.1! Moisture ............................................................................................................ 11!
4.2! Free Fatty Acid (FFA) ...................................................................................... 13!
4.3! Kinematic Viscosity .......................................................................................... 16!
4.4! FAC Color ......................................................................................................... 18!
4.5! Saponification Value ......................................................................................... 20!
4.6! Moisture and Volatile Matter ............................................................................ 22!
4.7! Insoluble Impurities .......................................................................................... 24!
4.8! Unsaponifiable Matter ...................................................................................... 26!
4.9! Moisture, Insolubles, and Unsaponifiables (MIU) ........................................... 28!
4.10! Oxidation Stability ............................................................................................ 30!
4.11! Sulfur ................................................................................................................ 32!
4.12! Phosphorous, Calcium, and Magnesium ........................................................... 34!
5! Phosphoric Acid Pretreatment of Fats and Oils .................................................. 39!
6! Esterification of Free Fatty Acid with Amberlyst BD 20 .................................... 41!
7! Transesterification of Feedstocks .......................................................................... 44!
8! Biodiesel Characteristics ........................................................................................ 47!8.1! Cloud Point (CP) ............................................................................................... 47!
8.2! Cold Filter Plugging Point (CFPP) ................................................................... 49!
8.3! Cold Soak Filtration .......................................................................................... 51!
8.4! Fatty Acid Profile .............................................................................................. 53!
8.5! Relative Density ................................................................................................ 55!
8.6! Kinematic Viscosity .......................................................................................... 57!
8.7! Sulfated Ash ...................................................................................................... 59!
8.8! Carbon Residue ................................................................................................. 61!
8.9! Water and Sediment .......................................................................................... 63!

© 2010 Renewable Energy Group, Inc. All Rights Reserved Page 3 of 136
8.10! Visual Inspection .............................................................................................. 64!
8.11! Free and Total Glycerin .................................................................................... 66!
8.12! Flash Point ........................................................................................................ 71!
8.13! Copper Corrosion .............................................................................................. 73!
8.14! Phosphorous, Calcium, and Magnesium ........................................................... 74!
8.15! Total Acid Number (TAN) ............................................................................... 80!
8.16! Moisture ............................................................................................................ 82!
8.17! Sulfur ................................................................................................................ 84!
8.18! Oxidation Stability ............................................................................................ 86!
8.19! FTIR .................................................................................................................. 88!
9! Feedstock Supplier Information ............................................................................ 90!
10! Biodiesel Certificates of Analysis ........................................................................... 92!10.1! Algae 1 .............................................................................................................. 93!
10.2! Algae 2 .............................................................................................................. 94!
10.3! Babassu ............................................................................................................. 95!
10.4! Beef Tallow ....................................................................................................... 96!
10.5! Borage ............................................................................................................... 97!
10.6! Camelina ........................................................................................................... 98!
10.7! Canola ............................................................................................................... 99!
10.8! Castor .............................................................................................................. 100!
10.9! Choice White Grease ...................................................................................... 101!
10.10! Coconut ........................................................................................................... 102!
10.11! Coffee .............................................................................................................. 103!
10.12! Corn, Distiller’s .............................................................................................. 104!
10.13! Cuphea viscosissima ....................................................................................... 105!
10.14! Evening Primrose ............................................................................................ 106!
10.15 Fish.. ................................................................................................................ 107
10.16! Hemp ............................................................................................................... 108!
10.17! Hepar, High IV ............................................................................................... 109!
10.18! Hepar, Low IV ................................................................................................ 110!
10.19! Jatropha ........................................................................................................... 111!
10.20! Lesquerella fendleri ........................................................................................ 112!
© 2010 Renewable Energy Group, Inc. All Rights Reserved Page 4 of 136
10.21! Linseed ............................................................................................................ 113!
10.22! Moringa oleifera ............................................................................................. 114!
10.23! Mustard ........................................................................................................... 115!
10.24! Neem ............................................................................................................... 116!
10.25! Palm ................................................................................................................ 117!
10.26! Perilla .............................................................................................................. 118!
10.27! Poultry Fat ....................................................................................................... 119!
10.28! Rice Bran ........................................................................................................ 120!
10.29! Soybean ........................................................................................................... 121!
10.30! Stillingia .......................................................................................................... 122!
10.31! Sunflower ........................................................................................................ 123!
10.32! Tung ................................................................................................................ 124!
10.33! Used Cooking Oil ........................................................................................... 125!
10.34! Yellow Grease ................................................................................................. 126!
11! Pictures of Feedstock and Biodiesel .................................................................... 127!
12! References .............................................................................................................. 132!
© 2010 Renewable Energy Group, Inc. All Rights Reserved Page 5 of 136
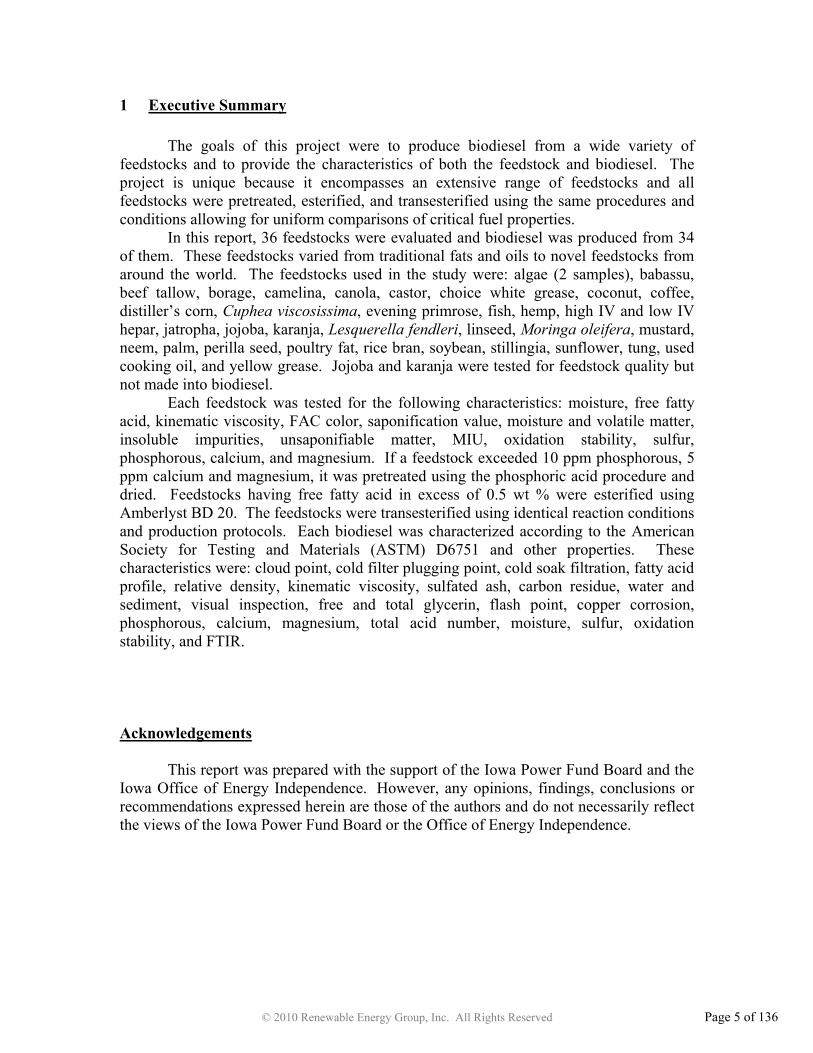
1 Executive Summary
The goals of this project were to produce biodiesel from a wide variety of feedstocks and to provide the characteristics of both the feedstock and biodiesel. The project is unique because it encompasses an extensive range of feedstocks and all feedstocks were pretreated, esterified, and transesterified using the same procedures and conditions allowing for uniform comparisons of critical fuel properties.
In this report, 36 feedstocks were evaluated and biodiesel was produced from 34 of them. These feedstocks varied from traditional fats and oils to novel feedstocks from around the world. The feedstocks used in the study were: algae (2 samples), babassu, beef tallow, borage, camelina, canola, castor, choice white grease, coconut, coffee, distiller’s corn, Cuphea viscosissima, evening primrose, fish, hemp, high IV and low IV hepar, jatropha, jojoba, karanja, Lesquerella fendleri, linseed, Moringa oleifera, mustard, neem, palm, perilla seed, poultry fat, rice bran, soybean, stillingia, sunflower, tung, used cooking oil, and yellow grease. Jojoba and karanja were tested for feedstock quality but not made into biodiesel.
Each feedstock was tested for the following characteristics: moisture, free fatty acid, kinematic viscosity, FAC color, saponification value, moisture and volatile matter, insoluble impurities, unsaponifiable matter, MIU, oxidation stability, sulfur, phosphorous, calcium, and magnesium. If a feedstock exceeded 10 ppm phosphorous, 5 ppm calcium and magnesium, it was pretreated using the phosphoric acid procedure and dried. Feedstocks having free fatty acid in excess of 0.5 wt % were esterified using Amberlyst BD 20. The feedstocks were transesterified using identical reaction conditions and production protocols. Each biodiesel was characterized according to the American Society for Testing and Materials (ASTM) D6751 and other properties. These characteristics were: cloud point, cold filter plugging point, cold soak filtration, fatty acid profile, relative density, kinematic viscosity, sulfated ash, carbon residue, water and sediment, visual inspection, free and total glycerin, flash point, copper corrosion, phosphorous, calcium, magnesium, total acid number, moisture, sulfur, oxidation stability, and FTIR.
Acknowledgements
This report was prepared with the support of the Iowa Power Fund Board and the Iowa Office of Energy Independence. However, any opinions, findings, conclusions or recommendations expressed herein are those of the authors and do not necessarily reflect the views of the Iowa Power Fund Board or the Office of Energy Independence.

© 2010 Renewable Energy Group, Inc. All Rights Reserved Page 6 of 136
2 Disclaimer
This report contains guidelines, procedures and protocols for performing experiments and testing that includes biodiesel, fats, oils, and chemicals. The authors in no way imply that these procedures are described in complete detail or are safe to reproduce. When performing chemical testing or analyzing products, there is no substitute for good judgment and thorough background research on hazards and toxicities. A list of possible hazards and hazardous environments when synthesizing and testing products described in the report include, but are not limited to: mechanical failure, high pressures, high temperature, high voltage, chemical toxicity, chemical reactivity, chemical explosion, acid burns, and toxic vapors. The authors assume no responsibility for any incident that occurs when reproducing procedures similar to or the same as described in this report.

© 2010 Renewable Energy Group, Inc. All Rights Reserved Page 7 of 136
3 Feedstock Sources
Sources of feedstocks are described in this chapter. For supplier contact information, see Chapter 9. Algae Oil
Two diverse samples of crude algal oil were obtained from Solazyme, Inc. Babassu Oil
Babassu oil was purchased from Jedwards International, Inc. Babassu oil is extracted from the seeds of the babassu palm tree, Attalea speciosa. The tree is common in Brazil, Mexico, and Honduras; it grows well in areas typically cultivated for coconut or palm. The kernels contain 60-70% oil.1 Beef Tallow
Crude beef tallow was obtained from a commercially available source. Animal tissue is converted to tallow using rendering; a process by which lipid material is separated from meat tissue and water under heat and pressure.2 Borage Oil
Borage oil, gamma linolenic acid (GLA) content of 20%, was purchased from Jedwards International, Inc. Borage oil comes from the plant, Borago officinalis, also known as starflower. It has the highest value of !-linolenic acid in any readily available specialty oil.3 Camelina Oil
Camelina oil comes from the plant, Camelina sativa. It is an annual flowering plant that grows well in temperate climates and is also known as gold-of-pleasure and false flax. Some varieties of camelina contain 38-40 % oil. Camelina can be grown in arid conditions and does not require significant amounts of fertilizer.4 Canola Oil
Crude degummed canola oil was obtained from a commercially available source. Canola is the seed of the species Brassica napus or Brassica campestris; the oil component contains less than two percent erucic acid and the solid component contains less than 30 micromoles per gram of glucosinolates.5 Castor Oil
Castor was United States Pharmacopeia (USP) grade, from Jedwards International, Inc. Castor oil comes from the castor bean Ricinus communis. Castor is grown in tropical and subtropical regions and prefers a dry climate. The seeds contain about 45-50% oil. Triglycerides of ricinoleic acid constitute 84-90%.1

© 2010 Renewable Energy Group, Inc. All Rights Reserved Page 8 of 136
Choice White Grease Crude choice white grease (CWG) was obtained from a commercially available
source. Choice white grease is a specific grade of mostly pork fat defined by hardness, color, fatty acid content, moisture, insolubles, unsaponifiables and free fatty acids.6 Coconut Oil
Refined, bleached, deodorized (RBD) coconut oil was purchased from Jedwards International, Inc. Coffee Oil
Refined coffee oil was purchased from Oils by Nature, Inc. Coffee oil comes from spent coffee grounds; the grounds can contain as much as 11 to 20 percent oil. Currently coffee grounds are disposed of or used as compost. After oil extraction, the grounds could still be used as compost and the oil could be used to make biodiesel.7 Corn Oil, Distiller’s
Crude, dry distiller’s grain (DDG) extracted corn oil was obtained from a commercially available source. The extracted corn oil comes from the DDG stream of the ethanol production process. Cuphea viscosissima Oil
RBD Cuphea oil was donated by the National Center for Agricultural Utilization Research. Cuphea viscosissima is also known as blue waxweed, an annual crop. The seeds contain 25-43% oil.1 Evening Primrose Oil
Evening primrose oil, GLA 9%, was purchased from Jedwards International, Inc. Evening primrose is a wildflower native to North America. Fish Oil
Fish oil was obtained from a commercially available source in Peru. Hemp Oil
Hemp seed oil was purchased from Jedwards International, Inc. The oil is derived from the plant Cannabis sativa and contains significant amounts of "-linolenic acid and !-linolenic acid.8 Hemp is legally grown in Canada as a niche crop and is used mainly in the health food market. Hemp seeds have an oil content of 33 percent.9 Hepar, High Iodine Value and Low Iodine Value (IV)
Crude, high IV hepar and crude, low IV hepar were obtained from a commercially available source. Hepar is a byproduct of the heparin manufacturing process. Pharmaceutical grade heparin is derived from the mucosal tissues of animals, such as pig intestines or cow lungs.10
© 2010 Renewable Energy Group, Inc. All Rights Reserved Page 9 of 136
Jatropha Oil Crude jatropha oil was obtained from a commercially available source. Jatropha
oil comes from the shrub Jatropha curcas, also known as physic nut. The plant is native to Mexico, Central America, Brazil, Bolivia, Peru, Argentina, and Paraguay.11 Jojoba Oil
Golden jojoba oil was purchased from Jedwards International, Inc. Jojoba (Simmondsia chinensis) is an evergreen perennial shrub grown in Arizona, Mexico, and neighboring areas. The dehulled seeds of jojoba contain 44% of liquid wax, which is not a triglyceride.1 Karanja Oil
Pure, cold pressed karanja oil was purchased from The Ahimsa Alternative, Inc. Karanja (Pongamia pinnata) is a medium sized evergreen tree that grows in India. The seed contains 27-39% oil. The oil is reddish brown and rich in unsaponifiable matter and oleic acid.1 Lesquerella fendleri Oil
RBD Lesquerella oil was purchased from Technology Crops International. Lesquerella fendleri is also known as Fendler’s bladderpod. Lesquerella seeds contain 20-28% oil with around 62% lesquerolic acid. Lesquerella oil is a source of hydroxy unsaturated fatty acids, and can be used similarly to castor oil.1 Linseed Oil
Crude linseed oil was purchased from Botanic Oil Innovations, Inc. Linseed has been traditionally used as a drying oil. It grows in Argentina, India, and Canada. It is an annual herb and contains 37-42% oil. The crude oil contains 0.25% phosphatides, a small amount of crystalline wax, and a water-soluble resinous matter with antioxidant properties.1
Moringa oleifera Oil
Crude Moringa oil was obtained from a commercially available source. Moringa oleifera is a tree that ranges in height from 5 to 10 meters, and is native to India, Africa, Arabia, Southeast Asia, the Pacific and Caribbean islands, South America, and the Philippines. Moringa seeds contain between 33 and 41 % oil. It is also known as ben oil, due to its content of behenic (docosanoic) acid.12 Mustard Oil
Refined mustard oil was obtained from a commercially available source. Neem Oil
Pure, cold pressed neem oil was purchased from The Ahimsa Alternative, Inc. Neem (Azadirachta indica) is a large evergreen tree, 12 to 18 m tall, found in India, Pakistan, Sri Lanka, Burma, Malaya, Indonesia, Japan, and the tropical regions of Australia. The kernels contain 40-50% of an acrid green to brown colored oil.1

© 2010 Renewable Energy Group, Inc. All Rights Reserved Page 10 of 136
Palm Oil Palm oil was obtained from a commercially available source.
Perilla Seed Oil
Perilla seed oil was purchased from Jedwards International, Inc. Perilla oil comes from the plant Perilla Ocymoides, the seeds of which contain 35-45 percent oil. Perilla oil has been cultivated in China, Korea, Japan, and India.13 Poultry Fat
Crude poultry fat was obtained from a commercially available source. Rice Bran Oil
Refined, bleached, deodorized, winterized (RBDW) rice bran oil was purchased from Jedwards International, Inc. Rice bran oil is a non-edible vegetable oil which is greatly available in rice cultivating countries. Rice bran is a co-product of rice milling, containing about 15-23% oil.14 Soybean Oil
Refined soybean oil was obtained from a commercially available source. Stillingia Oil
Stillingia oil was donated by SPESS, LSU AgCenter. Stillingia oil comes from the Chinese tallow tree (Triadica sebifera). The tree has been used to prevent soil erosion. The tree can be grown on marginal land, and is native to eastern Asia. The seeds contain 45-60 percent oil.15 Sunflower Oil
Sunflower oil was purchased from Jedwards, International, Inc. Tung Oil
Tung oil was purchased from Sigma-Aldrich Co. Used Cooking Oil
Crude used cooking oil was obtained from a commercially available source. Yellow Grease
Crude yellow grease was purchased from Wildlife Sciences. Yellow grease is made up of restaurant greases, which are fats and oils left over from cooking. It can also be from rendering plants producing different quality greases.2

© 2010 Renewable Energy Group, Inc. All Rights Reserved Page 11 of 136
4 Feedstock Testing 4.1 Moisture
Moisture is a minor component found in all feedstocks tested. Moisture can react with the catalyst during transesterification which can lead to soap formation and emulsions. 16,17 For this study, if the feedstock moisture was above 0.050 wt %, the feedstock was dried using heat and vacuum to reduce the moisture before further conversion to minimize effects from emulsions during transesterification. Materials and Methods
The feedstock moisture was measured in accordance with ASTM E203, Standard Test Method for Water Using Volumetric Karl Fischer Titration.17 The moisture was measured on a volumetric Titrando manufactured by Metrohm, Inc. Results and Discussion Table 4.1-1
Feedstock Moisture (wt %) Feedstock Moisture (wt %)
Algae 1 0.021 Jatropha 0.073 Algae 2 0.014 Jojoba 0.026 Babassu 0.057 Karanja 0.118 Beef Tallow 0.051 Lesquerella fendleri 0.030 Borage 0.023 Linseed 0.099 Camelina 0.051 Moringa oleifera 0.065 Canola 0.085 Mustard 0.039 Castor 0.179 Neem 0.098 Choice White Grease 0.218 Palm 0.049 Coconut 0.027 Perilla Seed 0.025 Coffee 0.033 Poultry Fat 0.065 Corn, Distiller’s 0.153 Rice Bran 0.021 Cuphea viscosissima 0.091 Soybean 0.029 Evening Primrose 0.019 Stillingia 0.052 Fish 0.106 Sunflower 0.020 Hemp 0.017 Tung 0.093 Hepar, High IV 0.497 Used Cooking Oil 0.242 Hepar, Low IV 0.146 Yellow Grease 0.485

© 2010 Renewable Energy Group, Inc. All Rights Reserved Page 12 of 136
Feedstock Moisture
0.000
0.100
0.200
0.300
0.400
0.500
Hem
pE
veni
ng P
rimro
seA
lgae
2S
unflo
wer
Alg
ae 1
Ric
e B
ran
Bor
age
Per
illa
See
dJo
joba
Coc
onut
Soy
bean
Lesq
uere
lla F
endl
eri
Cof
fee
Mus
tard
Pal
mB
eef T
allo
wC
amel
ina
Bab
assu
Mor
inga
Ole
ifera
Pou
ltry
Fat
Jatro
pha
Can
ola
Cup
hea
Vis
cosi
ssim
aTu
ngN
eem
Lins
eed
Fish
Kar
anja
Hep
ar, H
igh
IVC
orn
Cas
tor
Cho
ice
Whi
te G
reas
eU
sed
Coo
king
Oil
Yel
low
Gre
ase
Hep
ar, L
ow IV
Feedstock
Moi
stur
e (w
t %)
Fig. 4.1-1
For the feedstocks with a moisture content of above 0.05 wt %, the application of heat and vacuum successfully lowered the moisture content.

© 2010 Renewable Energy Group, Inc. All Rights Reserved Page 13 of 136
4.2 Free Fatty Acid (FFA)
The interaction of FFA in the feedstock and sodium methoxide catalyst may form emulsions which make separation of the biodiesel more difficult; possibly leading to yield loss. Emulsions can also increase cost by introducing extra cleaning steps and replacement of filters. To minimize the generation of soaps during the reaction, the target reduction for FFA in the feedstock was 0.5 wt % or less.16 Materials and Methods
The FFA determination was performed following two methods. ASTM D664, Standard Test Method for Acid Number of Petroleum Products by Potentiometric Titration, Method A, was first used to determine TAN in the samples, after this, the FFA values were calculated using the mathematical formulas found in the American Oil Chemists’ Society (AOCS) Method Ca 5a-40.18,19
An 836 Titrando (Metrohm, Inc.) instrument and a Dosino dispensing unit were used. Titration solvent, 0.1 N KOH in isopropanol was purchased from Fisher Scientific Inc.

© 2010 Renewable Energy Group, Inc. All Rights Reserved Page 14 of 136
Results and Discussion Table 4.2-1
Feedstock FFA (wt %) Feedstock FFA (wt %)
Algae 1 0.45 Jatropha 1.17 Algae 2 1.75 Jojoba 0.20 Babassu* 0.04 Karanja 8.27 Beef Tallow 1.61 Lesquerella fendleri 0.16 Borage 0.11 Linseed 0.66 Camelina 0.49 Moringa oleifera 0.21 Canola 0.34 Mustard 0.30 Castor 0.54 Neem 2.14 Choice White Grease 0.61 Palm** 0.54 Coconut* 0.07 Perilla Seed 0.43 Coffee 0.29 Poultry Fat 1.70 Corn, Distiller’s 12.22 Rice Bran 0.05 Cuphea viscosissima Not enough sample Soybean 0.07 Evening Primrose 0.36 Stillingia 5.30 Fish 1.37 Sunflower 0.04 Hemp 0.31 Tung 2.02 Hepar, High IV 3.63 Used Cooking Oil 2.72 Hepar, Low IV 1.27 Yellow Grease 7.38
*FFA is reported as lauric acid for coconut oil and babassu oil **FFA is reported as palmitic acid for palm oil.

© 2010 Renewable Energy Group, Inc. All Rights Reserved Page 15 of 136
Feedstock FFA
0
2
4
6
8
10
12
14S
unflo
wer
Bab
assu
Ric
e B
ran
Coc
onut
Soy
bean
Bor
age
Lesq
uere
lla F
endl
eri
Can
ola
Jojo
baM
orin
ga O
leife
raC
offe
eM
usta
rdH
emp
Eve
ning
Prim
rose
Per
illa
See
dA
lgae
1C
amel
ina
Cas
tor
Pal
mC
hoic
e W
hite
Lins
eed
Jatro
pha
Hep
ar, L
ow IV
Fish
Bee
f Tal
low
Pou
ltry
Fat
Alg
ae 2
Tung
Nee
mU
sed
Coo
king
Oil
Hep
ar, H
igh
IVS
tillin
gia
Yel
low
Gre
ase
Kar
anja
Cor
n
Feedstock
FFA
(wt %
)
Fig. 4.2-1
From Fig. 4.2-1, it can be seen that many feedstocks as received had FFA values that were above 0.5 wt %. These feedstocks were esterified by a method described in Chapter 6 of this report; using methanol and a special catalyst prior the transesterification step. Except for karanja oil, the FFA content was successfully lowered to below 0.5 wt %.

© 2010 Renewable Energy Group, Inc. All Rights Reserved Page 16 of 136
4.3 Kinematic Viscosity
Viscosity is defined as the resistance to shear or flow; it is highly dependent on temperature and it describes the behavior of a liquid in motion near a solid boundary like the walls of a pipe. The presence of strong or weak interactions at the molecular level can greatly affect the way the molecules of an oil or fat slide pass each other, therefore, affecting their resistance to flow.
The kinematic viscosity test calls for a glass capillary viscometer with a calibration constant (c) given in mm2/s2. The kinematic viscosity determination requires the measurement of the time (t) the fluid takes to go from point A to point B inside the viscometer. The kinematic viscosity (#) is calculated by means of the following equation20: # = c · t Materials and Methods
ASTM D445, Standard Test Method for Kinematic Viscosity of Transparent and Opaque Liquids (and Calculation of Dynamic Viscosity) was used. The units of kinematic viscosity are centistokes (cSt) or mm2/s.20 A K23700 kinematic viscosity bath manufactured by Koehler Instrument Company, Inc. was utilized. Results and Discussion Table 4.3-1
Feedstock Kinematic Viscosity (mm2/s at 40°C)
Feedstock Kinematic Viscosity (mm2/s at 40°C)
Algae 1 10.99 Jatropha 33.90 Algae 2 35.41 Jojoba 24.85 Babassu 28.45 Karanja 43.61 Beef Tallow 45.34 Lesquerella fendleri 126.80 Borage 29.92 Linseed 25.75 Camelina 30.90 Moringa oleifera 43.20 Canola 34.72 Mustard Not enough sampleCastor 251.20 Neem 50.30 Choice White Grease 40.96 Palm 44.79 Coconut 27.26 Perilla Seed 24.11 Coffee 40.97 Poultry Fat 36.63 Corn, Distiller’s 30.75 Rice Bran 36.68 Cuphea viscosissima Not enough sample Soybean 28.87 Evening Primrose 29.44 Stillingia Not enough sampleFish 24.31 Sunflower 35.84 Hemp 27.60 Tung 110.00 Hepar, High IV 38.62 Used Cooking Oil 27.00 Hepar, Low IV 40.60 Yellow Grease 132.10
© 2010 Renewable Energy Group, Inc. All Rights Reserved Page 17 of 136
Feedstock Kinematic Viscosity
0
50
100
150
200
250
300
Alg
ae 1
Per
illa
See
dFi
shJo
joba
Lins
eed
Coc
onut
Hem
pB
abas
suS
oybe
anE
veni
ng P
rimro
seB
orag
eC
orn
Cam
elin
aJa
troph
aA
lgae
2U
sed
Coo
king
Oil
Sun
flow
erP
oultr
y Fa
tR
ice
Bra
nC
anol
aH
epar
, Hig
h IV
Hep
ar, L
ow IV
Cho
ice
Whi
te G
reas
eC
offe
eY
ello
w G
reas
eM
orin
ga O
leife
raK
aran
jaP
alm
Bee
f Tal
low
Nee
mTu
ngLe
sque
rella
Fen
dler
iC
asto
r
Feedstock
Kin
emat
ic V
isco
sity
(mm
2 /s)
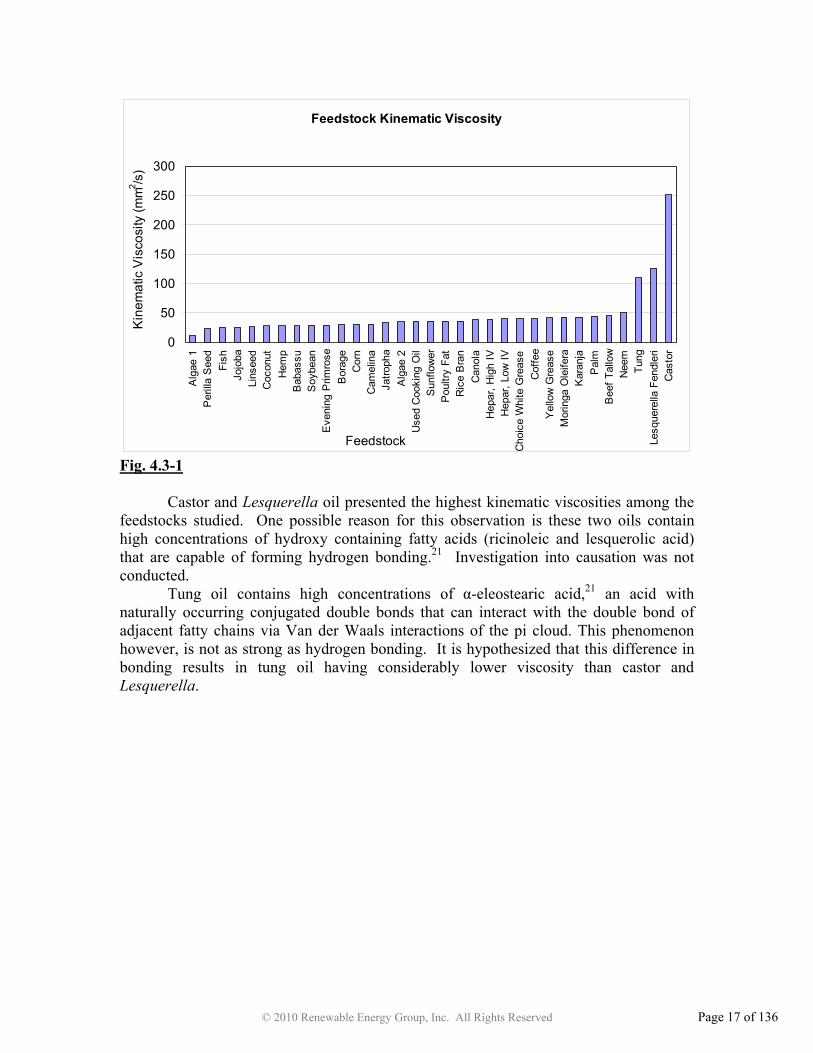
Fig. 4.3-1
Castor and Lesquerella oil presented the highest kinematic viscosities among the feedstocks studied. One possible reason for this observation is these two oils contain high concentrations of hydroxy containing fatty acids (ricinoleic and lesquerolic acid) that are capable of forming hydrogen bonding.21 Investigation into causation was not conducted.
Tung oil contains high concentrations of "-eleostearic acid,21 an acid with naturally occurring conjugated double bonds that can interact with the double bond of adjacent fatty chains via Van der Waals interactions of the pi cloud. This phenomenon however, is not as strong as hydrogen bonding. It is hypothesized that this difference in bonding results in tung oil having considerably lower viscosity than castor and Lesquerella.

© 2010 Renewable Energy Group, Inc. All Rights Reserved Page 18 of 136
4.4 FAC Color
The Fat Analysis Committee (FAC) color method determines the color of oils and fats by comparing them with color standards. Materials and Methods
This test uses AOCS Method Cc 13a-43, Color, FAC Standard Color.22 A Lovibond AF229 FAC Color Comparator was used to measure the FAC color of the feedstocks. It was purchased from Wilkens-Anderson Company of Chicago, Illinois. Results and Discussion Table 4.4 -1
Feedstock FAC Color Feedstock FAC Color
Algae 1 3 Jatropha 19 Algae 2 13 Jojoba 21 Babassu <13 Karanja 0 Beef Tallow 11A Lesquerella fendleri 13 Borage 13 Linseed 23 Camelina 23 Moringa oleifera 21 Canola 1 Mustard Not enough sample Castor <13 Neem 11A Choice White Grease <13 Palm 13 Coconut 13 Perilla Seed 13 Coffee 15 Poultry Fat 11B Corn, Distiller’s 33 Rice Bran 13 Cuphea viscosissima Not enough sample Soybean 0 Evening Primrose 15 Stillingia Not enough sample Fish 5 Sunflower <13 Hemp <13 Tung 0 Hepar, High IV 17 Used Cooking Oil 11B Hepar, Low IV <13 Yellow Grease 11B
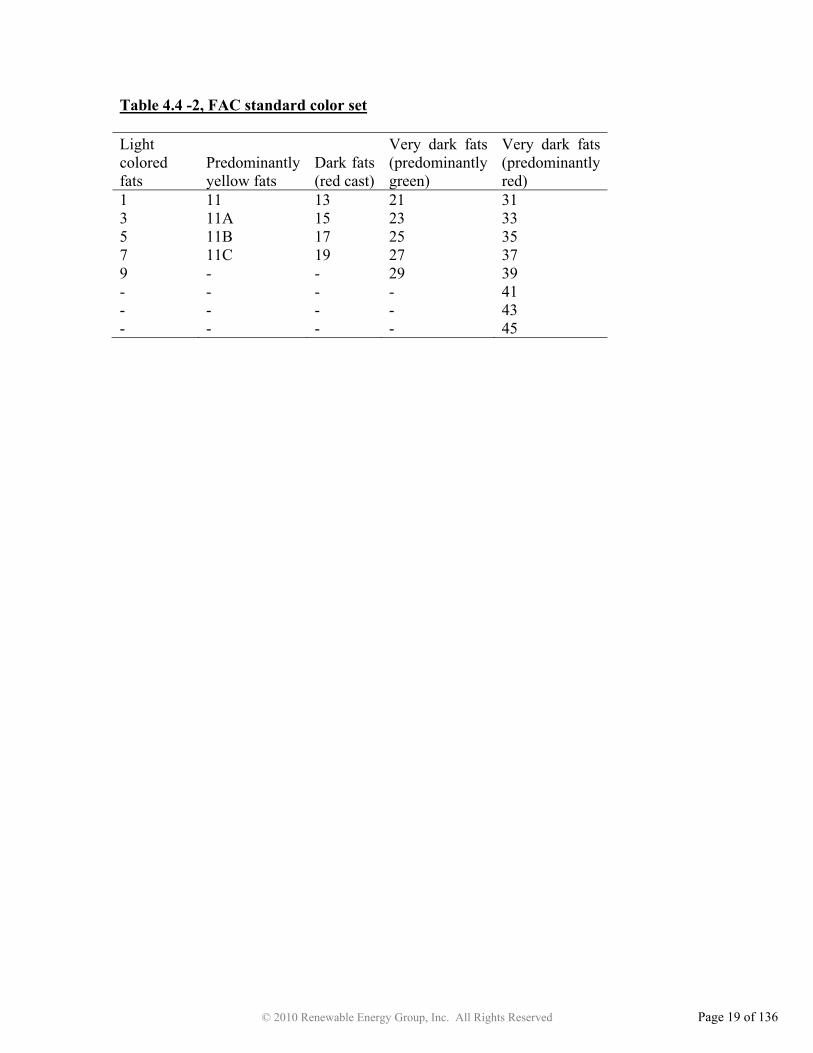
The FAC standard color set is shown in Table 4.4-2. The lightest color on the
wheel is a 13, but most of the oils and fats that received a 13 or <13 as a result would not be considered a dark fat.
© 2010 Renewable Energy Group, Inc. All Rights Reserved Page 19 of 136
Table 4.4 -2, FAC standard color set Light colored fats
Predominantly yellow fats
Dark fats (red cast)
Very dark fats (predominantly green)
Very dark fats (predominantly red)
1 11 13 21 31 3 11A 15 23 33 5 11B 17 25 35 7 11C 19 27 37 9 - - 29 39 - - - - 41 - - - - 43 - - - - 45

© 2010 Renewable Energy Group, Inc. All Rights Reserved Page 20 of 136
4.5 Saponification Value The saponification value is defined as the amount of potassium hydroxide (KOH)
in milligrams required to saponify one gram of fat or oil under the conditions specified. 23 Based on the length of the fatty acids present in the triacylglycerol molecule, the weight of the triacylglycerol molecule changes which in turn affects the amount of KOH required to saponify the molecule. Hence, saponification value is a measure of the average molecular weight or the chain length of the fatty acids present. As most of the mass of a triglyceride is in the three fatty acids, it allows for comparison of the average fatty acid chain length.
Materials and Methods
AOCS Method Cd 3-25 was used to determine the saponification value of the feedstocks.23 The method includes refluxing the known amount of fat or oil with a fixed but excess amount of alcoholic KOH. The amount of KOH remaining after hydrolysis was determined by back titrating with standardized 0.5 N HCl and the amount of KOH consumed during saponification was calculated. Hydrochloric acid solution, potassium hydroxide, and phenolphthalein were purchased from Fisher Scientific Inc. Results and Discussion Table 4.5 -1
Feedstock Saponification Value (mg KOH/g)
Feedstock Saponification Value (mg KOH/g)
Algae 1 160.60 Jatropha 200.80 Algae 2 185.82 Jojoba 105.99 Babassu 258.49 Karanja 188.50 Beef Tallow 198.00 Lesquerella fendleri 173.94 Borage 202.57 Linseed 187.63 Camelina 190.70 Moringa oleifera 194.96 Canola 189.80 Mustard Not enough sample Castor 191.08 Neem 209.66 Choice White Grease 202.45 Palm 208.62 Coconut 267.56 Perilla Seed 205.77 Coffee 195.65 Poultry Fat 188.08 Corn, Distiller’s 183.06 Rice Bran 201.27 Cuphea viscosissima Not enough sample Soybean 195.30 Evening Primrose 189.03 Stillingia Not enough sample Fish 205.67 Sunflower 193.14 Hemp 203.86 Tung 189.53 Hepar, High IV 205.35 Used Cooking Oil 198.50 Hepar, Low IV 207.41 Yellow Grease 198.36

© 2010 Renewable Energy Group, Inc. All Rights Reserved Page 21 of 136
Feedstock Saponification Value
0
50
100
150
200
250
300
Jojo
ba
Alg
ae 1
Lesq
uere
lla F
endl
eri
Cor
nA
lgae
2Li
nsee
dP
oultr
y Fa
tK
aran
jaE
veni
ng P
rimro
seTu
ngC
anol
aC
amel
ina
Cas
tor
Sun
flow
erM
orin
ga O
leife
raS
oybe
anC
offe
eB
eef T
allo
wY
ello
w G
reas
eU
sed
Coo
king
Oil
Jatro
pha
Ric
e B
ran
Cho
ice
Whi
te G
reas
eB
orag
eH
emp
Hep
ar, H
igh
IVFi
shP
erill
a S
eed
Hep
ar, L
ow IV
Pal
mN
eem
Bab
assu
Coc
onut
Feedstock
Sap
onifi
catio
n V
alue
(mg
KO
H/g
)
Fig. 4.5 -1
As seen from Table 4.5-1, the saponification value for the majority of the feedstocks are in the range of 185 to 210 mg KOH/g. This range is typical for feedstocks having predominately fatty acids with a chain length between C16 and C18.16
Babassu and coconut oil have a relatively higher saponification value of 258.5 and 267.6 mg KOH/g, respectively. Higher saponification values may indicate the presence of shorter chain lengths. As seen in Table 8.4-1, the babassu and coconut oil have a higher fraction of C12 and C14 fatty acids.
Jojoba and Lesquerella oil have lower than average saponification values of 106 and 173.9 mg KOH/g, respectively. For Lesquerella this indicates the presence of fatty acids with a longer chain length than C18. Table 8.4-1 confirms that Lesquerella has a higher C20 and C22 fraction. Jojoba is a long chain ester;24 of which the alcohol portion is a long chain alcohol and accounts for nearly as much weight in the molecule as the fatty acid portion of the ester. This added weight effectively dilutes the fatty acid leading to a lower saponification value.

© 2010 Renewable Energy Group, Inc. All Rights Reserved Page 22 of 136
4.6 Moisture and Volatile Matter
The test for moisture and volatile matter from the fats and oils industry may be included in fat and oil specifications. The method involves heating a known amount of feedstock to a certain temperature and recording the weight loss. The presence of volatile matter in a feedstock may lead to fatty acid methyl ester yield loss by reacting with the catalyst or by diluting the feedstock. Materials and Methods
The moisture and volatile matter was run in accordance with AOCS Method Ca 2b-38, Moisture and Volatile Matter Hot Plate Method.25 The temperature of the feedstock was measured with a Scotchtrak Heat Tracer IR-1000 (3M™). Results and Discussion Table 4.6 -1
Feedstock Moisture and Volatile Matter (wt %)
Feedstock Moisture and Volatile Matter (wt %)
Algae 1 Not tested Jatropha 0.0589 Algae 2 Not tested Jojoba 0.0059 Babassu 0.0260 Karanja 0.3126 Beef Tallow 0.3101 Lesquerella fendleri 0.0490 Borage <0.001 Linseed 0.0410 Camelina 0.0336 Moringa oleifera 0.0376 Canola <0.001 Mustard Not enough sample Castor 0.1301 Neem 0.5344 Choice White Grease 0.0415 Palm 0.0039 Coconut 2.5371 Perilla Seed <0.001 Coffee <0.001 Poultry Fat 0.0219 Corn, Distiller’s 0.4310 Rice Bran 1.7400 Cuphea viscosissima Not enough sample Soybean 0.4091 Evening Primrose <0.001 Stillingia Not enough sample Fish 1.1570 Sunflower <0.001 Hemp <0.001 Tung 0.0825 Hepar, High IV 0.4854 Used Cooking Oil 0.7598 Hepar, Low IV 0.0635 Yellow Grease 0.1629
© 2010 Renewable Energy Group, Inc. All Rights Reserved Page 23 of 136
Feedstock Moisture and Volatile Matter
0.0
0.5
1.0
1.5
2.0
2.5
3.0B
orag
eC
anol
aC
offe
eE
veni
ng P
rimro
seH
emp
Per
illa
See
dS
unflo
wer
Pal
mJo
joba
Pou
ltry
Fat
Bab
assu
Cam
elin
aM
orin
ga O
leife
raLi
nsee
dC
hoic
e W
hite
Gre
ase
Lesq
uere
lla F
endl
eri
Jatro
pha
Hep
ar, H
igh
IVTu
ngC
asto
rY
ello
w G
reas
eB
eef T
allo
wK
aran
jaS
oybe
anC
orn
Oil
Hep
ar, L
ow IV
Nee
mU
sed
Coo
king
Oil
Fish
Ric
e B
ran
Coc
onut
Feedstock
Moi
stur
e an
d V
oltil
es (w
t %)
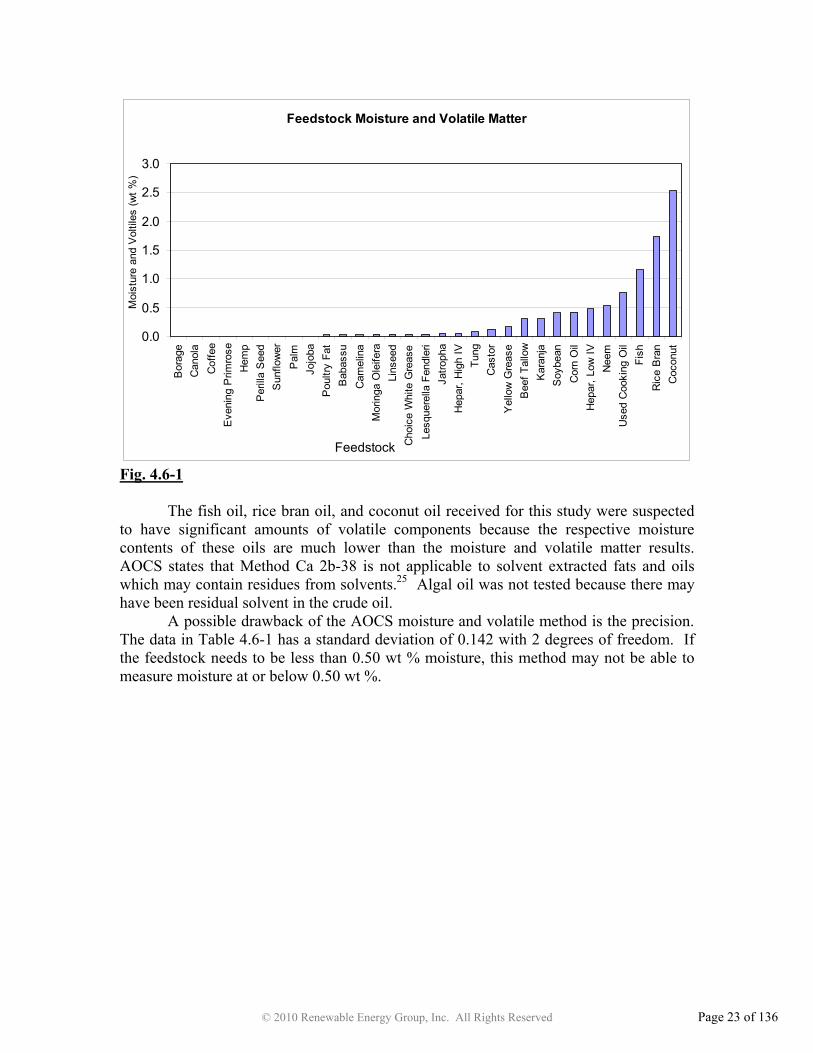
Fig. 4.6-1 The fish oil, rice bran oil, and coconut oil received for this study were suspected to have significant amounts of volatile components because the respective moisture contents of these oils are much lower than the moisture and volatile matter results. AOCS states that Method Ca 2b-38 is not applicable to solvent extracted fats and oils which may contain residues from solvents.25 Algal oil was not tested because there may have been residual solvent in the crude oil.
A possible drawback of the AOCS moisture and volatile method is the precision. The data in Table 4.6-1 has a standard deviation of 0.142 with 2 degrees of freedom. If the feedstock needs to be less than 0.50 wt % moisture, this method may not be able to measure moisture at or below 0.50 wt %.

© 2010 Renewable Energy Group, Inc. All Rights Reserved Page 24 of 136
4.7 Insoluble Impurities
The insoluble impurities test measures the amount of solids that are insoluble in kerosene and petroleum ether. These solids may consist of sand, dirt, and seed fragments in the case of vegetable oil and small particles of bones and gums in the case of animal fats or used cooking oil.26 Materials and Methods
The determination of insoluble impurities in feedstocks performed in this study was done following the instructions of AOCS Method Ca 3a-46.27 This procedure consists of dissolving the residue from the moisture and volatile matter experiment in kerosene and petroleum ether to allow all the nonpolar substances to dissolve, leaving behind all the small insoluble particles. Kerosene and petroleum ether were obtained from Fisher Scientific Inc. Results and Discussion Table 4.7-1
Feedstock Insoluble Impurities (wt %)
Feedstock Insoluble Impurities (wt %)
Algae 1 0.1279 Jatropha 0.0240 Algae 2 0.4743 Jojoba <0.001 Babassu 0.0120 Karanja 0.2730 Beef Tallow 0.1431 Lesquerella fendleri 0.0137 Borage 0.3999 Linseed 0.0800 Camelina 0.0139 Moringa oleifera 0.0079 Canola <0.001 Mustard Not enough sample Castor 0.1439 Neem 1.1136 Choice White Grease 0.2962 Palm 0.0059 Coconut <0.001 Perilla Seed 0.0059 Coffee 0.0079 Poultry Fat 0.1055 Corn, Distiller’s 0.2545 Rice Bran 0.0059 Cuphea viscosissima Not enough sample Soybean 0.0098 Evening Primrose 0.0039 Stillingia Not enough sample Fish 0.0277 Sunflower 0.0057 Hemp <0.001 Tung 0.0137 Hepar, High IV 0.0099 Used Cooking Oil 0.0401 Hepar, Low IV 0.0098 Yellow Grease 0.1728

© 2010 Renewable Energy Group, Inc. All Rights Reserved Page 25 of 136
Feedstock Insoluble Impurities
0.0
0.2
0.4
0.6
0.8
1.0
1.2
Can
ola
Coc
onut
H
emp
Jojo
ba
Even
ing
Prim
rose
Su
nflo
wer
Palm
R
ice
Bra
n Pe
rilla
See
d C
offe
e M
orin
ga O
leife
ra
Hep
ar, L
ow IV
Soyb
ean
Hep
ar, H
igh
IVB
abas
su
Lesq
uere
lla F
endl
eri
Tung
Cam
elin
a Ja
troph
aPe
ruvi
an F
ish
Use
d C
ooki
ng O
ilLi
nsee
d Po
ultry
Fat
Alg
ae 1
Bee
f Tal
low
Cas
tor
Yel
low
Gre
ase
Cor
n K
aran
ja
Cho
ice
Whi
te G
reas
eB
orag
e A
lgae
2N
eem
Feedstocks
Inso
lubl
e Im
purit
ies
(wt %
)
Fig. 4.7-1
The amount of insoluble impurities in oils and fats is primarily related to the extraction and purification methods utilized and therefore, a particular trend was not found that linked insoluble impurities with other oil and fat characteristics.

© 2010 Renewable Energy Group, Inc. All Rights Reserved Page 26 of 136
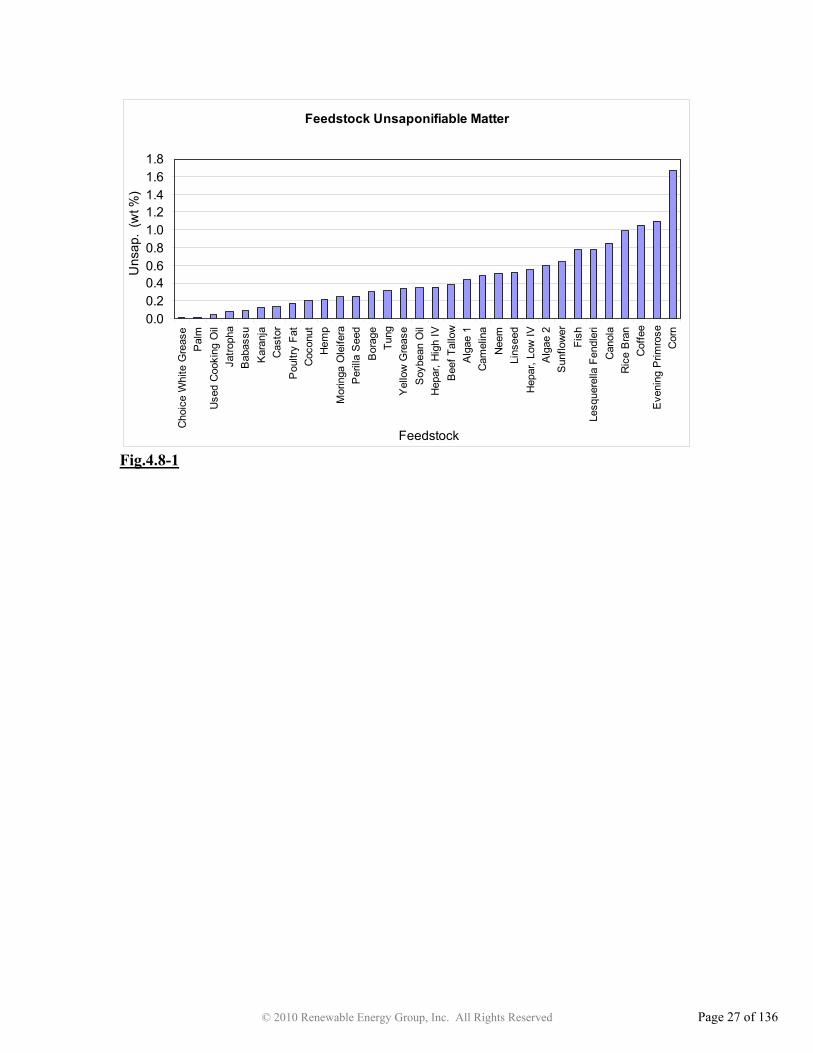
4.8 Unsaponifiable Matter
Unsaponifiable matter consists of organics which do not react with base to form soaps. These include sterols, higher molecular weight alcohols, pigments, waxes, and hydrocarbons.28 Since these components are very nonpolar there may be a possibility that they remain in the biodiesel after the transesterification reaction. Materials and Methods
The determinations of unsaponifiable matter were run in accordance with AOCS Method Ca 6a-40.28 Potassium hydroxide pellets, ethyl alcohol 95%, petroleum ether, and phenolphthalein were purchased from Fisher Scientific Inc. Results and Discussion Table 4.8-1
Feedstock Unsaponifiable Matter (wt %) Feedstock Unsaponifiable
Matter (wt %)
Algae 1 0.44 Jatropha 0.08 Algae 2 0.60 Jojoba Not applicable Babassu 0.09 Karanja 0.13 Beef Tallow 0.39 Lesquerella fendleri 0.78 Borage 0.30 Linseed 0.52 Camelina 0.49 Moringa oleifera 0.25 Canola 0.85 Mustard Not enough sample Castor 0.14 Neem 0.51 Choice White Grease 0.02 Palm 0.02 Coconut 0.20 Perilla Seed 0.26 Coffee 1.06 Poultry Fat 0.17 Corn, Distiller’s 1.67 Rice Bran 0.99 Cuphea viscosissima Not enough sample Soybean 0.35 Evening Primrose 1.10 Stillingia Not enough sample Fish 0.78 Sunflower 0.64 Hemp 0.22 Tung 0.32 Hepar, High IV 0.55 Used Cooking Oil 0.05 Hepar, Low IV 0.36 Yellow Grease 0.34
© 2010 Renewable Energy Group, Inc. All Rights Reserved Page 27 of 136
Feedstock Unsaponifiable Matter
0.00.20.40.60.81.01.21.41.61.8
Cho
ice
Whi
te G
reas
eP
alm
Use
d C
ooki
ng O
ilJa
troph
aB
abas
suK
aran
jaC
asto
rP
oultr
y Fa
tC
ocon
utH
emp
Mor
inga
Ole
ifera
Per
illa
See
dB
orag
eTu
ngY
ello
w G
reas
eS
oybe
an O
ilH
epar
, Hig
h IV
Bee
f Tal
low
Alg
ae 1
Cam
elin
aN
eem
Lins
eed
Hep
ar, L
ow IV
Alg
ae 2
Sun
flow
erFi
shLe
sque
rella
Fen
dler
iC
anol
aR
ice
Bra
nC
offe
eE
veni
ng P
rimro
seC
orn
Feedstock
Uns
ap.
(wt %
)
Fig.4.8-1
© 2010 Renewable Energy Group, Inc. All Rights Reserved Page 28 of 136
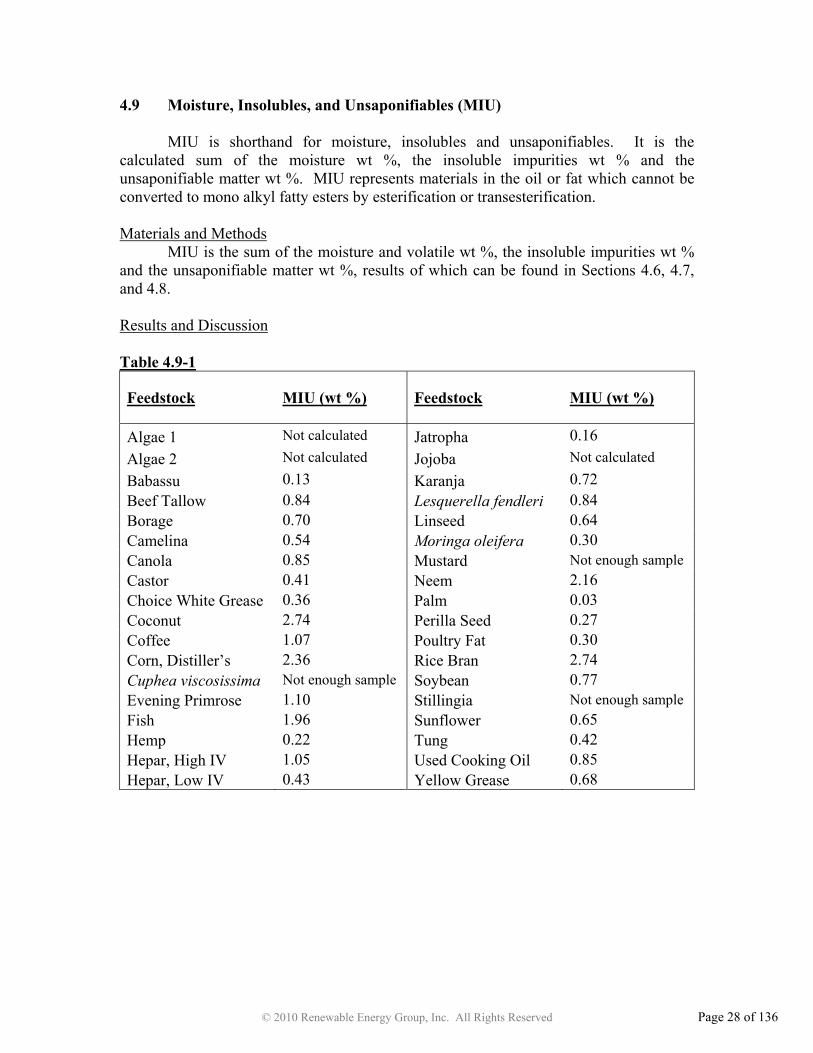
4.9 Moisture, Insolubles, and Unsaponifiables (MIU)
MIU is shorthand for moisture, insolubles and unsaponifiables. It is the calculated sum of the moisture wt %, the insoluble impurities wt % and the unsaponifiable matter wt %. MIU represents materials in the oil or fat which cannot be converted to mono alkyl fatty esters by esterification or transesterification. Materials and Methods
MIU is the sum of the moisture and volatile wt %, the insoluble impurities wt % and the unsaponifiable matter wt %, results of which can be found in Sections 4.6, 4.7, and 4.8. Results and Discussion Table 4.9-1
Feedstock MIU (wt %) Feedstock MIU (wt %)
Algae 1 Not calculated Jatropha 0.16 Algae 2 Not calculated Jojoba Not calculated
Babassu 0.13 Karanja 0.72 Beef Tallow 0.84 Lesquerella fendleri 0.84 Borage 0.70 Linseed 0.64 Camelina 0.54 Moringa oleifera 0.30 Canola 0.85 Mustard Not enough sample Castor 0.41 Neem 2.16 Choice White Grease 0.36 Palm 0.03 Coconut 2.74 Perilla Seed 0.27 Coffee 1.07 Poultry Fat 0.30 Corn, Distiller’s 2.36 Rice Bran 2.74 Cuphea viscosissima Not enough sample Soybean 0.77 Evening Primrose 1.10 Stillingia Not enough sample Fish 1.96 Sunflower 0.65 Hemp 0.22 Tung 0.42 Hepar, High IV 1.05 Used Cooking Oil 0.85 Hepar, Low IV 0.43 Yellow Grease 0.68

© 2010 Renewable Energy Group, Inc. All Rights Reserved Page 29 of 136
Feedstock MIU
0.0
0.5
1.0
1.5
2.0
2.5
3.0
Pal
mB
abas
suJa
troph
aH
emp
Per
illa
See
dM
orin
ga O
leife
raP
oultr
y Fa
tC
hoic
e W
hite
Gre
ase
Cas
tor
Tung
Hep
ar, L
ow IV
Cam
elin
aLi
nsee
dS
unflo
wer
Yel
low
Gre
ase
Bor
age
Kar
anja
Soy
bean
Lesq
uere
lla F
endl
eri
Bee
f Tal
low
Use
d C
ooki
ng O
ilC
anol
aH
epar
, Hig
h IV
Cof
fee
Eve
ning
Prim
rose
Fish
Nee
mC
orn
Ric
e B
ran
Coc
onut
Feedstock
MIU
(wt %
)
Fig. 4.9-1
© 2010 Renewable Energy Group, Inc. All Rights Reserved Page 30 of 136
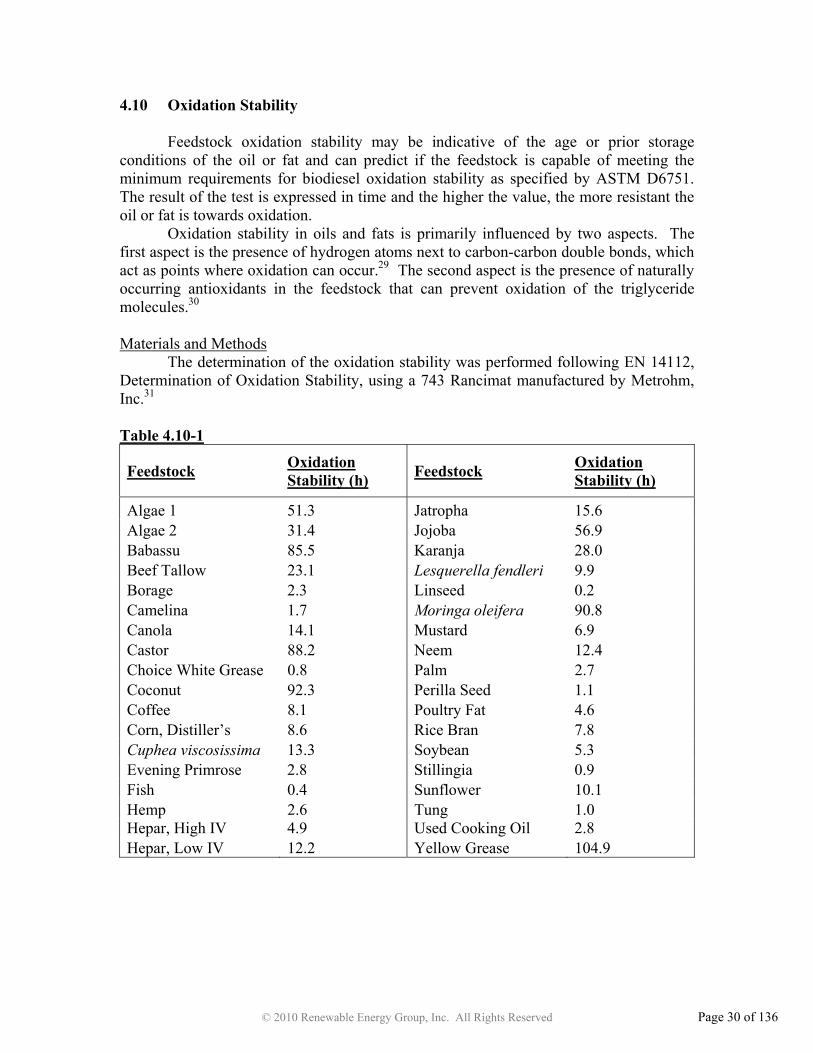
4.10 Oxidation Stability
Feedstock oxidation stability may be indicative of the age or prior storage conditions of the oil or fat and can predict if the feedstock is capable of meeting the minimum requirements for biodiesel oxidation stability as specified by ASTM D6751. The result of the test is expressed in time and the higher the value, the more resistant the oil or fat is towards oxidation.
Oxidation stability in oils and fats is primarily influenced by two aspects. The first aspect is the presence of hydrogen atoms next to carbon-carbon double bonds, which act as points where oxidation can occur.29 The second aspect is the presence of naturally occurring antioxidants in the feedstock that can prevent oxidation of the triglyceride molecules.30 Materials and Methods
The determination of the oxidation stability was performed following EN 14112, Determination of Oxidation Stability, using a 743 Rancimat manufactured by Metrohm, Inc.31 Table 4.10-1
Feedstock Oxidation Stability (h) Feedstock Oxidation
Stability (h)
Algae 1 51.3 Jatropha 15.6 Algae 2 31.4 Jojoba 56.9 Babassu 85.5 Karanja 28.0 Beef Tallow 23.1 Lesquerella fendleri 9.9 Borage 2.3 Linseed 0.2 Camelina 1.7 Moringa oleifera 90.8 Canola 14.1 Mustard 6.9 Castor 88.2 Neem 12.4 Choice White Grease 0.8 Palm 2.7 Coconut 92.3 Perilla Seed 1.1 Coffee 8.1 Poultry Fat 4.6 Corn, Distiller’s 8.6 Rice Bran 7.8 Cuphea viscosissima 13.3 Soybean 5.3 Evening Primrose 2.8 Stillingia 0.9 Fish 0.4 Sunflower 10.1 Hemp 2.6 Tung 1.0 Hepar, High IV 4.9 Used Cooking Oil 2.8 Hepar, Low IV 12.2 Yellow Grease 104.9
© 2010 Renewable Energy Group, Inc. All Rights Reserved Page 31 of 136
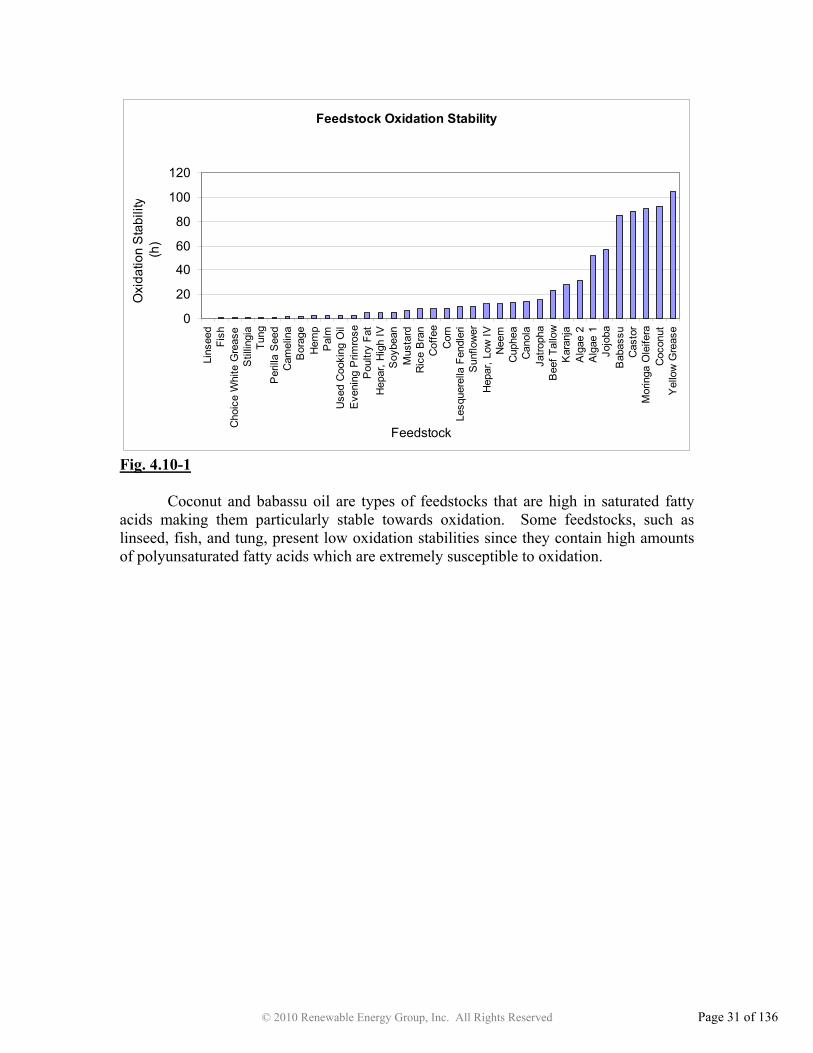
Feedstock Oxidation Stability
0
20
40
60
80
100
120
Lins
eed
Fish
Cho
ice
Whi
te G
reas
eS
tillin
gia
Tung
Per
illa
See
dC
amel
ina
Bor
age
Hem
pP
alm
Use
d C
ooki
ng O
ilE
veni
ng P
rimro
seP
oultr
y Fa
tH
epar
, Hig
h IV
Soy
bean
Mus
tard
Ric
e B
ran
Cof
fee
Cor
nLe
sque
rella
Fen
dler
iS
unflo
wer
Hep
ar, L
ow IV
Nee
mC
uphe
aC
anol
aJa
troph
aB
eef T
allo
wK
aran
jaA
lgae
2A
lgae
1Jo
joba
Bab
assu
Cas
tor
Mor
inga
Ole
ifera
Coc
onut
Yel
low
Gre
ase
Feedstock
Oxi
datio
n S
tabi
lity
(h)
Fig. 4.10-1
Coconut and babassu oil are types of feedstocks that are high in saturated fatty acids making them particularly stable towards oxidation. Some feedstocks, such as linseed, fish, and tung, present low oxidation stabilities since they contain high amounts of polyunsaturated fatty acids which are extremely susceptible to oxidation.

© 2010 Renewable Energy Group, Inc. All Rights Reserved Page 32 of 136
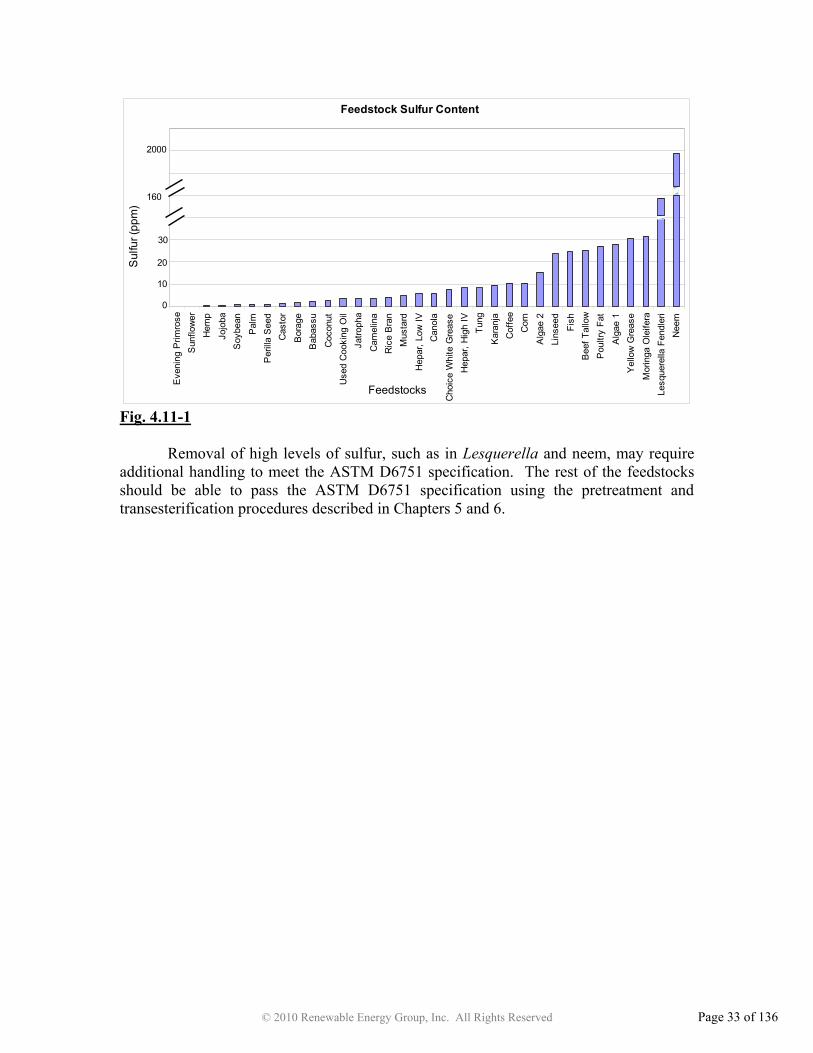
4.11 Sulfur
Sulfur content in biodiesel is limited to 15 ppm maximum by ASTM D6751. Therefore, it is important to know the original feedstock sulfur content since it can contribute to biodiesel sulfur content. Materials and Methods
The determination of sulfur in the feedstocks was done using ASTM D7039, Standard Test Method for Sulfur in Gasoline and Diesel Fuel by Monochromatic Wavelength Dispersive X-ray Fluorescence Spectrometry.32 A Sindie Bio Bench Top sulfur analyzer manufactured by X-Ray Optical Systems Inc. was used to measure the amount of sulfur.
Although ASTM D7039 was designed for gasoline and diesel fuel testing, due to equipment availability this method was also used to determine the sulfur content of the feedstock. Table 4.11-1
Feedstock Sulfur (ppm) Feedstock Sulfur (ppm)
Algae 1 28.1 Jatropha 3.5 Algae 2 15.4 Jojoba 0.3 Babassu 2.3 Karanja 9.7 Beef Tallow 25.2 Lesquerella fendleri 158.8 Borage 1.7 Linseed 23.7 Camelina 3.6 Moringa oleifera 31.4 Canola 5.7 Mustard 4.8 Castor 1.4 Neem 1990.0 Choice White Grease 7.7 Palm 1.0 Coconut 2.7 Perilla Seed 1.0 Coffee 10.5 Poultry Fat 27.2 Corn, Distiller’s 10.5 Rice Bran 4.0 Cuphea viscosissima Not enough sample Soybean 0.8 Evening Primrose 0.1 Stillingia Not enough sample Fish 24.5 Sunflower 0.1 Hemp 0.3 Tung 8.4 Hepar, High IV 8.3 Used Cooking Oil 3.4 Hepar, Low IV 5.6 Yellow Grease 30.7
© 2010 Renewable Energy Group, Inc. All Rights Reserved Page 33 of 136
Feedstock Sulfur Content
160
30
20
10
0
Eve
ning
Prim
rose
Sun
flow
erH
emp
Jojo
baS
oybe
an
Pal
mP
erill
a S
eed
Cas
tor
Bor
age
Bab
assu
Coc
onut
Use
d C
ooki
ng O
ilJa
troph
a
Cam
elin
aR
ice
Bra
nM
usta
rd
Hep
ar, L
ow IV
Can
ola
Cho
ice
Whi
te G
reas
eH
epar
, Hig
h IV
Tung
Kar
anja
Cof
fee
Cor
n
Alg
ae 2
Lins
eed
Fish
Bee
f Tal
low
Pou
ltry
Fat
Alg
ae 1
Yel
low
Gre
ase
Mor
inga
Ole
ifera
Lesq
uere
lla F
endl
eri
Nee
m
Feedstocks
Sul
fur (
ppm
)2000
Fig. 4.11-1
Removal of high levels of sulfur, such as in Lesquerella and neem, may require
additional handling to meet the ASTM D6751 specification. The rest of the feedstocks should be able to pass the ASTM D6751 specification using the pretreatment and transesterification procedures described in Chapters 5 and 6.
© 2010 Renewable Energy Group, Inc. All Rights Reserved Page 34 of 136
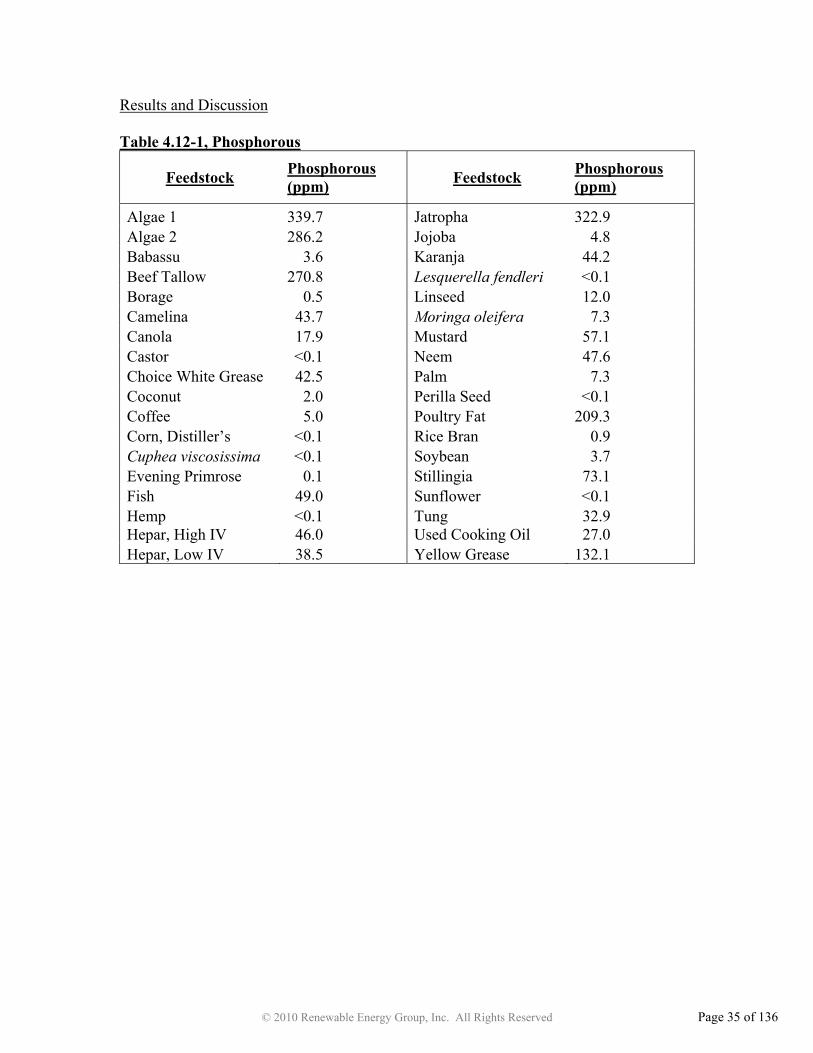
4.12 Phosphorous, Calcium, and Magnesium ASTM D6751 requires phosphorous in biodiesel be limited to 10 ppm (0.001 %
mass maximum) and the combined amount of calcium and magnesium to be less than 5 ppm. Phosphorous, calcium, and magnesium are minor components typically associated with phospholipids and gums that may act as emulsifiers33,34 or cause sediment, lowering yields during the transesterification process.35
Feedstocks were tested for metals using an Inductively Coupled Plasma Optical Emission Spectrometer (ICP-OES). If the phosphorous was higher than 10 ppm, the feedstock was pretreated and if either the calcium or magnesium were higher than 5 ppm, the feedstock was also pretreated. Materials and Methods
Phosphorous, calcium, and magnesium levels were determined using ASTM D4951, Standard Test Method for Determination of Additive Elements in Lubricating Oils by Inductively Coupled Plasma Atomic Emission Spectrometry.36 The feedstocks were run on a PerkinElmer Inc. Optima 7000 dual view ICP-OES with a cyclonic spray chamber. Cobalt was used as the internal standard and deodorized kerosene was used as the base oil.
© 2010 Renewable Energy Group, Inc. All Rights Reserved Page 35 of 136
Results and Discussion Table 4.12-1, Phosphorous
Feedstock Phosphorous (ppm) Feedstock Phosphorous
(ppm)
Algae 1 339.7 Jatropha 322.9 Algae 2 286.2 Jojoba 4.8 Babassu 3.6 Karanja 44.2 Beef Tallow 270.8 Lesquerella fendleri <0.1 Borage 0.5 Linseed 12.0 Camelina 43.7 Moringa oleifera 7.3 Canola 17.9 Mustard 57.1 Castor <0.1 Neem 47.6 Choice White Grease 42.5 Palm 7.3 Coconut 2.0 Perilla Seed <0.1 Coffee 5.0 Poultry Fat 209.3 Corn, Distiller’s <0.1 Rice Bran 0.9 Cuphea viscosissima <0.1 Soybean 3.7 Evening Primrose 0.1 Stillingia 73.1 Fish 49.0 Sunflower <0.1 Hemp <0.1 Tung 32.9 Hepar, High IV 46.0 Used Cooking Oil 27.0 Hepar, Low IV 38.5 Yellow Grease 132.1

© 2010 Renewable Energy Group, Inc. All Rights Reserved Page 36 of 136
Phosphorous Levels in Feedstocks
050
100150200250300350
Cas
tor
Cor
nC
uphe
a Vi
scos
issi
ma
Hem
pLe
sque
rella
Fen
dler
iPe
rilla
See
dSu
nflo
wer
Even
ing
Prim
rose
Bora
geR
ice
Bran
Coc
onut
Baba
ssu
Soyb
ean
Jojo
baC
offe
ePa
lmM
orin
ga O
leife
raLi
nsee
dC
anol
aU
sed
Coo
king
Oil
Tung
Hep
ar, L
ow IV
Cho
ice
Whi
te G
reas
eC
amel
ina
Kara
nja
Hep
ar, H
igh
IVN
eem
Fish
Mus
tard
Stilli
ngia
Yello
w G
reas
ePo
ultry
Fat
Beef
Tal
low
Alga
e 2
Jatro
pha
Alga
e 1
Feedstock
Pho
spho
rous
(ppm
)
Fig. 4.12-1, Phosphorous Table 4.12-2, Calcium
Feedstock Calcium (ppm) Feedstock Calcium (ppm)
Algae 1 <0.1 Jatropha 121.5 Algae 2 1.3 Jojoba 4.0 Babassu 0.4 Karanja 11.2 Beef Tallow 97.3 Lesquerella fendleri <0.1 Borage 5.6 Linseed 13.5 Camelina 15.8 Moringa oleifera 5.7 Canola 4.6 Mustard 9.1 Castor <0.1 Neem 25.9 Choice White Grease 0.7 Palm 1.1 Coconut <0.1 Perilla Seed 0.8 Coffee 3.3 Poultry Fat 35.5 Corn, Distiller’s <0.1 Rice Bran 0.6 Cuphea viscosissima <0.1 Soybean 0.1 Evening Primrose 0.8 Stillingia 45.9 Fish 5.2 Sunflower <0.1 Hemp 0.2 Tung 13.4 Hepar, High IV 6.7 Used Cooking Oil 0.1 Hepar, Low IV 3.8 Yellow Grease 38.9

© 2010 Renewable Energy Group, Inc. All Rights Reserved Page 37 of 136
Calcium Levels in Feedstocks
020406080
100120
Use
d C
ooki
ng O
ilC
ocon
utA
lgae
1C
asto
rC
orn
Cup
hea
Lesq
uere
lla F
endl
eri
Sun
flow
erS
oybe
anH
emp
Bab
assu
Ric
e B
ran
Cho
ice
Whi
te G
reas
eE
veni
ng P
rimro
seP
erill
a S
eed
Pal
mA
lgae
2C
offe
eH
epar
, Low
IVJo
joba
Can
ola
Fish
Bor
age
Mor
inga
Ole
ifera
Hep
ar, H
igh
IVM
usta
rdK
aran
jaTu
ngLi
nsee
dC
amel
ina
Nee
mP
oultr
y Fa
tY
ello
w G
reas
eS
tillin
gia
Bee
f Tal
low
Jatro
pha
Feedstock
Cal
cium
(ppm
)
Fig. 4.12-2, Calcium Table 4.12-3, Magnesium
Feedstock Magnesium (ppm) Feedstock Magnesium
(ppm)
Algae 1 0.2 Jatropha 104.1 Algae 2 19.0 Jojoba 2.4 Babassu 0.3 Karanja 4.9 Beef Tallow 16.1 Lesquerella fendleri 0.7 Borage 0.6 Linseed 5.8 Camelina 10.0 Moringa oleifera 4.3 Canola 4.9 Mustard 4.6 Castor 0.8 Neem 21.3 Choice White Grease 1.5 Palm 0.5 Coconut 0.1 Perilla Seed 0.2 Coffee 2.0 Poultry Fat 8.2 Corn, Distiller’s <0.1 Rice Bran 0.9 Cuphea viscosissima 0.2 Soybean 0.3 Evening Primrose 0.3 Stillingia 14.6 Fish 3.3 Sunflower 0.1 Hemp 0.2 Tung 13.5 Hepar, High IV 4.2 Used Cooking Oil 0.8 Hepar, Low IV 2.7 Yellow Grease 10.5

© 2010 Renewable Energy Group, Inc. All Rights Reserved Page 38 of 136
Magnesium Levels in Feedstock
Coc
onut
Sun
flow
erC
orn
Hem
pP
erill
a S
eed
Cup
hea
Vis
cosi
ssim
aA
lgae
1S
oybe
anB
abas
suE
veni
ng P
rimro
seP
alm
Bor
age
Lesq
uere
lla F
endl
eri
Use
d C
ooki
ng O
ilC
asto
rR
ice
Bra
nC
hoic
e W
hite
Gre
ase
Cof
fee
Jojo
baH
epar
, Low
IVFi
shH
epar
, Hig
h IV
Mor
inga
Ole
ifera
Mus
tard
Can
ola
Kar
anja
Lins
eed
Pou
ltry
Fat
Cam
elin
aY
ello
w G
reas
eTu
ngS
tillin
gia
Bee
f Tal
low
Alg
ae 2
Nee
mJa
troph
a
Feedstocks
Mag
nesi
um (p
pm)
20
15
10
5
0
100
150
Fig. 4.12-3, Magnesium
© 2010 Renewable Energy Group, Inc. All Rights Reserved Page 39 of 136
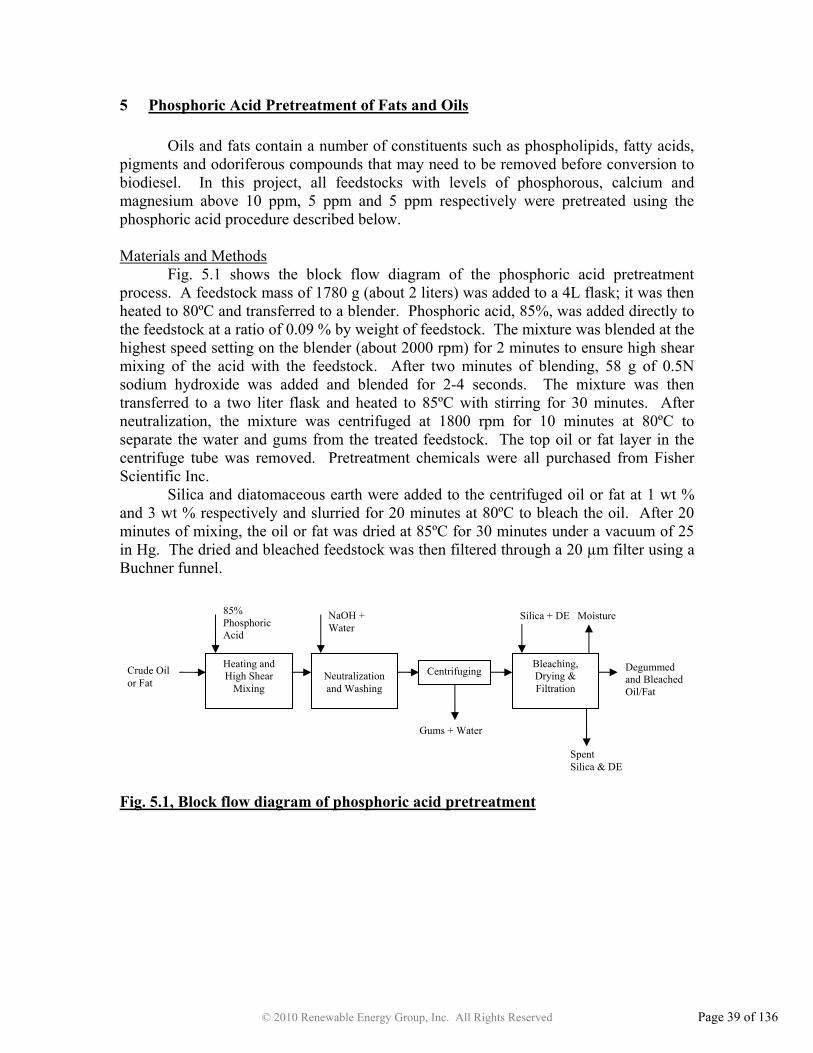
5 Phosphoric Acid Pretreatment of Fats and Oils
Oils and fats contain a number of constituents such as phospholipids, fatty acids, pigments and odoriferous compounds that may need to be removed before conversion to biodiesel. In this project, all feedstocks with levels of phosphorous, calcium and magnesium above 10 ppm, 5 ppm and 5 ppm respectively were pretreated using the phosphoric acid procedure described below. Materials and Methods
Fig. 5.1 shows the block flow diagram of the phosphoric acid pretreatment process. A feedstock mass of 1780 g (about 2 liters) was added to a 4L flask; it was then heated to 80ºC and transferred to a blender. Phosphoric acid, 85%, was added directly to the feedstock at a ratio of 0.09 % by weight of feedstock. The mixture was blended at the highest speed setting on the blender (about 2000 rpm) for 2 minutes to ensure high shear mixing of the acid with the feedstock. After two minutes of blending, 58 g of 0.5N sodium hydroxide was added and blended for 2-4 seconds. The mixture was then transferred to a two liter flask and heated to 85ºC with stirring for 30 minutes. After neutralization, the mixture was centrifuged at 1800 rpm for 10 minutes at 80ºC to separate the water and gums from the treated feedstock. The top oil or fat layer in the centrifuge tube was removed. Pretreatment chemicals were all purchased from Fisher Scientific Inc.
Silica and diatomaceous earth were added to the centrifuged oil or fat at 1 wt % and 3 wt % respectively and slurried for 20 minutes at 80ºC to bleach the oil. After 20 minutes of mixing, the oil or fat was dried at 85ºC for 30 minutes under a vacuum of 25 in Hg. The dried and bleached feedstock was then filtered through a 20 µm filter using a Buchner funnel.
Fig. 5.1, Block flow diagram of phosphoric acid pretreatment
Heating and High Shear
Mixing
85% Phosphoric Acid
Silica + DE Moisture NaOH + Water
Bleaching, Drying & Filtration
Neutralization and Washing
Spent Silica & DE
Centrifuging
Gums + Water
Crude Oil or Fat
Degummed and Bleached Oil/Fat
© 2010 Renewable Energy Group, Inc. All Rights Reserved Page 40 of 136
Results and Discussion Pretreatment was found to be effective in degumming the feedstocks. Of the oils
and fats pretreated, all but one of them were processed without anomaly. However, while processing tung oil, the oil emulsified during the caustic neutralization and water washing step. Acidulation with sulfuric acid and centrifugation of the emulsified oil to break the emulsion and remove water and gums was not effective. To break the emulsion, water was removed by drying under heat and vacuum. The dried, unemulsified oil was then centrifuged and bleached before continuing to the esterification process.

© 2010 Renewable Energy Group, Inc. All Rights Reserved Page 41 of 136
6 Esterification of Free Fatty Acid with Amberlyst BD 20
Feedstocks with FFA levels below 0.5 wt % do not require FFA reduction before transesterification.16 Feedstocks with FFA content greater than 0.5 wt % were esterified to lower the FFA prior to transesterification. The FFA was reduced in the feedstocks by esterification catalyzed by Amberlyst BD 20. For the FFA to be esterified, the feedstock should have a Karl Fischer moisture of < 0.05 wt %, calcium < 5 ppm, magnesium < 5 ppm and phosphorous < 10 ppm. If these conditions were not met, the feedstock was processed by the pretreatment procedure in Chapter 5. The results are summarized in Table 6.1. Materials and Methods
Amberlyst BD 20 (Rohm and Haas Co., Philadelphia) catalyst is activated by washing the solid particles with an equal volume of dry methanol (Fisher Scientific Inc.) and filtering by gravity six times. To a 5 liter, 4 necked, round bottom flask equipped with magnetic stirring, a 400 mL distillation receiver, Friedrichs condenser, a thermocouple probe, and heated by a heating mantle with digital controller, is added 316 g of activated Amberlyst BD 20 (16 % by weight of methanol and feedstock), 1620 g of feedstock and 355.5 g (20 % by volume of feedstock) of dry methanol. The mixture is heated to reflux. After one hour the methanol is removed by a vacuum of 21-24 inches Hg. Complete removal of methanol is assumed when the system reached 80-85°C. The FFA is then measured. If the FFA is less than 0.50 wt % the feedstock is removed from the catalyst by a siphon. If the FFA is more than 0.50 wt % another 355.5 g (20 % by volume of feedstock) of methanol is added, the mixture is refluxed for another hour, the methanol removed and the FFA checked. After the feedstock is removed from the catalyst, the Amberlyst BD 20 is washed with four volumes of dry methanol and stored under methanol until the next use.

© 2010 Renewable Energy Group, Inc. All Rights Reserved Page 42 of 136
Results and Discussion Table 6.1, Summary of Reaction Conditions with Amberlyst BD 20
Feedstock Stage Feedstock
FFA % Esterified
Feedstock FFA % Algae 2, refined 1 1.60 0.24 Beef Tallow, refined 1 1.90 0.23 Camelina, refined 1 2.00 0.26 Castor 1 1.10 0.36 Choice White Grease, refined 1 1.80 0.19 Corn, refined 1 12.20 1.40 Corn, refined 2 1.40 0.47 Fish Oil, refined 1 2.90 0.20 Hepar, High IV, refined 1 3.70 0.32 Hepar, Low IV, refined 1 1.33 0.11 Jatropha, refined 1 2.70 0.69 Jatropha, refined 2 0.68 0.28 Karanja, refined 1 8.20 2.73 Karanja, refined 2 2.73 1.80 Karanja, refined 3 1.80 1.10 Karanja, refined 4 1.10 0.85 Karanja, refined 5* 0.85 0.87 Karanja, refined 6 0.87 0.57 Karanja, refined 7 0.57 0.71 Linseed, refined 1 0.67 0.11 Moringa, refined 1 2.90 0.24 Neem, refined 1 5.80 1.00 Neem, refined 2 1.00 0.47 Palm 1 0.83 0.17 Poultry Fat, refined 1 8.80 1.20 Poultry Fat, refined 2 1.20 0.29 Stillingia, refined 1 5.30 0.85 Stillingia, refined 2 0.85 0.29 Tung, refined 1 1.70 0.17 Used Cooking Oil, refined 1 2.80 0.27 Yellow Grease, refined 1 6.70 1.10 Yellow Grease, refined 2 1.10 0.37 *Catalyst washed with four volumes of methanol

© 2010 Renewable Energy Group, Inc. All Rights Reserved Page 43 of 136
During the esterification reaction, changes in the feedstock were observed in addition to a reduction of FFA. All fats and oils appeared to shift in color toward red and the odor was modified for selected feedstocks. This was especially noticed for yellow grease, poultry fat, and used cooking oil.
Between feedstocks, the catalyst was washed with four volumes of methanol and reused. This enabled one batch of Amberlyst BD 20 to be used for a number of reactions and as many as 17 reactions were run with the same batch of catalyst without substantial reduction in the rate of conversion.
With the exception of refined karanja oil, Amberlyst BD 20 successfully reduced the FFA to below 0.5 wt %. In refined karanja oil the conversion of FFA to methyl ester was hindered and the FFA could not be reduced to below 0.5 wt %. Refined karanja oil not only inhibited the reaction; it appeared to have reached an equilibrium between 1.0 and 0.5 wt %. The reasons for this inhibition of the esterification were not pursued.

© 2010 Renewable Energy Group, Inc. All Rights Reserved Page 44 of 136
7 Transesterification of Feedstocks
In order for a feedstock to be transesterified for this project, the feedstock must have a moisture content of less than 0.05 wt %, a free fatty acid content of less than 0.5 wt %, phosphorous content of less than 10 ppm, and a combined calcium and magnesium content of less than 5 ppm.
Each feedstock was transesterified using the same production procedure. Two 700 g batches were made for each feedstock in order to have enough biodiesel for ASTM testing. For Cuphea, mustard, and stillingia, one batch was made due to limited feedstock quantity. Materials and methods
Transesterification was carried out in a 1000 mL EZE-Seal stirred reactor from Autoclave Engineers. Certified ACS Grade Methanol was purchased from Fisher Scientific Inc. Sodium methoxide solution was purchased from Sigma-Aldrich Co. (25 wt % in methanol). A 0.2 N hydrochloric acid solution was made using 36.5-38.0 % HCl purchased from Fisher Scientific Inc. (Mallinckrodt Baker NF/FCC/ACS grade) and deionized water. Standard Transesterification Procedure
To the reactor are added: 700 grams feedstock; methanol, 17.6 wt % of feedstock; and sodium methoxide, 2.64 wt % of feedstock. The reactor temperature is set to 65°C and remains at 65°C until the methyl ester is removed from the reactor. The mixer is turned on and set to 1200 rpm for 15 minutes for the first reaction.
After 15 minutes in the first reaction, the mixer is turned off and the methyl esters and glycerin settle for 15 minutes. The glycerin is removed and 4.4 wt % of methanol and 0.66 wt % of sodium methoxide are added for the second reaction. The mixer is set to 600 rpm for 15 minutes for the second reaction.
After 15 minutes in the second reaction, the mixer is turned off and 0.2 N hydrochloric acid solution (13 wt % of feedstock) is added. The mixer is turned back on and neutralization occurs for two minutes. After the two minutes, the methyl esters settle for 15 minutes. The hydrochloric acid layer is removed from the reaction vessel and then the methyl esters are removed.
When two batches of methyl ester are made, they are combined together into the same flask before proceeding to the next step.
The methyl esters are transferred into a flask which is heated to 70°C with stirring and the use of a vacuum pump. The methyl esters are placed under vacuum for 30 minutes to remove the methanol. After the methanol has been removed, the methyl esters are poured into a separatory funnel. Deionized water, 10 wt %, at 70°C is added to the separatory funnel and the mixture is shaken vigorously for two minutes.
The methyl esters are then settled for 15 minutes at room temperature. After 15 minutes, the water phase is removed. The methyl esters are then transferred to a flask to be dried.
The methyl esters are dried using a hotplate and a vacuum pump. The methyl esters are heated to 110°C under vacuum for one hour.

© 2010 Renewable Energy Group, Inc. All Rights Reserved Page 45 of 136
After the methyl esters have been dried and cooled back down to room temperature, diatomaceous earth (5 wt % of methyl ester) is added to the methyl ester. The methyl esters and diatomaceous earth are stirred and chilled at 15°C for 30 minutes. The slurry is removed and filtered through a filter press equipped with a 0.7 µm filter paper. The filtered methyl esters are then filtered again through a 0.7 µm glass fiber filter paper to remove all the diatomaceous earth. Variations to the Standard Transesterification Procedure Beef Tallow
The filtration of the beef tallow methyl esters resulted in some gelling when the methyl esters were chilled and passed through the filter press. A small amount of methyl ester remained in the filter cake with the diatomaceous earth. It is believed the beef tallow gelled in the filtration step because it was chilled (15°C) below the cloud point of the biodiesel (16°C). In order to improve the yield for beef tallow biodiesel, a filtration temperature of 18°C is recommended. Castor
The castor methyl esters plugged the filter press filter paper. Therefore the filter paper was replaced four times to limit the yield loss. While the biodiesel was filtered through the filter press, the rest of the castor methyl esters were kept at 15°C in the water bath so it would all be filtered at the same temperature. Cuphea viscosissima
Due to the limited amount of Cuphea methyl ester remaining after drying, the methyl esters were not chilled and filtered. Evening Primrose
In the water wash step, an emulsion formed in the separatory funnel. After 15 minutes, there was no visible water separation at the bottom of the funnel. Hydrochloric acid was added 10 grams at a time (40 grams total) until the methyl ester and water phase separated. Jojoba
Jojoba was characterized for its feedstock properties but not made into biodiesel because the procedure described in this chapter would not be applicable to a wax ester. The purpose of this project was to transesterify all the feedstocks using the same procedure and if jojoba was done differently, comparisons could not be made with jojoba methyl esters. Jojoba can be transesterified and used as a fuel using a different process. 37
Karanja
Esterification was only able to reduce the FFA of the oil to 0.7 wt %. Since 0.5 wt % was the maximum amount of FFA allowed in the feedstock, karanja was not made into biodiesel using the standard procedure. A small scale experiment was performed to see what would happen to the karanja when it was transesterified. A 20 gram sample of karanja oil was used, along with the standard ratios of chemicals as in the other
© 2010 Renewable Energy Group, Inc. All Rights Reserved Page 46 of 136
feedstocks for the project. After the water wash step, the karanja formed an emulsion with the water and the phases would not separate. No further refining experiments were done to make karanja suitable for transesterification. Lesquerella fendleri
In the first batch of Lesquerella biodiesel, the methyl ester became very dark after the second reaction in comparison to the original oil color. Therefore the batches were not mixed together after the second reaction and were water washed separately. There was an extra layer in the water in batch 1 after the water wash step. Also, the color of the methyl ester in batch 1 was noticeably darker than in batch 2. The batches were combined before the drying step. Palm
The palm methyl esters were filtered at 18°C because the methyl esters became gel-like in the water bath at 15°C during the filtration step. Tung
The tung methyl esters took a longer time than other methyl esters to filter through the diatomaceous earth and filter paper during the final filtration step.
© 2010 Renewable Energy Group, Inc. All Rights Reserved Page 47 of 136
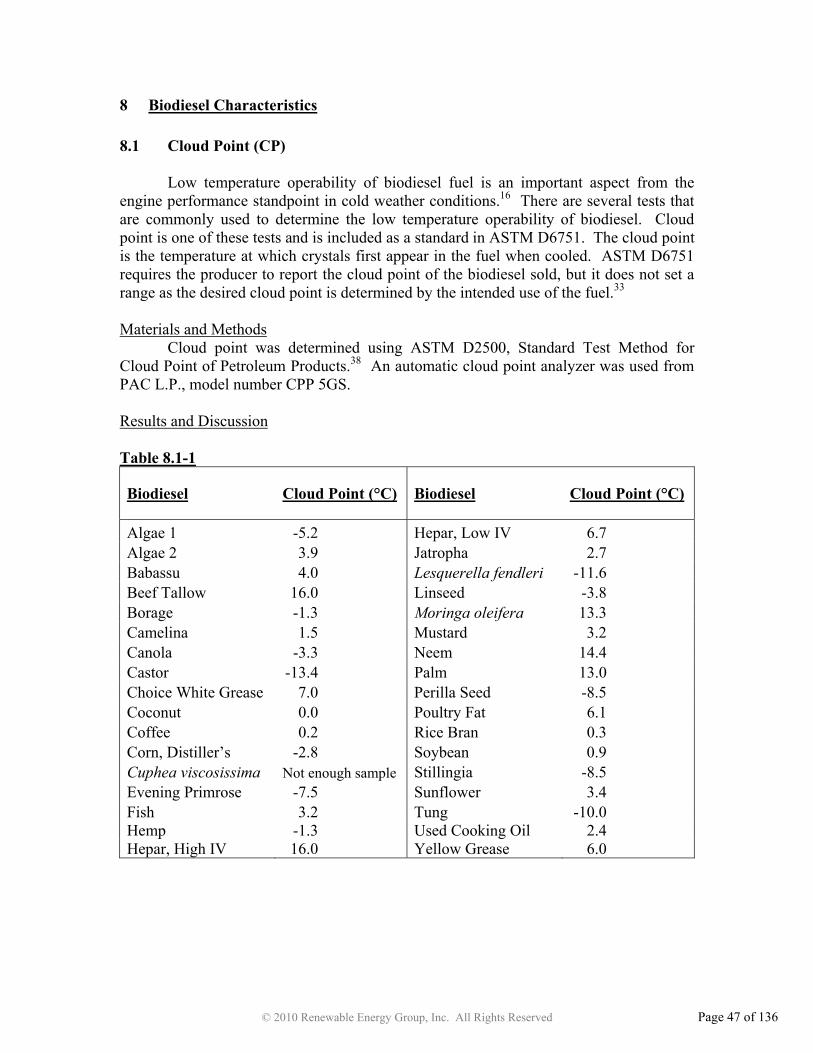
8 Biodiesel Characteristics 8.1 Cloud Point (CP)
Low temperature operability of biodiesel fuel is an important aspect from the engine performance standpoint in cold weather conditions.16 There are several tests that are commonly used to determine the low temperature operability of biodiesel. Cloud point is one of these tests and is included as a standard in ASTM D6751. The cloud point is the temperature at which crystals first appear in the fuel when cooled. ASTM D6751 requires the producer to report the cloud point of the biodiesel sold, but it does not set a range as the desired cloud point is determined by the intended use of the fuel.33 Materials and Methods
Cloud point was determined using ASTM D2500, Standard Test Method for Cloud Point of Petroleum Products.38 An automatic cloud point analyzer was used from PAC L.P., model number CPP 5GS. Results and Discussion Table 8.1-1
Biodiesel Cloud Point (°C) Biodiesel Cloud Point (°C)
Algae 1 -5.2 Hepar, Low IV 6.7 Algae 2 3.9 Jatropha 2.7 Babassu 4.0 Lesquerella fendleri -11.6 Beef Tallow 16.0 Linseed -3.8 Borage -1.3 Moringa oleifera 13.3 Camelina 1.5 Mustard 3.2 Canola -3.3 Neem 14.4 Castor -13.4 Palm 13.0 Choice White Grease 7.0 Perilla Seed -8.5 Coconut 0.0 Poultry Fat 6.1 Coffee 0.2 Rice Bran 0.3 Corn, Distiller’s -2.8 Soybean 0.9 Cuphea viscosissima Not enough sample Stillingia -8.5 Evening Primrose -7.5 Sunflower 3.4 Fish 3.2 Tung -10.0 Hemp -1.3 Used Cooking Oil 2.4 Hepar, High IV 16.0 Yellow Grease 6.0

© 2010 Renewable Energy Group, Inc. All Rights Reserved Page 48 of 136
Biodiesel Cloud Point
-15
-10
-5
0
5
10
15
20
Cas
tor
Lesq
uere
lla F
endl
eri
Tung
Per
illa
See
dS
tillin
gia
Eve
ning
Prim
rose
Alg
ae 1
Lins
eed
Can
ola
Cor
nB
orag
eH
emp
Coc
onut
Cof
fee
Ric
e B
ran
Soy
bean
Cam
elin
aU
sed
Coo
king
Oil
Jatro
pha
Mus
tard
Fish
Sun
flow
erA
lgae
2B
abas
suY
ello
w G
reas
eP
oultr
y Fa
tH
epar
, Low
IVC
hoic
e W
hite
Gre
ase
Pal
mM
orin
ga O
leife
raN
eem
Bee
f Tal
low
Hep
ar, H
igh
IV
Biodiesel
Clo
ud P
oint
(°C
)
Fig, 8.1-1
The cloud point of biodiesel varies significantly with feedstock. Of the feedstocks evaluated, castor biodiesel has the lowest cloud point of -13.4ºC whereas beef tallow biodiesel and high IV hepar biodiesel have the highest cloud points of 16.0ºC. The fatty acid distribution of the feedstock has an effect on the cloud point. Table 8.4-1 shows the fatty acid distribution of various fats and oils. Biodiesel made from feedstocks such as stillingia, tung, perilla, hemp, evening primrose, linseed, corn, borage, and soybean have a cloud point below or close to 0ºC because of the lower fraction of saturated fatty acids like palmitic and stearic. Biodiesel made from feedstocks such as beef tallow, yellow grease, and poultry fat, have a higher fraction of saturated fatty acids and therefore have higher cloud points. Biodiesel made from Lesquerella and castor oil have cloud points of -11.6ºC and -13.4ºC, which may be due to the low amount of saturated fatty acids. The interaction of viscosity in determination of cloud point was not evaluated.
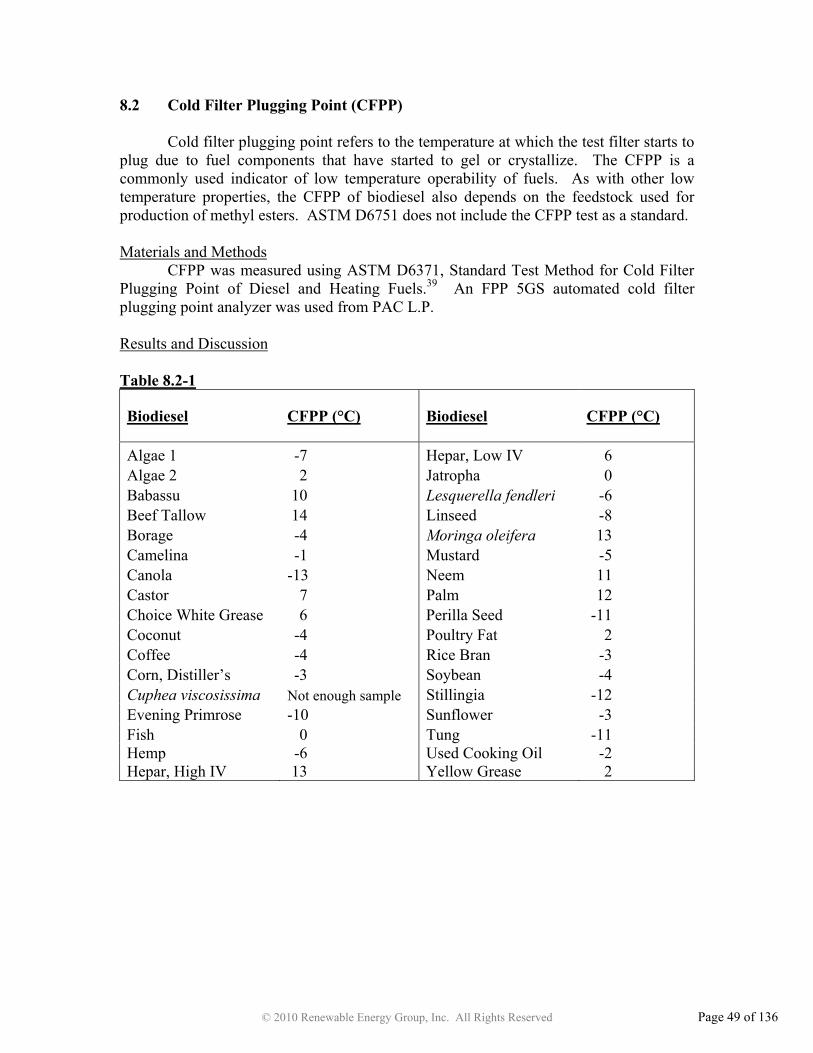
© 2010 Renewable Energy Group, Inc. All Rights Reserved Page 49 of 136
8.2 Cold Filter Plugging Point (CFPP)
Cold filter plugging point refers to the temperature at which the test filter starts to plug due to fuel components that have started to gel or crystallize. The CFPP is a commonly used indicator of low temperature operability of fuels. As with other low temperature properties, the CFPP of biodiesel also depends on the feedstock used for production of methyl esters. ASTM D6751 does not include the CFPP test as a standard. Materials and Methods
CFPP was measured using ASTM D6371, Standard Test Method for Cold Filter Plugging Point of Diesel and Heating Fuels.39 An FPP 5GS automated cold filter plugging point analyzer was used from PAC L.P. Results and Discussion Table 8.2-1
Biodiesel CFPP (°C) Biodiesel CFPP (°C)
Algae 1 -7 Hepar, Low IV 6 Algae 2 2 Jatropha 0 Babassu 10 Lesquerella fendleri -6 Beef Tallow 14 Linseed -8 Borage -4 Moringa oleifera 13 Camelina -1 Mustard -5 Canola -13 Neem 11 Castor 7 Palm 12 Choice White Grease 6 Perilla Seed -11 Coconut -4 Poultry Fat 2 Coffee -4 Rice Bran -3 Corn, Distiller’s -3 Soybean -4 Cuphea viscosissima Not enough sample Stillingia -12 Evening Primrose -10 Sunflower -3 Fish 0 Tung -11 Hemp -6 Used Cooking Oil -2 Hepar, High IV 13 Yellow Grease 2

© 2010 Renewable Energy Group, Inc. All Rights Reserved Page 50 of 136
Biodiesel Cold Filter Plugging Point (CFPP)
-15
-10-5
0
5
1015
20
Can
ola
Stil
lingi
aP
erill
a S
eed
Tung
Eve
ning
Prim
rose
Lins
eed
Alg
ae 1
Hem
pLe
sque
rella
Fen
dler
iM
usta
rdB
orag
eC
ocon
utC
offe
eS
oybe
anC
orn
Ric
e B
ran
Sun
flow
erU
sed
Coo
king
Oil
Cam
elin
aJa
troph
aFi
shA
lgae
2P
oultr
y Fa
tY
ello
w G
reas
eC
hoic
e W
hite
Gre
ase
Hep
ar, L
ow IV
Cas
tor
Bab
assu
Nee
mP
alm
Hep
ar, H
igh
IVM
orin
ga O
leife
raB
eef T
allo
w
Biodiesel
CFP
P (°
C)
Fig. 8.2-1
Similar to cloud point, the CFPP of biodiesel also varies with the fatty acid distribution; with a lower fraction of saturated fatty acids resulting in a lower CFPP, and a higher fraction of saturated fatty acids resulting in a higher CFPP. Usually, the CFPP of a fuel is lower than its cloud point.16 However, in the case of biodiesel made from castor and Lesquerella, the CFPP is higher than the cloud point. To determine the CFPP of the biodiesel by ASTM D6371, the biodiesel passes through a 45 micron filtration device under a vacuum of 2 kPa. The biodiesel is cooled at 1°C intervals, and the temperature at which the fuel fails to pass through the test filter under the test conditions in a specified length of time is reported as its CFPP.39 In the case of biodiesel made from castor and Lesquerella oils, the reason for test filter plugging at temperatures higher than the cloud point could be due to the high viscosity of the biodiesel and not due to the crystallization of biodiesel molecules. Babassu also has a cloud point lower than the CFPP, reasons of which have not been investigated.

© 2010 Renewable Energy Group, Inc. All Rights Reserved Page 51 of 136
8.3 Cold Soak Filtration
Cold soak filtration is the newest biodiesel requirement set in ASTM D6751.33 The cold soak filtration test is done to determine if crystals form at low temperatures and do not redissolve when the biodiesel returns to a higher temperature. Materials and Methods
The ASTM D6751 procedure involves chilling 300 mL of biodiesel for 16 hours at 40°F, removing the sample and letting the sample warm back up to room temperature. When the sample has warmed back up to 20-22°C, it is filtered through a 0.7 µm filter paper. The sample is timed as it passes through the filter paper and when all 300 mL passes through the paper, the result is reported (in seconds). The maximum allowable test result for cold soak filtration is 360 seconds.33
A Thermo Scientific refrigerator model number 3556 was used to chill all of the samples to the specified 40°F. A Hydrosol stainless steel filter holder from Millipore Corp. with a filter diameter of 47 mm was used for all of the biodiesel samples. The filter paper used was Grade GF/F glass fiber from Whatman Ltd. If the biodiesel did not pass through the filter in 720 seconds, the test was aborted and the result was reported as >720 s, and the volume of biodiesel that did not pass through the filter paper was measured in mL. Results and Discussion Table 8.3-1
Biodiesel Cold Soak Filtration (s) (mL Remaining)
Biodiesel Cold Soak Filtration (s) (mL Remaining)
Algae 1 85 Hepar, Low IV 77 Algae 2 84 Jatropha 286 Babassu 310 Lesquerella fendleri >720 (190 mL) Beef Tallow 76 Linseed 64 Borage 74 Moringa oleifera 78 Camelina 223 Mustard Not enough sample Canola 113 Neem >720 (170 mL) Castor >720 (216 mL) Palm 88 Choice White Grease 72 Perilla Seed 200 Coconut 49 Poultry Fat >720 (239 mL) Coffee 203 Rice Bran 111 Corn, Distiller’s 131 Soybean 67 Cuphea viscosissima Not enough sample Stillingia Not enough sample Evening Primrose 269 Sunflower 107 Fish 68 Tung >720 (69 mL) Hemp 66 Used Cooking Oil 81 Hepar, High IV 87 Yellow Grease 95
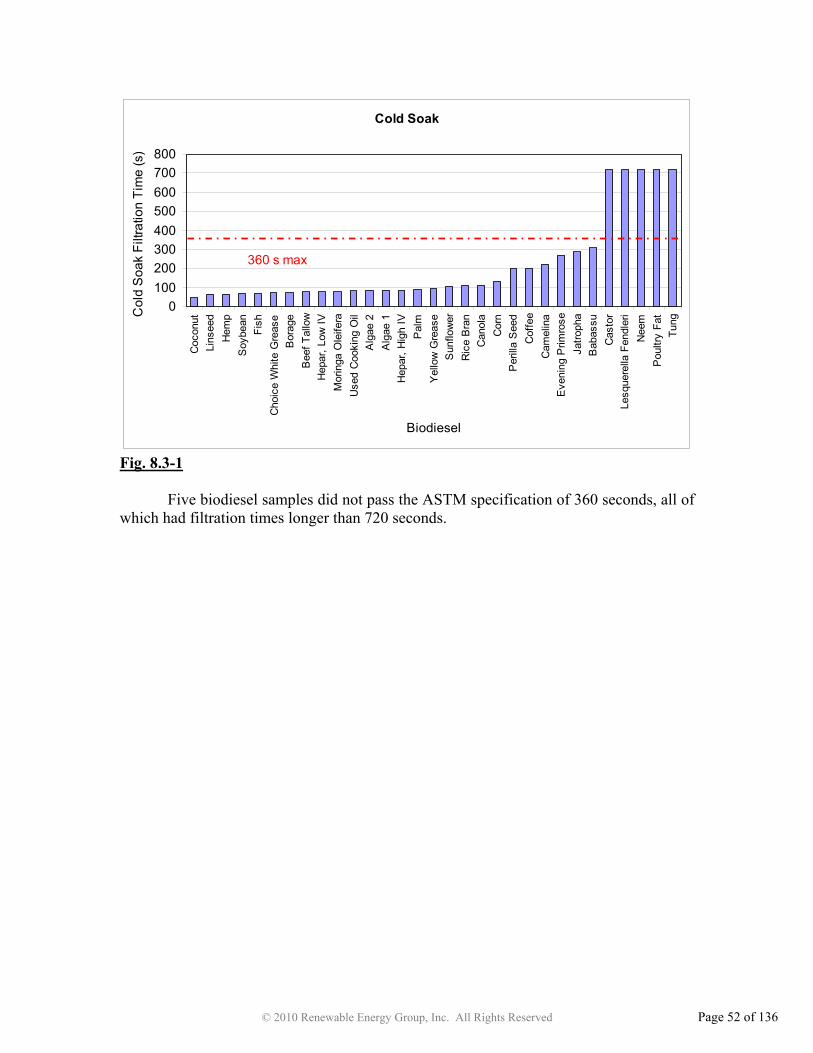
© 2010 Renewable Energy Group, Inc. All Rights Reserved Page 52 of 136
Cold Soak
0100200300400500600700800
Coc
onut
Lins
eed
Hem
pS
oybe
anFi
shC
hoic
e W
hite
Gre
ase
Bor
age
Bee
f Tal
low
Hep
ar, L
ow IV
Mor
inga
Ole
ifera
Use
d C
ooki
ng O
ilA
lgae
2A
lgae
1H
epar
, Hig
h IV
Pal
mY
ello
w G
reas
eS
unflo
wer
Ric
e B
ran
Can
ola
Cor
nP
erill
a S
eed
Cof
fee
Cam
elin
aE
veni
ng P
rimro
seJa
troph
aB
abas
suC
asto
rLe
sque
rella
Fen
dler
iN
eem
Pou
ltry
Fat
Tung
Biodiesel
Col
d S
oak
Filtr
atio
n Ti
me
(s)
360 s max
Fig. 8.3-1
Five biodiesel samples did not pass the ASTM specification of 360 seconds, all of which had filtration times longer than 720 seconds.
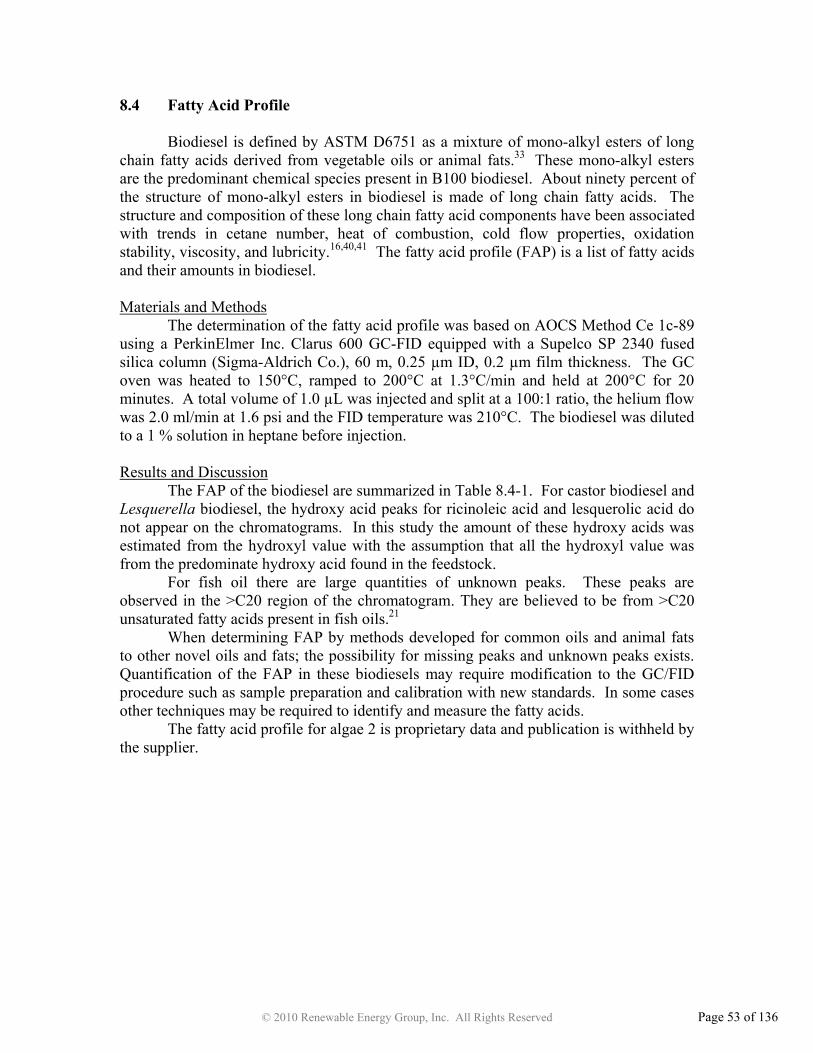
© 2010 Renewable Energy Group, Inc. All Rights Reserved Page 53 of 136
8.4 Fatty Acid Profile
Biodiesel is defined by ASTM D6751 as a mixture of mono-alkyl esters of long chain fatty acids derived from vegetable oils or animal fats.33 These mono-alkyl esters are the predominant chemical species present in B100 biodiesel. About ninety percent of the structure of mono-alkyl esters in biodiesel is made of long chain fatty acids. The structure and composition of these long chain fatty acid components have been associated with trends in cetane number, heat of combustion, cold flow properties, oxidation stability, viscosity, and lubricity.16,40,41 The fatty acid profile (FAP) is a list of fatty acids and their amounts in biodiesel. Materials and Methods
The determination of the fatty acid profile was based on AOCS Method Ce 1c-89 using a PerkinElmer Inc. Clarus 600 GC-FID equipped with a Supelco SP 2340 fused silica column (Sigma-Aldrich Co.), 60 m, 0.25 µm ID, 0.2 µm film thickness. The GC oven was heated to 150°C, ramped to 200°C at 1.3°C/min and held at 200°C for 20 minutes. A total volume of 1.0 µL was injected and split at a 100:1 ratio, the helium flow was 2.0 ml/min at 1.6 psi and the FID temperature was 210°C. The biodiesel was diluted to a 1 % solution in heptane before injection. Results and Discussion
The FAP of the biodiesel are summarized in Table 8.4-1. For castor biodiesel and Lesquerella biodiesel, the hydroxy acid peaks for ricinoleic acid and lesquerolic acid do not appear on the chromatograms. In this study the amount of these hydroxy acids was estimated from the hydroxyl value with the assumption that all the hydroxyl value was from the predominate hydroxy acid found in the feedstock.
For fish oil there are large quantities of unknown peaks. These peaks are observed in the >C20 region of the chromatogram. They are believed to be from >C20 unsaturated fatty acids present in fish oils.21
When determining FAP by methods developed for common oils and animal fats to other novel oils and fats; the possibility for missing peaks and unknown peaks exists. Quantification of the FAP in these biodiesels may require modification to the GC/FID procedure such as sample preparation and calibration with new standards. In some cases other techniques may be required to identify and measure the fatty acids.
The fatty acid profile for algae 2 is proprietary data and publication is withheld by the supplier.

© 2010 Renewable Energy Group, Inc. All Rights Reserved Page 54 of 136
Table 8.4-1, Fatty acid profiles for selected fats and oils
Feedstock
C8:
0
C10:
0
C12
:0
C14:
0
C15:
0
C16
:0
C16:
1
C17
:0
C17:
1
C18:
0
C18
:1
C18
:1n-
9(O
H)
C18
:2
C18:
3
C18:
3 9c
,11t
,13t
C20
:0
C20:
1
C20
:1n-
n(O
H)
C20
:2
C20:
5
C22
:0
C22:
1
C24
:0
C24
:1
UN
KNO
WN
S
Algae 1 0.6 6.9 0.2 3.0 75.2 12.4 1.2 0.4 0.1
Babassu 0.5 3.8 48.8 17.2 9.7 4.0 14.2 1.8
Beef Tallow 0.2 2.9 0.6 24.3 2.1 1.2 0.4 22.8 40.2 3.3 0.7 0.2 0.6 0.5
Borage 9.3 3.8 17.1 38.7 26.1 0.2 2.5 1.5 0.8
Camelina Oil 5.0 2.2 17.7 18.0 37.9 1.4 9.8 1.6 0.4 4.5 0.3 0.2 1.0
Canola Oil 3.8 0.3 1.9 63.9 19.0 9.7 0.6 0.4 0.2 0.2
Castora 0.9 1.1 3.1 90.3 4.0 0.6
Choice White Grease 1.3 21.6 2.8 0.2 0.3 9.0 50.4 12.2 1.0 0.2 0.5 0.3 0.2
Coconut 6.3 6.0 49.2 18.5 9.1 2.7 6.5 1.7
Coffee 11.0 0.5 3.4 70.0 12.7 0.8 0.6 0.1 0.2 0.1 0.6
Corn 12.1 0.1 0.1 1.8 27.2 56.2 1.3 0.4 0.2 0.6
Cuphea Viscosissima 4.7 18.2 3.5 46.9 22.8 2.3 0.6 0.4 0.6
Evening Primrose 6.0 1.8 6.6 76.3 9.0 0.3
Fish 0.2 7.7 18.8 9.3 0.3 0.3 3.9 15.0 4.6 0.3 0.2 1.4 25.1 0.7 1.3 0.4 10.5
Hemp 5.2 2.4 13.1 57.1 20.0 0.7 0.5 0.3 0.7
Hepar, High IV 0.2 1.0 20.7 2.7 0.3 0.3 8.9 46.7 15.6 0.5 0.2 0.8 1.3 0.2 0.4 0.1 0.1
Hepar, Low IV 0.1 0.1 1.5 28.0 1.9 0.3 0.2 20.2 36.1 9.7 0.3 0.2 0.7 0.4 0.3
Jatropha 12.7 0.7 5.5 39.1 41.6 0.2 0.2
Lesquerella Fendleri a 0.1 0.9 0.3 1.7 13.0 5.8 10.6 0.7 66.5 0.4
Linseed 4.4 3.8 20.7 15.9 54.6 0.2 0.3 0.1
Moringa Oleifera 5.5 1.2 5.8 76.3 0.7 3.1 2.0 4.2 0.4 0.8
Mustard 2.6 0.2 1.2 20.6 20.6 13.3 0.9 10.7 1.0 0.5 25.6 0.2 1.5 1.1
Neem 14.9 0.1 20.6 43.9 17.9 0.4 1.6 0.3 0.3
Palm 0.2 0.5 43.4 0.1 4.6 41.9 8.6 0.3 0.3 0.1
Perilla Seed 5.3 0.1 2.2 16.6 13.7 62.1
Poultry Fat 0.1 1.0 19.6 3.2 0.3 0.2 7.5 36.8 28.4 2.0 0.1 0.1 0.3 0.4
Rice Bran 0.3 12.5 2.1 47.5 35.4 1.1 0.6 0.3 0.2
Soybean 9.4 4.1 22.0 55.3 8.9 0.3
Stil lingia 0.4 0.1 7.5 2.3 16.7 31.5 41.5
Sunflower 4.2 3.3 63.6 27.6 0.2 0.7 0.4
Tung 1.8 2.1 5.3 6.8 0.7 72.2 0.2 0.1 10.4 0.4
Used Cooking Oil 0.1 0.1 11.8 0.4 0.1 0.1 4.4 25.3 49.5 7.1 0.3 0.4 0.3 0.1
Yellow Grease 0.1 0.5 14.3 1.1 0.3 0.2 8.0 35.6 35.0 4.0 0.3 0.3 0.2 0.1
a In the GC/FID chromatogram the hydroxy ester peaks were missing. The quantity of the hydroxy ester peaks was estimated from the hydroxyl value with the assumption that all the hydroxy value was the primary hydroxy acid in the sample.

© 2010 Renewable Energy Group, Inc. All Rights Reserved Page 55 of 136
8.5 Relative Density
Relative density is the density of the component compared to the density of water. Relative density is a measure of weight per unit volume. The relative density of biodiesel is needed to make mass to volume conversions, calculate flow and viscosity properties, and is used to judge the homogeneity of biodiesel tanks. Materials and Methods
Relative density was measured with a hydrometer in accordance with ASTM D1298, Standard Test Method for Density, Relative Density (Specific Gravity), or API Gravity of Crude Petroleum and Liquid Petroleum Products by Hydrometer Method.42 A Haake C10-K10 refrigerated bath was used from Thermo Fisher Scientific Inc. Results and Discussion Table 8.5-1
Biodiesel Relative Density Biodiesel Relative Density
Algae 1 0.8780 Hepar, Low IV 0.8755 Algae 2 0.8780 Jatropha 0.8795 Babassu 0.8760 Lesquerella fendleri 0.9110 Beef Tallow 0.8740 Linseed 0.8925 Borage 0.8865 Moringa oleifera 0.8770 Camelina 0.8880 Mustard Not enough sample Canola 0.8820 Neem 0.8845 Castor 0.8990 Palm 0.8760 Choice White Grease 0.8770 Perilla Seed 0.8990 Coconut 0.8073 Poultry Fat 0.8805 Coffee 0.8815 Rice Bran 0.8855 Corn, Distiller’s 0.8850 Soybean 0.8840 Cuphea viscosissima Not enough sample Stillingia Not enough sample Evening Primrose 0.8885 Sunflower 0.8800 Fish 0.8955 Tung 0.9030 Hemp 0.8885 Used Cooking Oil 0.8555 Hepar, High IV 0.8755 Yellow Grease 0.8825

© 2010 Renewable Energy Group, Inc. All Rights Reserved Page 56 of 136
Biodiesel Relative Density
0.740.760.780.800.820.840.860.880.900.92
Coc
onut
Use
d C
ooki
ng O
ilB
eef T
allo
wH
epar
, Hig
h IV
Hep
ar, L
ow IV
Bab
assu
Pal
mC
hoic
e W
hite
Gre
ase
Mor
inga
Ole
ifera
Alg
ae 1
Alg
ae 2
Jatro
pha
Sun
flow
erP
oultr
y Fa
tC
offe
eC
anol
aY
ello
w G
reas
eS
oybe
anN
eem
Cor
nR
ice
Bra
nB
orag
eC
amel
ina
Eve
ning
Prim
rose
Hem
pLi
nsee
dFi
shC
asto
rP
erill
a S
eed
Tung
Lesq
uere
lla F
endl
eri
Feedstock
Rel
ativ
e D
ensi
ty
Fig. 8.5-1
For twenty seven of the thirty one biodiesels, the relative density falls in the range 0.8600 to 0.9000. The most notable outlier is coconut biodiesel with a relative density of 0.8073. Since babassu biodiesel which has a similar fatty acid profile has a relative density of 0.8760, the reason for the low relative density in coconut biodiesel is unclear and was not investigated further. Lesquerella biodiesel (0.9110) and tung biodiesel (0.9030) have densities higher than 0.9 and may not pass EN Standard 14214, which specifies the density at 15°C to be 860-900 kg/m3.43 This would be equivalent to a relative density range of 0.86 to 0.90. Since castor biodiesel has a similar relative density to Lesquerella biodiesel, and both castor biodiesel and Lesquerella biodiesel are the only biodiesels in the study high in hydroxy esters,21 the presence of high amounts of hydroxy esters may be associated with higher density.
In the top ten highest relative densities, there is biodiesel from borage (0.8865), camelina (0.8880), evening primrose (0.8885), hemp (0.8885), linseed (0.8925), perilla (0.8990) and fish (0.8955). All these biodiesels have a similar structural component that is significantly different than the other biodiesels in the study. These biodiesels are rich in unsaturated esters with more than two double bonds. The presence of more than 25 wt % of unsaturated esters with more than two double bonds appears to be associated with an increase in relative density.
Of the 13 lowest relative densities, 11 are from biodiesels with 1.0 wt % or less unsaturated esters with more than two double bonds. This further strengthens the association of high levels of unsaturated ester with more than two double bonds to increased relative density.

© 2010 Renewable Energy Group, Inc. All Rights Reserved Page 57 of 136
8.6 Kinematic Viscosity Materials and Methods
Kinematic viscosity in biodiesel was determined using ASTM D445, Standard Test Method for Kinematic Viscosity of Transparent and Opaque Liquids (and Calculation of Dynamic Viscosity).20 A K23700 kinematic viscosity bath manufactured by Koehler Instrument Company, Inc. was used. Results and Discussion Table 8.6-1
Biodiesel Kinematic Viscosity (mm2/s)
Biodiesel Kinematic Viscosity (mm2/s)
Algae 1 4.519 Hepar, Low IV 4.643 Algae 2 4.624 Jatropha 4.253 Babassu 3.239 Lesquerella fendleri 10.020 Beef Tallow 4.824 Linseed 3.752 Borage 4.083 Moringa oleifera 5.008 Camelina 4.365 Mustard Not enough sample Canola 4.439 Neem 5.213 Castor 15.250 Palm 4.570 Choice White Grease 4.536 Perilla Seed 3.937 Coconut 2.726 Poultry Fat 4.496 Coffee 4.852 Rice Bran 4.958 Corn, Distiller’s 4.382 Soybean 4.039 Cuphea viscosissima Not enough sample Stillingia Not enough sample Evening Primrose 4.112 Sunflower 4.439 Fish 3.777 Tung 7.530 Hemp 3.874 Used Cooking Oil 4.332 Hepar, High IV 4.422 Yellow Grease 4.552

© 2010 Renewable Energy Group, Inc. All Rights Reserved Page 58 of 136
Biodiesel Kinematic Viscosity
02468
1012141618
Coc
onut
Bab
assu
Lins
eed
Fish
Hem
pP
erill
a S
eed
Soy
bean
Bor
age
Eve
ning
Prim
rose
Ja
troph
aU
sed
Coo
king
Oil
Cam
elin
aC
orn
Hep
ar, H
igh
IVS
unflo
wer
Can
ola
Pou
ltry
Fat
Alg
ae 1
Cho
ice
Whi
te G
reas
eY
ello
w G
reas
eP
alm
Alg
ae 2
Hep
ar, L
ow IV
Bee
f Tal
low
Cof
fee
Ric
e B
ran
Mor
inga
Ole
ifera
Nee
mTu
ngLe
sque
rella
Fen
dler
iC
asto
r
Biodiesel
Kin
emat
ic V
isco
sity
(mm
2 /s)
1.9 mm2/s min - 6.0 mm2/s max
Fig. 8.6-1
Biodiesel kinematic viscosities are all lower that those presented by their respective oils or fats. This is an expected finding since biodiesel molecules are single, long chain fatty esters with higher mobility than the bigger and bulkier triglyceride molecules. The same trends found for kinematic viscosity in the feedstocks are found in the biodiesels.
Castor, Lesquerella, and tung biodiesel present the highest kinematic viscosities among the biodiesel of this study; the reasons are the same explained previously in the kinematic viscosity of feedstocks chapter. They did not pass the ASTM D6751 specification of 1.9 mm2/s to 6.0 mm2/s.

© 2010 Renewable Energy Group, Inc. All Rights Reserved Page 59 of 136
8.7 Sulfated Ash
ASTM D874 measures sulfated ash that may come from abrasive solids, soluble metallic soaps, and unremoved catalysts.33 The biodiesel is ignited and burned and then treated with sulfuric acid to determine the percentage of sulfated ash present in the biodiesel.44 Materials and Methods
The sulfated ash determination of biodiesel samples in this study was done following ASTM D874, Standard Test Method for Sulfated Ash from Lubricating Oils and Additives.44 A muffle furnace, model FB1415M, from Thermo Scientific Inc. was used. Results and Discussion Table 8.7-1
Biodiesel Sulfated Ash (% mass) Biodiesel Sulfated Ash
(% mass)
Algae 1 <0.005 Hepar, Low IV <0.005 Algae 2 <0.005 Jatropha 0.009 Babassu <0.005 Lesquerella fendleri 0.010 Beef Tallow <0.005 Linseed <0.005 Borage <0.005 Moringa oleifera <0.005 Camelina <0.005 Mustard Not enough sample Canola <0.005 Neem <0.005 Castor 0.034 Palm <0.005 Choice White Grease <0.005 Perilla Seed <0.005 Coconut 0.006 Poultry Fat <0.005 Coffee <0.005 Rice Bran <0.005 Corn, Distiller’s <0.005 Soybean <0.005 Cuphea viscosissima Not enough sample Stillingia Not enough sample Evening Primrose 0.038 Sunflower <0.005 Fish <0.005 Tung <0.005 Hemp <0.005 Used Cooking Oil <0.005 Hepar, High IV <0.005 Yellow Grease <0.005

© 2010 Renewable Energy Group, Inc. All Rights Reserved Page 60 of 136
Biodiesel Sulfated Ash
0.000
0.005
0.010
0.015
0.030
0.035
0.040
Alg
ae 2
Alg
ae 1
Bab
assu
Oil
Bee
f Tal
low
Bor
age
Cam
elin
a O
il
Can
ola
Oil
Cho
ice
Whi
te G
reas
e
Cof
fee
Cor
n O
il
Fish
Hem
p
Hep
ar, H
igh
IV
Hep
ar, L
ow IV
Lins
eed
Oil
Mor
inga
Ole
ifera
Nee
m O
il
Pal
m O
il
Per
illa
See
d
Pou
ltry
Fat
Ric
e B
ran
Soy
bean
Oil
Sun
flow
er O
il
Tung
Use
d C
ooki
ng O
il
Yel
low
Gre
ase
Coc
onut
Oil
Jatro
pha
Lesq
uere
lla F
endl
eri
Cas
tor
Eve
ning
Prim
rose
Oil
Biodiesel
Sul
fate
d A
sh (%
mas
s)
0.020 % mass max
Fig. 8.7-1 The maximum ASTM limit for sulfated ash is 0.020 % mass and the majority of the evaluated biodiesels fell under the maximum limit with the exceptions of castor and evening primrose biodiesels.33 These biodiesels do not present high concentrations of calcium, magnesium, phosphorous or sulfur which are some common elements that compose sulfated ash, therefore, the source for these high sulfated ash results is unknown.

© 2010 Renewable Energy Group, Inc. All Rights Reserved Page 61 of 136
8.8 Carbon Residue
The carbon residue test indicates the extent of deposits that result from the combustion of a fuel. Carbon residue which is formed by decomposition and subsequent pyrolysis of the fuel components can clog the fuel injectors. ASTM D6751 includes carbon residue as a standard for biodiesel. The maximum allowable carbon residue for biodiesel is 0.050 % by mass.33 Materials and Methods
The carbon residue for biodiesel was measured according to ASTM D524, Standard Test Method for Ramsbottom Carbon Residue of Petroleum Products.45 The samples were tested using a Ramsbottom carbon residue tester manufactured by Koehler Instrument Company, Inc. Results and Discussion Table 8.8-1
Biodiesel Carbon Residue (% mass) Biodiesel Carbon Residue
(% mass)
Algae 1 0.007 Hepar, Low IV 0.025 Algae 2 0.042 Jatropha 0.026 Babassu 0.050 Lesquerella fendleri 0.109 Beef Tallow 0.028 Linseed 0.035 Borage 0.008 Moringa oleifera 0.033 Camelina 0.075 Mustard Not enough sample Canola 0.030 Neem 0.105 Castor 0.110 Palm 0.010 Choice White Grease 0.034 Perilla Seed 0.037 Coconut 0.010 Poultry Fat 0.025 Coffee 0.004 Rice Bran 0.047 Corn, Distiller’s 0.020 Soybean 0.038 Cuphea viscosissima Not enough sample Stillingia Not enough sample Evening Primrose 0.051 Sunflower 0.035 Fish 0.078 Tung 0.116 Hemp 0.019 Used Cooking Oil 0.040 Hepar, High IV 0.041 Yellow Grease 0.026
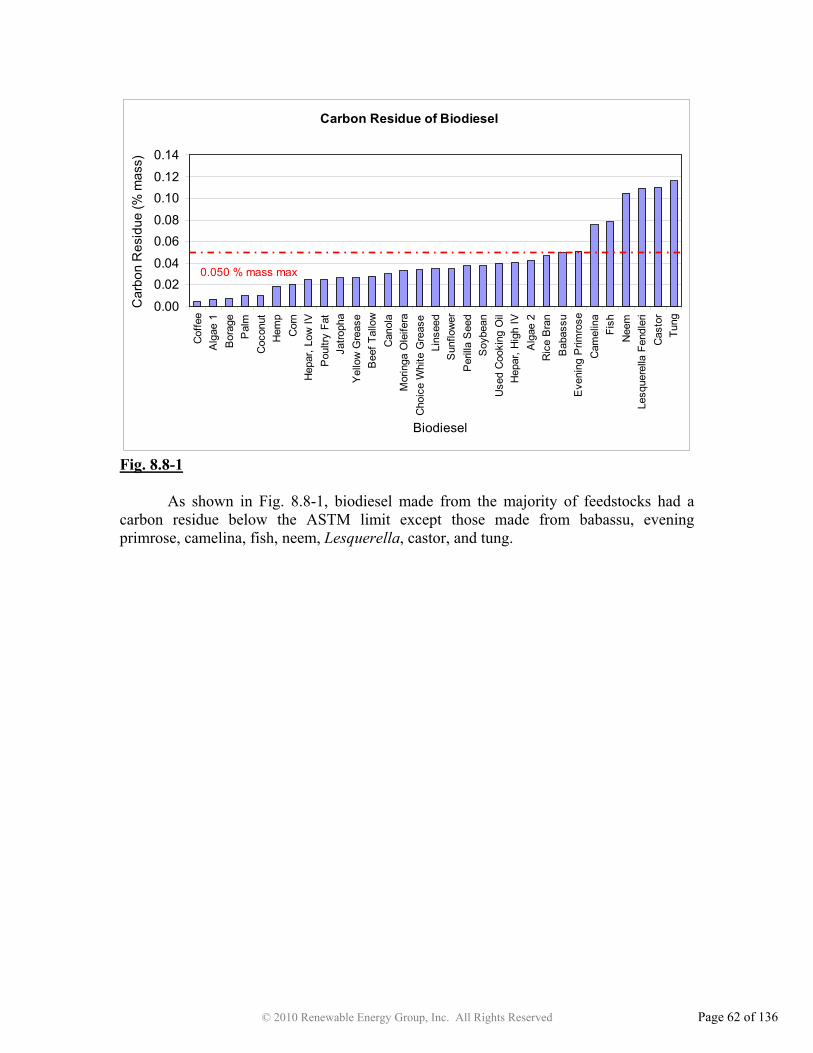
© 2010 Renewable Energy Group, Inc. All Rights Reserved Page 62 of 136
Carbon Residue of Biodiesel
0.00
0.020.04
0.060.08
0.100.12
0.14
Cof
fee
Alg
ae 1
Bor
age
Pal
mC
ocon
utH
emp
Cor
nH
epar
, Low
IVP
oultr
y Fa
tJa
troph
aY
ello
w G
reas
eB
eef T
allo
wC
anol
aM
orin
ga O
leife
raC
hoic
e W
hite
Gre
ase
Lins
eed
Sun
flow
erP
erill
a S
eed
Soy
bean
Use
d C
ooki
ng O
ilH
epar
, Hig
h IV
Alg
ae 2
Ric
e B
ran
Bab
assu
Eve
ning
Prim
rose
Cam
elin
aFi
shN
eem
Lesq
uere
lla F
endl
eri
Cas
tor
Tung
Biodiesel
Car
bon
Res
idue
(% m
ass)
0.050 % mass max
Fig. 8.8-1
As shown in Fig. 8.8-1, biodiesel made from the majority of feedstocks had a carbon residue below the ASTM limit except those made from babassu, evening primrose, camelina, fish, neem, Lesquerella, castor, and tung.

© 2010 Renewable Energy Group, Inc. All Rights Reserved Page 63 of 136
8.9 Water and Sediment
Water and sediment testing is done using 100 mL of biodiesel and centrifuging it at 1870 rpm for 11 minutes. If the water and sediment level is below 0.005 % volume (vol), the result is reported as <0.005 % vol. 46
Materials and Methods
Water and sediment tests were done as per ASTM D2709 Standard Test Method for Water and Sediment in Middle Distillate Fuels by Centrifuge.46 Samples were centrifuged using an L-K Industries, Inc. Benchmark 2000 centrifuge. Table 8.9-1
Biodiesel Water and Sediment (% Volume)
Biodiesel Water and Sediment (% Volume)
Algae 1 < 0.005 Hepar, Low IV < 0.005 Algae 2 < 0.005 Jatropha < 0.005 Babassu < 0.005 Lesquerella fendleri 0.075 Beef Tallow < 0.005 Linseed < 0.005 Borage < 0.005 Moringa oleifera < 0.005 Camelina < 0.005 Mustard Not enough sample Canola < 0.005 Neem < 0.005 Castor < 0.005 Palm < 0.005 Choice White Grease < 0.005 Perilla Seed < 0.005 Coconut < 0.005 Poultry Fat < 0.005 Coffee < 0.005 Rice Bran < 0.005 Corn, Distiller’s < 0.005 Soybean < 0.005 Cuphea viscosissima Not enough sample Stillingia Not enough sample Evening Primrose < 0.005 Sunflower < 0.005 Fish < 0.005 Tung < 0.005 Hemp < 0.005 Used Cooking Oil < 0.005 Hepar, High IV < 0.005 Yellow Grease < 0.005
Most of the biodiesel samples generated during this study presented <0.005 % volume as many samples had undetectable levels of water and sediment. A water layer was never observed. The Lesquerella biodiesel presented a green colored, gel-like sediment. Lesquerella biodiesel had a relatively high moisture level (0.073 wt %) and the biodiesel also appeared hazy.
© 2010 Renewable Energy Group, Inc. All Rights Reserved Page 64 of 136
8.10 Visual Inspection
The visual inspection test is a visual comparison method used to determine the presence of water and particulates in biodiesel. It is measured as a haze value by placing a line chart behind a clear jar of biodiesel and referencing how the lines compare to six different pictures with haze ratings from 1 to 6, with 1 being the least amount of particulates and 6 being the highest. A haze rating of 1 is the clearest; while a haze rating of 6 means that the biodiesel is very cloudy. Materials and Methods
Visual inspection of biodiesel is determined by ASTM D4176, Standard Test Method for Free Water and Particulate Contamination in Distillate Fuels (Visual Inspection Procedures), Procedure 2.47 Results and Discussion Table 8.10-1
Biodiesel Visual Inspection Biodiesel Visual
Inspection
Algae 1 1 Hepar, Low IV 1 Algae 2 1 Jatropha 1 Babassu 1 Lesquerella fendleri 2 Beef Tallow 1 Linseed 1 Borage 1 Moringa oleifera 1 Camelina 1 Mustard Not enough sample Canola 1 Neem 3 Castor 1 Palm 1 Choice White Grease 1 Perilla Seed 1 Coconut 1 Poultry Fat 1 Coffee 2 Rice Bran 1 Corn, Distiller’s 1 Soybean 1 Cuphea viscosissima Not enough sample Stillingia Not enough sample Evening Primrose 1 Sunflower 1 Fish 1 Tung 1 Hemp 1 Used Cooking Oil 1 Hepar, High IV 1 Yellow Grease 1
Neem had the highest haze rating of 3. Neem had a low moisture content of 0.036
wt %, and no suspended water particles were seen in the neem biodiesel. Neem also had a low water and sediment result, of <0.005 % volume. One possible reason that the neem biodiesel has a high haze rating is that the neem oil has a high level of insoluble impurities. The insoluble impurities in neem oil were higher than any of the other feedstocks at 1.11 wt %.
© 2010 Renewable Energy Group, Inc. All Rights Reserved Page 65 of 136
Lesquerella fendleri biodiesel appeared to have moisture in it, which was verified by the Karl Fischer moisture result of 0.073 wt %. The Lesquerella fendleri biodiesel had the most moisture of any of the biodiesels that were tested and may have been related to the performance on the visual inspection test.
Coffee biodiesel did not appear to have moisture in it and had a low Karl Fischer moisture content of 0.030 wt %. The coffee biodiesel appeared to have a high level of particulates, but other biodiesel and feedstock test results were not indicative of a cause for the haze particles.

© 2010 Renewable Energy Group, Inc. All Rights Reserved Page 66 of 136
8.11 Free and Total Glycerin Free and total glycerin is a measurement of how much triglyceride remains unconverted into methyl esters. Total glycerin is calculated from the amount of free glycerin, monoglycerides, diglycerides, and triglycerides. Materials and Methods Free and total glycerin was run in accordance with ASTM D6584, Standard Test Method for Determination of Free and Total Glycerin in B100 Biodiesel Methyl Esters by Gas Chromatography.48 A PerkinElmer Inc. Clarus 600 gas chromatograph equipped with a Restek MXT-Biodiesel TG Column, 14 m, 0.53 mm ID, 0.16 $m film thickness with 2 m Integra-Gap was used. Calibration standards were purchased from Sigma-Aldrich Co. Results and Discussion Table 8.11-1, Free Glycerin
Biodiesel Free Glycerin (mass %) Biodiesel Free Glycerin
(mass %)
Algae 1 0.009 Hepar, Low IV 0.002 Algae 2 0.014 Jatropha 0.006 Babassu 0.008 Lesquerella fendleri 0.055 Beef Tallow 0.008 Linseed 0.001 Borage 0.001 Moringa oleifera 0.001 Camelina 0.002 Mustard 0.004 Canola 0.006 Neem 0.000 Castor 0.367 Palm 0.003 Choice White Grease 0.012 Perilla Seed 0.000 Coconut 0.025 Poultry Fat 0.002 Coffee 0.001 Rice Bran 0.001 Corn, Distiller’s 0.001 Soybean 0.012 Cuphea viscosissima 0.002 Stillingia 0.000 Evening Primrose 0.005 Sunflower 0.007 Fish 0.006 Tung 0.015 Hemp 0.001 Used Cooking Oil 0.012 Hepar, High IV 0.002 Yellow Grease 0.009

© 2010 Renewable Energy Group, Inc. All Rights Reserved Page 67 of 136
Free Glycerin in Biodiesel
0.000
0.010
0.020
0.030
0.050
0.350
0.060
0.370
Nee
mP
erill
a S
eed
Stil
lingi
aB
orag
eC
offe
e
Cor
nH
emp
Lins
eed
Mor
inga
Ole
ifera
Ric
e B
ran
Cam
elin
aC
uphe
a V
isco
siss
ima
Hep
ar, H
igh
IVH
epar
, Low
IVP
oultr
y Fa
t
Pal
mM
usta
rd
Eve
ning
Prim
rose
Can
ola
Fish
Jatro
pha
Sun
flow
er
Bab
assu
Bee
f Tal
low
Alg
ae 1
Yel
low
Gre
ase
Cho
ice
Whi
te G
reas
e
Soy
bean
Use
d C
ooki
ng O
il
Alg
ae 2
Tung
Coc
onut
Lesq
uere
lla F
endl
eri
Cas
tor
Biodiesel
Free
Gly
cerin
(mas
s %
)
0.020 mass %
Fig. 8.11-1 Table 8.11-2, Monoglycerides
Biodiesel Monoglycerides (mass %) Biodiesel Monoglycerides
(mass %)
Algae 1 0.265 Hepar, Low IV 0.282 Algae 2 0.292 Jatropha 0.291 Babassu 0.341 Lesquerella fendleri 0.559 Beef Tallow 0.223 Linseed 0.392 Borage 0.250 Moringa oleifera 0.208 Camelina 0.222 Mustard 0.195 Canola 0.363 Neem 0.338 Castor 0.258 Palm 0.196 Choice White Grease 0.265 Perilla Seed 0.308 Coconut 0.130 Poultry Fat 0.244 Coffee 0.575 Rice Bran 0.281 Corn, Distiller’s 0.197 Soybean 0.473 Cuphea viscosissima 0.780 Stillingia 0.359 Evening Primrose 0.386 Sunflower 0.387 Fish 0.118 Tung 0.120 Hemp 0.513 Used Cooking Oil 0.411 Hepar, High IV 0.227 Yellow Grease 0.300

© 2010 Renewable Energy Group, Inc. All Rights Reserved Page 68 of 136
Table 8.11-3, Diglycerides
Biodiesel Diglycerides (mass %) Biodiesel Diglycerides
(mass %)
Algae 1 0.078 Hepar, Low IV 0.072 Algae 2 0.070 Jatropha 0.104 Babassu 0.231 Lesquerella fendleri 0.710 Beef Tallow 0.063 Linseed 0.112 Borage 0.066 Moringa oleifera 0.070 Camelina 0.125 Mustard 0.040 Canola 0.127 Neem 0.474 Castor 0.479 Palm 0.095 Choice White Grease 0.089 Perilla Seed 0.075 Coconut 0.040 Poultry Fat 0.079 Coffee 0.175 Rice Bran 0.059 Corn, Distiller’s 0.080 Soybean 0.088 Cuphea viscosissima 0.089 Stillingia 0.423 Evening Primrose 0.134 Sunflower 0.092 Fish 0.019 Tung 0.161 Hemp 0.101 Used Cooking Oil 0.161 Hepar, High IV 0.065 Yellow Grease 0.130
Table 8.11-4, Triglycerides
Biodiesel Triglycerides (mass %) Biodiesel Triglycerides
(mass %)
Algae 1 0.020 Hepar, Low IV 0.022 Algae 2 0.019 Jatropha 0.022 Babassu 0.038 Lesquerella fendleri 0.023 Beef Tallow 0.000 Linseed 0.000 Borage 0.000 Moringa oleifera 0.021 Camelina 0.022 Mustard 0.019 Canola 0.000 Neem 0.000 Castor 0.023 Palm 0.000 Choice White Grease 0.019 Perilla Seed 0.000 Coconut 0.000 Poultry Fat 0.020 Coffee 0.022 Rice Bran 0.000 Corn, Distiller’s 0.021 Soybean 0.019 Cuphea viscosissima 0.000 Stillingia 0.000 Evening Primrose 0.035 Sunflower 0.000 Fish 0.000 Tung 0.000 Hemp 0.022 Used Cooking Oil 0.000 Hepar, High IV 0.000 Yellow Grease 0.019

© 2010 Renewable Energy Group, Inc. All Rights Reserved Page 69 of 136
Table 8.11-5, Total Glycerin
Biodiesel Total Glycerin (mass %) Biodiesel Total Glycerin
(mass %)
Algae 1 0.091 Hepar, Low IV 0.088 Algae 2 0.102 Jatropha 0.100 Babassu 0.135 Lesquerella fendleri 0.307 Beef Tallow 0.076 Linseed 0.120 Borage 0.076 Moringa oleifera 0.067 Camelina 0.080 Mustard 0.062 Canola 0.114 Neem 0.158 Castor 0.507 Palm 0.068 Choice White Grease 0.095 Perilla Seed 0.091 Coconut 0.065 Poultry Fat 0.079 Coffee 0.178 Rice Bran 0.083 Corn, Distiller’s 0.066 Soybean 0.149 Cuphea viscosissima 0.218 Stillingia 0.156 Evening Primrose 0.128 Sunflower 0.121 Fish 0.040 Tung 0.070 Hemp 0.151 Used Cooking Oil 0.143 Hepar, High IV 0.070 Yellow Grease 0.108
Total Glycerin in Biodiesel
0.000
0.100
0.200
0.300
0.400
0.500
0.600
Fish
Mus
tard
Coc
onut
Cor
nM
orin
ga O
leife
raP
alm
Hep
ar, H
igh
IVTu
ngB
eef T
allo
wB
orag
eP
oultr
y Fa
tC
amel
ina
Ric
e B
ran
Hep
ar, L
ow IV
Alg
ae 1
Per
illa
See
dC
hoic
e W
hite
Gre
ase
Can
ola
Jatro
pha
Alg
ae 2
Yel
low
Gre
ase
Lins
eed
Sun
flow
erE
veni
ng P
rimro
seB
abas
suU
sed
Coo
king
Oil
Soy
bean
Hem
pS
tillin
gia
Nee
mC
offe
eC
uphe
aLe
sque
rella
Fen
dler
iC
asto
r
Biodiesel
Tota
l Gly
cerin
(mas
s%)
0.240 mass % max
Fig. 8.11-2

© 2010 Renewable Energy Group, Inc. All Rights Reserved Page 70 of 136
ASTM D6751 specifies that the free glycerin must be under 0.020 mass % and that the total glycerin must be under 0.240 mass %.33 Coconut, Lesquerella, and castor biodiesel failed the specification for free glycerin. Lesquerella and castor biodiesel failed the specification for total glycerin. It is hypothesized that additional water washes or longer settling times would reduce the levels of free and total glycerin in the finished product.

© 2010 Renewable Energy Group, Inc. All Rights Reserved Page 71 of 136
8.12 Flash Point
The flash point is the lowest temperature at which fuel emits enough vapors to ignite.49 Biodiesel has a high flash point; usually more than 150°C, while conventional diesel fuel has a flash point of 55-66°C.16 If methanol, with its flash point of 12°C is present in the biodiesel the flash point can be lowered considerably.50 To ensure that the methanol has been adequately stripped from the biodiesel, the Pensky-Martens closed cup flash point test was adopted. Materials and Methods
The flash points were measured with a Pensky-Martens closed cup tester (Koehler Instrument Company, Inc. K16200) using ASTM D93, Standard Test Methods for Flash Point by Pensky-Martens Closed Cup Tester.49 The apparatus and method consist of the controlled heating of the biodiesel in a closed cup, introducing an ignition source, and observing if the heated biodiesel flashes. The temperature at which the biodiesel flashes is recorded as the flash point. For biodiesel, a flash point of below 93°C is considered to be out of specification.33 If the biodiesel has not flashed at 160°C, the test is finished and the result is reported as >160°C.49 Results and Discussion Table 8.12-1
Biodiesel Flash Point (°C) Biodiesel Flash Point (°C)
Algae 1 >160 Hepar, Low IV >160 Algae 2 >160 Jatropha >160 Babassu 135 Lesquerella fendleri >160 Beef Tallow >160 Linseed >160 Borage >160 Moringa oleifera >160 Camelina >160 Mustard Not enough sample Canola >160 Neem >160 Castor >160 Palm >160 Choice White Grease >160 Perilla Seed >160 Coconut 115 Poultry Fat >160 Coffee >160 Rice Bran >160 Corn, Distiller’s >160 Soybean >160 Cuphea viscosissima Not enough sample Stillingia Not enough sample Evening Primrose >160 Sunflower >160 Fish >160 Tung >160 Hemp >160 Used Cooking Oil >160 Hepar, High IV >160 Yellow Grease >160

© 2010 Renewable Energy Group, Inc. All Rights Reserved Page 72 of 136
Biodiesel Flash Point
0
20
40
60
80
100
120
140
160
180
Coc
onut
Bab
assu
Alg
ae 1
Alg
ae 2
Bee
f Tal
low
Bor
age
Cam
elin
aC
anol
aC
asto
rC
hoic
e W
hite
Gre
ase
Cof
fee
Cor
n O
ilE
veni
ng P
rimro
seFi
shH
emp
Hep
ar, H
igh
IVH
epar
, Low
IVJa
troph
aLe
sque
rella
Fen
dler
iLi
nsee
dM
orin
ga O
leife
raN
eem
Pal
mP
erill
a S
eed
Pou
ltry
Fat
Ric
e B
ran
Soy
bean
Sun
flow
erTu
ngU
sed
Coo
king
Oil
Yel
low
Gre
ase
Feedstock
Flas
h P
oint
(°C
)
93°C min
Fig. 8.12-1
None of the measured flash points are less than 93°C and almost all the flash
points are above 160°C, indicating very low methanol levels in the biodiesel. The exceptions are babassu biodiesel with a flash point of 135°C, and coconut biodiesel with a flash point of 115°C. These flash points are probably not due to the methanol content since the methanol was stripped from them in a similar manner as the other biodiesel samples. The lower flash points in babassu and coconut biodiesel are more likely due to the presence of methyl esters with a chain length of less than 12 carbons. Methyl esters with these chain lengths have lower flash points than the C16 and C18 carbon chain lengths which predominate in biodiesel. The Pensky-Martens closed cup flash point of C10 methyl ester, methyl caprate, is 93.3 to 97.8°C.51 The Pensky-Martens closed cup flash point of C8 methyl ester, methyl caprylate, is 74°C.52 The babassu biodiesel contains 0.5 % methyl caprylate and 3.8 % methyl caprate while the coconut biodiesel contained 6.3 % methyl caprylate and 6.0 % methyl caprate.
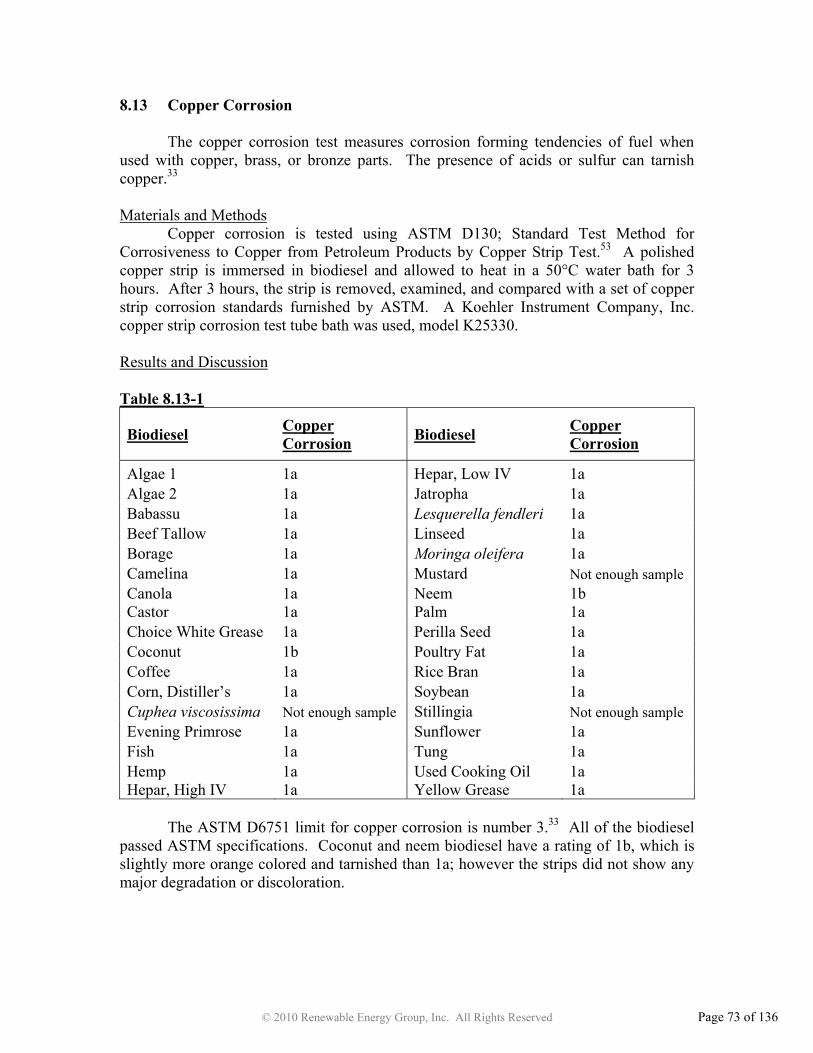
© 2010 Renewable Energy Group, Inc. All Rights Reserved Page 73 of 136
8.13 Copper Corrosion The copper corrosion test measures corrosion forming tendencies of fuel when used with copper, brass, or bronze parts. The presence of acids or sulfur can tarnish copper.33
Materials and Methods
Copper corrosion is tested using ASTM D130; Standard Test Method for Corrosiveness to Copper from Petroleum Products by Copper Strip Test.53 A polished copper strip is immersed in biodiesel and allowed to heat in a 50°C water bath for 3 hours. After 3 hours, the strip is removed, examined, and compared with a set of copper strip corrosion standards furnished by ASTM. A Koehler Instrument Company, Inc. copper strip corrosion test tube bath was used, model K25330. Results and Discussion Table 8.13-1
Biodiesel Copper Corrosion Biodiesel Copper
Corrosion
Algae 1 1a Hepar, Low IV 1a Algae 2 1a Jatropha 1a Babassu 1a Lesquerella fendleri 1a Beef Tallow 1a Linseed 1a Borage 1a Moringa oleifera 1a Camelina 1a Mustard Not enough sample Canola 1a Neem 1b Castor 1a Palm 1a Choice White Grease 1a Perilla Seed 1a Coconut 1b Poultry Fat 1a Coffee 1a Rice Bran 1a Corn, Distiller’s 1a Soybean 1a Cuphea viscosissima Not enough sample Stillingia Not enough sample Evening Primrose 1a Sunflower 1a Fish 1a Tung 1a Hemp 1a Used Cooking Oil 1a Hepar, High IV 1a Yellow Grease 1a
The ASTM D6751 limit for copper corrosion is number 3.33 All of the biodiesel
passed ASTM specifications. Coconut and neem biodiesel have a rating of 1b, which is slightly more orange colored and tarnished than 1a; however the strips did not show any major degradation or discoloration.

© 2010 Renewable Energy Group, Inc. All Rights Reserved Page 74 of 136
8.14 Phosphorous, Calcium, and Magnesium
The specifications from ASTM D6751 state that in biodiesel, the phosphorous must be less than 10 ppm, and calcium and magnesium combined must be less than 5 ppm.33 Materials and Methods
Phosphorous was determined using ASTM D4951, Standard Test Method for Determination of Additive Elements in Lubricating Oils by Inductively Coupled Plasma Atomic Emission Spectrometry.36 Calcium and Magnesium were determined using EN Standard 14538, Fat and Oil Derivatives – Fatty Acid Methyl Ester (FAME) - Determination of Ca, K, Mg, and Na content by optical emission spectral analysis with inductively coupled plasma (ICP OES).54
The biodiesel samples were run on a PerkinElmer Inc. Optima 7000 dual view ICP-OES with a cyclonic spray chamber. Cobalt was used as the internal standard, and PremiSolv (a light hydrotreated distillate, manufactured by Conostan) was used as the base oil. Results and Discussion: Table 8.14-1
Biodiesel Phosphorous (ppm) Biodiesel Phosphorous
(ppm)
Algae 1 <0.1 Hepar, Low IV <0.1 Algae 2 <0.1 Jatropha <0.1 Babassu <0.1 Lesquerella fendleri <0.1 Beef Tallow <0.1 Linseed <0.1 Borage <0.1 Moringa oleifera <0.1 Camelina <0.1 Mustard <0.1 Canola <0.1 Neem <0.1 Castor <0.1 Palm <0.1 Choice White Grease <0.1 Perilla Seed <0.1 Coconut <0.1 Poultry Fat <0.1 Coffee <0.1 Rice Bran <0.1 Corn, Distiller’s <0.1 Soybean <0.1 Cuphea viscosissima <0.1 Stillingia <0.1 Evening Primrose <0.1 Sunflower <0.1 Fish <0.1 Tung 0.9 Hemp <0.1 Used Cooking Oil <0.1 Hepar, High IV <0.1 Yellow Grease <0.1

© 2010 Renewable Energy Group, Inc. All Rights Reserved Page 75 of 136
Phosphorous Levels in Biodiesel
0.00
0.02
0.04
0.06
0.08
0.10
0.80
0.12
0.90
Alg
ae 1
Alg
ae 2
Bab
assu
Bee
f Tal
low
Bor
age
Cam
elin
aC
anol
a
Cas
tor
Cho
ice
Whi
te G
reas
eC
ocon
ut
Cof
fee
Cor
nC
uphe
a V
isco
siss
ima
Eve
ning
Prim
rose
Fish
Hem
pH
epar
, Hig
h IV
Hep
ar, L
ow IV
Jatro
pha
Lesq
uere
lla F
endl
eri
Lins
eed
Mor
inga
Ole
ifera
Mus
tard
Nee
m
Pal
mP
erill
a S
eed
Pou
ltry
Fat
Ric
e B
ran
Soy
bean
Stil
lingi
aS
unflo
wer
Use
d C
ooki
ng O
ilY
ello
w G
reas
eTu
ng
Biodiesel
Pho
spho
rous
(ppm
)10 ppm max
Fig. 8.14-1
The phosphorous for the biodiesel samples was undetectable for all of the samples except for tung biodiesel. Tung biodiesel was measured at 0.9 ppm, which is well below the specification of 10 ppm.

© 2010 Renewable Energy Group, Inc. All Rights Reserved Page 76 of 136
Table 8.14-2
Biodiesel Calcium (ppm) Biodiesel Calcium (ppm)
Algae 1 <0.1 Hepar, Low IV 0.2 Algae 2 0.7 Jatropha <0.1 Babassu 0.5 Lesquerella fendleri 0.2 Beef Tallow <0.1 Linseed <0.1 Borage 1.2 Moringa oleifera <0.1 Camelina 0.8 Mustard <0.1 Canola 0.4 Neem 0.3 Castor 0.1 Palm <0.1 Choice White Grease <0.1 Perilla Seed <0.1 Coconut <0.1 Poultry Fat <0.1 Coffee <0.1 Rice Bran 0.4 Corn, Distiller’s 0.6 Soybean <0.1 Cuphea viscosissima 7.2 Stillingia 0.5 Evening Primrose <0.1 Sunflower <0.1 Fish <0.1 Tung 0.2 Hemp <0.1 Used Cooking Oil 0.6 Hepar, High IV <0.1 Yellow Grease <0.1
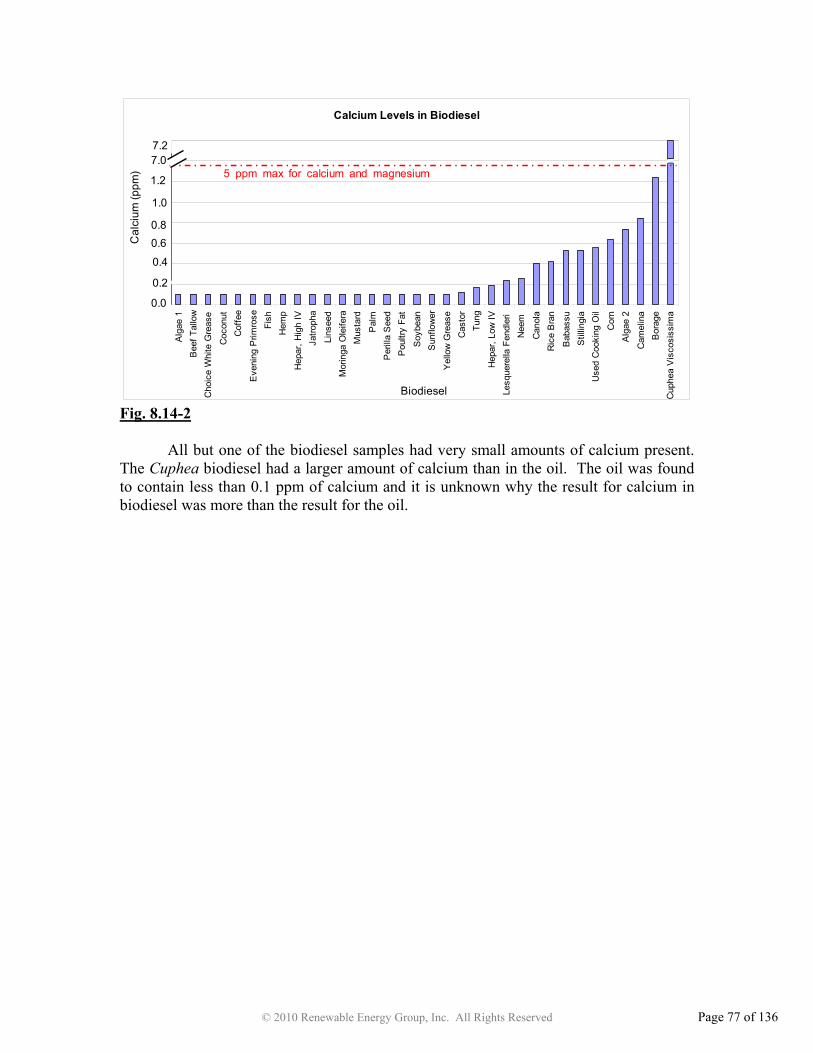
© 2010 Renewable Energy Group, Inc. All Rights Reserved Page 77 of 136
Calcium Levels in Biodiesel
7.27.0
1.0
0.80.6
0.4
0.2
0.0
Alg
ae 1
Bee
f Tal
low
Cho
ice
Whi
te G
reas
e
Coc
onut
Cof
fee
Eve
ning
Prim
rose
Fish
Hem
p
Hep
ar, H
igh
IVJa
troph
a
Lins
eed
Mor
inga
Ole
ifera
Mus
tard
Pal
mP
erill
a S
eed
Pou
ltry
Fat
Soy
bean
Sun
flow
er
Yel
low
Gre
ase
Cas
tor
Tung
Hep
ar, L
ow IV
Lesq
uere
lla F
endl
eri
Nee
m
Can
ola
Ric
e B
ran
Bab
assu
Stil
lingi
aU
sed
Coo
king
Oil
Cor
nA
lgae
2
Cam
elin
aB
orag
eC
uphe
a V
isco
siss
ima
Biodiesel
Cal
cium
(ppm
) 5 ppm max for calcium and magnesium 1.2
Fig. 8.14-2
All but one of the biodiesel samples had very small amounts of calcium present. The Cuphea biodiesel had a larger amount of calcium than in the oil. The oil was found to contain less than 0.1 ppm of calcium and it is unknown why the result for calcium in biodiesel was more than the result for the oil.
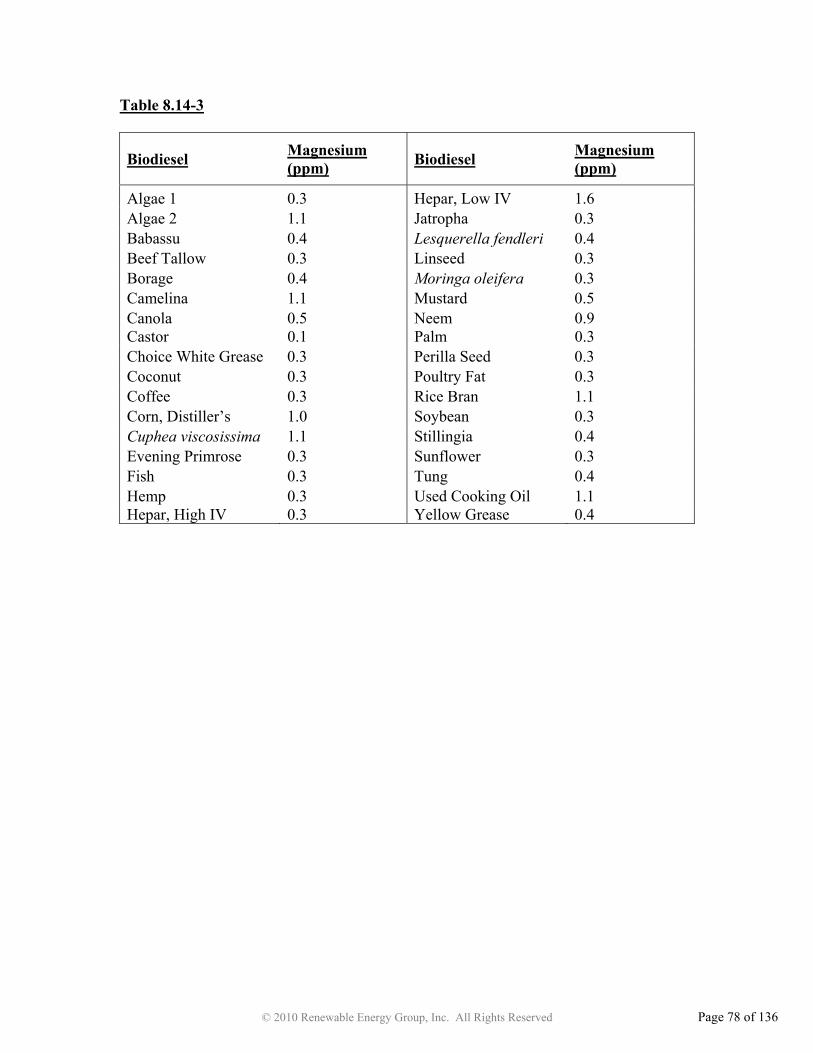
© 2010 Renewable Energy Group, Inc. All Rights Reserved Page 78 of 136
Table 8.14-3
Biodiesel Magnesium (ppm) Biodiesel Magnesium
(ppm)
Algae 1 0.3 Hepar, Low IV 1.6 Algae 2 1.1 Jatropha 0.3 Babassu 0.4 Lesquerella fendleri 0.4 Beef Tallow 0.3 Linseed 0.3 Borage 0.4 Moringa oleifera 0.3 Camelina 1.1 Mustard 0.5 Canola 0.5 Neem 0.9 Castor 0.1 Palm 0.3 Choice White Grease 0.3 Perilla Seed 0.3 Coconut 0.3 Poultry Fat 0.3 Coffee 0.3 Rice Bran 1.1 Corn, Distiller’s 1.0 Soybean 0.3 Cuphea viscosissima 1.1 Stillingia 0.4 Evening Primrose 0.3 Sunflower 0.3 Fish 0.3 Tung 0.4 Hemp 0.3 Used Cooking Oil 1.1 Hepar, High IV 0.3 Yellow Grease 0.4
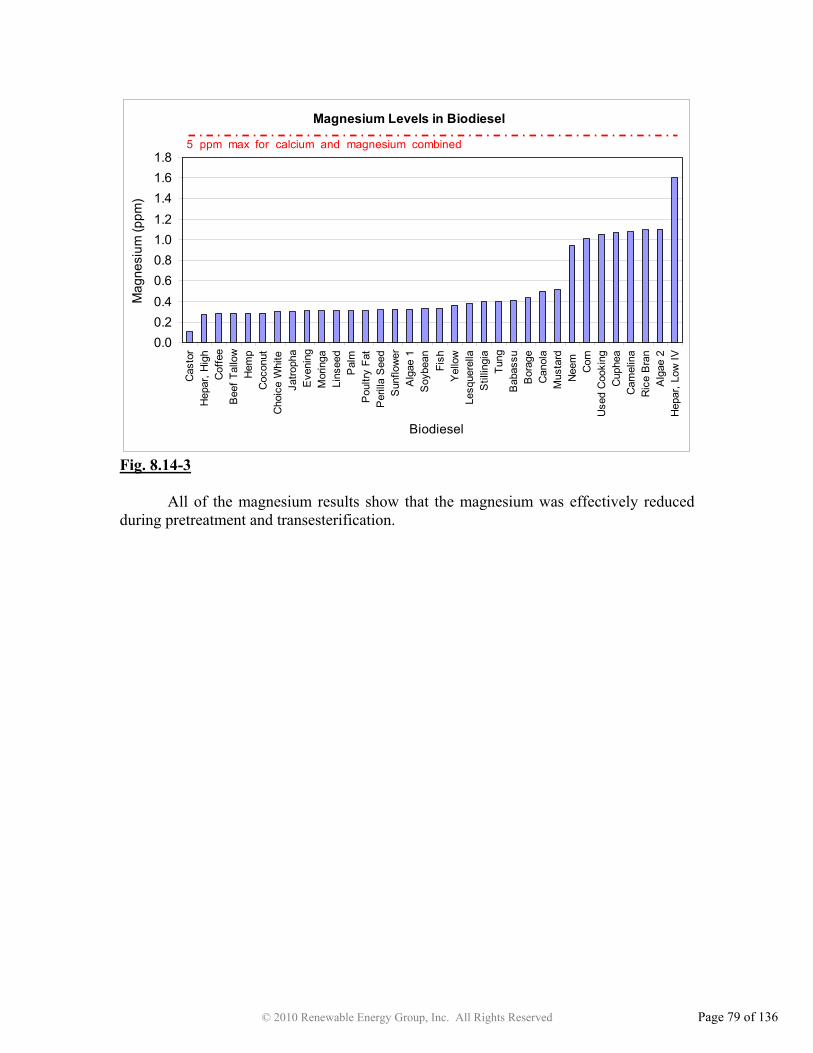
© 2010 Renewable Energy Group, Inc. All Rights Reserved Page 79 of 136
Magnesium Levels in Biodiesel
0.00.20.40.60.81.01.21.41.61.8
Cas
tor
Hep
ar, H
igh
Cof
fee
Bee
f Tal
low
Hem
pC
ocon
utC
hoic
e W
hite
Jatro
pha
Eve
ning
Mor
inga
Lins
eed
Pal
mP
oultr
y Fa
tP
erill
a S
eed
Sun
flow
erA
lgae
1S
oybe
anFi
shY
ello
wLe
sque
rella
Stil
lingi
aTu
ngB
abas
suB
orag
eC
anol
aM
usta
rdN
eem
C
orn
Use
d C
ooki
ngC
uphe
aC
amel
ina
Ric
e B
ran
Alg
ae 2
Hep
ar, L
ow IV
Biodiesel
Mag
nesi
um (p
pm)
5 ppm max for calcium and magnesium combined
Fig. 8.14-3
All of the magnesium results show that the magnesium was effectively reduced during pretreatment and transesterification.

© 2010 Renewable Energy Group, Inc. All Rights Reserved Page 80 of 136
8.15 Total Acid Number (TAN)
The TAN determination is an important test to assess the quality of a particular biodiesel. It can indicate the degree of hydrolysis of the methyl ester, a particularly important aspect when considering storage and transportation as large quantities of free fatty acids can cause corrosion in tanks.55 Materials and Methods
The TAN determination in the biodiesel samples was performed following ASTM D664 Standard Test Method for Acid Number of Petroleum Products by Potentiometric Titration, Method A.18 The tests were performed on an 836 Titrando titrator, manufactured by Metrohm Inc., and a Dosino dispensing unit. Results and Discussion Table 8.15-1
Biodiesel Total Acid Number (mg KOH/g)
Biodiesel Total Acid Number (mg KOH/g)
Algae 1 0.022 Hepar, Low IV 0.165 Algae 2 0.003 Jatropha 0.156 Babassu 0.431 Lesquerella fendleri 0.630 Beef Tallow 0.147 Linseed 0.058 Borage 0.138 Moringa oleifera 0.185 Camelina 0.338 Mustard 0.037 Canola 0.010 Neem 0.649 Castor 0.996 Palm 0.046 Choice White Grease 0.021 Perilla Seed 0.293 Coconut 0.106 Poultry Fat 0.044 Coffee 0.076 Rice Bran 0.586 Corn, Distiller’s 0.283 Soybean 0.266 Cuphea viscosissima 2.141 Stillingia 0.708 Evening Primrose 0.370 Sunflower 0.027 Fish 0.085 Tung 0.001 Hemp 0.097 Used Cooking Oil 0.332 Hepar, High IV 0.062 Yellow Grease 0.073

© 2010 Renewable Energy Group, Inc. All Rights Reserved Page 81 of 136
Biodiesel Total Acid Number (TAN)
0.0
0.5
1.0
1.5
2.0
2.5Tu
ngA
lgae
2C
anol
aC
hoic
e W
hite
Gre
ase
Alg
ae 1
Sun
flow
erM
usta
rdP
oultr
y Fa
tP
alm
Lins
eed
Hep
ar, H
igh
IVY
ello
w G
reas
eC
offe
eFi
shH
emp
Coc
onut
Bor
age
Bee
f Tal
low
Jatro
pha
Hep
ar, L
ow IV
Mor
inga
Ole
ifera
Soy
bean
Cor
nP
erill
a S
eed
Use
d C
ooki
ng O
ilC
amel
ina
Eve
ning
Prim
rose
Bab
assu
Ric
e B
ran
Lesq
uere
lla F
endl
eri
Nee
mS
tillin
gia
Cas
tor
Cup
hea
Vis
cosi
ssim
a
Biodiesel
TAN
(mg
KO
H/g
)
0.50 mg KOH/g max
Fig. 8.15-1 Most of the biodiesel are within specification as they fall under the ASTM limit for TAN (0.5 mg KOH/g).33 Rice bran, Lesquerella, neem, stillingia, castor and Cuphea, all had values that were higher than 0.5 mg KOH/g. Reasons for high total acid numbers in some biodiesels were not investigated further.

© 2010 Renewable Energy Group, Inc. All Rights Reserved Page 82 of 136
8.16 Moisture Materials and Methods
The moisture in the biodiesels was measured in accordance with ASTM E203 Standard Test Method for Water Using Volumetric Karl Fischer Titration17 on a volumetric Titrando manufactured by Metrohm, Inc. Results and Discussion Table 8.16-1
Biodiesel Moisture (wt %) Biodiesel Moisture (wt %)
Algae 1 0.037 Hepar, Low IV 0.026 Algae 2 0.026 Jatropha 0.022 Babassu 0.040 Lesquerella fendleri 0.073 Beef Tallow 0.038 Linseed 0.042 Borage 0.041 Moringa oleifera 0.060 Camelina 0.040 Mustard 0.021 Canola 0.036 Neem 0.036 Castor 0.053 Palm 0.083 Choice White Grease 0.026 Perilla Seed 0.042 Coconut 0.034 Poultry Fat 0.052 Coffee 0.030 Rice Bran 0.015 Corn, Distiller’s 0.032 Soybean 0.035 Cuphea viscosissima 0.050 Stillingia 0.052 Evening Primrose 0.031 Sunflower 0.032 Fish 0.056 Tung 0.067 Hemp 0.031 Used Cooking Oil 0.038 Hepar, High IV 0.024 Yellow Grease 0.036
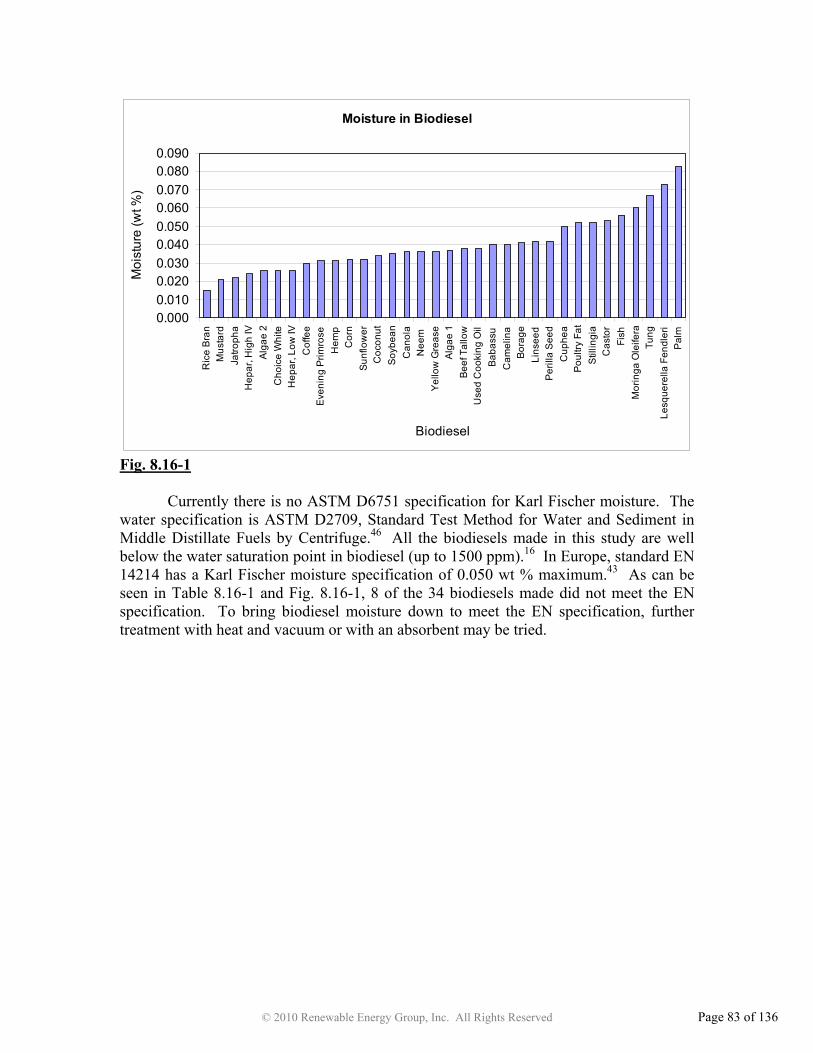
© 2010 Renewable Energy Group, Inc. All Rights Reserved Page 83 of 136
Moisture in Biodiesel
0.0000.0100.0200.0300.0400.0500.0600.0700.0800.090
Ric
e Br
anM
usta
rdJa
troph
aH
epar
, Hig
h IV
Alga
e 2
Cho
ice
Whi
teH
epar
, Low
IVC
offe
eEv
enin
g Pr
imro
seH
emp
Cor
nSu
nflo
wer
Coc
onut
Soy
bean
Can
ola
Nee
m
Yel
low
Gre
ase
Alga
e 1
Beef
Tal
low
Use
d C
ooki
ng O
ilBa
bass
uC
amel
ina
Bora
geLi
nsee
dP
erill
a S
eed
Cup
hea
Pou
ltry
Fat
Stil
lingi
aC
asto
rFi
shM
orin
ga O
leife
raTu
ngLe
sque
rella
Fen
dler
iP
alm
Biodiesel
Moi
stur
e (w
t %)
Fig. 8.16-1
Currently there is no ASTM D6751 specification for Karl Fischer moisture. The water specification is ASTM D2709, Standard Test Method for Water and Sediment in Middle Distillate Fuels by Centrifuge.46 All the biodiesels made in this study are well below the water saturation point in biodiesel (up to 1500 ppm).16 In Europe, standard EN 14214 has a Karl Fischer moisture specification of 0.050 wt % maximum.43 As can be seen in Table 8.16-1 and Fig. 8.16-1, 8 of the 34 biodiesels made did not meet the EN specification. To bring biodiesel moisture down to meet the EN specification, further treatment with heat and vacuum or with an absorbent may be tried.

© 2010 Renewable Energy Group, Inc. All Rights Reserved Page 84 of 136
8.17 Sulfur
In 2006, the U.S. Environmental Protection Agency mandated all on-road diesel fuel to have less than 15 ppm of sulfur. Beginning in 2010, off-road, locomotive, and marine fuels will begin to have a specification of less than 15 ppm sulfur for all No.1 and No.2 diesel fuel in the United States, with some rules being implemented over time.16
Materials and Methods
Sulfur was measured using ASTM D7039, Standard Test Method for Sulfur in Gasoline and Diesel Fuel by Monochromatic Wavelength Dispersive X-ray Fluorescence Spectrometry.32 A Sindie Bio Bench Top sulfur analyzer manufactured by X-Ray Optical Systems, Inc. was used to measure the amount of sulfur. Results and Discussion Table 8.17-1
Biodiesel Sulfur (ppm) Biodiesel Sulfur (ppm)
Algae 1 5.1 Hepar, Low IV 3.1 Algae 2 0.6 Jatropha 1.2 Babassu 5.3 Lesquerella fendleri 180.0 Beef Tallow 7.0 Linseed 1.9 Borage 1.3 Moringa oleifera 9.9 Camelina 0.6 Mustard 0.9 Canola 1.4 Neem 473.8 Castor 1.3 Palm 1.2 Choice White Grease 5.4 Perilla Seed 1.5 Coconut 3.2 Poultry Fat 21.1 Coffee 9.7 Rice Bran 6.0 Corn, Distiller’s 4.6 Soybean 0.8 Cuphea viscosissima Not enough sample Stillingia 1.5 Evening Primrose 1.1 Sunflower 0.2 Fish 9.3 Tung 13.3 Hemp 0.4 Used Cooking Oil 2.4 Hepar, High IV 3.4 Yellow Grease 6.2
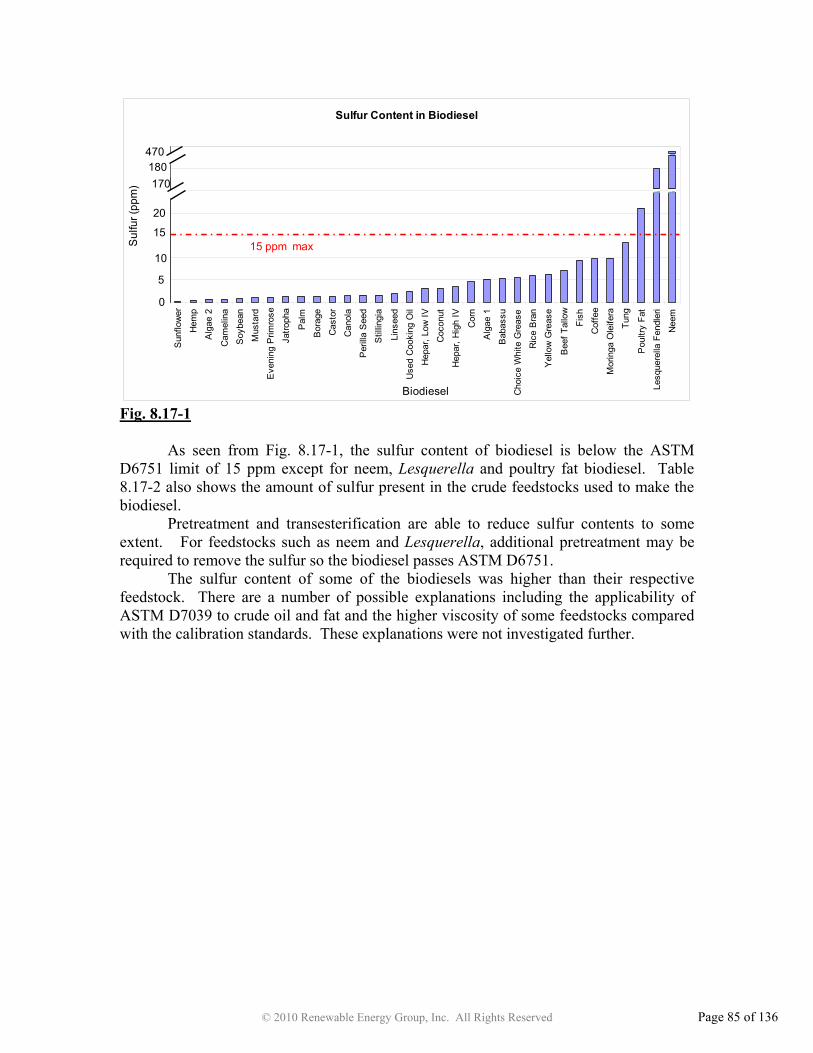
© 2010 Renewable Energy Group, Inc. All Rights Reserved Page 85 of 136
Sulfur Content in Biodiesel
470180170
20
15
10
5
0
Sun
flow
er
Hem
p
Alg
ae 2
Cam
elin
a
Soy
bean
Mus
tard
Eve
ning
Prim
rose
Jatro
pha
Pal
m
Bor
age
Cas
tor
Can
ola
Per
illa
See
d
Stil
lingi
a
Lins
eed
Use
d C
ooki
ng O
il
Hep
ar, L
ow IV
Coc
onut
Hep
ar, H
igh
IV
Cor
n
Alg
ae 1
Bab
assu
Cho
ice
Whi
te G
reas
e
Ric
e B
ran
Yel
low
Gre
ase
Bee
f Tal
low
Fish
Cof
fee
Mor
inga
Ole
ifera
Tung
Pou
ltry
Fat
Lesq
uere
lla F
endl
eri
Nee
m
Biodiesel
Sul
fur (
ppm
)
15 ppm max
Fig. 8.17-1
As seen from Fig. 8.17-1, the sulfur content of biodiesel is below the ASTM D6751 limit of 15 ppm except for neem, Lesquerella and poultry fat biodiesel. Table 8.17-2 also shows the amount of sulfur present in the crude feedstocks used to make the biodiesel.
Pretreatment and transesterification are able to reduce sulfur contents to some extent. For feedstocks such as neem and Lesquerella, additional pretreatment may be required to remove the sulfur so the biodiesel passes ASTM D6751. The sulfur content of some of the biodiesels was higher than their respective feedstock. There are a number of possible explanations including the applicability of ASTM D7039 to crude oil and fat and the higher viscosity of some feedstocks compared with the calibration standards. These explanations were not investigated further.
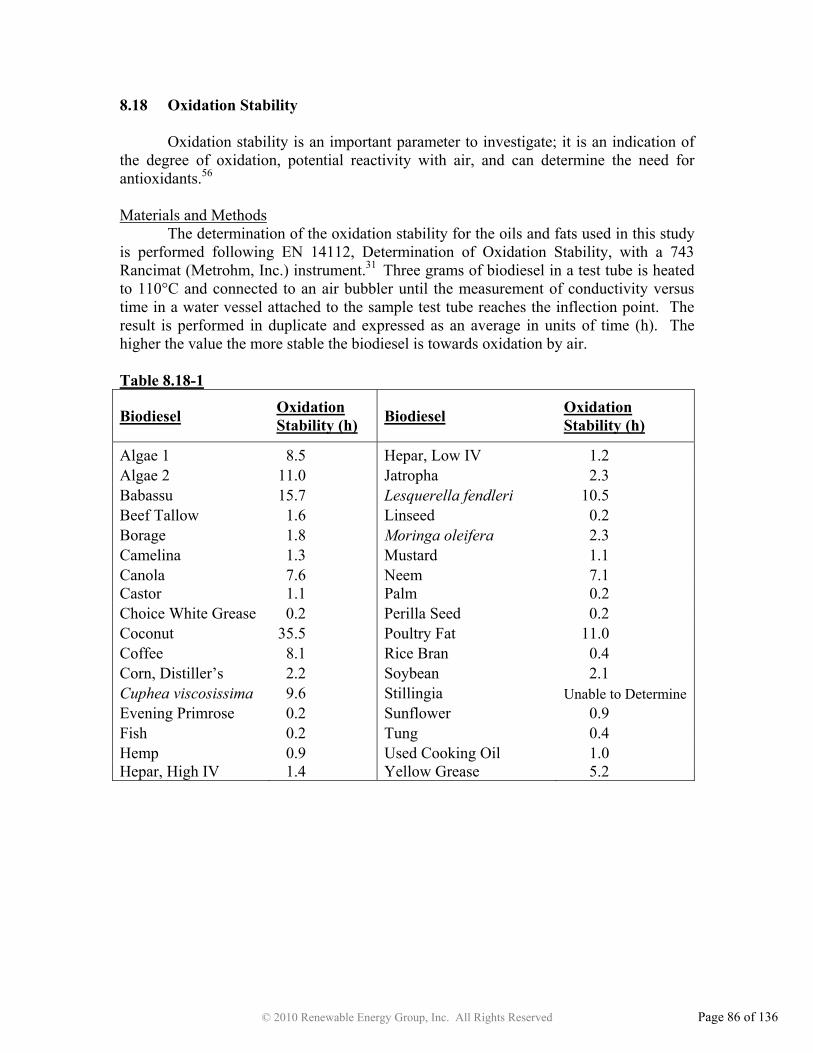
© 2010 Renewable Energy Group, Inc. All Rights Reserved Page 86 of 136
8.18 Oxidation Stability Oxidation stability is an important parameter to investigate; it is an indication of the degree of oxidation, potential reactivity with air, and can determine the need for antioxidants.56 Materials and Methods
The determination of the oxidation stability for the oils and fats used in this study is performed following EN 14112, Determination of Oxidation Stability, with a 743 Rancimat (Metrohm, Inc.) instrument.31 Three grams of biodiesel in a test tube is heated to 110°C and connected to an air bubbler until the measurement of conductivity versus time in a water vessel attached to the sample test tube reaches the inflection point. The result is performed in duplicate and expressed as an average in units of time (h). The higher the value the more stable the biodiesel is towards oxidation by air. Table 8.18-1
Biodiesel Oxidation Stability (h) Biodiesel Oxidation
Stability (h)
Algae 1 8.5 Hepar, Low IV 1.2 Algae 2 11.0 Jatropha 2.3 Babassu 15.7 Lesquerella fendleri 10.5 Beef Tallow 1.6 Linseed 0.2 Borage 1.8 Moringa oleifera 2.3 Camelina 1.3 Mustard 1.1 Canola 7.6 Neem 7.1 Castor 1.1 Palm 0.2 Choice White Grease 0.2 Perilla Seed 0.2 Coconut 35.5 Poultry Fat 11.0 Coffee 8.1 Rice Bran 0.4 Corn, Distiller’s 2.2 Soybean 2.1 Cuphea viscosissima 9.6 Stillingia Unable to Determine Evening Primrose 0.2 Sunflower 0.9 Fish 0.2 Tung 0.4 Hemp 0.9 Used Cooking Oil 1.0 Hepar, High IV 1.4 Yellow Grease 5.2
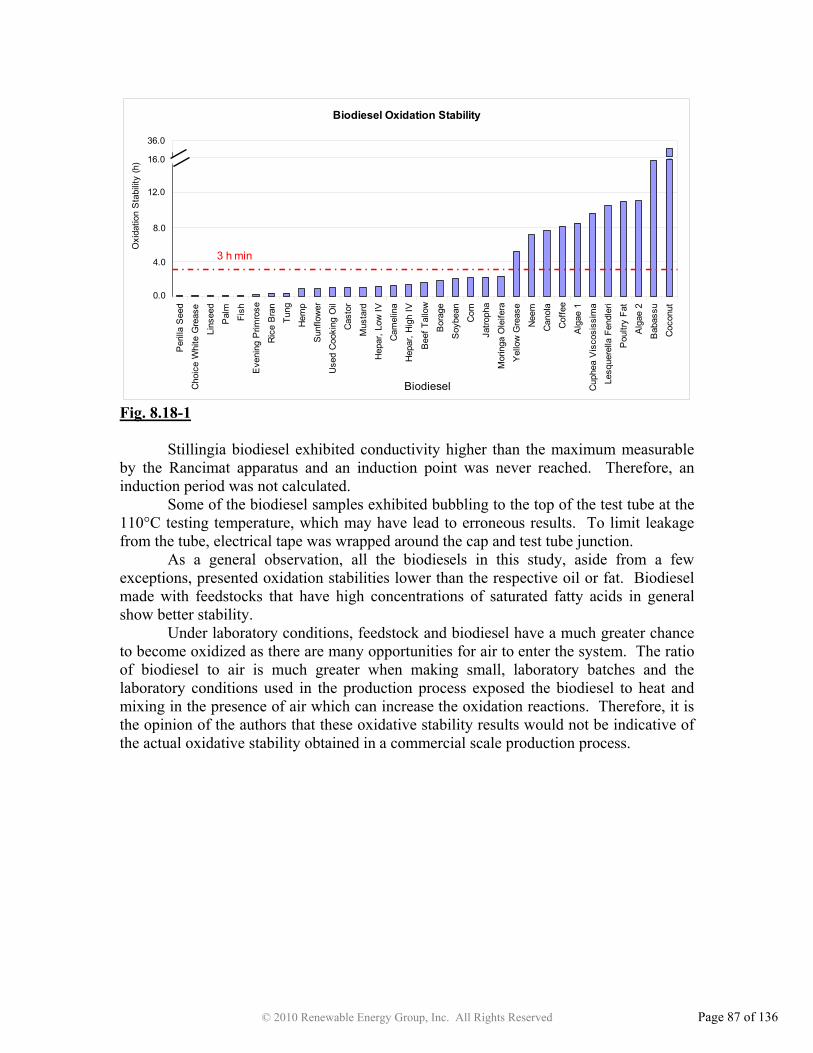
© 2010 Renewable Energy Group, Inc. All Rights Reserved Page 87 of 136
Biodiesel Oxidation Stability
0.0
36.0
16.0
12.0
8.0
4.0
Per
illa
See
d
Cho
ice
Whi
te G
reas
e
Lins
eed
Pal
m
Fish
Eve
ning
Prim
rose
Ric
e B
ran
Tung
Hem
p
Sun
flow
er
Use
d C
ooki
ng O
il
Cas
tor
Mus
tard
Hep
ar, L
ow IV
Cam
elin
a
Hep
ar, H
igh
IV
Bee
f Tal
low
Bor
age
Soy
bean
Cor
n
Jatro
pha
Mor
inga
Ole
ifera
Yel
low
Gre
ase
Nee
m
Can
ola
Cof
fee
Alg
ae 1
Cup
hea
Vis
cosi
ssim
a
Lesq
uere
lla F
endl
eri
Pou
ltry
Fat
Alg
ae 2
Bab
assu
Coc
onut
Biodiesel
Oxi
datio
n S
tabi
lity
(h)
3 h min
Fig. 8.18-1 Stillingia biodiesel exhibited conductivity higher than the maximum measurable by the Rancimat apparatus and an induction point was never reached. Therefore, an induction period was not calculated.
Some of the biodiesel samples exhibited bubbling to the top of the test tube at the 110°C testing temperature, which may have lead to erroneous results. To limit leakage from the tube, electrical tape was wrapped around the cap and test tube junction.
As a general observation, all the biodiesels in this study, aside from a few exceptions, presented oxidation stabilities lower than the respective oil or fat. Biodiesel made with feedstocks that have high concentrations of saturated fatty acids in general show better stability.
Under laboratory conditions, feedstock and biodiesel have a much greater chance to become oxidized as there are many opportunities for air to enter the system. The ratio of biodiesel to air is much greater when making small, laboratory batches and the laboratory conditions used in the production process exposed the biodiesel to heat and mixing in the presence of air which can increase the oxidation reactions. Therefore, it is the opinion of the authors that these oxidative stability results would not be indicative of the actual oxidative stability obtained in a commercial scale production process.

© 2010 Renewable Energy Group, Inc. All Rights Reserved Page 88 of 136
8.19 FTIR
FTIR (Fourier Transform Infra Red) is used to examine the functional groups of molecules. It does this by measuring the energy associated with the vibration of atoms that are connected together. FTIR has been used to elucidate structures in biodiesel and oleochemicals. AOCS Methods Cd 14-95 (00) and Cd 14d-99 (99) quantify the amount of trans acids in fats, oils and oleochemicals by FTIR.57,58 ASTM D7371 uses FTIR to determine the amount of biodiesel in blended fuels.59 Material at or less than 1 wt % may not be detectable by FTIR. Materials and Methods
The FTIR of the finished biodiesel samples were made with a PerkinElmer Inc. 100 spectrometer with attenuated total reflectance (ATR) sampling attachment and a resolution of 4° per cm-1. The spectra were taken at room temperature and in a range of 4000 – 650 cm-1. Air spectrum was used as the background. Results and Discussion
For biodiesel, the FTIR spectra is characterized by a series of peaks from 3100 cm-1 to 2750 cm-1, a strong peak from 1745 cm-1 to 1740 cm-1, a series of peaks from 1470 cm-1 to 1430 cm-1, a peak at 1360 cm-1, as well as a series of peaks from 1220 cm-1 to 1160 cm-1, 1020 cm-1 to 970 cm-1, 920 cm-1 to 840 cm-1, and a peak at 720 cm-1. These peaks are characteristic of the long chain fatty acid methyl esters which predominate in biodiesel.
Differences in the amount of unsaturation in biodiesel are responsible for variations in smaller peaks in the 1660 cm-1 and 1400 cm-1 region and for biodiesel high in methyl linoleate in the 790 cm-1 region.
The 1745 cm-1 to 1740 cm-1 peak is due to the carbonyl (C=O) of the ester group. This peak is not symmetrical. It has a series of shoulders at 1740 cm-1 to 1730 cm-1 associated with monoglycerides and 1720 cm-1 to 1710 cm-1 associated with free fatty acids.
The major differences seen in the FTIR between the feedstocks are in castor and Lesquerella biodiesel. The differences in the FTIR are similar for both of these biodiesels and are due to the presence of hydroxy esters. The presence of hydroxy esters adds a wide absorbance in the 3460 cm-1 region, a large absorbance in the 860 cm-1 region, and the region between 1100-950 cm-1 is different from other fatty acid methyl esters.
The castor biodiesel also has a very unsymmetrical carbonyl absorbance at 1742 cm-1. There is a large shoulder at 1740 cm-1. This shoulder is probably a carbonyl absorbance from an ester other than a methyl ester. It is probably not due to glycerides since it occurs at a higher wave number than is expected for the glycerides. Other biodiesels with similar glyceride contents do not exhibit this shoulder.
The FTIR of tung biodiesel also showed differences with an absorbance at 1585 cm-1 as well as at 992 cm-1 and 964 cm-1. These absorbances are most likely due to the unique fatty acid methyl ester found in tung biodiesel, methyl "-eleostearate. The absorbances at 992 cm-1 and 964 cm-1 may be due to the large quantity of trans double
© 2010 Renewable Energy Group, Inc. All Rights Reserved Page 89 of 136
bonds present in tung biodiesel. The fish oil biodiesel also has a prominent absorbance at 992 cm-1, possibly indicating the presence of trans double bonds.
The FTIR of biodiesels from a variety of feedstocks from vegetable and animal origins are very similar. They can be recognized as being fatty acid methyl esters. Differences in unsaturation and the amount of trans double bonds are noticeable. The detection of fatty acid methyl ester with other functional groups can be readily discerned. The presence of some minor components can also be detected and sometimes quantified.

© 2010 Renewable Energy Group, Inc. All Rights Reserved Page 90 of 136
9 Feedstock Supplier Information Botanic Oil Innovations, Inc. 1540 South River Street Spooner, WI 54801 Phone: (715) 635-7513 Fax: (715) 635-7519 Homepage: www.botanicoil.com Jedwards International, Inc. 39 Broad Street Quincy, MA 02169 Phone: (617) 472-9300 Fax: (617) 472-9359 Homepage: www.bulknaturaloils.com National Center for Agricultural Utilization Research (NCAUR) Steven C. Cermak New Crops and Processing Technology Research Unit 1815 N. University Peoria, IL 61604 Oils by Nature, Inc. 30300 Solon Industrial Parkway, Suite E Solon, Ohio 44139 Phone: (440) 498-1180 Fax: (440) 498-0574 Homepage: www.oilsbynature.com School of Plant, Environmental, and Soil Sciences (SPESS) Louisiana State University AgCenter Gary Breitenbeck 314 M. B. Sturgis Baton Rouge, LA 70803 Phone: (225) 578-1362 Sigma-Aldrich Corp. 3050 Spruce Street St. Louis, MO 63103 Phone: (314) 771-5765 Homepage: www.sigmaaldrich.com/united-states.html
© 2010 Renewable Energy Group, Inc. All Rights Reserved Page 91 of 136
Solazyme, Inc. 561 Eccles Ave. South San Francisco, CA 94080 Phone: (650) 780-4777 Fax: (650) 989-6700 Technology Crops International PO Box 11925 Winston-Salem, NC 27116 Toll free: (877) 780-5882 Fax: (336) 759-9406 The Ahimsa Alternative, Inc. 15 Timberglade Rd. Bloomington, MN 55437 Phone: (877)-873-6336 Fax: (866) 211-5460 Homepage: www.neemresource.com Wildlife Sciences David Pichotta 4268 Norex Dr. Chaska, MN 55318 Phone: (888) 316-2473 Fax: (952) 368-4234 Homepage: www.suetplus.com P

© 2010 Renewable Energy Group, Inc. All Rights Reserved Page 92 of 136
10 Biodiesel Certificates of Analysis

© 2010 Renewable Energy Group, Inc. All Rights Reserved Page 93 of 136
10.1 Algae 1
Units
-5.2 (22.64) °C (°F)
°C
% Mass
% Mass
% Mass
% Mass
% Mass
% Volume
mg KOH/g
Haze
N/A
hrs
°C
% Mass
seconds
ppm
ppm (ug/g)
ppm (ug/g)
% Mass
% Mass
% Mass
mm²/sec.
N/A1,2,3,4,5 These are not ASTM D 6751 specification requirements.
Units%%%%%%%%%%%%%%%%%%%%%%%%%
Biodiesel Certificate of Analysis
N/A
N/A
93 min.
D 4176, Procedure 2
D 6584
D 6584
D 6584
0.050 max.
Product Type: B100
CFPP¹: -7
D 2500
N/A
Test Method (current revision)
N/A D 6371
ASTM Limit
Report
0.020 max.
0.240 max.
N/A
D 6584
Monoglycerides²:
Test Parameter
Cloud point:
Feedstock:
ASTM D 6751 Analysis of Biodiesel
Free Glycerin:
Total Glycerin:
Algae 1
Acid Number:
Visual Inspection:
Water & Sediment:
Triglycerides4:
Diglycerides³:
Flashpoint (closed cup):
Moisture5:
< 0.0050.020
Oxidative Stability (110 °C):
Relative Density at 60 °F:
0.022
10.8780
Magnesium:
Phosphorus:
Calcium:
D 6751 Annex
D 7039
5 max. Ca+Mg
5 max. Ca+Mg
EN 14538
Sulfated Ash:
360
0.020 max.
5.1
0.007<0.005
Cold Soak Filtration:
Sulfur: 15
0.001 max.
N/A D 1298
EN 14110
D 93
EN 14538
1.9-6.0
E 203
3 min.
0.050 max.
No. 3 max.
4.519
D 4951
Carbon Residue:
Copper Corrosion (3 hrs at 50 °C): D 130
D 445Kinematic Viscosity at 40 °C:
D 524
D 874
D 664, Test Method A
Result
0.0090.091
0.2650.078 D 6584
D 2709
0.50 max.
N/A
8.5> 160
<0.1
1a
<0.1
0.03785
0.3
Fatty Acid Profile Analysis of Biodiesel
AOCS Ce1c-89
Test Parameter Name Result Test Method C8:0 AOCS Ce1c-89Caprylic
AOCS Ce1c-89
C14:0 0.6 AOCS Ce1c-89MyristicLauric
C10:0 Capric
C15:0 Pentadecanoic
C12:0
AOCS Ce1c-89
AOCS Ce1c-89
C16:0 Palmitic 6.9 AOCS Ce1c-89C16:1 0.2 AOCS Ce1c-89Palmitoleic
AOCS Ce1c-89
C18:0 3.0 AOCS Ce1c-89StearicMargaroleic
C17:0 Margaric
C18:1 Oleic 75.2
C17:1
AOCS Ce1c-89
AOCS Ce1c-89
C18:1-9c,12(OH) Ricinoleic AOCS Ce1c-89C18:2 12.4 AOCS Ce1c-89Linoleic
AOCS Ce1c-89
C20:0 0.4 AOCS Ce1c-89Arachidic"-Eleostearic
C18:3 Linolenic 1.2
C20:1 Gadoleic
C18:3-9c,11t,13t
AOCS Ce1c-89C20:1-11c,14(OH) Lesquerolic AOCS Ce1c-89
AOCS Ce1c-89Eicosadienoic
C22:0 Behenic 0.1 AOCS Ce1c-89
C20:2 AOCS Ce1c-89
C24:0 Lignoceric
C20:5 Timnodonic
C22:1 Erucic AOCS Ce1c-89AOCS Ce1c-89
UNKNOWNS AOCS Ce1c-89C24:1 Nervonic AOCS Ce1c-89
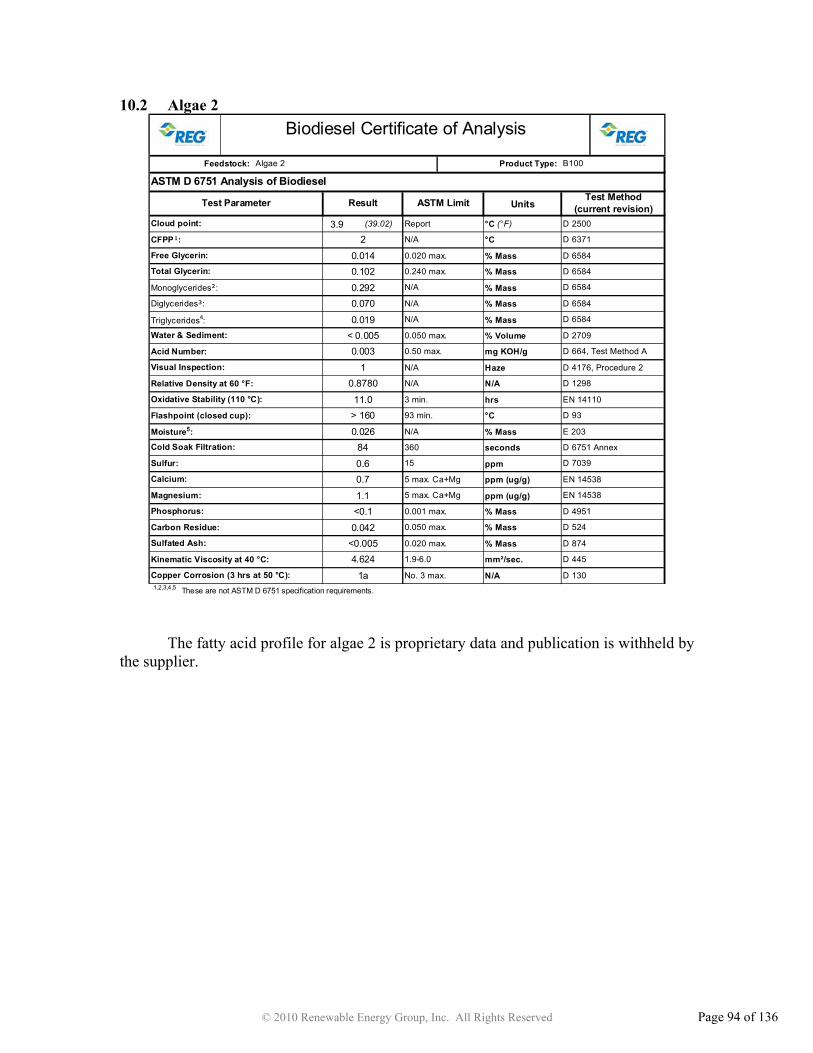
© 2010 Renewable Energy Group, Inc. All Rights Reserved Page 94 of 136
10.2 Algae 2
The fatty acid profile for algae 2 is proprietary data and publication is withheld by the supplier.
Units
3.9 (39.02) °C (°F)
°C
% Mass
% Mass
% Mass
% Mass
% Mass
% Volume
mg KOH/g
Haze
N/A
hrs
°C
% Mass
seconds
ppm
ppm (ug/g)
ppm (ug/g)
% Mass
% Mass
% Mass
mm²/sec.
N/A1,2,3,4,5 These are not ASTM D 6751 specification requirements.
84
D 664, Test Method A
Result
D 6584
D 2709
0.50 max.0.003
0.050 max.
0.240 max.
N/A
0.026
> 16011.0
0.8780
1.9-6.0
No. 3 max.
Kinematic Viscosity at 40 °C:
Copper Corrosion (3 hrs at 50 °C): D 1301a
4.624
D 6751 Annex
D 7039
D 4951
D 445
EN 14538
D 524
D 874
93 min.
3 min.
N/A
5 max. Ca+Mg
360
E 203
Carbon Residue:
Oxidative Stability (110 °C):
1
EN 14538
15
0.001 max.
5 max. Ca+Mg
N/A
N/A
D 1298
EN 14110
D 4176, Procedure 2
D 93
0.020 max.
Cold Soak Filtration:
Sulfur:
<0.0050.042
<0.10.050 max.
1.1
0.70.6
Relative Density at 60 °F:
Sulfated Ash:
Phosphorus:
Calcium:
Flashpoint (closed cup):
Moisture5:
Magnesium:
Water & Sediment:
Triglycerides4:
Acid Number:
Visual Inspection:
< 0.0050.019
0.0700.292
Test Parameter
Cloud point:
Feedstock:
ASTM D 6751 Analysis of BiodieselAlgae 2
Biodiesel Certificate of Analysis
ASTM Limit
Product Type:
D 6584
Test Method (current revision)
B100
N/A
CFPP¹: N/A D 6371
D 6584
2
D 6584
D 6584
Monoglycerides²:
N/A
Free Glycerin: 0.020 max.
D 2500
Diglycerides³:
Report
Total Glycerin: 0.1020.014

© 2010 Renewable Energy Group, Inc. All Rights Reserved Page 95 of 136
10.3 Babassu
Units
4.0 (39.2) °C (°F)
°C
% Mass
% Mass
% Mass
% Mass
% Mass
% Volume
mg KOH/g
Haze
N/A
hrs
°C
% Mass
seconds
ppm
ppm (ug/g)
ppm (ug/g)
% Mass
% Mass
% Mass
mm²/sec.
N/A1,2,3,4,5 These are not ASTM D 6751 specification requirements.
Units%%%%%%%%%%%%%%%%%%%%%%%%%
0.040
D 6584
D 6584
134.715.7
0.87601
N/A
D 4176, Procedure 2
D 93
CFPP¹: N/A
Result
D 6371
ASTM Limit
Report D 2500
Test Method (current revision)Test Parameter
Cloud point:
Feedstock:
ASTM D 6751 Analysis of BiodieselProduct Type: B100Babassu
Water & Sediment:
0.008
10
0.431< 0.0050.038
0.231
Triglycerides4:
Diglycerides³:
Monoglycerides²:
Oxidative Stability (110 °C):
Free Glycerin:
Total Glycerin:
Phosphorus:
Calcium:
Flashpoint (closed cup):
Moisture5:
Acid Number:
Visual Inspection:
Relative Density at 60 °F:
Sulfated Ash:
360
0.020 max.
Cold Soak Filtration:
Sulfur:
<0.0050.050
<0.10.050 max.
Magnesium:
5 max. Ca+Mg
N/A
N/A
93 min.
Carbon Residue:
E 203
N/A
5 max. Ca+Mg
D 6751 Annex
D 7039
D 1298
EN 14110
15
0.001 max.
D 524
D 874
EN 14538
1.9-6.0
D 4951
D 2709
0.50 max.
N/A
0.050 max.
N/A
D 6584
0.341
0.135
D 6584
Copper Corrosion (3 hrs at 50 °C): D 1301a
3.239 D 445
No. 3 max.
Kinematic Viscosity at 40 °C:
D 65840.020 max.
0.4
0.55.3
310
D 664, Test Method A
EN 14538
3 min.
0.240 max.
Fatty Acid Profile Analysis of BiodieselTest Parameter Name Result Test Method
C8:0 0.5 AOCS Ce1c-89C10:0 Capric 3.8 AOCS Ce1c-89
Caprylic
AOCS Ce1c-89
C12:0 Lauric 48.8 AOCS Ce1c-89C14:0 17.2 AOCS Ce1c-89Myristic
C16:0AOCS Ce1c-89
C16:1 AOCS Ce1c-89PalmitoleicPalmitic 9.7
C15:0 Pentadecanoic
C17:0 Margaric AOCS Ce1c-89
AOCS Ce1c-89
C17:1 Margaroleic AOCS Ce1c-89C18:0 4.0 AOCS Ce1c-89Stearic
C18:1-9c,12(OH)AOCS Ce1c-89
C18:2 1.8 AOCS Ce1c-89LinoleicRicinoleic
C18:1 Oleic 14.2
C18:3 Linolenic AOCS Ce1c-89
AOCS Ce1c-89
C18:3-9c,11t,13t "-Eleostearic AOCS Ce1c-89C20:0 AOCS Ce1c-89Arachidic
C20:1-11c,14(OH)AOCS Ce1c-89
C20:2 AOCS Ce1c-89EicosadienoicLesquerolic
C20:1 Gadoleic
C20:5 Timnodonic AOCS Ce1c-89AOCS Ce1c-89
C22:1 Erucic AOCS Ce1c-89C22:0 Behenic
C24:0 Lignoceric AOCS Ce1c-89
Biodiesel Certificate of Analysis
UNKNOWNS AOCS Ce1c-89C24:1 Nervonic AOCS Ce1c-89

© 2010 Renewable Energy Group, Inc. All Rights Reserved Page 96 of 136
10.4 Beef Tallow
Units
16.0 (60.8) °C (°F)
°C
% Mass
% Mass
% Mass
% Mass
% Mass
% Volume
mg KOH/g
Haze
N/A
hrs
°C
% Mass
seconds
ppm
ppm (ug/g)
ppm (ug/g)
% Mass
% Mass
% Mass
mm²/sec.
N/A1,2,3,4,5 These are not ASTM D 6751 specification requirements.
Units%%%%%%%%%%%%%%%%%%%%%%%%%UNKNOWNS 0.5 AOCS Ce1c-89
C24:1 Nervonic AOCS Ce1c-89
<0.005
AOCS Ce1c-89C22:1 Erucic AOCS Ce1c-89
Timnodonic
C24:0 Lignoceric
C22:0 BehenicC20:5
AOCS Ce1c-89AOCS Ce1c-89
EicosadienoicC20:1-11c,14(OH) Lesquerolic AOCS Ce1c-89C20:2 AOCS Ce1c-89
AOCS Ce1c-89C20:1 Gadoleic 0.6 AOCS Ce1c-89
Arachidic
Linolenic 0.7
C20:0 0.2C18:3-9c,11t,13t "-EleostearicC18:3
AOCS Ce1c-89AOCS Ce1c-89
LinoleicC18:1-9c,12(OH) Ricinoleic AOCS Ce1c-89C18:2 3.3 AOCS Ce1c-89
AOCS Ce1c-89C18:1 Oleic 40.2 AOCS Ce1c-89
Stearic
Margaric 1.2
C18:0 22.8C17:1 Margaroleic 0.4C17:0
AOCS Ce1c-89AOCS Ce1c-89
PalmitoleicC16:0 Palmitic 24.3 AOCS Ce1c-89C16:1 2.1 AOCS Ce1c-89
C14:0 2.9 AOCS Ce1c-89C15:0 Pentadecanoic 0.6 AOCS Ce1c-89
Myristic
AOCS Ce1c-89C10:0 Capric AOCS Ce1c-89
CaprylicC8:0
C12:0 Lauric 0.2 AOCS Ce1c-89
Fatty Acid Profile Analysis of BiodieselTest Parameter Name Result Test Method
D 664, Test Method A
Result
D 6584
D 2709
0.50 max.
0.0630.223
0.0760.008
14
No. 3 max.
Kinematic Viscosity at 40 °C:
Copper Corrosion (3 hrs at 50 °C): D 1301a
4.824 D 445
D 524
D 874
EN 14538
1.9-6.0
D 6751 Annex
D 7039
D 4951
0.8740
EN 14538
<0.10.3
<0.17
76
Carbon Residue:
N/A
N/A
93 min.
3 min.
0.028
1
1.6 EN 14110
D 4176, Procedure 2
D 93
E 203
Oxidative Stability (110 °C):
Sulfated Ash:
360
0.020 max.
Cold Soak Filtration:
Sulfur: 15
0.001 max.
5 max. Ca+Mg
0.050 max.
Phosphorus:
Calcium:
Flashpoint (closed cup):
Moisture5:
5 max. Ca+Mg
0.038
>160
0.050 max.< 0.0050.147
ASTM D 6751 Analysis of Biodiesel
ASTM Limit
Report
N/A
Total Glycerin:
Acid Number:
Visual Inspection:
Relative Density at 60 °F:
Water & Sediment:
D 1298
Free Glycerin: D 65840.020 max.
D 2500
Product Type:
Test Parameter
Cloud point:
Feedstock:
D 6584
Triglycerides4:
Diglycerides³:
0.240 max.
N/AMonoglycerides²:
D 6584
N/A
N/A0.000
Biodiesel Certificate of Analysis
B100
Magnesium:
Test Method (current revision)
Beef Tallow
CFPP¹: N/A D 6371
D 6584

© 2010 Renewable Energy Group, Inc. All Rights Reserved Page 97 of 136
10.5 Borage
Units
-1.3 (29.66) °C (°F)
°C
% Mass
% Mass
% Mass
% Mass
% Mass
% Volume
mg KOH/g
Haze
N/A
hrs
°C
% Mass
seconds
ppm
ppm (ug/g)
ppm (ug/g)
% Mass
% Mass
% Mass
mm²/sec.
N/A1,2,3,4,5 These are not ASTM D 6751 specification requirements.
Units%%%%%%%%%%%%%%%%%%%%%%%%%UNKNOWNS 0.8 AOCS Ce1c-89
C24:1 Nervonic AOCS Ce1c-89
<0.005
AOCS Ce1c-891.5
C22:1 Erucic 2.5 AOCS Ce1c-89
Timnodonic
C24:0 Lignoceric
C22:0 Behenic 0.2C20:5
AOCS Ce1c-89AOCS Ce1c-89
EicosadienoicC20:1-11c,14(OH) Lesquerolic AOCS Ce1c-89C20:2 AOCS Ce1c-89
AOCS Ce1c-89C20:1 Gadoleic AOCS Ce1c-89
Arachidic
Linolenic 26.1
C20:0C18:3-9c,11t,13t "-EleostearicC18:3
AOCS Ce1c-89AOCS Ce1c-89
LinoleicC18:1-9c,12(OH) Ricinoleic AOCS Ce1c-89C18:2 38.7 AOCS Ce1c-89
AOCS Ce1c-89C18:1 Oleic 17.1 AOCS Ce1c-89
Stearic
Margaric
C18:0 3.8C17:1 MargaroleicC17:0
AOCS Ce1c-89AOCS Ce1c-89
PalmitoleicC16:0 Palmitic 9.3 AOCS Ce1c-89C16:1 AOCS Ce1c-89
C14:0 AOCS Ce1c-89C15:0 Pentadecanoic AOCS Ce1c-89
Myristic
AOCS Ce1c-89C10:0 Capric AOCS Ce1c-89
CaprylicC8:0
C12:0 Lauric AOCS Ce1c-89
Fatty Acid Profile Analysis of BiodieselTest Parameter Name Result Test Method
D 664, Test Method A
Result
D 6584
D 2709
0.50 max.
0.0660.250
0.0760.001
-4
No. 3 max.
Kinematic Viscosity at 40 °C:
Copper Corrosion (3 hrs at 50 °C): D 1301a
4.083 D 445
D 524
D 874
EN 14538
1.9-6.0
D 6751 Annex
D 7039
D 4951
0.8865
EN 14538
<0.10.4
1.21.3
74
Carbon Residue:
N/A
N/A
93 min.
3 min.
0.008
1
1.8 EN 14110
D 4176, Procedure 2
D 93
E 203
Oxidative Stability (110 °C):
Sulfated Ash:
360
0.020 max.
Cold Soak Filtration:
Sulfur: 15
0.001 max.
5 max. Ca+Mg
0.050 max.
Phosphorus:
Calcium:
Flashpoint (closed cup):
Moisture5:
5 max. Ca+Mg
0.041
>160
0.050 max.< 0.0050.138
ASTM D 6751 Analysis of Biodiesel
ASTM Limit
Report
N/A
Total Glycerin:
Acid Number:
Visual Inspection:
Relative Density at 60 °F:
Water & Sediment:
D 1298
Free Glycerin: D 65840.020 max.
D 2500
Product Type:
Test Parameter
Cloud point:
Feedstock:
D 6584
Triglycerides4:
Diglycerides³:
0.240 max.
N/AMonoglycerides²:
D 6584
N/A
N/A0.000
Biodiesel Certificate of Analysis
B100
Magnesium:
Test Method (current revision)
Borage
CFPP¹: N/A D 6371
D 6584
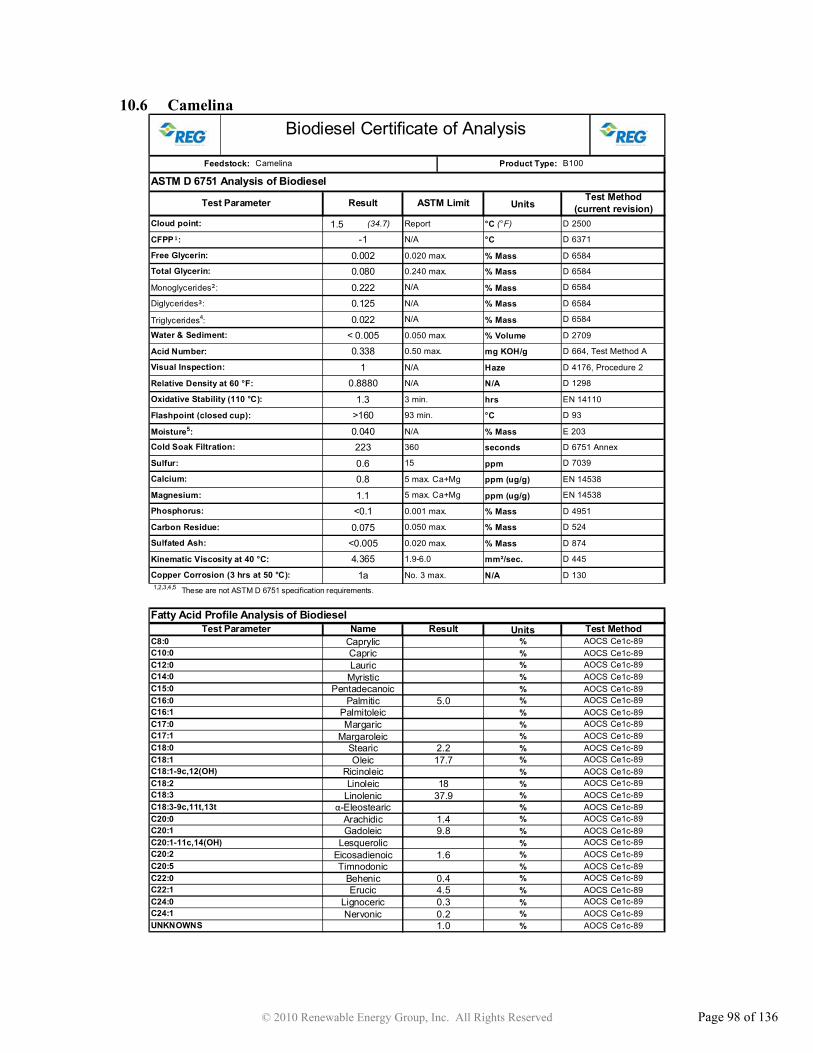
© 2010 Renewable Energy Group, Inc. All Rights Reserved Page 98 of 136
10.6 Camelina
Units
1.5 (34.7) °C (°F)
°C
% Mass
% Mass
% Mass
% Mass
% Mass
% Volume
mg KOH/g
Haze
N/A
hrs
°C
% Mass
seconds
ppm
ppm (ug/g)
ppm (ug/g)
% Mass
% Mass
% Mass
mm²/sec.
N/A1,2,3,4,5 These are not ASTM D 6751 specification requirements.
Units%%%%%%%%%%%%%%%%%%%%%%%%%
-1
>1601.3
0.88801
0.0800.002
UNKNOWNS 1.0 AOCS Ce1c-89
<0.0050.075
<0.11.1
AOCS Ce1c-89C24:0 Lignoceric 0.3 AOCS Ce1c-89
0.2C24:1 Nervonic
C22:0 Behenic 0.4 AOCS Ce1c-89C22:1 Erucic 4.5 AOCS Ce1c-89
AOCS Ce1c-89C20:5 Timnodonic AOCS Ce1c-89
Eicosadienoic
Gadoleic 9.8
C20:2 1.6C20:1-11c,14(OH) LesquerolicC20:1
AOCS Ce1c-89AOCS Ce1c-89
ArachidicC18:3-9c,11t,13t "-Eleostearic AOCS Ce1c-89C20:0 1.4 AOCS Ce1c-89
AOCS Ce1c-89C18:3 Linolenic 37.9 AOCS Ce1c-89
Linoleic
Oleic 17.7
C18:2 18C18:1-9c,12(OH) RicinoleicC18:1
AOCS Ce1c-89AOCS Ce1c-89
StearicC17:1 Margaroleic AOCS Ce1c-89C18:0 2.2 AOCS Ce1c-89
AOCS Ce1c-89C17:0 Margaric AOCS Ce1c-89
Palmitoleic
Pentadecanoic
C16:1C16:0 Palmitic 5.0C15:0
AOCS Ce1c-89AOCS Ce1c-89
MyristicC12:0 Lauric AOCS Ce1c-89C14:0 AOCS Ce1c-89
C8:0 AOCS Ce1c-89C10:0 Capric AOCS Ce1c-89
Caprylic
Fatty Acid Profile Analysis of BiodieselTest Parameter Name Result Test Method
D 664, Test Method A
Result
D 6584
D 2709
0.50 max.0.338< 0.0050.022
0.1250.222
D 1301a
4.365 D 4451.9-6.0
No. 3 max.
Kinematic Viscosity at 40 °C:
Copper Corrosion (3 hrs at 50 °C):
EN 14538
D 524
D 874
EN 14538
E 203
Carbon Residue:
N/A
N/A
93 min.
3 min.
D 6751 Annex
D 7039
D 4951
223
D 1298
EN 14110
D 4176, Procedure 2
D 93
Oxidative Stability (110 °C):
Sulfated Ash:
360
0.020 max.
Cold Soak Filtration:
Sulfur: 15
0.001 max.
5 max. Ca+Mg
0.050 max.
Phosphorus:
Calcium:
Flashpoint (closed cup):
Moisture5:
5 max. Ca+Mg
0.80.6
0.040
ASTM D 6751 Analysis of Biodiesel
ASTM Limit
Report
N/A
0.050 max.
Total Glycerin:
Acid Number:
Visual Inspection:
Relative Density at 60 °F:
Water & Sediment:
Free Glycerin: D 65840.020 max.
D 2500
Product Type:
Test Parameter
Cloud point:
Feedstock:
D 6584
Triglycerides4:
Diglycerides³:
0.240 max.
N/AMonoglycerides²:
D 6584
N/A
N/A
Biodiesel Certificate of Analysis
B100
Magnesium:
Test Method (current revision)
Camelina
CFPP¹: N/A D 6371
D 6584

© 2010 Renewable Energy Group, Inc. All Rights Reserved Page 99 of 136
10.7 Canola
Units
-3.3 (26.06) °C (°F)
°C
% Mass
% Mass
% Mass
% Mass
% Mass
% Volume
mg KOH/g
Haze
N/A
hrs
°C
% Mass
seconds
ppm
ppm (ug/g)
ppm (ug/g)
% Mass
% Mass
% Mass
mm²/sec.
N/A1,2,3,4,5 These are not ASTM D 6751 specification requirements.
Units%%%%%%%%%%%%%%%%%%%%%%%%%
< 0.0050.010
1
<0.005
0.4
0.5<0.1
0.030
UNKNOWNS AOCS Ce1c-89C24:1 Nervonic AOCS Ce1c-89
AOCS Ce1c-890.2
C22:1 Erucic AOCS Ce1c-89
Timnodonic
C24:0 Lignoceric 0.2
C22:0 Behenic 0.4C20:5
AOCS Ce1c-89AOCS Ce1c-89
EicosadienoicC20:1-11c,14(OH) Lesquerolic AOCS Ce1c-89C20:2 AOCS Ce1c-89
AOCS Ce1c-89C20:1 Gadoleic AOCS Ce1c-89
Arachidic
Linolenic 9.7
C20:0 0.6C18:3-9c,11t,13t "-EleostearicC18:3
AOCS Ce1c-89AOCS Ce1c-89
LinoleicC18:1-9c,12(OH) Ricinoleic AOCS Ce1c-89C18:2 19.0 AOCS Ce1c-89
AOCS Ce1c-89C18:1 Oleic 63.9 AOCS Ce1c-89
Stearic
Margaric
C18:0 1.9C17:1 MargaroleicC17:0
AOCS Ce1c-89AOCS Ce1c-89
PalmitoleicC16:0 Palmitic 3.8 AOCS Ce1c-89C16:1 0.3 AOCS Ce1c-89
C14:0 AOCS Ce1c-89C15:0 Pentadecanoic AOCS Ce1c-89
Myristic
AOCS Ce1c-89C10:0 Capric AOCS Ce1c-89
CaprylicC8:0
C12:0 Lauric AOCS Ce1c-89
Fatty Acid Profile Analysis of BiodieselTest Parameter Name Result Test Method
D 664, Test Method A
Result
D 6584
D 2709
0.50 max.
-13
0.0060.098
0.3010.078
D 1301a
4.439 D 4451.9-6.0
No. 3 max.
Kinematic Viscosity at 40 °C:
Copper Corrosion (3 hrs at 50 °C):
EN 14538
D 524
D 874
EN 14538
E 203
Carbon Residue:
N/A
N/A
93 min.
3 min.
D 6751 Annex
D 7039
D 4951
>160
D 1298
EN 14110
D 4176, Procedure 2
D 93
Oxidative Stability (110 °C):
Sulfated Ash:
360
0.020 max.
Cold Soak Filtration:
Sulfur: 15
0.001 max.
5 max. Ca+Mg
0.050 max.
Phosphorus:
Calcium:
Flashpoint (closed cup):
Moisture5:
5 max. Ca+Mg
0.8820
7.6
0.036113
1.4
ASTM D 6751 Analysis of Biodiesel
ASTM Limit
Report
N/A
0.050 max.
Total Glycerin:
Acid Number:
Visual Inspection:
Relative Density at 60 °F:
Water & Sediment:
Free Glycerin: D 65840.020 max.
D 2500
Product Type:
Test Parameter
Cloud point:
Feedstock:
D 6584
Triglycerides4:
Diglycerides³:
0.240 max.
N/AMonoglycerides²:
D 6584
N/A
N/A0.020
Biodiesel Certificate of Analysis
B100
Magnesium:
Test Method (current revision)
Canola
CFPP¹: N/A D 6371
D 6584
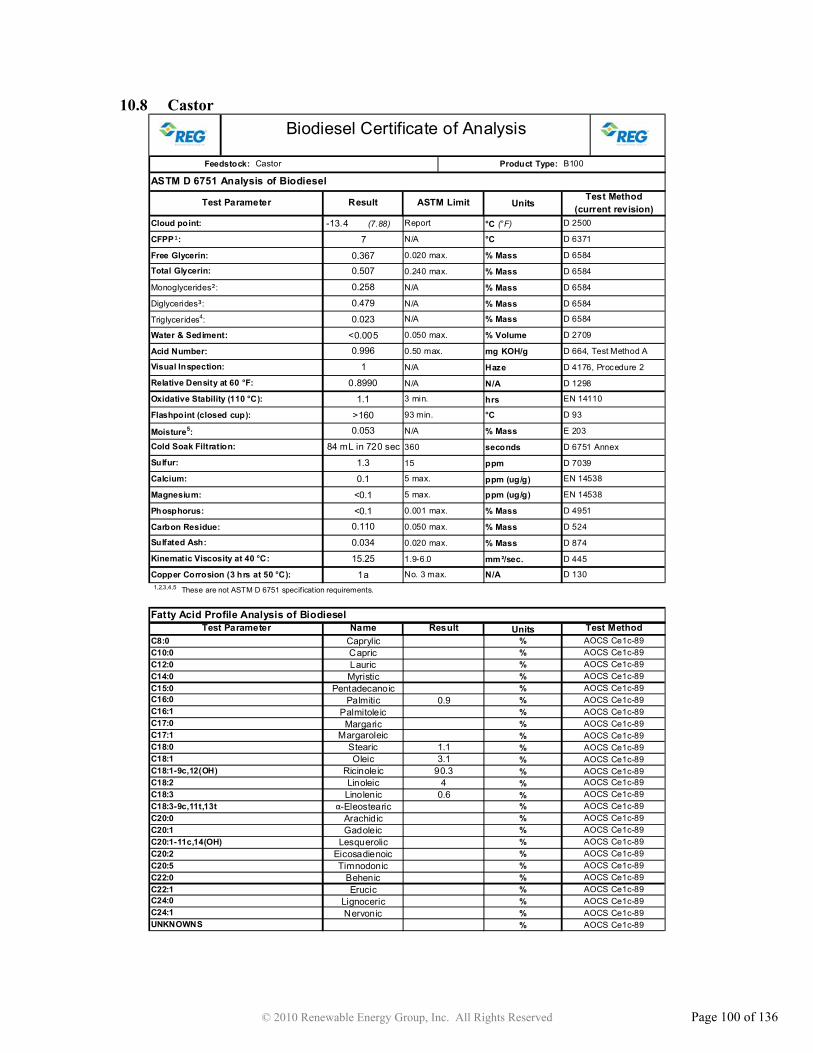
© 2010 Renewable Energy Group, Inc. All Rights Reserved Page 100 of 136
10.8 Castor
Units
-13.4 (7.88) °C (°F)
°C
% Mass
% Mass
% Mass
% Mass
% Mass
% Volume
mg KOH/g
Haze
N/A
hrs
°C
% Mass
seconds
ppm
ppm (ug/g)
ppm (ug/g)
% Mass
% Mass
% Mass
mm ²/sec.
N/A1,2,3,4,5 These are not ASTM D 6751 specification requirements.
Units%%%%%%%%%%%%%%%%%%%%%%%%%
Biodiesel Certificate of Analysis
B100
Magnesium:
Test Method (current revision)
Castor
CFPP¹: N/A D 6371
D 6584
D 6584
Triglycerides4:
Diglycerides³:
0.240 max.
N/AMonoglycerides²:
D 6584
N/A
N/A
Free Glycerin: D 65840.020 max.
D 2500
Product Type:
Test Parameter
Cloud point:
Feedstock:
ASTM D 6751 Analysis of Biodiesel
ASTM Limit
Report
N/A
5 max.
0.1
1.3
0.053
0.050 max.
Total Glycerin:
Phosphorus:
Calcium:
Flashpoint (closed cup):
Moisture5:
Acid Number:
Visual Inspection:
Relative Density at 60 °F:
Water & Sediment:
Oxidative Stability (110 °C):
Sulfated Ash:
360
0.020 max.
Cold Soak Filtration:
Sulfur: 15
0.001 max.
5 max.
0.050 max.
D 1298
EN 14110
D 4176, Procedure 2
D 93
E 203
Carbon Residue:
N/A
N/A
93 min.
3 min.
D 6751 Annex
D 7039
D 4951
84 mL in 720 sec
EN 14538
D 524
D 874
EN 14538
1.9-6.0
No. 3 max.
Kinematic Viscosity at 40 °C:
Copper Corrosion (3 hrs at 50 °C): D 1301a
15.25 D 445
D 664, Test Method A
Result
D 6584
D 2709
0.50 max.0.996<0.005
0.023
0.479
0.258
Fatty Acid Profile Analysis of BiodieselTest Parameter Name Result Test Method
C12:0 Lauric AOCS Ce1c-89
AOCS Ce1c-89C10:0 Capric AOCS Ce1c-89
CaprylicC8:0
C14:0 AOCS Ce1c-89C15:0 Pentadecanoic AOCS Ce1c-89
Myristic
AOCS Ce1c-89AOCS Ce1c-89
PalmitoleicC16:0 Palmitic 0.9 AOCS Ce1c-89C16:1 AOCS Ce1c-89
Margaric
C18:0 1.1C17:1 MargaroleicC17:0
AOCS Ce1c-89C18:1 Oleic 3.1 AOCS Ce1c-89
Stearic
AOCS Ce1c-89AOCS Ce1c-89
LinoleicC18:1-9c,12(OH) Ricinoleic 90.3 AOCS Ce1c-89C18:2 4 AOCS Ce1c-89
Linolenic 0.6
C20:0C18:3-9c,11t,13t "-EleostearicC18:3
AOCS Ce1c-89C20:1 Gadoleic AOCS Ce1c-89
Arachidic
AOCS Ce1c-89AOCS Ce1c-89
EicosadienoicC20:1-11c,14(OH) Lesquerolic AOCS Ce1c-89C20:2 AOCS Ce1c-89
Timnodonic
C24:0 Lignoceric
C22:0 BehenicC20:5
AOCS Ce1c-89C22:1 Erucic AOCS Ce1c-89
0.034
0.110<0.1
<0.1
UNKNOWNS AOCS Ce1c-89C24:1 Nervonic AOCS Ce1c-89
7
>160
1.1
0.8990
1
0.5070.367

© 2010 Renewable Energy Group, Inc. All Rights Reserved Page 101 of 136
10.9 Choice White Grease
Units
7.0 (44.6) °C (°F)
°C
% Mass
% Mass
% Mass
% Mass
% Mass
% Volume
mg KOH/g
Haze
N/A
hrs
°C
% Mass
seconds
ppm
ppm (ug/g)
ppm (ug/g)
% Mass
% Mass
% Mass
mm²/sec.
N/A1,2,3,4,5 These are not ASTM D 6751 specification requirements.
Units%%%%%%%%%%%%%%%%%%%%%%%%%UNKNOWNS 0.2 AOCS Ce1c-89
C24:1 Nervonic AOCS Ce1c-89
<0.005
AOCS Ce1c-89C22:1 Erucic 0.3 AOCS Ce1c-89
Timnodonic
C24:0 Lignoceric
C22:0 BehenicC20:5
AOCS Ce1c-89AOCS Ce1c-89
EicosadienoicC20:1-11c,14(OH) Lesquerolic AOCS Ce1c-89C20:2 AOCS Ce1c-89
AOCS Ce1c-89C20:1 Gadoleic 0.5 AOCS Ce1c-89
Arachidic
Linolenic 1
C20:0 0.2C18:3-9c,11t,13t "-EleostearicC18:3
AOCS Ce1c-89AOCS Ce1c-89
LinoleicC18:1-9c,12(OH) Ricinoleic AOCS Ce1c-89C18:2 12.2 AOCS Ce1c-89
AOCS Ce1c-89C18:1 Oleic 50.4 AOCS Ce1c-89
Stearic
Margaric 0.2
C18:0 9.0C17:1 Margaroleic 0.3C17:0
AOCS Ce1c-89AOCS Ce1c-89
PalmitoleicC16:0 Palmitic 21.6 AOCS Ce1c-89C16:1 2.8 AOCS Ce1c-89
C14:0 1.3 AOCS Ce1c-89C15:0 Pentadecanoic AOCS Ce1c-89
Myristic
AOCS Ce1c-89C10:0 Capric AOCS Ce1c-89
CaprylicC8:0
C12:0 Lauric AOCS Ce1c-89
Fatty Acid Profile Analysis of BiodieselTest Parameter Name Result Test Method
D 664, Test Method A
Result
D 6584
D 2709
0.50 max.
0.0890.265
0.0950.012
6
No. 3 max.
Kinematic Viscosity at 40 °C:
Copper Corrosion (3 hrs at 50 °C): D 1301a
4.536 D 445
D 524
D 874
EN 14538
1.9-6.0
D 6751 Annex
D 7039
D 4951
0.8770
EN 14538
<0.10.3
<0.15.4
72
Carbon Residue:
N/A
N/A
93 min.
3 min.
0.034
1
0.2 EN 14110
D 4176, Procedure 2
D 93
E 203
Oxidative Stability (110 °C):
Sulfated Ash:
360
0.020 max.
Cold Soak Filtration:
Sulfur: 15
0.001 max.
5 max. Ca+Mg
0.050 max.
Phosphorus:
Calcium:
Flashpoint (closed cup):
Moisture5:
5 max. Ca+Mg
0.026
>160
0.050 max.< 0.0050.021
ASTM D 6751 Analysis of Biodiesel
ASTM Limit
Report
N/A
Total Glycerin:
Acid Number:
Visual Inspection:
Relative Density at 60 °F:
Water & Sediment:
D 1298
Free Glycerin: D 65840.020 max.
D 2500
Product Type:
Test Parameter
Cloud point:
Feedstock:
D 6584
Triglycerides4:
Diglycerides³:
0.240 max.
N/AMonoglycerides²:
D 6584
N/A
N/A0.019
Biodiesel Certificate of Analysis
B100
Magnesium:
Test Method (current revision)
Choice White Grease
CFPP¹: N/A D 6371
D 6584

© 2010 Renewable Energy Group, Inc. All Rights Reserved Page 102 of 136
10.10 Coconut
Units
0.0 (32) °C (°F)
°C
% Mass
% Mass
% Mass
% Mass
% Mass
% Volume
mg KOH/g
Haze
N/A
hrs
°C
% Mass
seconds
ppm
ppm (ug/g)
ppm (ug/g)
% Mass
% Mass
% Mass
mm ²/sec.
N/A1,2,3,4,5 These are not ASTM D 6751 specification requirements.
Units%%%%%%%%%%%%%%%%%%%%%%%%%
Biodiesel Certificate of Analysis
Result
Erucic
Arachidic
Linoleic
Stearic
Palmitoleic
Test Method
0.025
-4
0.006
0.010<0.1
0.3
<0.1
3.2
0.065
UNKNOWNS AOCS Ce1c-89
0.8073
1
AOCS Ce1c-89
C22:0 Behenic AOCS Ce1c-89C22:1
Fatty Acid Profile Analysis of BiodieselTest Parameter Name
C24:1 Nervonic AOCS Ce1c-89C24:0 Lignoceric
AOCS Ce1c-89
C20:2 AOCS Ce1c-89C20:5 Timnodonic AOCS Ce1c-89
Eicosadienoic
C20:1 Gadoleic AOCS Ce1c-89C20:1-11c,14(OH) Lesquerolic AOCS Ce1c-89
C18:3-9c,11t,13t "-Eleostearic AOCS Ce1c-89C20:0 AOCS Ce1c-89
C18:2 1.7 AOCS Ce1c-89C18:3 Linolenic AOCS Ce1c-89
C18:1 Oleic 6.5 AOCS Ce1c-89C18:1-9c,12(OH) Ricinoleic AOCS Ce1c-89
AOCS Ce1c-89C17:1 Margaroleic AOCS Ce1c-89
AOCS Ce1c-89
C18:0 2.7 AOCS Ce1c-89
C16:1 AOCS Ce1c-89C17:0 Margaric
Palmitic 9.1C15:0 Pentadecanoic
AOCS Ce1c-89
C12:0 Lauric 49.2 AOCS Ce1c-89C14:0 18.5 AOCS Ce1c-89Myristic
C16:0
C8:0 6.3 AOCS Ce1c-89C10:0 Capric 6 AOCS Ce1c-89
Caprylic
D 664, Test Method A
Result
D 6584
D 2709
0.50 max.0.106< 0.005
0.000
0.040
0.130
1.9-6.0
No. 3 max.
Kinematic Viscosity at 40 °C:
Copper Corrosion (3 hrs at 50 °C): D 1301b
2.726
D 4176, Procedure 2
D 93
D 4951
D 445
EN 14538
D 524
D 874
EN 14538
Carbon Residue:
0.034
Magnesium:
D 1298
EN 14110
49
35.5
5 max.
D 6751 Annex
D 7039
E 203
Oxidative Stability (110 °C):
Sulfated Ash:
360
0.020 max.
Cold Soak Filtration:
Sulfur: 15
0.001 max.
5 max.
0.050 max.
Acid Number:
Visual Inspection:
Relative Density at 60 °F:
Water & Sediment:
Phosphorus:
Calcium:
Flashpoint (closed cup):
Moisture5:
N/A
N/A
93 min.
3 min.
N/A
114.8
N/A
0.050 max.
Test Parameter
Cloud point:
Feedstock:
ASTM D 6751 Analysis of Biodiesel
Free Glycerin: D 65840.020 max.
D 2500
Product Type:
ASTM Limit
D 6584
D 6584
D 6371
Triglycerides4:
Diglycerides³:
0.240 max.
N/AMonoglycerides²:
Total Glycerin:
D 6584
N/A
Report
B100
Test Method (current revision)
Coconut
CFPP¹: N/A
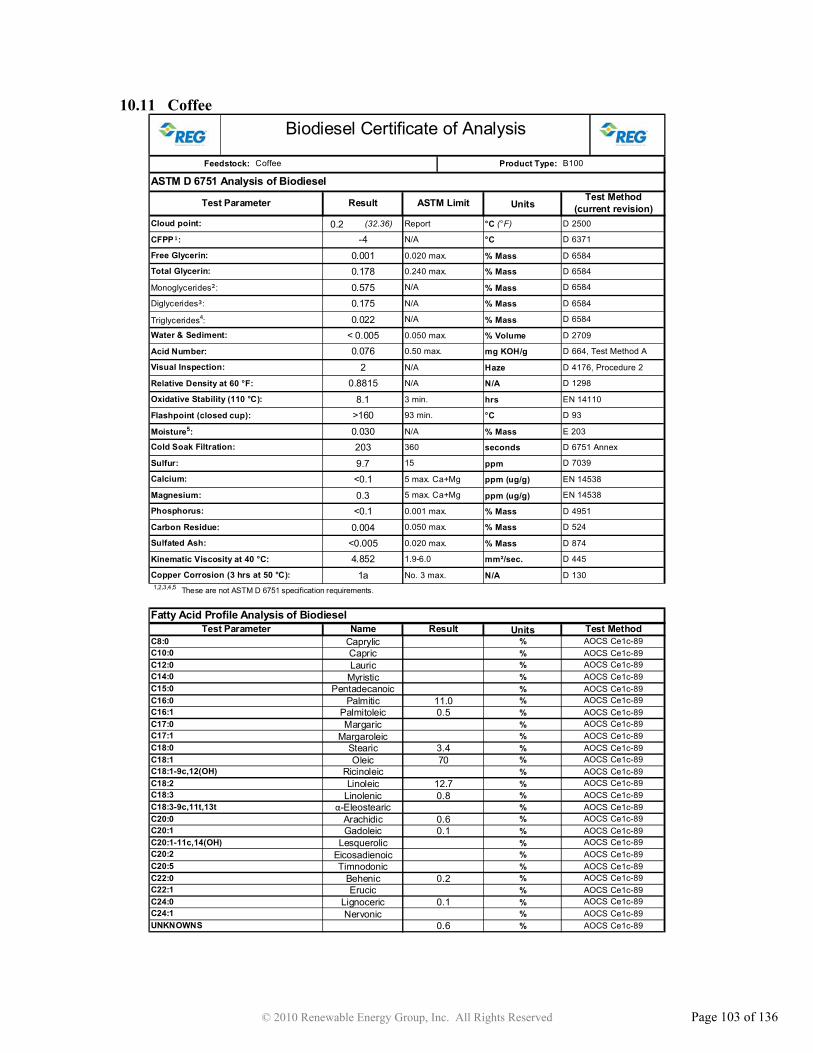
© 2010 Renewable Energy Group, Inc. All Rights Reserved Page 103 of 136
10.11 Coffee
Units
0.2 (32.36) °C (°F)
°C
% Mass
% Mass
% Mass
% Mass
% Mass
% Volume
mg KOH/g
Haze
N/A
hrs
°C
% Mass
seconds
ppm
ppm (ug/g)
ppm (ug/g)
% Mass
% Mass
% Mass
mm²/sec.
N/A1,2,3,4,5 These are not ASTM D 6751 specification requirements.
Units%%%%%%%%%%%%%%%%%%%%%%%%%
D 6371
D 6584
D 6584
Triglycerides4:
Diglycerides³:
0.240 max.
N/AMonoglycerides²:
D 6584
N/A
0.020 max.
D 2500
Product Type:
ASTM Limit
Report
B100
Test Method (current revision)
Coffee
CFPP¹: N/A
N/A
0.050 max.
Test Parameter
Cloud point:
Feedstock:
ASTM D 6751 Analysis of Biodiesel
Free Glycerin: D 6584
N/A
N/A
93 min.
3 min.
N/A
Total Glycerin:
Phosphorus:
Calcium:
Flashpoint (closed cup):
Moisture5:
Acid Number:
Visual Inspection:
Relative Density at 60 °F:
Water & Sediment:
Oxidative Stability (110 °C):
Sulfated Ash:
360
0.020 max.
Cold Soak Filtration:
Sulfur: 15
0.001 max.
5 max. Ca+Mg
0.050 max.
5 max. Ca+Mg
D 6751 Annex
D 7039
E 203
Carbon Residue:
<0.19.7
D 4951
Magnesium:
D 1298
EN 14110
D 4176, Procedure 2
D 93
D 130
D 445
EN 14538
D 524
D 874
EN 14538
1.9-6.0
No. 3 max.
Kinematic Viscosity at 40 °C:
Copper Corrosion (3 hrs at 50 °C):
D 664, Test Method A
Result
D 6584
D 2709
0.50 max.
0.022
0.1750.575
0.1780.001
Fatty Acid Profile Analysis of BiodieselTest Parameter Name Result Test Method
C8:0 AOCS Ce1c-89C10:0 Capric AOCS Ce1c-89
Caprylic
0.511.0C16:0 Palmitic AOCS Ce1c-89
C12:0 Lauric AOCS Ce1c-89C14:0 AOCS Ce1c-89C15:0 Pentadecanoic AOCS Ce1c-89
Myristic
C16:1 AOCS Ce1c-89C17:0 Margaric AOCS Ce1c-89
Palmitoleic
C17:1 Margaroleic AOCS Ce1c-893.4C18:0 AOCS Ce1c-89
C18:1 Oleic AOCS Ce1c-89Stearic
70C18:1-9c,12(OH) Ricinoleic AOCS Ce1c-89
C18:3 Linolenic AOCS Ce1c-89Linoleic 12.7
0.8C18:2 AOCS Ce1c-89
C18:3-9c,11t,13t "-Eleostearic AOCS Ce1c-89
C20:1 Gadoleic AOCS Ce1c-89Arachidic 0.6
0.1C20:0 AOCS Ce1c-89
C20:1-11c,14(OH) Lesquerolic AOCS Ce1c-89
C20:5 Timnodonic AOCS Ce1c-89EicosadienoicC20:2 AOCS Ce1c-89
C22:0 Behenic AOCS Ce1c-890.2C22:1 Erucic AOCS Ce1c-89C24:0 Lignoceric AOCS Ce1c-890.1
8.1
<0.0050.004
<0.10.3
0.030
>160
UNKNOWNS AOCS Ce1c-890.6C24:1 Nervonic AOCS Ce1c-89
Biodiesel Certificate of Analysis
-4
1a
4.852
0.88152
0.076< 0.005
203

© 2010 Renewable Energy Group, Inc. All Rights Reserved Page 104 of 136
10.12 Corn, Distiller’s
Units
-2.8 (26.96) °C (°F)
°C
% Mass
% Mass
% Mass
% Mass
% Mass
% Volume
mg KOH/g
Haze
N/A
hrs
°C
% Mass
seconds
ppm
ppm (ug/g)
ppm (ug/g)
% Mass
% Mass
% Mass
mm²/sec.
N/A1,2,3,4,5 These are not ASTM D 6751 specification requirements.
Units%%%%%%%%%%%%%%%%%%%%%%%%%
Magnesium:
Test Method (current revision)
Corn
CFPP¹: N/A D 6371
D 6584
D 6584
Triglycerides4:
Diglycerides³:
0.240 max.
N/AMonoglycerides²:
D 6584
N/A
N/A
Test Parameter
Cloud point:
Feedstock:
ASTM D 6751 Analysis of Biodiesel
ASTM Limit
Report D 2500
Product Type:
N/A
5 max. Ca+Mg
0.032
> 160
0.8850
0.050 max.
Total Glycerin:
Phosphorus:
Calcium:
Flashpoint (closed cup):
Moisture5:
Acid Number:
Visual Inspection:
Relative Density at 60 °F:
Water & Sediment:
Oxidative Stability (110 °C):
Sulfated Ash:
360
0.020 max.
Cold Soak Filtration:
Sulfur: 15
0.001 max.
5 max. Ca+Mg
0.050 max.
D 1298
EN 14110
D 4176, Procedure 2
D 93
E 203
Carbon Residue:
N/A
N/A
93 min.
3 min.
D 6751 Annex
D 7039
D 4951
2.2
D 130
D 445
EN 14538
D 524
D 874
EN 14538
1.9-6.0
No. 3 max.
Kinematic Viscosity at 40 °C:
Copper Corrosion (3 hrs at 50 °C):
D 664, Test Method A
Result
D 6584
D 2709
0.50 max.
< 0.0050.021
0.0800.197
0.066
Fatty Acid Profile Analysis of BiodieselTest Parameter Name Result Test Method
C12:0 Lauric AOCS Ce1c-89
AOCS Ce1c-89C10:0 Capric AOCS Ce1c-89
CaprylicC8:0
C14:0 AOCS Ce1c-89C15:0 Pentadecanoic AOCS Ce1c-89
Myristic
AOCS Ce1c-89AOCS Ce1c-89
PalmitoleicC16:0 Palmitic 12.1 AOCS Ce1c-89C16:1 0.1 AOCS Ce1c-89
Margaric
C18:0 1.8C17:1 Margaroleic 0.1C17:0
AOCS Ce1c-89C18:1 Oleic 27.2 AOCS Ce1c-89
Stearic
AOCS Ce1c-89AOCS Ce1c-89
LinoleicC18:1-9c,12(OH) Ricinoleic AOCS Ce1c-89C18:2 56.2 AOCS Ce1c-89
Linolenic 1.3
C20:1-11c,14(OH) Lesquerolic
C18:3-9c,11t,13t "-EleostearicC18:3
AOCS Ce1c-89
C20:0 0.4 AOCS Ce1c-89C20:1 Gadoleic
C22:0 Behenic 0.2 AOCS Ce1c-89
C20:2 AOCS Ce1c-89C20:5 Timnodonic
C22:1 ErucicC24:0 Lignoceric
UNKNOWNS 0.6 AOCS Ce1c-89C24:1 Nervonic AOCS Ce1c-89
1
131
0.283
AOCS Ce1c-89Eicosadienoic
AOCS Ce1c-89Arachidic
AOCS Ce1c-89AOCS Ce1c-89
<0.11.0
0.64.6
1a
4.382<0.0050.020
Biodiesel Certificate of Analysis
0.001
-3Free Glycerin: D 65840.020 max.
B100
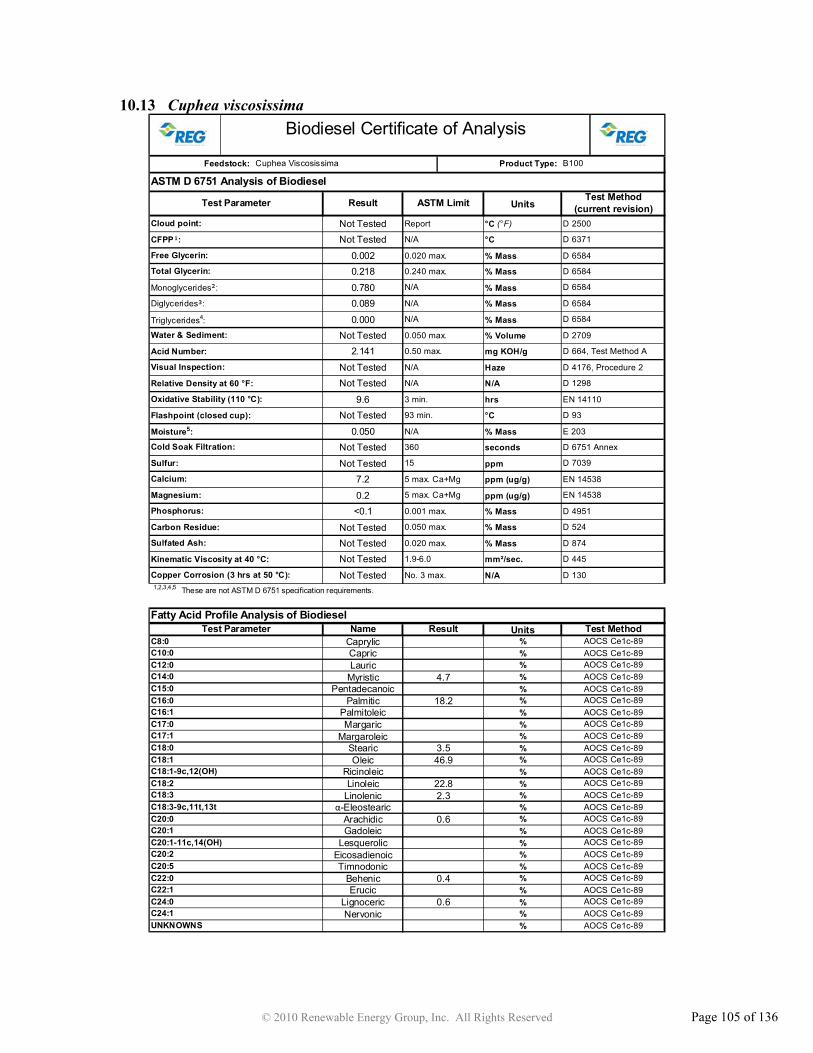
© 2010 Renewable Energy Group, Inc. All Rights Reserved Page 105 of 136
10.13 Cuphea viscosissima
Units
°C (°F)
°C
% Mass
% Mass
% Mass
% Mass
% Mass
% Volume
mg KOH/g
Haze
N/A
hrs
°C
% Mass
seconds
ppm
ppm (ug/g)
ppm (ug/g)
% Mass
% Mass
% Mass
mm²/sec.
N/A1,2,3,4,5 These are not ASTM D 6751 specification requirements.
Units%%%%%%%%%%%%%%%%%%%%%%%%%
Not Tested
2.141
Palmitoleic
Myristic
Caprylic
Fatty Acid Profile Analysis of BiodieselTest Parameter
C15:0 Pentadecanoic
Arachidic
Linoleic
Stearic
Nervonic AOCS Ce1c-89UNKNOWNS AOCS Ce1c-89
Not Tested
Not Tested
Not TestedNot TestedNot Tested
<0.1
C24:1C24:0 Lignoceric 0.6 AOCS Ce1c-89
C22:0 Behenic 0.4 AOCS Ce1c-89C22:1 Erucic AOCS Ce1c-89
C20:2 AOCS Ce1c-89C20:5 Timnodonic AOCS Ce1c-89
Eicosadienoic
C20:1 Gadoleic AOCS Ce1c-89C20:1-11c,14(OH) Lesquerolic AOCS Ce1c-89
C18:3-9c,11t,13t "-Eleostearic AOCS Ce1c-89C20:0 0.6 AOCS Ce1c-89
C18:2 22.8 AOCS Ce1c-89C18:3 Linolenic 2.3 AOCS Ce1c-89
C18:1 Oleic 46.9 AOCS Ce1c-89C18:1-9c,12(OH) Ricinoleic AOCS Ce1c-89
C17:1 Margaroleic AOCS Ce1c-89C18:0 3.5 AOCS Ce1c-89
C16:1 AOCS Ce1c-89C17:0 Margaric AOCS Ce1c-89
AOCS Ce1c-89C16:0 Palmitic 18.2 AOCS Ce1c-89
Capric AOCS Ce1c-89C12:0 Lauric AOCS Ce1c-89
Name Result Test Method
C14:0 4.7 AOCS Ce1c-89
C8:0 AOCS Ce1c-89C10:0
D 130
D 664, Test Method A
Result
D 6584
D 2709
0.50 max.
Not Tested0.000
0.0890.780
1.9-6.0
No. 3 max.
Kinematic Viscosity at 40 °C:
Copper Corrosion (3 hrs at 50 °C):
D 4176, Procedure 2
D 93
D 4951
D 445
EN 14538
D 524
D 874
EN 14538
D 1298
EN 14110
Not Tested
Not Tested
Not Tested
9.6
D 6751 Annex
D 7039
E 203
Carbon Residue:
0.050
Magnesium: 0.2
7.2
Sulfated Ash:
360
0.020 max.
Cold Soak Filtration:
Sulfur: 15
0.001 max.
5 max. Ca+Mg
0.050 max.
5 max. Ca+Mg
Visual Inspection:
Relative Density at 60 °F:
Water & Sediment:
Oxidative Stability (110 °C):
Phosphorus:
Calcium:
Flashpoint (closed cup):
Moisture5: N/A
93 min.
3 min.
N/A
Not Tested
N/A
0.050 max.
Test Parameter
Cloud point:
Feedstock:
ASTM D 6751 Analysis of Biodiesel
N/A
Acid Number:
Free Glycerin: D 65840.020 max.
D 2500
Product Type:
0.002
Not Tested
ASTM Limit
D 6584
D 6584
D 6371
Triglycerides4:
Diglycerides³:
0.240 max.
N/AMonoglycerides²:
Total Glycerin: 0.218
Biodiesel Certificate of Analysis
D 6584
N/A
Report
B100
Test Method (current revision)
Cuphea Viscosissima
CFPP¹: N/A
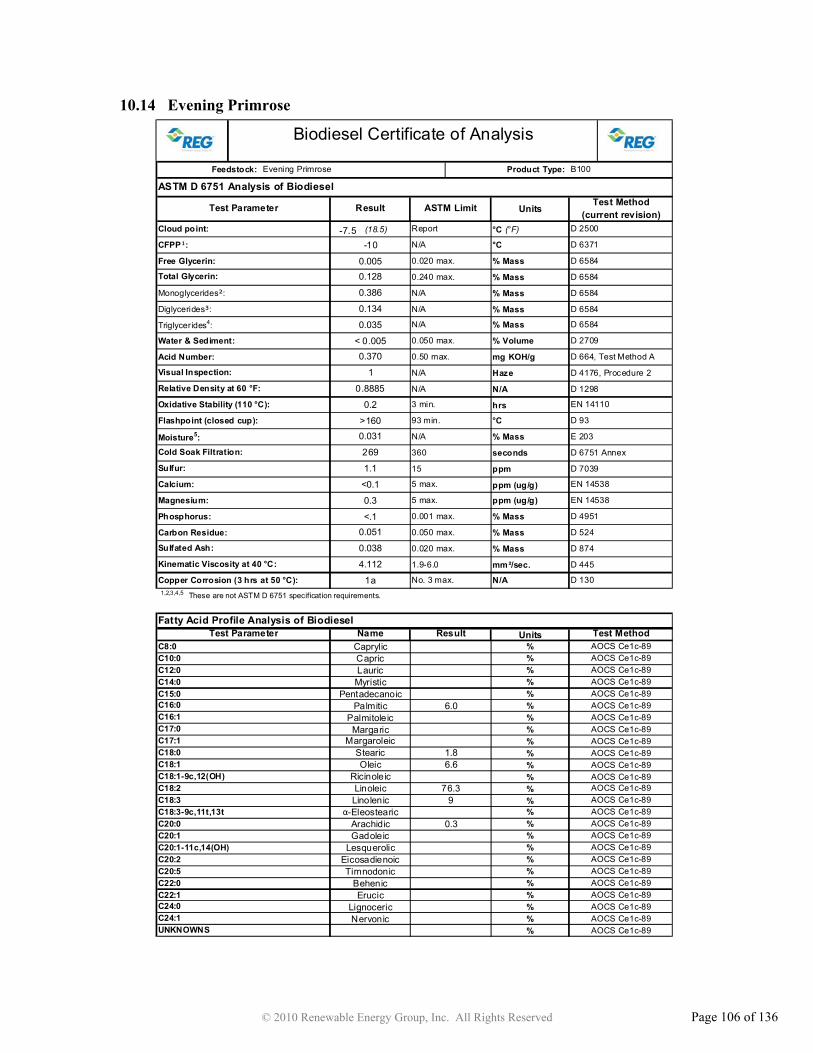
© 2010 Renewable Energy Group, Inc. All Rights Reserved Page 106 of 136
10.14 Evening Primrose
Units
-7.5 (18.5) °C (°F)
°C
% Mass
% Mass
% Mass
% Mass
% Mass
% Volume
mg KOH/g
Haze
N/A
hrs
°C
% Mass
seconds
ppm
ppm (ug/g)
ppm (ug/g)
% Mass
% Mass
% Mass
mm ²/sec.
N/A1,2,3,4,5 These are not ASTM D 6751 specification requirements.
Units%%%%%%%%%%%%%%%%%%%%%%%%%
Biodiesel Certificate of Analysis
Report
B100
Magnesium:
Test Method (current revision)
Evening Primrose
CFPP¹: N/A D 6371
ASTM Limit
D 6584
D 6584
Triglycerides4:
Diglycerides³:
0.240 max.
N/AMonoglycerides²:
D 6584
N/A
D 65840.020 max.
D 2500
Product Type:
N/A
0.050 max.
Test Parameter
Cloud point:
Feedstock:
ASTM D 6751 Analysis of Biodiesel
Free Glycerin:
N/A
N/A
93 min.
3 min.
N/A
Total Glycerin:
Phosphorus:
Calcium:
Flashpoint (closed cup):
Moisture5:
Acid Number:
Visual Inspection:
Relative Density at 60 °F:
Water & Sediment:
Oxidative Stability (110 °C):
Sulfated Ash:
360
0.020 max.
Cold Soak Filtration:
Sulfur: 15
0.001 max.
5 max.
0.050 max.
5 max.
D 6751 Annex
D 7039
E 203
Carbon Residue:
0.031
D 4951
0.3
<0.1
1.1
D 1298
EN 14110
D 4176, Procedure 2
D 93
EN 14538
D 524
D 874
EN 14538
1.9-6.0
No. 3 max.
Kinematic Viscosity at 40 °C:
Copper Corrosion (3 hrs at 50 °C): D 1301a
4.112 D 445
D 664, Test Method A
Result
D 6584
D 2709
0.50 max.
< 0.005
0.035
0.134
0.386
0.128
Result Test Method C8:0 AOCS Ce1c-89C10:0 Capric AOCS Ce1c-89
Lauric AOCS Ce1c-89C14:0 AOCS Ce1c-89
C16:0 Palmitic 6.0 AOCS Ce1c-89C15:0 Pentadecanoic AOCS Ce1c-89
C18:0 1.8 AOCS Ce1c-89
C16:1 AOCS Ce1c-89C17:0 Margaric AOCS Ce1c-89C17:1 Margaroleic AOCS Ce1c-89
C18:1-9c,12(OH) Ricinoleic AOCS Ce1c-89C18:1 Oleic 6.6 AOCS Ce1c-89
C20:0 0.3 AOCS Ce1c-89
C18:2 76.3 AOCS Ce1c-89C18:3 Linolenic 9 AOCS Ce1c-89C18:3-9c,11t,13t "-Eleostearic AOCS Ce1c-89
C20:1-11c,14(OH) Lesquerolic AOCS Ce1c-89C20:1 Gadoleic AOCS Ce1c-89
C20:2 AOCS Ce1c-89C20:5 Timnodonic AOCS Ce1c-89
Eicosadienoic
C24:0
C22:0 BehenicC22:1 Erucic
UNKNOWNS AOCS Ce1c-89C24:1 Nervonic AOCS Ce1c-89
-10
Lignoceric AOCS Ce1c-89
0.370
AOCS Ce1c-89AOCS Ce1c-89
Arachidic
Linoleic
Stearic
Palmitoleic
0.8885
1
269
0.005
>160
0.2
0.038
0.051<.1
Myristic
Caprylic
Fatty Acid Profile Analysis of BiodieselTest Parameter Name
C12:0

© 2010 Renewable Energy Group, Inc. All Rights Reserved Page 107 of 136
10.15 Fish
Units
3.2 (37.76) °C (°F)
°C
% Mass
% Mass
% Mass
% Mass
% Mass
% Volume
mg KOH/g
Haze
N/A
hrs
°C
% Mass
seconds
ppm
ppm (ug/g)
ppm (ug/g)
% Mass
% Mass
% Mass
mm²/sec.
N/A1,2,3,4,5 These are not ASTM D 6751 specification requirements.
Units%%%%%%%%%%%%%%%%%%%%%%%%%
Water & Sediment:
D 6584
Biodiesel Certificate of Analysis
CFPP¹: N/A D 6371
Test Method (current revision)
Diglycerides³:
Monoglycerides²:
N/A
Total Glycerin:
Free Glycerin: 0.020 max.
D 2500
Product Type: B100Fish
Test Parameter
Cloud point:
Feedstock:
ASTM D 6751 Analysis of Biodiesel
ASTM Limit
0.050 max.
Oxidative Stability (110 °C):
N/A
N/A
93 min.
3 min.
N/A
5 max. Ca + Mg
Phosphorus:
Flashpoint (closed cup):
D 7039
D 4951
Moisture5:
Acid Number:
Visual Inspection:
Relative Density at 60 °F:
Magnesium:
Calcium:
<0.0050.078
Triglycerides4:
E 203
Carbon Residue:
D 1298
EN 14110
D 4176, Procedure 2
D 93
D 6751 Annex
Kinematic Viscosity at 40 °C:
Copper Corrosion (3 hrs at 50 °C):
Sulfated Ash:
360
0.020 max.
Cold Soak Filtration:
Sulfur: 15
0.001 max.
5 max. Ca + Mg
D 1301a
3.777 D 4451.9-6.0
No. 3 max.
EN 14538
D 524
D 874
EN 14538
D 664, Test Method A
Result
D 6584
D 2709
0.50 max.
N/A
Report
0.240 max.
N/A
0.050 max.
D 6584
D 6584
D 6584
Fatty Acid Profile Analysis of Biodiesel
>1600.2
<0.10.3
<0.19.3
Test Parameter Name Result Test Method C8:0 AOCS Ce1c-89C10:0 Capric AOCS Ce1c-89
Caprylic
AOCS Ce1c-89
C12:0 Lauric 0.2 AOCS Ce1c-89C14:0 7.7 AOCS Ce1c-89Myristic
C16:0AOCS Ce1c-89
C16:1 9.3 AOCS Ce1c-89PalmitoleicPalmitic 18.8
C15:0 Pentadecanoic
C17:0 Margaric 0.3 AOCS Ce1c-89
AOCS Ce1c-89
C17:1 Margaroleic 0.3 AOCS Ce1c-89C18:0 3.9 AOCS Ce1c-89Stearic
C18:1-9c,12(OH)AOCS Ce1c-89
C18:2 4.6 AOCS Ce1c-89LinoleicRicinoleic
C18:1 Oleic 15
C18:3 Linolenic 0.3 AOCS Ce1c-89
AOCS Ce1c-89
C18:3-9c,11t,13t "-Eleostearic AOCS Ce1c-89C20:0 0.2 AOCS Ce1c-89Arachidic
C20:1-11c,14(OH)AOCS Ce1c-89
C20:2 AOCS Ce1c-89EicosadienoicLesquerolic
C20:1 Gadoleic 1.4
C20:5 Timnodonic 25.1 AOCS Ce1c-89
C22:1 Erucic 1.28 AOCS Ce1c-89C22:0 Behenic 0.7 AOCS Ce1c-89
Nervonic AOCS Ce1c-89C24:0 Lignoceric AOCS Ce1c-89
0.4C24:1UNKNOWNS 10.52 AOCS Ce1c-89
0.006
0
0.000
0.0190.118
0.040
0.085< 0.005
680.056
0.89551

© 2010 Renewable Energy Group, Inc. All Rights Reserved Page 108 of 136
10.16 Hemp
Units
-1.3 (29.66) °C (°F)
°C
% Mass
% Mass
% Mass
% Mass
% Mass
% Volume
mg KOH/g
Haze
N/A
hrs
°C
% Mass
seconds
ppm
ppm (ug/g)
ppm (ug/g)
% Mass
% Mass
% Mass
mm²/sec.
N/A1,2,3,4,5 These are not ASTM D 6751 specification requirements.
Units%%%%%%%%%%%%%%%%%%%%%%%%%
0.4
0.001
<0.0050.019
<0.10.3
C24:0
0.9
0.88851
66
Lignoceric
C20:2C20:5
C20:1 Gadoleic
UNKNOWNS 0.7 AOCS Ce1c-89C24:1 Nervonic AOCS Ce1c-89
AOCS Ce1c-89
0.097
AOCS Ce1c-89Timnodonic AOCS Ce1c-89
Eicosadienoic
C22:0 Behenic 0.5 AOCS Ce1c-89C22:1 Erucic AOCS Ce1c-89
0.3
AOCS Ce1c-89Arachidic
C20:1-11c,14(OH) Lesquerolic AOCS Ce1c-89
C20:0 0.7 AOCS Ce1c-89C18:3-9c,11t,13t "-Eleostearic AOCS Ce1c-89C18:3 Linolenic 20 AOCS Ce1c-89
AOCS Ce1c-89
C18:2 57.1 AOCS Ce1c-89LinoleicRicinoleic
C18:1 Oleic 13.1AOCS Ce1c-89
C17:1 Margaroleic AOCS Ce1c-89C18:0 2.4 AOCS Ce1c-89Stearic
C18:1-9c,12(OH)
C17:0 Margaric AOCS Ce1c-89
AOCS Ce1c-89
C16:1 AOCS Ce1c-89PalmitoleicPalmitic 5.2
C15:0 PentadecanoicAOCS Ce1c-89
C12:0 Lauric AOCS Ce1c-89C14:0 AOCS Ce1c-89Myristic
C16:0
C8:0 AOCS Ce1c-89C10:0 Capric AOCS Ce1c-89
Caprylic
Fatty Acid Profile Analysis of BiodieselTest Parameter Result ASTM Limit Test Method
D 130
D 664, Test Method A
Result
D 6584
D 2709
0.50 max.
< 0.0050.022
0.1010.513
1.9-6.0
No. 3 max.
Kinematic Viscosity at 40 °C:
Copper Corrosion (3 hrs at 50 °C): 1a
3.874
D 4176, Procedure 2
D 93
D 4951
D 445
EN 14538
D 524
D 874
EN 14538
Carbon Residue:
0.031
Magnesium:
D 1298
EN 14110
5 max. Ca + Mg
D 6751 Annex
D 7039
E 203
Oxidative Stability (110 °C):
Sulfated Ash:
360
0.020 max.
Cold Soak Filtration:
Sulfur: 15
0.001 max.
5 max. Ca + Mg
0.050 max.
Phosphorus:
Acid Number:
Visual Inspection:
Relative Density at 60 °F:
Water & Sediment:
Calcium:
Flashpoint (closed cup):
Moisture5:
N/A
N/A
93 min.
3 min.
N/A
>160
<0.1
0.050 max.
Test Parameter
Cloud point:
Feedstock:
ASTM D 6751 Analysis of Biodiesel
Free Glycerin:
0.151
-6D 65840.020 max.
D 2500
Product Type:
ASTM Limit
D 6584
D 6584
D 6371
Triglycerides4:
Diglycerides³:
0.240 max.
N/AMonoglycerides²:
Total Glycerin:
N/A
Biodiesel Certificate of Analysis
D 6584
N/A
Report
B100
Test Method (current revision)
Hemp
CFPP¹: N/A

© 2010 Renewable Energy Group, Inc. All Rights Reserved Page 109 of 136
10.17 Hepar, High IV
Units
16.0 (60.8) °C (°F)
°C
% Mass
% Mass
% Mass
% Mass
% Mass
% Volume
mg KOH/g
Haze
N/A
hrs
°C
% Mass
seconds
ppm
ppm (ug/g)
ppm (ug/g)
% Mass
% Mass
% Mass
mm²/sec.
N/A1,2,3,4,5 These are not ASTM D 6751 specification requirements.
Units%%%%%%%%%%%%%%%%%%%%%%%%%
870.024
>1601.4
0.87551
0.062< 0.005
<0.005
AOCS Ce1c-89AOCS Ce1c-89
AOCS Ce1c-89Erucic 0.3
Lignoceric
AOCS Ce1c-89
AOCS Ce1c-89C22:0 BehenicC22:1
UNKNOWNS AOCS Ce1c-89C24:1 NervonicC24:0
C20:2 0.4 AOCS Ce1c-89C20:5 Timnodonic AOCS Ce1c-89
EicosadienoicLesquerolic
C20:1 Gadoleic 0.7AOCS Ce1c-89
C18:3-9c,11t,13t "-Eleostearic AOCS Ce1c-89C20:0 0.2 AOCS Ce1c-89Arachidic
C20:1-11c,14(OH)
C18:3 Linolenic 0.3 AOCS Ce1c-89
AOCS Ce1c-89
C18:2 9.7 AOCS Ce1c-89LinoleicRicinoleic
C18:1 Oleic 36.1AOCS Ce1c-89
C17:1 Margaroleic 0.2 AOCS Ce1c-89C18:0 20.2 AOCS Ce1c-89Stearic
C18:1-9c,12(OH)
C17:0 Margaric 0.3 AOCS Ce1c-89
AOCS Ce1c-89
C16:1 1.9 AOCS Ce1c-89PalmitoleicPalmitic 28.0
C15:0 PentadecanoicAOCS Ce1c-89
C12:0 Lauric 0.1 AOCS Ce1c-89C14:0 1.5 AOCS Ce1c-89Myristic
C16:0
C8:0 AOCS Ce1c-89C10:0 Capric 0.1 AOCS Ce1c-89
Caprylic
Fatty Acid Profile Analysis of BiodieselTest Parameter Result ASTM Limit Test Method
D 664, Test Method A
Result
D 6584
D 2709
0.50 max.
0.000
0.0650.227
0.0700.002
Kinematic Viscosity at 40 °C:
Copper Corrosion (3 hrs at 50 °C): D 1301a
4.422 D 445
D 874
EN 14538
1.9-6.0
No. 3 max.
D 1298
EN 14110
D 4176, Procedure 2
D 93
Carbon Residue:
<0.13.4
D 4951
0.041
<0.10.3
EN 14538
D 524
5 max. Ca + Mg
D 6751 Annex
D 7039
E 203
Oxidative Stability (110 °C):
Sulfated Ash:
360
0.020 max.
Cold Soak Filtration:
Sulfur: 15
0.001 max.
5 max. Ca + Mg
0.050 max.
Acid Number:
Visual Inspection:
Relative Density at 60 °F:
Water & Sediment:
Phosphorus:
Calcium:
Flashpoint (closed cup):
Moisture5:
N/A
N/A
93 min.
3 min.
N/A
0.050 max.
Test Parameter
Cloud point:
Feedstock:
ASTM D 6751 Analysis of Biodiesel
Free Glycerin:
Total Glycerin:
13
D 6584
N/A
D 65840.020 max.
D 2500
Product Type:
N/A
Diglycerides³:
0.240 max.
N/AMonoglycerides²:
Magnesium:
Test Method (current revision)
Hepar, High IV
CFPP¹: N/A D 6371
ASTM Limit
D 6584
D 6584
Triglycerides4:
Biodiesel Certificate of Analysis
Report
B100

© 2010 Renewable Energy Group, Inc. All Rights Reserved Page 110 of 136
10.18 Hepar, Low IV
Units
6.7 (44.06) °C (°F)
°C
% Mass
% Mass
% Mass
% Mass
% Mass
% Volume
mg KOH/g
Haze
N/A
hrs
°C
% Mass
seconds
ppm
ppm (ug/g)
ppm (ug/g)
% Mass
% Mass
% Mass
mm²/sec.
N/A1,2,3,4,5 These are not ASTM D 6751 specification requirements.
Units%%%%%%%%%%%%%%%%%%%%%%%%%
Magnesium:
Test Method (current revision)
Hepar, Low IV
CFPP¹: N/A D 6371
D 6584
D 6584
Triglycerides4:
Diglycerides³:
0.240 max.
N/AMonoglycerides²:
D 6584
N/A
N/A
Free Glycerin: D 65840.020 max.
D 2500
Product Type: B100
Test Parameter
Cloud point:
Feedstock:
ASTM D 6751 Analysis of Biodiesel
ASTM Limit
Report
N/A
5 max. Ca + Mg
> 1601.2
0.050 max.
Total Glycerin:
Phosphorus:
Calcium:
Flashpoint (closed cup):
Moisture5:
Acid Number:
Visual Inspection:
Relative Density at 60 °F:
Water & Sediment:
Oxidative Stability (110 °C):
Sulfated Ash:
360
0.020 max.
Cold Soak Filtration:
Sulfur: 15
0.001 max.
5 max. Ca + Mg
0.050 max.
D 1298
EN 14110
D 4176, Procedure 2
D 93
E 203
Carbon Residue:
N/A
N/A
93 min.
3 min.
D 6751 Annex
D 7039
D 4951
0.8755
D 130
D 445
EN 14538
D 524
D 874
EN 14538
1.9-6.0
No. 3 max.
Kinematic Viscosity at 40 °C:
Copper Corrosion (3 hrs at 50 °C):
D 664, Test Method A
Result
D 6584
D 2709
0.50 max.
0.022
0.0720.282
0.0880.002
Fatty Acid Profile Analysis of BiodieselTest Parameter Name Result Test Method
C12:0 Lauric 0.2 AOCS Ce1c-89
AOCS Ce1c-89C10:0 Capric AOCS Ce1c-89
CaprylicC8:0
C14:0 1 AOCS Ce1c-89C15:0 Pentadecanoic AOCS Ce1c-89
Myristic
AOCS Ce1c-89AOCS Ce1c-89
PalmitoleicC16:0 Palmitic 20.7 AOCS Ce1c-89C16:1 2.7 AOCS Ce1c-89
Margaric 0.3
C18:0 8.9C17:1 Margaroleic 0.3C17:0
AOCS Ce1c-89C18:1 Oleic 46.7 AOCS Ce1c-89
Stearic
AOCS Ce1c-89AOCS Ce1c-89
LinoleicC18:1-9c,12(OH) Ricinoleic AOCS Ce1c-89C18:2 15.6 AOCS Ce1c-89
Linolenic 0.5
C20:1-11c,14(OH) Lesquerolic
C18:3-9c,11t,13t "-EleostearicC18:3
C20:0 AOCS Ce1c-89C20:1 Gadoleic 0.8
Arachidic
C22:0 Behenic 0.2 AOCS Ce1c-89
C20:2 1.3 AOCS Ce1c-89C20:5 Timnodonic
C22:1 Erucic 0.4C24:0 Lignoceric
UNKNOWNS 0.1 AOCS Ce1c-89C24:1 Nervonic AOCS Ce1c-890.1
1
0.165
0.026
< 0.005
3.1
77
AOCS Ce1c-89Eicosadienoic
AOCS Ce1c-89
AOCS Ce1c-89AOCS Ce1c-89
AOCS Ce1c-89
0.2
Biodiesel Certificate of Analysis
6
1a
4.643<0.0050.025
<0.11.6
0.2

© 2010 Renewable Energy Group, Inc. All Rights Reserved Page 111 of 136
10.19 Jatropha
Units
2.7 (36.86) °C (°F)
°C
% Mass
% Mass
% Mass
% Mass
% Mass
% Volume
mg KOH/g
Haze
N/A
hrs
°C
% Mass
seconds
ppm
ppm (ug/g)
ppm (ug/g)
% Mass
% Mass
% Mass
mm²/sec.
N/A1,2,3,4,5 These are not ASTM D 6751 specification requirements.
Units%%%%%%%%%%%%%%%%%%%%%%%%%
Caprylic
Fatty Acid Profile Analysis of BiodieselTest Parameter
C15:0 Pentadecanoic AOCS Ce1c-89
>160
AOCS Ce1c-89
Arachidic
Linoleic
Stearic
Palmitoleic
Myristic
UNKNOWNS AOCS Ce1c-89
0.022
1a
4.2530.0090.026
C24:1 NervonicC24:0 Lignoceric AOCS Ce1c-89
C22:0 Behenic AOCS Ce1c-89C22:1 Erucic AOCS Ce1c-89
C20:2 AOCS Ce1c-89C20:5 Timnodonic AOCS Ce1c-89
Eicosadienoic
C20:1 Gadoleic AOCS Ce1c-89C20:1-11c,14(OH) Lesquerolic AOCS Ce1c-89
C18:3-9c,11t,13t "-Eleostearic AOCS Ce1c-89C20:0 0.2 AOCS Ce1c-89
C18:2 41.6 AOCS Ce1c-89C18:3 Linolenic 0.2 AOCS Ce1c-89
C18:1 Oleic 39.1 AOCS Ce1c-89C18:1-9c,12(OH) Ricinoleic AOCS Ce1c-89
C17:1 Margaroleic AOCS Ce1c-89C18:0 5.5 AOCS Ce1c-89
C16:1 0.7 AOCS Ce1c-89C17:0 Margaric AOCS Ce1c-89
C16:0 Palmitic 12.7 AOCS Ce1c-89
Capric AOCS Ce1c-89C12:0 Lauric AOCS Ce1c-89
Name Result Test Method
C14:0 AOCS Ce1c-89
C8:0 AOCS Ce1c-89C10:0
D 664, Test Method A
Result
D 6584
D 2709
0.50 max.
N/A
0.050 max.
D 6584
D 6584
D 6584
No. 3 max.
Kinematic Viscosity at 40 °C:
Copper Corrosion (3 hrs at 50 °C): D 130
D 445
D 524
D 874
EN 14538
1.9-6.0
Sulfated Ash:
360
0.020 max.
Cold Soak Filtration:
Sulfur: 15
0.001 max.
5 max. Ca + Mg
286
0.050 max.
D 4176, Procedure 2
D 93
D 6751 Annex
D 7039
E 203
D 1298
EN 14110
D 4951<0.10.3
<0.11.2
2.3
0.8795
EN 14538
< 0.005Acid Number:
Visual Inspection:
Carbon Residue:
Relative Density at 60 °F:
Oxidative Stability (110 °C):
N/AMonoglycerides²:
N/A
Water & Sediment:
Triglycerides4: 0.022
1
0.156
Test Parameter
Cloud point:
Feedstock:
ASTM D 6751 Analysis of Biodiesel
5 max. Ca + Mg
Phosphorus:
Calcium:
N/A
N/A
93 min.
3 min.
N/A
Flashpoint (closed cup):
Moisture5:
Product Type: B100Jatropha
CFPP¹: N/A0Free Glycerin:
D 6371
ASTM Limit
Report
D 65840.020 max.
D 2500
0.006
Biodiesel Certificate of Analysis
Magnesium:
Test Method (current revision)
Diglycerides³:
0.240 max.Total Glycerin:
0.1040.291
0.100
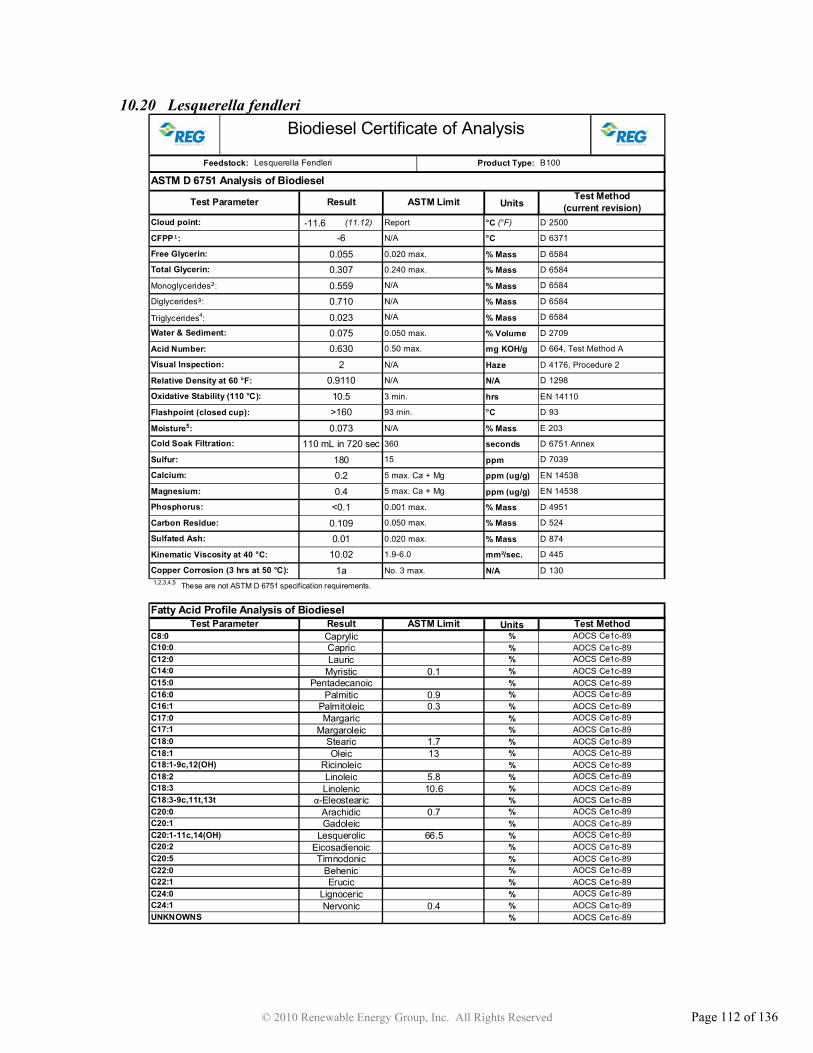
© 2010 Renewable Energy Group, Inc. All Rights Reserved Page 112 of 136
10.20 Lesquerella fendleri
Units
-11.6 (11.12) °C (°F)
°C
% Mass
% Mass
% Mass
% Mass
% Mass
% Volume
mg KOH/g
Haze
N/A
hrs
°C
% Mass
seconds
ppm
ppm (ug/g)
ppm (ug/g)
% Mass
% Mass
% Mass
mm²/sec.
N/A1,2,3,4,5 These are not ASTM D 6751 specification requirements.
Units%%%%%%%%%%%%%%%%%%%%%%%%%
Magnesium:
Test Method (current revision)
Diglycerides³:
0.240 max.Total Glycerin:
0.7100.559
0.307
Lesquerella Fendleri
CFPP¹: N/A
Free Glycerin:
ASTM Limit
Report
0.055
-60.020 max.
D 2500
Product Type: B100
D 6371
Phosphorus:
Calcium:
N/A
N/A
93 min.
3 min.
N/A
Flashpoint (closed cup):
Moisture5:
2
N/AMonoglycerides²:
N/A
Test Parameter
Cloud point:
Feedstock:
ASTM D 6751 Analysis of Biodiesel
D 6584
Oxidative Stability (110 °C):
Water & Sediment:
Triglycerides4:
0.6300.0750.023
Acid Number:
EN 14538
Visual Inspection:
Carbon Residue:
D 1298
EN 14110
D 4951
>16010.5
0.9110Relative Density at 60 °F:
D 93
D 6751 Annex
D 7039
E 203
D 130
Sulfated Ash:
360
0.020 max.
Cold Soak Filtration:
Sulfur: 15
0.001 max.
5 max. Ca + Mg
110 mL in 720 sec
1.9-6.0
No. 3 max.
Kinematic Viscosity at 40 °C:
Copper Corrosion (3 hrs at 50 °C):
D 445
D 664, Test Method A
Result
D 6584
D 2709
0.50 max.
N/A
0.050 max.
D 6584
D 6584
D 6584
0.010.109
<0.1D 524
D 874
EN 14538
0.050 max.
5 max. Ca + Mg
D 4176, Procedure 2
ASTM Limit Test Method Fatty Acid Profile Analysis of Biodiesel
Test ParameterC8:0 AOCS Ce1c-89C10:0 Capric AOCS Ce1c-89
Caprylic
C12:0 Lauric AOCS Ce1c-89C14:0 0.1 AOCS Ce1c-89C15:0 Pentadecanoic AOCS Ce1c-89
Myristic
C16:0 Palmitic 0.9 AOCS Ce1c-89C16:1 0.3 AOCS Ce1c-89C17:0 Margaric AOCS Ce1c-89
Palmitoleic
C17:1 Margaroleic AOCS Ce1c-89C18:0 1.7 AOCS Ce1c-89C18:1 Oleic 13 AOCS Ce1c-89
Stearic
C18:1-9c,12(OH) Ricinoleic AOCS Ce1c-89C18:2 5.8 AOCS Ce1c-89C18:3 Linolenic 10.6 AOCS Ce1c-89
Linoleic
C18:3-9c,11t,13t "-Eleostearic AOCS Ce1c-89C20:0 0.7 AOCS Ce1c-89C20:1 Gadoleic AOCS Ce1c-89
Arachidic
C20:1-11c,14(OH) Lesquerolic 66.5 AOCS Ce1c-89C20:2 AOCS Ce1c-89C20:5 Timnodonic AOCS Ce1c-89
Eicosadienoic
C22:0 Behenic AOCS Ce1c-89
AOCS Ce1c-89C22:1 Erucic AOCS Ce1c-89
C24:1C24:0 Lignoceric
0.2180
1a
10.02
Result
Biodiesel Certificate of Analysis
Nervonic AOCS Ce1c-890.4UNKNOWNS AOCS Ce1c-89
0.073
0.4

© 2010 Renewable Energy Group, Inc. All Rights Reserved Page 113 of 136
10.21 Linseed
Units
-3.8 (25.16) °C (°F)
°C
% Mass
% Mass
% Mass
% Mass
% Mass
% Volume
mg KOH/g
Haze
N/A
hrs
°C
% Mass
seconds
ppm
ppm (ug/g)
ppm (ug/g)
% Mass
% Mass
% Mass
mm²/sec.
N/A1,2,3,4,5 These are not ASTM D 6751 specification requirements.
Units%%%%%%%%%%%%%%%%%%%%%%%%%
0.001
<0.0050.035
<0.1
>160
0.8925
0.120
UNKNOWNS AOCS Ce1c-89
0.042
0.3
<0.11.9
C24:1 Nervonic AOCS Ce1c-89C24:0 Lignoceric 0.1 AOCS Ce1c-89
C22:0 Behenic 0.3 AOCS Ce1c-89C22:1 Erucic AOCS Ce1c-89
C20:5 Timnodonic AOCS Ce1c-89
AOCS Ce1c-89
C20:2 AOCS Ce1c-89EicosadienoicLesquerolic
C20:1 GadoleicAOCS Ce1c-89
C18:3-9c,11t,13t "-Eleostearic AOCS Ce1c-89C20:0 0.2 AOCS Ce1c-89Arachidic
C20:1-11c,14(OH)
C18:3 Linolenic 54.6 AOCS Ce1c-89
AOCS Ce1c-89
C18:2 15.9 AOCS Ce1c-89LinoleicRicinoleic
C18:1 Oleic 20.7AOCS Ce1c-89
C17:1 Margaroleic AOCS Ce1c-89C18:0 3.8 AOCS Ce1c-89Stearic
C18:1-9c,12(OH)
C17:0 Margaric AOCS Ce1c-89
AOCS Ce1c-89
C16:1 AOCS Ce1c-89PalmitoleicPalmitic 4.4
C15:0 PentadecanoicAOCS Ce1c-89
C12:0 Lauric AOCS Ce1c-89C14:0 AOCS Ce1c-89Myristic
C16:0
C8:0 AOCS Ce1c-89C10:0 Capric AOCS Ce1c-89
Caprylic
Fatty Acid Profile Analysis of BiodieselTest Parameter Name Result Test Method
D 6584
D 6584
D 6584
1a
D 6584
D 2709
0.50 max.
N/A
0.050 max.
No. 3 max.
Kinematic Viscosity at 40 °C:
Copper Corrosion (3 hrs at 50 °C): D 130
3.752 D 445
D 524
D 874
EN 14538
1.9-6.0
Sulfated Ash:
360
0.020 max.
Cold Soak Filtration:
Sulfur: 15
0.001 max.
5 max. Ca + Mg
64
0.050 max.
D 6751 Annex
D 7039
D 4951
0.2
EN 14538
Acid Number:
Visual Inspection:
Relative Density at 60 °F:
Carbon Residue:
E 203
D 664, Test Method A0.058< 0.005
D 1298
EN 14110
D 4176, Procedure 2
D 93
1
Test Parameter
Cloud point:
Feedstock:
ASTM D 6751 Analysis of Biodiesel
Phosphorus:
Calcium:
N/A
N/A
93 min.
3 min.
N/A
Flashpoint (closed cup):
Moisture5:
Oxidative Stability (110 °C):
Linseed
CFPP¹: N/A
5 max. Ca + Mg
N/AMonoglycerides²:
N/A
Water & Sediment:
Triglycerides4: 0.000
Magnesium:
Test Method (current revision)
Diglycerides³:
0.240 max.Total Glycerin:
0.1120.392
D 6371
ASTM Limit
Report
Free Glycerin:
Biodiesel Certificate of Analysis
Result
-8D 65840.020 max.
D 2500
Product Type: B100
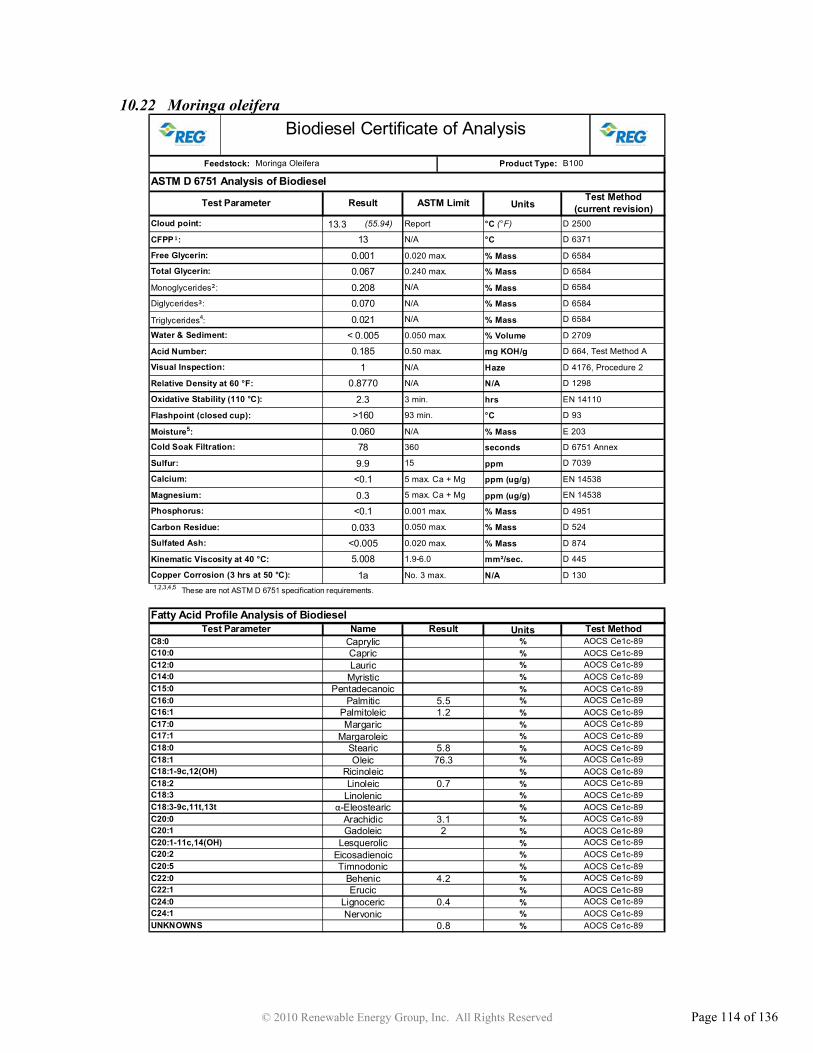
© 2010 Renewable Energy Group, Inc. All Rights Reserved Page 114 of 136
10.22 Moringa oleifera
Units
13.3 (55.94) °C (°F)
°C
% Mass
% Mass
% Mass
% Mass
% Mass
% Volume
mg KOH/g
Haze
N/A
hrs
°C
% Mass
seconds
ppm
ppm (ug/g)
ppm (ug/g)
% Mass
% Mass
% Mass
mm²/sec.
N/A1,2,3,4,5 These are not ASTM D 6751 specification requirements.
Units%%%%%%%%%%%%%%%%%%%%%%%%%
C18:3-9c,11t,13t
Caprylic
Gadoleic
Stearic
Palmitoleic
Myristic
Arachidic
AOCS Ce1c-890.4 AOCS Ce1c-89
UNKNOWNS 0.8 AOCS Ce1c-89
78
9.9
0.185
1
C24:1 NervonicC24:0 Lignoceric
4.2 AOCS Ce1c-89C22:1 Erucic AOCS Ce1c-89C22:0 Behenic
AOCS Ce1c-89C20:5 Timnodonic AOCS Ce1c-89
EicosadienoicC20:2AOCS Ce1c-89
C20:0 3.1 AOCS Ce1c-89C20:1C20:1-11c,14(OH) Lesquerolic
2 AOCS Ce1c-89
"-Eleostearic AOCS Ce1c-89
C18:2 0.7 AOCS Ce1c-89C18:3 Linolenic AOCS Ce1c-89
Linoleic
C18:1 Oleic 76.3 AOCS Ce1c-89C18:1-9c,12(OH) Ricinoleic AOCS Ce1c-89
C17:1 Margaroleic AOCS Ce1c-89C18:0 5.8 AOCS Ce1c-89
C16:1 1.2 AOCS Ce1c-89C17:0 Margaric AOCS Ce1c-89
C15:0 Pentadecanoic AOCS Ce1c-89C16:0 Palmitic 5.5 AOCS Ce1c-89
C12:0 Lauric AOCS Ce1c-89C14:0 AOCS Ce1c-89
C8:0 AOCS Ce1c-89C10:0 Capric AOCS Ce1c-89
Fatty Acid Profile Analysis of BiodieselTest Parameter Name Result Test Method
D 874
EN 14538
1.9-6.0
0.8770
2.3
5.008<0.005
<0.1
0.033
>160
D 6584
D 2709
0.50 max.
N/A
0.050 max.
D 6584
N/A
D 664, Test Method A
No. 3 max.
Kinematic Viscosity at 40 °C: D 445
Copper Corrosion (3 hrs at 50 °C): D 1301a
Sulfated Ash:
360
0.020 max.
Cold Soak Filtration:
Sulfur: 15
0.001 max.
5 max. Ca + Mg<0.1
0.3
Carbon Residue:
D 1298
EN 14110
D 4176, Procedure 2
D 93
D 6751 Annex
D 7039
D 4951
EN 14538
D 524
Visual Inspection:
Relative Density at 60 °F:
Triglycerides4:
E 203
0.021< 0.005
0.060
0.050 max.
Oxidative Stability (110 °C):
N/A
N/A
93 min.
3 min.
N/A
5 max. Ca + Mg
Phosphorus:
Flashpoint (closed cup):
Calcium:
Test Parameter
Cloud point:
Feedstock:
ASTM D 6751 Analysis of Biodiesel
ASTM Limit
Water & Sediment:
Moisture5:
Acid Number:
D 65840.020 max.
D 2500
Product Type:
Monoglycerides²:
Report
Free Glycerin:
Total Glycerin:
0.001
13
0.208
0.067
B100
0.240 max.
N/A
Result
D 6584
D 6584
Biodiesel Certificate of Analysis
Magnesium:
Test Method (current revision)
Moringa Oleifera
CFPP¹: N/A D 6371
Diglycerides³: 0.070

© 2010 Renewable Energy Group, Inc. All Rights Reserved Page 115 of 136
10.23 Mustard
Units
3.2 (37.76) °C (°F)
°C
% Mass
% Mass
% Mass
% Mass
% Mass
% Volume
mg KOH/g
Haze
N/A
hrs
°C
% Mass
seconds
ppm
ppm (ug/g)
ppm (ug/g)
% Mass
% Mass
% Mass
mm²/sec.
N/A1,2,3,4,5 These are not ASTM D 6751 specification requirements.
Units%%%%%%%%%%%%%%%%%%%%%%%%%
Caprylic
Fatty Acid Profile Analysis of BiodieselTest Parameter
C15:0 Pentadecanoic AOCS Ce1c-89
Not Tested
AOCS Ce1c-891.5
Arachidic
Linoleic
Stearic
Palmitoleic
Myristic
UNKNOWNS 1.1 AOCS Ce1c-89
0.021
Not Tested
Not TestedNot TestedNot Tested
C24:1 NervonicC24:0 Lignoceric 0.2 AOCS Ce1c-89
C22:0 Behenic 0.5 AOCS Ce1c-89C22:1 Erucic 25.6 AOCS Ce1c-89
C20:2 1 AOCS Ce1c-89C20:5 Timnodonic AOCS Ce1c-89
Eicosadienoic
C20:1 Gadoleic 10.7 AOCS Ce1c-89C20:1-11c,14(OH) Lesquerolic AOCS Ce1c-89
C18:3-9c,11t,13t "-Eleostearic AOCS Ce1c-89C20:0 0.9 AOCS Ce1c-89
C18:2 20.6 AOCS Ce1c-89C18:3 Linolenic 13.3 AOCS Ce1c-89
C18:1 Oleic 20.6 AOCS Ce1c-89C18:1-9c,12(OH) Ricinoleic AOCS Ce1c-89
C17:1 Margaroleic AOCS Ce1c-89C18:0 1.2 AOCS Ce1c-89
C16:1 0.2 AOCS Ce1c-89C17:0 Margaric AOCS Ce1c-89
C16:0 Palmitic 2.6 AOCS Ce1c-89
Capric AOCS Ce1c-89C12:0 Lauric AOCS Ce1c-89
Name Result Test Method
C14:0 AOCS Ce1c-89
C8:0 AOCS Ce1c-89C10:0
D 664, Test Method A
Result
D 6584
D 2709
0.50 max.
N/A
0.050 max.
D 6584
D 6584
D 6584
No. 3 max.
Kinematic Viscosity at 40 °C:
Copper Corrosion (3 hrs at 50 °C): D 130
D 445
D 524
D 874
EN 14538
1.9-6.0
Sulfated Ash:
360
0.020 max.
Cold Soak Filtration:
Sulfur: 15
0.001 max.
5 max. Ca + Mg
Not Tested
0.050 max.
D 4176, Procedure 2
D 93
D 6751 Annex
D 7039
E 203
D 1298
EN 14110
D 4951<0.10.5
<0.10.9
1.1
Not Tested
EN 14538
Not TestedAcid Number:
Visual Inspection:
Carbon Residue:
Relative Density at 60 °F:
Oxidative Stability (110 °C):
N/AMonoglycerides²:
N/A
Water & Sediment:
Triglycerides4: 0.019
Not Tested
0.037
Test Parameter
Cloud point:
Feedstock:
ASTM D 6751 Analysis of Biodiesel
5 max. Ca + Mg
Phosphorus:
Calcium:
N/A
N/A
93 min.
3 min.
N/A
Flashpoint (closed cup):
Moisture5:
Product Type: B100Mustard
CFPP¹: N/A-5Free Glycerin:
D 6371
ASTM Limit
Report
D 65840.020 max.
D 2500
0.004
Biodiesel Certificate of Analysis
Magnesium:
Test Method (current revision)
Diglycerides³:
0.240 max.Total Glycerin:
0.0400.195
0.062

© 2010 Renewable Energy Group, Inc. All Rights Reserved Page 116 of 136
10.24 Neem
Units
14.4 (57.92) °C (°F)
°C
% Mass
% Mass
% Mass
% Mass
% Mass
% Volume
mg KOH/g
Haze
N/A
hrs
°C
% Mass
seconds
ppm
ppm (ug/g)
ppm (ug/g)
% Mass
% Mass
% Mass
mm²/sec.
N/A1,2,3,4,5 These are not ASTM D 6751 specification requirements.
Units%%%%%%%%%%%%%%%%%%%%%%%%%
0.000
<0.0050.105
<0.1
>160
0.8845
0.158
UNKNOWNS AOCS Ce1c-89
0.036
0.9
0.3473.8
C24:1 Nervonic AOCS Ce1c-89C24:0 Lignoceric 0.3 AOCS Ce1c-89
C22:0 Behenic 0.3 AOCS Ce1c-89C22:1 Erucic AOCS Ce1c-89
C20:5 Timnodonic AOCS Ce1c-89
AOCS Ce1c-89
C20:2 AOCS Ce1c-89EicosadienoicLesquerolic
C20:1 GadoleicAOCS Ce1c-89
C18:3-9c,11t,13t "-Eleostearic AOCS Ce1c-89C20:0 1.6 AOCS Ce1c-89Arachidic
C20:1-11c,14(OH)
C18:3 Linolenic 0.4 AOCS Ce1c-89
AOCS Ce1c-89
C18:2 17.9 AOCS Ce1c-89LinoleicRicinoleic
C18:1 Oleic 43.9AOCS Ce1c-89
C17:1 Margaroleic AOCS Ce1c-89C18:0 20.6 AOCS Ce1c-89Stearic
C18:1-9c,12(OH)
C17:0 Margaric AOCS Ce1c-89
AOCS Ce1c-89
C16:1 0.1 AOCS Ce1c-89PalmitoleicPalmitic 14.9
C15:0 PentadecanoicAOCS Ce1c-89
C12:0 Lauric AOCS Ce1c-89C14:0 AOCS Ce1c-89Myristic
C16:0
C8:0 AOCS Ce1c-89C10:0 Capric AOCS Ce1c-89
Caprylic
Fatty Acid Profile Analysis of BiodieselTest Parameter Name Result Test Method
D 6584
D 6584
D 6584
1b
D 6584
D 2709
0.50 max.
N/A
0.050 max.
No. 3 max.
Kinematic Viscosity at 40 °C:
Copper Corrosion (3 hrs at 50 °C): D 130
5.213 D 445
D 524
D 874
EN 14538
1.9-6.0
Sulfated Ash:
360
0.020 max.
Cold Soak Filtration:
Sulfur: 15
0.001 max.
5 max. Ca + Mg
130 mL in 720 sec
0.050 max.
D 6751 Annex
D 7039
D 4951
7.1
EN 14538
Acid Number:
Visual Inspection:
Relative Density at 60 °F:
Carbon Residue:
E 203
D 664, Test Method A0.649< 0.005
D 1298
EN 14110
D 4176, Procedure 2
D 93
3
Test Parameter
Cloud point:
Feedstock:
ASTM D 6751 Analysis of Biodiesel
Phosphorus:
Calcium:
N/A
N/A
93 min.
3 min.
N/A
Flashpoint (closed cup):
Moisture5:
Oxidative Stability (110 °C):
Neem
CFPP¹: N/A
5 max. Ca + Mg
N/AMonoglycerides²:
N/A
Water & Sediment:
Triglycerides4: 0.000
Magnesium:
Test Method (current revision)
Diglycerides³:
0.240 max.Total Glycerin:
0.4740.338
D 6371
ASTM Limit
Report
Free Glycerin:
Biodiesel Certificate of Analysis
Result
11D 65840.020 max.
D 2500
Product Type: B100

© 2010 Renewable Energy Group, Inc. All Rights Reserved Page 117 of 136
10.25 Palm
Units
13.0 (55.4) °C (°F)
°C
% Mass
% Mass
% Mass
% Mass
% Mass
% Volume
mg KOH/g
Haze
N/A
hrs
°C
% Mass
seconds
ppm
ppm (ug/g)
ppm (ug/g)
% Mass
% Mass
% Mass
mm²/sec.
N/A1,2,3,4,5 These are not ASTM D 6751 specification requirements.
Units%%%%%%%%%%%%%%%%%%%%%%%%%
< 0.005
0.003
0.000
0.0950.196
0.068
0.083
>160
1
0.046
UNKNOWNS AOCS Ce1c-89
<.1
C22:0 AOCS Ce1c-89C22:1 AOCS Ce1c-89
C24:1 AOCS Ce1c-89C24:0 AOCS Ce1c-89
C20:5 AOCS Ce1c-89
C18:3-9c,11t,13t AOCS Ce1c-89
C20:1-11c,14(OH) AOCS Ce1c-89C20:2 AOCS Ce1c-89
C20:0 AOCS Ce1c-89C20:1 AOCS Ce1c-89
C18:2 AOCS Ce1c-89C18:3 AOCS Ce1c-890.3
8.6C18:1-9c,12(OH) AOCS Ce1c-89
0.1
0.3
C18:0 AOCS Ce1c-89C18:1 AOCS Ce1c-8941.9
4.6C17:1 AOCS Ce1c-89
Palmitic
Lauric
43.4
0.2
C16:1 AOCS Ce1c-89C17:0 AOCS Ce1c-89Margaric
Palmitoleic 0.1C16:0 AOCS Ce1c-89
Arachidic"-Eleostearic
LinolenicLinoleic
RicinoleicOleic
StearicMargaroleic
C14:0 AOCS Ce1c-89C15:0 AOCS Ce1c-89Pentadecanoic
Myristic 0.5C12:0 AOCS Ce1c-89
NervonicLignoceric
ErucicBehenic
TimnodonicEicosadienoicLesquerolic
Gadoleic
C8:0 AOCS Ce1c-89C10:0 AOCS Ce1c-89Capric
CaprylicTest Parameter Name Result Test Method
D 6584
D 6584
D 6584
Fatty Acid Profile Analysis of Biodiesel
0.2
0.8760
0.3
<0.11.2
88
D 664, Test Method A
Result
D 6584
D 2709
0.50 max.
N/A
Report
0.240 max.
N/A
0.050 max.
EN 14538
D 524
D 874
EN 14538
D 1301a
4.57 D 4451.9-6.0
No. 3 max.
Kinematic Viscosity at 40 °C:
Copper Corrosion (3 hrs at 50 °C):
Sulfated Ash:
360
0.020 max.
Cold Soak Filtration:
Sulfur: 15
0.001 max.
5 max. Ca + Mg
<0.0050.010
Triglycerides4:
E 203
Carbon Residue:
D 1298
EN 14110
D 4176, Procedure 2
D 93
D 6751 Annex
D 7039
D 4951
Moisture5:
Acid Number:
Visual Inspection:
Relative Density at 60 °F:
0.050 max.
Oxidative Stability (110 °C):
N/A
N/A
93 min.
3 min.
N/A
5 max. Ca + Mg
Phosphorus:
Flashpoint (closed cup):
0.020 max.
D 2500
Product Type: B100Palm
Test Parameter
Cloud point:
Feedstock:
ASTM D 6751 Analysis of Biodiesel
ASTM Limit
Magnesium:
Test Method (current revision)
Diglycerides³:
Monoglycerides²:
N/A
Total Glycerin:
Free Glycerin:
Calcium:
Water & Sediment:
D 6584
Biodiesel Certificate of Analysis
CFPP¹: N/A D 637112
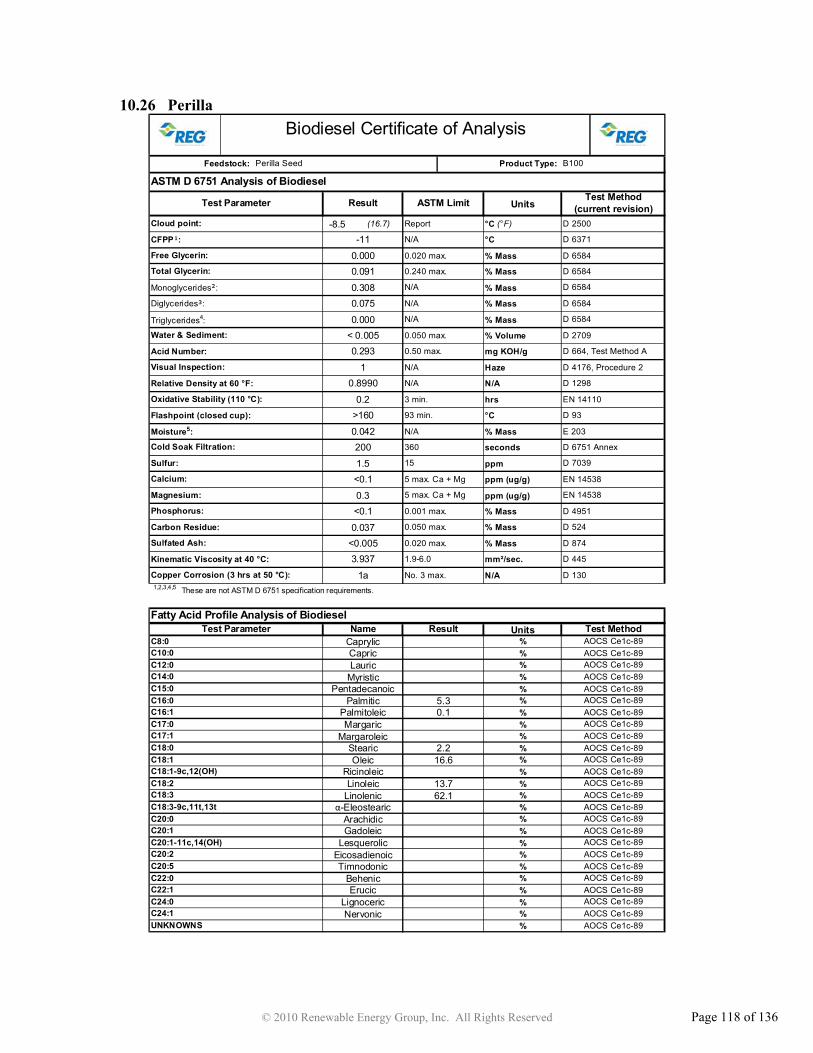
© 2010 Renewable Energy Group, Inc. All Rights Reserved Page 118 of 136
10.26 Perilla
Units
-8.5 (16.7) °C (°F)
°C
% Mass
% Mass
% Mass
% Mass
% Mass
% Volume
mg KOH/g
Haze
N/A
hrs
°C
% Mass
seconds
ppm
ppm (ug/g)
ppm (ug/g)
% Mass
% Mass
% Mass
mm²/sec.
N/A1,2,3,4,5 These are not ASTM D 6751 specification requirements.
Units%%%%%%%%%%%%%%%%%%%%%%%%%UNKNOWNS AOCS Ce1c-89
0.000
0.042
>1600.2
0.8990
C24:1 Nervonic AOCS Ce1c-89C24:0 Lignoceric AOCS Ce1c-89
C22:0 Behenic AOCS Ce1c-89C22:1 Erucic AOCS Ce1c-89
C20:5 Timnodonic AOCS Ce1c-89
AOCS Ce1c-89
C20:2 AOCS Ce1c-89EicosadienoicLesquerolic
C20:1 GadoleicAOCS Ce1c-89
C18:3-9c,11t,13t "-Eleostearic AOCS Ce1c-89C20:0 AOCS Ce1c-89Arachidic
C20:1-11c,14(OH)
C18:3 Linolenic 62.1 AOCS Ce1c-89
AOCS Ce1c-89
C18:2 13.7 AOCS Ce1c-89LinoleicRicinoleic
C18:1 Oleic 16.6AOCS Ce1c-89
C17:1 Margaroleic AOCS Ce1c-89C18:0 2.2 AOCS Ce1c-89Stearic
C18:1-9c,12(OH)
C17:0 Margaric AOCS Ce1c-89
AOCS Ce1c-89
C16:1 0.1 AOCS Ce1c-89PalmitoleicPalmitic 5.3
C15:0 PentadecanoicAOCS Ce1c-89
C12:0 Lauric AOCS Ce1c-89C14:0 AOCS Ce1c-89Myristic
C16:0
C8:0 AOCS Ce1c-89C10:0 Capric AOCS Ce1c-89
CaprylicTest Parameter Name Result Test Method
D 6584
D 6584
D 6584
Fatty Acid Profile Analysis of Biodiesel
0.3<0.1
<0.11.5
200
1
D 874
EN 14538
D 664, Test Method A
Result
D 6584
D 2709
0.50 max.
N/A
Report
0.240 max.
D 130
3.937
1a
D 4451.9-6.0
No. 3 max.
Kinematic Viscosity at 40 °C:
Copper Corrosion (3 hrs at 50 °C):
Sulfated Ash:
360
0.020 max.
Cold Soak Filtration:
Sulfur: 15
0.001 max.
5 max. Ca + Mg
0.037<0.005
Carbon Residue:
D 1298
EN 14110
D 4176, Procedure 2
D 93
D 6751 Annex
D 7039
D 4951
EN 14538
D 524
Visual Inspection:
Relative Density at 60 °F:
Triglycerides4:
E 203
0.050 max.
0.293< 0.005
0.050 max.
Oxidative Stability (110 °C):
N/A
N/A
93 min.
3 min.
N/A
5 max. Ca + Mg
Phosphorus:
Flashpoint (closed cup):
Calcium:
Test Parameter
Cloud point:
Feedstock:
ASTM D 6751 Analysis of Biodiesel
ASTM Limit
Water & Sediment:
Moisture5:
Acid Number:
Free Glycerin: D 65840.020 max.
D 2500
Product Type:
0.000
-11
Monoglycerides²:
N/A
Total Glycerin:
0.0750.308
0.091N/A
Biodiesel Certificate of Analysis
B100
Magnesium:
Test Method (current revision)
Perilla Seed
CFPP¹: N/A D 6371
Diglycerides³:

© 2010 Renewable Energy Group, Inc. All Rights Reserved Page 119 of 136
10.27 Poultry Fat
Units
6.1 (42.98) °C (°F)
°C
% Mass
% Mass
% Mass
% Mass
% Mass
% Volume
mg KOH/g
Haze
N/A
hrs
°C
% Mass
seconds
ppm
ppm (ug/g)
ppm (ug/g)
% Mass
% Mass
% Mass
mm²/sec.
N/A1,2,3,4,5 These are not ASTM D 6751 specification requirements.
Units%%%%%%%%%%%%%%%%%%%%%%%%%
< 0.005
0.002
0.020
0.0790.244
0.079
0.052
>160
1
0.044
UNKNOWNS AOCS Ce1c-89
<0.1
C24:1 Nervonic AOCS Ce1c-89C24:0 Lignoceric AOCS Ce1c-89
C22:0 Behenic 0.3 AOCS Ce1c-89C22:1 Erucic 0.4 AOCS Ce1c-89
C20:5 Timnodonic AOCS Ce1c-89
AOCS Ce1c-89
C20:2 0.1 AOCS Ce1c-89EicosadienoicLesquerolic
C20:1 GadoleicAOCS Ce1c-89
C18:3-9c,11t,13t "-Eleostearic AOCS Ce1c-89C20:0 0.1 AOCS Ce1c-89Arachidic
C20:1-11c,14(OH)
C18:3 Linolenic 2 AOCS Ce1c-89
AOCS Ce1c-89
C18:2 28.4 AOCS Ce1c-89LinoleicRicinoleic
C18:1 Oleic 36.8AOCS Ce1c-89
C17:1 Margaroleic 0.2 AOCS Ce1c-89C18:0 7.5 AOCS Ce1c-89Stearic
C18:1-9c,12(OH)
C17:0 Margaric 0.3 AOCS Ce1c-89
AOCS Ce1c-89
C16:1 3.2 AOCS Ce1c-89PalmitoleicPalmitic 19.6
C15:0 PentadecanoicAOCS Ce1c-89
C12:0 Lauric 0.1 AOCS Ce1c-89C14:0 1 AOCS Ce1c-89Myristic
C16:0
C8:0 AOCS Ce1c-89C10:0 Capric AOCS Ce1c-89
CaprylicTest Parameter Name Result Test Method
D 6584
D 6584
D 6584
Fatty Acid Profile Analysis of Biodiesel
11.0
0.8805
0.3
<0.121.1
61 mL in 720 sec
D 664, Test Method A
Result
D 6584
D 2709
0.50 max.
N/A
Report
0.240 max.
N/A
0.050 max.
EN 14538
D 524
D 874
EN 14538
D 1301a
4.496 D 4451.9-6.0
No. 3 max.
Kinematic Viscosity at 40 °C:
Copper Corrosion (3 hrs at 50 °C):
Sulfated Ash:
360
0.020 max.
Cold Soak Filtration:
Sulfur: 15
0.001 max.
5 max. Ca + Mg
<0.0050.025
Triglycerides4:
E 203
Carbon Residue:
D 1298
EN 14110
D 4176, Procedure 2
D 93
D 6751 Annex
D 7039
D 4951
Moisture5:
Acid Number:
Visual Inspection:
Relative Density at 60 °F:
0.050 max.
Oxidative Stability (110 °C):
N/A
N/A
93 min.
3 min.
N/A
5 max. Ca + Mg
Phosphorus:
Flashpoint (closed cup):
0.020 max.
D 2500
Product Type: B100Poultry Fat
Test Parameter
Cloud point:
Feedstock:
ASTM D 6751 Analysis of Biodiesel
ASTM Limit
Magnesium:
Test Method (current revision)
Diglycerides³:
Monoglycerides²:
N/A
Total Glycerin:
Free Glycerin:
Calcium:
Water & Sediment:
D 6584
Biodiesel Certificate of Analysis
CFPP¹: N/A D 63712

© 2010 Renewable Energy Group, Inc. All Rights Reserved Page 120 of 136
10.28 Rice Bran
Units
0.3 (32.54) °C (°F)
°C
% Mass
% Mass
% Mass
% Mass
% Mass
% Volume
mg KOH/g
Haze
N/A
hrs
°C
% Mass
seconds
ppm
ppm (ug/g)
ppm (ug/g)
% Mass
% Mass
% Mass
mm²/sec.
N/A1,2,3,4,5 These are not ASTM D 6751 specification requirements.
Units%%%%%%%%%%%%%%%%%%%%%%%%%
0.001
0.000
0.0590.281
0.083
UNKNOWNS AOCS Ce1c-89
<0.11.1
C22:1AOCS Ce1c-89
C20:2C20:5 Timnodonic
0.46
111
AOCS Ce1c-89AOCS Ce1c-89
C24:1 AOCS Ce1c-89
0.4
0.8855
0.015
>160
NervonicLignoceric
ErucicBehenic
C24:0
C20:1-11c,14(OH) AOCS Ce1c-89LesquerolicEicosadienoic
C22:0 AOCS Ce1c-89AOCS Ce1c-89
C18:3-9c,11t,13t "-Eleostearic AOCS Ce1c-89
C20:1 Gadoleic AOCS Ce1c-89ArachidicC20:0 AOCS Ce1c-89
12.5
C18:2 AOCS Ce1c-89C18:3 Linolenic AOCS Ce1c-89
Linoleic
C18:1 Oleic AOCS Ce1c-89Stearic
C18:1-9c,12(OH) Ricinoleic AOCS Ce1c-89
C17:1 Margaroleic AOCS Ce1c-892.1C18:0 AOCS Ce1c-89
C16:1 AOCS Ce1c-89C17:0 Margaric AOCS Ce1c-89
PalmitoleicC16:0 Palmitic AOCS Ce1c-89
0.6
1.135.4
47.5
C14:0 AOCS Ce1c-89C15:0 Pentadecanoic AOCS Ce1c-89
Myristic 0.3C12:0 Lauric AOCS Ce1c-89
0.2
0.3
C8:0 AOCS Ce1c-89C10:0 Capric AOCS Ce1c-89
CaprylicTest Parameter Name Result Test Method
D 6584
D 6584
D 6584
Fatty Acid Profile Analysis of Biodiesel
1
0.586< 0.005
D 664, Test Method A
Result
D 6584
D 2709
0.50 max.
N/A
Report
0.240 max.
N/A
0.050 max.
EN 14538
D 524
D 874
EN 14538
D 1301a
4.958 D 4451.9-6.0
No. 3 max.
Kinematic Viscosity at 40 °C:
Copper Corrosion (3 hrs at 50 °C):
Sulfated Ash:
360
0.020 max.
Cold Soak Filtration:
Sulfur: 15
0.001 max.
5 max. Ca + Mg
<0.0050.047
Triglycerides4:
E 203
Carbon Residue:
D 1298
EN 14110
D 4176, Procedure 2
D 93
D 6751 Annex
D 7039
D 4951
Moisture5:
Acid Number:
Visual Inspection:
Relative Density at 60 °F:
0.050 max.
Oxidative Stability (110 °C):
N/A
N/A
93 min.
3 min.
N/A
5 max. Ca + Mg
Phosphorus:
Flashpoint (closed cup):
0.020 max.
D 2500
Product Type: B100Rice Bran
Test Parameter
Cloud point:
Feedstock:
ASTM D 6751 Analysis of Biodiesel
ASTM Limit
Magnesium:
Test Method (current revision)
Diglycerides³:
Monoglycerides²:
N/A
Total Glycerin:
Free Glycerin:
Calcium:
Water & Sediment:
D 6584
Biodiesel Certificate of Analysis
CFPP¹: N/A D 6371-3

© 2010 Renewable Energy Group, Inc. All Rights Reserved Page 121 of 136
10.29 Soybean
Units
0.9 (33.62) °C (°F)
°C
% Mass
% Mass
% Mass
% Mass
% Mass
% Volume
mg KOH/g
Haze
N/A
hrs
°C
% Mass
seconds
ppm
ppm (ug/g)
ppm (ug/g)
% Mass
% Mass
% Mass
mm²/sec.
N/A1,2,3,4,5 These are not ASTM D 6751 specification requirements.
Units%%%%%%%%%%%%%%%%%%%%%%%%%
< 0.005
0.012
0.019
0.0880.473
0.149
0.035
>160
1
0.266
UNKNOWNS AOCS Ce1c-89
<0.1
C24:1 Nervonic AOCS Ce1c-89C24:0 Lignoceric AOCS Ce1c-89
C22:0 Behenic 0.3 AOCS Ce1c-89C22:1 Erucic AOCS Ce1c-89
C20:5 Timnodonic AOCS Ce1c-89
AOCS Ce1c-89
C20:2 AOCS Ce1c-89EicosadienoicLesquerolic
C20:1 GadoleicAOCS Ce1c-89
C18:3-9c,11t,13t "-Eleostearic AOCS Ce1c-89C20:0 AOCS Ce1c-89Arachidic
C20:1-11c,14(OH)
C18:3 Linolenic 8.9 AOCS Ce1c-89
AOCS Ce1c-89
C18:2 55.3 AOCS Ce1c-89LinoleicRicinoleic
C18:1 Oleic 22AOCS Ce1c-89
C17:1 Margaroleic AOCS Ce1c-89C18:0 4.1 AOCS Ce1c-89Stearic
C18:1-9c,12(OH)
C17:0 Margaric AOCS Ce1c-89
AOCS Ce1c-89
C16:1 AOCS Ce1c-89PalmitoleicPalmitic 9.4
C15:0 PentadecanoicAOCS Ce1c-89
C12:0 Lauric AOCS Ce1c-89C14:0 AOCS Ce1c-89Myristic
C16:0
C8:0 AOCS Ce1c-89C10:0 Capric AOCS Ce1c-89
CaprylicTest Parameter Name Result Test Method
D 6584
D 6584
D 6584
Fatty Acid Profile Analysis of Biodiesel
2.1
0.8840
0.3
<0.10.8
67
D 664, Test Method A
Result
D 6584
D 2709
0.50 max.
N/A
Report
0.240 max.
N/A
0.050 max.
EN 14538
D 524
D 874
EN 14538
D 1301a
4.039 D 4451.9-6.0
No. 3 max.
Kinematic Viscosity at 40 °C:
Copper Corrosion (3 hrs at 50 °C):
Sulfated Ash:
360
0.020 max.
Cold Soak Filtration:
Sulfur: 15
0.001 max.
5 max. Ca + Mg
<0.0050.038
Triglycerides4:
E 203
Carbon Residue:
D 1298
EN 14110
D 4176, Procedure 2
D 93
D 6751 Annex
D 7039
D 4951
Moisture5:
Acid Number:
Visual Inspection:
Relative Density at 60 °F:
0.050 max.
Oxidative Stability (110 °C):
N/A
N/A
93 min.
3 min.
N/A
5 max. Ca + Mg
Phosphorus:
Flashpoint (closed cup):
0.020 max.
D 2500
Product Type: B100Soybean
Test Parameter
Cloud point:
Feedstock:
ASTM D 6751 Analysis of Biodiesel
ASTM Limit
Magnesium:
Test Method (current revision)
Diglycerides³:
Monoglycerides²:
N/A
Total Glycerin:
Free Glycerin:
Calcium:
Water & Sediment:
D 6584
Biodiesel Certificate of Analysis
CFPP¹: N/A D 6371-4

© 2010 Renewable Energy Group, Inc. All Rights Reserved Page 122 of 136
10.30 Stillingia
Units
-8.5 (16.7) °C (°F)
°C
% Mass
% Mass
% Mass
% Mass
% Mass
% Volume
mg KOH/g
Haze
N/A
hrs
°C
% Mass
seconds
ppm
ppm (ug/g)
ppm (ug/g)
% Mass
% Mass
% Mass
mm²/sec.
N/A1,2,3,4,5 These are not ASTM D 6751 specification requirements.
Units%%%%%%%%%%%%%%%%%%%%%%%%%
AOCS Ce1c-89
AOCS Ce1c-89Erucic
UNKNOWNS AOCS Ce1c-89AOCS Ce1c-89
C22:0 BehenicC22:1
0.359
Not Tested
Unable to DetermineNot Tested
0.052
Not TestedNot Tested
C24:1 NervonicC24:0 Lignoceric
AOCS Ce1c-89
AOCS Ce1c-89
C20:2 AOCS Ce1c-89C20:5 Timnodonic AOCS Ce1c-89
EicosadienoicLesquerolic
C20:1 GadoleicAOCS Ce1c-89
C18:3-9c,11t,13t "-Eleostearic AOCS Ce1c-89C20:0 AOCS Ce1c-89Arachidic
C20:1-11c,14(OH)
C18:3 Linolenic 41.5 AOCS Ce1c-89
AOCS Ce1c-89
C18:2 31.5 AOCS Ce1c-89LinoleicRicinoleic
C18:1 Oleic 16.7AOCS Ce1c-89
C17:1 Margaroleic AOCS Ce1c-89C18:0 2.3 AOCS Ce1c-89Stearic
C18:1-9c,12(OH)
C17:0 Margaric AOCS Ce1c-89
AOCS Ce1c-89
C16:1 AOCS Ce1c-89PalmitoleicPalmitic 7.5
C15:0 PentadecanoicAOCS Ce1c-89
C12:0 Lauric 0.4 AOCS Ce1c-89C14:0 0.1 AOCS Ce1c-89Myristic
C16:0
C8:0 AOCS Ce1c-89C10:0 Capric AOCS Ce1c-89
Caprylic
Fatty Acid Profile Analysis of BiodieselTest Parameter Name Result Test Method
D 874
EN 14538
1.9-6.0
Not TestedNot Tested
<0.1
0.5
0.4
Result
D 6584
D 2709
0.50 max.
N/A
0.050 max.
D 6584
D 6584
D 6584
0.423
Kinematic Viscosity at 40 °C: D 445
Copper Corrosion (3 hrs at 50 °C): D 130No. 3 max.Not Tested
Sulfated Ash:
360
0.020 max.
Cold Soak Filtration:
Sulfur: 15
0.001 max.
5 max. Ca + Mg
Not Tested
1.5
Carbon Residue:
D 1298
EN 14110
D 4176, Procedure 2
D 93
D 6751 Annex
D 7039
D 4951
EN 14538
D 524
Visual Inspection:
Relative Density at 60 °F:
Triglycerides4:
E 203
D 664, Test Method A
0.000Not Tested
0.708
0.050 max.
Oxidative Stability (110 °C):
N/A
N/A
93 min.
3 min.
N/A
5 max. Ca + Mg
Phosphorus:
Flashpoint (closed cup):
Calcium:
Test Parameter
Cloud point:
Feedstock:
ASTM D 6751 Analysis of Biodiesel
ASTM Limit
Water & Sediment:
Moisture5:
Acid Number:
B100
0.240 max.
D 65840.020 max.
D 2500
Product Type:
Total Glycerin:
N/AMonoglycerides²:
Report
Free Glycerin:
0.156
-12
0.000
Biodiesel Certificate of Analysis
Magnesium:
Test Method (current revision)
Stillingia
CFPP¹: N/A D 6371
Diglycerides³: N/A

© 2010 Renewable Energy Group, Inc. All Rights Reserved Page 123 of 136
10.31 Sunflower
Units
3.4 (38.12) °C (°F)
°C
% Mass
% Mass
% Mass
% Mass
% Mass
% Volume
mg KOH/g
Haze
N/A
hrs
°C
% Mass
seconds
ppm
ppm (ug/g)
ppm (ug/g)
% Mass
% Mass
% Mass
mm²/sec.
N/A1,2,3,4,5 These are not ASTM D 6751 specification requirements.
Units%%%%%%%%%%%%%%%%%%%%%%%%%
<0.0054.439
1a
Arachidic
Linoleic
Stearic
Palmitoleic
Myristic
Caprylic
0.027< 0.0050.000
0.092
UNKNOWNS AOCS Ce1c-89
10.8800
0.9>160
0.032107
0.2
C24:1 Nervonic AOCS Ce1c-89C24:0 Lignoceric 0.4 AOCS Ce1c-89
C22:0 Behenic 0.7 AOCS Ce1c-89C22:1 Erucic AOCS Ce1c-89
C20:2 AOCS Ce1c-89C20:5 Timnodonic AOCS Ce1c-89
Eicosadienoic
C20:1 Gadoleic AOCS Ce1c-89C20:1-11c,14(OH) Lesquerolic AOCS Ce1c-89
C18:3-9c,11t,13t "-Eleostearic AOCS Ce1c-89C20:0 AOCS Ce1c-89
C18:2 27.6 AOCS Ce1c-89C18:3 Linolenic 0.2 AOCS Ce1c-89
C18:1 Oleic 63.6 AOCS Ce1c-89C18:1-9c,12(OH) Ricinoleic AOCS Ce1c-89
C17:1 Margaroleic AOCS Ce1c-89C18:0 3.3 AOCS Ce1c-89
C16:1 AOCS Ce1c-89C17:0 Margaric AOCS Ce1c-89
C15:0 Pentadecanoic AOCS Ce1c-89C16:0 Palmitic 4.2 AOCS Ce1c-89
C12:0 Lauric AOCS Ce1c-89C14:0 AOCS Ce1c-89
C8:0 AOCS Ce1c-89C10:0 Capric AOCS Ce1c-89
Fatty Acid Profile Analysis of BiodieselTest Parameter Name Result Test Method
<0.1
0.035
No. 3 max.
Kinematic Viscosity at 40 °C:
EN 14538
D 524
D 874
EN 14538
D 6584
D 6584
D 6584
0.240 max.
D 6584
D 2709
0.50 max.
N/A
0.050 max.
D 664, Test Method A
D 445
Copper Corrosion (3 hrs at 50 °C): D 130
Sulfated Ash:
1.9-6.0
360
0.020 max.
Cold Soak Filtration:
Sulfur: 15
0.001 max.
5 max. Ca + Mg
0.3<0.1
Calcium:
Triglycerides4:
E 203
Carbon Residue:
D 1298
EN 14110
D 4176, Procedure 2
D 93
D 6751 Annex
D 7039
D 4951
Flashpoint (closed cup):
Moisture5:
Acid Number:
Visual Inspection:
Relative Density at 60 °F:
Water & Sediment:
0.050 max.
Oxidative Stability (110 °C):
N/A
N/A
93 min.
3 min.
N/A
5 max. Ca + Mg
Phosphorus:
Test Parameter
Cloud point:
Feedstock:
ASTM D 6751 Analysis of Biodiesel
ASTM LimitResult
Report
Free Glycerin: D 65840.020 max.
D 2500
Product Type:
0.007
-3
N/A
Total Glycerin:
0.387
0.121N/AMonoglycerides²:
Biodiesel Certificate of Analysis
B100
Magnesium:
Test Method (current revision)
Sunflower
CFPP¹: N/A D 6371
Diglycerides³:
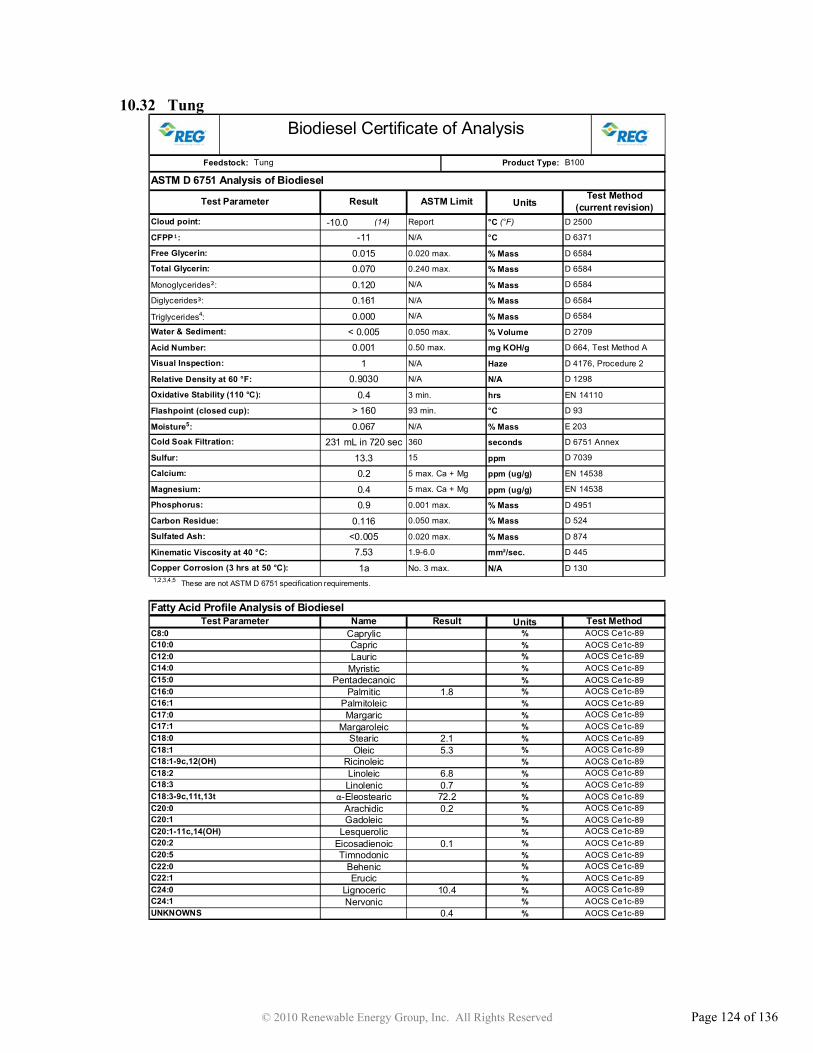
© 2010 Renewable Energy Group, Inc. All Rights Reserved Page 124 of 136
10.32 Tung
Units
-10.0 (14) °C (°F)
°C
% Mass
% Mass
% Mass
% Mass
% Mass
% Volume
mg KOH/g
Haze
N/A
hrs
°C
% Mass
seconds
ppm
ppm (ug/g)
ppm (ug/g)
% Mass
% Mass
% Mass
mm²/sec.
N/A1,2,3,4,5 These are not ASTM D 6751 specification requirements.
Units%%%%%%%%%%%%%%%%%%%%%%%%%
C24:0 Lignoceric 10.4
0.067
AOCS Ce1c-89C24:1 Nervonic AOCS Ce1c-89UNKNOWNS 0.4
AOCS Ce1c-89
0.4
Stearic
Palmitoleic
Myristic
Caprylic
Fatty Acid Profile Analysis of Biodiesel
231 mL in 720 sec
13.3
C22:0
0.9
0.116<0.005
7.53
AOCS Ce1c-89
Arachidic
Linoleic
Behenic AOCS Ce1c-89C22:1 Erucic
C20:2 0.1 AOCS Ce1c-89C20:5 Timnodonic AOCS Ce1c-89
Eicosadienoic
C20:1 Gadoleic AOCS Ce1c-89C20:1-11c,14(OH) Lesquerolic AOCS Ce1c-89
C18:3-9c,11t,13t "-Eleostearic 72.2 AOCS Ce1c-89C20:0 0.2 AOCS Ce1c-89
C18:2 6.8 AOCS Ce1c-89C18:3 Linolenic 0.7 AOCS Ce1c-89
C18:1 Oleic 5.3 AOCS Ce1c-89C18:1-9c,12(OH) Ricinoleic AOCS Ce1c-89
C17:1 Margaroleic AOCS Ce1c-89C18:0 2.1 AOCS Ce1c-89
C16:1 AOCS Ce1c-89C17:0 Margaric AOCS Ce1c-89
C15:0 Pentadecanoic AOCS Ce1c-89C16:0 Palmitic 1.8 AOCS Ce1c-89
C12:0 Lauric AOCS Ce1c-89C14:0 AOCS Ce1c-89
C8:0 AOCS Ce1c-89C10:0 Capric AOCS Ce1c-89
D 6584
D 6584
Test Parameter Name Result Test Method
< 0.0050.000
0.9030
> 160
D 874
EN 14538
D 664, Test Method A
Result
D 6584
D 2709
0.50 max.
N/A
0.050 max.
D 6584
1.9-6.0
No. 3 max.
Kinematic Viscosity at 40 °C:
D 1301a
D 445
Copper Corrosion (3 hrs at 50 °C):
Sulfated Ash:
360
0.020 max.
Cold Soak Filtration:
Sulfur: 15
0.001 max.
5 max. Ca + Mg0.2
0.4
Carbon Residue:
D 1298
EN 14110
D 4176, Procedure 2
D 93
D 6751 Annex
D 7039
D 4951
EN 14538
D 524
Visual Inspection:
Relative Density at 60 °F:
Triglycerides4:
E 203
1
0.001
0.050 max.
Oxidative Stability (110 °C):
N/A
N/A
93 min.
3 min.
N/A
5 max. Ca + Mg
Phosphorus:
Flashpoint (closed cup):
Calcium:
Test Parameter
Cloud point:
Feedstock:
ASTM D 6751 Analysis of Biodiesel
ASTM Limit
Water & Sediment:
Moisture5:
Acid Number:
Report
Free Glycerin: D 65840.020 max.
D 2500
Product Type:
0.015
-11
N/A
Total Glycerin:
0.1610.120
0.070 0.240 max.
N/AMonoglycerides²:
Biodiesel Certificate of Analysis
B100
Magnesium:
Test Method (current revision)
Tung
CFPP¹: N/A D 6371
Diglycerides³:
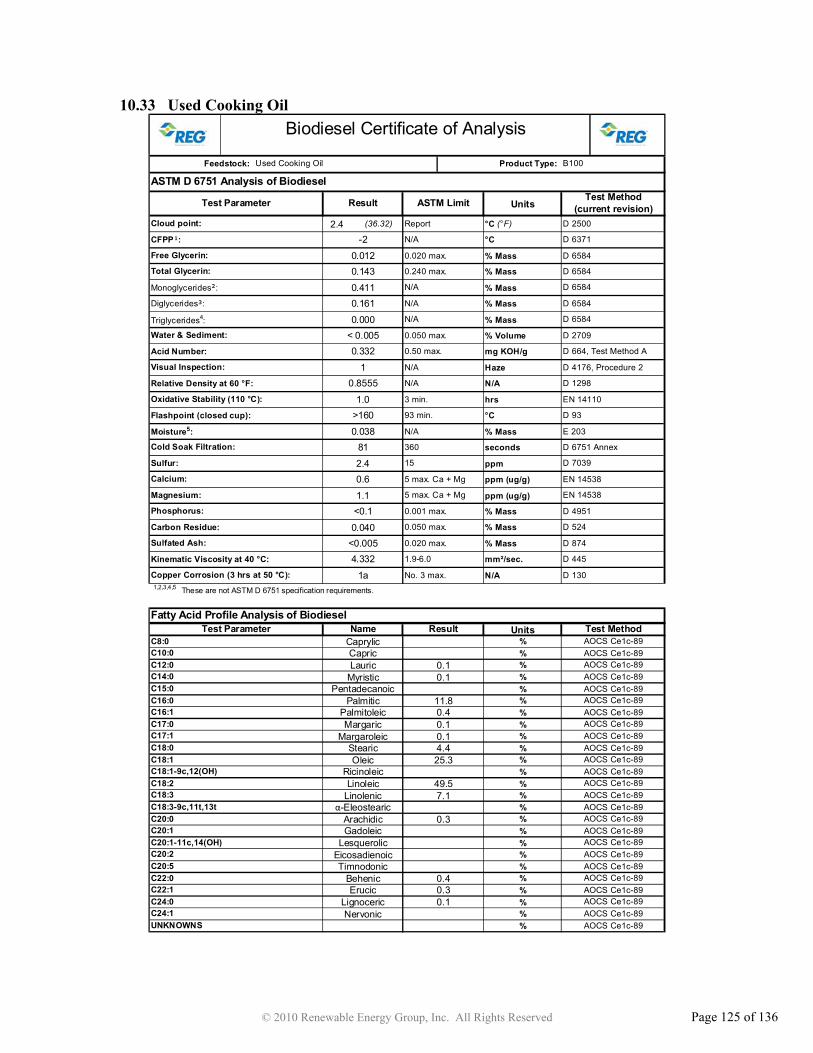
© 2010 Renewable Energy Group, Inc. All Rights Reserved Page 125 of 136
10.33 Used Cooking Oil
Units
2.4 (36.32) °C (°F)
°C
% Mass
% Mass
% Mass
% Mass
% Mass
% Volume
mg KOH/g
Haze
N/A
hrs
°C
% Mass
seconds
ppm
ppm (ug/g)
ppm (ug/g)
% Mass
% Mass
% Mass
mm²/sec.
N/A1,2,3,4,5 These are not ASTM D 6751 specification requirements.
Units%%%%%%%%%%%%%%%%%%%%%%%%%
0.1 AOCS Ce1c-89
0.4 AOCS Ce1c-89
UNKNOWNS AOCS Ce1c-89AOCS Ce1c-89
C22:0 BehenicC22:1
0.411
0.040
1.0>160
0.038
<0.0054.332
C24:1 NervonicC24:0 Lignoceric
Erucic 0.3 AOCS Ce1c-89
C20:2 AOCS Ce1c-89C20:5 Timnodonic AOCS Ce1c-89
Eicosadienoic
C20:1 Gadoleic AOCS Ce1c-89Arachidic
C20:1-11c,14(OH) Lesquerolic AOCS Ce1c-89
C20:0 0.3 AOCS Ce1c-89C18:3-9c,11t,13t "-Eleostearic AOCS Ce1c-89C18:3 Linolenic 7.1 AOCS Ce1c-89
AOCS Ce1c-89
C18:2 49.5 AOCS Ce1c-89LinoleicRicinoleic
C18:1 Oleic 25.3AOCS Ce1c-89
C17:1 Margaroleic 0.1 AOCS Ce1c-89C18:0 4.4 AOCS Ce1c-89Stearic
C18:1-9c,12(OH)
C17:0 Margaric 0.1 AOCS Ce1c-89
AOCS Ce1c-89
C16:1 0.4 AOCS Ce1c-89PalmitoleicPalmitic 11.8
C15:0 PentadecanoicAOCS Ce1c-89
C12:0 Lauric 0.1 AOCS Ce1c-89C14:0 0.1 AOCS Ce1c-89Myristic
C16:0
C8:0 AOCS Ce1c-89C10:0 Capric AOCS Ce1c-89
Caprylic
Fatty Acid Profile Analysis of BiodieselTest Parameter Name Result Test Method
D 874
EN 14538
1.9-6.0
10.8555
<0.1
0.6
1.1
Result
D 6584
D 2709
0.50 max.
N/A
0.050 max.
D 6584
D 6584
D 6584
0.161
Kinematic Viscosity at 40 °C: D 445
Copper Corrosion (3 hrs at 50 °C): D 130No. 3 max.1a
Sulfated Ash:
360
0.020 max.
Cold Soak Filtration:
Sulfur: 15
0.001 max.
5 max. Ca + Mg
81
2.4
Carbon Residue:
D 1298
EN 14110
D 4176, Procedure 2
D 93
D 6751 Annex
D 7039
D 4951
EN 14538
D 524
Visual Inspection:
Relative Density at 60 °F:
Triglycerides4:
E 203
D 664, Test Method A
0.000< 0.0050.332
0.050 max.
Oxidative Stability (110 °C):
N/A
N/A
93 min.
3 min.
N/A
5 max. Ca + Mg
Phosphorus:
Flashpoint (closed cup):
Calcium:
Test Parameter
Cloud point:
Feedstock:
ASTM D 6751 Analysis of Biodiesel
ASTM Limit
Water & Sediment:
Moisture5:
Acid Number:
B100
0.240 max.
D 65840.020 max.
D 2500
Product Type:
Total Glycerin:
N/AMonoglycerides²:
Report
Free Glycerin:
0.143
-2
0.012
Biodiesel Certificate of Analysis
Magnesium:
Test Method (current revision)
Used Cooking Oil
CFPP¹: N/A D 6371
Diglycerides³: N/A

© 2010 Renewable Energy Group, Inc. All Rights Reserved Page 126 of 136
10.34 Yellow Grease
Units
6.0 (42.8) °C (°F)
°C
% Mass
% Mass
% Mass
% Mass
% Mass
% Volume
mg KOH/g
Haze
N/A
hrs
°C
% Mass
seconds
ppm
ppm (ug/g)
ppm (ug/g)
% Mass
% Mass
% Mass
mm²/sec.
N/A1,2,3,4,5 These are not ASTM D 6751 specification requirements.
Units%%%%%%%%%%%%%%%%%%%%%%%%%
0.073< 0.005
950.036
0.009
2
0.019
0.1300.300
0.108
0.88251
UNKNOWNS AOCS Ce1c-89Nervonic AOCS Ce1c-89
C24:0 Lignoceric AOCS Ce1c-890.1C24:1
C22:0 Behenic 0.3 AOCS Ce1c-89C22:1 Erucic 0.2 AOCS Ce1c-89
C20:5 Timnodonic AOCS Ce1c-89
AOCS Ce1c-89
C20:2 AOCS Ce1c-89EicosadienoicLesquerolic
C20:1 GadoleicAOCS Ce1c-89
C18:3-9c,11t,13t "-Eleostearic AOCS Ce1c-89C20:0 0.3 AOCS Ce1c-89Arachidic
C20:1-11c,14(OH)
C18:3 Linolenic 4 AOCS Ce1c-89
AOCS Ce1c-89
C18:2 35 AOCS Ce1c-89LinoleicRicinoleic
C18:1 Oleic 35.6AOCS Ce1c-89
C17:1 Margaroleic 0.2 AOCS Ce1c-89C18:0 8.0 AOCS Ce1c-89Stearic
C18:1-9c,12(OH)
C17:0 Margaric 0.3 AOCS Ce1c-89
AOCS Ce1c-89
C16:1 1.1 AOCS Ce1c-89PalmitoleicPalmitic 14.3
C15:0 PentadecanoicAOCS Ce1c-89
C12:0 Lauric 0.1 AOCS Ce1c-89C14:0 0.5 AOCS Ce1c-89Myristic
C16:0
C8:0 AOCS Ce1c-89C10:0 Capric AOCS Ce1c-89
CaprylicTest Parameter Name Result Test Method
D 6584
D 6584
D 6584
Fatty Acid Profile Analysis of Biodiesel
>1605.2
<0.10.4
<0.16.2
D 664, Test Method A
Result
D 6584
D 2709
0.50 max.
N/A
Report
0.240 max.
N/A
0.050 max.
EN 14538
D 524
D 874
EN 14538
D 1301a
4.552 D 4451.9-6.0
No. 3 max.
Kinematic Viscosity at 40 °C:
Copper Corrosion (3 hrs at 50 °C):
Sulfated Ash:
360
0.020 max.
Cold Soak Filtration:
Sulfur: 15
0.001 max.
5 max. Ca + Mg
<0.0050.026
Triglycerides4:
E 203
Carbon Residue:
D 1298
EN 14110
D 4176, Procedure 2
D 93
D 6751 Annex
D 7039
D 4951
Moisture5:
Acid Number:
Visual Inspection:
Relative Density at 60 °F:
0.050 max.
Oxidative Stability (110 °C):
N/A
N/A
93 min.
3 min.
N/A
5 max. Ca + Mg
Phosphorus:
Flashpoint (closed cup):
0.020 max.
D 2500
Product Type: B100Yellow Grease
Test Parameter
Cloud point:
Feedstock:
ASTM D 6751 Analysis of Biodiesel
ASTM Limit
Magnesium:
Test Method (current revision)
Diglycerides³:
Monoglycerides²:
N/A
Total Glycerin:
Free Glycerin:
Calcium:
Water & Sediment:
D 6584
Biodiesel Certificate of Analysis
CFPP¹: N/A D 6371
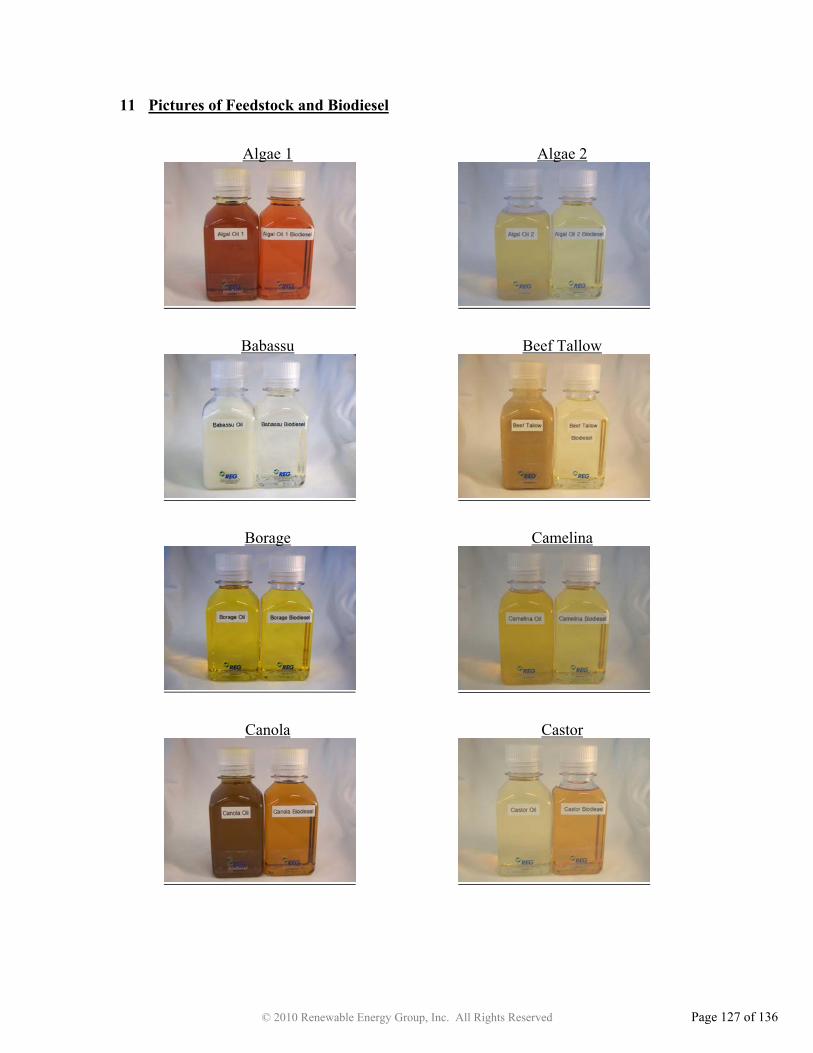
© 2010 Renewable Energy Group, Inc. All Rights Reserved Page 127 of 136
11 Pictures of Feedstock and Biodiesel
Algae 1
Algae 2
Babassu
Beef Tallow
Borage
Camelina
Canola
Castor

© 2010 Renewable Energy Group, Inc. All Rights Reserved Page 128 of 136
Choice White Grease
Coconut
Coffee
Corn
Evening Primrose
Fish
Hemp
Hepar, High IV
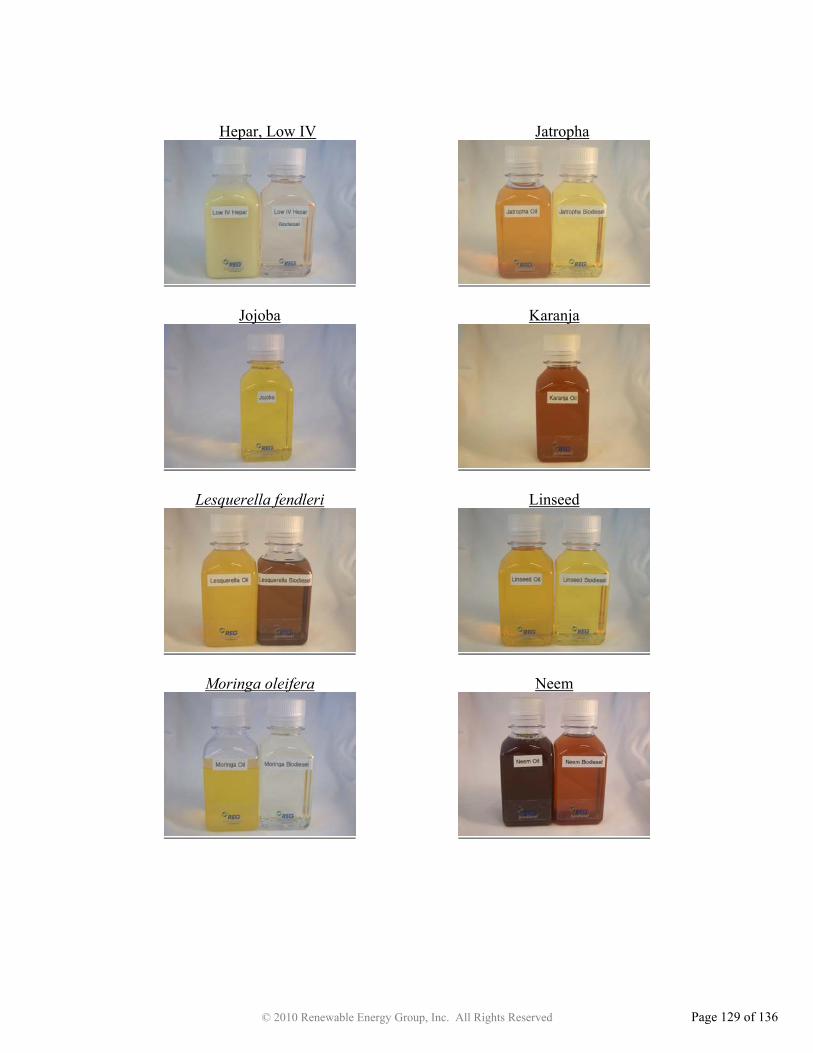
© 2010 Renewable Energy Group, Inc. All Rights Reserved Page 129 of 136
Hepar, Low IV
Jatropha
Jojoba
Karanja
Lesquerella fendleri
Linseed
Moringa oleifera
Neem
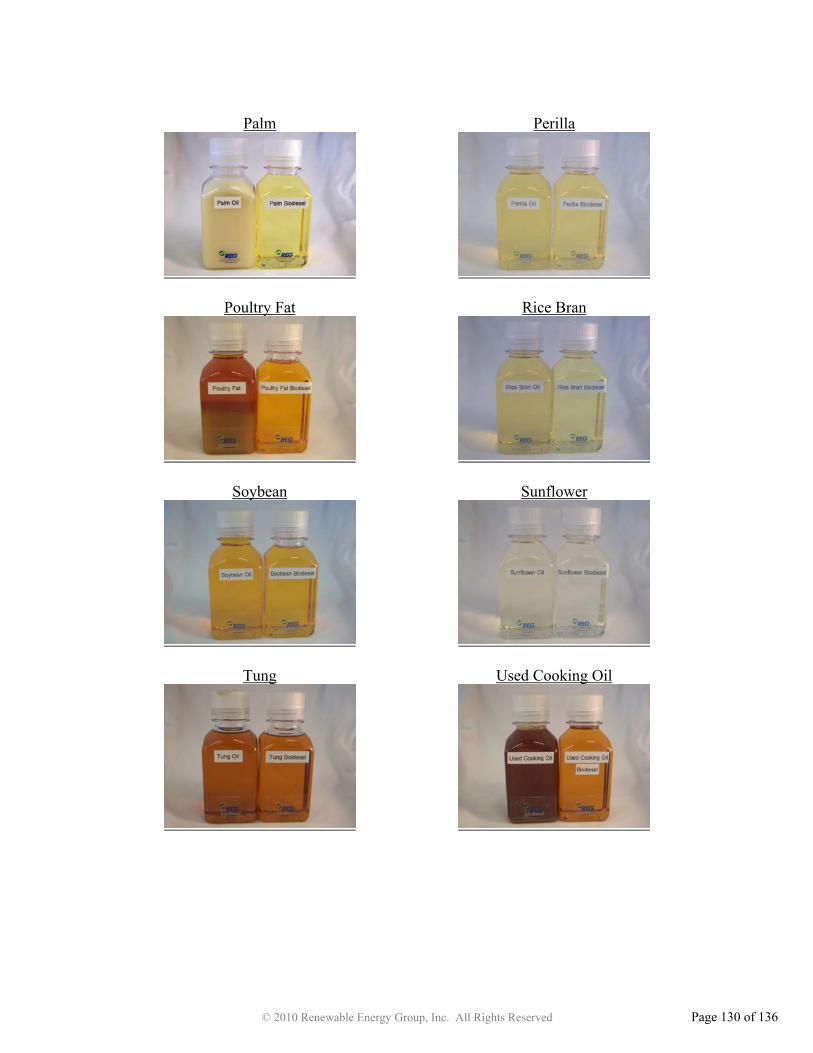
© 2010 Renewable Energy Group, Inc. All Rights Reserved Page 130 of 136
Palm
Perilla
Poultry Fat
Rice Bran
Soybean
Sunflower
Tung
Used Cooking Oil

© 2010 Renewable Energy Group, Inc. All Rights Reserved Page 131 of 136
Yellow Grease
© 2010 Renewable Energy Group, Inc. All Rights Reserved Page 132 of 136
12 References 1 Salunkhe, D.K., J.K. Chavan, R.N. Adsule, and S.S. Kadam. World Oilseeds. New York: Van Nostrand Reinhold, 1992. 2 Pocket Information Manual, A Buyer’s Guide to Rendered Products. National Renderers Association, Inc., 2003. 3 Borage Oil. 26 October 2009 <http://www.bulknaturaloils.com/plantoil/gammalinoleic/borageoil.html> 4 “Feedstocks: A Focus on Camelina.” Biodiesel Magazine. September 2008. 5 Canola Standards and Regulations. 21 October 2009 <http://www.canolacouncil.org/uploads/Standards1-2.pdf> 6 Choice White Grease. National Agricultural Library, United States Department of Agriculture. 21 October 2009 <http://agclass.nal.usda.gov/agt.shtml>. 7 Leighton, Paula. “Coffee Stimulates Biofuel Industry.” G Magazine Online. 8 January 2009. 22 October 2009 < http://www.gmagazine.com.au/news/1037/coffee-stimulates-biofuel-industry>. 8 Hemp Seed Oil, 22 October 2009 < http://www.bulknaturaloils.com/plantoil/alphalinoleic/hempseedoil.html>. 9 Jessen, Holly. “Hemp Biodiesel: When the Smoke Clears.” Biodiesel Magazine. February, 2007. 10 Heparin. Wikipedia. 22 October 2009 < http://en.wikipedia.org/wiki/Heparin>. 11 Achten, W.M.J., et al. “Jatropha bio-diesel production and use.” Biomass and Bioenergy 32 (2008) 1063-1084. 12 Rashid, U. et al., “Moringa oleifera oil: A possible source of biodiesel.” Bioresource Technology (2008), doi:10.1016/j.biortech.2008.03.066 13 "Perilla oil." Encyclopædia Britannica. 2009. Encyclopædia Britannica Online. 22 Oct. 2009 <http://www.britannica.com/EBchecked/topic/451818/perilla-oil>. 14 Sinha, Shailendra, Avinash Kumar Agarwal, and Sanjeev Garg. “Biodiesel development from rice bran oil: Transesterification process optimization and fuel characterization.” Energy Conversion and Management 49 (2008) 1248–1257.

© 2010 Renewable Energy Group, Inc. All Rights Reserved Page 133 of 136
15 Breitenbeck, Gary A. “Chinese Tallow Tress as a Potential Bioenergy Crop for Louisiana.” LSU AgCenter, <http://www.lsuagcenter.com/en/communications/publications/agmag/archive/2008/summer/chinese+tallow+trees+a+potential+bioenergy+crop+for+louisiana.htm>. 16 Knothe, G., Van Gerpen, J., and Krahl, J. The Biodiesel Handbook. Champaign, IL: AOCS Press, 2005. 17 ASTM Standard E203, 2008, “Standard Test Method for Water Using Volumetric Karl Fischer Titration,” ASTM International, West Conshohocken, PA, 2008.
18 ASTM Standard D664, 2009, “Standard Test Method for Acid Number of Petroleum Products by Potentiometric Titration,” ASTM International, West Conshohocken, PA, 2009.
19 AOCS Official Method Ca 5a-40, “Free Fatty Acids,” Official Methods and Recommended Practices of the AOCS, 5th Edition. AOCS Press, Champaign, IL 1998.
20 ASTM D445, 2006, “Standard Test Method for Kinematic Viscosity of Transparent and Opaque Liquids (and Calculation of Dynamic Viscosity),” ASTM International, West Conshohocken, PA, 2006. 21 Firestone D. Physical and Chemical Characteristics of Oils, Fats, and Waxes, 2nd Edition. Champaign, IL: AOCS Press, 2006.!22 AOCS Official Method Cc 13a-43, “Color,” Official Methods and Recommended Practices of the AOCS, 5th Edition. AOCS Press, Champaign, IL 1998. 23 AOCS Official Method Cd 3-25, “Saponification Value,” Official Methods and Recommended Practices of the AOCS, 5th Edition. AOCS Press, Champaign, IL 1998. 24 Winholz M., Budavari S., Blumetti R.F., and Otterbein E.S., editors. The Merck Index 10th Edition. Rahway, NJ: Merck & Company, 1983, 5105. 25 AOCS Ca 2b-38, “Moisture and Volatile Matter Hot Plate Method,” Official Methods and Recommended Practices of the AOCS, 5th Edition. AOCS Press, Champaign, IL 1998. 26 Keith, F. W., Blachly, F. E., Sadler, F. S. J. Am. Oil Chem. Soc. 1954, 31(7), 298-302. 27 AOCS Ca 3a-46, “Insoluble Impurities,” Official Methods and Recommended Practices of the AOCS, 5th Edition. AOCS Press, Champaign, IL 1998.

© 2010 Renewable Energy Group, Inc. All Rights Reserved Page 134 of 136
28 AOCS Ca 6a-40 “Unsaponifiable Matter,” Official Methods and Recommended Practices of the AOCS, 5th Edition. AOCS Press, Champaign, IL 1998. 29 McCormick, R. L.; Ratcliff, M.; Moens, L.; Lawrence R. “Several factors affecting the stability of biodiesel in standard accelerated tests.” Fuel Processing Technology 88 (2007) 651–657. 30 AOCS Cd 12b-92 “Oil Stability Index,” Official Methods and Recommended Practices of the AOCS, 5th Edition. AOCS Press, Champaign, IL 1998. 31 EN 14112:2003, “Fat and oil derivatives – Fatty Acid Methyl Esters (FAME) – Determination of oxidation stability ) (accelerated oxidation test),” 2003. 32 ASTM Standard D7039, 2007, “Standard Test Method for Sulfur in Gasoline and Diesel Fuel by Monochromatic Wavelength Dispersive X-ray Fluorescence Spectrometry,” ASTM International, West Conshohocken, PA, 2007. 33 ASTM Standard D6751, 2009, “Standard Specification for Biodiesel Fuel Blend Stock (B100) for Middle Distillate Fuels,” ASTM International, West Conshohocken, PA, 2009. 34 Hui, Y. H., Editor. “Soybean Oil.” Edible Oil and Fat Products: Oils and Oilseeds, in Bailey’s Industrial Oil and Fat Products, Volume 2. Fifth Edition, Wiley- Interscience, New York. 35 Van Gerpen, P., Clements D., Knothe G., Shanks B., and Pruszko R., Biodiesel Technology Workshop, Chapter 28, Iowa State University, March 2004. 36 ASTM Standard D4951, 2006, “Standard Test Method for Determination of Additive Elements in Lubricating Oils by Inductively Coupled Plasma Atomic Emission Spectrometry,” ASTM International, West Conshohocken, PA, 2006. 37 Bouaid, A., Bajo, L., Martinez, M., and J. Aracil. “Optimization of Biodiesel Production from Jojoba Oil.” IChemE 85(2007): 378-382. 38 ASTM Standard D2500, 2005, “Standard Test Method for Cloud Point of Petroleum Products,” ASTM International, West Conshohocken, PA, 2005. 39 ASTM Standard D6371, 2005, “Standard Test Method for Cold Filter Plugging Point of Diesel and Heating Fuels,” ASTM International, West Conshohocken, PA, 2005. 40 Knothe G. “Dependence of biodiesel fuel properties on the structure of fatty acid alkyl esters.” Fuel Processing Tech 86(2005): 1059 – 1070.

© 2010 Renewable Energy Group, Inc. All Rights Reserved Page 135 of 136
41 Knothe G, Steidley K. R. “Kinematic viscosity of biodiesel components (fatty acid alkyl esters) and related compounds at low temperature.” Fuel 86(2007): 2560 – 2567.
42 ASTM Standard D1298, 1999 (2005), “Standard Test Method for Density, Relative Density (Specific Gravity), or API Gravity of Crude Petroleum and Liquid Petroleum Products by Hydrometer Method,” ASTM International, West Conshohocken, PA, 2005.
43 EN 14214:2008, “Fatty acid methyl esters (FAME) for diesel engines,” 2008. 44 ASTM Standard D874, 2007, “Standard Test Method for Sulfated Ash from Lubricating Oils and Additives,” ASTM International, West Conshohocken, PA, 2007. 45 ASTM Standard D524, 2004, “Standard Test Method for Ramsbottom Carbon Residue of Petroleum Products,” ASTM International, West Conshohocken, PA, 2004. 46 ASTM Standard D2709, 1996 (2006), “Standard Test Method for Water and Sediment in Middle Distillate Fuels by Centrifuge,” ASTM International, West Conshohocken, PA, 2006. 47 ASTM Standard D4176, 2004e1, “Standard Test Method for Free Water and Particulate Contamination in Distillate Fuels (Visual Inspection Procedures),” ASTM International, West Conshohocken, PA, 2004. 48 ASTM Standard D6584, 2008, “Standard Test Method for Determination of Free and Total Glycerin in B-100 Biodiesel Methyl Esters by Gas Chromatography,” ASTM International, West Conshohocken, PA, 2008. 49 ASTM Standard D93, 2008, “Standard Test Methods for Flash Point by Pensky-Martens Closed Cup Tester,” ASTM International, West Conshohocken, PA, 2008. 50 Mallinckrodt Baker Inc., (2009) Methyl Alcohol Material Safety Data Sheet. 51 Proctor & Gamble Chemicals, (2002) Material Safety Data Sheet CE-1095. No. ME108-1.! 52!Proctor & Gamble Chemicals, (2006) Material Safety Data Sheet CE-895. No. ME507-6.! 53 ASTM Standard D130, 2004e1, “Standard Test Method for Corrosiveness to Copper from Petroleum Products by Copper Strip Test,” ASTM International, West Conshohocken, PA, 2004.
© 2010 Renewable Energy Group, Inc. All Rights Reserved Page 136 of 136
54 EN 14538:2006, “Fat and oil derivatives – Fatty acid methyl ester (FAME) – Determination of Ca, K, Mg, and Na content by optical emission spectral analysis with inductively coupled plasma (ICP OES),” 2006. 55 Wang, H., Tang, H., Wilson, J. J. Am. Oil Chem. Soc. 2008, 85, 1083-1086. 56 Knothe G, Van Gerpen J, Krahl J. The Biodiesel Handbook. Champaign, IL: AOCS Press, 2005, 122-136. 57 AOCS Cd 14-95, “Isolated trans Isomers Infrared Spectrometric Method,” Official Methods and Recommended Practices of the AOCS, 5th Edition. AOCS Press, Champaign, IL 1995. 58 AOCS Cd 14d-99, “Rapid Determination of Isolated trans Geometric Isomers in Fats and Oils by Attenuated Total Reflection Infrared Spectroscopy,” Official Methods and Recommended Practices of the AOCS, 5th Edition. AOCS Press, Champaign, IL 1999. 59 ASTM Standard D7371, 2007, “Standard Test Method for Determination of Biodiesel (Fatty Acid Methyl Esters) Content in Diesel Fuel Oil Using Mid Infrared Spectroscopy (FTIR-ATR-PLS Method),” ASTM International, West Conshohocken, PA, 2007.
Related Documents