University of Cape Town 91 Fischer-Tropsch Synthesis over Si0 2 , ZnO and MnO Supported Cobalt Catalysts By Richard Walsh- B.Sc. (Chern. Eng.) Submitted to the University of Cape Town in fulfillment of the requirements for the degree of Master of Engineering Department of Chemical Engineering University of Cape Town Rondebosch Cape Town South Africa 2 December, 1998

Welcome message from author
This document is posted to help you gain knowledge. Please leave a comment to let me know what you think about it! Share it to your friends and learn new things together.
Transcript
Univers
ity of
Cap
e Tow
n
91 Fischer-Tropsch Synthesis over Si02, ZnO
and MnO Supported Cobalt Catalysts
By
Richard Walsh- B.Sc. (Chern. Eng.)
Submitted to the University of Cape Town in fulfillment of the
requirements for the degree of
Master of Engineering
Department of Chemical Engineering
University of Cape Town
Ronde bosch
Cape Town
South Africa
2 December, 1998

The copyright of this thesis vests in the author. No quotation from it or information derived from it is to be published without full acknowledgement of the source. The thesis is to be used for private study or non-commercial research purposes only.
Published by the University of Cape Town (UCT) in terms of the non-exclusive license granted to UCT by the author.
Univers
ity of
Cap
e Tow
n

J)sT' (o (c; 0 w Pt \- s,
<49\J<l(Cfj
Acknowledgements
Acknowledgements
"The most important thing is not so much where we stand as the direction in which we are
going". (Margaret Fishback Powers)
I would like to thank Dr Eric van Steen for the support and encouragement that he has given
me throughout the course of this work, for helping me to keep moving when I felt like doing
some standing.
I would like to add Sasol, FRD and the Catalysis Research Unit to my thanks for the
postgraduate funding received, and trust that this work may serve as a suitable reward for
their investment.
Also thanks to my personal support base, especially Christy Wheeler for her support, help
and the use of her desk for several months.
Thank you to my parents, Rod and Jenny, for the opportunities that they have given me that
have brought me to this point in my ongoing education about life, the universe and
everything.
Viva Chemical Engineering!!!
Synopsis 11
Synopsis
Silica is well known as a support for cobalt supported Fischer-Tropsch catalysts. Silica has a
high surface area with an amorphous structure that promotes dispersion of the active cobalt
phase over the support surface. This dispersion is vital in terms of catalyst performance and
derives from the strength of interaction between the cobalt and the support. However, the
stronger the metal support interaction, the greater is the loss of active cobalt through
formation of cobalt support species that are hard to reduce.
Consequently ZnO and MnO were evaluated in comparison to Si02 as supports for cobalt
supported Fischer-Tropsch catalysts. The aim of the study was to characterise the interaction
between cobalt and the three supports (Si02, ZnO and MnO) in terms of the cobalt
reducibility as visualised using TPR, exposed cobalt surface area and cobalt dispersion as
evaluated using hydrogen chemisorption, and catalytic performance under Fischer-Tropsch
synthesis conditions.
Cobalt nitrate impregnated onto Si02, ZnO and MnO served as base catalysts with which to
evaluate the changes in physical and performance properties associated with the following
alterations in the preparation conditions:
• a change in precursor from cobalt nitrate to cobalt acetate,
• a change in impregnation solution from water to monoethylenediamine in water,
• a change in the pH of the impregnation solution, and
• a change in the contact time between the impregnation solution and the support.
The three supports showed significantly different behaviours in terms of both their metal
support interaction and their resulting performance under Fischer-Tropsch conditions. These
differences were largely a consequence of the physical characteristics of each support. The
degree of crystallinity of the support material was seen to play the greatest role in
determining the strength of metal support interaction. It was found that a high degree of
crystallinity resulted in lower metal support interaction. This was most apparent with the ZnO
support. The lower metal support interaction increased the ease of reducibility of the

Synopsis 111
supported cobalt, a favourable result, but lowered the cobalt dispersion decreasing the activity
of the catalyst through agglomeration of the active cobalt phase.
Cobalt nitrate on Si02 was found to be the most active catalyst as a result of high cobalt
reducibility while maintaining a sufficient metal support interaction to induce a high cobalt
dispersion.

Table of Contents lV
Table of Contents
Acknowledgements
Synopsis
Table of Contents
List of Figures
List of Tables
Page
.................................................••....••.••........•........... 11
................................................................................ lV
Vlll
............................................................................... Xlll
1. Introduction .............. ...................................................................................................... 1
1.1 Commercial Fischer Tropsch Process ........................................................................... 1
1.1.1 History of Catalysts for Fischer Tropsch Synthesis ............................................... 2
1.1.2 Reactor Technology Development.. ....................................................................... 2
1.2 Fischer Tropsch Synthesis ............................................................................................ 4
1.2.1 Reaction Mechanisms and Kinetics ...................................................................... .4
1.2.1.1 Fischer-Tropsch Reaction Mechanisms .............................................................. 5
1.2.1.1.1 Anderson-Schulz-Flory Product Distributions .............................................. 6
1.2.1.1.2 Secondary Reactions .............................................................................. .... ... 7
1.2.1.2 Reaction Kinetics ......................... ....... ...... ..................................................... ... 1 0
1.2.2 Effect of Reaction Parameters ................ ....... ....................................................... 11
1.2.2.1 Effect of Temperature ....................................................................................... 11
1.2.2.2 Effect of Total Pressure ............................ ........................................................ 12
1.2.2.3 Influence ofH2/CO Ratio ................................................................................. 13
1.3 Supported Metal Catalysts for Fischer-Tropsch Synthesis ......................................... 13
1.3.1 ActiveMetal .............................................................................................. ........... 14
1.3.1 .1 Iron .......... .... ...................................................................................................... 14
1.3.1.2 Ruthenium ......................................................................................................... 15
1.3.1.3 Cobalt. ............................................................................................................... 15
1.3.2 Metal and Oxide Promoters ................................................................................. 16
1.3 .3 Choice of Support ................................................................................................ 17
1.4 Catalyst Preparation ....................................................................................... ........ ... .. 17

Table of Contents v
1.4.1 Catalyst Synthesis ................................................................................................ 18
1.4.1.1 Interfacial Coordination Chemistry .......... ........... ................. ............................ 18
1.4.1.1.1 Influence of Precursor Compound ............................................................... 19
1.4.1.1.2 Influence of Support Type ............................................ ... ...... ... .................. 19
1.4.1.1.3 Influence of pH on surface charge in solution ............................................. 21
1.4.1.1.4 Metal Support Interactions ........................................ ..... ............................. 22
1.4.1.1.5 Influence of Impregnation Solution ......................................................... ... . 23
1.4.2 Catalyst Activation .......................... ... ... ............................................................... 24
1.4.2.1 Drying ............................................................................................................... 24
1.4.2.2 Calcination ........................................................................ .... ... ........ .... .. ........... 25
1.4.2.3 Reduction .......................................................................................................... 26
1.5 Catalyst Characterisation ............................................................................................ 27
1.5.1 Temperature Programmed Reduction .................................................................. 28
1.5.1.1 Application ofTPR to metal oxides ................................................................. 29
1.5.2 Hydrogen Chemisorption ..................................................................................... 29
1.5.3 Zeta Potential Measurement. .................. .............................................................. 30
1.6 Catalyst Deactivation .................................................................................................. 30
1.6.1 Catalyst Stability .................................................................................................. 31
1.6.2 Coke Formation .................................................................................................... 32
1. 7 Problems with Supported Cobalt Catalysts for FT -synthesis ..................................... 32
1.7.1 Low Reducibility of Supported Cobalt Catalysts ................................................ 32
1.7.2 Deactivation Through Cobalt Re-oxidation ......................................................... 33
1.7.3 Alternative Supports for Fischer Tropsch Cobalt Catalysts ................................. 34
2. Experimental Procedures ........................................................................................ 35
2.1 Catalyst Synthesis ..... .............................. .................................................................... 35
2.2 Catalyst Characterisation ............................................................................. .... ........... 38
2.2.1 Zeta Potential Measurements ............................................................................... 38
2.2.2 Temperature Programmed Reduction .................................................................. 39
2.2.2.1 TPR Equipment ............................................................................................ .... 39
2.2.2.2 TPR Procedure .................................................................................................. 40
2.2.3 X-Ray Diffractometry .......................................................................................... 42
2.2.4 Transmission Electron Microscopy ..................................................................... .42

Table of Contents vi
2.2.5 Hydrogen Chemisorption ..................................................................................... 43
2.3 Fischer Tropsch Synthesis ...................................... .................. .................................. 44
2.3.1 Experimental Apparatus ....................................................................................... 44
2.3.2 Experimental Procedure ....................................................................................... 47
2.3.3 Product Analysis ....................................... ................. .......................................... 48
3. Results ............................................................................................................................ 49
3.1 Catalyst Characterisation ............................................................................................ 49
3 .1.1 Zeta Potential Measurements .............................................................................. .49
3 .1.2 Equilibration of Impregnation pH ........................................................................ 51
3.1.3 X-Ray Diffractometry .......................................................................................... 53
3.1.4 Temperature Programmed Reduction .................................................................. 54
3.2 Influence of Catalyst Preparation Procedure .............................................................. 51
3.2.1 Base Case for Si02, ZnO and MnO ..................................................................... 51
3.2.1.1 Temperature Programmed Reduction ...... ......................................................... 58
3.2.1.1.1 Extent of Supported Cobalt Reduction ........................................................ 63
3.2.1.2 Hydrogen Chemisorption ........................................................................... ....... 66
3.2.1.3 Transmission Electron Microscopy .................................................................. 68
3.2.1.4 Fischer Tropsch Synthesis ................................................................................ 69
3.2.2 Effect ofthe Type of Cobalt Precursor ................................................................ 76
3.2.2.1 Temperature Programmed Reduction ................ ............................................... 76
3.2.2.1.1 Extent of Supported Cobalt Reduction ........................................................ 80
3.2.2.2 Hydrogen Chemisorption .................................................................................. 84
3.2.2.3 Transmission Electron Microscopy ............................................................. ..... 85
3.2.2.4 Fischer Tropsch Synthesis ................................................................................ 86
3.2.2.4.1 Si02 as a Support ......................................................................................... 87
3.2.2.4.2 ZnO as a Support ......................................................................................... 92
3.2.2.4.3 MnO as a Support ............................................................................. .... ....... 97
3.2.3 Effect ofthe Type oflmpregnation Solution ..................................................... l02
3.2.3.1 Temperature Programmed Reduction ............................................................. l03
3 .2.3 .1.1 Extent of Supported Cobalt Reduction ...................................................... 1 06
3.2.3.2 Hydrogen Chemisorption ........... .................................................................. ... l09
3.2.3.3 Transmission Electron Microscopy ................................................................ 111
Table of Contents Vll
3.2.3.4 Fischer-Tropsch Synthesis .............. ........... ...................................... ............. .. 112
3.2.3.4.1 Si02 as a Support ....................................................................................... 112
3.2.3.4.2 ZnO as a Support ....................................................................................... 117
3.2.3.4.3 MnO as a Support ...................................................................................... 122
3.2.4 Effect of the pH of Impregnation Solution ........................................................ 127
3.2.4.1 Temperature Programmed Reduction ............................................................. 128
3 .2.4.1.1 Extent of Supported Cobalt Reduction ...................................................... 132
3.2.4.2 Hydrogen Chemisorption .............................. ..... ............................................. 135
3.2.4.3 Transmission Electron Microscopy ................................................................ 136
3.2.4.4 Fischer Tropsch Synthesis .............................................................................. 136
3.2.4.4.1 Si02 as a Support ....................................................................................... 136
3.2.4.4.1.1 The Effect of Nitric Acid Addition ...................................................... 137
3.2.4.4.1.2 The Effect of Acetic Acid Addition ..................................................... 141
3.2.4.4.2 MnO as a Support ...................................................................................... 146
3.2.5 Effect ofthe Contact Time between Solution and Support ................................ 151
3.2.5.1 Temperature Programmed Reduction ............................................................ . 152
3.2.5.1.1 Extent of Supported Cobalt Reduction ...................................................... 153
3.2.5.2 Hydrogen Chemisorption ................................................................................ 155
3.2.5.3 Transmission Electron Microscopy ..................................... .. ......................... 155
3.2.5.4 Fischer Tropsch Synthesis ...................................... .... ...................... .. ............ 155
3.3 Time on Stream Behaviour ..................... ....... .................... ....................... ............. .... 161
3.3.1 SiOz as a Support ................................................ .................. ......... ..... ...... ... ...... 161
3.3.2 ZnO as a Support ................................................................................................ 165
3.3.3 MnO as a Support .. .......................................... ................. ......... ................ ... ...... 169
4. Comparison of Si02, ZoO and MoO Supports ................ ... ............ ......... ...... 174
4.1 Physical Characterisation of Si02, ZnO and MnO Catalysts ............. ......... .... .... ...... 174
4.2 Performance of Supported Cobalt Catalysts ............................................................. 179
5. Conclusions ................................................................................................................ . 185
References
Appendices
List of Figures viii
List of Figures Page
1.1. Total product yield as a function of carbon number for Co particles on a flat
Si02 wafer at three different flows .......................................................... 8
1.2. Experimental R. B. Anderson plots ofFT-product distributions showing the
change in chain growth rate constant in the range C11 _14 ••••••••••••••••••••••••••••••••• 9
1.3. (A) ASF plots for 100 Co/15 Zr02/100 AerosiV0.66 Ru. (B) Molar a-olefin
content in the fraction of linear ole fins with the same carbon number as a
function of carbon number. .................................................................. 12
1.4. Representation of the outer sphere of solvation and coordination sphere of
transition metal ions at various positions relative to the oxide-fluid interface ........ 20
1.5. Stability run for a Sasol produced cobalt catalysts ................ ..... .......... ........ 31
2.1. Experimental apparatus for catalyst drying procedure ...................... ........... .. 36
2.2. Diagram of the temperature programmed reduction apparatus ....................... .. 40
2.3. Temperature program used for TPR runs ............. . ................ .. ................. . 41
2.4. Axial bed temperature profile of the reactor in the furnace at 200°C ................. .45
2.5. Schematic of reactor configuration used for FT synthesis ..... ... .................... .. 45
2.6. Schematic of experimental apparatus for Fischer-Tropsch synthesis reaction
work .............................................................................................. 46
3.1. Zeta potential versus pH for Si02, ZnO and MnO ........................................ 50
3.2. XRD patterns for (A) Si02, (B) ZnO and (C) MnO .......... ............. ... .. .......... 53
3.3. Temperature programmed reduction profile for Co30 4 ..............................•... 55
3.4. TPR profiles for MnO in bought form, with HN03 added, and with HN03
added and calcined ............................................................................ 56
3.5. TPR spectra for base case catalysts Co/Si02, Co/ZnO and Co/MnO .................. 59
3.6. Evaluation ofthe extent of reduction of supported cobalt after reduction at
400°C for 16 hours for (A) Co/SiOz, (B) Co/ZnO and (C) Co/MnO .................. 64
3.7. TEM photographs for (A) Co/SiOz, (B) Co/ZnO and (C) Co/MnO ................... 68
3.8. ASF distributions for Co/Si02, Co/ZnO and Co/MnO .................................. 72
3.9. Total organic formation rates for Co/SiOz, Co/ZnO and Co/MnO ..................... 73
3.10. Olefin fraction ofthe linear organic product for Co/Si02, Co/ZnO and Co/MnO ... 74
List of Figures ix
3.11. Alpha olefin fraction ofthe linear olefin product for Co/Si02, Co/ZnO and
Co!MnO ........................................................................................ 75
3 .12. Effect of the choice of precursor on cobalt reducibility ................................. 78
3.13. Evaluation of the extent of reduction of supported cobalt after reduction at
400°C for 16 hours for (A) Co(A)/Si02, (B) Co(A)/ZnO and (C) Co(A)/MnO ...... 82
3.14. TEM photographs for (A) Co(A)/Si02, (B) Co(A)/ZnO and (C) Co(A)/MnO .... ... 86
3.15. Effect of the choice of precursor on the ASF distribution with Si02 as support ..... 89
3.16. Effect of the choice of precursor on the total organic formation rate with
Si02 as support ................................................................................ 90
3.17. Effect of the choice of precursor on the olefin fraction of the linear organic
product with Si02 as support ................. ... ............ ..... ........................... 91
3.18. Effect of the choice of precursor on the a-olefin fraction of the linear
olefins with Si02 as support ................................................................. 92
3.19. Effect ofthe choice of precursor on the ASF distribution with ZnO as support ...... 94
3.20. Effect of the choice of precursor on the total organic formation rate with
ZnO as support .......................................... .... ........................ ....... ... 95
3.21. Effect of the choice of precursor on the olefin fraction of the linear organic
product with ZnO as support .......................... ...... ...................... ......... . 96
3.22. Effect of the choice of precursor on the a-olefm fraction ofthe linear olefins
with ZnO as support .......................................................................... 97
3.23. Effect of the choice of precursor on the ASF distribution with MnO as support ..... 99
3.24. Effect of the choice of precursor on the total organic formation rate with
MnO as support.. . . . . . . . . . . . . . . . . . . . . . . . . . . . . . . . . . . . . . . . . . . . . . . . . . . . . . . . . . . . . . . . . . . . . . . . . . . . . . 100
3.25. Effect of the choice of precursor on the olefin fraction of the linear organic
product with MnO as support .................... ....... .................................... 101
3.26. Effect of the choice of precursor on the a-olefin fraction of the linear olefins
with MnO as support ......................................................................... 102
3.27. Effect of the addition ofMED to the impregnation solution on supported
cobalt reducibility .. .. ........................................................... ... ........... 104
3.28. Evaluation of the extent of reduction of supported cobalt after reduction at 400°C
for 16 hours for (A) Co(MED)/Si02, (B) Co(MED)/ZnO and
(C) Co(MED)!MnO .......................................................................... 107

List of Figures X
3.29. TEM photographs for (A) Co(MED)/Si02, (B) Co(MED)/ZnO and
(C) Co(MED)/MnO ........................................................................... 111
3.30. Effect of the type of impregnation solution on the ASF distribution for cobalt
nitrate on Si02 ................................................................................. 114
3 .31. Effect of the type of impregnation solution on the total organic formation rate
for cobalt nitrate on Si02 .................................................................... 115
3.32. Effect ofthe type of impregnation solution on the olefin fraction ofthe linear
organic product for cobalt nitrate on Si02 ................................................. 116
3.33. Effect of the type of impregnation solution on the a-olefin fraction of the
linear olefins for cobalt nitrate on Si02 .................................................... 117
3.34. Effect ofthe type of impregnation solution on the ASF distribution for cobalt
nitrate on ZnO ................................................................................. 119
3.35. Effect of the type of impregnation solution on the total organic formation rate
for cobalt nitrate on ZnO ..................................................................... 120
3.36. Effect ofthe type of impregnation solution on the olefin fraction ofthe linear
organic product for cobalt nitrate on ZnO ................................................. 121
3.37. Effect ofthe type of impregnation solution on the a-olefin fraction ofthe
linear olefins for cobalt nitrate on ZnO .................................................... 122
3.38. Effect of the type of impregnation solution on the ASF distribution for cobalt
nitrate on MnO ................................................................................ 124
3.39. Effect of the type of impregnation solution on the total organic formation rate
for cobalt nitrate on MnO ................................................................... 125
3.40. Effect of the type of impregnation solution on the olefin fraction of the linear
organic product for cobalt nitrate on MnO ................................................ 126
3 .41. Effect of the type of impregnation solution on the a-olefin fraction of the
linear olefins for cobalt nitrate on MnO ................................................... 127
3.42. Effect of the pH of the impregnation solution on supported cobalt reducibility
for Co/1/Si02 and Co/4/MnO ............................................................... 130
3.43. Effect of the pH of the impregnation solution on supported cobalt reducibility
for Co(A)/4/Si02 .............................................................................. 132
3 .44. Evaluation of the extent of reduction of supported cobalt after reduction at 400°C
for 16 hours for (A) Co/1/Si02, (B) Co(A)/4/Si02 and (C) Co/4/MnO ............... 133
3.45. Effect of the pH of impregnation solution on the ASF distribution for cobalt

List of Figures XI
nitrate on Si02 ................................................................................. 138
3.46. Effect of the pH of impregnation solution on the total organic formation rate
for cobalt nitrate on Si02 ..................................... ... .... ... ...................... 139
3.47. Effect of the pH of impregnation solution on the olefm fraction of the linear
organic product for cobalt nitrate on Si02 ................................................. 140
3.48. Effect of the pH of impregnation solution on the a-olefin fraction ofthe linear
olefins for cobalt nitrate on Si02 ........................................................... 141
3.49. Effect of the pH of impregnation solution on the ASF distribution for cobalt
acetate on Si02 ........ ........................................................................ 143
3.50. Effect of the pH of impregnation solution on the total organic formation rate
for cobalt acetate on Si02 .................................................................... 144
3.51. Effect of the pH of impregnation solution on the olefin fraction ofthe linear
organic product for cobalt acetate on Si02 .............. .. ................................ 145
3.52. Effect of the pH of impregnation solution on the a-olefin fraction of the linear
olefins for cobalt acetate on Si02 ............................................................ 146
3.53. Effect of the pH of impregnation solution on the ASF distribution for cobalt
nitrate on MnO . .............................. . ................. . ...... .... .................... 148
3.54. Effect of the pH of impregnation solution on the total organic formation rate
for cobalt nitrate on MnO ................ . ................................................... 149
3.55. Effect of the pH of impregnation solution on the olefin fraction ofthe linear
organic product for cobalt nitrate on MnO .. ..................... .. ........... . ..... . .... . 150
3.56. Effect ofthe pH of impregnation solution on the a-olefin fraction ofthe linear
ole fins for cobalt nitrate on MnO .......... . ................................................ 151
3.57. Effect of the contact time between impregnation solution and support on
the reducibility of cobalt nitrate on Si02 .......... . ........................................ 152
3.58. Evaluation of the extent of reduction ofCo/O/Si02 after reduction at 400°C for
16 hours .............................................. . ................... . ..................... 154
3.59. Effect of the contact time between impregnation solution and support on the
ASF distribution for cobalt nitrate on Si02 ................................................ 158
3.60. Effect of the contact time between impregnation solution and support on the
total organic formation rate for cobalt nitrate on Si02 ................................... 159
3.61. Effect of the contact time between impregnation solution and support on the
olefin fraction of the linear organic product for cobalt nitrate on Si02 ........ ... ..... 160

List of Figures Xll
3.62. Effect of the contact time between impregnation solution and support on the
a.-olefin fraction of the linear olefins for cobalt nitrate on Si02 ........................ 161
3.63. Time on stream activity for Co/Si02 ....................................................... 162
3.64. Time on stream behaviour of the ASF distribution for Co/Si02 ........................ 163
3.65. Time on stream behaviour of the total olefin fraction of the organic product
for Co/Si02 .................................................................................... 164
3.66. Time on stream behaviour of the a.-olefin ton-paraffin ratio ofthe organic
product formed over Co/Si02 ............................................................... 165
3.67. Time on stream activity for Co(A)/ZnO ................................................... 166
3.68. Time on stream behaviour of the ASF distribution for Co(A)/ZnO ................... 167
3.69. Time on stream behaviour of the total olefin fraction of the organic product
for Co(A)/ZnO ................................................................................ 168
3.70. Time on stream behaviour of the a.-olefin ton-paraffin ratio of the organic
product formed over Co(A)/ZnO ........................................................... 169
3.71. Time on stream activity for Co(MED)/MnO ............................................. 170
3.72. Time on stream behaviour of the ASF distribution for Co(MED)/MnO .............. 171
3.73. Time on stream behaviour ofthe total olefin fraction of the organic product
for Co(MED)/MnO ........................................................................... 172
3.74. Time on stream behaviour of the a.-olefin ton-paraffin ratio of the organic
product formed over Co(MED)/MnO ...................................................... 173
4.1. Exposed cobalt surface area as a function of the extent of reduction of cobalt
obtained during TPR. . . . . . . . . . . . . . . . . . . . . . . . . . . . . . . . . . . . . . . . . . . . . . . . . . . . . . . . . . . . . . . . . . . . . . . . . 179
4.2. Organic yield at steady state as a function of the exposed cobalt surface area
obtained from hydrogen chemisorption measurements .................................. 181

List of Tables Xlll
List of Tables
Page
1.1 Kinetics equations for CO hydrogenation over different metals ................... .. ... 1 0
2. 1. Physical characteristics of the three support, Si02, ZnO and MnO . . .. . ... .... .. . . . .. .. 37
2.2. Composition and nomenclature of catalysts . .. . . .. . . ....... . . . .. . .......... .. ...... ... .... 37
2.3. Re-reduction and reaction conditions for Fischer-Tropsch synthesis . ......... .. ...... 47
3. 1. Impregnation pH equilibration for cobalt nitrate and cobalt acetate on Si02, ZnO
andMnO .. . ........ .. . . ... . ..... . ...... . ............ . ........... . ... . ..... . . .. .. . .............. 52
3.2. TPR hydrogen consumption data for MnO with and without nitric acid addition .. . 57
3.3. TPR hydrogen consumption data for Co/Si02, Co/ZnO and Co/MnO ................ 59
3.4. TPR hydrogen consumption data for evaluation of the extent of reduction
of supported cobalt for Co/Si02, Co/ZnO and Co/MnO . .... .. . .. ... ... ... .............. 65
3.5. Surface area, dispersion, particle diameter and hydrogen adsorption reversibility
for Co/Si02, Co/ZnO and Co/MnO .. .. . ..... . . ............ .. ... .. ... .. .. . . .. .. . . . . . . .... ... 67
3.6. Characteristic data obtained in the Fischer-Tropsch synthesis for Co/Si02,
Co/ZnO and Co/MnO . .. . . . ... . .. .. .. . ................................ . .. .. ... . .............. 70
3.7. Effect of the choice of precursor on hydrogen consumption during TPR for Si02,
ZnO and MnO ... . .......... . .... .. . ... . ... .. . ...... .. . . .......... . .. . .. ..... .... .. ............ 77
3.8. TPR hydrogen consumption data for evaluation of the extent of reduction
of supported cobalt for Co(A)/Si02, Co(A)/ZnO and Co(A)/MnO ..... .. .. . .. . .. ..... 81
3.9. Surface area, dispersion, particle diameter and hydrogen adsorption reversibility
for Co(A)/Si02, Co(A)/ZnO and Co(A)/MnO ... ...... . . ...... ... .... . ........... ..... .. . 84
3.10. Effect of the choice of precursor on the activity and selectivity of cobalt
supported on Si02 ..... . ....... . ..... .... ... . ............. . ..... . .... . ........ .......... .... .. 87
3 .11 . Effect of the choice of precursor on the activity and selectivity of cobalt
supported on ZnO. . .. . . . . . . . . . . . . . . . . . . . . . . . . . . . . . . . . . . . . . . . . . . . . . . . . . . . . . . . . . . . . . . . . . . . . . . . . 93
3. 12. Effect of the choice of precursor on the activity and selectivity of cobalt
supported on MnO ....... ... .... . .......... . ...... . ..... . . . ................ . .. .. . .. .. . ....... 98
3.13. Effect ofthe addition ofMED to the impregnation solution on hydrogen
List of Tables xiv
consumption during TPR for cobalt nitrate onto SiOz, ZnO and MnO ............... 105
3.14. TPR hydrogen consumption data for evaluation of the extent of reduction
of supported cobalt for Co(MED)/Si02, Co(MED)/ZnO and Co(MED)/Mn0 ....... 108
3.15. Surface area, dispersion, particle diameter and hydrogen adsorption reversibility
for Co(MED)/Si02, Co(MED)/ZnO and Co(MED)/MnO ......................... ...... 110
3.16. Effect ofthe addition ofMED to the impregnation solution on the activity
and selectivity of cobalt nitrate on SiOz ................................................... 113
3.17. Effect ofthe addition ofMED to the impregnation solution on the activity
and selectivity of cobalt nitrate on ZnO ................................................... 118
3.18. Effect ofthe addition ofMED to the impregnation solution on the activity
and selectivity of cobalt nitrate on MnO ........... ..................... .. ...... ........... 123
3.19. Effect of the addition of acid to the impregnation solution on hydrogen
consumption during TPR for Co/l/Si02, Co/4/MnO and Co(A)/4/Si02 .............. 131
3.20. TPR hydrogen consumption data for evaluation of the extent of reduction
of supported cobalt for Co/1/SiOz, Co(A)/4/Si02 and Co/4/MnO ..................... 134
3.21. Surface area, dispersion, particle diameter and hydrogen adsorption reversibility
for Co/1/SiOz, Co(A)/4/SiOz and Co/4/MnO ............................................. 136
3.22. Effect of the pH of impregnation solution on the activity and selectivity of
cobalt nitrate on Si02 ......................... ...... .... ............. ......................... 137
3.23. Effect of the pH of impregnation solution on the activity and selectivity of
cobalt acetate on Si02 ................. .. .. . .................................................. 142
3.24. Effect of the pH of impregnation solution on the activity and selectivity of
cobalt nitrate on MnO ... . . ........ . .. .......... .. . .................... ....................... 147
3.25. Effect of impregnation solution contact time on hydrogen consumption during
TPR for cobalt nitrate on Si02 ............................................................ .. 153
3.26. TPR hydrogen consumption data for evaluation of the extent of reduction
of supported cobalt for Co/0/SiOz .......................................................... 154
3.27. Surface area, dispersion, particle diameter and hydrogen adsorption reversibility
for Co/0/SiOz .................................................................................. 155
3.28. Effect of the contact time between support and impregnation solution on the
activity and selectivity of cobalt nitrate on Si02 •...•.••••••.•.•••••• •• ••••••••• • •.• •••••• 156

CHAPTER!
INTRODUCTION

{
Chapter 1 - Introduction
1. Introduction
Fischer-Tropsch synthesis involves the production of hydrocarbons from CO hydrogenation
over transition metals from synthesis gas. This process is perhaps the most promising source
of chemicals and fuels from non-petroleum based supply such as coal and natural gas
[ Adesina, 1996].
A great deal of work has been carried out in order to obtain the "optimal catalyst" for this I process. Research has covered:
• The type of active metal -ruthenium [e.g. Regaini et al., 1996], iron [e.g. Donnelly and
( . Satterfield, 1989, Bukur et al., 1995], cobalt [e.g. Kuipers et al., 1996, and Iglesia et al.,
1992], and combinations ofthese [e.g. Kogelbauer et al., 1996],
the choice of support - various inorganic oxides including silica [e.g. Coulter and Sault,
1995], alumina [e.g. Hilmen et al., 1996] as well as titania, magnesia and zirconia,
• the preparation procedure - including impregnation techniques such as incipient wetness
and chemical vapour deposition,
• and the activation procedure [e.g. Bukur et al., 1995].
In order to optimise the production of the desired product in any catalytic process, we require
J a catalyst that is active and selective to that desired product. In order to achieve this r optimisation, a thorough understanding of the functioning of the catalyst and the reaction
pathway is needed. The specific functioning of the catalyst is affected and altered by a
number of variables throughout the processes of preparation and activation. Variables such as
pH of the impregnation solution, and the calcination temperature have a significant influence
on the fmal activity and selectivity of the catalyst.
1.1 Commercial Fischer Tropsch Process
Currently South Africa is in the lead in terms of commercial Fischer Tropsch application.
Sasol operates three plants with a combined production capacity of roughly 4 million tonnes
per year. Other companies operating this process are Shell in Malaysia, and Mossgas in South

Chapter 1 - Introduction 2
Africa. In order to make the FT process competitive with crude oil processes, innovative
work is being carried out in the field ofFT reactor technology and catalyst development.
1.1.1 History of Catalysts for Fischer Tropsch Synthesis
In 1902, Sabatier and Senderens [1902] formed methane over cobalt and nickel catalysts
using a feed consisting of various ratios of H2 and CO. In 1913, BASF produced a range of
liquid products over cobalt at high pressure [BASF, 1913]. Fischer and Tropsch followed this
work in 1923 with a liquid product formed at high pressure (-150 bar) over a fused iron
catalyst. The liquid was rich in oxygenates. Further work focussed on cobalt and nickel as
iron deactivated quickly under the reaction conditions employed, however interest in nickel
waned for two reasons: firstly, the methane selectivity was high, and secondly, nickel was
expelled from the reactors in the form of nickel carbonyl, resulting in loss of activity as the
nickel mass dropped. Cobalt with ThOz/MgO and Kieselguhr was the main catalyst used in
the first commercial Fischer Tropsch operations in Germany in 1936. In 1936, Pichler [1952]
discovered that lower reaction pressures extended the lifetime of the iron catalyst, introducing
iron as a competitive alternative to cobalt. In 1955, Sasol went online commercially, making
use of a precipitated iron catalyst [Dry, 1981]. Considerable research has been carried out on
the iron catalyst, and currently a precipitated iron catalyst is used at Sasol that is promoted
with copper, potassium and other oxides.
1.1.2 Reactor Technology Development
The type of reactor used and the operating conditions employed are governing factors with
respect to FT product distribution. Temperature becomes a major factor because the FT
process is highly exothermic (about 145 kJ per mole of carbon incorporated into a growing
chain) requiring the efficient removal of large amounts of heat. Increased temperatures result
in higher methane yields, carbon deposition and particle fragmentation, consequently the
reactor design needs an effective heat removal system.
The first reactors used were glass tube fixed bed types and were laboratory scale with an ID
of about 5mm. However as the Fischer-Tropsch process was upgraded and attempts were
Chapter 1 - Introduction 3
made to commercialise it, more attention needed to be paid to the reactor design. The three
major reactor configurations resulting were the fixed bed, the slurry bed and the fluidised bed
reactor types.
For the fixed bed reactor, the bulk of the work focussed on the removal of heat from the
system. Various designs have been employed to achieve this. In the original German reactors,
catalyst was packed between parallel metal plates. Metal tubes carrying cooling water ran
horizontally through the plates [Frohning et al., 1997]. Heat removal was poor as a result of
low linear gas velocities through the bed. A recycle ratio was employed to increase the fresh
feed velocity through the bed into the turbulent regime. At these conditions heat transfer
between the catalyst and the reactor walls was vastly improved. The current commercial fixed
bed system uses a multi-tubular design, with a typical reactor for industrial applications using
between 1500 and 2200 tubes in order to combat the high exothermicity of reaction. The
fixed bed configuration makes use of the cheapest catalyst available, namely alkalised fused
iron, producing mainly linear waxes, which can be hydrocracked to diesel. A number of
disadvantages arise with this reactor type. A high pressure drop across the bed results in
increased gas compression costs, while higher temperatures leads to carbon deposition with
particle expansion, disintegration and bed plugging.
The slurry bed reactor was first investigated by Fischer, and bears several advantages over
the fixed bed type. In the slurry reactor, gas is bubbled through a suspension of fine catalyst
particles. Heat is removed by circulating the slurry through external heat exchangers, or by
heat exchangers immersed in the slurry bed, thus heat exchanger design is easier than in the
fixed bed case. Higher temperatures than those used in fixed beds can be operated in slurry
reactors as carbon deposition on the catalyst does not adversely affect the performance of the
catalyst [Dry, 19 81 ].
Interest in fluidised bed reactors for the Fischer Tropsch synthesis resulted from their
successful employment as catalytic cracking units in the petroleum industry. Two types of
reactors are available, (1) the fixed fluidised bed (FXFBR), and (2) the circulating fluidised
bed (CFB). In the fixed fluidised bed, the catalyst remains "stationary", while catalyst is
entrained in the gas stream in the circulating option. Problems associated with these
configurations include achieving uniform fluidisation of the entire bed without gas bypass.
Chapter 1 - Introduction 4
Sasol II and III plants use circulating fluidised beds (CFB) as the benefits of this
configuration outweigh the negatives. Benefits include improved heat transfer characteristics
and higher gas throughputs than fixed beds, while lower pressure drops reduce gas
compression costs. Downtime is minimal as the reactor offers the option to add fresh catalyst
online.
There is a great deal of interest in the fixed fluidised bed reactor (FXFBR) and the bubble
column slurry reactor (BCSR). The FXFBR improves conversion and reduces installation and
compression costs compared to the CFB. In the BCSR, catalyst attrition and erosion is
minimised, while increased dispersion of the catalyst in the liquid suspension results in
uniform temperature and allows higher catalyst loading.
1.2 Fischer Tropsch Synthesis
Interest in the Fischer Tropsch process has fluctuated with the troughs and crests of the
petrochemical industry. For example the discovery of large oil deposits in the Middle East
resulted in decreased interest in theFT process. However, since the Middle east oil crisis of
1973, interest in Fischer Tropsch has resurfaced strongly as a source of chemicals and fuels
from non-petroleum based supplies such as coal and natural gas [Adesina, 1996]. The
majority of interest has manifested itself in the search for promising catalysts, as well as the
optimisation of reactor configurations and an understanding of the effect of reaction
parameters.
1.2.1 Reaction Mechanisms and Kinetics
The following section serves to introduce how the Fischer Tropsch reaction takes place (i.e.
what is happening to achieve the products from the reactants), as well as to evaluate certain
parameters that determine the rate at which this reaction can be achieved and the factors
inhibiting this.

Chapter 1 - Introduction 5
1.2.1.1 Fischer-Tropsch Reaction Mechanisms
CO hydrogenation via the Fischer-Tropsch process involves a complex system of series
parallel reaction steps and secondary reactions. Fischer-Tropsch synthesis is a polymerisation
type reaction that uses CHx monomers derived from synthesis gas to form higher molecular
weight hydrocarbons on the catalyst surface. The reaction proceeds via the following steps:
1. Hz and CO adsorption
2. Chain initiation
3. Chain growth
4. Chain termination
5. Product desorption
6. Readsorption and further reaction.
The simplified FT reaction can be written as follows:
These reactions can be accompanied by the water-gas shift reaction illustrated as follows:
co
A number of mechanisms have been proposed around this general picture of FTS.
Wojciechowski [1988] has presented a more detailed formulation of the necessary
components of each FTS mechanism as follows:
1. Hz and CO adsorb onto the active sites at the catalyst surface to form dissociated H atoms
and adsorbed C and 0 atoms. These adsorbed species interact leading to the formation of
CHx, OH, etc.
2. The monomeric species for chain growth can be visualised to be CH2 adsorbed on the
surface which is formed from adsorbed C and H species.
Chapter 1 - Introduction 6
3. Chain growth takes place via monomers formed near the growing chain, which migrate
towards the growing chain through surface diffusion.
4. 1-2 shift attachments may occur during chain growth resulting in branched hydrocarbon
formation, however as yet there is no conclusive evidence.
5. The termination stage and the resulting product type is determined by the type of species
adsorbed on the site adjacent to the growing chain. For example, when H atoms
predominate around the growing chain, termination as an n-paraffin via a-hydrogenation
becomes more likely.
6. The system pressure and temperature, and the H2/CO ratio are governing factors that
affect both kinetics as well as the product distribution ofFTS.
7. Product spectrums tend to follow Anderson-Schulz-Flory chain length distributions. (See
Chapter 1.2 .1.1.1)
The main products of the FTS reaction are saturated and unsaturated aliphatic hydrocarbons,
with minor amounts of alcohols, aldehydes and ketones formed as by-products. The growing
linear alkyl chains are chemically bound to the surface of the catalyst at the terminal carbon.
Termination of the chain occurs either by P-abstraction yielding an a-olefin, or by a
hydrogenation yielding an n-paraffin.
1.2.1.1.1 Anderson-Schulz-Flory Product Distributions
Because Fischer Tropsch synthesis is a chain growth reaction, its total product yield, on a
molar basis, decreases exponentially with increasing chain length. This chain growth
mechanism yields a molar distribution called the Ande:son-Schulz-Flory distribution, which
describes the probability of an alkyl group being inserted in an adsorbed chain. The
probability an is defined as follows:
an = molar yield of chains with carbon number n + 1
molar yield of chains with carbon number n
The Anderson-Schulz-Flory (ASF) distribution is obtained from the following mathematical
relationship:
Chapter 1 -Introduction 7
Log Men = log ((1-a)/a) + N log (a)
where N is the carbon number and Mn is the molar fraction of that carbon number. A plot of
log Mn versus Cn yields a straight line with a slope of log a . The maximum achievable value
of a would be 1. This is to all intents and purposes unachievable as a certain amount of chain
termination takes place at every carbon number. A number of factors influence the chain
growth probability. The probability varies according to the active metal used (i.e. iron, cobalt
or ruthenium) and the synthesis conditions (i.e. the temperature, partial pressures of reactants,
and molar feed ratio of H2/CO). Further change in the growth probability derives from the
addition of different promoters as well as differing amounts of the same promoter. These
variations deal with the slope of the straight line. A number of authors [e.g. Wojciechowski
and Sarup, 1988; Kuipers et al, 1995] have noted deviations from this straight-line prediction
as a result of secondary reactions.
1.2.1.1.2 Secondary Reactions
Secondary reactions strongly influence the FT product spectrum and can even be used to
optimise the selectivity to some desired product range. The secondary reactions that take
place are reinsertion, hydrogenation, and hydrogenolysis. Reactive products such as olefins
are able to be inserted in new growing chains via secondary reactions, or may act as chain
initiation species themselves.
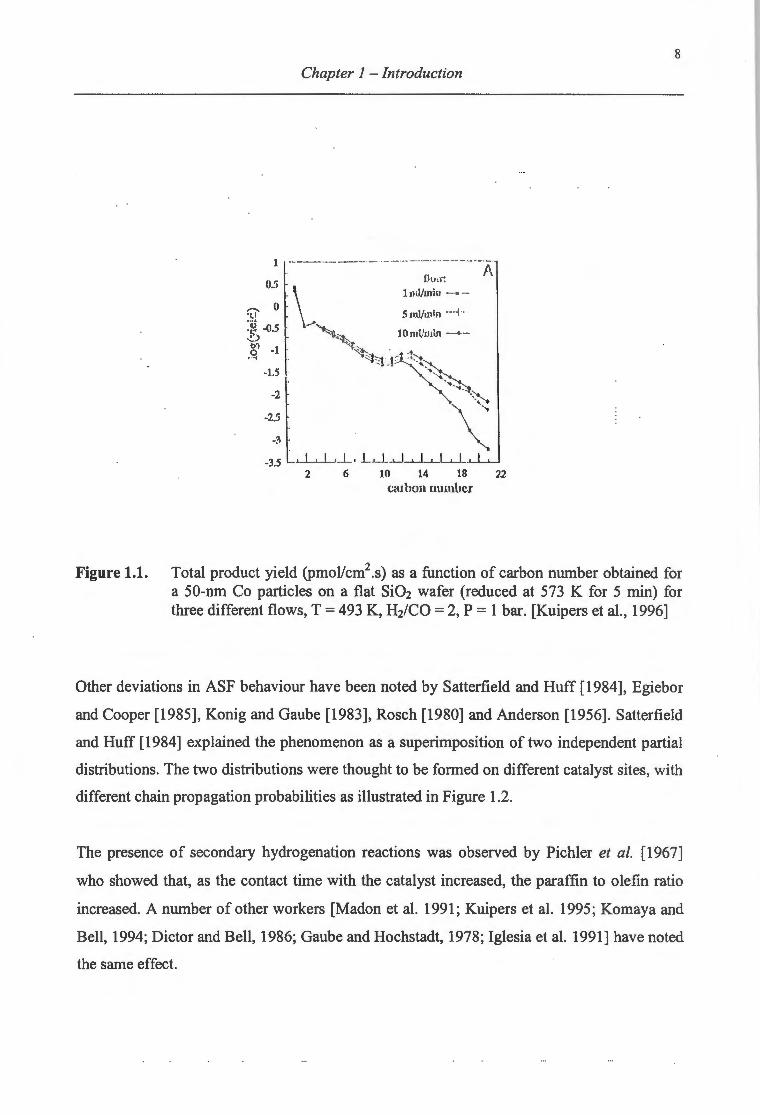
Kuipers et al [1996] produced product distributions that varied significantly from straight line
ASF behaviour as shown in Figure l.l.They attributed this deviation to reinsertion and/or
hydrogenolysis reactions. These secondary reactions were found to be chain-length
dependent resulting in high selectivities to middle distillates (C10 to C13). The effect of these
reactions in this carbon number region was so dominant that they observed chain growth
probabilities (a) above 1. This is not possible, even though reinsertion of a-olefins reverses
the termination reaction that takes place via P-dehydrogenation. This chain length
dependence is explainable in terms of the exponential increase in physisorbed olefin
concentration with increasing carbon number due to preferential adsorption of longer
hydrocarbons at the catalyst surface.
8 Chapter 1 -Introduction
1 --------- --- ··---·- ·---·--·-··--·----·-{\
-25
05
\
lu.l/mio -- • --
...; 5 mlJmin ----1 -
~~ 10m~'mln - <> --
~::uj~~ ~- ~
~ -2
-1.5
-3.5 ._l__,_L __ L j_.._L_.__l_,__l _ _, _ _t _ _,_L 2 6 lO 14 18
C!Uhon UUUlUCf
Figure 1.1. Total product yield (pmoVcm2.s) as a function of carbon number obtained for a 50-nm Co particles on a flat Si02 wafer (reduced at 573 K for 5 min) for three different flows, T = 493 K, Hz/CO = 2, P = 1 bar. [Kuipers et al., 1996]
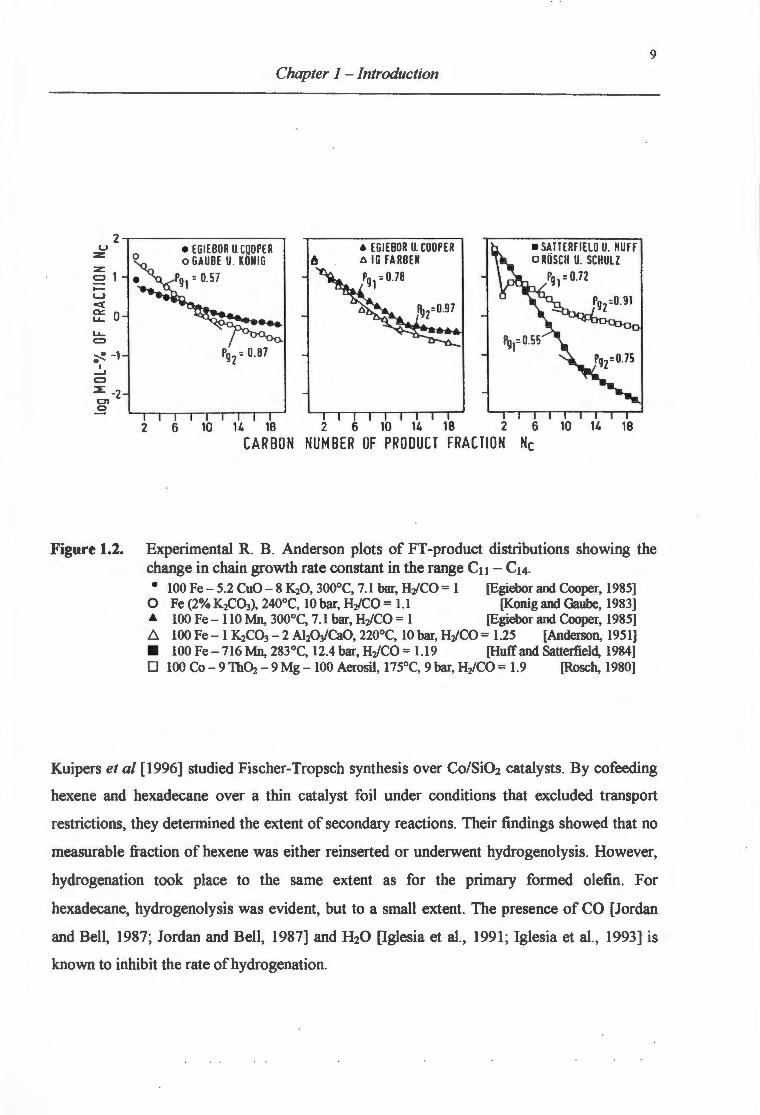
Other deviations in ASF behaviour have been noted by Satterfield and Huff [1984], Egiebor
and Cooper (1985], Konig and Gaube (1983], Rosch [1980] and Anderson [1956]. Satterfield
and Huff (1984] explained the phenomenon as a superimposition of two independent partial
distributions. The two distributions were thought to be formed on different catalyst sites, with
different chain propagation probabilities as illustrated in Figure 1.2.
The presence of secondary hydrogenation reactions was observed by Pichler et al. [1967]
who showed that, as the contact time with the catalyst increased, the paraffin to olefin ratio
increased. A number of other workers [Madon et al. 1991; Kuipers et al. 1995; Komaya and
Bell, 1994; Dictor and Bell, 1986; Gaube and Hochstadt, 1978; Iglesia et al. 1991] have noted
the same effect.
2 u
= 0
-L.J ~ 0::: 0 LL..
LL.. <=I
~ -1 I _.
<=I
~ -2 en .3
• EGIEBOR U. COOPER o GAUBE U. KONIG
9t: 0.57
Chapter 1 - Introduction
• EGIEBDR U. COOPER oiGFARBEN
Pg1 = 0.78
• SATTERFIELD U. HUFF o ROSCH U. SCHULZ
Pg 1=D.72
2 6 10 14 18 2 6 10 14 18 2 6 10 14 18
CARBON NUMBER OF PRODUCT FRACTION Nc
9
Figure 1.2. Experimental R. B. Anderson plots of FT -product distributions showing the change in chain growth rate constant in the range Cu- C14. • 100 Fe- 5.2 CuO- 8 K20 , 300°C, 7.1 bar, HiCO = 1 [Egiebor and Cooper, 1985]
0 Fe (2% K2C03), 240°C, 10 bar, H2/CO = 1.1 [Konig and Gaube, 1983] & 100 Fe- 110 Mn, 300°C, 7.1 bar, H2/CO = 1 [Egiebor and Cooper, 1985] b.. 100 Fe- 1 K2C03 - 2 AhWCaO, 220°C, 10 bar, H2/CO = 1.25 [Anderson, 1951] • 100 Fe- 716 Mn, 283°C, 12.4 bar, H2/CO = 1.19 [Huff and Satterfield, 1984] 0 100 Co-9Th~- 9 Mg- 100 Aerosil, 175°C, 9 bar, H2/CO = 1.9 [Rosch, 1980]
Kuipers et al [1996] studied Fischer-Tropsch synthesis over Co/Si02 catalysts. By cofeeding
hexene and hexadecane over a thin catalyst foil under conditions that excluded transport
restrictions, they determined the extent of secondary reactions. Their findings showed that no
measurable fraction of hexene was either reinserted or underwent hydrogenolysis. However,
hydrogenation took place to the same extent as for the primary formed olefin. For
hexadecane, hydrogenolysis was evident, but to a small extent. The presence of CO [Jordan
and Bell, 1987; Jordan and Bell, 1987] and H20 [Iglesia et al., 1991 ; Iglesia et al. , 1993] is
known to inhibit the rate ofhydrogenation.

Chapter 1 - Introduction 10
1.2.1.2 Reaction Kinetics
The temperature at which reaction takes place is a good indication of a catalyst's activity. The
lower the temperature needed generally, the higher the catalyst activity. On this basis, activity
declines in the order Fe < Ni < Co [Vannice, 1975]. For Fischer Tropsch catalysts, the
activity is determined by the nature of CO and H2 adsorption.
Carbon monoxide is strongly adsorbed on the catalyst and is known to poison hydrogenation
reactions. Initial bonding of CO takes place in the carbon down position with its molecular
axis perpendicular to the surface [Blyholder, 1964]. Carbon monoxide may be activated by a
strong interaction of the C and/or 0 atom with the catalyst surface. The result is to weaken
the C-0 bond enabling reaction with hydrogen. It has been shown that surfaces which
facilitate electron donation into the 2n • antibonding orbital of the CO molecule exhibit higher
probabilities of C-0 bond rupture and hence dissociative adsorption of CO. The C-0 bond
severage at the surface speeds up reaction initiation and consequently the activity of the
catalyst. The H2 chemisorption plays a subservient role on the catalyst surface. The presence
of CO adsorbed on the surface inhibits H2 adsorption, while CO adsorption is uninhibited by
the presence of H2 on the surface. Consequently CO is a stronger competitor for surface
adsorption sites than H2. For Fischer Tropsch, since H2 chemisorption is needed for reaction,
CO chemisorption must not be too strong so as to allow H2 access to the catalyst surface. This
CO inhibition of reaction is illustrated in many of the proposed kinetic expressions to
describe Fischer Tropsch synthesis. Table 1.1 shows several kinetic equations [Dry, 1981 ],
the major feature being the power to which the partial pressure of CO and H2 are raised.
Table 1.1. Kinetic equations for CO hydrogenation over different metals.
Metal Kinetic Equation Reference
Nickel - k 0.9 r- PH2 Pco -0.2 Luytens and Jurgens [1945]
Cobalt r = k PH/ I Pco Brotz [1949]
Iron r = k PH2 I (1 + a PH20 I Pco) Anderson [1956]
Ruthenium k 1.5 -0.6 r = PH2 Pco Ekerdt and Bell [1979]
Chapter 1 - Introduction 11
For CO the power is negative for nickel, cobalt and ruthenium revealing that increased
presence of carbon monoxide at the catalyst surface inhibits the rate. The rate increases with
increasing partial pressure of H2 . It is of interest to note that the kinetic expression for iron
catalysts shows a dependence upon the partial pressure of water. This could be attributable to
the ease with which iron oxidises relative to the other FT metals.
Thermodynamics dictates that methane should be the most favoured product for a significant
range of Fischer Tropsch reaction conditions. In the Fischer Tropsch system, methane is not
readily released from the surface, but undergoes numerous chain elongation steps. It has been
shown that the favoured product of chemi-desorption is the a-olefin. Schulz et al. [1988]
found that the rate of paraffin chemi-desorption from an iron manganese catalyst was
approximately four times slower than the a-olefin chemi-desorption rate. Thus, the extended
periods of intermediate adsorption results in methane inhibition and heightened surface
polymerisation probabilities. The inhibition of chemi-desorption can be attributed to carbon
monoxide.
1.2.2 Effect of Reaction Parameters
The choice of reaction parameters is key to product optimisation for any catalytic process.
The reactor configuration to which these parameters are applied determines the range of
applicable conditions due to physical constraints associated with that configuration. For
example, fixed bed reactors have significant limitations with regard to heat removal.
1.2.2.1 Effect of Temperature
The temperature of reaction for Fischer Tropsch synthesis plays a major role in determining
the rate of reaction as well as the product selectivity. The influence of temperature remains
consistent for all Fischer Tropsch catalysts. Increased temperatures shift product selectivity to
lighter molecular mass hydrocarbons. For example, at low temperatures (<190°C), nickel
catalysts yield a product with a high wax fraction. The same catalyst operating at high
temperatures (>300°C) produced mainly methane. Gallet al. (1952] found that the standard
Co/Th02/Mg0/Si02 catalyst gave a 1% yield of oxygenated product at temperatures in the
,.

12
Chapter 1 -Introduction
range of 180 to 200°C. As the temperature was lowered to between 160 and 175°C, the
oxygenated fraction was seen to increase, yielding a liquid organic product with 40%
alcohols. Anderson [1956] made a similar observation over a potassium promoted fused iron
catalyst. In this particular case, the oxygenated fraction was found to decrease significantly as
the temperature increased from 190°C to 220°C. Work done at Sasol over two iron catalysts
showed that a lower temperature favoured the formation of straight chain products, while
increased temperatures increased the branched product fraction [Dry, 1981]. Increased
temperature (~325 °C) was also found to increase the aromaticity of the product.
1.2.2.2 Effect of Total Pressure
Increased total pressure for Fischer Tropsch synthesis has been shown to shift the
hydrocarbon selectivity to a higher molecular weight product. This observation has been
noted for both cobalt [Martin, 1939] and fused iron catalysts [Friedman and Schlesinger,
1964]. No trend has been noted with regards olefinicity as pressure is increased, however
several authors have observed increased oxygenate fractions with increasing pressure
[Anderson et al. , 1952; Friedman and Schlesinger, 1964].
?1 0 E 0 0 z ~
~ -1
• PH2o·0.9 bar (base case) 0 PH2o• 8.S bar (water addition)
5 10 15 20 25 Carbon number, Nc
2 4 6 8 10 12 Carbon number, Nc
Figure 1.3. (A) ASF plots for 100 Co/15 ZrOz/100 Aerosil/0.66 Ru, T = 190°C, PH2 = 6 bar, Pco = 3 bar. (B) Molar a-olefin content in the fraction of linear olefins with the same carbon number as a function of carbon number. [Claeys et al., 1997]
Chapter 1 -Introduction 13
Changes in product spectrums with increased pressure can be attributed to increased partial
pressures of reactants and products. Claeys et al [1997] showed that increased partial
pressures of water over a slurry phase cobalt catalyst lead to significant changes in product
composition, including suppressed methane formation, enhanced chain growth, and the
inhibition of secondary olefin formation. Figure 1.3 (A) illustrates the effect of water partial
pressure on the chain growth probability while Figure 1.3 (B) shows the a.-olefin variance.
1.2.2.3 Influence of H2/CO Ratio
Work carried out on evaluating the effect of the H2/CO ratio indicate that a decrease in the
H2/CO ratio results in a higher average molecular weight hydrocarbon product and higher
olefinicity. Aromaticity was also found to increase over iron catalysts as the H2/CO ratio
decreased [Dry, 1981]. Anderson [1956] showed similar findings for a
Co/Ni/Th02/Mn/Kieselguhr catalyst. A lower H2/CO ratio resulted in a lower methane
selectivity and a higher olefin content. These results are understandable in that a catalyst
surface preferentially covered with hydrogen favours chain termination. Thus the desired
product selectivity is largely determined by the fractional surface coverage of CO, H2, C02
and H20.
1.3 Supported Metal Catalysts for Fischer-Tropsch Synthesis
Transition metals are being widely used as active catalysts in a variety of industrial processes
including oil refining and reductive amination. The supported metal catalysts hold a number
of significant advantages over their bulk metal counterparts. They are cheaper as the activity
per weight of active metal is increased due to high dispersions on high surface area carriers
that maximise active metal usage. They also show enhanced thermal stability due to
interaction between the active metal and support which leads to a decrease in catalyst
sintering and a prolonged lifespan, and they provide increased efficiency due to high metal
dispersions supported on high surface area carriers. Transition metals are generally regarded
as good hydrogenation catalysts. All Group VIII metals show certain amounts ofFT activity,
however not all are commercially viable [Vannice, 1975; Vannice, 1977; Vannice and

Chapter 1 - Introduction 14
Garten, 1980; Dry, 1981]. The different metals show differing activities and product
distributions, require different operating conditions, show different deactivation behaviours,
and vary greatly in cost.
A Fischer-Tropsch catalyst usually consists of four components: an active metal, a small
amount of a second metal (usually noble), oxide promoters (alkali, rare earth, and/or a
transition metal oxide such as Zr02), and a support (silica, alumina or titania). Various
combinations have been studied and documented in literature. The following section serves to
elaborate more on the benefits and drawbacks of each component chosen.
1.3.1 Active Metal
The choice of active metal used is significant both in terms of the cost of the catalyst and the
benefits that it brings in terms of activity and selectivity. The nature of carbon monoxide and
hydrogen adsorption and the interaction with the metal that results greatly influences the
effectiveness of that metal for Fischer-Tropsch synthesis. Commercially, cobalt and iron are
the dominant active metal components, while nickel is largely used as a methanation catalyst.
Nickel bears another disadvantage, namely that at CO partial pressures higher than about 0.5
bar, nickel carbonyl forms and is expelled from the reactor, lowering the catalyst activity as
the mass of catalyst reduces. Ruthenium also commands a large amount of research both as
an active metal specie and as a promoter. Other Group VIII metals such as Rh, lr, Re, Os Pd
and Pt all show FT activity, however in most cases the product spectrum consists mainly of
oxygenates as CO does not chemisorb dissociatively on these metals [Sommjai, 1981 ;
Janardaranao, 1990].
1.3.1.1 Iron
Iron has been used commercially in fixed bed and entrained fluidised bed reactors by Sasol
South Africa for synthesis gas conversion to fuels via Fischer Tropsch synthesis. The
commercial catalyst is prepared using a precipitation technique, and is promoted with copper
and potassium and other oxides. In the case of the Ruhrchemie catalyst, silica is added as a
structural promoter keeping up the pore structure. A large amount of research has been

Chapter 1 -Introduction 15
carried out on the iron catalyst. It shows very high activity to Fischer Tropsch synthesis,
second only to ruthenium [Vannice, 1975], but requires higher operating pressures ( - 15 bar).
The formation of carbides, nitrides, oxides and carbonitrides takes place easily on the iron
catalyst, however these compounds all show Fischer-Tropsch activity [Anderson, 1984].
Metallic iron is formed during the hydrogen reduction phase, but exposure to synthesis gas
results in rapid metal carbide formation [Dry, 1981; Amelse et al., 1978; Raupp and Delgass,
1979; Jung and Thomson, 1992]. During synthesis, specifically at high conversions, the
reaction mixture becomes more oxidising and magnetite is also formed [Dry, 1981;
Anderson, 1956; Satterfield et al., 1986]. This easy movement between metal phases proves
somewhat detrimental in that Fe has a stronger tendency to form elemental carbon than Co or
Ni, leading to catalyst deactivation as carbonaceous deposits block the active sites.
1.3.1.2 Ruthenium
Ruthenium has been shown to have the highest specific activity for FT synthesis of all the
Group VIII metals [Vannice, 1975], and may be active at temperatures as low as 373K. High
molecular weight species can be produced at lower temperatures than those required for Fe
and Co, while remaining carbide free under Fischer-Tropsch conditions. The three major
products formed on the ruthenium catalyst are n-paraffins, a-olefms and ,8-olefins.
1.3.1.3 Cobalt
Cobalt catalysts have a number of significant advantages over iron based catalysts. Cobalt
catalysts appear to provide the best compromise between performance and cost for the
Fischer-Tropsch synthesis. Operating pressures for cobalt are milder ( -5-15 atm) than for
iron ( - 15 atm). The formation of carbides on cobalt is thermodynamically unfavourable,
consequently there is a lower tendency for the build-up of carbonaceous material which
deactivates the catalyst. Cobalt catalysts produce mainly straight chain (linear) hydrocarbons
[Goodwin, 1991], with minimal alcohol formation and low water-gas shift activity
[Newsome, 1980; Goodwin, 1991].
Chapter 1 - Introduction 16
1.3.2 Metal and Oxide Promoters
The addition of an inactive species that serves to enhance selectivity/activity or stability of a
metal-supported catalyst has long been used in the preparation of Fischer-Tropsch Synthesis
catalysts. Alkali carbonates and alumina have been used to double promote iron catalysts,
while alkalis such as Th02 have been used to promote supported cobalt catalysts. The
promoter can show several significant effects in the case of Fischer-Tropsch synthesis:
1. They enhance the dissociation of CO on the surface of the catalyst which results in a shift
in selectivity to higher hydrocarbons;
2. They increase the overall rate of synthesis;
3. They favour the formation of unsaturated products;
4. They determine the extent to which other reactions take place in conjunction with the
hydrocarbon synthesis.
The fourth point largely refers to the formation of alcohols, as the C-0 bond strength is
weakened by the presence of a promoter such as vanadium, and hydrogenated to the alcohol.
Many studies have been carried out on catalyst promotion. Kogel bauer et al. [ 1996] promoted
an alumina supported cobalt catalyst with ruthenium. They noted that the presence of
ruthenium increased the reducibility of the catalyst and showed increased CO hydrogenation
activity. This increased activity paralleled the increased number of exposed metal atoms on
the surface following ruthenium addition as observed using H2 chemisorption. Hilmen et al.
[1996] noted that promotion of alumina supported cobalt catalysts with rhenium also resulted
in higher reducibilities of cobalt. Increased catalyst activities were also observed following
zirconia promotion of silica supported cobalt catalysts [Ali et al., 1995], and La promotion of
alumina supported cobalt catalysts [Vada et al. , 1995]. In both cases it was observed that
there was an optimum promotion amount.

Chapter 1 -Introduction 17
1.3.3 Choice of Support
The choice of support is of great importance in the design of a suitable supported metal
catalyst. Parameters such as basicity, dispersion effect, surface area, thermal and chemical
stability, mechanical strength, electronic modifications and strong metal-support interaction
have a significant effect on the preparation and functioning of the catalyst [Foger, 1985] .
Support materials can be classified into
1. Inert supports; like Si02 supplying high surface area for dispersion of the active
component.
2. Catalytically active supports; like aluminas, silica-aluminas and zeolites currently the
dominant support in industrial catalytic applications.
3. Supports influencing the active component as a result of strong metal support interactions,
as in the case ofTiOz and VzOs.
4. Structural supports such as the monoliths used in motor vehicle exhaust gas purification.
The most popular supports for Fischer-Tropsch catalysts are inorganic oxides such as silica,
alumina, titania, magnesia and zirconia.
1.4 Catalyst Preparation
The goal of catalyst preparation is to make a catalyst with a highly dispersed metal phase to
achieve a large surface area of active component. It is desirable to synthesise catalysts with
high volumetric productivity. This can be achieved for supported cobalt catalysts by:
1. The synthesis of small metal crystallites at high local surface densities on the support
surface, and
2. Using supports that increase the rate per surface cobalt atom (turnover rate). [Iglesia,
1997]
The ultimate performance of the prepared catalyst, as determined by its activity and

Chapter 1 - Introduction 18
selectivity, is strongly dependent upon the interaction of numerous chemical processes taking
place during its preparation. The preparation phase can be subdivided into 3 distinct
categories, namely (a) the chemical synthesis (b) calcining and (c) activation. These steps
become particularly important for Fischer-Tropsch synthesis where bulk phase changes in
catalyst composition may lead to different activities and product distributions.
1.4.1 Catalyst Synthesis
Fischer Tropsch catalysts are usually synthesised v1a precipitation, impregnation, 1on
exchange or vapour phase deposition techniques. Commercial iron and cobalt catalyst have
largely been prepared using precipitation techniques, while vapour phase deposition
techniques are promising in that high metal dispersions are achievable without deactivation
through strong metal support interactions.
\ Impregnation involves the deposition of a metal precursor on a support. The support acts as a
) mere physical surface, consequently the interaction between the metal and support is weak,
and requires a calcination step to provide a stronger chemical interaction. For this reason the
preparation procedure does not include a washing step so as not to eliminate the weakly
bound metal salt [Che, 1993].
1.4.1.1 Interfacial Coordination Chemistry
Whenever a cation (specifically a transition metal ion- TMI) is placed in solution, anionic or
neutral groups called ligands immediately surround the cation, and the chemistry associated
with the way these ligands and the cation interact is called coordination chemistry. The
chemistry involves an understanding ofthe properties ofTMI complexes including the nature
of the different chemical bonds that they can form and the optical and magnetic
transformations associated with their interaction with other compounds. The preparation of
supported catalysts through the deposition of transition metal complexes on metal oxides is
an example of coordination chemistry at a liquid solid interface. In aqueous solution, TMis
are complexed by water and/or other ligands present. As an example of this, Smith and
Jacobson [1956] noted the ability of silica to adsorb Co2+ complexed with ammonia and

Chapter 1 -Introduction 19
ethylenediamine. Burwell et al. [1965] gave evidence to suggest that this adsorption occurred
through substitution ofthe anionic ligand by a surface SiO- group. Thus the preparation of the
catalyst is strongly affected by the choice of metal precursor compound, the solution used for
impregnation which determines the nature of the ligands surrounding the cation, the nature of
the support surface, and the pH at which impregnation is done.
1.4.1.1.1 Influence of Precursor Compound
The choice of precursor compound has a strong effect on the performance of the finished
catalyst. For the case of cobalt deposition, the anion of the cobalt salt used leads to variances
in the strength with which the cobalt cation attaches to the support surface. This can be
attributed to the effect that the anion has on the pH of the impregnation solution, where a
lower pH results in a smaller interaction between cation and support. The purity of both the
precursor compound and support is of great importance to the final catalyst performance as
well. The presence of impurities such as chloride and sulphate ions, even in trace amounts
has been shown to decrease catalyst performance.
1.4.1.1.2 Influence of Support Type
When inorganic oxides are contacted with water, a liquid solid interface arises yielding a
perturbation in the first two layers of water surrounding the oxide. These layers are strongly
immobilised resulting in a drastic decrease in the dielectric constant of water as the associated
dipoles in the first water layer align themselves on the oxide surface [Antoniu, 1964]. The
surface of inorganic oxides offers various sites with which the metal precursor can interact
including oxygen atoms and hydroxyl groups. The oxide surface is able to enter the outer
sphere of solvation of transition metal complexes (TMis) through it's OH groups in the same
way that the solvent can [Che, 1993], as illustrated in model I of Figure 1.4. Thus the oxide
surface can act as a solid solvent shown in Figure 1.4 model II.
Oxygen atoms, different types of hydroxyl groups, and exposed metal atoms all affect the
charge localisation on the support surface as each of these species has different chemical
properties. Oxygen atoms behave as Lewis bases, metal cations as Lewis acids, while
hydroxyl groups can be classified as acidic, neutral or basic depending upon there attachment
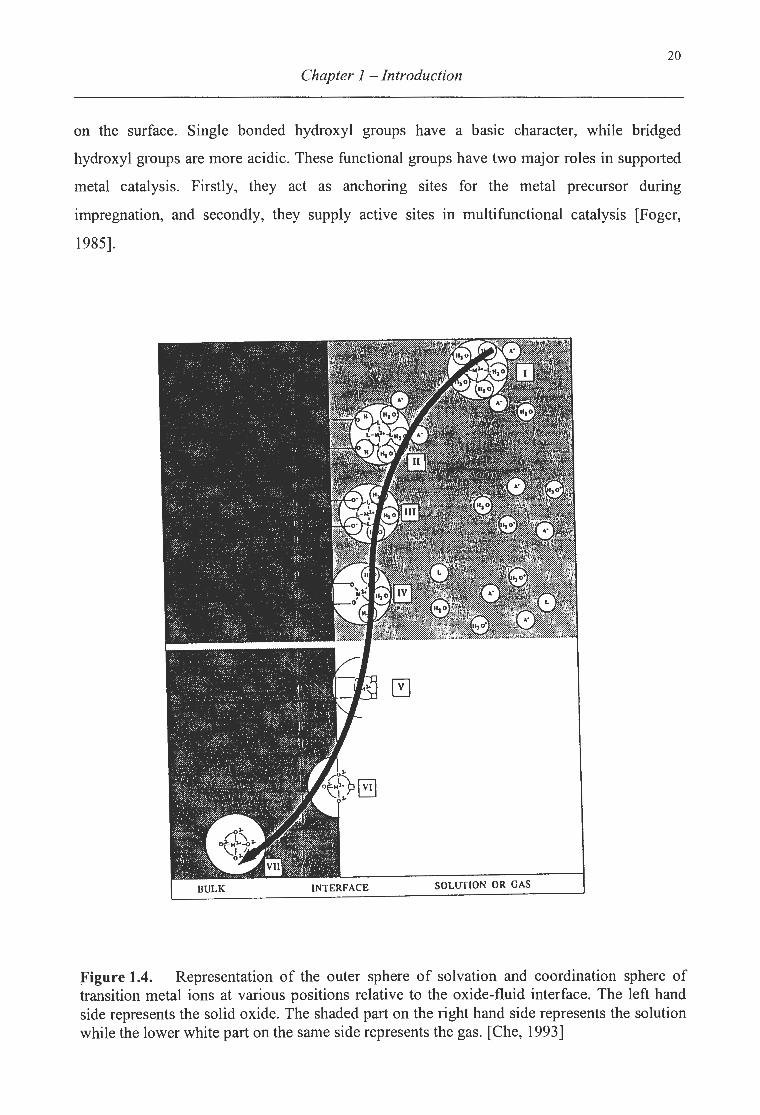
20
Chapter 1 -Introduction
on the surface. Single bonded hydroxyl groups have a basic character, while bridged
hydroxyl groups are more acidic. These functional groups have two major roles in supported
metal catalysis. Firstly, they act as anchoring sites for the metal precursor during
impregnation, and secondly, they supply active sites in multifunctional catalysis [Foger,
1985].
Figure 1.4. Representation of the outer sphere of solvation and coordination sphere of transition metal ions at various positions relative to the oxide-fluid interface. The left hand side represents the solid oxide. The shaded part on the right hand side represents the solution while the lower white part on the same side represents the gas. [Che, 1993]
Chapter 1 -Introduction 21
In the case of Fischer Tropsch synthesis, their role as an anchorage point for the precursor
greatly influences the final physical characteristics and performance of the catalyst. Parks et
al. [1985] have studied one specific example of this anchorage. They investigated surface
precipitation phenomena in the Co(II)/ Ah03 sorption system using Co(N03)2.6H20 as
precursor. When high concentrations of cations are sorbed onto oxide surfaces there is no
observed limit on sorption due to occupation of vacant sites. In these under-saturated
conditions, they showed that the presence of a sorbent material induces precipitation under
certain pH and concentration levels, and that this precipitation results in a phase similar to
Co(OH)2, consisting of ternary or double hydroxides of Co and Al. This phase was seen to be
hydrous and disordered with high concentrations of Co vacancies. These findings are
significant for several reasons. The first is that formation of a disordered precipitate of the
cation may happen easily, leading to non-uniform metal dispersions across the oxide surface.
Furthermore, during activation treatments, there is a strong possibility that large quantities of
cobalt will end up in forms other than the active phase. Consequently it is important to
understand factors that induce surface precipitation. These factors include the concentration
of metal ions in solution, the preparation temperature and the pH at which preparation takes
place.
1.4.1.1.3 Influence of pH on surface charge in solution
When an oxide is brought into contact with an aqueous solution, for example in the case of an
impregnation step, the surface hydroxyl groups enter into the following equilibria:
M-OH + H+ ~ [M-OH2t, or M-OH + H20 ~ [M-OH2t + OH
M-OR + OH- ~ M-oC-) + H20
.... .. (1)
.... .. (2)
Equation one results from involvement of basic oxides, while equation two results from
acidic oxides. This equilibration is a surface polarisation associated with the dissociation of
surface hydroxyl species and the readsorption of hydroxo complexes that are formed via the
partial dissolution of the oxide particle [Parks and DeBruyn, 1962]. The extent to which the
surface charging takes place is dependent upon the pH of the solution with which the surface
is in contact, as a result of the involvement ofboth H+ and OH- ions. At a specific pH, the net
surface charge is zero. This is called the point of zero charge (PZC) or the isoelectric point
Chapter 1 - Introduction 22
(IEP). Above the PZC, the surface of an oxide bears a net negative charge (8-0-) and will
attract and adsorb cations, while below the PZC, anionic species will adsorb onto the
positively charged (8-0H2 +) surface. The primary role of the pH in terms of what happens at
the solid surface is to act as a surface charge selection switch [Che and Bonnevoit, 1988].
Consequently the PZC can be used to predict molecular structures of surface metal oxide
species on oxide supports [Brunelle, 1978; Deo and Wachs, 1991].
The PZC becomes important when selecting the type of metal precursor and the pH at which
impregnation is carried out due to metal support interactions that result from charge
differences between the support surface and the metal precursor.
1.4.1.1.4 Metal Support Interactions
The term "strong metal support interactions" (SMSI) was introduced by Tauster et al. [1977]
to explain the lower values for H2 and CO chemisorption obtained on titania-supported
platinum group metals that were reduced above 700K. A metal support interaction can be
defined as a direct influence of the support on the chemisorption and catalytic properties of
the metal phase either by stabilising unusual metal particle structures, by changing the
electronic properties due to electron transfer processes between the metal particles and the
support, or chemical bonding between the metal and support [Foger, 1985]. Consequently,
support materials can be grouped according to their surface charge in solution within the pH
range of 1-14 as [Foger 1985]:
1. Cation adsorbers (support surface showing a net negative charge in solution) for example
silica, silica-aluminas and zeolites.
2. Anion adsorbers (surface showing a net positive charge in solution) for example magnesia.
3. Amphoteric supports (adsorb anions in acid, and cations in alkaline solutions) for example
alumina, titania and zirconia.
The surface polarisation of the support oxide results in a net positive or negative charge that
results in equilibria for anion and cation adsorption represented by the following equations
[Foger 1985]:
Chapter I -Introduction
s-oH + c + <=> s-o-c + + H+
S-OH + A- + H20 <=> S-OH2 +A- + OH-
.. .. (1)
.. .. (2)
The strength of the interaction between metal and support is principally controlled by:
1. the type of support and nature of the surface (number of functional groups) and,
23
2. the impregnation solution; where pH, type and concentration of metal compound, and the
presence of competing ions play an important role.
From the above equilibrium equations it is clear that cation uptake decreases with increasing
acid strength as the presence of H+ ions in solution drives the equilibrium in equation (1) to
the left. Cation exchange affinity is a function of charge and cation radius, i.e. M4+ > M 1+,
while anion exchange affinity increases with the polarisability of the anions and the anionic
charge, e.g. r > B( > Cr, and sol- > Cr [Foger, 1985].
SMSI during impregnation result in a metal precursor concentration gradient from the pore
mouth through to the centre of the support yielding an egg shell distribution. In order to
minimise this gradient, care must be taken to:
1. Ensure that enough precursor is present to saturate every adsorption site;
2. And allow long contact times between the support and impregnating solution.
These factors are significant and an understanding of their influence is useful in selecting
optimal impregnation solution conditions.
1.4.1.1.5 Influence of Impregnation Solution
The impregnation solution comprises molecules that can complex with the cation altering the
bonds that form between cation and the support surface. In aqueous solution, transition metal
ions are complexed by water and other ligands, forming an inner or coordination sphere
surrounding the metal ion, with the ligands arranging themselves in an octahedral
configuration around the cation. Ligands differ in the strength of the crystal field that they
exert when complexed with the cation. As the field strength increases, the transition metal ion
Chapter 1 -Introduction 24
becomes increasingly protected limiting the attachment options at the surface of the support.
This is the case for transition metal ions complexed with ethylenediamine. In this case, the
oxide surface acts as a monodentate ligand at the fluid-solid interface leading to trans
octahedral complexes. This contrasts to the water ammonia system as a solution. A
substitution of water for ammonia in the nickel hexaamine complex results in a weakened
coordination sphere. This weakening allows the oxide surface to act as a bidentate ligand
forming a neutral cis-octahedral complex at the oxide surface [Burwell et al., 1965]. Thus in
terms of ligand strength the order can be illustrated as follows:
H20 < NH3 < ethylenediamine
1.4.2 Catalyst Activation
Drying, calcination and reduction activate the catalyst. Each of these processes results in
changes in the physical structure of the catalyst. In the case of supported metal catalysts, this
change pertains particularly to the phase of the supported metal, it's dispersion, and the
strength of interaction with the support.
1.4.2.1 Drying
Drying of the catalyst removes the solvent used in the precursor deposition. Because the
solvent is usually water, this treatment often takes place between 80 and 220°C. During
liquid-phase impregnation, the catalytically active species is transported to the interior of the
support through capillary forces and diffusional effects. An equilibrium between the adsorbed
phase and the solute phase results as determined by the adsorption isotherm. Most
preparations aim at achieving a catalyst that has the active metal phase distributed uniformly
throughout the support. This distribution, · although affected during the reduction step, is
largely determined by the concentration profile through the support during impregnation and
drying. The strength of interaction between the metal and support strongly affects the spatial
arrangement of the metal on the support following the drying phase. The stronger the
interaction between precursor and support, the less likely it is that redistribution will take
place during the drying phase.

Chapter 1 - Introduction 25
Consequently, the presence of SMSI will result in a catalyst that shows a high dispersion of
the metal phase. Dispersion is defined as the fraction of the exposed active metal atoms
relative to the total number of metal atoms. From this definition it is clear that as the
dispersion increases, the size groupings of active metal species on the surface will decrease
so as to leave a greater fraction exposed. The reverse is also true. Weak interaction between
metal and support leads to a uniform distribution initially, however the drying phase results in
redistribution, as well as the formation of larger metal groupings on the surface. During
drying, evaporation of the solvent takes place at the pore mouths while solution flows from
the interior of the particles towards them. This has the effect of concentrating impregnation
solution at the pore mouths giving an egg-shell distribution.
The transport of precursor to the outer shell of the support particle can be inhibited by
1. using very high heating rates [Fenelov et al., 1979]; or
2. increasing the solution viscosity which inhibits redistribution [Kotter and Riekert, 1979].
Both of these conditions increase the rate at which water is removed relative to the rate of
liquid capillary flow.
1.4.2.2 Calcination
Calcination is a medium to high temperature treatment that is often performed in an oxidising
atmosphere. The aim of calcination is three-fold [Fager, 1985]:
1. Calcination decomposes the precursor compound forming an oxide species. This takes
place with Co(N03)2, where the nitrate decomposes to Co30 4 releasing N02 gas;
2. Calcination results in a dehydroxylation reaction between the precursor oxide and the
support that leads to chemical bonding that is absent during impregnation;
3. Calcination leads to sintering of the metal oxide, at the expense of metal dispersion on the
support.
Two parameters play an important role during calcination. These are the final temperature at
which the catalyst is calcined, as well as the rate at which that temperature is reached [Iglesia,
Chapter 1 -Introduction 26
1997]. Higher temperature treatments often lead to extremely strong bonds between the metal
oxide and the support. This effect has been noted for both cobalt and nickel on alumina
[Arnouldy and Moulijn, 1985]. The mobility of the cobalt ions increases as the calcination
temperature increases causing them to migrate into the lattice framework of the support.
When this occurs, excessively high reduction temperatures are needed to yield the active
metallic phase. This is not to say that any form of interaction between metal oxide and
support is undesirable. On the contrary, interaction keeps the metal oxide well dispersed on
the support. Consequently, the calcination step should be avoided if it results in the formation
of large metal oxide clusters. Iglesia [1997] showed that cobalt dispersion on silica almost
doubled on elimination of the calcination step.
The rate at which the temperature is increased to its final value has a significant effect on the
final dispersion of the catalyst. This effect was well illustrated by Iglesia [1997]. His work
showed that lowering the heating rate could increase the cobalt dispersion on a silica support
significantly.
Where the cobalt nitrate precursor is used, the exothermicity of decomposition leads to
increased local temperatures on the support surface resulting in larger Co agglomerates.
1.4.2.3 Reduction
Reduction is the final stage of catalyst activation. The metal oxide undergoes a
transformation to the metallic state, leaving metal atoms and small metal clusters on the
support surface. This reduction frequently takes place in hydrogen, although strong reducing
agents such as CO are also employed. The transformation of the metal precursor (Metal
nitrate in this case) is illustrated in the following equations:
MO + NOz .... . (1) Decomposition of precursor
~ M + HzO ..... (2) Reduction of metal
The possibility of reduction of the metal oxide is bound by thermodynamic constraints. The
possibility arises if the change in Gibbs Free Energy (~G) becomes negative. The standard
free energy for the reduction of oxides can be evaluated from equation (3)

Chapter 1 -Introduction 27
L\G = L\Go + RT ln[PH2o I PH2] ....... (3)
From equation (3) it is clear that reduction becomes favourable for large negative values of
l'lG0, or where the partial pressure of water is small. For the case of cobalt on silica, water has
been shown to induce the formation of cobalt silicates where the thermodynamics do not
favour reduction. These cobalt silicates are highly undesirable, as reduction temperatures
between 800 and 1 000°C are needed to achieve activation. These temperatures are not
practical or feasible.
A possible solution to the effect of water partial pressure is to increase the flow of hydrogen
over the catalyst while using slow temperature ramping protocols. The increased hydrogen
flow results in a flushing of water vapour, and increases the hydrogen partial pressure. A
slower temperature ramp reduces the rate at which reduction takes place, and in so doing,
decreases the amount of water vapour present. Iglesia [ 1997] investigated both of the above
effects for the reduction step. He noted that dispersion increased as H2 flow increased, and
the temperature ramping rate was slowed.
1.5 Catalyst Characterisation
Catalyst characterisation plays an integral role in catalyst design as it provides an evaluation
ofthe physico-chemical properties of the catalyst on both a quantitative and qualitative level.
These properties (mechanical strength, distribution of the metal phase, surface area, metal
support interaction etc.) influence the activity, selectivity and lifetime ofthe catalyst, as well
as heat and mass transfer, which determine active site accessibility. The characterisation
serves to link the catalyst performance under reaction with the structural and electronic
properties of the catalyst, allowing changes in performance and properties to be correlated.
Many techniques are available for this purpose including X-ray methods (X-ray
diffractometry (XRD), and Extended X-ray Absorption Fine Structure Spectroscopy
(EXAFS)), electron microscopy (TEM or SEM), electron spectroscopy (XPS) and infrared
spectroscopy (IR). The major limitation associated with these methods is that they are not
applicable to catalysts under working conditions. Other techniques of importance to

Chapter 1 - Introduction 28
supported metal catalyst characterisation are temperature programmed reduction and
hydrogen chemisorption.
1.5.1 Temperature Programmed Reduction
Temperature programmed reduction (TPR) is one of a class of temperature programmed
techniques including temperature programmed oxidation (TPO), desorption (TPD) and
sulphidisation (TPS).
The basic format of all of these involves the monitoring of a chemical reaction while the
temperature is increased linearly with time. In the case of TPR, a reducing gas (usually H2) is
passed over a fixed amount of solid catalyst. The temperature is ramped between two fixed
temperatures at a linear rate. The progress of reaction is monitored using a thermal
conductivity detector that picks up changes in hydrogen concentration in the exit due to
consumption over the catalyst.
The reactor containing the catalyst is situated in a furnace that has a temperature
programmable controller. The reactor effluent passes through a molsieve that traps the water,
followed by a TCD to detect hydrogen consumption.
Other methods for monitoring the progress of reduction include measuring the change in
pressure/concentration of the product gas, and observing the change in catalyst mass during
reduction. Temperature programmed reduction is particularly useful for the characterisation
of metal oxide catalysts. The results obtained are both quantitative and qualitative in nature.
The amount of hydrogen consumed during reduction gives information on the fraction of
metal oxide reduced, while the temperature and shape of the peaks give a qualitative
assessment on the ease of reduction and knowledge of the particular metal or metal oxide
species present.
Chapter 1 - Introduction 29
1.5.1.1 Application of TPR to metal oxides
In TPR oxidic species are reduced according to the following general reduction pathway:
MO + M +
The thermodynamics of the reaction (1) as measured by the change in Gibbs Free Energy is:
L1G = L'1G0 + RT ln[PH20 I PH2] ... (2)
During reduction, the constantly increasing temperatures as well as the gas flow rates over
the catalyst keep the partial pressure of water low. Under these conditions, reduction of the
metal oxide remains thermodynamically feasible.
1.5.2 Hydrogen Chemisorption
Chemisorption is the technique used to calculate the number of exposed metal atoms on the
surface, and to obtain metal surface areas and average metal particle sizes. Other techniques
such as TEM (Transition electron microscopy) and XRD-line broadening are also used to
calculate metal particle sizes and metal surface areas.
During chemisorption, a selected gas (usually H2) is adsorbed onto the supported metal such
that under specified conditions such that a chemisorbed monolayer of gas is formed on the
metal without a significant contribution from the support. The monolayer coverage is
measured either by volumetric, gravimetric, chromatographic techniques or titration [Foger,
1985]. If the surface contribution is negligible, then the adsorbed gas is chemisorbed to the
exposed metal atoms, allowing calculation of the metal surface area, the average particle size
and the number of surface atoms exposed.
Chapter 1 -Introduction 30
1.5.3 Zeta Potential Measurement
When particles are suspended in a liquid solution, they are observed to migrate m one
direction when an electronic field is applied. As the particle-liquid system is as a whole
electronically neutral, the existence of an electrical double layer is proposed to explain this
movement. The velocity of the particle can be measured microscopically using lasers applied
to dilute solutions in an analyser called a zetasizer. The effective surface charge of suspended
particles is measured by applying a constant electrical current across the suspension. This
current induces a movement of the particles into or out of a cell called electrophoresis and is
brought about by a timed exposure to the electrical potential. Weighing the cell allows
establishment of the excess or deficiency of particles in the cell. From this weight
measurement the zeta potential is calculated. [Webb and Orr, 1997]
1.6 Catalyst Deactivation
Catalyst deactivation refers to a decline in the activity of a catalyst as a result of factors such
as pore blockage and active site coverage that arise from the deposition of carbonaceous
material (coke formation). Most catalysts undergo some degree of deactivation during
reaction. The rate at which this happens is of extreme importance in industry, and can be the
defining feature that makes or breaks the economic feasibility of a proposed venture. Other
forms of catalyst deactivation that take place during Fischer Tropsch synthesis include [Royo
et al., 1996]:
• catalyst sintering, a process where the metal crystallites on the catalyst surface
agglomerate resulting in a decrease in active metal surface area,
• the conversion of the active metal phase to inert oxides, and
• the chemical poisoning of the surface resulting from the presence of poisons such as
sulphur in the feed.
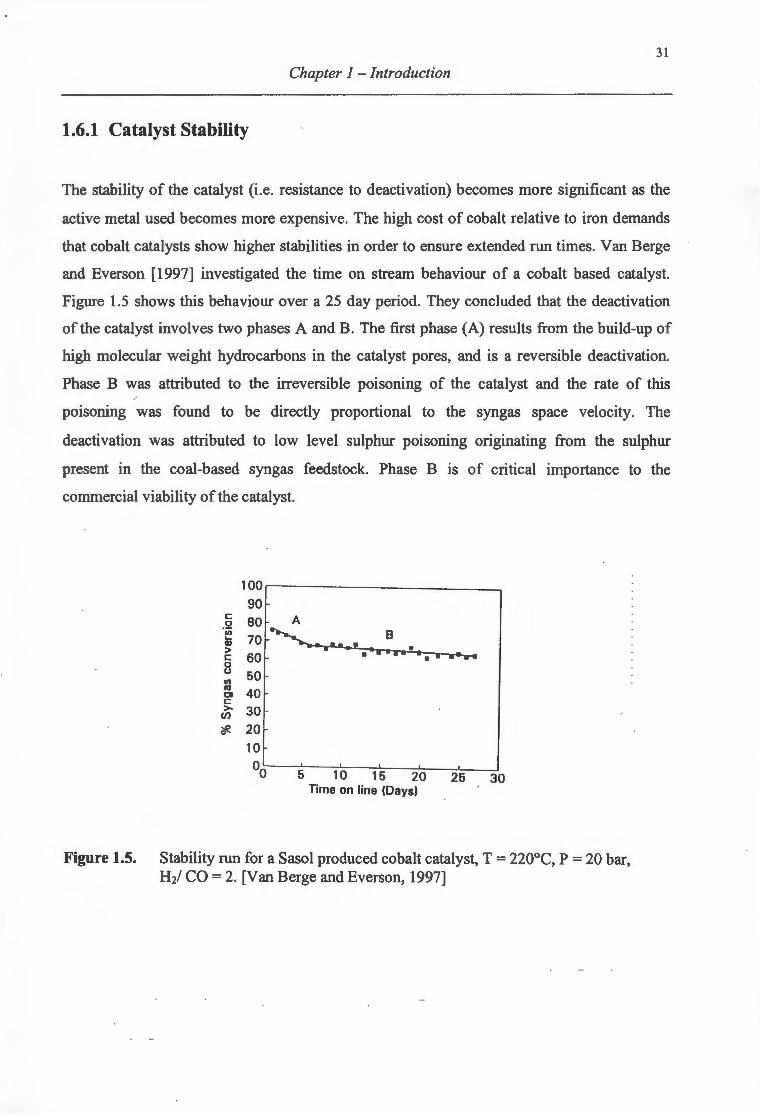
31
Chapter 1 -Introduction
1.6.1 Catalyst Stability
The stability of the catalyst (i.e. resistance to deactivation) becomes more significant as the
active metal used becomes more expensive. The high cost of cobalt relative to iron demands
that cobalt catalysts show higher stabilities in order to ensure extended run times. Van Berge
and Everson [1997] investigated the time on stream behaviour of a cobalt based catalyst.
Figure 1.5 shows this behaviour over a 25 day period. They concluded that the deactivation
of the catalyst involves two phases A and B. The first phase (A) results from the build-up of
high molecular weight hydrocarbons in the catalyst pores, and is a reversible deactivation.
Phase B was attributed to the irreversible poisoning of the catalyst and the rate of this
poisoning was found to be directly proportional to the syngas space velocity. The
deactivation was attributed to low level sulphur poisoning originating from the sulphur
present in the coal-based syngas feedstock. Phase B is of critical importance to the
commercial viability of the catalyst.
100 90
c: 80 A .Q en ~ ... 8 .... 70 Q)
> I • •••••• • c: 60 • •• ....... 0 u 50 en 10 40 Cl c: >- 30 en
?fi. 20 10
00 5 10 15 20 25 30 Time on line (Days)
Figure 1.5. Stability run for a Sasol produced cobalt catalyst, T = 220°C, P = 20 bar, Hz/ CO = 2. [Van Berge and Everson, 1997]
Chapter 1 - Introduction 32
1.6.2 Coke Formation
Coke formation and deposition is a common cause of catalyst deactivation in the chemical
and petrochemical industries. Coke deposition decreases the number of active sites available
for reaction in two ways; firstly by direct covering of the active sites, and secondly through
indirect means where the active sites are unaffected, but access of reactant to these sites is
limited through pore mouth blockage. Unlike sintering, which is an irreversible process, coke
formation can often be reversed under mild thermal treatments. The removal of coke deposits
is often carried out in a stream of either air, hydrogen, steam, carbon monoxide or a
combination of these. This regeneration results in the combustion of coke from the surface,
and is often accompanied by significant temperature increases due to its exothermic nature
[Royo et al., 1996]. The maximum temperature needs to be limited to prevent irreversible
sintering of the catalyst, and can be achieved by controlling the gas feed rate.
1.7 Problems with Supported Cobalt Catalysts for FT-synthesis
The use of cobalt as a Fischer-Tropsch catalyst provides certain beneficial features over other
choices of active metal. These features include low water-gas shift activity, as well as high
selectivity to high molecular weight straight-chain waxes that are valuable products or can be
hydrocracked to products in the middle distillate range. These advantages gained with cobalt
often come at a price, as activity can be reduced due to low reducibility of supported cobalt
catalysts and deactivation via cobalt metal re-oxidation for small cobalt particles.
1.7.1 Low Reducibility of Supported Cobalt Catalysts
A great deal of work carried out to develop silica and alumina supported cobalt catalysts that
maintain a high degree of dispersion has focussed on ways of increasing the reducibility of
the cobalt oxide on the support. Both the silica and alumina supports often induce strong
interactions with the metal. Reuel and Bartholomew [1984] studied the effect of support and
preparation method on the behaviour of the cobalt catalyst. They concluded that low cobalt

Chapter 1 - Introduction 33
reducibility derived from the formation of surface spinels through strong interaction between
cobalt and the support. These species were seen to reduce at temperatures greater than 550°C.
However reduction at these temperatures would induce rapid sintering of the metal, lowering
instead of enhancing activity [Kogelbauer et al., 1995; Puskas et al. , 1992].
Mehanjiev and Dimitrova [1981] and Mehanjiev et al. [1984] observed behaviour on alumina
similar to that observed on silica. They identified two cobalt species prior to reduction. The
first specie was an easily reducible Co30 4 phase, observed only for cobalt loadings greater
than 2 wt%. The second phase was composed of Co2+ ions which had diffused into the
alumina lattice. The Co2+ ions occupy tetrahedral and octahedral positions in the alumina
framework forming a surface spinel of CoAh04 [Chin and Hercules, 1982]. The activity of
the catalyst was largely determined by the percentage of cobalt present as the Co30 4 phase.
The calcination temperature [Sewell et al. , 1995], the pH of impregnation [Bonnevoit et al.,
1989; Ming and Baker, 1995], the cobalt precursor [Rosynek and Polansky, 1991], the
concentration of NOx gas at the surface [Coulter and Sault, 1995] and the presence of water
vapour over the Si02 supported cobalt catalyst [Kogelbauer et al., 1995] affect the percentage
of each phase.
1.7.2 Deactivation Through Cobalt Re-oxidation
The reducibility of metal oxides increases in the order Fe, Co, Ni and Ru. The possibility of
re-oxidation in an H2/H20 atmosphere decreases in the same order [Dry, 1981 ; Anderson,
1956]. Under Fischer-Tropsch synthesis conditions bulk oxidation of cobalt is not
thermodynamically favoured, however, surface layers may oxidise more readily than the bulk
oxides as metal dispersed on a support surface may have different properties to the bulk metal
[Huffman et al., 1995; Iglesia et al., 1993]. Hilmen et al. [1997] studied the re-oxidation of
alumina supported cobalt catalysts. Their study showed that promotion of the catalyst with
Re aided both the initial reduction as well as the re-oxidation of the cobalt during exposure to
H20/H2 and H20/He feeds . The presence of H20 resulted in the formation of aluminates with
high reduction temperatures deactivating the catalyst. Van Schalkwyk [1998] noted a similar
deactivation following water treatment using silica as a support.

Chapter 1 - Introduction 34
1.7.3 Alternative Supports for Fischer Tropsch Cobalt Catalysts
Catalyst preparation focuses on manufacturing a catalyst that achieves the necessary
production capability (activity) as well as being selective to some desired product or
products. With this in mind, the specific preparation route with regard to metal supported
catalysts should result in a catalyst that has high metal dispersion, minimal loss of activity
due to interaction with the support, and stability that prevents deactivation. The extent of
metal dispersion is largely a function of the strength of interaction with the support material.
These two properties are counterproductive, as increased interaction between metal and
support yields higher dispersions, but decreasing the metal reducibility. Consequently the
choice of support is significant, the aim being to find a support material that enhances
dispersion, while maintaining metal reducibility.

CHAPTER2
EXPERIMENTAL

Chapter 2 -Experimental 35
2. Experimental Procedures
A number of experimental procedures were carried out in order to evaluate the physical and
chemical properties of the catalyst, including H2 chemisorption, AA analysis, TPR, TPO and
TEM. The performance of the catalyst was tested under reaction conditions. The following
section documents these procedures and experimental set-ups.
2.1 Catalyst Synthesis
Three materials were used as supports for the cobalt catalysts, namely Si02, ZnO and MnO.
Table 2.1 shows the physical data of Si02, ZnO and MnO. The supports were obtained from
commercial suppliers and used as delivered. Si02 is a commonly used support material and
has a high surface area. The surface area of the MnO is only 4% of that of Si02 . ZnO has an
even smaller surface area (only 1% of that of Si02). The average pore diameters of the
materials were calculated using the following expression:
Pore diameter 4 x Pore volume I Surface area
The crystallinity of the three supports was determined by XRD and can be found in section
3.1.3.
The catalysts were prepared to yield each catalyst with a 9wt% loading of reduced cobalt
metal. The catalysts were prepared using the following technique:
• The correct amount of cobalt nitrate [Co(N03) 2.6H20] or cobalt acetate
[(CH3C00)2Co.4H20] was weighed out and placed in 50 ml of deionised water. The
cobalt crystals were dissolved in the water. The resultant solution was added to 5 grams
of support.
• As a result of the charge difference between the cobalt salt solution and the support used,
the mixtures were allowed to stand for two days to allow charge equilibration.
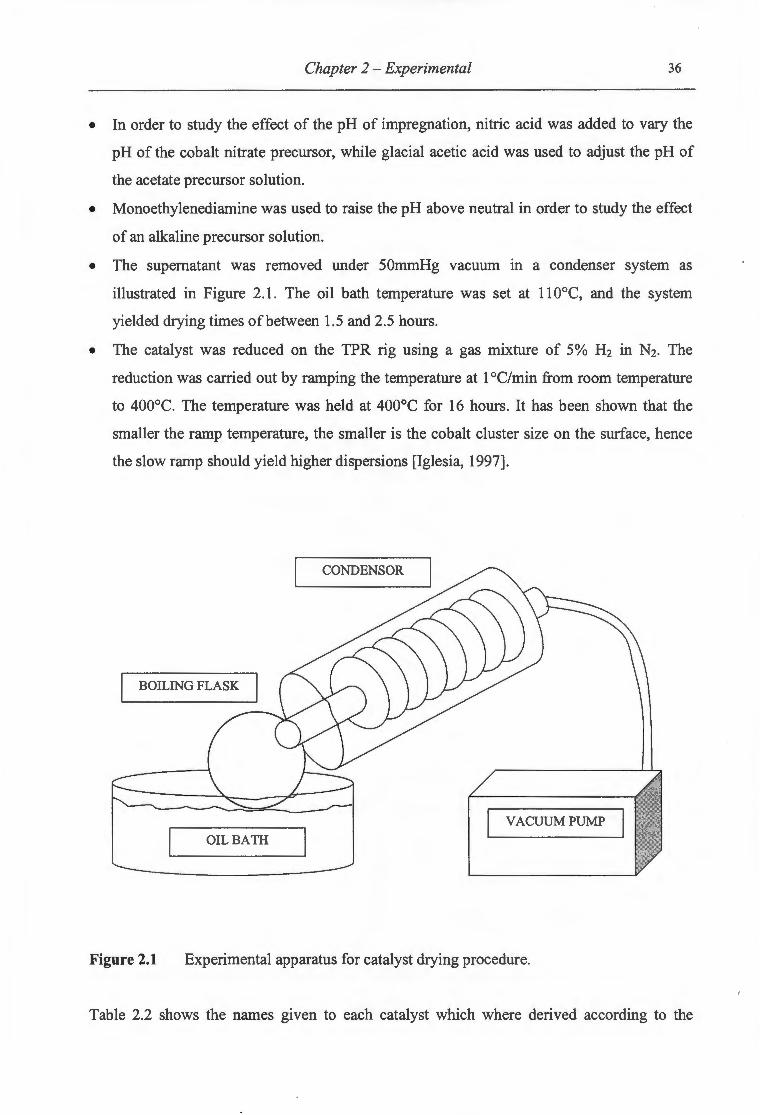
Chapter 2 -Experimental 36
• In order to study the effect of the pH of impregnation, nitric acid was added to vary the
pH of the cobalt nitrate precursor, while glacial acetic acid was used to adjust the pH of
the acetate precursor solution.
• Monoethylenediamine was used to raise the pH above neutral in order to study the effect
of an alkaline precursor solution.
• The supernatant was removed under 50mmHg vacuum in a condenser system as
illustrated in Figure 2.1. The oil bath temperature was set at 11 0°C, and the system
yielded drying times ofbetween 1.5 and 2.5 hours.
• The catalyst was reduced on the TPR rig using a gas mixture of 5% H2 in N2 . The
reduction was carried out by ramping the temperature at 1 °C/min from room temperature
to 400°C. The temperature was held at 400°C for 16 hours. It has been shown that the
smaller the ramp temperature, the smaller is the cobalt cluster size on the surface, hence
the slow ramp should yield higher dispersions [Iglesia, 1997].
CONDENSOR
BOILING FLASK
VACUUM PUMP
OIL BATH
Figure 2.1 Experimental apparatus for catalyst drying procedure.
Table 2.2 shows the names given to each catalyst which where derived according to the
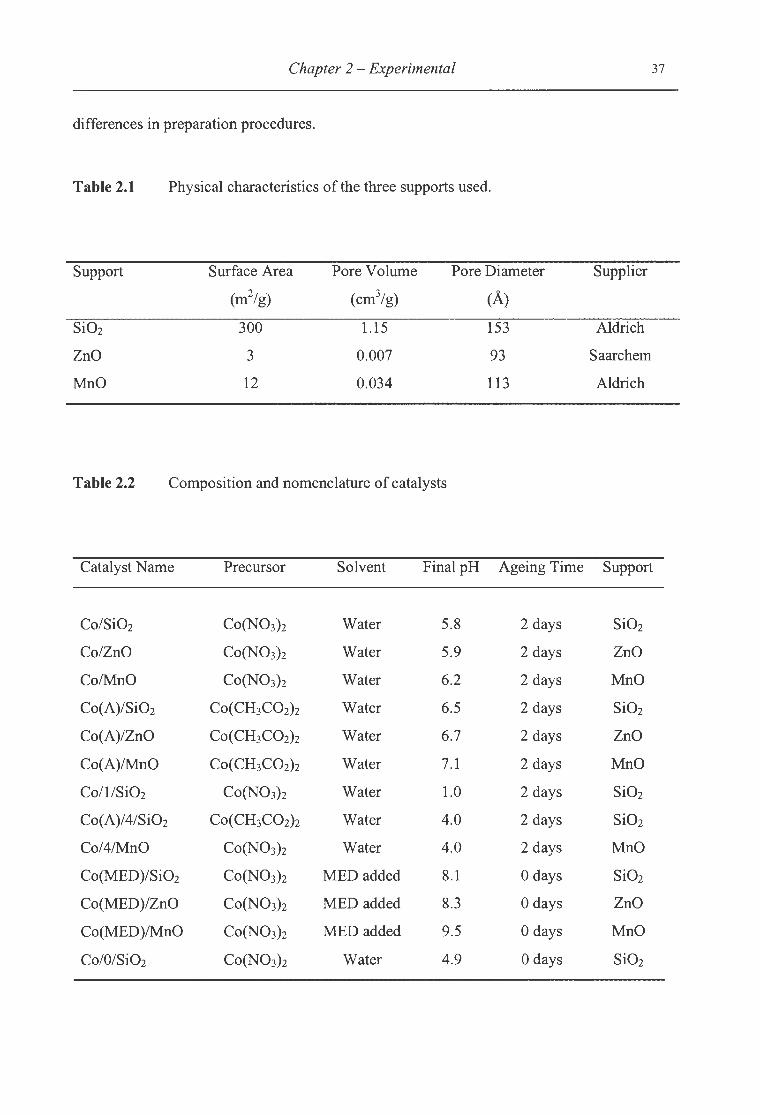
Chapter 2 -Experimental 37
differences in preparation procedures.
Table 2.1 Physical characteristics of the three supports used.
Support Surface Area Pore Volume Pore Diameter Supplier
(m2/g) (cm3/g) (A)
Si02 300 1.15 153 Aldrich
ZnO 3 0.007 93 Saarchem
MnO 12 0.034 113 Aldrich
Table 2.2 Composition and nomenclature of catalysts
Catalyst Name Precursor Solvent Final pH Ageing Time Support
Co/Si02 Co(N03)2 Water 5.8 2 days Si02
Co/ZnO Co(N03)2 Water 5.9 2 days ZnO
Co/MnO Co(N03)2 Water 6.2 2 days MnO
Co(A)/Si02 Co(CH3C02)2 Water 6.5 2 days Si02
Co(A)/ZnO Co(CH3C02)2 Water 6.7 2 days ZnO
Co(A)/MnO Co(CH3C02)2 Water 7.1 2 days MnO
Co/1/Si02 Co(N03)2 Water 1.0 2 days Si02
Co(A)/4/Si02 Co(CH3C02h Water 4.0 2 days Si02
Co/4/MnO Co(N03)2 Water 4.0 2 days MnO
Co(MED)/Si02 Co(N03)2 MED added 8.1 0 days Si02
Co(MED)/ZnO Co(N03)2 MED added 8.3 0 days ZnO
Co(MED)/MnO Co(N03)2 MED added 9.5 0 days MnO
Co/O/Si02 Co(N03)2 Water 4.9 0 days Si02

Chapter 2 -Experimental 38
2.2 Catalyst Characterisation
The vanous techniques outlined in the following section all play an important role in
examining the physical properties that largely determine the success or failure of that catalyst.
Characterisation provides valuable information about the structural, electronic and chemical
properties of the active catalyst component, knowledge that provides the wherewithal to
explain catalyst performance in detail. Characterisation techniques used in this work were
zeta potential measurements, temperature programmed reduction (TPR), temperature
programmed oxidation (TPO), transition electron microscopy (TEM), hydrogen
chemisorption, and atomic absorption spectroscopy (AAS).
2.2.1 Zeta Potential Measurements
A Zetasizer was used to obtain zeta potential measurements of the three supports studied,
namely Si02, ZnO and MnO. Zeta potential is a measure of the net charge on the surface of a
substance (inorganic oxides in this case) when the substance is placed in solution. The
equilibrium that develops between the positive and negative ions on the surface and in
solution determines whether the surface charge has a net negative or positive value. Changes
in the pH of the solution affect the equilibrium and alter the net surface charge. The surface
charge is important in understanding the interaction that takes place between the support and
the Co2+ ions that are loaded during impregnation.
Consequently plots of zeta potential versus pH were prepared for each support as follows:
• A small mass of support ( ~0.1 gram) was finely ground so that it would exist as a
suspension in a solution.
• The support was placed in 50 ml of 0.05 M solution of KCl and shaken. KCl was chosen
as both K+ and cr ions would behave as spectator ions and not avoid the surface-solution
equilibrium.

Chapter 2 -Experimental 39
• The pH of the solution was adjusted in the acid range using HCl, and in the alkaline range
using KOH in order to add H+ ions and OH- respectively, while introducing only spectator
ions as the conjugate ions.
• For each pH adjustment, an injection was done in the zetasizer. The zetasizer was set to
take three measurements per injection and give an average zeta reading and error at that
specific pH.
• Zeta results were stored on computer for further analysis.
2.2.2 Temperature Programmed Reduction
Temperature programmed reduction (TPR) was used to evaluate the reduction behaviours of
the catalysts synthesised during this work. The theory behind TPR is discussed in section
1.5.1, this section will serve to outline the equipment used and the procedure followed.
2.2.2.1 TPR Equipment
Figure 2.2 is a schematic of the TPR equipment. The TPR rig consisted of a quartz cell
housed in a furnace capable of achieving temperatures in excess of 1 000°C. The quartz cell
contained a thermowell which held a thermocouple in close proximity to the catalyst bed in
order to maintain accurate control of the temperature.
A mixture of 5% H2 in N 2 was used as the reducing gas, while N2 gas was used as a reference
gas. The flow of each of these gases was controlled using Brooks 9650 Series mass flow
controllers. Bubble meters were used to calibrate the mass flow controller settings. A thermal
conductivity detector was used to monitor the extent of consumption of hydrogen over the
catalyst by logging changes in thermal conductivity of the reducing gas relative to the
nitrogen reference stream of constant thermal conductivity. A 3 A molecular sieve was
situated downstream of the catalyst in order to trap water vapour formed during metal oxide
reduction.

NITROGEN
AIR
5% Hz(N2 GAS MIXTURE
Chapter 2 -Experimental
3A MOLECULAR SIEVE TRAP
TEMPERATURE CONTROLLED
REACTOR
Figure 2.2. Diagram of the temperature programmed reduction apparatus
2.2.2.2 TPR Procedure
40
THERMAL CONDUCTIVITY
DETECTOR
A mass of catalyst (typically 0.15 gram) was loaded into the quartz cell, resting upon a
porous quartz frit. The quartz cell was secured inside the furnace through attachment at either
end to stainless steel tubing. The reference and sample gas flows were adjusted to
60(NTP)ml/min using the mass flow controllers, the bubble columns and a stopwatch. A
temperature programme for the run was chosen by logging the heating rate and final

Chapter 2 - Experimental 41
temperature on a computer software program. The temperature program for the is shown in
Figure 2.3.
CALCINATION N2 gas flow over catalyst
REDUCTION 5% H2 in N2 gas flow over catalyst
Ramp @ 1 0°C/min
/ Cool to !OO"C and rd
Final T = 1000°C, hold for 20 minutes
Temperature
Figure 2.3. Temperature programme used for TPR runs for characterisation of the catalyst precursor.
Initially the catalyst underwent pretreatment in a nitrogen stream. The temperature was
ramped at 1 °C/min from room temperature to 400°C to decompose the nitrate or acetate still
present after drying. The system was allowed to cool down to 1 00°C and the TCD was
switched on and left to stabilise for at least 2 hours. The baseline TCD reading for nitrogen
was logged to computer, then the hydrogen gas was switched to pass over the catalyst and the
hydrogen baseline reading was logged to computer. The temperature was raised linearly at
1 0°C/min from 1 00°C to 1 000°C and maintained at 1 000°C for 20 minutes to ensure
complete reduction of the cobalt to metal form. The data was logged to microcomputer and
stored for further analysis. The H2 in N2 gas was calibrated using CuO. The calibration can be
found in Appendix I. The program used for the TPR runs performed to determine the degree
of reduction of the catalysts was as follows. A mass of catalyst at 400°C for 16 hours was
placed in the TPR cell. The temperature was ramped at 5°c/min to 1 00°C. The baseline
Chapter 2 -Experimental 42
nitrogen TCD reading and 5% Hz in Nz TCD readings were measured after which the
temperature was ramped at 1 0°C/min from 1 00°C to 1 000°C in the 5% Hz in Nz mixture.
2.2.3 X-Ray Diffractometry
Physical characterisation of the catalyst was done using x-ray diffractometry. The catalyst
particle is an ordered structure consisting repeated planes of the same kind of atom. When x
rays are reflected from these planes, a diffraction pattern is generated and recorded. Analysis
of these results allows for the assessment of the degree of crystallinity of the catalyst
material, as well as information enabling determination of the positions of individual atoms in
the particle structure.
A Phillips X-ray diffractometer was used to obtain x-ray diffraction spectra using Cu-Ka
radiation. The diffractometer operated under the following settings:
• voltage 40kV
• current 25mA
• 28 range 20 - 70°
• 28 step size 0.1°
• step duration 1 second
2.2.4 Transmission Electron Microscopy
Transmission electron microscope pictures were taken usmg a JEOL JEM-200CX
microscope. Prior to photography, the catalyst samples were prepared according to the
following procedure. Catalyst samples were reduced at 400°C for 16 hours in 5% Hz in Nz.
Each sample was crushed using a mortar and pestle in order to obtain smaller aggregates. The
finer catalyst particles were dispersed in methanol and placed on carbon coated copper grids.
The samples were left to stand in order to dry. Samples were viewed at 200kV in the electron
microscope.
r

Chapter 2 -Experimental 43
2.2.5 Hydrogen Chemisorption
Hydrogen chemisorption was used to measure the metal surface area of cobalt on the
different supports. Measurements were done using a Micrometries ASAP 2000C apparatus.
Hydrogen has been shown to yield monolayer coverage under certain conditions for
supported cobalt catalysts [Reuel and Bartholomew, 1984].
The catalyst was first reduced on the TPR rig using a gas mixture of 5% Hz in Nz. The
reduction was carried out by ramping the temperature at 1 °C/min from room temperature to
400°C. The temperature was held at 400°C for 16 hours. It has been shown that the smaller
the ramp temperature, the smaller is the cobalt cluster size on the surface, hence the slow
ramp should yield higher dispersions [Iglesia, 1997].
Following reduction, approximately 0.5g of catalyst was placed in the chemisorption
apparatus and re-reduced in situ at 400°C in a Hz gas stream. The sample was then evacuated
for 1 hour to remove any residual hydrogen or water that was present during activation. The
sample was then cooled to 1 oooc under vacuum and the hydrogen adsorption isotherms were
measured between 100 and 450 mmHG. The reversibility of the hydrogen adsorption was
measured by evacuating the sample at 1 00°C for 15 minutes an remeasuring the adsorption
isotherm. The reversibility of hydrogen adsorption is defined as the amount of hydrogen not
removed by evacuation relative to the total hydrogen adsor ed on the catalyst, and is
calculated from the following expression :
Reversibility= Virr I Ytotal x 100%
where Virr represents the amount of hydrogen not able to be re oved during 15 minutes of
evacuation, and Ytotai represents the total hydrogen uptake of the catalyst. A sample
calculation illustrating the procedure for determination of me al surface area, dispersion,
average crystallite diameter and reversibility of adsorption can b seen in Appendix II.
Chapter 2 -Experimental 44
2.3 Fischer Tropsch Synthesis
The following section discusses the experimental apparatus and procedures used to evaluate
the catalysts' performance under Fischer Tropsch conditions.
2.3.1 Experimental Apparatus
The experimental system used for determining Fischer Tropsch catalyst performance is
shown in Figure 2.6. A glass reactor with an ID of 16mm was used. The reactor was a fixed
bed type using a frit to position the catalyst in the furnace. A thermowell ran vertically
through the length of the reactor. The thermowell housed a thermocouple for accurate
measurement of the temperature within the catalyst bed. The thermocouple could be moved
vertically allowing measurement of the temperature profile of the bed. The axial temperature
profile can be seen in Figure 2.4. The furnace created an isothermal region 3 em long in
which the catalyst was placed. The glass reactor was housed in stainless steel casing with two
entrance lines and one exit line. The two entrance lines were separated using a rubber seal.
This system allowed one entrance line to flow over the catalyst, while the other line ran as a
bypass line down the outside of the reactor. Argon flowed in the one entrance line and served
to pressurise the reactor to reaction pressure, while the syngas (H2/CO = 2) flowed in the
second entrance line. A schematic of the reactor configuration used for Fischer-Tropsch
synthesis can be seen in Figure 2.5.

Chapter 2 - Experimental 45
205 ~-------------------------------------------------------,
-- 204 (.) 0 ............
fE :::J
•••••••••••••••••
~ 203 •••••• • •••• Q) c.. E Q)
I- 202 •• •
201 +---~--~--~----~--~--~--~----~--.---~--~--~--~ 0 5 10 15 20 25 30 35 40 45 50 55 60 65
Thermocouple Position (mm)
Figure 2.4. Axial bed temperature profile of the reactor in the furnace at approximately 200°C.
Bypass line
' Feed inlet
111-ttt-t+-+- Thermowell
:ttt-t+--+r'<>+<>lyst bed
Heating element
Product outlet ---+
Figure 2.5. Schematic of reactor configuration used for FT synthesis
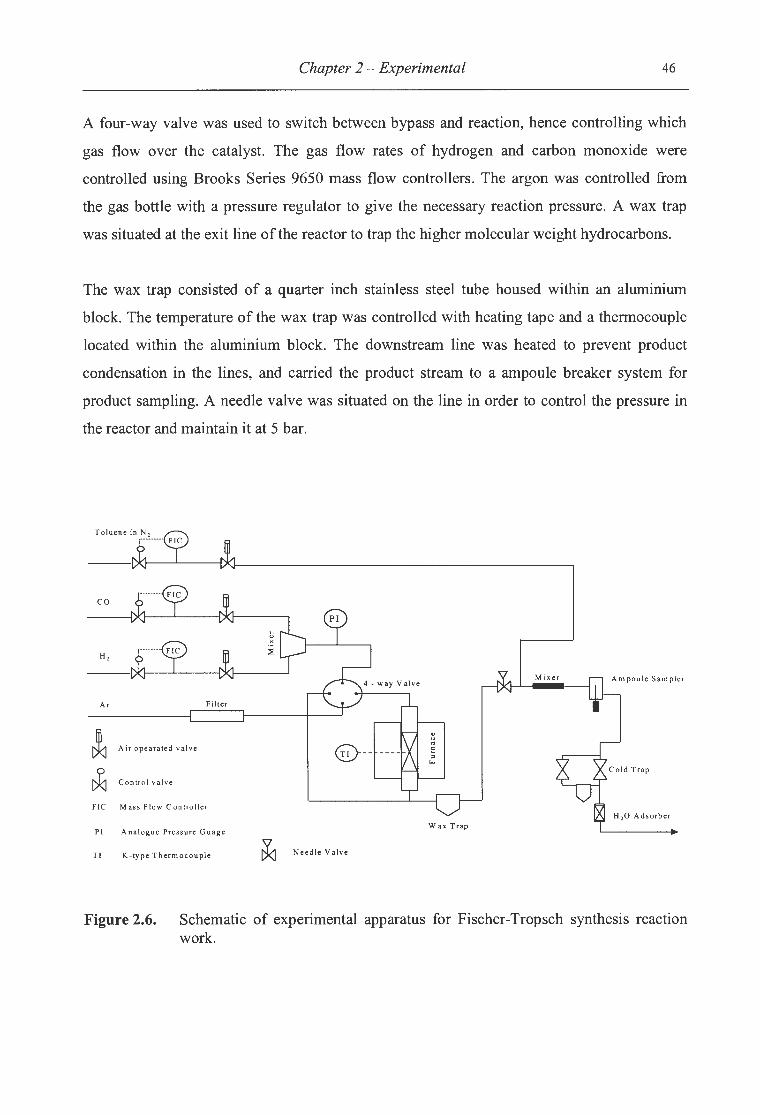
Chapter 2 - Experimental 46
A four-way valve was used to switch between bypass and reaction, hence controlling which
gas flow over the catalyst. The gas flow rates of hydrogen and carbon monoxide were
controlled using Brooks Series 9650 mass flow controllers. The argon was controlled from
the gas bottle with a pressure regulator to give the necessary reaction pressure. A wax trap
was situated at the exit line of the reactor to trap the higher molecular weight hydrocarbons.
The wax trap consisted of a quarter inch stainless steel tube housed within an aluminium
block. The temperature of the wax trap was controlled with heating tape and a thermocouple
located within the aluminium block. The downstream line was heated to prevent product
condensation in the lines, and carried the product stream to a ampoule breaker system for
product sampling. A needle valve was situated on the line in order to control the pressure in
the reactor and maintain it at 5 bar.
co
H,
Ar Fi lter
~ Air opearated valve
~ Control valve
FIC Mass Flow Controller
PI Analogue Press ure Guage Wax Trap
TI K-type Th ermocoup le DkJ Need le Va lve
Figure 2.6. Schematic of experimental apparatus for Fischer-Tropsch synthesis reaction work.
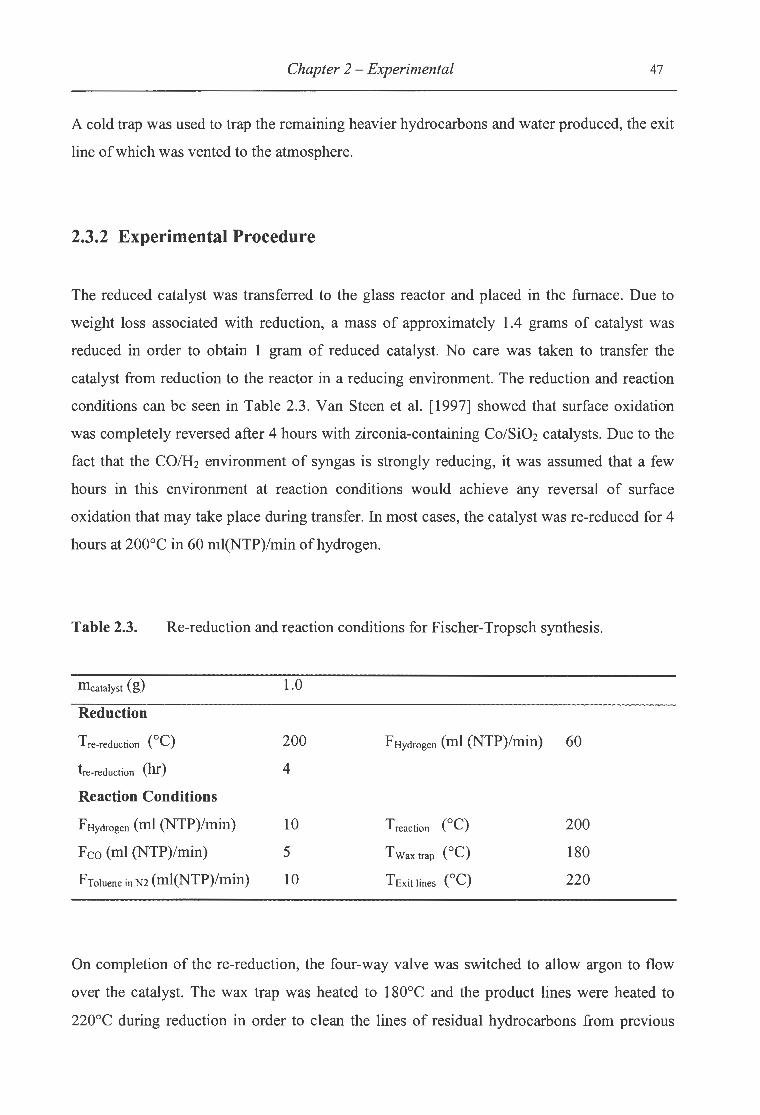
Chapter 2 -Experimental 47
A cold trap was used to trap the remaining heavier hydrocarbons and water produced, the exit
line of which was vented to the atmosphere.
2.3.2 Experimental Procedure
The reduced catalyst was transferred to the glass reactor and placed in the furnace. Due to
weight loss associated with reduction, a mass of approximately 1.4 grams of catalyst was
reduced in order to obtain 1 gram of reduced catalyst. No care was taken to transfer the
catalyst from reduction to the reactor in a reducing environment. The reduction and reaction
conditions can be seen in Table 2.3. Van Steen et al. [1997] showed that surface oxidation
was completely reversed after 4 hours with zirconia-containing Co/Si02 catalysts. Due to the
fact that the CO/H2 environment of syngas is strongly reducing, it was assumed that a few
hours in this environment at reaction conditions would achieve any reversal of surface
oxidation that may take place during transfer. In most cases, the catalyst was re-reduced for 4
hours at 200°C in 60 ml(NTP)/min of hydrogen.
Table 2.3. Re-reduction and reaction conditions for Fischer-Tropsch synthesis.
mcatalyst (g) 1.0
Reduction
T re-rectuction (°C) 200 F Hydrogen (ml (NTP)/min) 60
tre-reduction (hr) 4
Reaction Conditions
FHydrogen (ml (NTP)/min) 10 Treaction (°C) 200
Fco (ml (NTP)/min) 5 T Wax trap (°C) 180
Froluene in N2 (ml(NTP)/min) 10 T Exit lines (°C) 220
On completion of the re-reduction, the four-way valve was switched to allow argon to flow
over the catalyst. The wax trap was heated to 180°C and the product lines were heated to
220°C during reduction in order to clean the lines of residual hydrocarbons from previous

Chapter 2 - Experimental 48
runs. The reactor was pressurised to 5 bar with the argon. The H2, CO and N2 flows were
switched on and adjusted to the desired flow rates. The same flow rates were used for all
runs. They were 10 (NTP)ml/min H2, 5 (NTP)ml/min CO and 10 (NTP)ml/min N2. The flow
rate of the exit line was controlled using the needle valve and a bubble metre connected to the
cold trap. The exit flow line was set between 30 and 40 (NTP)ml/min, in order to maintain a
low percentage of argon and avoid excessive product dilution.
2.3.3 Product Analysis
Product analysis was carried out in two gas chromatographs. Conversion measurements were
obtained through permanent gas analysis on a Varian 3300 Series GC using a thermal
conductivity detector (TCD) and a 80/100 Carbosieve II column. The organic product
spectrum was analysed in a Varian 3400 gas chromatograph (GC) with a flame ionisation
detector (FID) detector and cryogenics installed. The cryogenic system installed on the FID
GC made use of C02 enabling GC oven temperatures of -70°C. The product separation was
achieved using a 38 metre OV-1 type column with 0.25 1-1m film thickness and 0.25 mm ID.
Several runs do not contain information on methane, C2 and C3 selectivities as the column in
the FID GC broke with the net effect of reducing the column length from 50 m to 38 m
upsetting lower hydrocarbon separation.
Prior to reaction, the composition of the bypass stream was analysed by injecting samples
with a Hamilton 0.5 ml syringe into the injector port of the TCD GC. When the bypass flows
were stable, the four way valve was switched to the reaction position. A Hamilton 5 ml
syringe was used for direct injection into the FID GC while ampoule samples were taken for
later analysis.
A mixture of 0.1% toluene in N2 was used as a standard gas for both the TCD and FID
analysis, and was fed to the product line after the needle valve. As nitrogen was constant
throughout the reaction, and toluene is not a Fischer Tropsch product, this mixture was
suitable as a standard.
Conversion and yield calculations are outlined in Appendix III.

CHAPTER3
RESULTS

Chapter 3 -Results 49
3. Results
The three supports used in this study were Si02, ZnO and MnO. Much work has been done
investigating the performance of cobalt catalysts using Si02 as a support [Kuipers et al.,
1996; Kogelbauer et al., 1995; Coulter and Sault, 1995]. Consequently Si02 is a good base to
work from in order to compare the performance of ZnO and MnO as supports for Fischer
Tropsch catalysts. The performance of the catalyst has been shown to depend significantly
upon the nature of the support used [Bartholomew and Reuel, 1991] as well as upon factors
such as the choice of precursor compound, the pH of impregnation and the impregnation
solvent employed [Sewell, 1996]. The pH of impregnation affects the interaction between
Co2+ ions and the support as determined by the zeta potential of the support. These factors
affect the extent of reducibility of the active metal on the support which is vital in
determining the catalyst activity. It is expected that the strength of interaction is the defining
criterion for cobalt reducibility on the catalyst surface.
3.1 Catalyst Characterisation
The surface charge as a function of pH was obtained using a zetasizer. The point of zero
charge (PZC) as defined in section 1.4.1 .1.3 occurred at a different pH for each of the three
supports. The catalyst reducibility of cobalt nitrate and acetate on Si02, ZnO and MnO under
differing preparation conditions was evaluated using TPR, while metal surface area
measurements were determined using hydrogen chemisorption. Base TPR runs were carried
out on the supports and the bulk cobalt oxide in order to evaluate the reducibility of the
support and metal separately, allowing more accurate interpretation ofTPR data.
3.1.1 Zeta Potential Measurements
The charge equilibrium between the surface of an inorganic oxide and the solution in which it
is placed is determined by the different functional groups (such as OH-) that exist on the
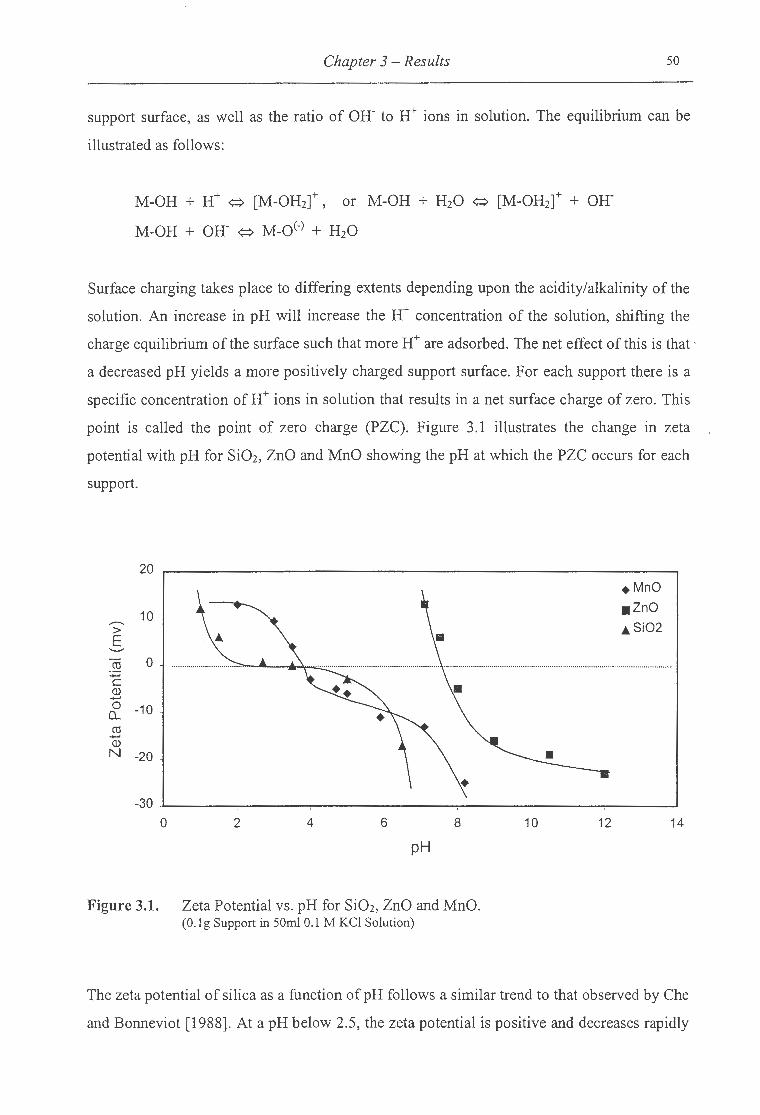
Chapter 3 - Results 50
support surface, as well as the ratio of OH- to H+ ions in solution. The equilibrium can be
illustrated as follows:
M-OH + H+ ~ [M-OHzt, or M-OH + HzO ~ [M-OHzt + OH
M-OR + OH- ~ M-oC-) + HzO
Surface charging takes place to differing extents depending upon the acidity/alkalinity of the
solution. An increase in pH will increase the W concentration of the solution, shifting the
charge equilibrium of the surface such that more H+ are adsorbed. The net effect of this is that ·
a decreased pH yields a more positively charged support surface. For each support there is a
specific concentration of H+ ions in solution that results in a net surface charge of zero. This
point is called the point of zero charge (PZC). Figure 3.1 illustrates the change in zeta
potential with pH for Si02, ZnO and MnO showing the pH at which the PZC occurs for each
support.
20
10 _......., > E
cu 0 ...... c Q) ...... 0 -10 0... cu ...... Q)
N -20
-30
0 2 4 6 8
pH
Figure 3.1. Zeta Potential vs. pH for SiOz, ZnO and MnO. (O.lg Support in 50ml 0.1 M KCI Solution)
+MnO .zno _.si02
10 12 14
The zeta potential of silica as a function of pH follows a similar trend to that observed by Che
and Bonneviot [1988]. At a pH below 2.5, the zeta potential is positive and decreases rapidly
Chapter 3 -Results 51
with increasing pH. In this pH range the surface of the silica is on average positively charged.
Between a pH of 2.5 and 5, the zeta potential is approximately zero, although there exists a
slight surplus of negative charge on the surface. At any pH larger than 5 the surface becomes
rapidly more negatively charged.
The point of zero charge (PZC) for MnO is at a pH of approximately 4. At pH values lower
than 4, the MnO surface is positively charged. For pH values larger than 4, the MnO surface
bears a net negative charge. The zeta potential varies steadily with pH, unlike the ZnO curve
which changes dramatically over a small pH range.
ZnO has a PZC at a significantly higher pH than either Si02 or MnO. The PZC for ZnO is at
a pH of approximately 7.8. At a pH lower than 7.8, the ZnO surface experiences a net
positive charge, while at pH values higher than 7.8 the ZnO surface has a net negative charge.
As the pH is lowered, the solubility of each support increases. The ZnO support dissolves
completely at a pH of between 5 and 6. The MnO and Si02 supports are more resilient,
however partial dissolution in strong acidic media does take place with MnO, and to a far
lesser extent with Si02.
3.1.2 Equilibration of Impregnation pH
It is well known that when an inorganic oxide is placed in a solution of containing W and
OK ions, an equilibrium reaction begins in o tier to balance charge between the surface and
the solution. This equilibration process may vary in speed depending upon the nature of the
support and the concentration of ions in solution. Due to the porous nature of many supports,
this equilibration may take days and even months. Consequently, when cobalt was loaded
onto Si02, ZnO and MnO, the initial pH of solution, as determined by the strong acidic nature
of Co(N03)2.6H20 and the weak acidic nature of Co(CH3C00)2.4H20, was seen to change as
a consequence of this equilibration. Table 3.1 shows the initial pH and the final pH after two
days of equilibration.
~ . .. ~ .
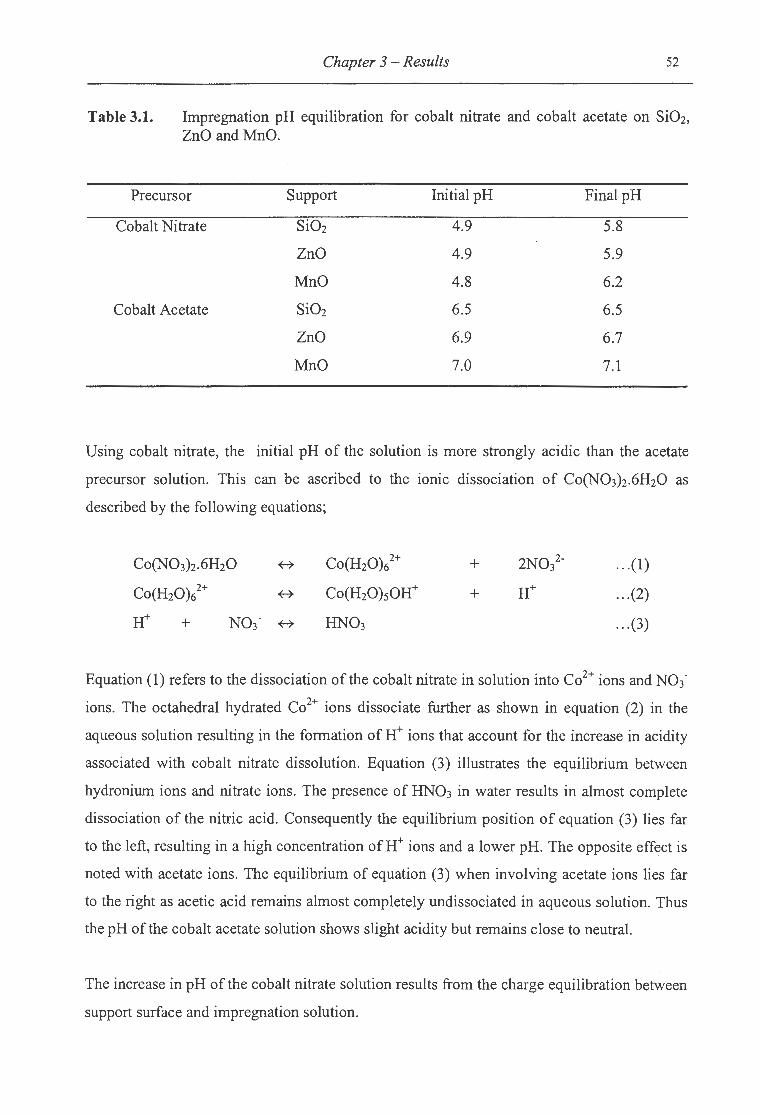
Chapter 3 - Results 52
Table 3.1. Impregnation pH equilibration for cobalt nitrate and cobalt acetate on. Si02, ZnO andMnO.
Precursor Support Initial pH Final pH
Cobalt Nitrate Si02 4.9 5.8
ZnO 4.9 5.9
MnO 4.8 6.2
Cobalt Acetate Si02 6.5 6.5
ZnO 6.9 6.7
MnO 7.0 7.1
Using cobalt nitrate, the initial pH of the solution is more strongly acidic than the acetate
precursor solution. This can be ascribed to the ionic dissociation of Co(N03)2.6H20 as
described by the following equations;
Co(N03)2.6H20
Co(H20)i+
+
Co(H20)62+
Co(H20)sOH+
HN03
+
+
... (1)
... (2)
... (3)
Equation (1) refers to the dissociation ofthe cobalt nitrate in solution into Co2+ ions and N03-
ions. The octahedral hydrated Co2+ ions dissociate further as shown in equation (2) in the
aqueous solution resulting in the formation of H+ ions that account for the increase in acidity
associated with cobalt nitrate dissolution. Equation (3) illustrates the equilibrium between
hydronium ions and nitrate ions. The presence of HN03 in water results in almost complete
dissociation of the nitric acid. Consequently the equilibrium position of equation (3) lies far
to the left, resulting in a high concentration of H+ ions and a lower pH. The opposite effect is
noted with acetate ions. The equilibrium of equation (3) when involving acetate ions lies far
to the right as acetic acid remains almost completely undissociated in aqueous solution. Thus
the pH of the cobalt acetate solution shows slight acidity but remains close to neutral.
The increase in pH of the cobalt nitrate solution results from the charge equilibration between
support surface and impregnation solution.

Chapter 3 - Results 53
3.1.3 X-Ray Diffractometry
The X-ray diffraction patterns for the three supports are illustrated in Figure 3.2. The plots
show the peak intensity as the diffraction angle is varied. The intensity generated at different
700
600 Si02 A
>- 500 -·u; 400 c (])
300 -c 200
100
0 10 20 30 40 50 60 70 80
2 Theta (Cu K alpha)
5000
4000 ZnO B
>-~ 3000 (J)
c (]) - 2000 c
1000
0 ! _k1 '
10 20 30 40 50 60 70 80
2 Theta (Cu K alpha)
c
40 50 60 70 80
2 Theta (Cu K alpha)
Figure 3.2. XRD patterns for (A) Si02, (B) ZnO and (C) MnO.

Chapter 3 - Results 54
angles is a measure the degree of crystallinity of the bulk material. The degree of crystallinity
can be observed from XRD patterns from the intensity of peaks associated with the relevant
material, as well as the extent of peak broadening. The wider the peaks, and the lower the
intensity, the more amorphous the material is. From Figure 3.2 (A) it is clear that the bulk
structure of the Si02 support is amorphous. In other words the support does not exist as a
highly structured framework. However the intensity of the characteristic peaks of the ZnO
support ZRD pattern indicate a very high degree of crystallinity (Figure 3.2(B)). The XRD
pattern of the MnO support (Figure 3.2 (C)) shows a higher degree of crystallinity than the
Si02 support, but is less crystalline than the ZnO support.
These findings have implications with respect to the way in which cobalt interacts during
impregnation, drying and activation. The less structured framework of the amorphous Si02
support will show more surface defects than both MnO and ZnO. As these defects serve as
anchors for cobalt during impregnation, the Si02 will show a higher degree of metal support
interaction than the other two supports. The ZnO support will show very little metal support
interaction due to a surface poor in functional groups.
3.1.4 Temperature Programmed Reduction
The same procedure was used for all TPR runs. The catalyst was calcined in nitrogen gas for
1 hour at 400°C prior to reduction. The reduction was carried out using 60 ml(NTP)/min of
5% H2 in N2 gas. The temperature was ramped from 1 00°C to 1 oooac at 1 0°C/min and held
at 1 000°C for 20 minutes to ensure complete reduction of the metal. The only alteration to
this program occurred during runs involving the ZnO support. For these runs, a maximum
temperature of 650°C was used to avoid interaction between the ZnO and the quartz cell,
where the ZnO had previously been seen to diffuse into the quartz leading to disintegration of
the quartz cell. Calibration of the TPR apparatus was performed using CuO. The calculation
and spectrum can be found in Appendix I.
Reduction of the bulk metal oxide Co304 is illustrated in Figure 3.3. The bulk oxide Co30 4
was reduced under the same conditions as the prepared catalysts in order to compare the
reducibility of cobalt on the studied supports. The reduction of the bulk cobalt oxide takes

Chapter 3 - Results 55
place as two reduction steps. The first step corresponds to the reduction of Co304 to CoO, and
the second step results from the reduction of Cod to zerovalent cobalt metal. These steps are
not clearly evident in Figure 3.3 as a result of high hydrogen consumption and possible
oxidation of the Co30 4 to Co203, although the main reduction section comprises a shoulder
and a main peak. The stoichiometries of these two steps are illustrated below:
CoO +
3Co0 +
Co +
Hz/Co = 0.33
Hz/Co = 1
The experimental hydrogen to cobalt ratio obtained for the total hydrogen to cobalt molar
ratio was 1.58. This value was higher than the expected ratio of 1.33, possibly a result of
further oxidation of the sample to Co203 prior to use. Reduction of the cobalt oxide sample
was complete by 490°C.
0.6
- 0.5 :::> ~ 0.4 ......... c 0 0.3 :.;::::; a. E 0.2 ::J C/)
0.1 c 0 u 0
N
I 0 200 400 600 800 1000
Temperature CC)
Figure 3.3. Temperature programmed reduction profile of Co30 4. (mass cat- 0.05g, heating rate= 10°C/rnin, Reducing gas= 60ml(NTP)/min 5% H2 in N2)
Temperature programmed reduction runs were done on the base MnO support, as well as on
MnO that was placed in a nitric acid solution and dried. Figure 3.4 illustrates the TPR profiles
obtained. The TPR profile for unaltered MnO showed a very small reduction peak at 400°C,
probably a result of small impurities or slight surface oxidation of the MnO support to Mn20 3
or Mn02 . The profiles with HN03 added were prepared in the same way as the catalysts.
MnO was placed in 50ml deionised solution and HN03 was added, followed by drying in a

Chapter 3 -Results 56
rotavap dryer under vacuum. This was to investigate the high hydrogen to cobalt molar ratios
that were attained during TPR for the MnO supported catalysts (see chapter 3.2.1.1 and
chapter 3.2.4.1 ). It was thought that the presence of the nitrate precursor and nitric acid may
have resulted in oxidation of the MnO support. This was thought to account for the high
ratios observed. This is indeed the case. HN03 was placed in solution over the MnO support
and dried. One TPR run was carried out on the dried MnO, while a second TPR was
performed following calcination of the dried MnO. The calcination step was performed to see
if the presence of nitric acid oxidised the support, or whether oxidation took place during the
nitrate decomposition.
0.5
........ 0.4 ~ <( ......... 0.3 c 0
:;::; Q. 0.2 E ::::J (/)
0.1 c 0 ()
N 0 I
0 200
HN03 added
/ HN03, calcined
._ MnO
400 600
Temperature CC) 800 1000
Figure 3.4. TPR profiles for MnO in bought form, with HN03 added, and with HN03 added and calcined. (mass cat- 0.15g, heating rate = 10°C/rnin, Reducing gas = 60rnl(NTP)/min 5% H2 in N2)
The TPR spectra for both cases illustrate significant enhancement of support reducibility
relative to the unaltered MnO TPR run. This indicates that MnO can alter oxidation states
quite easily. No precursor decomposition was seen for the uncalcined MnO spectrum
indicating that the HN03 resulted in oxidation while in solution. Table 3.2 shows the
hydrogen to manganese molar ratios associated with the spectra in Figure 3.4. The hydrogen
to MnO molar ratios were almost unaffected by calcination, indicating that oxidation of the
support was complete during the solution and drying phases. The slightly high hydrogen to
manganese ratio for the calcined catalyst indicates that calcination may oxidise a fraction of

Chapter 3 - Results 57
the MnO. Oxidation of the support was not observed with Si02 and ZnO. This can be
ascribed to the reluctance of these materials to oxidise.
Table 3.2. TPR hydrogen consumption data for MnO with and without nitric acid addition.
Catalyst
HN03 on MnO (calcined)
HN03 onMnO
MnO
HziMnTotal (mol/mol)
0.325
0.319
~o
3.2 Influence of Catalyst Preparation Procedure
During this investigation, the preparation procedure was varied in order to evaluate the effect
of support type, precursor compound impregnation pH, impregnation solvent, and
impregnation contact time. The effects were characterised using TPR, hydrogen
chemisorption, and TEM, as well as an evaluation of these changes under reaction conditions
in terms of catalyst activity and selectivity.
3.2.1 Base Case for Si02, ZnO and MnO
A base case catalyst was prepared for each support in order to create a basis with which to
evaluate changes in catalyst precursor, impregnation pH, impregnation solution and
impregnation contact time. The basis chosen was as follows:
The cobalt source was hydrous cobalt nitrate (Co(N03)2.6H20). A mass of cobalt nitrate
weighed out and dissolved in 50 ml deionised water in order to attain 9 wt% cobalt on .the
reduced catalyst. This solution was poured onto 5 g of each support. The mixture was shaken
for several minutes and left for two days to stand. The pH was taken at the initial

Chapter 3 - Results 58
impregnation, and once again just prior to drying 2 days later. Table 3.1 shows the changes in
pH for the 3 supports. The supernatant was removed using a rotavap drier as described in
chapter 2.1 . This procedure yielded 3 cobalt-supported catalysts formed on different supports
under the same conditions. The physico-chemical characteristics of the Si02, ZnO and MnO
supported cobalt catalysts were evaluated using TPR, hydrogen chemisorption and TEM. The
catalytic activity and selectivity of each catalyst was obtained under Fischer-Tropsch reaction
conditions.
3.2.1.1 Temperature Programmed Reduction
The TPR spectra of the base case Si02, ZnO and MnO supported cobalt catalyst precursor
prior to reduction can be seen in Figure 3.5. During the preliminary calcination step, the
nitrate precursor decomposes releasing N02 gas. Nitrate decomposition takes place at
approximately 240°C for Si02 supported cobalt catalysts [Sewell, 1996]. For this reason no
decomposition peak is evident in the spectra. The slower heating rate of 5°C/min and the high
gas flow rate over the bed both served to decrease the rate of decomposition and the partial
pressure of N02 gas at the support surface. N02 gas can act as an oxidising agent for Co2+,
and consequently plays a role in determining the final state of supported cobalt. Control of
the N02 concentration at the support surface may enhance metal dispersion on the support
surface [Iglesia, 1997]. When the cobalt nitrate precursor is decomposed, the exothermicity
of decomposition leads to increased local temperatures on the support surface resulting in
larger Co agglomerates. Higher linear gas velocities result in efficient heat removal,
minimising hotspots on the surface.
Table 3.3 gives the hydrogen to cobalt molar ratios for the total spectrum as well as below
400°C. Complete reduction of Co30 4 would result in a hydrogen to cobalt molar ratio of 1.33,
while complete reduction of divalent cobalt (CoO) would result in a hydrogen to cobalt molar
ratio of 1. Ratios obtained between 1 and 1.33 result from cobalt supported in a combination
of Co304 and CoO forms on the support surface. The hydrogen to cobalt molar ratios
obtained during TPR increase in the order Co/ZnO < Co/Si02 < Co/MnO.

Table 3.3.
Chapter 3 - Results 59
TPR hydrogen consumption data for the base case catalysts Co/Si02, Co/ZnO and Co!MnO
Catalyst H2/CoTotai H2/Co<4oo•c (moVmol) (moVmol)
Co/Si02 1.346 0.457
Co/ZnO 1.041 0.607
Co!MnO 3.361 1.968
Figure 3.5 illustrates that the hydrogen consumption as a function of temperature varies
significantly for the three supports. This observation is evidence of the differences in
interaction that take place between the cobalt and the support as well as the influence of the
support reducibility. In the previous section it was shown that bulk cobalt oxide (Co30 4)
underwent two distinct reduction phases during the oxide transition to the zerovalent state as
defined in chapter 3.1.4. The reduction behaviour of the supported cobalt showed significant
variation from the bulk cobalt oxide reduction.
0.25 ......... :::> <( .......... 0.2 c 0
:.:::; c. E 0.15 ::I en c 0 0.1 0 c <1) 0)
0.05 0 '-"0 >-I
0
0 200 400 600 800 1000
Temperature (°C)
Figure 3.5. TPR spectra for base case catalysts Co/Si02, Co/ZnO and Co!MnO. Cobalt nitrate loaded Si02, ZnO and MnO. (mass cat- 0.15g, heating rate = 10°C/min, Reducing gas= 60ml(STP)/min 5% H2 in N2)

Chapter 3 - Results 60
In the case of Co/Si02, four regions were noted during reduction of the catalyst up to 1 000°C.
The first two temperature regions of reduction, with the peak maxima at 270°C and 410°C
respectively result from the reduction of Co304 species to zerovalent metal [Sewell, 1996].
The third and fourth regions are characterised by broad flat reduction peaks. The reduction of
bulk cobalt oxide was seen to be complete by 490 °C, consequently the appearance of
reducible species at higher temperatures may indicate a resistance to reduction imposed
through interaction between cobalt and the Si02 support. The third region may be associated
with the formation of hydrosilicates, while the fourth peak, ranging from 750°C to 930°C, is
probably caused by the reduction of cobalt silicates [Ming and Baker, 1995].
The Co/ZnO catalyst showed two distinct reduction steps, with peak maxima at 280°C and
41 0°C. These two stages of reduction are due to the reduction of supported Co30 4. The peak
maxima are at temperatures lower than observed for the bulk Co30 4 seen in Figure 3.3. This
indicates that interaction between the ZnO surface and the supported cobalt is minimal or that
the interaction may aid reduction of the supported cobalt. Even though the spectrum only
shows reduction up to 650°C, previous TPR runs with ZnO have shown that cobalt reduction
is complete by this temperature as illustrated in Appendix I.
The Co!MnO spectrum seems to combine features from the Co/Si02 and Co/ZnO spectra.
Like the Co/ZnO catalyst, there are two distinct peaks with maxima at 260°C and 400°C, as
well as a broad shoulder above 450°C arising from interaction between cobalt and manganese
oxide. The initial two peaks seem to result from the two-step reduction of Co30 4 to metal
cobalt, however this is unlikely in lieu of the high hydrogen to cobalt ratio observed for the
two reduction region. Two explanations are possible for these two reduction steps. The first is
that the two peaks may be superimposed on a broad flat reduction peak resulting from
support reduction. This would explain the apparently high hydrogen to cobalt molar ratios
observed. The second explanation is that the first peak may result . from divalent cobalt
reduction followed by a second peak attributed to support reduction. Figure 3.4 shows the
reduction profile of MnO treated in HN03. The peak maximum of the MnO reduction peak
occurred at a temperature of 500°C. As Figure 3.5 does not contain the same peak, it is clear
that the presence of cobalt has altered the support reducibility. The cobalt may enhance the
dissociation of hydrogen on the catalyst surface. In this way, support reduction would take
Chapter 3 -Results 61
place at a lower temperature through promotion of hydrogen dissociation that can migrate to
the oxidised MnO sites.
The broad higher temperature peak may result from interaction between cobalt and support.
The hydrogen consumption peaks were significantly larger for Co!MnO than for Co/Si02 or
Co/ZnO. This increase in hydrogen consumption resulted from reduction of the MnO support
material that had been oxidised during the impregnation or calcination stage. This support
reduction seems to take place at the same time as the reduction of the cobalt oxide, as there is
no specific peak that can be attributed to the support reduction alone. This observation may
intimate that the cobalt combines easily with the MnO support integrating into the MnO
framework during either the impregnation, drying or calcination phase. It is most likely that
this incorporation results during the decomposition of the nitrate precursor. The high
exothermicity of this decomposition may enhance the cobalt mobility as well as loosening the
MnO structure for cobalt incorporation. As the hydrogen consumption was so high, it may be
that the entire surface of the MnO alters oxidation state, leading to variations in interaction
between cobalt and support.
The TPR results obtained for the three supports can be explained in terms of zeta potential at
the impregnation pH of each support.
The Co/Si02 catalyst showed the largest temperature range of reduction during TPR. The zeta
potential measured for Si02 in Figure 3.1 shows that there is a pH range (pH- 2-5) where the
zeta potential is approximately zero. At pH's greater than 5, the zeta potential becomes
strongly negative. This indicates that the net charge on the surface of the Si02 has moved
from neutral to strongly negative. At this stage the ratio of positive to negative surface
species has decreased. The more abundant negative charge on the surface results in a strong
electronic attraction of the Co2+ ions in solution. The electronic attraction initiates bonding of
the cobalt ions at the Si02 surface enhancing the probability of the formation of cobalt
silicates which may appear as high temperature peaks (>550°C) during TPR. Table 3.3 shows
that the overall hydrogen to cobalt ratio during TPR for Co/Si02 was 1.346, indicating that on
silica Co3+ and Co2
+ are in equivalent ratios, as present in the Co30 4 form. Cobalt was loaded

Chapter 3 -Results 62
in Co2+ form, consequently oxidation of the cobalt took place during calcination Below
400°C, 34% of the total hydrogen consumption had already taken place.
The Co/ZnO base catalyst had a final impregnation pH of 5.9. At this pH, Figure 3.1 shows
that the ZnO surface still has a net positively charged surface. The implications of this are
that the Co2+ ion sees an electronic repulsion from the ZnO surface resulting in weak
interaction between the cobalt and the support. ZnO readily dissolves in strong acidic
mediums, even in pH's as high as 5-6. Consequently the strong acidity of the nitrate
precursor is thought to partially dissolve the ZnO support at the initial impregnation pH of
4.9. As equilibration takes place over two days, the pH rises from 4.9 to 5.9 (Table 3.1). As
the pH rises, the ZnO may precipitate out of solution covering cobalt that had already
attached to the ZnO and will remain built into the support structure. For this reason the
hydrogen to cobalt molar ratio for the Co/ZnO TPR is 1.041 (Table 3.3) as opposed to the
expected value of 1.33 for complete reduction of Co30 4.
An alternate explanation for this discrepancy may be that cobalt was lost during loading and
drying where some of the support was not recoverable due to attachment to the boiling flask.
This could lead to irregularities in cobalt concentration on the recoverable catalyst and give
an inaccurate cobalt loading. Below 400°C, 58% of the hydrogen consumption had already
taken place indicating a higher ease of reducibility than the Si02 supported cobalt. The
absence of high temperature reduction regions illustrates that zinc oxide does not show a
propensity to form stable spinel type structures (A23+B2+04) as observed with the Si02
support. Zinc oxide cannot form spinel structures unless cobalt was in trivalent form, as zinc
will not shift to the trivalent form. A possible reason for this could be the fact that the zinc
oxide had a significantly more structured crystal framework than the largely amorphous Si02 .
The less ordered nature of Si02 results in a surface that is significantly more defective. It is
these defects that provide numerous functional groups that are possible attachment sites for
cobalt. The ZnO surface is less defective providing fewer attachment points. The net result is
that zinc oxide repels any interaction with the cobalt that might upset the regimented
structure. Thus when cobalt is loaded, the calcination step will result in complete oxidation of
divalent cobalt to Co30 4. This is confirmed by the presence of two peaks during reduction in
Figure 3.5, as well as the absence of any reduction associated with cobalt support species.
Consequently it is surprising to observe a hydrogen to cobalt molar ratio suggesting the
presence of all cobalt in divalent form.
Chapter 3 -Results 63
For the Co/MnO catalyst, the initial impregnation pH measured was 4.8. The pH increased to
a value of 6.2 over two days of equilibration (Table 3.1 ). The zeta potential measurements
indicated a point of zero charge at a pH of 4 for the MnO support. Above a pH of 4, the MnO
surface carried a net negative charge (Figure 3.1 ). Thus the impregnation of cobalt onto MnO
took place with MnO showing a net negative charge to the Co2+ ions in the impregnation
solution. This does not imply that no positively charged groups exist, but that the ratio of
negative to positive charge groups has increased. The result is an electronic attraction
between the positively charged cobalt ions and the surface, creating a metal support
interaction that decreases the ease of reducibility of the cobalt oxide on the MnO surface
during TPR. This is indeed the case. Figure 3.5 illustrates a broad reduction peak between
450°C and 750°C indicating this interaction. For the MnO catalyst, the hydrogen to cobalt
molar ratio is considerably higher than the theoretical value of 1.33 expected for Co30 4. The
high hydrogen to cobalt molar ratio of 3.361 observed can be attributable to the ease with
which the MnO support can shift between different oxidation states. This shift is probably
induced during either impregnation or calcination as a result of the strong oxidising
capabilities of NOx gas released during the nitrate precursor decomposition. This oxidation
would then be reversed during the temperature programmed reduction run, as the support
shifts back to MnO, which represents the lowest oxidation state of Mn. This could account
for the hydrogen to cobalt ratio well above the expected ratio of 1.33 associated with Co30 4
reduction. Below 400°C, 59% of the total hydrogen consumption had taken place.
3.2.1.1.1 Extent of Supported Cobalt Reduction
Figure 3.6 illustrates two TPR spectra for each base case catalyst. The first spectrum entitled
'calcined' corresponds to the pretreatment of the catalyst precursor which was applied. This
pretreatment consisted of a calcination step of 1 hour in N2 at 400°C to decompose the
precursor.
The second spectrum entitled 'reduced' illustrates the TPR profile following activation of the
catalyst by reduction in a 5% H2 in N2 gas mixture. The reduction pretreatment was the same
applied to the catalyst as an activation procedure prior to loading into the reactor for Fischer
Tropsch synthesis. By comparison of the two spectra, information on the extent of
reducibility of cobalt supported on Si02 (A), ZnO (B) and MnO (C) was obtained.
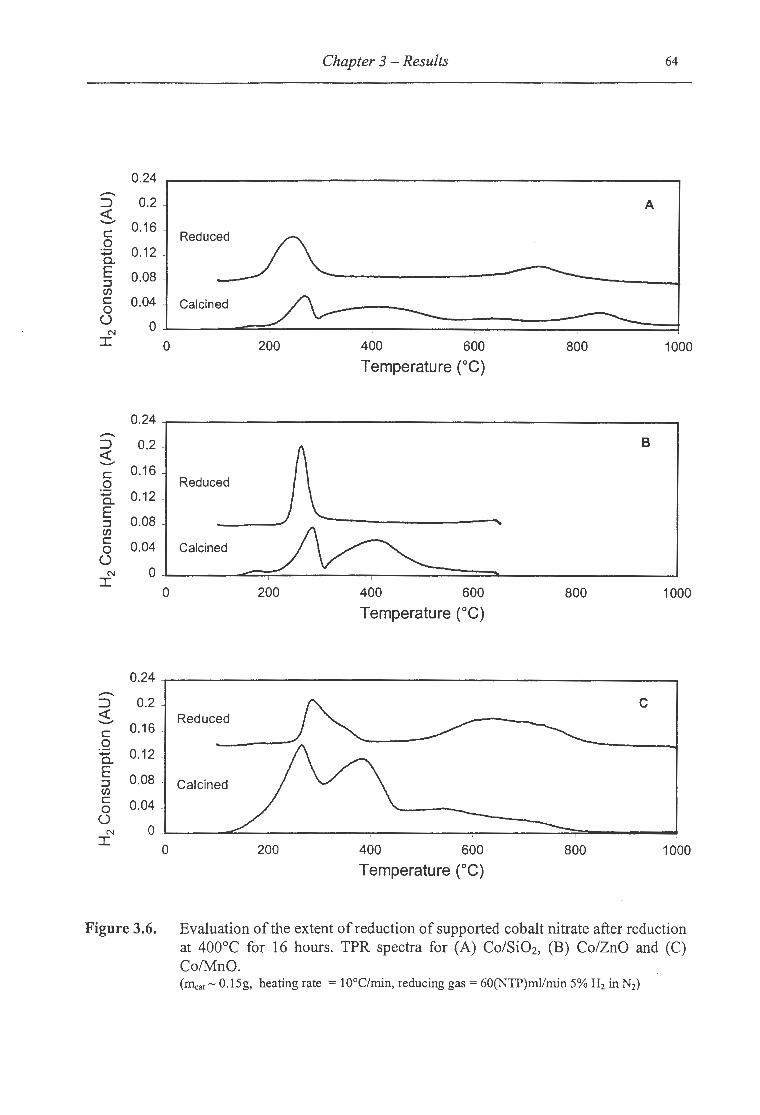
Chapter 3 - Results 64
0.24 ........... :::::> 0.2 A <l:: .........
0.16 c: Reduced 0 ~ 0.12 a. E 0.08 :J rJ)
c: 0.04 Calcined 0 -() 0 N
I 0 200 400 600 800 1000
Temperature (°C)
0.24 ...........
B :::::> 0.2
A <l:: .........
0.16 c: 0 Reduced ~ 0.12 a. E
0.08 :J ' rJ) c: 0.04 Calcined 0 ()
N 0 I
0 200 400 600 800 1000
Temperature (oC)
0.24 ........... :::::> 0.2 c <l:: Reduced .........
0.16 c: 0 ~ 0.12 a. E 0.08 -:J Calcined rJ) c: 0.04 -0 ()
N 0 ' I
0 200 400 600 800 1000
Temperature CC)
Figure 3.6. Evaluation of the extent of reduction of supported cobalt nitrate after reduction at 400°C for 16 hours. TPR spectra for (A) Co/Si02, (B) Co/ZnO and (C) Co/MnO. (fficat- 0.15g, heating rate = l0°C/min, reducing gas= 60(NTP)ml/min 5% H2 in N2)

Chapter 3 - Results 65
The extent of reducibility is defined as the fraction of the total cobalt present on the surface
that is in the active zerovalent form, and was calculated using the 'reduced' spectrum for each
catalyst. The assumption was made that all cobalt reduced above 400°C in the 'reduced'
spectrum would be in divalent form. This assumption is very reasonable as Co30 4 reduction
to CoO was seen to take place below 400°C for all catalysts where Co30 4 was present. The
hydrogen to cobalt ratio associated with divalent cobalt reduction is 1. Consequently the
extent of reduction was obtained by calculating the hydrogen to cobalt molar ratio above
400°C and subtracting this value from 1. The calculated extent of reductions for Co/Si02,
Co/ZnO and Co/MnO can be seen in Table 3.4.
Table 3.4.
Support
Si02
ZnO
MnO
TPR hydrogen consumption data for evaluation of the extent of reduction of supported cobalt for Co/Si02, Co/ZnO and Co/MnO.
H2:Co H2:Co Extent of Pretreatment
Total <400°C Reduction(%)
Calcination 1.346 0.457 80.3
Reduction 0.607 0.410
Calcination 1.040 0.607 91.4
Reduction 0.398 0.312
Calcination 3.361 1.968 28.7
Reduction 1.130 0.417
Reduction at 400°C for 16 hours significantly altered the reduction profile of the Si02
supported catalyst as compared to the calcined catalyst. The reduced sample underwent two
reduction steps. The first step had a maximum at 230°C and resulted from surface reoxidation
of zerovalent cobalt. The second reduction peak had a maximum at 730°C and was associated
with cobalt silicate reduction. Consequently the cobalt present as cobalt silicate was not in the
active form resulting in less than complete use of the supported cobalt. As a result, a
significant fraction of the cobalt is unavailable for Fischer-Tropsch synthesis. The extent of
reduction for the Co/Si02 catalyst was calculated to be 80.3%.
The ZnO supported cobalt catalyst showed a single peak in the 'reduced' TPR spectrum with
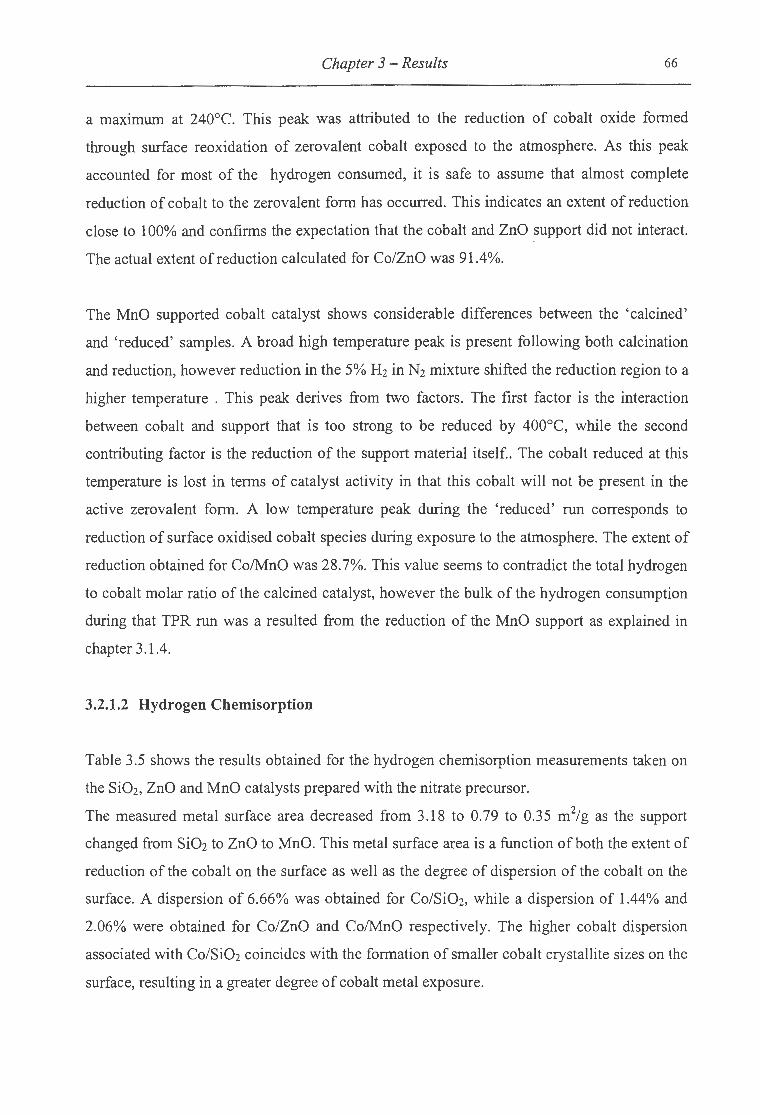
Chapter 3 - Results 66
a maximum at 240°C. This peak was attributed to the reduction of cobalt oxide formed
through surface reoxidation of zerovalent cobalt exposed to the atmosphere. As this peak
accounted for most of the hydrogen consumed, it is safe to assume that almost complete
reduction of cobalt to the zerovalent form has occurred. This indicates an extent of reduction
close to 100% and confirms the expectation that the cobalt and ZnO support did not interact.
The actual extent of reduction calculated for Co/ZnO was 91.4%.
The MnO supported cobalt catalyst shows considerable differences between the 'calcined'
and 'reduced' samples. A broad high temperature peak is present following both calcination
and reduction, however reduction in the 5% Hz in Nz mixture shifted the reduction region to a
higher temperature . This peak derives from two factors. The first factor is the interaction
between cobalt and support that is too strong to be reduced by 400°C, while the second
contributing factor is the reduction of the support material itself.. The cobalt reduced at this
temperature is lost in terms of catalyst activity in that this cobalt will not be present in the
active zero valent form. A low temperature peak during the 'reduced' run corresponds to
reduction of surface oxidised cobalt species during exposure to the atmosphere. The extent of
reduction obtained for Co/MnO was 28.7%. This value seems to contradict the total hydrogen
to cobalt molar ratio of the calcined catalyst, however the bulk of the hydrogen consumption
during that TPR run was a resulted from the reduction of the MnO support as explained in
chapter 3.1.4.
3.2.1.2 Hydrogen Chemisorption
Table 3.5 shows the results obtained for the hydrogen chemisorption measurements taken on
the Si02, ZnO and MnO catalysts prepared with the nitrate precursor.
The measured metal surface area decreased from 3.18 to 0.79 to 0.35 m2/g as the support
changed from Si02 to ZnO to MnO. This metal surface area is a function of both the extent of
reduction of the cobalt on the surface as well as the degree of dispersion of the cobalt on the
surface. A dispersion of 6.66% was obtained for Co/Si02, while a dispersion of 1.44% and
2.06% were obtained for Co/ZnO and Co/MnO respectively. The higher cobalt dispersion
associated with Co/Si02 coincides with the formation of smaller cobalt crystallite sizes on the
surface, resulting in a greater degree of cobalt metal exposure.
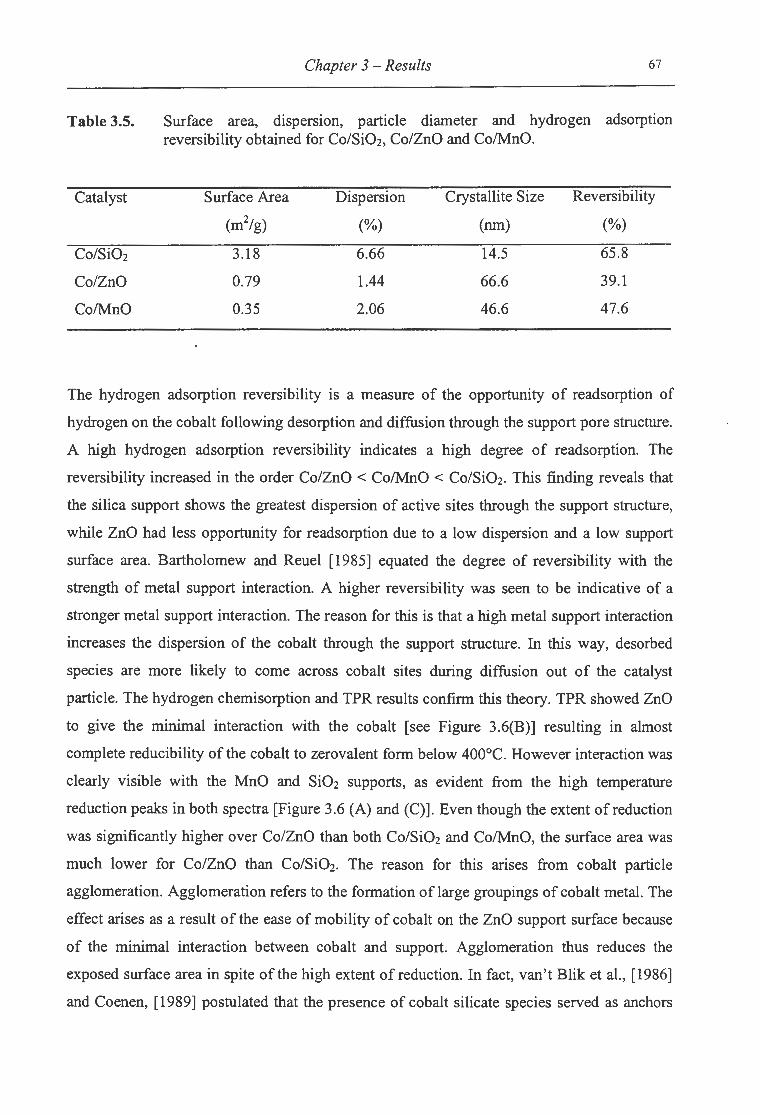
Table 3.5.
Catalyst
Co/Si02
Co/ZnO
Co/MnO
Chapter 3 - Results 67
Surface area, dispersion, particle diameter and hydrogen adsorption reversibility obtained for Co/Si02, Co/ZnO and Co/MnO.
Surface Area Dispersion Crystallite Size Reversibility
(m2/g) (%) (nm) (%)
3.18 6.66 14.5 65.8
0.79 1.44 66.6 39.1
0.35 2.06 46.6 47.6
The hydrogen adsorption reversibility is a measure of the opportunity of readsorption of
hydrogen on the cobalt following desorption and diffusion through the support pore structure.
A high hydrogen adsorption reversibility indicates a high degree of readsorption. The
reversibility increased in the order Co/ZnO < Co/MnO < Co/Si02. This finding reveals that
the silica support shows the greatest dispersion of active sites through the support structure,
while ZnO had less opportunity for readsorption due to a low dispersion and a low support
surface area. Bartholomew and Reuel [1985] equated the degree of reversibility with the
strength of metal support interaction. A higher reversibility was seen to be indicative of a
stronger metal support interaction. The reason for this is that a high metal support interaction
increases the dispersion of the cobalt through the support structure. In this way, desorbed
species are more likely to come across cobalt sites during diffusion out of the catalyst
particle. The hydrogen chemisorption and TPR results confirm this theory. TPR showed ZnO
to give the minimal interaction with the cobalt [see Figure 3.6(B)] resulting in almost
complete reducibility of the cobalt to zerovalent form below 400°C. However interaction was
clearly visible with the MnO and Si02 supports, as evident from the high temperature
reduction peaks in both spectra [Figure 3.6 (A) and (C)]. Even though the extent of reduction
was significantly higher over Co/ZnO than both Co/Si02 and Co/MnO, the surface area was
much lower for Co/ZnO than Co/Si02. The reason for this arises from cobalt particle
agglomeration. Agglomeration refers to the formation of large groupings of cobalt metal. The
effect arises as a result of the ease of mobility of cobalt on the ZnO support surface because
of the minimal interaction between cobalt and support. Agglomeration thus reduces the
exposed surface area in spite of the high extent of reduction. In fact, van't Blik et al., [1986]
and Coenen, [1989] postulated that the presence of cobalt silicate species served as anchors

Chapter 3 - Results 68
for the reduced metal clusters during activation by reduction. As no such species exist on
ZnO, agglomeration becomes exaggerated. Cobalt crystallite sizes over the three supports
increase from 14.5 nm to 46.6 nm to 66.6 nm as the support changed from Si02 to MnO to
ZnO confirming that metal support interaction decreased in the same order.
3.2.1.3 Transmission Electron Microscopy
TEM photographs for Co/SiOz, Co/ZnO and Co/MnO are illustrated in Figure 3.7. The
Co/Si02 photograph (Figure 3.7 (A)) shows black spots, which represent the reduced cobalt
crystallites, supported on the amorphous Si02 support. The amorphous nature of the Si02
support is revealed by the regular speckled nature of the material. No evidence of a distinct
crystal structure can be seen. The cobalt clusters vary in size from 7 nm to 40 nm and are well
dispersed through the support structure. This dispersion would be aided by the high
interaction between support and cobalt, as well as by the large surface area of 300 m2/g
provided by the Si02 support.
A B c
.....
Figure 3.7. TEM photographs for (A) Co/SiOz, (B) Co/ZnO and (C) Co/MnO

Chapter 3 - Results 69
The Co/ZnO catalyst shows two distinct phases present in Figure 3.7 (B). The first phase
consists of large rectangular ZnO crystals, while the second phase comprises the reduced
cobalt as illustrated by the black phase. The large amount of reduced cobalt present results
from the high extent of reducibility of cobalt obtained over the ZnO support. The ZnO
support had a very low surface area of 3.1 m2/g. Consequently the cobalt dispersion would
have been lowered with most of the cobalt resting on the support surface. As interaction
between cobalt and the ZnO support was minimal, cobalt may have become detached from
the support surface resulting in the small black spots scattered around in Figure 3.7 (B).
The TEM photograph of Co/MnO is illustrated in Figure 3.7 (C). The photograph did not
show clear distinction between reduced cobalt and support phases. This could be a result of
their physical similarities such as electron density as they are situated near each other on the
periodic table. The photograph illustrates that MnO shows a higher degree of crystallinity
than Si02. Crystals of MnO are evident as square crystals. The darker spots may be the
reduced cobalt. The amount of cobalt seems to be higher on MnO than on Si02 because more
black spots are visible. These additional black areas may not be due to the presence of cobalt,
but may in fact be a result of a different oxidation state of manganese oxide. It was shown in
chapter 3.1.4 that presence of the nitrate resulted in oxidation of the MnO support. This
manganese oxide phase may still be present following reduction at 400°C. An alternate
explanation for the additional black areas may be is a result of the low surface area of the
MnO support, which results in more cobalt per volume of MnO, however the low extent of
reduction associated with the Co/MnO catalyst makes this unlikely.
3.2.1.4 Fischer Tropsch Synthesis
The base case catalysts were tested under Fischer Tropsch conditions in order to obtain
activity and selectivity data necessary for performance characterisation.
The activity was measured in terms of the hydrocarbon yields obtained from the gas
chromatograph analysis of the organic products, as conversion measurements were unreliable
due to the low conversions obtained. The organic yield was calculated according to the
procedure laid out in Appendix III. Table 3.6 shows that the activity, in terms of yield,
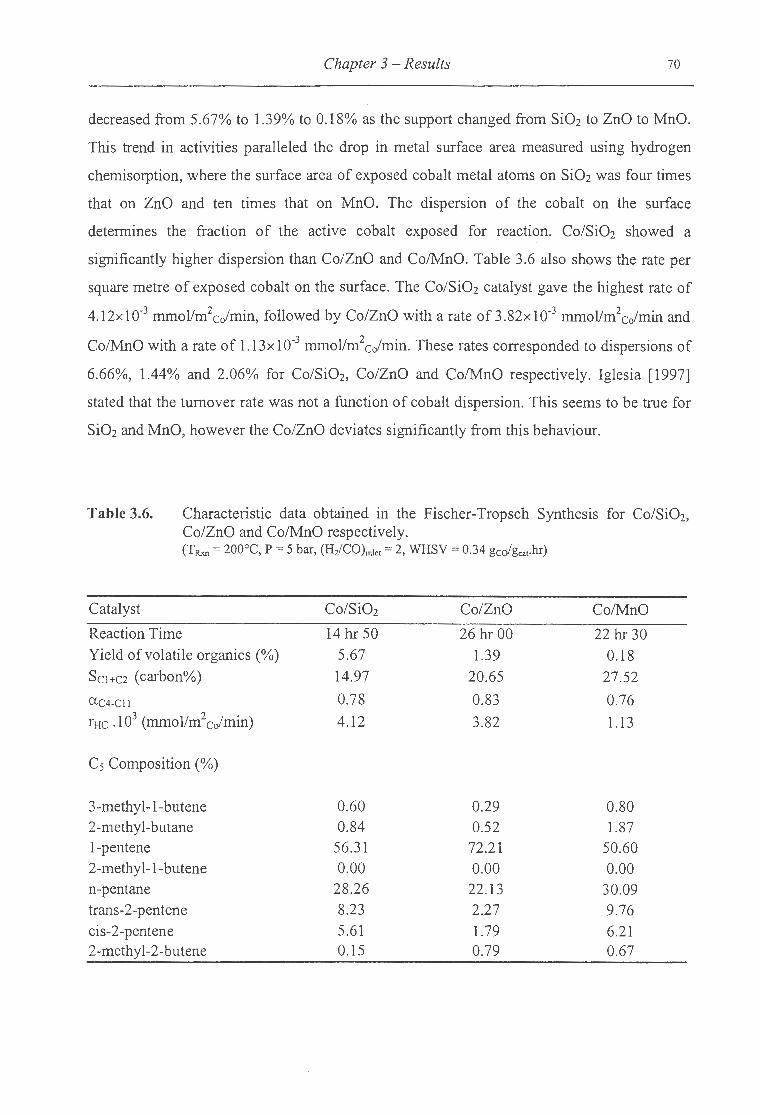
Chapter 3 -Results 70
decreased from 5.67% to 1.39% to 0.18% as the support changed from Si02 to ZnO to MnO.
This trend in activities paralleled the drop in metal surface area measured using hydrogen
chemisorption, where the surface area of exposed cobalt metal atoms on Si02 was four times
that on ZnO and ten times that on MnO. The dispersion of the cobalt on the surface
determines the fraction of the active cobalt exposed for reaction. Co/Si02 showed a
significantly higher dispersion than Co/ZnO and Co/MnO. Table 3.6 also shows the rate per
square metre of exposed cobalt on the surface. The Co/Si02 catalyst gave the highest rate of
4.12x10⁻³ mmollm2colmin, followed by Co/ZnO with a rate of 3.82x10⁻³ mmol/m2colmin and
Co/MnO with a rate of 1.13x10⁻³ mmollm2colmin. These rates corresponded to dispersions of
6.66%, 1.44% and 2.06% for Co/Si02, Co/ZnO and Co/MnO respectively. Iglesia [1997]
stated that the turnover rate was not a function of cobalt dispersion. This seems to be true for
Si02 and MnO, however the Co/ZnO deviates significantly from this behaviour.
Table 3.6. Characteristic data obtained in the Fischer-Tropsch Synthesis for Co/Si02, Co/ZnO and Co/MnO respectively. (T Rxn = 200°C, P = 5 bar, (Hz/CO)inlet = 2, WHSV = 0.34 ge<hca1.hr)
Catalyst Co/Si02 Co/ZnO Co/MnO
Reaction Time 14 hr 50 26 hr 00 22 hr 30 Yield of volatile organics(%) 5.67 1.39 0.18 Scl+C2 (carbon%) 14.97 20.65 27.52
CXc4-Cll 0.78 0.83 0.76
rHc .1 03 (mmollm2 colmin) 4.12 3.82 1.13
Cs Composition(%)
3-methyl-1-butene 0.60 0.29 0.80 2-methyl-butane 0.84 0.52 1.87 1-pentene 56.31 72.21 50.60 2-methyl-1-butene 0.00 0.00 0.00 n-pentane 28.26 22.13 30.09 trans-2-pentene 8.23 2.27 9.76 cis-2-pentene 5.61 1.79 6.21 2-methyl-2-butene 0.15 0.79 0.67

Chapter 3 - Results 71
The selectivity to the C1+2 fraction, on a carbon% basis, increased from 14.97% to 20.65% to
27.52% as the support changed from Si02 to ZnO to MnO. This trend is probability
associated with the availability of surrounding exposed cobalt metal sites that can enhance
the probability of CHx incorporation to form a growing chain. The presence of fewer active
sites results in heightened termination as methane. This characteristic is observed here as the
methane yield decreases from Si02 to ZnO to MnO.
Table 3.6 also gives information on the distribution of products within the Cs fraction. The
three major products formed on all three catalysts were a-olefins which are the primary
products of the Fischer-Tropsch synthesis, and n-paraffins and ~-olefms with small yields of
branched olefins and paraffins, all of which are secondary products. The Co/ZnO catalyst
gave the highest a-olefin content of 72.21% as compared to 56.31% for Co/SiOz and 50.60%
for Co/MnO. As the formation of a-olefins is the primary reaction of the Fischer-Tropsch
synthesis, the Co/ZnO catalyst suppresses the secondary hydrogenation reaction that would
result in the n-paraffin, as well as the secondary isomerisation of the growing chain that leads
to termination as a ~-olefin. The Co/MnO catalyst showed the highest ~-olefin selectivity of
16% of the organic yield as compared to 14% for Co/Si02 and 4% for the Co/ZnO catalyst.
Secondary hydrogenation to the n-paraffin was greatest over the Co/MnO catalyst yielding an
n-pentane selectivity of 30% compared to 28% for Co/Si02 and only 22% for Co/ZnO.
consequently the different supports result in major changes in the product selectivity as well
as catalyst activity. The activity was explainable in terms of exposed metal surface area as
determined by the extent of reduction of the cobalt on each support. However, because the
product spectrum is significantly altered, the physical characteristics of the support must play
a role in the Fischer-Tropsch synthesis.
The chain growth probabilities for the three catalysts are given in Table 3.6. These values
were calculated form the slope of the Anderson-Schulz-Flory distribution plots. The ASF
plots are illustrated in Figure 3.8 for Co/Si02, Co/ZnO and Co/MnO. The probability, a, was
calculated over the C4 to C11 range, as the ASF plots generally deviated from straight line
behaviour for higher carbon numbers. An increase in slope occurs at carbon number 15 for
Co/Si02 and at carbon number 12 for Co/ZnO. These increases were attributed to bleeding of
products from the wax trap. All the ASF plots give good straight line behaviour between C4
and C 11 . The C1 point in all three ASF plots is an exaggerated value, as the C1 and C2
fractions were combined due to difficulties with separation using the gas chromatograph.
. '-'•· ..

Chapter 3 -Results 72
However the contribution of the C2 fraction was minimal in relative terms for all runs
performed. The C3 fraction of the Co/MnO ASF plot was lower than the C4 point. This was
unexpected behaviour that was attributed to an error in the gas chromatograph settings.
The Co/ZnO catalyst gave the highest chain growth probability of 0.83. The chain growth
probability for Co/Si02 and Co/MnO were found to be 0.78 and 0.76 respectively. The
slightly higher chain growth probability observed over Co/ZnO may be attributable to the
larger cobalt crystallites observed on the ZnO support from hydrogen chemisorption. The
formation of these large cobalt crystallites stems from the weak interaction between cobalt
and the ZnO support, and leads to the agglomeration of cobalt on the surface of the support.
This agglomeration accounts for extensive reduction in the exposed metal surface area,
however it may provide a benefit in that large clusters result in the continual presence of
reactant in the vicinity of the growing chain. This could enhance growth by having adsorbed
species continually available for incorporation into the growing chain.
2
-+-Co/Si02 1.5
-co/ZnO
1 ---+-Co/MnO
..-"(:) ·c: Cll ~ 0.5 0
X ..._, 0) 0 -0 _J
-0.5
-1 0 2 4 6 8 10 12 14 16
Carbon Number (Nc)
Figure 3.8. Anderson-Schulz-Flory distributions for the base case catalysts Co/Si02,
Co/ZnO and Co/MnO. Cobalt nitrate loaded on Si02, ZnO and MnO. (~1 - lg, T = 200°C, P = 5 bar, H2 : CO = 2 : 1, WHSV = 0.34gcofgcat·hr )

Chapter 3 - Results 73
Figure 3.9 gives the rate of formation of the total organic products. The rate was calculated
according to the procedure illustrated in Appendix III. The rates are measured per gram of
catalyst, consequently they are comparable. The rate of formation is a measure of the activity
of the catalyst. Thus the rate parallels the yield measurements from Table 3.6 for the three
supported catalysts and decreasing from Co/Si02 to Co/ZnO to Co!MnO. Figure 3.9
illustrates the rate of formation as a function of carbon number. As the carbon number
increases for each catalyst, the rate of formation decreases. The Fischer-Tropsch reaction
follows a chain growth mechanism. A fraction of the growing alkyl chain at each carbon
number terminates, decreasing the rate at which products with higher carbon numbers form.
The surface area of exposed cobalt on the surface determines the availability of active sites
on the support surface. Consequently, as the exposed cobalt surface area was highest on the
Si02 support, it follows that the rate of formation of organic product should be significantly
higher as well.
2500 .......... ~ -+-Co/Si02
0) 2000 -c -Co/ZnO E - 1500 - __._co/MnO 0 E E 1000 ..........
(0
0 ~
u 500 ·c: ro e>
.._o 0
0 2 4 6 8 10 12 14 16 Carbon Number (Nc)
Figure 3.9. Total organic formation rates for the base case catalysts Co/Si02, Co/ZnO and Co/MnO. Cobalt nitrate loaded on Si02, ZnO and MnO. (ll1car- lg, T = 200°C, P = 5 bar, H2 : CO= 2: 1, WHSV = 0.34gcofgcar·hr)
The olefinicity of the linear organic product is shown in Figure 3.10 for each of the base
catalysts. In Table 3.6 the C5 product breakdown was given for each catalyst. The Co/ZnO
catalyst gave a linear olefin selectivity of 76%, compared to 70% for Co/Si02 and 67% for
Co/MnO. Figure 3.10 indicates that the higher linear olefinicity of the Co/ZnO catalyst
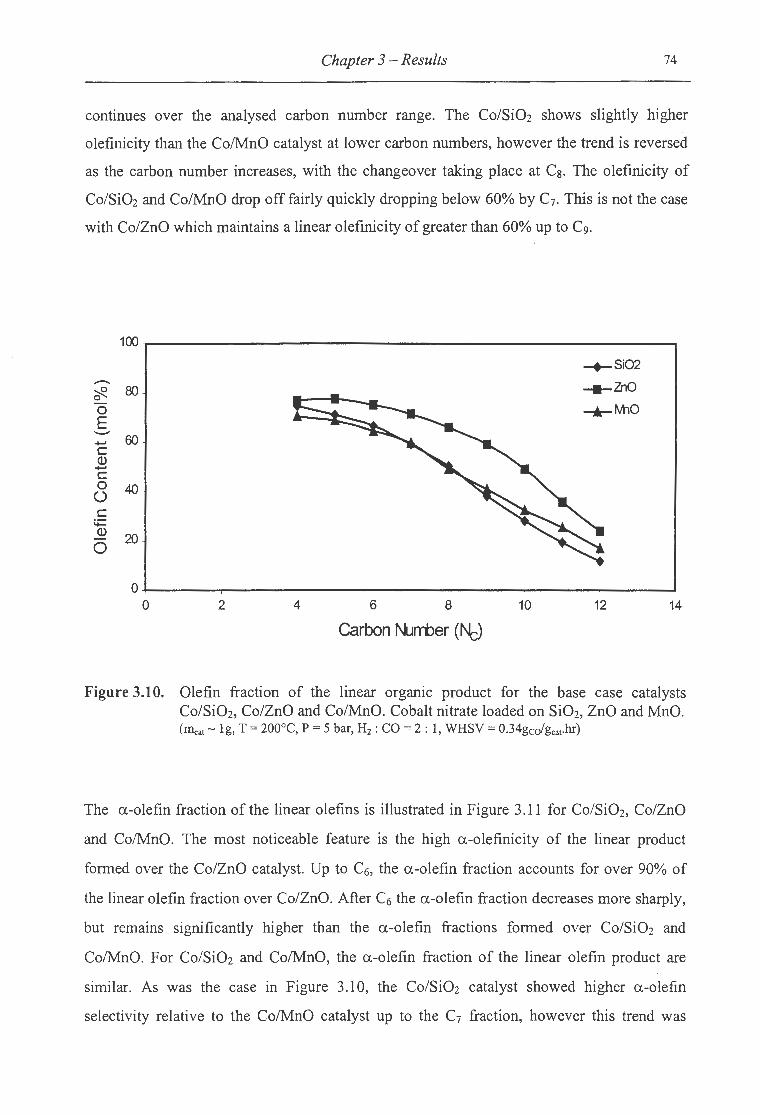
Chapter 3 -Results 74
continues over the analysed carbon number range. The Co/SiOz shows slightly higher
olefinicity than the Co/MnO catalyst at lower carbon numbers, however the trend is reversed
as the carbon number increases, with the changeover taking place at Cs. The olefinicity of
Co/Si02 and Co/MnO drop off fairly quickly dropping below 60% by C7. This is not the case
with Co/ZnO which maintains a linear olefinicity of greater than 60% up to C9.
100
-+-Si02 - -ZnO ~ 80 0
0 -+-M10 E -....... 60 c Q.) ....... c 0 40 ()
c t+= Q.)
20 0
0 0 2 4 6 8 10 12 14
Carbon f\llrrber (Nc)
Figure 3.1 0. Olefin fraction of the linear organic product for the base case catalysts Co/Si02, Co/ZnO and Co/MnO. Cobalt nitrate loaded on Si02, ZnO and MnO. (Il1cat - lg, T = 200°C, P = 5 bar, H2: CO = 2 : 1, WHSV = 0.34gcdgcat·hr)
The a-olefin fraction of the linear olefins is illustrated in Figure 3.11 for Co/Si02, Co/ZnO
and Co/MnO. The most noticeable feature is the high a-olefinicity of the linear product
formed over the Co/ZnO catalyst. Up to C6, the a-olefin fraction accounts for over 90% of
the linear olefin fraction over Co/ZnO. After C6 the a-olefin fraction decreases more sharply,
but remains significantly higher than the a-olefin fractions formed over Co/Si0 2 and
Co/MnO. For Co/Si02 and Co/MnO, the a-olefin fraction of the linear olefin product are
similar. As was the case in Figure 3.1 0, the Co/Si02 catalyst showed higher a-olefin
selectivity relative to the Co/MnO catalyst up to the C7 fraction, however this trend was

Chapter 3 - Results 75
reversed as the carbon number increased above C7. The high a-olefinicity observed over the
Co/ZnO catalyst may be associated with the hydrogen adsorption reversibility measured
during hydrogen chemisorption. A high adsorption reversibility indicates that the possibility
of readsorption on the catalyst surface may be high due to high dispersion of the active phase
and the resulting presence of numerous attachment sites on the surface. On the ZnO support,
cobalt agglomeration is high and the support surface area is low. These two factors cause the
primary a-olefin product to diffuse away from the catalyst surface with less chance of
readsorption compared to Co/Si02 and Co!MnO. In conjunction with this, hydrogen may be
less competitive for active sites lowering the tendency for termination of the growing chain as
a hydrogenated paraffin. Thus the lower dispersion not only affects the activity but alters the
selectivity by limiting both the secondary isomerisation and hydrogenation of the primary a
olefin.
100
'0' b' -+-Si02 0 80 E -ZnO
..._.. ...... _._Mlo c Q)
60 ...... c 0 u c 40
4= Q)
0 ro 20 .c 0.. <(
0 , 0 2 4 6 8 10 12 14
Carbon Number (Nc)
Figure 3.11. Alpha olefin fraction of the linear olefin product for the base case catalysts Co/Si02, Co/ZnO and Co/MnO. Cobalt nitrate loaded on Si02, ZnO and MnO. (II\:at- lg, T = 200°C, P = 5 bar, H2 : CO= 2: 1, WHSV = 0.34gcofgcat·hr)

Chapter 3 -Results 76
3.2.2 Effect of the Type of Cobalt Precursor
The metal precursor plays a maJor role in determining the physical and performance
characteristics of the catalyst. In terms of physical changes, the greatest change taking place
is the strength with which the cobalt is bound to the support surface. The strength of this
attachment affects the reducibility of the catalyst and ultimately alters the activity of the
catalyst. Si02, ZnO and MnO supported cobalt catalysts were prepared using both a nitrate
and acetate precursor. The reducibility of cobalt was evaluated using TPR, while the
performance of the catalyst, in terms of activity and selectivity, was evaluated under Fischer
Tropsch reaction conditions. Hydrogen chemisorption gave information on exposed cobalt
surface area, cobalt crystallite size and dispersion, and the reversibility of the hydrogen
adsorption.
3.2.2.1 Temperature Programmed Reduction
The TPR spectra obtained for cobalt nitrate and cobalt acetate loaded onto Si02, ZnO and
MnO are shown in Figure 3.12 (A), (B) and (C) respectively. The choice of precursor
significantly alters the TPR reduction profile for all three supports used. The temperature at
which reduction takes place is a measure of the ease of metal reducibility. The effect of the
precursor change from nitrate to acetate is to lower the ease with which the cobalt reduces to
metal form.
For the Si02 support, the spectrum changed dramatically as the precursor was changed from
nitrate to acetate. The TPR run for the Co(A)/Si02 catalyst was characterised by a dominant
reduction peak from 650°C to 860°C as seen in Figure 3.12 (A). This peak accounted for
77% of the hydrogen consumed during the run. The remaining 23% of hydrogen was
consumed in the peak with a maximum at 400°C. This reduction behaviour represents a
major alteration from that observed for the nitrate precursor. In the case of the nitrate
precursor, a fraction of 33% of the total hydrogen reduction took place before 400°C
compared with a fraction of 11% for the acetate precursor. The precursor transforms the
strength of interaction between the cobalt and the Si02 support. The change from nitrate to
acetate precursor greatly enhances the interaction between cobalt and support.
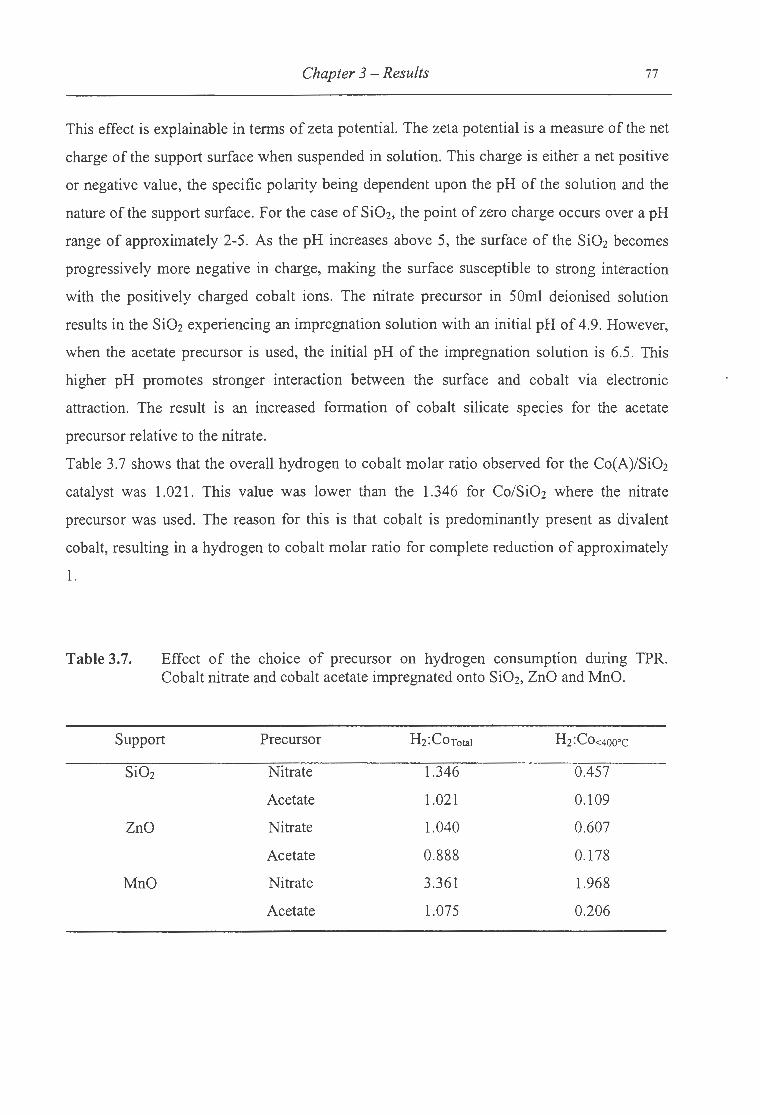
Chapter 3 -Results 77
This effect is explainable in terms of zeta potential. The zeta potential is a measure of the net
charge of the support surface when suspended in solution. This charge is either a net positive
or negative value, the specific polarity being dependent upon the pH of the solution and the
nature of the support surface. For the case of Si02, the point of zero charge occurs over a pH
range of approximately 2-5. As the pH increases above 5, the surface of the Si02 becomes
progressively more negative in charge, making the surface susceptible to strong interaction
with the positively charged cobalt ions. The nitrate precursor in 50ml deionised solution
results in the Si02 experiencing an impregnation solution with an initial pH of 4.9. However,
when the acetate precursor is used, the initial pH of the impregnation solution is 6.5. This
higher pH promotes stronger interaction between the surface and cobalt via electronic
attraction. The result is an increased formation of cobalt silicate species for the acetate
precursor relative to the nitrate.
Table 3.7 shows that the overall hydrogen to cobalt molar ratio observed for the Co(A)/Si02
catalyst was 1.021. This value was lower than the 1.346 for Co/Si02 where the nitrate
precursor was used. The reason for this is that cobalt is predominantly present as divalent
cobalt, resulting in a hydrogen to cobalt molar ratio for complete reduction of approximately
1.
Table 3.7. Effect of the choice of precursor on hydrogen consumption during TPR. Cobalt nitrate and cobalt acetate impregnated onto Si02, ZnO and MnO.
Support Precursor H2:C0Total H2 :Co<4oo•c
Si02 Nitrate 1.346 0.457
Acetate 1.021 0.109
ZnO Nitrate 1.040 0.607
Acetate 0.888 0.178
MnO Nitrate 3.361 1.968
Acetate 1.075 0.206
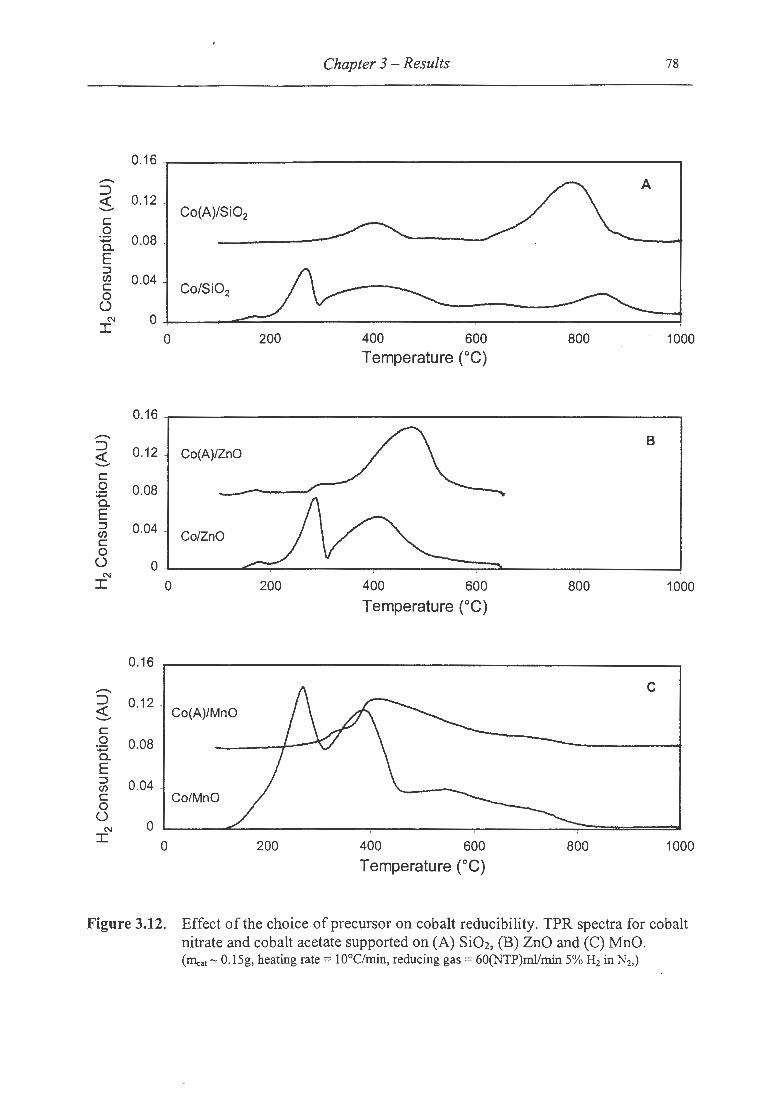
Chapter 3 - Results 78
0.16 .......... A :J <( 0.12 - Co(A)/Si02 c: 0
:.;:::; 0.08 c. E :J (/) 0.04 c: Co/Si02 0 ()
N 0 I
0 200 400 600 800 1000 Temperature CC)
0.16
:J B <( 0.12 Co(A)/ZnO -c: 0 0.08 :.;:::; c. E :J 0.04 (/) Co/ZnO c: 0 () 0
N
I 0 200 400 600 800 1000
Temperature (°C)
0.16
.......... c :J 0.12 <( Co(A)/MnO -c: 0 0.08 -:.;:::; c. E :J 0.04 -(/) c: 0
Co/MnO
0 N 0
I 0 200 400 600 800 1000
Temperature (°C)
Figure 3.12. Effect of the choice of precursor on cobalt reducibility. TPR spectra for cobalt nitrate and cobalt acetate supported on (A) Si02, (B) ZnO and (C) MnO. (Illeat - 0.15g, heating rate = 10°C/min, reducing gas = 60(NTP)ml/min 5% H2 in N2,)

Chapter 3 - Results 79
With the ZnO support, the TPR spectrum was significantly different for the acetate prepared
catalyst (Co(A)/ZnO) as illustrated in Figure 3.12 (B). The TPR spectrum for the acetate
catalyst was characterised by a single broad reduction peak with a maximum at
approximately 460°C. The peak begins at 280°C as a small flat shoulder. The nitrate
spectrum consisted of two distinct reduction peaks attributable to the two-stage reduction of
Co30 4 to zerovalent cobalt as described in chapter 3.1.4. The single peak reduction of the
acetate catalyst indicates that cobalt is probably supported on the ZnO support in divalent
cobalt oxide (CoO) form.
The Co(A)/ZnO catalyst was impregnated at an initial pH of 6.5, and remained at 6.5 for two
days. In terms of zeta potential, the ZnO surface would still experience a net positive surface
charge inhibiting interaction with the cobalt. However the higher pH experienced with the
acetate precursor than with the nitrate precursor, would lower the extent of dissolution of
ZnO consequently no cobalt would migrate into the ZnO structure.
The decomposition of the acetate precursor during calcination does not provide a strong
enough oxidising environment to oxidise divalent cobalt to the trivalent form. Thus no Co30 4
is present on the support surface resulting in the absence of a second peak during hydrogen
consumption. The shape of the divalent cobalt reduction peaks for the acetate and nitrate
peaks have similar shapes, however the acetate peak takes place at a higher temperature. The
reason for this shift arises from slightly increased interaction between cobalt and the ZnO
support, or possibly that the reduction of Co304 initiates the reduction of divalent cobalt at a
lower temperature. This temperature shift resulted in a hydrogen to cobalt molar ratio of
0.151 below 400°C for the acetate catalyst from Table 3. 7. The overall hydrogen to cobalt
molar ratio was calculated to be 0.888, lower than that experienced using the nitrate
precursor. The ratio is also lower than the expected value for complete CoO reduction.
The TPR spectra for the nitrate and acetate precursors on MnO are illustrated in Figure
3.12(C). The TPR spectrum for the Co(A)/MnO catalyst was characterised low and high
temperature reduction shoulder between 350°C and 385°C and 600°C and 800°C
respectively, as well as a single reduction peak with a maximum at 405°C. The peak is
associated with the reduction of divalent cobalt oxide (CoO). Minimal support reduction was
noted using the acetate precursor indicating that the oxidising capability of the decomposing
acetate is too weak to provide a significant shift in oxidation state of the MnO support that
..... •,
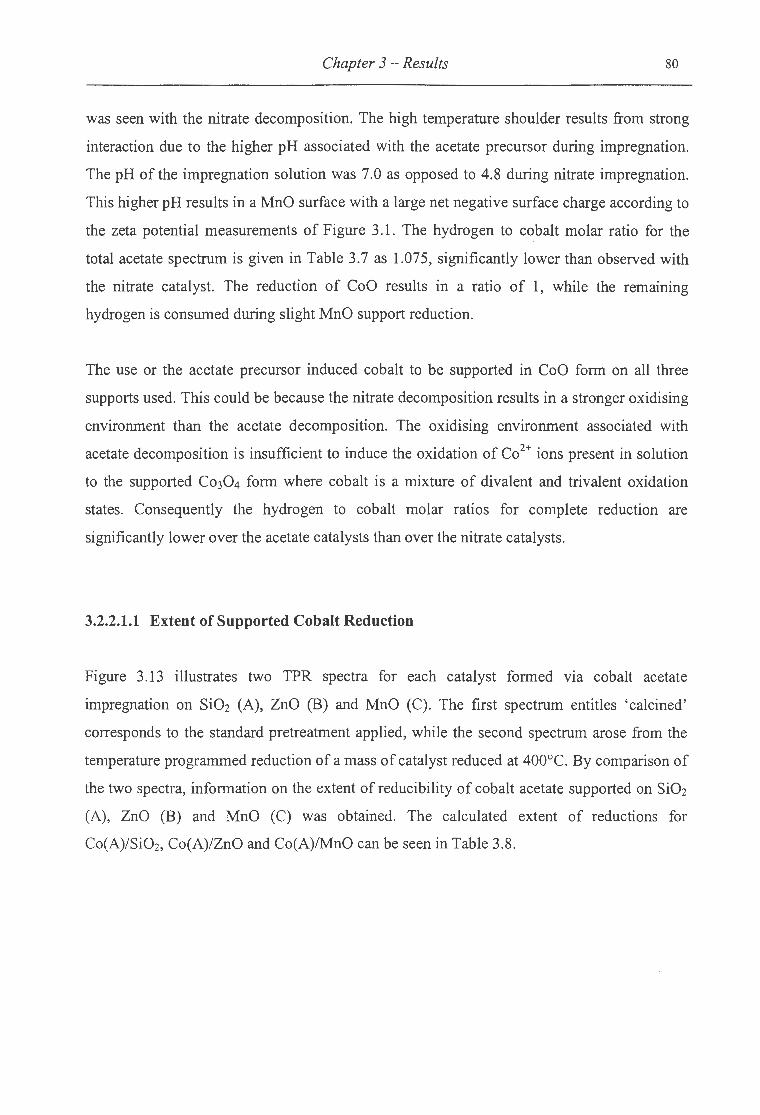
Chapter 3 -Results 80
was seen with the nitrate decomposition. The high temperature shoulder results from. strong
interaction due to the higher pH associated with the acetate precursor during impregnation.
The pH of the impregnation solution was 7.0 as opposed to 4.8 during nitrate impregnation.
This higher pH results in a MnO surface with a large net negative surface charge according to
the zeta potential measurements of Figure 3 .1. The hydrogen to cobalt molar ratio for the
total acetate spectrum is given in Table 3.7 as 1.075, significantly lower than observed with
the nitrate catalyst. The reduction of CoO results in a ratio of 1, while the remaining
hydrogen is consumed during slight MnO support reduction.
The use or the acetate precursor induced cobalt to be supported in CoO form on all three
supports used. This could be because the nitrate decomposition results in a stronger oxidising
environment than the acetate decomposition. The oxidising environment associated with
acetate decomposition is insufficient to induce the oxidation of Co2+ ions present in solution
to the supported Co30 4 form where cobalt is a mixture of divalent and trivalent oxidation
states. Consequently the hydrogen to cobalt molar ratios for complete reduction are
significantly lower over the acetate catalysts than over the nitrate catalysts.
3.2.2.1.1 Extent of Supported Cobalt Reduction
Figure 3.13 illustrates two TPR spectra for each catalyst formed v1a cobalt acetate
impregnation on Si02 (A), ZnO (B) and MnO (C). The first spectrum entitles 'calcined'
corresponds to the standard pretreatment applied, while the second spectrum arose from the
temperature programmed reduction of a mass of catalyst reduced at 400°C. By comparison of
the two spectra, information on the extent of reducibility of cobalt acetate supported on Si02
(A), ZnO (B) and MnO (C) was obtained. The calculated extent of reductions for
Co(A)/Si02, Co(A)/ZnO and Co(A)/MnO can be seen in Table 3.8.
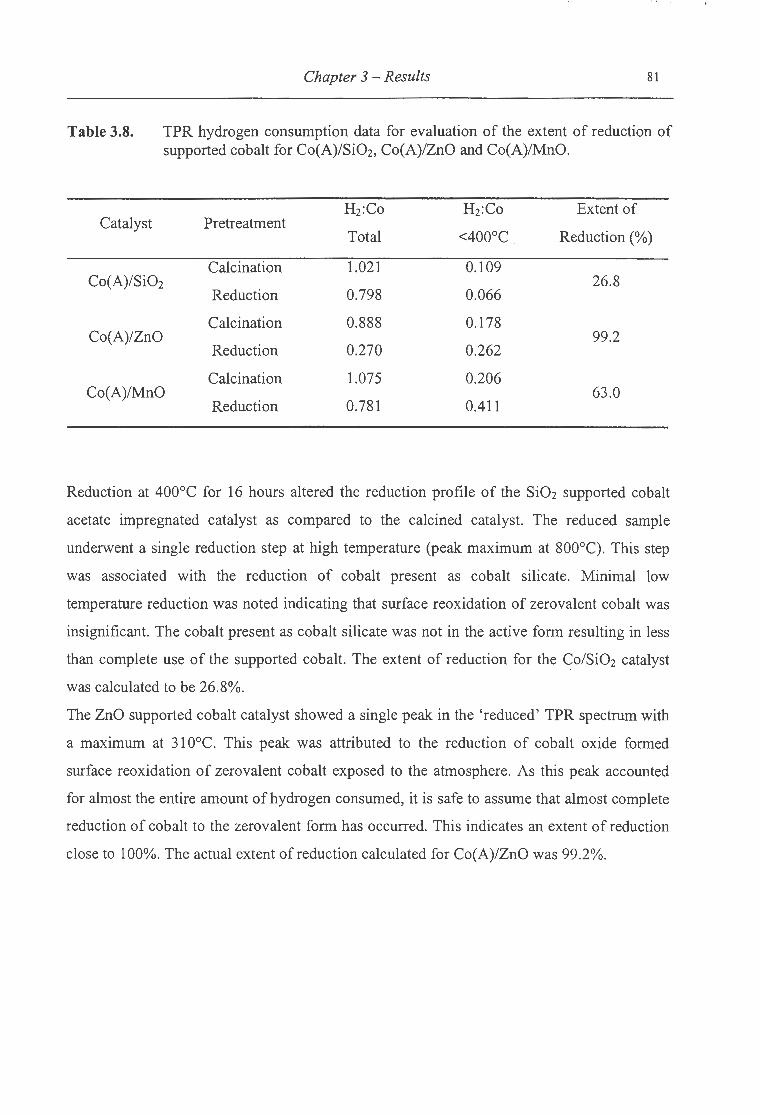
Table 3.8.
Catalyst
Co(A)/Si02
Co(A)/ZnO
Chapter 3 -Results 81
TPR hydrogen consumption data for evaluation of the extent of reduction of supported cobalt for Co(A)/Si02, Co(A)/ZnO and Co(A)!MnO.
H2:Co H2:Co Extent of Pretreatment
Total <400°C Reduction(%)
Calcination 1.021 0.109 26.8
Reduction 0.798 0.066
Calcination 0.888 0.178 99.2
Reduction 0.270 0.262
Calcination 1.075 0.206 Co(A)IMnO 63.0
Reduction 0.781 0.411
Reduction at 400°C for 16 hours altered the reduction profile of the Si02 supported cobalt
acetate impregnated catalyst as compared to the calcined catalyst. The reduced sample
underwent a single reduction step at high temperature (peak maximum at 800°C). This step
was associated with the reduction of cobalt present as cobalt silicate. Minimal low
temperature reduction was noted indicating that surface reoxidation of zerovalent cobalt was
insignificant. The cobalt present as cobalt silicate was not in the active form resulting in less
than complete use of the supported cobalt. The extent of reduction for the ~o/Si02 catalyst
was calculated to be 26.8%.
The ZnO supported cobalt catalyst showed a single peak in the 'reduced' TPR spectrum with
a maximum at 31 0°C. This peak was attributed to the reduction of cobalt oxide formed
surface reoxidation of zerovalent cobalt exposed to the atmosphere. As this peak accounted
for almost the entire amount of hydrogen consumed, it is safe to assume that almost complete
reduction of cobalt to the zerovalent form has occurred. This indicates an extent of reduction
close to 100%. The actual extent of reduction calculated for Co(A)/ZnO was 99.2%.
.... . j,. . ..... .
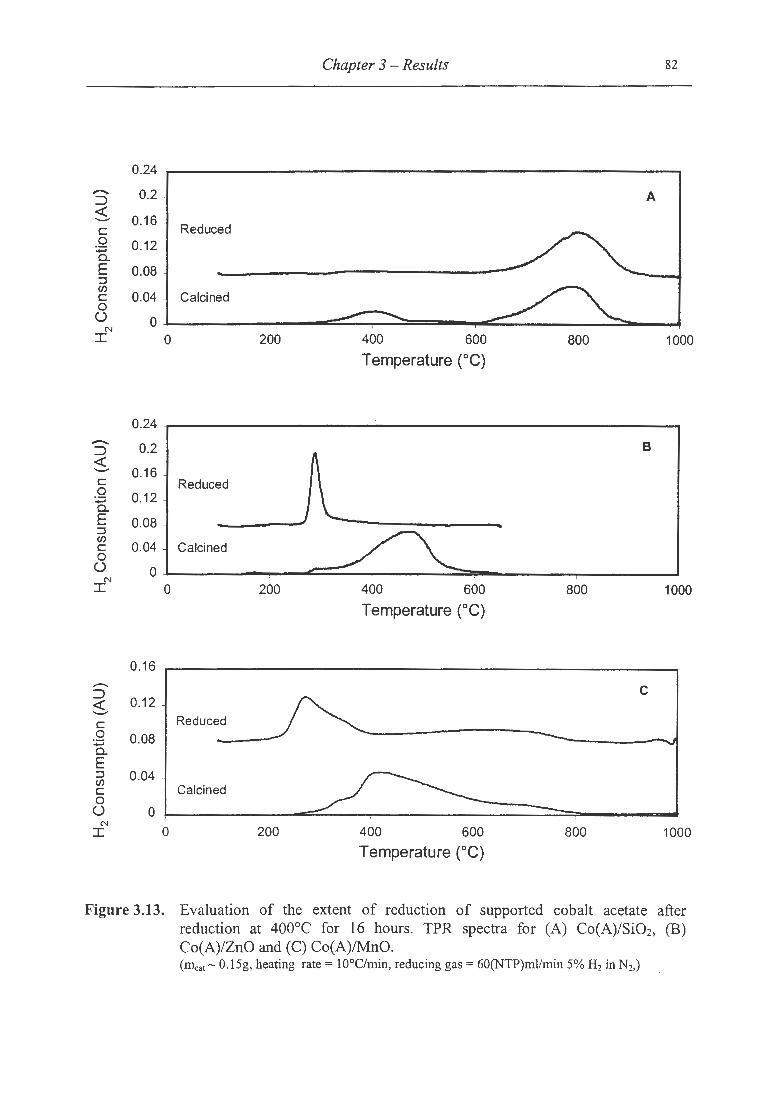
Chapter 3 -Results 82
0.24
A - 0.2 . :::> <!:
0.16 . ..__... c Reduced 0 0.12 :;:; 0.. E 0.08 ::J (/)
c 0.04 - Calcined 0 () 0
N I 0 200 400 600 800 1000
Temperature CC)
0.24
- 0.2 B :::> <!:
A_ ..__... 0.16 c Reduced 0 0.12 :;:; 0.. E 0.08 ::J (/)
0.04 c Calcined 0 () 0
N I 0 200 400 600 800 1000
Temperature (°C)
0.16 --:::> 0.12 -<!:
c ..__... c Reduced 0 0.08 :;:; 0.. E ::J 0.04 -(/) c Calcined 0 () 0
N
I 0 200 400 600 800 1000
Temperature CC)
Figure 3.13. Evaluation of the extent of reduction of supported cobalt acetate after reduction at 400°C for 16 hours. TPR spectra for (A) Co(A)/Si02, (B) Co(A)/ZnO and (C) Co(A)!MnO. (IIlcat- 0.15g, heating rate= 10°C/min, reducing gas= 60(NTP)ml/min 5% H2 in N2,)
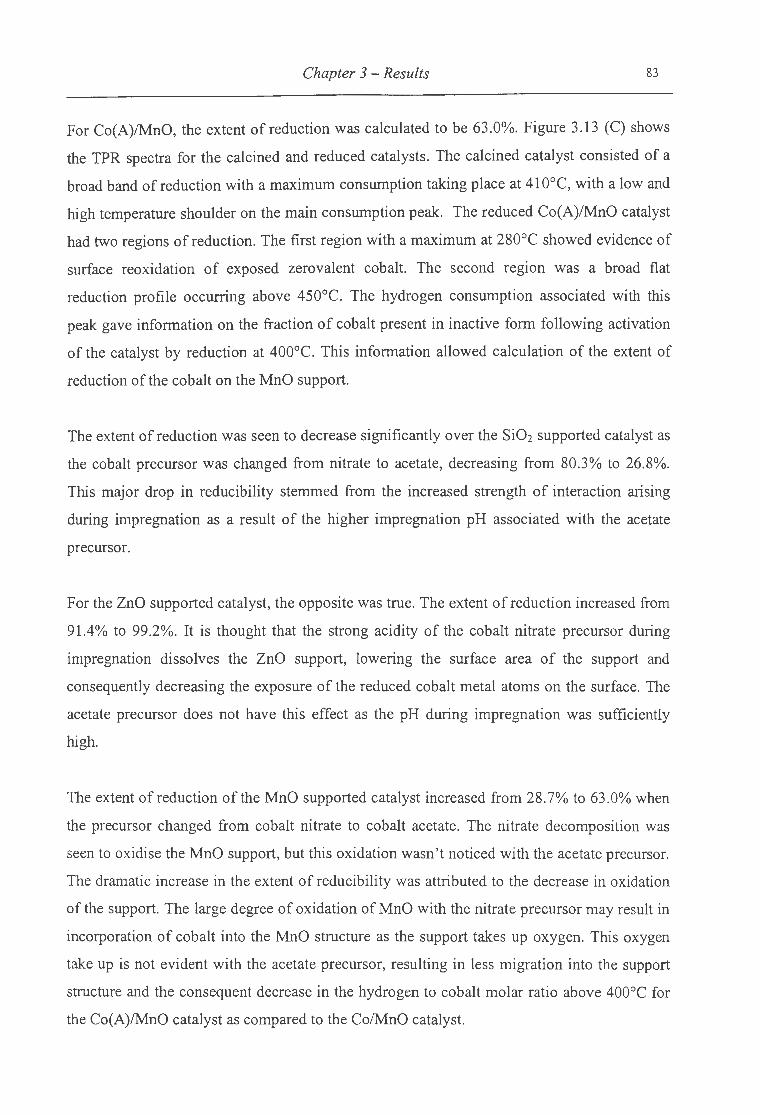
Chapter 3 -Results 83
For Co(A)!MnO, the extent of reduction was calculated to be 63.0%. Figure 3.13 (C) shows
the TPR spectra for the calcined and reduced catalysts. The calcined catalyst consisted of a
broad band of reduction with a maximum consumption taking place at 410°C, with a low and
high temperature shoulder on the main consumption peak. The reduced Co(A)!MnO catalyst
had two regions of reduction. The first region with a maximum at 280°C showed evidence of
surface reoxidation of exposed zerovalent cobalt. The second region was a broad flat
reduction profile occurring above 450°C. The hydrogen consumption associated with this
peak gave information on the fraction of cobalt present in inactive form following activation
of the catalyst by reduction at 400°C. This information allowed calculation of the extent of
reduction of the cobalt on the MnO support.
The extent of reduction was seen to decrease significantly over the Si02 supported catalyst as
the cobalt precursor was changed from nitrate to acetate, decreasing from 80.3% to 26.8%.
This major drop in reducibility stemmed from the increased strength of interaction arising
during impregnation as a result of the higher impregnation pH associated with the acetate
precursor.
For the ZnO supported catalyst, the opposite was true. The extent of reduction increased from
91.4% to 99.2%. It is thought that the strong acidity of the cobalt nitrate precursor during
impregnation dissolves the ZnO support, lowering the surface area of the support and
consequently decreasing the exposure of the reduced cobalt metal atoms on the surface. The
acetate precursor does not have this effect as the pH during impregnation was sufficiently
high.
The extent of reduction of the MnO supported catalyst increased from 28.7% to 63 .0% when
the precursor changed from cobalt nitrate to cobalt acetate. The nitrate decomposition was
seen to oxidise the MnO support, but this oxidation wasn't noticed with the acetate precursor.
The dramatic increase in the extent of reducibility was attributed to the decrease in oxidation
of the support. The large degree of oxidation of MnO with the nitrate precursor may result in
incorporation of cobalt into the MnO structure as the support takes up oxygen. This oxygen
take up is not evident with the acetate precursor, resulting in less migration into the support
structure and the consequent decrease in the hydrogen to cobalt molar ratio above 400°C for
the Co(A)!MnO catalyst as compared to the Co!MnO catalyst.
Chapter 3 - Results 84
3.2.2.2 Hydrogen Chemisorption
The influence of the precursor type on the surface area, dispersion, metal crystallite size and
adsorption reversibility was measured using hydrogen chemisorption. The results are shown
in Table 3.9. The use of the acetate precursor resulted in a lower exposed cobalt surface area
over both the Si02 and ZnO supports. However Co(A)/MnO showed a significantly higher
metal surface area than Co!MnO. The metal surface area is a function of both the extent of
cobalt reduction and the dispersion of the cobalt on the surface. Thus the low surface area of
the Co(A)/Si02 catalyst stems predominantly from the decrease in the extent of cobalt
reduction from 80.3% to 26.8% as the precursor changed from the nitrate to the acetate.
Although the extent of reduction increased slightly from 91.4% for Co/ZnO to 99.2% for
Co(A)/ZnO, the agglomeration of this zerovalent cobalt into large cobalt crystallites caused a
drop in the exposed cobalt surface area. The hydrogen adsorption reversibility improved
dramatically from 39.1% for Co/ZnO to 67.1% for Co(A)/ZnO. Higher adsorption
reversibility is a result of increased metal support interaction. This is confirmed by the TPR
findings where the acetate precursor resulted in an increased interaction between cobalt and
support.
Table 3.9.
Catalyst
Co(A)/Si02
Co(A)/ZnO
Co(A)!MnO
Surface area, dispersion, particle diameter and hydrogen adsorption reversibility for Co(A)/Si02, Co(A)/ZnO and Co(A)!MnO.
Surface Area Dispersion Crystallite Size Reversibility
(m2/g) (%) (nm) (%)
0.12 0.73 132.4 n.d. (t)
0.31 0.53 181.8 67.1
0.90 2.40 40.1 55.8
n.d. not determined
The extent of reduction increased from 28.7% to 63.0% as the precursor changed from nitrate
to acetate. This coincided with an improvement in exposed metal surface area from 0.35 m2/g

Chapter 3 -Results 85
for Co/MnO to 0.90 m2/g for Co(A)/MnO, while the cobalt dispersion increased from 2.06%
to 2.40%. The adsorption reversibility also improved from 47.6% to 55.8% suggesting
stronger interaction between the cobalt and the MnO support which in turn increases the
cobalt dispersion and the chance for readsorption. This was indeed the case, as TPR showed
that cobalt reduction took place at higher temperatures over the acetate prepared catalyst.
3.2.2.3 Transmission Electron Microscopy
Figure 3.14 shows the TEM photographs of Co(A)/Si02, Co(A)/ZnO and Co(A)/MnO. The
Co(A)/Si02 photograph contains no black spots indicating clusters of reduced cobalt. This is
in agreement with chemisorption data which showed minimal cobalt metal surface area.
The Co(A)/ZnO catalyst displays the same behaviour observed with Co/ZnO. Two phases are
visible in Figure 3.14. The large crystallites are ZnO crystals, while black spots indicate the
presence of cobalt in reduced form. Small amounts of the cobalt crystals are attached to the
ZnO support, but the vast majority exist on their own. The small spots scattered around are
probably cobalt oxide, as reoxidation of the reduced cobalt occurred on exposure to the
atmosphere. The clear distinction between cobalt and the ZnO support results from the lack
of interaction between them. The agglomeration that results may be so severe that cobalt is
more comfortable separate from the ZnO support, especially following oxidation through
exposure to the atmosphere. For this reason, the exposed metal surface area measured via
hydrogen chemisorption measurements is low in spite of the high extent of reduction
calculated through TPR.
The Co(A)/MnO catalyst showed similarities to the Co/MnO catalyst. The MnO support is
evident as clear square crystals, while reduced cobalt shows itself as black spots. The
Co(A)/MnO photograph contained less black than the Co/MnO, possibly a result of the
absence of the nitrate and the lack of support oxidation as a result of this. The cobalt
crystallite size is lower over Co(A)/MnO than over Co/MnO, dropping from approximately
60nm to 30nm. This contradicts chemisorption measurements. It is more likely that the
acetate would cause a decrease in cobalt crystallite size according to the stronger interaction
between cobalt and support observed over all three supports with the acetate precursor.

Chapter 3 - Results 86
Increased interaction reduces agglomeration of the reduced cobalt on the surface, decreasing
the metal crystallite size.
A B c
Figure 3.14. TEM photographs for (A) Co(A)/Si02, (B) Co(A)/ZnO and (C) Co(A)/MnO
3.2.2.4 Fischer Tropsch Synthesis
The effect of the precursor during preparation of the catalysts was tested under Fischer
Tropsch conditions in order to obtain activity and selectivity data necessary for performance
characterisation. The activity was measured in terms of the hydrocarbon yields obtained from
the gas chromatograph analysis of the organic products and was calculated according to the
procedure laid out in Appendix III.
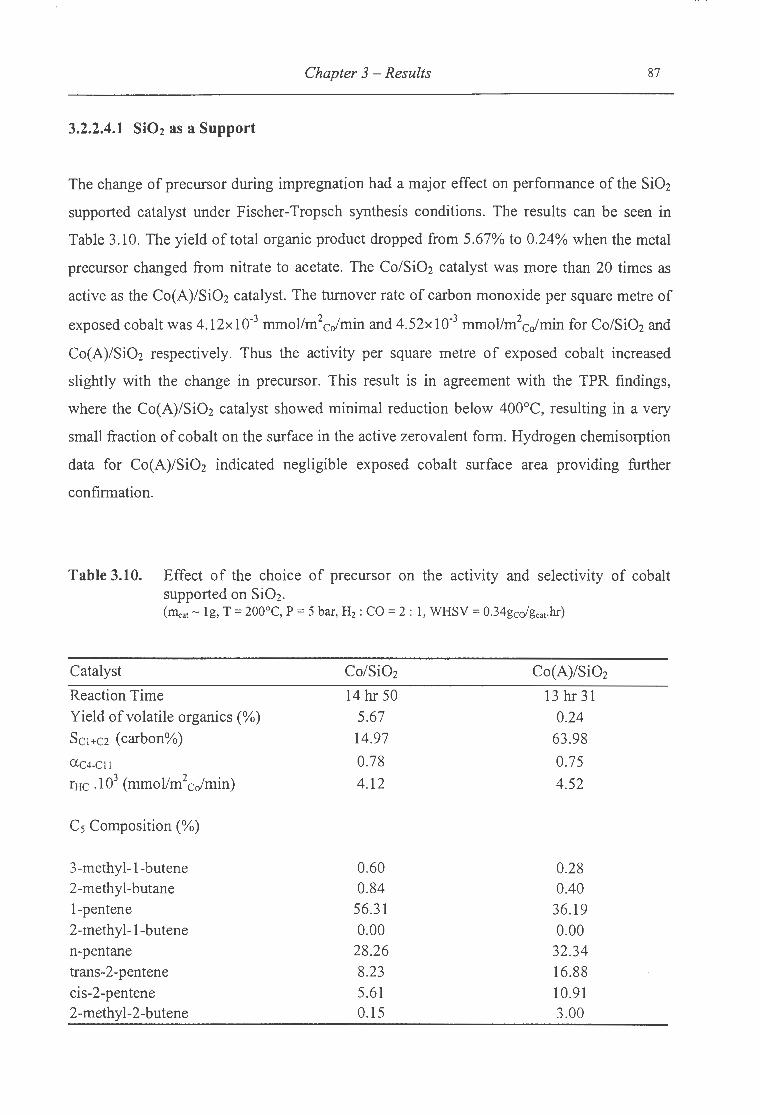
Chapter 3 - Results 87
3.2.2.4.1 Si02 as a Support
The change of precursor during impregnation had a major effect on performance of the Si02
supported catalyst under Fischer-Tropsch synthesis conditions. The results can be seen in
Table 3.10. The yield of total organic product dropped from 5.67% to 0.24% when the metal
precursor changed from nitrate to acetate. The Co/Si02 catalyst was more than 20 times as
active as the Co(A)/Si02 catalyst. The turnover rate of carbon monoxide per square metre of
exposed cobalt was 4.12x10⁻³ mmollm2cJmin and 4.52x10⁻³ mmollm2cJmin for Co/Si02 and
Co(A)/Si02 respectively. Thus the activity per square metre of exposed cobalt increased
slightly with the change in precursor. This result is in agreement with the TPR findings,
where the Co(A)/Si02 catalyst showed minimal reduction below 400°C, resulting in a very
small fraction of cobalt on the surface in the active zerovalent form. Hydrogen chemisorption
data for Co(A)/Si02 indicated negligible exposed cobalt surface area providing further
confirmation.
Table 3.10. Effect of the choice of precursor on the activity and selectivity of cobalt supported· on Si02. (Ineat- lg, T = 200°C, P = 5 bar, H2: CO= 2 : 1, WHSV = 0.34gcofgcat·hr)
Catalyst Co/Si02 Co(A)/Si02
Reaction Time 14 hr 50 13 hr 31 Yield of volatile organics(%) 5.67 0.24 Sc1+c2 (carbon%) 14.97 63.98
UC4-CII 0.78 0.75
rHc .1 03 (mmollm2 cJmin) 4.12 4.52
Cs Composition(%)
3-methyl-1-butene 0.60 0.28 2-methyl-butane 0.84 0.40 1-pentene 56.31 36.19 2-methyl-1-butene 0.00 0.00 n-pentane 28.26 32.34 trans-2-pentene 8.23 16.88 cis-2-pentene 5.61 10.91 2-methyl-2-butene 0.15 3.00

Chapter 3 - Results 88
The selectivity to the C1+2 fraction on a carbon percent basis was dramatically increased for
Co(A)/Si02 compared to the Co/Si02 catalyst, rising from 14.97% to 63.98%, representing an
increase of more than 400%. As the cobalt surface area decreases, the clusters become
smaller and more widespread on the support surface. As the availability of adsorption sites
becomes less, the growing chain becomes starved of reactant adsorbed in a close proximity.
Furthermore, the low activity inhibits the formation of a liquid organic layer around the
catalyst that would enhance readsorption. The result is that termination as methane increases,
as this is the thermodynamically favoured product.
The C5 compositions for the Co/Si02 and Co(A)/Si02 catalysts show considerable
differences. The most notable feature of the Co(A)/Si02 catalyst is the large extent of
secondary reactions taking place illustrated by the high selectivity to both P-olefin isomers
which accounted for nearly 28% of the total C5 fraction. This was approximately double the
fraction produced over the nitrate impregnated Si02 catalyst. Part of the reason for this may
be the slightly higher activity per square metre of exposed cobalt observed, as increased
secondary activity generally results from a higher turnover rate. The a-olefin, the primary
product of the Fischer-Tropsch synthesis, accounted for 36.19% of the C5 fraction for
Co(A)/Si02 as compared to 56.31% for the Co/Si02 catalyst, coinciding with the increase in
the P-olefin selectivity from 13.84% to 27.79% as the precursor changed from nitrate to
acetate. The linear alkane fractions were similar at 28.26% and 32.34% for the Co/Si02 and
Co(A)/Si02 catalysts respectively, indicating similar hydrogenation activities.
The chain growth probabilities were calculated from the slope of the Anderson-Schulz-Flory
(ASF) distribution illustrated in Figure 3.15 for both catalysts. The slopes were almost
parallel, yielding chain growth probabilities, a, of 0. 78 and 0. 7 5 for Co/Si02 and Co(A)/Si02
catalysts respectively. Thus the change of precursor seemed to result in only a slight increase
in the termination rate of the growing chain. The low yield for Co(A)/Si02 prevented
accurate analysis of the organic product past the C9 fraction resulting in a shorter ASF
distribution.
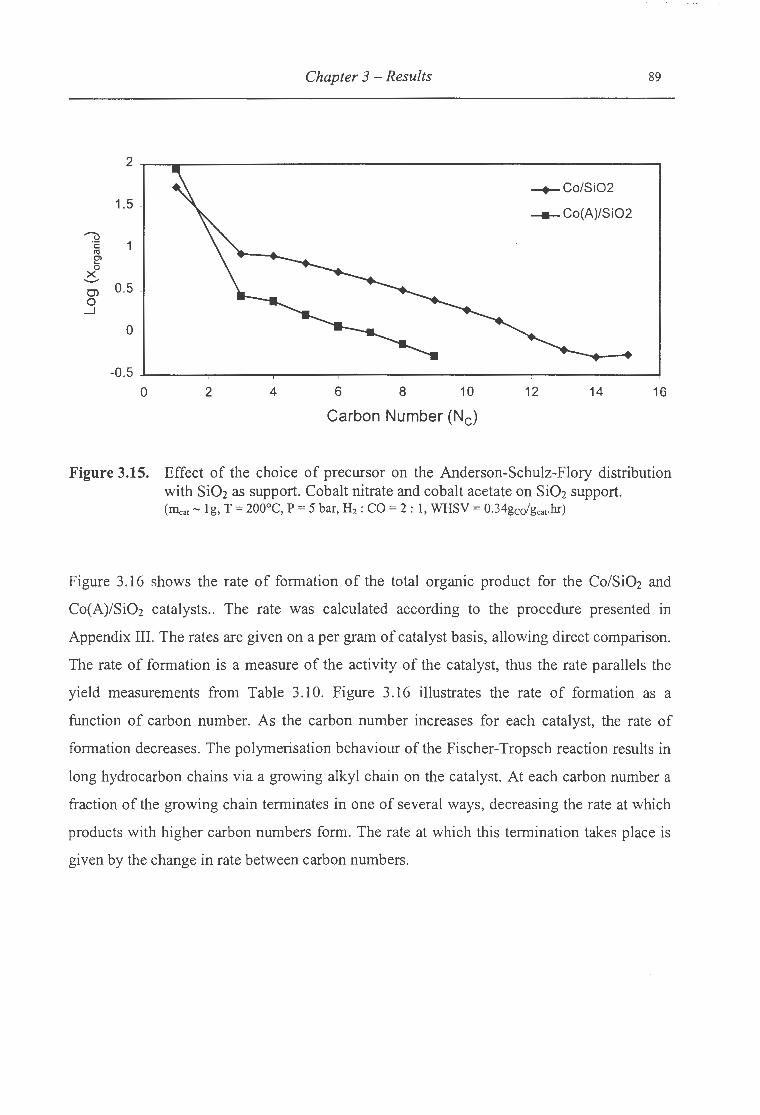
Chapter 3 -Results 89
2
-+-Co/Si02 1.5
- Co(A)/Si02 "'()
·c: ro !:!' 0
X ..__..
0> 0.5 0 _j
0
-0.5 0 2 4 6 8 10 12 14 16
Carbon Number (Nc)
Figure 3.15. Effect of the choice of precursor on the Anderson-Schulz-Flory distribution with Si02 as support. Cobalt nitrate and cobalt acetate on Si02 support. (11lca1 - lg, T = 200°C, P = 5 bar, Hz : CO= 2: 1, WHSV = 0.34gcdgcar·hr)
Figure 3.16 shows the rate of formation of the total organic product for the Co/Si02 and
Co(A)/Si02 catalysts.. The rate was calculated according to the procedure presented in
Appendix III. The rates are given on a per gram of catalyst basis, allowing direct comparison.
The rate of formation is a measure of the activity of the catalyst, thus the rate parallels the
yield measurements from Table 3.10. Figure 3.16 illustrates the rate of formation as a
function of carbon number. As the carbon number increases for each catalyst, the rate of
formation decreases. The polymerisation behaviour of the Fischer-Tropsch reaction results in
long hydrocarbon chains via a growing alkyl chain on the catalyst. At each carbon number a
fraction of the growing chain terminates in one of several ways, decreasing the rate at which
products with higher carbon numbers form. The rate at which this termination takes place is
given by the change in rate between carbon numbers.

Chapter 3 -Results 90
2500
--+-- Co/Si02
- Co(A)/Si02
....-:;:, ~ 2000
0) -c E 1500 -0 E 1000 E '-"'
(0
0 500 ..,--
(.)
·c: ro 0 ~
._o 0 2 4 6 8 10 12 14 16
Carbon Number (Nc)
Figure 3.16. Effect of the choice of precursor on the total organic formation rate with Si02 as support. Cobalt nitrate and cobalt acetate on Si02 support. (Illcat- lg, T = 200°C, P = 5 bar, Hz: CO= 2 : 1, WHSV = 0.34gcofgcat·hr)
The olefinicity of the linear organic product is shown in Figure 3.17 for the Co/Si02 and
Co(A)/Si02 catalysts. The selectivity to linear olefins of the two catalysts were similar for the
full range of carbon numbers, indicating similar growth probabilities as the profiles in Figure
3.17 were approximately parallel. In Table 3.10 the C5 product breakdown was given for each
catalyst. The linear olefin fractions were 70.15% and 63.98% for the Co/Si02 and
Co(A)/Si02 catalysts respectively. The linear olefin fraction was consistently higher for
Co/Si02. The olefin fraction for the Co(A)/Si02 catalyst could only be analysed up to the C9
fraction as the yield was too small to register as a peak in the gas chromatograph trace past
this carbon number.
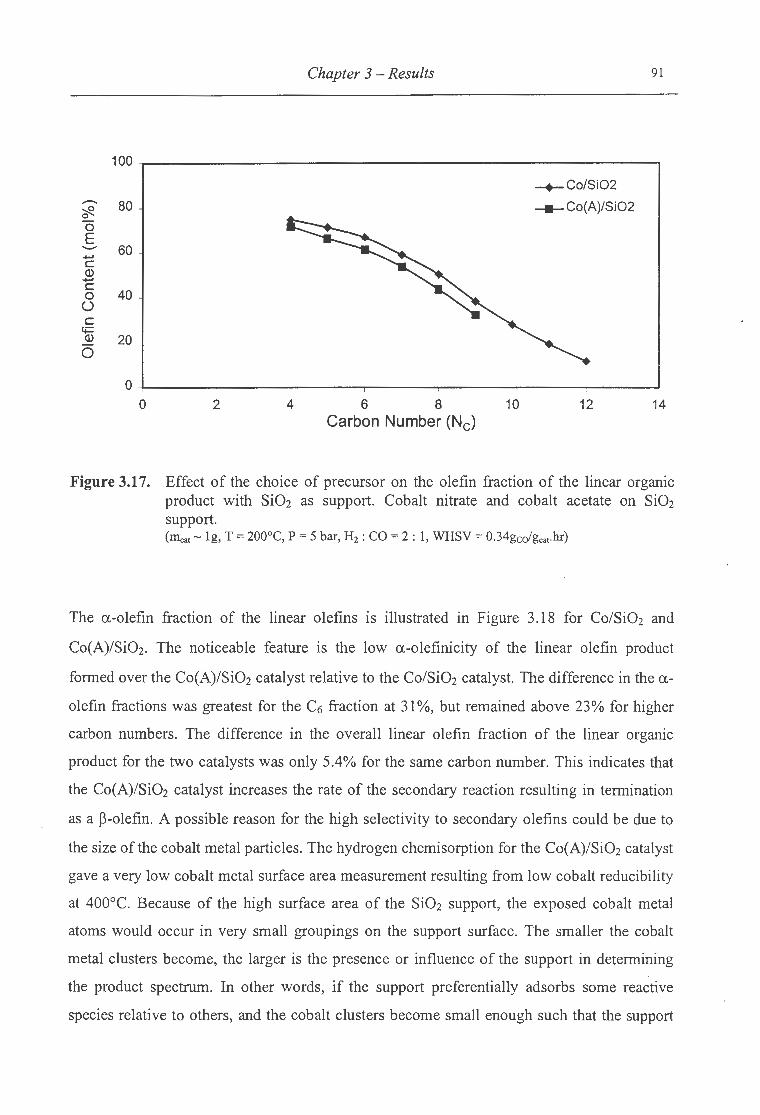
Chapter 3 - Results 91
100
-+-Co/Si02 - 80 - Co(A)/Si02 ~ 0
0 E .........
...... 60 c Q) ...... c
40 0 0 c ~ Q) 20 0
0 0 2 4 6 8 10 12 14
Carbon Number (Nc)
Figure 3.17. Effect of the choice of precursor on the olefin fraction of the linear organic product with Si02 as support. Cobalt nitrate and cobalt acetate on Si02 support. (IDcar- 1g, T = 200°C, P = 5 bar, H2 : CO= 2: 1, WHSV = 0.34gcdgcar·hr)
The a-olefin fraction of the linear ole fins is illustrated in Figure 3.18 for Co/Si02 and
Co(A)/Si02. The noticeable feature is the low a-olefinicity of the linear olefin product
formed over the Co(A)/Si02 catalyst relative to the Co/Si02 catalyst. The difference in the a
olefin fractions was greatest for the C6 fraction at 31%, but remained above 23% for higher
carbon numbers. The difference in the overall linear olefin fraction of the linear organic
product for the two catalysts was only 5.4% for the same carbon number. This indicates that
the Co(A)/Si02 catalyst increases the rate of the secondary reaction resulting in termination
as a P-olefin. A possible reason for the high selectivity to secondary olefins could be due to
the size of the cobalt metal particles. The hydrogen chemisorption for the Co(A)/Si02 catalyst
gave a very low cobalt metal surface area measurement resulting from low cobalt reducibility
at 400°C. Because of the high surface area of the Si02 support, the exposed cobalt metal
atoms would occur in very small groupings on the support surface. The smaller the cobalt
metal clusters become, the larger is the presence or influence of the support in determining
the product spectrum. In other words, if the support preferentially adsorbs some reactive
species relative to others, and the cobalt clusters become small enough such that the support

Chapter 3 - Results 92
becomes influential in providing growth or termination species, then the selectivity ·of the
catalyst could be significantly altered. The low a-olefinicity of the Co(A)/Si02 catalyst may
stem from the ability of the support to induce the double bond shift associated with P-olefin
formation, as well as enhancing termination as the P-olefin.
100
.......... -+-Co/Si02 ~ 80 0
- Co(A)/Si02 0 E .......... +J
60 c Q)
+J c 0
(.) 40 c
t;:: Q)
0 20 ro
.!: 0.. <(
0 ' 0 2 4 6 8 10 12 14
Carbon Number (Nc)
Figure 3.18. Effect of the choice of precursor on the a-olefin fraction of the linear olefins with SiOz as support. Cobalt nitrate and cobalt acetate on Si02 support. (llleat- lg, T = 200°C, P = 5 bar, H2: CO= 2: 1, WHSV = 0.34gcdgc31.hr)
3.2.2.4.2 ZnO as a Support
The change of precursor during impregnation altered both the activity and selectivity of the
ZnO supported catalyst under Fischer-Tropsch synthesis conditions. The results obtained are
presented in Table 3.11. The Co(A)/ZnO catalyst, prepared with the acetate precursor, gave
an organic product yield of 2.45% as opposed to 1.39% for the Co/ZnO catalyst prepared
with the nitrate precursor. This result was unexpected as, even though the TPR spectra for the
two catalysts revealed that the nitrate prepared catalyst had a lower extent of cobalt reduction,
the exposed surface area of the acetate prepared Co(A)/ZnO catalyst was lower as measured
by chemisorption. The turnover rate per square metre of exposed cobalt increased from
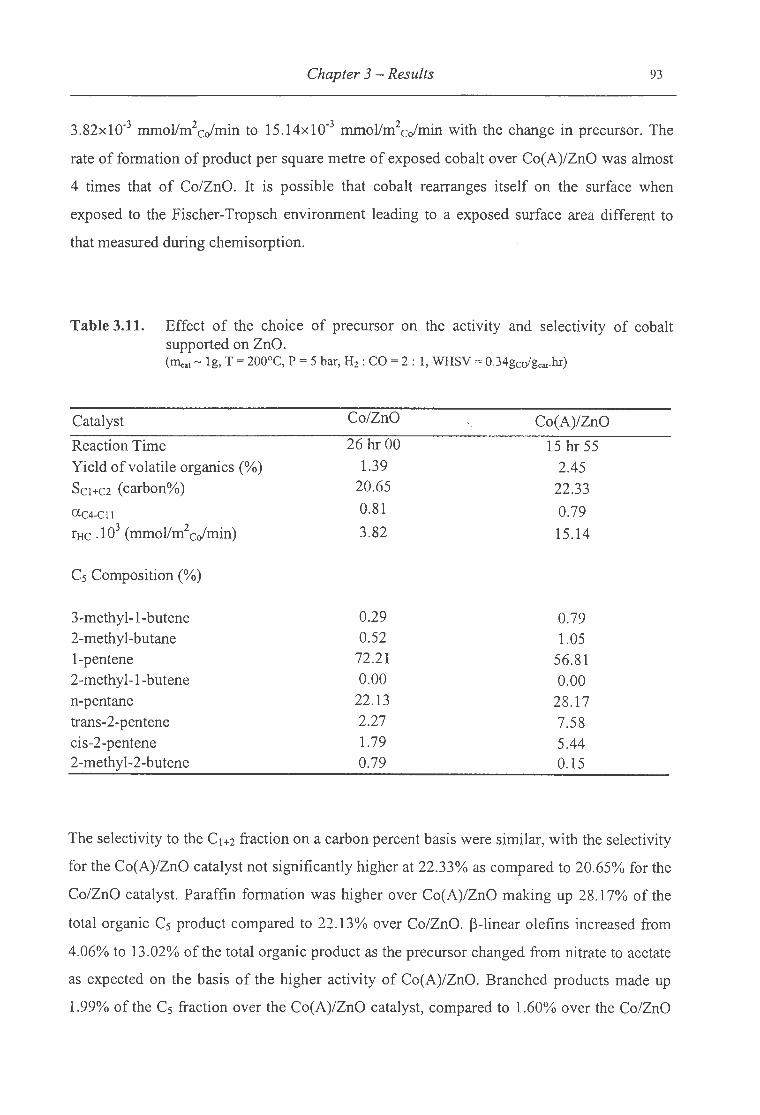
Chapter 3 - Results 93
3.82x10⁻³ mmol/m2cofmin to 15.14x10⁻³ mmollm2colmin with the change in precursor. The
rate of formation of product per square metre of exposed cobalt over Co(A)/ZnO was almost
4 times that of Co/ZnO. It is possible that cobalt rearranges itself on the surface when
exposed to the Fischer-Tropsch environment leading to a exposed surface area different to
that measured during chemisorption.
Table 3.11. Effect of the choice of precursor on the activity and selectivity of cobalt supported on ZnO. (Illcat- lg, T = 200°C, P = 5 bar, H2 : CO= 2: 1, WHSV = 0.34gcofgcat-hr)
Catalyst Co/ZnO Co(A)/ZnO
Reaction Time 26 hr 00 15 hr 55 Yield of volatile organics(%) 1.39 2.45 Sci+C2 (carbon%) 20.65 22.33
ac4-CII 0.81 0.79
rHc .1 03 (mmollm2 colmin) 3.82 15.14
C5 Composition(%)
3-methyl-1-butene 0.29 0.79 2-methyl-butane 0.52 1.05 1-pentene 72.21 56.81 2-methyl-1 -butene 0.00 0.00 n-pentane 22.13 28 .17 trans-2-pentene 2.27 7.58 cis-2-pentene 1.79 5.44 2-methyl-2-butene 0.79 0.15
The selectivity to the C1+2 fraction on a carbon percent basis were similar, with the selectivity
for the Co(A)/ZnO catalyst not significantly higher at 22.33% as compared to 20.65% for the
Co/ZnO catalyst. Paraffin formation was higher over Co(A)/ZnO making up 28.17% of the
total organic C5 product compared to 22.13% over Co/ZnO. ~-linear olefins increased from
4.06% to 13.02% of the total organic product as the precursor changed from nitrate to acetate
as expected on the basis of the higher activity of Co(A)/ZnO. Branched products made up
1.99% of the C5 fraction over the Co(A)/ZnO catalyst, compared to 1.60% over the Co/ZnO

Chapter 3 -Results 94
catalyst, once again indicating the enhanced formation of secondary reaction products over
the acetate catalyst.
The chain growth probabilities for Co(A)/ZnO and Co/ZnO were calculated from the slope of
the Anderson-Schulz-Flory distributions illustrated in Figure 3.19. The chain growth
probabilities were similar for the two catalysts, giving a values of 0.81 .and 0. 79 for Co/ZnO
and Co(A)/ZnO respectively. As was the case with the Si02 support, the change in precursor
from nitrate to acetate seemed to increase the termination rate of the growing chain slightly.
From C1 to C9, the ASF distributions matched each other closely, however above C9 their
behaviour deviated significantly, with the a value increasing for the Co/ZnO catalyst and
decreasing for the Co(A)/ZnO catalyst. Other workers [Kuipers et al., 1995; Huff and
Satterfield, 1984] have noted similar deviations from the expected straight line ASF
behaviour. Wax trap bleeding may cause the increase in chain growth probability over
Co/ZnO, while the drop in growth probability over the Co(A)/ZnO may result from the
presence of different types of active sites as postulated by Satterfield and Huff (1984].
2
1.5 -+-Co/ZnO
-Co(A)/ZnO
~ ·c: (I]
0.5 e> 0
>< ......... 0) 0 0
...J
-0 .5
-1
0 2 4 6 8 10 12 14 16
Carbon Number (Nc)
Figure 3.19. Effect of the choice of precursor on the Anderson-Schulz-Flory distribution with ZnO as support. Cobalt nitrate and cobalt acetate on ZnO support. (Inea1 - l g, T = 200°C, P = 5 bar, H2: CO = 2: 1, WHSV = 0.34gcdgcat·hr)
Figure 3.20 shows the rate of formation of the total organic product for the Co/ZnO ·and
Co(A)/ZnO catalysts as a function of carbon number. The rate was calculated according to
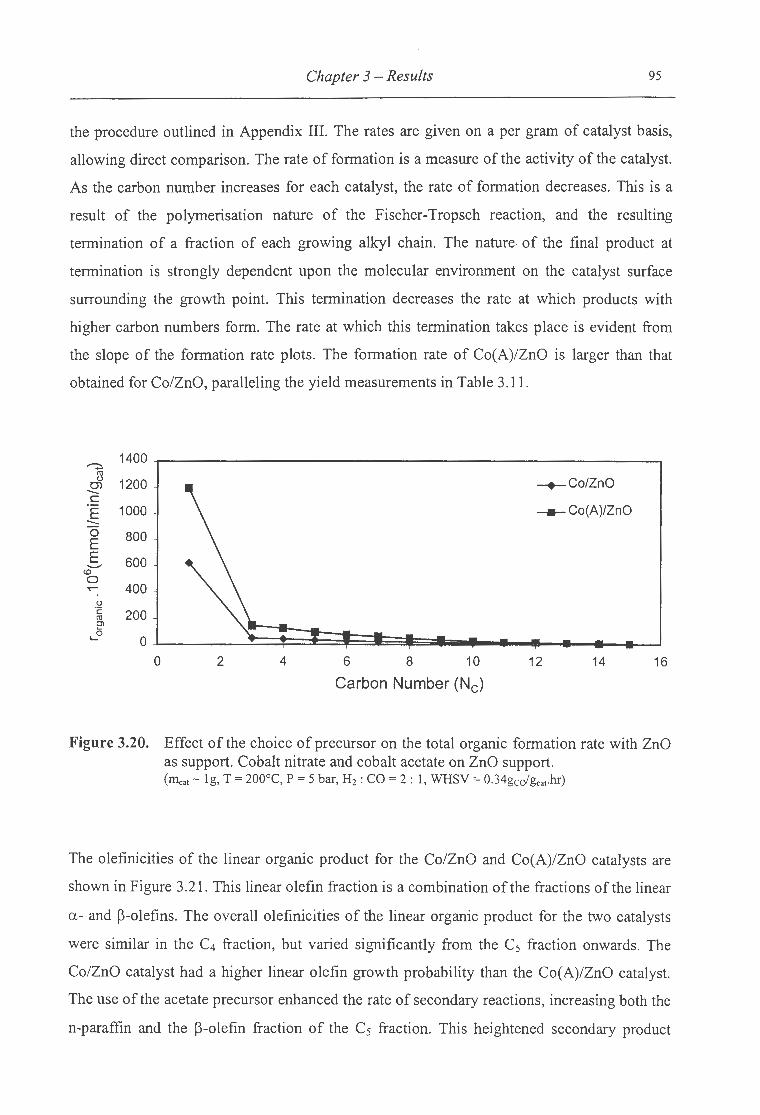
Chapter 3 -Results 95
the procedure outlined in Appendix III. The rates are given on a per gram of catalyst basis,
allowing direct comparison. The rate of formation is a measure of the activity of the catalyst.
As the carbon number increases for each catalyst, the rate of formation decreases. This is a
result of the polymerisation nature of the Fischer-Tropsch reaction, and the resulting
termination of a fraction of each growing alkyl chain. The nature. of the final product at
termination is strongly dependent upon the molecular environment on the catalyst surface
surrounding the growth point. This termination decreases the rate at which products with
higher carbon numbers form. The rate at which this termination takes place is evident from
the slope of the formation rate plots. The formation rate of Co(A)/ZnO is larger than that
obtained for Co/ZnO, paralleling the yield measurements in Table 3.11.
~ 1400
-+-Co/ZnO rl 1200 0> -c E 1000 - --Co(A)/ZnO -0 800 -E E 600 ..__...
<D 0 .....- 400
(.)
·c: 200 co e>
,_o 0
0 2 4 6 8 10 12 14 16
Carbon Number (Nc)
Figure 3.20. Effect of the choice of precursor on the total organic formation rate with ZnO as support. Cobalt nitrate and cobalt acetate on ZnO support. (m.,.1 - lg, T = 200°C, P = 5 bar, H2 : CO = 2: 1, WHSV = 0.34gcofgcat·hr)
The olefinicities of the linear organic product for the Co/ZnO and Co(A)/ZnO catalysts are
shown in Figure 3 .21. This linear olefin fraction is a combination of the fractions of the linear
a - and 0-olefins. The overall olefinicities of the linear organic product for the two catalysts
were similar in the C4 fraction, but varied significantly from the C5 fraction onwards. The
Co/ZnO catalyst had a higher linear olefin growth probability than the Co(A)/ZnO catalyst.
The use of the acetate precursor enhanced the rate of secondary reactions, increasing both the
n-paraffin and the 0-olefin fraction of the C5 fraction. This heightened secondary product
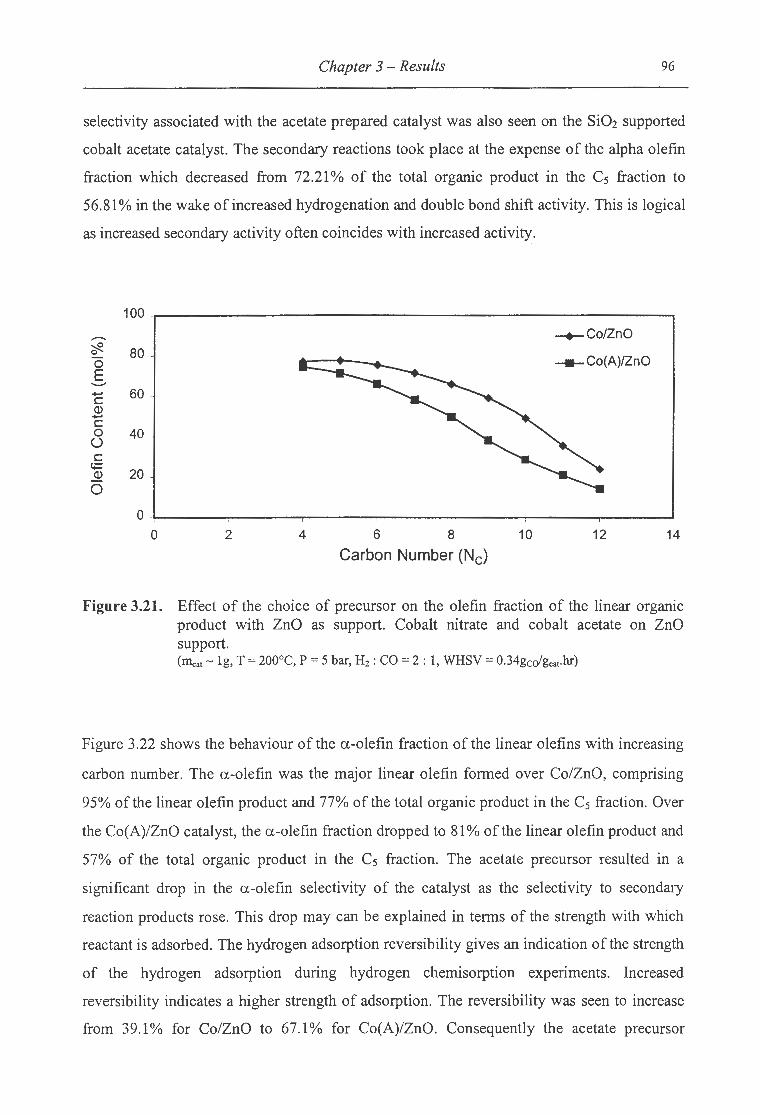
Chapter 3 - Results 96
selectivity associated with the acetate prepared catalyst was also seen on the Si02 supported
cobalt acetate catalyst. The secondary reactions took place at the expense of the alpha olefin
fraction which decreased from 72.21% of the total organic product in the C5 fraction to
56.81% in the wake of increased hydrogenation and double bond shift activity. This is logical
as increased secondary activity often coincides with increased activity.
100
.......... -+-Co/ZnO ~ 80 -0
0 -Co(A)/ZnO E .......... - 60 -c Q} -c 0 40 ()
c t+=
20 Q}
0
0 0 2 4 6 8 10 12 14
Carbon Number (Nc)
Figure 3.21. Effect of the choice of precursor on the olefin fraction of the linear organic product with ZnO as support. Cobalt nitrate and cobalt acetate on ZnO support. (111cat - lg, T = 200°C, P = 5 bar, H2 : CO = 2: 1, WHSV = 0.34gcdgca1.hr)
Figure 3.22 shows the behaviour of the a-olefin fraction of the linear olefins with increasing
carbon number. The a-olefin was the major linear olefin formed over Co/ZnO, comprising
95% of the linear olefin product and 77% of the total organic product in the C5 fraction. Over
the Co(A)/ZnO catalyst, the a-olefin fraction dropped to 81% of the linear olefin product and
57% of the total organic product in the C5 fraction. The acetate precursor resulted in a
significant drop in the a-olefin selectivity of the catalyst as the selectivity to secondary
reaction products rose. This drop may can be explained in terms of the strength with which
reactant is adsorbed. The hydrogen adsorption reversibility gives an indication of the strength
of the hydrogen adsorption during hydrogen chemisorption experiments. Increased
reversibility indicates a higher strength of adsorption. The reversibility was seen to increase
from 39.1 % for Co/ZnO to 67.1 % for Co(A)/ZnO. Consequently the acetate precursor

Chapter 3 -Results 97
resulted in a greater distribution of cobalt enhancing readsorption forming more secondary
product due to improved chance of primary product readsorption.
100
........... --+-Co/ZnO ~ 80 0
-co(A)/ZnO 0 E
........... 60 .......
c Q) ....... c 40 0 ()
c t;:: 20 Q)
0 co 0 ..c 0.. 0 2 4 6 8 10 12 14 <(
Carbon Number (Nc)
Figure 3.22. Effect of the choice of precursor on the a-olefin fraction of the linear olefins with ZnO as support. Cobalt nitrate and cobalt acetate on ZnO support. (m.,.1 - lg, T = 200°C, P = 5 bar, H2 : CO= 2 : 1, WHSV = 0.34gcofgcar·hr)
3.2.2.4.3 MnO as a Support
The change of precursor during impregnation had an unexpected effect on the activity and
selectivity of the MnO supported cobalt catalyst under Fischer-Tropsch synthesis conditions.
The results can be seen in Table 3.12. The Co(A)/MnO catalyst, prepared with the acetate
precursor, gave an organic product yield of 0.28% as opposed to 0.18% for the Co/MnO
catalyst prepared with the nitrate precursor. These activities were unexpectedly low. The TPR
spectra for the two catalysts suggested that both catalysts would have a significant fraction of
exposed metal atoms reaction due to the high reducibility of cobalt in both precursor cases.
However MnO support studies indicated that this reducibility was largely a result of support
reduction. In terms of zeta potential, both the Co/MnO and the Co(A)/MnO catalysts were
prepared under pH conditions that resulted in a net negative charge on the MnO surface. The
interaction between positive cobalt ions and the negative support surface may have resulted
in strongly attached oxide species that were reducible at temperatures greater than 400°C.

Chapter 3 -Results 98
Hydrogen chemisorption measurements however showed that the exposed surface area
increased from 0.35 m2/g to 0.90 m2/g as the precursor was changed from nitrate to acetate.
However the rate per square metre of exposed cobalt decreased from 1.13 x 1 o-3
mmol/m2 colmin to 0.68x 1 o-3 mmollm2 cofmin following an increase in cobalt dispersion from
2.06% to 2.40%. The increased surface area was partly responsible for the higher activity
noted over Co(A)/MnO, as the activity increased by a factor of 1.5 as the surface area almost
tripled. It was also noted that the extent of reduction increased from 28.7% to 63.0%
following the precursor change.
The selectivity to the C1+2 fraction on a carbon percent basis was 19.09% for the Co(A)/MnO
catalyst, lower than the 27.52% obtained over the Co/MnO catalyst. This is expected, as the
acetate prepared catalyst had the higher activity. Branched products made up 4.39% of the C5
fraction over the Co(A)/MnO catalyst, compared to 3.34% over the Co/MnO catalyst,
confirming the predisposition of the acetate prepared catalyst to secondary product formation
as seen over the ZnO and Si02 supported catalysts.
Table 3.12. Effect of the choice of precursor on the activity and selectivity of cobalt supported on MnO. (IIlcat- lg, T = 200°C, P = 5 bar, H2: CO= 2: 1, WHSV = 0.34gcdgc31.hr)
Catalyst Co/MnO Co(A)/MnO Reaction Time 22 hr 30 22 hr 25 Yield of volatile organics (%) 0.18 0.28 Sc1+c2 (carbon%) 27.52 19.09
ac4-Ctl 0.76 0.70 rHc .1 03 (mmol/m2cofmin) 1.13 0.68
Cs Composition(%)
3-methyl-1-butene 0.80 0.83 2-methyl-butane 1.87 3.06 1-pentene 50.60 42.81 2-methyl-1-butene 0.00 0.00 n-pentane 30.09 35.45 trans-2-pentene 9.76 10.71 cis-2-pentene 6.21 6.64 2-methyl-2-butene 0.67 0.50
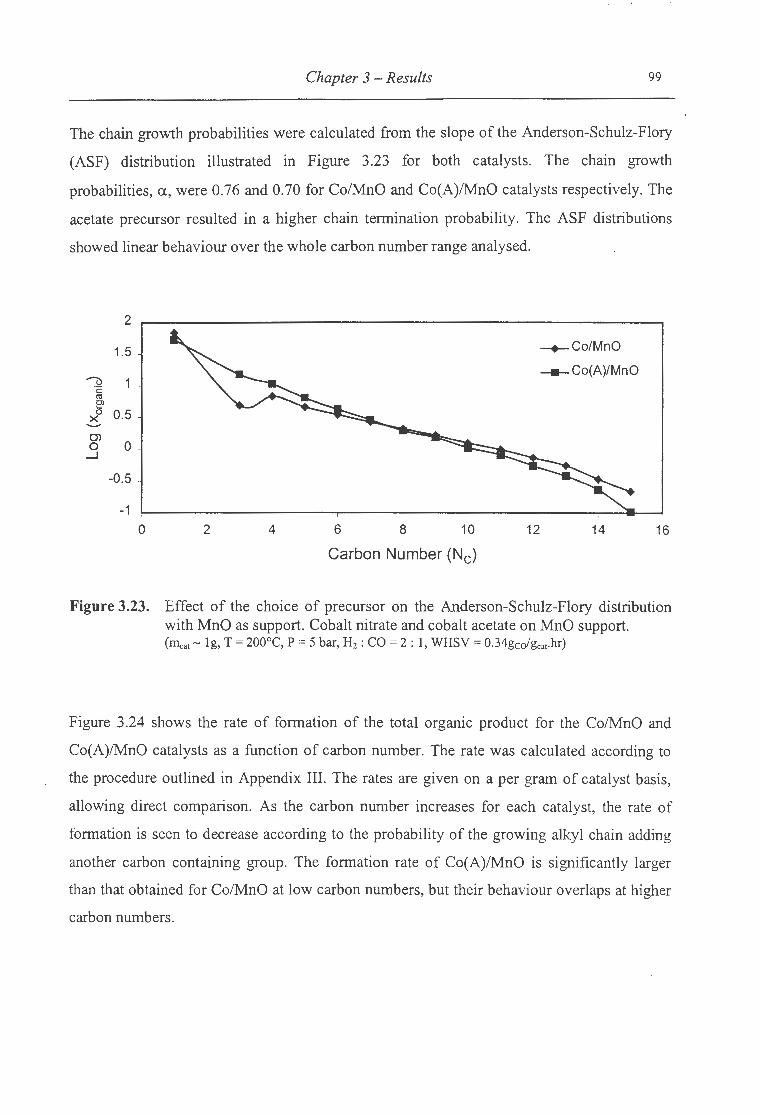
Chapter 3 - Results 99
The chain growth probabilities were calculated from the slope of the Anderson-Schulz-Flory
(ASF) distribution illustrated in Figure 3.23 for both catalysts. The chain growth
probabilities, a, were 0.76 and 0.70 for Co/MnO and Co(A)/MnO catalysts respectively. The
acetate precursor resulted in a higher chain termination probability. The ASF distributions
showed linear behaviour over the whole carbon number range analysed.
2
1.5 -+-Co/MnO
----u -co(A)/MnO
·c: ro E' 0 0.5 X -0)
0 0 _J
-0.5
-1 0 2 4 6 8 10 12 14 16
Carbon Number (Nc)
Figure 3.23. Effect of the choice of precursor on the Anderson-Schulz-Flory distribution with MnO as support. Cobalt nitrate and cobalt acetate on MnO support. (Illcat- lg, T = 200°C, P = 5 bar, H2 : CO= 2 : 1, WHSV = 0.34gcdgcat·hr)
Figure 3.24 shows the rate of formation of the total organic product for the Co/MnO and
Co(A)/MnO catalysts as a function of carbon number. The rate was calculated according to
the procedure outlined in Appendix III. The rates are given on a per gram of catalyst basis,
allowing direct comparison. As the carbon number increases for each catalyst, the rate of
formation is seen to decrease according to the probability of the growing alkyl chain adding
another carbon containing group. The formation rate of Co(A)/MnO is significantly larger
than that obtained for Co/MnO at low carbon numbers, but their behaviour overlaps at higher
carbon numbers.

Chapter 3 -Results 100
140 .-. co
-+-Co/MnO & 120 -c -Co(A)/MnO E 100 -0 80 E
E 60 ..._.. co 0 ....... 40
u ·c: 20 C1l e> ~ 0
0 2 4 6 8 10 12 14 16
Carbon Number (Nc)
Figure 3.24. Effect of the choice of precursor on the total organic formation rate with MnO as support. Cobalt nitrate and cobalt acetate on MnO support. (llla1 - 1g, T = 200°C, P = 5 bar, H2 : CO = 2 : 1, WHSV = 0.34gcdgcat·hr)
The olefinicity of the linear organic product is shown in Figure 3.25 for the Co/MnO and
Co(A)/MnO catalysts. In Table 3.12 the C5 product breakdown was given for each catalyst.
The linear olefin fractions were 66.57% and 60.16% for the Co/MnO and Co(A)/MnO
catalysts respectively. The selectivity to linear olefins was approximately 6% lower for the
acetate prepared catalyst relative to the nitrate catalyst. This difference was maintained over
the whole range of carbon numbers analysed. Once again the higher activity lead to an
increase in the extent of secondary reaction.
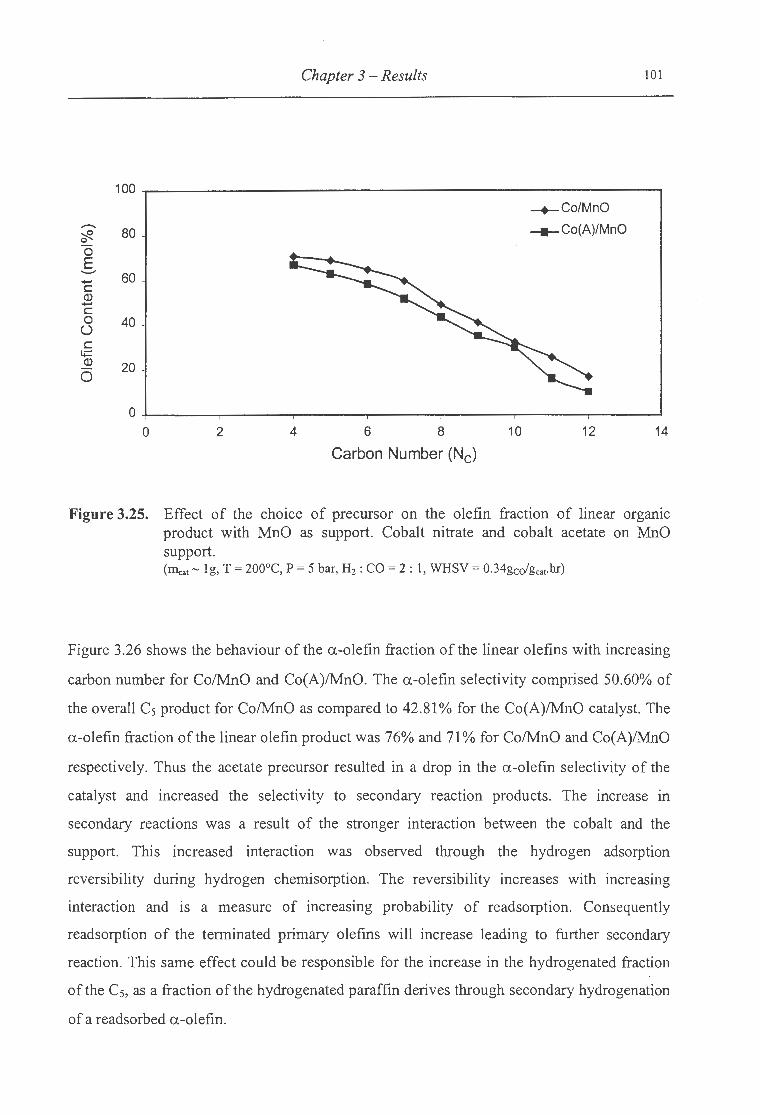
Chapter 3 -Results 101
100 -+-Co/MnO
_........ 80 -Co(A)/MnO ~ 0
0 E ...........
60 ....... c Q) ....... c 0 40 (.)
c t+= Q) 20 0
0 0 2 4 6 8 10 12 14
Carbon Number (Nc)
Figure 3.25. Effect of the choice of precursor on the olefin fraction of linear organic product with MnO as support. Cobalt nitrate and cobalt acetate on MnO support. (111cat- 1g, T = 200°C, P = 5 bar, H2: CO= 2: 1, WHSV = 0.34gcdgcat·hr)
Figure 3.26 shows the behaviour of the a-olefin fraction of the linear olefins with increasing
carbon number for Co/MnO and Co(A)/MnO. The a-olefin selectivity comprised 50.60% of
the overall C5 product for Co/MnO as compared to 42.81% for the Co(A)/MnO catalyst. The
a-olefin fraction of the linear olefin product was 76% and 71% for Co/MnO and Co(A)/MnO
respectively. Thus the acetate precursor resulted in a drop in the a-olefin selectivity of the
catalyst and increased the selectivity to secondary reaction products. The increase in
secondary reactions was a result of the stronger interaction between the cobalt and the
support. This increased interaction was observed through the hydrogen adsorption
reversibility during hydrogen chemisorption. The reversibility increases with increasing
interaction and is a measure of increasing probability of readsorption. Consequently
readsorption of the terminated primary olefins will increase leading to further secondary
reaction. This same effect could be responsible for the increase in the hydrogenated fraction
of the C5, as a fraction of the hydrogenated paraffin derives through secondary hydrogenation
of a readsorbed a-olefin.

Chapter 3 - Results 102
...-.. 100 ~
-+-Co/MnO 0
0 E 80 -co(A)/MnO --c Q) 60 -c 0 u c 40
t+= Q)
0 20 co .r:. c.. <( 0
0 2 4 6 8 10 12 14 Carbon Number (Nc)
Figure 3.26. Effect of the choice of precursor on the a-olefin fraction of the linear olefins with MnO as support. Cobalt nitrate and cobalt acetate on MnO support. (Ineat- 1g, T = 200°C, P = 5 bar, H2: CO= 2 : 1, WHSV = 0.34gcofgcat·hr)
3.2.3 Effect of the Type of Impregnation Solution
When the cobalt precursor is placed in solution, dissociation will take place and the cobalt
ions present will become partially or totally solvated. The strength of this solvation and the
extent to which it takes place determine the nature of the interaction between the cobalt ions
and the associated anions in the solution. This interaction in turn will affect the attraction and
the resulting strength of attachment to the support material used. Thus changes m
impregnation solution are expected to affect the cobalt support interaction, resulting m
alterations to cobalt reducibility, metal dispersion on the support surface, consequently
influencing the activity and selectivity ofthe catalyst.
The effect of impregnation solution was investigated by comparing the effect of water and the
effect of monoethylenediamine in aqueous solution on the prepared catalyst. Cobalt nitrate
was chosen as the cobalt source for both impregnation solutions as the nitrate precursor was
seen to yield significantly more active catalysts than the acetate precursor, as illustrated in

Chapter 3 -Results 103
section 3 .2.1.4. Monoethylenediamine will be abbreviated as MED for the remammg
sections.
3.2.3.1 Temperature Programmed Reduction
The influence of the impregnation solvent on the reducibility of cobalt supported on Si02
(A), ZnO (B) and MnO (C) can be seen in Figure 3.27. The TPR spectra for catalysts
prepared with MED added to the impregnation solution are distinctly different from those
prepared without MED addition. This was true for all three supports.
The TPR spectrum of the Si02 prepared MED catalyst (Co(MED)/Si02) consisted of a single
broad peak ranging from 430°C to 650°C with a maximum at 590°C. The spectrum was flat
from the starting temperature of 1 00°C to the beginning of the single peak. This temperature
range is usually characterised by the reduction peaks of Co30 4 and CoO indicating that the
presence of MED has prevented the formation of trivalent cobalt oxide on the support
surface. MED addition also eliminated cobalt silicate species that are frequently present
following cobalt impregnation on Si02 .
The reason for the absence of both the trivalent cobalt oxide and the cobalt silicates can be
attributed to the strong chelating effect of MED. The MED ligands can complex with the
cobalt ions, replacing the water ligands that initially surrounded them. This complexation
induces a strong field that restricts access of support surface functional groups that might
otherwise interact strongly with the cobalt ion. The hydrogen to cobalt molar ratio was 1.508,
higher than for the water solvent catalyst. This was expected as it was thought that the MED
complex would also reduce leading to a ratio greater than 1.33. No reduction was seen to take
place below 400°C, indicating strong complexation between cobalt and MED, as well as
interaction between cobalt and the support. This strong interaction may arise from the
chelating effect of the silica surface, which acts as a driving force for the formation of a
stable cis-octahedral complex [Che, 1993]
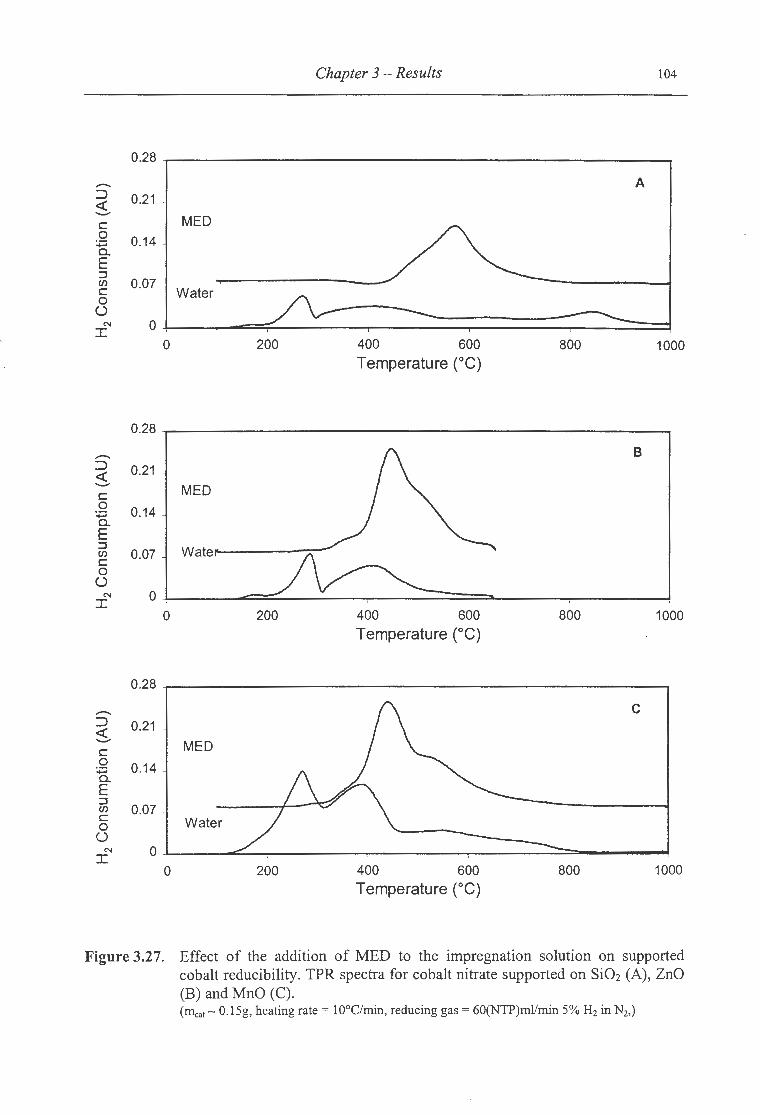
Chapter 3 - Results 104
0.28
.......... A ::J 0.21 ~ .......... c: MED 0 0.14 :.;::::; c.. E ::J (/) 0.07 c: Water 0
(,) N 0
I 0 200 400 600 800 1000
Temperature (°C)
0.28
.......... B ::J 0.21 ~ .......... MED c: 0 0.14 :.;::::; c.. E ::J
Wate (/) 0.07 c: 0
(,) N 0
I 0 200 400 600 800 1000
Temperature CC)
0.28
.......... c ::J 0.21 ~ .......... MED c: 0 0.14 :.;::::; c.. E ::J (/) 0.07 -c: Water 0 (,)
N 0 I
0 200 400 600 800 1000
Temperature CC)
Figure 3.27. Effect of the addition of MED to the impregnation solution on supported cobalt reducibility. TPR spectra for cobalt nitrate supported on Si02 (A), ZnO (B) and MnO (C). (nicat ~ 0.15g, heating rate= 10°C/min, reducing gas= 60(NTP)ml/min 5% H2 in N2,)

Chapter 3 - Results 105
The ZnO supported catalyst prepared with MED in solution gave a TPR spectrum with a
single peak with maximum hydrogen consumption at 430°C. However, unlike the Si02
support, two shoulders were evident on the peak. These were a low temperature shoulder
between 350°C and 400°C, and a larger shoulder at 580°C. The presence of these shoulders
suggests that the cobalt is present in more than one form on the ZnO surface, or that
irregularities on the ZnO surface result in varying strengths of interaction. The overall peak
could be a combination of cobalt in both oxide and MED complexed form. The hydrogen to
cobalt molar ratio for the ZnO supported catalyst was 2.361 for the total reduction spectrum,
and 0.199 for reduction up to 400°C as shown in Table 3.13. The high ratio for the overall
reduction is attributed to the reduction of both the cobalt oxide and the MED complex. The
low ratio for reduction below 400°C may result from interaction between both the cobalt and
the MED with the support, as the oxide support surface can also act as a monodentate ligand
at the fluid-solid interface [Burwell et al., 1965].
Table 3.13. Effect of the addition of MED to the impregnation solution on hydrogen consumption during TPR for cobalt nitrate impregnated onto Si02, ZnO and MnO.
Support Solvent Type H2:C0Total H2: Co<400°C
Si02 Water 1.346 0.457
MED 1.508 0.0
ZnO Water 1.040 0.607
MED 2.361 0.199
MnO Water 3.361 1.968
MED 1.742 0.320
The effect of MED in the impregnation solution on the MnO support was similar to that seen
for both the Si02 and ZnO supported cobalt catalysts. The notable feature once again was the
single reduction peak with a maximum at a temperature of 440°C. For all three supports, the
initial reduction began at a higher temperature, yielding a single broad peak. As for ZnO, the
MnO catalyst reduction peak had a low and high temperature shoulder attributable to effects
described above. It is possible that the shoulders may be associated with reduction of the

Chapter 3 - Results 106
MnO support, as oxidation of the support is still likely due to the decomposition of the nitrate
precursor. The hydrogen to cobalt molar ratio for the overall spectrum was 1.742, higher than
the ratio of 1 associated with complete CoO reduction. Once again the MED complex may
undergo reduction. The hydrogen to cobalt molar ratio for reduction below 400°C was 0.320
from Table 3.13. This low value stems from metal support interaction as discussed for the
Co(MED)/ZnO catalyst.
3.2.3.1.1 Extent of Supported Cobalt Reduction
Figure 3.28 illustrates two TPR spectra for the catalyst formed through cobalt nitrate
impregnation on Si02 (A), ZnO (B) and MnO (C) following the addition of MED to the
impregnation solution. The first spectrum entitles 'calcined' corresponds to a pretreatment
consisting of a calcination step of 1 hour in N2 at 400°G to decompose the precursor. The
second spectrum entitled 'reduced' illustrates the TPR profile following activation of the
catalyst by reduction in a 5% H2 in N2 gas mixture. The reduction pretreatment was the same
applied to the catalyst as an activation procedure prior to loading into the reactor for Fischer
Tropsch synthesis. By comparison of the two spectra, information on the extent of
reducibility of cobalt acetate supported on Si02 (A), ZnO (B) and MnO (C) was obtained.
The extent of reduction calculations for the MED prepared catalysts were based on the
assumption that, following reduction at 400°C for 16 hours, the unreduced cobalt was present
on the catalyst as divalent cobalt. This assumption seems reasonable in light of the fact that
MED is a strong field ligand that would prevent oxidation of the loaded divalent cobalt to the
trivalent form.
Reduction at 400°C for 16 hours caused differences in the reduction profile of the
Co(MED)/Si02 catalyst relative to the calcined catalyst as illustrated in Figure 3.28 (A). The
' reduced' sample showed three regions of reduction as opposed to the single reduction step
over the 'calcined' catalyst. The low temperature region with maximum hydrogen
consumption at 250°C is due to the reduction of reoxidised zerovalent cobalt following
exposure to the atmosphere. The majority of hydrogen consumption took place in a broad
peak with a maximum at 550°C. This reduction region corresponded to the single reduction
peak present during the TPR spectrum of the 'calcined' catalyst, and was attributed to Co2+
strongly chelated by both the MED and the SiOz support.

; •• • ~ t I • I 1 ~
Chapter 3 - Results 107
0.16
"""' A ::J 0.12 <l: ...........
c Reduced 0 0.08 :;:; a.. E :::J 0.04 (/) c Calcined 0 ()
0 N I 0 200 400 600 800 1000
Temperature CC)
0.2
......... B ::J 0.16 <l: ........... c 0.12 Reduced 0
:;:; a.. 0.08 -E :::J (/) 0.04 c Calcined 0 ()
0 N I 0 200 400 600 800 1000
Temperature CC)
0.2
- 0.16 c ::J <l: ........... c 0.12 Reduced 0
:;:; a.. 0.08 E :::J (/)
0.04 c Calcined 0 ()
N 0 I
0 200 400 600 800 1000
Temperature (°C)
Figure 3.28. Evaluation of the extent of reduction of supported cobalt nitrate after reduction at 400°C for 16 hours for (A) Co(MED)/Si02, (B) Co(MED)/ZnO and (C) Co(MED)/MnO. (IIlcat- 0.15g, heating rate= 10°C/min, reducing gas = 60(NTP)m1/min 5% H2 in N2, )
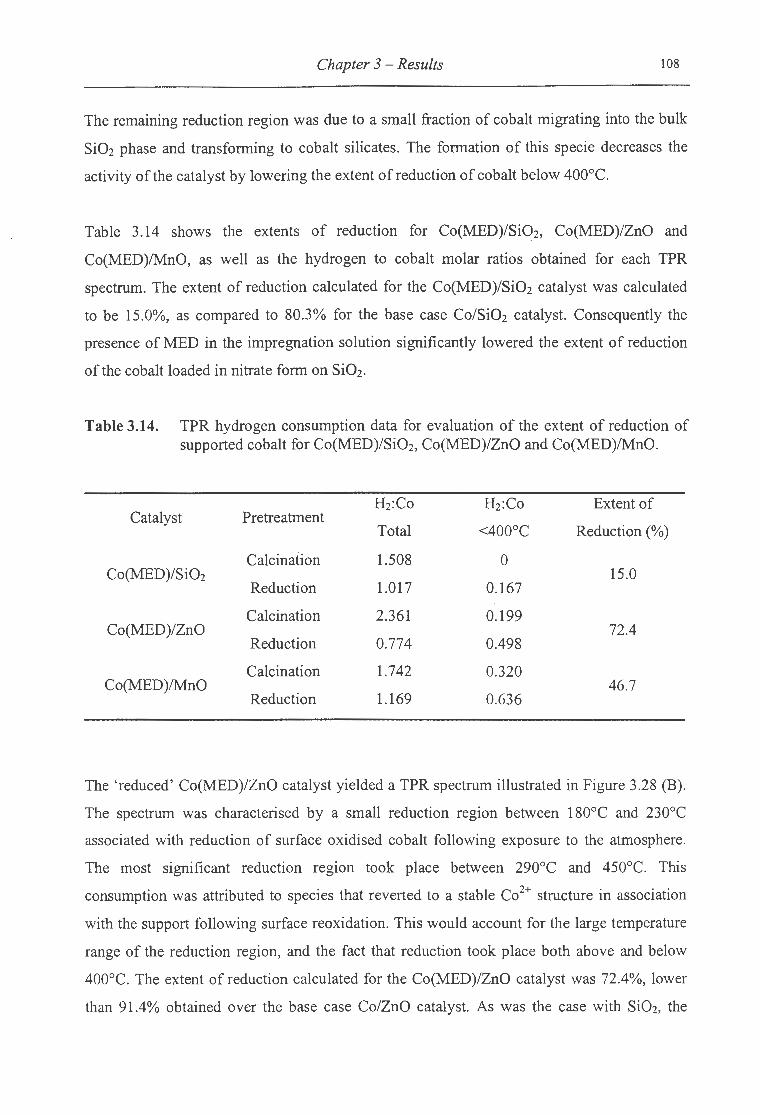
Chapter 3 - Results 108
The remaining reduction region was due to a small fraction of cobalt migrating into the bulk
Si02 phase and transforming to cobalt silicates. The formation of this specie decreases the
activity of the catalyst by lowering the extent of reduction of cobalt below 400°C.
Table 3.14 shows the extents of reduction for Co(MED)/Si02, Co(MED)/ZnO and
Co(MED)/MnO, as well as the hydrogen to cobalt molar ratios obtained for each TPR
spectrum. The extent of reduction calculated for the Co(MED)/Si02 catalyst was calculated
to be 15.0%, as compared to 80.3% for the base case Co/Si02 catalyst. Consequently the
presence of MED in the impregnation solution significantly lowered the extent of reduction
of the cobalt loaded in nitrate form on SiOz.
Table 3.14. TPR hydrogen consumption data for evaluation of the extent of reduction of supported cobalt for Co(MED)/SiOz, Co(MED)/ZnO and Co(MED)/MnO.
H2:Co Hz:Co Extent of Catalyst Pretreatment
Total <400°C Reduction (%)
Calcination 1.508 0 Co(MED)/SiOz 15.0
Reduction 1.017 0.167
Calcination 2.361 0.199 Co(MED)/ZnO 72.4
Reduction 0.774 0.498
Calcination 1.742 0.320 Co(MED)/MnO 46.7
Reduction 1.169 0.636
The 'reduced' Co(MED)/ZnO catalyst yielded a TPR spectrum illustrated in Figure 3.28 (B).
The spectrum was characterised by a small reduction region between 180°C and 230°C
associated with reduction of surface oxidised cobalt following exposure to the atmosphere.
The most significant reduction region took place between 290°C and 450°C. This
consumption was attributed to species that reverted to a stable Co2+ structure in association
with the support following surface reoxidation. This would account for the large temperature
range of the reduction region, and the fact that reduction took place both above and below
400°C. The extent of reduction calculated for the Co(MED)/ZnO catalyst was 72.4%, lower
than 91.4% obtained over the base case Co/ZnO catalyst. As was the case with SiOz, the

Chapter 3 -Results 109
presence of MED has lowered the extent of reduction of the supported cobalt. The decrease
results from the strong field ligand effect of MED on Co2+ ions that lowered the ease of
reducibility of the Co2+.
For Co(MED)/MnO, the extent of reduction was calculated to be 46.7% and is shown in
Table 3.14. The extent of reduction increased from 28.7% to 46.7% with the addition of
MED to the impregnation solution. Figure 3.28 (C) shows the TPR spectra for the 'calcined'
and 'reduced' catalysts. The 'calcined' catalyst consisted of a single broad band of reduction
with a maximum consumption taking place at 430°C, with a high temperature shoulder on the
main consumption peak. The 'reduced' Co(MED)/MnO catalyst had two regions of
reduction. The first region showed evidence of surface reoxidation of exposed zerovalent
cobalt to Co30 4 as the reduction profile comprised two regions of reduction, a main section
and a low temperature shoulder. Reoxidation to the Co30 4 form may occur as a result of the
ease with which MnO can alter oxidation states. In this way, the support may be able to aid
oxidation by supplying lattice oxygen while undergoing a change in oxidation state itself. The
second region was a broad flat reduction profile occurring above 500°C. The hydrogen
consumption associated with this peak gave information on the fraction of cobalt present in
inactive form following activation of the catalyst by reduction at 400°C. This region may
result from cobalt still bound to MED in the Co2+ form. This information allowed calculation
of the extent of reduction of the cobalt on the MnO support. The increased extent of reduction
obtained using MED was attributed to the strength with which the MED chelates with the
Co2+ ions. In so doing, cobalt is restricted from interacting with the MnO support and support
oxidation decreases as well. As MnO was seen to shift oxidation states easily, it is favourable
to prevent this oxidation as the oxidised support may be able to supply lattice oxygen that
results in oxidation of the supported cobalt which may enhance cobalt support interaction.
3.2.3.2 Hydrogen Chemisorption
Table 3.15 contains the results obtained from the hydrogen chemisorption measurements
performed on the Co(MED)/Si02, Co(MED)/ZnO and Co(MED)/MnO cobalt nitrate loaded
catalysts. The Co(MED)/MnO catalyst gave the highest surface area of 0.86 m2/g compared
to 0.44 m2/g and 0.17 m2/g for the ZnO and Si02 supported catalysts. Consequently . the
addition of MED to the impregnation solution caused large changes in the quantity of
exposed metal on the support surface for all three support types.
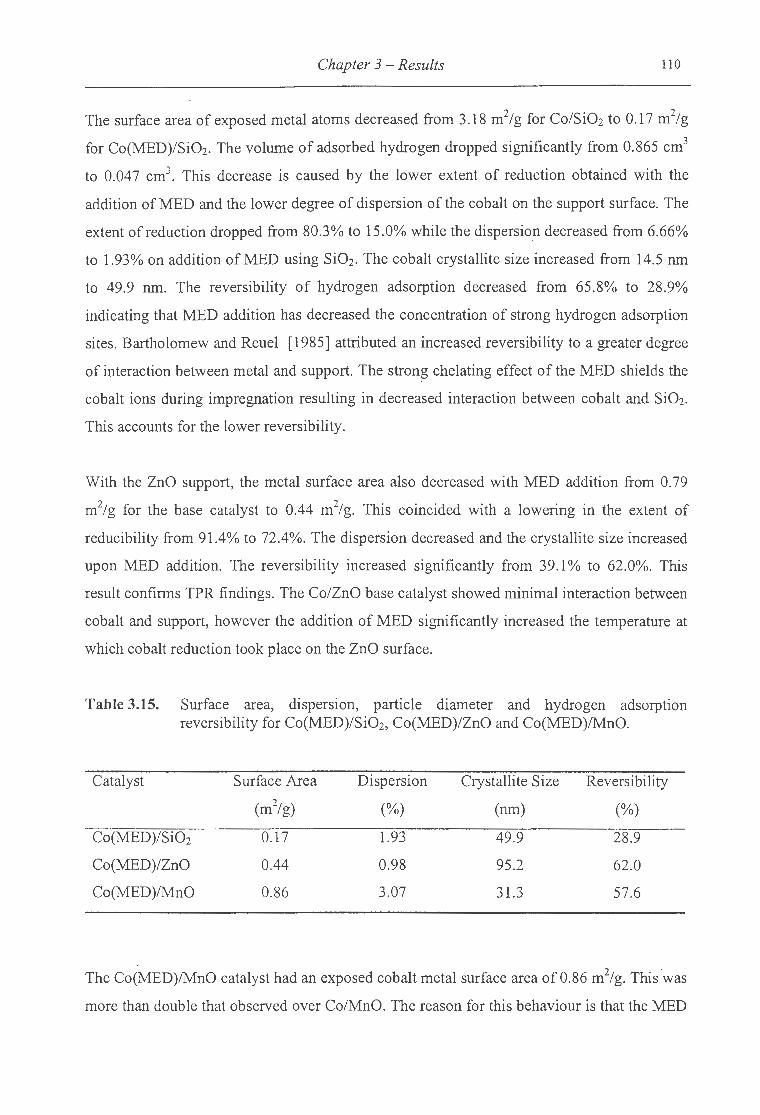
Chapter 3 -Results 110
The surface area of exposed metal atoms decreased from 3.18 m2/g for Co/Si02 to 0.17 m2/g
for Co(MED)/Si02. The volume of adsorbed hydrogen dropped significantly from 0.865 cm3
to 0.047 cm3. This decrease is caused by the lower extent of reduction obtained with the
addition of MED and the lower degree of dispersion of the cobalt on the support surface. The
extent of reduction dropped from 80.3% to 15.0% while the dispersion decreased from 6.66%
to 1:93% on addition ofMED using Si02. The cobalt crystallite size increased from 14.5 nm
to 49.9 nm. The reversibility of hydrogen adsorption decreased from 65.8% to 28.9%
indicating that MED addition has decreased the concentration of strong hydrogen adsorption
sites. Bartholomew and Reuel [1985] attributed an increased reversibility to a greater degree
of interaction between metal and support. The strong chelating effect of the MED shields the
cobalt ions during impregnation resulting in decreased interaction between cobalt and Si02.
This accounts for the lower reversibility.
With the ZnO support, the metal surface area also decreased with MED addition from 0. 79
m2/g for the base catalyst to 0.44 m2/g. This coincided with a lowering in the extent of
reducibility from 91.4% to 72.4%. The dispersion decreased and the crystallite size increased
upon MED addition. The reversibility increased significantly from 39.1% to 62.0%. This
result confirms TPR findings . The Co/ZnO base catalyst showed minimal interaction between
cobalt and support, however the addition of MED significantly increased the temperature at
which cobalt reduction took place on the ZnO surface.
Table 3.15. Surface area, dispersion, particle diameter and hydrogen adsorption reversibility for Co(MED)/Si02, Co(MED)/ZnO and Co(MED)!MnO.
Catalyst Surface Area Dispersion Crystallite Size Reversibility
(m2/g) (%) (nm) (%)
Co(MED)/Si02 0.17 1.93 49.9 28.9
Co(MED)/ZnO 0.44 0.98 95.2 62.0
Co(MED)/MnO 0.86 3.07 31.3 57.6
The Co(MED)!MnO catalyst had an exposed cobalt metal surface area of 0.86 m2/g. This ·was
more than double that observed over Co/MnO. The reason for this behaviour is that the MED

Chapter 3 - Results 11 1
is a strong field ligand that replaces the water ligands that surround the cobalt ions in aqueous
impregnations. The MnO support was seen to oxidise readily due to the presence of the
nitrate precursor, however the presence of MED protects the cobalt ions from the oxidising
strength of the N02 gas released during nitrate decomposition. In this way, the cobalt ions
interact to a lesser extent with the support resulting in a higher extent of reduction. The extent
of reduction was seen to increase from 28.7% to 46.7% following MED addition. The
reversibility ofhydrogen adsorption increased from 47.6% to 57.6% through MED addition.
3.2.3.3 Transmission Electron Microscopy
The TEM photographs for Co(MED)/Si02, Co(MED)/ZnO and Co(MED)/MnO are shown in
Figure 3.29 (A), (B) and (C) respectively. The photograph for Co(MED)/Si02 shows little
evidence of reduced cobalt crystallites. The amorphous Si02 does show small areas that are
darker, possibly a result of a small amount of reduced cobalt. The Co(MED)/Si02 catalyst
was calculated to have a very low exposed metal surface area of0.17 m2/g as opposed to 3.18
m2/g for Co/Si02• This drop in surface area means less cobalt present as reduced cobalt metal
as observed.
A B c
Figure 3.29. TEM photographs for (A) Co(MED)/Si02, (B) Co(MED)/ZnO and Co(MED)/MnO.
Chapter 3 -Results 112
The Co(MED)/ZnO photograph is shown in Figure 3.29 (B). The notable feature is that a
significantly larger fraction of the cobalt is supported on the ZnO support, in contrast with
both Co/ZnO and Co(A).ZnO, where cobalt oxide particles existed independent of the
support material. Consequently the MED has brought about an association between cobalt
and the support material. This is beneficial as dispersion of the cobalt will be improved and
the cobalt crystallites will be smaller.
The presence of MED in the impregnation solution resulted in the Co(MED)/MnO catalyst
illustrated in Figure-3.29 (C). The photograph was inconclusive as to the nature of the cobalt
crystallites or their association with the MnO support. However black spots are evident,
possibly indicating the presence of the cobalt, as no support oxidation was noted during
nitrate decomposition during TPR for this catalyst.
3.2.3.4 Fischer-Tropsch Synthesis
The effect of MED on the preparation of the catalysts was tested under Fischer-Tropsch
conditions in order to obtain activity and selectivity data necessary for performance
characterisation. The activity was measured in terms of the hydrocarbon yields obtained from
the gas chromatograph analysis of the organic products. The organic yield was calculated
according to the procedure laid out in Appendix III.
3.2.3.4.1 Si02 as a Support
Addition ofMED to the impregnation solution resulted in a major change in both the activity
and selectivity ofthe Si02 supported catalyst as illustrated in Table 3.16. The MED prepared
catalyst, Co(MED)/Si02, was significantly less active than the water prepared catalyst,
Co/Si02. The yield of organic product for the Co(MED)/Si02 catalyst was 1.20% as opposed
to 5.67% for the Co/Si02 catalyst. This represented a drop in activity of nearly 500%. This
lower yield is attributable to a decrease in exposed cobalt metal surface area from 3.18 m2/g
for Co/Si02 to 0.17 m2/g for Co(MED)/Si02 measured by hydrogen chemisorption. It is
interesting to note that the rate of consumption of carbon monoxide per square metre of
exposed cobalt increased dramatically from 4.12x10⁻³ mmollm2c0/min to 15.33x10⁻³
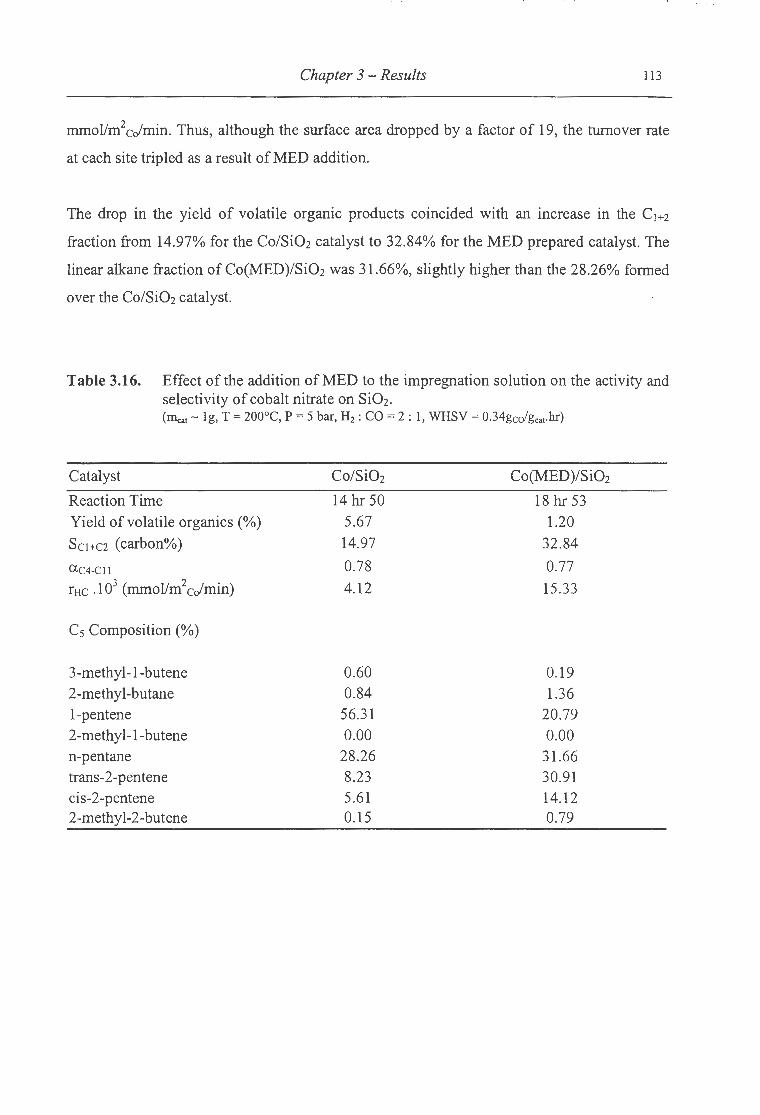
' ' ' a. I ~ , I
Chapter 3 -Results 113
mmollm2cofmin. Thus, although the surface area dropped by a factor of 19, the turnover rate
at each site tripled as a result ofMED addition.
The drop in the yield of volatile organic products coincided with an increase in the C1+2
fraction from 14.97% for the Co/Si02 catalyst to 32.84% for the MED prepared catalyst. The
linear alkane fraction of Co(MED)/Si02 was 31.66%, slightly higher than the 28.26% formed
over the Co/Si02 catalyst.
Table 3.16. Effect of the addition ofMED to the impregnation solution on the activity and selectivity of cobalt nitrate on Si02. (Il\:at- 1g, T = 200°C, P = 5 bar, H2 : CO= 2: 1, WHSV = 0.34gcdgca1.hr)
Catalyst Co/Si02 Co(MED)/Si02
Reaction Time 14 hr 50 18 hr 53 Yield of volatile organics(%) 5.67 1.20
Sc1+e2 (carbon%) 14.97 32.84
ac4-CII 0.78 0.77
rHc .103 (mmollm2cc/min) 4.12 15.33
C5 Composition(%)
3-methyl-1-butene 0.60 0.19 2-methyl-butane 0.84 1.36 1-pentene 56.31 20.79 2-methyl-1-butene 0.00 0.00 n-pentane 28.26 31.66 trans-2-pentene 8.23 30.91 cis-2-pentene 5.61 14.12 2-methyl-2-butene 0.15 0.79
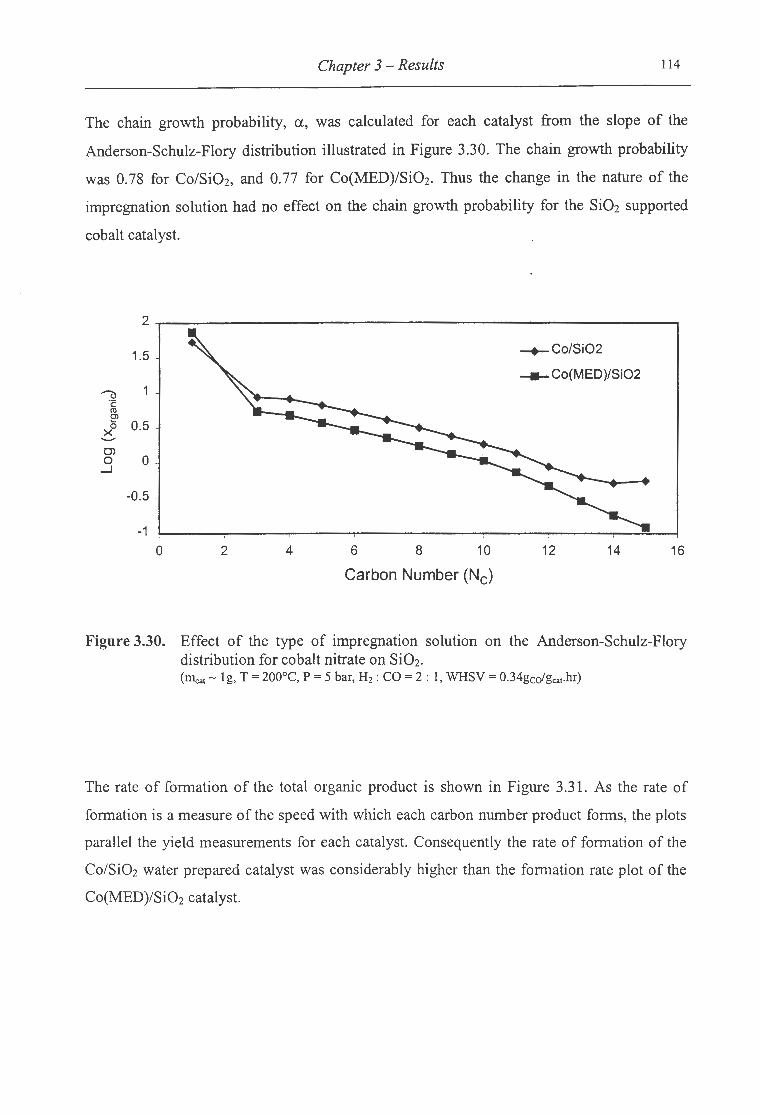
Chapter 3 - Results 114
The chain growth probability, a, was calculated for each catalyst from the slope of the
Anderson-Schulz-Flory distribution illustrated in Figure 3.30. The chain growth probability
was 0. 78 for Co/Si02, and 0. 77 for Co(MED)/Si02. Thus the change in the nature of the
impregnation solution had no effect on the chain growth probability for the Si02 supported
cobalt catalyst.
2
1.5 -+-Co/Si02
- Co(MED)/Si02 '()
·c: rn e>
0.5 ~ .......... 0) 0 _J
0
-0.5 -
-1
0 2 4 6 8 10 12 14 16
Carbon Number (Nc)
Figure 3.30. Effect of the type of impregnation solution on the Anderson-Schulz-Flory distribution for cobalt nitrate on Si02. (Il1ca1 - 1g, T = 200°C, P = 5 bar, H2 : CO= 2 : 1, WHSV = 0.34gco/gcar·hr)
The rate of formation of the total organic product is shown in Figure 3.31. As the rate of
formation is a measure of the speed with which each carbon number product forms, the plots
parallel the yield measurements for each catalyst. Consequently the rate of formation of the
Co/Si02 water prepared catalyst was considerably higher than the formation rate plot of the
Co(MED)/Si02 catalyst.
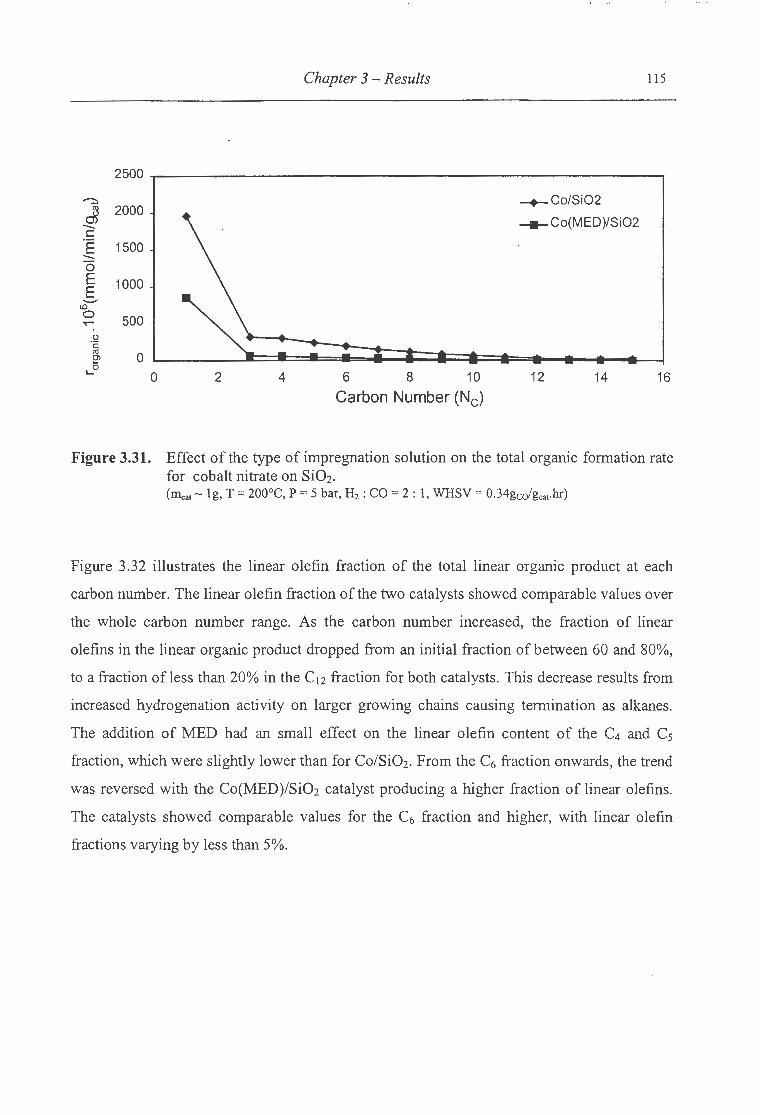
Chapter 3 -Results 115
2500
~
J 2000 -c
-+-Co/Si02
- Co(MED)/Si02 .E 1500 -0 E 1000 E ..........
<0 0 500 ...-
() ·c; ro 0 e> 0 ,_
0 2 4 6 8 10 12 14 16
Carbon Number (Nc)
Figure 3.31. Effect of the type of impregnation solution on the total organic formation rate for cobalt nitrate on Si02. (Inca1 - 1g, T = 200°C, P = 5 bar, H2: CO= 2: 1, WHSV = 0.34gcofgca,.hr)
Figure 3.32 illustrates the linear olefin fraction of the total linear organic product at each
carbon number. The linear olefin fraction of the two catalysts showed comparable values over
the whole carbon number range. As the carbon number increased, the fraction of linear
olefins in the linear organic product dropped from an initial fraction of between 60 and 80%,
to a fraction of less than 20% in the C12 fraction for both catalysts. This decrease results from
increased hydrogenation activity on larger growing chains causing termination as alkanes.
The addition of MED had an small effect on the linear olefin content of the C4 and C5
fraction, which were slightly lower than for Co/Si02. From the C6 fraction onwards, the trend
was reversed with the Co(MED)/Si02 catalyst producing a higher fraction of linear olefins.
The catalysts showed comparable values for the C6 fraction and higher, with linear olefin
fractions varying by less than 5%.
.... .......

Chapter 3 - Results 116
100
-+-Co/Si02 ........ 80 ~ 0
-Co(MED)/Si02
0 E ..._...
...... 60 c: Q) ...... c:
40 0 ()
c: t+= Q) 20 0
0 0 2 4 6 8 10 12 14
Carbon Number (Nc)
Figure 3.32. Effect of the type of impregnation solution on the olefin fraction of the linear organic product for cobalt nitrate on Si02•
(Illea1 - lg, T = 200°C, P = 5 bar, H2: CO= 2 : 1, WHSV = 0.34gcdgca1.hr)
The a.-olefin fraction of the total linear olefin fraction is shown in Figure 3.33. The addition
of MED to the impregnation solution dramatically altered the a.-olefin distribution of the
silica supported catalyst. In the C5 carbon number, the a.-olefin fraction of the total linear
olefin was 80.27%. This fraction dropped to 31.59% due to the effect of the MED during
impregnation. The formation of a.-olefins is the primary reaction during Fischer-Tropsch
synthesis, consequently the Co(MED)/SiOz catalyst greatly enhances the formation of
secondary reaction products. It is likely that the higher rate of carbon monoxide consumption
per square metre of exposed cobalt observed over Co(MED)/Si02 is responsible for the
higher secondary reaction activity, as higher secondary reaction activity generally coincides
with higher overall activity. The a.-olefin content of both catalysts was seen to decrease as the
carbon number increased, indicating that the longer hydrocarbon chains are more susceptible
to termination as hydrogenated products.
The higher secondary reaction activity over Co(MED)/Si02 may also be a result of the low
surface area of active cobalt species increasing the influence of the Si02 support. As the
cobalt surface area becomes smaller, active cobalt crystallites become smaller such that the

Chapter 3 -Results 117
surface effect is more and more noticeable. This same effect was evident for the Co(A)/Si02
catalyst. It is thought that the Si02 surface promotes the double bond shift activity of the
catalyst resulting in a higher proportion of secondary olefins in the product spectrum.
100
.......... -+-Co/Si02 ::::S! 0 80 0 - Co(MED)/Si02 E .__...
....... c 60 Q.) ....... c 0
(.) 40 c
t+= Q.)
0 20 ctl
..c 0.. <( 0
0 2 4 6 8 10 12 14
Carbon Number (Nc)
Figure 3.33. Effect of the type of impregnation solution on the a-olefin fraction of the linear olefins for cobalt nitrate on Si02. (m.,.1 - 1g, T = 200°C, P = 5 bar, H2 : CO= 2 : 1, WHSV = 0.34gcofgcat·hr)
3.2.3.4.2 ZnO as a Support
The presence of MED in the impregnation solution significantly altered the performance of
the ZnO supported cobalt catalysts under Fischer-Tropsch reaction conditions. The results
can be seen in Table 3.17. The yield of total organic products formed over Co(MED)/ZnO
was 0.93%, lower than the yield of 1.39% formed over the Co/ZnO catalyst. This findings
correlates with the decrease in exposed cobalt surface area which dropped from 0.79m2/g to
0.44 m2/g following MED addition as well as a drop in cobalt dispersion from 1.44% to
0.98%. However the turnover rate per square metre of exposed cobalt on the surface
increased from 3.82x10⁻³ mmol/m2c0/min to 4.57x10⁻³ mmol/m2cJmin. Consequently, even
though the overall yield decreased, the activity per cobalt area increased. This increased
activity per cobalt area may result in the higher secondary activity observed. Thus the
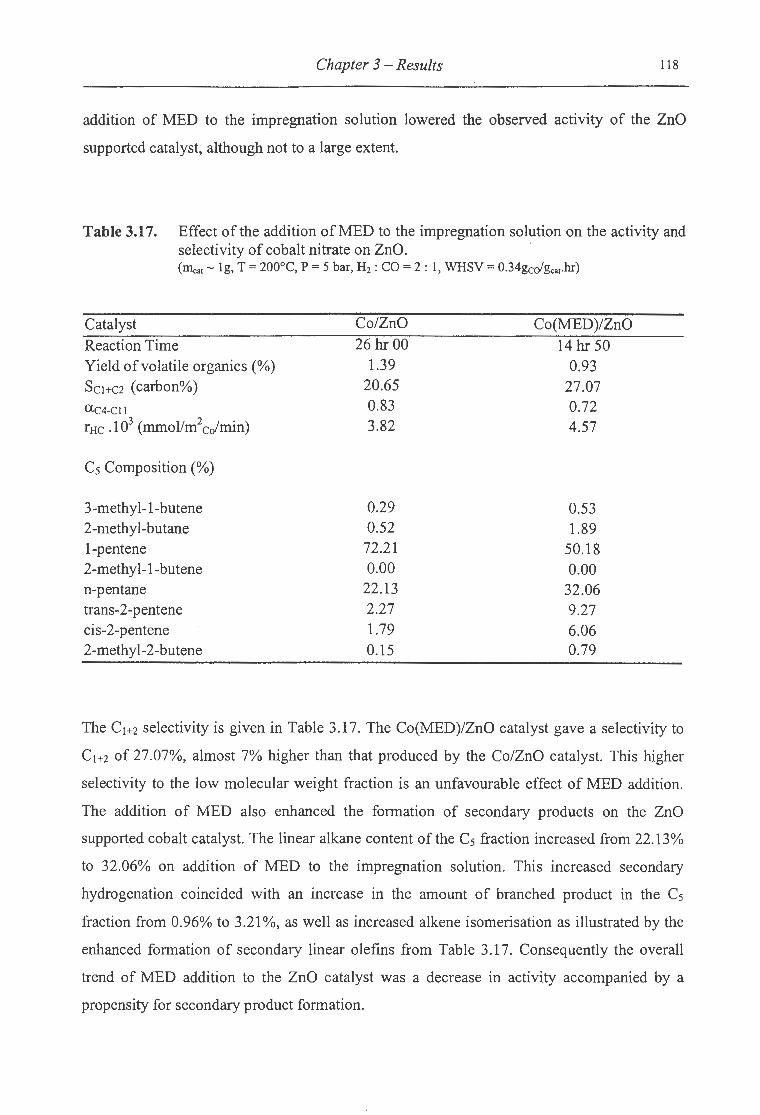
Chapter 3 -Results 118
addition of MED to the impregnation solution lowered the observed activity of the ZnO
supported catalyst, although not to a large extent.
Table 3.17. Effect of the addition of MED to the impregnation solution on the activity and selectivity of cobalt nitrate on ZnO. (Illca1 - 1g, T = 200°C, P = 5 bar, Hz: CO= 2: 1, WHSV = 0.34gcdgca1.hr)
Catalyst Co/ZnO Co(MED)/ZnO Reaction Time 26 hr 00 14 hr 50 Yield of volatile organics(%) 1.39 0.93 Sc1+e2 (carbon%) 20.65 27.07
ac4-CII 0.83 0.72 rHc .103 (mmollm2cc/min) 3.82 4.57
C5 Composition(%)
3-methyl-1-butene 0.29 0.53 2-methyl-butane 0.52 1.89 1-pentene 72.21 50.18 2-methyl-1-butene 0.00 0.00 n-pentane 22.13 32.06 trans-2-pentene 2.27 9.27 cis-2-pentene 1.79 6.06 2-methyl-2-butene 0.15 0.79
The C1+2 selectivity is given in Table 3.17. The Co(MED)/ZnO catalyst gave a selectivity to
C1+2 of 27.07%, almost 7% higher than that produced by the Co/ZnO catalyst. This higher
selectivity to the low molecular weight fraction is an unfavourable effect of MED addition.
The addition of MED also enhanced the formation of secondary products on the ZnO
supported cobalt catalyst. The linear alkane content of the C5 fraction increased from 22.13%
to 32.06% on addition of MED to the impregnation solution. This increased secondary
hydrogenation coincided with an increase in the amount of branched product in the C5
fraction from 0.96% to 3.21 %, as well as increased alkene isomerisation as illustrated by the
enhanced formation of secondary linear olefins from Table 3.17. Consequently the overall
trend of MED addition to the ZnO catalyst was a decrease in activity accompanied by a
propensity for secondary product formation.
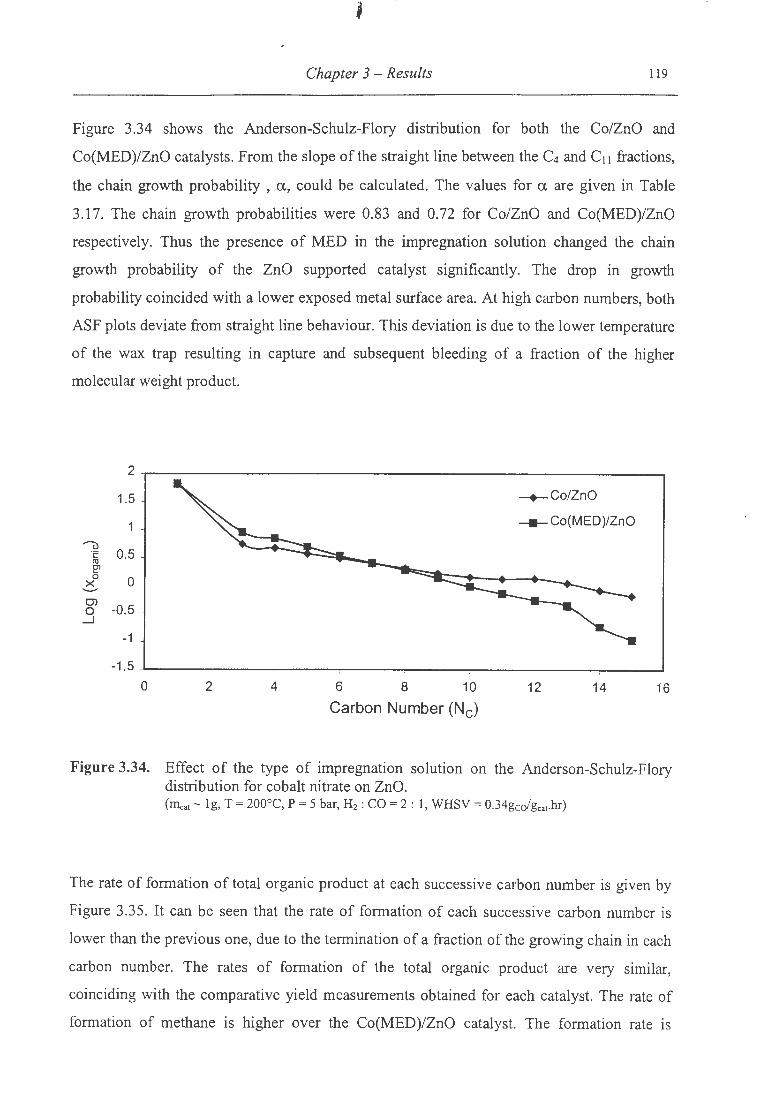
Chapter 3 -Results 119
Figure 3.34 shows the Anderson-Schulz-Flory distribution for both the Co/ZnO and
Co(MED)/ZnO catalysts. From the slope ofthe straight line between the C4 and C11 fractions,
the chain growth probability , a, could be calculated. The values for a are given in Table
3.17. The chain growth probabilities were 0.83 and 0.72 for Co/ZnO and Co(MED)/ZnO
respectively. Thus the presence of MED in the impregnation solution changed the chain
growth probability of the ZnO supported catalyst significantly. The drop in growth
probability coincided with a lower exposed metal surface area. At high carbon numbers, both
ASF plots deviate from straight line behaviour. This deviation is due to the lower temperature
of the wax trap resulting in capture and subsequent bleeding of a fraction of the higher
molecular weight product.
2
1.5 --+-Co/ZnO
--- Co(MED)/ZnO
"() 0.5 ·;::
Cll El 0 0 X ,__..
0> -0.5 0
_j
-1
-1 .5
0 2 4 6 8 10 12 14 16
Carbon Number (Nc)
Figure 3.34. Effect of the type of impregnation solution on the Anderson-Schulz-Flory distribution for cobalt nitrate on ZnO. (Il\:ar- 1g, T = 200°C, P = 5 bar, H2 : CO= 2: 1, WHSV = 0.34gcdgcar-hr)
The rate of formation of total organic product at each successive carbon number is given by
Figure 3.35. It can be seen that the rate of formation of each successive carbon number is
lower than the previous one, due to the termination of a fraction of the growing chain in each
carbon number. The rates of formation of the total organic product are very similar,
coinciding with the comparative yield measurements obtained for each catalyst. The rate of
formation of methane is higher over the Co(MED)/ZnO catalyst. The formation rate is
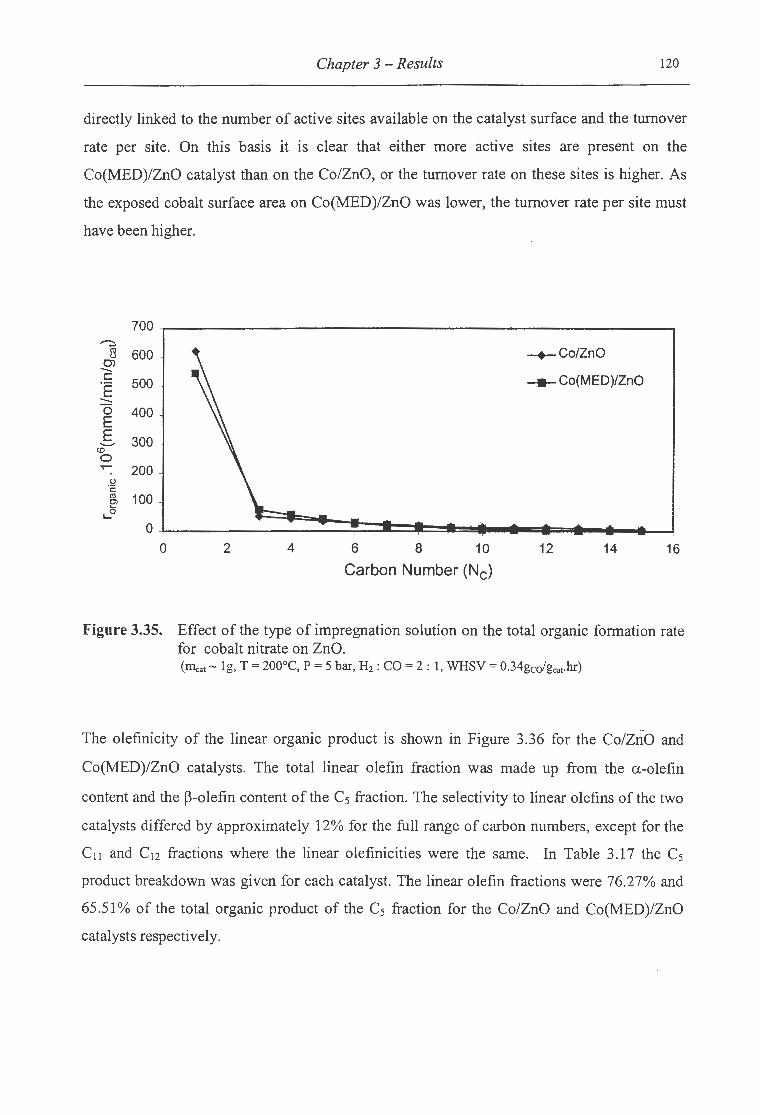
Chapter 3 - Results 120
directly linked to the number of active sites available on the catalyst surface and the turnover
rate per site. On this basis it is clear that either more active sites are present on the
Co(MED)/ZnO catalyst than on the Co/ZnO, or the turnover rate on these sites is higher. As
the exposed cobalt surface area on Co(MED)/ZnO was lower, the turnover rate per site must
have been higher.
700 ~
~ 0)
600 -+-Co/ZnO -c 500 -.E - Co(MED)/ZnO -0 400
E E 300 ..........
(()
0 ...-- 200 (,) ·c: ro 100 e>
L-0
0
0 2 4 6 8 10 12 14 16
Carbon Number (Nc)
Figure 3.35. Effect of the type of impregnation solution on the total organic formation rate for cobalt nitrate on ZnO. (111cat- 1g, T = 200°C, P = 5 bar, H2: CO= 2: 1, WHSV = 0.34gcchcat·hr)
The olefinicity of the linear organic product is shown in Figure 3.36 for the Co/ZnO and
Co(MED)/ZnO catalysts. The total linear olefin fraction was made up from the a-olefin
content and the ~-olefin content of the C5 fraction. The selectivity to linear olefins of the two
catalysts differed by approximately 12% for the full range of carbon numbers, except for the
C11 and C12 fractions where the linear olefinicities were the same. In Table 3.17 the C5
product breakdown was given for each catalyst. The linear olefin fractions were 76.27% and
65 .51% of the total organic product of the C5 fraction for the Co/ZnO and Co(MED)/ZnO
catalysts respectively.

Chapter 3 - Results 121
100
-~ 80 0
0 E
--+-Co/ZnO
- Co(MED)/ZnO .......... ...... 60 c Q) ...... c 0 40 u c
;,;:: 20 -Q)
0
0 ' 0 2 4 6 8 10 12 14
Carbon Number (Nc)
Figure 3.36. Effect of the type of impregnation solution on the olefin fraction of the linear organic product for cobalt nitrate on ZnO. (IDa.1 - 1g, T = 200°C, P = 5 bar, H2 : CO= 2: 1, WHSV = 0.34gcofgmhr)
Table 3.17 shows the breakdown of the total linear olefin content of the C5 fraction for
Co/ZnO and Co(MED/ZnO respectively. The total linear olefin content is split up between
the a-olefin and the ~-olefin content. The ~-olefin fraction is made up of the cis and trans 2-
pentene products. The a-olefin fraction of the linear olefins is illustrated in Figure 3.37 for
Co/ZnO and Co(MED)/ZnO. The a-olefin fraction of the total organic product was 50.18%
for the Co(MED)/ZnO catalyst, and 72.21% for the Co/ZnO catalyst. This meant that the a
olefin made up 76.60% and 94.68% of the linear olefin product over Co(MED)/ZnO and
Co/ZnO respectively. The a-olefinicity of the linear olefin product formed over the Co/ZnO
catalyst is consequently far higher than for the Co(MED)/ZnO catalyst for the complete
carbon number range. The largest difference in the a-olefin fraction of the total linear olefin
product occurs in the C9 fraction where the difference is approximately 47%. The difference
in the overall linear olefin fraction of the linear organic product for the two catalysts was only
12% for the same carbon number range. This indicates that the presence of MED in the
impregnation solution alters the catalyst's behaviour resulting in an increased rate of
secondary reaction resulting in product richer in branched and secondary olefin products and
a lower yield of primary a-olefins. This result follows from the higher turnover rate per
exposed cobalt surface area. The ~-linear olefin content of the C5 fraction increased from
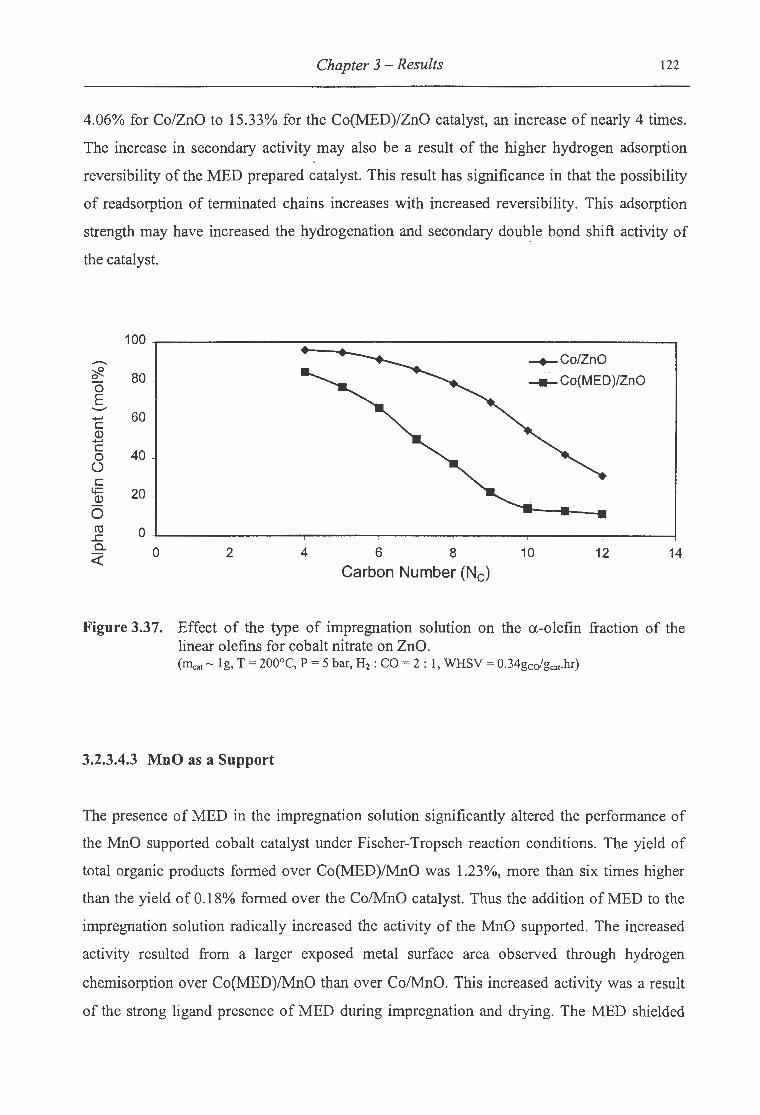
Chapter 3 - Results 122
4.06% for Co/ZnO to 15.33% for the Co(MED)/ZnO catalyst, an increase of nearly 4 times.
The increase in secondary activity may also be a result of the higher hydrogen adsorption
reversibility of the MED prepared catalyst. This result has significance in that the possibility
of readsorption of terminated chains increases with increased reversibility. This adsorption
strength may have increased the hydrogenation and secondary double bond shift activity of
the catalyst.
100
- -+-Co/ZnO
- Co(MED)/ZnO ~ 80 0
0 E ......... .... c 60 Q) .... c
40 0 0 c
t+= 20 Q)
0 rn 0 .c a. 0 2 <:{
4 6 8 Carbon Number (Nc)
10 12 14
Figure 3.37. Effect of the type of impregnation solution on the a-olefin fraction of the linear olefins for cobalt nitrate on ZnO. (m.:at- 1g, T = 200°C, P = 5 bar, H2: CO= 2: 1, WHSV = 0.34gcchcat·hr)
3.2.3.4.3 MnO as a Support
The presence of MED in the impregnation solution significantly altered the performance of
the MnO supported cobalt catalyst under Fischer-Tropsch reaction conditions. The yield of
total organic products formed over Co(MED)/MnO was 1.23%, more than six times higher
than the yield of 0.18% formed over the Co/MnO catalyst. Thus the addition of MED to the
impregnation solution radically increased the activity of the MnO supported. The increased
activity resulted from a larger exposed metal surface area observed through hydrogen
chemisorption over Co(MED)/MnO than over Co/MnO. This increased activity was a result
of the strong ligand presence of MED during impregnation and drying. The MED shielded

••• ' '"'· I • '
Chapter 3 - Results 123
the cobalt during nitrate decomposition lowering the oxidising effect of the MnO support on
the reduced cobalt. The C1+2 selectivity is given in Table 3.18. The Co(MED)/ZnO catalyst
gave a selectivity to C1+2 of 25.13%, about 2% lower than that produced by the Co/ZnO
catalyst. The addition of MED enhanced the formation of the a-olefin fraction from 50.60%
of the total organic yield to 66.33%. This increase coincided with an increase in the rate of
carbon monoxide consumption per exposed cobalt surface area from 1.13x 10"3
mmol/m2cJmin to 3.05x10⁻³ mmol/m2cJmin. This is surprising, as higher activity generally
results in greater secondary reaction activity. The presence of MED decreased both the
hydrogenation activity, as represented by the n-paraffin fraction, as well the secondary
isomerisation of the a-olefin, as represented by the linear ~-olefin fraction. The alkane
content of the C5 fraction decreased from 30.09% to 24.52% of the total organic product on
addition of MED to the impregnation solution. The branched product content was unaffected
by the presence of MED with Co/MnO containing 2.82% branched products and
Co(MED)/MnO containing 2.99% branched products.
Table 3.18. Effect of the addition ofMED to the impregnation solution on the activity and selectivity of cobalt nitrate on MnO. (Illcat- lg, T = 200°C, P = 5 bar, H2 : CO= 2 : 1, WHSV = 0.34gcofgcat·hr)
Catalyst Co!MnO Co(MED)/MnO Reaction Time 22 hr 30 23 hr 46 Yield of volatile organics(%) 0.18 1.23
Scl+C2 (carbon%) 27.52 25.13
ac4-Cll 0.76 0.71 rHc .1 03 (mmol/m2 cJmin) 1.13 3.05
C5 Composition(%)
3-methyl-1-butene 0.80 1.48 2-methyl-butane 1.87 1.38 1-pentene 50.60 66.33 2-methyl-1-butene 0.00 0.00 n-pentane 30.09 24.52 trans-2-pentene 9.76 3.73 cis-2-pentene 6.21 2.43 2-methyl-2-butene 0.15 0.13
' • • • I ~ '• •
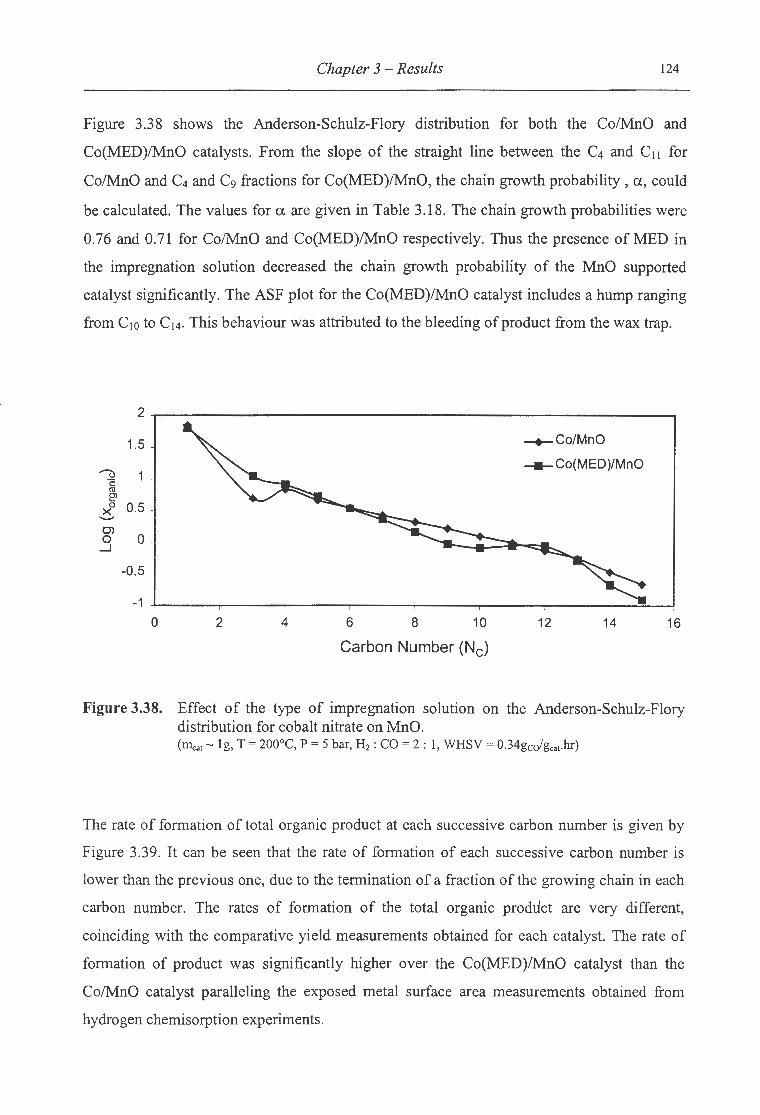
Chapter 3 - Results 124
Figure 3.38 shows the Anderson-Schulz-Flory distribution for both the Co/MnO and
Co(MED)/MnO catalysts. From the slope of the straight line between the C4 and C11 for
Co/MnO and C4 and C9 fractions for Co(MED)/MnO, the chain growth probability , a, could
be calculated. The values for a are given in Table 3.18. The chain growth probabilities were
0.76 and 0.71 for Co/MnO and Co(MED)/MnO respectively. Thus the presence of MEDin
the impregnation solution decreased the chain growth probability of the MnO supported
catalyst significantly. The ASF plot for the Co(MED)/MnO catalyst includes a hump ranging
from C10 to C14• This behaviour was attributed to the bleeding of product from the wax trap.
2
1.5 -+-Co/MnO
'"'"""() -Co(MED)/MnO
·c: ro e> 0 0.5 X .........
0) 0 0
.....1
-0.5
-1
0 2 4 6 8 10 12 14 16
Carbon Number (Nc)
Figure 3.38. Effect of the type of impregnation solution on the Anderson-Schulz-Flory distribution for cobalt nitrate on MnO. (11\:at - 1g, T = 200°C, P = 5 bar, H2 : CO= 2 : 1, WHSV = 0.34gcdgcat·hr)
The rate of formation of total organic product at each successive carbon number is given by
Figure 3.39. It can be seen that the rate of formation of each successive carbon number is
lower than the previous one, due to the termination of a fraction of the growing chain in each
carbon number. The rates of formation of the total organic product are very different,
coinciding with the comparative yield measurements obtained for each catalyst. The rate of
formation of product was significantly higher over the Co(MED)/MnO catalyst than the
Co/MnO catalyst paralleling the exposed metal surface area measurements obtained from
hydrogen chemisorption experiments.

Chapter 3 -Results 125
700 "'"':::> ~ 600 en
-+-Co/MnO -c 500 E
~ Co(MED)/MnO
-0 400 E E 300 .........
CD 0 200 ...-
{)
100 ·c: ro !? 0 0 ,_
0 2 4 6 8 10 12 14 16
Carbon Number (Nc)
Figure 3.39. Effect of the type of impregnation solution on the total organic formation rate for cobalt nitrate on MnO. (111ca1 - 1g, T = 200°C, P = 5 bar, H2 : CO= 2: 1, WHSV = 0.34gcdgcat·hr)
The olefinicity of the linear organic product is shown in Figure 3.40 for the Co/MnO and
Co(MED)/MnO catalysts. The total linear olefin fraction was made up from the a-olefin
content and the P-olefin content of the C5 fraction. The selectivity of linear olefins in the total
linear product for the two catalysts differed by varying degrees over the range of carbon
numbers. The olefinicity of the Co(MED)/MnO catalyst was continually higher than that of
the Co/MnO catalyst. At low carbon numbers (C4 and C5) and high carbon numbers (C 11 and
C12), the difference in olefinicity of the linear product was within 6% for the two catalysts.
However in the middle carbon number range, the olefinicities of the two catalysts showed a
sizeable difference. The greatest difference of 18% occurred in the C8 fraction. In Table 3.18
the Cs product breakdown was given for each catalyst. The linear olefin fractions were
66.57% and 72.49% for the Co/MnO and Co(MED)/MnO catalysts respectively.
. . ~ . ·'
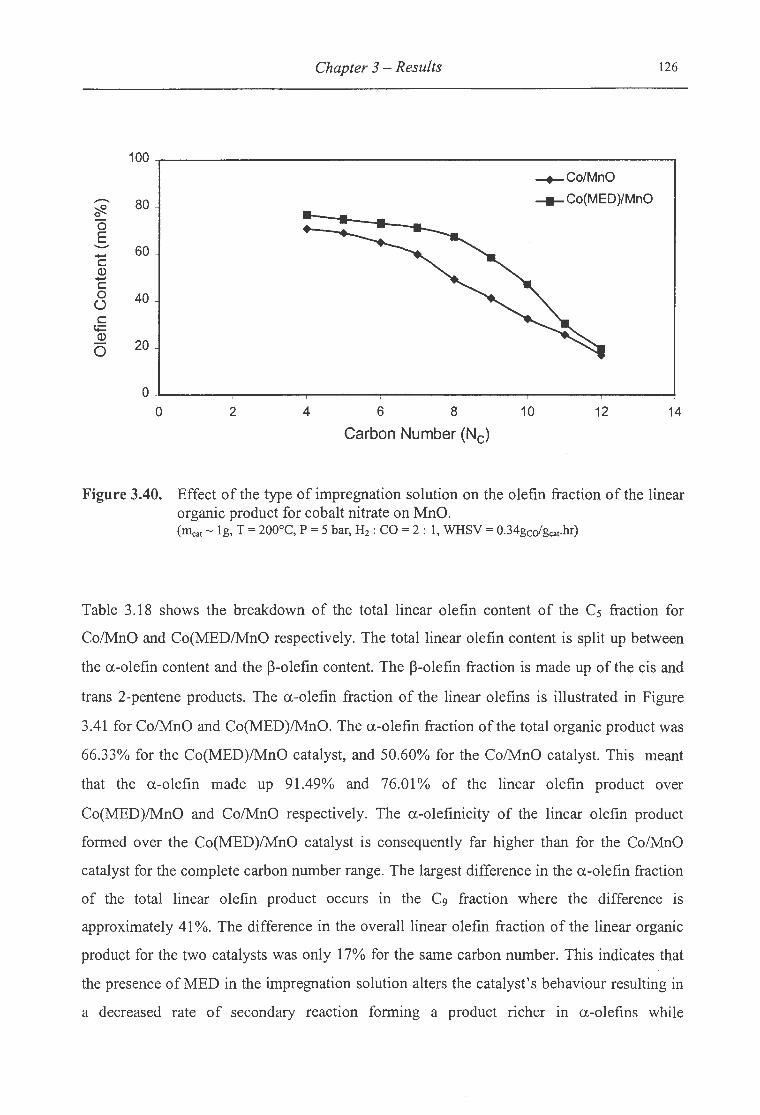
Chapter 3 -Results 126
100 -+-Co/MnO
......... 80 - Co(MED)/MnO ~ 0
0 E - 60 -c Q) -c 0 40 (.)
c t;:::: Q)
20 0
0 -, 0 2 4 6 8 10 12 14
Carbon Number (Nc)
Figure 3.40. Effect of the type of impregnation solution on the olefin fraction of the linear organic product for cobalt nitrate on MnO. (Illcat- 1g, T = 200°C, P = 5 bar, H2 : CO= 2 : 1, WHSV = 0.34gcofgcat·hr)
Table 3.18 shows the breakdown of the total linear olefin content of the C5 fraction for
Co/MnO and Co(MED!MnO respectively. The total linear olefin content is split up between
the a-olefin content and the P-olefin content. The P-olefin fraction is made up of the cis and
trans 2-pentene products. The a-olefin fraction of the linear olefins is illustrated in Figure
3.41 for Co/MnO and Co(MED)/MnO. The a-olefin fraction of the total organic product was
66.33% for the Co(MED)/MnO catalyst, and 50.60% for the Co/MnO catalyst. This meant
that the a-olefin made up 91.49% and 76.01% of the linear olefin product over
Co(MED)/MnO and Co/MnO respectively. The a-olefinicity of the linear olefin product
formed over the Co(MED)/MnO catalyst is consequently far higher than for the Co/MnO
catalyst for the complete carbon number range. The largest difference in the a-olefin fraction
of the total linear olefin product occurs in the c9 fraction where the difference is
approximately 41%. The difference in the overall linear olefin fraction of the linear organic
product for the two catalysts was only 17% for the same carbon number. This indicates that
the presence of MED in the impregnation solution alters the catalyst's behaviour resulting in
a decreased rate of secondary reaction forming a product richer in a-olefins while

Chapter 3 -Results 127
suppressing secondary isomerisation and hydrogenation reactions. The P-linear olefin content
of the C5 fraction decreased from 15.97% for Co/MnO to 6.16% for the Co(MED)/MnO
catalyst.
100 .......... ~ 0 --+-Co/MnO 0 80 E -Co(MED)/MnO
.......... .... c: Q) 60 .... c: 0 ()
c: 40 '<= Q)
0 co 20
..c: 0.. <(
0 0 2 4 6 8 10 12 14
Carbon Number (Nc)
Figure 3.41. Effect of the type of impregnation solution on the a-olefin fraction of the linear olefins for cobalt nitrate on MnO. (Illcat ~ 1g, T = 200°C, P = 5 bar, H2: CO= 2: 1, WHSV = 0.34gcolgcat·hr)
3.2.4 Effect of the pH of Impregnation Solution
The pH of the impregnation solution is known to influence the net surface charge of
inorganic oxides. By altering the pH of the solution, the surface charge can be adjusted to a
net positive, neutral or negative value. It is important to stress that a positive net surface
charge results from a surplus of positive charge, and not an absence of negative charge.
Figure 3.1 shows a plot of surface charge measured in millivolts as a function of pH. As the
charge on the support surface changes, the electronic interaction with the positively charged
cobalt ions in the impregnation solution changes. The more positive the surface charge, the
stronger is the repulsion expected between surface and metal, and the more negative the
surface the greater the attraction will be. At low pH's when the solution is strongly acidic, the
surface charge is positive. At a certain point or pH range for each support, the surface
Chapter 3 - Results 128
experiences a net surface charge of zero. This is called the point of zero charge, or isoelectric
point. At pH's above this point the surface bears a net negative charge.
In order to obtain a catalyst that is easily reducible, it is necessary to inhibit attraction
between the support and the cobalt ions. On the contrary however, the stronger the metal
support interaction, the lower the cobalt agglomeration will be yielding a more dispersed
active metal which is also highly favourable. Thus a trade-off exists. Improved reducibility
can be achieved by lowering the pH to promote an electronic repulsion between support and
the cobalt ions. Thus the effect of the pH of the impregnation solution was investigated by
adding the appropriate acid so as not in introduce extra ionic species. The pH of the cobalt
nitrate impregnation solution was adjusted with concentrated nitric acid, while the pH of the
cobalt acetate impregnation solution was altered with glacial acetic acid.
3.2.4.1 Temperature Programmed Reduction
The reduction behaviour of the catalysts was determined using a 5% H2 in N2 gas stream as a
reducing agent. The influence of the pH of the impregnation solution on the TPR spectra of
the catalysts was investigated. The solution pH for cobalt nitrate prepared catalysts was
adjusted using nitric acid, while the pH of the cobalt acetate prepared catalysts was adjusted
using glacial acetic acid. The TPR spectra for cobalt nitrate on Si02 and MnO following pH
adjustment are shown in Figure 3.42, and the TPR spectrum following acetic acid addition to
the Si02 supported cobalt acetate catalyst can be seen in Figure 3.43. No ZnO supported
catalyst was prepared at a lower pH for either metal precursor due to the fact that even small
amounts of acid were seen to dissolve the ZnO support making preparation unfeasible. No
MnO catalyst was prepared using cobalt acetate as the presence of glacial acetic acid was
seen to change the nature of the MnO support material.
The pH of the Si02 supported cobalt nitrate catalyst was adjusted to a pH of 1 using nitric
acid. Figure 3.42 (A) shows the effect of acid addition on the TPR spectrum of cobalt nitrate
on Si02• The addition of nitric acid to the impregnation solution had a small effect on the
TPR spectrum of cobalt nitrate on SiOz. The spectrum for Co/1/Si02 had a similar profile as
the spectrum for Co/Si02, with four bands of reduction between 1 00°C and 1 000°C. The first
Chapter 3 - Results 129
peak between 200°C and 300°C is attributed to the reduction of Co304 to CoO. The second
broad band is a result of CoO reduction to zerovalent cobalt. The two high temperature
reduction regions are due to the reduction of hydrosilicate and cobalt silicate species
respectively. The addition of nitric acid flattened the second peak associated with CoO
reduction. Another effect associated with the acid addition was the enhancement of the cobalt
silicate peak with a peak maximum at 860°C. Thus the addition of acid increased the
formation of cobalt silicates slightly at the expense of supported Co304. In terms of the
surface charge, acid addition should induce a net positive charge on the surface, lessening the
interaction between the support surface and the positively charged cobalt ions in the
impregnation solution, however the opposite was observed. A possible reason for this is that
the Si02 support may become slightly soluble in the acidic solution. In the strong acidic
medium, the surface becomes less well defined allowing incorporation of cobalt ions deep
into the Si02 support structure. This incorporation would account for the increased cobalt
silicate formation. Table 3.19 shows the hydrogen to cobalt molar ratios obtained during the
TPR runs. The total ratio was far higher for Co/Si02 at 1.346 than for the nitric acid catalyst
Coll/Si02, which gave a total ratio of 1.280. The smaller ratio indicates that more cobalt is
supported as divalent cobalt at the lower pH of impregnation.
The influence of nitric acid addition on the MnO supported cobalt nitrate prepared catalyst
can be seen in Figure 3.42 (B). The lower pH is expected to increase the ease of reducibility
of the cobalt on the support by decreasing the interaction between support and cobalt ions
during impregnation. This decreased interaction is expected due to the net positive charge of
the support at lower pH's resulting in repulsion between surface and Co2+ ions. The
Co(4)/Mn0 catalyst was impregnated at a pH of 4 following nitric acid addition to the
impregnation solution. The TPR spectra for Co/MnO and Co/4/MnO showed reduction
profiles. The reduction spectrum for Co/MnO consisted of two large peaks between 150°C
and 450°C, as well as a broad shoulder from 450°C to 820°C. Table 3.19 showed that the
total hydrogen to cobalt molar ratio increased from 3.361 to 3.684. This increase was not
isolated to one peak, but was seen to occur at every reduction step. Consequently the
hydrogen to cobalt molar ratio below 400°C increased from 1.968 to 2.226. The hydrogen
consumption during this reduction was too high to have resulted from cobalt reduction alone,
but was due in part to the reduction of the oxidised support material. The two peaks were
attributed to either the two step reduction pathway of Co30 4 to metallic cobalt, or to the

Chapter 3 -Results 130
reduction of divalent cobalt as well as reduction of the MnO support. The only way the two
peaks could result from Co30 4 reduction would be if this reduction was superimposed over
reduction of the oxidised MnO support. It is more likely that the first peak results from the
reduction of cobalt oxide, with the second peak attributable to the reduction of the MnO
support. The broad shoulder resulted from the interaction between cobalt and support, as well
as the reduction of the oxidised MnO support material.
.......... ::::> <I: ~
c 0 ~ 0.. E :J (J')
c 0 0
N
I
c 0 ~ 0.. E :J (J')
c 0 0
N
I
0.28
A 0.21
0.14 Co/1/Si02
0.07 Co/Si02
0
0 200 400 600 800 1000
Temperature CC)
0.28 -r----------------------------........ B
0.21 -
Co/4/MnO
0.14
0.07
0 +-----~~-----.-----~~---~~--------~ 0 200 400 600
Temperature CC) 800 1000
Figure 3.42. Effect of the pH of the impregnation solution on supported cobalt nitrate reducibility for (A) Co/1/SiOz and (B) Co/4/MnO. (Ineat- 0.15g, heating rate= 10°C/min, reducing gas= 60(NTP)ml/min 5% H2 in N2,)
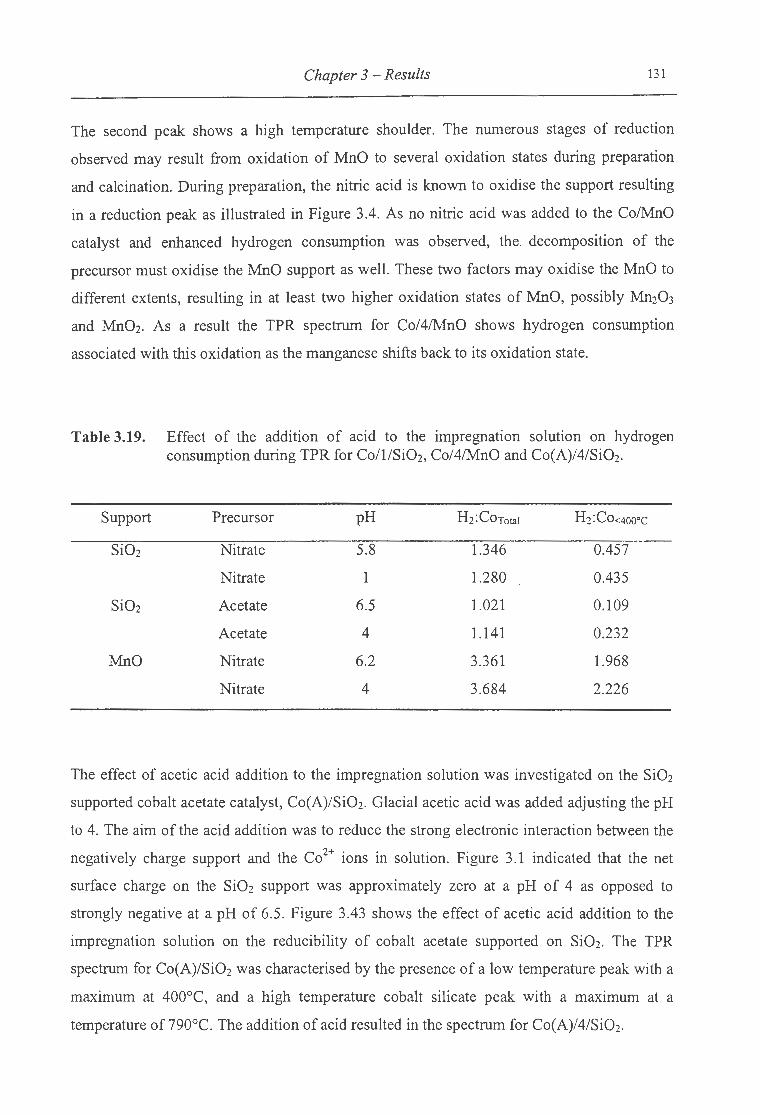
Chapter 3 - Results 131
The second peak shows a high temperature shoulder. The numerous stages of reduction
observed may result from oxidation of MnO to several oxidation states during preparation
and calcination. During preparation, the nitric acid is known to oxidise the support resulting
in a reduction peak as illustrated in Figure 3.4. As no nitric acid was added to the Co/MnO
catalyst and enhanced hydrogen consumption was observed, the. decomposition of the
precursor must oxidise the MnO support as well. These two factors may oxidise the MnO to
different extents, resulting in at least two higher oxidation states of MnO, possibly Mn20 3
and Mn02• As a result the TPR spectrum for Co/4/MnO shows hydrogen consumption
associated with this oxidation as the manganese shifts back to its oxidation state.
Table 3.19. Effect of the addition of acid to the impregnation solution on hydrogen consumption during TPR for Co/1/Si02, Co/4/MnO and Co(A)/4/Si02.
Support Precursor pH Hz:CoTotal Hz:Co<400°C
SiOz Nitrate 5.8 1.346 0.457
Nitrate 1 1.280 0.435
SiOz Acetate 6.5 1.021 0.109
Acetate 4 1.141 0.232
MnO Nitrate 6.2 3.361 1.968
Nitrate 4 3.684 2.226
The effect of acetic acid addition to the impregnation solution was investigated on the Si02
supported cobalt acetate catalyst, Co(A)/Si02. Glacial acetic acid was added adjusting the pH
to 4. The aim of the acid addition was to reduce the strong electronic interaction between the
negatively charge support and the Co2+ ions in solution. Figure 3.1 indicated that the net
surface charge on the Si02 support was approximately zero at a pH of 4 as opposed to
strongly negative at a pH of 6.5. Figure 3.43 shows the effect of acetic acid addition to the
impregnation solution on the reducibility of cobalt acetate supported on Si02 . The TPR
spectrum for Co(A)/Si02 was characterised by the presence of a low temperature peak with a
maximum at 400°C, and a high temperature cobalt silicate peak with a maximum at a
temperature of 790°C. The addition of acid resulted in the spectrum for Co(A)/4/Si02.
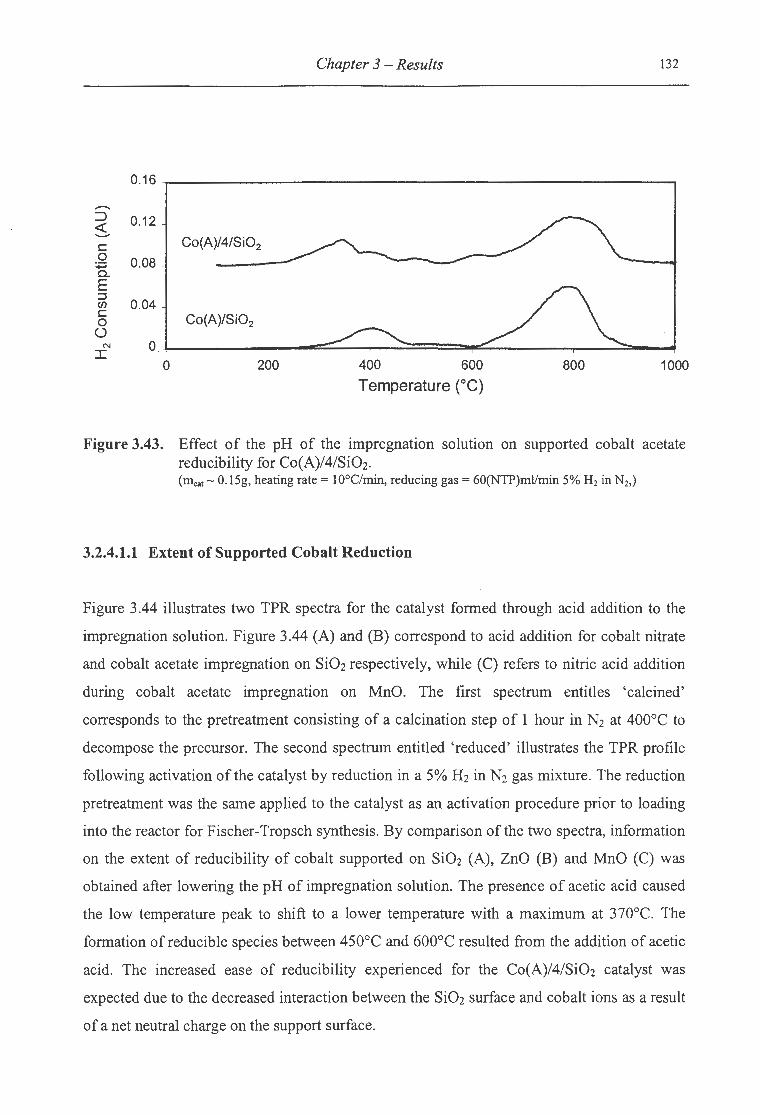
Chapter 3 - Results 132
0.16
-~ 0.12 <X: ......... Co(A)/4/Si02 c:
0 0.08 :;:::; c.. E ::l
0.04 en c: Co(A)/Si02 0 ()
N 0 I
0 200 400 600 800 1000
Temperature CC)
Figure 3.43. Effect of the pH of the impregnation solution on supported cobalt acetate reducibility for Co(A)/4/Si02. (IDeat- 0.15g, heating rate= 10°C/min, reducing gas= 60(NTP)ml/min 5% H2 in N2,)
3.2.4.1.1 Extent of Supported Cobalt Reduction
Figure 3.44 illustrates two TPR spectra for the catalyst formed through acid addition to the
impregnation solution. Figure 3.44 (A) and (B) correspond to acid addition for cobalt nitrate
and cobalt acetate impregnation on Si02 respectively, while (C) refers to nitric acid addition
during cobalt acetate impregnation on MnO. The first spectrum entitles 'calcined'
corresponds to the pretreatment consisting of a calcination step of 1 hour in N2 at 400°C to
decompose the precursor. The second spectrum entitled 'reduced' illustrates the TPR profile
following activation of the catalyst by reduction in a 5% H2 in N2 gas mixture. The reduction
pretreatment was the same applied to the catalyst as an activation procedure prior to loading
into the reactor for Fischer-Tropsch synthesis. By comparison of the two spectra, information
on the extent of reducibility of cobalt supported on Si02 (A), ZnO (B) and MnO (C) was
obtained after lowering the pH of impregnation solution. The presence of acetic acid caused
the low temperature peak to shift to a lower temperature with a maximum at 370°C. The
formation of reducible species between 450°C and 600°C resulted from the addition of acetic
acid. The increased ease of reducibility experienced for the Co(A)/4/Si02 catalyst was
expected due to the decreased interaction between the Si02 surface and cobalt ions as a result
of a net neutral charge on the support surface.
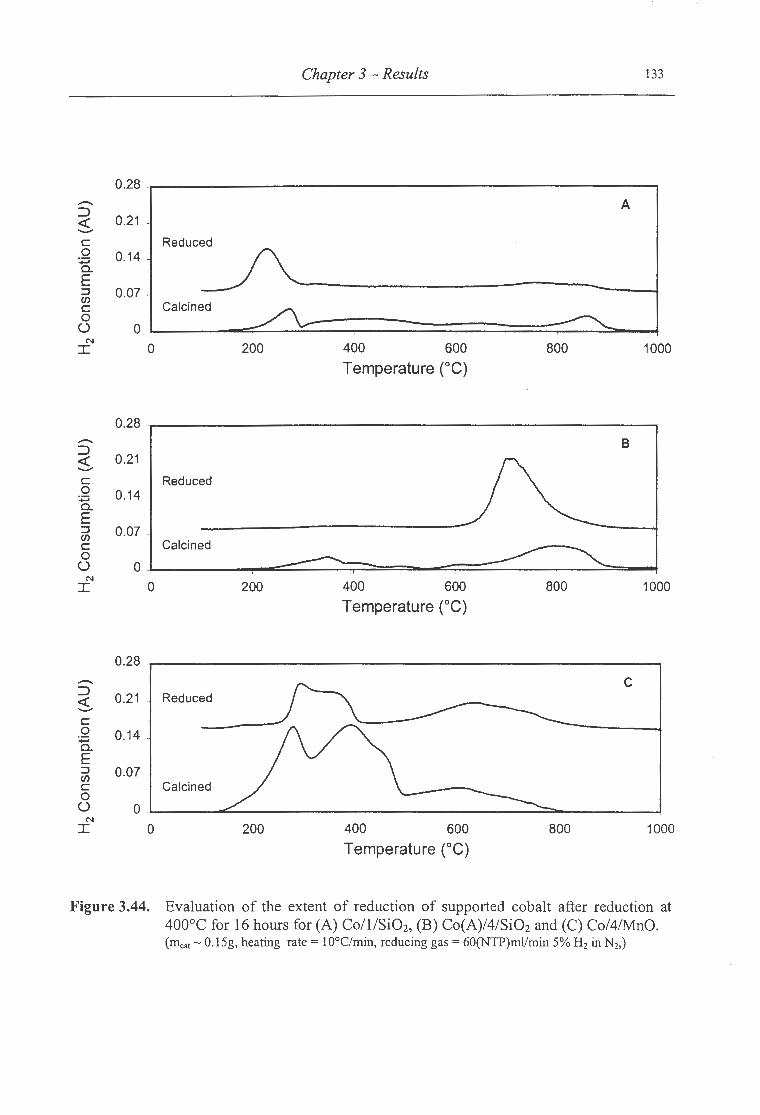
.. ~ ~- ... . . . . ~ ....
Chapter 3 - Results 133
0.28 ..--.. A ::J <( 0.21 -........ c Reduced 0 0.14 +=' 0... E ::J 0.07 IJ)
Calcined c 0
(.) 0 N
I 0 200 400 600 800 1000
Temperature (°C)
0.28 ....-... B ::J <( 0.21 ........ c Reduced 0 0.14 +=' 0... E ::J 0.07 IJ)
c Calcined 0
(.) 0 N
I 0 200 400 600 800 1000
Temperature (°C)
0.28
::J c
<( 0.21 Reduced ........ c 0 0.14 +=' 0... E ::J 0.07 -IJ) c Calcined 0
(.) 0 ' N
I 0 200 400 600 800 1000
Temperature (°C)
Figure 3.44. Evaluation of the extent of reduction of supported cobalt after reduction at 400°C for 16 hours for (A) Co/1/Si02, (B) Co(A)/4/Si02 and (C) Co/4/MnO. (Illcar- 0.15g, heating rate = l0°C/rnin, reducing gas= 60(NTP)ml/rnin 5% H2 in N2,)
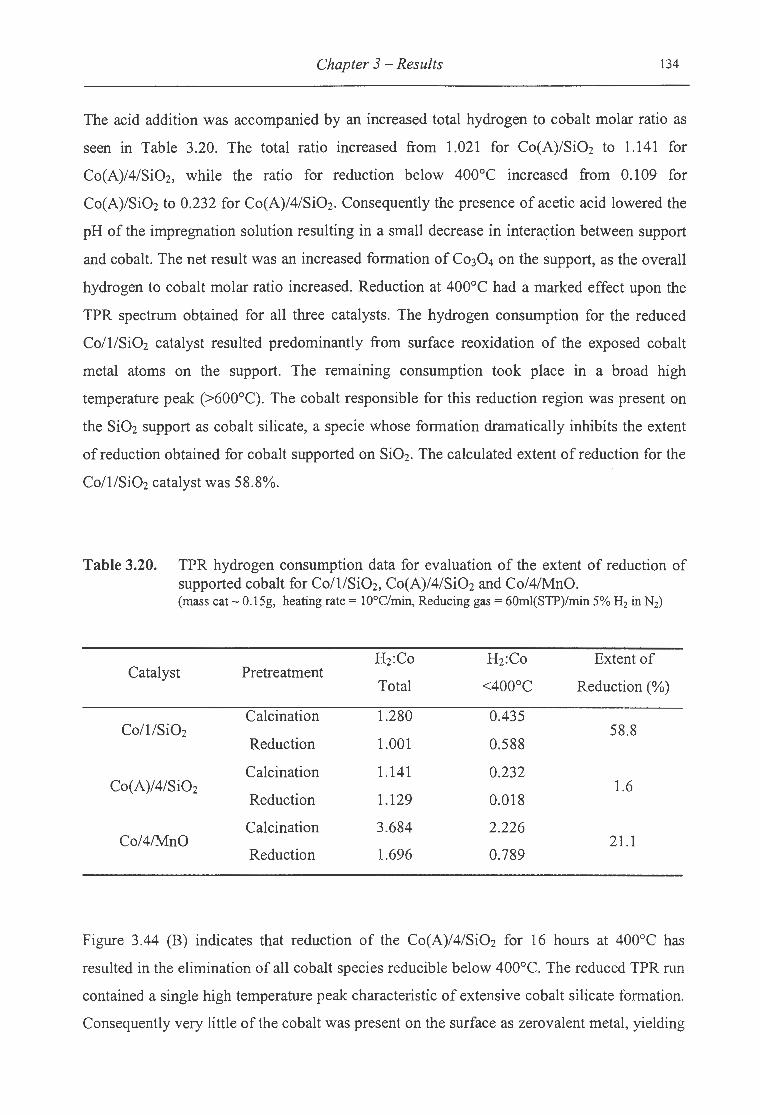
Chapter 3 - Results 134
The acid addition was accompanied by an increased total hydrogen to cobalt molar ratio as
seen in Table 3.20. The total ratio increased from 1.021 for Co(A)/SiOz to 1.141 for
Co(A)/4/Si02, while the ratio for reduction below 400°C increased from 0.109 for
Co(A)/Si02 to 0.232 for Co(A)/4/SiOz. Consequently the presence of acetic acid lowered the
pH of the impregnation solution resulting in a small decrease in intera~tion between support
and cobalt. The net result was an increased formation of Co304 on the support, as the overall
hydrogen to cobalt molar ratio increased. Reduction at 400°C had a marked effect upon the
TPR spectrum obtained for all three catalysts. The hydrogen consumption for the reduced
Co/1/Si02 catalyst resulted predominantly from surface reoxidation of the exposed cobalt
metal atoms on the support. The remaining consumption took place in a broad high
temperature peak (>600°C). The cobalt responsible for this reduction region was present on
the Si02 support as cobalt silicate, a specie whose formation dramatically inhibits the extent
of reduction obtained for cobalt supported on Si02• The calculated extent of reduction for the
Co/1/Si02 catalyst was 58.8%.
Table 3.20. TPR hydrogen consumption data for evaluation of the extent of reduction of supported cobalt for Co/1/SiOz, Co(A)/4/SiOz and Co/4/MnO. (mass cat- 0.15g, heating rate= l0°C/min, Reducing gas= 60ml(STP)/min 5% H2 in N2)
Hz:Co Hz:Co Extent of Catalyst Pretreatment
Total <400°C Reduction(%)
Calcination 1.280 0.435 Co/1/SiOz 58.8
Reduction 1.001 0.588
Calcination 1.141 0.232 Co(A)/4/SiOz 1.6
Reduction 1.129 0.018
Calcination 3.684 2.226 Co/4/MnO 21.1
Reduction 1.696 0.789
Figure 3.44 (B) indicates that reduction of the Co(A)/4/Si02 for 16 hours at 400°C has
resulted in the elimination of all cobalt species reducible below 400°C. The reduced TPR run
contained a single high temperature peak characteristic of extensive cobalt silicate formation.
Consequently very little of the cobalt was present on the surface as zero valent metal, yielding

• .fl ··..,.' . • J'
Chapter 3 - Results 135
an extent of reducibility of 1.6%.
Reduction of Co/4/MnO at 400°C resulted in a TPR spectrwn with a double humped low
temperature peak complete by 400°C, as well as a broad hydrogen consumption band present
in the calcined TPR spectrwn as well from 430°C to 800°C. The high temperature region was
attributed to the reduction of cobalt interacting with the MnO support, as well as reduction of
the support. The low temperature reduction results from surface reoxidation of cobalt. The
extent of reduction was calculated to be 21.1 %.
3.2.4.2 Hydrogen Chemisorption
Table 3.21 shows the results obtained from the hydrogen chemisorption measurements
performed on the Co/1/Si02, Co(A)4/Si0z and Co/4/MnO catalysts prepared by nitric or
acetic acid addition .. The Co/1/Si02 catalyst had a exposed metal surface area of 2.50 m2/g
compared to 3.18 m2/g obtained for the base case Co/Si02 catalyst. Thus the addition of acid
decreased the metal surface area of the catalyst. The addition of acid lowered the extent of
reduction of supported cobalt from 80.3% for Co/Si02 to 58.8% for Coll/Si02. The
combination of surface area and extent of reduction resulted in a slightly higher dispersion
and smaller cobalt crystallite sizes following preparation in nitric acid. The reversibility
dropped from 65 .8% to 56.1% with nitric acid addition to the impregnation solution.
No meaningful results were obtained for the Co(A)/4/Si02 catalyst prepared by acetic acid
addition during cobalt acetate impregnation on Si02.
Nitric acid addition during cobalt nitrate impregnation on MnO yielded the Co/4/MnO
catalyst. The acid addition improved the extent of reduction of the supported cobalt, leading
to an improved metal surface area. The lower acid addition also increased the cobalt
dispersion from 2.06% to 5.60%, while decreasing the cobalt crystallite size from 46.6 nm to
17.2 run.
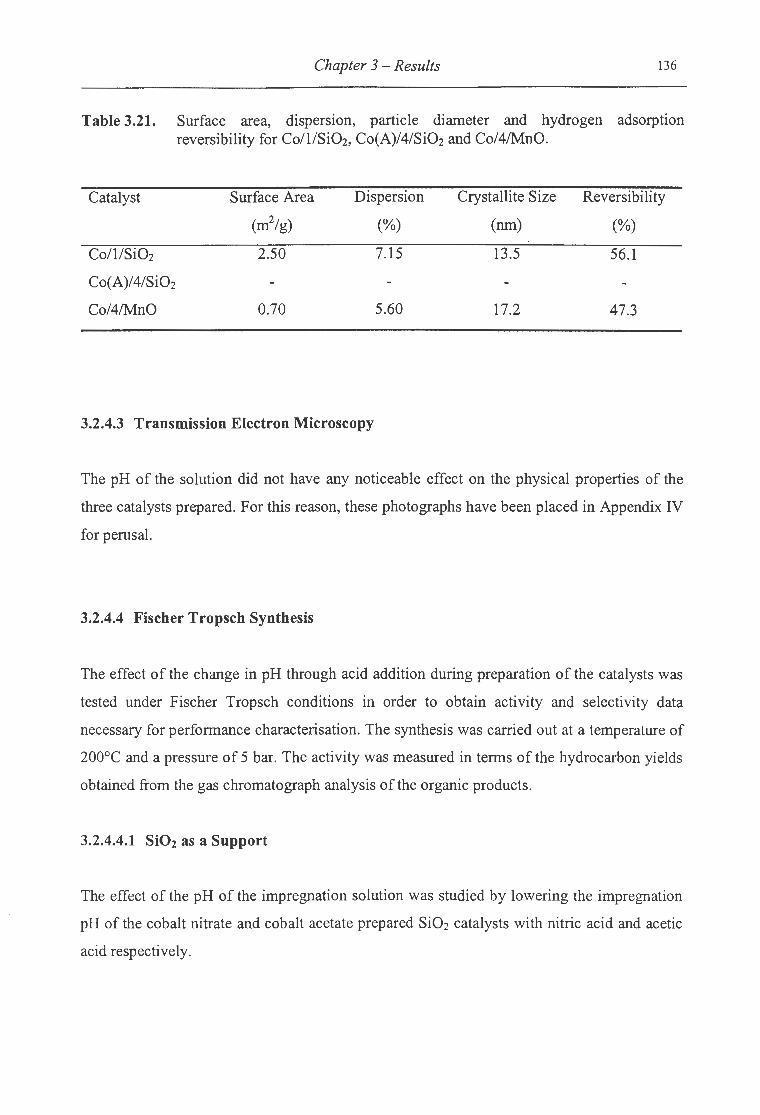
Chapter 3 - Results 136
Table 3.21. Surface area, dispersion, particle diameter and hydrogen adsorption reversibility for Co/1/Si02, Co(A)/4/Si02 and Co/4/MnO.
Catalyst Surface Area Dispersion Crystallite Size Reversibility
(m2/g) (%) (nm) (%)
Co/1/Si02 2.50 7.15 13.5 56.1
Co(A)/4/Si02
Co/4/MnO 0.70 5.60 17.2 47.3
3.2.4.3 Transmission Electron Microscopy
The pH of the solution did not have any noticeable effect on the physical properties of the
three catalysts prepared. For this reason, these photographs have been placed in Appendix IV
for perusal.
3.2.4.4 Fischer Tropsch Synthesis
The effect of the change in pH through acid addition during preparation of the catalysts was
tested under Fischer Tropsch conditions in order to obtain activity and selectivity data
necessary for performance characterisation. The synthesis was carried out at a temperature of
200°C and a pressure of 5 bar. The activity was measured in terms of the hydrocarbon yields
obtained from the gas chromatograph analysis ofthe organic products.
3.2.4.4.1 Si02 as a Support
The effect of the pH of the impregnation solution was studied by lowering the impregnation
pH of the cobalt nitrate and cobalt acetate prepared Si02 catalysts with nitric acid and acetic
acid respectively.
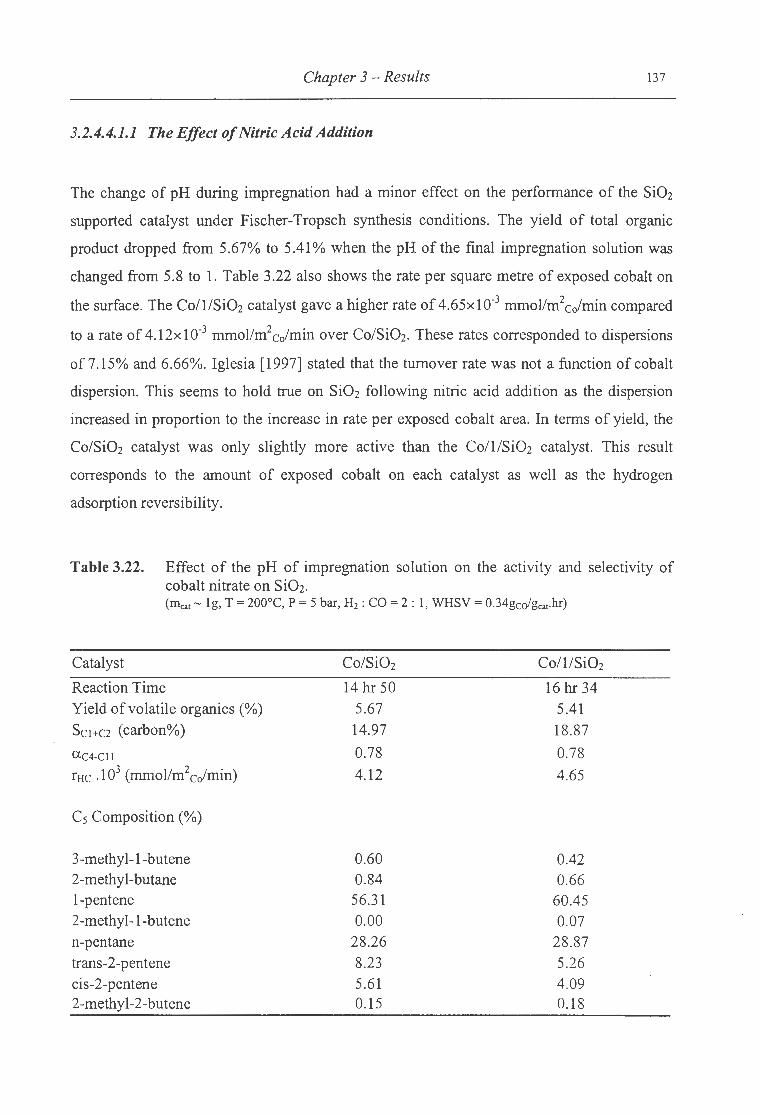
Chapter 3 - Results 137
3.2.4.4.1.1 The Effect of Nitric Acid Addition
The change of pH during impregnation had a minor effect on the performance of the Si02
supported catalyst under Fischer-Tropsch synthesis conditions. The yield of total organic
product dropped from 5.67% to 5.41% when the pH of the final impregnation solution was
changed from 5.8 to 1. Table 3.22 also shows the rate per square metre of exposed cobalt on
the surface. The Co/1/Si02 catalyst gave a higher rate of 4.65x10⁻³ mmoVm2cJmin compared
to a rate of 4.12x10⁻³ mmoVm2cofmin over Co/Si02. These rates corresponded to dispersions
of 7.15% and 6.66%. Iglesia [1997] stated that the turnover rate was not a function of cobalt
dispersion. This seems to hold true on Si02 following nitric acid addition as the dispersion
increased in proportion to the increase in rate per exposed cobalt area. In terms of yield, the
Co/Si02 catalyst was only slightly more active than the Co/1/Si02 catalyst. This result
corresponds to the amount of exposed cobalt on each catalyst as well as the hydrogen
adsorption reversibility.
Table 3.22. Effect of the pH of impregnation solution on the activity and selectivity of cobalt nitrate on Si02. (Illcat- lg, T = 200°C, P = 5 bar, Hz: CO= 2: 1, WHSV = 0.34gcdgcat·hr)
Catalyst Co/Si02 Co/1/Si02
Reaction Time 14 hr 50 16 hr 34 Yield ofvolatile organics(%) 5.67 5.41 Sc1+e2 (carbon%) 14.97 18.87
ac4-CII 0.78 0.78
rHc .1 03 (mmoVm2 cofmin) 4.12 4.65
Cs Composition(%)
3-methyl-1-butene 0.60 0.42 2-methyl-butane 0.84 0.66 1-pentene 56.31 60.45 2-methyl-1-butene 0.00 0.07 n-pentane 28.26 28.87 trans-2-pentene 8.23 5.26 cis-2-pentene 5.61 4.09 2-methyl-2-butene 0.15 0.18
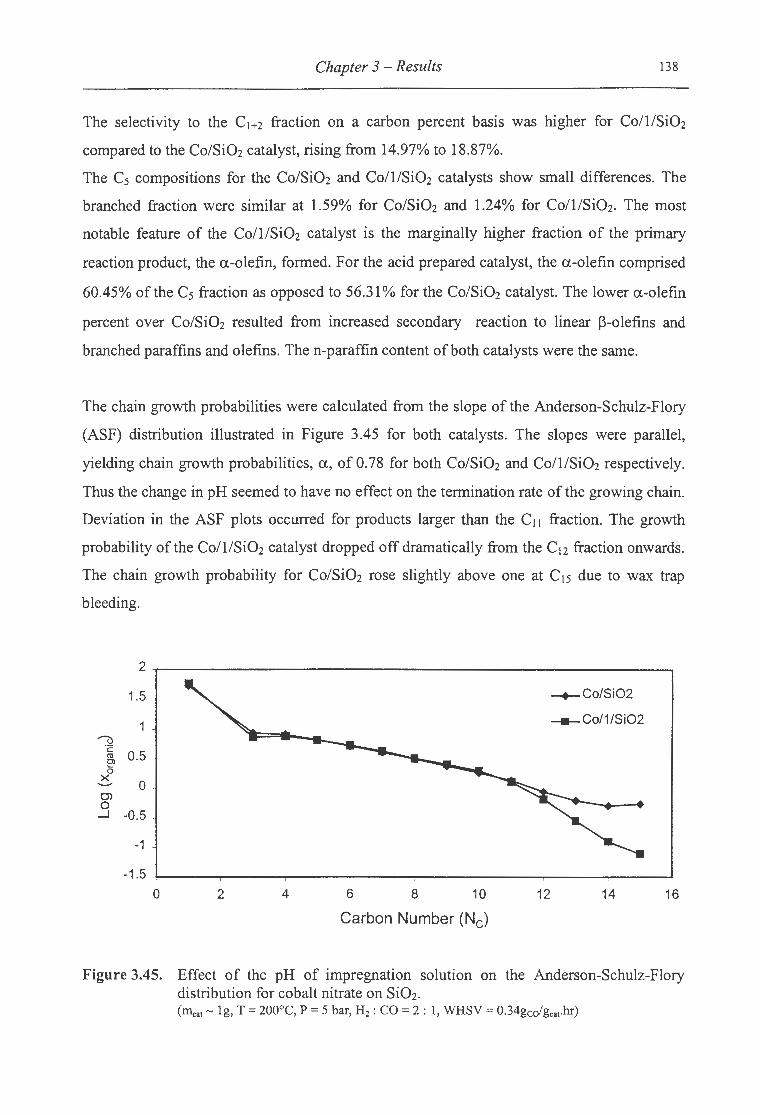
Chapter 3 -Results 138
The selectivity to the C1+2 fraction on a carbon percent basis was higher for Co/l/Si02
compared to the Co/Si02 catalyst, rising from 14.97% to 18.87%.
The C5 compositions for the Co/Si02 and Co/1/Si02 catalysts show small differences. The
branched fraction were similar at 1.59% for Co/Si02 and 1.24% for Co/1/Si02. The most
notable feature of the Co/1/Si02 catalyst is the marginally higher . fraction of the primary
reaction product, the a-olefin, formed. For the acid prepared catalyst, the a-olefin comprised
60.45% of the C5 fraction as opposed to 56.31% for the Co/Si02 catalyst. The lower a-olefin
percent over Co/Si02 resulted from increased secondary reaction to linear ~-olefins and
branched paraffins and olefins. Then-paraffin content ofboth catalysts were the same.
The chain growth probabilities were calculated from the slope of the Anderson-Schulz-Flory
(ASF) distribution illustrated in Figure 3.45 for both catalysts. The slopes were parallel,
yielding chain growth probabilities, a , of 0.78 for both Co/Si02 and Co/1/Si02 respectively.
Thus the change in pH seemed to have no effect on the termination rate of the growing chain.
Deviation in the ASF plots occurred for products larger than the C11 fraction. The growth
probability of the Co/1/Si02 catalyst dropped off dramatically from the C12 fraction onwards.
The chain growth probability for Co/Si02 rose slightly above one at C15 due to wax trap
bleeding.
2
1.5 -+-Co/Si02
-co/1/Si02 '()
·c: 0.5 ro
e> 0
>< 0 ---en 0 _J -0.5
-1 -
-1 .5
0 2 4 6 8 10 12 14 16
Carbon Number (Nc)
Figure 3.45. Effect of the pH of impregnation solution on the Anderson-Schulz-Flory distribution for cobalt nitrate on Si02. (11\:31 - lg, T = 200°C, P = 5 bar, H2 : CO = 2 : 1, WHSV = 0.34gcofgca1.hr)

Chapter 3 -Results 139
Figure 3.46 shows the rate of formation of the total organic product for the Co/SiOz and
Co/1/Si02 catalysts. The rate was calculated according to the procedure presented in
Appendix ill. The rates are given on a per gram of catalyst basis, allowing direct comparison.
The rate of formation is a measure of the activity of the catalyst, thus the rate parallels the
yield measurements from Table 3.22. Figure 3.46 shows that as the carbon number increases
for each catalyst, the rate of formation decreases. The polymerisation behaviour of the
Fischer-Tropsch reaction results in long hydrocarbon chains via a growing alkyl chain on the
catalyst. Consequently as the carbon number increases the rate of formation of each
successively higher carbon number fraction decreases as illustrated. The only difference in
the rate of formation between the catalysts was seen in the C1 and C2 fraction which were
grouped as C1, where the Co/SiOz catalyst showed a higher formation rate.
2500
--+- Co/Si02 ~
~ 2000 -Co/1/Si02 0) -c
E 1500 -0 E 1000 E ..._...
<.0 0
500 ...--u ·c: ro
0 ~ 0
'- 0 2 4 6 8 10 12 14 16
Carbon Number (Nc)
Figure 3.46. Effect of the pH of impregnation on the total organic formation rate for cobalt nitrate on SiOz. (Illear- lg, T = 200°C, P = 5 bar, Hz: CO= 2 : 1, WHSV = 0.34gcofgcat·hr)
The olefinicity of the linear organic product is shown in Figure 3.47 for the Co/Si02 and
Co/1/SiOz catalysts. The total linear olefin fraction was made up from the a-olefin content
and the ~-olefin content of the C5 fraction. The selectivity to linear olefins of the two
catalysts were similar for the full range of carbon numbers, indicating similar growth
probabilities as the profiles in Figure 3.47 were approximately parallel. In Table 3.22 the C5
product breakdown was given for each catalyst. The linear olefin fractions were 70.15% and
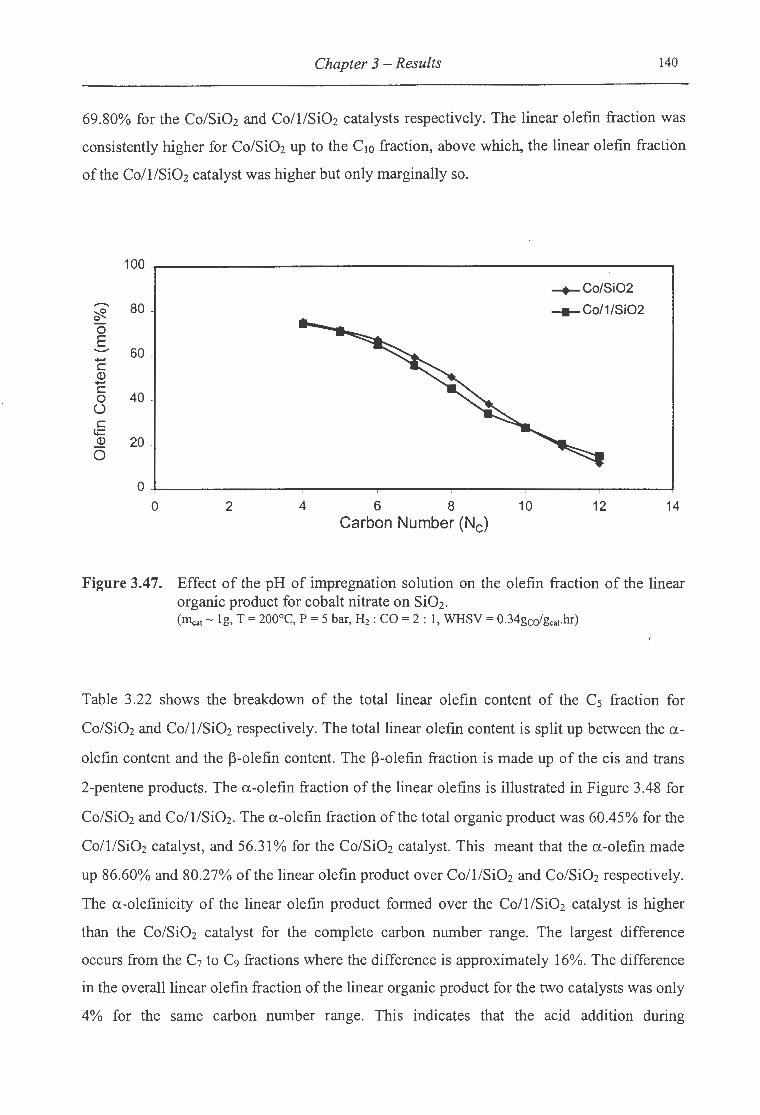
Chapter 3 - Results 140
69.80% for the Co/Si02 and Co/1/Si02 catalysts respectively. The linear olefin fraction was
consistently higher for Co/Si02 up to the C10 fraction, above which, the linear olefin fraction
of the Co/1/Si02 catalyst was higher but only marginally so.
100
--..- Co/Si02 .......... 80 -Co/1/Si02 ~ 0
0 E ........ 60 -c Q) -c
40 0 ()
c t+= Q) 20 0
0
0 2 4 6 8 10 12 14 Carbon Number (Nc)
Figure 3.47. Effect of the pH of impregnation solution on the olefin fraction of the linear organic product for cobalt nitrate on Si02 .
(lllcat- 1g, T = 200°C, P = 5 bar, H2: CO= 2: 1, WHSV = 0.34gcchcat·hr)
Table 3.22 shows the breakdown of the total linear olefin content of the C5 fraction for
Co/Si02 and Co/1/Si02 respectively. The total linear olefin content is split up between the a
olefin content and the ~-olefin content. The ~-olefin fraction is made up of the cis and trans
2-pentene products. The a-olefin fraction of the linear ole fins is illustrated in Figure 3.48 for
Co/Si02 and Co/1/Si02 . The a-olefin fraction of the total organic product was 60.45% for the
Co/1/Si02 catalyst, and 56.31% for the Co/Si02 catalyst. This meant that the a-olefin made
up 86.60% and 80.27% of the linear olefin product over Co/1/Si02 and Co/Si02 respectively.
The a-olefinicity of the linear olefin product formed over the Co/1/Si02 catalyst is higher
than the Co/Si02 catalyst for the complete carbon number range. The largest difference
occurs from the C7 to C9 fractions where the difference is approximately 16%. The difference
in the overall linear olefin fraction of the linear organic product for the two catalysts was only
4% for the same carbon number range. This indicates that the acid addition during

Chapter 3 - Results 141
impregnation alters the catalyst surface resulting in a decreased rate of secondary reaction
resulting in less branched product and less secondary linear olefins. The ~-olefin content of
the C5 fraction dropped from 13.84% for Co/Si02 to 9.35% for the Co/1/Si02 catalyst.
100
......... -+-Co/Si02 ~ 80 0
~Co/1/Si02 0 E --.....
60 c ().) ..... c 0 0 40 c
'+= ().)
0 20 n:l
.!:: c.. <( 0
0 2 4 6 8 10 12 14
Carbon Number (Nc)
Figure 3.48. Effect of the pH of impregnation solution on the a-olefin fraction of the linear olefins for cobalt nitrate on SiOz. (Illca1 - 1g, T = 200°C, P = 5 bar, Hz: CO= 2: 1, WHSV = 0.34gcofgcat·hr)
3.2.4.4.1.2 The Effect of Acetic Acid Addition
Glacial acetic acid was used to lower the pH of the impregnation solution for the preparation
of cobalt acetate on Si02 . As acetic acid is a weak acid, the lowest achievable pH was 4. The
catalyst prepared in the presence of acetic acid was named Co(A)/4/Si02.
The change of pH during impregnation had a major effect on the performance of the Si02
supported catalyst under Fischer-Tropsch synthesis conditions. Table 3.23 gives information
on the yield, C1+2 selectivity, the chain growth probability and the product breakdown of the
Cs fraction for the Co(A)/Si02 and Co(A)/4/Si02 catalysts. The yield of total organic product
increased from 0.24% to 0.46% when the pH of the final impregnation solution was changed
from 6.5 to 4. Thus the Co(A)/4/Si02 catalyst was more than twice as active as the

Chapter 3 -Results 142
Co(A)/Si02 catalyst. This result is in agreement with the TPR findings, where the
Co(A)/4/Si02 catalyst had a higher hydrogen to cobalt molar ratios for reduction below
400°C than the Co(A)/Si02, resulting in a larger fraction of cobalt on the surface in the active
zerovalent form. As no chemisorption data was obtained for Co(A)/4/SiOz, no comparisons
between metal surface area, dispersion or rate per exposed cobalt area could be made.
Table 3.23. Effect of the pH of impregnation solution on the activity and selectivity of cobalt acetate on SiOz. (Illc31 - 1g, T = 200°C, P = 5 bar, H2: CO= 2: 1, WHSV = 0.34gcdgc31.hr)
Catalyst Co(A)/SiOz Co(A)/4/SiOz
Reaction Time 13 hr 31 23 hr 40 Yield of volatile organics (%) 0.24 0.46
Sc1+c2 (carbon%) 63.98 35.70
ac4-Cll 0.75 0.84
rHc .103 (mmol/m2cc/min) 4.52
Cs Composition(%)
3-methyl-1-butene 0.28 0.26 2-methyl-butane 0.40 0.45 1-pentene 36.19 41.27 2-methyl-1-butene 0.00 0.00 n-pentane 32.34 32.36 trans-2-pentene 16.88 14.87 cis-2-pentene 10.91 9.28 2-methyl-2-butene 3.00 1.51
The C1+2 selectivity on a carbon percent basis dropped dramatically from 63.98% to 35.70%
as a result of the lower impregnation pH. The C5 compositions for the Co(A)/Si02 and
Co(A)/4/Si02 catalysts show small differences. The branched fraction were decreased upon
acid addition from 3.68% for Co(A)/SiOz to 2.22% for Co(A)/4/Si02. The C5 a-olefin
content of Co(A)/4/Si02 was marginally higher at 41.27% as opposed to 36.19% for the
Co(A)/SiOz catalyst. The higher a-olefin percent over Co(A)/4/Si02 coincided with a
decrease in secondary reactions to linear P-olefins and branched paraffins and olefins. The n-
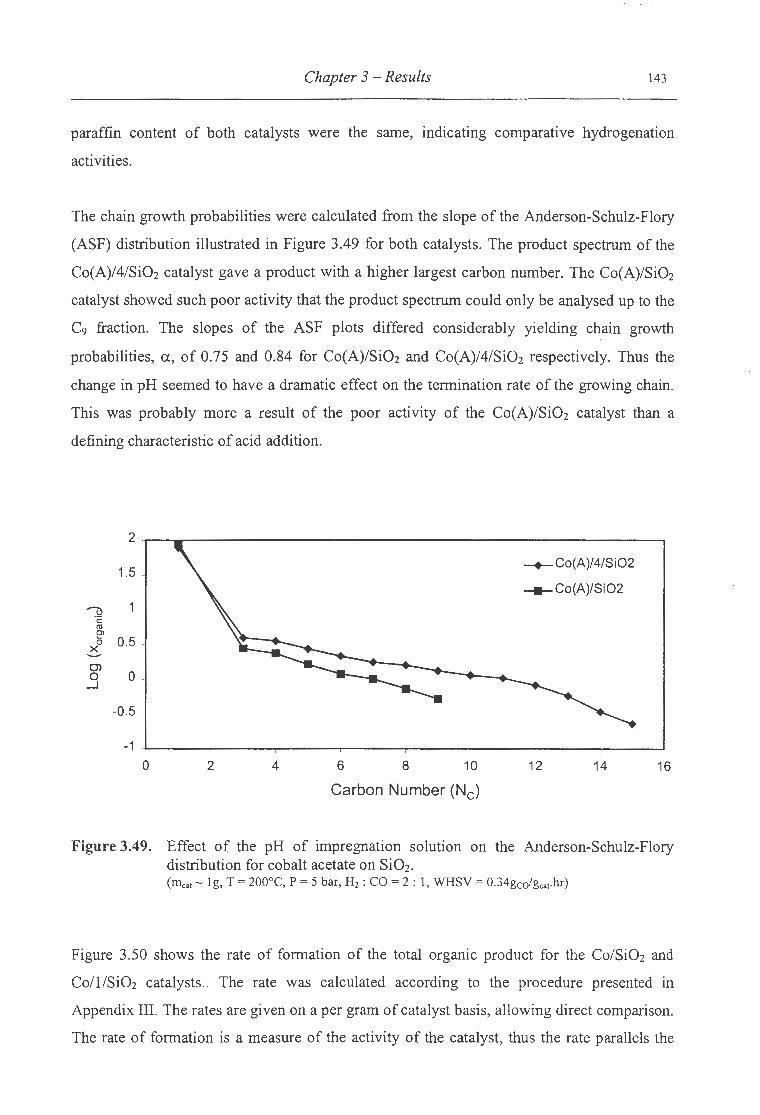
. .., .....
Chapter 3 -Results 143
paraffin content of both catalysts were the same, indicating comparative hydrogenation
activities.
The chain growth probabilities were calculated from the slope of the Anderson-Schulz-Flory
(ASF) distribution illustrated in Figure 3.49 for both catalysts. The product spectrum of the
Co(A)/4/Si02 catalyst gave a product with a higher largest carbon number. The Co(A)/Si02
catalyst showed such poor activity that the product spectrum could only be analysed up to the
C9 fraction. The slopes of the ASF plots differed considerably yielding chain growth
probabilities, a, of 0.75 and 0.84 for Co(A)/SiOz and Co(A)/4/Si02 respectively. Thus the
change in pH seemed to have a dramatic effect on the termination rate of the growing chain.
This was probably more a result of the poor activity of the Co(A)/Si02 catalyst than a
defining characteristic of acid addition.
2
1.5 --+- Co(A)/4/Si02
- Co(A)/Si02
~ ·c: Cll ~ 0.5 0
X ......... 0) 0 0
_J
-0.5 -
-1 0 2 4 6 8 10 12 14 16
Carbon Number (Nc)
Figure 3.49. Effect of the pH of impregnation solution on the Anderson-Schulz-Flory distribution for cobalt acetate on Si02 .
(Illca1 - 1g, T = 200°C, P = 5 bar, H2: CO= 2 : 1, WHSV = 0.34gcofgcat·hr)
Figure 3.50 shows the rate of formation of the total organic product for the Co/Si02 and
Co/l/Si02 catalysts .. The rate was calculated according to the procedure presented in
Appendix III. The rates are given on a per gram of catalyst basis, allowing direct comparison.
The rate of formation is a measure of the activity of the catalyst, thus the rate parallels the

Chapter 3 - Results 144
yield measurements from Table 3.23. Figure 3.50 illustrates the rate of formation as a
function of carbon number. The diagram is deceiving as the formation rate of Co(A)/4/Si02 is
almost double that of Co(A)/Si02, however as organic yields are so small over both catalysts,
little definition is visible in Figure 3.50.
400~----------------------------------------------------,
~
rl 300 0> -c .E -0 200 E E ..__,
<0 0 100
-+- Co(A)/4/Si02
- Co(A)/Si02
o+---~~~~=*~~._~~~+=~~--~~-.~ 0 2 4 6 8 10 12 14 16
Carbon Number (Nc)
Figure 3.50. Effect of the pH of impregnation solution on the total organic formation rate for cobalt acetate on Si02. (Il1cat- 1g, T = 200°C, P = 5 bar, H2: CO= 2: 1, WHSV = 0.34gcofgcat·hr)
The olefinicity of the linear organic product is shown in Figure 3.51 for the Co(A)/Si02 and
Co(A)/4/Si02 catalysts. The total linear olefin fraction was made up from the a-olefin content
and the P-olefin content of the C5 fraction. The selectivity to linear olefins of the two
catalysts differed by about 5% with the acid catalyst showing higher olefinicity except in the
C4 and Cs fractions where they were equal. In Table 3.23 the C5 product breakdown was
given for each catalyst. In the C5 fraction, the linear olefin fractions comprised 65.42% and
63.98% of the total organic product for the Co(A)/Si02 and Co(A)/4/Si02 catalysts
respectively.
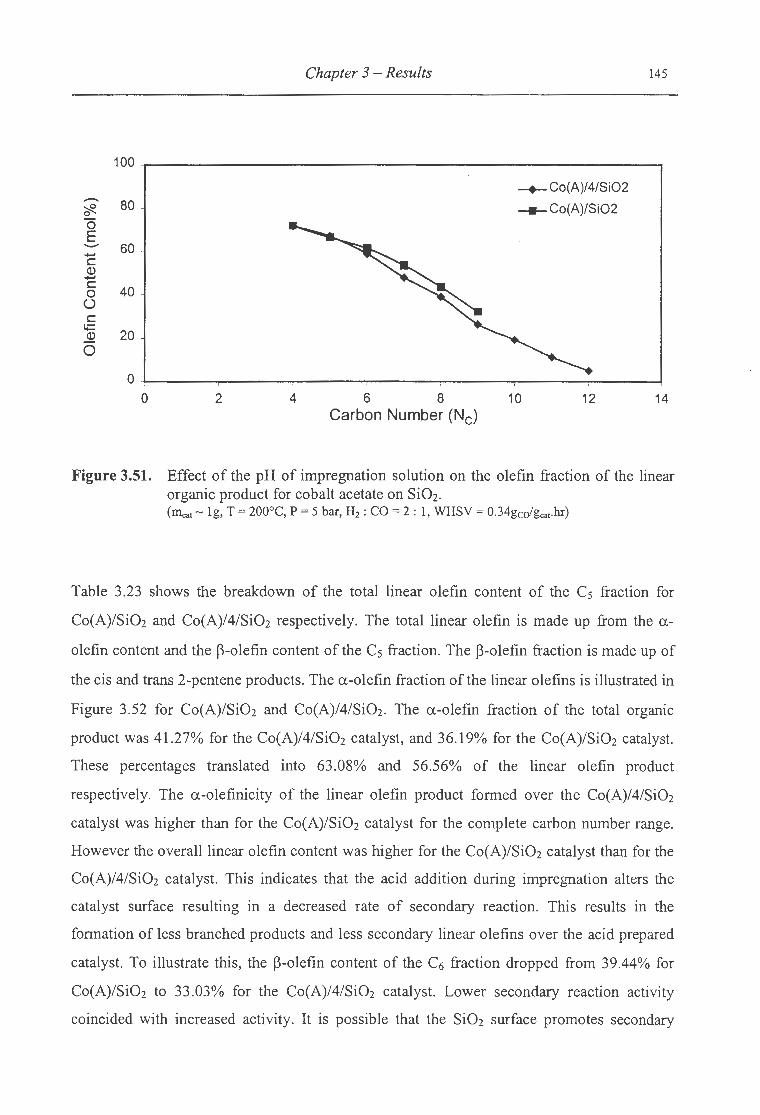
Chapter 3 - Results 145
100
-+- Co(A)/4/Si02 - 80 ~ 0 - Co(A)/Si02 0 E - 60 ...... c a.> ...... c
40 0 ()
c t;::
20 a.> 0
0 0 2 4 6 8 10 12 14
Carbon Number (Nc)
Figure 3.51. Effect of the pH of impregnation solution on the olefin fraction of the linear organic product for cobalt acetate on Si02.
(Inea1 - 1g, T = 200°C, P = 5 bar, H2 : CO= 2: 1, WHSV = 0.34gcdgcat·hr)
Table 3.23 shows the breakdown of the total linear olefin content of the C5 fraction for
Co(A)/Si02 and Co(A)/4/Si02 respectively. The total linear olefin is made up from the a
olefin content and the ~-olefin content of the C5 fraction. The ~-olefin fraction is made up of
the cis and trans 2-pentene products. The a-olefin fraction of the linear olefins is illustrated in
Figure 3.52 for Co(A)/Si02 and Co(A)/4/Si02. The a-olefin fraction of the total organic
product was 41.27% for the Co(A)/4/SiOz catalyst, and 36.19% for the Co(A)/Si02 catalyst.
These percentages translated into 63.08% and 56.56% of the linear olefin product
respectively. The a-olefinicity of the linear olefin product formed over the Co(A)/4/Si02
catalyst was higher than for the Co(A)/Si02 catalyst for the complete carbon number range.
However the overall linear olefin content was higher for the Co(A)/Si02 catalyst than for the
Co(A)/4/Si02 catalyst. This indicates that the acid addition during impregnation alters the
catalyst surface resulting in a decreased rate of secondary reaction. This results in the
formation of less branched products and less secondary linear olefins over the acid prepared
catalyst. To illustrate this, the ~-olefin content of the C6 fraction dropped from 39.44% for
Co(A)/Si02 to 33.03% for the Co(A)/4/Si02 catalyst. Lower secondary reaction activity
coincided with increased activity. It is possible that the Si02 surface promotes secondary

Chapter 3 - Results 146
activity, and as the cobalt crystallites become more substantial, the support plays less of a
role.
80
- -+- Co(A)/4/Si02 ~
- Co(A)/Si02 0 60 E ........-...... c <1> ...... c 0
40 (.)
c !+=
<1> 20 0 ro
..c 0. <{ 0
0 2 4 6 8 10 12 14
Carbon Number (Nc)
Figure 3.52. Effect of the pH of impregnation on the a-olefin fraction of the linear olefins for cobalt acetate on Si02. (11lca1 - 1g, T = 200°C, P = 5 bar, H2: CO = 2: 1, WHSV = 0.34gcofgcat·hr)
3.2.4.4.2 MnO as a Support
The change of pH during impregnation had a minor effect on the selectivity of the MnO
supported catalyst under Fischer-Tropsch synthesis conditions, but had a marked effect upon
the catalyst activity. The catalyst prepared in nitric acid was called Co/4/MnO as the final pH
of the impregnation solution was 4. Table 3.24 shows theFT reaction results for Co/4/MnO
and Co!MnO. The yield oftotal organic product increased from 0.18% to 0.46% when the pH
of the final impregnation solution was lowered from 7.1 to 4. Thus the Co/4/MnO catalyst
was 2.5 times more active than the Co!MnO catalyst. This result is in agreement with the
hydrogen chemisorption findings, where the exposed cobalt metal surface area was seen to
double from 0.35 m2/g for Co/MnO to 0.70 m2/g for Co/4/MnO. The dispersion also
increased from 2.06% to 5.60%. These two factors together combine to give a larger fraction
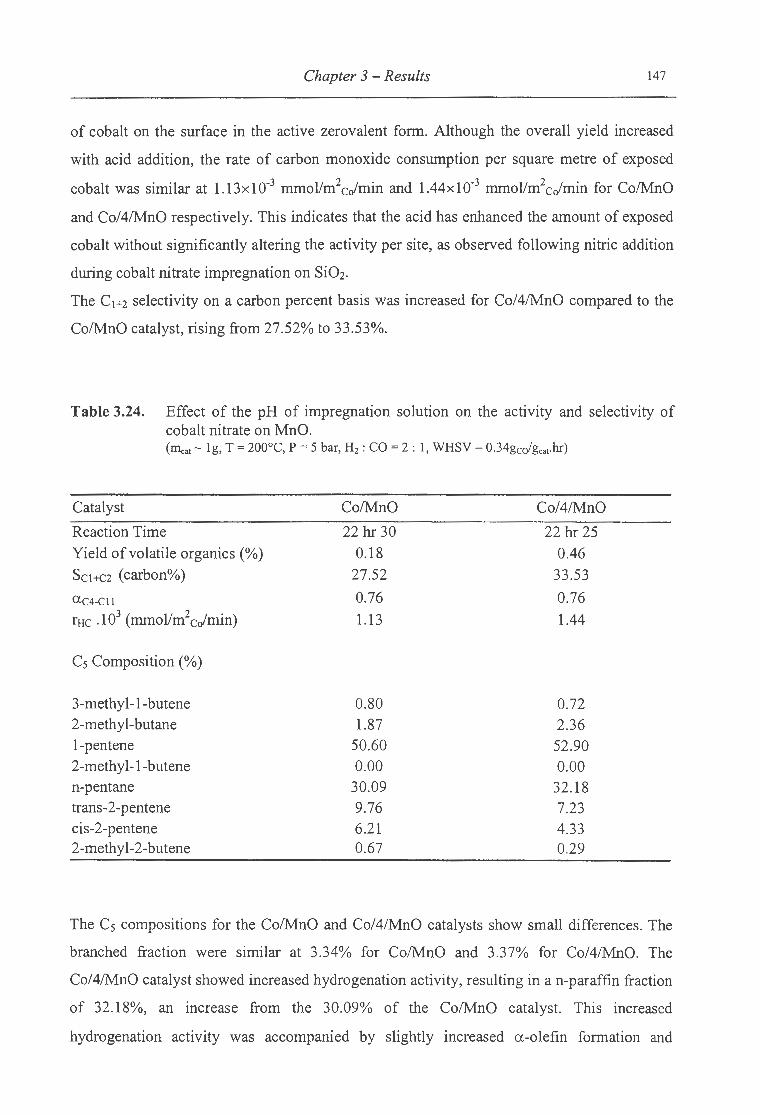
Chapter 3 - Results 147
of cobalt on the surface in the active zerovalent form. Although the overall yield increased
with acid addition, the rate of carbon monoxide consumption per square metre of exposed
cobalt was similar at 1.13x10⁻³ mmollm2cJmin and 1.44x10⁻³ mmol!m2cJmin for Co/MnO
and Co/4/MnO respectively. This indicates that the acid has enhanced the amount of exposed
cobalt without significantly altering the activity per site, as observed following nitric addition
during cobalt nitrate impregnation on Si02.
The C1+2 selectivity on a carbon percent basis was increased for Co/4/MnO compared to the
Co/MnO catalyst, rising from 27.52% to 33.53%.
Table 3.24. Effect of the pH of impregnation solution on the activity and selectivity of cobalt nitrate on MnO. (llleat- 1g, T = 200°C, P = 5 bar, H2 : CO= 2: 1, WHSV = 0.34gcd8ca1.hr)
Catalyst Co/MnO Co/4/MnO
Reaction Time 22 hr 30 22 hr 25 Yield of volatile organics(%) 0.18 0.46
Sc1+e2 (carbon%) 27.52 33.53
Uc4-CII 0.76 0.76
rHc .1 03 (mmollm2 cJmin) 1.13 1.44
Cs Composition(%)
3-methyl-1-butene 0.80 0.72 2-methyl-butane 1.87 2.36 1-pentene 50.60 52.90 2-methyl-1-butene 0.00 0.00 n-pentane 30.09 32.18 trans-2-pentene 9.76 7.23 cis-2-pentene 6.21 4.33 2-methyl-2-butene 0.67 0.29
The Cs compositions for the Co/MnO and Co/4/MnO catalysts show small differences. The
branched fraction were similar at 3.34% for Co/MnO and 3.37% for Co/4/MnO. The
Co/4/MnO catalyst showed increased hydrogenation activity, resulting in an-paraffin fraction
of 32.18%, an increase from the 30.09% of the Co/MnO catalyst. This increased
hydrogenation activity was accompanied by slightly increased a-olefin formation and
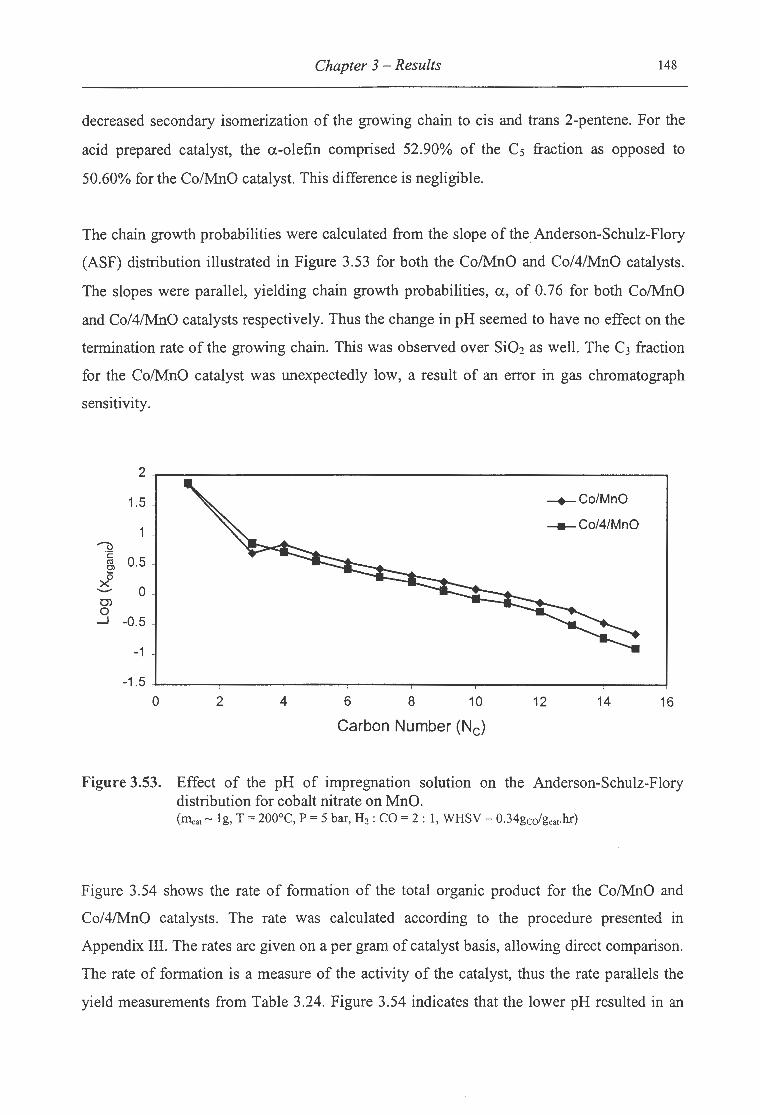
Chapter 3 -Results 148
decreased secondary isomerization of the growing chain to cis and trans 2-pentene. For the
acid prepared catalyst, the a-olefin comprised 52.90% of the Cs fraction as opposed to
50.60% for the Co!MnO catalyst. This difference is negligible.
The chain growth probabilities were calculated from the slope of the. Anderson-Schulz-Flory
(ASF) distribution illustrated in Figure 3.53 for both the Co!MnO and Co/4/MnO catalysts.
The slopes were parallel, yielding chain growth probabilities, a, of 0.76 for both Co!MnO
and Co/4/MnO catalysts respectively. Thus the change in pH seemed to have no effect on the
termination rate of the growing chain. This was observed over Si02 as well. The C3 fraction
for the Co!MnO catalyst was unexpectedly low, a result of an error in gas chromatograph
sensitivity.
2
1.5 -+-Co/MnO
-Co/4/MnO
~ ·c: 0.5 Cll
e> ~
0 '-"
0) 0 _J -0 .5
-1
-1.5 0 2 4 6 8 10 12 14 16
Carbon Number (Nc)
Figure 3.53. Effect of the pH of impregnation solution on the Anderson-Schulz-Flory distribution for cobalt nitrate on MnO. (Illca1 - 1g, T = 200°C, P = 5 bar, H2: CO= 2 : 1, WHSV = 0.34gcofgcat·hr)
Figure 3.54 shows the rate of formation of the total organic product for the Co/MnO and
Co/4/MnO catalysts. The rate was calculated according to the procedure presented in
Appendix III. The rates are given on a per gram of catalyst basis, allowing direct comparison.
The rate of formation is a measure of the activity of the catalyst, thus the rate parallels the
yield measurements from Table 3.24. Figure 3.54 indicates that the lower pH resulted in an

. . . . .. . . '· . . . . ~ - .
Chapter 3- Results 149
increased formation rate, particularly for the C1+2 fraction. This result parallels the exposed
metal surface area measurement from hydrogen chemisorption, with increased activity
deriving from a greater number of exposed active sites.
400
.....-.;::, --+-Co/MnO
-Co/4/MnO ~
300 O'l -c .E -0 200 E E ..._..
rD 100 0 ...... (.) ·c: ro
0 ~ 0 ,_
0 2 4 6 8 10 12 14 16
Carbon Number (Nc)
Figure 3.54. Effect of the pH of impregnation solution on the total organic formation rate for cobalt nitrate on MnO. (Illca1 - 1g, T = 200°C, P = 5 bar, H2: CO= 2: 1, WHSV = 0.34gcofgcat·hr)
The olefinicity of the linear organic product is shown in Figure 3.55 for the Co/MnO and
Co/4/MnO catalysts. The linear olefin product comprised the a- and ~-olefin fractions. The
selectivity to linear olefins for the two catalysts were similar for the full range of carbon
numbers, except for the C8 fraction, where the linear olefin content was higher. In Table 3.24
the C5 product breakdown was given for each catalyst. The linear olefin fractions made up
66.57% and 64.46% of the total organic product in the C5 fraction for the Co/MnO and
Co/4/MnO catalysts respectively.
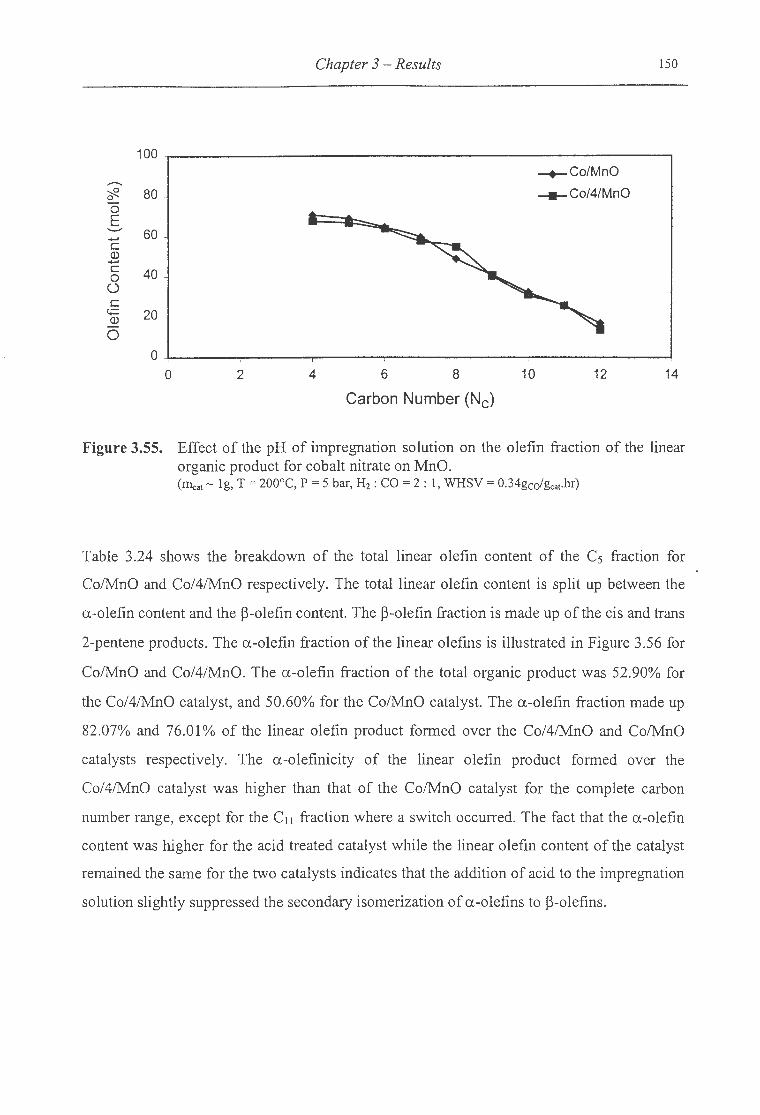
Chapter 3 - Results 150
100 --+-Co/MnO
........ :::R 0 80 - --Co/4/MnO 0 E ,__..
60 ...... c Q) ...... c 40 0 0 c
c.;:: 20 Q)
0 0
0 2 4 6 8 10 12 14
Carbon Number (Nc)
Figure 3.55. Effect of the pH of impregnation solution on the olefin fraction of the linear organic product for cobalt nitrate on MnO. (Il1cat- 1g, T = 200°C, P = 5 bar, H2 : CO= 2: 1, WHSV = 0.34gw'gc31.hr)
Table 3.24 shows the breakdown of the total linear olefin content of the C5 fraction for
Co/MnO and Co/4/MnO respectively. The total linear olefin content is split up between the
a.-olefin content and the ~-olefin content. The ~-olefin fraction is made up of the cis and trans
2-pentene products. The a.-olefin fraction of the linear ole fins is illustrated in Figure 3.56 for
Co/MnO and Co/4/MnO. The a.-olefin fraction of the total organic product was 52.90% for
the Co/4/MnO catalyst, and 50.60% for the Co/MnO catalyst. The a.-olefin fraction made up
82.07% and 76.01% of the linear olefin product formed over the Co/4/MnO and Co/MnO
catalysts respectively. The a.-olefinicity of the linear olefin product formed over the
Co/4/MnO catalyst was higher than that of the Co/MnO catalyst for the complete carbon
number range, except for the C 11 fraction where a switch occurred. The fact that the a.-olefin
content was higher for the acid treated catalyst while the linear olefin content of the catalyst
remained the same for the two catalysts indicates that the addition of acid to the impregnation
solution slightly suppressed the secondary isomerization of a.-olefins to ~-olefins.

Chapter 3 - Results 151
100
...-.. -+-Co/MnO ~ 80 -Co/4/MnO 0
0 E .......... .....
60 c Q.) ..... c 0 () 40 c
t;:: Q.)
0 20 ro
..c: Cl.
<( 0
0 2 4 6 8 10 12 14
Carbon Number (Nc)
Figure 3.56. Effect of the pH of impregnation solution on the a-olefin fraction of the linear olefins for cobalt nitrate on MnO. (~at- 1g, T = 200°C, P = 5 bar, H2 : CO= 2 : 1, WHSV = 0.34gcdgcat·hr)
3.2.5 Effect of the Contact Time between Solution and Support
Inorganic oxides are known to take a long time to reach charge equilibrium when placed in
solution. The presence of functional groups on the support surface leads to charge imbalances
between the support and the solution. These imbalances are rectified by the adsorption of
either positive or negative ions from the solution onto the support. Consequently the pH of
the impregnation solution varies as contact time between the support and the solution is
increased. This trend is illustrated in Table 3.1, where the pH of the impregnation solution
was seen to vary significantly from the initial impregnation to two days later when drying
was done. This change in pH coincides with an alteration in the net charge on the support
surface as the support takes up Co2+ ions and nitrate/acetate ions from solution. The net
surface charge plays an important role in determining the strength of interaction between the
support and cobalt ions. Table 3.1 showed that the initial pH of the impregnation solution to
be lower than the final pH of impregnation indicating that the solution is becoming
increasingly basic. As the solution becomes more basic, the net surface charge on the support
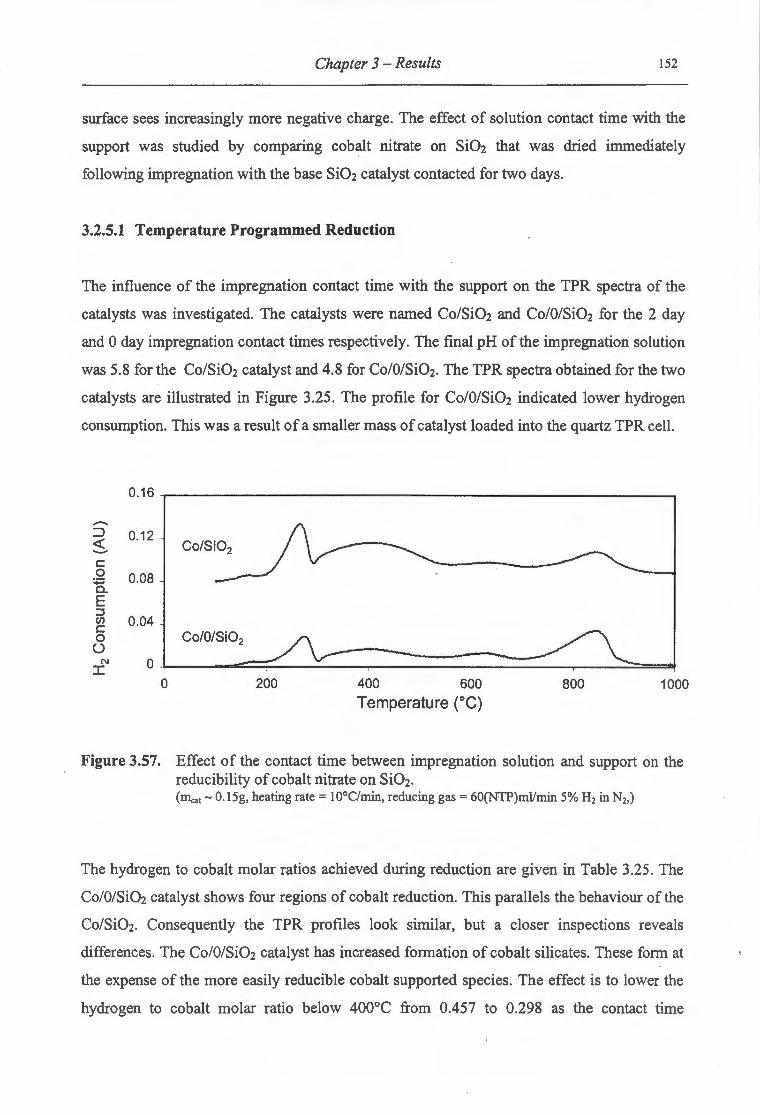
Chapter 3 - Results 152
surface sees increasingly more negative charge. The effect of solution contact time with the
support was studied by comparing cobalt nitrate on Si02 that was dried immediately
following impregnation with the base SiOz catalyst contacted for two days.
3.2.5.1 Temperature Programmed Reduction
The influence of the impregnation contact time with the support on the TPR spectra of the
catalysts was investigated. The catalysts were named Co/Si02 and Co/0/Si02 for the 2 day
and 0 day impregnation contact times respectively. The final pH of the impregnation solution
was 5.8 for the Co/Si02 catalyst and 4.8 for Co/0/SiOz. The TPR spectra obtained for the two
catalysts are illustrated in Figure 3.25. The profile for Co/O/Si02 indicated lower hycfrogen
consumption. This was a result of a smaller mass of catalyst loaded into the quartz TPR cell.
0.16
......... :J 0.12 <( Co/Si02 .......... c 0 0.08 ~ a. E :::J en 0.04 c
Co/O/Si02 0 ()
N 0 I 0 200 400 600 800 1000
Temperature (°C)
Figure 3.57. Effect of the contact time between impregnation solution and support on the reducibility of cobalt nitrate on Si02•
(111cat- 0.15g, heating rate= l0°C/min, reducing gas= 60(NTP)mVmin 5% H2 in N2, )
The hydrogen to cobalt molar ratios achieved during reduction are given in Table 3.25. The
Co/O/Si02 catalyst shows four regions of cobalt reduction. This parallels the behaviour of the
Co/Si02. Consequently the TPR profiles look similar, but a closer inspections reveals
differences. The Co/0/Si02 catalyst has increased formation of cobalt silicates. These form at
the expense of the more easily reducible cobalt supported species. The effect is to lower the
hydrogen to cobalt molar ratio below 400°C from 0.457 to 0.298 as the contact time
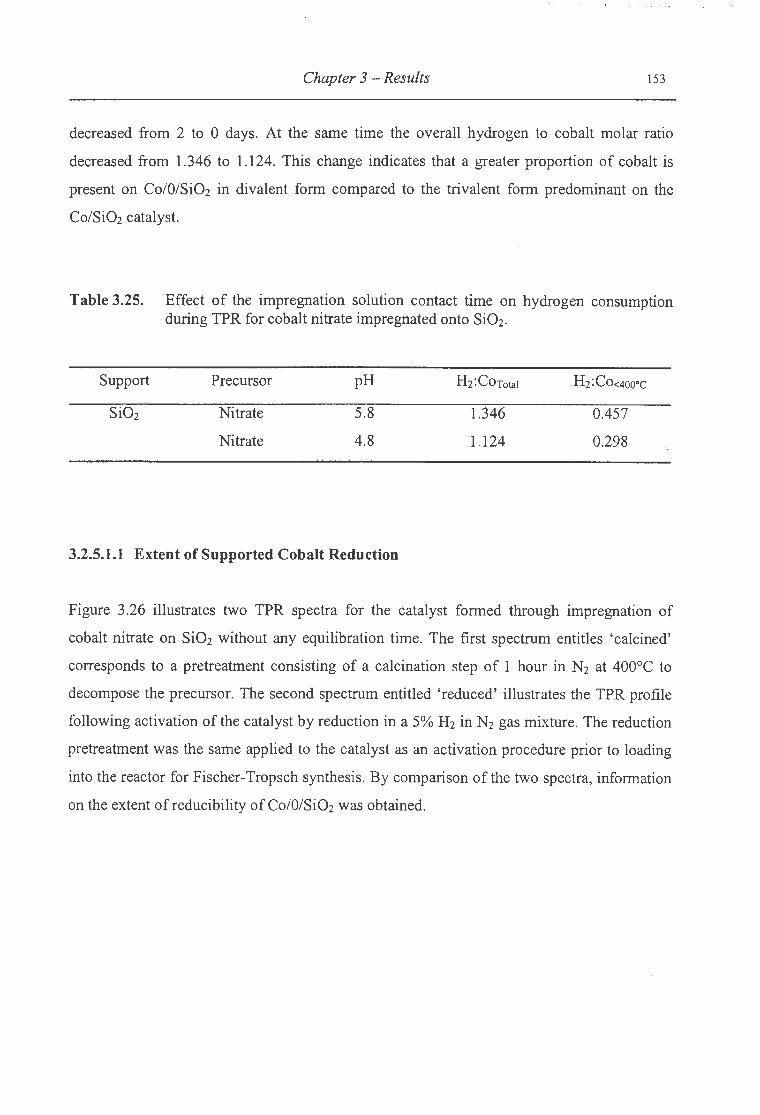
' _. I t!., ;, '' _; ; :f. .: ' • .. t • •' _. ... '. -~• •
Chapter 3 - Results 153
decreased from 2 to 0 days. At the same time the overall hydrogen to cobalt molar ratio
decreased from 1.346 to 1.124. This change indicates that a greater proportion of cobalt is
present on Co/O/Si02 in divalent form compared to the trivalent form predominant on the
Co/Si02 catalyst.
Table 3.25. Effect of the impregnation solution contact time on hydrogen consumption during TPR for cobalt nitrate impregnated onto Si02 .
Support
SiOz
Precursor
Nitrate
Nitrate
pH
5.8
4.8
3.2.5.1.1 Extent of Supported Cobalt Reduction
Hz:CoTotal
1.346
1.124
0.457
0.298
Figure 3.26 illustrates two TPR spectra for the catalyst formed through impregnation of
cobalt nitrate on Si02 without any equilibration time. The first spectrum entitles 'calcined'
corresponds to a pretreatment consisting of a calcination step of 1 hour in N2 at 400°C to
decompose the precursor. The second spectrum entitled 'reduced' illustrates the TPR profile
following activation of the catalyst by reduction in a 5% H2 in N2 gas mixture. The reduction
pretreatment was the same applied to the catalyst as an activation procedure prior to loading
into the reactor for Fischer-Tropsch synthesis. By comparison of the two spectra, information
on the extent of reducibility ofCo/0/SiOz was obtained.
Chapter 3 - Results 154
0.28
-:J 0.21 -<l: .........-c Reduced 0 0.14 :;::: 0. E ::J 0.07 (J) c Calcined 0 () 0
N
I 0 200 400 600 800 1000
Temperature (°C)
Figure 3.58. Evaluation of the extent of reduction of Co/O/Si02 after reduction at 400°C for 16 hours. (111ca1 - 0.15g, heating rate= 1 0°C/min, reducing gas= 60(NTP)ml/min 5% Hz in Nz,)
Table 3.26 shows hydrogen consumption data associated with the TPR runs illustrated in
Figure 3.58. The 'reduced' TPR spectrum consisted of a major low temperature peak
(maximum at 220°C) and a broad high temperature region of reduction between 600°C and
900°C. The low temperature peak arose from surface reoxidation of zerovalent cobalt
exposed to the atmosphere, while the high temperature reduction region was attributed·to the
presence of cobalt silicates that resulted in the loss of active phase (zerovalent) cobalt. The
extent of reduction calculated for Co/0/SiOz was 62.7%, lower than the 80.3% obtained with
Co/SiOz.
Table 3.26. TPR hydrogen consumption data for evaluation of the extent of reduction of supported cobalt for Co/0/SiOz. (mass cat- 0.15g, heating rate= 10°C/min, Reducing gas= 60ml(STP)/min 5% Hz in Nz)
Hz:Co Hz:Co Extent of Catalyst Pretreatment
Total <400°C Reduction (%)
Calcination 1.124 0.298 Co/0/SiOz 62.7
Reduction 1.035 0.662
Chapter 3 -Results 155
3.2.5.2 Hydrogen Chemisorption
Table 3.27 g1ves the hydrogen chemisorption measurements for the Co/O/Si02 catalyst
prepared through cobalt nitrate impregnation onto SiOz, followed by immediate drying. As
minimal contact time was allowed between support and cobalt ions,. no charge equilibration
of the impregnation solution took place. This lead to slight alterations in the nature of the
cobalt interaction with the Si02 as observed through TPR. These alterations were also seen
by means of hydrogen chemisorption. The smaller impregnation solution contact time
lowered the surface area of exposed cobalt metal on the support surface from 3.18 m2 I g to
2.91m2/g. This decrease in metal surface area coincided with a slight decrease in the extent of
reducibility calculated using TPR from 80.3% to 62.7%. The reversibility increased from
65.8% to 70.2% indicating marginally higher interaction between support and cobalt. The
cobalt particle size was higher and the cobalt dispersion was lower for the smaller contact
time. The cobalt dispersion improved from 6.66% to 7.79%.
Table 3.27. Surface area, dispersion, particle diameter and hydrogen adsorption reversibility for Co/O/Si02 •
Catalyst
Co/0/SiOz
Surface Area
(m2/g)
2.91
Dispersion
(%)
7.79
3.2.5.3 Transmission Electron Microscopy
Crystallite Size
(nm)
12.4
Reversibility
(%)
70.2
No noticeable change in the TEM photograph was noticed, and consequently the TEM
photograph for Co(O)/Si02 can be viewed in Appendix IV.
3.2.5.4 Fischer Tropsch Synthesis
The influence of the length of contact time between impregnation solution and support was
tested under Fischer Tropsch conditions in order to obtain activity and selectivity data. The
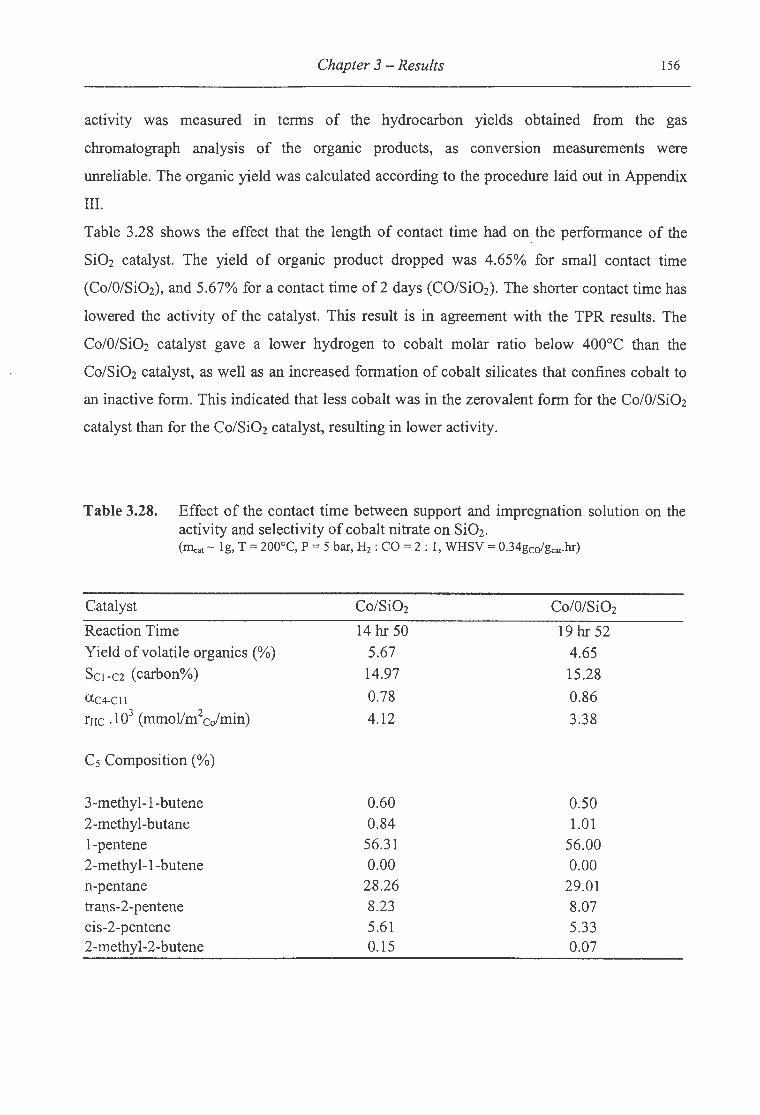
Chapter 3 - Results 156
activity was measured m terms of the hydrocarbon yields obtained from the gas
chromatograph analysis of the organic products, as conversion measurements were
unreliable. The organic yield was calculated according to the procedure laid out in Appendix
III.
Table 3.28 shows the effect that the length of contact time had onthe performance of the
Si02 catalyst. The yield of organic product dropped was 4.65% for small contact time
(Co/0/SiOz), and 5.67% for a contact time of 2 days (CO/SiOz). The shorter contact time has
lowered the activity of the catalyst. This result is in agreement with the TPR results. The
Co/O/Si02 catalyst gave a lower hydrogen to cobalt molar ratio below 400°C than the
Co/SiOz catalyst, as well as an increased formation of cobalt silicates that confines cobalt to
an inactive form. This indicated that less cobalt was in the zerovalent form for the Co/O/Si02
catalyst than for the Co/Si02 catalyst, resulting in lower activity.
Table 3.28. Effect of the contact time between support and impregnation solution on the activity and selectivity of cobalt nitrate on Si02. (Illcat- 1g, T = 200°C, P = 5 bar, Hz: CO= 2: 1, WHSV = 0.34gcofgcat·hr)
Catalyst Co/SiOz Co/0/SiOz
Reaction Time 14 hr 50 19 hr 52 Yield ofvolatile organics(%) 5.67 4.65 Sc1+e2 (carbon%) 14.97 15.28
ac4-CII 0.78 0.86 rHc .103 (mmol/m2cofmin) 4.12 3.38
Cs Composition(%)
3-methyl-1-butene 0.60 0.50 2-methyl-butane 0.84 1.01 1-pentene 56.31 56.00 2-methyl-1-butene 0.00 0.00 n-pentane 28.26 29.01 trans-2-pentene 8.23 8.07 cis-2-pentene 5.61 5.33 2-methyl-2-butene 0.15 0.07
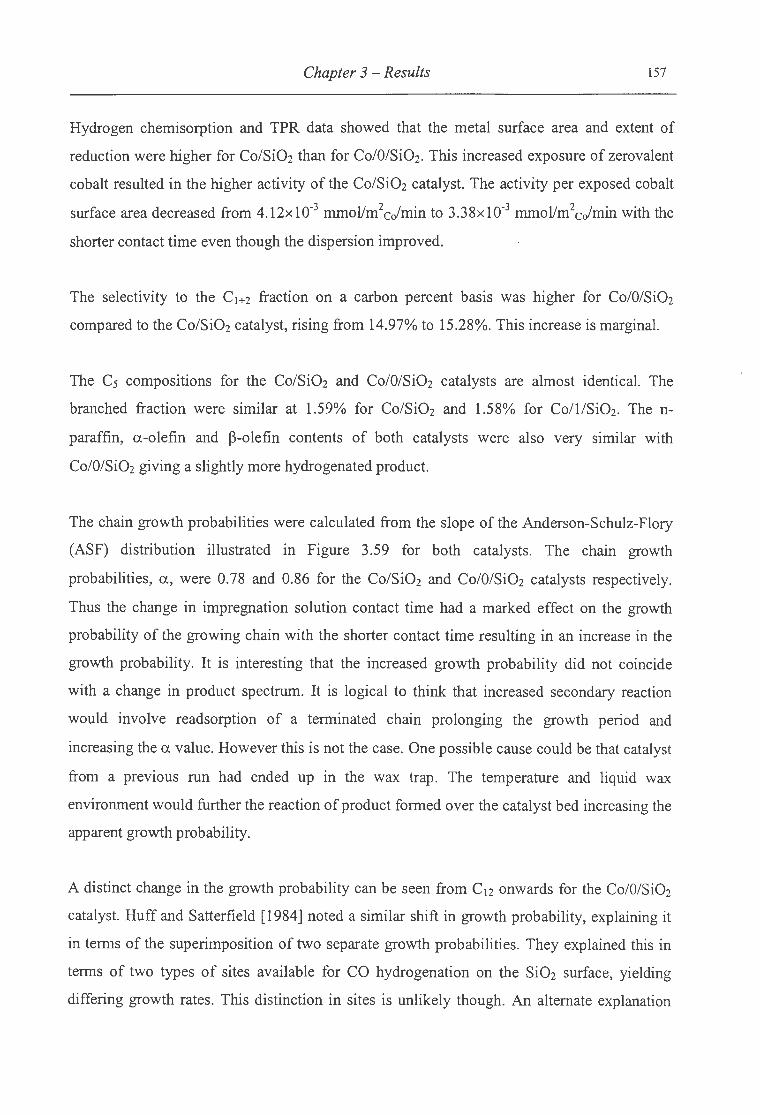
Chapter 3 -Results 157
Hydrogen chemisorption and TPR data showed that the metal surface area and extent of
reduction were higher for Co/Si02 than for Co/O/Si02. This increased exposure of zerovalent
cobalt resulted in the higher activity of the Co/Si02 catalyst. The activity per exposed cobalt
surface area decreased from 4.12x10⁻³ mrnol/m2colmin to 3.38x10⁻³ mrnol/m2colmin with the
shorter contact time even though the dispersion improved.
The selectivity to the C1+2 fraction on a carbon percent basis was higher for Co/O/Si02
compared to the Co/Si02 catalyst, rising from 14.97% to 15.28%. This increase is marginal.
The Cs compositions for the Co/SiOz and Co/O/Si02 catalysts are almost identical. The
branched fraction were similar at 1.59% for Co/Si02 and 1.58% for Co/1/Si02. The n
paraffin, a-olefin and P-olefin contents of both catalysts were also very similar with
Co/O/Si02 giving a slightly more hydrogenated product.
The chain growth probabilities were calculated from the slope of the Anderson-Schulz-Flory
(ASF) distribution illustrated in Figure 3.59 for both catalysts. The chain growth
probabilities, a, were 0.78 and 0.86 for the Co/Si02 and Co/O/Si02 catalysts respectively.
Thus the change in impregnation solution contact time had a marked effect on the growth
probability of the growing chain with the shorter contact time resulting in an increase in the
growth probability. It is interesting that the increased growth probability did not coincide
with a change in product spectrum. It is logical to think that increased secondary reaction
would involve readsorption of a terminated chain prolonging the growth period and
increasing the a value. However this is not the case. One possible cause could be that catalyst
from a previous run had ended up in the wax trap. The temperature and liquid wax
environment would further the reaction of product formed over the catalyst bed increasing the
apparent growth probability.
A distinct change in the growth probability can be seen from C12 onwards for the Co/0/Si02
catalyst. Huff and Satterfield [1984] noted a similar shift in growth probability, explaining it
in terms of the superimposition of two separate growth probabilities. They explained this in
terms of two types of sites available for CO hydrogenation on the Si02 surface, yielding
differing growth rates. This distinction in sites is unlikely though. An alternate explanation
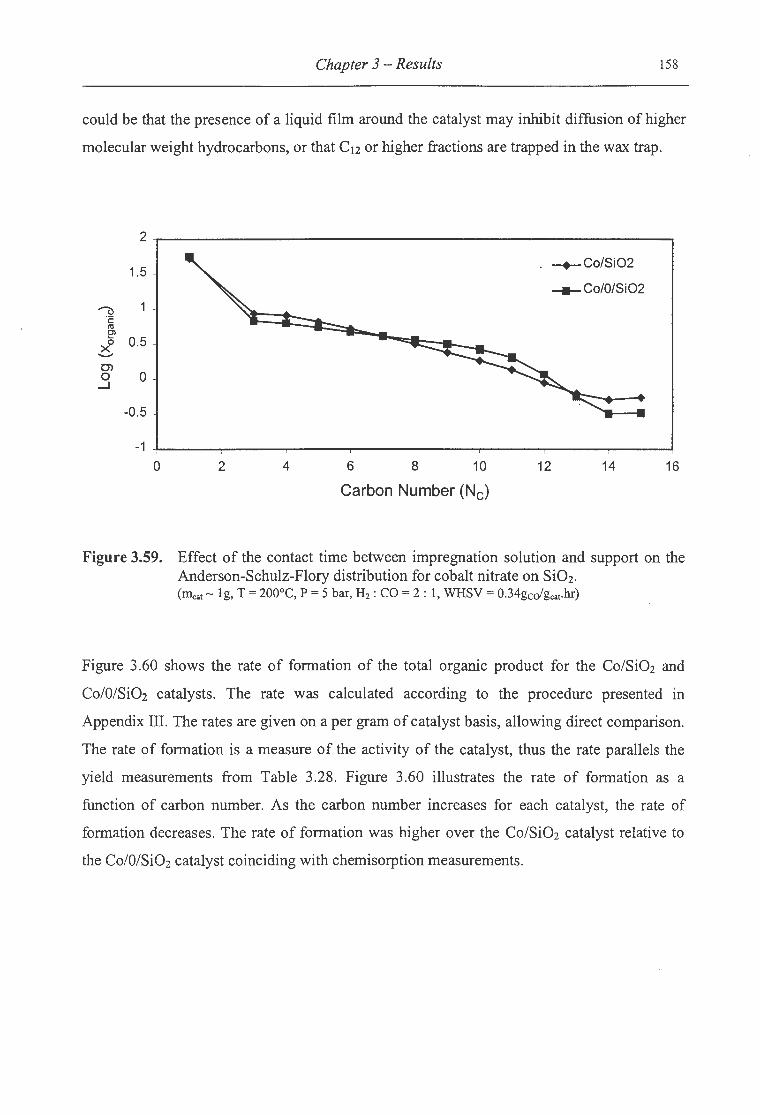
Chapter 3 - Results 158
could be that the presence of a liquid film around the catalyst may inhibit diffusion of higher
molecular weight hydrocarbons, or that C12 or higher fractions are trapped in the wax trap.
2
1.5 -+-Co/Si02
-Co/O/Si02 "()
·c: ro e> 0.5 >f -0>
0 _J
0
-0.5
-1
0 2 4 6 8 10 12 14 16
Carbon Number (Nc)
Figure 3.59. Effect of the contact time between impregnation solution and support on the Anderson-Schulz-Flory distribution for cobalt nitrate on Si02.
(m.:at- 1g, T = 200°C, P = 5 bar, Hz: CO= 2: 1, WHSV = 0.34gcdgcat·hr)
Figure 3.60 shows the rate of formation of the total organic product for the Co/Si02 and
Co/O/Si02 catalysts. The rate was calculated according to the procedure presented in
Appendix III. The rates are given on a per gram of catalyst basis, allowing direct comparison.
The rate of formation is a measure of the activity of the catalyst, thus the rate parallels the
yield measurements from Table 3.28. Figure 3.60 illustrates the rate of formation as a
function of carbon number. As the carbon number increases for each catalyst, the rate of
formation decreases. The rate of formation was higher over the Co/Si02 catalyst relative to
the Co/O/Si02 catalyst coinciding with chemisorption measurements.
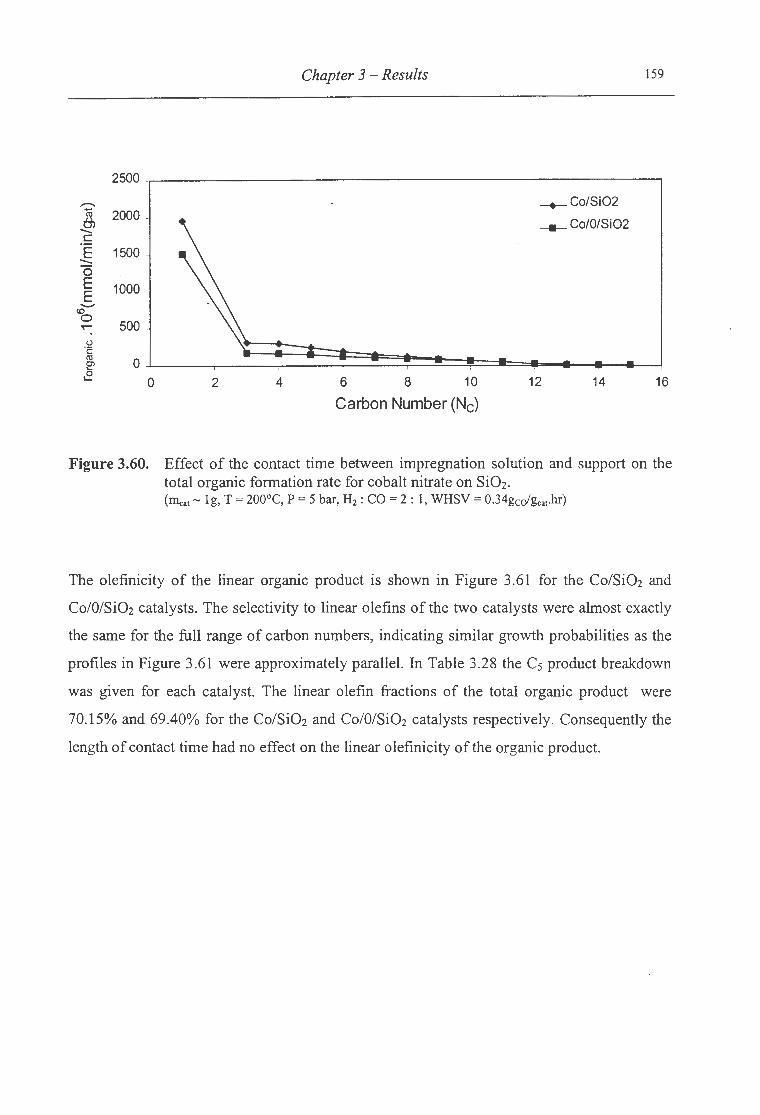
Chapter 3 -Results 159
2500
-+-Co/Si02
--- Co/O/Si02 ~ 2000 -c .E 1500 -0 E 1000 E -(!)
0 500 ~
u ·c: ro 0 e>
&5: 0 2 4 6 8 10 12 14 16
Carbon Number (Nc)
Figure 3.60. Effect of the contact time between impregnation solution and support on the total organic formation rate for cobalt nitrate on Si02. (~.1 - 1g, T = 200°C, P = 5 bar, H2: CO= 2: 1, WHSV = 0.34gcofgcat·hr)
The olefinicity of the linear organic product is shown in Figure 3.61 for the Co/Si02 and
Co/0/Si02 catalysts. The selectivity to linear olefins of the two catalysts were almost exactly
the same for the full range of carbon numbers, indicating similar growth probabilities as the
profiles in Figure 3.61 were approximately parallel. In Table 3.28 the C5 product breakdown
was given for each catalyst. The linear olefin fractions of the total organic product were
70.15% and 69.40% for the Co/Si02 and Co/O/Si02 catalysts respectively. Consequently the
length of contact time had no effect on the linear olefinicity of the organic product.

Chapter 3 - Results 160
100
-+-Co/Si02 - 80 -co/1/Si02 ?ft. 0 E - 60 -c Q) -c
40 0 ()
c t;:: Q) 20 0
0
0 2 4 6 8 10 12 14 Carbon Number (Nc)
Figure 3.61. Effect of the contact time between impregnation solution and support on the olefin fraction ofthe linear organic product for cobalt nitrate on Si02. (Il'lcat- 1g, T = 200°C, P = 5 bar, H2 : CO= 2 : 1, WHSV = 0.34gcofgcat·hr)
Table 3.28 shows the breakdown of the total linear olefin content of the C5 fraction for
Co/Si02 and Coll/Si02 respectively. The total linear olefin content is split up between the a
olefin content and the ~-olefin content. The ~-olefin fraction is made up of the cis and trans
2-pentene products. The a-olefin fraction of the linear olefins is illustrated in Figure 3.62 for
Co/Si02 and Co/O/Si02. The a-olefin fraction of the total organic product was 56.00% for the
Co/1/Si02 catalyst, and 56.31% for the Co/Si02 catalyst. This meant that the a-olefin
fraction of the linear olefin product over Co/O/Si02 and Co/Si02 were the same. Thus the
product spectrum remains unaltered as a result of a shorter contact time. This indicates that
the catalyst surfaces are identical in structure, and only differ in the availability of active sites
that affects the activity.
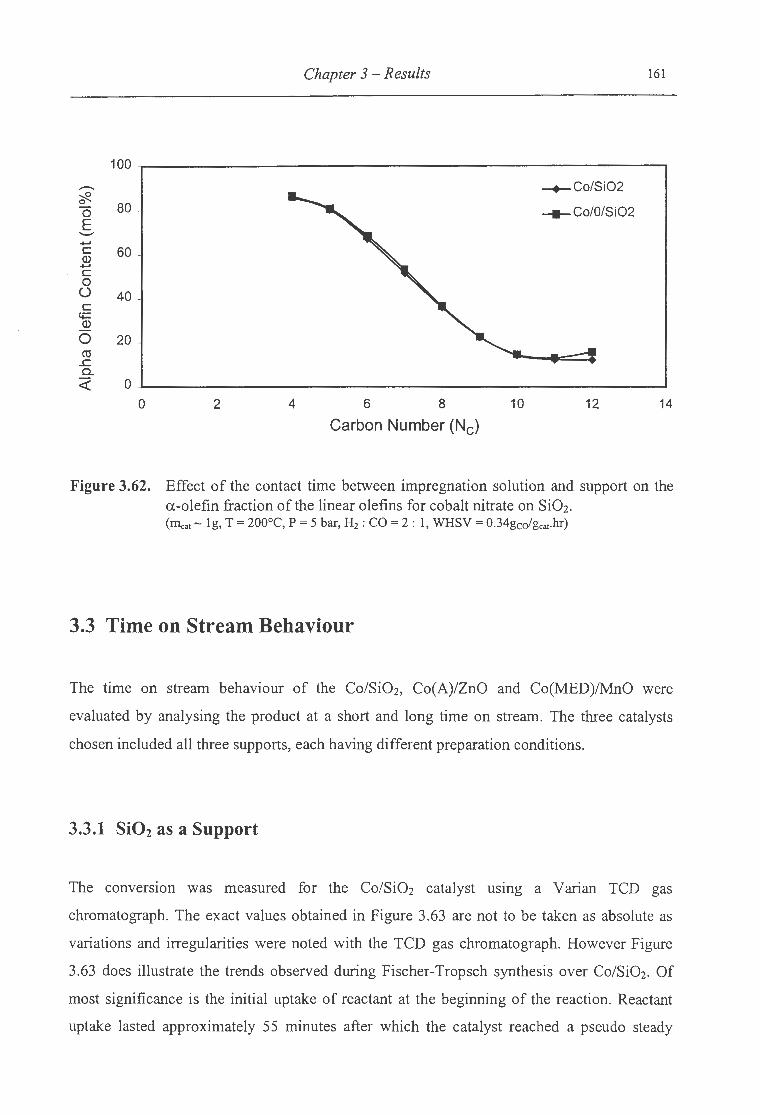
Chapter 3 -Results 161
100
- --+- Co/Si02 ~ 0
80 0 -Co/O/Si02 E .......... -c 60 Q) -c 0 () 40 c
'+= Q)
0 20 co
.r:. 0.. <( 0
0 2 4 6 8 10 12 14
Carbon Number (Nc)
Figure 3.62. Effect of the contact time between impregnation solution and support on the a-olefin fraction ofthe linear olefins for cobalt nitrate on Si02 .
(Illcat- 1g, T = 200°C, P = 5 bar, H2: CO= 2: 1, WHSV = 0.34gcofgca1.hr)
3.3 Time on Stream Behaviour
The time on stream behaviour of the Co/Si02, Co(A)/ZnO and Co(MED)/MnO were
evaluated by analysing the product at a short and long time on stream. The three catalysts
chosen included all three supports, each having different preparation conditions.
3.3.1 Si02 as a Support
The conversiOn . was measured for the Co/Si02 catalyst usmg a Varian TCD gas
chromatograph. The exact values obtained in Figure 3.63 are not to be taken as absolute as
variations and irregularities were noted with the TCD gas chromatograph. However Figure
3.63 does illustrate the trends observed during Fischer-Tropsch synthesis over Co/Si02• Of
most significance is the initial uptake of reactant at the beginning of the reaction. Reactant
uptake lasted approximately 55 minutes after which the catalyst reached a pseudo steady
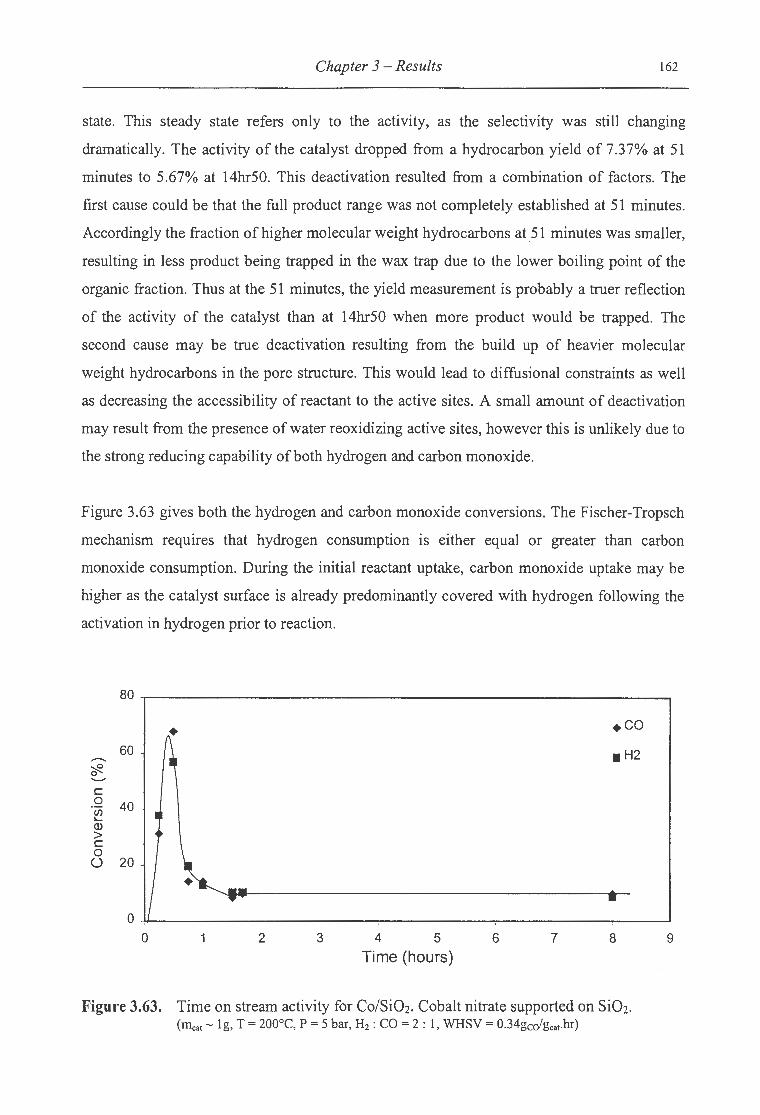
Chapter 3 -Results 162
state. This steady state refers only to the activity, as the selectivity was still changing
dramatically. The activity of the catalyst dropped from a hydrocarbon yield of 7.37% at 51
minutes to 5.67% at 14hr50. This deactivation resulted from a combination of factors. The
first cause could be that the full product range was not completely established at 51 minutes.
Accordingly the fraction of higher molecular weight hydrocarbons at 51 minutes was smaller,
resulting in less product being trapped in the wax trap due to the lower boiling point of the
organic fraction. Thus at the 51 minutes, the yield measurement is probably a truer reflection
of the activity of the catalyst than at 14hr50 when more product would be trapped. The
second cause may be true deactivation resulting from the build up of heavier molecular
weight hydrocarbons in the pore structure. This would lead to diffusional constraints as well
as decreasing the accessibility of reactant to the active sites. A small amount of deactivation
may result from the presence of water reoxidizing active sites, however this is unlikely due to
the strong reducing capability of both hydrogen and carbon monoxide.
Figure 3.63 gives both the hydrogen and carbon monoxide conversions. The Fischer-Tropsch
mechanism requires that hydrogen consumption is either equal or greater than carbon
monoxide consumption. During the initial reactant uptake, carbon monoxide uptake may be
higher as the catalyst surface is already predominantly covered with hydrogen following the
activation in hydrogen prior to reaction.
80
60 ~ -~ 0 ........... c
.Q 40 (j) I ..... (].) > c 0 u 20
I • --... ~ 0
• 0 1 2 3 4 5 6 7 8
Time (hours)
Figure 3.63. Time on stream activity for Co/Si02. Cobalt nitrate supported on Si02. (Illcat- lg, T = 200°C, P = 5 bar, H2 : CO= 2: 1, WHSV = 0.34gcofgcat·hr)
9

Chapter 3 -Results 163
Figure 3.64 shows the variation in chain growth with time on stream. The chain growth
probability was largely unaffected, except at higher molecular weight hydrocarbons where
the chain growth probability was not maintained at small times on stream. Increased reaction
time allows an equilibrium to be formed for the product diffusion from the catalyst surface
through the liquid film surrounding the catalyst into the gaseous phase to be carried out in the
product line. The saturation of the catalyst with hydrocarbon is at this stage not fully realised.
As a result the rate of readsorption of product has not been fully established yielding a drop
in the ASF plot at high carbon numbers. After 51 minutes on stream, the product termination
probability was stable up to the C11 fraction indicating that this equilibrium was still
developing for higher molecular weight hydrocarbons.
2
1.5 -+-51 min
----14hr50
'"""""0 0.5 ·c: Cll e'
0 xo -.._....
0) 0
-0 .5 _J
-1
-1.5
-2
0 2 4 6 8 10 12 14 16
Carbon Number (Nc)
Figure 3.64. Time on stream behaviour of the Anderson-Schulz-Flory distribution for Co/Si02. (rrlcat- 1g, T = 200°C, P = 5 bar, H2 : CO= 2 : 1, WHSV = 0.34gcofgcat·hr)
The time on stream behaviour of the olefin fraction of the total organic product is illustrated
in Figure 3.65. The olefin fraction consists of both the linear and branched olefin product.
The overall olefin selectivity was lower over the complete carbon number range for the
shorter time on stream. Figure 3.66 illustrates the ratio of the a-olefin to the n-paraffin at
each carbon number for the two times on stream. The longer time on stream of 14hr50
yielded a product richer in a-olefin relative to the hydrogenated product. The difference

Chapter 3 -Results 164
between the a-olefin and the n-paraffin arises in the termination step. The a-olefin forms
through hydrogen abstraction, while the n-paraffin results from the addition of hydrogen.
Figure 3.65 shows that at 51 minutes on stream, the hydrogenation reaction is more dominant
than after 14hr 50 resulting in the lower olefinicity of the organic product. Thus initially
hydrogen is more readily accessible than at later stages. This finding is explainable in terms
of the reduction prior to reaction. The catalyst was reduced at 400°C in a hydrogen
atmosphere. Hydrogen chemisorption indicated that the reversibility of hydrogen adsorption
was high over Co/Si02.
100
-+-51 minutes .-
80 ~ -14hr50 0
0 E - 60 -...... c Q) ...... c
40 0 0 c
t+= 20 Q)
0
0
0 2 4 6 8 10 12 14
Carbon Number (Nc)
Figure 3.65. Time on stream behaviour of the total olefin fraction of the organic product for Co/Si02. Olefin fraction includes linear and branched olefins. (Ineat- 1g, T = 200°C, P = 5 bar, H2 : CO= 2 : 1, WHSV = 0.34gCCY'gcat·hr)
This would suggest that hydrogen remains on the active sites during transfer to the reactor, as
well as during the initial phase of reaction. Carbon monoxide and hydrogen compete for
active sites. If the active sites are predominantly covered with hydrogen at the start, then it
seems logical that carbon monoxide will begin to replace hydrogen due to the fact that CO
adsorbs more strongly on cobalt. With time on stream the catalyst begins to favour the a
olefin primary product due to the enhanced presence of CO on the active sites. The high
activity of the Co/Si02 catalyst results in this replacement taking place at a rapid rate. As this
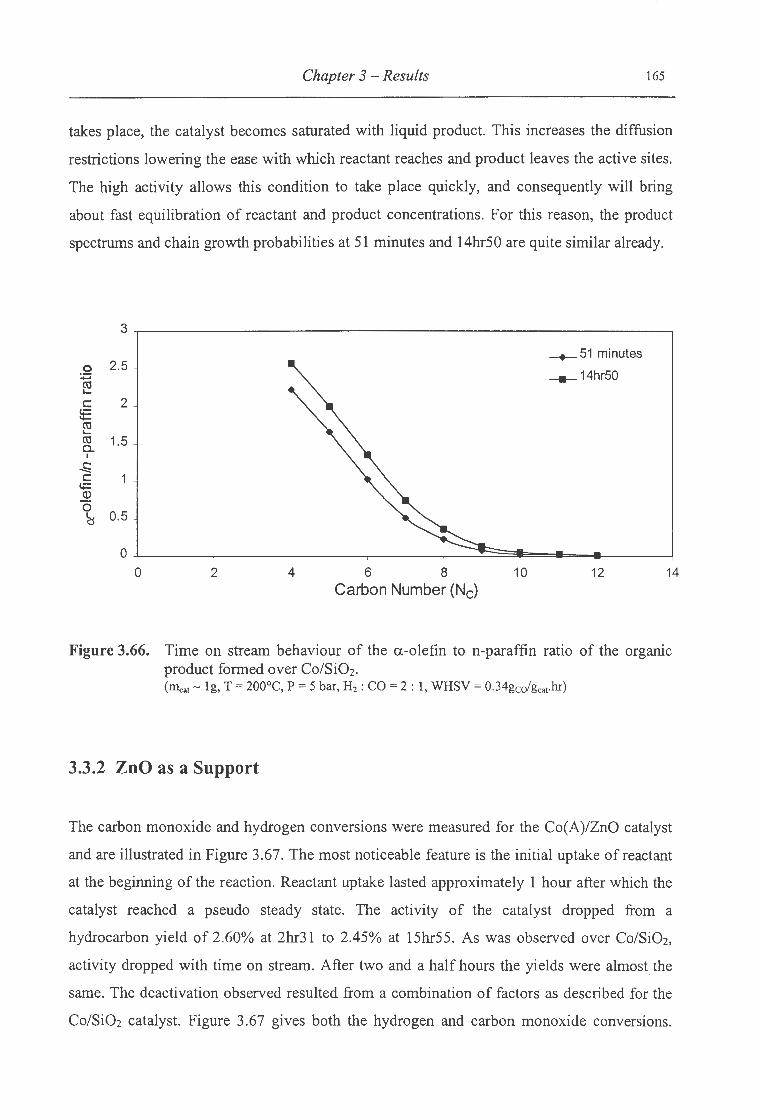
Chapter 3 - Results 165
takes place, the catalyst becomes saturated with liquid product. This increases the diffusion
restrictions lowering the ease with which reactant reaches and product leaves the active sites.
The high activity allows this condition to take place quickly, and consequently will bring
about fast equilibration of reactant and product concentrations. For this reason, the product
spectrums and chain growth probabilities at 51 minutes and 14hr50 are quite similar already.
3
---+-51 minutes 0 2.5
:;:; --- 14hr50 rn .... c 2 ~ rn .... rn 1.5 a..
I
..£:; c
t+= Cl)
0 0.5 ·~
0
0 2 4 6 8 10 12 14 Carbon Number (Nc)
Figure 3.66. Time on stream behaviour of the a-olefin to n-paraffin ratio of the organic product formed over Co/Si02. (Illcat- 1g, T = 200°C, P = 5 bar, H2 : CO= 2 : 1, WHSV = 0.34gcofgcar·hr)
3.3.2 ZoO as a Support
The carbon monoxide and hydrogen conversions were measured for the Co(A)/ZnO catalyst
and are illustrated in Figure 3.67. The most noticeable feature is the initial uptake of reactant
at the beginning of the reaction. Reactant uptake lasted approximately 1 hour after which the
catalyst reached a pseudo steady state. The activity of the catalyst dropped from a
hydrocarbon yield of 2.60% at 2hr31 to 2.45% at 15hr55. As was observed over Co/Si02,
activity dropped with time on stream. After two and a half hours the yields were almost the
same. The deactivation observed resulted from a combination of factors as described for the
Co/Si02 catalyst. Figure 3.67 gives both the hydrogen and carbon monoxide conversions.

Chapter 3 -Results 166
The Fischer-Tropsch mechanism requires that hydrogen consumption is either equal or
greater than carbon monoxide consumption. During the initial reactant uptake, carbon
monoxide uptake was observed to be higher at certain stages as the catalyst surface is already
predominantly covered with hydrogen following the activation in hydrogen prior to reaction.
80
.co • 60 •H2 ..-..
~ 0 .......... c 0 40 ·u; L.. (].) > c 0
(.) 20
• 0 0 0.5 1.5 2 2.5 3 3.5 4
Time (hours)
Figure 3.67. Time on stream activity for Co(A)/ZnO. (Illcat ~ 1g, T = 200°C, P = 5 bar, H2: CO= 2: 1, WHSV = 0.34gcofgca1.hr)
The chain growth probability can be seen in the Anderson-Schulz-Flory plots in Figure 3.68.
After 2hr31 of reaction, the ASF plots are almost an exact match. This indicates that the
diffusion pathway of product away from the catalyst surface has fully established itself for
the hydrocarbon range up to at least C1s- In other words, the liquid organic film around the
catalyst particles is formed, and product and reactant diffusion rates have stabilised, and
settled at steady state values. As the concentration of products leaving is still changing with
time on stream due to alterations observed in the product selectivity, however these
differences would not upset the density of the surrounding mixture as the changes taking
place are specific to each carbon number, due to variations in the final termination product
with time on stream.
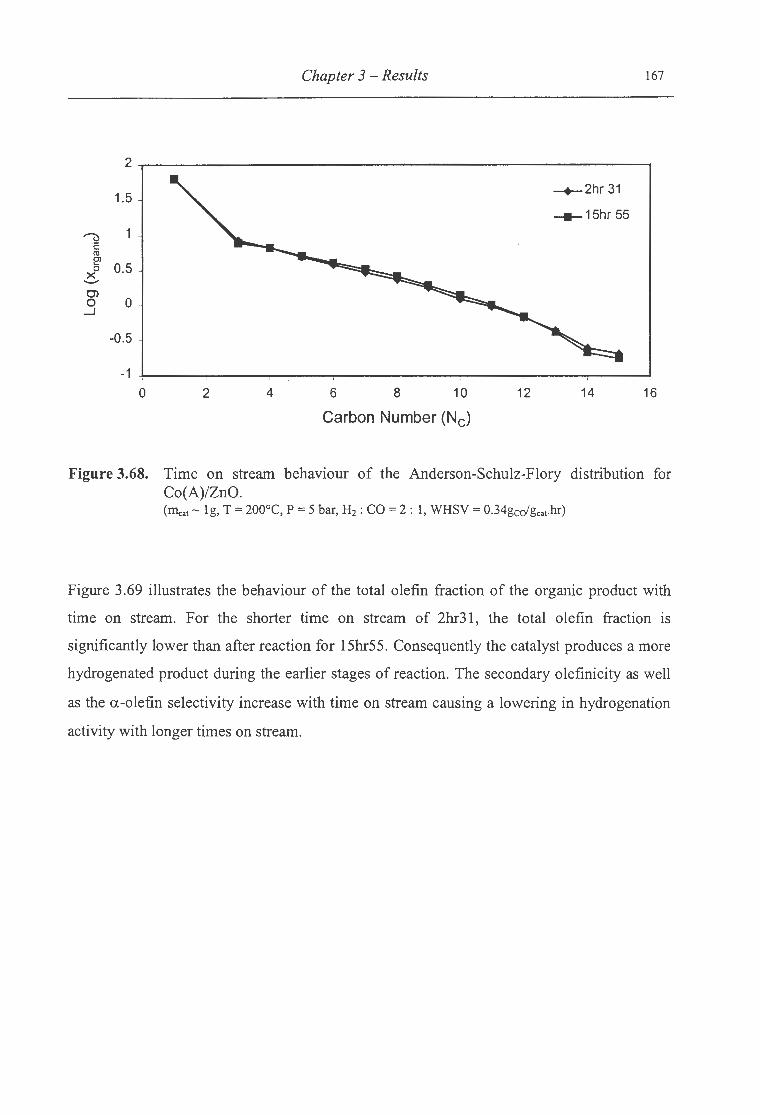
2
1.5
----u 1 ·c: ("Q
e> 0.5 0 X .......... 0> 0 _J
0
-0.5
-1
0
Chapter 3 - Results
2 4 6 8 10
Carbon Number (Nc)
12
~2hr31
-15hr55
14
167
16
Figure 3.68. Time on stream behaviour of the Anderson-Schulz-Flory distribution for Co(A)/ZnO. {m.,.1 - 1g, T = 200°C, P = 5 bar, H2: CO= 2: 1, WHSV = 0.34gcofgcat·hr)
Figure 3.69 illustrates the behaviour of the total olefin fraction of the organic product with
time on stream. For the shorter time on stream of 2hr31, the total olefin fraction is
significantly lower than after reaction for 15hr55. Consequently the catalyst produces a more
hydrogenated product during the earlier stages of reaction. The secondary olefinicity as well
as the a-olefin selectivity increase with time on stream causing a lowering in hydrogenation
activity with longer times on stream.

Chapter 3 - Results 168
100
-+-2hr 31 .....-..
80 ~ -15hr55 0
0 E ......... 60 ...... c Q) ...... c
40 0 (.)
c t;::
20 -Q)
0
0
0 2 4 6 8 10 12 14
Carbon Number (Nc)
Figure 3.69. Time on stream behaviour ofthe total olefin fraction of the organic product for Co(A)/ZnO. Olefin fraction includes linear and branched olefins. (rn.:a1 - lg, T = 200°C, P = 5 bar, H2 : CO= 2: 1, WHSV = 0.34gcofgca1.hr)
Figure 3.70 shows the behaviour of the ratio of a-olefin to n-paraffin with variation in time
on stream. At 2hr31, the low time on stream, the ratio of a-olefin to n-paraffin is significantly
lower than at 15hr55. This behaviour is attributed the still strong presence of hydrogen
adsorbed on the catalyst surface. As the catalyst activity is lower than that observed over
Co/Si02, the transition from a predominantly hydrogen covered surface following reduction
to a carbon monoxide dominated surface will take place more slowly. During the first few
hours of reaction, the reactant exchange, as well as the reduction of oxidised cobalt surface
species may enhance the hydrogenation activity.

Chapter 3 -Results 169
3
--+-2hr 31 0 2.5 -15hr55 :;::; ro ..... c 2 lE ro ..... ro 1.5 0..
I
c.: -c t+= Q)
0 0.5 I
~
0
0 2 4 6 8 10 12 14 Carbon Number (Nc)
Figure 3. 70. Time on stream behaviour of the a-olefin to n-paraffin ratio of the organic product formed over Co(A)/ZnO. (Illcat- 1g, T = 200°C, P = 5 bar, H2: CO= 2 : 1, WHSV = 0.34gcdgcat·hr)
3.3.3 MnO as a Support
The carbon monoxide and hydrogen conversions observed over the Co(MED)/MnO catalyst
can be seen in Figure 3. 71. Once again the most noticeable feature is the initial uptake of
reactant at the beginning of the reaction. Reactant uptake lasted approximately 1 hour after
which the catalyst reached a pseudo steady state. The yield of organic product increased from
1.05% after 21 minutes to 1.23% after 23hr46. According to Figure 3.71, after 21 minutes
reactant is being taken up through adsorption onto available surface sites. Consequently a
fraction of the active sites will not be completely covered, hence the catalyst is still not
making full use ofthe exposed active area.

Chapter 3 -Results 170
80~--------------------------------------------------------~
60
c 0
"(i) 40 1-Q)
> c 0 0 20 -
~ -04-----~~====~======~====~======~~--~
0 2 3 4 5 6
Time (hours)
Figure 3.71. Time on stream activity for Co(MED)/MnO. Cobalt nitrate supported on MnO with MED added to the impregnation solution. (m,.1 - 1g, T = 200°C, P = 5 bar, H2 : CO= 2: 1, WHSV = 0.34gcofgcat·hr)
The ASF plots at the different times on stream are illustrated in Figure 3.72. The chain
growth behaviour is only meaningful up to the C9 fraction. For higher molecular weight
hydrocarbons, a hump can be observed that is possibly associated with wax trap bleeding.
The fact that both ASF plots show this hump is indicative of bleeding. It is interesting to note
that the hump is more pronounced after 23hr46 on stream. The reason for this is that higher
molecular weight hydrocarbons are being formed as well as seeping from the wax trap as
opposed to the reaction behaviour after 21 minutes where no high molecular fraction has been
formed.
The absence of the heavier organic product after 21 minutes is understandable as the product
spectrum is still developing, as the FT reaction follows polymerisation behaviour. The higher
chain growth probability for the c3 to c9 fraction results from the lower extent of
readsorption during the early reaction stage prior to the formation of a liquid film around the
catalyst particles. The liquid film decreases the rate of diffusion of product away from the
catalyst enhancing readsorption and further chain growth. No liquid film limits readsorption
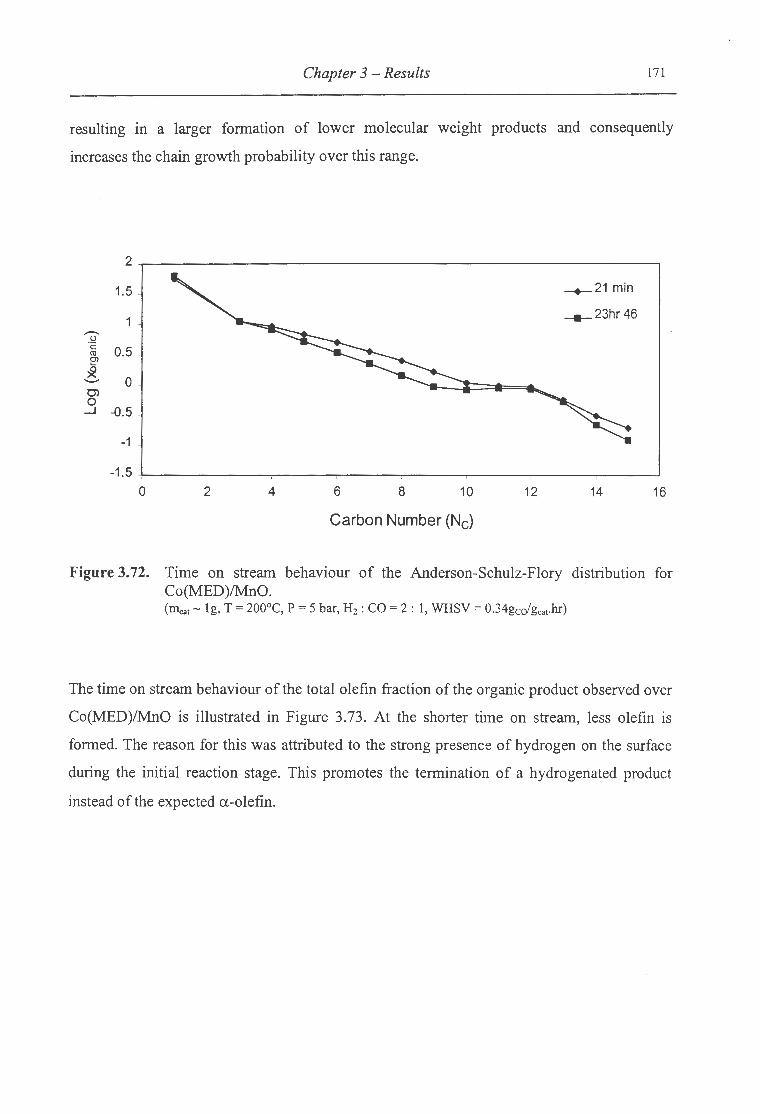
Chapter 3 - Results 171
resulting in a larger formation of lower molecular weight products and consequently
increases the chain growth probability over this range.
2
1.5 --+-21 min
---23hr46 .........
(.) ·c: 0.5 ro ~ ~
0 -0) 0 _J -D.5
-1
-1.5 0 2 4 6 8 10 12 14 16
Carbon Number (Nc)
Figure 3.72. Time on stream behaviour of the Anderson-Schulz-Flory distribution for . Co(MED)/MnO. (Illca1 - 1g, T = 200°C, P = 5 bar, H2: CO= 2: 1, WHSV = 0.34gcofgcat·hr)
The time on stream behaviour of the total olefin fraction of the organic product observed over
Co(MED)/MnO is illustrated in Figure 3.73. At the shorter time on stream, less olefin is
formed. The reason for this was attributed to the strong presence of hydrogen on the surface
during the initial reaction stage. This promotes the termination of a hydrogenated product
instead of the expected a-olefin.
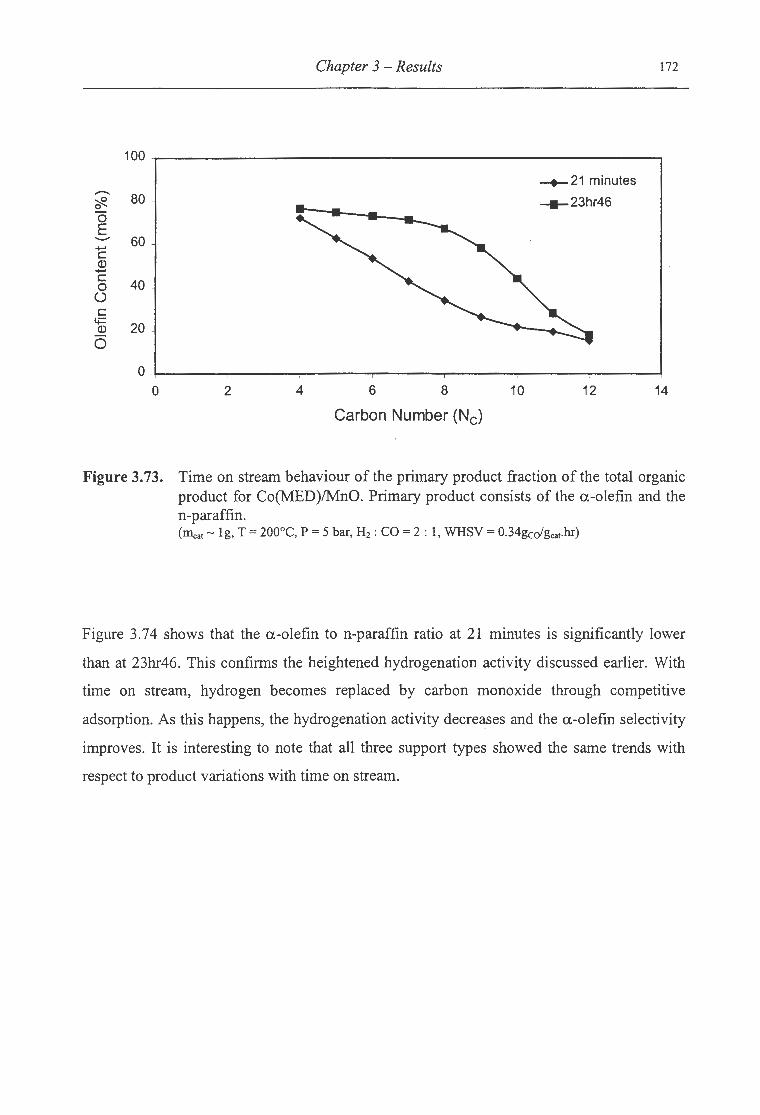
Chapter 3 - Results 172
100
-+-21 minutes - 80 ~ -23hr46 0
0 E ......... 60 -c Q) -c
40 0 u c
t.;:: 20 Q)
0
0 0 2 4 6 8 10 12 14
Carbon Number (Nc)
Figure 3. 73. Time on stream behaviour of the primary product fraction of the total organic product for Co(MED)!MnO. Primary product consists of the a-olefin and the n-paraffin. (Illcat- 1g, T = 200°C, P = 5 bar, H2: CO= 2 : 1, WHSV = 0.34gcofgca1.hr)
Figure 3.74 shows that the a-olefin to n-paraffin ratio at 21 minutes is significantly lower
than at 23hr46. This confirms the heightened hydrogenation activity discussed earlier. With
time on stream, hydrogen becomes replaced by carbon monoxide through competitive
adsorption. As this happens, the hydrogenation activity decreases and the a-olefin selectivity
improves. It is interesting to note that all three support types showed the same trends with
respect to product variations with time on stream.

Chapter 3 - Results 173
3.5
3 -+-21 minutes 0 -23hr46 :;::; ro 2.5 ..... c
lE 2 ro ..... ro 0..
1.5 I
c:: -c t+= Q)
0 I 0.5 tS
0
0 2 4 6 8 10 12 14 Carbon Number (Nc)
Figure 3.74. Time on stream behaviour of the a-olefin to n-paraffin ratio of the organic product formed over Co(MED)/MnO. (Illca1 - 1g, T = 200°C, P = 5 bar, H2: CO= 2 : 1, WHSV = 0.34gcofgcat·hr)


CHAPTER4
DISCUSSION


Chapter 4 -Discussion 174
4. Comparison of Si02, ZnO and MnO Supports
Studies documented in literature with respect to support type for cobalt supported Fischer
Tropsch catalysts indicate that the majority of work is carried out on silica (Si02) [e.g.
Kuipers et al., 1996; Kogelbauer et al., 1995; Coulter and Sault, 1995] and alumina (Ah03)
(e.g. Ragaini et al., 1996; Zsoldos et al., 1995]. Si02 has the benefit of a high surface area for
dispersion of the active component, but often a significant fraction of the loaded cobalt
deposits in inactive form as cobalt silicates arising through interaction with the support.
Using the cobalt supported on Si02 as a base case catalyst, ZnO and MnO were looked to as
alternative supports for cobalt supported Fischer-Tropsch catalysts. The effect of support can
be evaluated by comparing their physical characteristics and understanding how these
physical characteristics determine the performance characteristics under Fischer-Tropsch
conditions.
4.1 Physical Characterisation of Si02, ZnO and MnO Catalysts
The zeta potential measurements for the catalyst indicated that the point of zero charge (PZC)
was different for the three supports Si02, ZnO and MnO. The PZC for the Si02 support
occurred at the lowest pH of 2 , followed by MnO at a pH of 4 and finally ZnO at a pH of 8.
The plot of zeta potential versus pH gives an indication of the balance between positive and
negative charge on the support surface. At a pH below the PZC, each support bears a net
positive charge, and visa versa.
The zeta potential itself is not sufficient to characterise the interaction between cobalt and
support at any given pH. The zeta potential will indicate whether the cobalt is attracted to or
repelled by the majority of the support surface, however it can not show the magnitude of this
interaction. Consequently, when loading cobalt onto Si02 in a strong acidic medium, it seems
immediately apparent that strong repulsion should take place between support and cobalt.
However TPR showed that cobalt loaded at a pH of 1 showed minimal difference to the same
loading at a pH of 5.8. Consequently other effects are key to the level of interaction between
cobalt and support.

Chapter 4 -Discussion 175
Probably the most important effect must be the nature of the support surface. The support
nature refers to the various types of groups present, and both the charge on these groups and
the frequency with which they occur. These factors are determined by the degree of
crystallinity of the support material. A high crystallinity intimates a rigid repetitive structure
with few defects, and visa versa. Defects refer to the terminal groupings such as oxygen
atoms, hydroxyl groups and silanol groups that provide points of attachment for the charged
cobalt ions. It is these defects that are so important as attachment sites for the cobalt ions.
It was shown through XRD that ZnO had by far the highest degree of crystallinity, while
Si02 was completely amorphous. This difference has a significant effect on the physical
characteristics of the support material. Si02, being an amorphous material, is physically
defective in terms of the surface structure. The result is the availability of a wide range of
attachment points, especially groups bearing a negative charge, such as SiO-, which would
seek to interact with the Co2+ ions. These same groups are not available on the crystalline
ZnO support. The high crystallinity results in structured planes with minimal defective
groups for cobalt attachment. The frequency of surface defects on Si02 suggests that the
surface atoms, such as hydrogen, may be more mobile due to the apparent lack of repetitive
structure. This mobility may aid charge redistribution following cobalt impregnation
increasing the ease with which Co2+ ions are incorporated or attached. The formation of
cobalt silicates over Si02 may be accompanied by a lowering in the Gibbs free energy at the
surface through formation of more stable terminal species. This would not be the case on
ZnO, which would seek to maintain the crystal structure already in place. The MnO support
shows a degree of crystallinity between Si02 and ZnO, however a somewhat different effect
may be at play during cobalt impregnation on MnO, specifically with respect to the ease with
which manganese changes oxidation states.
Consequently both the crystallinity of the support material and the zeta potential of the
support in solution contribute to the strength of interaction arising during impregnation,
however the degree of crystallinity plays by far the greater role.
The extent of reduction and the exposed metal surface area were measured by TPR and
hydrogen chemisorption for the three support types. From these measurements, information
was obtained on the interaction between cobalt, loaded in both nitrate and acetate form, and
the support.

Chapter 4 -Discussion 176
The extent of reduction measured the fraction of the cobalt supported as the active zerovalent
form following reduction at 400°C for 16 hours in 5% H2 in N2 gas. On this basis, the ZnO
supported catalyst showed the highest extent of reduction, followed by Si02 and then MnO.
The extent of reduction of cobalt supported on MnO proved to be a problematic calculation
as the greater fraction of hydrogen consumption during TPR occurred through reduction of
the support material. Accordingly, no exact value could be attributed to the extent of
reduction of the cobalt, as no specific reduction step could be assigned to each reduction peak
due to offset hydrogen to cobalt molar ratios. It was assumed that the high temperature peak
of the Co!MnO reduction spectrum was due to supported cobalt oxide reduction arising from
interaction between cobalt and the MnO support. If this peak was a result of support
reduction alone, the extent of reduction would change significantly from 28.7% to
approximately 100%, unlikely considering the low activity obtained over the Co!MnO
catalyst under Fischer-Tropsch conditions. The differing extents of reduction for the three
supports derived from the type of interaction arising between cobalt and support for each case
or from interaction between cobalt as well as between cobalt and MED where used.
The ZnO supported catalysts maintained an extent of reduction consistently higher than the
other two supports irrespective of preparation conditions due to the low interaction between
support and cobalt. In fact, the support may even have repelled the positively charged cobalt
ions. Repulsion would arise due to electronic interactions as observed using zeta potential
measurements. A strongly positive support surface resulting from the acidic impregnation
medium used would attempt to counter the presence of positively charged Co2+ ions. This
positive surface, combined with the fact that ZnO shows a highly ordered crystal framework
yielding few surface defects, would mean few terminal surface sites attractive to cobalt ions.
Thus the ZnO surface behaves as little more than a physical resting point for cobalt following
evaporation of the impregnation solution. In fact, as the impregnation solution equilibrated
over two days, no solution colour change was observed intimating that cobalt remained
preferentially in solution as opposed to being adsorbed on the support. This has great
significance in terms of the final physical characteristics of the activated catalyst. Hydrogen
chemisorption revealed a lower exposed metal surface area than expected for cobalt loaded
on ZnO in both acetate and nitrate form. The reason for this is that zerovalent cobalt on the
surface groups together as large clusters. In so doing active cobalt particles are buried under
subsequent cobalt layers and are no longer available as active sites. This grouping or

Chapter 4 -Discussion 177
agglomeration of cobalt on the surface is a direct response to the absence of metal support
interaction. The result is that cobalt mobility across the surface of the support becomes
greatly enhanced, and cobalt finds stability among its own kind on the surface. The above
described effects are specific to the ZnO support. Far greater metal support interaction was
noted over both Si02 and MnO, but the interactions differed in that they were resulted from
different effects.
The Si02 support has long been known to interact with cobalt following aqueous
impregnation. The metal support interaction has been seen to vary significantly with changes
in precursor, calcination temperature and activation temperature indicating that the physical
nature of the Si02 surface is readily alterable [Sewell, 1996]. The reason for this stems from
the amorphous nature of the SiOz material. Amorphous refers to a structure that is not rigidly
repetitive as is the case with a strong crystal lattice. The result is that the surface is more
defective and provides a number of different options for attachment which would not be
available under more structured conditions. With this in mind, it seems logical that
temperature would enhance the ease with which the surface could rearrange itself into a
structure favourable for cobalt incorporation. This is exactly what is observed following
calcination. Sewell [1996] showed that higher calcination temperatures lead to significantly
higher cobalt silicate formation. The surface defects are present as positive and negative
groupings, the negative groups showing an electronic attraction to Co2+ ions. The strength of
the interaction serves to prevent significant relocation of the adsorbed cobalt during
activation, as was evident with the ZnO support. This inhibition prompted higher cobalt
dispersions and lower cobalt crystallite sizes. The exposed metal surface area on Si02 was
seen to be a function of the propensity for cobalt to migrate into the SiOz network resulting in
cobalt silicates. The more silicates present the lower the metal surface area. The performance
of the Fischer-Tropsch catalyst is largely determined by the cobalt dispersion and the extent
of reduction of the cobalt. These effects are counterproductive, with high dispersion generally
coinciding with low extents of reduction and visa versa. The Co/SiOz catalyst harnesses these
two features the best out of the catalysts studied, yielding a high dispersion with a moderate
metal support interaction which in turn did not suppress the extent of reduction to a great
degree. Figure 4.1 illustrates the relationship between the exposed surface area of metallic
cobalt and the extent of reduction ofthe total cobalt on the support for each catalyst prepared.
In all cases, irrespective of the preparation procedure, the catalyst with the extent of reduction
in between the other two catalysts prepared with the same method always had the highest

Chapter 4 -Discussion 178
exposed cobalt surface area. For example, of the catalysts prepared through MED addition to
the impregnation solution Co(MED)/MnO showed the highest exposed cobalt surface area
but had the second highest extent of reduction. For every preparation procedure, the same
trend occurred, with the middle extent of reduction resulting in a catalyst with the highest
exposed cobalt surface area for that preparation procedure. This phenomenon explains the
apparent lack of activity of the ZnO supported catalysts. Prior to reaction work, it was
thought that ZnO supported catalysts would yield high FT activities due to the ease with
which cobalt reduction took place. The conclusion to be drawn from this is that metal support
interaction, a phenomenon with a predominantly negative connotation, is as imperative to the
catalyst functioning as a high degree of reducibility is. On their own, neither characteristic is
sufficient to achieve the much sought after activity.
Thus ZnO alone is inadequate as a Fischer-Tropsch support. The low surface area of 3.1 m2 I g
is insufficient as cobalt agglomeration becomes increasingly more probable. This, together
with it's high crystallinity that suppresses metal support interaction, results in a catalyst ill
equipped for Fischer-Tropsch synthesis in terms of activity.
Much the same conclusion can be drawn for MnO supported catalysts, however for different
reasons than those associated with ZnO. MnO is problematic as a support material due to it's
innate ability to alter oxidation states. This characteristic is influential in terms of activity, as
the shift of oxidation state of the manganese support enhances the formation of spinel
structures at the expense of the zerovalent active cobalt.
Thus Si02, chosen as a base case on which to evaluate the ZnO and MnO performance,
remains the superior choice of support due to the materials amorphous nature and it's ability
to use metal support interaction to promote cobalt dispersion leading to significantly
improved activity.
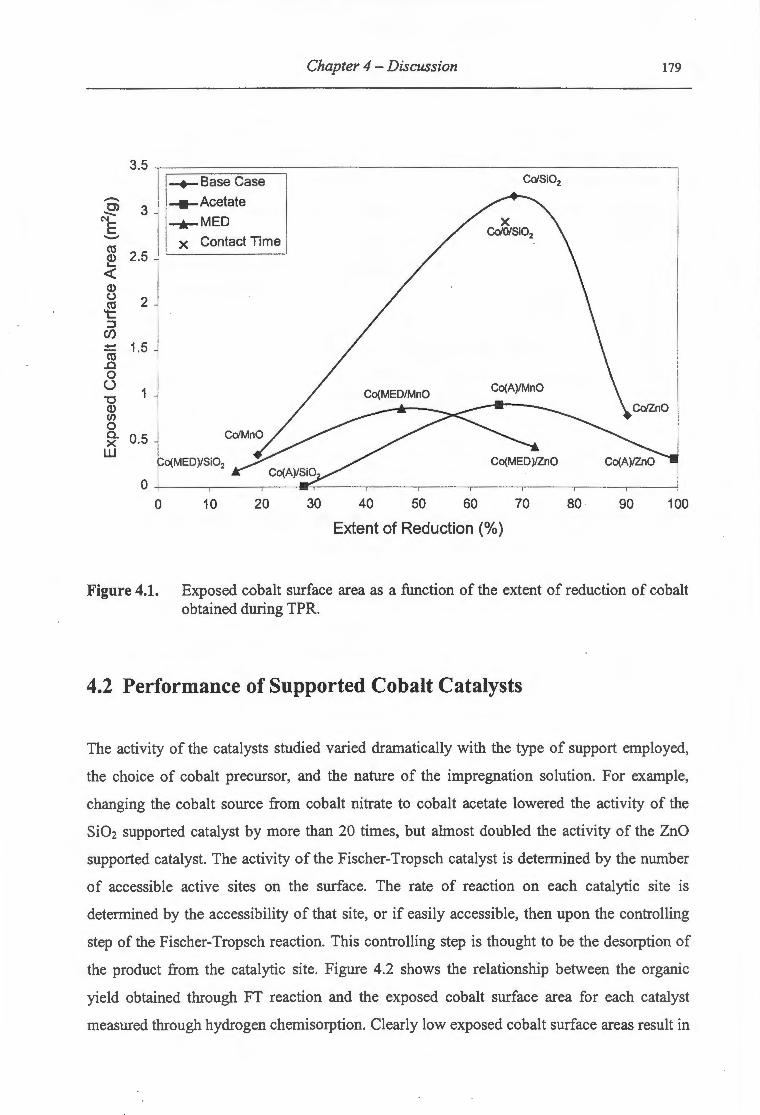
Chapter 4 -Discussion 179
3.5 -+-Base Case Co'Si02 - -Acetate 0) 3 N"" ......._MED E ........ Contact Time co X
Q) 2.5 ...... 4:: Q) u 2 {g :;:)
(f) - 1.5 co ..c 0 u "0 Q) (/)
0 a. 0.5 X w
Co(MED)/Si02
0 0 10 20 30 40 50 60 70 80 90 100
Extent of Reduction (%)
Figure 4.1. Exposed cobalt surface area as a function of the extent of reduction of cobalt obtained during TPR.
4.2 Performance of Supported Cobalt Catalysts
The activity of the catalysts studied varied dramatically with the type of support employed,
the choice of cobalt precursor, and the nature of the impregnation solution. For example,
changing the cobalt source from cobalt nitrate to cobalt acetate lowered the activity of the
Si02 supported catalyst by more than 20 times, but almost doubled the activity of the ZnO
supported catalyst. The activity of the Fischer-Tropsch catalyst is determined by the number
of accessible active sites on the surface. The rate of reaction on each catalytic site is
determined by the accessibility of that site, or if easily accessible, then upon the controlling
step of the Fischer-Tropsch reaction. This controlling step is thought to be the desorption of
the product from the catalytic site. Figure 4.2 shows the relationship between the organic
yield obtained through FT reaction and the exposed cobalt surface area for each catalyst
measured through hydrogen chemisorption. Clearly low exposed cobalt surface areas result in

Chapter 4 -Discussion 180
inactive catalysts that give low organic yields and visa versa. Consequently as the exposed
cobalt surface area increases, the yield of product should also increase. It is logical that this
relationship is linear, as more available active sites should coincide with a comparative
increase in yield of product. The scatter of points at low yields may arise from the inaccuracy
of the hydrogen chemisorption measurements. The three points at high exposed cobalt
surface area are from cobalt nitrate supported on Si02. From Figure 4.2 it is clear that there
exists a significant difference in catalytic activity between the cobalt nitrate on Si02 catalysts
and the other catalysts prepared. The MnO support resulted in a consistently low activity
irrespective of preparation procedure, while the changes in the preparation procedure resulted
in significant variances when using the ZnO support.
Changes in the support type resulted in significant variations in the selectivity of each
catalyst. These differences stemmed from the interaction between cobalt and the support ·
used. This interaction could be altered by changing the preparation conditions through
adjustment of different variables.
The selectivity of each catalyst was strongly dependent upon the interaction between cobalt
and support. Hydrogen chemisorption gave information on the reversibility of adsorption of
hydrogen on the active sites. Hydrogen adsorption reversibility was calculated as the fraction
of hydrogen not removed from the catalyst following 15 minutes of evacuation. Bartholomew
and Reuel [1985] equated the degree of reversibility with the strength of metal support
interaction. A higher reversibility was seen to be indicative of a stronger metal support
interaction. The hydrogen adsorption reversibility is also described as a measure of the
strength with which the hydrogen is adsorbed on the cobalt. It is unlikely that different sites
offer differing strengths of adsorption. Thus a high hydrogen adsorption reversibility
indicates a high degree of readsorption of hydrogen during diffusion out of the catalyst pore
structure and is related to the strength of metal support interaction in that strong interaction
favours higher cobalt dispersion. The higher dispersion results in a greater availability of
zerovalent cobalt attachment points as the hydrogen moves through the pore structure.
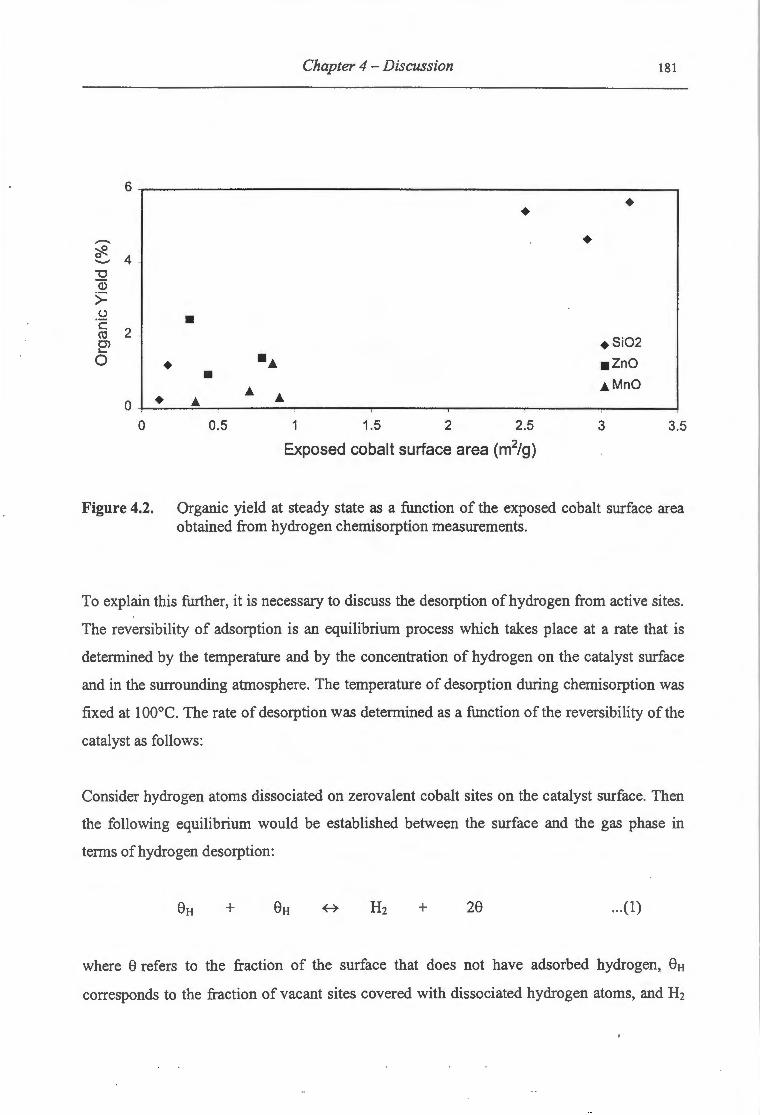
Chapter 4 -Discussion 181
6
• • ---- • ~ 0 4 ........... "0 Q)
>= (.) • c co 2
.sio2 e> 0 • ·~ .zno •
~ ~MnO
0 ' • ~ ~
0 0.5 1 1.5 2 2.5 3 3.5
Exposed cobalt surface area (m2/g)
Figure 4.2. Organic yield at steady state as a function of the exposed cobalt surface area obtained from hydrogen chemisorption measurements.
To explain this further, it is necessary to discuss the desorption of hydrogen from active sites.
The reversibility of adsorption is an equilibrium process which takes place at a rate that is
determined by the temperature and by the concentration of hydrogen on the catalyst surface
and in the surrounding atmosphere. The temperature of desorption during chemisorption was
fixed at 1 00°C. The rate of desorption was determined as a function of the reversibility of the
catalyst as follows:
Consider hydrogen atoms dissociated on zerovalent cobalt sites on the catalyst surface. Then
the following equilibrium would be established between the surface and the gas phase in
terms of hydrogen desorption:
+ + 28 ... (1)
where 8 refers to the fraction of the surface that does not have adsorbed hydrogen, 8H
corresponds to the fraction of vacant sites covered with dissociated hydrogen atoms, and H2

Chapter 4 -Discussion 182
is gas phase hydrogen. It is assumed that each site can only occupy a single hydrogen atom. It
follows that the rate at which desorption takes place can be described as follows:
... (2)
where ~ is the intrinsic rate constant of desorption in units of time-1• Rearranging and
integrating this expression yields the following time dependence of the hydrogen coverage of
the surface:
1/8H,t - 1 = ... (3)
The reversibility is defined as the amount of hydrogen not removed by evacuation relative to
the total hydrogen uptake ofthe catalyst and can be written as follows:
Reversibility = VH2,irr ... (4)
VH2, total
where V H2,irr denotes the volume of hydrogen not removed at time t, while V H2,total refers to
the total hydrogen uptake of the catalyst. V H2,irr is not an absolute reversibility. It refers only
to the fraction of sites still covered after time t of desorption. It is possible to remove all
hydrogen atoms under vacuum if the surrounding atmosphere is free of diatomic hydrogen, as
the desorption is time dependent. However during chemisorption, desorbed hydrogen passes
through the pore system to the surrounding atmosphere. As this happens, the desorbed
hydrogen has further opportunity to readsorb on other sites within the pore structure.
Consequently each site experiences an intrinsic desorption constant, ~' but the catalyst sees
an overall desorption constant, ~.observed, which includes the readsorption rate constant.
8H also describes the fraction of surface sites occupied by hydrogen atoms at time t such that
the following expression arises:
= VH2,irr Reversibility ... (5)
VH2, total
Chapter 4 -Discussion 183
Combining equations (3) and (5), the following expression for the rate of desorption
(ki,observed) as a function of reversibility and time is attained:
kl,observed [units: time-1] = 1 Reversibility ... (6)
t . Reversibility
Thus the reversibility can be seen to be a function of time and the overall rate at which
hydrogen desorbs during this time. Consequently, the higher the rate of readsorption of
hydrogen, the lower the observed rate constant will be, resulting in a higher reversibility of
adsorption. As reversibility was measure after 15 minutes, the t term was constant for all
reversibility calculations. Thus the reversibility was only a measure of the observed rate
constant of desorption for each catalyst. The above discussion gives physical meaning to the
term reversibility. It remains to describe the implications of this reversibility of hydrogen
adsorption on the performance of the catalyst under FT conditions.
The Fischer-Tropsch synthesis reaction consists of a polymerisation reaction that combines a
complex system of primary and secondary reaction steps to attain a product rich in a wide
variety of organic species. It is this broad spectrum of products that necessitates an
understanding of the principle factors governing specific products within this spectrum so as
to create an environment conducive to increasing their selectivity. Earlier, the metal surface
area was discussed, and it was shown that generally the higher the exposed cobalt surface
area, the higher the activity of the catalyst would be. However the availability of cobalt sites
is not enough to explain the acquired product spectrums achieved. It is here that the
reversibility of hydrogen adsorption may play a significant role. As a high reversibility of
hydrogen adsorption was shown to denote a higher degree of readsorption of hydrogen atoms
to the surface, it would seem logical that the following changes would result in the product
spectrum. The increased opportunity for readsorption on the surface through greater
distribution of active phase through the support pore structure would increase secondary
reaction activity. Consequently the hydrogenation activity and secondary isomerisation
activity would increase. From the FT product spectrums obtained, it was noted that the
changes in these selectivity parameters following alterations to the preparation procedure
Chapter 4 -Discussion 184
paralleled the change in reversibility for a given support. This was true for all catalysts
prepared with the exception of Co(MED)/Si02 and Co(MED)/MnO ·where the opposite
occurred.
The reversibility effect was especially prevalent over the ZnO supported catalysts. The
hydrogen adsorption reversibility over Co/ZnO was the lowest of all catalysts prepared at
39.1 %. Following impregnation of cobalt acetate on ZnO to yield the Co(A)/ZnO catalyst, the
reversibility increased from 39.1% to 67.1 %. This corresponded to a decrease in the a-olefin
percent of the C5 fraction from 77.21% to 56.81%, while the n-paraffin fraction increased
from 22.13% to 28 .17%. The double bond shift activity increased resulting in an increase in
secondary linear olefins from 4.06% to 13.02% of the C5 fraQtion. The chain growth
probability dropped from 0.81 to 0.79. Exactly the same trends were observed following
addition ofMED to the impregnation solution.
Bartholomew and Reuel [1985] equated the degree of reversibility with the strength of metal
support interaction. On this basis, the Si02 supported catalysts should show the highest
hydrogen adsorption reversibilities. This was observed for the base case catalysts prepared.
Thus the reversibility of adsorption may in turn be partly determined by the crystallinity of
the support material, with a more amorphous structure enhancing the metal support
interaction and consequent reversibility.

CHAPTERS
CONCLUSIONS

Chapter 5 - Conclusions 185
5. Conclusions
Si02, ZnO and MnO were investigated as supports for cobalt Fischer-Tropsch catalysts. Si02
is well established as a support, but little work has taken place with respect to the other two
support types. Cobalt nitrate impregnated on each of the three supports in aqueous medium
served as a base case with which to compare variations in the catalyst precursor, type of
impregnation solution, pH of impregnation solution and the contact time between the
impregnation solution and the support. It was shown that cobalt nitrate on Si02 impregnated
in a water medium gave the best activity under Fischer-Tropsch conditions, a result of the
factors discussed below.
The physical characteristics of the three supports were seen to vary significantly. The
crystallinity of the supports, obtained through X-ray diffractometry, differed greatly. The
degree of crystallinity was lowest for the amorphous Si02 support, increasing for MnO, with
ZnO showing the by far the highest degree of crystallinity. The degree of crystallinity has an
important role to play in determining the strength of interaction between cobalt and support.
The higher degree of crystallinity of ZnO resulted in a catalyst with weak and possibly non
existent metal support interaction. The net effect was to heighten the degree of reducibility of
the supported cobalt precursor, a favourable result of the low interaction. The opposite effect
was noted over Si02 and MnO. Both Si02 and MnO showed a more amorphous structure,
leading to stronger metal support interaction. This interaction decreased the degree of
reduction of the supported cobalt. In the case of Si02, the formation of cobalt silicate species
was largely responsible for the lower reducibility. With the MnO support, the presence of
either nitric acid or the decomposition of the nitrate precursor created a strong oxidising
environment that lead to the oxidation of the MnO to a higher oxidation state. Where this
oxidation was noted, the formation of spinel structures between the Co2+ and Mn3+ species
resulted lowering the degree of reducibility ofthe supported cobalt.
It was seen that the presence of a degree of metal support interaction was a key factor in
determining the activity of the catalyst. Metal support interaction results in the binding of the
cobalt to the support surface and lowers the cobalt mobility during drying and activation. In
so doing cobalt dispersion is maintained increasing the exposure of the active cobalt phase to
Chapter 5 - Conclusions 186
reactant under Fischer-Tropsch conditions. Over ZnO, the absence of metal support
interaction resulted in agglomeration of the cobalt lowering the exposed cobalt surface area
available for reaction. On this basis, it is clear that catalyst activity is optimised through
achieving a high degree of cobalt reduction while maintaining dispersion through the
presence of metal support interaction. Of the catalysts prepared, cobalt nitrate impregnated on
Si02 (Co/Si02) combined these two factors to give the highest activity.
A second physical characteristic important in determining the strength of interaction between
the cobalt precursor and the support is the zeta potential of the support at the pH of
impregnation, where the zeta potential is a measure of the net surface charge on the support.
It was found that the point of zero charge (PZC) of the three supports took place at
significantly different pH's. The PZC of Si02 occurred between a pH of 2 and 5, while for
ZnO and MnO, the PZC was at a pH of 8 and 4 respectively. The net surface charge at a pH
below the PZC was positive for each support, and vice versa.
For the base catalysts, the activity decreased from Co/Si02 to Co/ZnO to Co/MnO coinciding
with the exposed metal surface area calculated through hydrogen chemisorption. Co/ZnO
showed significantly less secondary product formation under Fischer-Tropsch synthesis
conditions, a consequence of the lower reversibility of adsorption indicating less opportunity
for readsorption of terminated primary product during diffusion out of the catalyst pore
structure.
The effect of precursor was studied by changing from cobalt nitrate to cobalt acetate. The use
of the acetate precursor resulted in the presence of Co2+ on the support surface following
drying and calcination as the oxidizing environment created through acetate decomposition
was too weak to shift divalent cobalt to the trivalent form. The extent of reduction increased
for the ZnO and MnO supported catalysts, and decreased dramatically for the Si02 catalyst as
a result of increased cobalt silicate formation. Activities improved for the ZnO and MnO
supported catalysts, coinciding with higher secondary hydrogenation and isomerisation
activity as a result of higher reversibilities of adsorption for both catalysts.
MED addition to the impregnation solution resulted in the complexation of Co2+ ions in
solution with the strong field MED ligands, replacing water ligands initially surrounding the
Chapter 5 - Conclusions 187
cobalt in solution. As MED is a strong field ligand, interaction between cobalt and the
support was decreased lowering the ease of attachment of cobalt to the support surface. In so
doing, the influence of the support was lowered, with reduction taking place as a single peak.
The extent of reduction was lower over Si02 and ZnO, but increased over MnO following the
addition of MED. The dispersion and exposed metal surface area followed the same trend,
both decreasing over Si02 and ZnO, but increasing over MnO. MED addition enhanced the
secondary hydrogenation and isomerisation activity over SiOz and ZnO, but lowered the
same activity over MnO.
The pH, adjusted with nitric acid for cobalt nitrate impregnation and with acetic acid for
cobalt acetate impregnation, altered the net surface charge of the support surface bringing
about the following changes in physical and performance characteristics. The extent of
reduction of cobalt nitrate on Si02 dropped with nitric acid addition, while the cobalt
dispersion improved. Performance under Fischer-Tropsch conditions showed mmor
differences in terms of activity and selectivity, with acid addition showing less secondary
reaction activity. The addition of acetic acid to cobalt acetate on Si02 lowered the
impregnation pH from 6.5 to 4 resulting in an organic yield twice that prior to acid addition, a
lower selectivity to the C1+2 fraction, and slightly lower secondary activity. The addition of
nitric acid to cobalt nitrate impregnated on MnO resulted in the further oxidation of the MnO
support already observed without acid addition. It was found that both the decomposition of
the nitrate precursor as well as the presence of nitric acid in the impregnation solution
resulted in the oxidation of the MnO support. As a result, the addition of nitric acid had little
effect on the extent of reduction of the cobalt, but dramatically improved the exposed cobalt
surface area which lead to increased activity. The selectivity remained largely unaffected by
nitric acid addition.
It was found that the pH of the impregnation solution changed with the length of contact time
between support and the impregnation solution, especially for cobalt nitrate impregnation.
The increased pH was a result of charge equilibration between the support and the cobalt
nitrate. The contact time between support and impregnation solution had little effect upon the
physical and performance characteristics of cobalt nitrate impregnated on Si02. The extent of
reduction was lower for the shorter contact time, while the cobalt dispersion improved. The
hydrogen adsorption reversibility also improved coinciding with a higher chain growth

Chapter 5 - Conclusions 188
probability. The overall activity was lower for the shorter contact time, while the selectivity
of the C5 fraction was generally unaffected.
Investigation of the time on stream behaviour showed that hydrogenation activity was higher
during the early reaction stages as a result of the hydrogen coverage of the catalyst following
reduction. With increasing time on stream, the a-olefin fraction increases as carbon
monoxide competes for adsorption sites.

REFERENCES


References
References
Adesina, A. A., Appl. Catal., 138 (1996) 345-367.
Ali, S., Chen, B. and Goodwin, J. G., Jr., J. Catal., 157 (1995) 35.
Amelse, J. A., Butt, J. B. and Schwartz, L. J., J. Phys. Chern., 82 (1978) 558.
Anderson, R. B., in "Catalysis IV", P. H. Emmett (Editor), Reinhold, New York, 1956.
Anderson, R. B., Seligman, B., Schulz, J. F., Kelly, R. and Elliott, M. A, Ind. Eng. Chern., 44
(1952) 391.
Anderson, R. B., The Fischer-Tropsch Synthesis, Academic Press, New York, (1984).
Antoniu, A. A., J. Phys. Chern., 68 (1964) 2754.
Arnouldy, P. and Moulijn, J. A., J. Catal., 93 (1985) 38.
Badische Analin Soda Fabriek, German Patent 293, (1913) 787.
Bartholomew, C. H. and Reuel, R. C., Appl. Catal., 73 (1991) 65. ,
Bretz, W., Z. Elektrochemie, 5 (1949) 301.
Brunelle, J.P., Pure Appl. Chern., 50 (1978) 1211.
Bukur, B. B., Nowicki, L., Manne, R. K., and Lang, X., J. Catal, 155 (1995) 366.
Burwell, R. L., Jr., Pearson, R. G., Haller, G. L., Tjok, P. B. and Chock, S. P ., Inorg. Chern.,
4 (1965) 1123.
Che, M. and Bonneviot, L., Pure and Appl. Chern ., 60 (1988) 1369.
Che, M. and Bonneviot, L., Successful Design of Catalysts. Future Requirements and
Development, T. Inui (ed.), Elsevier, Amsterdam, (1988) 147.
Che, M., in Proc. 101h Int. Congr. on Catalysis, Budapest, 1992, Guzci, L., Solymosi, F., and
Tetteny, P., eds., Elsevier, Amsterdam, (1993) 31.
Chin, R. L. and Hercules, D. M., J. Phys. Chern., 86 (1982) 3079.
Chin, R. L. and Hercules, D. M., J. Phys. Chern., 86 (1982) 360.
Claeys, M., Schulz, H. and Harms, S., Studies in Surface Science and Catalysis, Elsevier, 107
(1997) 193.
Coenen, J. W. E., Appl. Catal., 54 (1989) 65
Coulter, K. E. and Sault, A. G., J. Catal., 154 (1995) 56.
Deo, G., Wachs, I. E., J. Phys. Chern., 95 (1991) 5889.
Dieter, R. A. and Bell, A. T., J. Catal., 97 (1986) 121.
Donnelly, T. J. and Satterfield, C. N., Appl. Catal., 52 (1989) 93.

References
Dry, M. E., in "Catalysis Science and Technology", Anderson, J. R. and Boudart, M. (eds.),
New York, 1 (1981) 159.
Dry, M. E., in "Catalysis Science and Technology", Anderson, J. R. and Boudart, M. (eds.),
New York, 1 (1981) 160.
Dry, M. E., in "The Fischer-Tropsch Synthesis", Research Division, Sasol, (1981).
Egiebor, N. 0. and Cooper, W. C., Appl. Catal., 14 (1985) 323.
Ekerdt, J. G. and Bell, A. T., J. Catal., 58 (1979) 170.
Fenelov, V. B., Neimark, A., Kheifets, L. A. and Samakhov, A. A., in "Preparations of
Catalysts II", Delmon, B., Grange, P., Jacobs, P. A. and Poncelet, G. (eds.), Amsterdam,
Elsevier, (1979) 223.
Fischer, F. and Tropsch, H., Brennst. Chern., 4 (1923) 276.
Foger, K., in "Catalysis Science and Technology", Anderson, J. R. and Boudart, M., 6 (1985)
228.
Friedman, S. and Schlesinger, M.D., US Bur. Mines Bull., (1964) 614.
Frohning, C. D., Kolbel, H., Ralek, M., Rottig, W., Schur, F. and Schulz, H., Fischer
Tropsch-Synthese, Chemierohstoffe aus Kohle, Falbe J. (ed.), Thieme Verlag, Stuttgart,
(1997).
Gall, D., Gibson, E. J. and Hall, C. C., J Appl. Chern., 2 (1952) 371.
Gaube, J. and Hochstadt, G., Chern. Ing. Tech., 50 (1978) 627.
Goodwin, J. G., Jr., Prep. ACS Div. Petr. Chern., 36 (1991) 156.
Hilmen, A. M., Schanke, D. and Holmen, A., Catal. Lett., 38 (1996) 143.
Hilmen, A. M., Schanke, D. and Holmen, A., in ''Natural gas Conversion IV", Studies in
Surface Science and Catalysis, 107 (1997) 237.
Huff, G. A. and Satterfield, C. N., J Catal., 85 (1984) 370.
Huffman G. P., Shah, N., Zhao, J., Huggins, F. E., Hoost, T. E., Halvorsen, S. and Goodwin
J. G. Jr., J Catal., 151 (1995) 17.
Iglesia, E., Appl. Catal., 161, (1997) 59.
Iglesia, E., in ''Natural Gas Conversion IV", Studies in Surface Science and Catalysis,
Amsterdam, Elsevier, 107 (1997) 153.
Iglesia, E., Reyes, S. C. and Madon, R. J., J Catal., 129 (1991) 238.
Iglesia, E., Reyes, S.C., Madon, R. A. and Soled, S. L., Adv. Catal., 39 (1993).
Iglesia, E., Soled, S. L., and Fiato, R. A., J Catal., 137 (1992) 212.
Iglesia, E., Soled, S. L., Rocco, A. F. and Via, G. H., J Catal., 143 (1993) 345.
References
Jordan, D. S. and Bell, A. T., J Catal., 107 (1987) 338.
Jordan, D. S. and Bell, A. T., J Catal., 108 (1987) 63.
Jung, H. and Thomson, W. J., J Catal., 134 (1992) 654.
Kogelbauer, A., Goodwin, J. G. Jr., and Oukaci, R., J Catal., 160 (1996) 125.
Kogelbauer, A. , Weber, J. C. and Goodwin, J. G. Jr., Catal. Lett., 34 (1995) 259.
Komaya, T. and Bell, A. T., J Catal., 146 (1994) 237.
Konig, L. and Gaube, J., Chern. Ing. Tech., 55 (1983) 14.
Kotter, M. and Riekert, L., in "Preparations of Catalysts II", Delmon, B., Grange, P., Jacobs,
P. A. and Poncelet, G. (eds.), Amsterdam, Elsevier, (1979) 51.
Kuipers, E. W., Scheper, C., Wilson, J. H., Vinkenburg, I. H. and Oosterbeek, H., J Catal.,
158 (1996) 288.
Kuipers, E. W., Vinkenburg, I. H. and Oosterbeek, H., J Catal., 152 (1995) 137.
Luyten, L. and Jurgens, J. C., Bull. Soc. Chirn. Be/g., 54 (1945) 303.
Madon, R. J., Reyes, S.C. and Iglesia, E., J Phys. Chern., 95 (1991) 7795.
Martin, F., Chern Fabriek, 12 (1939) 233.
Mehanjiev, D. and Dimitrova, P., Cornrnun. Dep. Chern. Bulg. Acad. Sci., 14 (1981) 330.
Mehanjiev, D., Dimitrova, P. and Dyakova, B., Cornrnun. Dep. Chern. Bulg. Acad. Sci., 17
(1984) 204.
Ming, H. and Baker, B . G., Appl. Catal., 123 (1995) 23.
Newsome, D. S., Catal. Rev.-Sci. Eng., 21 (1980) 275.
Parks, G. A. and DeBruyn, P. L., J Phys. Chern., 66 (1962) 967.
Pichler, H., Advances in Catalysis, Vol. 4, Frankenburg, Komarewsky and Rideal (eds.), New
York, Academic Press Inc., (1952).
Pichler, H., Schulz, H. and Elstner, M., Brennst. Chern., 48 (1967) 78.
Puskas, I., Fleisch, T. H ., Hall, J. B., Meyers, B. L. and Roginski, R. T. , J Catal., 134 (1992)
615.
Raupp, G. B. and Delgass, W. N., J Catal., 58 (1979) 348.
Regaini, V., Carli, R., Bianchi, C. L., Lorenzetti, D., Predieri, G. and Moggi, P., Appl. Catal.,
139 (1996) 31.
Reuel, R. C. and Bartholomew, C. H., J Catal., 85 (1984) 63.
Rosch, S., Dissertation, University ofKarlsruhe, (1980).
Royo, C., Percides, J. M ., Monzon, A. and Santamaria, J., Ind. Eng. Chern. Res., 35 (1996)
1813.

References
Sabatier, P. and Senderens, J. B., Compte Rendus Hebd., 134 (1902) 514.
Schulz, H., Beck, K. and Erich, E., Methane Conversion, Elsevier, (1988) 457.
Sewell, G. S., O'Connor, C. T. and van Steen, E., Appl. Catal., 125 (1995) 99.
Sewell, G. S., Ph. D. Thesis, University of Cape Town, (1996).
Smith, G. W. and Jacobson, H. W., J. Phys. Chern., 60 (1956) 1008.
Vada, S., Chen, B. and Goodwin, J. G., Jr., J. Catal., 153 (1995) 224.
Van Berge, P. J. and Everson, R. C., in ''Natural Gas Conversion IV", Studies in Surface
Science and Catalysis, 107 (1997) 207.
Van Schalkwyk, E., M. Sc. Thesis, University of Cape Town, (1998).
Vannice, M.A. and Garten, R. L., J. Catal., 86 (1980) 242.
Vannice, M.A., J. Catal., 37 (1975) 449.
Vannice, M. A, J. Catal., 50 (1977) 228.
van't Blik, H. F. J., Koningsberger, D. C. and Prins, R. J., J. Catal., 97 (1986) 210.
Wojchiechowski, B. W, Cat. Rev. Sci. Eng., 30(4) (1988) 629.
Wojchiechowski, B. W. and Sarup, B., Can. J. Chern. Eng., 66 (1988) 831.
Zsoldos, Z., Garin, F., Hiliare, L. and Guzci, L., Cat. Lett., 33 (1995) 39.

APPENDICES


Appendix!
Appendix I
TPR calibration and Sample Calculation
The hydrogen concentration of the Hz in Nz gas mixture was calculated using a known mass
of CuO, according to the following reaction stoichiometry:
CuO + Cu +
The CuO was placed in a quartz reactor described previously, and secured in the furnace. The
thermal conductivity of 60mVmin Nz and 60 mVmin Hz in Nz were measured consecutively
relative to a reference nitrogen gas stream flowing at 60 mVmin. The difference in the TCD
measurement between the Nz and the Hz in Nz gas streams yielded the thermal conductivity
of the hydrogen present in the Hz in Nz gas mixture. During the TPR run, the thermal
conductivity of the exit stream is recorded. As hydrogen was consumed during copper
reduction, the thermal conductivity of the exit gas changed reflecting the hydrogen
consumption.
1.2 1--- H2 in N2 TCD baseline -~
<( .......... 0.8 c
0 H2 consumption peak ~ 0.6 c..
E 0.4 :::J (/)
c 0.2 0 () N2 TCD baseline
N 0 I
0 20 40 60 80 100 120 Temperature (°C)
The hydrogen consumed in terms of the logged thermal conductivity acquired data was
calculated using the trapezoidal rule given by the following expression:
Hz consumption= 2:n (Sn+i + sn) x (tn+l + tn) x 0.5

Appendix!
where s is the value logged for a given TCD reading and t is the time elapsed in minutes. The
above expression was converted into mmols of hydrogen consumed on the assumption that
the hydrogen concentration was 5%. On this basis, 1.020 mmols ofhydrogen were consumed.
However, the mass ofCuO used was 0.107g, giving 1.340 mmols of Cu. As the stoichiometry
of complete CuO reduction requires a 1:1 ratio of hydrogen to copper, the first guess of 5%
for the hydrogen concentration was seen to be inaccurate. The correct hydrogen concentration
was calculated from the following expression:
Hz concentration = 1.340 x 5% = 6.6 vol% Hz in Nz.
All TPR runs used a similar procedure to obtain the hydrogen consumption, however for all
other runs a hydrogen concentration of 6.6% was used.

Appendix !I
Appendix II
Hydrogen Chemisorption Sample Calculation
Hydrogen chemisorption was used to measure the number of exposed cobalt atoms of the
reduced catalyst. As the cobalt content of the catalyst was known, the metallic dispersion and
the average particle diameter could be calculated. Chemisorption was carried out twice at
1 00°C. The first chemisorption measurement was followed by a 15 minute evacuation period
during which time weakly adsorbed hydrogen desorbed. After this the hydrogen uptake of the
catalyst was remeasured. From these two chemisorption measurements, the amount of
strongly bound hydrogen was calculated.
The hydrogen chemisorption data obtained for the Co/Si02 catalyst will be used below to
show the calculation procedure.
The total hydrogen uptake was 0.865 cm3/gcat. while the amount of hydrogen not removed
through evacuation was 0.570 cm3/gcat· According to Bartholomew et al. [1980], hydrogen
desorption is dissociative on cobalt. Accordingly the total number of exposed cobalt atoms
can be obtained from the following calculation:
Ncobalt = (0.865 cm3H2/gcat )/ (22414 cm3H2/mol H2). (2 mol Co/mol H2) . NAv
4.648 x 10¹⁹ atoms Co/gcat
where NAv is Avogadro's number. Using a site density for fcc cobalt of 14.6 atoms/nm2
[Bartholomew et al., 1980], the metallic surface area can be calculated using the following
relationship:
Surface Area (4.648 x 10¹⁹ atoms)/(14.6 atoms/nm2). 10-18 m2/nm2
3.18 m2/gcat
The reversibility of hydrogen adsorption was is calculated as a percentage of the total
hydrogen uptake that is strongly adsorbed, according to the following calculation:
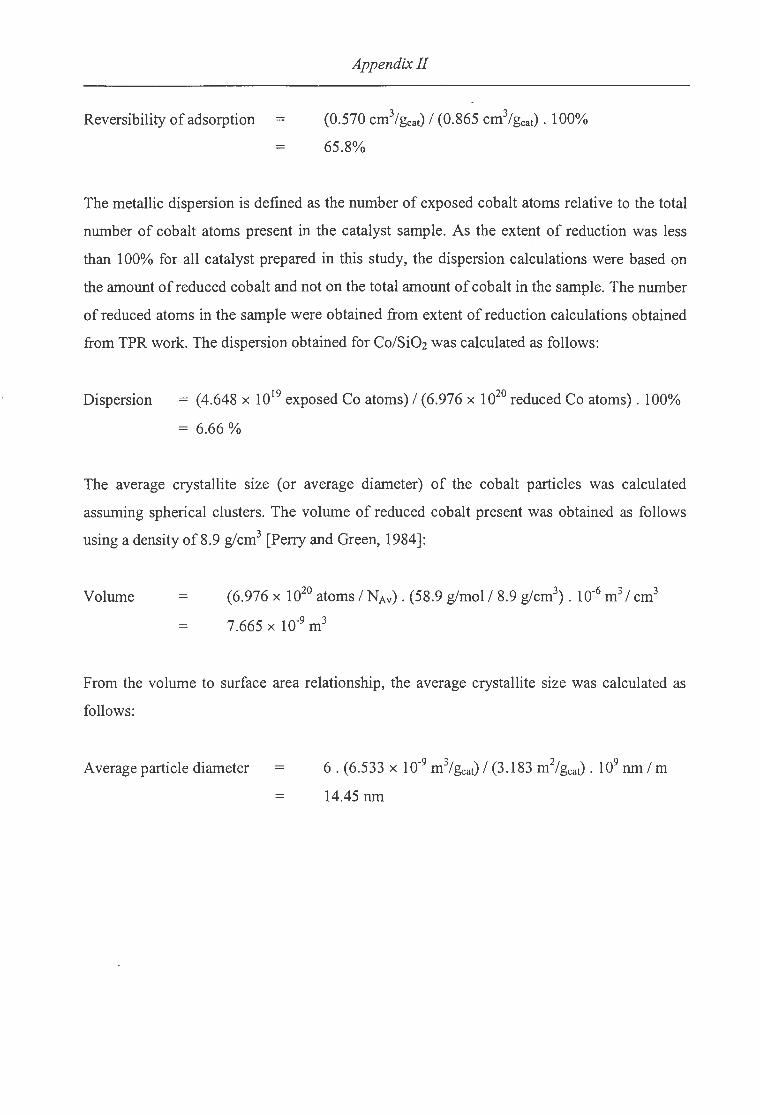
Appendix II
Reversibility of adsorption =
= 65.8%
The metallic dispersion is defined as the number of exposed cobalt atoms relative to the total
number of cobalt atoms present in the catalyst sample. As the extent of reduction was less
than 100% for all catalyst prepared in this study, the dispersion calculations were based on
the amount of reduced cobalt and not on the total amount of cobalt in the sample. The number
of reduced atoms in the sample were obtained from extent of reduction calculations obtained
fro~ TPR work. The dispersion obtained for CoiSi02 was calculated as follows:
Dispersion = (4.648 x 10¹⁹ exposed Co atoms) I (6.976 x 10²⁰ reduced Co atoms). 100%
= 6.66%
The average crystallite size (or average diameter) of the cobalt particles was calculated
assuming spherical clusters. The volume of reduced cobalt present was obtained as follows
using a density of 8.9 g/cm3 [Perry and Green, 1984]:
Volume (6.976 x 10²⁰ atoms I NAv). (58.9 g/mol I 8.9 g/cm3). 10-6 m3 I cm3
7.665 x 10⁻⁹ m3
From. the volume to surface area relationship, the average crystallite size was calculated as
follows:
Average particle diameter 6. (6.533 x 10⁻⁹ m31&at) I (3.183 m21gcat). 109 nm I m
14.45 nm

Appendix III
Appendix III
Sample calculation of conversion, yield and selectivity of .the
Fischer-Tropsch Synthesis reaction
The syngas feed of CO and H2 were flowed over the catalyst in a 1 : 2 ratio. Downstream of
the reactor a stream of 0.121% of toluene in nitrogen was flowed as an inert internal standard
for both the conversion and organic yield calculations. The conversion of carbon monoxide
and hydrogen was calculated using a TCD gas chromatograph following calibration. The
calibration was done by injecting known percentages of a H2, CO and N2 gas mixture and
noting the TCD response of for each gas. The relative response factor for CO and H2 were
obtained by dividing the response factor of the gas by the response factor of the nitrogen
mixture.
Using the relative response factors, the areas obtained upon integration of the TCD signal
following injection of gas from the product stream could be converted to molar ratios. As the
molar fraction of the bypass was measured in the same way prior to the start of reaction,
comparison of the bypass and reaction streams allowed calculation of the carbon monoxide
and hydrogen conversions as illustrated in the following table for the Co/Si02 catalyst after
1.5 hours of reaction:
Component Standard Bypass Flow Product Stream Conversion
Area (a.u.) Rel. Response Molar ratio Molar ratio (%)
H2 375268 11.890 1.026 10.928 10.43
N2 31561 1 1 1
co 31915 1.011 0.539 0.498 8.51
The yield of total organic product and the selectivity of the product were determined using an
FID gas chromatograph. The fraction of each organic product could be evaluated because the
molar fraction of toluene in the product stream was known. As the relative response factors
for all products formed were the same, easy evaluation of the relative amounts of each

Appendix III
product was possible. The yield of organic product was obtained from the following
expressions:
Yield =
where AreaHc :
AreaTol:
llc,tol
nco
[(AreaHc I AreaToJ).(llc,toi I nNz)] I [nco I nNz]. 100%
Area of hydrocarbon product in the FID GC trace
Area of toluene in the FID GC trace
molar flow of carbon in standard toluene in Nz gas mixture
Molar flow ofNz in standard toluene in N2 gas mixture
Molar flow of carbon monoxide in syngas feed stream
Molar flow of standard N2 gas mixture.
The yield calculated for CoiSiOz was as follows:
Yield
=
[(3.559).(0.008576)] I [0.537] . 100%
5.67%
Selectivity calculations were performed on a molar basis from the gas chromatograph traces.
The area of each peak was on a carbon basis. To obtain the number of moles, the peak was
divided by the carbon number associated with that particular product to obtain an area per
molecule measurement. From this the selectivity of that particular specie could be obtained as
· follows:
Selectivity =
where Nc
Areai,Nc
AreaTotai,Nc
[ Area1,Nc INc] I [ AreaTotai,Nc INc] . 100%
Carbon number
Area of specie i in the carbon number fraction Nc
Area of total organic product of carbon number Nc
The rate of formation of organic product in each carbon number was calculated as follows:
Formation Rate = [(AreaHc,Nc INc) . FTol] . [AreaTol INc]

where Nc
AreaHc,Nc
FTol
Area Tot
Appendix III
Carbon number
Area of total hydrocarbons of carbon number Nc
Molar flow of toluene
Area of toluene

Appendix IV
Appendix IV
TEM Photographs for Co/1/Si02, Co(A)/4/Si02, Co/4/MnO and
Co/O/Si02
Co/1/SiOz Co(A)/4/SiOz
Co/4/MnO Co/0/SiOz

Appendix V
Appendix V
Reaction Data for Fischer-Tropsch Synthesis
Base Case Catalysts
~l. Rla:Da1 Till&: 1otT.DlYI -..:
Qrtm l"intD" A_Pa3fin AJD'l'Ol A_ Odin A_de'01 ~ Taalml A_a.ddin ~ ~ ~-Ida Rm.10'
01 m:i% m:t'/o m:t'/o c:a1xrf/o ( ITtl"d..rTYi 1 ljltidj( lj/t'i<:t)( l.fj ljltidj( l!:lU l!:til::S
3 4:ID6 1400 Q94 4:ID6 72 316.5 4 133£1 mu :mm 9J7ffi Q91 ~ 3m15 ffiO 75.0 9.1 <93.1 5 1~1ffi '3J:fJ1 W3) 70712 Qf2 5Jllt6 :IJ7lA3 811 71.3 92 :ms 6 167:B3 2iiD) :mrn 57210 Q72 51Cffi3 Z5E1 ffi6 012 a? 1ffi6 7 1ffim arn2 amD 4)1ffi Q61 437i'ffi 1:mJ7 413 ffi1 ao 1416 8 19Im ~ anm 2iD:19 QB) 415478 7JID 316 52.1 7.1 116.3 9 ~16 ~ 1341ro 1516 Q:E 'JifSI7 :ml8 21.8 Jl2 6.1 ffi5 10 2PIIQ ~ 7m23 9E1 OZ1 3)1793 11373 11.5 3?.9 52 67.6 11 18m) 1ffi11 4<ff£ 5323 Q14 ~ ffi!2 a9 25.1 42 5J.2 12 143143 12179 19{12 zm -D. CO 17.ill3 ZIJ1 as 157 3.0 3?.4 13 115XI fm4 81ffi 1313 -D2) 1:ml:i 1191 7.0 129 23 22.9 14 11<BB 7lH3 :00 g:o -D.al 1174i5 5:B ao 6.0 20 1as 15 133lli IIfil 1!E3 15) -023 1J):tB 1.8 23 2l2
U1£l1J 11119: .a:m.uTI1
Qrtm l"intD" A_Pa31in AJD'l'Ol A_aain A_de'Ol ~ Taalml A_a.ddin ~n ~ ~-Ida Rm.10'
01 m:t'lo m:t'/o m:t'/o c:a1xrf/o (rnrdfniti 1 Lf~ 21~ un dlt:i OtL.b
3 OT7'Z5 21575 Q74 OT7'Z5 51 51.4 4 174B Lt3i5 !HB4 14374 QOT IB1ffi 5:ill3 lli9 TT.O 58 .:t3.4 5 16115 :m3 EfQD 11ffi3 Q57 i!ID5 ffi'* 94.7 77.5 57 342 6 18144 JJ74 ffi157 9lD Q<{J 7®1 51103 91.0 75.3 56 LB.3 7 ai2)7 :H» 5li37 7234 Q<() ~ ~ ffi.8 71.4 54 23.1 8 225iU ae1 <ffil3 ffiD Q31 ffiffi 34ffB 78.6 83.1 50 1a9 9 ~ 2719 ET1 :m1 Q21 ~ ~ ffi2 511 4.5 151 10 :!912 :H» 27714 ::1m Q15 ffi716 15179 ~.7 410 4.3 13.1 11 33177 :m:l :ID19 an5 Q12 53193 8421 Lt?.1 :£.6 4.4 121 12 ~ 3774 14'* 15)7 Q12 s:w5 ID 31.0 23.8 4.9 122 13 4ffi:l} J'i}t mi5 ffi2 Q()t ~ 2B1 27.0 17.1 4.4 102 14 :Ift'ffi 2771 ~ ffi3 -D.CB 44413 1GB 19.3 127 3.5 7.6 15 ~ 2318 3E3 E -{).18 SJ157 fJT7 22.0 1Q3 3.0 6.1

Appendix V
IUlM'U tm:DaliiTB: '"'·-·· C:rtm I'Url:a' A_Paalin AJD'l'Ol A_ Odin A_deOl ~ Tctifml A_a..ciEDI ~ ~ ~-tdal Rm.10'
Ol nd% m:f'/o m:f'/o catx:d/o (mrdlnirt 1 ttti:1J ttti:1J -~.~ ttti:1J LJ.O 1U:Ul 3 14ll) /ffl1 Q70 14ll) 5.9 7.7 4 7ffi1 1aE 18271 4ffi3 Q~ Zffi2 14772 ffi8 70.7 109 107 5 f3T72 1:£1 ~ 2iJJI Offi 217ffi 11:m 760 ffi.9 9.1 72 6 ff94 1149 1Ji9 21C6 054 1~ 'i'tD1 619 6U 82 5.4 7 ffi'18 978 10147 1522 042 16Ri 4413 43.5 ffi7 7.3 42 8 7E 911 7010 1(ll) 032 '\ltC:9 2310 ~0 48.0 6.5 32 9 7fJ17 875 5W 678 022 13Hi 1EID 2:16 41.0 5.9 26 10 7fi51 7(6 :ms <H) QC9 10t?2 ED1 17.9 323 4.9 1.9 11 ffi?1 @ LZl2 322 -001 am 4lil al2 25.5 4.3 1.5 12 6!134 ~ 1312 1ffi -013 77tf3 16.9 3.5 1.1 13 5742 442 10Xl 77 -ill6 6742 14.8 28 09 14 44ffj 318 -047 44ffj 1.9 05 15 310) ';!Jl -Qffi 310) 1.3 03
Effect of Cobalt Acetate
-~ tm:Dalnna: ur.strm
C:rtm I'Url:a' A_Paalin A..JDfOl A_Cldin A_deOl ~ Tctifml A_CJ.dEfin ~n ~ ~-tdal Rm.10'
Ol m:f'/o m:f'/o m:f'/o catx:d/o (ITtl'dJrrirl 1 1~1:.::!:1 1~~ 1.~ 1~~ ow :m,g
3 18ID BJl) Q44 18ID 59 1Q7 4 5iffi 1442 14iU) J5T7 Q37 2W4 10ill 723 71.8 6.7 9.1 5 5716 1143 11310 2m Q21 1/ffi) f53J1 ffi6 63.4 58 6.3 6 !lli3 ~ 9ffi 1577 urn 15123 3378 Ji7 61.3 51 4.6 7 OE1 aE 72l2 1234 QO) 1:£19 1Em 23.3 53.6 50 3.9 8 fffi2 7ffi 4ffi3 782 -014 111:!) 5i9 11.9 43.6 4.1 28 9 5IO Effi am 478 .@3 8iU) 322 3.4 20

Appendix V
~ une: .... ..u•••
QrixnN.ni:Jr A_Rrali1 A.JBfOl A_Oem A_da'Ol ~ T~Ata A_a.dEiin ~n ~ ~-w Rte.1J'
01 rrd% nd% rrd% c:atxrflc (nm:fnii 1 t:ilit)f t:ilit)f uu t:ilit]f :zL;j 11llio
3 2m32 77'017 oro 2m32 83 1<fl1 4 f5Tlffi '1('!ffi 1932B ~ 083 JID11 1ffiiD ffi.2 74.5 94 tE.4 5 -rn18 'WB4 18m3 J3:01 071 2Dt21 ~ 81.3 71.3 91 97.1 6 f2191 "13IE miD 2iU34 061 ~ 111185 ffi6 EBO 87 766 7 ffiD1 13372 131132 1rnJ2 052 2'JUJ3 7Zm ffi.1 ffi4 81 61.0 8 'KlR:B tml- 1CD163 1313) Q.IQ al1152 4:Bfi ;(}8 43.8 7.3 47.8 9 "1CESf) 1'001 ffi:93 7.m 023 171143 100 21.0 J3.2 6.1 33.2
10 9nl5 9ffi 371ffi *0' 014 tr.510 6iUi 180 :B5 4.9 ~8
11 831CD "BD 21ffE 2D2 001 ~ J:ffi 141 a:l8 39 181 12 67151 ffiE 1'XI£ "00 -016 i'8B3 am 180 142 29 124 13 ..f:BD :BE sm ffi3 -O:E B.:Im 13J) 2i6 100 1.9 7.4 14 'E351 am ZID ~ -064 3'ffi) iiD 315 72 1.1 4.3 15 arm 1731 -076 arm 00 09 33
IU¥-JMJJ I"UDDUlllle:.u~.""-111.1
QrixnN.rtl:Jr A_Rrnlin A.JBfOl A_ Win A_da'Ol ~ T~Ata A_adEfin ~n ~n ~-w Rte.1J'
01 m:f/o m:f/o m:f/o c:atxrflc (nm:fnii 1 ~ ~ l.f,j ~ l'::il 1104
3 E11 9W 5m3 1ire1 1.18 ~ 5m3 160 :£4 4 2I[Q 001 51ffi5 "1JH) 1.CB 77151 JfN 74.8 638 150 22.8 5 21E 4272 :!00 ~ 08) ~ 25iY3 712 62.9 112 136 6 1ffi12 31(2 JD37 44<13 062. 4<6t) 1$ ffiO ffi3 88 89 7 17183 m 18m 'ZJ"!.;) 043 :miB 7t(Jl ;(}1 51.8 7.1 6.2
8 1$1 19J5 12232 15B 023 J3193 :m1 ';£7 .:t3.4 55 42 9 16JE 1781 ffiD ffi1 018 ~ 1Cffi 126 35.1 4.8 32
10 tE78 tffi 5)44 5:0 0(2 18l?2 liD 142 2j7 37 23 11 115:15 "00 Zl3l 421 -OCB 13743 163 31 1.7 12 1C072 8Il 1143 143 .ffi3 11218 1Q2 23 12 13 Ba3 6.D iiD 5:1- -0-'Q tm3 7.8 1.7 08 14 ffi31 419 -064 ffi31 1.1 05 15 ~ 187 -OS9 ~ 05 Q2

Appendix V
Effect of MED Addition
............ .....,._"2 IJOe: ~~;~•~•••
cat:xnN.nbr A_Rrcflin A.Jlll'Ol A_CJem A_de01 ~ Td31ml A_a.de:fin ~ ~n ~-w Rm.1J'
01 nd% rm% rm% C:rl:xrf/o (111l1ihil 1 ~ ~ l.t5/ ;Q!:l tttll
3 114]?2 JIJJ1 2m3 iYD 074 -rn:m 17.3 72 E2.6 4 5iU5 1<m4 10m3 Ji?2) QfB 161ffi3 43ft"1 443 618 85 ffi1 5 5)713 100 1C5m 21:!9 057 153151 3'IDt. 31.6 01.5 82 .:no 6 Lffi3) 773J ~ 16':ID 047 13ID4 17819 A:l6 ffi1 7.8 337 7 432"0 6173 6t347 131J3 033 1CJfffi7 gJl) 140 5j8 7.1 al3 8 400 5)31 45t27 9iffi 025 ffi373 47Jl 104 tEO 62 m 9 :m=2 4418 BID om 012 EBl5Z ~1 86 427 53 153 10 :ID9 F2 1S8£ 5153 om ffiB5 1m3 85 242 4.7 122
11 3E}l. 2111- 10153 3219 .0.13 ;ffi57 ::!:t3 36 84 12 Z!2J8 2ZJ3 4lQ 1Em .0.33 300 138 25 54 13 213:14 16t2 ;m) 7ffi .O.ffi 2Iffi 98 1.6 33 14 17B2 12D a£ .0.74 17B2 00 1.1 21 15 15131 w .0.91 15131 08 1.4
ll.IY1:1.¥.a1J I JOe: t:nUnl1
cat:xn N.nbr A_Paafin A.Jlll'Ol A_ Gain A_de01 ~ Td31ml A_C4dain ~n ~n ~-w R:m.U
01 nd% nd% nd% camflc (111l1ihil 1 ~ ~ 1.83 ~ L/.1 !:Mf
3 1016J7 3ff9 093 1016J7 11.0 740 4 2/f517 fff9 ~ 17191 081- 1J3::141 ffi1A3 81,5 ffi5 112 ffi5 5 2IB1 5IE 61257 12251 OEB 91213 ~ ro6 01.1 99 :£8 6 2iUB 4516 ~ 8132 053 iffii2 32197 ffiO 613 82 Zl.6 7 am3 J11.1 :IDil 55Zl 04) ffiZi8 1mi) 418 5j4 72 A:l7 8 2ffil 3174 3115) :lm 023 ffiill 11ffi5 '312 ffi1 61 154 9 2H2 :m5 215t3 23::» 013 45ffi Lff5 223 4Z4 49 11.0 'X) 2'ffi) 2ID 1@7 14Ii .o.az :lfW AID 142 41.1 39 7.8 11 'fi(fi2 1ffi1 "0183 1122 .0.14 27J:I5 1313 129 37:4 32 58 12 15ID till 53?2 733 .QJ3 212J2 68 2)1 27 45 13 13316 ~ 2)!) 6:» .0.33 1ffiJ3 159 23 36 14 gm EB1 .0.74 gm 1.0 1.5 15 8I9 t(Jf .0.93 8I9 07 09
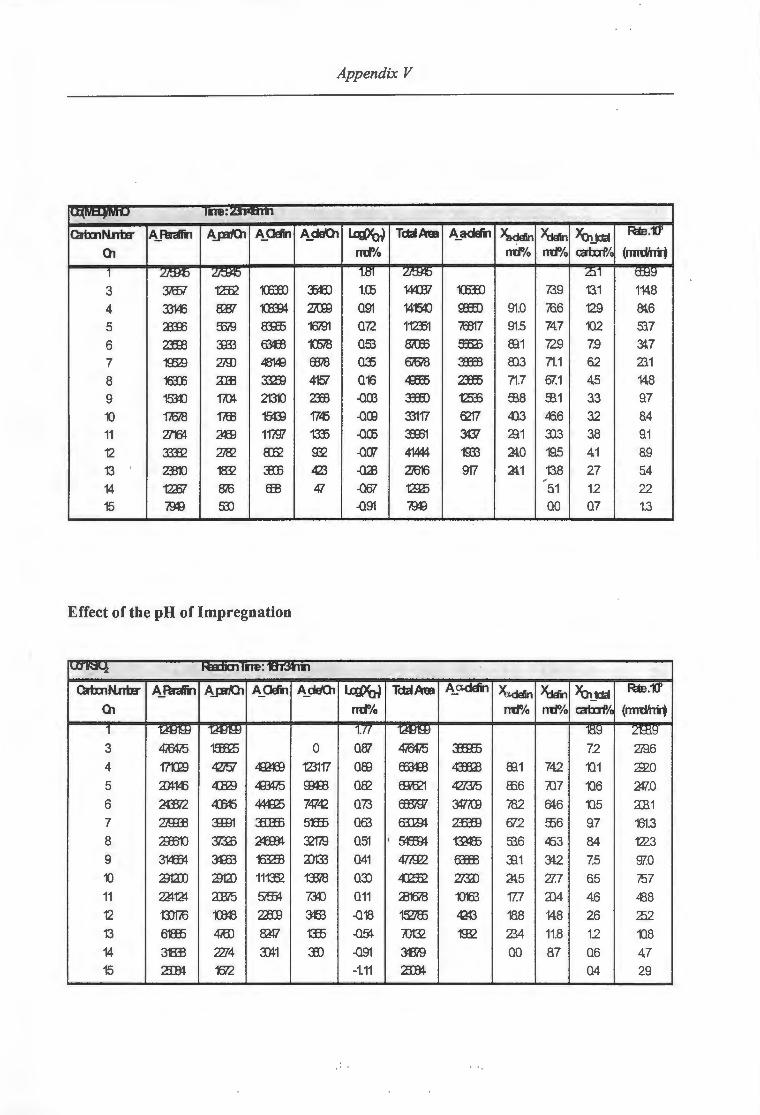
Appendix V
111'8: ............... ,
CltmNnta" A_Rram A.JBfOl A_OSin A_daOI ~ TdaAm A_ adEm ~ ~n ~-w Rm.1J'
01 m:f% m:f'/o m:f'/o catxrflc (mrd'rrii
1 ~ ~ l.tfl Lt.l:RJ :.::J.l t:tl::l~
3 3liJ5T 121'2 1CElD :Dti) 1.(6 144137 1CElD 73.9 131 1148 4 33116 w ~ 2iUB 091 1415:() gm) 91.0 166 129 8t6
5 JllB ffii9 8Iffi 16i91 072 112D1 m7 91.5 74.7 10.2 53.7 6 z:m3 :m3 6m3 1C6i'8 053 &UD ffim ffi1 729 7.9 3U
7 ~ 2iY) .:814l ffi78 OJ5 6i6i'8 :Hfi3 813 71.1 62 23.1 8 16IE am :mB 4157 016 4m5 2R5 71.7 67.1 4.5 14.8 9 153{) ID 21310 2.!B .{lffi Jffi) 12ffi ffi8 ffi1 33 97 10 171378 1iffl 15m 17-'5 .{1(9 33117 w 413 .£6 32 84 11 27164 ~ 11W m5 .{1(6 E31 3{37 23.1 :n3 38 91 12 3312 ~ 8.12 gQ .{107 41444 1ffi3 ~.0 195 4.1 89 13 2B10 1832 :m3 423 .{123 2iB16 917 ~.1 138 27 54 -14 1ZE7 8iU Em tfl .{101 '12I5 51 12 22 15 '00 SD .{191 '00 00 07 1.3
Effect of the pH of Impregnation
,u:n~ t61DCJ1111'e: IIIJII.7'111.1
CltmNnta" A_Rralin A.JBfOl A_OSin A_de'Ol ~ Tc:taAm A_ adair~ ~ ~ ~-w Rm.11'
01 m:f'/o m:f'/o m:f'/o catxrflc (rnmnrt
1 TJlJ'H:j TJlJ'H:j 1.{{ TJlJ'H:j 'ltl!:l ZHl.9
3 4rot'5 15m3 0 087 4rot'5 :mH5 72 2Jd6 4 '1?'aB lf.lJ51 ..mm 123117 Offi ffB{B 4mB ffi1 742 101 2:12.0 5 ~143 4:BB ~ ffi:m 01:2 ~ .Q73i'5 836 107 106 av.o 6 ~ 4I1I5 444325 747LQ 073 E!I!i97 :wtt9 782 et6 105 2E1 7 2ffiB 3ID1 :mm 51ffi 063 6:IIDl- 2Ii!B 012 ffi6 97 'X31.3 8 2I6t) 373J3 ~ 3W3 051 · ~ -rnffi 536 453 84 1223 9 3\lffi1 3m3 "ffiffi 2)133 041 47iW2 EffiE :£1 312 7.5 9ZO
10 23till :;:g1J) 111:!2 13318 03J ~ 273Il ~5 27.7 65 757 11 m~ aBi5 9351 7Jt) 011 ~ 'Om 17.7 al4 4.6 .£8 12 '1:D1iU '(8:3 Z:II9 3ffi .{118 15Z7ffi tOO 188 148 26 2)2
13 6ffi5 4iiD w 1JD .{}~ iD132 1gQ 23.4 11.8 12 1Q8 14 31813 2274 ~1 JI) .{191 313i9 00 87 06 47 15 ~ 1612 -1.11 ~ 04 29
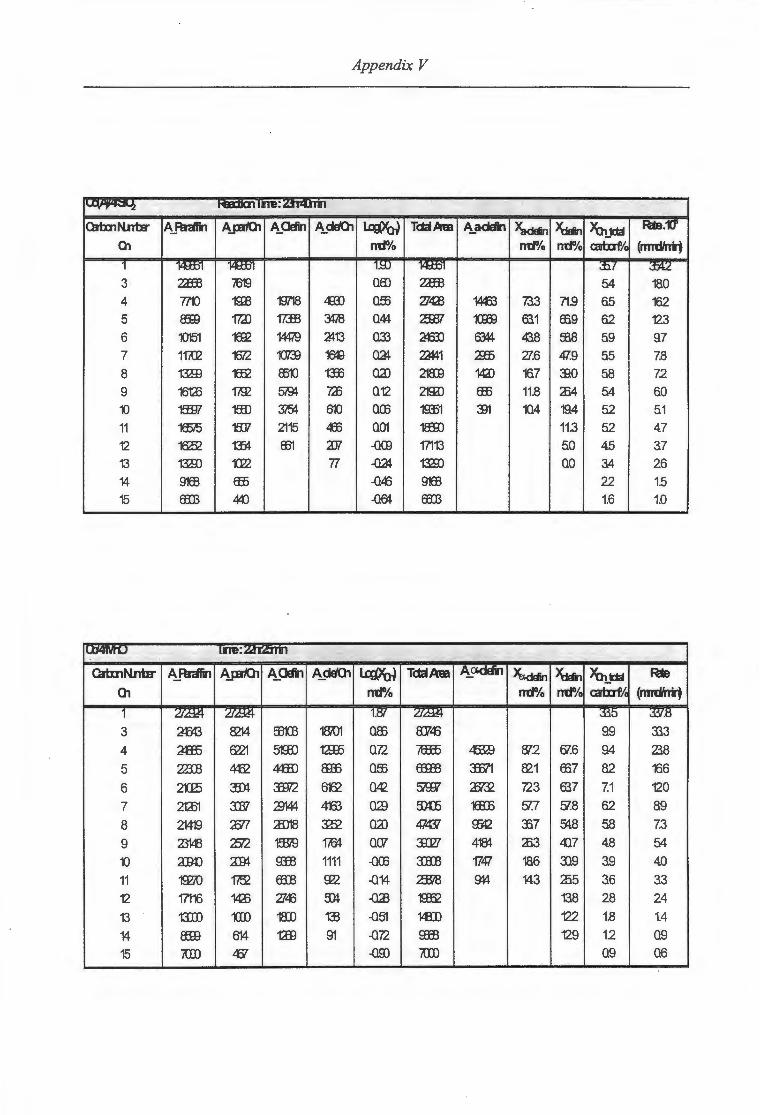
Appendix V
-... talliCJ'IIITB: ~ r•t .. u•• Cri:xnNnbr A_Rrafi1 A.JDl'Ot A_(lain A_da'Ch L.cQ>W Tda.A&l A_ adEm ~ >wu, >u,_w Rm."'J'
Ol nd% nd% nd% catx:rflc (rmdhii 1 lll:tl:ll lll:tl:ll 1.ill 14:H::i1 J;).{ ~
3 ZBB iB19 Qff) ZBB 54 180 4 T11J 19B 19718 .:mJ Qffi 2748 14<fi3 73.3 71.9 65 162 5 am 17J) 17.!E 3478 Q44 'ZI:JJ1 1<R9 6l1 ffi9 62 12.3 6 10151 w 144i9 ~13 Q33 ~ 63::14 43.8 ffi8 59 97 7 11i02 1672 1CJ7:!l 100 @ 2&141 23D 27.6 4Z9 55 7.8 8 13!E 1ffi2 ffi1J 1:ffi Qa) 218:9 14D 167 :BO 58 72 9 16t!) 1iY2 ~ 7J3 Q12 21ffi) Effi 11.8 J3.4 54 60 10 1W 1ffi) 3i5:l- 610 QC6 19!51 :In 10.4 194 52 51 11 1ffii5 15J7 2115 453 Q01 18m 11.3 52 4.7 12 1652 m ffi1 'X51 .QC9 17113 50 4.5 37 13 m:n 1Cl?2 77 ~ m:n QO 34 26 14 91EB Effi .Q~ 91EB 22 1.5 15 ffiB 4<:0 .Q~ ffiB 1.6 1.0
ll04MU IITB:.u:~ •~••'
Cri:xnNntB' ARralin A_jBlOl A_OSin ~da'Ch ~ Tda.Am A_a.dail ~ ~ >u,_w RE Ol nd% mt'/o mt'/o catx:rflc (rmdhTt 1 :u~ :u~ 1.~ :u~ ~0 ~-tj
3 ~ aM ffiK.B '001 Qffi a:v~ 99 333 4 ~ 6?21 5-m:l 12R5 Q72 lffiD 4m3 f!12 67.6 94 238 5 2m3 4:52 4ffi) am Qffi Ef£ffi 3El1 f£1 ffi7 82 166 6 2'G:5 Jrn Ei2 662 ~ 51rfJ1 :£732 723 637 7.1 12.0 7 2m 3137 ~ 4163 ()2:) S}(6 'mE 51.7 51.8 62 89 8 21419 'NT AD18 3B2 Qa) 47-'W S6t2 -:£.7 51:8 58 7.3 9 23143 2i'2 153(9 1/6:1. Q07 :m?l 4~ J3.3 4)7 48 54
1J :;mo am 9IB 1111 .QC6 JB:B 1747 186 3)9 39 40 11 19?iO 1'i52 ffiB g?2 .Q14 2Bi8 9l4 143 2)5 36 33 12 17116 14a3 2743 !I» -043 m32 138 28 24 13 13lD 1ID 18J) 1J3 .Q51 14m 122 1.8 1.4 14 am 614 tm 91 .Q72 gffi 12.9 12 Q9
15 IUD .<fiT .Q9) IUD Q9 Q6

Appendix V
Effect of Contact Time
---"""l 11BDCJ111J8: IWII._.I.I
Qltx:nN.nbr A_Rralin A_jJIIOl A_Oefin A_deOl ~ T~A"ea A_adelil ~ >wu, >b,_~ RE.'IJ'
01 mf'/o mf'/o mf'/o c::atx:rflc (rmdhii 1 1'ltib( 1'ltib( 1.t.J 1'ltib( 153 ID.f
3 4'6153 1J3718 0 Qffi 4'6153 55 181.3 4 ~ :mD :3i{)tB miD oro 51'J3(8 3m[) ffi4 723 68 161.5 5 'ffi~ :nm JEH) BIB 074 ffD:I74 3HID 8)7 i{}5 7.5 1<65 6 -m:m :mB 374<£9 6ffi1. 067 5051 2EID ffi4 ffi6 7.7 12)5
7 2lK6 ~115 333)14 lfJ1ll 061 571ffi) 17lJ(} 532 ffi2 7.8 '[96
8 amJ7 33113 217'4£ 37..:ffi 053 SBf73 101531 Jl6 410 7.8 932 9 :IB7J3 4::971 2mE ~ 051 ~1 4m' 226 Jl4 7.8 ffi7 10 37T1'iJ) '31773 131ffJ7 17311 043 !192:6 193:tl 147 L58 7.3 720 11 351ZB 319D 742:8 ~1 031 42m3 gm 132 17.5 62 ffi1 12 ZB131 -mE 23!B E1 007 J159 4lD 157 96 38 31.1 13 mB2 'KIB3 7ffi2 15?2 .Q25 f£54 2B5 3)3 55 20 151 14 fJ1T18 E2iD 3471 :m .Q-4} 900 112> ~4 38 12 87 15 mB:t 67'E m i{) .Q43 10m3 1.0 1.4 89

Related Documents