International Journal of Emerging Technologies in Engineering Research (IJETER) Volume 1, Issue 3, August (2015) www.ijeter.everscience.org ISSN: 2454-6410 ©EverScience Publications 35 By-Passing Infected Areas in Wireless Sensor Networks using Twin Rolling Ball Technique Kiran Kamati Department of PG studies, VTU, Belagavi, Karnataka, India. Dr.Santosh Deshapande Professor Department of CNE, PG Centre VTU Belagavi, Karnataka, India Abstract – The hardware failure, software corruption and unfavorable operating environment among the different nodes in wireless sensor network that can affect quality of collected data This resulting in misleading packet translation, wrong decision making and communication failure. The sensed data from other uninfected region might also get stuck in infected regions. There is some existing method such as BOUNDHOLE and GAR (Greedy Anti-Void Routing) can used to solve these issues but it degrades the performance mainly due to high risk of falling into loop and visiting unnecessary nodes. In this proposed solution we use twin rolling ball method to divert the incoming traffic from infected region and get stuck packet out of infected region. Fuzzy data clustering is used in proposed solution in order to find the infected nodes. The information obtained from fuzzy data clustering is used in proposed By-passed Routing (BPR) technique which use the two rolling balls rotate in both clockwise and counter clockwise direction. The first node hit by any ball in any direction and is uninfected, is selected as next hop. Index Terms – Wireless Sensor Networks, Routing Protocols, Fault-Tolerance, Anomalies Detection, Performance Evaluation. 1. INTRODUCTION Wireless Sensor Networks (WSN) have been playing an important part in different remote event monitoring applications, particularly in hazardous regions and unfriendly situations. In such applications events can be detected through the data sensing and forwarding to the sink node for further processing. Before transmitting the data to sink node, sensors perform the data fusion process to reduce the traffic between fusion nodes and sink node. However, the direct communication between source nodes and sink node can affect by the energy of the node and other resources. Therefore, communication in wireless sensor network can be achieved through the intermediate nodes which in turn forward the got information to another node until packet reach their desired destination. This can save energy and increase the lifetime of their battery. 1.1. Problem Statement The software corruption, hardware failure and non-favorable operating environment among different nodes in wireless sensor network can reduce the nodes functionality and affect the entire wireless sensor network operations. Node experiencing such a problem is called an infected node. Due to infected node packets cannot be forwarded to destination these packets become lost or stuck in the infected areas. This problem will increase the packet loss rate and energy consumption. The corrupted data in the packets results in false analyses and wrong decision making at end system. Hence a timely detection of the infected nodes and determine the alternative route to divert the traffic from infected area. 1.2. Problem Formulation Consider a set of nodes N={Ni | V i} where i is the index of node within a 2-dimensional (2D) Euclidean plane. The source node is known in advance the location of the destination node and through periodic beacon updates it knows the location of other nodes in the sets. In this case we take all the sensor nodes are homogeneous. The position of the nodes can be presented by P = {PN| PN(xNi, yNi) V i}. The transmission range of set of N nodes can be presented by D={D(PNi,R) | V i} where D(PNi, R) ={x| ||x – PNi|| <= R, V x ϵ R 2 }. In this case, the transmission extent for each of Ni is given by R and the centre of the radius is denoted by SN. The neighboring table for each node since the packet is conveyed to destination using the 1-hop information as in GF is given by TNi = [IDNk, PNk] | PNk ϵ D(PNi, R), V k ≠ i where IDNk represents the identification number for node Nk. To initiate the transmission, a source node (NS), according to the position of the destination node (ND) determines the next hop from its routing table TNs which has nearer to the destination node than itself. The same procedure conduct repeated until all the packets have been received by the destination node. Local Minima Problem: If neighbor table of node Nv have no 1-hop neighbor which has closer to destination than node Nv then this will create the local minima problem. This can be presented as follows: {PNk | d(PNk, PND) > d(PNv,PND), V PNk ϵ TNv} = Ø Where TNv is the neighboring table of node Nv containing the closest 1-hop neighbors of Nv. In this case, Nk is closest 1-hop neighbor of node Nv but it cannot be selected as a next

Welcome message from author
This document is posted to help you gain knowledge. Please leave a comment to let me know what you think about it! Share it to your friends and learn new things together.
Transcript

International Journal of Emerging Technologies in Engineering Research (IJETER)
Volume 1, Issue 3, August (2015) www.ijeter.everscience.org
ISSN: 2454-6410 ©EverScience Publications 35
By-Passing Infected Areas in Wireless Sensor
Networks using Twin Rolling Ball Technique
Kiran Kamati
Department of PG studies, VTU, Belagavi, Karnataka, India.
Dr.Santosh Deshapande
Professor Department of CNE, PG Centre VTU Belagavi, Karnataka, India
Abstract – The hardware failure, software corruption and
unfavorable operating environment among the different nodes in
wireless sensor network that can affect quality of collected data
This resulting in misleading packet translation, wrong decision
making and communication failure. The sensed data from other
uninfected region might also get stuck in infected regions. There
is some existing method such as BOUNDHOLE and GAR (Greedy
Anti-Void Routing) can used to solve these issues but it degrades
the performance mainly due to high risk of falling into loop and
visiting unnecessary nodes. In this proposed solution we use twin
rolling ball method to divert the incoming traffic from infected
region and get stuck packet out of infected region. Fuzzy data
clustering is used in proposed solution in order to find the infected
nodes. The information obtained from fuzzy data clustering is
used in proposed By-passed Routing (BPR) technique which use
the two rolling balls rotate in both clockwise and counter
clockwise direction. The first node hit by any ball in any direction
and is uninfected, is selected as next hop.
Index Terms – Wireless Sensor Networks, Routing Protocols,
Fault-Tolerance, Anomalies Detection, Performance Evaluation.
1. INTRODUCTION
Wireless Sensor Networks (WSN) have been playing an
important part in different remote event monitoring
applications, particularly in hazardous regions and unfriendly
situations. In such applications events can be detected through
the data sensing and forwarding to the sink node for further
processing. Before transmitting the data to sink node, sensors
perform the data fusion process to reduce the traffic between
fusion nodes and sink node. However, the direct
communication between source nodes and sink node can affect
by the energy of the node and other resources. Therefore,
communication in wireless sensor network can be achieved
through the intermediate nodes which in turn forward the got
information to another node until packet reach their desired
destination. This can save energy and increase the lifetime of
their battery.
1.1. Problem Statement
The software corruption, hardware failure and non-favorable
operating environment among different nodes in wireless
sensor network can reduce the nodes functionality and affect
the entire wireless sensor network operations. Node
experiencing such a problem is called an infected node. Due to
infected node packets cannot be forwarded to destination these
packets become lost or stuck in the infected areas. This problem
will increase the packet loss rate and energy consumption. The
corrupted data in the packets results in false analyses and
wrong decision making at end system. Hence a timely detection
of the infected nodes and determine the alternative route to
divert the traffic from infected area.
1.2. Problem Formulation
Consider a set of nodes N={Ni | V i} where i is the index of
node within a 2-dimensional (2D) Euclidean plane. The source
node is known in advance the location of the destination node
and through periodic beacon updates it knows the location of
other nodes in the sets. In this case we take all the sensor nodes
are homogeneous. The position of the nodes can be presented
by P = {PN| PN(xNi, yNi) V i}. The transmission range of set of
N nodes can be presented by D={D(PNi,R) | V i} where D(PNi,
R) ={x| ||x – PNi|| <= R, V x ϵ R2}. In this case, the transmission
extent for each of Ni is given by R and the centre of the radius
is denoted by SN. The neighboring table for each node since
the packet is conveyed to destination using the 1-hop
information as in GF is given by TNi = [IDNk, PNk] | PNk ϵ D(PNi,
R), V k ≠ i where IDNk represents the identification number for
node Nk. To initiate the transmission, a source node (NS),
according to the position of the destination node (ND)
determines the next hop from its routing table TNs which has
nearer to the destination node than itself. The same procedure
conduct repeated until all the packets have been received by the
destination node.
Local Minima Problem: If neighbor table of node Nv have no
1-hop neighbor which has closer to destination than node Nv
then this will create the local minima problem. This can be
presented as follows:
{PNk | d(PNk, PND) > d(PNv,PND), V PNk ϵ TNv} = Ø
Where TNv is the neighboring table of node Nv containing the
closest 1-hop neighbors of Nv. In this case, Nk is closest 1-hop
neighbor of node Nv but it cannot be selected as a next

International Journal of Emerging Technologies in Engineering Research (IJETER)
Volume 1, Issue 3, August (2015) www.ijeter.everscience.org
ISSN: 2454-6410 ©EverScience Publications 36
transmitting node of node Nv because node Nk has longer
distance to the destination than node Nv.
The Rolling Ball (RB) Limitations: The RB can be illustrated
in Fig 1 While RB is proven to be successful in avoiding the
identified infected regions, it tends to visit unnecessary nodes
and results in longer routing delays.
Definition (Rolling Ball): In given set of sensor nodes Ni ϵ N,
we consider a circle is a Rolling Ball (RB) is defined by
The rolling circle (RBNi(Si, R/2)) is attached at a
center point Si ϵ R2 with a radius of (R/2).
{RBÑ(Si, R/2)ᴒN} = 0 indicate the node Nk ϵ N should
not be present in the open space within the rolling ball
(RBÑ(Si, R/2)).
Fig 1 The Rolling Ball operation
Problem (False Boundary Detection): From Fig 1 the rolling
ball (RBÑ(Si, R/2)) is attached at the centre of the node Ni, it
will rotate in a clockwise or counter-clockwise until it hits node
Nj. It will continue until the first unidirectional edge is
revisited. From Fig 1 when rolling ball is meet the edge Eij
after the edges Eij, Ejk, Ekl, Elm and Emi are traversed than rolling
ball operation is terminated. However, there will be
communication intersection with another node as shown in Fig
2. This will produce longer routing path because visiting the
unnecessary nodes.
Fig 2 The communication intersection problem which defines
the exit gate node.
1.3. Objectives
To design the method that can get the stuck
packets out of the infected regions.
To design the method that can by-pass infected
areas and reroute the incoming packets to
uninfected regions.
To minimize the effects of infected nodes
because effect of trapping important packets
inside an infected region could be massive.
2. PROPOSED WORK AND METHODOLOGY
The proposed By-Passed Routing (BPR) technique consists
two main parts, namely infected area identification and by-
passed routing.
Fig 3 The proposed architecture view for By-Passed Routing
(BPR) technique
2.1. Fuzzy Data Clustering
Infected node: The node Ni from the given set of sensor nodes
N= [N1,N2,……Nn] is considered as infected if it does satisfies
the following condition
Contains some outlying fluctuation points which can
be classified as anomalous with its fraction over
normal measurements is >=10% of its aggregated
readings over a considered time window δT.
Infected area: Given a subset (n) of WSN sensor nodes (n ϵ
N), which are over a particular spatial area A, that area is
considered as an infected area if and only if;
All the sensor nodes in n satisfy the criteria for
Definition of infected node.

International Journal of Emerging Technologies in Engineering Research (IJETER)
Volume 1, Issue 3, August (2015) www.ijeter.everscience.org
ISSN: 2454-6410 ©EverScience Publications 37
Each node is within one hop communication distance
of at least one other node in n.
Fuzzy data clustering method is used for detecting the anomaly
in the sensed data. Based on membership values fuzzy data
clustering method make the partition of data into clusters and
in this method each data element can part of more than one
cluster. The membership value represent degree which data
element belonging to the particular cluster.
The FCM algorithm try to divide a list of n elements
X={X1,X2,….,Xn} into a C fuzzy clusters based on certain
condition. The output of algorithm is a set of C cluster centers
C={C1,C2,….,Cn} and membership matrix W=wab where wab
belongs to [0,1] a=1,….n, b=1…….C, where wij indicate the
strength of association between element Xa and the cluster Cb.
The FCM (fuzzy c – means clustering) goal to minimize an
objective function (jm)
n C
Jm= ∑ ∑ wabm ||Xa – Cb||2
a=1 b=1
C
Where wab = 1÷ ∑ (||Xa – Cb|| ÷ ||Xa – Ck||)2÷(m-1)
K=1
The fuzzifier m identifies the degree of cluster fuzziness. A
smaller m results in larger membership’s wab values assigned to
data means whose intensities are close to the particular centroid
and larger m value results in smaller membership’s wab values
assigned to data means data is far from the centroid. The
membership’s wab converge to 0 or 1. The value of m is
normally set to 2 when there is a no experimental knowledge.
The membership degree of any data point X in kth cluster is
represented by wk(X). In FCM, the mean of membership degree
of every data points in the cluster is centroid of that cluster.
Ck =∑x wk(X)m X ÷ ∑x wk(X)m
Fuzzy-C-Mean algorithm 1
Step1. Select a number of clusters.
Step2. Randomly assign membership value for each data point
and centroid for each cluster.
Step3. Iterate until the algorithm meet its condition (that is, the
variation of values between two iterations is no more than €,
the given sensitivity threshold):
Step4. Determine the center of every cluster.
Step5. For every data element, determine its degree of
membership within a cluster [4-5].
2.2. By-Passed Routing (BPR)
The aim of this technique is first to get stuck packets out of the
infected regions. Second we divert the incoming packets from
infected region. Once the information about the infected region
is obtained from fuzzy data clustering than that can be used to
by-pass the area and reroute the incoming packets to uninfected
region. This section consists of three different parts: Getting the
Stuck Packets Out, By-passing the infected areas, and Normal
Routing.
Algorithm 2: Avoiding Infected Areas
Step 1: Require: NextHopID, Ns, ND Address;
Step 2: Ns initiates transmission using GF Algorithm;
Step 3: if (d(Nj, ND) < d(Ni ,ND) == TRUE) then
Step 4: Assign Nj as the next hop;
Step 5: if (Local Minima problem is met) then
Step 6: if (Stuck Messages != 0) then
Call the Twin Rolling Balls
function;
Get the Stuck Messages out;
Step 7: else
Step 8: Route the incoming packets using BPR;
Step 9: else
Step 10: Perform the GF algorithm;
Getting the Stuck Packets Out: Some packets are stuck in the
region due to the infected nodes and also there is no node
available for forward these packets to next hop. If no alternative
path arrangement made for these packets than there is high risk
of being dropped. This section composed of three parts: Twin
Rolling Balls, Forwarding the Stuck Packets, and the
Derivation of Exit Gate Node.
The Twin Rolling Balls: For all Niϵ N the two similar rolling
balls RB1Ni(Si, R/2) and RB2Ni(Si, R/2) is defined by
The two rolling circles attached at the NLocal with its
center point at Si and radius of both circles is equal to
R/2.
{RBiÑi(Si, R/2)ᴒN}= NULL indicate the node Nk ϵ N should
not be present in the open space within the two rolling balls
({RBiÑi(Si, R/2)ᴒN}).
Fig 4 The Twin Rolling Balls operation
After the identification of infected nodes and infected packets
we need to define the boundary nodes to route the packets away
from the infected region. In this proposed By-pass routing
(BPR) technique we use the twin rolling ball method to identify
the boundary nodes. These two rolling ball attached at NLocal(
node which has local minima problem) and rotate in both
International Journal of Emerging Technologies in Engineering Research (IJETER)
Volume 1, Issue 3, August (2015) www.ijeter.everscience.org
ISSN: 2454-6410 ©EverScience Publications 38
clockwise and counter clockwise direction. First node that hits
any ball, any direction and is uninfected is selected as a next
hop. Rotate in one direction may take longer time if node
located far away from the ball. Hence we use two rolling ball
rotate in both direction, it ensures faster direction of next hop.
Flow Chart: Twin Rolling Ball
Forwarding the Stuck Packets: The BOUNDHOLE and
GAR (Greedy Anti-Void Routing) can get the stuck packet out
of the infected region but it may results in high possibility of
falling in loop and visiting unnecessary nodes. In proposed
rolling ball method, the two rolling ball is attached at local
minima node and rotate in both clockwise and counter
clockwise direction. This method compare the distance
between first node hit by the two rolling ball in both direction.
The node which has smaller distance and is not infected will be
selected as next hop (N6 using counter-clockwise rotation). The
selected node determines the direction for rest of rotation. The
rolling ball continues to rotate in that direction until all the
nodes within communication range of NLocal has been visit. This
method results in shorter paths and save the energy
consumption by avoiding the unnecessary transmission.
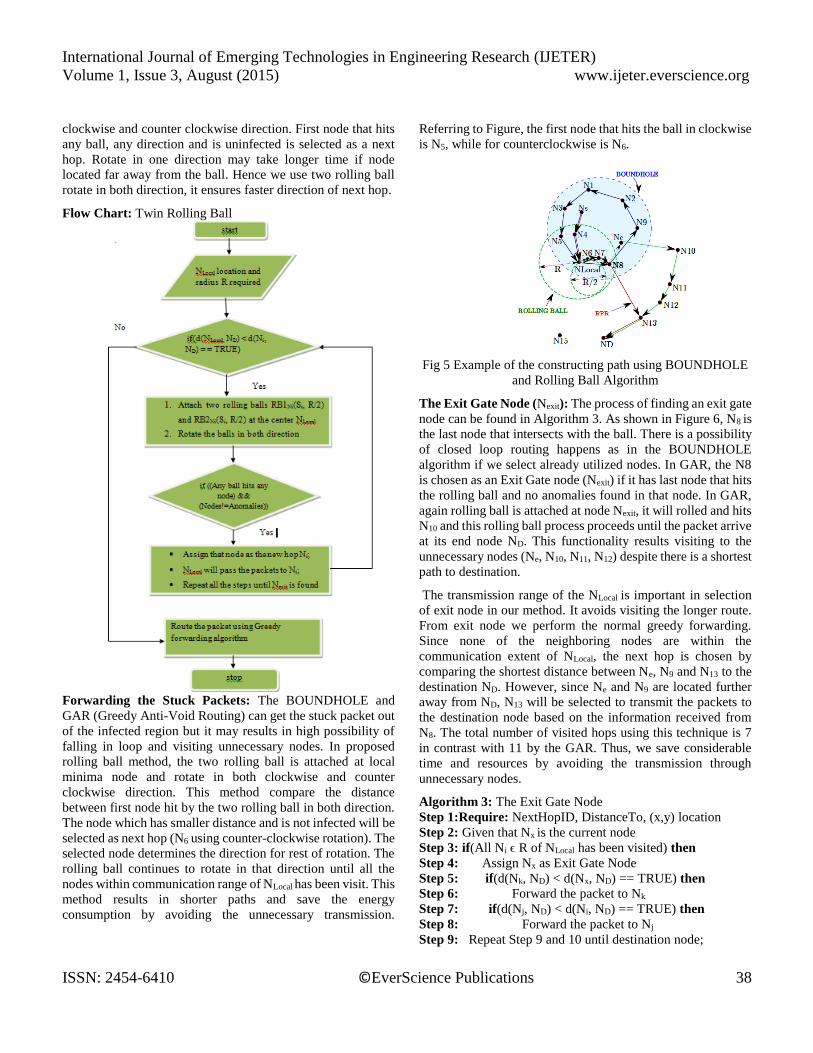
Referring to Figure, the first node that hits the ball in clockwise
is N5, while for counterclockwise is N6.
Fig 5 Example of the constructing path using BOUNDHOLE
and Rolling Ball Algorithm
The Exit Gate Node (Nexit): The process of finding an exit gate
node can be found in Algorithm 3. As shown in Figure 6, N8 is
the last node that intersects with the ball. There is a possibility
of closed loop routing happens as in the BOUNDHOLE
algorithm if we select already utilized nodes. In GAR, the N8
is chosen as an Exit Gate node (Nexit) if it has last node that hits
the rolling ball and no anomalies found in that node. In GAR,
again rolling ball is attached at node Nexit, it will rolled and hits
N10 and this rolling ball process proceeds until the packet arrive
at its end node ND. This functionality results visiting to the
unnecessary nodes (Ne, N10, N11, N12) despite there is a shortest
path to destination.
The transmission range of the NLocal is important in selection
of exit node in our method. It avoids visiting the longer route.
From exit node we perform the normal greedy forwarding.
Since none of the neighboring nodes are within the
communication extent of NLocal, the next hop is chosen by
comparing the shortest distance between Ne, N9 and N13 to the
destination ND. However, since Ne and N9 are located further
away from ND, N13 will be selected to transmit the packets to
the destination node based on the information received from
N8. The total number of visited hops using this technique is 7
in contrast with 11 by the GAR. Thus, we save considerable
time and resources by avoiding the transmission through
unnecessary nodes.
Algorithm 3: The Exit Gate Node
Step 1:Require: NextHopID, DistanceTo, (x,y) location
Step 2: Given that Nx is the current node
Step 3: if(All Ni ϵ R of NLocal has been visited) then
Step 4: Assign Nx as Exit Gate Node
Step 5: if(d(Nk, ND) < d(Nx, ND) == TRUE) then
Step 6: Forward the packet to Nk
Step 7: if(d(Nj, ND) < d(Ni, ND) == TRUE) then
Step 8: Forward the packet to Nj
Step 9: Repeat Step 9 and 10 until destination node;

International Journal of Emerging Technologies in Engineering Research (IJETER)
Volume 1, Issue 3, August (2015) www.ijeter.everscience.org
ISSN: 2454-6410 ©EverScience Publications 39
Step 10: else
Step 11: Compare the distance of node Ni with Nk
Step 12: if(d(Ni, ND) < d(Nx, ND) == TRUE) then
Step 13: Forward the packet to Ni
Step 14: else Step 15: Call LocalMinima();
By-Passing Infected Areas: This method is needs to protect
both generated packets and packets ‘on-the-fly’ from being
routed to infected nodes. Therefore, we provide an alternative
route to detour the affected packets. There are three processes
in this method. First is flag notification of the infected nodes.
This is followed by traffic diversion and finally the beacon
updates.
Flag Notification of the Infected Nodes: The back-pressure
method can used to notify source node about the infected node.
The back-pressure method can insert the flags in notification
packet and send it to the source node. Here flag is set to 1 if any
infected node is detected or set to 0 if no infected node is
detected. This method sends notification packet to the source
node through the intermediate nodes that are present within the
same route with infected node. This can avoid the unnecessary
transmission of notification packet. Each intermediate node
receives the notification packet, check its routing table and
delete the corresponding entry of infected node. Each
intermediate node continues to route the notification packet to
its one hop adjacent node until it arrives at the source node.
Source node will also delete the corresponding entry of infected
node and avoid the sending packet through that infected nodes.
Traffic Diversion: The identification of location of infected
node is important to discover the way to divert the incoming
traffic from infected region. After the identification of infected
nodes periodic beacon updates occurs between the intermediate
nodes. After the beacon updates each intermediate node knows
position and distance to their new uninfected 1-hop neighbor.
The use of these uninfected 1-hop neighbors we correctly
forward the packet to the destination. Each intermediate node
chooses its 1-hop neighbor based on closest distance to the
destination. This action will continue until it reaches the
destination, unless they receive another infection notification.
This will save time and resources for retransmission and there
will be minimum communication overhead because each node
requires only knowledge of its 1-hop neighbor.
Beacon Updates: Frequent updates of data in each nodes
routing table results in timely delivery of data in the network.
In order to minimize the routing overhead we limits the updates
for every five intermediate nodes means all five intermediate
updates its routing table one by one after receiving the
notification message. If source node not receives the ACK from
5th intermediate node after certain threshold, the source node
will retransmit the same packet from which ACK is missing.
The source node will piggyback the received information to the
downstream nodes. First node which receives notification
message updates its routing table and continues to forward the
notification packet to its next hop available in routing table.
Sometime it takes the longer duration to send the ACK. For
example we limit updates for every 10th node if first node is
infected during the transmission; it can only detected after the
10th node this may lead to delay in detecting infected node and
huge waste of resources in terms of energy.
Normal Forwarding Algorithm: There is no infected nodes
are found than packets are forwarded using Greedy forwarding
or hop-by-hop forwarding. The source node, knowing the
address of the destination, will encapsulate address of
destination into packet to its next 1-hop neighbor. The current
node receives information of destination and based on this
information it find its next 1-hop neighbor. This process will
continue until it reaches the destination. In case of local
minima, the BPR technique is automatically applied.
3. RESULTS AND DISCUSSION
Figure 6 Identification of Location of Infected Nodes
The Figure 6 screenshot shows the identification of location of
infected nodes and alternative path for routing the packets to
destination. The red mark nodes represent the infected nodes.
Figure 7 Command Window

International Journal of Emerging Technologies in Engineering Research (IJETER)
Volume 1, Issue 3, August (2015) www.ijeter.everscience.org
ISSN: 2454-6410 ©EverScience Publications 40
The command window values from above screenshots are used
for assess the performance of twin rolling ball technique. The
graph is taken based upon these command window values.
Figure 8 Infected areas Vs Number of hops graph
Figure 9 Infected areas Vs packet Deliver Ratio graph.
Figure 10 Infected areas Vs Routing efficiency
Figure 11 Infected areas Vs Energy consumption
Figure 12 Infected areas Vs Avg End to End Delay
Figure 8 graph screenshot shows infected areas Vs Number of
hops graph. The number of hops through which packet travel
is increases as area of infected node increases. Figure 9 graph
screenshot shows infected areas Vs packet Deliver Ratio graph.
This graph shows ratio of packet that are successfully
forwarded to destination. Figure 10 graph screenshot shows
infected areas Vs Routing efficiency. Routing path efficiency
is ratio of number of hops for whole networks to the number
hops used for the shortest distance. Figure 11 graph screenshot
shows infected areas Vs Energy consumption. The small
number of hops used for transferring the packets results in each
node utilizes more energy to transmit the packet to destination.
As infected area increases, the average energy consumption
also increases. Figure 12 graph screenshot shows infected
areas Vs Avg End to End Delay. This delay depends on number
of hops and the packet delivery ratio. The infected area results
in longer route for transferring the packets to destination which
increases the Avg End-to-End Delay.

International Journal of Emerging Technologies in Engineering Research (IJETER)
Volume 1, Issue 3, August (2015) www.ijeter.everscience.org
ISSN: 2454-6410 ©EverScience Publications 41
4. CONCLUSION
It can be concluded that By-Pass Routing (BPR) technique is
used to avoid infected nodes, it can be performed using the
fuzzy data clustering that detect the infected nodes and twin
rolling ball method in proposed By-Pass Routing (BPR)
technique that quickly detect boundary nodes around the
infected nodes for forwarding the stuck packets and incoming
packets away from the infected area. The proposed By-Pass
Routing (BPR) technique overcome from false boundary
detection and visits to unnecessary nodes problem present in
the existing BOUNDHOLE and GAR (Greedy Anti-Void
Routing) method and improve overall performance of network.
REFERENCES [1] N. Ahmed, S. S. Kanhere, and S. Jha, “The holes problem in wireless
sensor networks: a survey,” SIGMOBILE Mob. Comput. Commun. Rev.,
vol. 9, no. 2, pp. 4–18, Apr. 2005.
[2] D. Chen and P. K. Varshney, “On-demand geographic forwarding for data delivery in wireless sensor networks,” Computer Communications,
vol. 30, no. 1415, pp. 2954 – 2967, 2007.
[3] K.-I. Kim, M.-J. Baek, and T.-E. Sung, “Load balancing for greedy forwarding of geographic routing in wireless networks,” IEICE
Transactions, vol. 93-B, no. 8, pp. 2184–2187, 2010.
[4] G. Qing Fang, Jie Gao and L.J., “Locating and bypassing routing holes in sensor networks,” in INFOCOM : 23rd Annual Joint Conference of the
IEEE Computer and Communications Societies, 2004, pp. 2458–2468.
[5] K.-T. F. Wen-Jiunn Liu, “Greedy routing with anti-void traversal for wireless sensor networks,” IEEE Transactions on Mobile Computing,
vol. 8, no. 7, pp. 910–922, 2009.
[6] “Greedy Geographical Void Routing for Wireless Sensor Networks” Chiang Tzu-Chiang, Chang Jia-Lin, Tsai Yue-Fu, and Li Sha-Pai.
[7] Evangelos Kranakis, Harvinder Singh, and Jorge Urrutia. Compass
routing on geometric networks. In Proceedings of the 11th Canadian Conference on Computational Geometry, pages 51.54, 1999.
[8] Fabian Kuhn, Roger Wattenhofer, Yan Zhong, and Aaron Zollinger.
Geometric ad-hoc routing: Of theory and practice. In 23rd ACM Symposium on Principles of Distributed Computing (PODC '03), July
2003.
Related Documents