Arizona Weather & Climate 1 In this chapter you will learn: How to distinguish between weather and climate. Major physical processes influencing weather patterns in the Southwest How weather impacts Arizona water About scale and climate in the southwest About drought and climate in Arizona ARIZONA WEATHER & CLIMATE By Gregg Garfin & Robert Emanuel “And it never failed that during the dry years the people forgot about the rich years, and during the wet years they lost all memory of the dry years. It was always that way.” –John Steinbeck, East of Eden, 1952 INTRODUCTION Water must get to Arizona’s watersheds by some means. Whether it was deposited into the underground aquifers beneath desert valleys eons ago or comes tumbling down White Mountain streams from last year’s snows, the hydrologic cycle is the process responsible. That cycle is powered by solar energy and uses the atmosphere to convey its treasure to our watersheds. The hydrologic cycle involves the two great engines of the planet—the ocean and the atmosphere both powered by heat from the sun. Both the ocean and atmosphere absorb solar energy and convey that energy to the land or back to the ocean. The everyday operation of these processes can be called weather, while the long-term variations in weather are called climate. This chapter will teach you about some of the fundamentals of Arizona’s weather and climate. They serve as a cornerstone to understanding how watersheds work. First, we need to make some important distinctions. Weather brings us our surface water (or that not already deposited thousands of years ago in aquifers), while climate governs where, when, and how much water we get. The difference between weather and climate is largely one of scale: rain may fall on you locally and you can call it weather, but rain falling every year in the same location might be more aptly called climate. Scientists who study climate are called climatologists, while those who study weather are meteorologists. We will start by talking about climate patterns on the larger spatial scale then move into some aspects of weather on the smaller scale. Then we will describe how these patterns have changed or will change over time, hence influencing the distribution of water to our watersheds. CLIMATE IN AN ARID STATE Arizona has an arid climate; thus it might seem to a person not native to the state that Arizona is always in drought. Rather, aridity is a normal state of affairs in Arizona that varies between above normal rain or snowfall and below normal rain or snowfall. Situated at the intersection of the four major North American deserts, Arizona’s primary vegetation is typical of the Sonoran Desert in the south and the Great Basin Desert in the north, and is far lusher than deserts centered in the subtropical latitudes (such as the Sahara Desert).

Welcome message from author
This document is posted to help you gain knowledge. Please leave a comment to let me know what you think about it! Share it to your friends and learn new things together.
Transcript

Arizona Weather & Climate 1
In this chapter you will learn:
How to distinguish between weather and climate.
Major physical processes influencing weather patterns in the Southwest
How weather impacts Arizona water About scale and climate in the southwest About drought and climate in Arizona
ARIZONA WEATHER & CLIMATE By Gregg Garfin & Robert Emanuel “And it never failed that during the dry years the people forgot about the rich years, and during the wet years they lost all memory of the dry years. It was always that way.” –John Steinbeck, East of Eden, 1952 INTRODUCTION Water must get to Arizona’s watersheds by some means. Whether it was deposited into the underground aquifers beneath desert valleys eons ago or comes tumbling down White Mountain streams from last year’s snows, the hydrologic cycle is the process responsible. That cycle is powered by solar energy and uses the atmosphere to convey its treasure to our watersheds. The hydrologic cycle involves the two great engines of the planet—the ocean and the atmosphere both powered by heat from the sun. Both the ocean and atmosphere absorb solar energy and convey that energy to the land or back to the ocean. The everyday operation of these processes can be called weather, while the long-term variations in weather are called climate. This chapter will teach you about some of the fundamentals of Arizona’s weather and climate. They serve as a cornerstone to understanding how watersheds work. First, we need to make some important distinctions. Weather brings us our surface water (or that not already deposited thousands of years ago in aquifers), while climate governs where, when, and how much water we get. The difference between weather and climate is largely one of scale: rain may fall on you locally and you can call it weather, but rain falling every year in the same location might be more aptly called climate. Scientists who study climate are
called climatologists, while those who study weather are meteorologists. We will start by talking about climate patterns on the larger spatial scale then move into some aspects of weather on the smaller scale. Then we will describe how these patterns have changed or will change over time, hence influencing the distribution of water to our watersheds.
CLIMATE IN AN ARID STATE
Arizona has an arid climate; thus it might seem to a person not native to the state that Arizona is always in drought. Rather, aridity is a normal state of affairs in Arizona that varies between above normal rain or snowfall and below normal rain or snowfall. Situated at the intersection of the four major North American deserts, Arizona’s primary vegetation is typical of the Sonoran Desert in the south and the Great Basin Desert in the north, and is far lusher than deserts centered in the subtropical latitudes (such as the Sahara Desert).

Arizona Weather & Climate 2
Figure 1. Precipitation patterns in the Southwest, represented on a series of climatographs for each climate division in the region (dashed line). Numbers in the upper-left and upper-right corners represent mean annual precipitation and mean annual temperature (in degrees Fahrenheit). The x-axis of the climatogram is January to December while the y-axis represents between 0 and 3 inches of precipitation (from Sheppard et al. 1999).
As is typical of most of the world's desert regions, Arizona’s climate is strongly influenced by seasonal variations in the location and strength of a semi-permanent subtropical high pressure circulation. This circulation is strongest during the summer and keeps storms to our north or south and brings Arizona its many days of clear skies and warm, dry conditions. It results from hot air rising at the Equator, then descending around 30ºt. The descending air keeps a band of deserts
around the globe consistently dry. During the winter, however, this pattern is displaced or disappears altogether and we receive precipitation (rain, sleet, hail, or snowfall). That precipitation comes from the south—as the North American Monsoon—as well as from the west—through Pacific frontal storms. These two weather conditions provide us with a majority of our precious precipitation. Figure 1 illustrates this, with what climatologists call a bimodal distribution of precipitation.
Arizona Weather & Climate 3
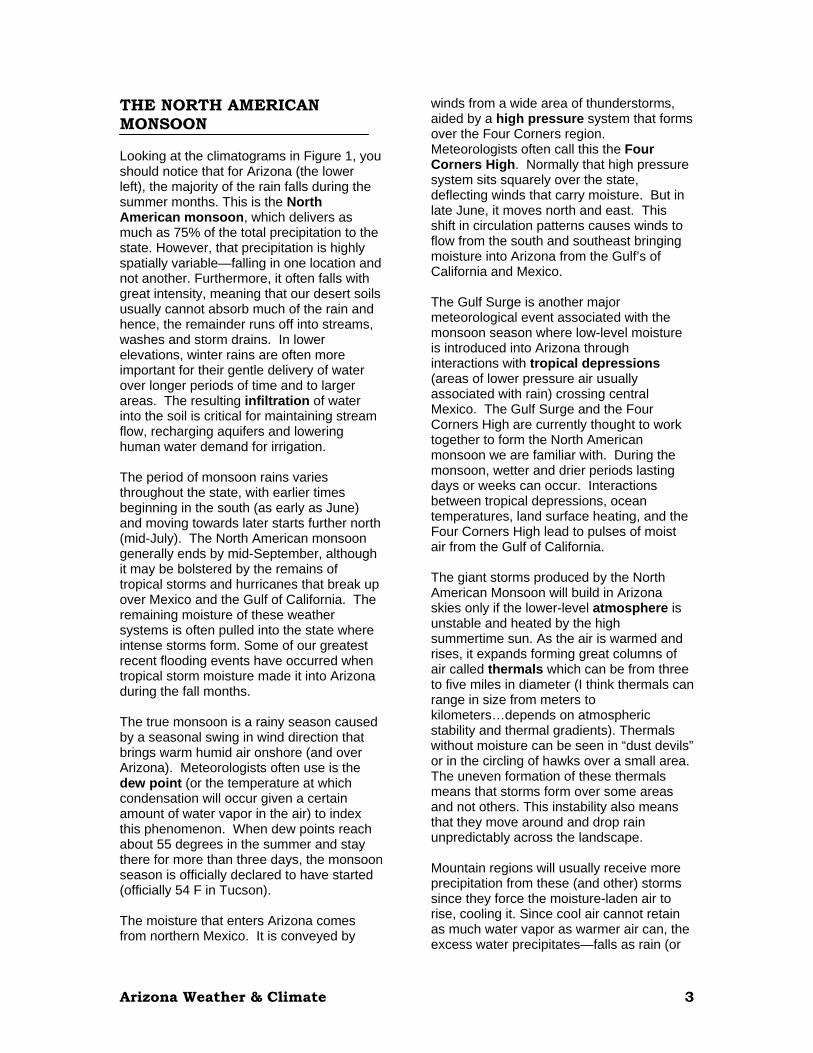
THE NORTH AMERICAN MONSOON Looking at the climatograms in Figure 1, you should notice that for Arizona (the lower left), the majority of the rain falls during the summer months. This is the North American monsoon, which delivers as much as 75% of the total precipitation to the state. However, that precipitation is highly spatially variable—falling in one location and not another. Furthermore, it often falls with great intensity, meaning that our desert soils usually cannot absorb much of the rain and hence, the remainder runs off into streams, washes and storm drains. In lower elevations, winter rains are often more important for their gentle delivery of water over longer periods of time and to larger areas. The resulting infiltration of water into the soil is critical for maintaining stream flow, recharging aquifers and lowering human water demand for irrigation. The period of monsoon rains varies throughout the state, with earlier times beginning in the south (as early as June) and moving towards later starts further north (mid-July). The North American monsoon generally ends by mid-September, although it may be bolstered by the remains of tropical storms and hurricanes that break up over Mexico and the Gulf of California. The remaining moisture of these weather systems is often pulled into the state where intense storms form. Some of our greatest recent flooding events have occurred when tropical storm moisture made it into Arizona during the fall months. The true monsoon is a rainy season caused by a seasonal swing in wind direction that brings warm humid air onshore (and over Arizona). Meteorologists often use is the dew point (or the temperature at which condensation will occur given a certain amount of water vapor in the air) to index this phenomenon. When dew points reach about 55 degrees in the summer and stay there for more than three days, the monsoon season is officially declared to have started (officially 54 F in Tucson). The moisture that enters Arizona comes from northern Mexico. It is conveyed by
winds from a wide area of thunderstorms, aided by a high pressure system that forms over the Four Corners region. Meteorologists often call this the Four Corners High. Normally that high pressure system sits squarely over the state, deflecting winds that carry moisture. But in late June, it moves north and east. This shift in circulation patterns causes winds to flow from the south and southeast bringing moisture into Arizona from the Gulf’s of California and Mexico. The Gulf Surge is another major meteorological event associated with the monsoon season where low-level moisture is introduced into Arizona through interactions with tropical depressions (areas of lower pressure air usually associated with rain) crossing central Mexico. The Gulf Surge and the Four Corners High are currently thought to work together to form the North American monsoon we are familiar with. During the monsoon, wetter and drier periods lasting days or weeks can occur. Interactions between tropical depressions, ocean temperatures, land surface heating, and the Four Corners High lead to pulses of moist air from the Gulf of California. The giant storms produced by the North American Monsoon will build in Arizona skies only if the lower-level atmosphere is unstable and heated by the high summertime sun. As the air is warmed and rises, it expands forming great columns of air called thermals which can be from three to five miles in diameter (I think thermals can range in size from meters to kilometers…depends on atmospheric stability and thermal gradients). Thermals without moisture can be seen in “dust devils” or in the circling of hawks over a small area. The uneven formation of these thermals means that storms form over some areas and not others. This instability also means that they move around and drop rain unpredictably across the landscape. Mountain regions will usually receive more precipitation from these (and other) storms since they force the moisture-laden air to rise, cooling it. Since cool air cannot retain as much water vapor as warmer air can, the excess water precipitates—falls as rain (or
Arizona Weather & Climate 4
THUNDERSTORM FORMATION Assume we have an adequate source of moisture and heat. Both tend to be present during Arizona’s monsoon season and contribute to unstable air. Early in the day, and as the land begins to warm with solar energy, thermals of air form. Some of these we see as scattered puffy clouds. By noon it is not uncommon to see the clouds have developed considerably. This is known as the cumulus stage. As energy and moisture continue to feed into the developing cumulus, the cloud begins to become darkened, very rugged, threatening or producing heavy showers, possibly hail, and violent winds. The cloud is often topped with a flattened, “anvil”, pointing in the direction of the prevailing winds aloft; this cloud (cumulonimbus) represents the mature stage. As the process of events continue, the energy and moisture needed to sustain the activity diminishes and the cloud begins to collapse forming the dissipating stage. These processes can produce the most violent weather in the form of flooding, lightning, and winds—even tornadoes—found in Arizona. The unstable air in these storms can produce extreme downdrafts that are called microbursts.
hail, sleet and snow). Areas on the other side of these mountain ranges will receive less precipitation because the air is effectively drained. While thunderstorms occur at a more localized scale and may occur on several sides of a mountain, this is what is known as a rain shadow effect. It is responsible for forming drier deserts east of most mountain ranges in western North America. If the landscape were completely flat, the sun would heat it evenly, but mountains cause uneven heating of the lower-level atmosphere. That orographic influence means they may generate their own weather. In the summer months they may build up heavy thunderstorms overhead—and receive the lion’s share of the precipitation as discussed above. This increased precipitation is an important
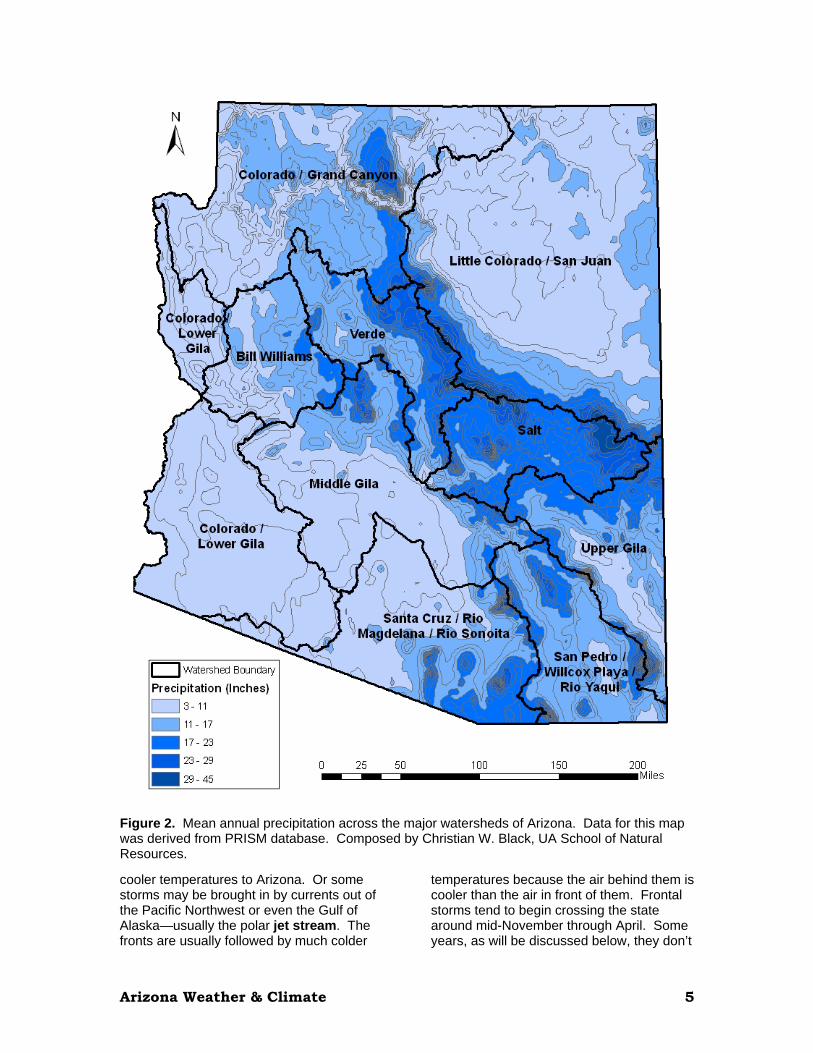
reason by mountains along the Mogollon Rim and Colorado Plateau contain many of the headwaters of our streams and rivers (see Figure 2). Looking at Figure 2, you will notice that a broad band of heavy precipitation runs through the central part of Arizona—this represents the White Mountains, Sky Islands, and the Mogollon Rim. Note that some of the state’s most important rivers begin here—the Salt, Verde, and Gila. WINTER PRECIPITATION Looking again at the climatograms for Arizona in Figure 1, as we move into the mountains that run through the central and northern portions of the state, notice that wintertime precipitation also plays an important role. It constitutes the other “hump” in the bimodal distribution of precipitation. It contributes to the deep blue orographic band in Figure 2 that indicates precipitation between 17 and 45 inches annually. When air temperatures are below freezing the precipitation falls mostly as snow. The deposits of this snow are called snowpack. Since much of our surface water begins at headwaters in these mountainous regions (including the Rocky Mountain headwaters of the Colorado River), the amount of snowpack that develops in these headwater regions is critical for streams to flow during the spring and summer months. Winter precipitation also is vitally important for the desert regions of the state. While summer thunderstorms give quick relief to residents, their rainfall is only a temporary solution to water scarcity because the water runs off quickly. In contrast, the winter precipitation, brought by Pacific storms and their associated fronts—the leading edge of a distinct air-mass—may deliver bands of soaking rains that fall over a broad area. This steady, longer-term precipitation may better infiltrate into soils, help to recharge aquifers and fill streams dependent upon high water tables. These storms are brought in by westerly winds that cross California and Northern Mexico, delivering rain and snow along with
Arizona Weather & Climate 5
Figure 2. Mean annual precipitation across the major watersheds of Arizona. Data for this map was derived from PRISM database. Composed by Christian W. Black, UA School of Natural Resources.
cooler temperatures to Arizona. Or some storms may be brought in by currents out of the Pacific Northwest or even the Gulf of Alaska—usually the polar jet stream. The fronts are usually followed by much colder
temperatures because the air behind them is cooler than the air in front of them. Frontal storms tend to begin crossing the state around mid-November through April. Some years, as will be discussed below, they don’t

Arizona Weather & Climate 6
come at all because of interactions between circulation patterns and sea temperatures (such as the now famous El Niño and La Niña effects). In the late spring, air temperatures rise again, and the storm tracks retreat further north as the high pressure ridge is reestablished over the majority of the state. This period, often referred to as the arid foresummer brings high temperatures, wind in some locations, and dry conditions while the mountains begin to thaw and snowpack melts. OTHER INFLUENCES ON ARIZONA CLIMATE: WHY DRY GETS DRIER Remember the subtropical high pressure circulation? The interaction of this important phenomenon with other atmospheric features has much to do with the amount of precipitation we receive in different seasons and years. Some of these atmospheric features include the polar and subtropical jet streams in the winter, the North American monsoon circulation during summer, and long-or short-term ocean-atmosphere variations. These interactions determine the intensity, frequency, and duration of drought in Arizona. As mentioned earlier, precipitation in Arizona is highly seasonal, with peaks during the winter (November-April) and summer (July-September). Wintertime precipitation—including snowpack formation—is especially vital for water supply for the rest of the year. It is easy to see that variations in winter precipitation are critical to the story of drought in Arizona.
OCEAN-ATMOSPHERE INTERACTIONS In addition to strong seasonality, Arizona precipitation, like that of most of the world's desert regions, is characterized by a high degree of interannual variation (varying from year to year). One of the key factors influencing interannual precipitation variations in Arizona, during winter in particular, is the El Niño-Southern
Oscillation (ENSO), a multi-season to multi-year variation in equatorial Pacific Ocean temperatures and associated atmospheric circulation. The ENSO phenomenon has a period of variation of approximately 2 to 10 years, with an average interval of 3 to 4 years between El Niño episodes. ENSO results from a tight connection between the ocean and atmosphere. A quick look at a globe will show that about 50 percent of the Earth’s equatorial region is located in the Pacific Ocean. In particular, the equatorial atmosphere over much of the Pacific Ocean receives the most solar radiation of anywhere on earth. The equatorial ocean can get quite warm, and can impart a lot of energy to the atmosphere. Consequently, changes in the ocean and atmosphere in this area have a large influence on the rest of the Earth. Because of the ocean’s great mass and capacity to retain heat (known as thermal capacity), it changes slowly. Consequently, changes here can influence the atmosphere for a long time (months, years or decades). HOW ENSO WORKS Normally, the western equatorial Pacific Ocean is the center of warm sea surface temperatures and atmospheric low pressure (frequent storms). The eastern equatorial Pacific Ocean is characterized by a relative coolness and clear skies (high pressure), maintained by (1) ocean currents that bring cold water from higher and cooler latitudes and (2) the trade winds that blow from east to west across the tropics. When the trade winds that blow from east to west across this region weaken during an El Niño episode, warm surface-water conditions can expand eastward from near Indonesia across the tropical Pacific. These warm waters are accompanied by tropical showers and thunderstorms (low pressure). The waters of the western equatorial Pacific Ocean cool relative to the eastern equatorial Pacific Ocean and the atmosphere there is now characterized by clear skies and high pressure. These basin-wide changes in atmospheric pressure across the Pacific Ocean, sometimes described as a “see-saw,” are called the Southern Oscillation. The oscillation represents a sort of thermal

Arizona Weather & Climate 7
see-saw across the Pacific. The thermal opposite of El Niño is a shift back to unusually cool waters in the eastern equatorial Pacific Ocean generally followed by less storm-forming convention. This phenomenon is called La Niña. Figure 3, on page nine, illustrates the impacts of this see-saw on North America—especially as winds that bring moisture to the western United States during the critical winter months. The following section explains this process in greater detail. HOW ENSO AFFECTS OUR REGION The atmosphere, like the ocean, is a fluid. Hence, the atmosphere displays wave-like motion. During the El Niño phase of ENSO, the vigorous rising air from convection displaced from the western to the eastern tropical Pacific Ocean imparts energy to the upper atmosphere. This helps steer upper-level winds from tropical latitudes to the midlatitudes, and impacts climate all over the world. In particular, during El Niño episodes the westerly flow shifts, (1) southward, (2) becoming more wave-like from north to south, or (3) even splitting into two branches (see Figure 3). Storms that travel the southern branch may tap into moisture of lower latitudes over the eastern Pacific Ocean, resulting in an increase in low-intensity winter precipitation in the Southwest. During the La Niña phase of ENSO, tropical easterly winds are enhanced, westerly flow enters North America far to the north of Arizona, and subtropical high pressure, with its clear skies and dry conditions can dominate our region. When ENSO is in its El Niño phase, Arizona frequently receives above average winter precipitation, due to shifts in westerly flow increased low-latitude moisture available to storms tracking across the Southwest. The El Niño-wet Arizona winter connection, however, is quite variable, and although most of the wettest Arizona winters have occurred during the El Niño phase, there have been a considerable number of dry Arizona El Niño winters. When ENSO is in its La Niña phase, Arizona is most frequently dry due to a more northern storm track and
increased influence of subtropical high pressure. Several Arizona droughts during the past two decades (1989-90, 1995-96, 1998-2001) have been initiated by La Niña conditions in the Pacific. El Niño impacts often (but not always) produce more precipitation and lower temperatures during winter months, both of which can add up to increased soil moisture and better stream flow during the year. Too much of a good thing, however, can lead to damaging storms and floods. For instance, winter floods are more likely to occur during El Niño years. Snowpack from precipitation during an El Niño winter contributed to January 1993 flooding in Arizona, following a series of Pacific storms. Similarly, the spectacular October 1983 floods in Arizona may have been indirectly related to the ongoing El Niño. Although most of the downpour again came from a tropical storm, the storm itself may have been driven deeper into Arizona by El Niño conditions, which have a strong influence on wind patterns emanating from the tropics. During the El Niño years that occurred during the 1895-1996 period, December-March precipitation rates for Arizona’s seven regional climate divisions averaged 170% of their 102-year mean, according to information from NOAA’s Climate Prediction Center. In some ways ENSO’s main effect is to affect the variability of precipitation. El Niño provides no real safeguard against below-average precipitation. But if departures above the norm are going to occur, they will probably occur during the El Niño phase of ENSO. La Niña winter precipitation, reliably drier than average, is less variable than winter precipitation during either the neutral or El Niño phase of ENSO. It is important to note that ENSO has varied considerably in frequency, intensity, and interval between El Niño and La Niña phase over the historical and paleoclimate record. Variability in the location of ENSO centers of convection in the Pacific Ocean also has an effect on whether a particular El Niño episode, for example, will produce significant precipitation in Arizona. When the center of convection is further east in the Pacific, and/or when there is a strong El Niño, then there is a greater chance that
Arizona Weather & Climate 8
Arizona will receive above-average winter precipitation.
OBSERVING & PREDICTING ENSO A series of events in the tropical Pacific Ocean set the wheels of El Niño in motion. First, the usual easterly trade winds die down or even change direction, a phenomenon climatologists detect by comparing atmospheric pressure in Northern Australia, (western Pacific Ocean) with that of Tahiti (east-central Pacific Ocean). When the trade winds let up during an El Niño event, the warm surface waters of the western equatorial Pacific that typically pool in the vicinity of Darwin, Australia can expand into the eastern Pacific, butting up against the western coast of the Americas. Sea surface temperature measurements in regions of the equatorial Pacific that are sensitive indicators of ENSO activity, then, allow scientists to detect El Niño months beforehand. These projections are possible in part because the ocean plays a large role in determining climate at longer time scales (such as seasons-to-years). Again, El Niño-Southern Oscillation (ENSO) results from a tight connection between the ocean and atmosphere. Because of the ocean’s thermal capacity, it changes slowly, and thus climatologists can be fairly certain that atmospheric conditions will not change rapidly. This allows climatologists to predict ENSO conditions at time scales that are impossible for weather prediction—or your daily forecasts. Typically, El Niño events begin between March and September and end in February or March, respectively. However, many events are not typical and develop differently through the seasons and from year to year. The peak strength of ENSO events is in the northern hemisphere winter, and it is during this time of the year that ENSO predictions are typically most accurate. But like any weather forecasting, climatologists and meteorologists employ some science, statistics, computer modeling, and a healthy dash of caution!
LONGER TIME-SCALE INFLUENCES ON ARIZONA CLIMATE & DROUGHT As mentioned previously, climate includes long-term variability. In many cases, when we talk about the long-term, it can be measured in terms of decades, centuries or even millennia. Multi-decade time scale changes in the climate of both the Pacific and Atlantic Ocean basins are implicated in severe sustained drought in Arizona. In the Pacific Ocean, a recently discovered phenomenon, called the Pacific Decadal Oscillation (PDO), has been linked to the long-term record of winter (November-March) precipitation variations in the western United States. An analogy to the PDO might be to think of it as an ENSO circulation that occurs over decades. The PDO involves the North and equatorial Pacific Ocean. The PDO is related to long-term variability of the Pacific Ocean north of the equator. In the case of the PDO, both sea surface temperatures and atmospheric pressure vary at the same rates, such that multi-decade periods of relatively cool water in the east-central tropical Pacific and along the west coast of North America combined with relatively warm water in the Northwest Pacific are associated with multi-decade dry periods in Arizona. This is known as the “cool phase” of the PDO. The “warm phase” of the PDO features relatively warm water in the east-central tropical Pacific and along the west coast of North America combined with relatively cool water in the Northwest Pacific; this phase is associated with multi-decade wet periods in Arizona. The effects of ENSO are enhanced or dampened according to the phase of the PDO. The cool PDO phase is associated with enhanced La Niña activity and dry conditions in the Southwest, and vice versa.

Arizona Weather & Climate 9
Figure 3. El Niño and La Niña impacts on weather patterns in North America. Graphic courtesy of NOAA.
Arizona Weather & Climate 10
Researchers are just beginning to understand the internal dynamics of this climatic factor and are wading through sometimes contradictory data that show different results depending on what types of climatic records are examined and at what time scales. Current studies conclude that the PDO is strongly, but not uniformly, correlated with winter precipitation in the Southwest. Although the internal dynamics that cause the PDO to shift are not yet fully understood, studies of its impacts are already helping climate forecasters to improve seasonal forecasts. The PDO has important implications for improving forecasts, because it imposes at least some order on the climate system over long periods of time. Although year-to-year variations in Arizona precipitation are not perfectly correlated with PDO variations, multi-decade shifts in the PDO correspond to at least three 20th century wet and dry epochs in Arizona. Some of these periods include:
The mid-1900s to early-1940s wet period. An early-1940s to mid-1970s dry period. A mid-1970s to late 1990s wet period.
During the cool PDO phase, La Niña tends to be strong and stable. Multi-year droughts in the 1950s, which occurred during the last cool phase of the PDO, caused tremendous disruption to social, agricultural, ecological, and economic systems. Such droughts have recurred about twice per century over the past 400 years. Atmospheric pressure, sea surface temperatures and western U.S. drought patterns since 1999 indicate the possibility that the PDO might have shifted to a phase favoring dry conditions in Arizona for the next 20 or so years. Across Arizona, 1999-2003 is one of the driest 5-year periods of
winter precipitation in the instrumental climate record. Unfortunately, during wet Southwest PDO phases, our ability to forecast ENSO-related winter precipitation is usually one-to-several seasons in advance of that winter. During dry Southwest PDO phases, forecast lead time is diminished to perhaps only one month in advance!
ATLANTIC INFLUENCES & PALEOCLIMATE The multi-decadal behavior of the Atlantic Ocean is also associated with multi-decade dry conditions in the Southwest. A recently discovered phenomenon called the Atlantic Multidecadal Oscillation (AMO) in conjunction with Pacific Ocean climate patterns, such as ENSO and PDO, appears to produce atmospheric circulation patterns conducive to atmospheric circulation that weakens or strengthens connections between El Niño and Southwest precipitation. Severe drought conditions across consecutive seasons and years in the central and southern Rockies (including Arizona) may be the result of a confluence of PDO and AMO conditions favoring a more northern winter storm track across North America. According to tree-ring reconstructions of past climate, the drought of record in the Southwest, the so-called late-1500s megadrought, as well as the 1950s drought were probably associated with such conditions. However, confluence of PDO-AMO conditions is not associated with the early 20th-century drought, which was particularly severe in the Colorado River Basin. The early 20th-century drought, the most severe drought in the instrumental record of Arizona climate, was so severe that it nearly wiped out the Arizona ranching industry.
Arizona Weather & Climate 11
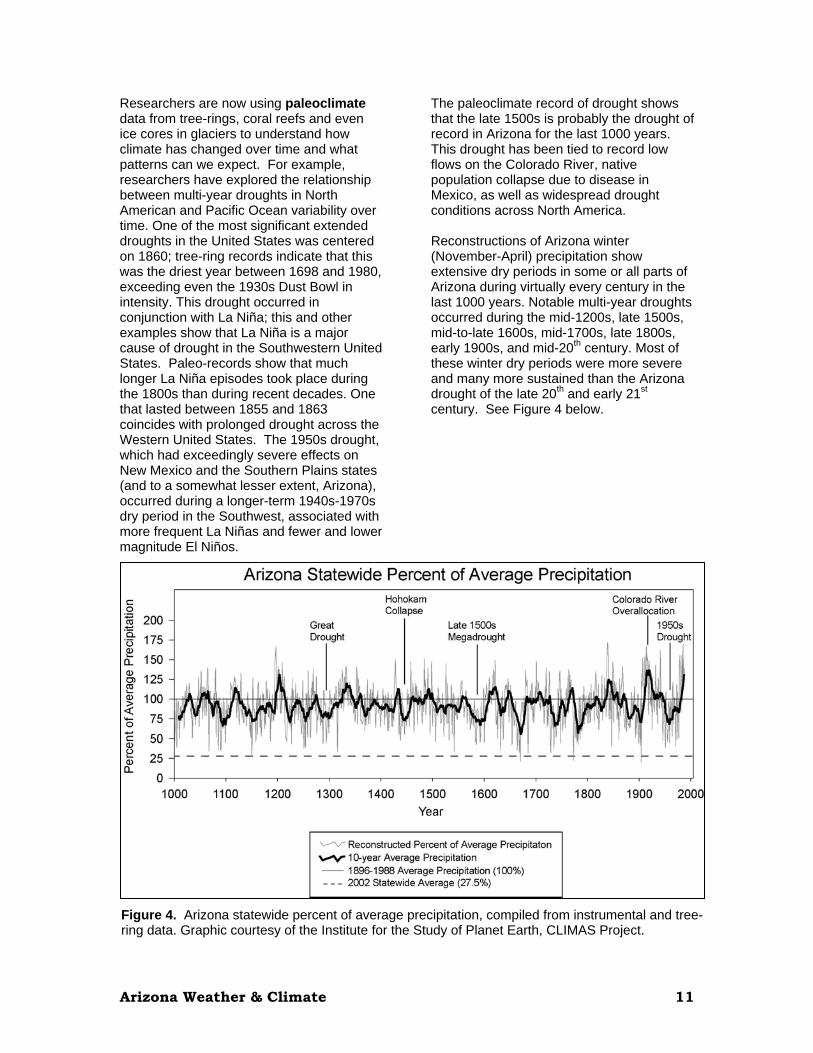
Figure 4. Arizona statewide percent of average precipitation, compiled from instrumental and tree-ring data. Graphic courtesy of the Institute for the Study of Planet Earth, CLIMAS Project.
Researchers are now using paleoclimate data from tree-rings, coral reefs and even ice cores in glaciers to understand how climate has changed over time and what patterns can we expect. For example, researchers have explored the relationship between multi-year droughts in North American and Pacific Ocean variability over time. One of the most significant extended droughts in the United States was centered on 1860; tree-ring records indicate that this was the driest year between 1698 and 1980, exceeding even the 1930s Dust Bowl in intensity. This drought occurred in conjunction with La Niña; this and other examples show that La Niña is a major cause of drought in the Southwestern United States. Paleo-records show that much longer La Niña episodes took place during the 1800s than during recent decades. One that lasted between 1855 and 1863 coincides with prolonged drought across the Western United States. The 1950s drought, which had exceedingly severe effects on New Mexico and the Southern Plains states (and to a somewhat lesser extent, Arizona), occurred during a longer-term 1940s-1970s dry period in the Southwest, associated with more frequent La Niñas and fewer and lower magnitude El Niños.
The paleoclimate record of drought shows that the late 1500s is probably the drought of record in Arizona for the last 1000 years. This drought has been tied to record low flows on the Colorado River, native population collapse due to disease in Mexico, as well as widespread drought conditions across North America. Reconstructions of Arizona winter (November-April) precipitation show extensive dry periods in some or all parts of Arizona during virtually every century in the last 1000 years. Notable multi-year droughts occurred during the mid-1200s, late 1500s, mid-to-late 1600s, mid-1700s, late 1800s, early 1900s, and mid-20th century. Most of these winter dry periods were more severe and many more sustained than the Arizona drought of the late 20th and early 21st century. See Figure 4 below.

Arizona Weather & Climate 12
SOME FINAL THOUGHTS Water is life in Arizona’s watersheds. The distribution of water throughout the state is governed in large part by broad patterns of climate and everyday local weather. Understanding the patterns of how it is distributed, when and why is much more difficult. The science—and art—of meteorology and climatology is not perfect and methods or results are constantly being debated. But there are a few conclusions we can draw by looking at weather and climate patterns over time and space:
Planning for wintertime precipitation over years and decades—especially in the mountainous regions of the state—is key to dealing with long-term water supplies in the state. Wintertime precipitation is governed by complex ocean and atmospheric interactions that are only partly understood. Drought is a fact of life for residents of Arizona’s watersheds, especially judging by the combined paleoclimate and instrumental records. We must learn to plan for and then adapt to drought for the long-term health of Arizona’s watersheds and economy. This process may not be easy but it is vitally important.
WORDS TO KNOW Atmosphere: the region of gasses surrounding the earth Bimodal: a curve or distribution having two high points. Circulation: a movement of air in the atmosphere. Climate: the summation of accumulated weather patterns of a region; the analysis of average conditions as well as the frequency of extreme events. Climatograph: a graphic presentation of average monthly temperature and precipitation.
Cloud: visible, atmospheric moisture in condensed water droplets. Convection: the vertical movement of air; the rolling mixing of the atmosphere due to uneven heating of the earth’s surface. Cumulonimbus: a name given to unstable, thunderstorm-type, clouds with precipitation. Cumulus: a cloud term used to describe puffy, unstable, clouds. Dew Point: the temperature at which condensation occurs. El Nino (ENSO): Anomalous warming in the eastern Pacific ocean; A reversal of oceanic surface temperature changes where the eastern pacific is relatively warm and the western pacific is relative cool. Expansion: the tendency for compressed air molecules to move apart in an attempt to reduce their energy level. Foresummer: a period of dry weather between the winter and summer rainy seasons. This period is also associated with warm or extremely hot weather. Front: the leading edge of a characteristically-distinct air mass as it moves over the earths surfaces. Gulf Surge: a meteorological event associated with the “Monsoon” season where low-level moisture is introduced into Arizona through interactions with tropical depressions crossing central Mexico. Humidity: a term used in reference to the amount of water vapor in the atmosphere. Infiltration: water penetrating the surface of the soil and entering lower soil profiles. Jet Stream: a current of fast moving air found in the upper levels of the atmosphere that often steers storms. La Nina: Unusually low sea surface temperatures in the eastern Pacific and strong easterly winds; A reversal of oceanic surface temperature where the eastern
Arizona Weather & Climate 13
Pacific currents are relatively cool and the western Pacific currents are relatively warm. Meteorologist: an occupation studying the physical and dynamic qualities of the atmosphere; especially weather, prediction and forecasting. Monsoon: a distinct, seasonal, shift in circulation patterns which results in a significant increase in rainfall. NOAA: National Oceanographic & Atmospheric Administration NWS: National Weather Service; part of NOAA Orographic: an association with mountainous terrain; the presence/effects of mountains on atmospheric circulation and precipitation. Paleoclimate: pre-historic or pre-instrumental climate, usually recorded in the growth of tree-rings or coral, geologic formations and ice cores from glaciers. Polar: air masses and systems associated with the polar regions of world. Precipitation: any form of meteorological falling moisture such as rain, snow, sleet, ice. Radiation: solar energy striking the earth’s surface. Rain Shadow Effect: the effect of mountains forcing air to rise, cool and precipitate water vapor, leaving the leeward side drier than the windward side. Relative Humidity: the amount of water vapor present in the atmosphere in comparison to the maximum amount of water vapor which could be held at a specific temperature. Ridge: an extended area of high pressure. Snowpack: deposits of snow that form over the course of a season. Solar Energy: inclusive energy derived, by earth, from the sun.
Subtropical: the regions just north or south of the equator which demonstrate both cooler than tropical and warmer than temperate climates; adjacent to the tropics. Thermal: a vertical, rising column of air caused by localized heating of the earths surface; hawks and gliders utilize the upward moving air as a source of lift. Thermal Capacity: the ability for something to store heat. Tropical Depression: an area of low pressure air associated with rain and originating in tropical regions of the world. Weather: meteorological events and conditions at a given time. REFERENCES Adams, D.K. and A.C. Comrie 1997. The North American Monsoon. Bulletin of the American Meteorological Society, Vol 78: 10. Allan RJ, Lindesay J, Parker D. 1996. El Niño –Southern Oscillation and Climatic Variability. CSIRO Publishing: Collingwood, Victoria. Brown, D.P. and A.C. Comrie, 2002. Sub-regional precipitation linkages to SOI and PDO in the Southwest United States. Atmospheric Science Letters. Cole, J.E., J.T. Overpeck, and E.R. Cook, 2002. Multiyear La Niña events and persistent drought in the contiguous United States. Geophysical Research Letters,29(13):25-1–25-4. Gray, S.T., Betancourt, J.L., Fastie, C.L. and Jackson, S.T. 2003. Patterns and sources of multidecadal oscillations in drought-sensitive tree-ring records from the central and southern Rocky Mountains. Hereford, R., R.H. Webb, and S. Graham, 2002. Precipitation history of the Colorado Plateau Region, 1900-2000. USGS Fact Sheet 119-02 http://geopubs.wr.usgs.gov/fact-sheet/fs119-02/

Arizona Weather & Climate 14
Mantua, N.J. The Pacific Decadal Oscillation and Climate Forecasting for North America. Pacific Northwest Climate Impacts Group. http://tao.atmos.washington.edu/PNWimpacts/Publications/Sector.htm Meko, D., Stockton, C.W., and Boggess, W.R., 1995. The tree-ring record of severe sustained drought. Water Resources Bulletin 31(5), 789-801. Sheppard, P.R. Comrie, A.C., Packin, G.D., Angersbach, K., Hughes, M.K., 2002. The climate of the U.S. Southwest. Climate Research 21: 219-238. Trenberth, K.E., and Robert Henson. 2001. Children of the tropics: El Niño and La Niña. http://www.ucar.edu/communications/factsheets/elnino/ Zebiak, S. 1999. El Niño and the science of climate prediction. Consequences 5(2):3–15. http://www.gcrio.org/CONSEQUENCES/vol5no2/article_1.html Geophysical Research Letters 30: 10.1029/2002GL016154.
Related Documents