by Frankie O’Connell Benefits and obstacles to be expected from a liberalisation process of the aviation market

By Frankie O’Connell Benefits and obstacles to be expected from a liberalisation process of the aviation market.
Dec 26, 2015
Welcome message from author
This document is posted to help you gain knowledge. Please leave a comment to let me know what you think about it! Share it to your friends and learn new things together.
Transcript

by Frankie O’Connell
Benefits and obstacles to be expected from a liberalisation process of the aviation market

What is Deregulation?

Airlines disappointed in system prior to deregulation
Limited freedom of product differentiation1st classBusiness classEconomy class
On-timeFrequencyBaggageComfortIFE/emailLoungesFoodSchedules
Airlines wanted the freedom to set their own fares Had to be cost competitive
Difficult to increase the number of aircraft, frequencies and routes
Number of airlines on a route was strictly controlled
Airlines had to cross subsidize profitable routes with unprofitable ones
Ability to function without government interference

• The number of airlines rose from 36 in 1978 to over 120 by 1985 (230% increase in just 7 years)
• The top five airlines had accounted for 69% of the US domestic traffic in 1978 But by 2005 it had fallen considerably to 57% (Competition was Intense)
The Effects of US Deregulation on Airlines
• Then there was a period of consolidation as the major airlines fought back to regain market. By 1993, the top five carriers accounted for 70% of the industry output
• The intense competition continued and many airlines failed. From 1979–1999, 176 received operating certificate and only 37 (21%) of those airlines are still operating today
• Created hub and spoke networks. The entry and exit of a competitor is heavily influenced by the network of the home airline• After 2001, The US airline industry went into meltdown. The cumulative losses from 2001 – 2004 were $32.3 billion

The Effects of US Deregulation on Passengers
• Fares in the US domestic market fell by 40% from 1980 – 2005
• 60% of this fall was due to because of deregulation (Morrison & Winston, 1995)
• The US Department of Transportation estimates that passengers save $19.4 billion per year, in lower fares because of deregulation.
Morrison, S. and Winston, C. (1995). The Evolution of the Airline Industry, Washington D.C. The Brookings Institution.
• Lower fares • Higher number of frequencies• Increased number of destinations• Seamless travel - there was more collaboration with other airlines via alliances• There were increased delays as more flights went through congested hubs
The major effects on Passenger welfare

Why Europe wanted deregulation
• Access to the market was severely restricted (Single designation)
• The capacity offered by each airline was restricted generally 50:50
*This freedom is also sometimes referred to as 'beyond rights‘. It is the right of an airline from one country to land in a second country, to then pick up passengers and fly on to a third country where the passengers then deplane.
• As late as 1997, out of 988 routes within the EU only 48 had multiple designation
• Of the 988 routes, only 88 allowed 5th Freedom traffic rights*
• The regulatory bodies of bilateral partners approved fares and there was NO competition on price
• The airlines designated by a country had to be substantially owned and controlled by it or by its nationals
• Many of Europe’s airlines received state aid: e.g. Air France $3.8 billion in 1994(equivalent to 60 percent of the value of all of BA stock or the entire annual revenue of Singapore Airlines

European Airline Deregulation (3 phases)
The three packages agreed by the European council of ministers
1st Package (1987-1989) - It abandoned the equal sharing of capacity on routes served by airlines of the two states. - It facilitated the entry new airlines by opening up new market access - Allowed agreements between community airlines relating to capacity, tariffs co-ordination, revenue pooling, runway slot allocation, CRS and pax handling
Source: Council Directive of 14 December 1987 on fares for scheduled air services between Member States (87/601/EEC) and Council Decision of 14 December 1987 on the sharing of passenger capacity on scheduled air services between member states (87/602/EEC) Brussels: Commission of the European Communities
2nd package (1990-1992) - Further loosened constraints on pricing, capacity restrictions and market access - The end of immigration and customs controls between the 12 states

3rd Package 1993 - Onwards (Full European Deregulation)
Deutsche BA KLM UK
Source: CEC (1992) Council Regulation No. 2407/92 on licensing of air carriers; Council Regulation No. 2408/92 on access Community air carriers to intra community air routes, and Concil Regulation No 2409/92 on fares and rates for air servives. Official Journal 24 August, Brussels: Commission of the European Communities
Ryanair Hubs - Dublin - Stockholm - Shannon - Frankfurt - London Stansted - Milan - London Luton - Rome - Brussels - Brussles - Barcelona
Ryanair
- Creation of an effective ‘ Open Skies’ policy within Europe such that the European Community would become a single ‘domestic market’
- Airlines from member states can operate with full traffic rights on any route within the EU without capacity restrictions
- Governments may impose restrictions only on issues such as the environment
- There are no price controls: Airlines can set their own fares and cargo tariffs (EU regulations 2409/92)….This is why Ryanair can offer free flights
- The airline must be majority owned and controlled by any of the member states or their nationals.

European Low Cost Routes 2006European Low Cost Routes 2000
The growth of Europe’s low cost carriers 2000 - 2006

Scheduled annual passenger traffic between London and Venice 1986 - 2006 (Trendline extrapolated from 1997 to 2006)
Source: UK CAA, 2007
1986
1987
1988
1989
1990
1991
1992
1993
1994
1995
1996
1997
1998
1999
2000
2001
2002
2003
2004
2005
2006
0
100,000
200,000
300,000
400,000
500,000
600,000
700,000
800,000
900,000
1,000,000
Extrapolated

Deregulation has created many opportunities

Change in traffic between the UK and Europe 1996 - 2005

Within Asia Pacific Within Europe Within US0%
5%
10%
15%
20%
25%
30%
2001
2002
2003
2004
2005
2006
The growth of low cost carriers in Asia, Europe and the US (Seat Capacity)

This environment created many opportunities
The LCCs had a very positive impact on the local economic community
Tourism(Bypassing major cities)
Hotels Restaurants Car rental facilities Triggered the formation of new tourism related industries
Local Businesses(e.g. Frankfurt Hahn)
The area surrounding Hahn reported an increase in the number of businesses from 30 in 1996 to 103 by 2003
At Cologne(Bonn)
The average spending of each incoming passenger was €285 per passenger per trip
The region earned €147 million from having the extra air traffic in 2003
Source: http://www.elfaa.com/documents/ELFAABenefitsofLFAs2004.pdf

Intense competition as a result of deregulation
According to the European Commission, the number of scheduled airlines in Europe increased dramatically from 1992 to 2006
Many new entrants types:-
Low cost carriers Low cost carrier subsidiaries of Full service airline (e.g. Germanwings, BMI baby)Traditional airlines rebranded as low cost carriers (e.g. Aer Lingus )All business class airlines such as Eos, Silverjet and MaxJet Regional airlines such as Lagun Air in Spain Regional airlines which have been converted to low cost carriers, such as FlyBe Independent charter airlines such as Air Finland

Yield decline of EU and US markets (1993 - 2007)
Source: IATA
93 94 95 96 97 98 99 0 1 2 3 4 5 6
7E
60
65
70
75
80
85
90
95
100
0 0 0 0 0 0 0
Ind
ex
0
EU Short-haul
US domestic

Load Factors of domestic and international airlines
Source: IATA
1995
1996
1997
1998
1999
2000
2001
2002
2003
2004
2005
2006
62%
64%
66%
68%
70%
72%
74%
76%
78%
International
Domestic

Multilateral Air Service Agreements and Arrangements
Name of agreement Started Current participants
European Union 3rd Package 1993 29 states of EU plus Iceland, Liechtenstein Norway and Sweden
Caribbean Community ASA 1996 Granada, Jamaica, Trinidad, Barbados, etc
Fortaleza Agreement 1997 4 principle members: Argentina Brazil, Paraguay Uruguay
5 Associates: Bolivia, Chile, Columbia, Ecuador, Peru
CLMV Agreement 1997 Cambodia. Laos, Myanmar and Vietnam
COMESA Air Transport 1999 20 states of the Common Market for Eastern andLiberalisation Program Southern Africa
Yamoussoukro II 1999 52 African states (was aimed at inaugurating an Open
Skies policy which would remove bilateral constraints & boost intra-regional traffic)
Asia’s (MALIAT) agreement 2001 Setting the framework to develop open skies in Asia
European-Mediterranean ASA 2005 EU and Morocco
EU and Western Balkans 2006 EU and 6 states (i.e. Crotia, Serbia, etc)

• EU Open skies policy signed in December 2006• 10 Million passengers planned to fly to Morocco by 2010• Ryanair has sealed a deal with the Moroccan government to open 20 routes and carry one million passengers a year in five years time.
Moroccan Airport Traffic 1995 - 2006
Source: ONDA 1995
1996
1997
1998
1999
2000
2001
2002
2003
2004
2005
2006
0
2
4
6
8
10Domestic
International
Pas
sen
gers
(M
illi
ons)
56% growth in
3 years

Egyptian Airport traffic 1997 - 2006
Source: EHCAAN
1997 1998 1999 2000 2001 2002 2003 2004 2005 20060
5
10
15
20
25
30
Cairo Airport
Mil
lion
s of
pas
sen
gers
All Airports
• Traffic at Egyptian airports will have doubled from 13.5 million passengers in 1997 to an estimated 27 million by 2007

The Middle East air transport system remains heavily regulated, withsubstantial limitations on the allocation of traffic rights
Negotiation of traffic rights is conducted within a bilateral system
Constraints in the allocation of traffic rights have posed a substantial barrier to the entry and growth of new carriers operating intra-regional routes
Air Arabia – being compelled to operate a less than daily service on themajority of its routes.
Deregulation of the Middle East market
However, Jordan, Bahrain, Morocco, Oman, Qatar, Kuwait and UAE haveAn Open Skies policy with the US. Also open sky policies in UAE & Lebanon
Open skies could be critical to Jordan as Tourism has the potential to produce up to 10% of Jordan’s GDP… (Currently only around 4%)

Liberalisation in the Saudi domestic market
• Saudi Arabia’s civil aviation administration stated that 13 companies were pursuing licences to operate as national air carriers
• Only 2 licences were granted: Nas Air (Riyadh) and Sama (Dammam). Both started operations in 2007
Route Traffic (2006) Sama FrequencyRiyadh – Jeddah 2,418,000 3Jeddah – Damman 793,000 2Riyadh – Abha 779,000 2Riyadh – Dammam 683,000 2Riyadh – Gizan 350,000 1Riyadh – Madinah 341,000 1Damman – Abha 139,000 2Damman – Gizan 32,000 1

the Intra-Arab Freedoms of the Air Programme amongst 16 member States of the Arab Civil Aviation Commission (ACAC) (the Agreement on the Liberalizationof Air Transport between the Arab States was signed in 2004)
Its very similar to the EU’s 3rd package
Deregulation of the Middle East market
Establishing a ‘vast Arab free trade zone’ - fosters regional and international economic development
Frees the intra-regional movement of goods, individuals and capital
Forms the justification for a regional deregulation of air services.Signatory state Ratified?Bahrain NoEgypt NoIraq NoJordan YesLebanon YesOman NoPalestine Yes
Signatory state Ratified?Somalia NoSudan NoSyria YesTunisia NoMorocco NoUAE YesYemen YesSaudi YesSource: AACO

Provisions of the Arab Civil Aviation Commission agreement(similarity to EU 3rd package)
Concerning: ACAC Agreement EU Council Regulation
Licensing & Ownership
•Multiple air transport operating licenses can be granted in each state. • Substantial ownership must be retained by party countries or by its citizens
• Multiple licenses granted to member states only if carrier is located in EU • Must be majority controlled, owned by member EU states/nationals
Granting oftraffic rights
• Right to operate to any state • Right to operate from a 3rd state to 4th • No Cabotage
• Right to operate to any state • Operate from a 3rd state to 4th • Cabotage allowed
Capacitycontrols
• Capacity unrestricted • Frequencies unrestricted • Operate any aircraft type
• Capacity unrestricted • Frequencies unrestricted • Operate any aircraft type
Tariffs• No restriction on fare• Does not need the approval of the Civil Aviation Authority
• No restriction on fare• Does not need the approval of the Civil Aviation Authority

Europe Asia Pacific0
20,000
40,000
60,000
80,000
100,000
120,000
B747-800
B777
B787
A330/340
A350
A380
Cap
acit
y (S
eats
)
- Air France, - Lufthansa - Virgin
- Singapore- Cathay Pacific- Qantas
Source: O’Connell Analysis from ACAS data
.
Danger, Danger, Danger Widebody capacity on order (August 2007)
Middle East- Emirates- Etihad- Qatar Airways

Airports in the Gulf and Development Plans
Cost Passenger Passenger throughput capacity (US$ Billions) (Millions) (Millions)
Dubai (Expansion) $ 4.1 billion 24.7 70 Dubai1 (New) $ 8.2 billion --- 120
Doha (Expansion) $ 0.15 billion 7.4 12 Doha (New) $ 5.5 billion --- 50
Abu Dhabi (Expansion) $ 6.8 billion 5.4 20
Jeddah (Expansion) $ 1.5 billion 13.3 25
Source: Airports Council International, AACO, ATI

Government support for Emirates, Qatar Airways, Etihad, etc
Massive aircraft orders and airport development
Aircraft loans backed by oil reserves
Qantas accused Emirates of basking in the support of the Government of Dubai
The region must level the playing field. Is it too late?
Yemenia’s chief stated at the AACO AGM in 2005 in Sana’a‘There are some governments in this region who want to be all over the world map’‘There are heavily-subsidised airlines against which we cannot compete’‘This assistance threatens carriers which are trying to operate commercially.
Action needed: If airlines become affiliated to the AACA treaty; then the major carriers should NOT be allowed to setup bases outside of their sovereign state
Consolidation of the market.. Could two airlines from different states merge?
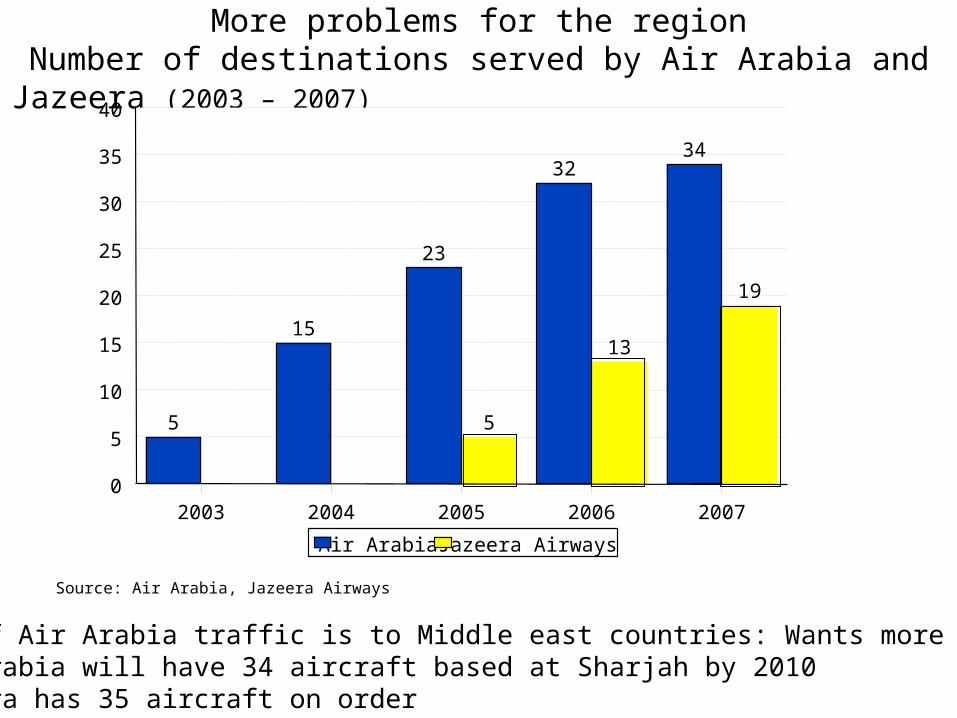
More problems for the regionNumber of destinations served by Air Arabia and Jazeera (2003 – 2007)
• 58% of Air Arabia traffic is to Middle east countries: Wants more access• Air Arabia will have 34 aircraft based at Sharjah by 2010 • Jazeera has 35 aircraft on order
Source: Air Arabia, Jazeera Airways
5
15
23
3234
5
13
19
2003 2004 2005 2006 20070
5
10
15
20
25
30
35
40
Air Arabia Jazeera Airways

Air Arabia’s break-even load factor and actual load factor2005 - 2007
Source: Air Arabia
77%73% 70%
79% 80%84%
2005 2006 20070%
20%
40%
60%
80%
100%
Break-even load factor Actual load factor
Impressive

Conclusion
Deregulation has tremendous benefits for passengers
• Reduce Fares• Exponentially grow traffic
Deregulation will positively impact the economy
• Significantly Increase tourism revenue• Increase number of industries• Increase the employment level
Deregulation will immediately and dramatically increase the competitionbetween airlines
• Existing bilaterals will be eliminated• Multiple airlines allowed on any route• Charge whatever fare they want• Multiple frequencies
• Deregulation is coming quicker than you think…. Will you be ready?
• Wise not to deregulate until the resources (i.e. Fleet, Management, Staff, IT, Marketing, etc) is adequate enough to take on the competition. (Need Govt help)
• Wise to join an alliance as soon as possible or you will be left without any partner• Big Question that you must now decide. Do you form a MEDA multi-agreement pact or join the upcoming ACAC pact or stay independent?

Thank you very much, it was a pleasure
Related Documents