Does GNP Mean Gross National Problem? Trends and Growth Patterns of Philippine Economy By: Fej Billones Grace Salas Bianca Reyes

By: Fej Billones Grace Salas Bianca Reyes. I. Economic Principles I. GDP II. GNP II. Problem Statement III. Relative Importance of the Problem in Various.
Dec 19, 2015
Welcome message from author
This document is posted to help you gain knowledge. Please leave a comment to let me know what you think about it! Share it to your friends and learn new things together.
Transcript

Does GNP Mean Gross National Problem?
Trends and Growth Patterns of Philippine Economy
By: Fej BillonesGrace SalasBianca Reyes
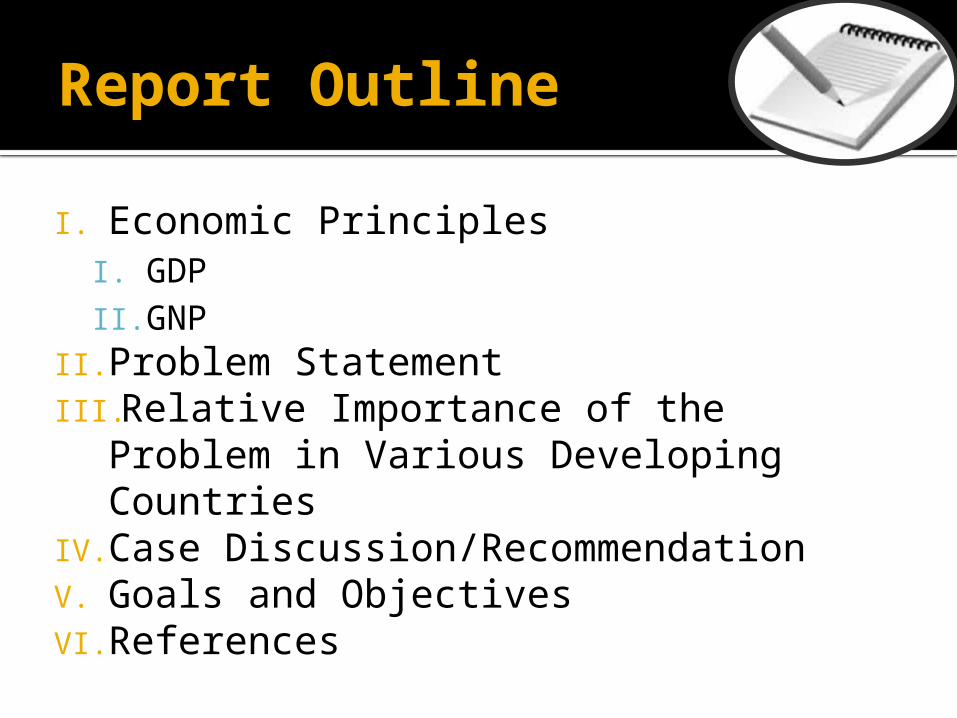
Report Outline
I. Economic PrinciplesI. GDP II. GNP
II. Problem StatementIII. Relative Importance of the Problem
in Various Developing Countries IV. Case Discussion/RecommendationV. Goals and ObjectivesVI. References
I. Economic Principle
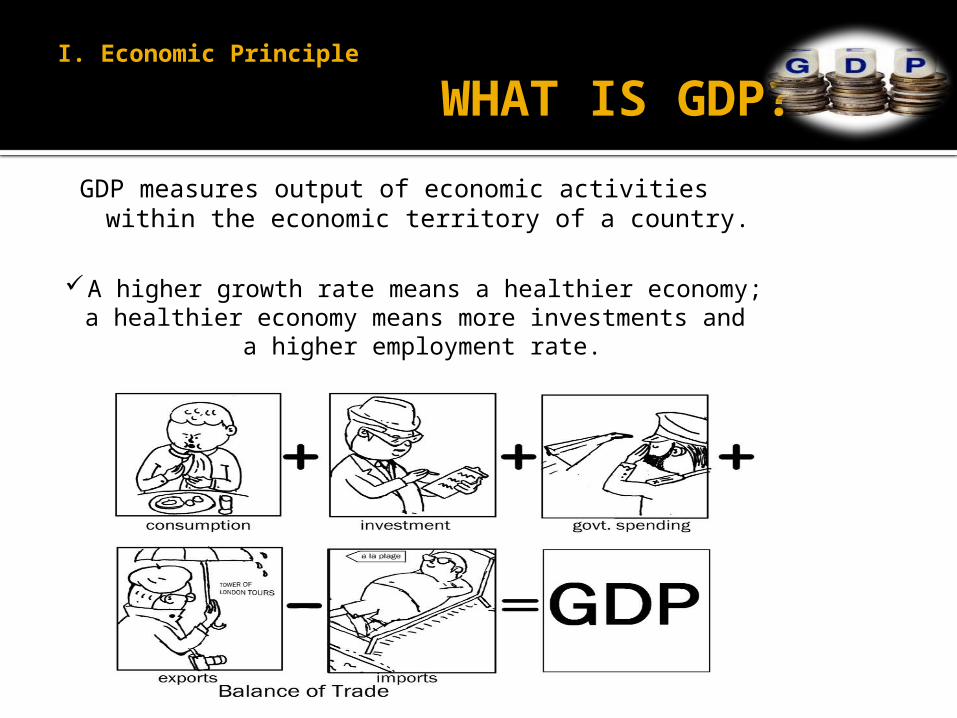
WHAT IS GDP?GDP measures output of economic activities
within the economic territory of a country.
A higher growth rate means a healthier economy; a healthier economy means more investments and
a higher employment rate.

I. Economic Principle
APPROACHES TO CALCULATING GDP
1. Production approach calculates the GDP based on industrial origin wherein the domestic economy is divided
into 3 productive sectors: a) agriculture, fishery, and forestry; b) industry; and c) services. This approach sums up the value added contribution of each sector to obtain the total
contribution to the economy. 2. Expenditure approach
sums up personal consumption expenditures of households, government consumption, investment or capital formation, and exports less imports. This approach yields GDP by type of expenditure.
Common sources of these data are household expenditures surveys, retail and wholesale trade surveys, producer surveys, customs records, government accounts, and special surveys done by the statistical centers.
Both the production and expenditure approaches must yield the same results of GDP (Table 1). This is because:
Output from prod’n of goods + services = total expenditures on goods and services Output (production approach) is either consumed and/or saved (expenditure approach)

Nominal GDP: GDP at current prices
Real GDP or GDP at constant prices inflation adjustment of
GDP: adjust the Nominal GDP figure for the increase in prices that occurred from one period to the next
I. Economic Principle
NOMINAL AND REAL GDP

Non-productive activities Goods and services that cannot be measured using market prices.
Examples of these are services of housewives, production of illegal gambling such as jueteng, drugs and prostitution.
Informal sector Refers to the sidewalk vendors and home-based businesses that
may opt to understate their income Also refers to illegal activities gambling and drugsEnvironmental cost Environment as casualties of development: soil erosion, dying
forest because of logging, water pollution because of mining, among others
Social cost The OFWs earn dollars to meet the needs of their families but
their absence has resulted in broken homes and dysfunctional family. GDP is neither a measure of material well-being nor an indicator of welfare.
I. Economic Principle
LIMITATIONS OF GDP
Composition of Phil GDP
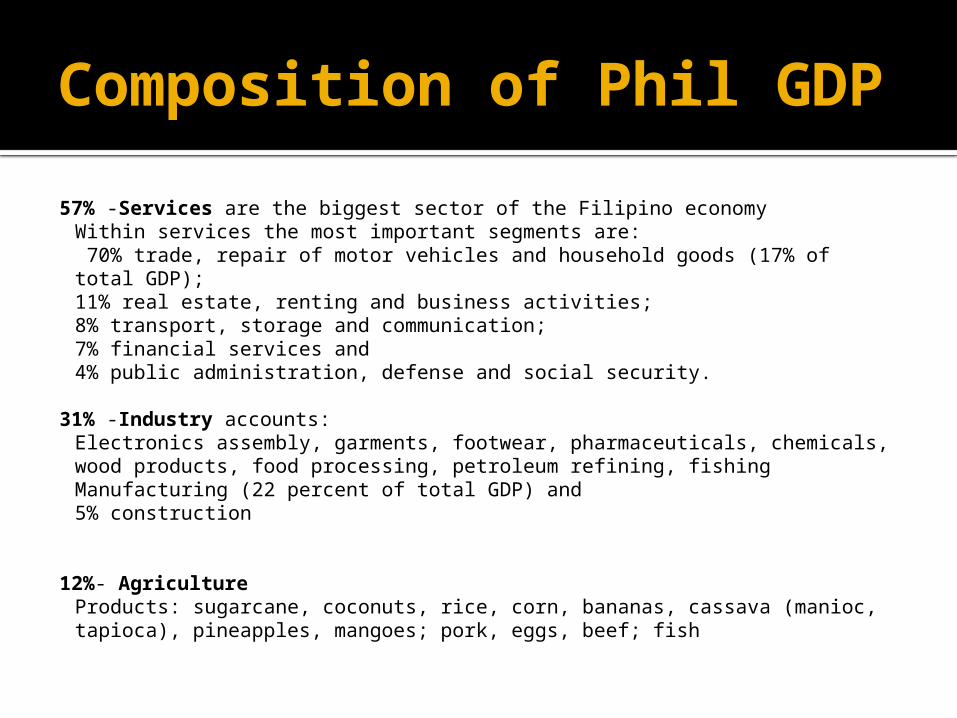
57% -Services are the biggest sector of the Filipino economy Within services the most important segments are: 70% trade, repair of motor vehicles and household goods (17% of total GDP); 11% real estate, renting and business activities; 8% transport, storage and communication; 7% financial services and 4% public administration, defense and social security.
31% -Industry accounts:Electronics assembly, garments, footwear, pharmaceuticals, chemicals, wood products, food processing, petroleum refining, fishingManufacturing (22 percent of total GDP) and 5% construction
12%- AgricultureProducts: sugarcane, coconuts, rice, corn, bananas, cassava (manioc, tapioca), pineapples, mangoes; pork, eggs, beef; fish

I. Economic Principle
HISTORY OF PHILIPPINES’ GDP
Debt-steered growth in the 1970s
Economic growth was decent in the 1970s, averaging at 5.7 percent. But growth in that decade was driven by aggressive foreign borrowings, which were encouraged by multilateral institutions to build up dollars in light of successive oil shocks. The foreign borrowings resulted not only in public spending growth in infrastructure but also in deficits.

I. Economic Principle
HISTORY OF PHILIPPINES’ GDP
Sedentary growth in the 1980s
The 1980s was both the “dark ages”and “renaissance” in the Philippine economy. Political unrest, economy slid from 5.1 percent in 1980 to 3 percent level to 1.9 percent before it plummeted negative 7.3 percent.
Demise of Ferdinand Marcos thru 1986 EDSA Revolution, rise of Corazon Aquino to power, the economy bounced to 3.4 percent before it reached the respectable 6 percent level.
Last 4 years of 1980 were spent battling foreign debt and restoring investors’ confidence; and framing/ ratifying the new Constitution, fighting military unrest.
I. Economic Principle
HISTORY OF PHILIPPINES’ GDP
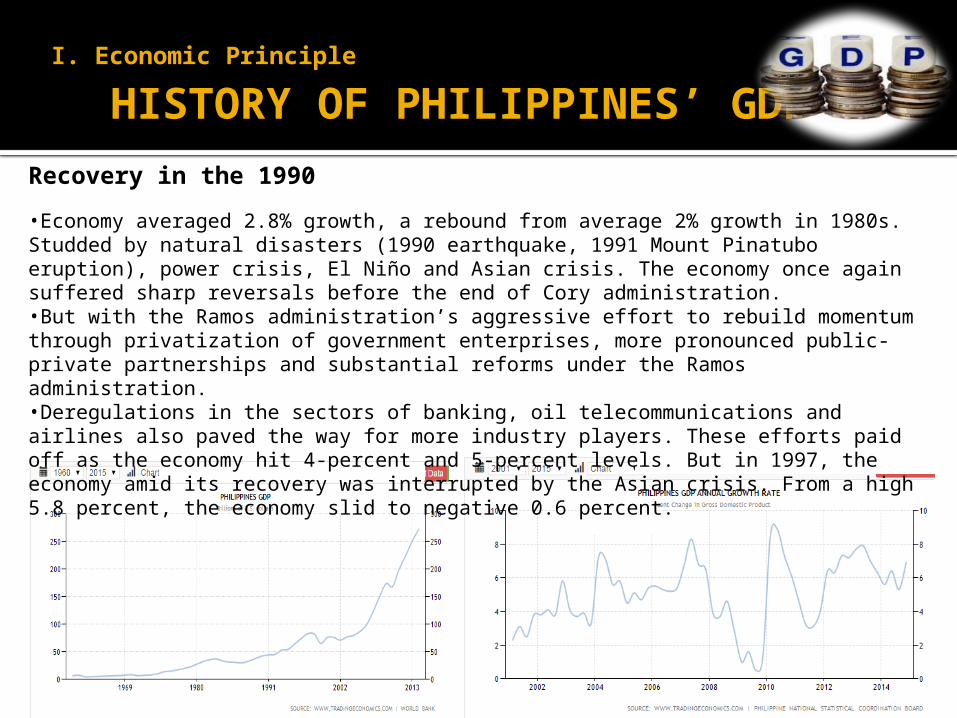
Recovery in the 1990
•Economy averaged 2.8% growth, a rebound from average 2% growth in 1980s. Studded by natural disasters (1990 earthquake, 1991 Mount Pinatubo eruption), power crisis, El Niño and Asian crisis. The economy once again suffered sharp reversals before the end of Cory administration. •But with the Ramos administration’s aggressive effort to rebuild momentum through privatization of government enterprises, more pronounced public-private partnerships and substantial reforms under the Ramos administration. •Deregulations in the sectors of banking, oil telecommunications and airlines also paved the way for more industry players. These efforts paid off as the economy hit 4-percent and 5-percent levels. But in 1997, the economy amid its recovery was interrupted by the Asian crisis. From a high 5.8 percent, the economy slid to negative 0.6 percent.
I. Economic Principle
HISTORY OF PHILIPPINES’ GDP
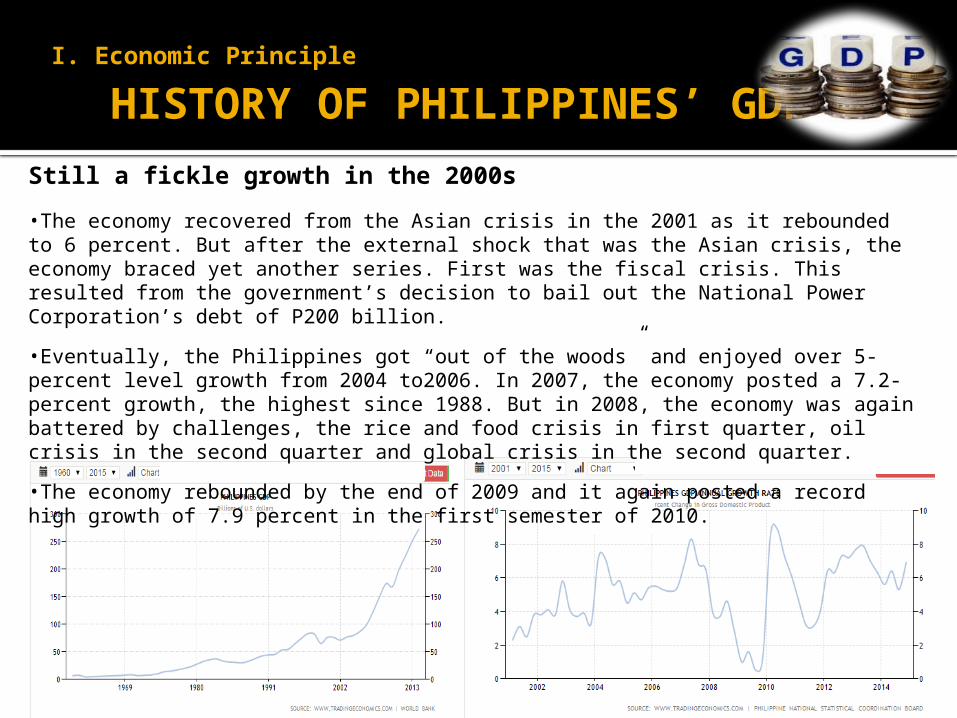
Still a fickle growth in the 2000s
•The economy recovered from the Asian crisis in the 2001 as it rebounded to 6 percent. But after the external shock that was the Asian crisis, the economy braced yet another series. First was the fiscal crisis. This resulted from the government’s decision to bail out the National Power Corporation’s debt of P200 billion.
•Eventually, the Philippines got “out of the woods” and enjoyed over 5-percent level growth from 2004 to2006. In 2007, the economy posted a 7.2-percent growth, the highest since 1988. But in 2008, the economy was again battered by challenges, the rice and food crisis in first quarter, oil crisis in the second quarter and global crisis in the second quarter.
•The economy rebounded by the end of 2009 and it again posted a record high growth of 7.9 percent in the first semester of 2010.
I. Economic Principle
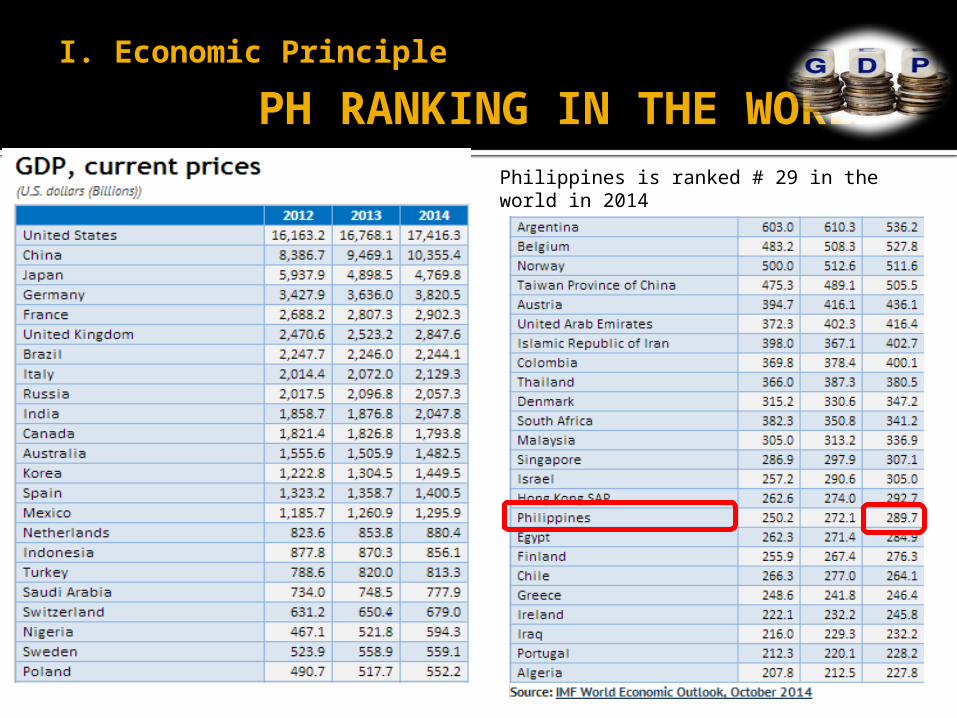
PH RANKING IN THE WORLDPhilippines is ranked # 29 in the world in 2014
I. Economic Principle
PH RANKING IN THE WORLD
Philippines is ranked # 29 in the world in 2014
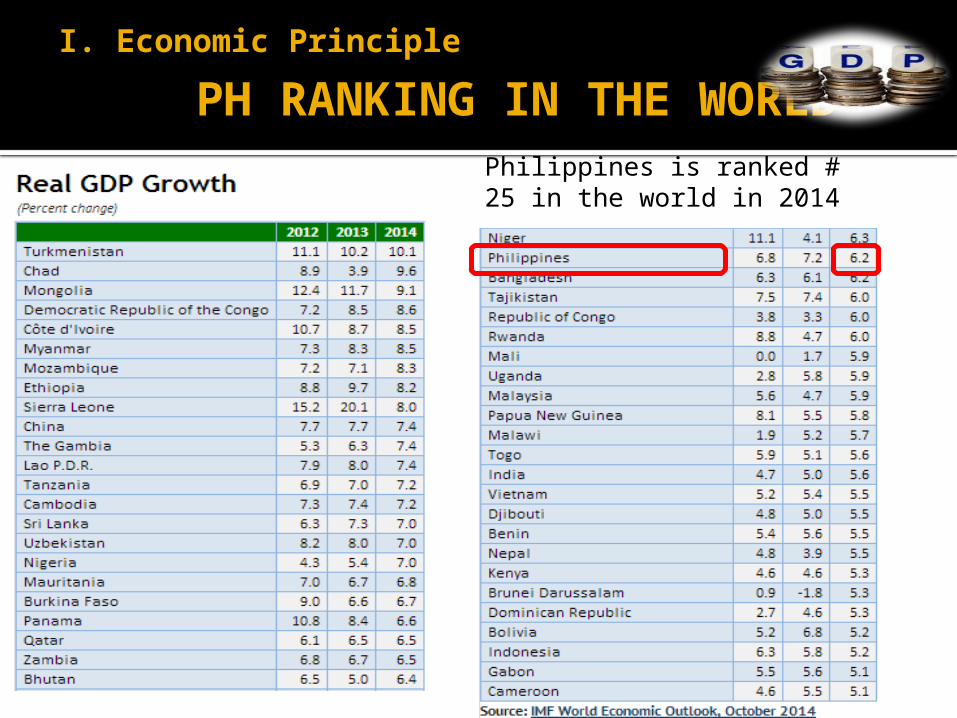
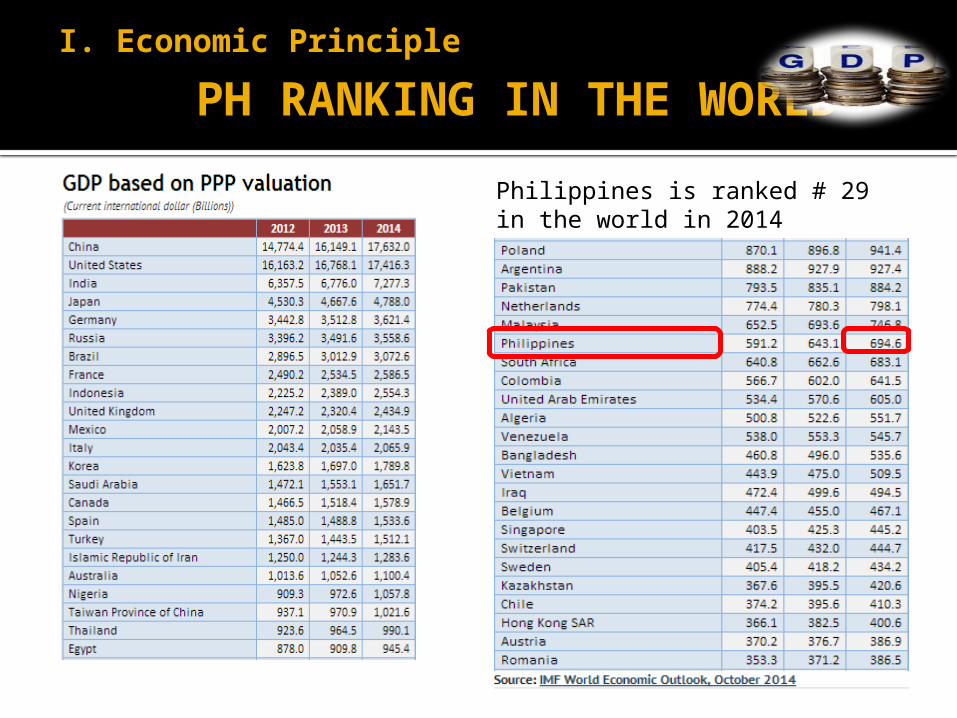
Philippines is ranked # 25 in the world in 2014
I. Economic Principle
PH RANKING IN THE WORLD

I. Economic Principle
WHAT IS GNP?
GNP (Gross National Product) is the
total market value of all final goods
and services produced within a given
period by factors of production owned
by a country’s citizens, regardless of
where the output is produced.
GNI (Gross National Income) is GNP
converted into dollars using an
average of currency exchange rates
over several years adjusted for rates
of inflation. (It uses Worldbank Atlas
method for the conversion)
I. Economic Principle
CALCULATING GNP
GNP = GDP + Net factor income from abroad
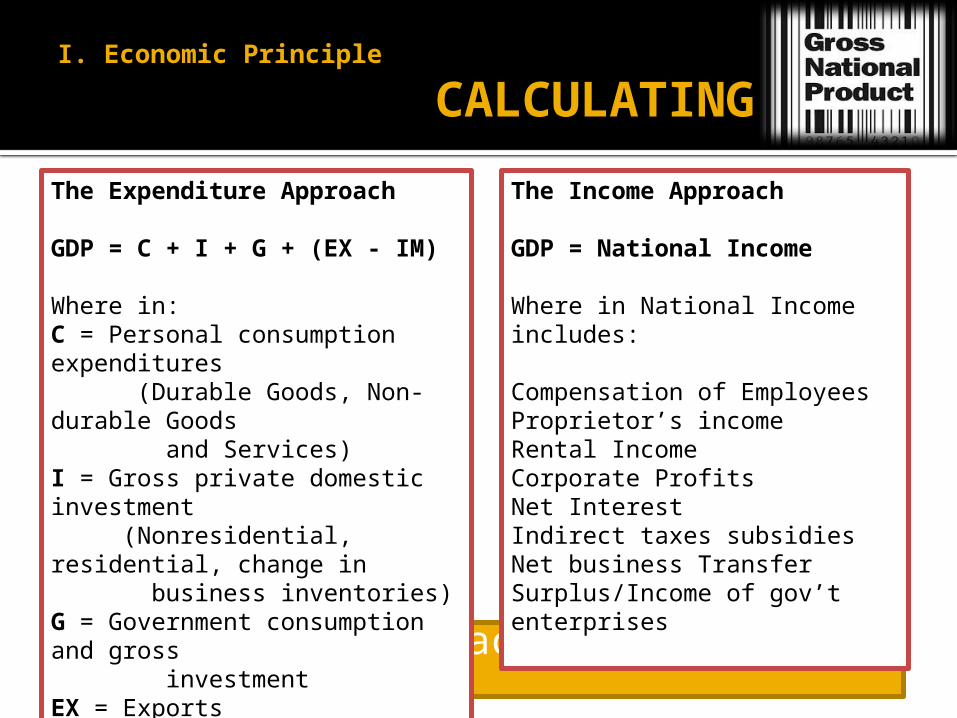
The Expenditure Approach
GDP = C + I + G + (EX - IM)
Where in: C = Personal consumption expenditures (Durable Goods, Non-durable Goods and Services)I = Gross private domestic investment (Nonresidential, residential, change in business inventories)G = Government consumption and gross investmentEX = ExportsIM = Imports
The Income Approach
GDP = National Income
Where in National Income includes:
Compensation of EmployeesProprietor’s incomeRental IncomeCorporate Profits Net Interest Indirect taxes subsidiesNet business Transfer Surplus/Income of gov’t enterprises

I. Economic Principle
CALCULATING GNP

GNP is being reported by: Philippine National Statistical Coordination Board.
I. Economic Principle
PH GNP GROWTH

I. Economic Principle
Difference of GDP and GNP
Gawa
Dito sa
Pilipinas
Gawa
Ng
Pilipino

II. PROBLEM STATEMENT
II. Problem statement
THE PROBLEM
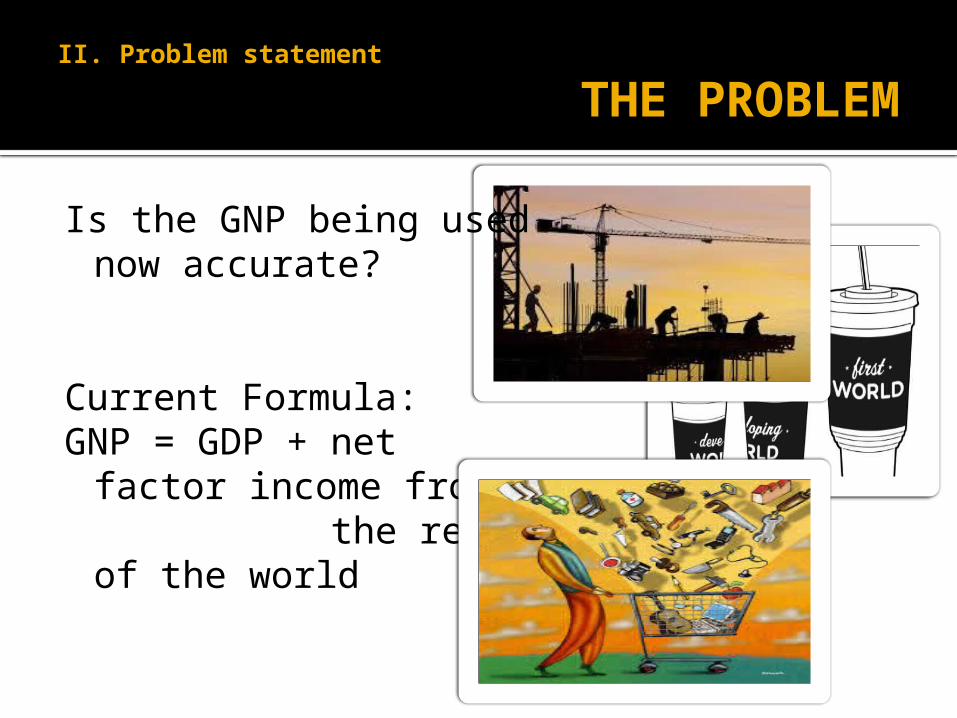
Is the GNP being used now accurate?
Current Formula: GNP = GDP + net factor
income from the rest of the
world

The current GNP computation may not be measuring the real economic value of a country.
II. Problem statement
WHY IS IT A PROBLEM?
II. Problem statement
SUB ISSUES
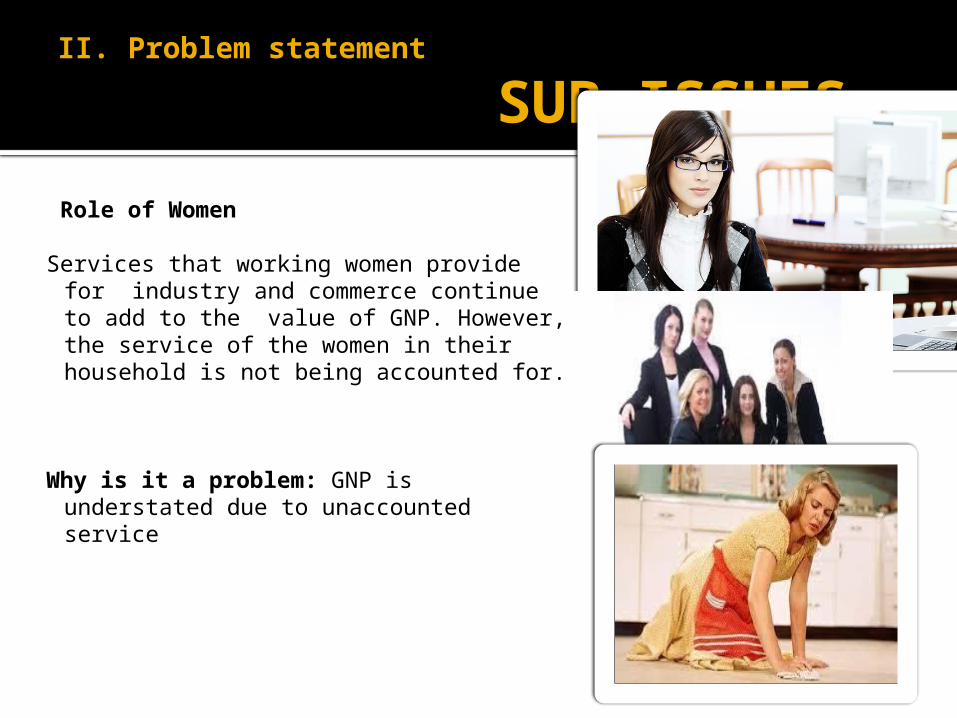
Role of Women Services that working women provide for
industry and commerce continue to add to the value of GNP. However, the service of the women in their household is not being accounted for.
Why is it a problem: GNP is understated due to unaccounted service

Public sector vs. Private Sector
Some of the public goods/service tend to be overvalued compared to private goods/service.
E.g. expenses of DSWD.
Why is it a problem: GNP is overstated
II. Problem statement
SUB ISSUES

Military Expenditure
Increasing military expenditure (monetary transactions) add to the GNP however its not productive to the economy
Why is it a problem: GNP is overstated
II. Problem statement
SUB ISSUES

Exploitation of irreplaceable resources
The usage of natural resources add up to the GNP. However, depletion of natural resources is not being accounted for.
Why is it a problem: GNP is
overstated
II. Problem statement
SUB ISSUES

Environmental Considerations
The operations by privateindustries/factories add up to
the GNP of the country. However, the negative impact on theenvironment is not accountedfor.
Why is it a problem: GNP is overstated
II. Problem statement
SUB ISSUES

III. CASE DISCUSSION
1. What do you think should be taken off national accounts to arrive at a real measure of progress?
2. Role of Women:
Female Population in PH

III. CASE DISCUSSION
Role of Women:
The report does not show the labor being taken by women at home. How can we measure it even? The house helper can be used as a measurement of calculating the value that these women produce.
Proposed computation: Monthly salary of helper x multiply by the number of
stay home mothers

III. CASE DISCUSSION
Public Sector and Private SectorMilitary Expenditure
Gov’t should only include expenditure with economic impact. If they add more budget for Defense, its not a guarantee that enemies would decrease. Or worst, the more they add, the more enemies to face.
Benefit is hard to measure

III. CASE DISCUSSION
Exploitation of irreplaceable resourcesEnvironmental Considerations
Mineral reserves and the processing time can be identified . There is always corresponding depletion on it. Firms should measure the “net reserve” to get the real economic value of any irreplaceable resources.
If the main cause of any epidemic disease or any health problem in the area is pollution, the government should less this environmental cost to the actual production done by these manufacturing companies.
E.q. Mineral Reserves xxDepletion (xx)Net Reserve xx _
E.q. (for identified health prob)Total Production xxExpenses on impact of the production xxNet of production xx

III. CASE DISCUSSION
# 3. Physical Quality of Index- Includes 3 indicators
- Life expectancy- Infant mortality rate- Literacy rate
- Uses a scale of 1 to 100
- Relates fruits of economic growth with human betterment
- Analyzes nature of distribution of income
- Does not include social/psychological properties e.g. security, justice & human rights
- Need to normalize the indicators- Life expectancy - measured in terms of years- Infant mortality rate - in terms of per thousand- Basic literacy rate - in terms of percentage.

Rank Country Quality of Life Index31 Slovakia 108.7432 Croatia 108.733 Poland 95.1934 Uruguay 91.9435 Israel 91.1636 Italy 90.6137 Malaysia 89.0538 Singapore 87.9939 Mexico 83.4740 Hungary 83.1841 Argentina 81.1242 India 78.0143 Greece 77.48
44Bosnia And Herzegovina
74.6
45 Belarus 74.4346 Hong Kong 73.2447 Chile 69.3248 Serbia 69.3149 Turkey 67.8250 Romania 63.2751 Bulgaria 62.652 Thailand 56.6453 Ecuador 42.2554 Kazakhstan 40.6455 Jordan 39.5456 Brazil 38.7657 Colombia 36.5358 China 30.359 Philippines 28.0960 Pakistan 22.32
Rank Country Quality of Life Index
1 Switzerland 206.232 United States 195.553 Germany 192.694 Sweden 180.925 Finland 178.886 Denmark 178.557 Canada 178.298 Australia 175.98
9United Arab Emirates
173.27
10 Austria 171.8211 New Zealand 168.5612 Japan 168.4713 Norway 168.4114 Netherlands 160.98
15 United Kingdom 150.97
16 Estonia 145.417 Ireland 142.3518 Kuwait 141.3719 Saudi Arabia 139.8820 France 136.3121 Belgium 134.7122 Slovenia 125.5623 Portugal 124.7124 Puerto Rico 123.6425 Spain 123.64
26 Czech Republic 122.99
27 Lithuania 121.9128 South Korea 117.929 Taiwan 114.0630 South Africa 111.61
PQLI - Philippines is ranked # 59 in the world in 2014III. CASE DISCUSSION

III. CASE DISCUSSION
# 4. A combination of GDP, GNP and PQLI can be used to evaluate the economic welfare of countries.
An alternative is to use:- Measure of Economic Welfare
MEW = Value of GDP + Value of Leisure Time + Value of Unpaid Work – Value of Environmental
Damage
- Index of Sustainable Economic WelfareISEW = Personal Expenditure + Public Expenditure (excluding defense) + Value of Unpaid Work – Private Defense – Value of Environmental Damage

IV. Relative importance of the problem in various developing countries
Majority of global growth for the rest of this decade will happen in the developing world!
“Emerging markets" have accounted for more than half of world GDP for the first time since two centuries ago. -Financial Times, 2013

IV. Relative importance of the problem in various developing countries
Developing countries: Demographics
Across Asia demographics variation is significant (% under age 14 : ave. age) - Aging Populations: China (17.3% : 36.6), Japan (13.1% : 45.4) , Singapore (13.8% :
33.5), Taiwan (27.3% : 38.1), HK (11.6% : 43.9), Thai land (19.9% : 34.7), - Growth or Young Populations: Vietnam (25.2% : 28.2), Philippines (34.6% : 23.1),
Indonesia (27.3% : 28.5), Malaysia (29.63% : 27.1), Burma (27.5% : 27.2),
Aging Populations
Non-Aging Populations
2013
2027
Source: BIS Sharpnel, Datamonitor,Euromonitor
IV. Relative importance of the problem in various developing countries
Global Perspective
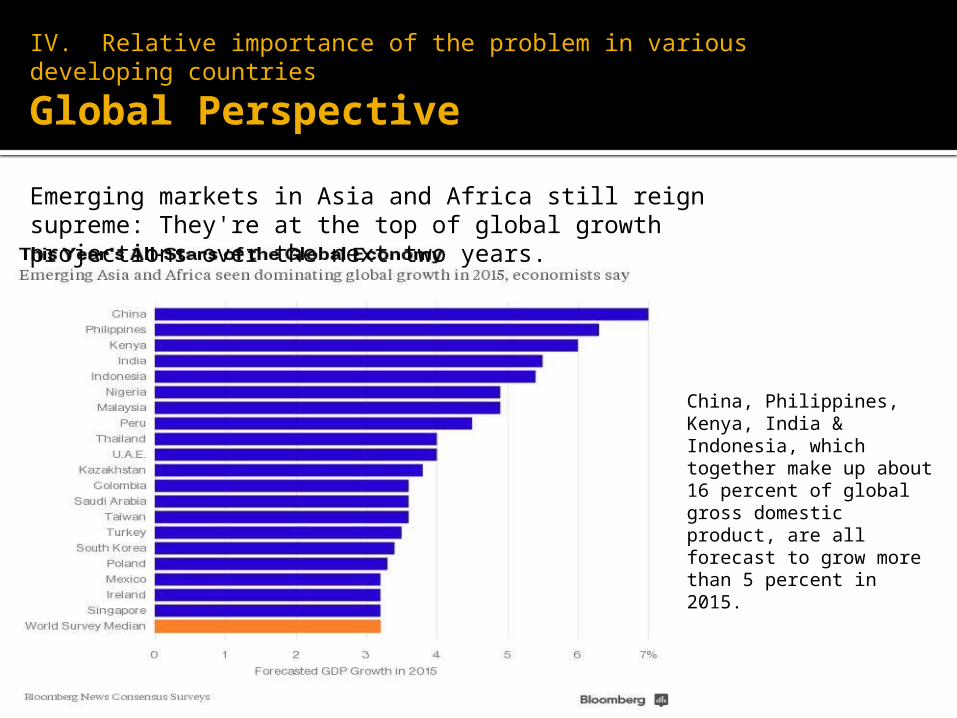
Emerging markets in Asia and Africa still reign supreme: They're at the top of global growth projections over the next two years.
China, Philippines, Kenya, India & Indonesia, which together make up about 16 percent of global gross domestic product, are all forecast to grow more than 5 percent in 2015.

IV. Relative importance of the problem in various developing countries
GDP may be an inaccurate indicator in the developing (and may still also be the poorest) countries: a concern for policymakers or for anyone who wants to use statistics to help the world’s poorest people -Bill Gates
Developing countries do not update their reporting often enough, so their GDP numbers may miss large and fast-growing economic sectors, like cell phones
Real progress is not measured accuratelyStandard of living may not be in sync with economic
growth

V. Goals and Objectives
The goal is to have an accurate indicator/ measure of a nation’s overall economic value.
GNP measures income, but not equality, it measures growth, but not destruction, and it ignores values like social cohesion and the environment.
GNP has to be supplemented with other essential indicators for quality of life/ overall living standards:
Childhood and maternal death rates Human Development Index : health and education statistics Multidimensional Poverty Index : indicators for nutrition,
sanitation, and access to cooking fuel and water Purchasing power parity: cost of the same basket of goods
and services in different countries

VI. REFERENCES
http://knoema.com/nwnfkne/world-gdp-ranking-2014-data-and-charts http://www.economicsconcepts.com/physical_quantity_of_life_index.htm http://www.preservearticles.com/201107119036/brief-notes-on-physical-
quality-of-life-index-pqli.html http://www.numbeo.com/quality-of-life/rankings.jsp http://
www.economicsonline.co.uk/Global_economics/Measure_of_economic_welfare_MEW.html
National Economic and Development Authority. 2006. Statement of Socioeconomic Planning Secretary Augusto B. Santos on the release of the FY 2005 National Income Accounts. January 30. National Statistical Coordination Board. Measurement of gross domestic product. ______. NSCB technical notes. ______.
Virola, R. 2004. GDP and GNP: Gawa dito sa Pilipinas and Gawa ng Pilipino? Statistically speaking. The Philippine system of national accounts. National Statistical Coordination Board.
http://www.oecdobserver.org/news/archivestory.php/aid/1518/Is_GDP_a_satisfactory_measure_of_growth_.html#sthash.NbHxKhm6.dpufhttp://www.project-syndicate.org/commentary/poor-countries-need-more-accurate-gdp-data-by-bill-gates#Ih63gHTVu31vqmp7.99 http://www.nscb.gov.ph/gender/FS%20on%20WAM%2018mar2013.pdf http://www.tradingeconomics.com/philippines/gdp-growth-annual
http://www.project-syndicate.org/commentary/poor-countries-need-more-accurate-gdp-data-by-bill-gates
Related Documents