BY: EMILY ULMA Final Project Presentation

BY: EMILY ULMA Final Project Presentation. Research Question Based on profiles of individual charitable contributions by state in 2011, which state in.
Dec 28, 2015
Welcome message from author
This document is posted to help you gain knowledge. Please leave a comment to let me know what you think about it! Share it to your friends and learn new things together.
Transcript

BY: EMILY ULMA
Final Project Presentation

Research Question
Based on profiles of individual charitable
contributions by state in 2011, which state in the United States is the most
giving and which is the least?

Literature Review
Generosity is a long-standing American tradition, one that continues to grow. The Giving USA Foundation estimates that Americans gave $248.5 billion to charity last year. To put the size of the donations in perspective, Americans gave to charity last year an amount roughly equal to the national incomes of Norway or Indonesia. The most important source of giving is, not surprisingly, contributions from private individuals, which represent more than 75 percent of the total. The second most important source of contributions is foundations, and in third place, donations. ( Hernández-Murillo , "Publications")
What motivates people to give? Who gives? What is the price of giving? Why do people volunteer time to charitable activities? Economists have found some answers to these questions, but they have just started to model philanthropy as a market.
The fact that charitable donations can be deducted from taxable income implies that the richest individuals, who face the highest marginal tax rate, have the greatest incentive to donate because they face the lowest marginal cost of giving. (For them, charitable giving carries with it the highest effective subsidy.) In other words, for an individual facing a marginal tax rate of 30 percent, the price of a dollar given to charity is 70 cents; the remaining 30 cents are paid by the government in taxes foregone, hence the subsidy. (Note that someone who does not itemize deductions effectively pays a price of one dollar for each dollar of giving.) ( Hernández-Murillo , "Publications")

Literature Review
On average, Americans give about 3 percent of their income to charity each year. But the giving gap between the rich and poor is significant, especially in view of the widening income gap. The report shows those who earned $200,000 or more donated 4.6 percent less of their income between 2006 and 2012; those who earned less than $100,000 gave 4.5 percent more. (Bever, 2014)
Poor and middle-income Americans are reaching deeper into their pockets when donating to charity, while the nation’s wealthiest are giving less, according to a report by Chronicle of Philanthropy that analyzed taxpayers’ IRS data. (Bever, 2014)
After reading this literature I was expecting to find that the states with lower average adjusted gross incomes to be more giving.

Works Cited
Hernández-Murillo, R., & Roisman, D. (2005, October 1). Publications. Retrieved November 16, 2014, from https://www.stlouisfed.org/publications/re/articles/?id=347
Bever, L. (2014, October 6). Report: Which states give the most to charity? The ones with church-goers. Retrieved November 19, 2014, from http://www.washingtonpost.com/news/morning-mix/wp/2014/10/06/report-which-states-give-the-most-to-charity-the-ones-with-church-goers/

Data Sources Used
http://nccs.urban.org/statistics/Giving.cfm National Center for Charitable Statistics

Data Sources Used

Data Sources Used
This data source, Data on Individual Giving by State 2011, came from the IRS Statistics of Income prepared by the National Center for Charitable Statistics at the Urban Institute.
The United States total is based on the 50 states and the District of Columbia only.
Since only returns with itemized contributions are included, IRS data do not account for all contributions. In 2011, 32% of US taxpayers chose to itemize deductions of their returns which means that 2/3 of US taxpayers take standard deduction and no one knows how much they donated to charity.
The two factors that I focused on were 1. Average AGI (Adjusted Gross Income) for All Returns = the average income, 2. Average Contribution of Itemizers = the average amount they give

Data Analysis
Highlighted the data Copy and pasted it into excelCleaned it up, text to columns, deleted unnecessary
things Highlighted the columns for Average AGI for All
Returns and Average Contribution of ItemizersCreated a bar graph to show the Average AGI For All
Returns (average income by state)Used to formula Average AGI For All Returns/Average
Contribution of Itemizers to find out what state is the most giving and the least
Took my answers and created a line graph to display my findings

Findings
Alaba
ma
Arizo
na
Califo
rnia
Conn
ecticut
District
Georgia
Idaho
Indian
a
Kansas
Louis
iana
Marylan
d
Michiga
n
Mississ
ippi
Montan
a
Nevada
Jersey Yo
rk
Dako
ta
Oklaho
ma
Penn
sylvania
Carolin
a
Tenn
essee
Utah
Virgin
ia
Virgin
ia
Wyo
ming0
10,000
20,000
30,000
40,000
50,000
60,000
70,000
80,000
90,000
Average AGI for all Returns $83,608
$40,932

Findings
Findings
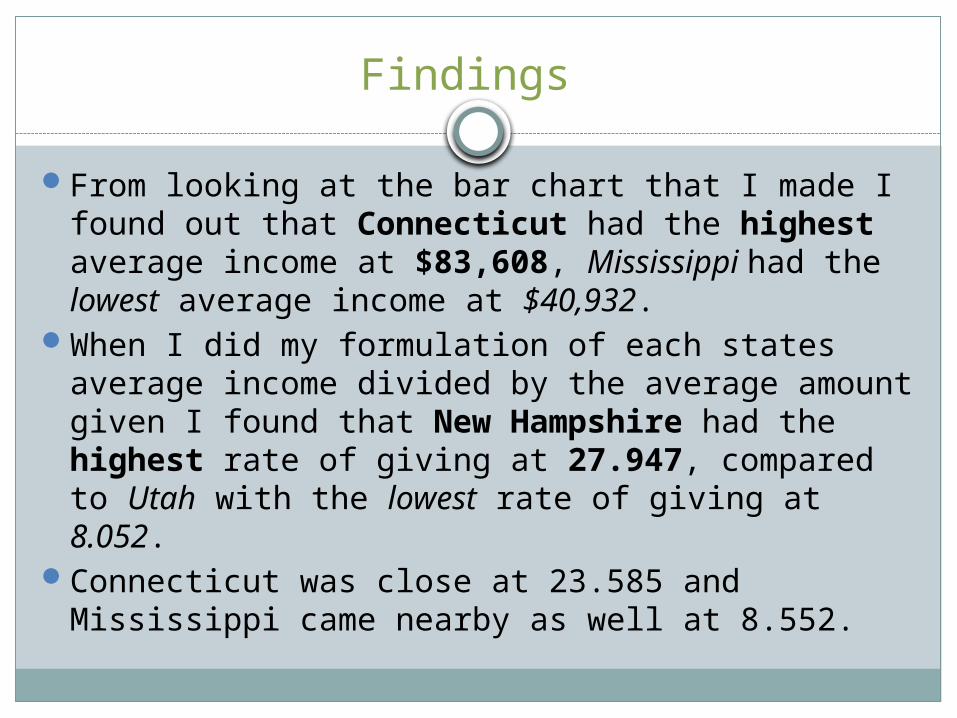
From looking at the bar chart that I made I found out that Connecticut had the highest average income at $83,608, Mississippi had the lowest average income at $40,932.
When I did my formulation of each states average income divided by the average amount given I found that New Hampshire had the highest rate of giving at 27.947, compared to Utah with the lowest rate of giving at 8.052.
Connecticut was close at 23.585 and Mississippi came nearby as well at 8.552.

Findings
From my research I can conclude that the state with the highest average income (CT) did not give as much as a state in comparison with a lower average income (NH).
New Hampshire’s average income was $62,545 and Utah’s average income was $52,716.
Charities are a big part of social welfare so it is important donate and keep giving to those in need.
This government believes in the dynamism of charities and their power to improve the quality of individuals’ lives and our national life. In ensuring all charities have to demonstrate how they fulfill their obligations in exchange for the benefits they receive.
Related Documents