BWP BRL COP COU EUR IDR PEN SGD ZAR THB VND USD CNY NOK THB CNY BRL AFA, AFN, XAG, MGA, THB, PAB, ETB, VEB, VEF BOB, GHC, CRC, SVC, NIC, NIO, DKK, EEK, ISK NOK, SKK, SEK, CZK, CSK, GMD, MKD, DZ BHD, IQD, JOD, KWD, LYD, RSD, CSD, SD TND, YUD, YUM, AED, MAD, STD, AUD, BSD BZD, BMD, BND, KYD, CAD, XCD, FJD, GYD HKD, SBD, JMD, BBD, LRD, NAD, NZD, SGD SRD, TWD, TTD, USD, USS, USN, ZWD, ZWR ZWL, VND, GRD, AMD, XDR, CVE, MZE, PTE TPE, EUR, CHE, ANG, AWG, NLG, HUF, ADF BEF, BIF, KMF, CDF, DJF, FRF, GNF, LUF, MGF RWF, CHF, XOF, XAF, XPF, XFO, XFU, CHW TG, PYG, UAH, PGK, LAK, HRK, MWK, ZMK, OA, AOK, AON, AOR, MMK, GEL, LVL, ALL HNL, SLL, MDL, ROL, RON, BGL, BGN, SZL, MT TL, SML, VAL, LTL, CYP, EGP, FKP, GIP, IEP, LBP HP, SDP, SDG, SYP, TRL, TRY, GBP, LSL, AZM ZN, TMM, TMT, DEM, BAM, FIM, MZM, MZN BOV, ERN, NGN, BTN, XAU, MRO, TOP, XPD, MO DanPer Trujillo and Civil Association FríoAéreo, Peru 9 Country : Peru ISO member body : Instituto Nacional de Defensa de la Competencia y de la Protección de la Propiedad Intelectual (National Institute for the protection of competition and intellectual property) (INDECOPI) Project team : Project leader : Ms. Rosario Uría, Technical Secretary of the Standardization and Non-tariff Barriers Surveillance Commission (INDECOPI) Member : Mr. Rodolfo Tupayachi, Economic Research Division (INDECOPI) Member : Mr. Santiago Dávila, Manager of the Economic Research Division (INDECOPI) Member : Mr. Juan de la Cruz, Economic Research Division (INDECOPI) Member : Ms. Patricia Castro (INDECOPI) ISO Central Secretariat advisor : Daniele Gerundino Duration of the study : October 2010 – May 2011

Welcome message from author
This document is posted to help you gain knowledge. Please leave a comment to let me know what you think about it! Share it to your friends and learn new things together.
Transcript

BWPBRLCOPCOUEURIDRPENSGDZARTHBVNDUSDCNYNOKTHBCNYBRL
AFA, AFN, XAG, MGA, THB, PAB, ETB, VEB, VEF, BOB, GHC, CRC, SVC, NIC, NIO, DKK, EEK, ISK,
NOK, SKK, SEK, CZK, CSK, GMD, MKD, DZD, BHD, IQD, JOD, KWD, LYD, RSD, CSD, SDD,
TND, YUD, YUM, AED, MAD, STD, AUD, BSD, BZD, BMD, BND, KYD, CAD, XCD, FJD, GYD,
HKD, SBD, JMD, BBD, LRD, NAD, NZD, SGD, SRD, TWD, TTD, USD, USS, USN, ZWD, ZWR,
ZWL, VND, GRD, AMD, XDR, CVE, MZE, PTE, TPE, EUR, CHE, ANG, AWG, NLG, HUF, ADF, BEF, BIF, KMF, CDF, DJF, FRF, GNF, LUF, MGF, RWF, CHF, XOF, XAF, XPF, XFO, XFU, CHW,
HTG, PYG, UAH, PGK, LAK, HRK, MWK, ZMK, AOA, AOK, AON, AOR, MMK, GEL, LVL, ALL, HNL, SLL, MDL, ROL, RON, BGL, BGN, SZL, MTL, ITL, SML, VAL, LTL, CYP, EGP, FKP, GIP, IEP, LBP, SHP, SDP, SDG, SYP, TRL, TRY, GBP, LSL, AZM, AZN, TMM, TMT, DEM, BAM, FIM, MZM, MZN, BOV, ERN, NGN, BTN, XAU, MRO, TOP, XPD, MOP
DanPer Trujillo and Civil Association FríoAéreo, Peru
9
Country : PeruISO member body : Instituto Nacional de Defensa de la Competencia y de la Protección de la Propiedad Intelectual (National Institute for the protection of competition and intellectual property) (INDECOPI)Project team :Project leader : Ms. Rosario Uría, Technical Secretary of the Standardization and Non-tariff Barriers Surveillance Commission (INDECOPI)Member : Mr. Rodolfo Tupayachi, Economic Research Division (INDECOPI)Member : Mr. Santiago Dávila, Manager of the Economic Research Division (INDECOPI)Member : Mr. Juan de la Cruz, Economic Research Division (INDECOPI)Member : Ms. Patricia Castro (INDECOPI)ISO Central Secretariat advisor : Daniele GerundinoDuration of the study : October 2010 – May 2011

162 Economic benefits of standards
9.1 Introduction
Asparagus is the star product among non-traditional agricultural
exports (NTAX’s) in Peru. The country is one of the leading exporters
of asparagus and recognized worldwide for the quality of its products.
The privileged position of Peru in international markets for asparagus
is the result of private and public efforts to develop competitive ad-
vantages in a context characterized by strong international competi-
tion, strict sanitary and phytosanitary market access requirements,
growing private demand for high-quality and safe products and
traceability requirements.
How has this industry managed to achieve such a level of success
in an increasingly demanding and competitive global market ? And,
what are the reasons and change factors that have encouraged the
development of a sustainable industry that has a significant impact
on the Peruvian economy ?
The success of the sector can be explained by a combination of fac-
tors among which the implementation of standards has played an
important role by facilitating the adoption and transfer of knowledge
and technology at intra-company as well as at inter-company levels.
The asparagus industry has made significant progress in the im-
plementation of good manufacturing practices and management
systems for safety and quality – starting with the HACCP (Hazard
Analysis Critical Control Point) system, which was followed by the
implementation of other management systems, focused on support-
ing integrated quality assurance.

Economic benefits of standards 163
To analyze the contribution of standards, INDECOPI 1 and the Stand-
ardization and Non-tariff Barriers Surveillance Commission 2 of Peru
decided to apply a methodology recently developed by ISO to assess
the economic impact of standards.
The methodology focuses on microeconomic analysis of the activities
of businesses or industries and provides a useful insight into how to
consider the multiple ways in which the adoption of standards can
promote the development and growth of companies or sectors. In
essence, the approach focuses on the value chain analysis, on the
identification of key value drivers that characterize a company or an
industry, and on the relationship between the application of standards
and the creation of value. The impact of standards is determined by
measuring how they affect relevant operational indicators for the
various business functions, and then translated in monetary terms.
Considering the Peruvian asparagus value chain, INDECOPI and the
Standardization and Non-tariff Barriers Surveillance Commission of
Peru decided to analyze two companies to represent the sector. The
first is a leading agro-exporter, DanPer Trujillo 3 (located in Trujillo, in
the North of Peru) and the second a logistics consortium, Civil As-
sociation FríoAéreo (located in Lima), which plays a critical role in the
sector’s logistics, by handling nearly all the Peruvian fresh asparagus
shipments by air.
1 Instituto Nacional de Defensa de la Competencia y de la Protección de la Propiedad Intelectual
(INDECOPI) – the main national institution in charge of standardization, accreditation and
metrology in Peru.
2 The Commission is responsible for developing regulatory activities nationwide in its capacity as
National Regulatory Agency. It supervises the subsequent control and elimination of non-tariff
trade barriers, according to commitments made in the framework of the World Trade Organiza-
tion, free trade agreements and the corresponding supranational and national regulations. It
is also in charge of managing the official electronic signature infrastructure.
3 For further information, please consult : http://www.danper.com/Web/en/Default.aspx. Address :
Carretera Industrial s/n Sector Barrio Nuevo Moche – Trujillo, Peru.
164 Economic benefits of standards
The idea was that the analysis of these two organizations would al-
low significant insight into the whole sector – without engaging in
a complex sector study which would have required more time and
resources.
While the quantitative assessment was only completed for DanPer
(as explained in the following sections), the combination of DanPer’s
quantitative results and the qualitative findings concerning both
organizations, allowed us to consider factors and trends applicable
to the whole sector.
Finally, it is important to note that the analysis is focused on the
assessment of the standards contribution to Danper’s asparagus
business, which represent about 50 % of its revenue.
9.2 The selected companies
DanPer began operating with great success in February 1994 as
an international joint venture with Danish and Peruvian capital (see
Table 1). The company’s agricultural operations cover 5 000 hectares,
where asparagus (green and white), artichokes, pepper (jalapeño and
piquillo), string beans, mango and papaya 4 are cultivated.
Around two-thirds of the land under cultivation is owned by DanPer
and the remaining one third is owned by external suppliers. It is worth
noting that DanPer only started production from its own fields in
2003, although this has expanded substantially since then. However,
the quantities from external suppliers are also growing, due to the
development of the market and the expansion of DanPer’s sales.
4 Asparagus represents about 44 % of the land under cultivation, while 47 % is dedicated to
artichokes, 8 % to peppers, and the remaining area to fruits.
Economic benefits of standards 165
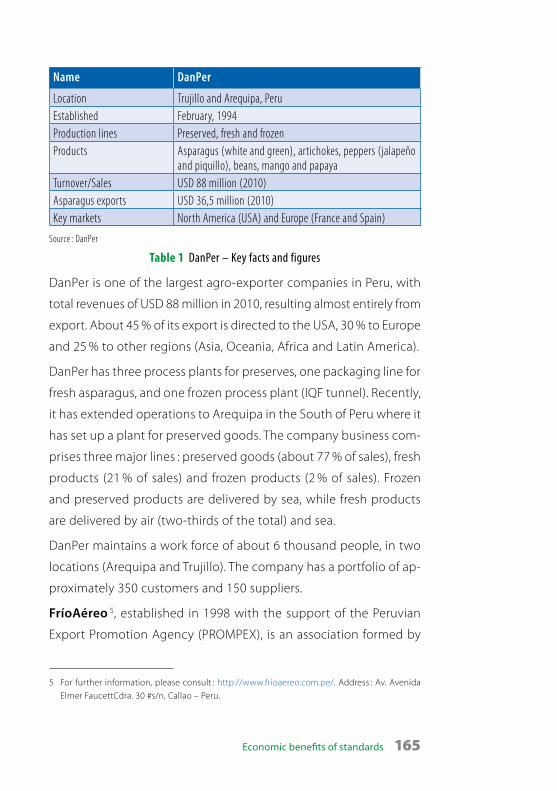
Name DanPer
Location Trujillo and Arequipa, PeruEstablished February, 1994Production lines Preserved, fresh and frozen Products Asparagus (white and green), artichokes, peppers (jalapeño
and piquillo), beans, mango and papayaTurnover/Sales USD 88 million (2010)Asparagus exports USD 36,5 million (2010)Key markets North America (USA) and Europe (France and Spain)
Source : DanPer
Table 1 DanPer – Key facts and figures
DanPer is one of the largest agro-exporter companies in Peru, with
total revenues of USD 88 million in 2010, resulting almost entirely from
export. About 45 % of its export is directed to the USA, 30 % to Europe
and 25 % to other regions (Asia, Oceania, Africa and Latin America).
DanPer has three process plants for preserves, one packaging line for
fresh asparagus, and one frozen process plant (IQF tunnel). Recently,
it has extended operations to Arequipa in the South of Peru where it
has set up a plant for preserved goods. The company business com-
prises three major lines : preserved goods (about 77 % of sales), fresh
products (21 % of sales) and frozen products (2 % of sales). Frozen
and preserved products are delivered by sea, while fresh products
are delivered by air (two-thirds of the total) and sea.
DanPer maintains a work force of about 6 thousand people, in two
locations (Arequipa and Trujillo). The company has a portfolio of ap-
proximately 350 customers and 150 suppliers.
FríoAéreo 5, established in 1998 with the support of the Peruvian
Export Promotion Agency (PROMPEX), is an association formed by
5 For further information, please consult : http://www.frioaereo.com.pe/. Address : Av. Avenida
Elmer FaucettCdra. 30 #s/n, Callao – Peru.

166 Economic benefits of standards
exporters of perishable products (fruits, vegetables and flowers),
primarily serving those companies requiring post-harvest manage-
ment of their products up to pre-shipment stage.
Thanks to the establishment and growth of FríoAéreo, the airport
Jorge Chavez in Lima has today the largest perishable-goods centre
in Latin America, with modern equipment and a logistics system
that provides optimal conditions to handle and store products. The
cold terminal has filled a gap in the exporters’ supply chain, since,
prior to its establishment, perishable products faced serious risks of
deterioration due to a break in the cold chain.
FríoAéreo was established by nine member companies, which repre-
sented 40 % of the Peruvian agro-export industry. Today, 33 compa-
nies are members of FríoAéreo, representing 80-90 % of the industry.
Around 80 % of the total Peruvian exports of perishable products
dispatched by air pass through its cold chain management facilities.
Since its inception, FríoAéreo has contributed greatly to reducing inef-
ficiency in the perishable products logistic chain, particularly in reduc-
ing quality losses and long loading times (from 4 hours in 1998 to 1.5
hours in 2005). The company also provides reliable information to the
industry, enabling export companies to improve strategic planning.
9.3 Attitude of the companies towards standardization
The success achieved by the Peruvian asparagus industry in inter-
national markets depends on its ability to supply trustworthy, safe
products of high quality.
In 1998, the private and public sector, with the support of INDECOPI,
promoted the creation of the Asparagus National Technical Com-

Economic benefits of standards 167
mittee of Standardization (ANTCS) as a way to develop standards
that would strengthen safety and other product and process quality
attributes, responding effectively to the requirements of importers
and national regulatory authorities of importing countries. To achieve
this, the national standards for asparagus published by ANTCS were
harmonized with Codex Alimentarius 6 standards.
Private certification schemes have also become increasingly important
requirements demanded by international markets, to which Peruvian
exporters have responded proactively.
Standards implementation and certification has considerably influenced
the evolution of the Peruvian agro-export sector in terms of product
quality, environmental sustainability of the production systems, and
better social welfare conditions.
9.3.1 Standards context
The role of these companies within the industry value chain is im-
portant and has an influence on the use of standards by suppliers
and logistics operators.
For DanPer, products and services provided by suppliers (farmers)
and logistic operators are key to meeting the requirements of for-
eign markets. In this sense, the use of quality and safety standards
by DanPer influences the improvement of suppliers’ operations and
their deliverables (upstream) – as a large buyer of supplies it can push
the use of certain standards by its suppliers.
6 The Codex Alimentarius Commission was created in 1963 by FAO (Food and Agriculture
Organization of the United Nations) and WHO (World Health Organization) to develop food
standards, guidelines and related texts such as codes of practice under the Joint FAO/WHO
Food Standards Programme. More information on : http://www.codexalimentarius.net/web/
index_en.jsp#
168 Economic benefits of standards
For FríoAéreo, as a downstream service provider of storage (cold chain
management facilities), the use of standards is critical to reducing
the risks of inadequate handling of products. Given its position in
the market, it can influence the implementation of process, safety
and quality standards by its customers, to optimize the quality of
exported products.
9.3.2 Standards capability
DanPer Trujillo has an important history in dealing with standards
and, since its establishment, has maintained a strategic and very
proactive attitude toward standards7. In DanPer’s vision, adapting
to new standards is seen as an opportunity to improve production
processes and to open new markets, which is worth the cost (in time
and in money) incurred.
In a decade, FríoAéreo has successfully adopted standards for all its
processes, and promoted the implementation of standards such as
NTP 011.109:2008, ASPARAGUS – Asparagus fresh – Requirements, which
have played a key role in promoting the use of standards throughout
the industry. Its experience with the implementation of standards
has allowed FríoAéreo to develop indicators and control systems for
quality attributes that allow asparagus producers to monitor their
quality performance, and introduce corrective measures as required.
7 DanPer Trujillo is part of ANTCS, the consortium of firms that have created IPEH and FríoAéreo.

Economic benefits of standards 169
9.4 Analysis of the value chain
9.4.1 Industry value chain
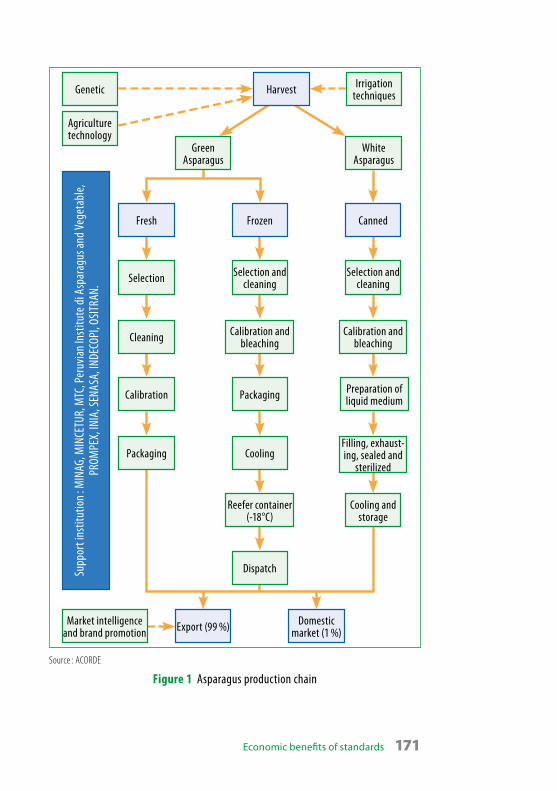
Two chains have been outlined In this section. The first (see Figure 1)
highlights the asparagus production chain, and the second (see
Figure 2) describes the main stages for fresh green asparagus 8
export. These chains are useful in understanding the value chain of
the Peruvian asparagus 9 industry.
According to FAO (2007), the fresh asparagus supply chain involves
several steps from production to export.
“ The process begins with selection of varieties, nursery, planting,
application of chemical inputs and irrigation, disease control, and
harvesting. Timing is fundamental to maintaining a quality product,
for example, harvesting is a very coordinated activity, no more than
30 minutes are allowed from harvest to arrival in the packing house
in order to avoid deterioration of quality. In the logistics/post-harvest
component, fresh asparagus is loaded, weighed, cut, washed, and
then sorted, graded, and bunched. Next, the asparagus is packed in
specialized cartons (5-12 kg), pre-cooled and loaded onto refriger-
ated trucks. It then passes through customs clearance, cold storage
and airport handling, and is finally shipped by air, and more recently,
also by sea.
The marketing component consists of identification of, and negotiation
with, buyers, market research information, and ensuring completion
of the sale, etc. “(FAO, 2007 : p. 27)
8 Ositran (2009), this document analysed the logistic chain of green asparagus with a key focus
on the use of transport infrastructure for export. The goal was to identify the main bottlenecks
that could affect business sustainability within this sector
9 Green asparagus is the main variety produced in Peru, representing more than 80 % of total
production.

170 Economic benefits of standards
In general, processing plants are close to cultivation areas 10, except
when transportation and processing costs are larger in comparison
to field costs.
10 The main cultivation areas are located in Junín, Trujillo, Lima and Ica.
Economic benefits of standards 171
White Asparagus
Irrigation techniquesGenetic
Agriculture technology
Supp
ort i
nstit
utio
n : M
INAG
, MIN
CETU
R, M
TC, P
eruv
ian In
stitu
te di
Asp
arag
us an
d Veg
etab
le,
PROM
PEX,
INIA
, SEN
ASA,
INDE
COPI
, OSIT
RAN.
Harvest
Green Asparagus
Fresh
Selection
Cleaning
Calibration
Packaging
Selection and cleaning
Calibration and bleaching
Calibration and bleaching
Preparation of liquid medium
Filling, exhaust-ing, sealed and
sterilized
Cooling and storage
Packaging
Cooling
Dispatch
Reefer container (-18°C)
Selection and cleaning
Frozen Canned
Export (99 %) Domestic market (1 %)
Market intelligence and brand promotion
Source : ACORDE
Figure 1 Asparagus production chain
172 Economic benefits of standards
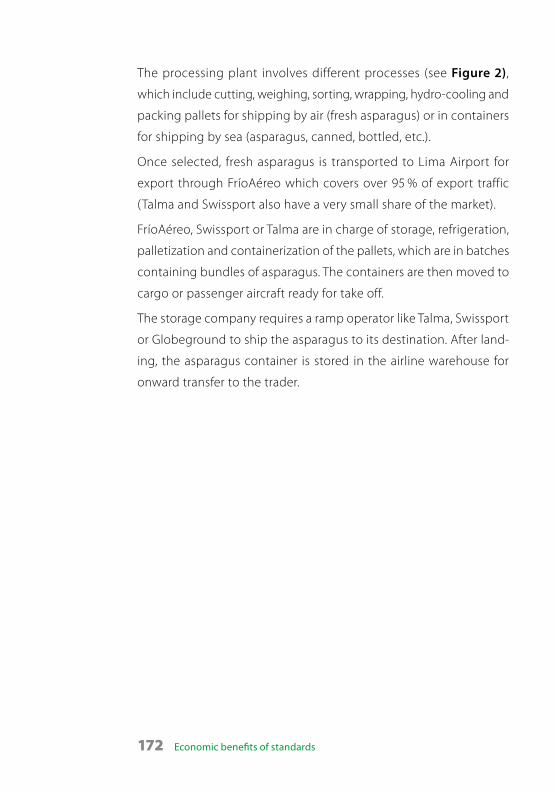
The processing plant involves different processes (see Figure 2),
which include cutting, weighing, sorting, wrapping, hydro-cooling and
packing pallets for shipping by air (fresh asparagus) or in containers
for shipping by sea (asparagus, canned, bottled, etc.).
Once selected, fresh asparagus is transported to Lima Airport for
export through FríoAéreo which covers over 95 % of export traffic
(Talma and Swissport also have a very small share of the market).
FríoAéreo, Swissport or Talma are in charge of storage, refrigeration,
palletization and containerization of the pallets, which are in batches
containing bundles of asparagus. The containers are then moved to
cargo or passenger aircraft ready for take off.
The storage company requires a ramp operator like Talma, Swissport
or Globeground to ship the asparagus to its destination. After land-
ing, the asparagus container is stored in the airline warehouse for
onward transfer to the trader.
Economic benefits of standards 173
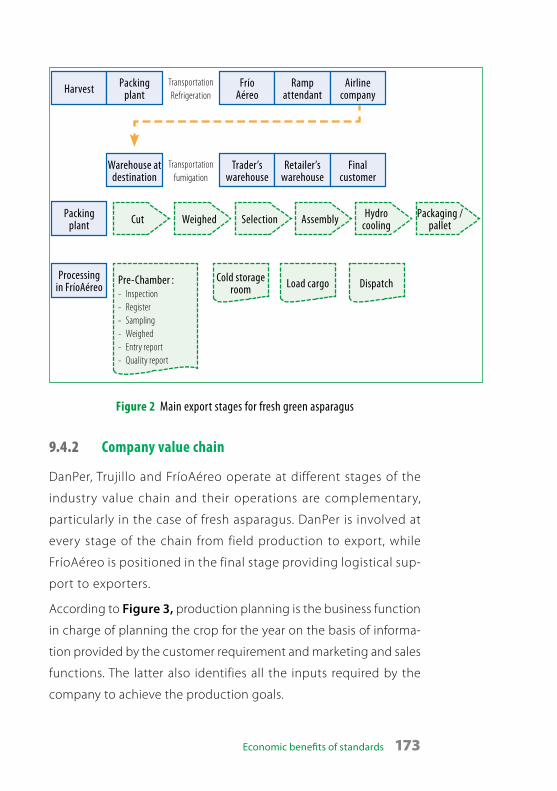
Cut Weighed Selection Assembly Hydro cooling
Packaging / pallet
Harvest Packing plant
Warehouse at destination
Frío Aéreo
Ramp attendant
Airline company
Trader’s warehouse
Retailer’s warehouse
Final customer
Transportation Refrigeration
Transportation fumigation
Packing plant
Processing in FríoAéreo
Pre-Chamber : - Inspection - Register - Sampling - Weighed - Entry report - Quality report
Cold storage room Load cargo Dispatch
Figure 2 Main export stages for fresh green asparagus
9.4.2 Company value chain
DanPer, Trujillo and FríoAéreo operate at different stages of the
industry value chain and their operations are complementary,
particularly in the case of fresh asparagus. DanPer is involved at
every stage of the chain from field production to export, while
FríoAéreo is positioned in the final stage providing logistical sup-
port to exporters.
According to Figure 3, production planning is the business function
in charge of planning the crop for the year on the basis of informa-
tion provided by the customer requirement and marketing and sales
functions. The latter also identifies all the inputs required by the
company to achieve the production goals.
174 Economic benefits of standards
The harvesting/collecting function implements the requirements
of the production planning function in the field. This stage is criti-
cal because harvesting/collecting supplies the production process,
including that provided by third parties. In the production/packing
function, the asparagus is then processed and packed according to
customer requirements. It is important to mention that at this stage
DanPer operates three asparagus production lines : fresh, frozen and
preserved11.
Outbound logistics is another stage critical to the export process,
mainly for fresh asparagus. At this stage proper handling of the
fresh product from factory to port or FríoAéreo warehouse must be
ensured, along with temperature control.
The support and strategic processes complement the activities of the
execution process. Within these secondary activities, the key func-
tions are research and development (R&D), process control, systems
and quality assurance, and human resources. R&D is responsible for
developing new products or upgrading existing ones, as well as
for improving the production process. Process control and systems
and quality assurance are in charge of product sampling and testing
product compliance with specified requirements.
Finally, human resources has become a very important function for
DanPer. This business is highly labour intensive and the implementa-
tion of programmes to improve labour conditions is essential. Em-
ployee involvement and individual contributions to the company’s
continual improvement philosophy, have been key factors in the
rapid growth of DanPer.
11 Fresh asparagus represents around 20 % of sales, whilst preserved asparagus accounts for 70 %,
and frozen for 10 %.

Economic benefits of standards 175
Marketing and sales b)
Production planning
Harvesting / collecting
Production/packing
Outbound logistics
Management and administration
Board of directors
Research and development
Integrated management system a)
Human resources
Process control
Maintenance and warehousing
Systems and quality assurance
Customer requirement
CUS-TOM-ER b)
Execution process
Support process
Strategic process {
{
}
}a) Involves the strategic planning and direction revision.
b) Customer (satisfaction) includes some activities of sales (post-sales).
Source : DanPer Trujillo
Figure 3 The DanPer Trujillo value chain
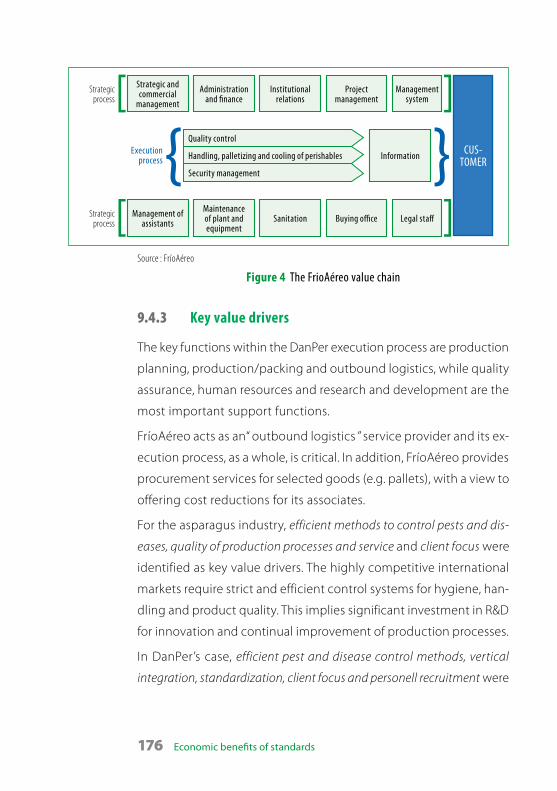
Figure 4 outlines the FríoAéreo value chain. Satisfying customer
requirements by providing storage and cold services is the core busi-
ness. In the execution stage, storage and cold services are provided,
supplemented by quality control and product control. Quality control
covers product sampling and analysis of asparagus characteristics,
whereas product control is applied to trace temperature and to
monitor the humidity of products until they are loaded onto the
aircraft. The information gathered through this process is used to
develop reports describing product quality and rankings that are
then distributed to FríoAéreo’s associates.
The functions belonging to the Support Process provide services to the
execution process, including maintenance of facilities and equipment.
176 Economic benefits of standards
Quality control
Handling, palletizing and cooling of perishables
Security management
Strategic process
Strategic process
CUS-TOMER
Execution process{ }
Strategic and commercial
management
Management of assistants
Administration and finance
Maintenance of plant and equipment
Institutional relations
Sanitation
Project management
Buying office
Information
Management system
Legal staff
Source : FríoAéreo
Figure 4 The FrioAéreo value chain
9.4.3 Key value drivers
The key functions within the DanPer execution process are production
planning, production/packing and outbound logistics, while quality
assurance, human resources and research and development are the
most important support functions.
FríoAéreo acts as an“ outbound logistics ” service provider and its ex-
ecution process, as a whole, is critical. In addition, FríoAéreo provides
procurement services for selected goods (e.g. pallets), with a view to
offering cost reductions for its associates.
For the asparagus industry, efficient methods to control pests and dis-
eases, quality of production processes and service and client focus were
identified as key value drivers. The highly competitive international
markets require strict and efficient control systems for hygiene, han-
dling and product quality. This implies significant investment in R&D
for innovation and continual improvement of production processes.
In DanPer’s case, efficient pest and disease control methods, vertical
integration, standardization, client focus and personell recruitment were
Economic benefits of standards 177
identified as key value drivers. Many are related to the ability to ensure
reliable asparagus supply, a key success factor for this industry. DanPer
is keen to establish relationships with farmers and suppliers in order
to standardize process and quality, and to assure a fast, reliable and
flexible service to customers.
In FríoAéreo’s case, quality service and service efficiency were identified
as key value drivers. Performing cold chain management is essential
for agro-exporters of fresh products, and the company efforts focus
on maintaining outstanding service and process control. To support
continual quality improvement, quality reports are regularly delivered
to associates and awards assigned.
9.5 Scope of the assessment
DanPer Trujillo takes part in almost all stages of the industry value
chain, which involve the processes from harvesting to export (product
placed on port), whereas FríoAéreo12 operates as a service provider in
the delivery of the product to its final destination, when the product
is loaded on the aircraft (see Figure 5).
12 The goal of the service provided by FríoAéreo is to maintain the quality of the product by
ensuring the handling and cold chain protection during transit of the product through the
airport.

178 Economic benefits of standards
Harvesting
Farmers FríoAéreo
Production/ packing
Agro-exporters
Storage Outbound logistics Shipped Customer
IN SCOPE
Figure 5 Fresh asparagus industry value chain
Therefore, the assessment can focus on the functions related to in-
bound and outbound logistics, production/operations and marketing
and sales, which are the main functions of the industry. However,
human resources and research and development can be included
as complementary functions in the development of the industry.
The main reason why only certain business functions were selected
is explained by the leading role that standards seem to play in the
development of the production process.
9.6 Use of standards in the companies value chains
The most important standards and certifications and, separately,
regulations, applied by DanPer, are provided in the list below.
DanPer : Standards and certifications
NTP 011.109 (2008), ASPARAGUS – Asparagus fresh – Requirements ;
NTP 011.116 (1991), ASPARAGUS – Refrigerated Transportation Guide ;
NTP 209.401(2001), ASPARAGUS – Hygienic practices for processing
of fresh asparagus ; 21 CFR 110 : NTP 209.402(2003), ASPARAGUS
– Good Agricultural Practices ; Certifications to ISO 9001:2008,
ISO 14001:2004, OHSAS 18001:2007, SA 8000 (Social Accountability
International), Globalgap version 03, USGAP Version 08.06, BASC
version 03-2008.
Economic benefits of standards 179
DanPer : Regulations
The Control of Pesticides Regulation 1986, CAC / Vol. III Second Edi-
tion 1993. Maximum Limits for Pesticide Residues, UK Statutory MRLs,
Regulation EU Nº 765/2010, European Biocides Scheme – Biocidal
Product Directive 98/8/EC, Directive 79/117/EEC : Active substances
prohibited, Certification HACCP according to Codex Alimentarius
annex to CAP/RCP 1-1969 (Rev 04 – 2003).
In DanPer’s case, most of the standards, certifications and regulations
are applied by each operational business function (see Table 1).
Governments and traders are highly demanding in terms of compli-
ance to health, safety and environmental protection requirements
for agricultural products entering their countries.
Inbound logistics and productions/operations make significant use
of standards certifications and must comply with the regulations
of importing countries, concerning primarily good manufacturing
practices, control of pesticides, maximum levels of contaminants or
phytosanitary aspects.
It is important to note that for DanPer it is virtually impossible to
separate the impact of voluntary standards and certifications,
from that of regulations. Considering that regulations do not have
a dominant role (in terms of number or relative influence) and that
all types of requirements are treated in the same way through the
company processes, the assessment has been conducted in consid-
eration of the full set of normative documents.
In FríoAéreo’s case, quality and environmental management (ISO 9000
and ISO 14000) are the main standards used by the management and
administration and production/operations business functions. The
production/operations and post-service business functions also use
national standards covering fresh asparagus requirements and sam-
180 Economic benefits of standards
pling procedures, which are very important to their activities. Finally,
the certification BASC13 which addresses the problem of concealing
contraband in commercial trade is employed in the operations of
procurement, production/operations and post-service.
FríoAéreo’ : Standards and certifications
NTP 011.109 (2008), ASPARAGUS – Asparagus fresh – Requirements ;
NTP-ISO 2859-1:1999, Sampling procedures for inspection by attributes ;
NTP-ISO 9000:2007, Quality Management Systems – Fundamentals and
Vocabulary ; ISO 9001:2008, Quality Management Systems – Requirements ;
ISO 14001:2004, Environmental Management Systems – Requirements
with guidance for use ; ISO 14004:2004, Environmental Management
Systems – General guidelines on principles, systems and supporting
techniques ; Certifications : Business Alliance for Secure Commerce
(BASC) ; Directorate General of Civil Aviation (DGAC) ; GS1 : Global
Traceability Conformance.
The standards impact map used by the companies
The main impacts of standards on the activities of each business
function are summarized in Tables 1 and 2 (a more comprehensive
list of the standards impact map can be found in the full report).
In DanPer’s case, the implementation of national and international
standards such as NTP 011.109, NTP 209.401, ISO 9001 and ISO 14001,
has had a substantial impact on the development of its operations,
helping to organize processes in compliance with regulations and
to continually improve process efficiency.
However, the most important impact of standards was identified
in the marketing and sales department. Conformity to standards
13 BASC’s security standards are designed to significantly improve security practices and in the
process deter contraband smugglers and terrorists from using their companies to introduce
contraband and implements of terror in legitimate shipments.
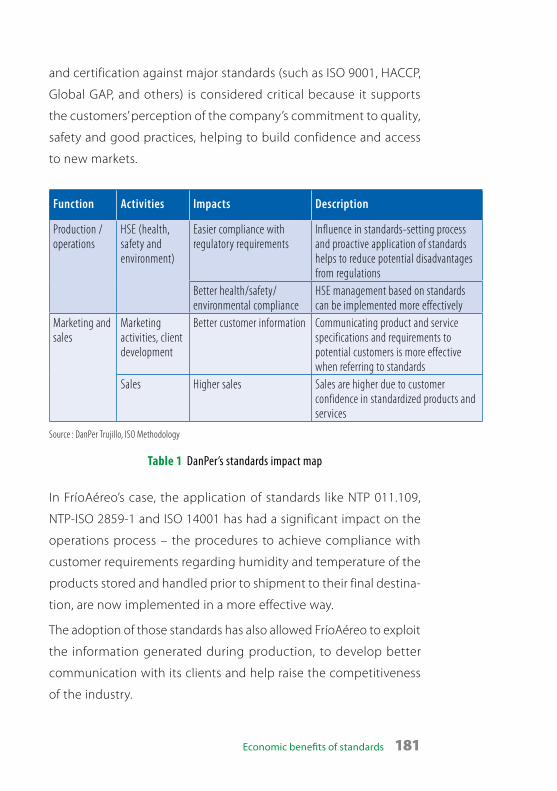
Economic benefits of standards 181
and certification against major standards (such as ISO 9001, HACCP,
Global GAP, and others) is considered critical because it supports
the customers’ perception of the company’s commitment to quality,
safety and good practices, helping to build confidence and access
to new markets.
Function Activities Impacts Description
Production / operations
HSE (health, safety and environment)
Easier compliance with regulatory requirements
Influence in standards-setting process and proactive application of standards helps to reduce potential disadvantages from regulations
Better health/safety/environmental compliance
HSE management based on standards can be implemented more effectively
Marketing and sales
Marketing activities, client development
Better customer information Communicating product and service specifications and requirements to potential customers is more effective when referring to standards
Sales Higher sales Sales are higher due to customer confidence in standardized products and services
Source : DanPer Trujillo, ISO Methodology
Table 1 DanPer’s standards impact map
In FríoAéreo’s case, the application of standards like NTP 011.109,
NTP-ISO 2859-1 and ISO 14001 has had a significant impact on the
operations process – the procedures to achieve compliance with
customer requirements regarding humidity and temperature of the
products stored and handled prior to shipment to their final destina-
tion, are now implemented in a more effective way.
The adoption of those standards has also allowed FríoAéreo to exploit
the information generated during production, to develop better
communication with its clients and help raise the competitiveness
of the industry.

182 Economic benefits of standards
Function Activities Impacts Description
Production / operations
Environmental con-ditions assurance
Better environmental management
Environmental management based on standards can be implemented more effectively in order to maintain the correct temperature and humidity levels
Service Customer care and technical support
Better customer communication
You can communicate information about products and services to customers more effectively by using standardized specifications
Source : FríoAéreo, ISO Methodology
Table 2 FríoAéreo’s standards impact map
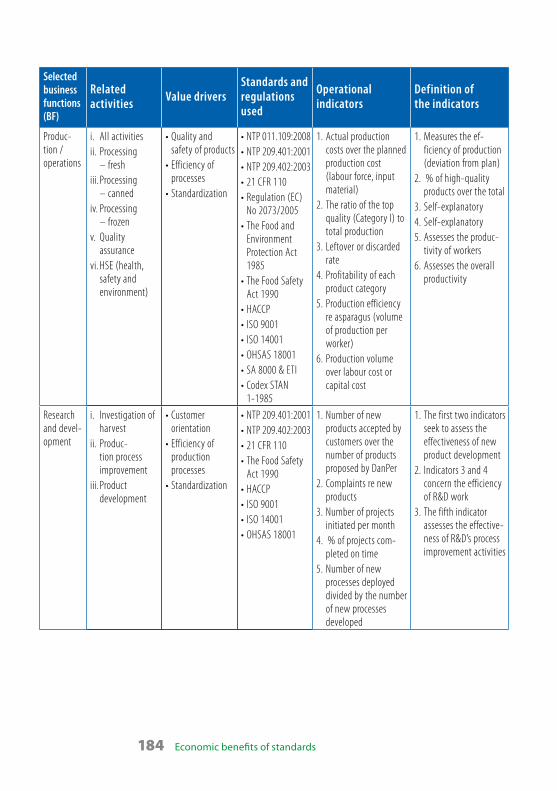
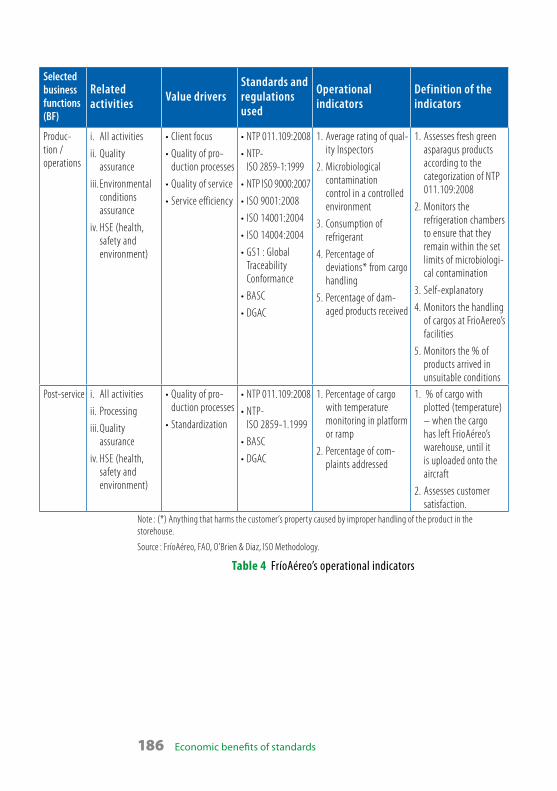
9.7 Selection of operational indicators to measure the impact of standards
Tables 3 and 4 present a list of operational indicators obtained from
interviews with each company. The quantification of the impact of
standards on them (actually on the subset for which it was possible
to gather relevant data) leads to the assessment of the standards
value for the company.
Selected business functions (BF)
Related activities Value drivers
Standards and regulations used
Operational indicators
Definition of the indicators
Field operations
i. Planningii. Irrigationiii. Pest controliv. Operations
(from planting to harvesting)
v. Personnel management
•Quality and safety of products•Optimal crop
yield•Personnel
involvement
•HACCP (Codex)•Codex Stan
193-1995• ISO 9001
1. Quality of harvested crops
2. Field productivity3. Waste4. Personnel qualifica-
tion, motivation and satisfaction
1. % of products by category of quality
2. Volume of harvested product/cost
3. % of waste4. Based on personnel
surveys and other (e.g. training)

Economic benefits of standards 183
Selected business functions (BF)
Related activities Value drivers
Standards and regulations used
Operational indicators
Definition of the indicators
Procure-ment (crops)
i. Planningii. Quality controliii. Procurement of
crops
•Quality control•Cost effectiveness
•NTP 209.401 : 2001•NTP 209.402 :
2003•Regulation (EC)
No 2073/2005•Regulation (EC)
No 178/2002•The Control of
Pesticides Regu-lation 1986•HACCP• ISO 9001• ISO 14001•OHSAS 18001•SA 8000•Codex Stan
192-1995
1. The actual kilogram recorded to the total kilogram forecasted ;
2. The actual kilogram recorded from own fields over the total kilogram recorded ;
3. Number of orders that do not meet the specifications as a percentage of total number of orders
1. Assesses the compli-ance of raw material supply against plan ;
2. Assesses the percent-age of inputs from the company’s own fields in relation to third-party fields ;
3. Measures the level of non-conformity of suppliers
Logistics/procure-ment
i. Procurement (all goods except crops)
ii. Handling incom-ing materials and products
iii. Transportation
•Quality of supply/suppliers•Cost effectiveness•Efficiency of
transport
• ISO 9001•CAC/RCP 60-2005•Regulation (EC)
No 2023/2006
1. Selection of suppliers2. Cost
1. Ratio of suppliers in top quality ranking (category A and B)
2. Cost of purchased goods
184 Economic benefits of standards
Selected business functions (BF)
Related activities Value drivers
Standards and regulations used
Operational indicators
Definition of the indicators
Produc-tion / operations
i. All activitiesii. Processing
– freshiii. Processing
– cannediv. Processing
– frozenv. Quality
assurancevi. HSE (health,
safety and environment)
•Quality and safety of products•Efficiency of
processes•Standardization
•NTP 011.109:2008•NTP 209.401:2001•NTP 209.402:2003•21 CFR 110•Regulation (EC)
No 2073/2005•The Food and
Environment Protection Act 1985•The Food Safety
Act 1990•HACCP• ISO 9001• ISO 14001•OHSAS 18001•SA 8000 & ETI•Codex STAN
1-1985
1. Actual production costs over the planned production cost (labour force, input material)
2. The ratio of the top quality (Category I) to total production
3. Leftover or discarded rate
4. Profitability of each product category
5. Production efficiency re asparagus (volume of production per worker)
6. Production volume over labour cost or capital cost
1. Measures the ef-ficiency of production (deviation from plan)
2. % of high-quality products over the total
3. Self-explanatory4. Self-explanatory5. Assesses the produc-
tivity of workers6. Assesses the overall
productivity
Research and devel-opment
i. Investigation of harvest
ii. Produc-tion process improvement
iii. Product development
•Customer orientation•Efficiency of
production processes•Standardization
•NTP 209.401:2001•NTP 209.402:2003•21 CFR 110•The Food Safety
Act 1990•HACCP• ISO 9001• ISO 14001•OHSAS 18001
1. Number of new products accepted by customers over the number of products proposed by DanPer
2. Complaints re new products
3. Number of projects initiated per month
4. % of projects com-pleted on time
5. Number of new processes deployed divided by the number of new processes developed
1. The first two indicators seek to assess the effectiveness of new product development
2. Indicators 3 and 4 concern the efficiency of R&D work
3. The fifth indicator assesses the effective-ness of R&D’s process improvement activities

Economic benefits of standards 185
Selected business functions (BF)
Related activities Value drivers
Standards and regulations used
Operational indicators
Definition of the indicators
Marketing and sales
i. All activitiesii. Marketing
activities, client development
iii. Market analysis, research
iv. Contractingv. Sales
•Customer focus, customer service•Sales
effectiveness•Social
responsibility• Innovation
effectiveness•Market
knowledge
•NTP 011.109:2008•NTP 209.401:2001•Regulation (EC)
No 2377/1999•HACCP• ISO 9001• ISO 14001•OHSAS 18001•The Food Safety
Act 1990
1. Volume of sales per person
2. Average growth in profits
3. Actual sales over forecasted sales
4. Total DanPer exports over total industry exports
5. Number of customer complaints (fresh or preserved products)
1. The first and third indicators assess the productivity of the sales function
2. The third indicator as-sesses the company’s profitability
3. The fourth indicator assesses Danper’s market share
4. The fifth indica-tor assesses the degree of customer dissatisfaction
Human resources
i. Recruitmentii. Salariesiii. Personnel
managementiv. Trainingv. Employees
and social programmes
•Transparency•Personnel
involvement and development
•SA 8000•OHSAS 18001• ISO 9001
1. Personnel enquiries : working environment
2. Number of employees or contract workers to the total number of personnel required on time
3. Salary increase4. Personnel improve-
ment (training)5. Retention of
employees
1. Measures personnel satisfaction
2. Measures the ef-ficiency of sourcing
3. Self-explanatory4. Measures invest-
ment in personnel improvement
5. Indirect measure of personnel satisfaction
Source : DanPer, ISO Methodology
Table 3 DanPer’s operational indicators
186 Economic benefits of standards
Selected business functions (BF)
Related activities Value drivers
Standards and regulations used
Operational indicators
Definition of the indicators
Produc-tion / operations
i. All activities
ii. Quality assurance
iii. Environmental conditions assurance
iv. HSE (health, safety and environment)
•Client focus
•Quality of pro-duction processes
•Quality of service
•Service efficiency
•NTP 011.109:2008
•NTP-ISO 2859-1:1999
•NTP ISO 9000:2007
• ISO 9001:2008
• ISO 14001:2004
• ISO 14004:2004
•GS1 : Global Traceability Conformance
•BASC
•DGAC
1. Average rating of qual-ity Inspectors
2. Microbiological contamination control in a controlled environment
3. Consumption of refrigerant
4. Percentage of deviations* from cargo handling
5. Percentage of dam-aged products received
1. Assesses fresh green asparagus products according to the categorization of NTP 011.109:2008
2. Monitors the refrigeration chambers to ensure that they remain within the set limits of microbiologi-cal contamination
3. Self-explanatory
4. Monitors the handling of cargos at FrioAereo’s facilities
5. Monitors the % of products arrived in unsuitable conditions
Post-service i. All activities
ii. Processing
iii. Quality assurance
iv. HSE (health, safety and environment)
•Quality of pro-duction processes
•Standardization
•NTP 011.109:2008
•NTP-ISO 2859-1.1999
•BASC
•DGAC
1. Percentage of cargo with temperature monitoring in platform or ramp
2. Percentage of com-plaints addressed
1. % of cargo with plotted (temperature) – when the cargo has left FrioAéreo’s warehouse, until it is uploaded onto the aircraft
2. Assesses customer satisfaction.
Note : (*) Anything that harms the customer’s property caused by improper handling of the product in the storehouse.
Source : FríoAéreo, FAO, O’Brien & Diaz, ISO Methodology.
Table 4 FríoAéreo’s operational indicators
Economic benefits of standards 187
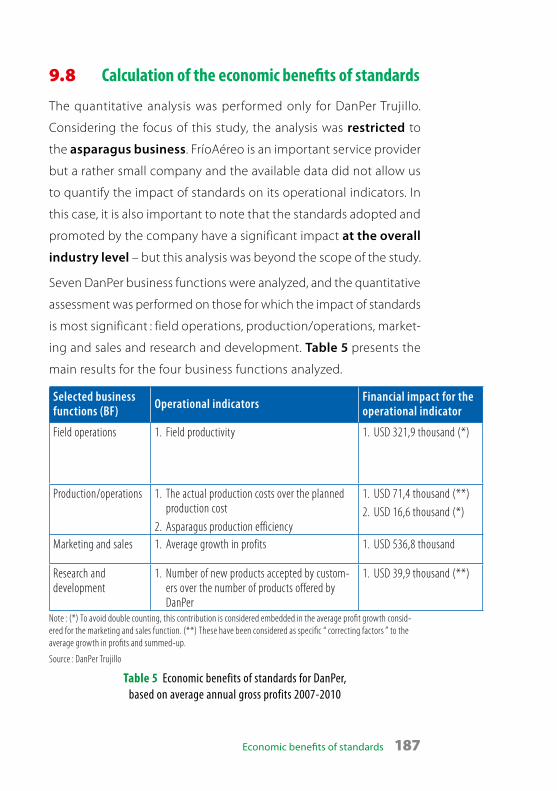
9.8 Calculation of the economic benefits of standards
The quantitative analysis was performed only for DanPer Trujillo.
Considering the focus of this study, the analysis was restricted to
the asparagus business. FríoAéreo is an important service provider
but a rather small company and the available data did not allow us
to quantify the impact of standards on its operational indicators. In
this case, it is also important to note that the standards adopted and
promoted by the company have a significant impact at the overall
industry level – but this analysis was beyond the scope of the study.
Seven DanPer business functions were analyzed, and the quantitative
assessment was performed on those for which the impact of standards
is most significant : field operations, production/operations, market-
ing and sales and research and development. Table 5 presents the
main results for the four business functions analyzed.
Selected business functions (BF) Operational indicators Financial impact for the
operational indicator
Field operations 1. Field productivity 1. USD 321,9 thousand (*)
Production/operations 1. The actual production costs over the planned production cost
2. Asparagus production efficiency
1. USD 71,4 thousand (**)2. USD 16,6 thousand (*)
Marketing and sales 1. Average growth in profits 1. USD 536,8 thousand
Research and development
1. Number of new products accepted by custom-ers over the number of products offered by DanPer
1. USD 39,9 thousand (**)
Note : (*) To avoid double counting, this contribution is considered embedded in the average profit growth consid-ered for the marketing and sales function. (**) These have been considered as specific “ correcting factors ” to the average growth in profits and summed-up.
Source : DanPer Trujillo
Table 5 Economic benefits of standards for DanPer, based on average annual gross profits 2007-2010
188 Economic benefits of standards
To support the quantitative analysis, and in particular the translation
of the operational indicators in financial metrics, the following as-
sumptions were made :
1. Sales and gross profit figures are always related to the total busi-
ness of the company14. As a consequence, when the analysis
focuses on indicators referring to specific product categories (e.g.
fresh or preserved asparagus), the estimated economic values
presented in Table 5, calculated as the % of the total business
derived from the selected categories, should be considered as a
close approximation of the actual economic benefits of standards.
2. The annual average gross profit for the period 2007-2010, 23,6 %,
was estimated on the basis of the average gross profits of competi-
tors comparable in size to DanPer15 (such as Agroindustrias AIB16
and Camposol17). It was also assumed that the total gross profits
was an average constant over the three years, corresponding to
USD 2 147,3 thousand per year.
The details of the assessment for the four selected business functions
are given below.
Field operations
Four key operational indicators (KOI) are considered for this business
function, but only one, field productivity, could be assessed (informa-
tion on other KOI’s was unavailable or not relevant).
14 The total turnover includes figures of sales data of asparagus, artichokes, peppers, and the
other products detailed by DanPer.
15 DanPer could not provide its average gross profits over the period in the time required.
16 The information was gathered from the financial accounts published on Conasev (Business
and Securities National Supervisory Commission of Peru). http://www.conasev.gob.pe/eeff/
eeff_x_empresa.asp
17 Camposol Holding Plc (2011) Fourth Quarter and Preliminary Full Year 2010 Results. http://hugin.
info/138464/R/1492669/428469.pdf
Economic benefits of standards 189
To avoid double counting, the contribution of increased field pro-
ductivity is considered embedded in the average growth of profits
calculated for the marketing and sales function. However, it is useful
to present the logical steps taken to perform the quantitative assess-
ment of field productivity :
1. The volume of asparagus harvested and ranked as top quality
(this is the only crop used for fresh products) increased from 1,2
MT in 2007 to 4,4 MT in 2010. A difference of 3,2 MT.
2. Taking into account that the utilization rate of raw material in
fresh products is about 70 %, the volume of products exported
amounted to 816,4 thousand kilograms in 2007 and 3 099,3 thou-
sand kilograms in 2010.
3. The sale price and product cost for fresh asparagus (exported)
was approximately USD 2,36 and USD 1,25 per kilogram in 2007
and USD 2,72 and USD 1,25 per kilogram in 2010.
4. Therefore, the income generated by the exports of those quan-
tities in 2007 and 2010 were USD 1 929 thousand (USD 2,36 X
816,4 thousand kg.) and USD 8 420 thousand (USD 2,72 X 3 099,3
thousand kg.), respectively. At the same time, the costs were
USD 1 458 thousand (USD 1,25 X 1,2 MT) in 2007 and USD 5 534
thousand in 2010 (USD 1,25 X 4,4 MT).
5. This represents a gross profit increase of USD 2 415 thousand for
the 2007-2010 period or, assuming, for simplicity, a linear growth
over the three years, an annual gross profit of USD 805 thousand.
6. According to DanPer managers, the use of standards in field
operations (notably NTP 209.402, NTP 011.109, HACCP, OHSAS
18001, SA 8000, and others) has been an important catalyst in
the improvement of the selected products harvested from com-
pany fields. Throughout the assessment process, it was estimated
that the use of standards contributed about 40 % to the results
190 Economic benefits of standards
indicated under step 5 : i.e. an average contribution of USD 321,9
thousand to the company’s annual gross profits.
Production/operations
Six KOIs were considered for this business function, but the quantita-
tive assessment was limited to two : the actual production costs over
the planned production cost and asparagus production efficiency (data
re : other KOI’s were unavailable or not relevant).
The quantitative assessment of actual production costs versus planned
production cost was conducted as follows :
1. The assessment covers the labour cost incurred in producing white
preserved asparagus for export. Planned and actual labour cost
for 2007 and 2010 are compared and reductions in the difference
between planned vs. actual are accounted as cost savings.
2. In 2007, the planned labour cost per worker was USD 0,32 per
kilogram with a resulting actual cost of USD 0,40 per kilogram.
In 2010, the planned and actual labour costs were USD 0,46 and
USD 0,53 per kilogram respectively.
3. The quantity of preserved asparagus exported in the analysis
period (2007 and 2010) was 21,5 MT and 17,1 MT.
4. Therefore, the actual labour cost exceeded the planned cost by
1 720 thousand USD in 2007 and by 1 197 thousand USD in 2010
(respectively, 25 % and 15,2 % of the planned costs). This represents
improved cost planning, with a decrease of the labour cost delta
of 523 thousand USD (2010 vs. 2007), or 174,3 thousand USD per
year. This figure is assumed as labour cost savings.
5. The use of standards (in particular ISO 9001 supporting a thorough
implementation of the continual improvement philosophy) has
significantly contributed to improve process efficiency. DanPer’s
management estimated that the implementation of standards

Economic benefits of standards 191
contributed 40 % to the results indicated under item 4 – that
is, an average annual cost saving of USD 71,4 thousand (40 % of
178,4 thousand USD).
The assessment of the KOI asparagus production efficiency is consid-
ered embedded in the average growth of profits calculated for the
marketing and sales function. More details on this assessment can
be found in the full report.
Marketing and sales
DanPer exports nearly all of its products (75 % of total production
is exported to the USA and Europe). These target markets, and the
buyers serving them, are very demanding in terms of safety, trace-
ability and quality requirements.
Many customers (notably large department store chains) demand
certifications against several standards – in these cases, certification
is almost “ mandatory ” in winning contracts. However, even for those
customers who do not directly request certification, commitment
to standards and certification strongly support the image of, and
confidence in, the company, making it easier to reach contractual
agreements.
Five KOIs are considered for this business function, but the quantita-
tive assessment was limited to one : average growth in profits (data re
other KOIs were unavailable or not relevant). The assessment for this
KOI was conducted as follows :
1. The total company sales increased from USD 62 340 thousand in
2007 to USD 89 610 thousand in 2010. This represents a USD 27 270
thousand difference.
2. Assuming a linear growth over the three years, this represents an
average annual sales increase of USD 9 090 thousand. Consider-
ing the average gross profits for the period (23,6 %), this gives an

192 Economic benefits of standards
annual gross profit average of USD 2 147,3 thousand per year.
Asparagus exports account for approximately 50 % of that amount,
i.e. USD 1 073,7 thousand.
As noted above, compliance with regulations (relevant to export markets),
and certifications and extensive use of standards (e.g. ISO 9001, OHSAS
18001, HACCP, Global GAP, Regulation (EC) No 2377/1999, Ethical
Trading Initiative – ETI, etc.) are considered a critical factor in DanPer’s
sales growth. DanPer’s management estimated that certifications and
implementation of standards contributed to increased sales in about
50 % of cases. This translates to a contribution to average annual
gross profit of USD 536,8 thousand (50 % of USD 1 073,7 thousand).
Research and development
The use of standards by this business function has had a seminal
impact, supporting the conception of new ways to improve pro-
duction processes or to create new product lines. In addition, using
standards has made it easier to design new products according to
international requirements and/or to adapt products to customer
requirements in a shorter time.
Of the five KOIs identified for this business function, only one could
be assessed, number of new products accepted by customers over the
number of products offered by DanPer. The assessment was conducted
as indicated below :
1. The overall sales value of new products in 2007 was only USD 17 035,
but reached USD 1 031,5 thousand in 2010. An increase of
USD 1 014,5 thousand or, assuming a linear growth, an annual
increase of USD 338,2 thousand.
2. Based on the average gross profit margin (23,6 %) this represents
an annual contribution of USD 79,9 thousand to the total com-
pany gross-profit.
Economic benefits of standards 193
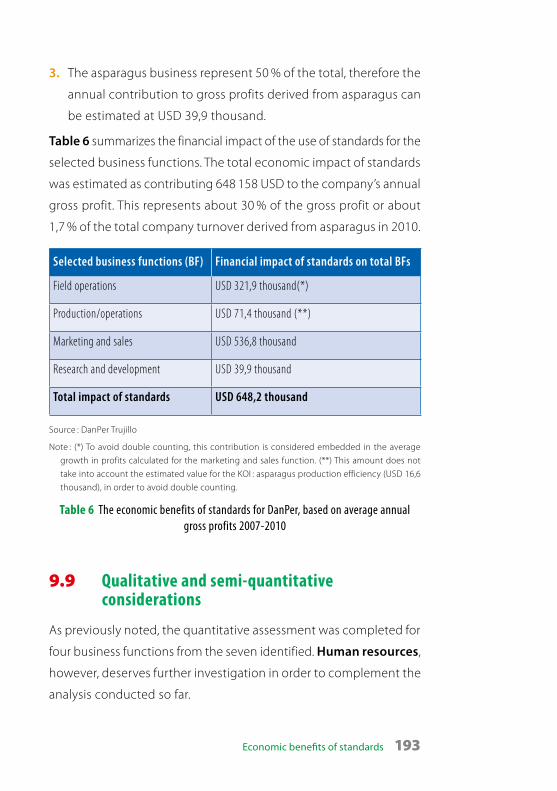
3. The asparagus business represent 50 % of the total, therefore the
annual contribution to gross profits derived from asparagus can
be estimated at USD 39,9 thousand.
Table 6 summarizes the financial impact of the use of standards for the
selected business functions. The total economic impact of standards
was estimated as contributing 648 158 USD to the company’s annual
gross profit. This represents about 30 % of the gross profit or about
1,7 % of the total company turnover derived from asparagus in 2010.
Selected business functions (BF) Financial impact of standards on total BFs
Field operations USD 321,9 thousand(*)
Production/operations USD 71,4 thousand (**)
Marketing and sales USD 536,8 thousand
Research and development USD 39,9 thousand
Total impact of standards USD 648,2 thousand
Source : DanPer Trujillo
Note : (*) To avoid double counting, this contribution is considered embedded in the average
growth in profits calculated for the marketing and sales function. (**) This amount does not
take into account the estimated value for the KOI : asparagus production efficiency (USD 16,6
thousand), in order to avoid double counting.
Table 6 The economic benefits of standards for DanPer, based on average annual gross profits 2007-2010
9.9 Qualitative and semi-quantitative considerations
As previously noted, the quantitative assessment was completed for
four business functions from the seven identified. Human resources,
however, deserves further investigation in order to complement the
analysis conducted so far.

194 Economic benefits of standards
DanPer’s awareness of, and commitment to, social responsibility is an
important factor contributing to its success. This highlights its influ-
ence on employee performance, and an attitude that is considered
very positively by buyers (in support of their own supply chain ac-
countability, and as further proof of the company’s seriousness and
qualification). Considering DanPer’s attitude on standards, and its use
of standards in the social responsibility area (e.g. OHSAS 18001), an
attempt was also made to assess the impact of standards on human
resource activities.
Five KOIs were identified (see Table 3), however the lack of specific
data did not allow us to perform the assessment. For example, in the
case of “ personnel enquiries ” (concerning the working environment),
DanPer has recently implemented an employee survey, but there is
no reference to historical data to evaluate changes. In the case of
“ personnel improvement ” (training), the use of standards may have
a direct impact as a means of facilitating transfer of information and
knowledge, but no relevant data were found. No direct correlation
between the application of standards and KOIs such as “ salary in-
crease ” or “ retention of employees18 ” was identified.
However, the company management is well aware of the importance
of fair personnel practices and social matters. This attitude seems to
have contributed significantly to the involvement and motivation
of employees in supporting the effective and rapid implementation
of standards, the benefits of which are reflected in the company’s
rapid growth.
18 The strong agricultural growth in the north of Peru is leading to a demand for more workers.
As a result, the hiring process has become complicated for companies in a job market with
inadequate qualified labour, especially during the high season.
Economic benefits of standards 195
Procurement and logistics is another business function critical
to the production process. Although this function does not base
its activities directly on standards, it does so indirectly through the
specifications provided by other departments that extensively ap-
ply standards in their processes. A more extensive application of
standards by this business function could improve, for example, its
purchase programme to achieve further cost savings and strengthen
its partnership with suppliers.
Within the field operation business function, the KOI quality of the
harvested crops was not assessed, because we were not able to find
a way to quantify the extra value derived from top quality products,
and avoid double counting with other KOIs in the marketing and sales
function. However, DanPer’s management indicated that the imple-
mentation of standards has also contributed to a significant increase
in the percentage of asparagus ranked as “ top quality product ”, from
31,5 % of the total in 2007 to 45,4 % in 2010.
Finally, it is important to emphasise that DanPer has been able to
grow faster than the sector. Its share of Peru’s asparagus exports
increased from 8.5 % in 2007 to 9.5 % in 2010. The company’s man-
agement believes that standards, and its attitude to standards, have
contributed significantly to its success. As a result, it seems reason-
able to conclude that the value of standards to DanPer exceeds the
figures given in Table 6.
However, while the implementation of standards has contributed to
DanPer’s performance and impressive growth, it is also important to
consider that this has primarily been led by the expansion of global de-
mand and the existence of Free Trade Agreements – factors that cannot
be isolated from the pure impact of the use of standards.
196 Economic benefits of standards
9.10 ConclusionsDanPer has been active in the market for nearly 17 years, and has
implemented key standards such as NTP 011.109, NTP 011.116, NTP
209.401, ISO 9001, GlobalGAP, USGAP, OHSAS 18001, and HACCP since
2004. Not all its business functions apply standards, but the company
intends to further expand their application in future.
The economic value of standards shown in Table 6 provides an esti-
mate of the company’s asparagus business. Extending the analysis to
the full range of DanPer’s agricultural products (including artichokes,
pepper, beans and fruits) would certainly increase the figures in
the table. It is also likely that standards have an impact on some of
the operational indicators that could not be quantified during the
assessment.
According to DanPer’s managers, standards play an essential role.
They continue to facilitate access to markets and new customers.
As analyzed in this study, this contribution generates substantial
economic value. In addition, standards have been valuable tools in
helping DanPer to improve its production processes and activities
in several areas.
Although the methodology was fully applied to only one (leading)
company, and in qualitative terms to another key player of the sector,
the results enable us to consider the reality that standards create value.
In future it would be worthwhile considering application of the
methodology to the whole asparagus sector or even to the total
Peruvian agro-export industry.
Many small to medium enterprises operate in these industries and
follow the steps undertaken by larger companies. In a broad sense,
the implementation of standards is contributing to a change in the
landscape of the sector, and this is reflected in improved competi-

Economic benefits of standards 197
tiveness, technology transfer, high employment, process improve-
ments, access to markets and the growing interest of new investors
and customers.

Related Documents