SAP Business Information Warehouse (BW) Dipl. Inform. Marco Pesarese SAP AG

BW- sap AG ppt
Jan 01, 2016
BW- sap AG ppt
Welcome message from author
This document is posted to help you gain knowledge. Please leave a comment to let me know what you think about it! Share it to your friends and learn new things together.
Transcript

SAP Business Information Warehouse (BW)
Dipl. Inform. Marco Pesarese
SAP AG

© SAP AG 2003, Title of Presentation, Speaker Name / 2
Content
Introduction: The SAP company and the SAP Business Information Warehouse
From Oltp to Olap
Dimensional Modelling
Data staging
Data analyzing
BW development process

© SAP AG 2003, Title of Presentation, Speaker Name / 3
The SAP company
SAP AG in 2002 revenues: € 7.4 billion60,100 installations19,300 companies run SAPProviding 23 Industry Solutions 28,654 SAP employees (March 2003)
12 million users in 120+ countries team with us toIntegrate their business processesExtend their competitive capabilities Get a better return on information at a lower total cost of ownership
Unique Partner EcosystemMore than 1,500 partnersOverall more than 120,000 SAP partner certificates

© SAP AG 2003, Title of Presentation, Speaker Name / 4
SAP Milestones over 30 Years
mySAP.comOne-Step-Business
6,265 bill. € Revenue25,000Employees15,000 Customersin 120 Countries
R/10.3 mill. € Revenue9 Employees
R/2Mainframe
5.1 mill. € Revenue60 Employees50 Customersin 2 Countries
R/3Client/Server
424 mill. € Revenue3,200 Employees2,800 Customers in 35 Countries
mySAPBusiness SuiteSAP NetWeaverESA
7.4 bill. € Revenue28,654 Employees19,300 Customersin 120+ Countries
1999/20001972 1979 1992 2002/2003

© SAP AG 2003, Title of Presentation, Speaker Name / 5
SAP 1990-2002Million € Employees
1.000
2.000
3.000
4.000
5.000
6.000
7.000
8.000
5.000
10.000
15.000
20.000
25.000
30.000
255 362 425 563 9361.379
1.903
3.022
4.316
5.110
6.266
7.341
053 88 76 116 230 333
482775 901 796 803
1.312
0
2.138 2.685 3.1573.648
5.2296.857
9.202
12.856
19.30820.975
24.178
28.410Revenue
Profit
Employees
28,797
1,626
7,413
1990 1991 1992 1993 1994 1995 1996 1997 1998 1999 2000 2001 2002

© SAP AG 2003, Title of Presentation, Speaker Name / 6
Global and Local Customers - A Selection

© SAP AG 2003, Title of Presentation, Speaker Name / 7
SAP Product Portfolio
SAP NetWeaver
SAP for <Industry>
SAP xApps
SAP xApp Resource & Program Mgmt
SAP xApp Product Definition
SAP xApp Mergers & Acquisitions
...
PackagedSolutions
Service Management for <Industry>Financial Insights for <Industry>
...
SAP for Aerospace & DefenseSAP for Automotive
...
mySAP Business Suite
mySAP ERP
mySAP Financials
mySAP HR
mySAP CRM
mySAP SCM
mySAP SRM
mySAP PLM
mySAP EnterprisePortal
mySAP Business Intelligence
mySAP Marketplace
SAP R/3 Enterprise*
mySAP All-in-One
SAP Solutions forSmall & MidsizeBusiness
SAP Business One
SAP Enterprise PortalSAP Master Data Mgmt
SAP Business IntelligenceSAP Mobile Infrastructure
SAP Exchange InfrastructureSAP Web Application Server
Industry-SpecificApplications
Entry Data RepositoryInvoice and Contract Accounting
...
...
* for installed base customers

© SAP AG 2003, Title of Presentation, Speaker Name / 8
DW Analytic Scenarios: Some examples

© SAP AG 2003, Title of Presentation, Speaker Name / 9
Business-Reporting

© SAP AG 2003, Title of Presentation, Speaker Name / 10
Report History at SAP
Roots go back to operational reporting for 30 years.
Application-specific operational reporting: Abap-programs itself were called „reports“: ~ 20.000 programs for reporting purposes.
Four generic tools developed over time:
1. SAP Query: Generation of Abap-programs. Limited sort, no olap.
2. Report-writer: FICO, Print-layout driven financial reports. Separation query definition from execution. Hierarchy support.
3. Recherche/EIS: CO, Profitability & Analysis Mini Olap with cube-alike structures. „Aspects“ & generic datastructures.
4. LIS: Logistic Information System. Data staging tools.

© SAP AG 2003, Title of Presentation, Speaker Name / 11
Report History at SAP: The Birth of BW
Winter 1996: Video-Conference with Hasso „Reporting server“ with Excel frontend.
Late summer 1997: BW 1.0. 19 developer (Walldorf). 5 pilot-customer.
2003: BW 3.x. 70 developer (Walldorf, Palo Alto, Australia, Bangalore), growing to more than 100 this year. > 6500 installations: One of the most successfull DW products in the market
Complete tool suite: Data warehouse, SAP content, olap processor, frontend reporting with Excel & web, Web Application Designer, Query Designer.
BW was the first system outside of R/3 „Light“ installation with only ~12GB.

© SAP AG 2003, Title of Presentation, Speaker Name / 12
Operational and Analysis Support
Operational Support
Details.
Current data with minimal history.
Changes triggered by events.
Minimal integration with other systems.
High normalization (for transactional integrity).
Analysis Support
Often aggregated data.
Comprehensive history needed.
Fixed from a specific point in time.
Maximum Integration with data from other systems.
Read-Only (no transactions).

© SAP AG 2003, Title of Presentation, Speaker Name / 13
Operational and Analysis Systems
Operational Systems
Complex, redundancy-free ER models for every business case.
Highly specialized programs.
Analysis Systems
One model for everything.
One set of analyzing tools for all kind of data.
Performance is more important than redundancy-free.
Massive data amount: Typical size between 100 Mbyte and 5 Tbyte.

© SAP AG 2003, Title of Presentation, Speaker Name / 14
Why it came that way?
Over the years, software system became bigger and more complex and the amount of data grew.
ER models for enterprise business scale have hundreds of logicalentries (e.g., SAP has more than 15.000 tables for R/3), which are linked together.
Millions of transactions per month made it more and more time consuming to get the data out of the system – especially, when transactions are still ongoing.

© SAP AG 2003, Title of Presentation, Speaker Name / 15
Solutions needed
Three core problems can be seen for reporting in the operational system:
a) Difficult navigation.
b) Performance.
c) Data-merge with other applications.
Part of the solution was to move all data from the transactionalsystem to a separate system, which is optimized for analysis purpose (users don‘t do transactions.)

© SAP AG 2003, Title of Presentation, Speaker Name / 16
The far side...
Centaurus A Jet (Cen A, NGC 5128): The jet originates from the vicinity of the supermassive black hole at the center of the galaxy (lower right hand corner of the image).

© SAP AG 2003, Title of Presentation, Speaker Name / 17
Transition to Dimensional Modelling
The technical aspects of operational systems became a showstopper, too:
End users can neither understand nor navigate ER models.
There is no software to usefully query a general ER model.
Low performance: Cost based optimizers are notorious to make the wrong choices (with destastrous consequences for performance).
It came out in practical work on designing databases, that thereis no optimum for best transactional design and performance.
In the middle of the 90‘s, an alternative modelling approach forhigh performance and simple navigation feature design came to life: Dimensional Modelling.

© SAP AG 2003, Title of Presentation, Speaker Name / 18
ER database design
A database should represent the current state of the real world.The world keeps changing need for state-updates.
To avoid update-inconsistencies, the ACID principle is used together with a db schema, which keeps redundancies away:
Normalized ER-models.

© SAP AG 2003, Title of Presentation, Speaker Name / 19
The Star-Schema approach
In dimensional modelling, we have facts (one big table) surrounded by dimensions (several small tables).
The fact-table has a multi-part key corresponding exactly to the single-part primary key in the dimension tables.
(In implementations, very often surrogate keys are used).
This is called the „star“-structure.
By modelling data in this way, you cannot avoid redundancy, but every kind of model in the star can be navigated in similar way and is very fast accessable.

© SAP AG 2003, Title of Presentation, Speaker Name / 20
Facts
Beside the keys, the fact table also contains numerical values (the measures): together this is called a fact.
The measures worth to analyze: An olap-engine selects and aggregates these values and delivers a multi-dimensional resultset.
Typical aggregation for all dimensions: Summation.
Exception aggregation (e.g. for time): Take last entry, average,etc.

© SAP AG 2003, Title of Presentation, Speaker Name / 21
In other words...
Dimensions answer the questions: „Who?“ „What?“ „When?“
Measures answer: „How much?“
© SAP AG 2003, Title of Presentation, Speaker Name / 22
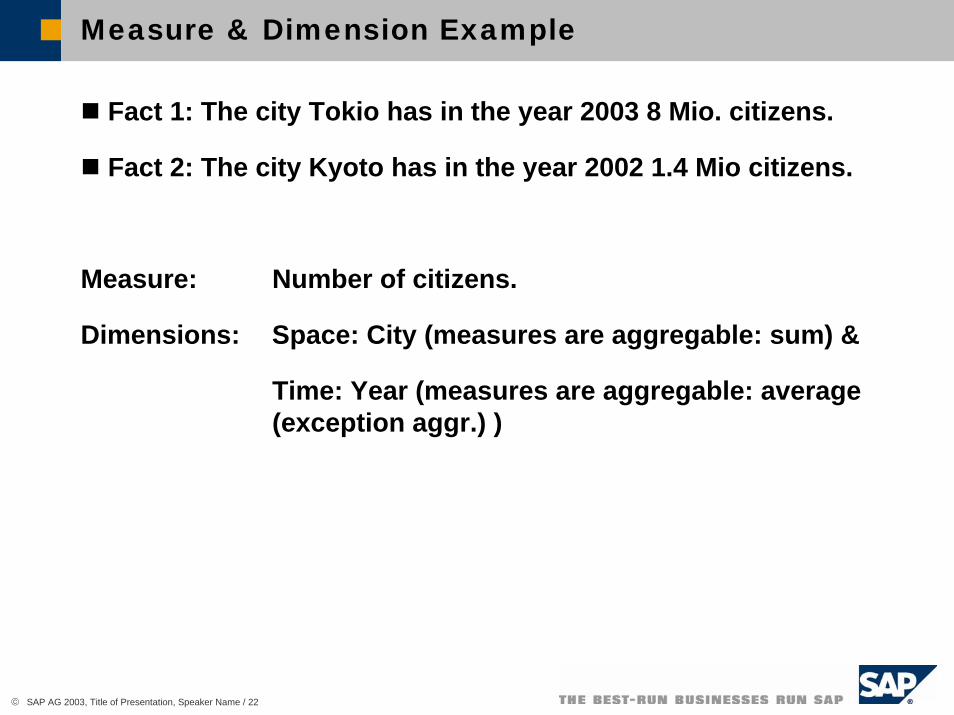
Measure & Dimension Example
Fact 1: The city Tokio has in the year 2003 8 Mio. citizens.
Fact 2: The city Kyoto has in the year 2002 1.4 Mio citizens.
Measure: Number of citizens.
Dimensions: Space: City (measures are aggregable: sum) &
Time: Year (measures are aggregable: average (exception aggr.) )

© SAP AG 2003, Title of Presentation, Speaker Name / 23
Cube of a three-dimensional data structure

© SAP AG 2003, Title of Presentation, Speaker Name / 24
ER to Dimensional Model (DM) conversion
Connection between DM and ER: An ER diagram breaks down into several DM diagrams. DM has „business rules“, ER „data rules“.
Conversion steps:
1. Separate the ER diagram into discrete business processes. Model each one alone.
2. Select m:n relations in the ER model containing numeric and additive nonkey facts: This will be the fact tables.
3. Denormalize the remaining tables into flat tables with single-part key that connects directly to the fact table: This will be the dimensions tables.

© SAP AG 2003, Title of Presentation, Speaker Name / 25
ER to DM example

© SAP AG 2003, Title of Presentation, Speaker Name / 26
Strengths of DM
Arguments for DM in the reporting area:
Tools can make strong assumptions about the dimensional model (it is a predictable, standard framework)
It withstands unexpected changes in user behaviour.
Use of aggregates for performance-tuning.
Gracefully extensible to accomodate unexpected new data and new design desicions (e.g. adding new data columns, no data reloading. Old applications can still run).
In the business world, there is a body of standard approaches for handling common modelling situations in the business world.

© SAP AG 2003, Title of Presentation, Speaker Name / 27
Problems of the Star-Schema
For business scenarios there are some problems with the classical star-schema, e.g.:
Only max. 16 keys available for a table (covering all databases)
Although most business master data is used by several business processes, the star-schema needs to replicate all of it.
No multilingual description for the dimension-attributes
With changes of dimension-attributes over time, there is no way to take care of the old and new one values for the attributes.
All hierarchy-relations need to be modelled as attributes of a dimensiontable (in the classical approach). Beside this, some hierarchy types are not possible.

© SAP AG 2003, Title of Presentation, Speaker Name / 28
Snowflake
Snowflaking is the removal of low-cardinality attributes from dimension tables and the placement of these attributes in „secondary“ dimension tables.

© SAP AG 2003, Title of Presentation, Speaker Name / 29
BW: Something in between Star and Snowflake
1. Cluster dimensions together to have the limited-keys problem solved new table between facts and dimensions (unfortunatelly, this table is called in BW the dimensions-“D“-table)
2. Do „sidding“ of all dimension-members: No alphanumerical keys used anymore („S“-Table), replaced by surrogate ids. Needed for performance in the olap engine & simplier programming with unified structures.
3. Masterdata sharing.
4. Separate navigation from display attributes, which are used after the olap task. Cluster them into Time-depended and independed attributes: „X“, „Y“, „P“ and „Q“ tables.

© SAP AG 2003, Title of Presentation, Speaker Name / 30
InfoCube Snowflake Schema
Fact Dim
Using of DB specific features (indices, partitioning, joins,…)
Fact table
Dimension tables
Time independent characteristic values with attributesTime dependent characteristic values with attributesCharacteristic values
Attributes/hierarchies (external)

© SAP AG 2003, Title of Presentation, Speaker Name / 31
Hierarchies
Hierarchies can be modelled through dimension layout or through hierarchies on dimensions. More than one hierarchy per dimensionpossible (external hierarchies).
Hierarchies can model dimension-members on several locations, including links: More a network than a tree. Problem for the olap-engine: Aggregation should still be valid for the merging nodes.
Hierarchies can be time-/version-depended: They change during a period of time, but user expects correct merge.
Nodes can have values (e.g. costcenter).

© SAP AG 2003, Title of Presentation, Speaker Name / 32
SAP Business Warehouse: Architecture

© SAP AG 2003, Title of Presentation, Speaker Name / 33
Business Modeling
Data Flow TransparencyApplied Business StructureData Model TransparencyAutomated Administration
Hierarchies
DataModelData Flow
Process Chain
(Error-processing)
© SAP AG 2003, Title of Presentation, Speaker Name / 34
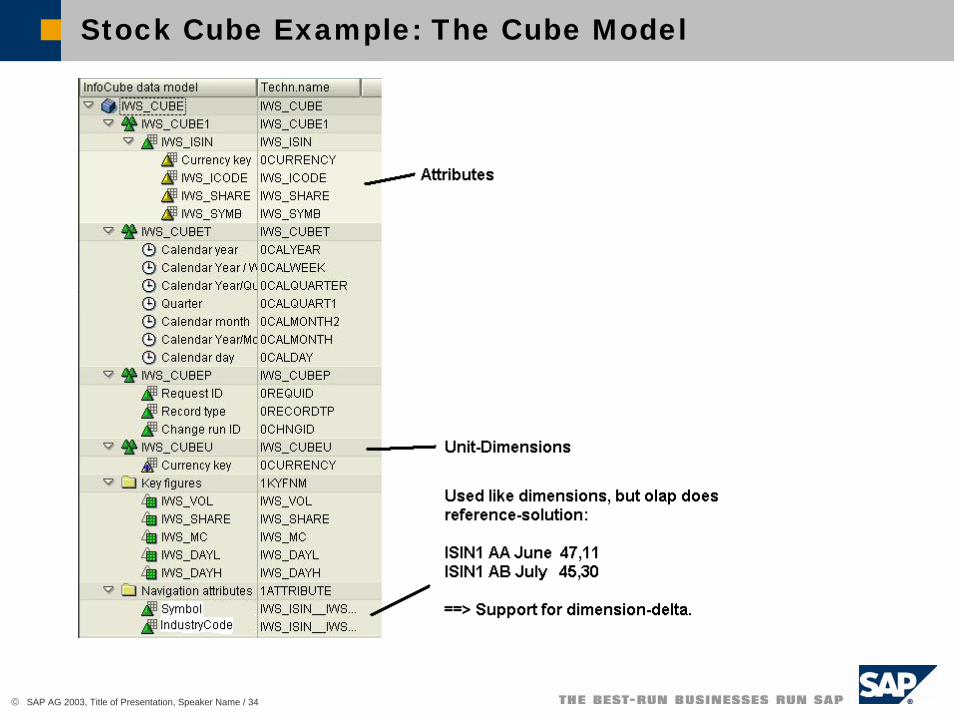
Stock Cube Example: The Cube Model

© SAP AG 2003, Title of Presentation, Speaker Name / 35
Staging
Staging is critical task: Procedure, if loading fails somewhere in the middle? Is there time enough to load while the oltp is going on with it‘s work?
Trade-off between number of aggregates & loadingtime!
Requirements: Delta-Update, Recovery & Consolidation of keys from different systems.
Several steps until data are in the cubes:
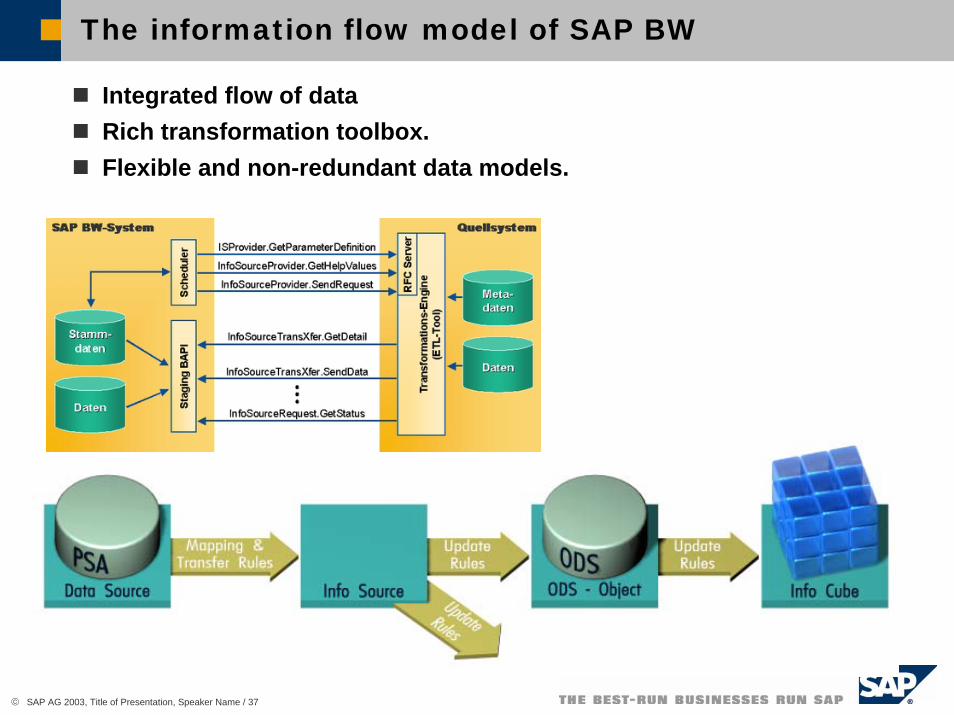
Raw-Data loading into PSA (persistent staging area).
Transfer-Rules clean the data and convert them into the correct format (e.g. number of leading zeros in customer id etc.)
Update rules apply these data for ODS (Operational Data Storage) or cubes.

© SAP AG 2003, Title of Presentation, Speaker Name / 36
Extraction, Transformation and Loading
AnwendungsspezifischAnwendungsspezifisch
ExtraktortypenExtraktortypen
Business ContentBusiness Content--ExtraktorenExtraktoren
AnwendungsunabhAnwendungsunabhängigängig
GenerischeGenerischeExtraktorenExtraktoren
KundendeKundendefiniertefinierteExtraktorenExtraktoren ((generischgenerisch))
Anwendungs-spezifischeDB-Tabellen
LIS
FI-SL
CO-PA
DB-/Tab./View
Funktions-baustein
FICOHR
SAP CRMLO Cockpit
Anwendungs-spezifischeDB-Tabellen
VerschiedeneSAP-
DB-Tabellen
InfoSet
Open for any sourceFlexible set of ETL capabilitiesIntegration to mySAP.com on application levelOpen to third-party toolsSupport of open standards
© SAP AG 2003, Title of Presentation, Speaker Name / 37
The information flow model of SAP BW
Integrated flow of dataRich transformation toolbox. Flexible and non-redundant data models.

© SAP AG 2003, Title of Presentation, Speaker Name / 38
Stock Cube Example: Data Loading
• WebService: Getting the stock price information
• PSA + ODS
• Activating
• Applying the generated transactions to the cube.

© SAP AG 2003, Title of Presentation, Speaker Name / 39
Stock Cube Example: Data Loading
Data is loaded from a WebService into the PSA, from where it goes via a transformation rule into the ODS.
Why not directly into the Cube?
Because we need to have some delta-handling:
In ODS we can define what a key is and what not, whereas in the cube everything is a key (request-number!).
Writing into ODS and then activating the delta generates two entries for the Cube:
- Minus old entry (do not delete)
- Plus new entry
Moving from F-Fact-Table into E-Fact-Table delete the null-entries
(removing the request number).

© SAP AG 2003, Title of Presentation, Speaker Name / 40
OLAP ArchitectureD
ata
Acq
uisi
tion
Com
mon
Rea
d / W
rite
Inte
rfac
e
Ope
n In
terf
ace
and
Web
Ser
vice
s
USE
R In
tera
ctio
n
AccessAccess Business LogicBusiness Logic PresentationPresentation
Database & Storage Analytical Functionality Navigation
Summarized, Dimensional data
OLAP EngineOLAP Engine BI Suite BI Suite
Granular, volatile dataODSODS
RDBMS•Data Partitioning•Indexing•Parallel Querying
Master Data
Drill-Down, Drill-Thru, Drill-AcrossPivotingWhat IfSlice and DiceGallery of ready-to-use Web Templates / Items
Table, ChartMapAlert MonitorContext Menu
Business CalculationsForecastsException ScanningAlertingQuery Pre-CalculationCachingBackground PrintingData Mining Algorithms

© SAP AG 2003, Title of Presentation, Speaker Name / 41
Olap-Analytics
Data is inside cubes Execute a query and render the resultset.
The core of every DW is the OLAP (OnLine Analytic Processor, E.F. Codd 1993) engine: It selects and aggregats the data.
Main difficulties:
Performance („keep a request always under 4 seconds“).
Optimize for business questions („currency conversion“, „elimination of int. business vol.“, „time-depended hierarchies“, „top n“, „conditions“, „planed-current-comparison“...)
SAP‘s olap engine is much more than what is defined in the literature about olap: Generalize the very different report-requirements in business.

© SAP AG 2003, Title of Presentation, Speaker Name / 42
OLAP-Functions
Navigation: Dice, Drill-down/up,Swap
Filter: Restrict (slice) characteristics to selections
Aggregation: Std: Key figure-dependant calculation formula for the aggregation of single result values. Others: Excp, Local.
Layout: Characteristics, results rows, hierarchy node position
Exception & Condition: Result-dependant selection and layout
Structuring: Hierarchical layout of characteristic values
Generic analysis functions: Formulas, Currency Transl., Elimination of Internal Business Volume, Sorting
Concepts for optimizing runtime: Aggregates, Olap-Cache
Integrated additional functions: Variables, Authorization, …

© SAP AG 2003, Title of Presentation, Speaker Name / 43
Aggregation
1. Standard aggregation is executed first. This can be set in the key figure definition. Possible types of aggregation are summation (SUM), minimum (MIN), and maximum (MAX). Minimum and maximum can be set, for example, for date key figures.
2. The aggregation of a selected characteristic takes place after the standard aggregation (exception aggregation). Possible exception aggregations available are average, counter, first value, last value, minimum, maximum, no aggregation, standard deviation, summation and variance. Cases where exception aggregation would be applied include, for example, storage non-cumulatives that cannot be summed by time, or counters that count the number of characteristics for a particular characteristic. Performance-critical: No aggregates are possible for exception-aggregation!
3. Aggregation by currency and units is executed last. If two figures are aggregated unequally with different currencies or units, the system marks this with ‘*’.
Formulas are only calculated after figures have been fully aggregated (with few exceptions like currency translation)

© SAP AG 2003, Title of Presentation, Speaker Name / 44
Performance-Issues
Access to data: Sum 100 Mbyte to one number and do this for several possible dimension-views. The result should be there in 1 - 4 seconds. Be scalable: Do a query over 2 Tbyte in the same time...
Solution: Pre-aggregate over all typical dimensions and view-states. Monitor, which queries are running and how long do they take to select good aggregates.

© SAP AG 2003, Title of Presentation, Speaker Name / 45
Designing a query
Every query can be seen as the combination of two entities:
1. A structural description of what should be seen (data-selection). This creates a new virtual cube.
2. A view which describes the layout of the resultset.

© SAP AG 2003, Title of Presentation, Speaker Name / 46
Designing a query
Dimensions are moved to different axes: Row, column, free, filter.
Filter-axis: The settings here cannot be changed during runtime (e.g., the user should see only his department).
Free-axis: Not inside the first runtime view, but can easiely be moved in by the user.
Only dimensions, no structures No cells!
At least one structure with measures needed, but maximum two structures (on different axis) One has selections/formulas.
Exception: Structure on filter-axis.
Two structures on two axes: Intersections can be used for so called „cell calculations“: Customers use this feature to implement special report numbers.
Modelling reuseable elements like calculated measures or structures.
Variables help to customize the filters at a dimension.

© SAP AG 2003, Title of Presentation, Speaker Name / 47
Stock Cube Example: A Query Definition

© SAP AG 2003, Title of Presentation, Speaker Name / 48
Executed Query in the Web as Pivot-Table

© SAP AG 2003, Title of Presentation, Speaker Name / 49
Analyze
Drill up/down/into into a dimension
Exchange dimensions in the view: Move their position on the axis, move to another axis (also free-axis moving it out).
Hierarchy navigation.
Filter on dimensions: Select members.
Sort (not breaking the hierarchies).
Define exceptions („traffic lights“) on the data.
Define conditions: Manipulate resultset by looking at the cell data.

© SAP AG 2003, Title of Presentation, Speaker Name / 50
Analyze: Cube View

© SAP AG 2003, Title of Presentation, Speaker Name / 51
Misc issues regarding queries
Technical names are used beside the internal id and description.
The internal id is not readable and recognizable for people, andthe description is language-dependend Problem in multinational companies and for debugging.

© SAP AG 2003, Title of Presentation, Speaker Name / 52
Web Application Framework
BEx Analyzer /Query Designer
BEx Web ApplicationDesigner
Web Design Tool (option)
OLAP ProcessorOLAP Processor
Web ServiceWeb Service
Charting EngineCharting Engine
Web Browser
HTLM Templates InfoProvider
BW Serverwith
SAP Web AS

© SAP AG 2003, Title of Presentation, Speaker Name / 53
SAP Business Warehouse: A usage scenario
© SAP AG 2003, Title of Presentation, Speaker Name / 54
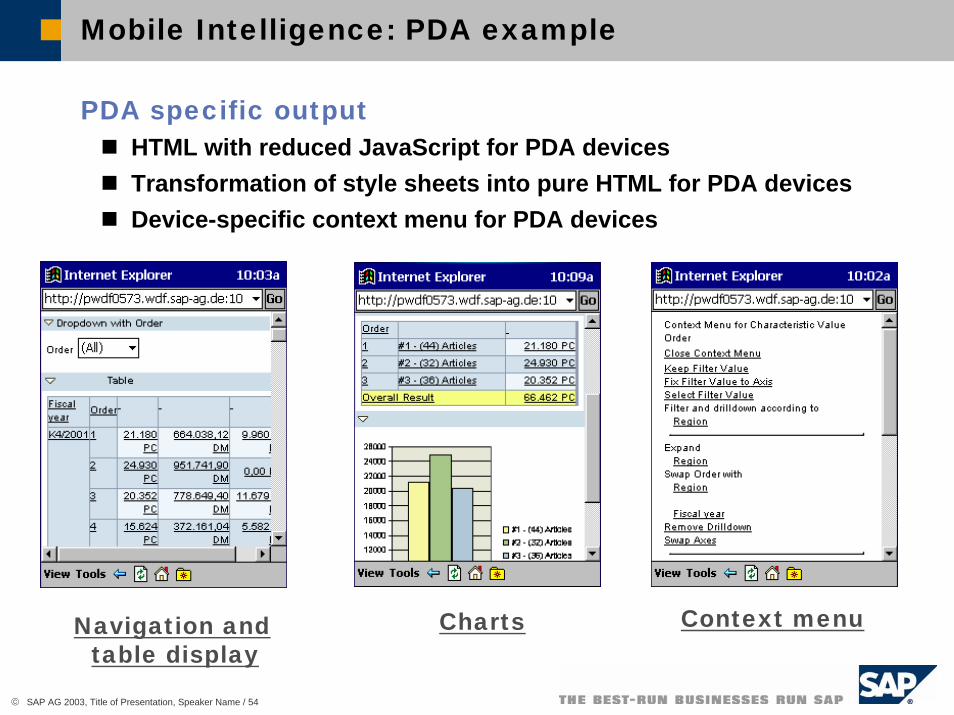
Mobile Intelligence: PDA example
PDA specific outputHTML with reduced JavaScript for PDA devicesTransformation of style sheets into pure HTML for PDA devicesDevice-specific context menu for PDA devices
Context menuChartsNavigation and table display

© SAP AG 2003, Title of Presentation, Speaker Name / 55
Geocoding
Dimensions can have geo-coding attributes Align data into maps.

© SAP AG 2003, Title of Presentation, Speaker Name / 56
SAP BW - Business Explorer
AUTHORS ANDANALYSTS
EXECUTIVES ANDKNOWLEDGE WORKERS
INFORMATIONCONSUMERS
BUSINESS INTELLIGENCE USERS
BUSINESS INTELLIGENCE SUITE
QueryDesign
Web Application
Design
AUTHORING
REPORTING & ANALYSIS
DEPLOYMENTEnterprise
Portal Web
Desktop Mobile
DataMining
Ad-hoc Query
OLAPAnalysis
Dash-boards
TabularReports
FormattedReports

© SAP AG 2003, Title of Presentation, Speaker Name / 57
BW: Central Tool Inside SAP Applications

© SAP AG 2003, Title of Presentation, Speaker Name / 58
Perspective of data warehouses
More than just only enterprise business...

© SAP AG 2003, Title of Presentation, Speaker Name / 59
BW Development-Process
Role-in: Customers, customer-community (ASUG etc.), other SAP groups.
The art of generalizing highly different business-requirements.
SAP is a product-company: How to develop something new and still be compatible to the old systems. Difficult to develop „out of context“. Maintaining old systems is an integral part of the day-by-day work.

© SAP AG 2003, Title of Presentation, Speaker Name / 60
Development-Process: People
Two career-paths: Manager or Architect.
All (even senior-) architects and some managers are still coding.
Many nature-scientists.
Stable environment; company takes care of people by giving many (social) benefits.

© SAP AG 2003, Title of Presentation, Speaker Name / 61
Distributed development
Walldorf
Palo Alto
Sofia
Tel-Aviv
Bangalore
Sydney
Sometimes difficult to find meeting-time convenient for everyone ;-)

© SAP AG 2003, Title of Presentation, Speaker Name / 62
Our environment
Quiet environment with max. four people per office.
Much freedom to optimize workspace.
Work from home possible (internet-vpn).
Coffee-corners (often used for ad-hoc meetings).
Casual wear (Birkenstock...)
Free lunch.
(„... will work for bandwidth...“)

© SAP AG 2003, Title of Presentation, Speaker Name / 63
Development tools
Java: Perforce & Eclipse. Basis delivers it‘s own Eclipse distribution with SAP specific plugins.
Abap: Central development server Consolidationsystem Quality server.
Abap language is better than it‘s image: Optimized for large-scale database-development and complex structures. It is fast and highly scalable. Remote-debugging and tracing are said to be one of the most important success-secrets of SAP.
The R/3 basis system transports not only coding but also database changes.

© SAP AG 2003, Title of Presentation, Speaker Name / 64
Support for customers: Support Packages
BW: Every two months a support package.
Two days emergency correction time after development close.
Internal tests by developer (round-robin) and automatic tests.
Errors & solutions available via notes for customers (with attached coding corrections).

© SAP AG 2003, Title of Presentation, Speaker Name / 65
Support for customers: CSN/OSS
CSN/OSS: Message board.
Every message comes into pool (different support level: local, regional, global, development) and is then manually moved to a more specific pool.
Hiding internal notes.
Customer has (a limited) right to escalate.
Sometimes separation in New Development and Installed Base Development. Right now: Every developer must spend some time doing support.

© SAP AG 2003, Title of Presentation, Speaker Name / 66
Support for customers: Debugging
From csn access to the customer‘s system: By SAP-R3, rfc, PCanywhere or even netMeeting.
The backend has a complete IDE.
Build-in trace of every program step possible.
Debugging in the dev- or even production system.
On-the-fly code and database changes possible.

© SAP AG 2003, Title of Presentation, Speaker Name / 67
SAP/BW References
SAP-BI: http://www.sap.com/bi/
SAP-Help: http://help.sap.com/
SAP-Jobs: http://www.sap.com/company/jobs/
(current focus: „Strategic Research and Development Initiative“)
SAP Business Information Warehouse: Seemann, Schmalzridt, Lehmann. SAP Press, ISBN: 3-934358-41-1
Mastering the SAP Business Information Warehouse: Kevin McDonald, Andreas Wilmsmeier, David C. Dixon, W.H. Inmon. Wiley, ISBN 0-471-21-971-1

© SAP AG 2003, Title of Presentation, Speaker Name / 68
DW References
Data Warehouse Systeme – Architektur, Entwicklung, Anwendung: Andreas Bauer, Holger Günzel (Hrsg.). dpunkt.verlag, ISBN: 3-932588-76-2 (good technology overview with comprehensive reference chapter)
The Data Warehouse Toolkit: Ralph Kimball, Wiley, ISBN: 047115337-0
OLAP - Grundlagen, Modellierung und betriebswirtschaftliche Lösungen: Karsten Oehler, Hanser Fachbuch, ISBN: 3446213090
OLAP – Multidimensionale Datenbanken: Nils Clausen, Addison-Wesley, ISBN: 3-8273-1402-X

© SAP AG 2003, Title of Presentation, Speaker Name / 69
Misc. Online-References
Ralph Kimball‘s online articles 1995-1998 in DBMS: http://www.dbmsmag.com/artin303.html#A000024
Java-Jolap: http://www.jcp.org/en/jsr/detail?id=69
MS-Mdx: http://msdn.microsoft.com/library/default.asp?url=/library/en-us/dnolap/html/sqlolap.asp
The Data Warehousing Information Center (link collection):http://www.dwinfocenter.org/
Bill Inmon: http://www.inmoncif.com/
Nigel Pendse: http://www.olapreport.com/

© SAP AG 2003, Title of Presentation, Speaker Name / 70
Q & A
Any questions?

© SAP AG 2003, Title of Presentation, Speaker Name / 71
The End.

© SAP AG 2003, Title of Presentation, Speaker Name / 72
Copyright 2003 SAP AG. All Rights Reserved
No part of this publication may be reproduced or transmitted in any form or for any purpose without the express permission of SAP AG. The information contained herein may be changed without prior notice.
Some software products marketed by SAP AG and its distributors contain proprietary software components of other software vendors.
Microsoft®, WINDOWS®, NT®, EXCEL®, Word®, PowerPoint® and SQL Server® are registered trademarks of Microsoft Corporation.
IBM®, DB2®, DB2 Universal Database, OS/2®, Parallel Sysplex®, MVS/ESA, AIX®, S/390®, AS/400®, OS/390®, OS/400®, iSeries, pSeries, xSeries, zSeries, z/OS, AFP, Intelligent Miner, WebSphere®, Netfinity®, Tivoli®, Informix and Informix® Dynamic ServerTM are trademarks of IBM Corporation in USA and/or other countries.
ORACLE® is a registered trademark of ORACLE Corporation.
UNIX®, X/Open®, OSF/1®, and Motif® are registered trademarks of the Open Group.
Citrix®, the Citrix logo, ICA®, Program Neighborhood®, MetaFrame®, WinFrame®, VideoFrame®, MultiWin® and other Citrix product names referenced herein are trademarks of Citrix Systems, Inc.
HTML, DHTML, XML, XHTML are trademarks or registered trademarks of W3C®, World Wide Web Consortium, Massachusetts Institute of Technology.
JAVA® is a registered trademark of Sun Microsystems, Inc.
JAVASCRIPT® is a registered trademark of Sun Microsystems, Inc., used under license for technology invented and implemented by Netscape.
MarketSet and Enterprise Buyer are jointly owned trademarks of SAP AG and Commerce One.
SAP, R/3, mySAP, mySAP.com, xApps, xApp and other SAP products and services mentioned herein as well astheir respective logos are trademarks or registered trademarks of SAP AG in Germany and in several other countries all over the world. All other product and service names mentioned are the trademarks of their respective companies.

© SAP AG 2003, Title of Presentation, Speaker Name / 73
Copyright 2003 SAP AG. Alle Rechte vorbehalten
Weitergabe und Vervielfältigung dieser Publikation oder von Teilen daraus sind, zu welchem Zweck und in welcher Form auch immer, ohne die aus-drückliche schriftliche Genehmigung durch SAP AG nicht gestattet. In dieser Publikation enthaltene Informationen können ohne vorherige Ankün-digung geändert werden.
Die von SAP AG oder deren Vertriebsfirmen angebotenen Softwareprodukte können Softwarekomponenten auch anderer Softwarehersteller enthalten.
Microsoft®, WINDOWS®, NT®, EXCEL®, Word®, PowerPoint® und SQL Server® sind eingetragene Marken der Microsoft Corporation.
IBM®, DB2®, DB2 Universal Database, OS/2®, Parallel Sysplex®, MVS/ESA, AIX®, S/390®, AS/400®, OS/390®, OS/400®, iSeries, pSeries, xSeries, zSeries, z/OS, AFP, Intelligent Miner, WebSphere®, Netfinity®, Tivoli®, Informixund Informix® Dynamic ServerTM sind Marken der IBM Corporation in den USA und/oder anderen Ländern.
ORACLE® ist eine eingetragene Marke der ORACLE Corporation.
UNIX®, X/Open®, OSF/1® und Motif® sind eingetragene Marken der Open Group.
Citrix®, das Citrix-Logo, ICA®, Program Neighborhood®, MetaFrame®, WinFrame®, VideoFrame®, MultiWin® und andere hier erwähnte Namen von Citrix-Produkten sind Marken von Citrix Systems, Inc.
HTML, DHTML, XML, XHTML sind Marken oder eingetragene Marken des W3C®, World Wide Web Consortium, Massachusetts Institute of Technology.
JAVA® ist eine eingetragene Marke der Sun Microsystems, Inc.
JAVASCRIPT® ist eine eingetragene Marke der Sun Microsystems, Inc., verwendet unter der Lizenz der von Netscape entwickelten und implementierten Technologie.
MarketSet und Enterprise Buyer sind gemeinsame Marken von SAP AG und Commerce One.
SAP, R/3, mySAP, mySAP.com, xApps, xApp und weitere im Text erwähnte SAP-Produkte und –Dienstleistungen sowie die entsprechenden Logos sind Marken oder eingetragene Marken der SAP AG in Deutschland und anderen Ländern weltweit. Alle anderen Namen von Produkten und Dienstleistungen sind Marken der jeweiligen Firmen.
Related Documents