Analysis of observed soil moisture patterns under different land covers in Western Ghats, India B. Venkatesh a,⇑,1 , Nandagiri Lakshman b , B.K. Purandara a , V.B. Reddy c a National Institute of Hydrology, Belgaum, India b Department of Applied Mechanics & Hydraulics, NITK, Surathkal, India c The Energy and Resources Institute, Western Regional Centre, Goa, India article info Article history: Received 21 September 2009 Received in revised form 7 October 2010 Accepted 4 December 2010 Available online xxxx This manuscript was handled by K. Georgkakos, Editor-in-Chief Keywords: Western Ghats Soil moisture Acacia plantation Field experiments Profile mean summary An understanding of the soil moisture variability is necessary to characterize the linkages between a region’s hydrology, ecology and physiography. In the changing land use scenario of Western Ghats, India, where deforestation along with extensive afforestation with exotic species is being undertaken, there is an urgent need to evaluate the impacts of these changes on regional hydrology. The objectives of the present study were: (a) to understand spatio-temporal variability of soil water potential and soil mois- ture content under different land covers in the humid tropical Western Ghats region and (b) to evaluate differences if any in spatial and temporal patterns of soil moisture content as influenced by nature of land cover. To this end, experimental watersheds located in the Western Ghats of Uttara Kannada District, Karnataka State, India, were established for monitoring of soil moisture. These watersheds possessed homogenous land covers of acacia plantation, natural forest and degraded forest. In addition to the measurements of hydro-meteorological parameters, soil matric potential measurements were made at four locations in each watershed at 50 cm, 100 cm and 150 cm depths at weekly time intervals during the period October 2004–December 2008. Soil moisture contents derived from potential measurements collected were analyzed to characterize the spatial and temporal variations across the three land covers. The results of ANOVA (p < 0.01, LSD) test indicated that there was no significant change in the mean soil moisture across land covers. However, significant differences in soil moisture with depth were observed under forested watershed, whereas no such changes with depth were noticed under acacia and degraded land covers. Also, relationships between soil moisture at different depths were evaluated using correlation analysis and multiple linear regression models for prediction of soil moisture from climatic variables and antecedent moisture condi- tion were developed and tested. A regression model relating near-surface soil moisture (50 cm) with profile soil moisture content was developed which may prove useful when surface soil moisture contents derived from satellite remote sensing are available. Overall results of this study indicate that while the nature of land cover has an influence on the spatio-temporal variability of soil moisture, other variables related to topography may have a more dominant effect. Ó 2010 Elsevier B.V. All rights reserved. 1. Introduction Soil moisture in the uppermost 1–2 m of the earth’s surface is recognized as a key variable in numerous environmental studies, including those related to meteorology, hydrology, agriculture and climate change. Although the amount of soil water may seem insignificant when compared to the total quantity of water at the global scale, it is this thin layer of soil that controls the success of agriculture and regulates partitioning of precipitation into runoff and sub-surface water storage. Furthermore, soil moisture content is one of the few directly observable hydrological variables that play an important role in quantifying water and energy budgets necessary for climate studies (Jackson, 1993). The impor- tant role played by soil moisture on growth of crops/vegetation (Rodriguez-Iturbe, 2000), groundwater recharge (Hodnett and Bell, 1986) and partitioning of rainfall into runoff and infiltration (Merz and Plate, 1997) are well documented. Unlike discharge or climate variables, soil moisture is not monitored regularly – in spite of its importance. Given the tremendous spatial and temporal variability exhibited by soil moisture (Western and Bloschl, 1999), it is very difficult to observe soil moisture at fine spatial and temporal resolutions while covering even moderately large spatial domains. The complexity of the problem is further compounded by the fact that soil moisture varies both in the lateral and vertical directions. 0022-1694/$ - see front matter Ó 2010 Elsevier B.V. All rights reserved. doi:10.1016/j.jhydrol.2010.12.006 ⇑ Corresponding author. Tel.: +91 831 2448 679; fax: +91 831 2447 269. E-mail addresses: [email protected], [email protected] (B. Venkatesh). 1 Scientist. Journal of Hydrology xxx (2010) xxx–xxx Contents lists available at ScienceDirect Journal of Hydrology journal homepage: www.elsevier.com/locate/jhydrol Please cite this article in press as: Venkatesh, B., et al. Analysis of observed soil moisture patterns under different land covers in Western Ghats, India. J. Hydrol. (2010), doi:10.1016/j.jhydrol.2010.12.006

Welcome message from author
This document is posted to help you gain knowledge. Please leave a comment to let me know what you think about it! Share it to your friends and learn new things together.
Transcript
Journal of Hydrology xxx (2010) xxx–xxx
Contents lists available at ScienceDirect
Journal of Hydrology
journal homepage: www.elsevier .com/ locate / jhydrol
Analysis of observed soil moisture patterns under different land coversin Western Ghats, India
B. Venkatesh a,⇑,1, Nandagiri Lakshman b, B.K. Purandara a, V.B. Reddy c
a National Institute of Hydrology, Belgaum, Indiab Department of Applied Mechanics & Hydraulics, NITK, Surathkal, Indiac The Energy and Resources Institute, Western Regional Centre, Goa, India
a r t i c l e i n f o
Article history:Received 21 September 2009Received in revised form 7 October 2010Accepted 4 December 2010Available online xxxxThis manuscript was handled byK. Georgkakos, Editor-in-Chief
Keywords:Western GhatsSoil moistureAcacia plantationField experimentsProfile mean
0022-1694/$ - see front matter � 2010 Elsevier B.V. Adoi:10.1016/j.jhydrol.2010.12.006
⇑ Corresponding author. Tel.: +91 831 2448 679; faE-mail addresses: [email protected], bvenki30@
1 Scientist.
Please cite this article in press as: Venkatesh, BHydrol. (2010), doi:10.1016/j.jhydrol.2010.12.00
s u m m a r y
An understanding of the soil moisture variability is necessary to characterize the linkages between aregion’s hydrology, ecology and physiography. In the changing land use scenario of Western Ghats, India,where deforestation along with extensive afforestation with exotic species is being undertaken, there isan urgent need to evaluate the impacts of these changes on regional hydrology. The objectives of thepresent study were: (a) to understand spatio-temporal variability of soil water potential and soil mois-ture content under different land covers in the humid tropical Western Ghats region and (b) to evaluatedifferences if any in spatial and temporal patterns of soil moisture content as influenced by nature of landcover. To this end, experimental watersheds located in the Western Ghats of Uttara Kannada District,Karnataka State, India, were established for monitoring of soil moisture. These watersheds possessedhomogenous land covers of acacia plantation, natural forest and degraded forest. In addition to themeasurements of hydro-meteorological parameters, soil matric potential measurements were made atfour locations in each watershed at 50 cm, 100 cm and 150 cm depths at weekly time intervals duringthe period October 2004–December 2008.
Soil moisture contents derived from potential measurements collected were analyzed to characterizethe spatial and temporal variations across the three land covers. The results of ANOVA (p < 0.01, LSD) testindicated that there was no significant change in the mean soil moisture across land covers. However,significant differences in soil moisture with depth were observed under forested watershed, whereasno such changes with depth were noticed under acacia and degraded land covers. Also, relationshipsbetween soil moisture at different depths were evaluated using correlation analysis and multiple linearregression models for prediction of soil moisture from climatic variables and antecedent moisture condi-tion were developed and tested. A regression model relating near-surface soil moisture (50 cm) withprofile soil moisture content was developed which may prove useful when surface soil moisture contentsderived from satellite remote sensing are available. Overall results of this study indicate that while thenature of land cover has an influence on the spatio-temporal variability of soil moisture, other variablesrelated to topography may have a more dominant effect.
� 2010 Elsevier B.V. All rights reserved.
1. Introduction
Soil moisture in the uppermost 1–2 m of the earth’s surface isrecognized as a key variable in numerous environmental studies,including those related to meteorology, hydrology, agricultureand climate change. Although the amount of soil water may seeminsignificant when compared to the total quantity of water at theglobal scale, it is this thin layer of soil that controls the successof agriculture and regulates partitioning of precipitation intorunoff and sub-surface water storage. Furthermore, soil moisture
ll rights reserved.
x: +91 831 2447 269.gmail.com (B. Venkatesh).
., et al. Analysis of observed soi6
content is one of the few directly observable hydrological variablesthat play an important role in quantifying water and energybudgets necessary for climate studies (Jackson, 1993). The impor-tant role played by soil moisture on growth of crops/vegetation(Rodriguez-Iturbe, 2000), groundwater recharge (Hodnett and Bell,1986) and partitioning of rainfall into runoff and infiltration (Merzand Plate, 1997) are well documented. Unlike discharge or climatevariables, soil moisture is not monitored regularly – in spite of itsimportance. Given the tremendous spatial and temporal variabilityexhibited by soil moisture (Western and Bloschl, 1999), it is verydifficult to observe soil moisture at fine spatial and temporalresolutions while covering even moderately large spatial domains.The complexity of the problem is further compounded by the factthat soil moisture varies both in the lateral and vertical directions.
l moisture patterns under different land covers in Western Ghats, India. J.
2 B. Venkatesh et al. / Journal of Hydrology xxx (2010) xxx–xxx
Spatial and temporal heterogeneity of soil moisture has beenattributed to controls exercised by various factors such as precipi-tation and climate (Famiglietti et al., 1998), land-cover/vegetation(Mahmood and Hubbard, 2007; Fu and Chen, 2000), soil propertiesand mean soil moisture content (Bell et al., 1980) and topography(Wilson et al., 2005; Moore et al., 1988; Western et al., 1999; Craveand Gascuel-odux, 1997).
Accurate estimation of soil moisture through conceptual andphysically-based models is also rendered difficult due to insufficientknowledge on the exact relationships between soil moisture andthese influencing factors, many of which exhibit significant inter-relationships (Qiu et al., 2001, 2003). Robust calibration andvalidation of such soil moisture models is hampered by thenon-availability of long-term observations, especially in the humidtropics. In an effort to circumvent the problems posed by ground-based monitoring, efforts are being made to use microwavesatellite remote sensing data to map soil moisture over large areas(e.g., Vischel et al., 2008). However, these methods provide informa-tion only on near-surface soil moisture thereby necessitating theneed for approaches to infer the more important profile soil mois-ture content (Fernandez-Galvez et al., 2006) from satellite imagery.
The effect of land cover on soil moisture variability has not re-ceived sufficient research attention. Although this aspect has beenthe subject of intense research from the agricultural/agronomicperspective, few field experiments have focused on long-term soilmoisture variability under natural vegetation. Exceptions to thisare studies carried out by Qiu et al., (2003), Fu et al., (2003) andLongobardi, (2008) in which soil moisture dynamics under variousnatural land covers was explored using intensive spatio-temporalfield monitoring. The non-availability of long-term soil moisturemeasurements extending over 2 or more years under different nat-ural land covers has prevented a better understanding of the im-pacts of land cover modifications on the hydrological cycle.
This is especially true of India, where large-scale land covermodifications are taking place to provide land for human activities.In particular, the Western Ghats mountain ranges located in thesouth-western part of India are undergoing tremendous changein land use/cover due to deforestation on one hand and afforesta-tion of degraded and grass lands by planting the exotic speciessuch as Acacia plants on the other hand (Jha et al., 2000; Bhatet al., 2002). The Uttara Kannada District of Karnataka State, Indiacomprises a portion of the Western Ghats and is one of the forestrich districts of the State. For several decades, the forests in thisDistrict have been exploited to meet both fuel and land require-ments of the region (Prasad and Hegde, 1986; Priya et al., 2007).Several studies have been taken up to assess the extent of landdegradation in this region (Reddy et al., 1986; Mani, 1985; Prasadet al., 1985; Mishra et al., 1985; Gadgil, 1987a,b; Nadkarni et al.,1989) and have confirmed the alarming rate at which forests havebeen removed. These studies are of the opinion that the degrada-tion has been uni-directional and conversion of forests to agricul-tural land appears to be the primary cause for deforestation.Livestock grazing, forest fires and widespread extraction of fuelwood and fodder have also contributed to land degradation (Leleet al., 1993; Rai, 2004).
Given that the Western Ghats mountain ranges form theheadwater catchments of all major rivers of Peninsular India,there is a growing cause for concern regarding the hydrologicalimpacts of such land cover changes. While the hydrological im-pacts of deforestation are well known, a few studies have re-ported that reforestation with exotic tree species may lead tomining of sub-surface water (Vandana and Bondhopadhdyay,1983; Calder et al., 1992). However, the effect of such exoticspecies on the soil moisture regime of this hydro-ecologicallysensitive region has not been studied through long term fieldobservations. No studies have reported the differences in soil
Please cite this article in press as: Venkatesh, B., et al. Analysis of observed soiHydrol. (2010), doi:10.1016/j.jhydrol.2010.12.006
moisture regime under exotic tree species and vegetative coversthat occur naturally in the region.
Therefore, the present study was taken up with the followingobjectives: (a) to understand spatio-temporal variability of soilwater potential and soil moisture content under different land cov-ers in the humid tropical Western Ghats region and (b) to evaluatedifferences if any in spatial and temporal patterns of soil moisturecontent as influenced by nature of land cover. To this end, experi-mental watersheds located in the Western Ghats close toKodigibail Village, Siddapur Taluk, Uttara Kannada District of Kar-nataka State, India, were selected for monitoring of soil moisture.The selection of these watersheds were done such that they fallwithin a homogeneous climatic region and possess similar soiltype and geology but differ only in the nature of land cover – nat-ural forest, degraded forest and acacia plantation. The field exper-imentation was taken up to address the following issues: (a)quantification of spatio-temporal variability of soil moisture underdifferent land covers using long-term observations (b) evaluationof depth-wise variations in soil moisture content and explorationof relationships between soil moisture content at various depthswith particular emphasis on developing relationships between sur-face and profile soil moisture content; and (c) development andtest of a model for soil moisture prediction using routinely ob-served climate data and antecedent soil moisture content.
2. Study area
The Western Ghats, locally called as ‘Sahayadri Mountains’’, is arange of mountains in the peninsular India running approximatelyparallel to its west coast and home to the largest tracts of moisttropical forests in the country. The coastal District of Uttara Kanna-da, Karnataka State straddles the Ghats, which are at their lowesthere (<600 m) and are about 20–25 km inland. East of the crest lineof the Ghats are rolling hills with forested slopes and shallow val-leys with cultivation. This region, locally known as the Malnaad,covers most of the Siddapur, Sirsi and Yellapur talukas. The Sidda-pur taluk formed the focus of this study.
The region has a tropical climate with mean monthly tempera-tures ranging from 20 to 27 �C. The average annual rainfall is2800 mm with significant intra-annual variability. About 70–80%of the rainfall is received between June and September due tothe south-west monsoon phenomenon, while the remaining rain-fall is spread over remaining 8 months. The number of rainy daysduring June to September is about 100–110. The geology of thearea consists of Dharwar (Chlorite) schists, granitic gneisses andcharnockites from the Archean complex (Bourgeon, 1989). The ma-jor soil types found in the study area are red or yellowish-redlateritic soil, with gravely-clay texture. Forest soils are deep tomoderately drained, dark brown to dark yellowish brown withsandy-clay to sandy-clayey-loam texture. They are rich in humus,acidic and usually deep. Broadly, the soils of this region have beencategorized as red sandy or sandy-clay loams (Kamath, 1985) ormore specifically as mainly Ferrallitics (French soil taxonomy)(Bourgeon, 1989) or Alfisols and Inceptisols (USDA soil taxonomy).The forest vegetation of this area is a mixture of semi-evergreenand moist deciduous associations (Pascal, 1986). The latter vegeta-tion type is often the product of intensive human use and thereforemay take the form of a tree savanna, heavily pruned trees withgrass in the under storey. Pure grasslands occur in small patchesand are dominated by Themeda sp (Lélé and Hegde, 1997).
2.1. Experimental sites and soil sampling
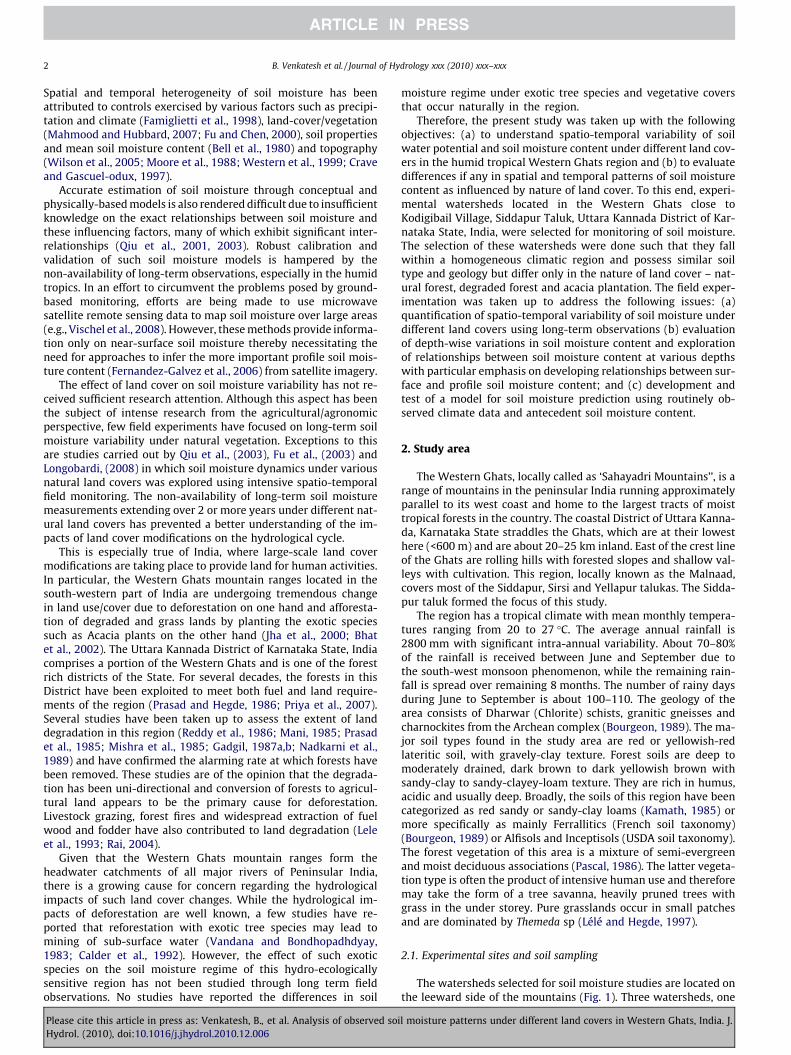
The watersheds selected for soil moisture studies are located onthe leeward side of the mountains (Fig. 1). Three watersheds, one
l moisture patterns under different land covers in Western Ghats, India. J.
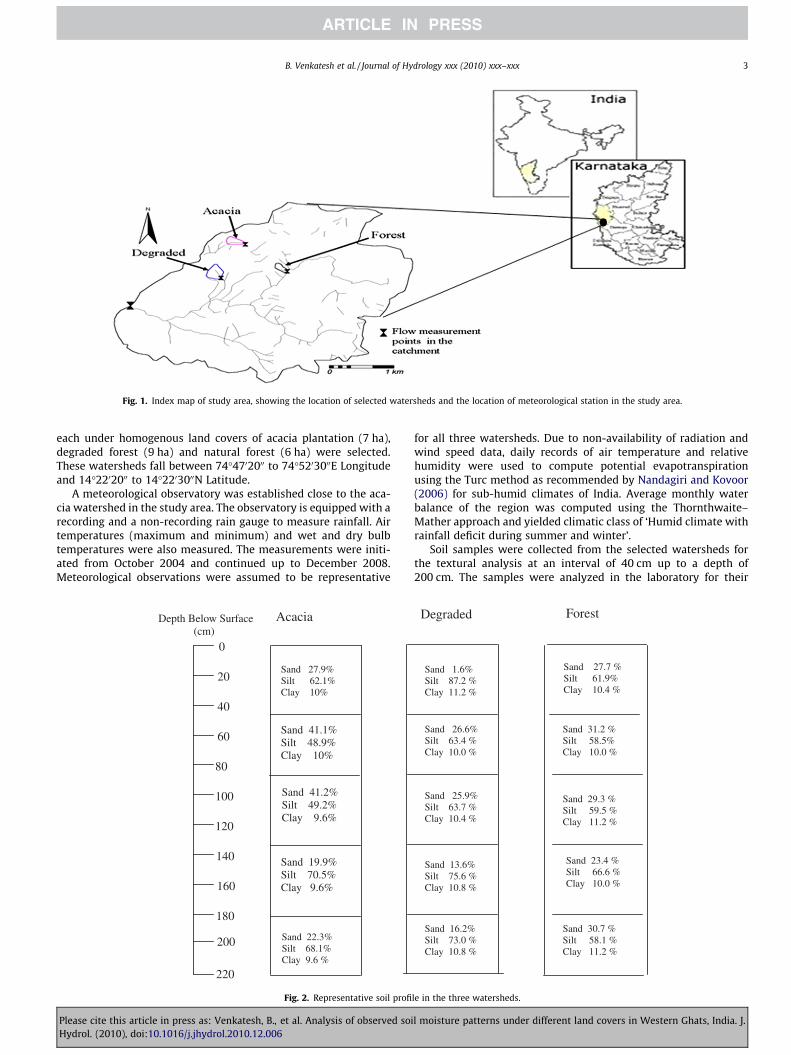
Fig. 1. Index map of study area, showing the location of selected watersheds and the location of meteorological station in the study area.
B. Venkatesh et al. / Journal of Hydrology xxx (2010) xxx–xxx 3
each under homogenous land covers of acacia plantation (7 ha),degraded forest (9 ha) and natural forest (6 ha) were selected.These watersheds fall between 74�4702000 to 74�5203000E Longitudeand 14�2202000 to 14�2203000N Latitude.
A meteorological observatory was established close to the aca-cia watershed in the study area. The observatory is equipped with arecording and a non-recording rain gauge to measure rainfall. Airtemperatures (maximum and minimum) and wet and dry bulbtemperatures were also measured. The measurements were initi-ated from October 2004 and continued up to December 2008.Meteorological observations were assumed to be representative
220
200
180
160
140
120
100
80
60
40
20
0
Acacia
Sand 27.9% Silt 62.1% Clay 10%
Sand 41.1% Silt 48.9% Clay 10%
Sand 41.2% Silt 49.2% Clay 9.6%
Sand 19.9% Silt 70.5% Clay 9.6%
Sand 22.3% Silt 68.1% Clay 9.6 %
Depth Below Surface (cm)
Fig. 2. Representative soil profi
Please cite this article in press as: Venkatesh, B., et al. Analysis of observed soiHydrol. (2010), doi:10.1016/j.jhydrol.2010.12.006
for all three watersheds. Due to non-availability of radiation andwind speed data, daily records of air temperature and relativehumidity were used to compute potential evapotranspirationusing the Turc method as recommended by Nandagiri and Kovoor(2006) for sub-humid climates of India. Average monthly waterbalance of the region was computed using the Thornthwaite–Mather approach and yielded climatic class of ‘Humid climate withrainfall deficit during summer and winter’.
Soil samples were collected from the selected watersheds forthe textural analysis at an interval of 40 cm up to a depth of200 cm. The samples were analyzed in the laboratory for their
Degraded Forest
Sand 27.7 % Silt 61.9% Clay 10.4 %
Sand 31.2 % Silt 58.5% Clay 10.0 %
Sand 29.3 % Silt 59.5 % Clay 11.2 %
Sand 23.4 % Silt 66.6 % Clay 10.0 %
Sand 30.7 % Silt 58.1 % Clay 11.2 %
Sand 1.6% Silt 87.2 % Clay 11.2 %
Sand 26.6% Silt 63.4 % Clay 10.0 %
Sand 25.9% Silt 63.7 % Clay 10.4 %
Sand 13.6% Silt 75.6 % Clay 10.8 %
Sand 16.2% Silt 73.0 % Clay 10.8 %
le in the three watersheds.
l moisture patterns under different land covers in Western Ghats, India. J.
4 B. Venkatesh et al. / Journal of Hydrology xxx (2010) xxx–xxx
texture using the sieve method to quantify the coarse grains and byusing the hydrometer method to determine the particle fractions.Most of these samples classified as silty loam as per USDA classifi-cation. The depth wise variation of the soil texture in the selectedwatersheds is presented in the Fig. 2.
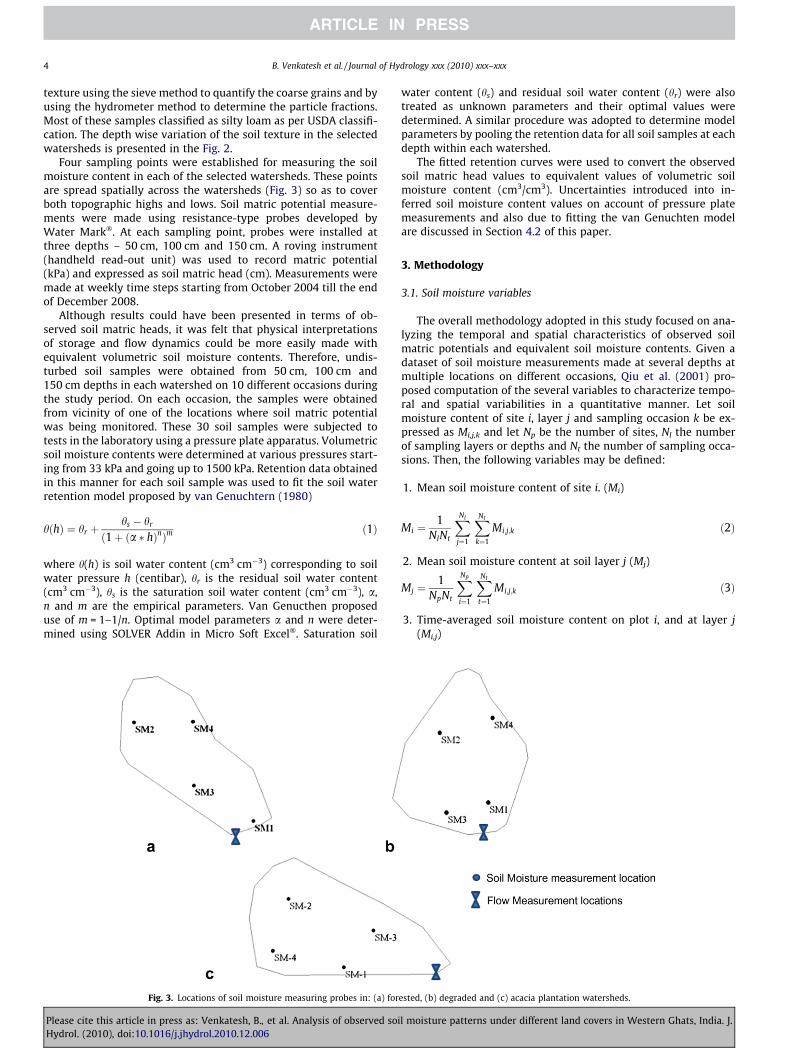
Four sampling points were established for measuring the soilmoisture content in each of the selected watersheds. These pointsare spread spatially across the watersheds (Fig. 3) so as to coverboth topographic highs and lows. Soil matric potential measure-ments were made using resistance-type probes developed byWater Mark�. At each sampling point, probes were installed atthree depths – 50 cm, 100 cm and 150 cm. A roving instrument(handheld read-out unit) was used to record matric potential(kPa) and expressed as soil matric head (cm). Measurements weremade at weekly time steps starting from October 2004 till the endof December 2008.
Although results could have been presented in terms of ob-served soil matric heads, it was felt that physical interpretationsof storage and flow dynamics could be more easily made withequivalent volumetric soil moisture contents. Therefore, undis-turbed soil samples were obtained from 50 cm, 100 cm and150 cm depths in each watershed on 10 different occasions duringthe study period. On each occasion, the samples were obtainedfrom vicinity of one of the locations where soil matric potentialwas being monitored. These 30 soil samples were subjected totests in the laboratory using a pressure plate apparatus. Volumetricsoil moisture contents were determined at various pressures start-ing from 33 kPa and going up to 1500 kPa. Retention data obtainedin this manner for each soil sample was used to fit the soil waterretention model proposed by van Genuchtern (1980)
hðhÞ ¼ hr þhs � hr
ð1þ ða � hÞnÞmð1Þ
where h(h) is soil water content (cm3 cm�3) corresponding to soilwater pressure h (centibar), hr is the residual soil water content(cm3 cm�3), hs is the saturation soil water content (cm3 cm�3), a,n and m are the empirical parameters. Van Genucthen proposeduse of m = 1–1/n. Optimal model parameters a and n were deter-mined using SOLVER Addin in Micro Soft Excel�. Saturation soil
Fig. 3. Locations of soil moisture measuring probes in: (a) for
Please cite this article in press as: Venkatesh, B., et al. Analysis of observed soiHydrol. (2010), doi:10.1016/j.jhydrol.2010.12.006
water content (hs) and residual soil water content (hr) were alsotreated as unknown parameters and their optimal values weredetermined. A similar procedure was adopted to determine modelparameters by pooling the retention data for all soil samples at eachdepth within each watershed.
The fitted retention curves were used to convert the observedsoil matric head values to equivalent values of volumetric soilmoisture content (cm3/cm3). Uncertainties introduced into in-ferred soil moisture content values on account of pressure platemeasurements and also due to fitting the van Genuchten modelare discussed in Section 4.2 of this paper.
3. Methodology
3.1. Soil moisture variables
The overall methodology adopted in this study focused on ana-lyzing the temporal and spatial characteristics of observed soilmatric potentials and equivalent soil moisture contents. Given adataset of soil moisture measurements made at several depths atmultiple locations on different occasions, Qiu et al. (2001) pro-posed computation of the several variables to characterize tempo-ral and spatial variabilities in a quantitative manner. Let soilmoisture content of site i, layer j and sampling occasion k be ex-pressed as Mi,j,k and let Np be the number of sites, Nl the numberof sampling layers or depths and Nt the number of sampling occa-sions. Then, the following variables may be defined:
1. Mean soil moisture content of site i. (Mi)
Mi ¼1
NlNt
XNl
j¼1
XNt
k¼1
Mi;j;k ð2Þ
2. Mean soil moisture content at soil layer j (Mj)
Mj ¼1
NpNt
XNp
i¼1
XNt
t¼1
Mi;j;k ð3Þ
3. Time-averaged soil moisture content on plot i, and at layer j(Mi,j)
ested, (b) degraded and (c) acacia plantation watersheds.
l moisture patterns under different land covers in Western Ghats, India. J.
B. Venkatesh et al. / Journal of Hydrology xxx (2010) xxx–xxx 5
Mi;j ¼1Nt
XNt
k¼1
Mi;j;k ð4Þ
4. Profile Variability of time-averaged soil moisture content onplot, i, (VPi)
VPi;k ¼
ffiffiffiffiffiffiffiffiffiffiffiffiffiffiffiffiffiffiffiffiffiffiffiffiffiffiffiffiffiffiffiffiffiffiffiffiffiffiffiffiffiffiffiffiffiffiffiffiffiffiffiffiffiffiffiffiffiffiffiffiNlPNl
j¼1ðMi;jÞ2 �PNl
j¼1Mi;j
� �2
NlðNl � 1Þ
vuutð5Þ
5. Temporal Variability of layer averaged soil moisture content onplot, i, (VTi)
VTi ¼
ffiffiffiffiffiffiffiffiffiffiffiffiffiffiffiffiffiffiffiffiffiffiffiffiffiffiffiffiffiffiffiffiffiffiffiffiffiffiffiffiffiffiffiffiffiffiffiffiffiffiffiffiffiffiffiNtPNt
k¼1Mi;k �PNt
k¼1Mi;k
� �
NtðNt � 1Þ
vuutð6Þ
6. Spatial variability of layered averaged soil moisture at soil layerj (VSj)
VSj ¼
ffiffiffiffiffiffiffiffiffiffiffiffiffiffiffiffiffiffiffiffiffiffiffiffiffiffiffiffiffiffiffiffiffiffiffiffiffiffiffiffiffiffiffiffiffiffiffiffiffiffiffiffiffiffiffiffiffiffiffiffiffiNpPNp
i¼1ðMi;jÞ2 �PNp
i¼1Mi;j
� �2
NpðNp � 1Þ
vuutð7Þ
7. Profile gradient of time-averaged soil moisture on plot i, (Gi)
Gi ¼Mi;3 �Mi;1
1:5ð8Þ
In the present study, the seven variables defined by Eqs. (2)–(8)were computed for four sites (Np) in each of the watersheds atthree depths (Ni) at 7 day time steps (Nt) during the period October2004–December 2008.
3.2. Correlation and regression analysis
In addition to characterizing the spatial and temporal character-istics of observed soil moisture contents under different land cov-ers, the study also focused on exploring the relationships betweensoil moisture levels at different depths using correlation analysis.
An effort was also made to develop a simple regression-basedmodel for prediction of soil moisture from climatic variables andantecedent soil moisture content. Accordingly, the following linearmultiple linear regression model was fitted to available observa-tions separately for each watershed.
SMj ¼ aþ b � P þ c � T þ d � RHþ e � AMC ð9Þ
where SMj is the soil moisture content with j being set to eitherdepths 50, 100 and 150 cm or the soil moisture for the profile asa whole (PM), P is rainfall (mm), T is air temperature (�C), RH is rel-ative humidity (%) and AMC is antecedent moisture content. a, b, c, dand e are regression coefficients.
Further, while developing the prediction models for the 100 cmand 150 cm depths, an additional predictor variable in the form ofthe soil moisture content of the immediate upper layer was
Fig. 4. Plot of observed soil matric po
Please cite this article in press as: Venkatesh, B., et al. Analysis of observed soiHydrol. (2010), doi:10.1016/j.jhydrol.2010.12.006
included in the model defined by Eq. (9). Also, while developingthe model for with soil moisture of the profile as a whole (SMPM),the soil moisture in the surface layer (SM50) was included as anadditional predictor in Eq. (9).
All the models described above were calibrated using observeddata for the period October 2004–December 2007 and validatedwith the remaining dataset (January 2008–December 2008). Statis-tics used to assess model performances in both calibration andvalidation phases included: the coefficient of determination (R2),root mean square error (RMSE) and mean absolute error (MAE).In an effort to identify the most parsimonious model, the AkaikeInformation Criteria was also computed as,
AIC ¼ Nðln SSEÞ þ 2Nv ð10Þ
where SSE is the sum of square of error between observed and pre-dicted soil moisture contents, N is sample size and Nv is the numberof independent variables included in the model. A model with min-imum AIC is considered best.
4. Results and discussion
4.1. Variations in observed soil matric potentials
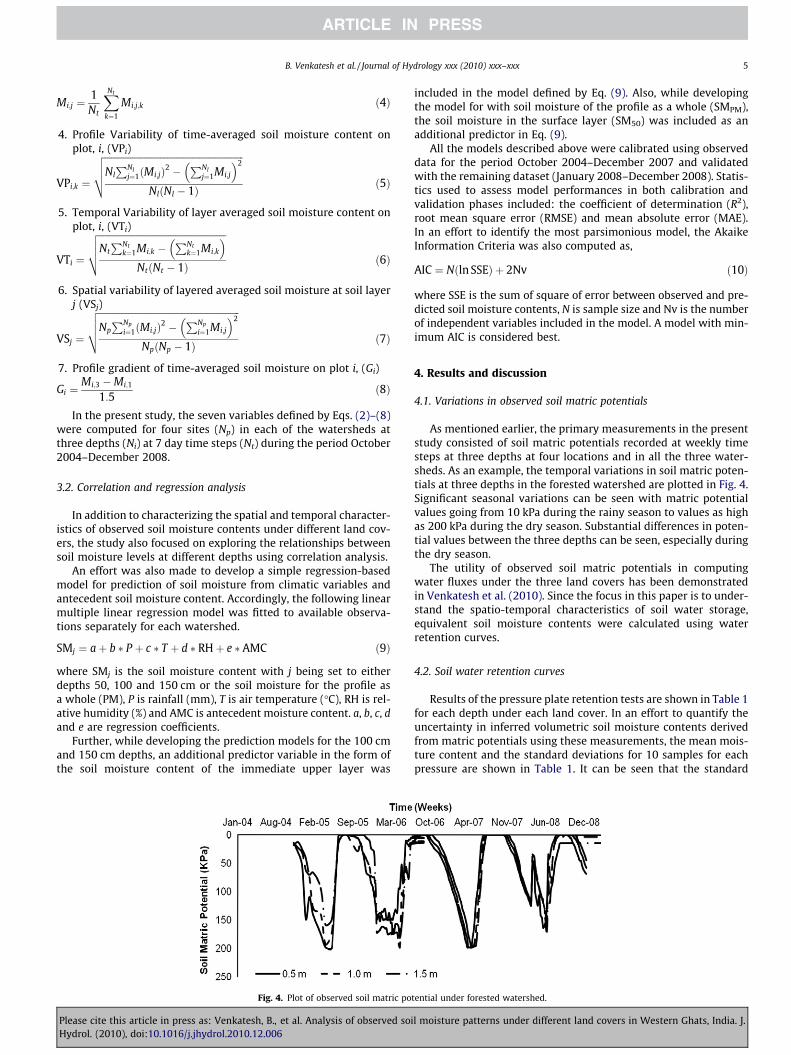
As mentioned earlier, the primary measurements in the presentstudy consisted of soil matric potentials recorded at weekly timesteps at three depths at four locations and in all the three water-sheds. As an example, the temporal variations in soil matric poten-tials at three depths in the forested watershed are plotted in Fig. 4.Significant seasonal variations can be seen with matric potentialvalues going from 10 kPa during the rainy season to values as highas 200 kPa during the dry season. Substantial differences in poten-tial values between the three depths can be seen, especially duringthe dry season.
The utility of observed soil matric potentials in computingwater fluxes under the three land covers has been demonstratedin Venkatesh et al. (2010). Since the focus in this paper is to under-stand the spatio-temporal characteristics of soil water storage,equivalent soil moisture contents were calculated using waterretention curves.
4.2. Soil water retention curves
Results of the pressure plate retention tests are shown in Table 1for each depth under each land cover. In an effort to quantify theuncertainty in inferred volumetric soil moisture contents derivedfrom matric potentials using these measurements, the mean mois-ture content and the standard deviations for 10 samples for eachpressure are shown in Table 1. It can be seen that the standard
tential under forested watershed.
l moisture patterns under different land covers in Western Ghats, India. J.
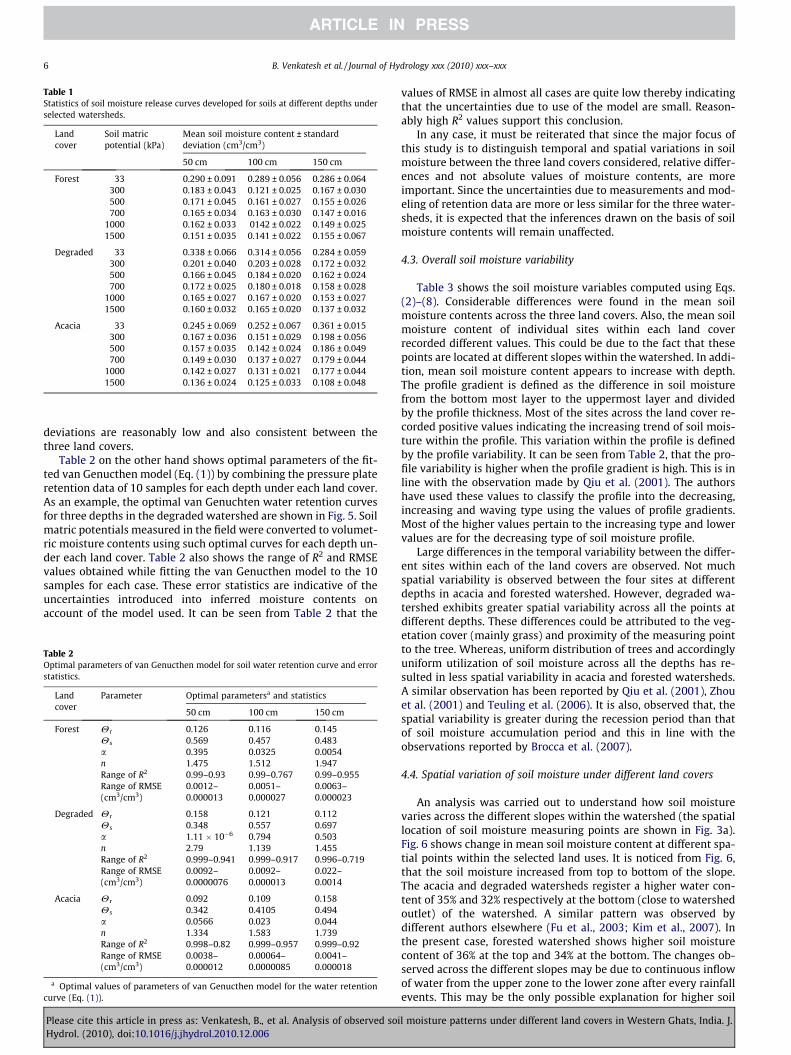
Table 1Statistics of soil moisture release curves developed for soils at different depths underselected watersheds.
Landcover
Soil matricpotential (kPa)
Mean soil moisture content ± standarddeviation (cm3/cm3)
50 cm 100 cm 150 cm
Forest 33 0.290 ± 0.091 0.289 ± 0.056 0.286 ± 0.064300 0.183 ± 0.043 0.121 ± 0.025 0.167 ± 0.030500 0.171 ± 0.045 0.161 ± 0.027 0.155 ± 0.026700 0.165 ± 0.034 0.163 ± 0.030 0.147 ± 0.016
1000 0.162 ± 0.033 0142 ± 0.022 0.149 ± 0.0251500 0.151 ± 0.035 0.141 ± 0.022 0.155 ± 0.067
Degraded 33 0.338 ± 0.066 0.314 ± 0.056 0.284 ± 0.059300 0.201 ± 0.040 0.203 ± 0.028 0.172 ± 0.032500 0.166 ± 0.045 0.184 ± 0.020 0.162 ± 0.024700 0.172 ± 0.025 0.180 ± 0.018 0.158 ± 0.028
1000 0.165 ± 0.027 0.167 ± 0.020 0.153 ± 0.0271500 0.160 ± 0.032 0.165 ± 0.020 0.137 ± 0.032
Acacia 33 0.245 ± 0.069 0.252 ± 0.067 0.361 ± 0.015300 0.167 ± 0.036 0.151 ± 0.029 0.198 ± 0.056500 0.157 ± 0.035 0.142 ± 0.024 0.186 ± 0.049700 0.149 ± 0.030 0.137 ± 0.027 0.179 ± 0.044
1000 0.142 ± 0.027 0.131 ± 0.021 0.177 ± 0.0441500 0.136 ± 0.024 0.125 ± 0.033 0.108 ± 0.048
6 B. Venkatesh et al. / Journal of Hydrology xxx (2010) xxx–xxx
deviations are reasonably low and also consistent between thethree land covers.
Table 2 on the other hand shows optimal parameters of the fit-ted van Genucthen model (Eq. (1)) by combining the pressure plateretention data of 10 samples for each depth under each land cover.As an example, the optimal van Genuchten water retention curvesfor three depths in the degraded watershed are shown in Fig. 5. Soilmatric potentials measured in the field were converted to volumet-ric moisture contents using such optimal curves for each depth un-der each land cover. Table 2 also shows the range of R2 and RMSEvalues obtained while fitting the van Genucthen model to the 10samples for each case. These error statistics are indicative of theuncertainties introduced into inferred moisture contents onaccount of the model used. It can be seen from Table 2 that the
Table 2Optimal parameters of van Genucthen model for soil water retention curve and errorstatistics.
Landcover
Parameter Optimal parametersa and statistics
50 cm 100 cm 150 cm
Forest Hr 0.126 0.116 0.145Hs 0.569 0.457 0.483a 0.395 0.0325 0.0054n 1.475 1.512 1.947Range of R2 0.99–0.93 0.99–0.767 0.99–0.955Range of RMSE(cm3/cm3)
0.0012–0.000013
0.0051–0.000027
0.0063–0.000023
Degraded Hr 0.158 0.121 0.112Hs 0.348 0.557 0.697a 1.11 � 10�6 0.794 0.503n 2.79 1.139 1.455Range of R2 0.999–0.941 0.999–0.917 0.996–0.719Range of RMSE(cm3/cm3)
0.0092–0.0000076
0.0092–0.000013
0.022–0.0014
Acacia Hr 0.092 0.109 0.158Hs 0.342 0.4105 0.494a 0.0566 0.023 0.044n 1.334 1.583 1.739Range of R2 0.998–0.82 0.999–0.957 0.999–0.92Range of RMSE(cm3/cm3)
0.0038–0.000012
0.00064–0.0000085
0.0041–0.000018
a Optimal values of parameters of van Genucthen model for the water retentioncurve (Eq. (1)).
Please cite this article in press as: Venkatesh, B., et al. Analysis of observed soiHydrol. (2010), doi:10.1016/j.jhydrol.2010.12.006
values of RMSE in almost all cases are quite low thereby indicatingthat the uncertainties due to use of the model are small. Reason-ably high R2 values support this conclusion.
In any case, it must be reiterated that since the major focus ofthis study is to distinguish temporal and spatial variations in soilmoisture between the three land covers considered, relative differ-ences and not absolute values of moisture contents, are moreimportant. Since the uncertainties due to measurements and mod-eling of retention data are more or less similar for the three water-sheds, it is expected that the inferences drawn on the basis of soilmoisture contents will remain unaffected.
4.3. Overall soil moisture variability
Table 3 shows the soil moisture variables computed using Eqs.(2)–(8). Considerable differences were found in the mean soilmoisture contents across the three land covers. Also, the mean soilmoisture content of individual sites within each land coverrecorded different values. This could be due to the fact that thesepoints are located at different slopes within the watershed. In addi-tion, mean soil moisture content appears to increase with depth.The profile gradient is defined as the difference in soil moisturefrom the bottom most layer to the uppermost layer and dividedby the profile thickness. Most of the sites across the land cover re-corded positive values indicating the increasing trend of soil mois-ture within the profile. This variation within the profile is definedby the profile variability. It can be seen from Table 2, that the pro-file variability is higher when the profile gradient is high. This is inline with the observation made by Qiu et al. (2001). The authorshave used these values to classify the profile into the decreasing,increasing and waving type using the values of profile gradients.Most of the higher values pertain to the increasing type and lowervalues are for the decreasing type of soil moisture profile.
Large differences in the temporal variability between the differ-ent sites within each of the land covers are observed. Not muchspatial variability is observed between the four sites at differentdepths in acacia and forested watershed. However, degraded wa-tershed exhibits greater spatial variability across all the points atdifferent depths. These differences could be attributed to the veg-etation cover (mainly grass) and proximity of the measuring pointto the tree. Whereas, uniform distribution of trees and accordinglyuniform utilization of soil moisture across all the depths has re-sulted in less spatial variability in acacia and forested watersheds.A similar observation has been reported by Qiu et al. (2001), Zhouet al. (2001) and Teuling et al. (2006). It is also, observed that, thespatial variability is greater during the recession period than thatof soil moisture accumulation period and this in line with theobservations reported by Brocca et al. (2007).
4.4. Spatial variation of soil moisture under different land covers
An analysis was carried out to understand how soil moisturevaries across the different slopes within the watershed (the spatiallocation of soil moisture measuring points are shown in Fig. 3a).Fig. 6 shows change in mean soil moisture content at different spa-tial points within the selected land uses. It is noticed from Fig. 6,that the soil moisture increased from top to bottom of the slope.The acacia and degraded watersheds register a higher water con-tent of 35% and 32% respectively at the bottom (close to watershedoutlet) of the watershed. A similar pattern was observed bydifferent authors elsewhere (Fu et al., 2003; Kim et al., 2007). Inthe present case, forested watershed shows higher soil moisturecontent of 36% at the top and 34% at the bottom. The changes ob-served across the different slopes may be due to continuous inflowof water from the upper zone to the lower zone after every rainfallevents. This may be the only possible explanation for higher soil
l moisture patterns under different land covers in Western Ghats, India. J.

Fig. 5. Fitted Soil Water Retention curves for degraded watershed.
Table 3Statistics of the time averaged observed soil moisture at various depths under different land cover types.
Landcover
Site Mi,j,j = 50 cm
Mi,j,j = 100 cm
Mi,j,j = 150 cm
Mean,Mi
Profile variability,VPi
Profile gradient,Gi
Temporal variability,VTi
Forest 1 26 30 32 29 2.830 0.036 3.3802 24 31 33 30 2.820 0.0365 3.3603 28 36 35 33 3.600 0.078 1.7004 30 33 34 31 3.540 0.0400 1.703Mean, Mj 27 32.5 33.5 30.75Spatial variability,VSj
1.22 2.64 1.45 1.77
Degraded 1 29 30 33 30 0.966 0.0121 3.3902 28 31 32 31 0.742 0.0077 3.3403 33 32 35 34 0.599 0.0077 1.7894 35 36 38 37 0.248 0.0031 1.774Mean, Mj 31.25 32.25 34.5 33Spatial variability VSj 4.06 3.68 2.75 3.49
Acacia 1 28 30 32 30 0.884 0.0114 3.5502 30 34 33 33 1.670 0.022 3.5603 34 36 37 36 1.003 0.0124 1.8964 35 36 38 37 1.790 0.0172 1.893Mean, Mj 31.75 34 35 34Spatial variability,VSj
2.66 2.21 2.50 2.44
B. Venkatesh et al. / Journal of Hydrology xxx (2010) xxx–xxx 7
moisture in the bottom layer than that of other two layers. As it hasbeen reported by many researchers (Montgomery et al., 1997;Uchida et al., 2002; Asano et al., 2002; Freer et al., 2004), the con-tribution of flow from bedrock to the soil may be another possibleexplanation for the persistence of soil moisture in the bottom andmiddle zones of these watersheds.
4.5. Temporal variability of soil moisture under three land covers
The temporal variation of mean soil moisture content within0–150 cm under three land covers is shown is Fig. 7. Also shownis the accumulated daily rainfall over weekly time steps for the en-tire study period. The seasonal variation of the mean soil moisturein all the land covers is apparent. As expected, increase or decreaseof mean soil moisture is associated with the occurrences of highand low rainfall amounts. Also three peaks in soil moisture contentare exhibited since the data period covers the monsoon season offour years. Similarly, four troughs are observed corresponding tothe dry season of each year.
In general, the peak moisture content value corresponds to theheaviest rainfall in the season. However, for smaller rainfall events,there are differences in the response of soil moisture under differ-ent land covers. For example, in the acacia and forested watershedsthe build up of soil moisture is at a slower rate compared to that in
Please cite this article in press as: Venkatesh, B., et al. Analysis of observed soiHydrol. (2010), doi:10.1016/j.jhydrol.2010.12.006
the degraded watershed. The accumulated amount of rainfallwhich is responsible for building up the soil moisture duringthe study period under the selected land covers is tabulated inTable 4. It can be seen from the results shown in Table 4 that, thisamount varies year to year and layer to layer. This could be due toantecedent moisture available in the soil. The influence of anteced-ent moisture on soil moisture build up is clearly evident during theyears 2007 and 2008 under degraded and acacia watersheds. Theresponse in the degraded watershed is relatively steep and soilmoisture peak is attained rapidly. The peak (field capacity) soilmoisture at the 50 cm layer was attained for lower amount of rain-fall (834 and 915 mm for 2007 and 2008 respectively). Similarly,recession in the degraded watershed is faster in comparison tothe other two watersheds. The recession is quite higher at 50 cmdepth in comparison to the other two layers. The average rate ofsoil moisture drying at this depth varies from 0.028 to 0.0342per week by volume in the year 2006–2007 and 2007–2008respectively. During the same period, a lower rate of drying wasobserved at 150 cm depth. A similar process is observed underthe acacia watershed. This clearly implies that, the use of moistureunder these watersheds is mostly confined to the first layer (up to50 cm depth) on account of plant water use. This result is only tobe expected since Acacia does not have a deep rooting system(Kallarackal and Somen, 2008).
l moisture patterns under different land covers in Western Ghats, India. J.
0
10
20
30
40
335 245 166 145Dist. from Watershed Outlet (m)
Mea
n S
oil M
oist
ure
(% v
/v)
Forested Watershed
0
10
20
30
40
320 125 95 85Dist. from Watershed Outlet (m)
Mea
n So
il M
oist
ure
(% v
/v)
Degraded Watershed
0
10
20
30
40
386 237 185 180Dist. from Watershed Outlet (m)
Mea
n S
oil M
oist
ure
(% v
/v)
Acacia Watershed
a
b
c
Fig. 6. Measured soil moisture at different slopes within each of the selectedwatersheds.
0
0.1
0.2
0.3
0.4
0.5
0.6
0.7
0.8
Oct
-04
Dec
-04
Feb-
05
Apr
-05
Jun-
05
Aug
-05
Oct
-05
Dec
-05
Feb-
06
Apr
-06
Jun-
06
Aug
-06
Oct
-06
Time (w
Vol
umet
ric
soil
moi
stur
e cm
3 /cm
3
(v/v
)
Rainfall Acacia
Fig. 7. Comparison of mean soil moistu
Table 4Salient features of the soil wetting and drying under different land covers.
Land cover Natural
Depth in cm 50
Accumulated rainfall up to attaining peak soil moisture (cm) 2005 13512006 14592007 14852008 993
Average drying rate of soil moisture/week (cm3/cm3) 2005–06 0.00932006–07 0.00422007–08 0.0053
8 B. Venkatesh et al. / Journal of Hydrology xxx (2010) xxx–xxx
Please cite this article in press as: Venkatesh, B., et al. Analysis of observed soiHydrol. (2010), doi:10.1016/j.jhydrol.2010.12.006
On the other hand, forested watershed required higher amountof rainfall (1485 and 993 mm respectively for 2007 and 2008) toreach the maximum soil moisture level. As observed by Lin et al.(2006), the antecedent soil moisture can influence the distributionof soil moisture and its build up in the forested watersheds. Therecession in the watershed is quite higher at 150 cm depth. Thisis due to the presence of roots, which use the moisture for theirphysiological activities especially during the post monsoon seasonwhen water is freely available (Kallarackal and Somen, 2008). Thisis further supported by the presence of higher mean moisture con-tent at this depth in the selected watershed. Similarly, Lin et al.(2006) reported consistently higher moisture content in deepersoil layers (0.91–1.09 m) of a forested watershed in central Penn-sylvania State, USA.
An ANOVA test was done to verify the influence of land cover onthe soil moisture at p < 0.01 significant level. The result indicatedno significant differences across the land covers. This may implythat parameters other than land cover may have an influence onthe soil moisture regime (e.g., Pellenq et al., 2003; Freer et al.,2004; Wilson et al., 2004). Similarly, ANOVA test was carried outfor soil moisture between different layers (i.e., 50–100 cm,100–150 cm and 50–150 cm) to evaluate the impact of land coversat these depths. The results (Table 5) show that there is no signif-icant difference in the mean soil moisture across the depths underAcacia and Degraded watersheds. However, the forested watershedshowed a significant difference (p < 0.01, LSD) in observed meansoil moisture at these depths.
4.6. Variation of soil moisture at different depths
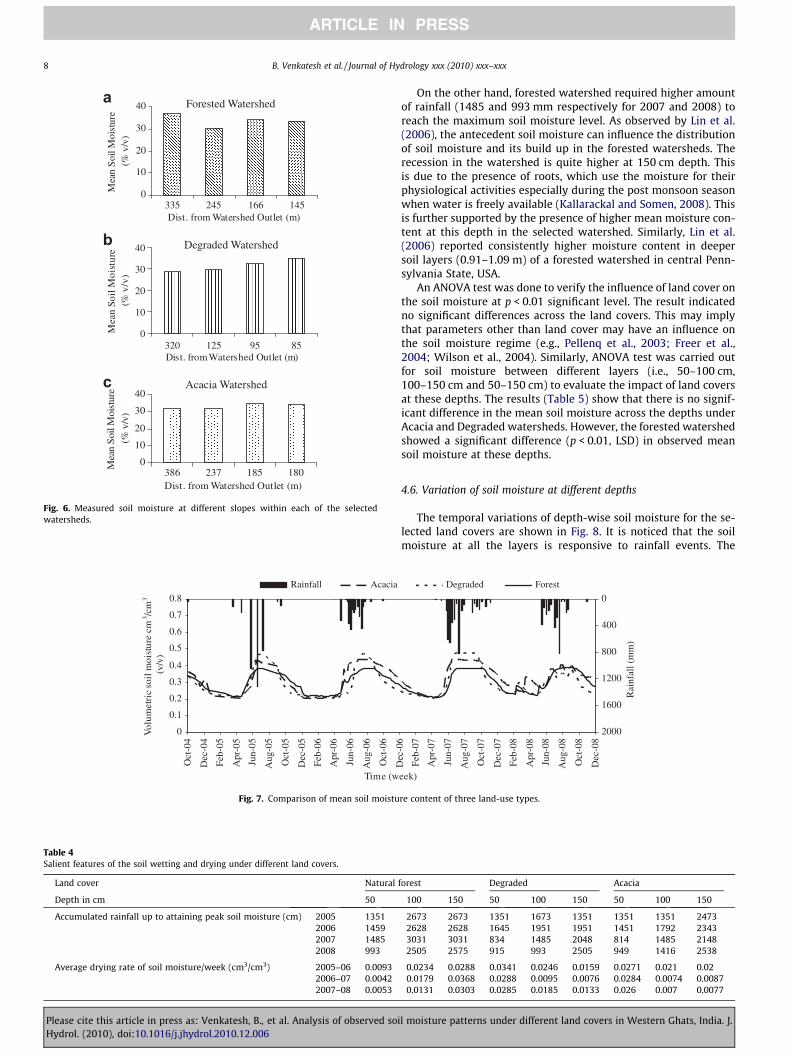
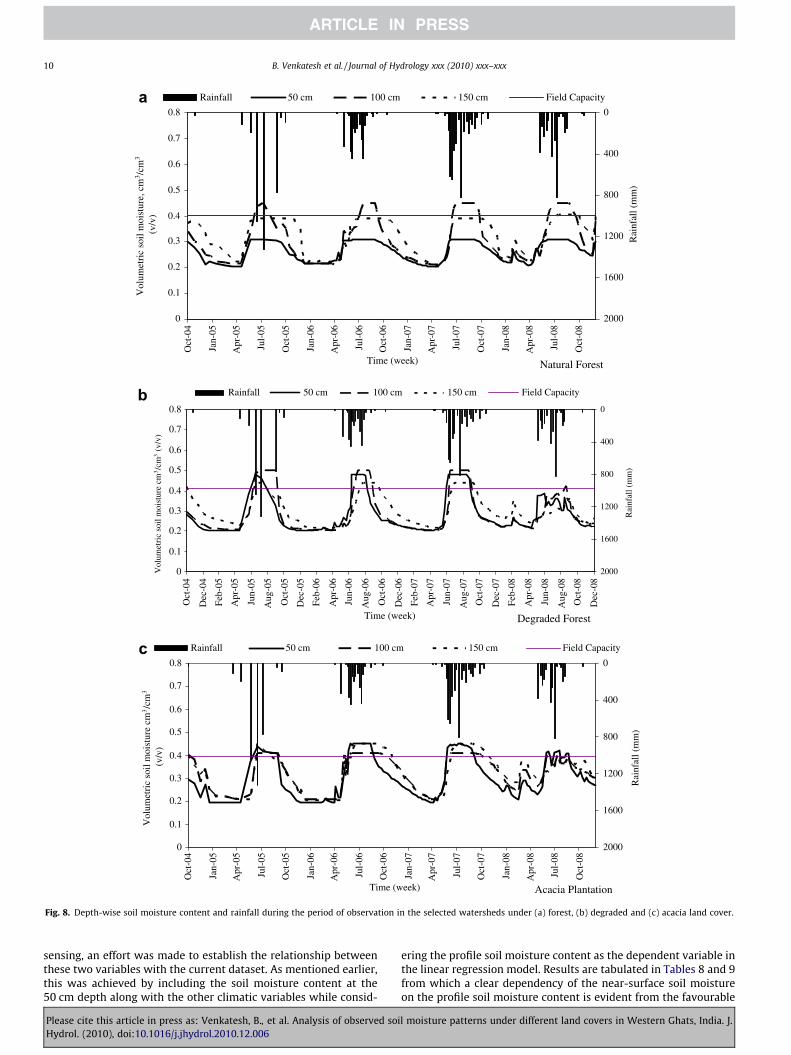
The temporal variations of depth-wise soil moisture for the se-lected land covers are shown in Fig. 8. It is noticed that the soilmoisture at all the layers is responsive to rainfall events. The
Dec
-06
Feb-
07
Apr
-07
Jun-
07
Aug
-07
Oct
-07
Dec
-07
Feb-
08
Apr
-08
Jun-
08
Aug
-08
Oct
-08
Dec
-08
eek)
0
400
800
1200
1600
2000
Rai
nfal
l (m
m)
Degraded Forest
re content of three land-use types.
forest Degraded Acacia
100 150 50 100 150 50 100 150
2673 2673 1351 1673 1351 1351 1351 24732628 2628 1645 1951 1951 1451 1792 23433031 3031 834 1485 2048 814 1485 21482505 2575 915 993 2505 949 1416 2538
0.0234 0.0288 0.0341 0.0246 0.0159 0.0271 0.021 0.020.0179 0.0368 0.0288 0.0095 0.0076 0.0284 0.0074 0.00870.0131 0.0303 0.0285 0.0185 0.0133 0.026 0.007 0.0077
l moisture patterns under different land covers in Western Ghats, India. J.
Table 5Comparison of mean soil moisture content across the soil layers through ANOVA test.
Land cover type Soil layer (cm) Difference in mean soil moisturecontent between layers (% v/v)
Forest 50–100 �3.99a
100–150 �5.412a
50–150 �1.423
Degraded 50–100 �0.0480100–150 �1.378450–150 �1.3303
Acacia 50–100 �1.528100–150 �0.900850–150 �2.429
a Mean soil moisture values are significant at P < 0.01 significant level.
B. Venkatesh et al. / Journal of Hydrology xxx (2010) xxx–xxx 9
wetting and drying of soil moisture is in agreement with rainfalloccurrences. The increase in the soil moisture at different layershows a lag, which indicates the movement of water through thesoil layers. This process suggests that the water infiltrated afterthe rainfall event moves faster through the soil profile to augmentthe soil moisture at lower soil layers (i.e., at 100 cm and 150 cm).Also, Fig. 8 depicts that the soil layer at 100 cm holds the maxi-mum moisture under degraded and forested watershed. Whereas,in the acacia watershed, the lower soil layer (at 150 cm) holds themaximum soil moisture. This can be due to lower rate of watermovement to the next soil layer under these land covers, or maybe contribution from lateral flow within the soil layer from theupslope due to change in the properties of saturated hydraulic con-ductivity. A similar observation was reported by Kroner and Jahr(2005) under a conifer forest in Thuringia, Germany. Zhou et al.(2001) reported that soil moisture under Eucalyptus and mixedforest was lower than the bare land catchment. The statisticsshown in Table 6 indicates that the lower most layer holds themaximum moisture with higher standard deviation in acacia andforested watersheds. On the other hand, the degraded watershedshows a higher standard deviation in the middle layer.
The field capacity of the soil was superimposed on the plot oftemporal variation of layer-wise soil moisture (Fig. 8). This permitsvisualization of the resident time of the soil moisture at fieldcapacity under the selected watersheds. From this plot it can beseen that soil moisture in the deeper layer (150 cm) under forestedwatershed is maintained at a higher level for longer time durationin comparison to the degraded watershed, where the moisturerecession is quite faster. Whereas under the acacia plantation, itis noticed that soil moisture in entire profile have similar residenttime but lesser than that of forested watershed. The most impor-tant observation made is that, soil moisture in the upper layer(at 50 cm) of forested watershed did not reach the field capacityduring the study period.
4.7. Relationship between soil moisture at various depths
Soil moisture is an important component and a key mediatorbetween land surface and atmospheric interactions. The variationof soil moisture across different land covers under varying climaticconditions needs to be probed for better understanding how thisquantity varies over different time-scales and at different depths.These variations may be assessed by the strength of correlationsand cross-correlations between soil moisture content in the top-layer (0–50 cm) and moisture content in the other layers underin each land cover. Such analyses may provide an opportunity todetermine the lag for attaining maximum correlation and howthese correlations and lags vary across the land covers. The resultsobtained are tabulated in Table 7. It is found that a strong correla-tion exists between all the layers across all the land covers. The
Please cite this article in press as: Venkatesh, B., et al. Analysis of observed soiHydrol. (2010), doi:10.1016/j.jhydrol.2010.12.006
highest correlation is observed in acacia between soil moisture atthe 100 cm depth with that at 150 cm depth. The lowest correla-tion is exhibited between moisture contents at 50 cm and150 cm depths in the degraded watershed.
Soil moisture levels are also modified by the movement ofwater in and out of the layer, and due to root uptake from eachlayer. Therefore, an analysis was undertaken to establish time-lagrelationships by lagging the soil moisture time series betweenany two depths by 1 week, 2 weeks and so on. The lag durationwhich yielded highest correlation coefficient between the two timeseries was identified. The results shown in Table 7 suggest that thecorrelation between soil moisture content in 50 cm and 100 cmdepths is highest under all the land covers and no lag was needed.This suggests, in the first few soil layers, the movement of water isfaster. A similar analysis between 50 cm and 150 cm suggests that,there is a lag varying between 1 and 2 weeks, indicating the slowermovement of water below 100 cm depth in these watersheds. Theresults obtained here are in agreement with the observations madeby Mahmood and Hubbard (2007) under varying land covers andclimatic conditions of USA. Similarly Lin et al. (2006) reported thatin humid tropical forested watersheds, the sub-surface soil mois-ture is mostly dependent on the combined effect of topographyand soil characteristics. Since these monitoring points are locatedon slopes, the water moving from upper slope to lower levelsmay contribute to soil moisture at 100 cm and 150 cm. This phe-nomenon may be responsible for not showing any lag-time be-tween the 50 cm and 100 cm layers and between the 100 cm and150 cm layers. Also, the soil moisture augmentation in thesewatersheds may be more due to the lateral movement of waterwithin the soil layer than the vertical movement of water.
4.8. Development of soil moisture prediction models
An attempt was made to relate the soil moisture observed at 4spatial locations under acacia, degraded forest and natural forestwith at-site meteorological parameters and soil moisture variablesin the respective watersheds. As described in Article (3.0), a linearmodel (Eq. (9)) was used for the purpose. Table 8 shows regressioncoefficients of the independent variables for the prediction modelsat three soil depths and for the profile mean along with R2 andRMSE values. Values of R2 greater than 0.9 and small values ofRMSE for all cases indicate that the performance of all the devel-oped models is reasonably good. From the regression coefficientsit can be seen that the influence of rainfall, relative humidity andair temperature on the soil moisture at different depths is small.The largest values of coefficients are associated with the anteced-ent moisture condition (AMC) variable, thereby indicating itsimportance. Also, both R2 and RMSE values show some improve-ment with the inclusion of soil moisture of the immediate upperlayer. However, the relationship developed for 150 cm depth underacacia showed no significant impact of soil moisture observed at100 cm. Whereas for the same depth under forest show a greatersignificance in the relationship. This clearly indicates that the soilmoisture at the 150 cm depth is augmented by the movement ofwater from upper soil layer under forested watershed. The signs(positive or negative) associated with the regression coefficientsof the variables reflect the nature of relationship with soil mois-ture. For example, the negative coefficient for relative humiditymay be indicative of the processes of evapotranspiration which isdirectly related to the wetting and drying up of soil.
4.9. Relationship between near-surface soil moisture and profile soilmoisture
In an effort to aid estimation of profile soil moisture contentfrom near-surface soil moisture derived from satellite remote
l moisture patterns under different land covers in Western Ghats, India. J.
0
0.1
0.2
0.3
0.4
0.5
0.6
0.7
0.8
Oct
-04
Dec
-04
Feb-
05
Apr
-05
Jun-
05
Aug
-05
Oct
-05
Dec
-05
Feb-
06
Apr
-06
Jun-
06
Aug
-06
Oct
-06
Dec
-06
Feb-
07
Apr
-07
Jun-
07
Aug
-07
Oct
-07
Dec
-07
Feb-
08
Apr
-08
Jun-
08
Aug
-08
Oct
-08
Dec
-08
Time (week)
Vol
umet
ric
soil
moi
stur
e cm
3/c
m3 (
v/v)
0
400
800
1200
1600
2000
Rai
nfal
l (m
m)
Rainfall 50 cm 100 cm 150 cm Field Capacity
Degraded Forest
0
0.1
0.2
0.3
0.4
0.5
0.6
0.7
0.8
Oct
-04
Jan-
05
Apr
-05
Jul-
05
Oct
-05
Jan-
06
Apr
-06
Jul-
06
Oct
-06
Jan-
07
Apr
-07
Jul-
07
Oct
-07
Jan-
08
Apr
-08
Jul-
08
Oct
-08
Time (week)
Vol
umet
ric
soil
moi
stur
e cm
3/c
m3
(v/v
)
0
400
800
1200
1600
2000
Rai
nfal
l (m
m)
Rainfall 50 cm 100 cm 150 cm Field Capacity
Acacia Plantation
0
0.1
0.2
0.3
0.4
0.5
0.6
0.7
0.8
Oct
-04
Jan-
05
Apr
-05
Jul-
05
Oct
-05
Jan-
06
Apr
-06
Jul-
06
Oct
-06
Jan-
07
Apr
-07
Jul-
07
Oct
-07
Jan-
08
Apr
-08
Jul-
08
Oct
-08
Time (week)
Vol
umet
ric
soil
moi
stur
e, c
m3 /c
m3
(v/v
)
0
400
800
1200
1600
2000
Rai
nfal
l (m
m)
Rainfall 50 cm 100 cm 150 cm Field Capacity
Natural Forest
a
b
c
Fig. 8. Depth-wise soil moisture content and rainfall during the period of observation in the selected watersheds under (a) forest, (b) degraded and (c) acacia land cover.
10 B. Venkatesh et al. / Journal of Hydrology xxx (2010) xxx–xxx
sensing, an effort was made to establish the relationship betweenthese two variables with the current dataset. As mentioned earlier,this was achieved by including the soil moisture content at the50 cm depth along with the other climatic variables while consid-
Please cite this article in press as: Venkatesh, B., et al. Analysis of observed soiHydrol. (2010), doi:10.1016/j.jhydrol.2010.12.006
ering the profile soil moisture content as the dependent variable inthe linear regression model. Results are tabulated in Tables 8 and 9from which a clear dependency of the near-surface soil moistureon the profile soil moisture content is evident from the favourable
l moisture patterns under different land covers in Western Ghats, India. J.

Table 6Temporal variations of soil moisture in selected land uses.
Land cover Depth (cm) Mean (cm3/cm3) Standard deviation (r)
Forest 50 27.00 4.12100 32.50 8.68150 33.50 7.29
Degraded 50 31.25 10.16100 32.25 10.93150 34.50 8.27
Acacia 50 31.75 9.69100 34.00 8.39150 35.00 9.78
Table 7Relationship between soil moisture at various depths.
Land cover Statistic 50 cm vs100 cm
50 cm vs150 cm
100 cm vs150 cm
Forest Correlation 0.926a 0.840a 0.830a
Cross-correlation 0.926(0) 0.851(1) 0.830(0)
Degraded Correlation 0.908a 0.694a 0.851a
Cross-correlation 0.908(0) 0.784(2) 0.875(1)
Acacia Correlation 0.916a 0.904a 0.984a
Cross-correlation 0.916(0) 0.926(1) 0.984(0)
Values in parenthesis are lag time in weeks.a Values are significant at p < 0.01 significant level.
Table 9Performance indices of soil moisture prediction models in validation phase.
Landcover
Depth(m)
Previous layer Performance statistics
0.5 1.0 RMSE MAE AIC R2
Forest 0.5 – – 0.0111 0.0068 �246.37 0.9511.0 – – 0.0218 0.0139 �181.27 0.9671.0 Included – 0.0292 0.0261 �149.85 0.9721.5 – – 0.0290 0.0165 �90.24 0.6141.5 – Included 0.2419 0.238 �63.71 0.792PM – – 0.0184 0.0112 �198.69 0.953PM Included – 0.0216 0.0189 �182.63 0.953
Degraded 0.5 – – 0.0274 0.0145 �148.99 0.8761.0 – – 0.0186 0.0136 �185.20 0.9581.0 Included – 0.0197 0.0138 �177.78 0.9531.5 – – 0.0198 0.0122 �179.89 0.8041.5 – Included 0.0176 0.110 �188.31 0.853PM – – 0.0211 0.0131 �173.57 0.777PM Included – 0.0210 0.0144 �172.14 0.838
Acacia 0.5 – – 0.0231 0.0158 �170.80 0.9341.0 – – 0.0241 0.0141 �166.31 0.8581.0 Included – 0.0157 0.0104 �208.32 0.9471.5 – – 0.0213 0.0128 �178.49 0.7781.5 – Included 0.0215 0.0129 �177.42 0.780PM – – 0.0207 0.0128 �180.90 0.891PM Included – 0.0140 0.0099 �219.47 0.965
B. Venkatesh et al. / Journal of Hydrology xxx (2010) xxx–xxx 11
values of performance statistics. A t test was carried out to checkthe significance of the coefficients of the equation and showedno significant change in the values of the coefficients at p < 0.001.
4.10. Validation of soil moisture prediction models
This section describes the performance of the regression modelsin predicting the soil moisture content for data which was not usedin calibration (i.e., data for January 2008–December 2008). Perfor-mance indices of MAE, RMSE, AIC and R2 computed for the valida-tion phase shown in Table 9. The variations of these indices are
Table 8Multiple linear regression models developed for the prediction of soil moisture content at
Land cover Variables Intercept Regressio
SM50 SM100 Rainfall (
Natural forest SM50 0.0036 – – 2.84 � 10SM100 0.0224 – – 7.17 � 10
�0.0010 0.1672 – 6.26 � 10SM150 0.2181 – – 6.7 � 10�
0.221 – 0.468 7.28 � 10SMPM
a 0.0104 – – 4.99 � 10�0.0048 0.260 – 3.526 � 1
Degraded SM50 0.0140 – – 7.84 � 10SM100 0.0248 – – 8.17 � 10
�0.00435 0.3678 � 2.72 � 10SM150 �0.01178 – – 4.64 � 10
�0.00325 – 0.162 2.88 � 10SMPM
a 0.00819 – – 6.79 � 100.00231 0.370 – 1.93 � 10
Acacia SM50 0.0378 – – 7.6 � 10�
SM100 0.0493 – – 5.8 � 10�
0.0508 0.421 – ��1 � 1SM150 0.0237 – – 6.81 � 10
0.0176 – 0.0925 6.58 � 10SMPM
a 0.0327 – – 6.58 � 100.0422 0.5005 – �2.6 � 1
RMSE: root mean square error. AMC: antecedent soil moisture content at weekly time sa Represents the relation between the near-surface soil moisture with the profile mea
Please cite this article in press as: Venkatesh, B., et al. Analysis of observed soiHydrol. (2010), doi:10.1016/j.jhydrol.2010.12.006
shown in Fig. 9. It can be seen that RMSE constantly increases withthe depth in the forested watershed (Fig. 9a), whereas it decreaseswith depth in the degraded watershed. RMSE values in the acaciawatershed are initially low and increase up to 100 cm depth andthen converge to the value for degraded land cover at 150 cmdepth.
MAE values decline with depth under the acacia and degradedcovers (Fig. 9b). However, estimates under forested watershedshow a steady increase in the values. Similarly, the values of R2
steadily (Fig. 9a) decreased with the increase with the depth underall the land covers. The estimates of AIC (Fig. 9b) follow the sametrend as MAE.
Overall, the performance of all the models in the validation isreasonably good. They can be used with confidence in conditionsthat are similar to the ones in the study area.
different depths.
n coefficients for R2 RMSE
P0) mm RH (%) Temp. (�C) AMC
�5 5.54 � 10�7 0.00072 0.905 0.950 0.0123�5 2.04 � 10�6 �0.0002 0.922 0.969 0.0213�5 2.1 � 10�6 �0.0002 0.859 0.970 0.02086 1.01 � 10�6 �0.0045 0.626 0.848 0.0375�5 2.54 � 10�6 �0.0054 0.273 0.913 0.0288�5 1.23 � 10�6 0.00023 0.929 0.967 0.01530�5 1.22 � 10�6 �0.00022 0.794 0.976 0.0136�5 0.00033 �0.00024 0.853 0.959 0.0258�5 0.000565 �0.00168 0.877 0.965 0.0258�5 0.000266 �0.00091 0.646 0.978 0.0206�5 0.000526 �0.0003 0.906 0.970 0.0175�5 0.000317 2.1 � 10�7 0.755 0.978 0.0150�5 0.000457 0.00071 0.884 0.977 0.0176�5 0.000209 �0.0002 0.597 0.992 0.01645 1.93 � 10–6 �0.00092 0.890 0.957 0.02575 �1.4 � 10�6 �0.00076 0.890 0.937 0.0275
0�5 �2.3 � 10�6 �0.00097 0.518 0.960 0.021�5 1.59 � 10�6 �4.2 � 10�5 0.911 0.939 0.029�5 9.88 � 10�7 4.53 � 10�5 0.834 0.939 0.029�5 �8.1 � 10�7 �0.00038 0.910 0.956 0.0235
0�6 �1.6 � 10�6 �0.00082 0.454 0.981 0.0155
tep.n soil moisture.
l moisture patterns under different land covers in Western Ghats, India. J.

12 B. Venkatesh et al. / Journal of Hydrology xxx (2010) xxx–xxx
5. Summary and conclusions
An experimental study was carried out to understand spatio-temporal variability of soil moisture under different land covers(acacia, degraded forest, forest) in watersheds located in theWestern Ghats mountain ranges of Karnataka State, India. Results
Fig. 9. Plot of performance indices used for vali
Please cite this article in press as: Venkatesh, B., et al. Analysis of observed soiHydrol. (2010), doi:10.1016/j.jhydrol.2010.12.006
indicated that there is no significant difference in the mean soilmoisture content between the three land covers considered. Thisclearly indicates that soil moisture is not only influenced by landcover but also by other parameters. Also, an attempt was madeto understand the relationships between soil moisture in differentlayers within each of the selected land covers through correlation
dating the soil moisture prediction models.
l moisture patterns under different land covers in Western Ghats, India. J.
B. Venkatesh et al. / Journal of Hydrology xxx (2010) xxx–xxx 13
analysis. The prominent finding of this analysis is the existence ofstrong correlation and cross correlation between soil moisture atdifferent depths. The lag influence of rainfall on soil moisturewas found only in the degraded watershed.
Multiple linear regression models were developed for predic-tion of soil moisture from climatic variables, antecedent moistureand moisture in the adjacent upper layer and found to perform rea-sonably well both in calibration and validation phases. A similarrelationship was developed to predict profile mean moisture fromclimatic variables and near-surface soil moisture, which may proveuseful in studies utilizing estimates of surface soil moisture fromsatellite remote sensing.
Based on overall results of this study, it can be concluded thatthe selected watersheds can be considered as hydrological respon-sive units with respect to soil moisture soil moisture variabilitysince no significant spatial and temporal variations across differentland covers was evident. These results may also prove useful indeveloping more physically realistic representations of the vadozezone component in catchment-scale hydrological models.
Acknowledgment
The authors wish to thank the Director, National Institute ofHydrology, India for his kind approval to set-up the experimentalwatersheds and to publish this work. Thanks are due to the projectofficers and other field personnel who helped us in carrying out thefield work. We also thank two anonymous reviewers whose sug-gestions greatly helped to improve the quality of this manuscript.
References
Asano, Y., Uchida, T., Ohte, N., 2002. Residence times and flow paths of water insteep un-channeled catchments, Tanakami, Japan. Journal of Hydrology 261,173–192.
Bell, K.R., Blanchard, R.J., Schmugge, T.J., Witczak, M.W., 1980. Analysis of surfacemoisture variations within large field sites. Water Resource Research 16 (4),796–810.
Bhat, D.M., Murali, K.S., Ravindranath, N.H., 2002. Comparison of Field Performanceof Two Exotic Species: Acacia Auriculiformis and Cassia Siamea in Hilly andHigh Rainfall Zone of Uttara Kannada District, Western Ghats, Southern India,Technical Report No. 93, Centre for Ecological Sciences, Indian Institute ofScience, Bangalore, India.
Bourgeon, G., 1989. Explanatory Booklet on the Reconnaissance of Soil Map ofForest Area: Western Karnataka and Goa, Instiut Francia de Pondichery,Pondicherry.
Brocca, L., Morbidelli, R., Melone, F., Moramarco, T., 2007. Soil moisture spatialvariability in experimental areas of central Italy. Journal of Hydrology 333,356–373.
Calder, I.R., Hall, R.L., Adlard, P.G., 1992. Growth and Water Use of ForestPlantations. John Wiley & Sons, Chichester, England. 381p..
Crave, A., Gascuel-odux, C., 1997. The influence of topography on the time and spacedistribution of soil surface water content. Hydrological Process 11, 203–210.
Famiglietti, J.S., Rudnicji, J.W., Rodell, M., 1998. Variability in surface moisturecontent along a hillslope transect: Rattlesnake Hill, Texas. Journal of Hydrology210, 259–281.
Fernandez-Galvez, J., Simmonds, L.P., Barahona, E., 2006. Estimating detailed soilwater profile records from point measurement. European Journal of Soil Science57, 708–718.
Freer, J., Mc Donnel, J.J., Beven, K.J., Peter, N.E., Burnd, D.A., Hooper, R.P., Aulenbach,B., Kendall, C., 2004. Role of bedrock topography on subsurface storm flow.Water Resources Research 38, 1269.
Fu, B., Chen, L., 2000. Agricultural landscape spatial pattern analysis in the semi-aridhill area of the Loess Plateau, China. Journal of Arid Environments 44 (3),291–303.
Fu, B., Wang, J., Chen, L., Qiu, Y., 2003. The effect of land use on soil moisturevariation in the Danangou catchment of the Loess Plateau, China. Catena 54,197–213.
Gadgil, M., 1987a. Depleting renewable resources: a case study from KarnatakaWestern Ghats. Indian Journal of Agricultural Economics 42, 376–387.
Gadgil, M., 1987b. An Operational Research Programme for Integrated Developmentof Microcatchments in Uttara Kannada District: A Proposal, Technical ReportNo. 49, Centre for Ecological Sciences, Indian Institute of Science, Bangalore,India.
Hodnett, M.G., Bell, J.P., 1986. Soil moisture investigation of groundwater rechargethrough black cotton soils in Madhya Pradesh, India. Hydrological SciencesJournal 31 (3), 361–381.
Please cite this article in press as: Venkatesh, B., et al. Analysis of observed soiHydrol. (2010), doi:10.1016/j.jhydrol.2010.12.006
Jackson, T.J., 1993. III Measuring surface soil moisture using passive microwaveremote sensing. Hydrological Processes 7, 139–152.
Jha, C.S., Dutt, C.B.S., Bawa, K.S., 2000. Deforestation and land use changes inWestern Ghats, India. Current Science 79 (2), 231–238.
Kallarackal, J., Somen, C.K., 2008. Water loss from tree plantations in the tropics.Current Science 94 (2), 201–210.
Kamath, S.U. (Ed.), 1985. Karnataka State Gazetteer: Uttara Kannada District.Gazetter of India. (Government of Karnataka: Bangalore).
Kim, S., Lee, H., Woo, C., Nam, Kim, J., 2007. Soil moisture monitoring on a steephillside. Hydrological Processes 21 (21), 2910–2922.
Kroner, C., Jahr, T., 2005. Hydrological experiments around thesuperconducting gravimeter at moxa observatory. Journal of Geodynamics 41(1–3), 268–275.
Lélé, Sharachchandra, Hegde, Gurupada T., 1997. Potential herblayer productionand grazing effects in anthropogenic savannahs in the moist tropical forests ofthe Western Ghats of India. Tropical Grasslands 31(6), 574–587.
Lele, S., 1993, Degradation, Sustainability, or Transformation: A Case Study ofVillagers’ Use of Forest Lands in the Malnaad Region of Uttara Kannada District,India’’, Ph.D. Thesis, Energy & Resources Group, University of California,Berkeley.
Lin, H.S., Kogelmann, W., Walker, C., Bruns, M.A., 2006. Soil moisture patterns in aforested catchment: a hydropedological perspective. Geoderma 131,345–368.
Longobardi, A., 2008. Observing soil moisture temporal variability under fluctuatingclimatic conditions. Hydrology and Earth System Science 5, 935–969.
Mahmood, R., Hubbard, K.G., 2007. Relationship between soil moisture ofnear surface and multiple depths of the root zone under heterogeneous landuses and varying hydro climatic condition. Hydrological Processes 21, 3449–3462.
Mani, A., 1985. Agrarian Technology and Eco-degradation of Betta Forests in SalkaniVillage in North Kanara district, Karnataka, Technical Report No. 1, Centre forEcological Sciences. Indian Institute of Science, Bangalore, India.
Merz, B., Plate, E.J., 1997. An analysis of the effect of spatial variability of soil andsoil moisture on runoff. Water Resources Research 33, 2909–2922.
Mishra, B.K., Hegde, M.S., Subramanian, D.K., Prasad, S.N., 1985. Studies in VillageEcosystems of North Kanara District of Karnataka, Technical Report No. 12,Centre for Ecological Sciences, Indian Institute of Science, Bangalore, India.
Montgomery, D.R., Dietrich, W.E., Torres, R., Anderson, S.P., Loague, K., 1997.Piezometric response of a small catchment. Water Resources Research 33,91–110.
Moore, I.D., Burch, G.J., Mackenzie, D.H., 1988. Topographic effects on thedistribution of surface soil water and the location of ephemeral gullies.Transactions of the American Society of Agriculture Engineering 31, 1098–1107.
Nadkarni, M.V., Pasha, S.A., Prabhakar, L.S., 1989. The Political Economy of ForestUse and Management. Sage Publications, New Delhi.
Nandagiri, L., Kovoor, G.M., 2006. Performance evaluation o referenceevapotrasnpiration equations across a range of indian climates. Journal ofIrrigation and Drainage Engineering, ASCE 132 (3), 238–249.
Pascal, J.P., 1986. Explanatory Booklet on the Forest Map of South India, Travaux dela Section Scientifique et Technique, Hors Série No. 18, French Institute,Pondicherry.
Pellenq, J., Kalma, J., Boulet, G., Wooldrudge, S., Kerr, Y., Chehbouni, A., 2003. A dis-aggregation scheme for soil moisture based on topography and soil depth.Journal of Hydrology 275, 112–127.
Prasad, S.N., Hegde, H.G., 1986. Community forest for the degraded, high rainfalltracts of peninsular India. International Tree Crops Journal 4, 57–67.
Prasad, S.N., Hegde, M.S., Gadgil, M., Hegde, K.M., 1985. An experiment in eco-development in Uttara Kannada district of Karnataka. South AsianAnthropologist 6 (1), 73–83.
Priya, D., Arjun, M., Pratjeesj, C.M., Carrigues, J.P., Puryavaud, J.P., Roessingh, Krista,2007. Forest degradation in Western Ghats biodiversity hotspot, Resourcescollection, livelihood concerns and sustainability. Current Science 93 (11),1573–1578.
Qiu, Y., Fu, B., Wang, J., Chen, L., 2001. Soil moisture variation in relation totopography and land use in a hillslope catchment of the loess plateau, China.Journal of Hydrology 240, 243–263.
Qiu, Y., Fu, B., Wang, J., Chen, L., 2003. Spatiotemporal prediction of soil moisturecontent using multiple-linear regression in a small catchment of the LoessPlateau, China. Catena 54, 173–195.
Rai, N.D., 2004. The Socio-economic and Ecological Impact of Garcinia gumm-guttaFruit Harvest in the Western Ghats, India. Forest Products, Livelihoods andConservation. Case Studies of Non-Timber Forest Product Systems. Volume 1-Asia. Edited by Koen Kusters and Brian Belcher. CIFOR, pp. 23:42.
Reddy, A.N.Y., Sarmah, D., Pande, P., Narvekar, G.B., Gouda, B. S., Yekanthappa, K.,1986. Integrated Approach for Eco-development of Uttara Kannada District,Office of the Conservator of Forests, Canara Circle, Karnataka ForestDepartment, Dharwad, Mimeo.
Rodriguez-Iturbe, I., 2000. Eco-hydrology: a hydrologic perspective of climate-soil-vegetation dynamics. Water Resources Research 36, 3–9.
Teuling, A.J., Uijlenhoet, R., Hupet, F., Van Loon, E.E., Troch, P.A., 2006. Estimatingspatial mean root zone moisture from point scale observations. Hydrology EarthSystem Science 10, 755–767.
Uchida, T., Kosugi, K., Mizuyama, T., 2002. Effect of pipeflow and bedrockgroundwater on runoff generation at a speed headwater catchment Ashiu,Central Japan. Water Resources Research 38 (7), 1119. doi:10.1029/2001WR000261.
l moisture patterns under different land covers in Western Ghats, India. J.

14 B. Venkatesh et al. / Journal of Hydrology xxx (2010) xxx–xxx
Van Genuchtern, M.Th, 1980. A closed form equation for predicting the hydraulicconductivity of unsaturated soils. Soil Science Society of America Journal 44,892–898.
Vandana, S., Bondhopadhdyay, J., 1983. Eucalyptus – a disastrous tree for India.Ecologist 13, 184–187.
Venkatesh, B., Lakshman Nandagiri, Purandara, B.K., Reddy, V.B., 2010. Variability ofsoil hydrologic characteristics under different land covers a case study fromSahayadri mountains, India. In: Proceedings of National Seminar on SustainableWater Resources Management’’, Organised by NITK, Surathkal, India, 7–9 Jan2010.
Vischel, T., Pegram, G.G.S., Sinclair, S., Wagner, W., Bartsch, A., 2008. Comparison ofsoil moisture fields estimated by catchment modeling and remote sensing: acase study in South Africa. Hydrology Earth System Science 12, 751–767.
Please cite this article in press as: Venkatesh, B., et al. Analysis of observed soiHydrol. (2010), doi:10.1016/j.jhydrol.2010.12.006
Western, A.W., Bloschl, G., 1999. On spatial scaling of soil moisture. Journal ofHydrology 217, 203–224.
Western, A.W., Grayson, R.B., Bloschl, G., Willgoose, G.R., McMohan, T.A., 1999.Observed spatial organization of soil moisture and its relation to terrain indices.Water Resources Research 35 (3), 797–810.
Wilson, D.J., Western, A.W., Grayson, R.B., 2005. A terrain and data based method forgenerating the spatial distribution of soil moisture. Advances in WaterResources 28, 43–54.
Zhou, G.Y., Morris, J.D., Yan, J.H., Yu, Z.Y., Peng, S.L., 2001. Hydrological impacts ofreafforestation with eucalyptus and indigenous species: a case study inSouthern China. Forest Ecology and Management 167 (1–3), 209–222.
l moisture patterns under different land covers in Western Ghats, India. J.
Related Documents


![GEOGRAPHY - KopyKitab... distinguish between western ghats and eastern ghats [4m] c)What is drainage basin [2m] ... Difference between Western ghats and Eastern ghats [2m]](https://static.cupdf.com/doc/110x72/5aa043b77f8b9a7f178ddf76/pdfgeography-kopykitab-distinguish-between-western-ghats-and-eastern-ghats.jpg)