Buyographics Matt Carmichael @buyographics

Buyographics - Presented to Waubonsee Community College, 2014
Aug 18, 2015
Welcome message from author
This document is posted to help you gain knowledge. Please leave a comment to let me know what you think about it! Share it to your friends and learn new things together.
Transcript

BuyographicsMatt Carmichael@buyographics


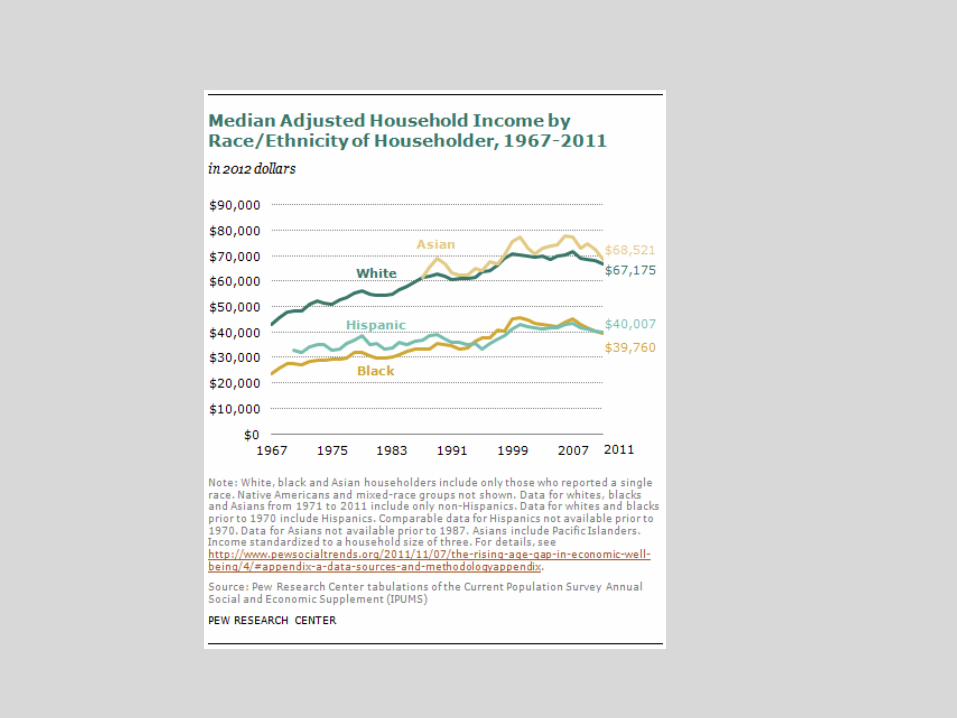
America is an aging nation Many Boomers have $ Sell to customers with $


Black
Hispanic
Asian
All Minoriti
es
Single
Women
Under 30
0%10%20%30%40%50%60%70%80%90%
100%Demographics win in the long term


Demographics, personified


Location: Teton County, Mt.Generation: BoomerRace/Ethnicity: White, non-HispanicHousehold: Married, 3 kids
Location: Los Angeles CountyGeneration: BoomerRace/Ethnicity: White, HispanicHousehold: Married, 2 kids
Location: New York CountyGeneration: MillennialRace/Ethnicity: BlackHousehold: Boyfriend + roommate


Ten stories? Or two?


A nice, middle-class home


The middle class today
The freedom to make some choices without the pressure to make others.


The most important problem that we are facing today is rising inequality. Robert Shiller, Nobel-winning economist


Location: Champaign, ILGeneration: MillennialRace/Ethnicity: White, non-HispanicHousehold: Unmarried partner


#amiright?!?


#letsdance


How Journalists Count
1… 2

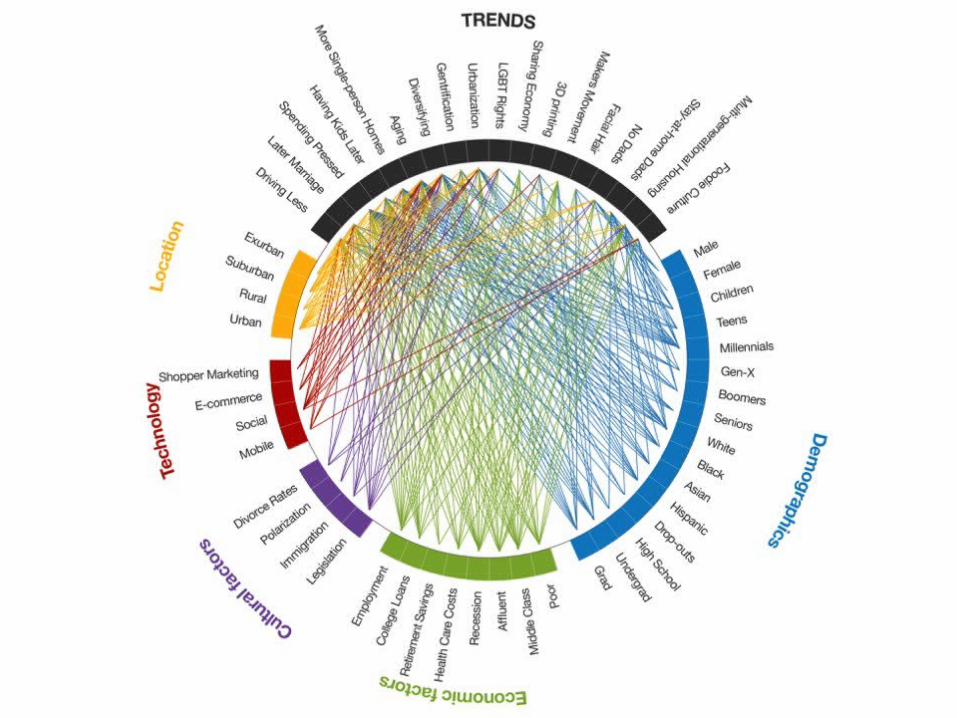
T R E N D

Mobile tech Married later
Woman
Living at home
Helicopter parentsUrban
Renter
Driving less
twenty-something
Bi-racial couple Full-time worker
middle-class
Entitled
“The Monocle Returns”
“In a New Trend in Hair Removal, Women Prefer the Natural Look”
“Baby Boomers Are Drawn to Green and Eco-Friendly Funerals”
We have reached Peak___ Auto/Beard/Oil
_______ is the future
“Online Merchants Home In on Imbibing Consumers”
“It’s Hip to Be Round – Potbellies are in”

Decline in Detroit
Detroit's decline has been going on for a long while. In the face of growing foreign and domestic competition, auto companies merged, or quit, or moved out of town to get closer to markets. Automation began replacing workers in the plants that remained. In the past seven years, Chrysler, the city's biggest employer, has dropped from 130,000 to 50,000 workers. The U.S. Government lists Detroit as an area of "substantial and persistent unemployment.''
Time Magazine

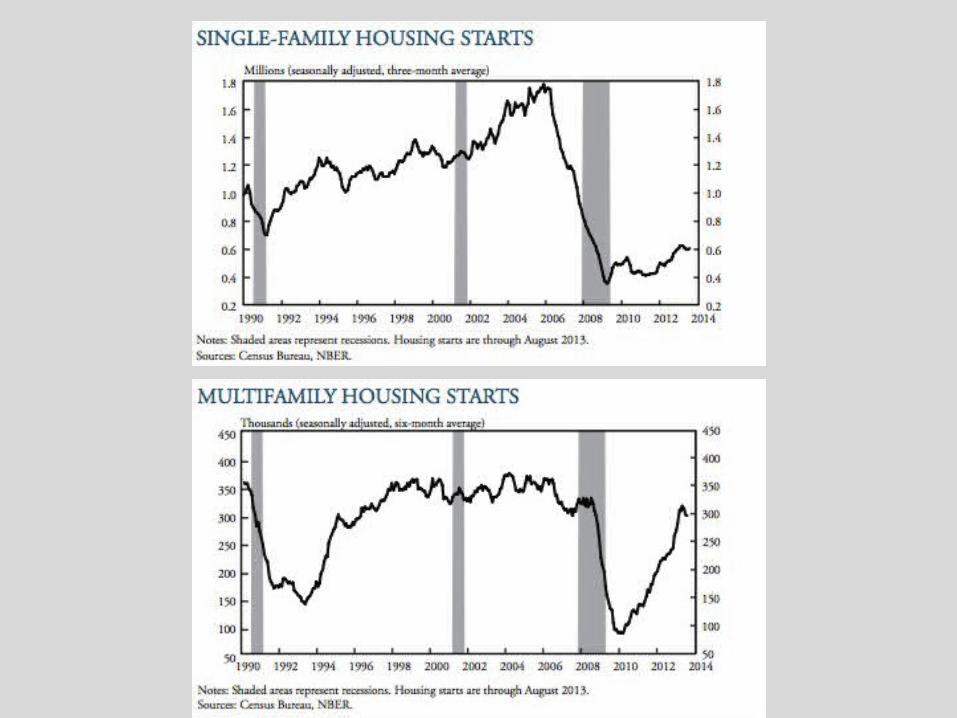
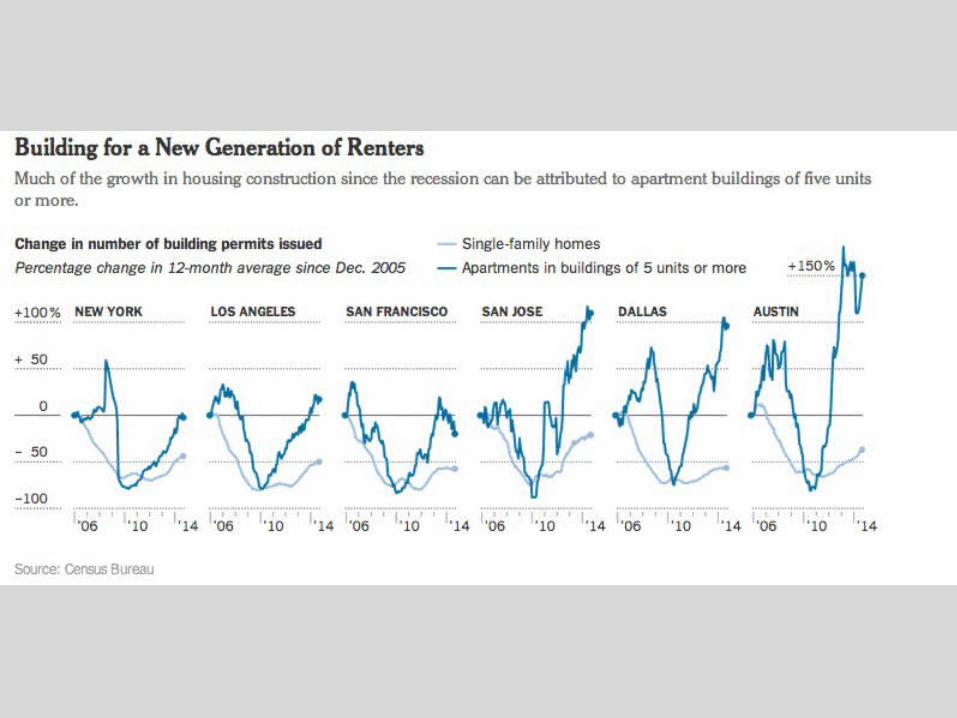
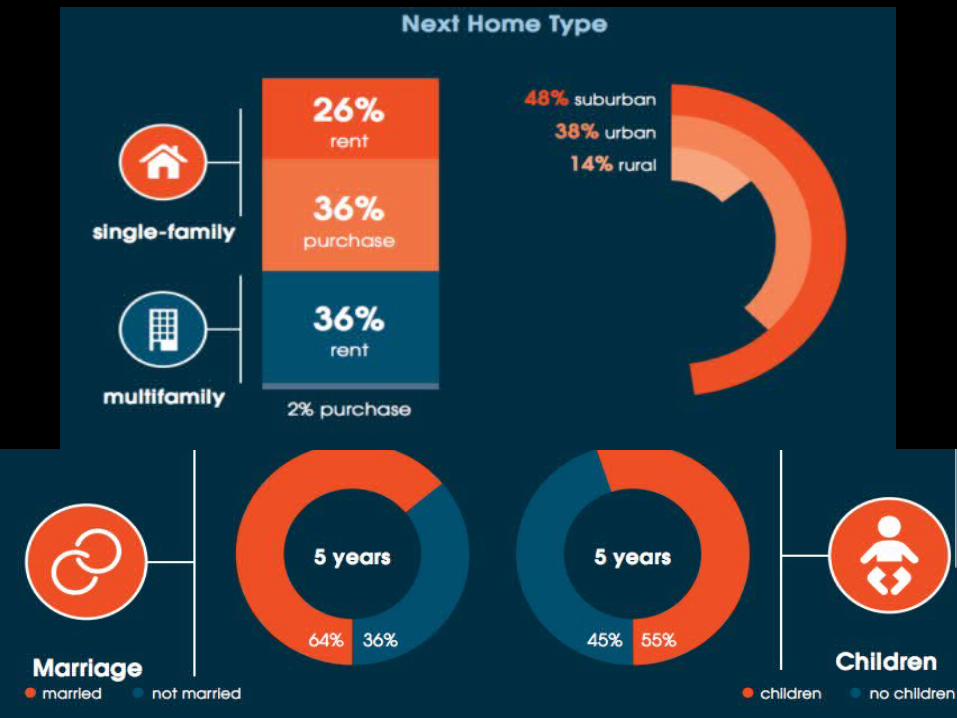
Millennials are buying fewer homes than previous generations

Home ownership rates have dropped

Home ownership changes: economic + demographic


Delayed household formation: The student loan equation
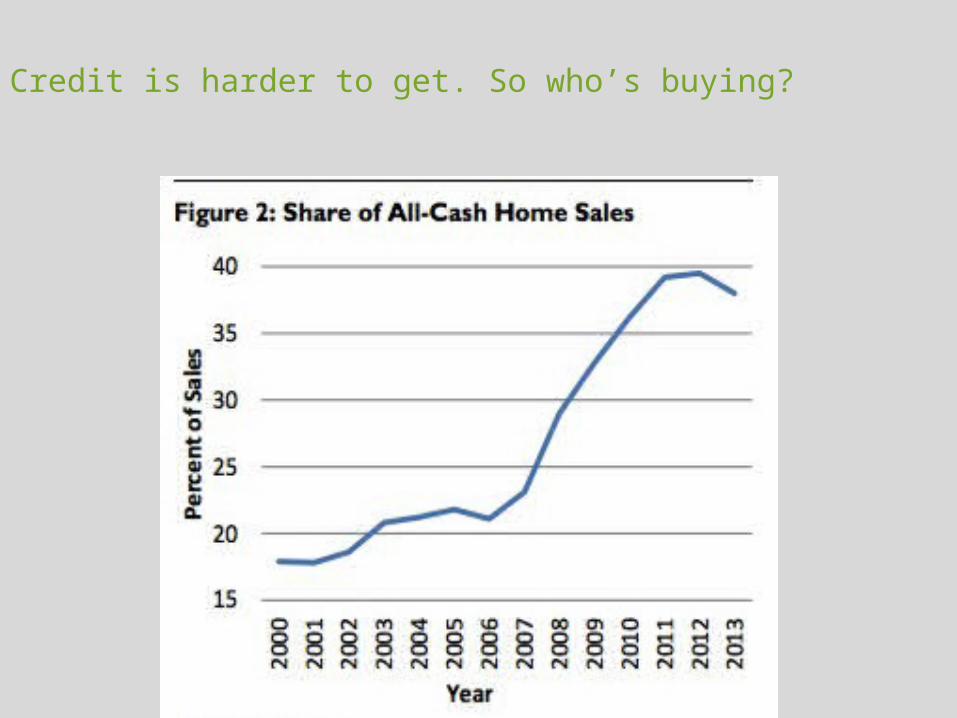
Credit is harder to get. So who’s buying?
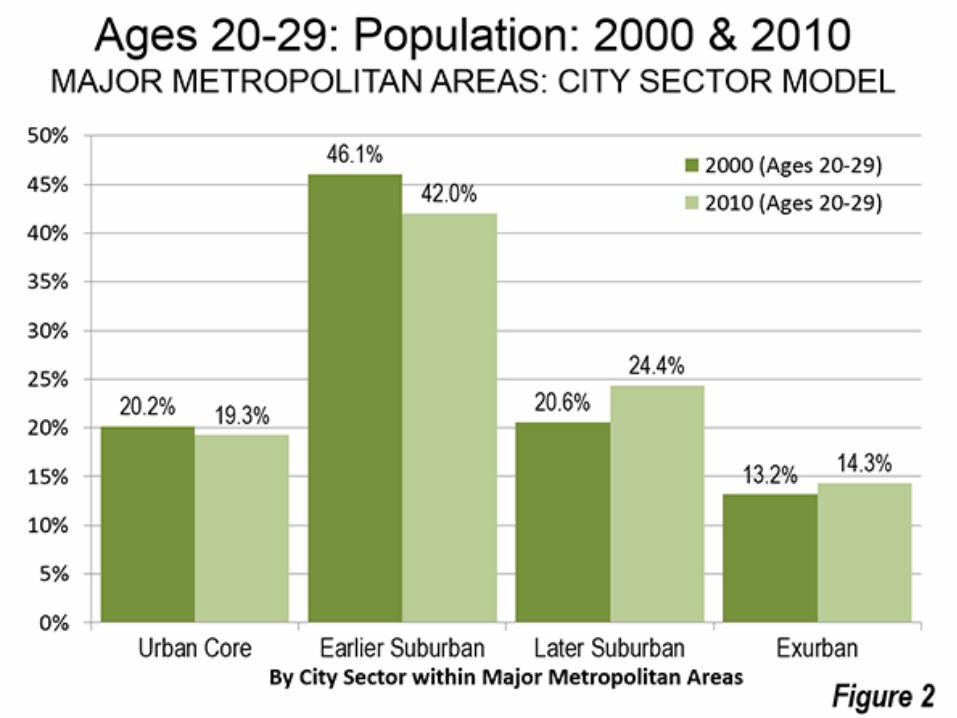
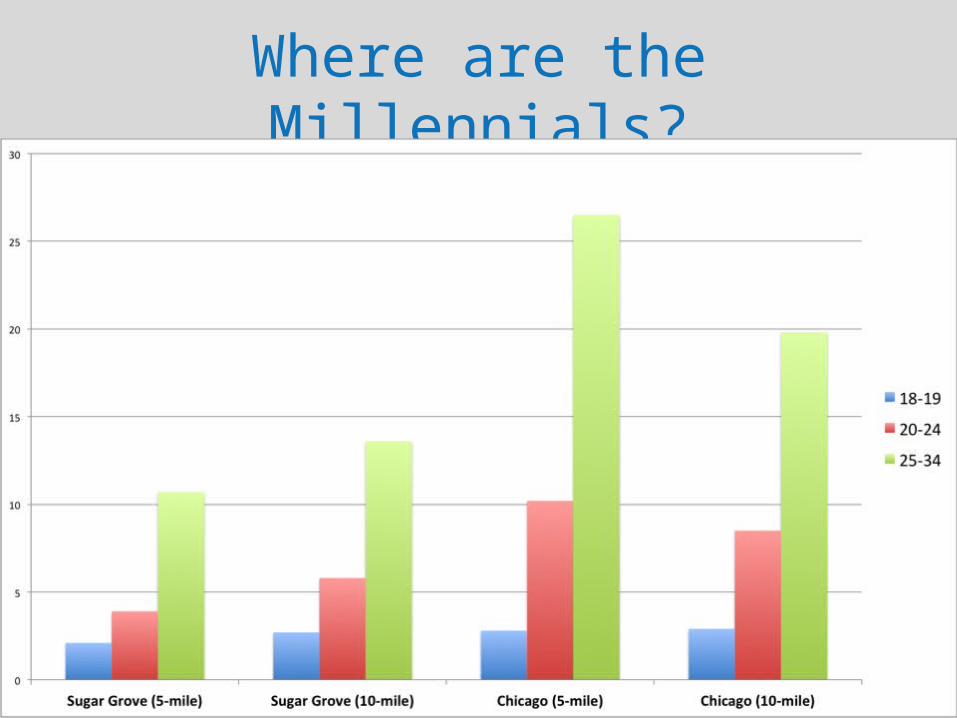
Where are the Millennials?


Driving


Why today’s youth driving less
• Demographics– Living in different kinds of households
• Economic– Cars cost money. Gas prices fluctuate.
• Technological– People can connect virtually
• Location– People live where there are options
• Legal– Every state passed new GDL laws since 1995
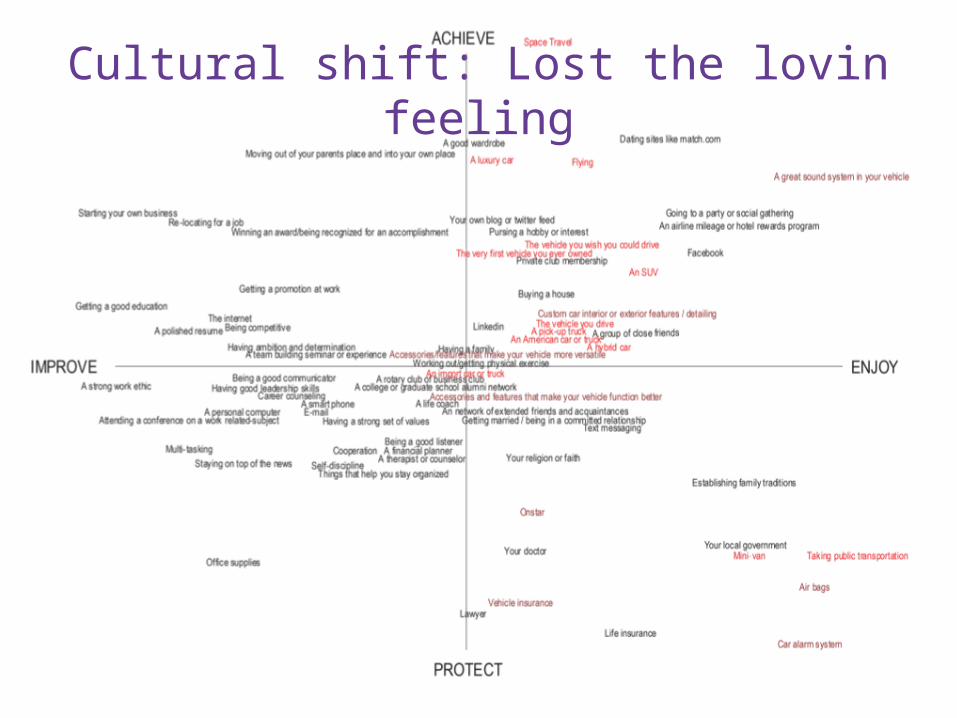
Cultural shift: Lost the lovin feeling

Cultural shift: Lost the lovin feeling

Technology: Options

Unemployment – 6 million

Education is the single most important determinate of income potential

Why we need alternatives to Private Universities

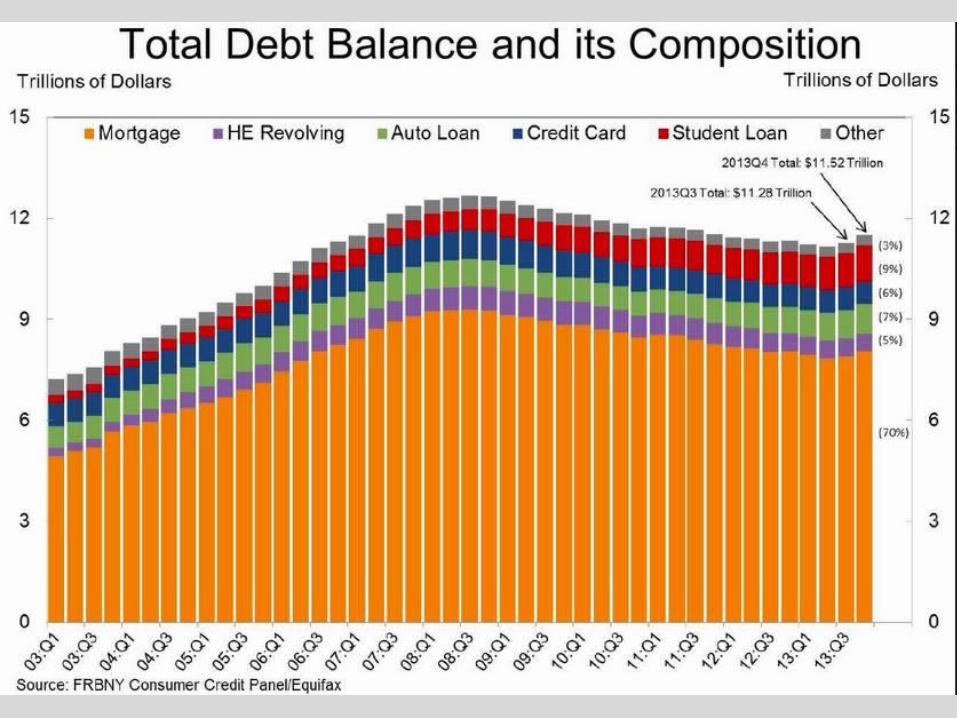
Loan debt isn’t just growing, it is changing

Job TypeChange, 2012-22
Median wageNumber Percent
Registered nurses 526.8 19.4 65,470
Secretaries and administrative assistants, except legal, medical, and executive 307.8 13.2 32,410
Customer service representatives 298.7 12.6 30,580
Construction laborers 259.8 24.3 29,990
General and operations managers 244.1 12.4 95,440
Carpenters 218.2 24.2 39,940
Bookkeeping, accounting, and auditing clerks 204.6 11.4 35,170
Heavy and tractor-trailer truck drivers 192.6 11.3 38,200
Medical secretaries 189.2 36.0 31,350
Licensed practical and licensed vocational nurses 182.9 24.8 41,540
First-line supervisors of office and administrative support workers 171.5 12.1 49,330
Elementary school teachers, except special education 167.9 12.3 53,400
Accountants and auditors 166.7 13.1 63,550
Medical assistants 162.9 29.0 29,370
Software developers, applications 139.9 22.8 90,060
Management analysts 133.8 18.6 78,600
Sales representatives 132.0 8.9 54,230
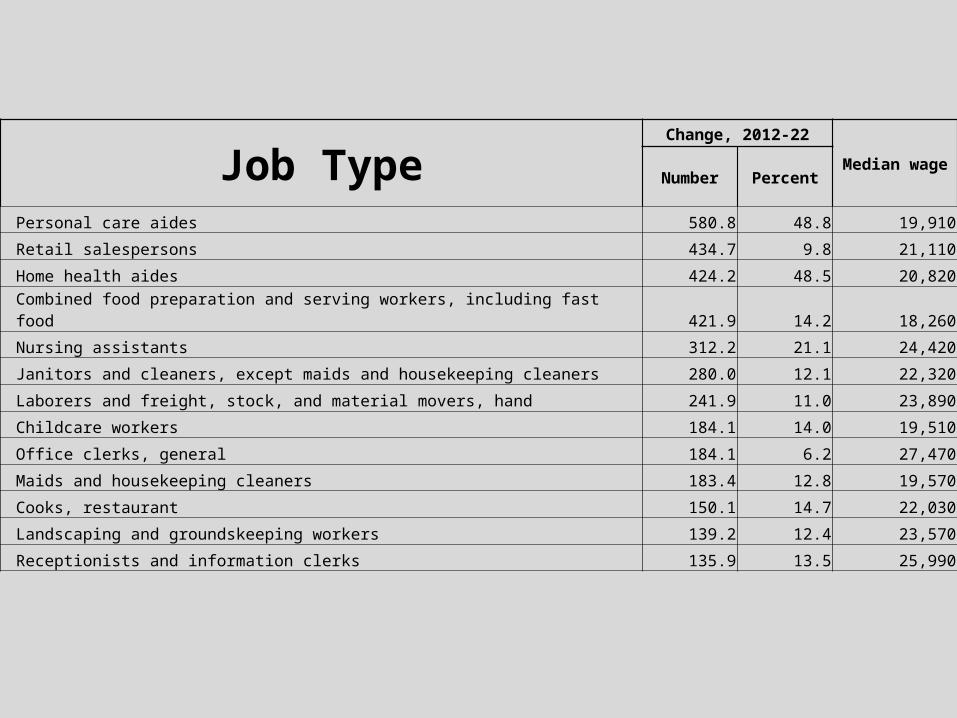
Job TypeChange, 2012-22
Median wageNumber Percent
Personal care aides 580.8 48.8 19,910
Retail salespersons 434.7 9.8 21,110
Home health aides 424.2 48.5 20,820
Combined food preparation and serving workers, including fast food 421.9 14.2 18,260
Nursing assistants 312.2 21.1 24,420
Janitors and cleaners, except maids and housekeeping cleaners 280.0 12.1 22,320
Laborers and freight, stock, and material movers, hand 241.9 11.0 23,890
Childcare workers 184.1 14.0 19,510
Office clerks, general 184.1 6.2 27,470
Maids and housekeeping cleaners 183.4 12.8 19,570
Cooks, restaurant 150.1 14.7 22,030
Landscaping and groundskeeping workers 139.2 12.4 23,570
Receptionists and information clerks 135.9 13.5 25,990


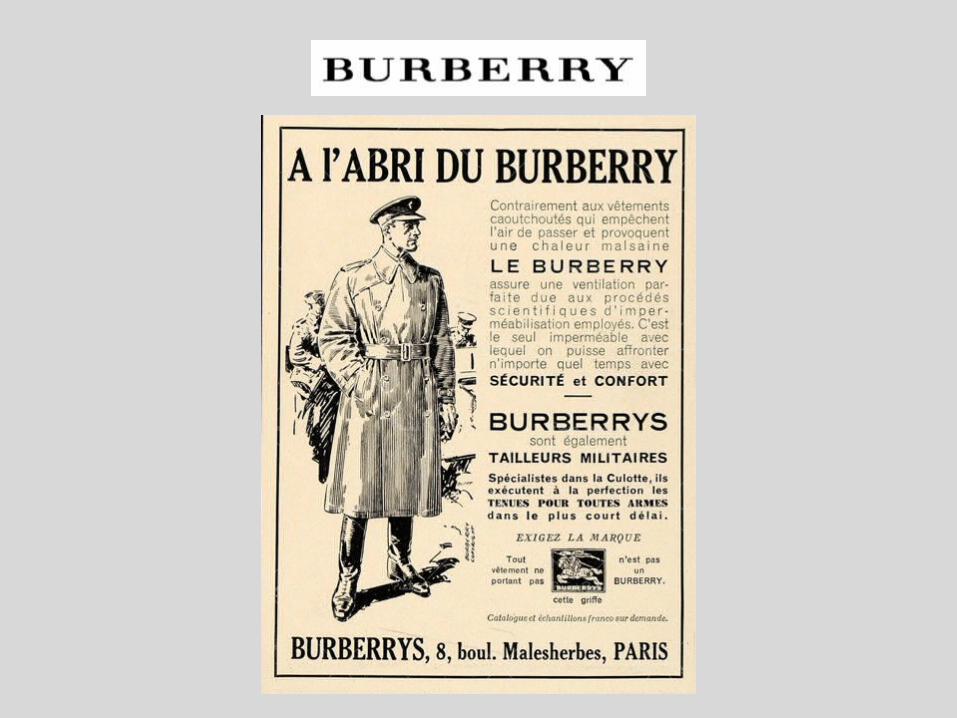
Advertising used to be easy

Agency execs worked hard


Sometimes it is Just Re-Packaging

…or Just the Right Message

Profound changes in just 40 years.

Related Documents