BUYER POWER IN THE EUROPEAN GAS MARKET ♦ MELINA CALDAS CABRERA ♦♦ Abstract The levels of consumption of gas in the European Union have been increasing considerably in the last years. Given that domestic resources are becoming scarce and imports come mainly from three countries, European policymakers argue that there is a need to guarantee the security of supply. For this, they propose the creation of big distribution companies, which are believed to have a bargaining power that enables them to offset the market power upstream. The article analyzes this policy from a theoretical perspective using models of buyer power. In particular, the models of Chipty and Snyder (1999) and Inderst and Wey (2003), which associate the existence of bargaining power to the shape of the cost function in the upstream market, are presented and analyzed. Given the characteristics of the gas production technology, we expect the cost function of gas suppliers to be convex in early stages of production and to become concave as cheaper fields are deployed and new fixed investments are required in order to develop new and more expensive fields. We conclude that only in convex stages of the cost function, it will be convenient for gas retailers to merge. I. Introduction The consumption of gas in the European Union has been increasing considerably in the last years. The product is of foremost importance for the European economy since it is used not only as a final product by households, but also as an energy source in several economic sectors, such as transport and electricity generation. Since production of gas in the Union is not sufficient to attend its requirements, almost a half of the current energy requirements is met by imported products, and ♦ This Paper is based on the monography prepared for obtaining the Master of Science in Economics at Tilburg University, Netherlands. ♦ Economic Studies Division, INDECOPI.

Welcome message from author
This document is posted to help you gain knowledge. Please leave a comment to let me know what you think about it! Share it to your friends and learn new things together.
Transcript
BUYER POWER IN THE EUROPEAN GAS MARKET♦
MELINA CALDAS CABRERA♦♦
AbstractThe levels of consumption of gas in the European Union have been increasing considerably in the last years. Given that domestic resources are becoming scarce and imports come mainly from three countries, European policymakers argue that there is a need to guarantee the security of supply. For this, they propose the creation of big distribution companies, which are believed to have a bargaining power that enables them to offset the market power upstream. The article analyzes this policy from a theoretical perspective using models of buyer power. In particular, the models of Chipty and Snyder (1999) and Inderst and Wey (2003), which associate the existence of bargaining power to the shape of the cost function in the upstream market, are presented and analyzed. Given the characteristics of the gas production technology, we expect the cost function of gas suppliers to be convex in early stages of production and to become concave as cheaper fields are deployed and new fixed investments are required in order to develop new and more expensive fields. We conclude that only in convex stages of the cost function, it will be convenient for gas retailers to merge.
I. Introduction
The consumption of gas in the European Union has been increasing considerably in the last years. The product is of foremost importance for the European economy since it is used not only as a final product by households, but also as an energy source in several economic sectors, such as transport and electricity generation. Since production of gas in the Union is not sufficient to attend its requirements, almost a half of the current energy requirements is met by imported products, and
♦ This Paper is based on the monography prepared for obtaining the Master of Science in Economics at Tilburg University, Netherlands.
♦ Economic Studies Division, INDECOPI.
6 Revista de la Competencia y la Propiedad Intelectual Nº 8
unless something is done in the next decades this percentage will rise significantly.1 Furthermore, there is little competition between the three main exporters of gas to the Union (Russia, Norway and Algeria) as a result of the combination of the particular characteristics of the market among which the most important are: uneven distribution of the resource across the world, price indexing, negotiation of supplies through take-or-pay contracts and the use of pipelines as the main mean of transportation of imports.
This situation constitutes a growing concern among European policymakers who argue that there is a need to make the internal energy market more competitive, which is understood as guaranteeing security of supply and lower prices. One of the initiatives that has been advocated in this regard is the creation of national champions in the distribution sector of the market, that is, the promotion of big and strong companies which are supposed to have a bargaining power that could offset the market power of gas producers.
Although this policy has several supporters, there is little academic work on the specific matter. The present article aims at contributing to the topic by analyzing the subject from a theoretical perspective on the basis of economic models of buyer power. In particular, we present and analyze the implications of two models that link the existence of buyer power on certain curvatures of the cost function of suppliers. We also apply one of them to the European gas market in order to determine if the presence of bigger retailers would be able to counterbalance the market power of the main exporters of gas to the Union through an improved bargaining position.
With this in mind, the remainder of this article is organized as follows. Section II presents the main characteristics of gas markets in the world and, in particular, in the European Union. Section III introduces some basic concepts and reviews the most influential works on the topic of buyer power. Section IV analyzes in more detail two models that associate the existence of buyer power to the shape of the cost function in the upstream market: the study of Chipty and Snyder (1999) about the role of firm size in bilateral bargaining and the analysis of Inderst and Wey (2003) regarding bargaining and mergers in bilateral oligopolistic industries. Section V adjusts one of these models to the characteristics of the European gas market in order to analyze if the promotion of bigger gas retailers would increase their buyer power. Finally, Section VI presents some concluding remarks.
1 Commission of the European Communities (2006).
Buyer power in the European gas market 7
II. General background
2.1 Development of gas markets around the world
Natural gas was discovered in the early 1950s as a by-product of the exploitation of oil. Its use was limited at first; in fact, it was considered to be a second-rate energy product. However, after a long process of market development it is nowadays an important multi-faceted source of energy.
In the beginning, gas markets were only regional. This is because gas has a much lower energy density than oil, so its transportation and storage costs are higher. It took some time before exploration for gas as such became economically attractive. Most large gas structures were found after World War II, and the few ones that were developed, were destined for national use only. The Groningen field in the Netherlands was the first large field from which gas was produced for export, but the North American gas industry was the first one to develop (Energy Charter Treaty- ECT, 2007).
One of the most common means of gas transportation is the use of pipelines. Nonetheless, the use of liquefied natural gas (LNG) is becoming more and more popular. In fact, the LNG market is transforming into an increasingly liquid market, especially since the year 2000. This transformation was caused by several factors, among which Stern (2006a) identifies four: (i) a substantial cost reduction in the LNG chain2; (ii) the transformation of the US and UK from surplus markets with low prices to shortage markets with high prices; (iii) the slow pace of liberalized access to pipeline networks in Continental Europe, which makes the transportation of LNG a more attractive option, and (iv) the greater emphasis on diversification of gas supplies, especially in the UK and Southern Europe. The only factor that is now limiting its expansion is the absence of exclusive LNG trading hubs of in its own and, according to ECT (2007), this is unlikely to happen soon given the high costs of storing LNG. Furthermore, LNG production might not keep pace with the increasing global demand.
2 Although these reductions have been partly reversed in the last few years because of the high demand of both liquefaction plants and LNG tankers.
8 Revista de la Competencia y la Propiedad Intelectual Nº 8
2.2 The European gas market
2.2.1 Some basic facts
We can identify some clear differences between the development of the gas market in the UK and the rest of Europe. On the one hand, the UK has traditionally relied on domestic gas with an emerging surplus of low-cost gas from the Central North Sea. Nowadays, the UK has one of the most price-competitive gas industries in the world.3 The gas production in the UK was big enough to make this country self-sufficient and even a gas exporter between 1997 and 2003. However, because of the decline of the North Sea production and the increase of domestic gas demand, the UK has now become a net importer of gas. In fact, according to Stern (2006a), the country may be 40% dependent on imports by the year 2010 and up to 80% by 2020.
On the other hand, the development of the gas industry in Continental West Europe has been characterized by imports from super-giant fields, starting with the development of the Groningen field in 1959. Unlike the UK, the only cases in Continental Europe in which gas is used on a large scale for power generation are the Netherlands, Italy and Spain. The use of imported gas for producing electricity is limited in the rest of countries in this area. In fact, exporting countries have been traditionally hesitant to sell to the segment of large-scale power generation where domestic resources for power generation existed. This difference is also reflected in the fact that price elasticity of demand seems to be lower in Continental Europe in comparison to the elasticity observed in the UK. (ECT, 2007)
As a whole, the consumption and import levels of gas are increasing in Europe and nowadays this has become an important concern for policy makers. Dutch production may be maintained at current levels until 2010-15 mainly with output of the Groningen field compensating for declining production in small fields; however, there are limits on the annual production increases expected from the Netherlands considering the overall production cap on the Groningen field of 425 Bcm for the period 2006-2015. Norway is the only European country whose gas production is
3 According to ECT (2007) this is the result of three factors: (i) reliance on domestic gas and the discovery of low cost gas in the Central North Sea; (ii) the need to expand the UK power sector in an environmentally friendly way, and (iii) a combination of major policy initiatives which includes the privatization of the government gas monopoly in 1986, the creation of a regulatory agency, the requirement that the transmission offered third-party access and the release of some of British Gas’s customers from their purchase obligations.
Buyer power in the European gas market 9
expected to rise strongly up to 2010. Production levels in most of the other countries of continental Europe will decline. As a result, European production of gas will not increase significantly after 2010 and it might even fall, especially after 2015. (Stern, 2006a)
2.2.2. Gas contracts
It is important to review the characteristics of the contracts since they determine the nature of the negotiations between suppliers and retailers in the market. Because of the low energy density and consequent high transportation and storage costs of gas, the market for this element evolved initially in a regional context. Most large gas structures were found after World War II, and the ones that were developed were used only in a national level.
As mentioned before, the Groningen field in the Netherlands was the first large field from which gas was produced for export. According to ECT (2007), the Dutch government wanted to maximize the rent income from the Groningen field so, together with Esso and Shell, it developed the concepts of replacement or market value pricing and long-term contracts (20–30 years) with a minimum pay based on a netback/replacement value pricing, with regular review possibilities to adjust pricing to the originally sought balance. With this type of contracts, the exporting country takes the risks and chances of price development via the replacement value pricing concept, while the buyer takes the obligation to buy a defined volume via the minimum take-or pay obligation against earning a satisfactory margin.
This model quickly became very popular around Europe so other countries, such as Russia, Norway and Algeria, also started using them. However, one characteristic that the Dutch contracts and other gas exports did not share is the provision of daily and annual supply flexibility destined to cover seasonal and other market fluctuations. This is because, unlike the Dutch exports, those from other countries need to cover much higher transportation costs. Therefore, gas contracts in Europe present the following characteristics:
(i) A long-term supply obligation and a long-term off-take obligation: the seller commits to deliver a certain amount of gas and the buyer commits to receive a certain volume of gas per year or to pay for the part of this gas that it does not want to receive (take-or-pay clauses);
(ii) Prices calculated on the basis of the value of competing energies;

10 Revista de la Competencia y la Propiedad Intelectual Nº 8
(iii) The possibility to review the price conditions at regular intervals (typically three years), and
(iv) The possibility to invoke arbitration in case of disagreement on the price adjustment.
Regarding the determination of the prices of gas delivered on the basis of this type of contracts, Asche et al. (2002)4 present a general formula that links gas prices to the price of relevant energy substitutes, such as light fuel oil, coal and electricity. The price formula consists of two parts: a fixed term and a variable term. The fixed term is a constant basis price that reflects the parties’ evaluation of the value of the gas at the time of entering the contracts; while the variable one is an escalation supplement linking the gas price to alternative forms of energy. Each alternative energy commodity is assigned a certain weight in order to reflect the competitive situation between natural gas and the substitute. Additionally, the price change of each energy commodity is multiplied by an energy conversion factor to make it commensurable with natural gas. In consequence, taking into account all of the above mentioned characteristics, a typical price formula takes the following form:
P = Po + Σj αj (AEj — AEjo) EKAEj δj (1)
where: P = gas price, Po = basis price, αj = weight in the escalation element for substitute j (with Σj αj = 1), (AEj — AEjo) = price change for substitute j (actual minus historic price), EKAEj = energy conversion factor, and δj = impact factor for price changes in substitute j.5
2.2.3 Security of supply
Nowadays there is a movement towards the access to secure, reliable and cost-effective sources of energy in Europe. This trend can be identified not only in political speeches, but also in official documents such as the Communication from the Commission to the European Council and the European Parliament - An
4 Asche et al. (2002) p. 2555 Impact factors (δj) are typically high (around 0.85 or 0.90), so natural gas prices are highly
responsive to price changes in substitutes and exhibit volatility. Nonetheless, this volatility is reduced by the fact that prices are averages over some window of three or six months.
Buyer power in the European gas market 11
Energy Policy for Europe (2007), which recognizes the importance of energy for the functioning of the European economy and identifies three challenges: sustainability (environmental concerns), security of supply and competitiveness.
Regarding the second objective, it is important to recognize that the main concern about this topic involves both the depletion of indigenous resources and political and geopolitical problems. As we have seen, European gas production will not increase significantly after 2010 and it is likely to fall after 2015. Furthermore, the EU projects that by the year 2030 gas imports will represent 80% of the Union’s demand.6 Taking these into account, security of supply of gas is usually linked to international trade.
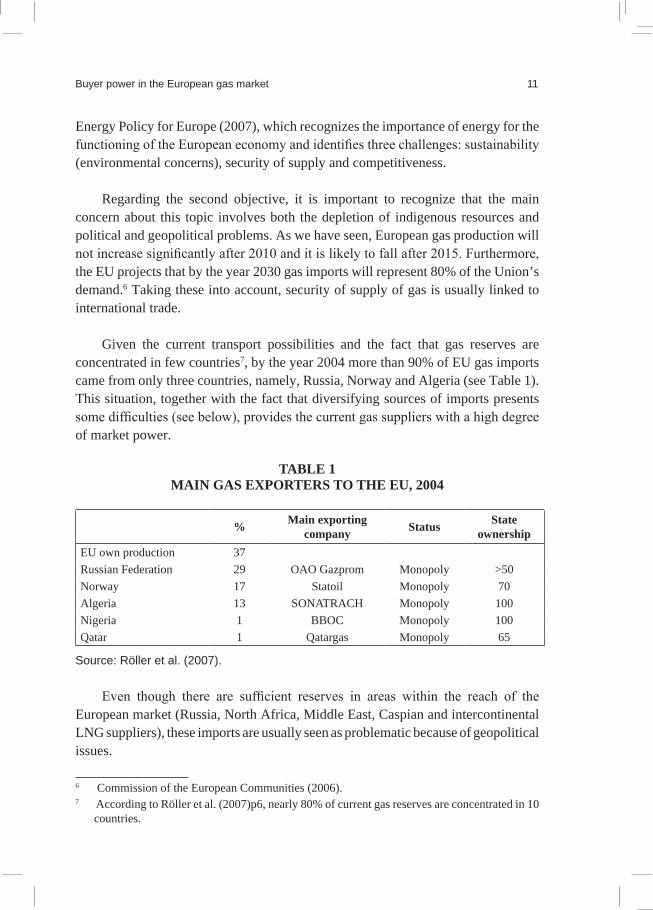
Given the current transport possibilities and the fact that gas reserves are concentrated in few countries7, by the year 2004 more than 90% of EU gas imports came from only three countries, namely, Russia, Norway and Algeria (see Table 1). This situation, together with the fact that diversifying sources of imports presents some difficulties (see below), provides the current gas suppliers with a high degree of market power.
TABLE 1MAIN GAS EXPORTERS TO THE EU, 2004
% Main exporting company Status State
ownershipEU own production 37 Russian Federation 29 OAO Gazprom Monopoly >50Norway 17 Statoil Monopoly 70Algeria 13 SONATRACH Monopoly 100Nigeria 1 BBOC Monopoly 100Qatar 1 Qatargas Monopoly 65
Source: Röller et al. (2007).
Even though there are sufficient reserves in areas within the reach of the European market (Russia, North Africa, Middle East, Caspian and intercontinental LNG suppliers), these imports are usually seen as problematic because of geopolitical issues.
6 Commission of the European Communities (2006).7 According to Röller et al. (2007)p6, nearly 80% of current gas reserves are concentrated in 10
countries.

12 Revista de la Competencia y la Propiedad Intelectual Nº 8
With respect to the countries in the Middle East and North of Africa it is important to note that they are seen as a huge potential import resource for European gas markets because they are geographically close to Europe and most of them have natural gas reserves to production ratios that exceed 100 years. The International Energy Agency highlights this potential, as can be seen in Table 2. However, according to Stern (2006a) these projections are over-optimistic for several reasons. The first one is that they would require the development of a significant number of new fields that may not be realistic from an institutional, political and geopolitical point of view. The second one is that they assume that the percentage of exports to Europe in relation to total exports would remain at around 60-65%, which does not take into account the developments in the North American and Pacific markets. And the third one is that Algeria and Qatar account for 70-90% of total exports, so if any political or geopolitical issue arises in any of these two countries, the results would be seriously compromised.
TABLE 2MIDDLE EAST AND NORTH AFRICANa/. GAS EXPORT
PROJECTIONS OF THE INTERNATIONAL ENERGY AGENCY, 2003-2030 (BCM)
To Europe Total Exports
2003 2010 2030 2003 2010 2020 2030
Middle East 62 135 117 34 102 185 244North Africa 61 183 170 63 86 143 200TOTAL 63 118 287 97 188 327 444
Major Exporters b/. 2003 2010 2020 2030
Qatar 19 78 126 152Algeria 64 76 114 144Iran - 75 131 157Egypt - 10 119 128Libya 61 72 113 134Iraq - 71 117 117TOTAL 84 172 310 432
Notes: a/. In addition to the countries listed, UAE, Kuwait and Saudi Arabia are also included Middle East and North African countries.
b/. Figures are for “net trade”.Source: Stern (2006a).

Buyer power in the European gas market 13
And with respect to Russia, the main concern has to do with the tense political situation, which is reflected in its problematic relationship with Ukraine and Belarus, the two main export corridors for Russian gas to Europe. These worries are particularly important after the Russian-Ukrainian gas crises of 2006 and 2009 (see Apendix 1).
Concerns about the reliability of foreign supply are growing overwhelmingly. In order to reduce the risk associated with the exercise of market power and the political instability, it has been suggested to switch into alternative energy sources and to increase energy efficiency. However, given the limited scope for these measures, many European policymakers are suggesting the promotion of national champions: strong companies with bargaining power which are believed to be able to offset the market power upstream.8 We analyze this policy from a theoretical perspective and try to find out if the creation of big distribution companies would provide them with a stronger bargaining position in the negotiations with the Union’s main gas suppliers. We start firstly by presenting the basic concepts and the literature review and next the theoretical framework. Finally, we conclude with some policy implications.
III. Basic concepts and literature review
Economic models usually deal with producers selling goods to final consumers but this is rarely seen in reality. In fact, most markets are characterized by the existence of several distribution channels. In the last years, there is a growing concern about the role of the firms in the distribution sector and the potential benefits that may arise as a consequence of the growing levels of concentration observed. It is argued that the consolidation of retailers can not only produce cost savings (which could lead to reaching economies of scale and scope), but also enhance the ability of retailers to extract discounts from upstream firms. And all of these could in turn be traduced in lower prices for final consumers.
8 The national champion policy is the motivation for the creation of large companies throughout Europe. This is the case of the approval of the mergers of Ruhrgas and E.ON in Germany, Endesa and Gas Natural in Spain and Gaz de France and Suez in France. In the three cases, governments agreed to reduce competition arguing that these companies would be large enough to outweigh the power of gas monopolists, which in turn would promote supply security and investment (Röller et al., 2007: 25-29).
14 Revista de la Competencia y la Propiedad Intelectual Nº 8
3.1 Buyer power
Inderst and Mazzarotto (2008) define buyer power as “the bargaining strength that a buyer has with respect to the suppliers with whom it trades”. Even though this bargaining strength is translated into more favorable conditions of trade, the existence of individual discounts is not necessarily the manifestation buyer power.9 Usually, the existence of buyer power is associated with buyers of large size and there are several reasons for this:
(i) A large buyer can credibly threaten to incur in substantial costs in order to integrate backwards, so it does not need to negotiate with the supplier anymore.
(ii) In case switching suppliers involves large one-off costs, a large buyer can credibly threaten to change to another supplier.
(iii) A large buyer can find it profitable to support the entry of new suppliers by sharing costs or committing to purchase the entrant’s product.
(iv) A large buyer may be more aware of other alternative sources of supply and use more competitive procurement procedures (e.g. auctions).
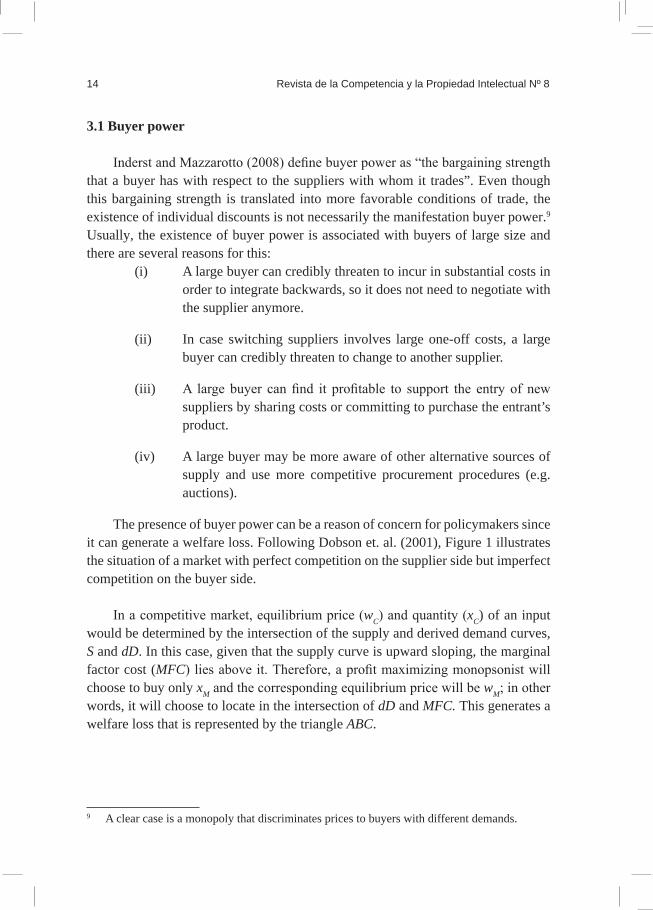
The presence of buyer power can be a reason of concern for policymakers since it can generate a welfare loss. Following Dobson et. al. (2001), Figure 1 illustrates the situation of a market with perfect competition on the supplier side but imperfect competition on the buyer side.
In a competitive market, equilibrium price (wC) and quantity (xC) of an input would be determined by the intersection of the supply and derived demand curves, S and dD. In this case, given that the supply curve is upward sloping, the marginal factor cost (MFC) lies above it. Therefore, a profit maximizing monopsonist will choose to buy only xM and the corresponding equilibrium price will be wM; in other words, it will choose to locate in the intersection of dD and MFC. This generates a welfare loss that is represented by the triangle ABC.
9 A clear case is a monopoly that discriminates prices to buyers with different demands.

Buyer power in the European gas market 15
FIGURE 1
Even though the situation described above corresponds to a market with a single buyer, it can also appear when there are several buyers in the market. According to Dobson et al. (2001), in this case the ability of buyers to influence prices depends on the presence of three conditions: (i) the buyers jointly account for a substantial portion of total purchases in the market; (ii) there are barriers to entry in the buyer’s market, and (iii) the supply curve is upward sloping.
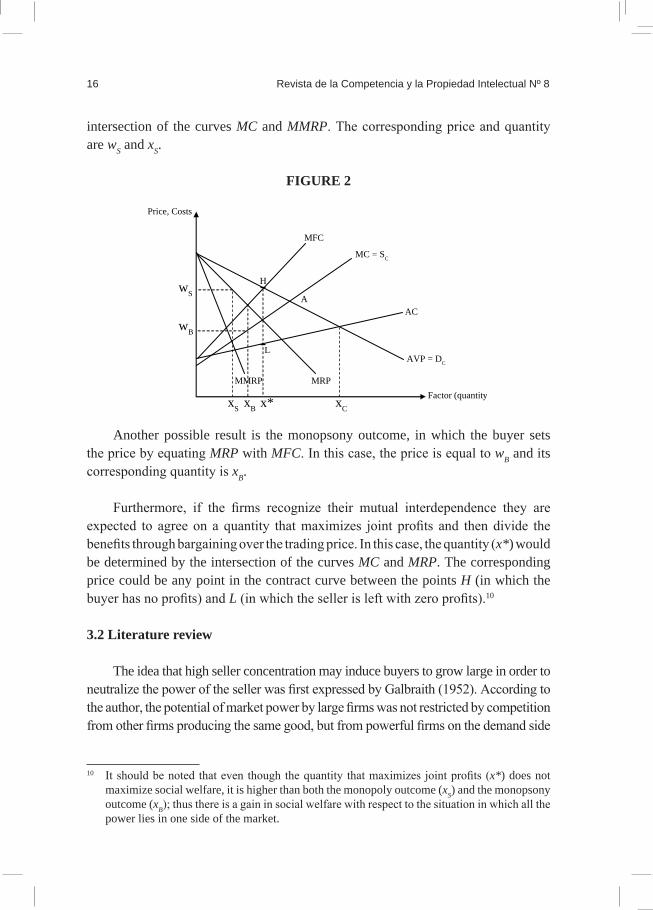
If we add imperfect competition in the upstream market, the situation gets more complicated. Figure 2 presents the equilibrium situation of an upstream monopoly that produces a factor that is bought by a downstream monopsony. If the buyer acts as a competitive firm in its output market, equilibrium would be determined by the intersection of the derived demand for the input and the average (net) value product of the factor (AVP). Nonetheless, if the monopsonist buyer is monopolist in its output market, then the derived demand for the factor is equal to marginal revenue product (MRP), that is, the curve marginal to AVP.
The curve MMRP is marginal to MRP and represents the marginal revenue associated with selling the factor to a buyer that has monopoly power but not monopsony power. The curve AC is the seller’s average production cost, while the curve MC represents its marginal costs (in a competitive setting, this would be its supply curve). The curve MFC is marginal to MC.
Many results can emerge from a situation as the above described. In one of them, the monopoly outcome, the monopoly sets the price and the buyer reacts purchasing in a competitive manner. This situation is represented in Figure 2 by the
Factor (quantity)
Price, Costs
MFC
S
dD
B
A
C
wM
wC
xM xC
16 Revista de la Competencia y la Propiedad Intelectual Nº 8
intersection of the curves MC and MMRP. The corresponding price and quantity are wS and xS.
FIGURE 2
Another possible result is the monopsony outcome, in which the buyer sets the price by equating MRP with MFC. In this case, the price is equal to wB and its corresponding quantity is xB.
Furthermore, if the firms recognize their mutual interdependence they are expected to agree on a quantity that maximizes joint profits and then divide the benefits through bargaining over the trading price. In this case, the quantity (x*) would be determined by the intersection of the curves MC and MRP. The corresponding price could be any point in the contract curve between the points H (in which the buyer has no profits) and L (in which the seller is left with zero profits).10
3.2 Literature review
The idea that high seller concentration may induce buyers to grow large in order to neutralize the power of the seller was first expressed by Galbraith (1952). According to the author, the potential of market power by large firms was not restricted by competition from other firms producing the same good, but from powerful firms on the demand side
10 It should be noted that even though the quantity that maximizes joint profits (x*) does not maximize social welfare, it is higher than both the monopoly outcome (xS) and the monopsony outcome (xB); thus there is a gain in social welfare with respect to the situation in which all the power lies in one side of the market.
MFC
MC = SC
AVP = DC
H
L
wS
wB
Price, Costs
AC
MRP MMRP
A
xCxBxS x* Factor (quantity)
Buyer power in the European gas market 17
of the market who extracted competitive prices that were passed on to consumers. In the moment, this reasoning was contested by several authors (e.g. Stigler (1954)) who criticized the lack of a supporting theory for the idea. Nonetheless, since then many studies have tried to prove that the more concentrated the buyers’ side of the market, the lower are sellers’ price-cost margins.
Different methodological approaches can be identified when reviewing the literature concerning the topic. For instance, some authors use models of infinitely repeated procurement auctions. One of such works is the article by Snyder (1996), who presents a model consisting of a buyer seeking bids from many potential sellers.11
A popular approach in works that deal with buyer power is the use of experiments and the main tool applied in them is the posted-offer market institution. In posted-offer markets, each seller simultaneously posts a sales price and after all prices have been displayed to buyers and sellers, the buyers purchase the quantity they desire in a random order. Since buyers cannot make counteroffers, the only recourse they have to negotiate a better price is demand withholding, that is, the rejection of a profitable purchase given fairness concerns or strategic reasons (Ruffle (2005)). The works of Ruffle (2000) and Engle-Warwick and Ruffle (2006) are some examples of this approach. The first one tries to determine the impact of the number of buyers, surplus division at the market-clearing price and information revelation on strategic and fairness-motivated demand withholding; while the second one examines the ability of a small number of buyers to influence the pricing of a monopolist.
Given the constant interaction between buyers and sellers in the market, one of the most used tools in the analysis of buyer power is bargaining. Typically, a bargaining situation is characterized by the presence of two parties, A and B, who can realize a joint profit of z. In order to determine how this profit should be shared it is important to take into consideration the profit that each party could realize outside of their negotiations, vA and vB, which are called the “breakdown” or “outside-option” payoffs. Therefore, in case negotiations are successful, the net surplus is equal to z – vA – vB. If neutrality is assumed, each party obtains half of this expression plus its outside option. It is easy to see that if a party’s outside option increases, this will also increase its bargaining power, allowing it to extract a larger share of the jointly realized profits, z, and therefore, increasing its buyer power (Inderst and Mazzarotto (2008)).
11 In this case, the bid represents the price at which a seller is willing to provide the good.
18 Revista de la Competencia y la Propiedad Intelectual Nº 8
Von Ungern-Sternberg (1996) uses this bargaining concept within a Cournot model and a perfect competition model in order to study the predictions of the theory of countervailing power. Dobson and Waterson (1997) evaluate the importance of countervailing power (manifested as the effects of increased retail concentration) on consumer prices and welfare within a bargaining model in which an upstream firm supplies a homogeneous good to N symmetric retailers that are differentiated by their retail service. And Chen (2001) attempts to assess Galbraith’s hypothesis of countervailing power using a bargaining model in which an upstream supplier sells to a group of downstream retailers.
Another aspect in which a bargaining setting has been used to evaluate the impact of buyer power is the incentives of firms to merge. Horn and Wolinsky (1988) analyze the incentives of firms to merge within a model that includes two firms which produce related products (either substitutes or complements) using one input supplied by a single firm at a price determined through bargaining. Mazzarotto (2004) analyzes the origin of buyer power through the comparison of different merger scenarios in a setting where one monopolist sells its product to retailers that are horizontally differentiated. Chae and Heidhues (2003) identify risk aversion as a source of buyer power using the bargaining mechanism in a model with two independent markets in which an input supplier negotiates with a downstream producer.
A group of bargaining models condition the existence of quantity discounts to the shape of the surplus function or the shape cost function of the upstream firm. This type of models will be further analyzed in Section III; nonetheless, it is useful to review some of the existing works.
Inderst and Wey (2000) analyze the impact of horizontal mergers of suppliers or retailers on their respective bargaining power in a model with N producers that sell their products to M retailers, who distribute them to final consumers. Using the Nash bargaining solution12 and assuming that demand is independent at all retailers, the authors find that in equilibrium retailer mergers are more likely (less likely) if suppliers have increasing (decreasing) unit costs, while supplier mergers are more likely (less likely) if goods are substitutes (complements).13
12 According to the Nash bargaining solution, the incremental surplus generated by the outcome of the negotiation between the supplier and buyer i is evenly split between the two parties, under the belief that all other buyers purchase an efficient amount.
13 The authors also analyze the role of bargaining power in technology choice under different

Buyer power in the European gas market 19
Inderst (2005) considers a model in which multiple buyers can purchase a homogeneous good from multiple sellers, which are characterized by having strictly convex costs, in order to determine if it is better to be a small or a large buyer in order to secure low purchasing prices. He shows that if there is a single supplier, then a large buyer pays a strictly lower price per unit. Nonetheless, with multiple suppliers, the size of the buyer can be a disadvantage because per-unit incremental costs of switching suppliers are lower the smaller the purchased quantity, that is, small buyers pay lower per-unit costs.
This kind of models has also been tested using experiments. Normann, Ruffle and Snyder (2003) test in an experimental setting if the existence of large buyer discounts depends on the curvature of the total surplus function over which the parties bargain. In particular, they argue that large-buyer discounts emerge in the bargaining process if the total surplus function is concave, that per-unit price should be the same for large and small buyers if the total surplus function is linear and that there are multiple equilibria if the total surplus function is convex. Their results are consistent with the theory.
Finally, some works concentrate on linking the theory of buyer power to what is observed in real markets, either through descriptive case studies or econometric analysis. For instance, in the group of descriptive case studies we find the works by Dobson and Waterson (1999) and Dobson et al. (2001). In the former the authors investigate whether the market power of retailers is the reason for the observed price differences across European countries and between Europe and the United States for almost identical products. In the latter the authors perform case studies in four European countries and identify significant concentration in the food sector in the Union, as well as evidence of the existence of discounts to retail chains or buyer groups.
Among the econometric studies, we find the articles by Schumacher (1991), Peters (2000) and Fisher Ellison and Snyder (2001), which study the American manufactures market, the German automobile industry and the American antibiotics commercialization, respectively.
market structures and show that a supplier facing non-integrated retailers can increase its surplus by focusing more on “inframarginal” cost reduction at the expense of higher marginal costs.

20 Revista de la Competencia y la Propiedad Intelectual Nº 8
IV. Buyer Power And Cost Functions
There are several hypothesized mechanisms through which an increase in the size of a buyer can provide it with a stronger bargaining position vis-à-vis an input supplier. In the present section, we concentrate on the case in which the improvement in the bargaining position depends on certain curvatures in the cost function. In particular, two models are presented and compared: the model by Chipty and Snyder (1999) and the model by Inderst and Wey (2003).
4.1 Chipty and Snyder
Chipty and Snyder (1999) examine the effect of a buyer merger on its bargaining position and find that it depends on the shape of the supplier’s gross surplus: the buyers’ bargaining position is improved with the merger if the function is concave, while it is worsened if the function is convex. As we will see, this is equivalent to saying that a merger improves the buyers’ bargaining position in case the cost function is convex and worsens it if the cost function is concave.
4.1.1 The model
A single supplier produces a homogeneous good which is sold to n buyers. Buyer i obtains the gross surplus vi(qi) when he buys qi units of the good. In order to facilitate the comparison with the model by Inderst and Wey (2003), we assume that vi(qi) = p.qi, where p represents the indirect demand for the good. It is assumed that this gross surplus does not depend on the quantity purchased by buyer j.14
On the other hand, the supplier produces a total of Q∆ units (where Q∆ = Σi= 1qi and ∆ is the set of retailers, ∆ = 1, ..., n) and gets a gross surplus from the production equal to V(Q∆) . In many applications, the main component of V(Q∆) is the total cost of producing Q∆ units (C(Q∆)); in fact, it is useful to think of this surplus as V(Q∆) = – C(Q∆).
The supplier negotiates simultaneously and separately with each buyer in order to determine the quantity to be traded (qi) and the tariff for the bundle (Ti), which could be a nonlinear price. The outcome of the negotiations is given by the Nash bargaining solution, so the vector of quantities q* = (q1, ..., qn) maximizes the total surplus of the supplier and buyers:
14 The authors refer to this assumption as “buyer independence”.
n
* *

Buyer power in the European gas market 21
where Q∆\i ≡ Σj≠iqj. The vector of transfers from the buyers to the supplier, T* = (T1, ..., Tn), completes the specification of the equilibrium.
Once we know q* and T * , and taking into consideration the bargaining mechanism, we can calculate the net surplus that each player obtains in equilibrium:
– In case the negotiations between the supplier and buyer i break down, the supplier earns Σj≠iTj – C(Q∆\i), while buyer i gets no surplus.
– In case the negotiations between the supplier and buyer i are successful, the supplier earns Σj=iTj – C(Q∆), while buyer i gets p. qi – Ti .
– According to the Nash bargaining solution, the parties evenly split the incremental surplus generated by the outcome of the negotiation; hence the supplier’s net surplus and buyer i’s net surplus must be equal:
Solving the above expression for , we can verify that in equilibrium the tariff transferred from buyer i to the supplier is equal to half the additional total surplus:
If we substitute into the expressions for the supplier’s net surplus, we find that in equilibrium the supplier gets:
And substituting Ti into the expressions for buyer i’s net surplus, we find that in equilibrium he earns:
4.1.2 Merger of two buyers
Given the results presented in the previous section, we can now analyze a merger of two buyers, namely buyers 1 and 2. In order to distinguish the equilibria with and without a merger, we refer to the situation in which buyers 1 and 2 are merged as
* *
* *
* *
* **n *
*
22 Revista de la Competencia y la Propiedad Intelectual Nº 8
the m-equilibrium and to the situation in which buyers 1 and 2 are separate entities as the s-equilibrium.15 16
In case buyers 1 and 2 decide to merge, in the m -equilibrium there are n – 1 buyers who purchase qm = (q1+2, q3, ..., qn). This quantity vector maximizes total surplus, so:
Buyers 1 and 2 will choose to merge if and only if they get a higher net surplus in the m-equilibrium than in the s-equilibrium. In mathematical terms, this means that:
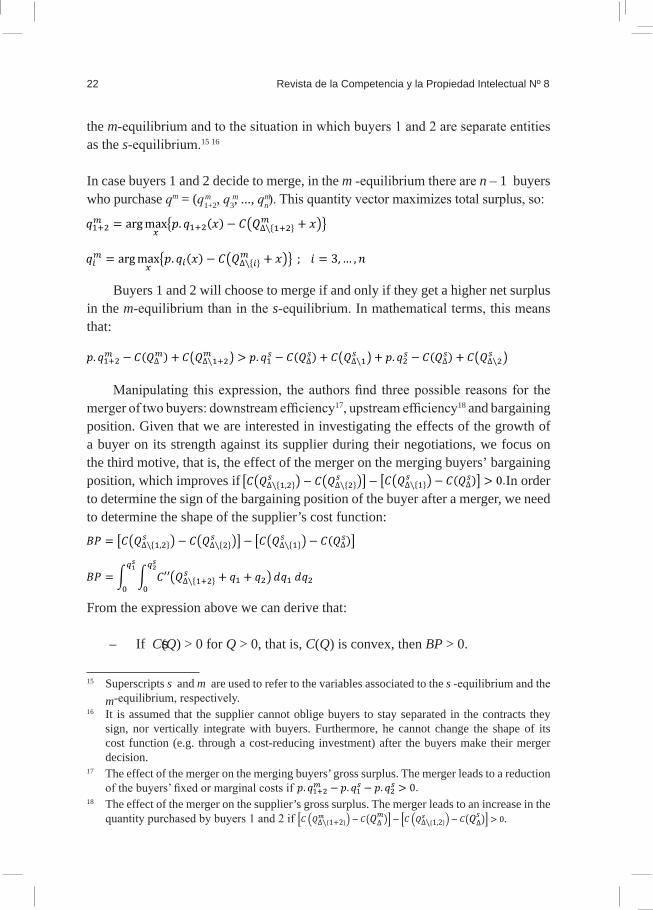
Manipulating this expression, the authors find three possible reasons for the merger of two buyers: downstream efficiency17, upstream efficiency18 and bargaining position. Given that we are interested in investigating the effects of the growth of a buyer on its strength against its supplier during their negotiations, we focus on the third motive, that is, the effect of the merger on the merging buyers’ bargaining position, which improves if In order to determine the sign of the bargaining position of the buyer after a merger, we need to determine the shape of the supplier’s cost function:
From the expression above we can derive that:
– If C″(Q) > 0 for Q > 0, that is, C(Q) is convex, then BP > 0.
15 Superscripts s and m are used to refer to the variables associated to the s -equilibrium and the m-equilibrium, respectively.
16 It is assumed that the supplier cannot oblige buyers to stay separated in the contracts they sign, nor vertically integrate with buyers. Furthermore, he cannot change the shape of its cost function (e.g. through a cost-reducing investment) after the buyers make their merger decision.
17 The effect of the merger on the merging buyers’ gross surplus. The merger leads to a reduction of the buyers’ fixed or marginal costs if
18 The effect of the merger on the supplier’s gross surplus. The merger leads to an increase in the quantity purchased by buyers 1 and 2 if .
m m
.
.
m

Buyer power in the European gas market 23
– If C″(Q) < 0 for Q > 0, that is, C(Q) is concave, then BP < 0.
– If C″(Q) = 0 for Q > 0, that is, C(Q) is linear, then BP = 0.
We now analyze with further detail the two first cases, which correspond to the situations where the model predicts that the bargaining position of the buyers change as a consequence of the merger:
a ) C(Q) is convex
If C(Q) is convex, the merger confers positive bargaining effects. Therefore, in absence of efficiency effects (upstream or downstream), the model predicts that buyers 1 and 2 should merge to form a larger buyer. In this case, buyer 2’s contribution to the total surplus as a marginal buyer is less than its contribution as an inframarginal buyer. Therefore the surplus generated by the merged buyer is more than twice the surplus that either buyer would obtain separately (see Figure 3).
A convex cost function implies that marginal costs are increasing. In this case, the supplier can roll over more of his high marginal costs to the marginal separated buyer, whereas a merged buyer gets the opportunity to benefit from the lower inframarginal rents.
FIGURE 3
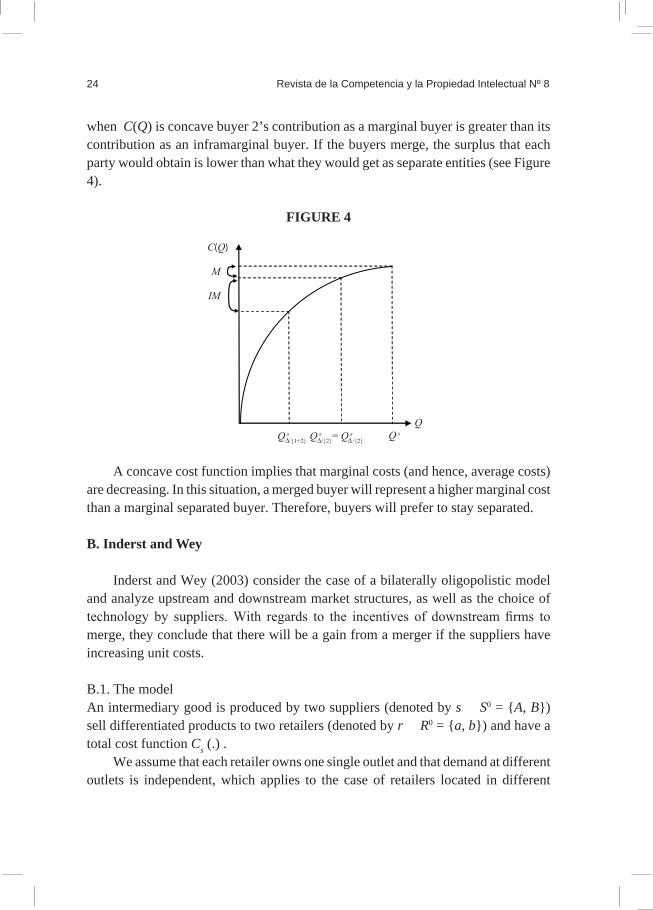
b) C(Q) is concave
If C(Q) is concave, the merger worsens the bargaining position of the buyers. Therefore, in absence of efficiency effects (upstream or downstream), the model predicts that buyers 1 and 2 should bargain separately. Unlike the previous case,
24 Revista de la Competencia y la Propiedad Intelectual Nº 8
when C(Q) is concave buyer 2’s contribution as a marginal buyer is greater than its contribution as an inframarginal buyer. If the buyers merge, the surplus that each party would obtain is lower than what they would get as separate entities (see Figure 4).
FIGURE 4
A concave cost function implies that marginal costs (and hence, average costs) are decreasing. In this situation, a merged buyer will represent a higher marginal cost than a marginal separated buyer. Therefore, buyers will prefer to stay separated.
B. Inderst and Wey
Inderst and Wey (2003) consider the case of a bilaterally oligopolistic model and analyze upstream and downstream market structures, as well as the choice of technology by suppliers. With regards to the incentives of downstream firms to merge, they conclude that there will be a gain from a merger if the suppliers have increasing unit costs.
B.1. The modelAn intermediary good is produced by two suppliers (denoted by s ∈ S0 = A, B) sell differentiated products to two retailers (denoted by r ∈ R0 = a, b) and have a total cost function Cs (.) .
We assume that each retailer owns one single outlet and that demand at different outlets is independent, which applies to the case of retailers located in different
Buyer power in the European gas market 25
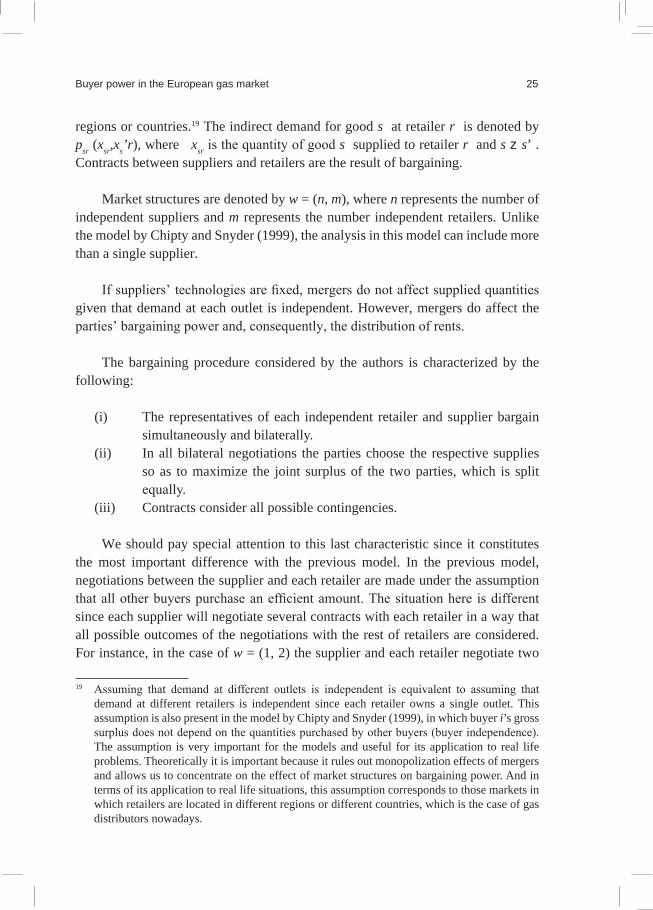
regions or countries.19 The indirect demand for good s at retailer r is denoted by psr (xsr,xs’r), where xsr is the quantity of good s supplied to retailer r and s ≠ s’ . Contracts between suppliers and retailers are the result of bargaining.
Market structures are denoted by w = (n, m), where n represents the number of independent suppliers and m represents the number independent retailers. Unlike the model by Chipty and Snyder (1999), the analysis in this model can include more than a single supplier.
If suppliers’ technologies are fixed, mergers do not affect supplied quantities given that demand at each outlet is independent. However, mergers do affect the parties’ bargaining power and, consequently, the distribution of rents.
The bargaining procedure considered by the authors is characterized by the following:
(i) The representatives of each independent retailer and supplier bargain simultaneously and bilaterally.
(ii) In all bilateral negotiations the parties choose the respective supplies so as to maximize the joint surplus of the two parties, which is split equally.
(iii) Contracts consider all possible contingencies.
We should pay special attention to this last characteristic since it constitutes the most important difference with the previous model. In the previous model, negotiations between the supplier and each retailer are made under the assumption that all other buyers purchase an efficient amount. The situation here is different since each supplier will negotiate several contracts with each retailer in a way that all possible outcomes of the negotiations with the rest of retailers are considered. For instance, in the case of w = (1, 2) the supplier and each retailer negotiate two
19 Assuming that demand at different outlets is independent is equivalent to assuming that demand at different retailers is independent since each retailer owns a single outlet. This assumption is also present in the model by Chipty and Snyder (1999), in which buyer i’s gross surplus does not depend on the quantities purchased by other buyers (buyer independence). The assumption is very important for the models and useful for its application to real life problems. Theoretically it is important because it rules out monopolization effects of mergers and allows us to concentrate on the effect of market structures on bargaining power. And in terms of its application to real life situations, this assumption corresponds to those markets in which retailers are located in different regions or different countries, which is the case of gas distributors nowadays.
26 Revista de la Competencia y la Propiedad Intelectual Nº 8
contracts: one specifying quantities and transfers for the case in which negotiations with the other retailer are successful and one specifying quantities and transfers for the case in which negotiations with the other retailer break down.
The three requirements listed above lead to an iterative procedure starting from the case where all negotiations break down to the case where all other negotiations are successful.
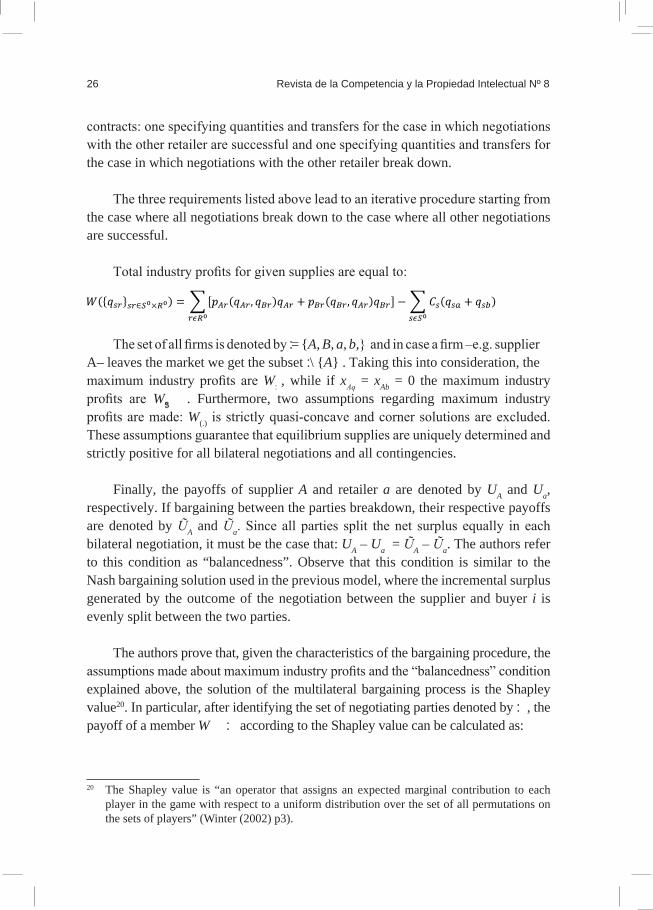
Total industry profits for given supplies are equal to:
The set of all firms is denoted by Ω = A, B, a, b, and in case a firm –e.g. supplier A– leaves the market we get the subset Ω \ A . Taking this into consideration, the maximum industry profits are WΩ, while if xAq = xAb = 0 the maximum industry profits are WΩ/A. Furthermore, two assumptions regarding maximum industry profits are made: W(.) is strictly quasi-concave and corner solutions are excluded. These assumptions guarantee that equilibrium supplies are uniquely determined and strictly positive for all bilateral negotiations and all contingencies.
Finally, the payoffs of supplier A and retailer a are denoted by UA and Ua, respectively. If bargaining between the parties breakdown, their respective payoffs are denoted by ŨA and Ũa. Since all parties split the net surplus equally in each bilateral negotiation, it must be the case that: UA – Ua = ŨA – Ũa. The authors refer to this condition as “balancedness”. Observe that this condition is similar to the Nash bargaining solution used in the previous model, where the incremental surplus generated by the outcome of the negotiation between the supplier and buyer i is evenly split between the two parties.
The authors prove that, given the characteristics of the bargaining procedure, the assumptions made about maximum industry profits and the “balancedness” condition explained above, the solution of the multilateral bargaining process is the Shapley value20. In particular, after identifying the set of negotiating parties denoted by Ω, the payoff of a member W ∈ Ω according to the Shapley value can be calculated as:
20 The Shapley value is “an operator that assigns an expected marginal contribution to each player in the game with respect to a uniform distribution over the set of all permutations on the sets of players” (Winter (2002) p3).

Buyer power in the European gas market 27
(2)
where and denote the number of elements in these sets. In this setting, the Shapley value reflects the incremental contributions of w to various subsets
B.2. Merger of two buyers
Once we have determined all the characteristics of the market and the bargaining mechanisms between the firms, we can find the retailers’ payoff under the different market structures applying the Shapley value. Table 3 shows the results.
TABLE 3RETAILERS’ PAYOFF UNDER DIFFERENT MARKET STRUCTURES
Market structure Retailers’ payoff
The integrated retailer realizes
.
Retailer r realizes
; where r ≠ r’.
The integrated retailer realizes
Retailer r realizes
In order to determine under which conditions the merger of two buyers will enhance their bargaining position vis-à-vis the supplier(s), the retailers’ joint payoff under different structures must be compared. For instance, consider the situation in which the suppliers are integrated (n = 1). The retailers will have an incentive to merge if the payoff they realize when (w = 1, 1) is higher than the one they obtain when (w = 1, 2), that is:
.
w = (1,1)
w = (1,2)
w = (2,1)
w = (2,2)
r r
s s
; where
28 Revista de la Competencia y la Propiedad Intelectual Nº 8
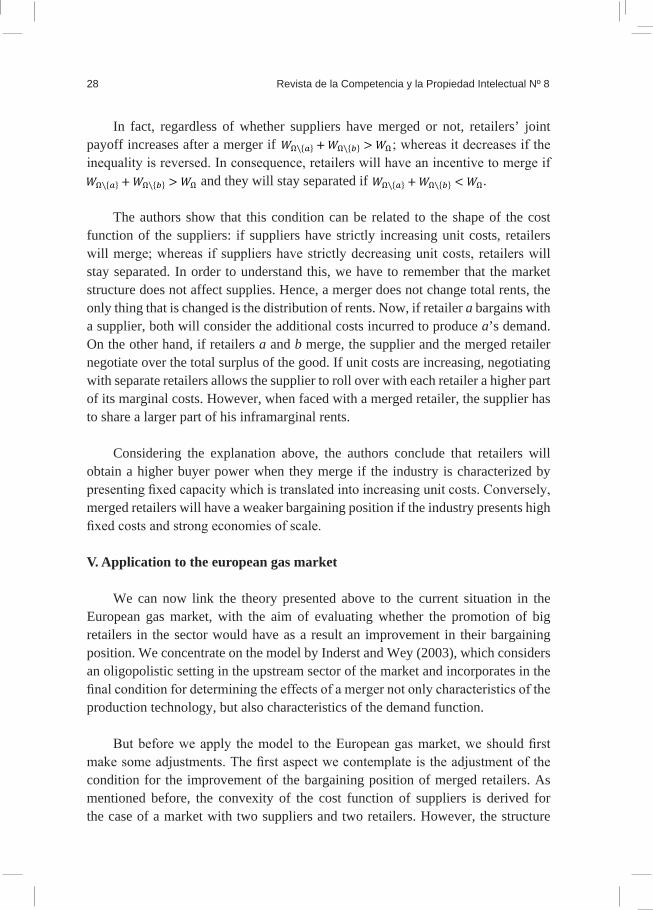
In fact, regardless of whether suppliers have merged or not, retailers’ joint payoff increases after a merger if
; whereas it decreases if the
inequality is reversed. In consequence, retailers will have an incentive to merge if mmmmmm and they will stay separated if .
The authors show that this condition can be related to the shape of the cost function of the suppliers: if suppliers have strictly increasing unit costs, retailers will merge; whereas if suppliers have strictly decreasing unit costs, retailers will stay separated. In order to understand this, we have to remember that the market structure does not affect supplies. Hence, a merger does not change total rents, the only thing that is changed is the distribution of rents. Now, if retailer a bargains with a supplier, both will consider the additional costs incurred to produce a’s demand. On the other hand, if retailers a and b merge, the supplier and the merged retailer negotiate over the total surplus of the good. If unit costs are increasing, negotiating with separate retailers allows the supplier to roll over with each retailer a higher part of its marginal costs. However, when faced with a merged retailer, the supplier has to share a larger part of his inframarginal rents.
Considering the explanation above, the authors conclude that retailers will obtain a higher buyer power when they merge if the industry is characterized by presenting fixed capacity which is translated into increasing unit costs. Conversely, merged retailers will have a weaker bargaining position if the industry presents high fixed costs and strong economies of scale.
V. Application to the european gas market
We can now link the theory presented above to the current situation in the European gas market, with the aim of evaluating whether the promotion of big retailers in the sector would have as a result an improvement in their bargaining position. We concentrate on the model by Inderst and Wey (2003), which considers an oligopolistic setting in the upstream sector of the market and incorporates in the final condition for determining the effects of a merger not only characteristics of the production technology, but also characteristics of the demand function.
But before we apply the model to the European gas market, we should first make some adjustments. The first aspect we contemplate is the adjustment of the condition for the improvement of the bargaining position of merged retailers. As mentioned before, the convexity of the cost function of suppliers is derived for the case of a market with two suppliers and two retailers. However, the structure
Buyer power in the European gas market 29
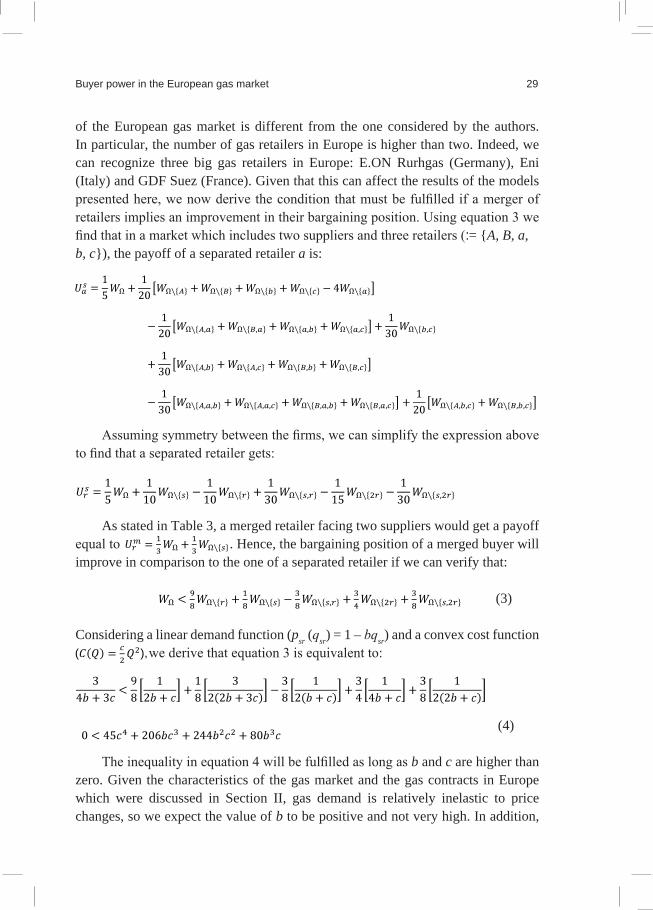
of the European gas market is different from the one considered by the authors. In particular, the number of gas retailers in Europe is higher than two. Indeed, we can recognize three big gas retailers in Europe: E.ON Rurhgas (Germany), Eni (Italy) and GDF Suez (France). Given that this can affect the results of the models presented here, we now derive the condition that must be fulfilled if a merger of retailers implies an improvement in their bargaining position. Using equation 3 we find that in a market which includes two suppliers and three retailers (Ω = A, B, a, b, c), the payoff of a separated retailer a is:
Assuming symmetry between the firms, we can simplify the expression above to find that a separated retailer gets:
As stated in Table 3, a merged retailer facing two suppliers would get a payoff equal to
. Hence, the bargaining position of a merged buyer will
improve in comparison to the one of a separated retailer if we can verify that:
(3)
Considering a linear demand function (psr (qsr) = 1 – bqsr) and a convex cost function
we derive that equation 3 is equivalent to:
(4)
The inequality in equation 4 will be fulfilled as long as b and c are higher than zero. Given the characteristics of the gas market and the gas contracts in Europe which were discussed in Section II, gas demand is relatively inelastic to price changes, so we expect the value of b to be positive and not very high. In addition,
( ),

30 Revista de la Competencia y la Propiedad Intelectual Nº 8
it is reasonable to assume that the value of c will be higher than zero since we expect total costs to be non-negative. Thus, when w = (2, 3) and the cost function of suppliers is convex, a merger of retailers will improve their bargaining position.
The second aspect that should be considered for the application of the model to the European gas market is the shape of the cost function of gas suppliers. The gas production technology is characterized by presenting very large fixed costs since drilling wells and constructing pipelines to connect the processing and demand centers is very expensive. Given that cheaper gas fields are exploited first while the most expensive fields are developed later, it can also be argued that marginal costs are increasing. Furthermore, as initial reserves are exploited, the remaining fields are situated in less convenient locations like deepwater offshore and remote arctic locations, which are difficult to manage and require additional expenses (such as internal corrosion control).21
As a result of these characteristics, we would expect the cost function of gas suppliers to be convex in early stages of production but as the cheaper fields are deployed and new ones are developed (which implies incurring in additional fixed costs), we expect it to become concave. Figure 5 presents a sketch of the hypothesized cost curve.
FIGURE 5
Considering all of the above, we conclude that the effect of a merger of gas retailers on their bargaining position will depend on which part of the cost function
21 Ruschau and Al-Anezi (2001).
Buyer power in the European gas market 31
of gas producers we are currently located: only in convex stages of the cost function, it will be convenient for gas retailers to merge.
VI. Conclusion
Nowadays, gas is one of the most important sources of energy, being used with residential, commercial and industrial purposes. Considering that it is a non-renewable natural resource that is unevenly distributed around the world, there are several concerns regarding its availability. Moreover, the existence of oligopolistic competition between the main producers provides a further source of worries for policymakers and consumers. In order to address these issues it has been proposed to encourage the creation of big firms in the distribution sector of the European gas market. These firms are supposed to have bargaining power which would offset the market power of the main suppliers of gas to the Union. We analyze this statement from a theoretical perspective.
Taking as a starting point the definition of buyer power proposed by Inderst and Mazzarotto (2008), we review some of the most important works that deal with this the topic from different approaches (theoretical, experimental and econometric). Two of these studies are presented and analyzed in further detail: the model by Chipty and Snyder (1999) and the one by Inderst and Wey (2003). These models analyze the incentives of downstream firms to grow through a merger in a context of oligopolistic competition between upstream producers and even though the models differ in several aspects, they reach the same conclusion: a merger of downstream firms will improve their bargaining position if the cost function of upstream producers is convex.
In order to apply the theory presented to the European gas market, we extend the model of Inderst and Wey (2003) to a market in which three downstream firms face a duopolistic upstream market. We find that, as long as the cost function of the latter is convex and the demand of the product depends negatively on its price, the bargaining position of a merged retailer will be enhanced in comparison to the one of a separated retailer. Nonetheless, given the characteristics of the gas production technology, we expect the cost function of gas suppliers to be convex in early stages of production and to become concave as cheaper fields are deployed and new fixed investments are required in order to develop new and more expensive fields. In this sense, only in the convex stages of the cost function of suppliers of gas to the Union, it will be favorable for the bargaining position of distributors to grow through a merger.
32 Revista de la Competencia y la Propiedad Intelectual Nº 8
An interesting extension of the present study would be a comprehensive analysis of the cost functions of the main exporters of gas to the Union (Russia, Norway and Algeria) in order to determine whether the promotion of big gas retailers would actually improve their bargaining position or not.
A further extension would be to evaluate how the results of the model change if fringe suppliers (such as LNG exporters from America and the Middle East) gain a higher market share, limiting the current suppliers’ market power.
Finally, it is important to recognize that the bargaining procedure specified in the models presented and analyzed could be improved in order to reflect more accurately the characteristics of negotiations that are observed in the European gas markets. In particular, the models assume that the supplier and each buyer negotiate over quantities to be traded and their corresponding tariffs; while gas contracts in Europe specify a long-term supply obligation and a long-term off-take obligation, as well as prices that are calculated on the basis of the value of competing energies (see equation 1). Consequently, the analysis would certainly be improved by designing a bargaining procedure that reflects more accurately the particular characteristics of the gas contracts in Europe.
REFERENCES
ASCHE, F.; P. OSMUNDSEN and R. TVETERAS (2002). “European market integration for gas? Volume flexibility and political risk”. Energy Economics, 24: 249-265.
CHAE, S. and P. HEIDHUES (2003). Buyer’s Alliances for Bargaining Power. Wissenschaftszentrum Berlin. Research Unit: Competition and Innovation. CIG Working Papers, SP II 2003-24.
CHEN, Z. (2001). Dominant Retailers and the Countervailing Power Hypothesis. Carleton University. Department of Economics, Carleton Economic Papers 01-05.
CHIPTY, T. and C. M. SNYDER (1999). “The Role of Firm Size in Bilateral Bargaining: A Study of the Cable Television Industry”. The Review of Economics and Statistics, 81(2): 326-340.
COMMISSION OF THE EUROPEAN COMMUNITIES (2000). Towards a European Strategy for the Security of Energy Supply. EU Green Paper 2000.
Buyer power in the European gas market 33
COMMISSION OF THE EUROPEAN COMMUNITIES (2006). A European Strategy for Sustainable, Competitive and Secure Energy. EU Green Paper 2006.
COMMISSION OF THE EUROPEAN COMMUNITIES (2007). An Energy Policy for Europe. Communication from the Commission to the European Council and the European Parliament.
DOBSON, P. W.; R. CLARKE; S. Davies and M. WATERSON (2001). “Buyer Power and its Impact on Competition in the Food Retail Distribution Sector of the European Union”. Journal of Industry, Competition and Trade, Vol. 1, No 3: 247 – 281.
DOBSON, P.W. and M. WATERSON (1997). “Countervailing Power and Consumer Prices”. The Economic Journal, 107 (March): 418-430. Royal Economic Society.
DOBSON, P.W. and M. WATERSON (1999). “Retailer Power: Recent Developments and Policy Implications”. Economic Policy, 14: 133-164
ENGLE-WARWICK, J. and B. J. RUFFLE (2006). Buyer Concentration as a Source of Countervailing Power: Evidence from Experimental Posted-Offer Markets. McGill University. Department of Economics, Working Paper 2006-12.
ENERGY CHARTER TREATY (2007). Putting a Price on Energy: International Pricing Mechanisms for Oil and Gas.
FISHER Ellison, S. and C. M. SNYDER (2001). Countervailing Power in Wholesale Pharmaceuticals. MIT Dept. of Economics, Working Paper No 01-27.
GALBRAITH, J. K. (1952). American Capitalism: The Concept of Countervailing Power. Houghton Mifflin.
HORN, H. and A. WOLINSKY (1988). “Bilateral Monopolies and Incentives for Merger”. RAND Journal of Economics, Vol. 19, No. 3: 408-419
INDERST, R. (2005). Large-Buyer Discount or Large-Buyer Premium? Working paper available in http://www.wiwi.uni-frankfurt.de/profs/inderst/Theory/theory_englisch.htm. Last visited on 27 July 2009.
INDERST, R. and N. MAZZAROTTO (2008). “Buyer Power in Distribution”. Chapter for the ABA Antitrust Section Handbook, Issues in Competition Law and Policy. W.D. Collins, ed., 2008.
INDERST, R. and C. WEY (2000). Market Structure, Bargaining and Technology Choice. Wissenschaftszentrum Berlin (WZB), Research Unit: Competition and Innovation. CIG Working Paper FS IV 00-12.
INDERST, R. and C. WEY (2003). “Bargaining, mergers and technology choice in bilaterally oligopolistic industries”. RAND Journal of Economics, 34(1): 1-19.

34 Revista de la Competencia y la Propiedad Intelectual Nº 8
MAZZAROTTO, N. (2004). Retail Mergers and Buyer Power. Centre for Competition & Regulation, Working Paper CCR 04-3.
NORMANN, H.T.; B. RUFFLE and C.M. SNYDER (2003). Do Buyer-Size Discounts Depend on the Curvature of the Surplus Function? Experimental Tests of Bargaining Models. EconWPA.
PETERS, J. (2000). “Buyer Market Power and Innovative Activities. Evidence for the German Automobile Industry”. Review of Industrial Organization, 16: 13 – 38.
PIRANI, S.; J. STERN and K. YAFIKAMAVA (2009). The Russo-Ukrainian Gas Dispute of January 2009: A Comprehensive Assessment. Oxford Institute for Energy Studies.
RÖLLER, L.; J. DELGADO and H. W. FRIEDERISZICK (2007). Energy: Choices for Europe. Bruegel Blueprint Series.
ROTEMBERG, J. and G. SALONER (1986). “A supergame-theoretic model of business cycles and price wars during booms”. American Economic Review 76: 195 – 222.
RUFFLE, B. J. (2000). “Some factors affecting demand withholding in posted-offer markets”. Economic Theory, Vol. 16, No 3: 529 – 544.
RUFFLE, B. J. (2005). Buyer Countervailing Power: A Survey of the Theory and Experimental Evidence. Ben-Gurion University of the Negev. Department of Economics.
RUSCHAU, G. R. and M. A. Al-ANEZI (2001). “Oil and Gas Exploration and Production”. Corrosion Cost and Preventive Strategies in the United States, Appendix S.
SCHUMACHER, U. (1991). “Buyer Structure and Seller Performance in U.S. Manufacturing Industries”. Review of Economics and Statistics, Vol. 73, No 2: 277 – 284.
SNYDER, C. M. (1996). “A dynamic theory of countervailing power”. RAND Journal of Economics, Vol. 27, No 4: 747 – 769.
SNYDER, C.M. (1998). “Why do larger buyers pay lower prices? Intense supplier competition”. Economic Letters, 58: 205 – 209.
SNYDER, C. M. (2005). “Countervailing Power”. Contribution to the New Palgrave Dictionary.
STERN, J. (2006a). The New Security Environment for European gas: worsening geopolitics and increasing global competition. Oxford Institute for Energy Studies.
STERN, J. (2006b). Natural Gas Security Problems in Europe: the Russian-Ukrainian Crisis of 2006. Asia Pacific Review, 13: 1, 32 – 59.

Buyer power in the European gas market 35
STERN, J. (2006c). The Russian-Ukrainian gas crisis of January 2006. Oxford Institute for Energy Studies.
STIGLER, G.J. (1954). “The Economist Plays with Blocs”. American Economic Review, 44: 7 – 14.
VON UNGERN-STERNBERG, T. (1996). “Countervailing Power Revisited”. International Journal of Industrial Organization, 14: 507 – 520.
WINTER, E. (2002). “The Shapley Value”. The Handbook of Game Theory. Eds. R. J. Aumann and S. Hart, North-Holland.
Related Documents