Anusha Raheja [email protected] +91 22 6635 1220 February 12, 2018 Ini Buy Yes Bank Industry: BFSI Stock Idea Higher growth + low valuations!!! Yes Bank remains one of our best bet in the sector, we recommend a BUY rating on the stock with the TP of ₹424. It is likely to be one the key beneficiaries of economic revival. We anticipate strong asset growth going forward – advances to grow at 30% CAGR over the next 2 yrs. Progress on retail assets/liabilities of the bank is also happening at much faster pace. Retail piece is likely to make the balance sheet and earnings of the bank more granular, stable and less volatile leading to improvement in the valuation multiples. Build-up of retail liabilities would improve its CASA/fees/retail loans generation capacity in a big way. In addition to this, asset quality stress on bank’s book is relatively less as compared to peer banks as reflected in Q3FY18 results. Higher growth than the industry, de-risking the balance-sheet with more build-up of retail assets/liabilities, relatively less asset quality stress, considering all these positives, we believe the bank is likely to trade at higher multiples. BUY with the TP of ₹424, upside of 30%. Asset quality outlook not very bleak – Q3FY18 results reaffirms our view that asset quality outlook of the bank is not that bleak. Also, going forward, we do not anticipate any large material shocks coming on the asset quality side. We aren’t much worried about the RBI RBS divergence amount as it is the only bank that recovered & resolved 90% of divergence amount within 6 months reflecting its holding superior quality of collaterals. We also draw comfort from the fact that total maximum stress on its balance sheet is hardly 2.8% reflected in the form of BB & below rated exposure vs. 3% for Indusind Bank and 9% for Axis Bank (Dec’17). We estimate credit cost of 70 bps in FY18E in line with the management guidance of 60-80 bps. With the increase in the balance sheet-size and seasoning of the book, we expect gross NPAs to increase marginally from 1.5% in FY17 to 1.6%/1.95%/2.2% in FY18/19/20E. It is anticipating recoveries to the tune of 30-40% from ARC sale in FY19 which could give sizeable boost to profitability. Margin improvement likely with structural change in the balance-sheet - Transformation of liability profile of the bank with massive surge in CASA deposits has aided the margin expansion of the bank so far. Sustenance or improvement of margins, on the balance sheet size which is expected to double in next 3 years, would be a commendable job. In our view, there is further room for margins to improve from 3.25% in FY17 to 3.5% in FY20E led by factors like higher corporate credit demand, self-origination of PSL loans, surge in CASA deposits, normalisation of savings deposit rates & higher growth in superior yielding retail assets. Advances to grow at faster pace – gaining market share - In Q3FY18, corporate loans recorded one of the highest growth seen in last 8 yrs. We expect this trend to continue going forward as well. Loan are estimated to grow at 30% CAGR during FY18-20E driven by both corporate & retail loans. Yes Bank is well positioned for next leg of growth coming from revival in corporate demand and also further wresting market share from PSU banks. With all retail assets products in place & sizeable branch expansion, visibility of retail asset growth is also very strong. Within retail segment, bank is likely to grow aggressively in commercial retail segment viz. commercial vehicle loans, commercial equipment financing, auto loans etc. High asset growth + increasing retail franchise = huge opportunity for valuations to improve - Currently, the bank is trading at attractive valuations of 3x/2.5x/2.1 x on FY18E/FY19E/FY20E on ABV. Return ratios are expected to improve from 17.8% in FY18E to 19.5% in FY20E. We assign 2.7x fair value multiple to FY20E ABV, giving us target price of ₹424 and an upside of 30% from the current levels. Yes Bank remains one of our best bet in the sector. Stock Data Current Market Price (₹) 326 1 year Target Price (₹) 424 Potential upside (%) 30 Market Cap (₹ bn) 755 52-Week Range (₹) 383 / 275 Face Value (₹) 2 Reuters YESB.BO Bloomberg YES IN BSE / NSE Code 532648 / YESBANK Shareholding Pattern Financial Snapshot YE Mar FY16 FY17 FY18E FY19E FY20E NII ((₹ bn) 45.7 58.0 78.9 106.5 136.4 PAT ((₹ bn) 25.4 33.3 42.4 53.4 68.2 yoy (%) 26.6 31.1 27.4 25.7 27.9 EPS (₹) 12.1 14.6 18.5 23.2 29.7 ABV (₹) 61.9 89.3 109.3 129.9 157.1 P/BV (x) 4.1 2.8 2.8 2.4 1.9 P/ABV (x) 4.2 2.9 3.0 2.5 2.1 ROA (%) 1.7 1.8 1.7 1.7 1.7 ROE (%) 20.6 19.2 17.8 18.4 19.5 Gross NPAs (%) 0.8 1.5 1.6 1.9 2.1 PCR (%) 62.0 46.9 60.3 63.1 65.8 Relative Price Performance Promoter 20.0% FPI 43.2% MF 11.3% Insurance 12.3% Public & others 13.2% 50 60 70 80 90 100 110 120 130 140 Feb-17 May-17 Aug-17 Nov-17 Feb-18 Yes Bank S&P Bse Sensex

Welcome message from author
This document is posted to help you gain knowledge. Please leave a comment to let me know what you think about it! Share it to your friends and learn new things together.
Transcript
Anusha Raheja
+91 22 6635 1220
February 12, 2018
Ini Buy
Yes Bank
Industry: BFSI
Stock Idea
Higher growth + low valuations!!!
Yes Bank remains one of our best bet in the sector, we recommend a BUY rating on the
stock with the TP of ₹424. It is likely to be one the key beneficiaries of economic revival.
We anticipate strong asset growth going forward – advances to grow at 30% CAGR over
the next 2 yrs. Progress on retail assets/liabilities of the bank is also happening at much
faster pace. Retail piece is likely to make the balance sheet and earnings of the bank
more granular, stable and less volatile leading to improvement in the valuation multiples.
Build-up of retail liabilities would improve its CASA/fees/retail loans generation capacity
in a big way. In addition to this, asset quality stress on bank’s book is relatively less as
compared to peer banks as reflected in Q3FY18 results. Higher growth than the industry,
de-risking the balance-sheet with more build-up of retail assets/liabilities, relatively less
asset quality stress, considering all these positives, we believe the bank is likely to trade
at higher multiples. BUY with the TP of ₹424, upside of 30%.
Asset quality outlook not very bleak – Q3FY18 results reaffirms our view that asset quality
outlook of the bank is not that bleak. Also, going forward, we do not anticipate any large
material shocks coming on the asset quality side. We aren’t much worried about the RBI RBS
divergence amount as it is the only bank that recovered & resolved 90% of divergence amount
within 6 months reflecting its holding superior quality of collaterals. We also draw comfort from
the fact that total maximum stress on its balance sheet is hardly 2.8% reflected in the form of BB
& below rated exposure vs. 3% for Indusind Bank and 9% for Axis Bank (Dec’17). We estimate
credit cost of 70 bps in FY18E in line with the management guidance of 60-80 bps. With the
increase in the balance sheet-size and seasoning of the book, we expect gross NPAs to increase
marginally from 1.5% in FY17 to 1.6%/1.95%/2.2% in FY18/19/20E. It is anticipating recoveries
to the tune of 30-40% from ARC sale in FY19 which could give sizeable boost to profitability.
Margin improvement likely with structural change in the balance-sheet -
Transformation of liability profile of the bank with massive surge in CASA deposits has aided
the margin expansion of the bank so far. Sustenance or improvement of margins, on the
balance sheet size which is expected to double in next 3 years, would be a commendable job.
In our view, there is further room for margins to improve from 3.25% in FY17 to 3.5% in FY20E
led by factors like higher corporate credit demand, self-origination of PSL loans, surge in CASA
deposits, normalisation of savings deposit rates & higher growth in superior yielding retail
assets.
Advances to grow at faster pace – gaining market share - In Q3FY18, corporate loans
recorded one of the highest growth seen in last 8 yrs. We expect this trend to continue going
forward as well. Loan are estimated to grow at 30% CAGR during FY18-20E driven by both
corporate & retail loans. Yes Bank is well positioned for next leg of growth coming from revival
in corporate demand and also further wresting market share from PSU banks. With all retail
assets products in place & sizeable branch expansion, visibility of retail asset growth is also very
strong. Within retail segment, bank is likely to grow aggressively in commercial retail segment
viz. commercial vehicle loans, commercial equipment financing, auto loans etc.
High asset growth + increasing retail franchise = huge opportunity for valuations to
improve - Currently, the bank is trading at attractive valuations of 3x/2.5x/2.1 x on
FY18E/FY19E/FY20E on ABV. Return ratios are expected to improve from 17.8% in FY18E to
19.5% in FY20E. We assign 2.7x fair value multiple to FY20E ABV, giving us target price of ₹424
and an upside of 30% from the current levels. Yes Bank remains one of our best bet in the
sector.
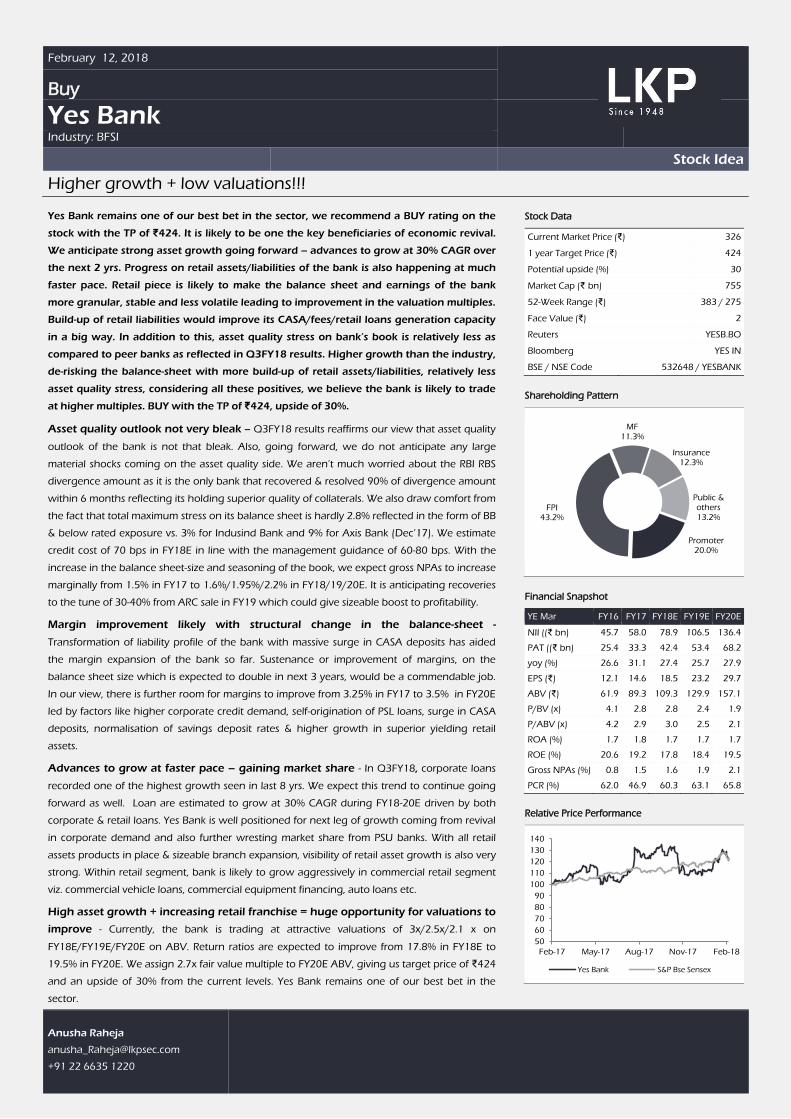
Stock Data
Current Market Price (₹) 326
1 year Target Price (₹) 424
Potential upside (%) 30
Market Cap (₹ bn) 755
52-Week Range (₹) 383 / 275
Face Value (₹) 2
Reuters YESB.BO
Bloomberg YES IN
BSE / NSE Code 532648 / YESBANK
Shareholding Pattern
Financial Snapshot
YE Mar FY16 FY17 FY18E FY19E FY20E
NII ((₹ bn) 45.7 58.0 78.9 106.5 136.4
PAT ((₹ bn) 25.4 33.3 42.4 53.4 68.2
yoy (%) 26.6 31.1 27.4 25.7 27.9
EPS (₹) 12.1 14.6 18.5 23.2 29.7
ABV (₹) 61.9 89.3 109.3 129.9 157.1
P/BV (x) 4.1 2.8 2.8 2.4 1.9
P/ABV (x) 4.2 2.9 3.0 2.5 2.1
ROA (%) 1.7 1.8 1.7 1.7 1.7
ROE (%) 20.6 19.2 17.8 18.4 19.5
Gross NPAs (%) 0.8 1.5 1.6 1.9 2.1
PCR (%) 62.0 46.9 60.3 63.1 65.8
Relative Price Performance
Promoter 20.0%
FPI 43.2%
MF 11.3%
Insurance 12.3%
Public & others 13.2%
50
60
70
80
90
100
110
120
130
140
Feb-17 May-17 Aug-17 Nov-17 Feb-18
Yes Bank S&P Bse Sensex

Yes Bank
LKP Research 2
Key Investment Arguments
Time again Yes Bank has proved superior quality of management decisions which gets
reflected from following instances – 1) Better & fast decision making ability – ahead of its
counterparts 2) Rightly using the current systemic NPA burden on the banks, wrest their
market share, which are constrained for growth due to capital & NPAs. Here, Yes is not only
gaining market share in volumes but also adding bigger & better rated quality corporates on
its books 3) Fast buildup of retail products. In short span of time, the bank has built entire retail
assets bouquet and currently has all the products on its shelf that any large cap bank would
have 4) Met their own guidance repeatedly 5) Sizeable investment in technology – higher than
what its peer banks have done. Bank is expected to reap huge benefit of this in future 6) Only
bank to recover or resolve nearly 90% of its RBI RBS divergence led amount in a matter of 6
months. This also is very good example reflecting its holding superior quality of collateral 7)
Rightly timed investment into securities & asset management businesses which could add
significant value to the bank in the future. Such diversification is not even done by its close
competitor Indusind Bank & many other medium sized banks.
In our view, all these huge positive factors can’t be ignored which the bank has earned over
the years. This along-with the fact that the bank has recovered & resolved nearly 90% of its RBI
RBS divergence amount further re-affirms our positive view on the bank.
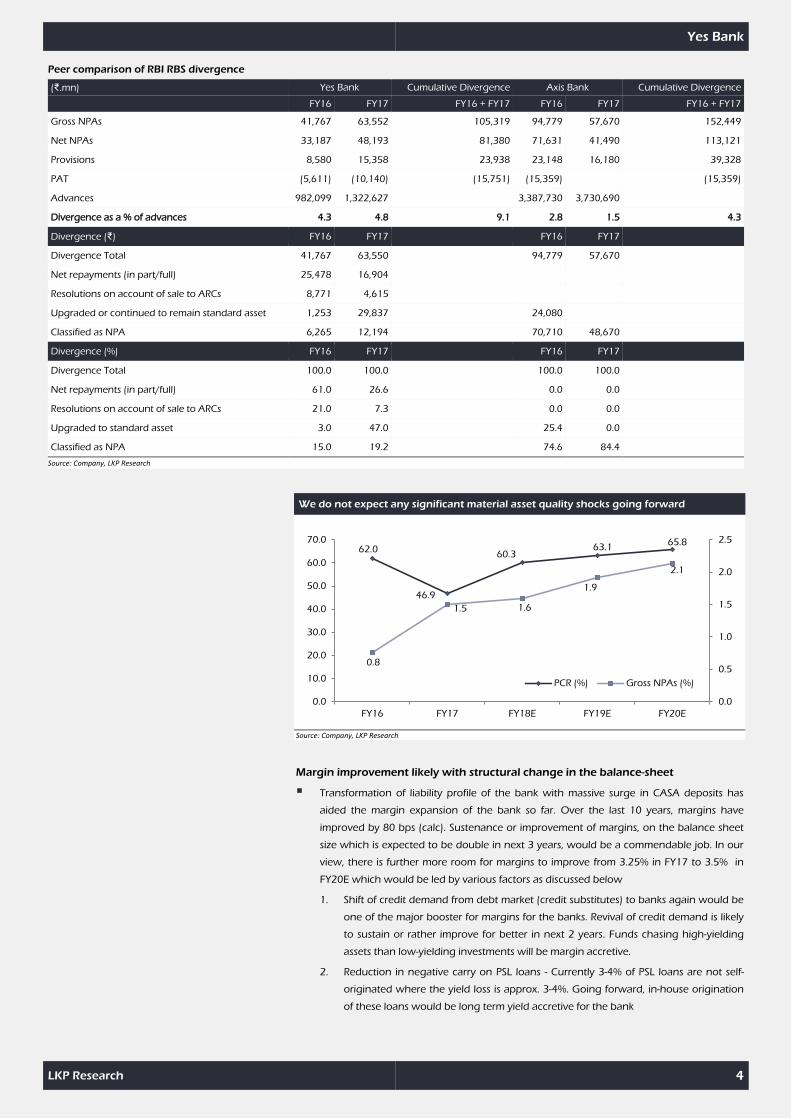
Asset quality outlook not very bleak
1. Yes Bank had Rs63.6 bn of RBI RBS divergence in Q2FY18. However, more
importantly, the bank recovered & resolved nearly 90% of this amount within 6
months of identification reflecting the strength & quality of its balance sheet. It is the
only bank to resolve nearly its entire RBI RBS amount. We also draw comfort from the
fact that total maximum stress on its balance sheet is hardly 2.8% reflected in the
form of BB & below exposure vs. 3% for Indusind Bank and 9% for Axis Bank (Dec’17)
2. Bank’s total exposure to sensitive sector is at 7.7% which includes exposure to non-
renewable electricity generation at 3.4%, iron & steel 2% and telecom at 2.3%. Here,
telecom sector lending is to all AAA rated companies where the risk of default is bare
minimum. Also, in power sector, nearly 90-95% of the projects are operational.
Relative risk in this sector has reduced materially over the period of time as SEBs now
has started honouring the commitments. The bank exposure to commercial real
estate is at 6% which includes majority of the lending done to residential project
developers which are well distributed across India – this book also holds up well from
the asset quality standpoint.
3. Total standard stressed assets of the bank amounts to 1.5% (Q3FY18) only which is
relatively much less as compared to other banks. Of the total stressed assets, nearly
1.1% are nothing but SRs (Security Receipts). Going forward, bank expects recoveries
to the tune of 30-40% from ARC sale in FY19 which could give sizeable boost to
profitability.
4. Overall, we expect credit cost of 70 bps in FY18E (75 bps in FY19E) in line with the
management guidance of 60-80 bps for current fiscal. In our view, FY19 year would
be better compared to current fiscal from asset quality standpoint. With the increase
in the balance sheet-size and seasoning of the book, we expect gross NPAs increase
marginally from 1.5% in FY17 to 1.6%/1.95%/2.2% in FY18/19/20E. While we
estimate the coverage ratios to surge to 60%+ mark in the coming years. While
management has also guided to increase the coverage ratios to 60% by Q1FY19.

Yes Bank
LKP Research 3
Rating breakup of the corporate banking exposure of the bank– maximum stress on bank’s books reflected from BB & Below rated exposure is relatively less at 2.8% as compared to other banks
Q3FY17 Q4FY17 Q1FY18 Q2FY18 Q3FY18
AAA 17.1 20.9 20.8 19.7 22
AA 19.5 15.6 14 14.8 13.4
A 39.6 39.6 41.6 41.1 42.8
BBB 22.1 21.8 21.8 21.5 19
BB & Below 1.7 2 1.8 2.9 2.8
Total 100 99.9 100 100 100
Source: Company
Exposure to sensitive sector
(% of advances) Q2FY18 Q3FY18
1) Non-renewable electricity generation 3.4 3.4
1a) Exposure to SEBs 0 0
2) Iron & Steel 2 2
2a) A & above rated 1.6 1.6
3) Telecom 3.9 2.3
3a) A & above rated 3.7 2.1
Source: Company
Quarterly asset quality trends – recent Q3FY18 quarter reflects reduction the asset quality pain
(Rs.mn) Q1FY17 Q2FY17 Q3FY17 Q4FY17 Q1FY18 Q2FY18 Q3FY18
Gross NPAs
Opening Bal. 7,490 8,445 9,166 10,058 20,186 13,644 27,204
Add: Slippages 2,996 3,015 1,265 10,127 2,010 19,888 4,949
Less: Reductions, recoveries & write-offs
2,041 2,294 373 - 8,551 6,328 2,409
Closing Gross NPAs 8,445 9,166 10,058 20,185 13,645 27,204 29,744
Net NPAs 3,024 3,230 3,424 10,722 5,453 15,433 15,951
Provisions 5,422 5,936 6,634 9,463 8,192 11,771 13,793
PCR (%) 64 65 66 47 60 43 46
Stressed Assets
Restructured Advances 5,229 5,115 5,002 4,816 3,314 1,161 903
Security Receipts 1,994 2,589 2,588 9,771 9,771 14,123 18,342
5:25 - 1,031 1,031 1,255 1,389 2,283 1,120
SDR 343 343 1,935 2,996 2,874 4,771 3,619
S4A - - - 189 189 188 1,535
Source: Company, LKP Research
RBI RBS Divergence details
RBI - RBS Amt (₹.mn) %
Total Amt of divergence 63,550 100.0
Upgraded 29,869 47.0
ARC Sale 4,400 6.9
Paid Fully 17,159 27.0
Remaining Gross NPAs 12,123 19.1
Source: Company, LKP Research
Yes Bank
LKP Research 4
Peer comparison of RBI RBS divergence
(₹.mn) Yes Bank Cumulative Divergence Axis Bank Cumulative Divergence
FY16 FY17 FY16 + FY17 FY16 FY17 FY16 + FY17
Gross NPAs 41,767 63,552 105,319 94,779 57,670 152,449
Net NPAs 33,187 48,193 81,380 71,631 41,490 113,121
Provisions 8,580 15,358 23,938 23,148 16,180 39,328
PAT (5,611) (10,140) (15,751) (15,359) (15,359)
Advances 982,099 1,322,627 3,387,730 3,730,690
Divergence as a % of advances 4.3 4.8 9.1 2.8 1.5 4.3
Divergence (₹) FY16 FY17 FY16 FY17
Divergence Total 41,767 63,550 94,779 57,670
Net repayments (in part/full) 25,478 16,904
Resolutions on account of sale to ARCs 8,771 4,615
Upgraded or continued to remain standard asset 1,253 29,837 24,080
Classified as NPA 6,265 12,194 70,710 48,670
Divergence (%) FY16 FY17 FY16 FY17
Divergence Total 100.0 100.0 100.0 100.0
Net repayments (in part/full) 61.0 26.6 0.0 0.0
Resolutions on account of sale to ARCs 21.0 7.3 0.0 0.0
Upgraded to standard asset 3.0 47.0 25.4 0.0
Classified as NPA 15.0 19.2 74.6 84.4
Source: Company, LKP Research
We do not expect any significant material asset quality shocks going forward
Source: Company, LKP Research
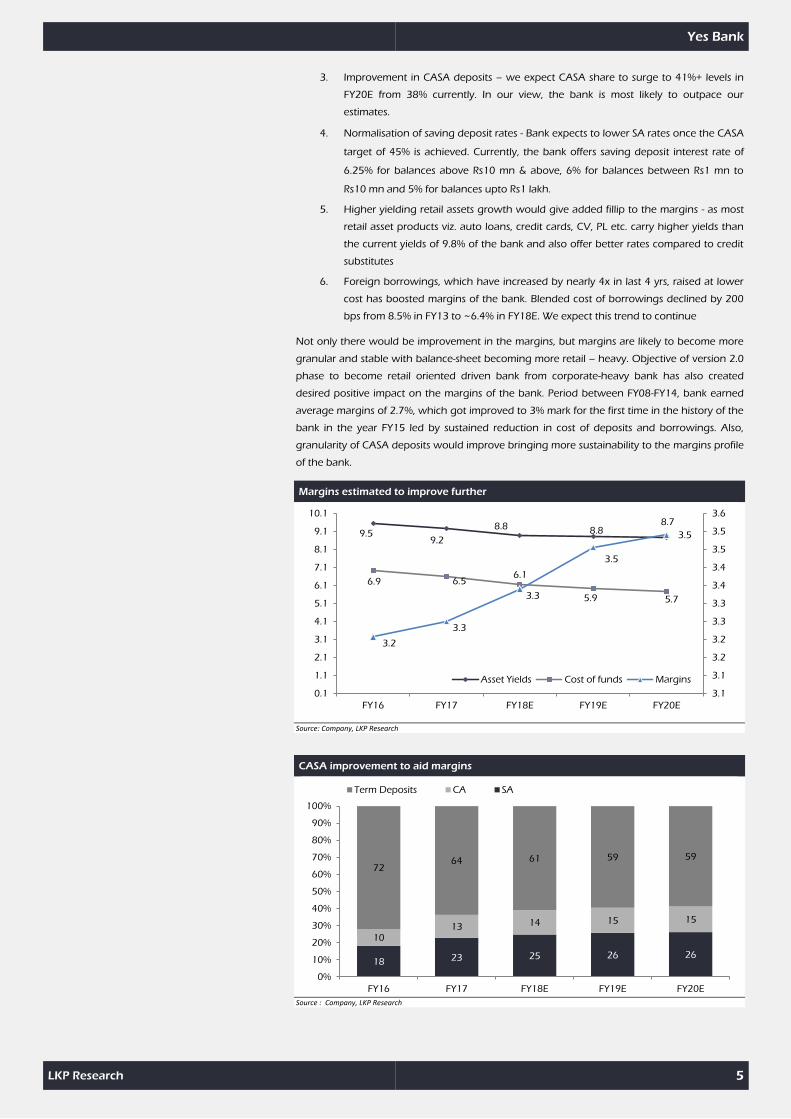
Margin improvement likely with structural change in the balance-sheet
Transformation of liability profile of the bank with massive surge in CASA deposits has
aided the margin expansion of the bank so far. Over the last 10 years, margins have
improved by 80 bps (calc). Sustenance or improvement of margins, on the balance sheet
size which is expected to be double in next 3 years, would be a commendable job. In our
view, there is further more room for margins to improve from 3.25% in FY17 to 3.5% in
FY20E which would be led by various factors as discussed below
1. Shift of credit demand from debt market (credit substitutes) to banks again would be
one of the major booster for margins for the banks. Revival of credit demand is likely
to sustain or rather improve for better in next 2 years. Funds chasing high-yielding
assets than low-yielding investments will be margin accretive.
2. Reduction in negative carry on PSL loans - Currently 3-4% of PSL loans are not self-
originated where the yield loss is approx. 3-4%. Going forward, in-house origination
of these loans would be long term yield accretive for the bank
62.0
46.9
60.3 63.1
65.8
0.8
1.5 1.6
1.9
2.1
0.0
0.5
1.0
1.5
2.0
2.5
0.0
10.0
20.0
30.0
40.0
50.0
60.0
70.0
FY16 FY17 FY18E FY19E FY20E
PCR (%) Gross NPAs (%)
Yes Bank
LKP Research 5
3. Improvement in CASA deposits – we expect CASA share to surge to 41%+ levels in
FY20E from 38% currently. In our view, the bank is most likely to outpace our
estimates.
4. Normalisation of saving deposit rates - Bank expects to lower SA rates once the CASA
target of 45% is achieved. Currently, the bank offers saving deposit interest rate of
6.25% for balances above Rs10 mn & above, 6% for balances between Rs1 mn to
Rs10 mn and 5% for balances upto Rs1 lakh.
5. Higher yielding retail assets growth would give added fillip to the margins - as most
retail asset products viz. auto loans, credit cards, CV, PL etc. carry higher yields than
the current yields of 9.8% of the bank and also offer better rates compared to credit
substitutes
6. Foreign borrowings, which have increased by nearly 4x in last 4 yrs, raised at lower
cost has boosted margins of the bank. Blended cost of borrowings declined by 200
bps from 8.5% in FY13 to ~6.4% in FY18E. We expect this trend to continue
Not only there would be improvement in the margins, but margins are likely to become more
granular and stable with balance-sheet becoming more retail – heavy. Objective of version 2.0
phase to become retail oriented driven bank from corporate-heavy bank has also created
desired positive impact on the margins of the bank. Period between FY08-FY14, bank earned
average margins of 2.7%, which got improved to 3% mark for the first time in the history of the
bank in the year FY15 led by sustained reduction in cost of deposits and borrowings. Also,
granularity of CASA deposits would improve bringing more sustainability to the margins profile
of the bank.
Margins estimated to improve further
Source: Company, LKP Research
CASA improvement to aid margins
Source : Company, LKP Research
9.5 9.2
8.8 8.8 8.7
6.9 6.5 6.1
5.9 5.7
3.2
3.3
3.3
3.5
3.5
3.1
3.1
3.2
3.2
3.3
3.3
3.4
3.4
3.5
3.5
3.6
0.1
1.1
2.1
3.1
4.1
5.1
6.1
7.1
8.1
9.1
10.1
FY16 FY17 FY18E FY19E FY20E
Asset Yields Cost of funds Margins
18 23 25 26 26
10 13 14 15 15
72 64 61 59 59
0%
10%
20%
30%
40%
50%
60%
70%
80%
90%
100%
FY16 FY17 FY18E FY19E FY20E
Term Deposits CA SA
Yes Bank
LKP Research 6
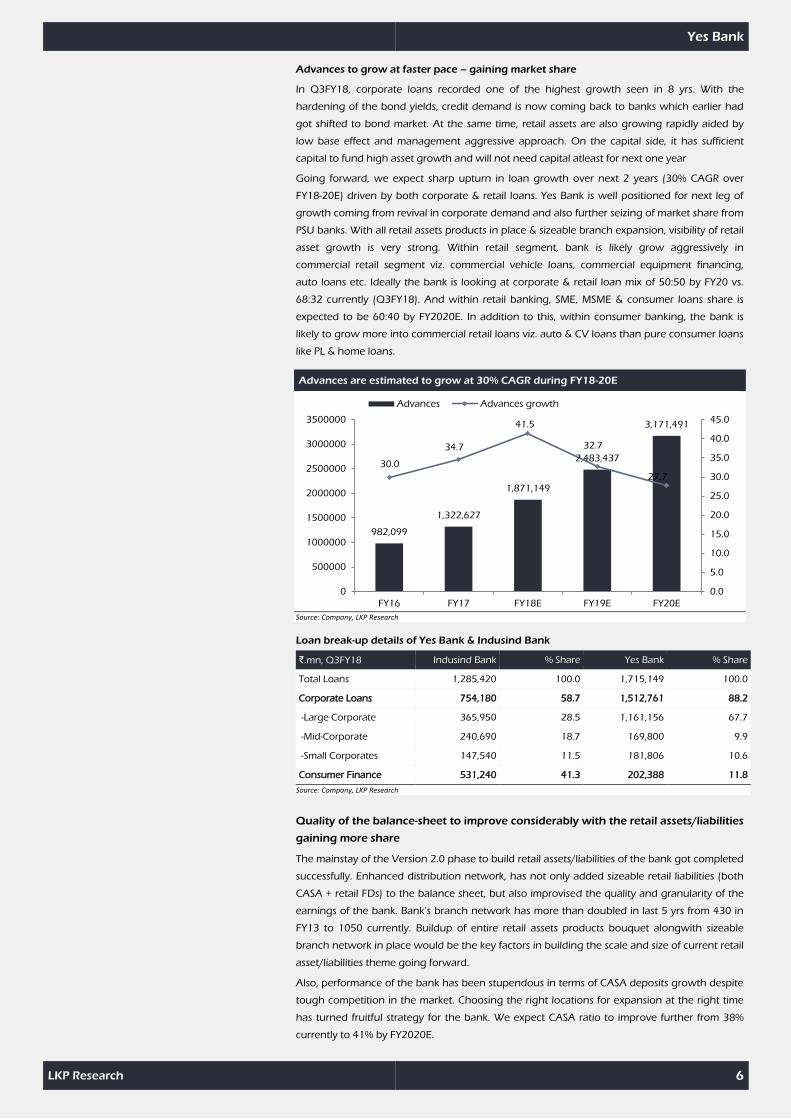
Advances to grow at faster pace – gaining market share
In Q3FY18, corporate loans recorded one of the highest growth seen in 8 yrs. With the
hardening of the bond yields, credit demand is now coming back to banks which earlier had
got shifted to bond market. At the same time, retail assets are also growing rapidly aided by
low base effect and management aggressive approach. On the capital side, it has sufficient
capital to fund high asset growth and will not need capital atleast for next one year
Going forward, we expect sharp upturn in loan growth over next 2 years (30% CAGR over
FY18-20E) driven by both corporate & retail loans. Yes Bank is well positioned for next leg of
growth coming from revival in corporate demand and also further seizing of market share from
PSU banks. With all retail assets products in place & sizeable branch expansion, visibility of retail
asset growth is very strong. Within retail segment, bank is likely grow aggressively in
commercial retail segment viz. commercial vehicle loans, commercial equipment financing,
auto loans etc. Ideally the bank is looking at corporate & retail loan mix of 50:50 by FY20 vs.
68:32 currently (Q3FY18). And within retail banking, SME, MSME & consumer loans share is
expected to be 60:40 by FY2020E. In addition to this, within consumer banking, the bank is
likely to grow more into commercial retail loans viz. auto & CV loans than pure consumer loans
like PL & home loans.
Advances are estimated to grow at 30% CAGR during FY18-20E
Source: Company, LKP Research
Loan break-up details of Yes Bank & Indusind Bank
₹.mn, Q3FY18 Indusind Bank % Share Yes Bank % Share
Total Loans 1,285,420 100.0 1,715,149 100.0
Corporate Loans 754,180 58.7 1,512,761 88.2
-Large Corporate 365,950 28.5 1,161,156 67.7
-Mid-Corporate 240,690 18.7 169,800 9.9
-Small Corporates 147,540 11.5 181,806 10.6
Consumer Finance 531,240 41.3 202,388 11.8
Source: Company, LKP Research
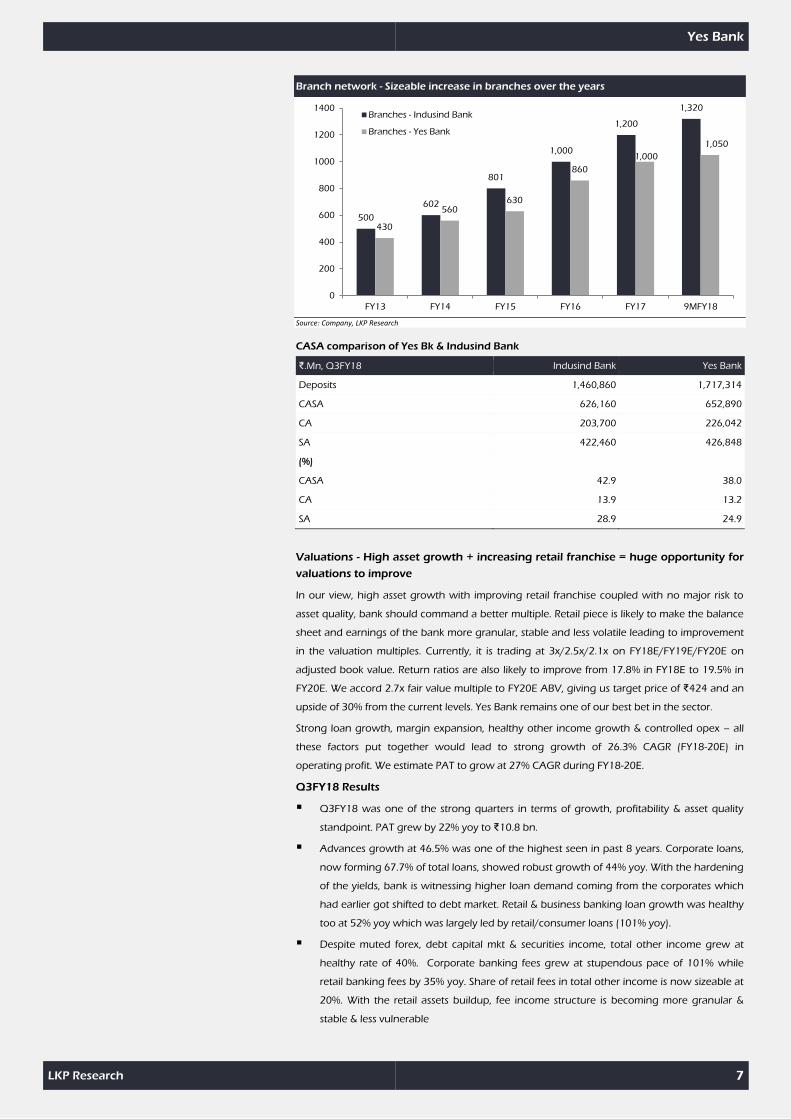
Quality of the balance-sheet to improve considerably with the retail assets/liabilities
gaining more share
The mainstay of the Version 2.0 phase to build retail assets/liabilities of the bank got completed
successfully. Enhanced distribution network, has not only added sizeable retail liabilities (both
CASA + retail FDs) to the balance sheet, but also improvised the quality and granularity of the
earnings of the bank. Bank’s branch network has more than doubled in last 5 yrs from 430 in
FY13 to 1050 currently. Buildup of entire retail assets products bouquet alongwith sizeable
branch network in place would be the key factors in building the scale and size of current retail
asset/liabilities theme going forward.
Also, performance of the bank has been stupendous in terms of CASA deposits growth despite
tough competition in the market. Choosing the right locations for expansion at the right time
has turned fruitful strategy for the bank. We expect CASA ratio to improve further from 38%
currently to 41% by FY2020E.
982,099
1,322,627
1,871,149
2,483,437
3,171,491
30.0
34.7
41.5
32.7
27.7
0.0
5.0
10.0
15.0
20.0
25.0
30.0
35.0
40.0
45.0
0
500000
1000000
1500000
2000000
2500000
3000000
3500000
FY16 FY17 FY18E FY19E FY20E
Advances Advances growth
Yes Bank
LKP Research 7
Branch network - Sizeable increase in branches over the years
Source: Company, LKP Research
CASA comparison of Yes Bk & Indusind Bank
₹.Mn, Q3FY18 Indusind Bank Yes Bank
Deposits 1,460,860 1,717,314
CASA 626,160 652,890
CA 203,700 226,042
SA 422,460 426,848
(%)
CASA 42.9 38.0
CA 13.9 13.2
SA 28.9 24.9
Valuations - High asset growth + increasing retail franchise = huge opportunity for
valuations to improve
In our view, high asset growth with improving retail franchise coupled with no major risk to
asset quality, bank should command a better multiple. Retail piece is likely to make the balance
sheet and earnings of the bank more granular, stable and less volatile leading to improvement
in the valuation multiples. Currently, it is trading at 3x/2.5x/2.1x on FY18E/FY19E/FY20E on
adjusted book value. Return ratios are also likely to improve from 17.8% in FY18E to 19.5% in
FY20E. We accord 2.7x fair value multiple to FY20E ABV, giving us target price of ₹424 and an
upside of 30% from the current levels. Yes Bank remains one of our best bet in the sector.
Strong loan growth, margin expansion, healthy other income growth & controlled opex – all
these factors put together would lead to strong growth of 26.3% CAGR (FY18-20E) in
operating profit. We estimate PAT to grow at 27% CAGR during FY18-20E.
Q3FY18 Results
Q3FY18 was one of the strong quarters in terms of growth, profitability & asset quality
standpoint. PAT grew by 22% yoy to ₹10.8 bn.
Advances growth at 46.5% was one of the highest seen in past 8 years. Corporate loans,
now forming 67.7% of total loans, showed robust growth of 44% yoy. With the hardening
of the yields, bank is witnessing higher loan demand coming from the corporates which
had earlier got shifted to debt market. Retail & business banking loan growth was healthy
too at 52% yoy which was largely led by retail/consumer loans (101% yoy).
Despite muted forex, debt capital mkt & securities income, total other income grew at
healthy rate of 40%. Corporate banking fees grew at stupendous pace of 101% while
retail banking fees by 35% yoy. Share of retail fees in total other income is now sizeable at
20%. With the retail assets buildup, fee income structure is becoming more granular &
stable & less vulnerable
500
602
801
1,000
1,200
1,320
430
560 630
860
1,000
1,050
0
200
400
600
800
1000
1200
1400
FY13 FY14 FY15 FY16 FY17 9MFY18
Branches - Indusind Bank
Branches - Yes Bank

Yes Bank
LKP Research 8
Drop in the advances yields led to margin fall of 20 bps to 3.5% (reported). Advances
yields came off by 40 bps from 10.2% in Q2FY18 to 9.8% in Q3FY18. Although margins
have corrected in the near term, long term outlook on margins is upbeat due to various
factors like surge in CASA deposits, normalization of SA rates, reduction in interest reversal
on NPA accounts etc.
Incremental slippages for the quarter were much less at ₹4.9 bn vs. ₹19.9 bn in Q2FY18
(includes ₹12 bn RBI RBS divergence amount). 50% of incremental slippages for the
quarter came from accounts already recognized stressed assets (NCLT, 5.25, SDR). Total
credit cost was at 18 bps vs. 29 bps qoq. In % terms, gross NPAs stood at 1.72% vs. 1.82%
qoq. In addition to this, bank sold one standard account to ARC having gross value of Rs6
bn (net value of ₹4.2 bn). Bank’s total restructured assets now stands at 1.5%, of this,
majority is in SRs (at 1.06%). It is expecting recoveries to the tune of 30-40% from these
ARC sale in FY19. Also, bank is aiming to increase the provision coverage ratio to 60%+
which is low currently at 46%
Financial Highlights
(in ₹Mn) Q3FY18 Q3FY17 yoy (%) Q3FY17 qoq (%) 9MFY18 9MFY17 yoy (%)
Interest earned 50,703 42,134 20.3 48,003 5.6 145,244 120,757 20.3
Interest/discount on advances/bills 38,462 31,393 22.5 36,932 4.1 110,738 89,507 23.7
Income on investments 10,977 9,642 13.8 9,227 19.0 29,231 28,545 2.4
Interest on bal. with RBI 825 708 16.4 1,447 (43.0) 4,065 1,472 176.1
Others 440 391 12.4 398 10.5 1,211 1,233 (1.8)
Interest expenses 31,815 27,241 16.8 29,153 9.1 89,416 79,181 12.9
Net Interest Income (NII) 18,888 14,893 26.8 18,851 0.2 55,828 41,576 34.3
Other Income 14,223 10,165 39.9 12,484 13.9 38,029 28,994 31.2
Total income 33,111 25,059 32.1 31,335 5.7 93,857 70,570 33.0
Operating expenses 13,093 10,520 24.4 12,269 6.7 37,730 29,104 29.6
Employee cost 5,334 4,675 14.1 5,628 (5.2) 16,423 13,082 25.5
Other operating expenses 7,759 5,846 32.7 6,641 16.8 21,308 16,022 33.0
Operating profit 20,018 14,538 37.7 19,067 5.0 56,127 41,465 35.4
Provision for contingencies 4,213 1,154 265.2 4,471 (5.8) 11,542 4,837 138.6
PBT 15,805 13,384 18.1 14,596 8.3 44,585 36,629 21.7
Provision for taxes 5,036 4,558 10.5 4,569 10.2 14,134 12,469 13.4
Net profit 10,769 8,826 22.0 10,027 7.4 30,451 24,160 26.0
Equity 4,597 4,230 8.7 4,581 0.3 4,597 4,230 8.7
EPS (₹) 23 21 12.3 22 7.0 66 57 16.0
Ratios (%)
Int. exp/Int earned (%) 63 65 - 61 - 62 66 -
Cost/Income ratio (%) 40 42 - 39 - 40 41 -
Gross NPAs (₹) 29,743 10,059 195.7 27,203 9.3 29,743 10,059 195.7
Net NPAs (₹) 15,951 3,425 365.8 15,433 3.4 15,951 3,425 365.8
Gross NPAs (%) 1.7 0.9 - 1.8 - 1.7 0.9 -
Net NPAs (%) 0.9 0.3 - 1.0 - 0.9 0.3 -
ROA (%) 1.7 1.8 - 1.7 - 1.5 1.5 -
CAR (%) 18.4 15.6 - 17.0 - 18.4 15.6 -
Provision coverage (%) 46.4 66.0 43.3 46.4 66.0
Balance Sheet (₹.mn)
Deposits 1,717,314 1,323,758 29.7 1,579,898 8.7 1,717,314 1,323,758 29.7
Advances 1,715,149 1,170,870 46.5 1,486,753 15.4 1,715,149 1,170,870 46.5
Source: Company, LKP Research
Yes Bank
LKP Research 9
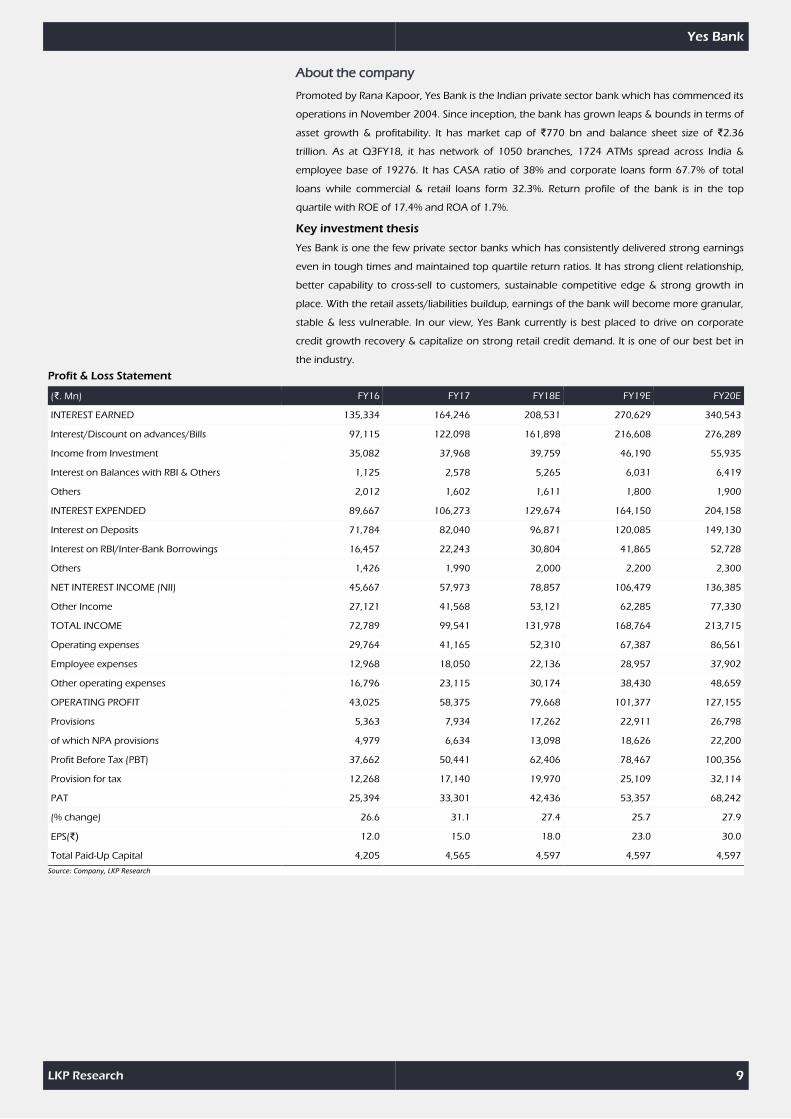
About the company
Promoted by Rana Kapoor, Yes Bank is the Indian private sector bank which has commenced its
operations in November 2004. Since inception, the bank has grown leaps & bounds in terms of
asset growth & profitability. It has market cap of ₹770 bn and balance sheet size of ₹2.36
trillion. As at Q3FY18, it has network of 1050 branches, 1724 ATMs spread across India &
employee base of 19276. It has CASA ratio of 38% and corporate loans form 67.7% of total
loans while commercial & retail loans form 32.3%. Return profile of the bank is in the top
quartile with ROE of 17.4% and ROA of 1.7%.
Key investment thesis
Yes Bank is one the few private sector banks which has consistently delivered strong earnings
even in tough times and maintained top quartile return ratios. It has strong client relationship,
better capability to cross-sell to customers, sustainable competitive edge & strong growth in
place. With the retail assets/liabilities buildup, earnings of the bank will become more granular,
stable & less vulnerable. In our view, Yes Bank currently is best placed to drive on corporate
credit growth recovery & capitalize on strong retail credit demand. It is one of our best bet in
the industry.
Profit & Loss Statement
(₹. Mn) FY16 FY17 FY18E FY19E FY20E
INTEREST EARNED 135,334 164,246 208,531 270,629 340,543
Interest/Discount on advances/Bills 97,115 122,098 161,898 216,608 276,289
Income from Investment 35,082 37,968 39,759 46,190 55,935
Interest on Balances with RBI & Others 1,125 2,578 5,265 6,031 6,419
Others 2,012 1,602 1,611 1,800 1,900
INTEREST EXPENDED 89,667 106,273 129,674 164,150 204,158
Interest on Deposits 71,784 82,040 96,871 120,085 149,130
Interest on RBI/Inter-Bank Borrowings 16,457 22,243 30,804 41,865 52,728
Others 1,426 1,990 2,000 2,200 2,300
NET INTEREST INCOME (NII) 45,667 57,973 78,857 106,479 136,385
Other Income 27,121 41,568 53,121 62,285 77,330
TOTAL INCOME 72,789 99,541 131,978 168,764 213,715
Operating expenses 29,764 41,165 52,310 67,387 86,561
Employee expenses 12,968 18,050 22,136 28,957 37,902
Other operating expenses 16,796 23,115 30,174 38,430 48,659
OPERATING PROFIT 43,025 58,375 79,668 101,377 127,155
Provisions 5,363 7,934 17,262 22,911 26,798
of which NPA provisions 4,979 6,634 13,098 18,626 22,200
Profit Before Tax (PBT) 37,662 50,441 62,406 78,467 100,356
Provision for tax 12,268 17,140 19,970 25,109 32,114
PAT 25,394 33,301 42,436 53,357 68,242
(% change) 26.6 31.1 27.4 25.7 27.9
EPS(₹) 12.0 15.0 18.0 23.0 30.0
Total Paid-Up Capital 4,205 4,565 4,597 4,597 4,597
Source: Company, LKP Research

Yes Bank
LKP Research 10
Balance Sheet
(₹.mn) FY16 FY17 FY18E FY19E FY20E
Application of funds
Cash & Bal. with RBI 57,762 69,521 81,418 105,509 134,100
Balance with banks & money at call and short notice 24,423 125,974 147,497 154,040 166,932
Advances / Credit 982,099 1,322,627 1,871,149 2,483,437 3,171,491
Investments 488,385 500,318 611,111 718,806 894,251
Fixed assets 4,707 6,835 8,647 11,166 14,102
Other assets 95,259 125,325 120,502 139,783 163,546
TOTAL ASSETS 1,652,634 2,150,599 2,840,323 3,612,740 4,544,421
Sources of funds
Total Paid-Up Capital 4,205 4,565 4,597 4,597 4,597
Reserves & Surplus 133,661 215,976 258,572 311,929 380,171
Networth 137,866 220,541 263,169 316,526 384,769
Deposits 1,117,195 1,428,739 1,877,314 2,442,820 3,117,529
-Current deposits 109,251 190,878 266,042 359,157 466,904
-Savings deposits 204,177 327,818 466,848 630,245 819,318
Borrowings 316,590 386,067 571,909 710,111 880,213
Other liabilities & provisions 80,983 115,253 127,931 143,283 161,910
TOTAL LIABILITIES 1652634 2150599 2840323 3612740 4544421 Source: Company, LKP Research
Ratios
(A) Efficiency Ratios (%) FY16 FY17 FY18E FY19E FY20E
Int. exp/Int. earned (%) 66.3 64.7 62.2 60.7 60.0
NII / Total Income (%) 62.7 58.2 59.8 63.1 63.8
Other income / Total Income (%) 37.3 41.8 40.2 36.9 36.2
Cost / Income 40.9 41.4 39.6 39.9 40.5
Cost/Income (excluding trading gains) (%) 42.4 44.5 42.0 40.7 41.2
C-D ratio (%) 88.6 94.0 101.3 103.6 104.0
I-D ratio (%) 43.7 35.0 32.6 29.4 28.7
Incremental CD ratio (%) 112.4 113.4 124.5 111.5 105.1
Incremental ID ratio (%) 10.9 3.8 24.7 19.0 26.0
Loan / Assets ratio (%) 59.9 62.4 66.9 70.1 71.3
Deposits / Assets ratio (%) 67.6 66.4 66.1 67.6 68.6
CA / Total Deposits (%) 9.8 13.4 14.2 14.7 15.0
SA / Total Deposits (%) 18.3 22.9 24.9 25.8 26.3
CASA / Total Deposits 28.1 36.3 39.0 40.5 41.3
B) Spreads (%) FY16 FY17 FY18E FY19E FY20E
Yield on Assets (%) 9.5 9.2 8.8 8.8 8.7
Yield on Advances (%) 11.2 10.6 10.1 9.9 9.8
Yield on Investments (%) 7.4 7.7 7.2 7.0 7.0
Cost of Funds (%) 6.9 6.5 6.1 5.9 5.7
Cost of Deposits (%) 7.1 6.4 5.9 5.6 5.4
Cost of Earning Assets (%) 6.3 6.0 5.5 5.3 5.2
Spreads (%) 2.6 2.7 2.7 2.9 3.0
Net Interest Margin 3.2 3.3 3.3 3.5 3.5
C) Solvency FY16 FY17 FY18E FY19E FY20E
Gross NPAs (₹) 7490 20186 30196 48430 69290
Net NPAs (₹) 2845 10723 12001 17890 23700
Gross NPAs / Gross Advances (%) 0.8 1.5 1.6 1.9 2.1
Net NPAs / Net advances (%) 0.29 0.81 0.64 0.72 0.75
Provisions Coverage Ratio (%) (Excl. Fl. Prov.) 62.0 46.9 60.3 63.1 65.8
Credit cost (%) (incl NPA provisions) 0.5 0.49 0.7 0.8 0.7
Credit cost (%) (incl. NPA + SA + rest provisions) 0.5 0.6 0.9 0.9 0.8
Yes Bank
LKP Research 11
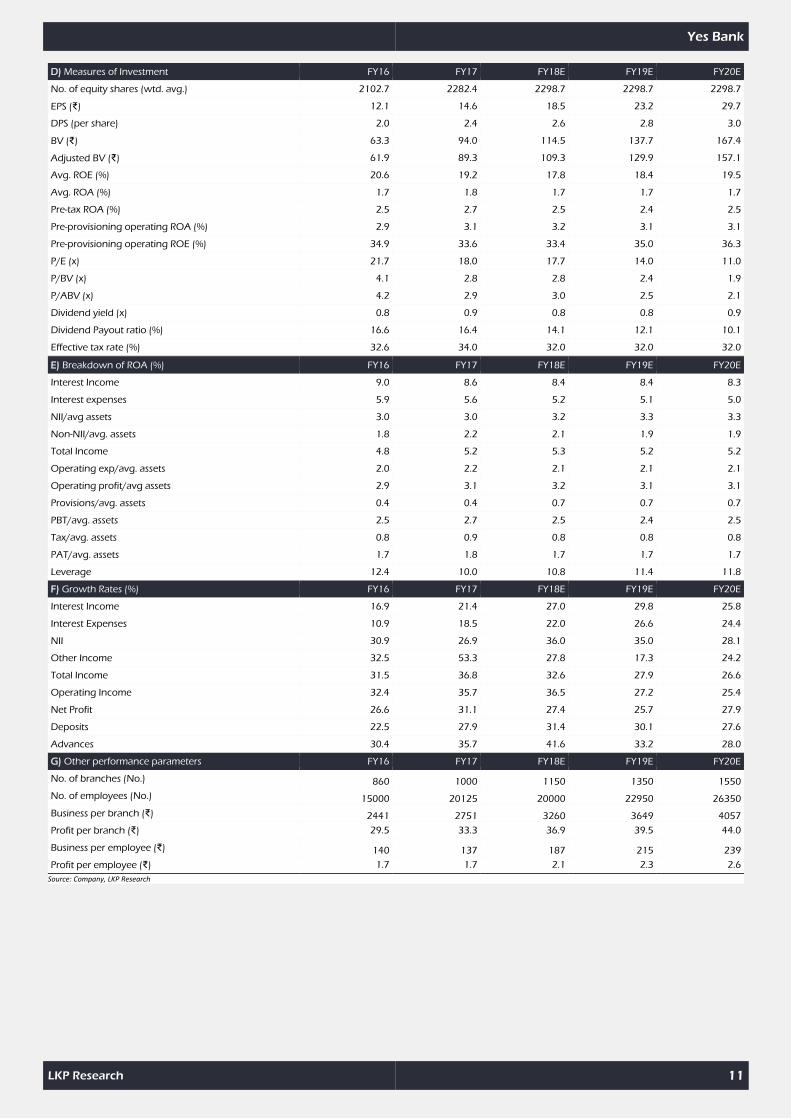
D) Measures of Investment FY16 FY17 FY18E FY19E FY20E
No. of equity shares (wtd. avg.) 2102.7 2282.4 2298.7 2298.7 2298.7
EPS (₹) 12.1 14.6 18.5 23.2 29.7
DPS (per share) 2.0 2.4 2.6 2.8 3.0
BV (₹) 63.3 94.0 114.5 137.7 167.4
Adjusted BV (₹) 61.9 89.3 109.3 129.9 157.1
Avg. ROE (%) 20.6 19.2 17.8 18.4 19.5
Avg. ROA (%) 1.7 1.8 1.7 1.7 1.7
Pre-tax ROA (%) 2.5 2.7 2.5 2.4 2.5
Pre-provisioning operating ROA (%) 2.9 3.1 3.2 3.1 3.1
Pre-provisioning operating ROE (%) 34.9 33.6 33.4 35.0 36.3
P/E (x) 21.7 18.0 17.7 14.0 11.0
P/BV (x) 4.1 2.8 2.8 2.4 1.9
P/ABV (x) 4.2 2.9 3.0 2.5 2.1
Dividend yield (x) 0.8 0.9 0.8 0.8 0.9
Dividend Payout ratio (%) 16.6 16.4 14.1 12.1 10.1
Effective tax rate (%) 32.6 34.0 32.0 32.0 32.0
E) Breakdown of ROA (%) FY16 FY17 FY18E FY19E FY20E
Interest Income 9.0 8.6 8.4 8.4 8.3
Interest expenses 5.9 5.6 5.2 5.1 5.0
NII/avg assets 3.0 3.0 3.2 3.3 3.3
Non-NII/avg. assets 1.8 2.2 2.1 1.9 1.9
Total Income 4.8 5.2 5.3 5.2 5.2
Operating exp/avg. assets 2.0 2.2 2.1 2.1 2.1
Operating profit/avg assets 2.9 3.1 3.2 3.1 3.1
Provisions/avg. assets 0.4 0.4 0.7 0.7 0.7
PBT/avg. assets 2.5 2.7 2.5 2.4 2.5
Tax/avg. assets 0.8 0.9 0.8 0.8 0.8
PAT/avg. assets 1.7 1.8 1.7 1.7 1.7
Leverage 12.4 10.0 10.8 11.4 11.8
F) Growth Rates (%) FY16 FY17 FY18E FY19E FY20E
Interest Income 16.9 21.4 27.0 29.8 25.8
Interest Expenses 10.9 18.5 22.0 26.6 24.4
NII 30.9 26.9 36.0 35.0 28.1
Other Income 32.5 53.3 27.8 17.3 24.2
Total Income 31.5 36.8 32.6 27.9 26.6
Operating Income 32.4 35.7 36.5 27.2 25.4
Net Profit 26.6 31.1 27.4 25.7 27.9
Deposits 22.5 27.9 31.4 30.1 27.6
Advances 30.4 35.7 41.6 33.2 28.0
G) Other performance parameters FY16 FY17 FY18E FY19E FY20E
No. of branches (No.) 860 1000 1150 1350 1550
No. of employees (No.) 15000 20125 20000 22950 26350
Business per branch (₹) 2441 2751 3260 3649 4057
Profit per branch (₹) 29.5 33.3 36.9 39.5 44.0
Business per employee (₹) 140 137 187 215 239
Profit per employee (₹) 1.7 1.7 2.1 2.3 2.6
Source: Company, LKP Research

Yes Bank
LKP Securites Ltd, 13th Floor, Raheja Center, Free Press Road, Nariman Point, Mumbai-400 021. Tel -91-22 - 66351234 Fax- 91-22-66351249. www.lkpsec.com
DISCLAIMERS AND DISCLOSURES
LKP Sec. ltd. (CIN-U67120MH1994PLC080039, www. Lkpsec.com) and its affiliates are a full-fledged, brokerage and financing group. LKP was established in
1992 and is one of India's leading brokerage and distribution house. LKP is a corporate trading member of Bombay Stock Exchange Limited (BSE), National
Stock Exchange of India Limited(NSE), MCX Stock Exchange Limited (MCX-SX).LKP along with its subsidiaries offers the most comprehensive avenues for
investments and is engaged in the businesses including stock broking (Institutional and retail), merchant banking, commodity broking, depository participant,
insurance broking and services rendered in connection with distribution of primary market issues and financial products like mutual funds etc.
LKP hereby declares that it has not defaulted with any stock exchange nor its activities were suspended by any stock exchange with whom it is registered in
last five years. However, SEBI and Stock Exchanges have conducted the routine inspection and based on their observations have issued advice letters or levied
minor penalty on LKP for certain operational deviations in ordinary/routine course of business. LKP has not been debarred from doing business by any Stock
Exchange / SEBI or any other authorities; nor has its certificate of registration been cancelled by SEBI at any point of time.
LKP offers research services to clients. The analyst for this report certifies that all of the views expressed in this report accurately reflect his or her personal
views about the subject company or companies and its or their securities, and no part of his or her compensation was, is or will be, directly or indirectly related
to specific recommendations or views expressed in this report.
Other disclosures by LKP and its Research Analyst under SEBI (Research Analyst) Regulations, 2014 with reference to the subject company(s) covered in this
report-:
Research Analyst or his/her relative’s financial interest in the subject company. (NO)
LKP or its associates may have financial interest in the subject company.
LKP or its associates and Research Analyst or his/her relative’s does not have any material conflict of interest in the subject company. The research Analyst or
research entity (LKP) has not been engaged in market making activity for the subject company.
LKP or its associates may have actual/beneficial ownership of 1% or more securities of the subject company at the end of the month immediately preceding
the date of publication of Research Report.
Research Analyst or his/her relatives have actual/beneficial ownership of 1% or more securities of the subject company at the end of the month immediately
preceding the date of publication of Research Report: (NO)
LKP or its associates may have received any compensation including for investment banking or merchant banking or brokerage services from the subject
company in the past 12 months.
LKP or its associates may have received compensation for products or services other than investment banking or merchant banking or brokerage services from
the subject company in the past 12 months.
LKP or its associates may have received any compensation or other benefits from the Subject Company or third party in connection with the research report.
Subject Company may have been client of LKP or its associates during twelve months preceding the date of distribution of the research report and LKP may
have co-managed public offering of securities for the subject company in the past twelve months.
Research Analyst has served as officer, director or employee of the subject company: (NO)
LKP and/or its affiliates may seek investment banking or other business from the company or companies that are the subject of this material. Our salespeople,
traders, and other professionals may provide oral or written market commentary or trading strategies to our clients that reflect opinions that are contrary to
the opinions expressed herein, and our proprietary trading and investing businesses may make investment decisions that may be inconsistent with the
recommendations expressed herein.
In reviewing these materials, you should be aware that any or all of the foregoing, among other things, may give rise to real or potential conflicts of interest
including but not limited to those stated herein. Additionally, other important information regarding our relationships with the company or companies that
are the subject of this material is provided herein. This report is not directed to, or intended for distribution to or use by, any person or entity who is a citizen or
resident of or located in any locality, state, country or other jurisdiction where such distribution, publication, availability or use would be contrary to law or
regulation or which would subject LKP or its group companies to any registration or licensing requirement within such jurisdiction. Specifically, this document
does not constitute an offer to or solicitation to any U.S. person for the purchase or sale of any financial instrument or as an official confirmation of any
transaction to any U.S. person.
Unless otherwise stated, this message should not be construed as official confirmation of any transaction. No part of this document may be distributed in
Canada or used by private customers in United Kingdom.
All trademarks, service marks and logos used in this report are trademarks or registered trademarks of LKP or its Group Companies. The information contained
herein is not intended for publication or distribution or circulation in any manner whatsoever and any unauthorized reading, dissemination, distribution or
copying of this communication is prohibited unless otherwise expressly authorized. Please ensure that you have read “Risk Disclosure Document for Capital
Market and Derivatives Segments” as prescribed by Securities and Exchange Board of India before investing in Indian Securities Market. In so far as this report
includes current or historic information, it is believed to be reliable, although its accuracy and completeness cannot be guaranteed.
All material presented in this report, unless specifically indicated otherwise, is under copyright to LKP. None of the material, nor its content, nor any copy of it,
may be altered in any way, transmitted to, copied or distributed to any other party, without the prior express written permission of LKP.%
Related Documents