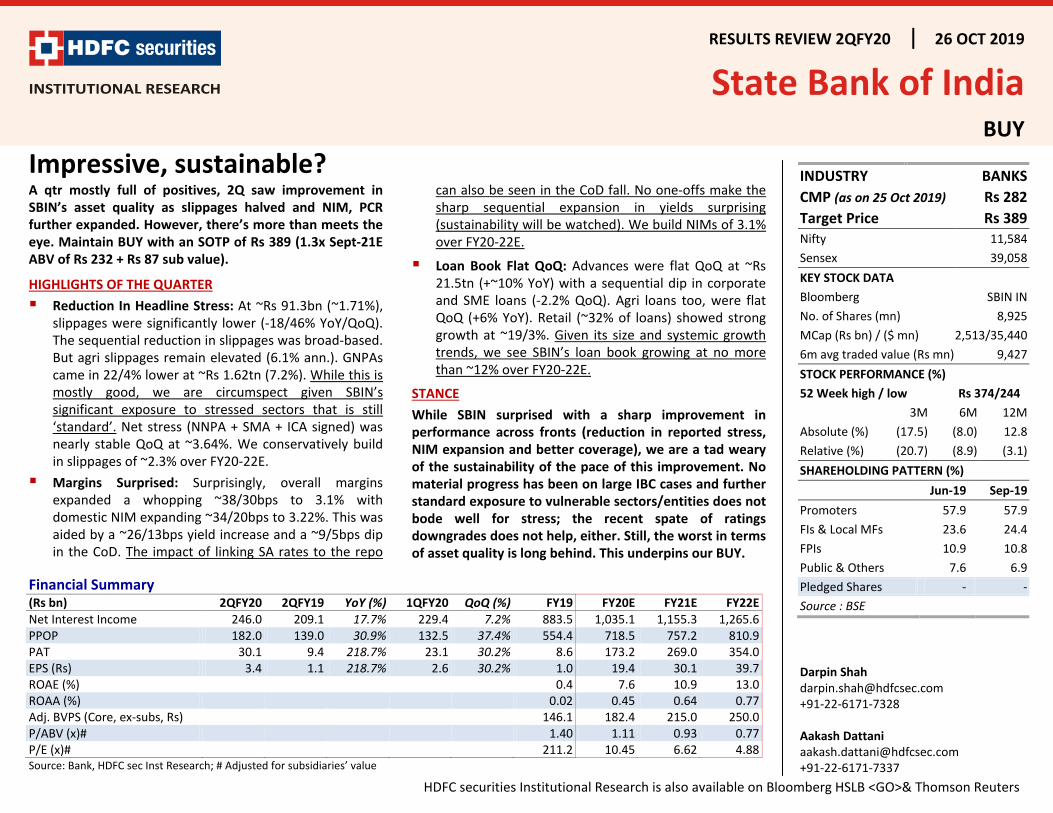
RESULTS REVIEW 2QFY20 26 OCT 2019 State Bank of India BUY Impressive, sustainable? A qtr mostly full of positives, 2Q saw improvement in SBIN’s asset quality as slippages halved and NIM, PCR further expanded. However, there’s more than meets the eye. Maintain BUY with an SOTP of Rs 389 (1.3x Sept-21E ABV of Rs 232 + Rs 87 sub value). HIGHLIGHTS OF THE QUARTER Reduction In Headline Stress: At ~Rs 91.3bn (~1.71%), slippages were significantly lower (-18/46% YoY/QoQ). The sequential reduction in slippages was broad-based. But agri slippages remain elevated (6.1% ann.). GNPAs came in 22/4% lower at ~Rs 1.62tn (7.2%). While this is mostly good, we are circumspect given SBIN’s significant exposure to stressed sectors that is still ‘standard’. Net stress (NNPA + SMA + ICA signed) was nearly stable QoQ at ~3.64%. We conservatively build in slippages of ~2.3% over FY20-22E. Margins Surprised: Surprisingly, overall margins expanded a whopping ~38/30bps to 3.1% with domestic NIM expanding ~34/20bps to 3.22%. This was aided by a ~26/13bps yield increase and a ~9/5bps dip in the CoD. The impact of linking SA rates to the repo can also be seen in the CoD fall. No one-offs make the sharp sequential expansion in yields surprising (sustainability will be watched). We build NIMs of 3.1% over FY20-22E. Loan Book Flat QoQ: Advances were flat QoQ at ~Rs 21.5tn (+~10% YoY) with a sequential dip in corporate and SME loans (-2.2% QoQ). Agri loans too, were flat QoQ (+6% YoY). Retail (~32% of loans) showed strong growth at ~19/3%. Given its size and systemic growth trends, we see SBIN’s loan book growing at no more than ~12% over FY20-22E. STANCE While SBIN surprised with a sharp improvement in performance across fronts (reduction in reported stress, NIM expansion and better coverage), we are a tad weary of the sustainability of the pace of this improvement. No material progress has been on large IBC cases and further standard exposure to vulnerable sectors/entities does not bode well for stress; the recent spate of ratings downgrades does not help, either. Still, the worst in terms of asset quality is long behind. This underpins our BUY. Financial Summary (Rs bn) 2QFY20 2QFY19 YoY (%) 1QFY20 QoQ (%) FY19 FY20E FY21E FY22E Net Interest Income 246.0 209.1 17.7% 229.4 7.2% 883.5 1,035.1 1,155.3 1,265.6 PPOP 182.0 139.0 30.9% 132.5 37.4% 554.4 718.5 757.2 810.9 PAT 30.1 9.4 218.7% 23.1 30.2% 8.6 173.2 269.0 354.0 EPS (Rs) 3.4 1.1 218.7% 2.6 30.2% 1.0 19.4 30.1 39.7 ROAE (%) 0.4 7.6 10.9 13.0 ROAA (%) 0.02 0.45 0.64 0.77 Adj. BVPS (Core, ex-subs, Rs) 146.1 182.4 215.0 250.0 P/ABV (x)# 1.40 1.11 0.93 0.77 P/E (x)# 211.2 10.45 6.62 4.88 Source: Bank, HDFC sec Inst Research; # Adjusted for subsidiaries’ value INDUSTRY BANKS CMP (as on 25 Oct 2019) Rs 282 Target Price Rs 389 Nifty 11,584 Sensex 39,058 KEY STOCK DATA Bloomberg SBIN IN No. of Shares (mn) 8,925 MCap (Rs bn) / ($ mn) 2,513/35,440 6m avg traded value (Rs mn) 9,427 STOCK PERFORMANCE (%) 52 Week high / low Rs 374/244 3M 6M 12M Absolute (%) (17.5) (8.0) 12.8 Relative (%) (20.7) (8.9) (3.1) SHAREHOLDING PATTERN (%) Jun-19 Sep-19 Promoters 57.9 57.9 FIs & Local MFs 23.6 24.4 FPIs 10.9 10.8 Public & Others 7.6 6.9 Pledged Shares - - Source : BSE Darpin Shah [email protected] +91-22-6171-7328 Aakash Dattani [email protected] +91-22-6171-7337 HDFC securities Institutional Research is also available on Bloomberg HSLB <GO>& Thomson Reuters

Welcome message from author
This document is posted to help you gain knowledge. Please leave a comment to let me know what you think about it! Share it to your friends and learn new things together.
Transcript
RESULTS REVIEW 2QFY20 26 OCT 2019
State Bank of India BUY
Impressive, sustainable? A qtr mostly full of positives, 2Q saw improvement in SBIN’s asset quality as slippages halved and NIM, PCR further expanded. However, there’s more than meets the eye. Maintain BUY with an SOTP of Rs 389 (1.3x Sept-21E ABV of Rs 232 + Rs 87 sub value).
HIGHLIGHTS OF THE QUARTER Reduction In Headline Stress: At ~Rs 91.3bn (~1.71%),
slippages were significantly lower (-18/46% YoY/QoQ). The sequential reduction in slippages was broad-based. But agri slippages remain elevated (6.1% ann.). GNPAs came in 22/4% lower at ~Rs 1.62tn (7.2%). While this is mostly good, we are circumspect given SBIN’s significant exposure to stressed sectors that is still ‘standard’. Net stress (NNPA + SMA + ICA signed) was nearly stable QoQ at ~3.64%. We conservatively build in slippages of ~2.3% over FY20-22E.
Margins Surprised: Surprisingly, overall margins expanded a whopping ~38/30bps to 3.1% with domestic NIM expanding ~34/20bps to 3.22%. This was aided by a ~26/13bps yield increase and a ~9/5bps dip in the CoD. The impact of linking SA rates to the repo
can also be seen in the CoD fall. No one-offs make the sharp sequential expansion in yields surprising (sustainability will be watched). We build NIMs of 3.1% over FY20-22E.
Loan Book Flat QoQ: Advances were flat QoQ at ~Rs 21.5tn (+~10% YoY) with a sequential dip in corporate and SME loans (-2.2% QoQ). Agri loans too, were flat QoQ (+6% YoY). Retail (~32% of loans) showed strong growth at ~19/3%. Given its size and systemic growth trends, we see SBIN’s loan book growing at no more than ~12% over FY20-22E.
STANCE While SBIN surprised with a sharp improvement in performance across fronts (reduction in reported stress, NIM expansion and better coverage), we are a tad weary of the sustainability of the pace of this improvement. No material progress has been on large IBC cases and further standard exposure to vulnerable sectors/entities does not bode well for stress; the recent spate of ratings downgrades does not help, either. Still, the worst in terms of asset quality is long behind. This underpins our BUY.
Financial Summary (Rs bn) 2QFY20 2QFY19 YoY (%) 1QFY20 QoQ (%) FY19 FY20E FY21E FY22E Net Interest Income 246.0 209.1 17.7% 229.4 7.2% 883.5 1,035.1 1,155.3 1,265.6 PPOP 182.0 139.0 30.9% 132.5 37.4% 554.4 718.5 757.2 810.9 PAT 30.1 9.4 218.7% 23.1 30.2% 8.6 173.2 269.0 354.0 EPS (Rs) 3.4 1.1 218.7% 2.6 30.2% 1.0 19.4 30.1 39.7 ROAE (%) 0.4 7.6 10.9 13.0 ROAA (%) 0.02 0.45 0.64 0.77 Adj. BVPS (Core, ex-subs, Rs) 146.1 182.4 215.0 250.0 P/ABV (x)# 1.40 1.11 0.93 0.77 P/E (x)# 211.2 10.45 6.62 4.88 Source: Bank, HDFC sec Inst Research; # Adjusted for subsidiaries’ value
INDUSTRY BANKS CMP (as on 25 Oct 2019) Rs 282 Target Price Rs 389 Nifty 11,584 Sensex 39,058 KEY STOCK DATA Bloomberg SBIN IN No. of Shares (mn) 8,925 MCap (Rs bn) / ($ mn) 2,513/35,440 6m avg traded value (Rs mn) 9,427 STOCK PERFORMANCE (%) 52 Week high / low Rs 374/244 3M 6M 12M Absolute (%) (17.5) (8.0) 12.8 Relative (%) (20.7) (8.9) (3.1) SHAREHOLDING PATTERN (%) Jun-19 Sep-19 Promoters 57.9 57.9 FIs & Local MFs 23.6 24.4 FPIs 10.9 10.8 Public & Others 7.6 6.9 Pledged Shares - - Source : BSE
Darpin Shah [email protected] +91-22-6171-7328 Aakash Dattani [email protected] +91-22-6171-7337
HDFC securities Institutional Research is also available on Bloomberg HSLB <GO>& Thomson Reuters
STATE BANK OF INDIA : RESULTS REVIEW 2QFY20
Deposit Growth Accelerates: On a sequential basis,
deposit growth accelerated ~200bps to 3% (+8% YoY), led by faster CA growth (+12/8%). SA grew ~7/3%. Sustained SA traction will be watched for, as SBIN has linked its SA rates to the Repo. The current SA rate is 3.25% and is likely to fall (push for NIMs) to 3% (floor set by SBIN) as the policy rate may fall. Deposit growth has been uninspiring for the past few qtrs. We believe SBIN can grow faster, despite a large base, given its reach and potential for faster TD growth (+9/3% now). While the CD ratio ~71% is comfortable, some aggression on the deposit front wouldn’t hurt.
Why Didn’t SBIN Opt For a Lower Tax Rate? To our surprise, SBIN did not opt for the lower tax rate under Section 115BAA (recent tax cut announcement). We find this quite surprising, the option to avail the new (lower) rate is an obvious choice. We don’t think SBIN benefited materially anyway from the provisions that this option disqualifies the assessee from availing. Commentary suggests that the management is still deliberating the choice. Further, as at Mar-19, SBIN had a net DTA of ~Rs 104bn, which has fallen to ~Rs 70bn, along with some MAT credit. If SBIN opts for the new tax rate, these assets will be marked-down. Even this is not reason enough to defer the selection. There seems to be more than meets the eye here.
NPA Provisions Dip: While overall provisions were ~9/43% higher at ~Rs 131bn, NPA provisions were ~5% lower at ~Rs 110bn (2.06% ann.) Other provisions were significantly higher at ~Rs 27bn as SBIN used the opportunity presented by one-off gains on stake sale in SBI Life, to provide against certain exposures. Coverage thus increased ~900/190bps to ~63% calc. (with ~89% coverage on IBC cases). However, SBIN’s coverage on its exposure to DHFL
(~Rs 140bn, standard for now) is ~20%. If the rumoured findings of the recent forensic audit hold true, SBIN will have to much more against this exposure. We conservatively build elevated LLPs over FY20-22E at 1.6%.
Opportune CRAR Bump Up: Just when we thought SBIN was running slightly low on capital, CRAR (13.6%) saw a ~100/70bps bump up which almost entirely reflected in CET1 (10.1%). This was a consequence of (1) Reduction in overall RWA/Assets (-140bps YoY), (2) Reduction in DTA o/s and (3) Regulatory reduction in risk weights for consumer credit. The CET1 does not include 1HFY20 PAT. While we do not build a fund raise, we believe it is prudent for SBIN to raise funds within the year.
SMA: SMA I dipped ~31% QoQ to ~Rs 50bn (23bps of loans) while SMA II increased ~Rs 40% QoQ to ~Rs 44bn (~21bps). These did not include a/cs with exposure in excess of Rs 20bn or where an ICA had been entered.
SBIN had entered an ICA for a/cs worth ~Rs 168bn (vs. Rs 191bn QoQ) incl. ~Rs 90bn (vs. ~Rs 26bn QoQ) worth of SMA a/cs.
Exposure to Vulnerable Sectors:
Power: Out of the total exposure of ~Rs 1.97tn, ~12.2% is non-performing and ~37% of the standard exposure is to private players. Notable changes in this part of the book are (1) ~10% QoQ increase in A rated exposure, (2) Nearly doubling in unrated exposure due to higher lending to state discoms.
NBFCs: Out of the total exposure of ~Rs 1.67 tn (-4% QoQ), (1) ~45% is to ‘large PVT sector backed NBFCs’, (2) Exposure to other Pvt NBFCs shrank ~Rs 10bn QoQ to ~Rs 356bn, possibly incl. IBHFL, DHFL etc.
Page | 2

STATE BANK OF INDIA : RESULTS REVIEW 2QFY20
SOTPParticulars Rs bn Per Share Rationale State Bank (Bank consol) 2,697 302 1.3x Sept-21E Core ABV of Rs 232 SBI Life 541 61 Sept-20 EV + 21.1x Sept-21E VNB SBI AMC 116 13 5% FY21E AUM Others 312 35 Stakes in NSE, UTI MF, SBI Caps and others Total Value 3,667 411 Less: Hold Co Discount 194 22 Net Total Value 3,473 389 CMP 2,513 282 Upside (%) 38.2 38.2 Source: HDFC sec Inst Research Change In Estimates
Rs mn FY20E FY21E
Old New Change Old New Change NII 1,013.1 1,035.1 2.2% 1,127.4 1,155.3 2.5% PPOP 684.3 718.5 5.0% 767.1 757.2 -1.3% PAT 197.3 173.2 -12.2% 307.1 269.0 -12.4% Adj. BVPS (Rs) 183.6 182.4 -0.6% 219.4 215.0 -2.0% Source: HDFC sec Inst Research
Page | 3
STATE BANK OF INDIA : RESULTS REVIEW 2QFY20
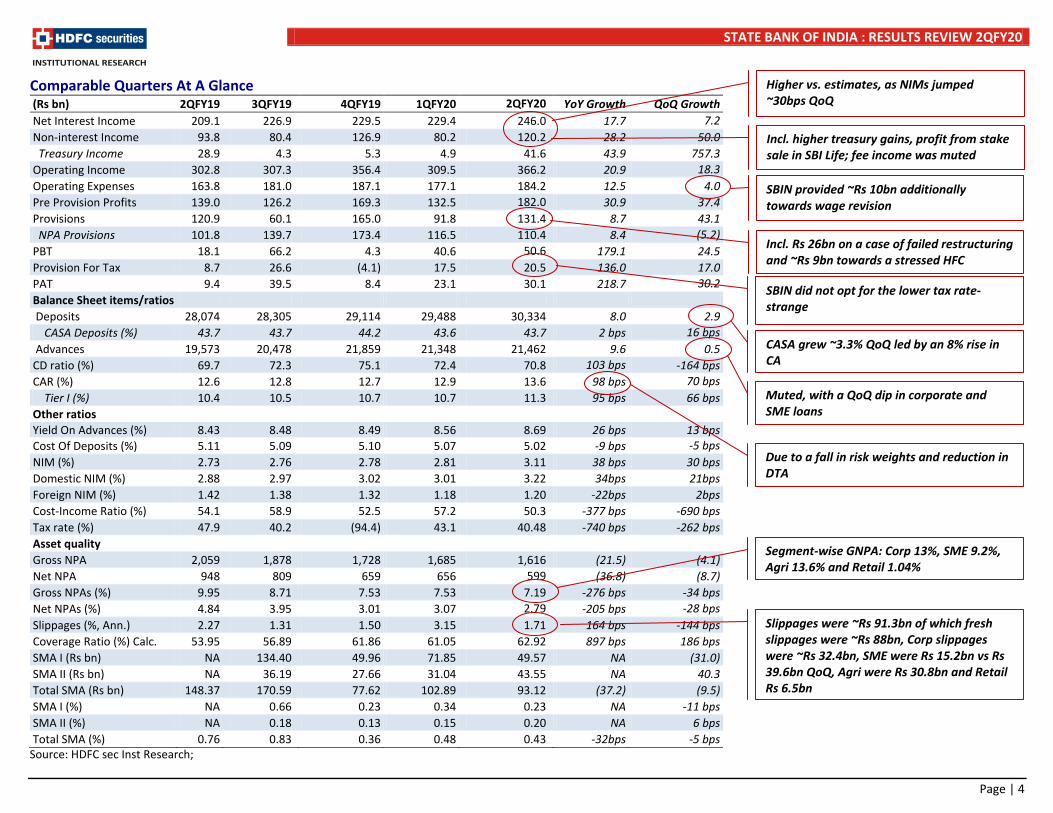
Comparable Quarters At A Glance (Rs bn) 2QFY19 3QFY19 4QFY19 1QFY20 2QFY20 YoY Growth QoQ Growth Net Interest Income 209.1 226.9 229.5 229.4 246.0 17.7 7.2 Non-interest Income 93.8 80.4 126.9 80.2 120.2 28.2 50.0 Treasury Income 28.9 4.3 5.3 4.9 41.6 43.9 757.3 Operating Income 302.8 307.3 356.4 309.5 366.2 20.9 18.3 Operating Expenses 163.8 181.0 187.1 177.1 184.2 12.5 4.0 Pre Provision Profits 139.0 126.2 169.3 132.5 182.0 30.9 37.4 Provisions 120.9 60.1 165.0 91.8 131.4 8.7 43.1 NPA Provisions 101.8 139.7 173.4 116.5 110.4 8.4 (5.2) PBT 18.1 66.2 4.3 40.6 50.6 179.1 24.5 Provision For Tax 8.7 26.6 (4.1) 17.5 20.5 136.0 17.0 PAT 9.4 39.5 8.4 23.1 30.1 218.7 30.2 Balance Sheet items/ratios Deposits 28,074 28,305 29,114 29,488 30,334 8.0 2.9 CASA Deposits (%) 43.7 43.7 44.2 43.6 43.7 2 bps 16 bps Advances 19,573 20,478 21,859 21,348 21,462 9.6 0.5 CD ratio (%) 69.7 72.3 75.1 72.4 70.8 103 bps -164 bps CAR (%) 12.6 12.8 12.7 12.9 13.6 98 bps 70 bps Tier I (%) 10.4 10.5 10.7 10.7 11.3 95 bps 66 bps Other ratios Yield On Advances (%) 8.43 8.48 8.49 8.56 8.69 26 bps 13 bps Cost Of Deposits (%) 5.11 5.09 5.10 5.07 5.02 -9 bps -5 bps NIM (%) 2.73 2.76 2.78 2.81 3.11 38 bps 30 bps Domestic NIM (%) 2.88 2.97 3.02 3.01 3.22 34bps 21bps Foreign NIM (%) 1.42 1.38 1.32 1.18 1.20 -22bps 2bps Cost-Income Ratio (%) 54.1 58.9 52.5 57.2 50.3 -377 bps -690 bps Tax rate (%) 47.9 40.2 (94.4) 43.1 40.48 -740 bps -262 bps Asset quality Gross NPA 2,059 1,878 1,728 1,685 1,616 (21.5) (4.1) Net NPA 948 809 659 656 599 (36.8) (8.7) Gross NPAs (%) 9.95 8.71 7.53 7.53 7.19 -276 bps -34 bps Net NPAs (%) 4.84 3.95 3.01 3.07 2.79 -205 bps -28 bps Slippages (%, Ann.) 2.27 1.31 1.50 3.15 1.71 164 bps -144 bps Coverage Ratio (%) Calc. 53.95 56.89 61.86 61.05 62.92 897 bps 186 bps SMA I (Rs bn) NA 134.40 49.96 71.85 49.57 NA (31.0) SMA II (Rs bn) NA 36.19 27.66 31.04 43.55 NA 40.3 Total SMA (Rs bn) 148.37 170.59 77.62 102.89 93.12 (37.2) (9.5) SMA I (%) NA 0.66 0.23 0.34 0.23 NA -11 bps SMA II (%) NA 0.18 0.13 0.15 0.20 NA 6 bps Total SMA (%) 0.76 0.83 0.36 0.48 0.43 -32bps -5 bps
Source: HDFC sec Inst Research;
Higher vs. estimates, as NIMs jumped ~30bps QoQ
Muted, with a QoQ dip in corporate and SME loans
CASA grew ~3.3% QoQ led by an 8% rise in CA
Due to a fall in risk weights and reduction in DTA
Slippages were ~Rs 91.3bn of which fresh slippages were ~Rs 88bn, Corp slippages were ~Rs 32.4bn, SME were Rs 15.2bn vs Rs 39.6bn QoQ, Agri were Rs 30.8bn and Retail Rs 6.5bn
Segment-wise GNPA: Corp 13%, SME 9.2%, Agri 13.6% and Retail 1.04%
SBIN provided ~Rs 10bn additionally towards wage revision
Incl. Rs 26bn on a case of failed restructuring and ~Rs 9bn towards a stressed HFC
Incl. higher treasury gains, profit from stake sale in SBI Life; fee income was muted
SBIN did not opt for the lower tax rate- strange
Page | 4
STATE BANK OF INDIA : RESULTS REVIEW 2QFY20
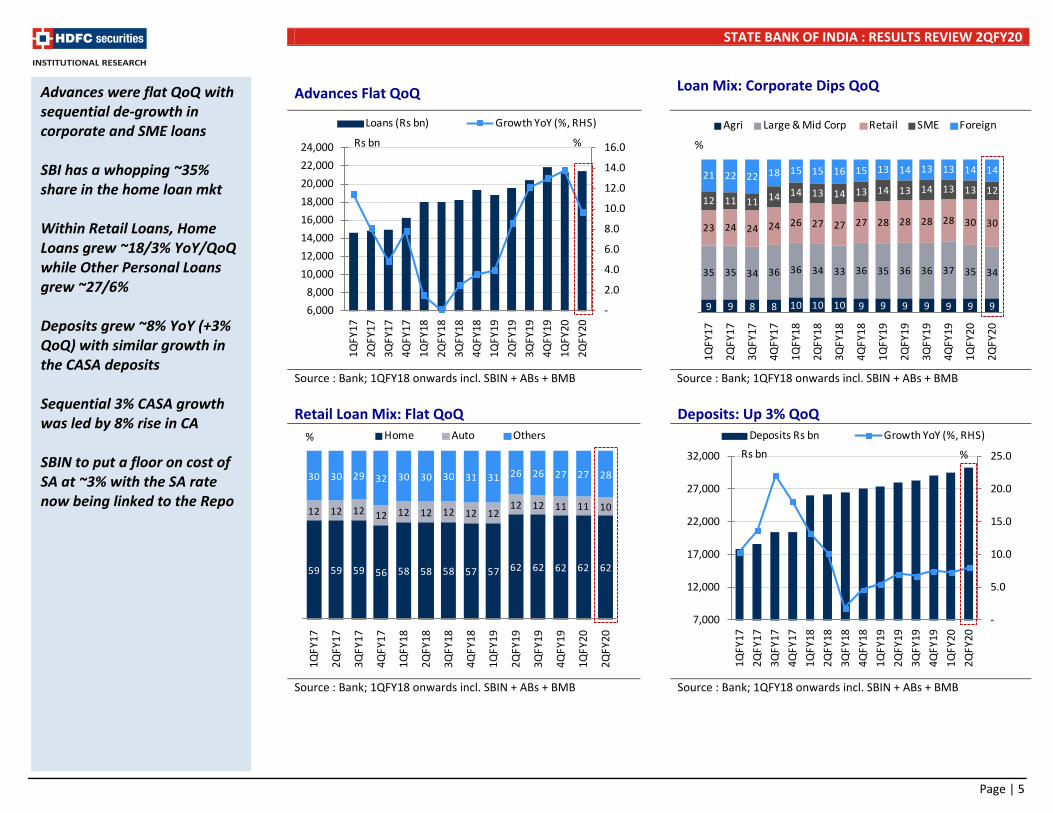
Advances Flat QoQ Loan Mix: Corporate Dips QoQ
Source : Bank; 1QFY18 onwards incl. SBIN + ABs + BMB Source : Bank; 1QFY18 onwards incl. SBIN + ABs + BMB Retail Loan Mix: Flat QoQ Deposits: Up 3% QoQ
Source : Bank; 1QFY18 onwards incl. SBIN + ABs + BMB Source : Bank; 1QFY18 onwards incl. SBIN + ABs + BMB
Advances were flat QoQ with sequential de-growth in corporate and SME loans SBI has a whopping ~35% share in the home loan mkt Within Retail Loans, Home Loans grew ~18/3% YoY/QoQ while Other Personal Loans grew ~27/6% Deposits grew ~8% YoY (+3% QoQ) with similar growth in the CASA deposits Sequential 3% CASA growth was led by 8% rise in CA SBIN to put a floor on cost of SA at ~3% with the SA rate now being linked to the Repo
-
2.0
4.0
6.0
8.0
10.0
12.0
14.0
16.0
6,0008,000
10,00012,00014,00016,00018,00020,00022,00024,000
1QFY
17
2QFY
17
3QFY
17
4QFY
17
1QFY
18
2QFY
18
3QFY
18
4QFY
18
1QFY
19
2QFY
19
3QFY
19
4QFY
19
1QFY
20
2QFY
20
Loans (Rs bn) Growth YoY (%, RHS)
Rs bn %
9 9 8 8 10 10 10 9 9 9 9 9 9 9
35 35 34 36 36 34 33 36 35 36 36 37 35 34
23 24 24 24 26 27 27 27 28 28 28 28 30 30
12 11 11 14 14 13 14 13 14 13 14 13 13 12 21 22 22 18 15 15 16 15 13 14 13 13 14 14
1QFY
17
2QFY
17
3QFY
17
4QFY
17
1QFY
18
2QFY
18
3QFY
18
4QFY
18
1QFY
19
2QFY
19
3QFY
19
4QFY
19
1QFY
20
2QFY
20
Agri Large & Mid Corp Retail SME Foreign
%
59 59 59 56 58 58 58 57 57 62 62 62 62 62
12 12 12 12 12 12 12 12 12 12 12 11 11 10
30 30 29 32 30 30 30 31 31 26 26 27 27 28
1QFY
17
2QFY
17
3QFY
17
4QFY
17
1QFY
18
2QFY
18
3QFY
18
4QFY
18
1QFY
19
2QFY
19
3QFY
19
4QFY
19
1QFY
20
2QFY
20
Home Auto Others%
-
5.0
10.0
15.0
20.0
25.0
7,000
12,000
17,000
22,000
27,000
32,000
1QFY
17
2QFY
17
3QFY
17
4QFY
17
1QFY
18
2QFY
18
3QFY
18
4QFY
18
1QFY
19
2QFY
19
3QFY
19
4QFY
19
1QFY
20
2QFY
20
Deposits Rs bn Growth YoY (%, RHS)Rs bn %
Page | 5

STATE BANK OF INDIA : RESULTS REVIEW 2QFY20
CASA Ratio: Sequentially Stable QoQ At 43.7% Overall And Domestic CD Ratios Dip QoQ
Source : Bank; 1QFY18 onwards incl. SBIN + ABs + BMB Source : Bank; 1QFY18 onwards incl. SBIN + ABs + BMB
NII Up ~18/7% YoY/QoQ NIMs Improve QoQ
Source : Bank; 1QFY18 onwards incl. SBIN + ABs + BMB Source : Bank; 1QFY18 onwards incl. SBIN + ABs + BMB
Domestic CD Ratio stood at ~65.6% (-200bps QoQ) Overall CD Ratio dipped ~165bps QoQ to 70.8% NIMs jumped 30bps QoQ to ~3.11% with domestic NIMs at 3.22% (+21bps QoQ) and foreign NIMs at ~1.2% (flat QoQ) We expect NIMs of 3.1% over FY20-21E NIM improvement was led by a 5bps drop in CoD and a 13bps rise in Yields NIM improvement is a positive surprise
6 8 7 7 6 6 7 7 6 6 6 7 6 6
35 43 38 36 36 37 37 37 37 37 38 37 37 37
55 45 51 52 54 53 53 52 53 53 53 52 53 53
5 5 4 4 4 4 4 4 3 3 3 3 3 3
1QFY
17
2QFY
17
3QFY
17
4QFY
17
1QFY
18
2QFY
18
3QFY
18
4QFY
18
1QFY
19
2QFY
19
3QFY
19
4QFY
19
1QFY
20
2QFY
20
CA SA TD Foregin%
50.0
55.0
60.0
65.0
70.0
75.0
80.0
85.0
1QFY
17
2QFY
17
3QFY
17
4QFY
17
1QFY
18
2QFY
18
3QFY
18
4QFY
18
1QFY
19
2QFY
19
3QFY
19
4QFY
19
1QFY
20
2QFY
20
Overall CD ratio % Domestic CD ratio %
(10.0)
(5.0)
-
5.0
10.0
15.0
20.0
25.0
30.0
80100120140160180200220240260
1QFY
17
2QFY
17
3QFY
17
4QFY
17
1QFY
18
2QFY
18
3QFY
18
4QFY
18
1QFY
19
2QFY
19
3QFY
19
4QFY
19
1QFY
20
2QFY
20
NII (Rs bn) Growth YoY (%, RHS)Rs bn %
2.8
2.8
2.8 2.8
2.4 2.4
2.5
2.5 2.
8 2.
7 2.
8 2.
8 2.
8 3.1
6.5
7.0
7.5
8.0
8.5
9.0
9.5
10.0
1.0
2.0
3.0
4.0
5.0
6.0
7.0
1QFY
17
2QFY
17
3QFY
17
4QFY
17
1QFY
18
2QFY
18
3QFY
18
4QFY
18
1QFY
19
2QFY
19
3QFY
19
4QFY
19
1QFY
20
2QFY
20
Cost of Deposits NIM Yield on Advances (RHS)
% %
Page | 6
STATE BANK OF INDIA : RESULTS REVIEW 2QFY20
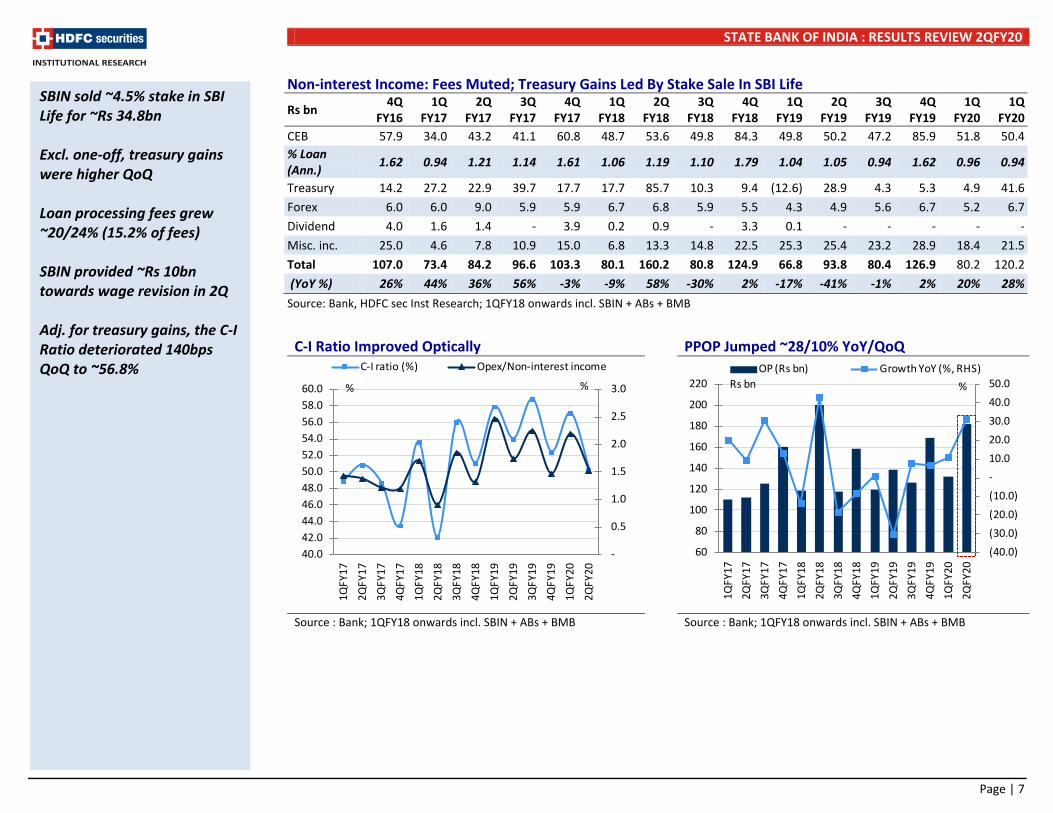
Non-interest Income: Fees Muted; Treasury Gains Led By Stake Sale In SBI Life Rs bn 4Q
FY16 1Q
FY17 2Q
FY17 3Q
FY17 4Q
FY17 1Q
FY18 2Q
FY18 3Q
FY18 4Q
FY18 1Q
FY19 2Q
FY19 3Q
FY19 4Q
FY19 1Q
FY20 1Q
FY20 CEB 57.9 34.0 43.2 41.1 60.8 48.7 53.6 49.8 84.3 49.8 50.2 47.2 85.9 51.8 50.4 % Loan (Ann.) 1.62 0.94 1.21 1.14 1.61 1.06 1.19 1.10 1.79 1.04 1.05 0.94 1.62 0.96 0.94
Treasury 14.2 27.2 22.9 39.7 17.7 17.7 85.7 10.3 9.4 (12.6) 28.9 4.3 5.3 4.9 41.6 Forex 6.0 6.0 9.0 5.9 5.9 6.7 6.8 5.9 5.5 4.3 4.9 5.6 6.7 5.2 6.7 Dividend 4.0 1.6 1.4 - 3.9 0.2 0.9 - 3.3 0.1 - - - - - Misc. inc. 25.0 4.6 7.8 10.9 15.0 6.8 13.3 14.8 22.5 25.3 25.4 23.2 28.9 18.4 21.5 Total 107.0 73.4 84.2 96.6 103.3 80.1 160.2 80.8 124.9 66.8 93.8 80.4 126.9 80.2 120.2 (YoY %) 26% 44% 36% 56% -3% -9% 58% -30% 2% -17% -41% -1% 2% 20% 28% Source: Bank, HDFC sec Inst Research; 1QFY18 onwards incl. SBIN + ABs + BMB
C-I Ratio Improved Optically PPOP Jumped ~28/10% YoY/QoQ
Source : Bank; 1QFY18 onwards incl. SBIN + ABs + BMB Source : Bank; 1QFY18 onwards incl. SBIN + ABs + BMB
SBIN sold ~4.5% stake in SBI Life for ~Rs 34.8bn Excl. one-off, treasury gains were higher QoQ Loan processing fees grew ~20/24% (15.2% of fees) SBIN provided ~Rs 10bn towards wage revision in 2Q Adj. for treasury gains, the C-I Ratio deteriorated 140bps QoQ to ~56.8%
-
0.5
1.0
1.5
2.0
2.5
3.0
40.042.044.046.048.050.052.054.056.058.060.0
1QFY
17
2QFY
17
3QFY
17
4QFY
17
1QFY
18
2QFY
18
3QFY
18
4QFY
18
1QFY
19
2QFY
19
3QFY
19
4QFY
19
1QFY
20
2QFY
20
C-I ratio (%) Opex/Non-interest income
% %
(40.0)(30.0)(20.0)(10.0)-10.0 20.0 30.0 40.0 50.0
60
80
100
120
140
160
180
200
220
1QFY
17
2QFY
17
3QFY
17
4QFY
17
1QFY
18
2QFY
18
3QFY
18
4QFY
18
1QFY
19
2QFY
19
3QFY
19
4QFY
19
1QFY
20
2QFY
20
OP (Rs bn) Growth YoY (%, RHS)Rs bn %
Page | 7

STATE BANK OF INDIA : RESULTS REVIEW 2QFY20
Provisions Break-up: Created Additional Provisions Towards Stressed NBFC Rs bn 4Q
FY16 1Q
FY17 2Q
FY17 3Q
FY17 4Q
FY17 1Q
FY18 2Q
FY18 3Q
FY18 4Q
FY18 1Q
FY19 2Q
FY19 3Q
FY19 4Q
FY19 1Q
FY20 2Q
FY20 LLP 121.4 63.4 76.7 72.4 109.9 121.3 167.2 177.6 240.8 130.4 101.8 139.7 173.4 116.5 110.4 % Ann. 3.40 1.76 2.15 2.01 2.91 2.64 3.71 3.92 5.12 2.74 2.13 2.79 3.28 2.16 2.06 MTM (0.1) 0.1 1.1 1.0 0.8 (7.6) 0.4 40.4 47.6 71.0 17.5 (79.9) (16.2) (12.3) (9.2) SA 10.0 9.2 (0.7) 13.6 2.9 (20.4) 22.8 (29.9) (8.5) (9.2) 1.0 (0.6) 8.1 (12.9) 3.0 Others 0.4 1.5 1.9 2.3 3.8 (4.0) 1.1 0.6 1.1 0.1 0.6 0.9 (0.3) 0.5 27.2 Total 131.7 74.1 79.0 89.4 117.4 89.3 191.4 188.8 281.0 192.3 120.9 60.1 165.0 91.8 131.4 YoY % 100% 85% 81% 12% -11% -32% 29% 58% 34% 115% -37% -68% -41% -52% 9% As % PPOP* 93% 67% 70% 71% 73% 75% 96% 161% 177% 161% 87% 48% 97% 69% 72%
Tax (2.5) 11.2 7.9 9.9 14.7 9.4 (7.2) (47.1) (44.9) (23.8) 8.7 26.6 (4.1) 17.5 20.5 (% PBT) -24% 31% 24% 28% 34% 32% -84% 66% 37% 33% 48% 40% -94% 43% 40% Source: Bank, HDFC sec Inst Research, * PPOP: Pre-provisioning operating profits; 1QFY18 onwards incl. SBIN + ABs + BMB
GNPAs Dip 4%; NNPAs Down ~9% QoQ Segment-Wise GNPA Contribution
Source : Bank; 1QFY18 onwards incl. SBIN + ABs + BMB Source : Bank; 1QFY18 onwards incl. SBIN + ABs + BMB
We like that SBIN proactively utilised on-off gains from the stake sale in its life insurance business to prop-up provisions (Rs 26bn towards a failed restructuring and ~Rs 9bn towards a stressed HFC) SBIN has cumulative provisions of Rs 14bn against the stressed HFC LLPs were slightly lower QoQ Segment wise GNPAs Corp: 13.0% vs. 13.6% QoQ Retail: 1.0% vs. 1.2% Agri: 13.6% vs.13.1% SME: 9.2% vs. 9.3% Overseas: 0.6% vs. 0.6% Exposure to precarious sectors: Infra: Rs 3.23tn, of which Telecom: Rs 357bn Power: Rs 1.98tn NBFCs: Rs 1.67tn Iron & Steel: Rs 640bn
1.0
3.0
5.0
7.0
9.0
11.0
75
575
1,075
1,575
2,075
2,575
1QFY
17
2QFY
17
3QFY
17
4QFY
17
1QFY
18
2QFY
18
3QFY
18
4QFY
18
1QFY
19
2QFY
19
3QFY
19
4QFY
19
1QFY
20
2QFY
20
Gross NPA Net NPA Gross NPA (%) RHS Net NPA (%) RHSRs bn %
63 64 66 71 66 67 71 73 73 71 70 67 63 62
17 17 16 14 16 15 12 12 12 13 14 14 16 16
9 8 7 7 10 10 10 9 10 11 12 14 16 17 3 3 2 2 4 4 3 3 3 3 4 4 5 4 8 8 9 6 4 4 4 3 2 2 1 1 1 1
1QFY
17
2QFY
17
3QFY
17
4QFY
17
1QFY
18
2QFY
18
3QFY
18
4QFY
18
1QFY
19
2QFY
19
3QFY
19
4QFY
19
1QFY
20
2QFY
20
Foreign Retail Agri SME Corporate%
Page | 8

STATE BANK OF INDIA : RESULTS REVIEW 2QFY20
Asset Quality Movement: Slippages Half QoQ
Rs bn 4Q FY16
1Q FY17
2Q FY17
3Q FY17
4Q FY17
1Q FY18
2Q FY18
3Q FY18
4Q FY18
1Q FY19
2Q FY19
3Q FY19
4Q FY19
1Q FY20
2Q FY20
Opening 728 982 1,015 1,058 1,082 1,779 1,881 1,861 1,991 2,234 2,128 2,059 1,878 1,727 1,685 Slippages 303 108 119 104 104 301 106 268 328 143 109 65 80 170 91 % Ann. 8.49 3.00 3.33 2.88 2.75 6.55 2.36 5.90 6.98 3.01 2.27 1.31 1.50 3.15 1.71 Upgrades/Recoveries 17 28 15 21 22 80 33 44 1 149 43 66 57 58 39 Write-Offs 32 46 61 59 39 132 93 93 85 101 135 180 173 155 121 Closing 982 1,015 1,058 1,082 1,124 1,881 1,861 1,991 2,234 2,128 2,059 1,878 1,727 1,685 1,616 QoQ % 35% 3% 4% 2% 4% 6% -1% 7% 12% -5% -3% -9% -8% -2% -4% Source: Bank, HDFC sec Inst Research; 1QFY18 onwards incl. SBIN + ABs + BMB
Peer Set Comparison
BANK Mcap (Rs bn)
CMP (Rs) Rating TP
(Rs) ABV (Rs) P/E (x) P/ABV (x) ROAE (%) ROAA (%)
FY20E FY21E FY22E FY20E FY21E FY22E FY20E FY21E FY22E FY20E FY21E FY22E FY20E FY21E FY22E KMB # 3,031 1,588 NEU 1,628 239 277 323 37.7 31.1 25.2 5.39 4.53 3.78 14.9 15.1 15.7 1.96 2.01 2.07 ICICIBC # 3,024 469 BUY 510 156 181 214 21.3 13.4 9.6 2.34 1.99 1.64 9.3 13.5 16.4 1.08 1.48 1.79 AXSB# 1,995 708 BUY 958 272 314 363 33.2 15.1 12.3 2.50 2.16 1.87 7.5 13.7 14.8 0.68 1.31 1.41 IIB 901 1,272 BUY 1,904 515 581 688 17.1 13.4 10.7 2.47 2.19 1.85 16.5 16.6 18.1 1.73 1.86 1.94 RBL 112 260 NEU 294 161 179 214 20.6 11.1 7.7 1.62 1.46 1.22 7.0 12.0 15.4 0.62 0.98 1.18 FB 159 80 BUY 119 63 74 85 9.4 7.8 6.2 1.27 1.09 0.95 12.2 13.2 14.8 1.00 1.04 1.13 CUB 154 210 BUY 261 68 80 94 18.3 16.0 14.0 3.07 2.62 2.24 16.0 15.8 15.5 1.72 1.69 1.65 DCBB 54 175 BUY 243 97 113 130 13.2 10.8 8.6 1.80 1.55 1.34 12.4 13.5 14.9 1.07 1.14 1.22 KVB 44 56 BUY 89 52 61 67 12.2 6.9 4.4 1.06 0.91 0.83 5.6 9.6 14.6 0.50 0.79 1.11 SBIN# 2,513 282 BUY 389 182 215 250 10.5 6.6 4.9 1.11 0.93 0.77 7.6 10.9 13.0 0.45 0.64 0.77 AUBANK 209 690 BUY 807 121 148 184 30.7 22.3 17.3 5.68 4.66 3.76 18.1 19.6 20.8 1.80 1.91 1.93
Source: Company, HDFC sec Inst Research, # Adjusted for subsidiaries value;
Fresh slippage Break up -Retail Rs 6.5bn vs. Rs 24.4bn -Corp Rs 32.4bn vs. Rs 53.5bn -Agri Rs 30.8bn vs. Rs 42.4bn -SME Rs 15.2bn vs. Rs 39.6bn SMA I (Rs 50bn, 23bps) and II (Rs 44bn, 20bps) stand at Rs 93bn i.e. 43bps
Page | 9

STATE BANK OF INDIA : RESULTS REVIEW 2QFY20
Standalone Income Statement (Rs bn) FY18 FY19 FY20E FY21E FY22E
Interest Earned 2,205.0 2,428.7 2,697.4 2,967.7 3,252.5
Interest Expended 1,456.5 1,545.2 1,662.3 1,812.4 1,986.8
Net Interest Income 748.5 883.5 1,035.1 1,155.3 1,265.6
Other Income 446.0 367.7 458.1 454.7 488.7
Fee Income (CEB) 230.0 233.0 278.4 305.2 332.4
Treasury Income 123.0 10.2 62.3 25.5 25.5
Total Income 1,194.5 1,251.2 1,493.1 1,610.0 1,754.3
Total Operating Exp 599.4 696.9 774.7 852.7 943.4
Employee Expense 331.8 410.5 458.3 507.0 566.0
PPOP 595.1 554.4 718.5 757.2 810.9
Provisions & Contingencies 750.4 538.3 471.1 397.8 337.8
Prov. for NPAs (incl. std prov.) 677.7 545.4 486.6 385.3 325.3
PBT (155.28) 16.1 247.4 359.5 473.1
Provision for Tax (89.81) 7.5 74.2 90.5 119.1
PAT (65.47) 8.6 173.2 269.0 354.0 Source: Bank, HDFC sec Inst Research; FY18, FY19E, FY20E and FY21E metrics include the erstwhile Associate Banks and BMB, now merged into SBIN.
Standalone Balance Sheet (Rs bn) FY18 FY19 FY20E FY21E FY22E
SOURCES OF FUNDS Share Capital 8.9 8.9 8.9 8.9 8.9
Reserves 2,182.4 2,200.2 2,343.5 2,566.1 2,859.1
Shareholders' Funds 2,191.3 2,209.1 2,352.4 2,575.0 2,868.0
Savings 10,137.7 10,917.5 11,845.5 12,733.9 13,816.3
Current 1,901.7 2,058.8 2,161.7 2,269.8 2,383.3
Term Deposit 15,023.9 16,137.6 17,751.3 19,748.4 22,118.2
Total Deposits 27,063.4 29,113.9 31,758.5 34,752.1 38,317.7
Borrowings 3,621.4 4,030.2 4,433.2 4,876.5 5,412.9
Other Liabilities & Provs 1,671.4 1,456.0 1,565.2 1,643.4 1,725.6
Total Liabilities 34,547.5 36,809.1 40,109.3 43,847.0 48,324.3
APPLICATION OF FUNDS Cash & Bank Balance 1,919.0 2,224.9 1,932.9 1,886.8 2,511.3
Investments 10,609.9 9,670.2 10,298.8 10,937.3 11,577.1
G-Secs 8,484.0 7,618.8 8,034.9 8,410.0 9,043.0
Advances 19,348.8 21,858.8 24,536.5 27,419.5 30,380.8
Fixed Assets 399.9 392.0 411.6 432.2 453.8
Other Assets 2,269.9 2,663.3 2,929.6 3,171.3 3,401.2
Total Assets 34,547.5 36,809.1 40,109.3 43,847.0 48,324.3 Source: Bank, HDFC sec Inst Research
Page | 10
STATE BANK OF INDIA : RESULTS REVIEW 2QFY20
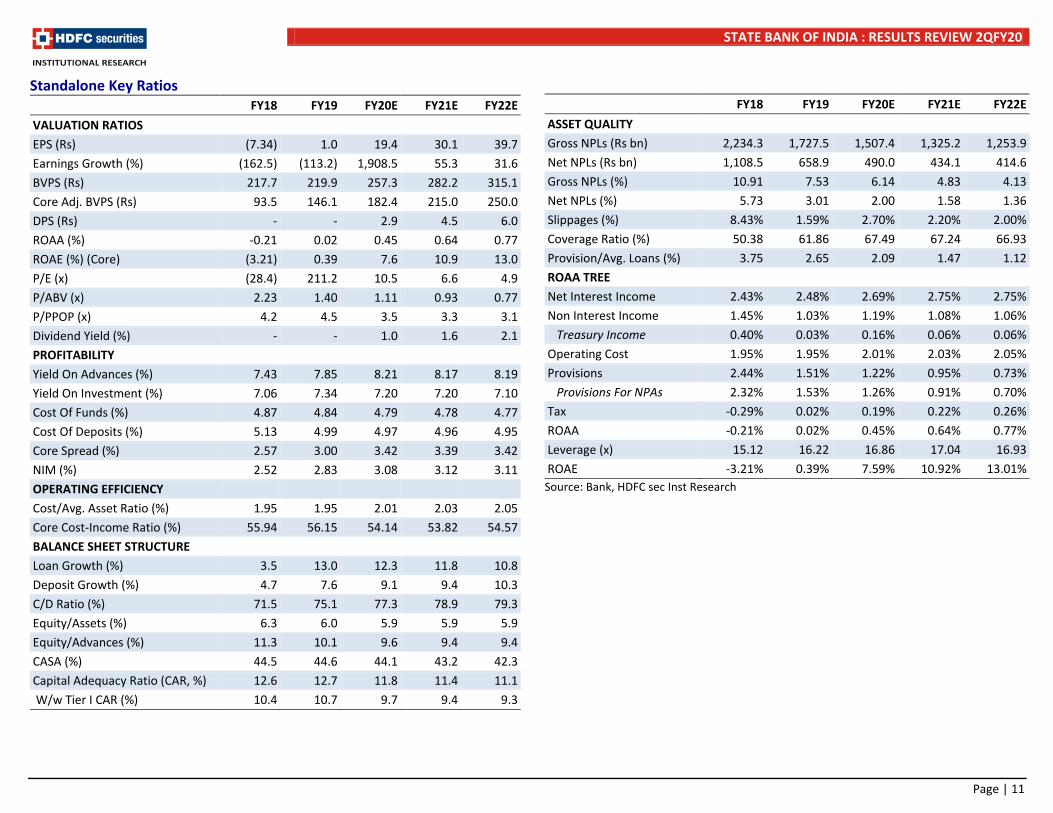
Standalone Key Ratios
FY18 FY19 FY20E FY21E FY22E VALUATION RATIOS EPS (Rs) (7.34) 1.0 19.4 30.1 39.7 Earnings Growth (%) (162.5) (113.2) 1,908.5 55.3 31.6 BVPS (Rs) 217.7 219.9 257.3 282.2 315.1 Core Adj. BVPS (Rs) 93.5 146.1 182.4 215.0 250.0 DPS (Rs) - - 2.9 4.5 6.0 ROAA (%) -0.21 0.02 0.45 0.64 0.77 ROAE (%) (Core) (3.21) 0.39 7.6 10.9 13.0 P/E (x) (28.4) 211.2 10.5 6.6 4.9 P/ABV (x) 2.23 1.40 1.11 0.93 0.77 P/PPOP (x) 4.2 4.5 3.5 3.3 3.1 Dividend Yield (%) - - 1.0 1.6 2.1 PROFITABILITY Yield On Advances (%) 7.43 7.85 8.21 8.17 8.19 Yield On Investment (%) 7.06 7.34 7.20 7.20 7.10 Cost Of Funds (%) 4.87 4.84 4.79 4.78 4.77 Cost Of Deposits (%) 5.13 4.99 4.97 4.96 4.95 Core Spread (%) 2.57 3.00 3.42 3.39 3.42 NIM (%) 2.52 2.83 3.08 3.12 3.11 OPERATING EFFICIENCY Cost/Avg. Asset Ratio (%) 1.95 1.95 2.01 2.03 2.05 Core Cost-Income Ratio (%) 55.94 56.15 54.14 53.82 54.57 BALANCE SHEET STRUCTURE Loan Growth (%) 3.5 13.0 12.3 11.8 10.8 Deposit Growth (%) 4.7 7.6 9.1 9.4 10.3 C/D Ratio (%) 71.5 75.1 77.3 78.9 79.3 Equity/Assets (%) 6.3 6.0 5.9 5.9 5.9 Equity/Advances (%) 11.3 10.1 9.6 9.4 9.4 CASA (%) 44.5 44.6 44.1 43.2 42.3 Capital Adequacy Ratio (CAR, %) 12.6 12.7 11.8 11.4 11.1 W/w Tier I CAR (%) 10.4 10.7 9.7 9.4 9.3
FY18 FY19 FY20E FY21E FY22E ASSET QUALITY Gross NPLs (Rs bn) 2,234.3 1,727.5 1,507.4 1,325.2 1,253.9 Net NPLs (Rs bn) 1,108.5 658.9 490.0 434.1 414.6 Gross NPLs (%) 10.91 7.53 6.14 4.83 4.13 Net NPLs (%) 5.73 3.01 2.00 1.58 1.36 Slippages (%) 8.43% 1.59% 2.70% 2.20% 2.00% Coverage Ratio (%) 50.38 61.86 67.49 67.24 66.93 Provision/Avg. Loans (%) 3.75 2.65 2.09 1.47 1.12 ROAA TREE Net Interest Income 2.43% 2.48% 2.69% 2.75% 2.75% Non Interest Income 1.45% 1.03% 1.19% 1.08% 1.06% Treasury Income 0.40% 0.03% 0.16% 0.06% 0.06% Operating Cost 1.95% 1.95% 2.01% 2.03% 2.05% Provisions 2.44% 1.51% 1.22% 0.95% 0.73% Provisions For NPAs 2.32% 1.53% 1.26% 0.91% 0.70% Tax -0.29% 0.02% 0.19% 0.22% 0.26% ROAA -0.21% 0.02% 0.45% 0.64% 0.77% Leverage (x) 15.12 16.22 16.86 17.04 16.93 ROAE -3.21% 0.39% 7.59% 10.92% 13.01%
Source: Bank, HDFC sec Inst Research
Page | 11
STATE BANK OF INDIA : RESULTS REVIEW 2QFY20
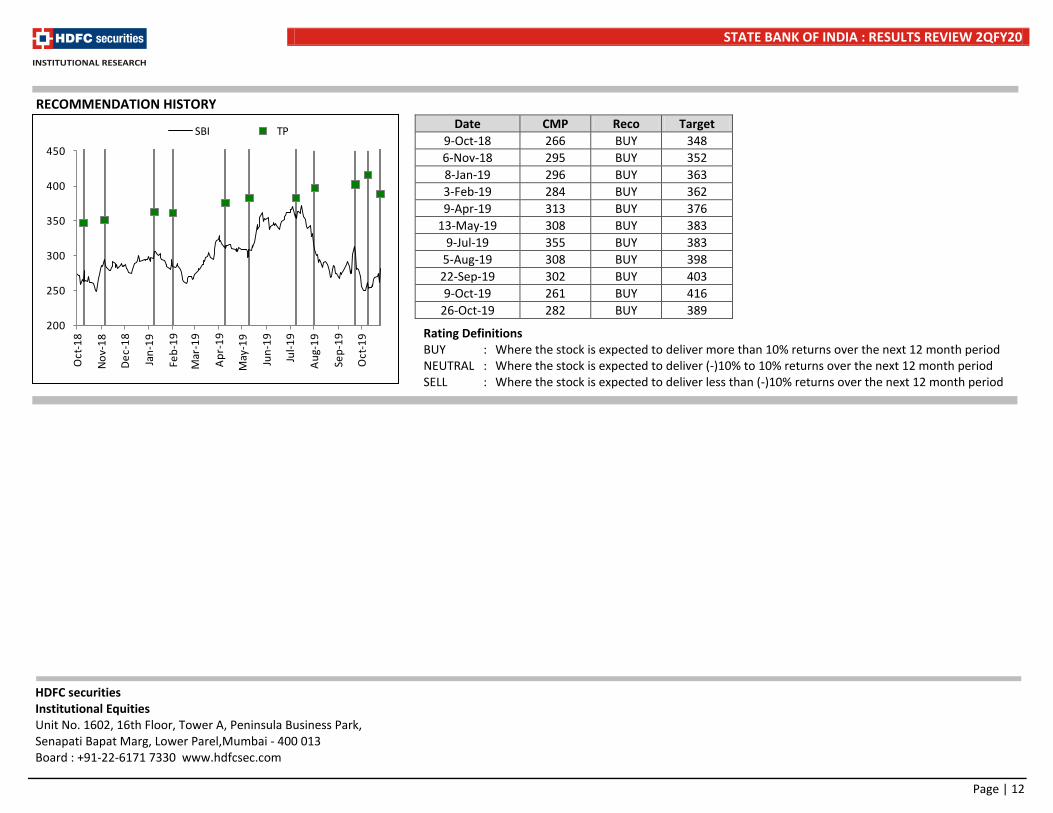
RECOMMENDATION HISTORY
Rating Definitions BUY : Where the stock is expected to deliver more than 10% returns over the next 12 month period NEUTRAL : Where the stock is expected to deliver (-)10% to 10% returns over the next 12 month period SELL : Where the stock is expected to deliver less than (-)10% returns over the next 12 month period
Date CMP Reco Target 9-Oct-18 266 BUY 348 6-Nov-18 295 BUY 352 8-Jan-19 296 BUY 363 3-Feb-19 284 BUY 362 9-Apr-19 313 BUY 376
13-May-19 308 BUY 383 9-Jul-19 355 BUY 383
5-Aug-19 308 BUY 398 22-Sep-19 302 BUY 403 9-Oct-19 261 BUY 416
26-Oct-19 282 BUY 389
200
250
300
350
400
450
Oct
-18
Nov-
18
Dec-
18
Jan-
19
Feb-
19
Mar
-19
Apr-
19
May
-19
Jun-
19
Jul-1
9
Aug-
19
Sep-
19
Oct
-19
SBI TP
HDFC securities Institutional Equities Unit No. 1602, 16th Floor, Tower A, Peninsula Business Park, Senapati Bapat Marg, Lower Parel,Mumbai - 400 013 Board : +91-22-6171 7330 www.hdfcsec.com
Page | 12

STATE BANK OF INDIA : RESULTS REVIEW 2QFY20
Disclosure: We, Darpin Shah, MBA & Aakash Dattani, ACA, authors and the names subscribed to this report, hereby certify that all of the views expressed in this research report accurately reflect our views about the subject issuer(s) or securities. HSL has no material adverse disciplinary history as on the date of publication of this report. We also certify that no part of our compensation was, is, or will be directly or indirectly related to the specific recommendation(s) or view(s) in this report. Research Analyst or his/her relative or HDFC Securities Ltd. does not have any financial interest in the subject company. Also Research Analyst or his relative or HDFC Securities Ltd. or its Associate may have beneficial ownership of 1% or more in the subject company at the end of the month immediately preceding the date of publication of the Research Report. Further Research Analyst or his relative or HDFC Securities Ltd. or its associate does not have any material conflict of interest. Any holding in stock –No HDFC Securities Limited (HSL) is a SEBI Registered Research Analyst having registration no. INH000002475. Disclaimer: This report has been prepared by HDFC Securities Ltd and is solely for information of the recipient only. The report must not be used as a singular basis of any investment decision. The views herein are of a general nature and do not consider the risk appetite or the particular circumstances of an individual investor; readers are requested to take professional advice before investing. Nothing in this document should be construed as investment advice. Each recipient of this document should make such investigations as they deem necessary to arrive at an independent evaluation of an investment in securities of the companies referred to in this document (including merits and risks) and should consult their own advisors to determine merits and risks of such investment. The information and opinions contained herein have been compiled or arrived at, based upon information obtained in good faith from sources believed to be reliable. Such information has not been independently verified and no guaranty, representation of warranty, express or implied, is made as to its accuracy, completeness or correctness. All such information and opinions are subject to change without notice. Descriptions of any company or companies or their securities mentioned herein are not intended to be complete. HSL is not obliged to update this report for such changes. HSL has the right to make changes and modifications at any time. This report is not directed to, or intended for display, downloading, printing, reproducing or for distribution to or use by, any person or entity who is a citizen or resident or located in any locality, state, country or other jurisdiction where such distribution, publication, reproduction, availability or use would be contrary to law or regulation or what would subject HSL or its affiliates to any registration or licensing requirement within such jurisdiction. If this report is inadvertently sent or has reached any person in such country, especially, United States of America, the same should be ignored and brought to the attention of the sender. This document may not be reproduced, distributed or published in whole or in part, directly or indirectly, for any purposes or in any manner. Foreign currencies denominated securities, wherever mentioned, are subject to exchange rate fluctuations, which could have an adverse effect on their value or price, or the income derived from them. In addition, investors in securities such as ADRs, the values of which are influenced by foreign currencies effectively assume currency risk. It should not be considered to be taken as an offer to sell or a solicitation to buy any security. This document is not, and should not, be construed as an offer or solicitation of an offer, to buy or sell any securities or other financial instruments. This report should not be construed as an invitation or solicitation to do business with HSL. HSL may from time to time solicit from, or perform broking, or other services for, any company mentioned in this mail and/or its attachments. HSL and its affiliated company(ies), their directors and employees may; (a) from time to time, have a long or short position in, and buy or sell the securities of the company(ies) mentioned herein or (b) be engaged in any other transaction involving such securities and earn brokerage or other compensation or act as a market maker in the financial instruments of the company(ies) discussed herein or act as an advisor or lender/borrower to such company(ies) or may have any other potential conflict of interests with respect to any recommendation and other related information and opinions. HSL, its directors, analysts or employees do not take any responsibility, financial or otherwise, of the losses or the damages sustained due to the investments made or any action taken on basis of this report, including but not restricted to, fluctuation in the prices of shares and bonds, changes in the currency rates, diminution in the NAVs, reduction in the dividend or income, etc. HSL and other group companies, its directors, associates, employees may have various positions in any of the stocks, securities and financial instruments dealt in the report, or may make sell or purchase or other deals in these securities from time to time or may deal in other securities of the companies / organizations described in this report. HSL or its associates might have managed or co-managed public offering of securities for the subject company or might have been mandated by the subject company for any other assignment in the past twelve months. HSL or its associates might have received any compensation from the companies mentioned in the report during the period preceding twelve months from t date of this report for services in respect of managing or co-managing public offerings, corporate finance, investment banking or merchant banking, brokerage services or other advisory service in a merger or specific transaction in the normal course of business. HSL or its analysts did not receive any compensation or other benefits from the companies mentioned in the report or third party in connection with preparation of the research report. Accordingly, neither HSL nor Research Analysts have any material conflict of interest at the time of publication of this report. Compensation of our Research Analysts is not based on any specific merchant banking, investment banking or brokerage service transactions. HSL may have issued other reports that are inconsistent with and reach different conclusion from the information presented in this report. Research entity has not been engaged in market making activity for the subject company. Research analyst has not served as an officer, director or employee of the subject company. We have not received any compensation/benefits from the subject company or third party in connection with the Research Report. HDFC securities Limited, I Think Techno Campus, Building - B, "Alpha", Office Floor 8, Near Kanjurmarg Station, Opp. Crompton Greaves, Kanjurmarg (East), Mumbai 400 042 Phone: (022) 3075 3400 Fax: (022) 2496 5066 Compliance Officer: Binkle R. Oza Email: [email protected] Phone: (022) 3045 3600 HDFC Securities Limited, SEBI Reg. No.: NSE, BSE, MSEI, MCX: INZ000186937; AMFI Reg. No. ARN: 13549; PFRDA Reg. No. POP: 11092018; IRDA Corporate Agent License No.: CA0062; SEBI Research Analyst Reg. No.: INH000002475; SEBI Investment Adviser Reg. No.: INA000011538; CIN - U67120MH2000PLC152193 Mutual Funds Investments are subject to market risk. Please read the offer and scheme related documents carefully before investing.
Page | 13
Related Documents