Business-to-Business E-Commerce: Value Creation, Value Capture and Valuation by Luis Garicano and Steven N. Kaplan* Abstract This paper presents a framework to analyze the potential changes in transaction costs due to the introduction of e-commerce on transactions between businesses. It then illustrates and applies this framework using internal data from an Internet-based firm to measure process improvements, marketplace benefits, and motivation costs. We find that process improvements and marketplace benefits are potentially large, while little evidence exists of increases in motivation costs. Finally, we use the framework to help discuss why valuations of Internet companies were so high at the end of 1999 and why they have declined so precipitously since then. Keywords: Electronic commerce; transaction costs; measurement of information asymmetries; Internet economics; Internet valuations. JEL: D2, L1, O3 *Graduate School of Business, University of Chicago

Welcome message from author
This document is posted to help you gain knowledge. Please leave a comment to let me know what you think about it! Share it to your friends and learn new things together.
Transcript

Business-to-Business E-Commerce: Value Creation, Value Capture and Valuation
by Luis Garicano and Steven N. Kaplan*
Abstract
This paper presents a framework to analyze the potential changes in transaction costs due to the
introduction of e-commerce on transactions between businesses. It then illustrates and applies this
framework using internal data from an Internet-based firm to measure process improvements,
marketplace benefits, and motivation costs. We find that process improvements and marketplace benefits
are potentially large, while little evidence exists of increases in motivation costs. Finally, we use the
framework to help discuss why valuations of Internet companies were so high at the end of 1999 and why
they have declined so precipitously since then.
Keywords: Electronic commerce; transaction costs; measurement of information asymmetries; Internet economics; Internet valuations. JEL: D2, L1, O3 *Graduate School of Business, University of Chicago


3
I. Introduction.
In this paper, we study the economic impact resulting from the introduction of the Internet in
transactions between firms (i.e., business-to-business (B2B) e-commerce). We present a framework that
describes the potential changes in transaction costs caused by transferring a transaction from a physical
marketplace to an Internet-based one. Following Milgrom and Roberts (1992), our framework
differentiates between coordination costs and motivation costs. We argue that it is likely that B2B e-
commerce reduces coordination costs and increases efficiency.
We illustrate and apply this framework using detailed internal data from one Internet-based firm
to measure process improvements, marketplace benefits, and motivation costs. Our results suggest that
process improvements and marketplace benefits are potentially large. We find little evidence that
informational asymmetries are more important in the electronic marketplace we study than the existing
physical ones.
Finally, we use the framework to help discuss why valuations were so high at the end of 1999 and
why they have declined so precipitously since then. We also speculate that the long-term real effects of
B2B and the Internet are likely to be quite favorable.
II. Measuring value creation in B2B e-commerce.
As mentioned above, B2B e-commerce has the potential to substantially reduce transaction costs
in inter-firm trade. Following Milgrom and Roberts (1992), we classify transaction costs in two
categories: costs associated with the problem of coordination and costs associated with the problem of
motivation. Shifting a transaction from a physical environment to the Internet has the potential to affects
both types of transaction costs.
A. Coordination costs
Coordination costs are “related to the need to determine prices and other details of the transaction,
to make the existence and location of potential buyers and sellers known to one another, and to bring the

4
buyers and sellers together to transact.” We find it useful to classify the effects of the Internet on
coordination costs into two general categories: process improvements and marketplace benefits. Below,
we describe the potential Internet-based improvements in these coordination costs. It is important to
recognize (and we then discuss) that reductions in transactions costs are likely to lead to additional direct
and indirect benefits. We use this framework in later sections to study the gains attained in some
examples.
1. Process improvements
B2B e-commerce can improve efficiencies by reducing the costs involved in an existing business
process. Such an improvement may take place in two basic forms. First, it may simply reduce the cost of
an activity already being conducted, as when a transaction that is currently conducted by phone or fax is
automated. In other instances, the Internet provides an opportunity to redesign the existing process.
The methodology we use to measure or estimate the value of process improvements is
straightforward. First, we describe and measure the costs of the activities involved in the existing process
in detail. Second, we describe and measure the costs of the process using B2B e-commerce. The
difference, if any, is the value of the process improvement.
2. Marketplace benefits
We classify the second way in which B2B e-commerce can reduce coordination costs as
marketplace benefits (or direct information improvements). These benefits come in some of the
following forms. The Internet potentially reduces a buyer’s cost of finding suppliers because it is less
expensive to search for products and compare prices over the Internet than it is to read catalogs and make
phone calls. Conversely, sellers can reach more potential customers at lower cost. As a result, buyers
will find sellers they might not have otherwise found. EBay is an example of this on the consumer side.
(eBay is C2C – consumer-to-consumer.)

5
Second, the Internet potentially provides buyers with better information about product
characteristics (including prices and availability) because it is less expensive to obtain.
Finally, the Internet also potentially provides better information about buyers and sellers.
On the other hand, conducting the transaction over the Internet may increase these transaction costs, due
to the buyers’ inability to physically inspect the merchandise object of the exchange. This may be the case
when buyers need to match their needs for objects based precisely on a characteristic that requires
physical inspection. For example, consider the second hand car example that we explore in depth later.
Suppose that dealers in a particular location sell cars to a lower income, older consumer who takes good
care of the cars, while dealers in another location cater to lower income handy-men. Holding all the
observable characteristics constant, dealers in the first location will be looking for cars in perfect
condition; while dealers in the second location will be looking for cars in bad, but repairable condition. If
the condition of the car is hard to communicate without hearing the motor and looking at the car, it will be
difficult to distinguish between these cars in an Internet auction. As a consequence, the matching of cars
with buyers may be worsened. It is important to note that this effect takes place regardless of the fact
that the composition of supply of cars is unchanged (no adverse selection).
Estimating these costs and benefits is appreciably more difficult than estimating the process
improvement benefits. One place to look – and one for which we have data – is at the buyer’s willingness
to pay for each object. Higher willingness to pay by buyers for a particular item is evidence of better
matching. Other places to look include the amount of trade and prices sellers receive. If B2B e-
commerce delivers marketplace benefits, trade should increase. Ebay is a clear example of this in that
trade occurs that would not occur otherwise. Higher prices for sellers would represent better matching. It
is likely, on the other hand, that lower customer acquisition costs would reduce prices.
3. Direct and indirect effects of coordination costs reductions
Clearly, any reduction in coordination costs results in direct economic gains through a reduction
in the cost of undertaking these transactions. It is possible, however, that other indirect benefit also will

6
arise. As the costs of undertaking spot market transactions decreases, participants in these transactions
may adjust their behavior and realize further efficiency gains. Although estimating these effects is
beyond the scope of this paper, we discuss briefly here the effects of the two main sources of these
changes: better information processing, and changes in organizational form.
Better information about future demand through B2B e-commerce may allow a seller to improve
its demand forecasts, and use that information to change its production decisions to better match demand.
Conversely, a buyer might obtain better information about existing (and future supply), and use that
information to change its inventory decisions.
Second, make or buy decisions are likely to be affected. If the Internet is able to produce
important decreases in the costs of carrying out transactions in the market, the transaction costs
economizing paradigm (Coase [1939] and Williamson [1985]) leads us to predict that fewer transactions
will be undertaken inside firms and more will be undertaken in the market.
B. Motivation costs
Milgrom and Roberts (1992) distinguish two types of motivation-related transaction costs: those
associated with informational incompleteness and asymmetries, and those associated with imperfect
commitment.
1. Informational incompleteness and asymmetries
These type of transaction costs are present “when the parties to the transaction do not have all the
relevant information needed to determine whether the terms of an agreement are acceptable and whether
they are actually being met.” To the extent that physically observing the merchandise to evaluate its
condition is valuable to the buyer, some of that information is lost through the conduct of the transaction
through an electronic format.
This loss of information about the object of the exchange may translate into an efficiency loss if
adverse selection worsens in virtual transactions. Consider, for example, the original lemons issue in
7
second hand automobile markets (Akerlof, 1970), which will later be our example. Holding observable
characteristics constant, sellers might try to sell cars with strange sounding motors exclusively thorough
the Internet. If sellers offer this type of object more frequently over the Internet, buyers willingness to
pay for the average object decreases, leading sellers of higher (unobserved) quality to withdraw from the
market.
2. Transaction costs that arise from imperfect commitment
Milgrom and Roberts (1992) define these costs as deriving from “the inability of parties to bind
themselves to follow through on threats and promises that they would like to make but which, having
made, they would like to renounce.” B2B e-commerce has the potential to increase or decrease these
costs. First, by standardizing processes and by leaving an electronic trail, the Internet has the potential to
reduce the costs of imperfect commitment. Alternatively, a buyer may avoid intermediary fees by
viewing the product over the Internet, but contacting the seller directly.
C. Value Capture
After applying the framework, it should be possible to understand the effect of a new technology
or process on transaction costs. If the technology does reduce transaction costs, it is potentially viable /
valuable. The question then becomes who will capture the reduction in transaction costs. If the
technology is unique or difficult to imitate, the innovator should be able to capture some of the
improvements and become valuable. On the other hand, if the technology can be easily imitated by
competitors, the customers will capture most of the benefits.
III. The Framework in Action: The Case of Autodaq
A. Impact on Coordination costs (1): Process improvements
In this section, we compare the time and economic costs involved in the Autodaq / Internet
process with those in the physical auction process.
8
In the physical world, when a large volume seller needs to dispose of a car, the seller stores the
car and then has it transported to a physical auction site. At the physical auction site, the car is described
and inspected. The car may also be reconditioned by the auction site operator. Reconditioning involves
repairing minor flaws in the car’s exterior – dents, scratches, etc. When a sufficient number of cars are
physically at the auction site, an auction is held. Dealers travel to the physical auction site and bid on the
car. After the auction, the car is transported again to the winning dealer. The winning dealer performs
any necessary maintenance or repairs and any additional reconditioning needed to retail the car.
In the Autodaq / Internet system, Autodaq contracts with an inspector who inspects, describes,
and photographs the car. For cars coming off lease, this occurs at the turn-in dealer. For cars coming
from rental fleets, this occurs at the fleet marshalling yard. The car is then put up for sale in an online
auction. Dealers bid on the car over the Internet from their computers. The car is transported to the
winning dealer. The winning dealer performs any necessary maintenance, repairs and reconditioning. If
the car does not sell over the Internet, the car continues through the physical auction process.1
Unlike physical auctions, which are run as ascending oral auctions, Autodaq auctions employ a
second price auction in the form of a “proxy bidding” mechanism. With a proxy bid, dealers submit the
highest price they would be willing to pay and Autodaq automatically increases their bid in the presence
of other bids by just enough to become the leading bid. The auction format also allows dealers to directly
purchase the car by accepting the ask price given by the seller.
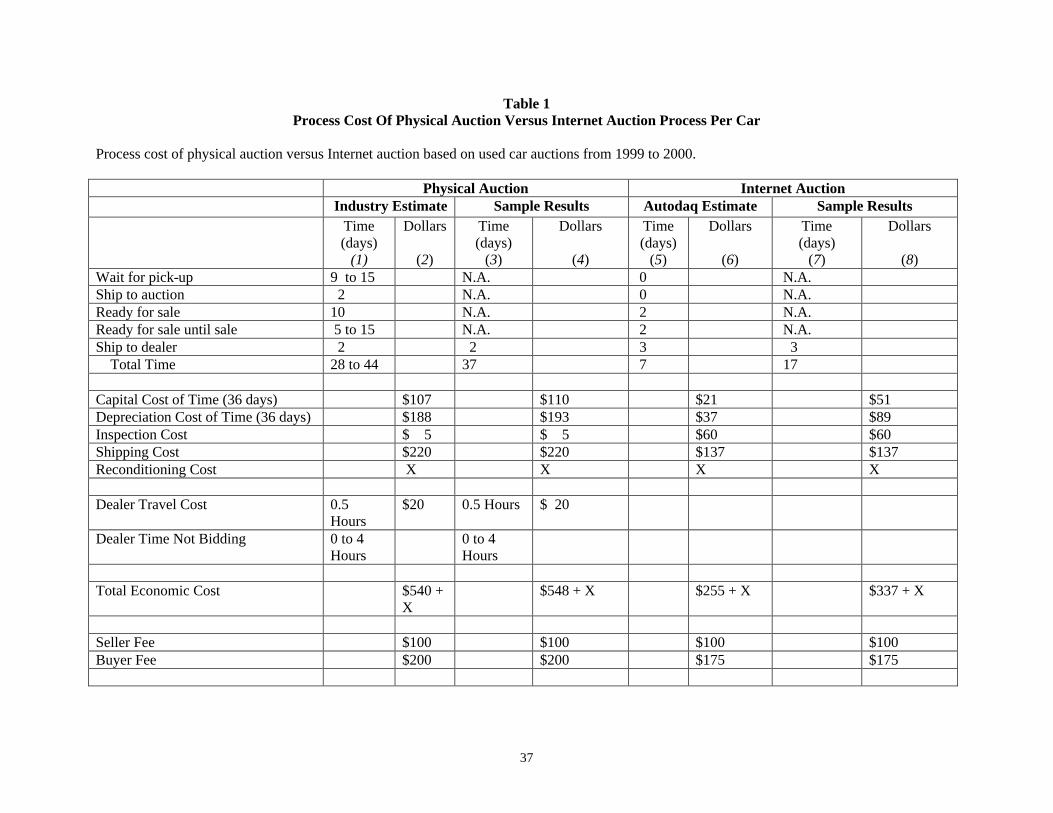
[ Table I Here]
Table I compares the physical auction process to the Autodaq Internet process, both in terms of
time and money. The comparison is made for a typical car coming off lease or from a rental fleet. The
1 This process is not unique to Autodaq. Several competitors exist. In particular, the largest operator of physical auctions, Manheim, has an Internet based subsidiary – Manheim Online. Manheim Online differs from Autodaq in that it uses the Internet to list the cars that it has for sale at its physical auction site. In its current incarnation, therefore, Manheim Online, potentially reduces buyer transaction costs, but does not change seller transaction costs.
9
table measures time from the day the car comes off lease or is retired by the rental car company to the day
the car arrives at the buying dealer. The table measures costs as the economic costs of the process. It
does not measure the benefits to a seller from moving from a physical process to the Internet process. We
report both estimated times involved in the physical auction process and in the Internet process and actual
times for both processes from a sample provided by one of the sellers that used the Autodaq process.
The estimates for the physical auction process in column (1) and (2) were provided by Autodaq
and by Tom Kontos of ADT Automotive. As mentioned earlier, ADT Automotive was the second largest
competitor in the physical auction business.2 We obtained similar estimates in interviews with other
industry participants. Column 1 reports that the physical auction process takes from 28 to 44 days.
We also estimate these costs directly from a sample of cars sold through the physical auction
process provided to us by one of the lessors that provided Autodaq cars to sell. Our analysis is in columns
(3) and (4) of Table I. The information provided by the seller allows us to calculate time to sale from (1)
lessor inspection date and (2) lease end for cars sold through the physical auction and for cars sold
through Autodaq.
Neither date is ideal. According to Autodaq, a car was typically inspected before the lessee
turned it in. Time to sale from lessor inspection date, therefore, overstates the time from turn-in to sale.
A car sold through Autodaq was inspected an average of 9 days before the car was turned in. According
to Autodaq, the overstatement is slightly worse for the cars sold through Autodaq because all such cars
were inspected before they were turned in. While most of the cars sold through the physical auction were
inspected before they were turned in, a small number were inspected at the physical auction. The
comparisons between Internet and physical auction processes, therefore, will slightly understate the
advantage of the Internet.
Time to sale from lease end also is problematic because cars are sold both well before the lease
end date and well after the lease end date. On this dimension, we do not know if there is a bias between
the cars sold through Autodaq and cars sold through the physical auction.

10
In our analysis, we use the time from inspection to sale because (1) it appears to be a more
reliable measure of the disposition process and (2) we have inspection dates for all cars, but do not have
lease-end dates for all cars. The results are qualitatively similar using both dates.
For all 9,205 cars, we calculate the time that elapsed from lessor inspection date to the date the
car was sold. The median time is 35 days. We add two days to this to estimate the delivery time from the
auction to the purchasing dealer. As we report in Table I, the median elapsed time is 37 days. This is
close to the midpoint of the range provided by ADT Automotive. 37 days also is consistent with the
estimates we obtained from other interviews. On the other hand, if these cars were inspected 9 days
before they were turned in, the median time would be more like 28 days, which is at the low end of the
range in column 1.3
Column 5 in the table reports Autodaq’s estimates of the time that is involved in the Internet
auction process. Autodaq believes that the Internet process should take 7 days compared to the 28 to 44
days in the physical auction process.
The potential time reductions come in several areas. First, it typically takes 9 to 15 days before
lessors and fleet owners ship a car to the physical auction site. Part of the reason for the delay is that the
physical auction company does not pick the car up immediately. The other reason is that the seller may
attempt to sell the car to the original dealer, but must take some time attempting to determine the
appropriate price. It is not entirely clear that all of the savings here are Internet specific. It would seem
possible for the lessors to contract with a physical auction site to reduce this time as well. It remains to be
seen whether Autodaq can reduce this time.
Second, it typically takes 15 to 25 days from the time a car arrives at a physical auction site until
it is sold. On the Internet, Autodaq estimates this time can be reduced to 4 days. One reason for the delay
in the physical auction process is that the car generally waits some time before it is reconditioned and
2 ADT has subsequently merged with Mannheim, the largest competitor in they physical auction business. 3 For 7,221 cars, we can measure the time from lease end to sale. The median time from lease end to sale in our sample is 36 days (compared to 35 days from inspection).

11
reconditioning takes some time.4 The more important reason, however, is that the physical auction sites
try to make each individual auction somewhat homogeneous in terms of the cars available. In other
words, they attempt to sell largely Fords in one auction; largely Toyotas in the next. This is done because
dealers typically look for particular types of cars. As a result, the physical auctions will wait until they
have a critical mass of a particular car type or brand before holding an auction. This is not a
consideration for Autodaq because the dealer does not have to physically go to the Autodaq auction site.
Autodaq’s estimates make two optimistic assumptions. First, the estimates assume that the cars
sell quickly on the Internet, which implies a liquid market. Second, the estimates assume that the cars are
listed for sale almost immediately after they come off lease which assumes sophisticated and timely
tracking and inspection processes. We interpret Autodaq’s estimates, therefore, as the likely process costs
of a liquid Internet market.
To obtain a more neutral estimate of the gains generated by the Internet, we calculated the actual
time that elapsed from the day a car was inspected by the lessor to the day the car was sold for a sample
of 694 cars sold over the Internet by Autodaq. The median time is 14 days. We add three days to this to
estimate the time until the car is delivered to the purchasing dealer. Column 7 reports that the median
actual elapsed time is 17 days.5
The “Dollars” columns in Table I attempt to value the economic costs of the two processes. The
most important costs are the costs of capital, depreciation, and transportation. The cost of capital is
relatively straightforward. The typical car (in our sample) sells for $13,600. Each day the car is not sold,
the seller is not able to deploy that capital elsewhere. We assume a cost of capital of 8%. This is
essentially a debt cost of capital (and, as such, may understate the true cost of capital for a seller).
4 It is important to note that in both the Autodaq system and the physical auction, buying dealers typically perform reconditioning (despite the fact that some reconditioning is performed by the physical auction). It is possible that the reconditioning time is greater in the Autodaq system, although Autodaq claims that this is not the case. 5 For the 270 cars with a lease-end date, the median time from lease end to sale is 20 days.

12
The cost of depreciation is based on the fact that sale prices for used cars depreciate with the age
of the car. We assume a depreciation rate of 14%. This reflects the fact that in the data provided by
Autodaq, the sales price declines by 14.8% per car-year (with a standard error of 1.7%).
Autodaq and the industry experts with whom we spoke estimated that it costs $110 to ship a car
from the lessor to a physical auction and then an additional $110 to ship a car from the physical auction to
the buyer. The transportation cost to ship a car from the lessor directly to a local buyer was estimated at
$137. The difference reflects the absence of economies of scale in shipping directly.
Autodaq estimates that a dealer travels one hour each way to an auction and buys four cars. This
translates to one-half hour of travel time per car purchased. Conservatively valuing a dealer’s time at $40
per hour6 this translates into $20 per car. Autodaq assumes that a dealer spends five hours at the physical
auction. We assume, conservatively, that the dealer does not waste any of these hours at the auction.
Finally, we assume that reconditioning costs are the same for the physical auction as for the
Internet auction. This also is likely to be conservative in that cars bought in a physical auction are usually
reconditioned again by the buyer after they are bought. To account for this, we have not added any extra
time to the Internet process for reconditioning.
Based on these assumptions, we estimate in column (2) that the physical auction process has an
economic cost of $540 per car (not including reconditioning) given the industry estimates of the time
costs in column (1). Using our sample results rather than the industry estimates, we obtain an almost
identical cost of $548 per car (not including reconditioning) in column (4).
Under the assumption of a liquid market and using Autodaq’s estimates, the Autodaq / Internet
process has an economic cost in column (6) of only $255 per car (without reconditioning) – a $285
reduction from the industry estimates. Using the costs implied by the actual 17 days elapsed from
inspection to delivery in our sample, the Internet process has a total economic cost in column (8) of $337
(without reconditioning) – a $211 reduction from the physical auction sample results. The difference
6 This is conservative as mechanics probably cost more than this.
13
would be at least as large if we measured the costs from turn in to delivery because the average time from
inspection to turn in is at least as large for the Internet sample as for the physical auction sample.
Both of the estimated reductions ($211 from the sample and $285 from industry estimates) are
conditional on both markets being liquid. In the Autodaq sample, this was not the case – the probability
of a sale was 24% not 100%. As a result, the (conditional) process savings overstate actual savings.
We estimate the actual savings using the following assumptions. The seller attempts to sell a car
over the Internet. If a sale occurs, it occurs in a median 5 days.7 In the 76% of cases in which a sale does
not occur, the seller decides after 5 days to sell the car through a physical auction process. The car then
takes 28 days before it is delivered to a purchasing dealer.8 For these cars, the lessor incurs 5 additional
days of interest and depreciation costs that we estimate to be $41. In our sample, therefore, relative to the
physical auction process, the Autodaq / Internet process provides a 24% likelihood of a $211 reduction in
process costs and a 76% likelihood of a $41 increase in process costs. The net effect is an average
decrease in process costs of $19 per car.
This analysis highlights that liquidity is important in an Internet market not only to deliver
attractive pricing, but also to deliver savings in process costs.
Overall, the results in Table I indicate moderate reduction in process costs for cars sold using the
Internet in our sample. The results suggest potentially substantial reductions in process costs as the
Internet market becomes more liquid. Not including reconditioning, the reductions in a liquid market of
more than $200 are on the order of 40% of the total economic cost. Multiplied over an annual market of 5
million cars, the analysis implies potential process cost reductions on the order of $1 billion per year.
B. Impact on Coordination costs (2): Marketplace Benefits
A second potential benefit of B2B is the extension of the market it provides. Both buyers and
sellers can search a larger number of counterparts, and, as a consequence, may find goods and services
7 This assumes that the car is inspected 9 days before it is turned in. 8 Again, this assumes that the car is inspected 9 days before it is turned in.

14
that they would not otherwise have found. In the case of used automobiles, this seems likely to be an
advantage. Used automobile dealers require an appropriate mix of inventory in their dealerships.
Obtaining that mix is the main reason they purchase at auctions.
In this section, we attempt to estimate the marketplace benefits in the Autodaq / Internet process.
Our goal is to assess how much more a dealer would be willing to pay in the Internet market (versus the
physical market) for a car that better matches the dealer’s desired inventory. This is not possible to
estimate directly because it is not observable. On the other hand, because marketplace benefits are
potentially large on the Internet, getting some grasp on the magnitude of this gain is important.
In what follows, we propose a simple method that exploits (1) the geographic rollout used by
Autodaq and (2) a no-arbitrage argument on the seller side. Under reasonable conditions, this method
places a lower bound on the dealer’s willingness to pay for access to the larger marketplace.
Autodaq’s rollout followed a predetermined pattern. Between the end of October of 1999 and the
end of February 2000, the buyers were almost exclusively in California. The sellers, on the other hand,
were three large leasing companies that sold cars coming off lease throughout the US. Cars sold in
California in that period, therefore, included cars from the Southern, Midwestern and Western U.S.
The type of sellers implies that the cars were, from their perspective, commodities up to their
physical characteristics.9 The willingness to pay by buyers for each car differs widely, as it depends on
the quality of the match of the particular car with the needs of the dealership. Suppose that a dealer has a
choice between two cars that are from the seller’s perspective identical, but that are valued differently by
the dealer because of the dealer’s particular requirements. Suppose, first, that both of these cars can be
purchased over the Internet, but one is geographically further away. If we observe a dealer buying a car
that is not from California, the dealer must have viewed that car as a particularly attractive match in order
to incur the additional transportation costs. From a seller perspective, cars are indistinguishable. The
difference in transportation costs, therefore, provides a lower bound estimate of the difference in
9In this analysis, we assume that adverse selection problems are absent. Our analysis below confirms that adverse selection is likely not an issue here.

15
willingness-to-pay for cars that are purchased from out-of-state. This provides an estimate of the
marketplace benefit for those cars.
[Table II Here]
In Table II, we report the transportation costs for 586 cars sold in the Autodaq Internet auction.
The transportation costs are the actual costs paid by the buyers. Table II shows that transportation costs
average $465 for out-of-state cars and only $223 for California cars, implying a transportation cost
differential of $242 per car.
It is important to note that we cannot say with certainty how much value was created from this
improved matching in our sample. In the extreme, it is possible that the buyer values an out-of-state car
at exactly $242 more than an in-state car and pays the entire differential in transportation costs, leaving
the buyer with no surplus. It seems reasonable to argue, however, that with a liquid Internet market,
dealers in California will be able to buy cars in California over the Internet and capture more, if not all, of
the gains from improved matching.
We also can attempt to estimate the marketplace benefits relative to a physical auction. For a sale
to take place on the Internet, the Internet price must be at least equal to the physical auction price less the
process cost savings. Thus the sum of the marketplace benefits and the process improvements is at least
equal to the difference in transportation costs caused by the additional shipping distance of the Internet
auction versus the physical auction. As before, it may be the case that, at the current stage of
development of the Internet, the total increase in surplus is small, if the transport costs are equal to the
efficiency gains.
In our sample, we can estimate differential transportation costs caused by the additional shipping
distance. Autodaq and industry analysts we spoke to estimated that the buyer pays roughly $110 to
transport a car it buys from a physical auction site to its dealership. As we reported above, Table II shows
that average transportation costs are $465 for cars transported from out of state to dealers in California.
16
This suggests that the average car from out-of-state purchased on the Internet is transported a much
greater distance than the average car purchased at a physical auction. The extra transportation cost of
$355 suggests that the sum of the marketplace benefit and process cost reductions exceeded $355 on
average for out-of-state cars sold on the Internet.10 Again, in a more liquid market, the distance required
to obtain improved matching should decline, and more of the benefit should accrue to buyers and sellers.
Overall, our results suggest substantial marketplace benefits to the Internet auction in the
wholesale used car market. These benefits are potentially of the same order of magnitude as the process
improvements.
C. Asymmetric Information in Physical and Internet Automobile Auctions
1. Quality Information in Car Auctions
While in a physical auction a buyer can obtain an independent indication of the condition of the
car (by self-inspection), the Internet auction relies exclusively on information that can be observed in the
database. As a consequence, informational asymmetries between sellers and buyers may be more
pronounced in Internet auctions.
In the wholesale used car market, however, the potential informational loss may be small as
information in physical auctions is usually restricted. In describing the physical auctions, Genesove
[1993] points out that bidders have limited access to the cars:
“Prior to the bidding, the car is parked outside, where potential bidders can examine its exterior. They are prohibited from opening the doors or raising the hood. Mileage and options are chalked on the car’s windows. When the car’s turn approaches, it is driven into the appropriate lane and then, before bidding is concluded on the previous car, driven up to the auction block. Now the hood is raised and dealers are permitted to enter the car. There is time to check the odometer, to ensure that the air conditioner works (but, in the summer months at least, not the heater) and to take a look at the running motor. But there is no opportunity to test the brakes or any number of other things that a consumer might check out in a drive around the block (…) On top of the auction block stands the auctioneer and, beside him, the seller, who under the rules of the auction must be present. The auctioneer announces any major defects in the car, of which the seller has informed him. Bidding is oral and ascending. When bidding will go no higher, the
10 This calculation also is conditional on an interstate sale.
17
seller is asked to accept or reject the winning bid. About 60% of the time he accepts. The car will have been driven away before the bidding is concluded. From the time it arrived at the auction block until the time it is driven away, a minute and a half will have passed.” Internet-based auctions such as those run by Autodaq, on the other hand, do not allow any
physical inspection of the cars by the buyer.11 Instead, the seller and the third-party inspection made
available by Autodaq provide extensive information on the car’s options and all other measurable aspects
of the car condition, such as its mileage, the damages suffered, age etc. Importantly, Autodaq does not
preclude buyers and sellers from participating in physical auctions. This raises the possibility of sellers
offering only those cars that are in a relatively worse unobservable condition through this channel.
Possibly attenuating adverse selection in our data is the fact that Autodaq is primarily directed at
lessors and fleet owners. Individual used car dealers have only recently started selling cars. Only 571
out of 3552 cars auctioned in our sample, and 111 out of 864 cars sold where auctioned by a dealership.
To understand the implications of the coexistence of these two markets, we take as our starting
point a variant of the simple model of adverse selection of Akerlof [1970]. Suppose that, conditional on
all the observable characteristics, there are two types of cars, G (good) valued by consumers at PG and
lemons L, valued at PL with the proportion of good cars sold in a particular market given by q.12
First, consider the physical market. Assume there is no asymmetric information in the physical
market, so that good cars can be sold at price PG and lemons at price PL there. Suppose the higher cost of
the physical market mechanism is C, so that the value of the sale to the seller is PG - C if the car is not a
lemon, and PL-C if it is. The average price of cars sold in the physical market is then Pp = q PG +(1-q) PL.
Now introduce a competitive electronic market. Here, both classes of cars cannot be
distinguished, as consumers cannot physically inspect the cars. There are two types of outcomes in this
11 Both Autodaq and the physical auctions do inspect the cars and describe them for buyers. Autodaq argues (and we agree), that the information in electronic form is richer and more useful as it allows buyers to search more efficiently for their desired cars and options. 12 Consistent with our previous discussion, the entire surplus is captured by the seller. We now ignore the transport costs considerations to simplify the discussion.
18
market, depending on the cost of the informational asymmetries relative to the benefit of using an
electronic market medium:
1) When the cost of the physical market mechanism is high enough relative to the asymmetric
information costs, so that the average price is higher than the net profit from selling a known good car in
the physical market, i.e. if q PG +(1-q) PL > ( PG -C) or, equivalently, C> (1-q)( PG - PL), both types of
cars are sold in the electronic market, at a price Pe= q PG +(1-q) PL. In this case, the ratio of average
physical market price to electronic market price is 1.
2) If the cost imposed by the presence of lemons on the sellers of good cars is higher than the gain
from using an electronic market C, or formally if C < (1-q)( PG - PL), no transactions of good cars take
place, as good cars are withdrawn and sold in the physical market. In this case, adverse selection exists in
the electronic market. The observed average market price, reflecting the lower average quality of cars
transacted, is Pe =L.
Adverse selection translates in this case to the withdrawal from the electronic market of cars with
relatively good unobservable characteristics within each class in favor of the physical world auction. If
adverse selection is present, we would expect to see a lower average price, conditional on observable
characteristics, for cars sold over the Internet. High quality cars for each level of observable
characteristics would have a low probability of being sold,13 given that the seller would demand high
average prices for the average condition that buyers expect to find in the market.
Apart from this implication for relative price levels, adverse selection also has implications on the
price structure. If adverse selection is important, Internet prices will be lower relative to physical world
prices when adverse selection risk is larger. When a low risk of adverse selection exists, i.e. when the
variance in the condition of cars is small, the difference between the physical world and the Internet
prices will be small. On the other hand, when the adverse selection risk is high, this spread will be large.
13 Note that the seller could just not bring high quality cars to the auction block. Given that the cost of merely posting the car on the electronic market is very low, and that the reserve price can be used to avoid selling it cheap, we can expect even cars with very good unobservable characteristics to be posted. In fact, the opposite is likely to have occurred. Autodaq screened out (i.e., did not list) cars with excessive mileage and excessive known damage.

19
This different risk is to a large extent predictable. The variance in the unobservable condition of the car is
largely a consequence of the unobservable care by the owner. Thus the more that the quality of care
affects the value of the car, the larger the risk of adverse selection. 14
Genesove’s [1993] study of adverse selection in used car markets is the most notable precedent
for our research. He tests for adverse selection by analyzing the effects of the identity of the seller on
prices. He expects systematic differences between the incentives of used and new car dealers to sell used
cars to show up in differences in prices if they are selling different quality cars. Our study differs from
his in that, rather than examining adverse selection in one market, our focus is on comparing adverse
selection in two different markets where we expect, a priori, to find different degrees of informational
asymmetry in them. However, we rely on Genesove’s insights to examine the extent of adverse selection
in the Internet market in itself.
2. Data
Our sample consists of 3552 sold and unsold cars on auction at Autodaq for a period in 1999 and
2000. These are all of the cars that were auctioned by Autodaq at least once in the period we study,
except for those that were withdrawn by their owners without completing a three-auction cycle.15 For
most of our sample period, all cars were put through a maximum of three one-day auction cycles16.
The construction and content of most of the variables in our sample is self-explanatory. One
exception is the ratio of Internet to physical price, which is intended as a proxy for “how much a buyer
would have been willing to pay for this car in the physical world.” We construct this as the ratio of two
variables: the price at which a car was actually sold; and the price at which an average car with similar
observable characteristics was sold in that month in physical auctions. Autodaq provided these estimates
using as a complete data set of physical auction sales.
14 There is another type of adverse selection in this market, unrelated to the quality of care, but related to the quality of manufacturing. This is unlikely to be an issue here for two reasons: first, initial defects are not frequent; and, second, all the models are less than 4 years old so manufacturer warranties typically cover such defects. 15 None of our results are sensitive to including those cars as not sold.

20
While matching these prices generates rich information, the inferences we can draw from the
matches are limited, because the matches are not as precise as we would wish. In particular, the
algorithm takes into account motorization, drive (2-wheel, 4-wheel), style, model, and model year, but
does not differentiate the matches by mileage and option data. For this reason, part of our analysis also
relies on the wholesale Kelley Blue Book (KBB) prices of the cars in the sample. The KBB is an industry
guide of wholesale and retail prices for vehicles. The KBB price uses the full physical observable
characteristics of the car (year, make, model, series, engine, drivetrain, options, mileage, etc.). We do not
use the KBB for any analysis of price levels, but only for our analysis of the changes in relative prices in
response to changes in the cars’ physical characteristics.
[Table III Here]
Descriptive statistics for our sample are given in Table III. The table shows that 24.3% of the
3552 cars offered for sale on the Internet were sold over the period at an average sell price of roughly
$13,600. Estimated physical auction values for the cars were available for a subsample of 3001
observations. The average physical auction value for these cars was $14,200, while the average KBB
value for these cars was substantially higher at $15,500. According to Autodaq and the industry sources
we spoke to (including one competitor), the roughly 10% differential is an industry standard.17 Share of
damages is the ratio of the estimated dollar value of damages suffered to the book value of the car.
Our main objective is to use the data to measure the importance of informational asymmetries in
Internet auctions. We try to do this using three elements in our data: the difference in price levels
between the Internet and the physical world, the structure of relative prices, and the actual probability of
sale of individual cars on the Internet. We expand on our use of these three pieces of information below.
16 This constraint was lifted later in the sample, but to little effect: only six cars were sold after three cycles. 17 The difference between book value and selling price and its magnitude are also present in Genesove [1993]. He finds that the book value is an imperfect predictor of the selling price, but does not document any systematic relation between the bias and the age, mileage or other characteristics of the car.
21
3. Empirical Specifications and Results
i. Relative Price Levels. Assuming that the physical and Internet markets are competitive, we
expect to see lower prices relative to the physical market when the quality of the cars sold on the Internet
is worse than the quality of the cars sold in the physical real world. We can directly test this implication
by comparing the average prices attained by the auctioned cars in the Internet market with the average
price they would have attained had they been auctioned in the physical market.
[Table IV. Here]
Table IV presents this test. The data in the table reject the hypothesis (at the 95% level) that cars
attain lower prices over the Internet than they would have attained in the physical world. In fact, the data
suggest that the Internet prices are significantly higher than the prices in the physical world.
There are two caveats to this interpretation. First, the price in the physical market is for an
average car within a model-year-motor-drivetrain cell. A finding that the average price of a car in the
Internet is higher than in the physical market could be compatible with adverse selection, if cars in the
Internet have less mileage for a given number of years driven, or if they have more options. Regrettably,
the micro-data on the physical market do not allow us to draw such distinctions. Second, the differences
in average prices may respond to factors other than the average quality of the car sold. In particular,
given the lower transaction costs using the Internet, dealers may be willing to pay higher prices for
Internet-based transactions. For this reason, we think the evidence on the structure of relative prices in
both markets is a better gauge of the extent to which adverse selection matters. We turn to this issue next.
ii. Relative Price Structure. As noted above, adverse selection between the physical market and
the Internet is more likely to be a problem the higher the proportion of “lemons” and the lower their
value. Accordingly, if adverse selection is a problem, the effect should increase as the variance of a car’s

22
condition increases. As the variance of a car’s condition increases, the adverse selection should manifest
itself in a larger decrease in the Internet price than in the physical world price.
We test for adverse selection by assuming that conditional on model characteristics, the variance
of the value of a newer car, of a car with low mileage or of one with a good observable condition is likely
to be small. In contrast, the variance of the value of an older car, or one with more miles will vary more
depending on the care taken by its user. In other words, if the quality of care can only be (partially)
gauged from direct observation of the car, the cars in the second category, for which care is likely to
matter more, will be subject to relatively more important adverse selection problems over the Internet.
To test this hypothesis, we could turn again to the most direct data available, i.e. the price on the
Internet relative to the price in the physical world. Because of the limitations in matching Internet prices
to physical auction prices, we turn to the KBB prices as our proxy for the price that the car would have
attained in a physical auction; these prices do differentiate cars by mileage, condition and options. As
long as the relation between the KBB price and the price that an average car with the same characteristics
would have obtained in the physical auction is constant, this is appropriate for our purposes.18 We test the
hypothesis that as the variance in the condition of the car increases – as given by mileage, age and percent
of damages suffered by the car – the Internet price relative to the physical price decreases.
[Table V Here]
The first set (a) of specifications in Table V presents the OLS evidence conditional on the car
being sold. The evidence on the existence of more adverse selection in the electronic auction is mixed.
Holding constant the KBB price, a car does not lose significantly more value in the Internet than in the
physical market. Similarly, higher mileage does not appear to decrease the value of the car more in the
18 Note that the use of the KBB rather than the average physical auction price biases the results in favor of finding that adverse selection is more pronounced in the Internet than in physical markets. This is true because more information goes into non-auction sales in the physical world that are the bases for the KBB than at auctions. Using
23
Internet than in the physical market. In fact, the Internet price declines significantly more slowly with
miles than the KBB price would predict, rejecting the hypothesis of adverse selection. On the other hand,
each car-year reduces the Internet price by around 2 percent points more than the KBB price, suggesting
that this could be a mechanism through which adverse selection is observed.
A problem with those specifications is that the Internet sample is censored by the reserve price, as
we do not observe transaction prices for unsold cars. For this reason, the second set of specifications (b)
in Table V repeats the analysis using all of the observations in the sample, with a censored normal
regression where the reserve price is the censoring point. The evidence in favor of adverse selection in
these specifications is also weak. Including seller fixed effects, the age and the mileage do not appear to
reduce the price that a car could attain on the Internet relative to the price that would attain in a physical
world auction as measured by the KBB price.
iii. Identity of the Seller. Most cars sold in the Autodaq auctions are sold by leasing companies
or rental car companies. For the last part of our sample period, however, individual dealers sold cars on
the Internet. Following Genesove [1993], we exploit the difference in incentives between the three types
of sellers (dealers, leasing companies and rental car companies) to uncover evidence of adverse selection.
We expect adverse selection to be most important for cars sold by individual dealers. Dealers have
greater incentives and opportunities (1) to check the quality of care and condition of each individual car,
and (2) to select those cars to sell on their lot and those to sell on the Internet. As a consequence, after
controlling for physical characteristics of these cars, we expect the identity of the seller of the car to
matter. Individual dealers should obtain lower prices for their cars, holding everything else equal.
The effect of rental car companies is more ambiguous. Holding all else constant, rental car
company cars have been through many more users. Their unobservable quality should be lower and, as a
result, their average price should be lower. On the other hand, selection should be less important for
rental cars, as rental car companies have a policy of selling all their cars after some fixed period of time.
the estimated physical auction car of an equivalent car rather than the KBB as the counterfactual does not affect our results.

24
The set of specifications (c) in Table V tests these hypotheses. The regressions reject the
hypothesis that individual dealers are perceived to sell lower quality cars over the Internet than
institutional sellers. The first column controls only for the book price of the car, and shows a significant
effect of individual dealer on price, but exactly of the opposite sign as the one predicted by the theory.
Controlling for a car’s physical characteristics, the effect decreases, but the dealer effect is still positive
and significant. Holding all physical characteristics constant, a car sold by a individual dealer earns a
premium over the KBB price that is 4% higher than that of the leasing companies (the excluded category).
The lack of evidence of adverse selection in the dealer market is important for another reason.
One might argue that our results for lessor or fleet sales are biased because (1) the buyers know the
identity of the sellers and (2) lessor sellers get good prices for their cars in general. The similar results for
the dealer market suggest that our results are not biased for this reason.
iv. Probability of Sale. A final hypothesis concerns the probability that a car is sold. This
contains no information on the comparison of adverse selection in the Internet market relative to physical
markets, but may contain some information on whether adverse selection exists at all. Clearly, adverse
selection implies that cars with good (online) unobservable condition should be relatively less likely to
sell on the Internet market. For this difference to be translated into an actually lower probability of sale,
however, it would be necessary that cars in relatively good unobservable condition do ‘show-up’ in the
Internet market, likely with a higher reservation price, only to be later withdrawn from auction. In our
data, it is possible to assume that sellers initially attempt to sell all cars that they are planning to sell in
auction on the Internet. First, that is the arrangement between the firm in our study and the sellers.
Second, the sellers can choose a high reservation price for even their best-conditioned cars. As a result,
there is at worst only a small opportunity cost of trying the Internet.
Accordingly, if adverse selection is important on the Internet, we expect that the greater the
variance in a car’s condition (which would increase the incidence of adverse selection), the lower the
probability that the auction is successful. In our sample, cars with more miles, higher age, and a history
of more accidents in the past would have a lower probability of sale if adverse selection exists.

25
The alternative hypothesis is that adverse selection is not a particular problem in Internet markets.
A reason for this in Autodaq’s case is that individual dealer sales over the Internet were limited and under
stringent conditions. To the extent that such dealers are more likely to try to dump their lemons, it may
actually be that the Autodaq market is more, rather than less, efficient than the physical auction market.
The final set of specifications (d) in Table V present the analysis of the probability that a sale
actually takes place using a Probit model. The evidence is inconsistent with the existence of important
adverse selection in these markets. Damaged cars do seem to be somewhat less likely to be sold, but
neither older cars nor cars with more miles are less likely to be transacted. In fact, there is a significantly
positive effect of the age of the car on the probability of a sale.
Caution must also be exercised in interpreting these results. Only if dealers do not withdraw their
‘good condition’ cars prior to sale, but rather post them with a higher reservation price, do we expect to
see adverse selection manifested in a lower probability of sale for cars more affected by adverse selection.
v. Is Adverse Selection a problem over the Internet? Overall, we find little evidence consistent
with the hypothesis that adverse selection is more pervasive in the Internet market than in the physical
world, or even that adverse selection is a problem at all in the Internet marketplace we study.19 As we
observed before, this conclusion necessarily must be qualified by the measures that Autodaq has taken to
reduce the incidence of adverse selection in this particular instance.
19In turn, previous studies of physical motor vehicle market by Bond [1982] and Genesove [1993], have found little evidence of adverse selection in these markets.

26
IV. From Value Creation to Value Capture: The rise and fall of B2B Valuations
It is well-known that publicly-traded Internet firms achieved levels that were extraordinary by
most standards. For example, Ofek and Richardson (2001) show that in the aggregate, Internet firms
traded at roughly 35 times revenue at the end of 1999. If those firms had achieved industry-average net
income margins at the time, they would have had price-earnings (P/E) ratios of 605. Ofek and
Richardson (2001) also estimate the growth rates that would have been required to justify such high P/E
ratios and find that such rates are extremely high by historical standards. Cooper et al. (2001) find that
firms that announce name changes to include “dotcom” experience abnormal returns of 74% over this
period.
In the two years since the end of 1999, Internet valuations have declined precipitously. From
February 2000 to December 2000, Ofek and Richardson report that the value of these firms declined by
an average of 80%. That decline has continued in the subsequent months.
In this section, we discuss what the market appears to have believed when Internet
valuations peaked. we then use the framework of the previous section to discuss why those beliefs turned
out to be so wrong.
A Why were valuations so high?
Valuations of B2B e-commerce were based on very aggressive growth assumptions. One
B2B e-commerce firm, Chemdex, attained a market capitalization of $11 billion with $2 million of true
revenues. Rajgopal et al. (2000) also find that B2B valuations related to alliances, acquisitions, customer
acquisition, but not to earnings.
The rational story for these companies is that investors assumed that (1) the businesses
delivered large reductions in transaction costs; (2) business customers would adopt quickly, i.e., a large
volume of activity would move to the internet; (3) competition would be slow and network effects would
emerge; and (4) the B2Bs would be able to capture a meaningful portion of transaction cost savings.
27
B. Why are they so low now?
Why have the valuations of Internet companies decline so precipitously since March 2000?
Clearly, the market’s expectations of growth have declined a great deal. Ofek and Richardson (2001)
argue that part of the reason for the decline was an increase in the number of selling shareholders driven
by expiring lock-up agreements. In this section, we present some additional thoughts concerning the
downward revisions in growth expectations.
For B2B as well as business to consumer (B2C) e-commerce businesses, the market greatly
reduced its expectations of (some combination of) future growth, of the extent of transaction cost
reductions, the ability to capture those reductions, the speed of adoption, the ability to take advantage of
network effects, the extent of competition, and (for B2C) the extent to which traffic could be transformed
into revenues. Is the change in the market’s expectations for B2C and B2B companies surprising?
It is worth considering the framework from section II. Many B2C companies are simply
improved catalogs. Such businesses reduce transaction costs for individual consumers –the Internet can
make it easier to find items (like books) and easier to order them (books and stocks) – and for the
cataloger – order taking and order fulfillment are less costly. However, this is not an earth shattering
change. The introduction of catalogs brought with them transaction cost reductions, but not extraordinary
valuations. Catalogs (and brokerage firms) also regularly face competition. It is hard to imagine a
rational story for such high B2C valuations for e-commerce companies.
One exception is a company like eBay. EBay does provide a service that is not available offline.
It also benefits from network effects because it connects many buyers to many sellers. Sellers know they
are more likely to find buyers at eBay. That attracts more sellers. Buyers know they are more likely to
find sellers at eBay. This attracts more buyers. Buyers and sellers are less likely to make good matches
through other companies. As more buyers and sellers use eBay, the advantage of eBay over other
companies increases. Consistent with this, eBay’s value has only declined by slightly more than 50% of
its peak value.

28
Is the change in the market’s expectations for B2B companies surprising? The extent of the
decline in B2B was more of a surprise to us. It was not surprising to see some decline. It was surprising
to see a large fraction of these companies fail. Based on the framework, it was more plausible that B2B
companies reduced transaction costs substantially. B2B business models also were more likely (than
B2C models) to rely on business models that utilized network effects, matching many buyers to many
sellers in the way that eBay did.
What went wrong? In some markets, companies have obtained transaction cost reductions, but
B2B companies have not been able to capture much of this reduction because of competition. This is
arguably true in the procurement area where the a number of companies have been able to provide
software and procurement processes that are not largely differentiated from each other. Network effects
have not materialized in those markets.
There also was a belief in a number of markets that B2B companies would be able to charge a
percentage of the transaction value, rather than a fixed transaction fee. This reflected a misunderstanding
of the nature of the transaction cost savings. In many cases, the transaction cost savings is a fixed amount
– time spent punching in data – rather than a percentage of the transaction value.
Finally, in some markets, companies just have not adopted the new technologies. This occurred
for two reasons. First, some companies, particularly suppliers, were not interested in using internet
marketplaces because they did not want to put an intermediary between their customers and themselves.
Second, companies have been able to use the Internet without having to commit. I.e., it is possible to use
the internet to get price information, but then go to traditional suppliers for execution.
C. Did sophisticated investors “know” prices were too high?
Answering whether people knew prices were too high is, of course, very difficult. Ofek and
Richardson present evidence and argue that the decline in Internet stocks is related to short sales
constraints and the expiration of IPO lock-ups. They argue that the rise and fall of Internet stocks can be

29
explained by an initial relative oversupply of optimistic investors who drove prices up followed by the
arrival of more pessimistic investors – insiders – who drove prices down.
The Ofek and Richardson story suggests that sophisticated investors – like venture capitalists –
believed a bubble existed. While this story is plausible, there are some pieces of evidence that are not
consistent with this explanation.
[Figure 1 Here] At the same time that venture capitalists were some of the insiders who sold shares after lock-ups
expired, the venture capitalists also sharply increased the amount of money they raised and the pace of
their investments in new Internet and technology related start-ups. Figure 1 shows the large increase in
funds committed to VC funds while figure 2 shows the huge increase in investments by VCs in 1999 and
2000. Much of this investment went into New Economy investments. Hendershott (2001) documents a
similar pattern for pure Internet investments.
Presumably the VCs who made these investments believed that the investments would be
profitable on average. To believe the investments would be profitable, the VCs must have believed, on
average, that the companies they invested in would be viable and valuable. In other words, such a large
increase in investment seems inconsistent with a pessimistic view of the New Economy companies.
Furthermore, the VCs received most of their capital commitments from large institutional investors –
pension funds, endowments, etc – who also must have been optimistic about these investments.
[Figure 2 Here] One might argue that the VCs and institutional investors made these investments with the
expectation of flipping their private investments to irrational public investors. This argument, however,
would require the VCs to have believed that stock prices would remain irrationally high for at least two
years. I.e., even under optimistic conditions, it still would take that time for the VC to invest in an early
stage company, take it public, wait for the lock-up period to end, and then sell the shares. This argument
also runs into difficulty in that it assumes that the investors in public securities would be irrational. Yet, a

30
substantial number of investors in public securities were the same institutions who invested in the VC
funds.
[Figure 3 Here] Figure 3 sheds some light on this. Figure 3 presents a time series of VC-backed IPOs and first
VC round investments (based on data from Venture Economics). First VC round investments provide a
measure of the number of new companies backed by VCs. VC-backed IPOs provide a measure of the
number of VC companies that succeed. Figure 3 shows that it was reasonable for VCs to assume there
would be 200 to 250 VC-backed IPOs per year. At the same time, figure 3 shows an incredible increase
in VC funded first rounds in 1999 and, particularly, 2000. The large increase in VC investments without
a concomitant increase in the number of IPOs is certainly consistent with VCs and institutional investors
believing that stock prices would remain high.
Figure 3 does leave us with a puzzle. The huge increase in number of companies funded suggests
that competition would be a huge problem. Yet it is difficult to justify the high valuations in 1999 and
early 2000 without assuming that competition would be modest.
Two other observations are relevant. First, buyout investors made large and high profile
investments in B2B and other technology companies. For example, Forstmann Little, Hicks Muse, and
KKR, among others, invested and have subsequently lost hundreds of millions of dollars in such
companies. These sophisticated buyout investors must have believed that the investments had a positive
expected value at the time.
Second, infrastructure companies like Cisco, Lucent, and others also have lost a large fraction of
their values. This is important to mention because their securities were liquid throughout the rise and
fall.20
We draw the following conclusion from these observations. Insiders and sophisticated investors
– including VCs and some buyout investors – may have believed that many of their individual stocks
20 We thank John Cochrane for this observation.
31
were overvalued when Internet valuations were high. As a result, they sold shares. At the same,
however, those same investors believed that the New Economy companies were viable entities and that
there were opportunities to create more New Economy companies. Furthermore, some of these
sophisticated investors believed that some of these companies were undervalued – particularly the buyout
investors who invested in telecommunications.
V. Conclusion and Implications
A. Summary
In this paper, we present a framework to evaluate the impact of B2B (and other Internet / New
Economy) businesses on transaction costs. We apply this framework to one particular business and find
that process improvements and marketplace benefits are potentially large – on the order of 5% of the
automobile value and a much large fraction of the total transaction cost. Moreover, we do not find
evidence that the Internet increases adverse selection costs.
We then use the framework to consider the rise and fall of B2B (and other Internet) valuations.
High valuations were fueled by beliefs that B2Bs would grow significantly and would deliver larger
reductions in transaction costs. There also was an implicit assumption that competition would be weak,
possibly because of network effects. Valuations fell as the market began to realize that those beliefs and
assumptions would not be validated.
We then discuss the implications of the rise and fall of valuations. It is simplistic to argue that
smart, informed individuals took advantage of naïve public investors. Sophisticated and previously
successful venture capital and buyout investors behaved as if they believed that Internet and New
Economy companies would be much more successful than they have been.
B What are the real effects of the internet / new economy likely to be?

32
We have seen a boom and then a bust in B2B, Internet, and technology valuations. Stock market
investors obtained terrific returns and then horrific ones. In April 2002, the S&P 500 stands at roughly
1100 while the NASDAQ Composite rests at roughly 1750. These are the same levels these indices
registered in early 1998. In other words, the stock market has roughly stood still (ignoring modest
dividends) overall in the last four years. The results in Hendershott (2001) suggest that the overall return
on investment in Internet companies also was roughly breakeven.
The question, then, is whether the investments in B2B (as well as the New Economy and
technology in general) had a similar negligible effect on the overall economy. It is here that the real
effects on the economy need not be the same as the effects on the stock market. It is our sense that the
B2B and other related technology investments have generated and will continue to generate substantial
improvements in productivity. The favorable productivity numbers since the mid-1990s and continuing
in the recent downturn certainly are consistent with this.
The Internet allows companies to substantially alter many of the processes by which they do
business. For example, B2B and other technologies allow large reductions in transaction costs in areas
like procurement, accounts payable, and human resources. Many of these are labor intensive functions
that can be outsourced or automated. Consistent with this, an increasing number of companies move
tasks and processes like data entry, simple programming, and call center services from the United States
to India and other lower wage countries. Much of this would not be possible without the New Economy
investments and technologies.

33
General Electric (GE) provides an interesting example.21 In the late 1990s, Jack Welch
challenged his employees to move everything they could to the Internet. They found that while they
could not move transactions so quickly to the Internet, they found could move a large number of internal
and support processes. And they could do so with “simple Web application [software] supported by
email.” GE expects that transactions will gradually move to the Internet as software evolves and other
companies move more toward the Internet. GE also expects to develop Web-based customer systems that
monitor how GE equipment is performing and, therefore, improve the performance of that equipment.
We have not attempted to estimate the overall or macro implications of all this. Casual empiricism
suggests that there are still a large number of existing processes for which New Economy technology can
reduce transaction costs substantially. The implementation of these transaction cost reductions will be
gradual as they require some up front investment and adjustment costs.
It is possible, therefore, that the New Economy technology can generate strong productivity
increases at the same time that the companies and technologies that enable them do not earn much profit
and the corporations that implement them do not earn much additional profit. Competition and the ability
to copy drive profits down for the enablers. Competition among the companies that implement the
improvements drives prices down for end users. In the end, the end users / consumer benefit as measured
by the productivity increases despite the fact that the stock market does not.
21 The quote and the information in this paragraph are taken from the Wall Street Journal, May 8, 2001, p. A1.
34
Acknowledgements:
This research has been supported by the Center for Research in Security Prices, the Kauffman
Foundation, the Graduate School of Business at the University of Chicago and the Lynde and Harry
Bradley Foundation and the Olin Foundation through grants to the Center for the Study of the Economy
and the State. We thank Severin Borenstein, Judy Chevalier, David Genesove Charles Morris, Rod
Parsley, Erik Peterson, Jagadish Turimella, Frank Wolak, and seminar participants at IESE (Barcelona),
University Pompeu Fabra, and the NBER E-Commerce project for helpful comments and discussions.
Address correspondence to Luis Garicano, Graduate School of Business, The University of Chicago, 1101
East 58th Street, Chicago, IL 60637 or e-mail at [email protected]. ©2002 Luis Garicano
and Steven Kaplan.
35
References
Akerlof, G., 1970. “The Market for 'Lemons': Quality Uncertainty and the Market Mechanism,”
Quarterly Journal of Economics 222: 488-500.
Bond, E.W, 1982. “A Direct Test of the “Lemons” Model: The Market for Used Pick-Up Trucks”
American Economic Review 72 (4): 832-80.
Demers, E. and Lev.B., 2001. "A Rude Awakening: Internet Value-Drivers in 2000"Working paper,
NYU.
Garicano, L. and Kaplan, S.N. 2001, “The Effects of Business-to-Business E-Commerce on Transaction
Costs”, Journal of Industrial Economics, vol. 49 (4),December 2001: 463-485.
Genesove, D., 1993. “Adverse Selection in the Wholesale Used Car Market” Journal of Political
Economy v101, n4: 644-65.
Hand, J.R.M. 2000. “The role of economic fundamentals, web traffic, and supply and demand in the
pricing of U.S.
Internet stocks,” Working paper, University of North Carolina..
Hendershott, R., 2001.“Net Value: Wealth Creation (and Destruction) during the Internet Boom, ”
Working Paper, Leavey School, Santa Clara University.
Jorion P. and Talmor, E. 2001. “Value relevance of financial and non-financial information in emerging
industries…,” Working paper, UC-Irvine.
36
Milgrom P. and Roberts, J., 1992. Economics, Organization and Management. Englewood Cliffs, NJ:
Prentice Hall.
Ofek, E. and Richardson, M. 2001. “Dotcom mania: The rise and fall of internet stock prices,” NBER
Working Paper #8630.
Rajgopal S., Kotha, S. and Venkatachalam, M., 2000. “The relevance of web traffic for Internet stock
prices,”
Working paper, University of Washington.
Sawhney, M. and Kaplan, S.N. 1999. “Let’s Get Vertical,” Business 2.0, September.
Trueman, B., Wong, M.H. and. Zhang, X 2001. “The eyeballs have it: Searching for the value in Internet
stocks,” Working paper, UC-Berkeley.
Williamson, O. (1985) “The Economic Institutions of Capitalism” New York: Free Press
37
Table 1 Process Cost Of Physical Auction Versus Internet Auction Process Per Car
Process cost of physical auction versus Internet auction based on used car auctions from 1999 to 2000. Physical Auction Internet Auction Industry Estimate Sample Results Autodaq Estimate Sample Results
Time (days)
(1)
Dollars
(2)
Time (days)
(3)
Dollars
(4)
Time (days)
(5)
Dollars
(6)
Time (days)
(7)
Dollars
(8) Wait for pick-up 9 to 15 N.A. 0 N.A. Ship to auction 2 N.A. 0 N.A. Ready for sale 10 N.A. 2 N.A. Ready for sale until sale 5 to 15 N.A. 2 N.A. Ship to dealer 2 2 3 3 Total Time 28 to 44 37 7 17 Capital Cost of Time (36 days) $107 $110 $21 $51 Depreciation Cost of Time (36 days) $188 $193 $37 $89 Inspection Cost $ 5 $ 5 $60 $60 Shipping Cost $220 $220 $137 $137 Reconditioning Cost X X X X Dealer Travel Cost 0.5
Hours $20 0.5 Hours $ 20
Dealer Time Not Bidding 0 to 4 Hours
0 to 4 Hours
Total Economic Cost $540 +
X $548 + X $255 + X $337 + X
Seller Fee $100 $100 $100 $100 Buyer Fee $200 $200 $175 $175

38
Table 1 (continued) Process Cost Of Physical Auction Versus Internet Auction Process Per Car
Assumptions: Times:
Industry Estimates: Industry estimates for physical auction were obtained from Tom Kontos at ADT Automotive and confirmed by other sources. Autodaq estimates for Internet auction were provided by Autodaq.
Sample Results: Sample median for physical auction is time from inspection to time of sale for 9205 cars sold by lessors through physical auction process augmented by two days for dealer shipment. Sample median for Internet auction is time from inspection to time of sale for 694 cars sold through Autodaq process augmented by three days for dealer shipment.
Wait for pick-up is time from lessee delivery of car to dealer until car is picked-up by physical auction. Ready for sale is time from delivery at physical auction site to the time car is ready for sale. Includes time to recondition.
Used cars in our sample have an average sale value of $13,600. Interest rate / cost of capital assumed to equal 8%. Each day, therefore, costs seller 8% x $13,600 / 365 = $2.98 per day in capital costs. The table assumes that used car values decline or depreciate in value by 14% per year. Each day, therefore, costs seller 14% x $13,600 / 365 = $5.22 per day in depreciation costs / forgone sales price. In the data provided by Autodaq, the sales price declines by 14.8% (with a standard error of 1.7%) per year. Inspection cost for physical auction assumes 15 minutes at a cost of $20 per hour; for Autodaq, is the cost to Autodaq. Dealer travel cost assumes that dealer travels a total of two hours and buys four cars for an average of 0.5 hours per car. Dealer time is valued at $40 per hour. Shipping cost is two shipments at $110 each for the physical auction; one shipment at $137 for the Autodaq process. Based on Autodaq and industry interviews. Reconditioning costs assumed to be the same for both processes
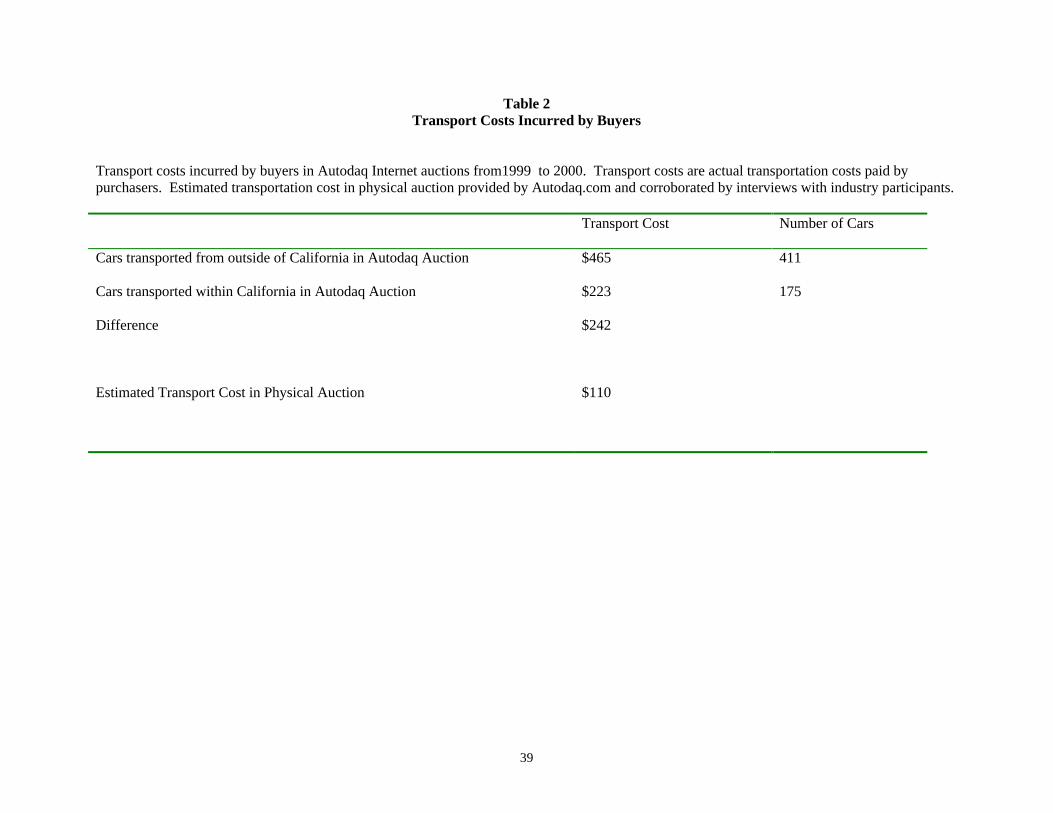
39
Table 2 Transport Costs Incurred by Buyers
Transport costs incurred by buyers in Autodaq Internet auctions from1999 to 2000. Transport costs are actual transportation costs paid by purchasers. Estimated transportation cost in physical auction provided by Autodaq.com and corroborated by interviews with industry participants. Transport Cost Number of Cars
Cars transported from outside of California in Autodaq Auction $465 411
Cars transported within California in Autodaq Auction $223 175
Difference $242
Estimated Transport Cost in Physical Auction $110
40
Table 3 Descriptive Statistics
Descriptive statistics for Autodaq Internet auctions from 1999 to 2000. Sold equals one if a car put up for sale in an Autodaq auction was sold. Internet price is the price the car sold for in the Internet auction. Estimated physical auction value is the value the Autodaq estimates the car would have sold for in a physical auction based on data from physical auctions. Book price is the price of a similar car according to the Kelley Blue Book.
Variable Obs Mean Std. Dev. Min Max Vehicle
Sold 3552 0.24 0.43 0.00 1.00
Internet Price [$1000]
865 13.6 5.3 3.1 32.7
Estimated Physical Auction Value[$1000]
3001 14.2 5.6 0.0 74.9
Blue Book Price [$1000]
Mileage (1000)
3552 3.57 1.43 196.00 10.83
Age (2000-year)
3552 2.15 1.50 0.00 7.00
Dollar of damages (1000$)
3552 0.128 0.20 0.00 2.22
Auction Date
616 1.04 0.13 0.67 2.10
Seller = Rental Company
3552 .30 .46 0 1
Seller = Individual Dealer
3552 0.05 .20 0 1
Seller = Leasing Company
3552 0.65 0.48 0 1

41
Table 4 Price Levels: Internet Auctions Versus Physical Auctions
Price level of internet auction relative to physical auctions Autodaq Internet auctions from 1999 to 2000. Internet price is the price the car sold for. In the Autodaq auction. Estimated physical auction value is the value the Autodaq estimates the car would have sold for in a physical auction based on data from physical auctions. The data correspond to a matched sample of internet sales with the price of an average car of identical model year, motorization and drive in physical auctions. ** is significantly larger than 1.
Model Year of Manufacture
Internet price/
physical auction value
N(number of Internet Cars) 95% Confidence Interval
1995 1.176** 31 1.104 1.247
(0.035)
1996 1.114** 80 1.07 1.158 (0.022)
1997 1.018** 418 1.008 1.028 (0.005)
1998 1.049** 42 1.02 1.078 (0.014)
1999 1.062** 23 1.019 1.105 (0.021)
42
Table 5
Performance of Internet Auctions Regressions for Autodaq Internet auctions from 1999 to 2000. Internet price is the price the car sold for. Book price is the price of a similar car according to the Kelley Blue Book.
Independent Variables
Dependent Variables
Log Blue Book Price
Mileage (000)
Damages ($1000) Age Auction
Date Seller Fixed
Effects
Seller = Individual
Dealer
Seller = Rental
Company Constant
R Sq (N)
1.0505** 0.0077** 0.0000 -0.0154** 0.0003** -0.2924** 0.9628 (0.0076) (0.0026) (0.0000) (0.0039) (0.0000) (0.028) (843)
1.0502** 0.0091** 0.0000 -0.0209** 0.0001 yes -0.2475** 0.9637
(a) Log Internet Price
(OLS)
(0.0078) (0.0026) (0) (0.0043) (0.0001) (0.0342) (843)
1.0137** -0.011** 0.0001** 0.0383** 0.0002** -0.3141** (0.0072) (0.0025) (0.000) (0.0034) (0) (0.0251) (3147)
0.9945** -0.0038 0.0001* -0.0039 0.0001* yes -0.1175**
(b) Log Internet Price
(Censored Normal
regressions) (0.0071) (0.0024) (0.000 (0.0039) (0.0001) (0.0324) (3147)
1.0615** 0.0978** 0.0489** -0.3083** 0.9604 (0.0075) (0.0103) (0.016) (0.0203) (843)
1.0514** 0.0084** 0.0000 -0.0205** 0.0002** 0.0384** -0.0389* -0.2759** 0.9636
(c) Log Internet Price
(OLS) (0.0077) (0.0025) (0.0000) (0.0042) (0) (0.0141) (0.0193) (0.0288) (843)
-0.03 -0.0005** 0.2963** -0.0022** -0.8456** (0.0238) (0.0001) (0.0308) (0.0003) (0.1073) (3552) 0.0066 -0.0002* 0.1734** -0.0069** yes 0.539*
(d) Probability Car Sold
(Probit)
(0.0246) (0.0001) (0.0408) (0.0007) (0.2174) (3552) Standard Errors In parenthesis * Significant at 5% level; ** Significant at 1% level;.
27
Figure 1
Fundraising by venture capital partnerships 1980 - 2001
(in $ billions)
$0
$10
$20
$30
$40
$50
$60
$70
$80
1980 1982 1984 1986 1988 1990 1992 1994 1996 1998 2000
Source: Private Equity Analyst
$ B
illio
ns

28
Figure 2
Venture Capital Financing 1990 - 2001
0
1000
2000
3000
4000
5000
6000
1990 1991 1992 1993 1994 1995 1996 1997 1998 1999 2000 2001
Co
mp
anie
s
$0
$20,000
$40,000
$60,000
$80,000
$100,000
$120,000
Source: Venture Economics
$ M
illio
n
VC-Backed CompaniesVC $ Volume

29
Figure 3
VC 1st Rounds Versus VC-Backed IPOs
0
50
100
150
200
250
300
350
1990 1991 1992 1993 1994 1995 1996 1997 1998 1999 2000 2001
IPO
s
0
500
1000
1500
2000
2500
3000
3500
4000
4500
Source: Venture Economics
1st
Ro
un
ds
VC-Backed IPOsCos. w/ VC 1st Round
Related Documents


