Business Strategy and Organizational Performance: Measures and Relationships By Jamil Anwar CIIT/SP12-PMS-006/ISB PhD Thesis In Management Sciences COMSATS University Islamabad Islamabad Campus- Pakistan Spring, 2017

Welcome message from author
This document is posted to help you gain knowledge. Please leave a comment to let me know what you think about it! Share it to your friends and learn new things together.
Transcript
Business Strategy and Organizational
Performance: Measures and Relationships
By
Jamil Anwar
CIIT/SP12-PMS-006/ISB
PhD Thesis
In
Management Sciences
COMSATS University Islamabad
Islamabad Campus- Pakistan
Spring, 2017
ii
COMSATS University Islamabad
Business Strategy and Organizational Performance:
Measures and Relationships
A Thesis Presented to
COMSATS University, Islamabad
In partial fulfillment
of the requirement for the degree of
PhD (Management Sciences)
By
Jamil Anwar
CIIT/SP12-PMS-006/ISB
Spring, 2017
iii
Business Strategy and Organizational Performance:
Measures and Relationships
A Post Graduate Thesis submitted to the Department of Management Sciences as
partial fulfillment of the requirement for the award of Degree of Ph.D in
Management Sciences.
Name Registration Number
Jamil Anwar CIIT/SP12-PMS-006/ISB
Supervisor
Dr. Syed Amjad Farid Hasnu
Professor, Department of Management Sciences
COMSATS University Islamabad, Abbottabad Campus
iv
Certificate of Approval
This is to certify that the research work presented in this thesis, entitled “Business
Strategy and Organizational Performance: Measures and Relationships” was conducted
by Mr. Jamil Anwar, CIIT/SP12-PMS-006/ISB, under the supervision of Dr. Syed Amjad
Farid Hasnu. No part of this thesis has been submitted anywhere else for any other
degree. This thesis is submitted to the Department of Management Sciences, COMSATS
University Islamabad, in the partial fulfillment of the requirement for the degree of
Doctor of Philosophy in the field of Management Sciences.
Student Name: Jamil Anwar Signature: __________________
Examinations Committee:
Signature
External Examiner 1:
(Designation& Office Address)
……………………………………
……………………………………
Signature
External Examiner 2:
(Designation& Office Address)
……………………………………
……………………………………
.
Dr. Syed Amjad Farid Hasnu
Supervisor
Department of Management Sciences,
CUI, Abbottabad Campus
.
Dr. Aneel Salman,
HoD
Department of Management
Sciences,
COMSATS University, Islamabad
.
Dr. Samina Nawab
Chairperson,
Department of Management Sciences,
CUI
.
Dr. Khalid Riaz
Dean,
Faculty of Business
Administration, CUI
v
Author’s Declaration
I, Jamil Anwar, CIIT/SP12-PMS-006/ISB, hereby state that my PhD thesis titled
“Business Strategy and Organizational Performance: Measures and Relationships” is my
own work and has not been submitted previously by me for taking any degree from this
University i.e. COMSATS University, Islamabad or anywhere else in the country/world.
At any time if my statement is found to be incorrect even after I graduate, the University
has the right to withdraw my PhD degree.
Date: _________________ Signature: ________________________
Jamil Anwar
CIIT/SP12-PMS-006/ISB
vi
Plagiarism Undertaking
I solemnly declare that research work presented in the thesis titled “Business Strategy and
Organizational Performance: Measures and Relationships” is solely my research work
with no significant contribution from any other person. Small contribution/help wherever
taken has been duly acknowledged and that complete thesis has been written by me.
I understand the zero tolerance policy of HEC and COMSATS University, Islamabad
towards plagiarism. Therefore, I as an author of the above titled thesis declare that no
portion of my thesis has been plagiarized and any material used as reference is properly
referred/cited.
I undertake if I am found guilty of any formal plagiarism in the above titled thesis even
after award of PhD Degree, the University reserves the right to withdraw/revoke my PhD
degree and that HEC and the university has the right to publish my name on the
HEC/university website on which names of students are placed who submitted
plagiarized thesis.
Date: __________________ Signature: _______________________
Jamil Anwar
CIIT/SP12-PMS-006/ISB
vii
Certificate
It is certified that Jamil Anwar, CIIT/SP12-PMS-006/ISB has carried out all the work
related to this thesis under my supervision at the Department of Management Sciences,
COMSATS University, Islamabad and the work fulfills the requirements for award of
PhD degree.
Date:___________________
Supervisor:
________________________________
Dr. Syed Amjad Farid Hasnu
Professor
Department of Management Sciences
CUI, Abbottabad Campus
Head of Department:
______________________________
Dr. Aneel Salman
Head, Department of Management Sciences
COMSATS University, Islamabad

viii
DEDICATION
Dedicated to my parents, wife, and kids for their love, care
and prayers

ix
ACKNOWLEDGEMENTS
Alhamdolillah. I am very thankful to Almighty Allah (SWT) for blessing me with the
opportunity, determination, and confidence to undertake this doctoral program.
While conducting this research, I received support from many people. It is my pleasure to
take this opportunity to thank all of them. First of all, I am deeply thankful to my
supervisor Prof. Dr. Syed Amjad Farid Hasnu for his continuous guidance, support and
kind heartedness. I am also thankful to the HODs and program coordinators at the
department of Management Sciences, COMSATS University, Islamabad for their
continuous support.
I am thankful to Muhammad Shafi, Joint Director, State Bank of Pakistan for helping me
in data collection in the proper format. Thanks to my colleagues and friends for their
continuous support and encouragement during the whole process.
Very special thanks to my loving parents, my wife, children and other family members
for their continuous support and prayers during this period. It would not be possible to
complete the thesis with in time without their prayers, support, encouragement, and
patience they showed throughout this time. May Allah (SWT) bless all of them. Ameen
Jamil Anwar
CIIT/SP12-PMS-006/ISB
x
Publication
The following research has been published during the preparation of this thesis.
Impact Factor Publication
Jamil Anwar, SAF Hasnu (2017), Strategic Patterns and Firm Performance: Comparing
Consistent, Flexible and Reactor Strategies, Journal of Organizational Change
Management, 30(7), pp: 1015-1029
HEC Approved Journal Publication
Jamil Anwar, SAF Hasnu (2019), The Impact of Consistent, Flexible and Reactor
Strategy on Organizational Performance: A Comparative Analysis, Pakistan Business
Review, 20(1), pp:
Jamil Anwar, Said Shah, SAF Hasnu (2016). Business Strategy and Organizational
Performance: Measures and Relationships. Pakistan Economic and Social Review, 54(1),
97-122
ESCI/SCOPUS Publications
Jamil Anwar, SAF Hasnu (2016). Strategy-Performance Linkage: Methodological
Refinements and Empirical Analysis. Journal of Asia Business Studies, 10(3), pp: 303 -
317
Jamil Anwar, SAF Hasnu (2017), Strategy-Performance Relationship: A Comparative
Analysis of Pure, Hybrid, and Reactor Strategies, Journal of Advances in Management
Research, 13(4), pp: 446-465
Jamil Anwar, SAF Hasnu (2016). Business Strategy and Firm Performance: A Multi-
Industry Analysis. Journal of Strategy and Management, 9(3), 361 – 382
xi
Conference Proceedings
Jamil Anwar, SAF Hasnu (2015), Business Strategy and organizational Performance: An
Analysis of Textile Sector, 7th SAICON: International Conference on Meeting the
Challenge: Navigating the Future (http://ww2.comsats.edu.pk/saicon2015/)
Jamil Anwar, SAF Hasnu (2013), Organizational Structure and Performance: A proposed
Framework for Doctoral Research, 5th SAICON: International Conference on
Management, Innovation, Leadership, Economics and Strategies (MILES)
(http://www.ciit-atd.edu.pk/secure/newsandevents/NewsDetails.aspx?Id=253
xii
ABSTRACT
Business Strategy and Organizational Performance: Measures and
Relationships
The contemporary literature is challenging the original idea that strategic purity leads to
superior performance. Similarly, there is an inconclusive debate in extant literature about
the superiority of strategic consistency over strategic flexibility. To address these issues,
the objectives of the research include: the refinement of scoring methodology for
classification of strategic types and strategic behavior of the firms; the comparison of
strategic groups’ performance across firm size and industry; strategy-performance, size-
performance, industry-performance, contingent effect of strategy, size, and industry on
performance; and the comparative analysis of single industry results with multi-industry
results for generalization. Drawing on the contingency theory perspective, Miles and
Snow typology is used for operationalization of strategic types using seven years
archived financial data of 307 joint stock companies listed at Pakistan Stock Exchange
(PSE). The findings reveal that the defending and analysing strategies perform better than
prospecting and reacting strategies. Hybrid strategies outperformed pure strategies while
both consistent and flexible strategies performed equally well and outperformed the
reactors. The performance of strategic types varies with the change in firm size and
industry. The results imply that for better performance, firms in Pakistan should either
compete on the basis of service, price, quality, and operational excellence or should focus
on a balance of innovation and core product development. Innovation, rapid growth and
new product developments is non-profitable. Similarly, inconsistent strategic behaviour
results in poor performance. The conceptualization of pure, hybrid, consistent, and
flexible strategic types, identification of strategic transition of the firms to find out
behaviour along with their empirical testing, refinements in methodology for objective
measures, a comparison of single industry vs multi-industry results are the major
contributions of the study. Typology-driven theorizing for hybrid, consistent, and flexible
strategic types is one of the promising area for future research
Keywords: Business Strategy; Strategic Typology; Strategic Behavior; Organizational
Performance; Contingency Theory; Scoring Methodology
xiii
TABLE OF CONTENTS
Certificate of Approval ......................................................................................... iv
Author’s Declaration .............................................................................................. v
Plagiarism Undertaking ........................................................................................ vi
Certificate .............................................................................................................. vii
DEDICATION ..................................................................................................... viii
ACKNOWLEDGEMENTS .................................................................................. ix
Publication ............................................................................................................... x
Introduction ............................................................................................................ 1
1.1 Overview ................................................................................................................................ 2
1.2. The Pakistan’s Business Context ........................................................................................ 10
1.3 Strategic Management in Pakistan ....................................................................................... 14
1.4 Motivation of the Study ....................................................................................................... 15
1.5 Problem Statement ............................................................................................................... 17
1.6 Objectives of the Study ........................................................................................................ 17
1.7 The Research Questions ....................................................................................................... 18
1.8 Research Methodology ........................................................................................................ 18
1.9 Contribution of the Study ..................................................................................................... 19
1.10 Structure of the Thesis ....................................................................................................... 20
Theoretical Literature Review ............................................................................ 21
2.1 Introduction .......................................................................................................................... 22
2.2 Strategic Management –A Historical Perspective ............................................................... 22
2.3 What is Strategy? ................................................................................................................. 28
2.4 Intended versus Realized Strategy ....................................................................................... 29
2.5 Strategic Purity versus Strategic Hybridization ................................................................... 31
2.6 Strategic Behaviour .............................................................................................................. 32
2.6.1 Strategic Consistency versus Strategic Flexibility ......................................................... 33
2.7 Strategy Levels..................................................................................................................... 36
xiv
2.7.1 Corporate-Level Strategy .............................................................................................. 36
2.7.2 Business-Level Strategy ................................................................................................. 37
2.7.3 Functional-Level Strategy .............................................................................................. 39
2.8 Organizational and Environmental Contingencies .............................................................. 40
2.9 Strategic Groups and Typologies ......................................................................................... 41
2.10 Miles and Snow Typology ................................................................................................. 45
2.10.1 Miles and Snow’s Strategic Types ............................................................................... 47
2.11 Contingency Theory ........................................................................................................... 51
2.12 Business Strategy and Organizational Performance .......................................................... 55
2.12.1 Miles and Snow’s Strategic Types and Organizational Performance.......................... 58
2.12.2 Strategy and Performance: A Contingency Theory Perspective ................................. 59
2.13 Summary ............................................................................................................................ 62
Empirical Literature Review ............................................................................... 64
3.1 Introduction .......................................................................................................................... 65
3.2. Evidence on Industries and Countries Studied, Distribution Patterns of Strategic Types,
and Methodologies Applied ....................................................................................................... 65
3.3 Strategy-Performance Relationships .................................................................................... 69
3.4 Methodological Development for Application of Miles and Snow Typology..................... 76
3.5 Strategic Management in Pakistan ....................................................................................... 81
3.6 Hypotheses Development .................................................................................................... 84
3.7 Summary .............................................................................................................................. 91
Research Methodology ......................................................................................... 93
4.1 Introduction .......................................................................................................................... 94
4.2 Research Paradigm............................................................................................................... 94
4.2.1 Positivist Approach ....................................................................................................... 95
4.3 Research Design................................................................................................................... 97
4.4 Strategy and Performance Variables, Sample size, Tools and Techniques ......................... 98
4.5 Sample and Data ................................................................................................................ 103
4.6 Measures of Strategy, Performance, and Contingent Variables ........................................ 105
4.6.1 Measures of Strategy: Independent Variables ........................................................... 105
4.6.2 Measuring Performance: Dependent Variables ......................................................... 107
xv
4.6.3 Measuring Contingency Variables .............................................................................. 108
4.7 Identification of Strategic Types ........................................................................................ 110
4.7.1 Cluster Analysis ........................................................................................................... 110
4.7.2 Conceptual Development for Scoring Method ........................................................... 111
4.8 Step-by-Step Process to Calculate the Strategy Types using SAS Codes.......................... 114
4.8.1 SAS Data Set ................................................................................................................ 115
4.8.2 Average Calculation .................................................................................................... 116
4.8.3 Rank Calculation .......................................................................................................... 116
4.8.4 Categorization of Firms ............................................................................................... 117
4.8.5 Comparison of Strategies Overtime and Identification of Consistent, Flexible and
Reactor Strategy................................................................................................................... 118
4.9 Data Analysis Techniques .................................................................................................. 120
4.9.1 Descriptive Statistics ................................................................................................... 120
4.9.2 ANOVA and Regression Analysis ................................................................................. 120
4.10 Conceptual Model ............................................................................................................ 122
4.11 Ethical Issues and their Resolution .................................................................................. 125
4.11.1 Ethical Issues ............................................................................................................. 125
4.11.2 Resolution of Ethical Issues ....................................................................................... 126
4.12 Summary .......................................................................................................................... 127
Results and Discussion ....................................................................................... 128
5.1 Introduction ........................................................................................................................ 129
5.2 Identification of Strategic Types ........................................................................................ 129
5.3 Strategic Types, Firm Size and Industry ............................................................................ 133
5.4 Strategy and Performance .................................................................................................. 137
5.5 Strategic Behavior and Performance .................................................................................. 138
5.6 Strategy, Firm Size, and Organizational Performance ....................................................... 140
5.7 Firm Size, Strategic Behavior, and Organizational Performance ...................................... 142
5.8 Strategy, Industry, and Performance .................................................................................. 143
5.9 Industry, Strategic Behavior, and Performance ................................................................. 145
5.10 Hypotheses Testing .......................................................................................................... 148
5.10.1 Proportionate Distribution of Strategic Types .............................................................. 148
xvi
5.10.2 Analysis of Variance (ANOVA) ................................................................................... 149
5.10.2.1 Performance Comparison among Viable Strategies .............................................. 149
5.10.2.2 Pair-wise Differences in Performance ................................................................... 153
5.10.2.3 Performance Comparison between Viable Strategies and Reactors ..................... 155
5.10.2.4 Performance Comparison of Pure, Hybrid, and Reactors ...................................... 157
5.10.2.5 Performance Comparison of Consistent, Flexible, and Reactors........................... 157
5.10.3 The Impact of Strategy, Firm Size, and Industry on Performance: Univariate Analysis
................................................................................................................................................. 160
5.10.3.1 Strategy-Performance Relationship ....................................................................... 160
5.10.3.2 Size-Performance Relationship .............................................................................. 163
5.10.3.3 Industry-Performance Relationship ....................................................................... 164
5.10.4 The impact of Strategy, Size, and Industry on Performance: Multivariate Analysis. 166
5.11 Textile Industry Analysis and its Comparison with Overall Results ............................... 169
5.11.1 Strategic Types Distribution ...................................................................................... 170
5.11.2 Strategic Types and Performance ............................................................................. 171
5.11.3 Strategic Behavior and Performance ........................................................................ 171
5.11.4 Strategy, Size and Performance ................................................................................ 172
5.11.5 Strategic Behavior, Firm Size, and Performance ....................................................... 172
5.11.6 Strategy, Industry, and Performance ........................................................................ 173
5.11.7 Industry, Strategic Behavior, and Performance ........................................................ 173
5.11.8 Strategy-Performance Relationship .......................................................................... 173
5.12 Comparative Summary of the Results: Multi-Industry (MI) versus Single Industry (SI) 175
5.13 Discussion ........................................................................................................................ 180
5.13.1 Refinement in Scoring Methodology ........................................................................ 180
5.13.2 Presence and Distribution of Strategic Types ........................................................... 181
5.13.3 Strategy-Performance Relationship: Pure Versus Hybrid Strategies ........................ 182
5.13.4 Strategy-Performance Relationship: Consistency versus Flexibility ......................... 183
5.13.5 Strategy-Performance Relationship: Miles and Snow Typology Perspective ........... 187
5.13.6 Strategy-Performance Relationship: Reactor Strategy ............................................ 189
5.13.7 Strategy-Performance Relationship: The Contingency Effect .................................. 190
5.14 Summary .......................................................................................................................... 192
Summary and Conclusion .................................................................................. 194
xvii
6.1 Introduction ........................................................................................................................ 195
6.2 Summary of the Research .................................................................................................. 195
6.2.1 Conclusion ................................................................................................................... 197
6.2.2 Contributions and Implications of the Study .............................................................. 198
6.2.4 Limitations of the Study .............................................................................................. 202
6.2.5 Opportunities for Future Research ............................................................................. 203
References ........................................................................................................... 204
Appendices .......................................................................................................... 222
A1: Step-by-step SAS coding for classification of strategic types and groups ........................ 223
A2: Firms Strategic Orientation: Industry Wise ...................................................................... 231
A3: Results -Textile Sector ...................................................................................................... 262
xviii
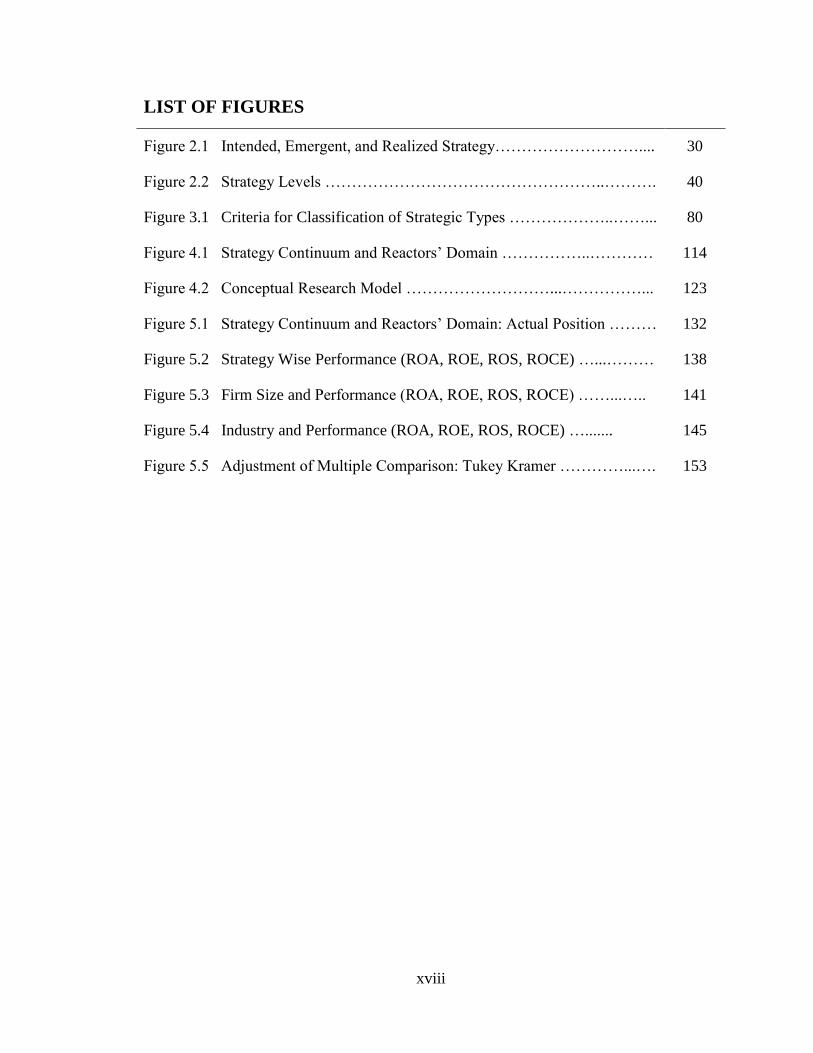
LIST OF FIGURES
Figure 2.1 Intended, Emergent, and Realized Strategy………………………....
Figure 2.2 Strategy Levels ……………………………………………..……….
Figure 3.1 Criteria for Classification of Strategic Types ………………..……...
Figure 4.1 Strategy Continuum and Reactors’ Domain ……………..…………
Figure 4.2 Conceptual Research Model ………………………...……………...
Figure 5.1 Strategy Continuum and Reactors’ Domain: Actual Position ………
Figure 5.2 Strategy Wise Performance (ROA, ROE, ROS, ROCE) …...………
Figure 5.3 Firm Size and Performance (ROA, ROE, ROS, ROCE) ……...…..
Figure 5.4 Industry and Performance (ROA, ROE, ROS, ROCE) ….......
Figure 5.5 Adjustment of Multiple Comparison: Tukey Kramer …………...….
30
40
80
114
123
132
138
141
145
153
xix
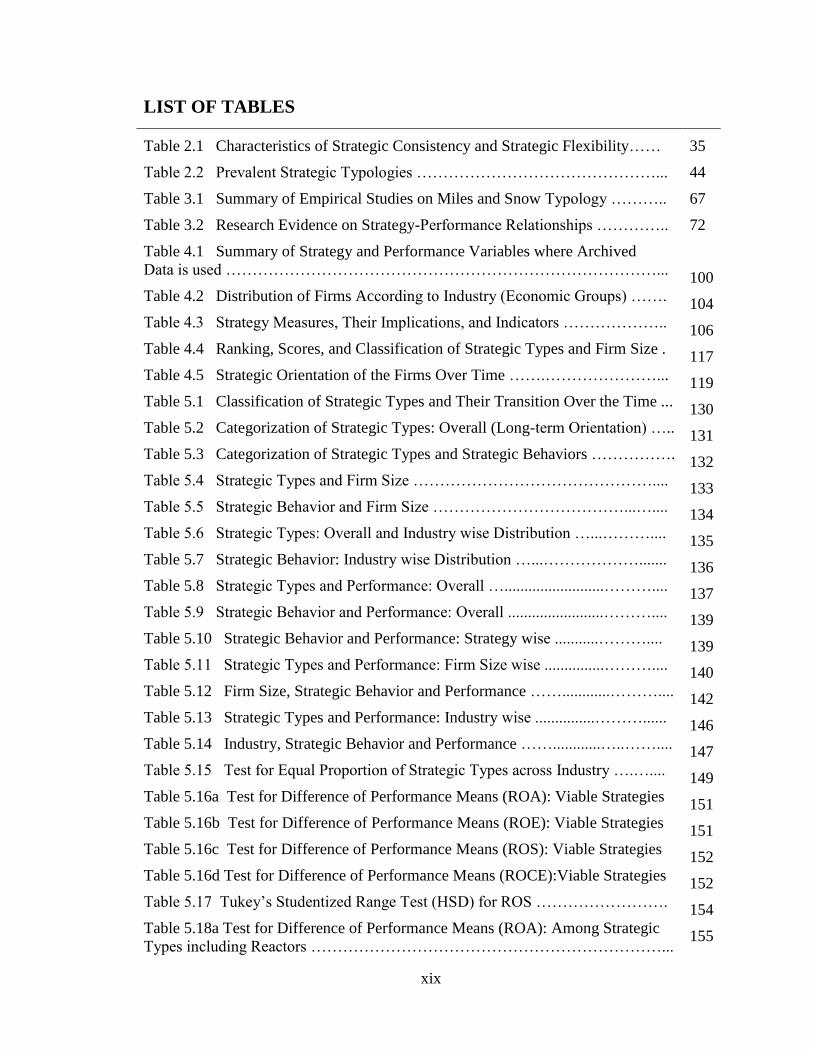
LIST OF TABLES
Table 2.1 Characteristics of Strategic Consistency and Strategic Flexibility……
Table 2.2 Prevalent Strategic Typologies ………………………………………...
Table 3.1 Summary of Empirical Studies on Miles and Snow Typology ………..
Table 3.2 Research Evidence on Strategy-Performance Relationships …………..
Table 4.1 Summary of Strategy and Performance Variables where Archived
Data is used ………………………………………………………………………...
Table 4.2 Distribution of Firms According to Industry (Economic Groups) …….
Table 4.3 Strategy Measures, Their Implications, and Indicators ………………..
Table 4.4 Ranking, Scores, and Classification of Strategic Types and Firm Size .
Table 4.5 Strategic Orientation of the Firms Over Time …….…………………...
Table 5.1 Classification of Strategic Types and Their Transition Over the Time ...
Table 5.2 Categorization of Strategic Types: Overall (Long-term Orientation) …..
Table 5.3 Categorization of Strategic Types and Strategic Behaviors …………….
Table 5.4 Strategic Types and Firm Size ………………………………………....
Table 5.5 Strategic Behavior and Firm Size ………………………………...…....
Table 5.6 Strategic Types: Overall and Industry wise Distribution …...………....
Table 5.7 Strategic Behavior: Industry wise Distribution …...……………….......
Table 5.8 Strategic Types and Performance: Overall ….........................………....
Table 5.9 Strategic Behavior and Performance: Overall ........................………....
Table 5.10 Strategic Behavior and Performance: Strategy wise ...........………....
Table 5.11 Strategic Types and Performance: Firm Size wise ...............………....
Table 5.12 Firm Size, Strategic Behavior and Performance ……............………....
Table 5.13 Strategic Types and Performance: Industry wise ...............………......
Table 5.14 Industry, Strategic Behavior and Performance ……............…..……....
Table 5.15 Test for Equal Proportion of Strategic Types across Industry ….…....
Table 5.16a Test for Difference of Performance Means (ROA): Viable Strategies
Table 5.16b Test for Difference of Performance Means (ROE): Viable Strategies
Table 5.16c Test for Difference of Performance Means (ROS): Viable Strategies
Table 5.16d Test for Difference of Performance Means (ROCE):Viable Strategies
Table 5.17 Tukey’s Studentized Range Test (HSD) for ROS …………………….
Table 5.18a Test for Difference of Performance Means (ROA): Among Strategic
Types including Reactors …………………………………………………………...
35
44
67
72
100
104
106
117
119
130
131
132
133
134
135
136
137
139
139
140
142
146
147
149
151
151
152
152
154
155
xx
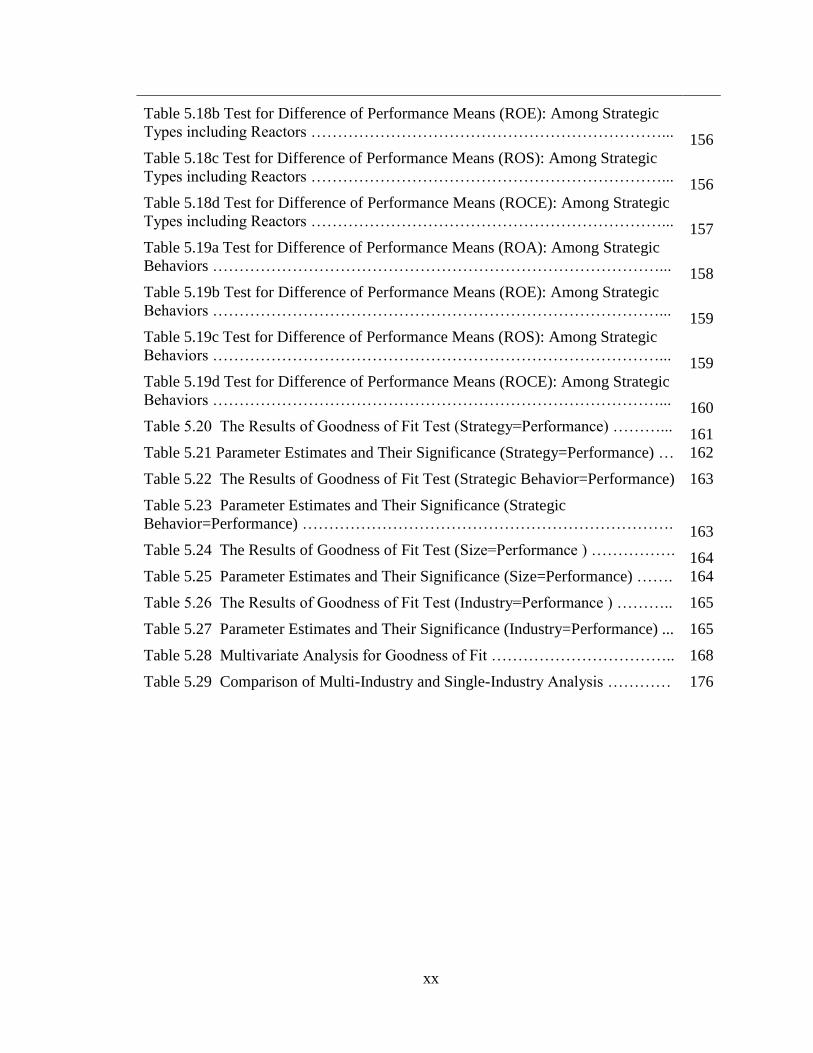
Table 5.18b Test for Difference of Performance Means (ROE): Among Strategic
Types including Reactors …………………………………………………………...
Table 5.18c Test for Difference of Performance Means (ROS): Among Strategic
Types including Reactors …………………………………………………………...
Table 5.18d Test for Difference of Performance Means (ROCE): Among Strategic
Types including Reactors …………………………………………………………...
Table 5.19a Test for Difference of Performance Means (ROA): Among Strategic
Behaviors …………………………………………………………………………...
Table 5.19b Test for Difference of Performance Means (ROE): Among Strategic
Behaviors …………………………………………………………………………...
Table 5.19c Test for Difference of Performance Means (ROS): Among Strategic
Behaviors …………………………………………………………………………...
Table 5.19d Test for Difference of Performance Means (ROCE): Among Strategic
Behaviors …………………………………………………………………………...
Table 5.20 The Results of Goodness of Fit Test (Strategy=Performance) ………...
Table 5.21 Parameter Estimates and Their Significance (Strategy=Performance) …
Table 5.22 The Results of Goodness of Fit Test (Strategic Behavior=Performance)
Table 5.23 Parameter Estimates and Their Significance (Strategic
Behavior=Performance) …………………………………………………………….
Table 5.24 The Results of Goodness of Fit Test (Size=Performance ) …………….
Table 5.25 Parameter Estimates and Their Significance (Size=Performance) …….
Table 5.26 The Results of Goodness of Fit Test (Industry=Performance ) ………..
Table 5.27 Parameter Estimates and Their Significance (Industry=Performance) ...
Table 5.28 Multivariate Analysis for Goodness of Fit ……………………………..
Table 5.29 Comparison of Multi-Industry and Single-Industry Analysis …………
156
156
157
158
159
159
160
161
162
163
163
164
164
165
165
168
176
xxi
LIST OF ABBREVIATION
BCG Boston Consulting Group
BLS Business Level Strategy
CLS Corporate Level Strategy
CPEC China Pakistan Economic Corridor
DA-Like Defender-Analyzer-Like
FLS Functional Level Strategy
HBR Harvard Business Review
IO Industrial Organization
KSE Karachi Stock Exchange
M&S Miles and Snow
PA-Like Prospector-Analyzer-Like
PSE Pakistan Stock Exchange
RBV Resource Based View
ROA Return on Assets
ROE Return on Equity
ROS Return on Sales
ROCE Return on Capital Employed
SM Strategic Management
SSP Strategy-Structure-Performance
SBP State Bank of Pakistan
TCE Transaction Cost Economics

1
Chapter 1
Introduction
2
1.1 Overview
An organization is an established mechanism for achieving its articulated purpose. Most
of the organizations engage themselves in an ongoing process through questioning,
verifying, and redefining the ways of interaction with their environments for evaluating
their purposes. They constantly modify and refine the structure of roles, relationships,
and managerial process to complement strategy. Effective organizations create and
maintain a viable market for their goods or services whereas ineffective organizations fail
to do so (Miles and Snow, 1978; 2003). Management and organizational theorists view
strategy as the mechanism that provides integration for internal operations and guides for
environmental alignment.
In strategy-performance relationship, one of the central questions is to investigate why
firms succeed or fail in a given situation. This question has preoccupied the strategy field
since its inception (Boyd et al, 2012). The causes of success or failure of firms
encompass the questions such as: how firms chose strategies and create a fit; how they
behave over the time; why firms differ in their performance and structure; and how they
are managed etc (Porter, 1991). The strategy-performance relationship has been
examined widely through theoretical and empirical studies. In empirical studies, this
relationship is generally operationalized by using number of different measures and
models of causality powered by strategic typologies. Such type of research used to
distinguish different strategic types to investigate the relationship of strategy with varying
nature of performance measures (Luoma, 2015). In the prevailing complexity of
competitive market conditions and the fact that the business strategy is contingency
based, the existence of universal set of strategic choices is rare. This means that the
organizational effectiveness is dependent upon the amount of “congruence” or “fit”
between environmental and structural factors and the organization’s strategic response to
those factors (Pleshko et al., 2014).
The original idea that purity in strategic stance leads to the superior performance has been
widely challenged in the extant literature. There is rapidly increase in the evidences in
favour of the argument that the focus of the firms is shifting to hybrid form of strategic
3
choice instead of adapting pure strategy (Salavou, 2015). The complex and ever changing
challenges of the international market suggest that firms with hybrid strategies can
produce better performance. The adaptability and comfort ability of dealing with
uncertain strategic issues is now the fundamental requirement. Therefore, the
organizations have to blend their pure strategies to make hybrid strategies (Review,
2018a). This shift of focus has raised the fundamental question whether hybrid strategy
has become superior to the pure strategy and vice versa? Similarly, there is an
inconclusive debate in the literature about adaptation of strategic orientation or behaviour
by the management in a given environment over the time. The supporters for having
consistency in strategic choice argue that organizations perform better if they chose to
stick consistently for a longer period of time to a core strategy. The counter argument
states that for a superior performance, strategic flexibility is the better choice as doing so
firms are able to exploit the given situation and by adjusting their strategic stance for
competitive advantage (Fehre, Kronenwett, & Lindsta, 2016; Moss, Payne, & Moore,
2014; Review, 2018b). Also, investigating the influence of other contingency factors such
as industry in which a firm operates, the size of the firm, and the strategic choice, is an
important area for the enhancement of theory in the field of strategic management.
Furthermore, researchers, for example, Amitabh & Gupta (2010) and Ven et al., (2013)
have emphasized on the importance of expanding the methodological toolbox for
empirical research and stressed the need for longitudinal studies for exploring the
strategy-performance relationship.
One difficulty in business strategy level research is the fact that two matching strategic
settings seldom occur. Because of this difficulty, three primary approaches are used to
study strategy. These approaches are: the “situation-specific view”, “universal view”, and
“contingency view”. The situation-specific view sees strategy as an artful alignment of
internal strengths and weaknesses; environmental opportunities and threats; and
managerial values (Andrews, 1971; Martín-Alcázar et al., 2005). In contrast, the
universal laws of strategy exist to some extent in all settings (Delery & Doty, 1996;
Martín-Alcázar et al., 2005; Rozell & Terpstra, 1993). An example of this view is the
Boston Consulting Group’s “universally observable view” which implies that there is
4
only one grand type of setting and one universally sound competitive strategy (Hambrick
& Lei, 1985). Balancing these extreme views, contingency theory states that the
appropriateness of different strategies depends on the competitive settings of businesses.
It differs from the universal view by stressing that "it all depends." The situationalists
view differ from contingency in many ways. For example, it is difficult to generalize the
findings mostly because of case study approach whereas in contingency research the
findings can be generalized. Similarly, the prediction of the future behavior of the
organizations choices are difficult in situationalists approach while the contingency
research makes it possible to predict the future (Hambrick, 2003). The difference of
situation-specific view from contingency based view is also based on the fact that there
are classes of settings for which strategic generalizations can be made. Contingency
theory requires having a basis on which to divide competitive settings into discrete
classes. For this purpose, contingency variables are identified to categorize the firms into
discrete classes. Many researchers such as Hofer (1975), Mintzberg (1979), Porter
(1980), Donaldson (2001), Daft (2015) etc. identified some key contingent factors like
strategy, firm size, industry, technology, country etc. According to Hambrick & Lei
(1985), organizational and strategy scholars can make their greatest contributions through
the contingency view by dividing competitive settings into discrete classes.
The popularity of contingency based research can be attributed to a fundamental
assumption that there is no one best way to organize a fit that is equally effective under
all conditions. The reason of extending this assumption to the strategy context or
paradigm is based on the fact that it is rooted in the concept of matching organizational
resources with the corresponding environmental circumstances. In this approach, the
relationship between two variables is predicted by the third variable (Ginsberg &
Venkatraman 1985; Pleshko et al. 2014; Donaldson 2001). In line with these
perspectives, studies that focus on the contingent relationship between an independent or
contextual variable (for example strategic orientation, firm size, and industry etc.) and a
dependent variable (for example performance) across different contexts are considered as
legitimate contingency based research.
5
Contingency variables such as strategy, structure, firm size, industry etc significantly
influence the strategic stance and performance. For example, changes in firm size
influence the firm performance and exhibits different characteristics of organizational
design. As organizational size changes, complexities in roles, organizational structure and
behavior changes. Similarly, the fundamental differences between the two industries
seem to concern buyer dispersion, needs and knowledgeability, and demand uncertainty.
Such variations give rise to a significant differences in strategic thinking of the
management. The peculiarities of industry limit the managerial influence significantly as
it restricts the management to design and implement strategy proactively for higher
performance (Wilden et al. 2013; Hambrick & David Lei 1985; Madanoglu et al. 2014;
Ven et al. 2013; Jennings et al. 2003).
The contribution of strategic group analysis is noteworthy in highlighting the nature of
strategy-performance relationship. Strategic groups’ analyses help in identifying the
clusters of businesses, within most industries, that seek to execute similar business
strategies. Each strategic group contains the number of firms that peruse a similar
strategy so that they can benefit from the competitive advantage (DeSarbo, Grewal, &
Wang, 2009; Lin, Tsai, & Wu, 2014). Strategic groups provide empirical evidence of the
presence of a number of patterns of strategic behavior of the firms. Such analysis
provides a useful intermediate frame of reference between seeing each firm separately
and seeing the industry as a whole. Comparing the outcomes of groups’ differences and
similarities in a given industry helps to clarify the strategic features associated with the
performance of an organization (Zamani et al. 2013). For identification of strategic
groups and for investigating their relationship with performance, strategic typologies are
generally operationalized.
Strategic typologies helps in identify multiple competitive strategic choices available to
the organizations or business units and provide the theoretical foundation for
identification of groups across industries. Strategic management studies provide several
strategic typologies in this regard. These typologies are conceptually driven interrelated
sets of ideal categories meeting three criteria: (1) they contain quantifiable and clearly
defined construct, (2) they articulate the construct relationships, and (3) the assumptions
6
of the typology are testable (Doty & Glick, 1994). This means that a typology provides
multiple causal relationships in a given environment. Based on its conceptual and
methodological soundness, a typology reduces the complexity of classification and causal
relationships to a manageable level (Fiss & Peer, 2011).
Numerous typologies are developed to categorize the business-level strategy. The major
contribution comes from: strategic types of Miles and Snow (1978) known as
“Prospectors, Analyzers, Defenders, and Reactors”; generic strategies of Porter (1980) as
“Cost Leadership, Differentiation, and Focus”; high-performance gestalts of Miller
(1990) termed as “Craftsman, Builder, Pioneer, and Salesman”; and strategic types of
Treacy & Wiersema (1995) named as “Operational Excellence, Product Leadership, and
Customer Intimacy”. Theoretical foundations and practical approach of these typologies
have stimulated a widespread research in strategic management.
The contribution Miles and Snow’s typology is specifically appropriate for a context in
which strategy-performance relationship of firms from multi-industry settings is
investigated. The typology has been validated through a numerous tests in a wide range
of research settings (Hambrick 2003) making it suitable to study with both perceive
information and for archival financial data for analysis. Some examples of research using
this typology are how the strategy types differ: in their administrative practice
(environment scanning, power and influence process, organizational structure, and
reward settings); in their functional profiles and policies (vertical integration, R&D
intensity, fixed assets configuration, sales force management practices, and advertising);
and in their performance under various environmental conditions etc (Blackmore &
Nesbitt, 2013; Hambrick, 2003).
Miles and Snow (1978) offered two important elements for competitive advantage of
organizations. First element is a general model of the process of adaptation specifying the
major decisions needed by an organization regarding the entrepreneurial, engineering,
and administrative problems to maintain an effective alignment with its environment. The
second and most popular component of the framework is the strategic typology
portraying diverse pattern of adaptive conduct or behavior used by organizations within a
7
given industry or other group of industries. Accordingly, the choices and decisions of the
top management are the critical determinants of organizational structure and process.
These choices, which are complex in nature, are classified into three broad problems of
organizational adaptation. The entrepreneurial problem highlights the selection and
adjustment of the product-market domain. The issues relating to the engineering problem
include the problems regarding production and delivery of the products and services. The
administrative problems refer to the establishment of managerial roles, their inter-
relationships and the organizational processes to achieve the effectiveness. The typology
presented four distinct strategic types that an organization opts during its course of
business. Businesses that adapt defender strategy follow functional structure and they
prosper through the focus on stability and efficiency. On the other hand, prospectors
flourish by stimulating new product and market opportunities following divisional
structure. Analyzers flourish by adapting a matrix structure and by creating a balance
strategy. Analyzers are more innovative in their product-market initiative than defenders.
Their innovative approach is more cautious and selective than Prospectors. Reactors
depend on the environmental forces in their approaches and hence do not prosper at all
(Miles & Snow. 1978).
Hambrick (1983), termed Miles and Snow framework as the "configurational view" of
strategic choice which focuses on how management creates a fit between organizational
characteristics with its environment and how they match each other requirements.
Subsequent studies used this work to build the Strategy-Structure-Performance paradigm
that made this framework as "arguably the most important sub-stream of research on
structural contingency theory”. The paradigm focuses on the importance of the linkage
between strategic types and organizational performance rather than seeing strategy and
structure in isolation for the importance of their impact on performance. the theoretical
basis for the paradigm is that the performance of an organization is likely to be higher
when its strategy and structure are compatible with each other. The performance will be
lower if there is no such matching or compatibility (Wasserman, 2008). Hence, the
framework of Miles and Snow has been integrated into contingency research in
8
organizational theory and it has been extended by the configurrists to other organizational
processes as well (Hambrick 2003).
There is a great support for Miles and Snow typology’s basic assumption that “viable
strategies perform equally well in the long-run”. However, there are reasonable instances
where this assumption was violated (Blackmore & Nesbitt, 2013; Hambrick, 1983;
Parnell et al., 2015; Parnell & Wright, 1993; Smith et al., 1989; Zamani et al., 2013). One
of the many reasons for the significant differences in the performance among viable
strategic types is the varying nature and scope of performance measures. The difference
in environmental context is another reason in this regard. For instance, Hambrick (1983)
found that defenders performed better than prospectors when their performance was
compared in terms of profitability while in terms of market share, prospectors performed
better than defenders. In other studies, for example, prospectors showed higher
performance in terms of sales growth while analyzers provided higher return on assets
(ROA). Similarly, prospectors outperformed all other strategic types (Parnell & Wright,
1993; Zamani et al., 2013). Regarding environmental context, the inconsistencies and
differences in performance was also found when the performance comparisons were
made across the countries (Parnell et al., 2015). Comparing the performance of viable
strategies with that of reactor, it was also found that viable strategies performed
negatively although, they outperformed reactors. For example, the performance of
prospectors was negative in China while the performance of analyzers was recorded
negative in USA and Turkey (Parnell et al., 2012; Parnell et al., 2015). Reactors generally
performed poorly which support the main assumption of Miles and Snow typology but
reactors also performed better than viable strategies in some studies. For example, in
highly regulated industry reactors outperformed viable strategies (Snow & Hrebiniak,
1980). Blackmore & Nesbitt (2013) also found that reactors performed better in one of
the performance measure (ROA) over viable strategies. These findings supports the
assessment of Zahra & Pearce (1990) that “the preassumed inferiority of reactor strategy
to others is questionable”. Similarly, Conant et al. (1990) also argued that reactors have
the potential to perform better if they improve their strategic practices step by step. By
doing so, they can sufficiently sustain and exploit environmental conditions. The findings
9
of the studies also show that there is no consistency in the impact of contingencies as the
influence of contingent factors on strategy-performance relationship is inconclusive.
A number of researchers have commented on Miles and Snow’s work that there is a need
for further refinements in methodology, particularly the process for identification of
reactor strategy (Amitabh & Gupta, 2010; Conant et al., 1990; Desarbo, Benedetto et al.,
2005; Sarac, Ertan, & Yucel, 2014; Shortell & Zajac, 1990; Smith et al., 1989; Thomas &
Ramaswamy, 1996; Ven et al., 2013; Zahra & Pearce II, 1990). These researchers have
suggested for validation and empirical testing of the underlying assumptions of Miles and
Snow typology across industries and in different contexts specifically in countries other
than developed countries.
Following gaps are identified based on the detailed investigation of the previous research
on Miles and Snow typology:
Most of the empirical research using Miles and Snow typology is cross-sectional
using information collected through questionnaire or interviews which measure
the intended or perceived strategy. Few researchers have used archived data to
measure realized strategy and within this even lesser number used the financial
data for identification of strategic types.
The contemporary debate that does strategic purity matters or firms should
combine/hybridize the pure strategies to have competitive advantage is under
researched.
Very few attempts were made to investigate the transition of strategic orientation
over the time to find out the strategic behavior of the firms. To fill this gap, it is
important to know that in rapidly changing environment whether the firms with
consistency in strategic choice brings better results or firms should follow a
flexible strategy.
Generally, the operationalization of reactor strategy is neglected specifically in
longitudinal studies. Therefore, there is a need to develop a mechanism for
identification of this residual strategy.
10
There is a dearth of studies where a comparative analysis of single-industry and
multi-industry is done in one setting.
1.2. The Pakistan’s Business Context
Local, social, and cultural contexts shapes the behavior of the management. The
contextual environments in developing countries have different dynamics. There are
environmental complexities because these environments lack predictability and have
limited resources for development. From a strategic point of view, long-term planning is
generally compromised because of the turbulent and unpredictable business environment.
Therefore, the concepts and theories developed, practiced, and promoted in advanced
countries face intense difficulties and restrictions when they are perused in developing
nations. In this context, the attentiveness of business and management research in
developing and emerging countries represents significant gap in literature. This gap is
visible in both theoretical and empirical studies. This phenomenon, therefore, is even
more pertinent to the developing as well as the emerging economies of the Asian
countries (such as China, India, and Pakistan) those are at the verge of competitive
business pressures from MNCs and global integration of resources. The management in
these countries are faced with unique set of challenges because of differences in the
business contexts, developments and understanding of theories, and the management
practices. These challenges are significantly different from those faced by the developed
world where they have stable economic and institutional structure. (Janjua & Sobia,
2010; Parnell et al., 2015; Zamani et al., 2013)
Pakistan is occupying a strategic geographical location in South Asia. Its neighboring
countries include India, China, Iran, and Afghanistan. Pakistan falls in low income
country list having per capita income equal to US $ 1,629 in 2017. In GDP of Pakistan,
agriculture sector has been the largest contributor since its inception. This is now
replaced by the rising contribution of manufacturing and service sector showing a shifting
trend toward more modern and developed economic infrastructure. Being ranked at
number 6 in the world in terms of population, Because of its strategic location, large
potential consumer market, and cheap labor, Pakistan can be an attractive and lucrative
11
place for international investors. According to SBP, Foreign Direct Investment (FDI) in
Pakistan rose to US $ 2767.6 million at the end of June, 2018 (SBP, 2018). Pakistan
offers a promising investment and growth opportunity for international community
because its young educated generation is entering into job market, particularly in the
information and telecommunication sector. However, the drivers for change in the
external environment such as the law & order situation, global & national economic
situation, R&D and innovation etc. are expected to affect the business organizations in
the region. Similarly, the internal change drivers such as quality in production design and
service delivery are seen as the promising opportunity for business growth in future
(Government of Pakistan, 2017; Janjua & Sobia, 2010).
Historically, economic growth in Pakistan has remained volatile. Although, it lacks a
steady growth pattern that adds uncertainty to the economic development conditions, it is
widely acknowledged that Pakistan has immense economic potential. However, in recent
times, a smooth upward trend in economic growth rate has been witnessed since 2013-14.
Since then, the growth in Real GDP, which was above 4 percent in 2013-14, has steadily
increased and reached to the level of 5.28 percent in 2016-17. This growth rate is the
highest in 10 years. Pakistan is expected to become the world’s 20th largest economy by
the end of 2030 and 16th largest by the year 2050 according to a report published by
PricewaterhouseCoopers in 2017. Other reputed international publications, for example,
Bloomberg and Economist, have also acknowledged the impressive economic growth in
Pakistan in the last few years (Government of Pakistan, 2017b).
China-Pakistan Economic Corridor (CPEC) project is expected to change the business
dynamics of Pakistan as it will enhance the geographical linkages through improved road,
rail and air transportation system, people-to-people contact, academic and cultural
understanding, trade and businesses, energy production, and regional integration and
harmony (Government of Pakistan, 2017a). CPEC project promises a future of economic
connectivity and regional cooperation having far reaching positive implications: by
cultivating a more systematic, up-graded and need-based interaction for socio-economic,
industrial, energy and trade development (Rizvi, 2015); by building a strong,
interconnected, and integrated nation where all segments of population benefit equally
12
from stability and growth (Hussain, 2016); and by providing an economic support to a
long-time ally with strategic hedge and facilitating trade (Ritzinger, 2015). The
interaction of Chinese engineers, technicians and labor with their counterpart Pakistanis
will enhance the skills of the local workforce. This will also impact the strategic practices
and management of local business in the backdrop of international competition.
On the other hand, in the “ease of doing business ranking” index, Pakistan is at 144th
number among 190 economies. On the basis of certain key parameters, this index ranks
the economies or countries against each other. These parameters are: the level of
conduciveness of regulatory environment to business operations; and level of protections
of property rights. Countries with top twenty ranking (1 to 20) have friendlier and simpler
regulatory environments for businesses with strong property rights protection. Pakistan is
behind India (ranked 130), Egypt (122), Indonesia (91), China (78), and Turkey (69) in
this ranking whereas Bangladesh is ranked below at 176 (World Bank, 2017). The major
obstacles for business in Pakistan are non-availability of electricity, political instability,
and tax administration (World Bank, 2013). Similarly, Pakistan falls in the lowest band of
innovation as its innovation index is 91/125. The interest of businessmen is being shifted
away from entrepreneurial activities because of increasing cost of doing business (Haque,
et al., 2007). According to them, the absence of innovation and the non-dynamism of
business are the two major problems for lacking entrepreneurial activities. The reasons
for lack of innovation include the inheritance of family business in majority cases and the
imitation of business models. Similarly, the mindset of the businessmen is to remain
local. Particularly, small businesses rarely attempt to move even across the cities or local
boundaries. Hence, internationalization conglomerates are seldom phenomenon.
Businessmen in Pakistan need to invest in brand management and brand development to
give a significant boost to entrepreneurial activities. According to Haque (2007), the
causes for the poor business atmosphere are:
Lack of Expert Skills and Research
o Business in Pakistan generally resist the development of professional
management because they are largely owner-operated
13
o Rather than depending on professional management, the growth in
business is traditionally dependent on policy favors
Poor Legal Framework
o Because of weaknesses in legal and judicial systems, mistrust of
professional managers and misuse of business information harms the
professional growth of the businesses
o There is lack of faith and confidence because of the incompetence of the
legal system for enforcement of even the fundamental business rights of
property and contracts
The other obstacles for business growth in Pakistan include the lack of trust and social
capital, and financing constraints etc.
The large corporations in Pakistan are less than 10% in terms of number of business
enterprises which is dominated by SMEs (more than 90%). But the contribution of large
corporations towards GDP and exports is more than 60%. Large industries and business
have advantage of accessing funds from financial markets over small enterprises (SMEs).
Similarly, large corporations have the advantage of having good management and
technical skills, large assets base, distributed ownership, relevant and appropriate
knowledge base, focus corporate governance, international financial support in case of
MNCs, and backing of the Government particularly in case of public sector enterprises
(BYCO Petrolium, 2015).
On cultural dimensions, Pakistan scores high on “high power distance”, “low
individualism”, “high masculinity”, “high uncertainty avoidance”, and “no long-term
horizon” (Hofstede, 2017; Shah & Amjad, 2011). When we link these cultural
dimensions of Pakistan with the management concepts and practices, it is found that in
such circumstances, people take care of group problems and show loyalty with long-term
group commitment. Employer/employee relationships and hiring and promotion decision
are perceived in moral terms. People in such situations resist innovation having pessimist
attitude. For continuous motivation, they consider security as an important element.
14
1.3 Strategic Management in Pakistan
For any business to be effective and sustainable, the choice of strategy is considered to be
the most fundamental ingredient. The creation of market perception for product and
service value, market and customer focus, and competitive advantage requires the
selection of an appropriate and suitable business strategy. The studies on strategy-
performance relationships in Pakistani firms are not very large. However, there are many
studies in which this relationship is investigated directly or through moderation and
mediation of some contingent variables. These studies investigated many aspects of
strategic management such as strategic orientations, strategy formulation and
implementation, marketing strategies, strategic management concepts and practices,
strategic change behavior, capital structure, working capital policies and their
relationships with organizational performance.
Hassan et al., (2013) investigated the direct impact of marketing strategy creativity and
marketing strategy implementation effectiveness on organizational performance and
checked the mediating and moderating relationship of strategy and environmental
uncertainty. Miles and Snow’s strategic types (prospectors, analyzers, differentiated
defenders, low cost defenders and reactors) were operationalized through survey
instrument from service and manufacturing companies in Pakistan. Applying Miles and
Snow typology, Khan et al. (2016) analyzed the effect of strategy formulation and
strategy content on organizational performance for firms in private sector where only
defending, prospecting and reacting strategic types were considered for analysis. Afza &
Ahmed (2017) examined the capital structure and performance relationship for non-
financial firms using 8 years archived data taking business strategy as a moderating
variable. Michael Porter’s strategic types: cost leadership, product differentiation, hybrid
strategy (combination of cost leadership and product differentiation), and stuck in the
middle (no strategy) were operationalized through financial measures. Afzal (2009) also
applied Porter’s generic strategies: low cost leadership, differentiation, and product
market scope to investigate strategy-performance relationship where marketing practices
are taken as moderating variable.
15
Besides application of strategic typologies, some other studies also studied the strategic
management concepts in Pakistan. For example, Afza et al. (2008) investigated the
relationship between strategic diversification and firm performance. Nazir & Afza (2009)
analyzed the relationship of working capital management policies (aggressive versus
conservative approaches) and firm performance. Malik & Kotabe (2009) studied the
relationship of dynamic capability development mechanism (“organizational learning,
reverse engineering, and manufacturing flexibility“) with organizational performance for
emerging market manufacturing firms in India and Pakistan.
Keeping in view the above facts, the challenges for strategic managers and policy makers
are manifold in Pakistan. The key characteristics of Pakistani business environment
include the rich natural resources and cultural heritage, young growing population,
turbulent business environment, geostrategic and geopolitical importance, uncertain and
unstable environment etc. Hence, it is expected that the organizational performance,
strategic choices, and the behavior of the strategic orientation of the firms for Miles and
Snow typology assumptions may not be similar as are found in developed countries.
1.4 Motivation of the Study
One of the central question in strategy-performance relationship research is why firms
succeed or fail in a given environment? To find out the causes of success or failure of the
firms such questions are investigated further: how firms choose strategy and how they
behave over the time to create a fit? Why firms differ in their strategic fit and in
structure? Why firms differ in performance? These questions provide the motivation for
an extensive investigation of listed firms of Pakistan Strategy-performance context. The
research purpose include: firstly, to extend the scope of prior research within the strategic
management field by investigating strategy-performance relationship keeping in view the
contingent factors of firm size and industry. Here, strategy is conceptualized in terms of
pure and hybrid strategies. Similarly, the identification of strategic behavior over the time
is missing in strategy-performance relationship research. This research fills this gap by
measuring the strategic transition and find out the consistent, flexible, and reactor
behavior over the time and then investigating the strategy-performance relationship;
16
secondly, the research uses the archived financial data of listed companies in Pakistan
which is very rarely used for measuring strategic orientation of the firms. The objective
here is to reach a better understanding of management’s strategic approaches and
behaviors so that a proper structure and resource fit can be created for better
performance; thirdly, the research analyses the multi-industry data and single industry
(textile industry) for comparing the similarities and differences between the results so that
the findings can be generalized; and fourthly, there are methodological limitations for
classification of strategic types and strategic behavior when archived financial data is
used. This research does the refinements in methodology by presenting step-by-step
procedure for operationalization and classification of strategic types and behavior.
The context of the research is Pakistan which is a low per capita income country
depending historically on agricultural sector. The trend is now changing and the
dependence has been shifting towards manufacturing and service sectors. The factors
such as law and order situations, global economic competition and challenges, R&D and
innovation pressures, quality in production design, service delivery, and infrastructure are
affecting the business competition and practices in the country. In terms of “ease of doing
business” index, Pakistan is ranked at a lower number, because of lack of expertise and
skills and poor legal framework. CPEC is also changing the business environment and
state of competition in Pakistan.
Keeping in view this background, all listed firms on Pakistan Stock Exchange (PSE) are
selected for this study because: first, they represent the whole economy comprising the 12
economic groups as classified by the State Bank of Pakistan; secondly, they represent
both public and private sector; thirdly, the large corporations in Pakistan contribute more
than 60% towards the GDP and exports; fourthly, the personal interests of the researcher
is to study strategy through financial data that reflect the realized strategy of the
management to provide the foundation for researcher in the field of strategic
management.
17
1.5 Problem Statement
The increasing emphasis of firms for hybridization or combination of pure strategies to
have sustainable competitive advantage has raised the question whether strategic
hybridization gives superior performance than strategic purity? Similarly, there is an
inconclusive debate in contemporary literature about the superiority of strategic
consistency over strategic flexibility and vice versa. Even though, the strategic typologies
are widely used for investigating strategy-performance relationship, there are
methodological limitations to operationalize the strategic orientation and strategic
behavior of the firms into pure versus hybrid strategic types and consistent versus flexible
and reactors behavior respectively. To address these issues, a renewed emphasis is,
therefore, needed for typology-driven classification of strategic orientation and behavior
coupled with methodological refinements to investigate the relationship of strategy and
performance along with contingent impact of size of the firm and the industry in which a
firm operates. Drawing upon the perspective of contingency theory of strategy, the aim of
this research is to address these issues.
1.6 Objectives of the Study
To make refinements in methodology that will help in identification of strategic types
through archived data to categorize the strategic types into pure, hybrid, consistent,
flexible, and inconsistent (reactors) types and then to empirically test the relationship of
these strategic types with organizational performance. The impact of contingent factors
such as firm size and industry is also investigated. Following are the specific objectives
of the study:
1. To develop a scoring methodology using archived financial data to operationalize
the strategic orientation. The method will help in classifying the firms in strategic
groups following pure, hybrid, consistent, flexible, and reactors.
2. To investigate the differences in performance among strategic groups/types across
firm sizes and industries
3. To investigate the relationships of:
a. Pure, hybrid, and reactor strategy with performance
18
b. Consistent, flexible, and reactor strategy with performance
c. Firm size and Industry with performance
d. Contingent (interactive) effect of firm size and industry on strategy and
organizational performance
4. To have an in depth study of one industry and compare the similarities and
differences in results with multi-industry analysis
1.7 The Research Questions
Based on the problem statement and the research objectives, the study investigated the
following research questions:
1. What is the strategic orientation and strategic behavior of listed firms in Pakistan?
Specifically, to know:
a. Whether firms pursuing pure strategies or hybrid strategies?
b. Is there consistency in their strategic stance over the time or they adapt
flexibility or have inconsistent behavior?
2. Does there exists a significant difference in the performance based on their
strategic groups/types or strategic behavior of the firms? Specifically;
a. Is the performance of viable strategies similar or differ significantly?
b. Dose there exist a significant difference between the performance of viable
strategies and reactors?
c. Is hybrid strategy superior to pure strategy?
d. Is consistency in strategy performs better than flexibility?
3. Is the effect of contingent factors (firm size and industry) on organizational
strategy and performance is significant?
4. Does the results from single industry analysis are similar or different from multi-
industry analysis? Can the findings are generalizable or not?
1.8 Research Methodology
The data of 307 joint stock firms representing 12 industries (economic groups), listed at
Pakistan Stock Exchange -PSE (Formerly Karachi Stock Exchange –KSE) for seven
19
years (2007-2013) is used for analysis. The data source is the publication of Central Bank
(State Bank of Pakistan) “Financial Statement Analysis of Companies (Non-Financial)
Listed at Karachi Stock Exchange”. Strategy is considered as independent variable,
organizational financial performance as dependent variable while firm size and industry
are taken as contingent variables. Descriptive Statistics, ANOVA, and Regression
techniques are applied to analyze the data and to interpret the results. SAS (9.3) software
is used for data management and analysis.
1.9 Contribution of the Study
The proposed scoring methodology will help the researchers in identification of
multiple strategic groups based on varying characteristics of the firms. A standard
scale is developed for classification of pure and hybrid strategic types on a
continuum. Secondly, a mechanism is developed for identification of strategic
behavior of the firms over the time to classify the firms into consistent, flexible,
and inconsistent (reactors) types. In this context, this study is the pioneering work
in a longitudinal research. The empirical findings validate the theoretical
underpinning associated with these strategic groups. The methodology can be
replicated where strategic groups are to be operationalized through typologies.
The original work of Miles and Snow suggests four mutually exclusive and static
strategic types. In actual, the firms hybridize the pure strategies by combining the
characteristics of pure strategies. Also, when viewed through the lenses of
strategic fit, they are better presented as the changing behavior over the time. This
means that an organization reconfigures its processes and deploys resources in
reply to changes in its internal and external environment. Doing so, the
organization reposition itself into one of the viable strategic types. The
investigation of strategic transition over time and their classification into
consistent, flexible, and specifically reactors is another contribution of the study.
The study presents a detailed comparative analysis of single-industry and multi-
industries in the same settings. The applicability of the methodology in both
settings and the conformity of most of the results provide sufficient evidence to
generalize the findings.
20
1.10 Structure of the Thesis
This study is organized into six chapters. The second chapter presents a theoretical
review of literature. This include the historical development of strategic management
field, the concept of strategy and its various dimensions, strategic groups and typologies,
pure and hybrid strategies, strategic consistency and flexibility, Miles and Snow strategic
typology, contingency theory, strategy and organizational performance with special
relevance to Miles and Snow typology and contingency theory. In the third chapter, the
empirical literature review where Miles and Snow typology is applied for strategy-
performance relationships. The chapter provides the updated information about the
research settings, strategy and performance relationships, methodologies used for
analysis, and distribution pattern of strategic types. Hypotheses are also developed in this
chapter. The fourth chapter covers the research design, strategy and performance
measures, variables of interest, detail description of scoring method, research model and
estimation methodology. The fifth chapter presents the results, analysis and discussions
while sixth and last chapter represents conclusion including implications of the study and
the opportunities for the future research. The industry-wise firms’ strategic orientation
and strategic behavior over the time, the results of textile industry, and the list of
publications is given in the annexures.

21
Chapter 2
Theoretical Literature Review
22
2.1 Introduction
The chapter presents the theoretical foundation and the scope of the topic. It starts
with a brief on historical development of strategic management field. The concept of
strategy in its various forms (intended and realized; pure and hybrid; consistent and
flexible) and strategic levels in organization (corporate strategy, business strategy, and
functional strategy) is discussed next. The contemporary debate on strategic purity
versus strategic hybridization and strategic consistency versus strategic flexibility is
highlighted in subsequent sections. Next, the idea of strategic groups and strategic
typologies in general and the typology of Miles and Snow in particular is presented in
greater length followed by the literature on contingency theory. A review of literature
regarding the strategy-performance relationship with special focus on Miles and Snow
typology and the perspective of contingency theory concludes the chapter.
The literature presented in this chapter is important because it discusses the broader
domain of the thesis and then narrowed down the concept to the main focus that is
related to the strategy-performance relationship in the background of contingency
theory. Here the concept of strategy is narrowed to the realized strategy
operationalized using Miles and Snow typology. Performance is referred to the
financial measures and the contingent factors are identified as firm size and industry.
Hence, the chapter provides the foundation to the next chapter: empirical literature
review which focused on the core domain of the thesis.
2.2 Strategic Management –A Historical Perspective
Strategic management has been a multidisciplinary area of research. The theories and
concepts are borrowed from other disciplines such as: psychology, economics,
philosophy, sociology, political science, and systems science etc. The developments
in the concepts and theories of strategic management includes the industrial
organizational view, resource-based and knowledge-based views of the firm,
competitive and behavioral strategy, competitive dynamics, global strategy,
innovation and technology strategy, institutional and nonmarket strategies,
stakeholder theory, strategic leadership and change, and strategy processes etc.
(Durand, Grant, & Madsen, 2017).
23
The evolution in the field of strategic management has been impressive. There has
been an inspiring growth in this field particularly in the variety of topics and the
diversity of methods employed for research in a relatively small duration of time.
Furrer & Thomas (2008) and Hoskisson et al. (1999) did a systematic review of the
evolution of strategic management field. According to them, the development in
strategic management is divided into three periods: (1) the founders or the precursors;
(2) the birth in the 1960s; and (3) the transition towards a research orientation in the
1970s and afterwards. The precursors (the writers of the era before 1960s) explored
and suggested the definition and the role of management along with the possibilities
for strategic choice. For example, Taylor (1947) initiated the concept of a “science of
work”; Barnard (1938) studied the “roles of managers”; Simon (1947) analyzed the
administration and developed a framework for that; and Selznick (1957), introduced
the idea of “distinctive competence” etc. According to Koch (2011), the roots of the
strategy go back to Alfred Salon’s reorganization of General Motors in 1921 while
Peter Drucker in his book “Concept of the Corporation” published in 1944 suggested
that goal setting and organization design or structure are the key features of the most
successful companies. Drucker was the first person to propose that creating and
satisfying the customer needs is the basic purpose of a business.
The pace of development of strategic management field grew to powerful adolescence
in 1960s. In 1960, the article “Marketing Myopia” published in HBR by Theodore
Levitt was one of the first attempts to look at corporate strategy. The developments
during this period can be attributed to the three ground-breaking works by Alfred
Chandler’s “Strategy and Structure” (1962), Igor Ansoff’s “Corporate Strategy”
(1965), and Kenneth Andrews’s books “Business Policy: Text and Cases” (1965) and
“The Concept of Corporate Strategy” (1971). According to Chandler (1962), structure
follows strategy and therefore, organizations should develop their strategies before
designing organizational structure. He defined strategy as the “setting of long term
goals and objectives, the determination of courses of action, and the allocation of
resources to achieve the objectives”. Ansoff’s (1965) work presumes that
maximization of profitability is the ultimate purpose of an organization. His
framework provides a number of checklists and charts for developing objectives,
evaluating synergy between firms’ business and functions, assessing the
organization’s competency profile, deciding how to diversify and expand the
24
businesses, product-market position, and resource allocation etc. Kenneth Andrews
presented one of the most applied models of strategy, one component of which is
SWOT analysis. Based on SWOT analysis, strategy is chosen with particular
emphasis on the fit between external opportunities and firms’ own competences
(internal strengths). The organizational structure is then modified to facilitate the
implementation of the strategy.
Another important development was the foundation of Boston Consulting Group
(BCG) in 1963 by Bruce Henderson. BCG developed two very widely used strategic
management tools: an experience curve and Growth-Share matrix. The focus of the
research shifted from a “deterministic -one-best-way approach” to a more contingency
based perspective where firms adapt themselves to their environments effectively.
The orientation of these studies was towards managerial aspects with an emphasis on
normative recommendation rather than on analysis and pragmatism. The research in
these developments was dominantly based on “in-depth case studies” where the
results of such studies were hardly generalizable (Furrer & Thomas, 2008; Hoskisson
et al., 1999; Koch, 2011).
In response to generalizability issue because of case study research, a shift towards
research orientation focus started in 1970s. During this time period a dichotomous
development took place between two sets of research perspectives. One was
ontological (philosophy concerned with the nature of being) and the other was
epistemological (philosophy concerned with the knowledge of being) perspective.
One perspective was a “process approach” consisting descriptive studies explaining
how strategies are formulated and implemented. In this context, the research is based
on the investigation of organization’s actual decision-making. This leads to a more
realistic conceptions of process, in which strategies are arrived at indirectly and, to
some extent, unintentionally. The major contributions during this time, for example,
were “The nature of Managerial Work” by Henry Mintzberg (1973), and Igor
Ansoff’s (1979) “Strategic Management”, “Logical Incrementalism” by Quinn (1980)
and Mintzberg’s (1978, 1985) “Emergent Strategy” (Furrer & Thomas, 2008; Koch,
2011). The other perspective was the research exploring strategy-performance
relationship. Here, departing from case study research, studies were based on large-
scale data and statistical procedure were applied for deductive analysis and
25
hypotheses testing. The theoretical bases were dominated by industrial organization
(IO) view where Porter (1979, 1980, and 1985) has made the most influential
contributions specifically in understanding the structure of an industry in which the
firms are in. Porter argued that the profitability of the organization is influenced by
the structural characteristics of the industry in which the firm is placed besides firm’s
relative competitive position. External environment was assumed to have more impact
on profitability than the internal factors. Hence, the main focus of strategic
management research during this time was on the relationship of external
environment with organizational performance (Furrer & Thomas, 2008; Hoskisson et
al., 1999; Koch, 2011).
From late 1980s, the focus of research on strategy switched from the focus of external
environment of the firms (e.g. industry structure) as a unit of analysis to the internal
resources of the firms such as capabilities, and structure. The field of strategic
management witnessed the attention of two major streams of research attracted during
this time period. These streams are: the concept of “transaction costs economics
(TCE)” by Williamson (1975, 1985) and a well-known “agency theory” by Jensen
and Meckling (1976) and Fama (1980). TCE has three major contributions in this
regard. One, it provided a theoretical foundation to the management of large
organizations that how to adapt a multidivisional structure in their organizational
setup. The view argued for diversification of the firms’ geographical presence and
emphasized the relationship of multidivisional structure with the organizational
performance. Second, TCE concept clarify the working of hybrid forms of
organization such as joint ventures and strategic alliances. Finally, TCE view provide
guidance for choosing global modes of business and how to enter in the global
markets. Agency theory, on the other hand, clarifies that the interests of share-holders
and managers may diverge and suggested for separation of ownership and control.
Agency theory has been applied in strategic management covering diverse topics such
as corporate governance, diversification, and innovation etc. (Furrer & Thomas, 2008;
Hoskisson et al., 1999).
Parallel to these developments, a resource-based view (RBV) rose to the lime lights.
RBV highlights the importance of internal resources, instead of external resources, for
competitive advantage. The emphasis of the RBV is on the relationship of
26
organization’s internal resources, capabilities, and performance. RBV theorizes a firm
as a bundle of unique resources which are valuable, rare, non-imitable, and hard to
substitute. These internal resources are more important than external factors for
competitive advantage. These resources become the strengths and weaknesses of the
firms. Barney (1991) and Grant (1991b) provided other important developments in
strategy theory during this time. The research focus once again shifted to the RBV
theory (Furrer & Thomas, 2008; Hoskisson et al., 1999).
Late 1980s also saw the development of competency based theories of corporate
diversification (Hamel & Prahalad, 1989). In their ground-breaking article “Strategic
Intent”, Gary Hamel and Prahalad argued that proportionately higher commitment and
ambition to change are the hallmark of successful organizations. They further argued
in their article “The Core Competence of the Corporation”, that the real key to
competence was a firms’ distinctive skills, collective learning abilities, and
technologies (Koch, 2011). The other sources of competitive advantage are customer
trust, corporate culture, brand image, management skills, technology, and
information-based invisible assets etc. These resources are durable and time-
consuming to accumulate. They can be simultaneously applied in multiple ways.
These resources effects the productivity in a sense that they are both inputs and
outputs of business activities. The approach of corporate diversification developed by
Prahalad and his colleagues, postulate that value creation through diversification can
be increased by sharing the less tangible assets across businesses. They also
highlighted the potential role of this sharing in creating value through diversification
(Furrer & Thomas, 2008).
Along with these developments, the concept of strategic typologies emerged from
1970’s which opened a new dimension of empirical research in strategic management.
For instance, Miles & Snow (1978) presented four “strategic types” (“Defenders,
Analyzers, Prospectors, and Reactors”), Porter (1980) offered his set of "Generic
Strategies" (“Cost Leadership, Differentiation, and Focus”); Miller (1990) followed
with his “high-performance Gestalts" (“Craftsman, Builder, Pioneer, and Salesman”);
and Treacy & Wiersema’s (1995) three strategic types “Operational Excellence,
Product Leadership, and Customer Intimacy” etc. Specifically, the typology of Miles
and Snow has been applied widely and has gone through the frequent tests of validity
27
in a broad range of backgrounds such as hospitals, colleges, banking, manufacturing,
and life insurance etc from both public and private sectors. The typology has provided
a conceptual framework for examining a host of relationships. For example,
researchers have studied how the strategic types differ in their administrative practices
(including environmental scanning, power and influence processes, organizational
structures, and reward systems); in their functional profiles and policies (for example,
vertical integration, sales force management, marketing and advertising, R&D
intensity, and fixed-asset configurations etc.); and in their effectiveness under diverse
environmental conditions. Researchers who have undertaken these studies come from
different academic fields, including strategy, organizational theory, human resource
management, operations management, marketing, and accounting etc. Clearly, the
typology have had a substantial influence on the research trajectories of several fields
in the administrative sciences (Hambrick, 2003). The typology is considered as uniqe
in a senses as it views the organization as an integrated and complete social system
that interact with the ever changing environment (Daniel Rajaratnam & Chonko,
1995).
The contemporary discussion in strategic management research is about the
superiority of strategic hybridization over strategic purity and vice versa. The initial
concept that pure strategy leads to higher performance is challenged by the
contemporary scholars who argue for the adaption of hybrid form of strategy for
superior performance. The evidence in favour of this shift is increasing with
accelerating pace (Salavou, 2015). Similarly, there is an inconclusive debate in the
contemporary literature regarding the supremacy of strategic consistency over
strategic flexibility and vice versa? The supporters of the strategic consistency argue
that organizations with consistency in their strategic stance over the longer period of
time produce better results (Fehre et al., 2016; Lamberg, Tikkanen, & Nokelainen,
2009; Miles & Snow, 1978; Parnell & Lester, 2003; Porter, 1980; Sanchez, 1995). On
the other hand, it is argued that flexibility in strategic choice is the necessary
condition for improved performance (Herhausen & Morgan, 2014; Ouakouak &
Ammar, 2015; Parnell, 2005).
This overview of historical development of strategic management demonstrates how
research in this area grew remarkably and consistently. According to Furrer &
28
Thomas (2008) and Koch (2011), the sustainability of the growing development in the
field of strategic management without delivering great value was not possible and the
value of strategy has increased, is increasing, and shows no sign of diminishing.
2.3 What is Strategy?
The origin of strategy is the Greek word “strategos” which means the “art of the
general”. Chandler (1962) defined strategy as “the determination of the long-term
goals and objectives and the adoption of courses of actions and allocation of resources
necessary for carrying out these goals”. Ansoff (1965) viewed strategy as the decision
rules and guidelines required by an organization for its profitable growth. According
to Porter & Roach (1996), “strategy is the creation of a unique and valuable position
involving a different set of activities. It is the trade-offs in competing by choosing
what not to do, and involves creating a fit among activities of an organization”.
Mintzberg (1978) defined strategy as a pattern in a stream of decisions (Mintzberg,
1978). According to Waterman et al (1980), strategy means the actions that a
company plans in response to or in an anticipation of changes in its external
environment, its competitors, and its customers. It is the way a company intends to
improve its position. The position can be achieved through competitive advantage by
following, for example, a low-cost production or delivery mechanism, by achieving
sales and service dominance, and by providing better value to the customers etc. It is
an organization’s way of saying: Here is how we will create unique value.
The concept of strategy was introduced in the academics by faculty of Harvard
Business School during the 1950s. Their view of strategy is normative in a sense that
strategy is an imaginative act of integrating number of complex decisions. Chandler's
(1962) was the first person who employed descriptive concept for defining strategy.
According to him, strategy is the mechanism used for plotting a new direction. He
argues that there is a substantial impact of strategy on organizational structure and
hence on performance. This idea of strategy comprises the elements of both ends
(goals and objectives) and means (allocation of resources and courses of action).
Mintzberg (1978) has introduced the concept of intended, emergent and realized
strategies. These developments in the concept of strategy enabled the researchers to
think beyond the normative and the abstract aspects of strategy. It enables them to
move toward those decisions which involve organizational ends and means necessary
29
to achieve those ends (Snow & Hambrick, 1980). Mintzberg (1978) summarizes the
developments in the definition of strategy and concludes that such definitions treat
strategy as unambiguous, consciously and purposefully developed, and formulated
earlier for application of particular decisions in future. Mintzberg improved the
conception of strategy by introducing the notion of deliberate and emergent strategy.
Deliberate strategy is related with the effective implementation of the intended
strategy. Emergent strategy originates because of the interaction of the organization’s
internal and external environments. This is different from what was intended by the
managers. The first kind is generally applied to predictable and stable conditions,
while the second one (emergent strategy) emerges from a firm’s quick response to the
uncertainties of the environment.
Focusing on RBV, Lin et al., (2014), postulates that the strategy is a mechanism that
ensures a sustainable competitive advantage. This advantage is achieved by the
development of key capabilities through investing in the resources needed for superior
performance in the long run. But, strategy is successful only if it supports an
organization to develop and possess critical capabilities and resources. The
inseparability of organization and its external environment is the fundamental concern
for strategy thinkers because the organizations use strategy to cope with the change
taking place in the environment. Resultantly, the substantial part of strategy remains
un-programmed, un-structured, and non-repetitive.
Strategy formulation involves both conceptual and analytical exercises. There are
ample support in favor of both views as some authors stress more for analytical
dimension while others affirm that the heart of strategy making is the conceptual work
(Chaffee, 1985). It is, therefore, understandable that strategy scholars should search
and propose numerous configurational schemes that will help to bring order to an
otherwise complex array of business choices (Hambrick, 2003).
2.4 Intended versus Realized Strategy
It is difficult to conclude whether an organization follows a certain type of strategy or
not?. Another issue relating to this difficulty is that a course of action or mechanism
that an organization has formulated but not implemented is actually a strategy? In
contrast to this, is a set of specific pattern being applied for making important
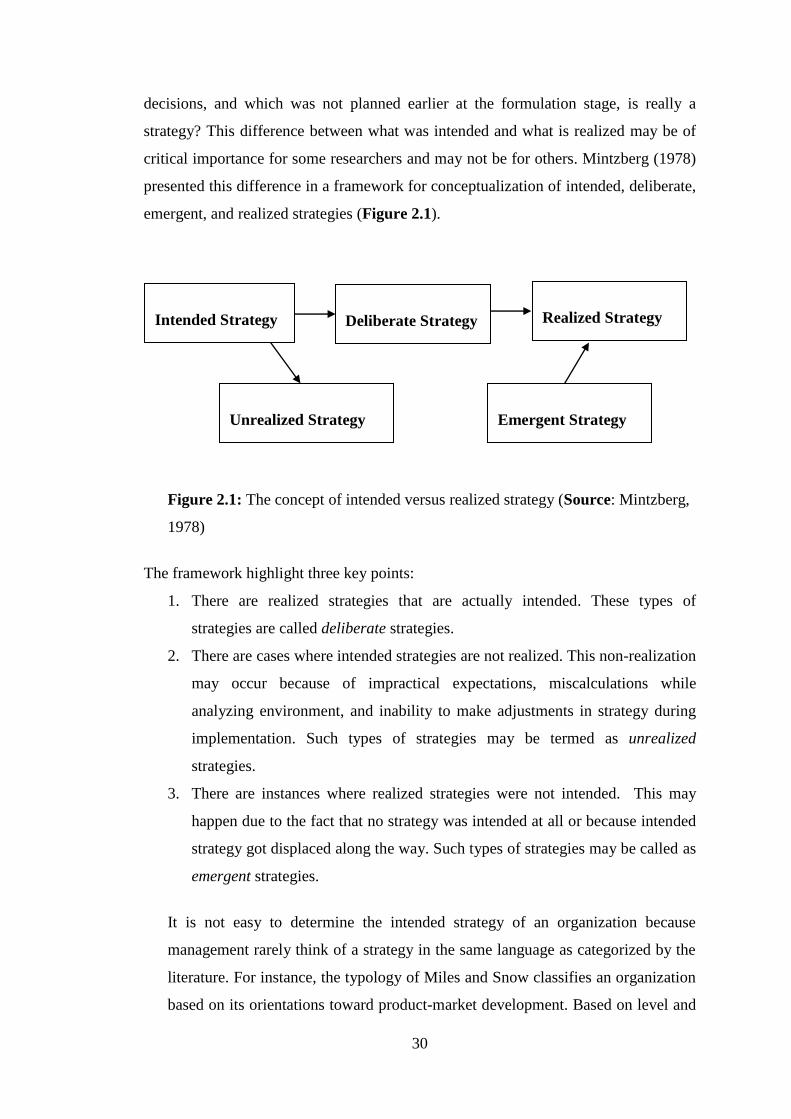
30
decisions, and which was not planned earlier at the formulation stage, is really a
strategy? This difference between what was intended and what is realized may be of
critical importance for some researchers and may not be for others. Mintzberg (1978)
presented this difference in a framework for conceptualization of intended, deliberate,
emergent, and realized strategies (Figure 2.1).
Figure 2.1: The concept of intended versus realized strategy (Source: Mintzberg,
1978)
The framework highlight three key points:
1. There are realized strategies that are actually intended. These types of
strategies are called deliberate strategies.
2. There are cases where intended strategies are not realized. This non-realization
may occur because of impractical expectations, miscalculations while
analyzing environment, and inability to make adjustments in strategy during
implementation. Such types of strategies may be termed as unrealized
strategies.
3. There are instances where realized strategies were not intended. This may
happen due to the fact that no strategy was intended at all or because intended
strategy got displaced along the way. Such types of strategies may be called as
emergent strategies.
It is not easy to determine the intended strategy of an organization because
management rarely think of a strategy in the same language as categorized by the
literature. For instance, the typology of Miles and Snow classifies an organization
based on its orientations toward product-market development. Based on level and
Intended Strategy
Deliberate Strategy
Realized Strategy
Unrealized Strategy
Emergent Strategy
31
intensity of this orientation, an organization is classified into one of the four
strategic types (defenders, analyzers, prospectors, and reactors). Typically,
managers do not consider their organizations as being one of these strategic types.
Instead, management imagines and strive for being first, the best, biggest in size
or market share, lowest in price, and highest quality provider etc. Therefore,
researchers should have a clear understanding whether their purpose is served by
observing realized strategy or by investigating the intended strategies (Snow and
Hambrick, 1980). A strategy (intended or realized) guides the organization's
ongoing alignment with its environment and shapes internal policies and
procedures. This perspective for empirically viewing business-level strategy is
available in the Miles and Snow (1978) typology. The key questions, therefore,
are: How does the industry environment affect the effectiveness of different
strategic types? How do the strategic types differ in their functional tendencies?
(Hambrick, 1983). These questions are still valid and therefore need investigation.
2.5 Strategic Purity versus Strategic Hybridization
The strategy-performance relationship has been critically and widely examined by
applying the strategic typologies of Miles and Snow and Michael Porter. These
typologies classify organizations into one of the distinct strategic types. All
configurational theories (e.g. Miles and Snow) initially identify a finite number of
ideal types. Such type of grouping of strategic types are considered as pure strategies.
Firms those are able to hybridize or make combination of several factors related to
pure strategies (e.g. “low cost and differentiation” or “defenders and prospectors”)
may have competitive advantage. According to Parnell (2011) and Doty & Glick
(1994), hybrid strategies are combination of ideal or pure strategic types depicting a
behaviour that combines or integrate more than one pure strategic choices for
differentiation to achieve efficiency (Pertusa-Ortega, Molina-AzorÃn, & Claver-
Cortes, 2009). Hybridization of ideal types can result either in a finite or an infinite
set of hybrid types. Typically, hybrid types are supposed to be effective when
organizations respond simultaneously to conflicting contingencies (Doty & Glick,
1994).
The traditional view was that superior performance is linked with strategic purity
while deviation core strategy (such as having a “stuck-in the middle” strategy) leads
32
to undesirable performance (Porter, 1980). But, in practice, firms combine the aspects
of pure strategies instead of perusing the pure form of strategies created by theory.
This hybridization of pure strategies reflect reality because through hybridization
firms can adapt many combinations of pure strategies. This phenomenon is
independent of the industry in which a firm falls. Although, there is ample support in
favour of strategic purity, the debate in extant literature is that does strategic purity
still is a better choice for superior performance or not? (Pertusa-Ortega et al., 2010;
Salavou, 2013, 2015; Thornhill & White, 2007). The other terms used for hybrid
strategies in the literature are “mixed”, “integrated”, or “combination of strategies”
etc.
2.6 Strategic Behaviour
Organizational behavior refers to organizational members' work-related activities.
Behavioral perspective postulate that different strategies require different behaviors.
The link between strategy and behavior is useful because it provides a clear
explanation of why behavior should be linked to strategy. There are many examples
of strategic behaviors such as customer-oriented behavior; competitor-oriented
behavior; innovation-oriented behavior; and internal or cost-oriented behavior (Olson,
Slater, & Hult, 2005). Similarly, Strategic groups provide empirical evidence of the
presence of a number of patterns of strategic behavior of the firms. The comparison of
differences and similarities in strategic groups in a given industry, helps to clarify the
strategic features accompanied with performance (Zamani et al. 2013). According to
Slater, Olson, & Finnegan (2011), the success of business strategy is dependent on an
appropriate strategic behavior that helps organizations to create a supportive
organizational culture which is a source of competitive advantage as it enables the
organization to execute its strategy in a more effective and efficient manner.
In this study, we examine strategic behaviors that have the potential to influence
organizational performance. These include consistency-oriented behavior; flexibility-
oriented behavior; and inconsistency or reaction-oriented behavior. The consistent
strategic behavior means that the organizations are stick to the core business strategy
for a longer period of time and exploit the business opportunities with cautious and
incremental growth by maintaining their products, customers, markets, and core
technology intact. The flexibility-oriented strategic behavior focus on broad and
33
continuous growth by aggressively exploring and exploiting the new opportunities for
product and market development (Fehre et al., 2016; Lamberg et al., 2009; Moss et
al., 2014). In the process, firms following this behavior change their strategic
orientation for adjustment to get the benefits of innovation and first movers’
advantages. However, their shift in strategic stance is well thought and infrequent.
The inconsistent or reactor behavior means that such firms do not have any defined
strategy and they react to the changes in the environment in an inconsistent way.
Doing so they cannot reap the benefits of a well thought strategic moves (Ingram,
Kraśnicka, Wronka-pośpiech, Gtod, & Gtod, 2016; Miles & Snow, 1978; Parnell et
al., 2015; Snow & David J. Ketchen, 2014). Consistent and flexible strategic
behaviors are expected to have positive impact on organizational performance while
the inconsistent or reactor behavior is expected to have a negative impact on
performance or have worse performance than the consistent and flexible behaviors. In
this context, literature on strategic consistency and strategic flexibility is discussed
below while the literature on reactor will be discussed under Miles and Snow
typology (section 2.10.1.4)
2.6.1 Strategic Consistency versus Strategic Flexibility
Strategic consistency is the intentional continuity of the management to stick with the
past strategic choice (Moss et al., 2014). The consistency in strategic choice becomes
the constituent element (Fehre et al., 2016). Strategic consistency is the firm’s actions
that necessitate adaptation in response to changes in the business environment and
ensuring continuity to the history of the firms. In a dynamic environment, maintaining
strategic consistency means adjustment in strategic stance in response to the most
efficient change in competitive actions to accommodate new and intentionally
identified strategic direction and goals. While in stable environment this would
usually mean constant and unwavering competitive behaviour over time (Lamberg et
al., 2009). This helps managers in selecting a strategic course of action for a longer
duration of time. Doing so, the organizations develop expertise, enjoy the benefits of
specialization, portray a clear customer image, and foster a culture of learning
organization. Consistency in strategic approach provides an opportunity to deal with
imperfect information in a rapidly changing environment. Consistency ensures the
accumulation of competitive advantages because of the activities that support each
34
other rather than cancelling them out. Strategic consistency makes it easier to
communicate to employees, shareholders, and customers. Because of single-
mindedness, it improves implementation as well (Porter & Roach, 1996).
Organizational value resides in the development of consistent stakeholders
relationship by developing routines, specialization, and core capabilities (Miles et al.,
1978; Porter, 1980). Past research shows a positive relationship strategic consistency
with organizational performance (Fehre et al., 2015; Lamberg et al., 2009).
However, in a fast changing environment with a dynamic and competitive nature of
businesses, a long-term orientation toward strategic consistency may be less
rewarding since current business environments demands adaptability, flexibility, and
speed. Flexibility in strategic choices leads to improved performance due to the firms’
ability to make adjustments in direction and speed of strategic activities (Anikeeff &
Sriram, 1995; Lamberg et al., 2009; Moss et al., 2014). An organization adapts
flexibility to avoid being outdated and unresponsiveness to the demands of new
products, technology, or market approaches (Parnell, 2005).
Strategic flexibility is an organization's ability to respond or react quickly to the
changing competitive circumstances (Herhausen & Morgan, 2014). It makes an
organization capable to respond effectively in a dynamic, complex, an unpredictable
circumstances (Sanchez, 1995). Flexibility in strategy is the capacity of a firm that
enable it to change, adjust, and exploit opportunities resulted from environmental and
evolutional changes (Ouakouak & Ammar, 2015). Flexibility enables an organization
to redeploy its resources so that it can cope with the barriers to exit in weakening
industries (Harrigan, 1980). Strategic flexibility enables an organization to manage
economic and political risks. This is done by responding quickly (in a proactive or
reactive manner) to market opportunities and threats that makes it possible to resort to
"surprise management." With a diverse collection of strategic choices, strategic
flexibility enables firms to manage effectively in the uncertain and "fast-occurring"
markets (Tansuhaj & Grewal and Patriya, 2001). The crucial antecedents of strategic
flexibility include technological orientation, strategic planning, and inter-functional
cooperation (Herhausen & Morgan, 2014). According to Sanchez (1995), the concept
of strategic flexibility is divided into resource flexibility and coordination flexibility.
Resource flexibility refers to the ability of a firm in adjusting and responding for
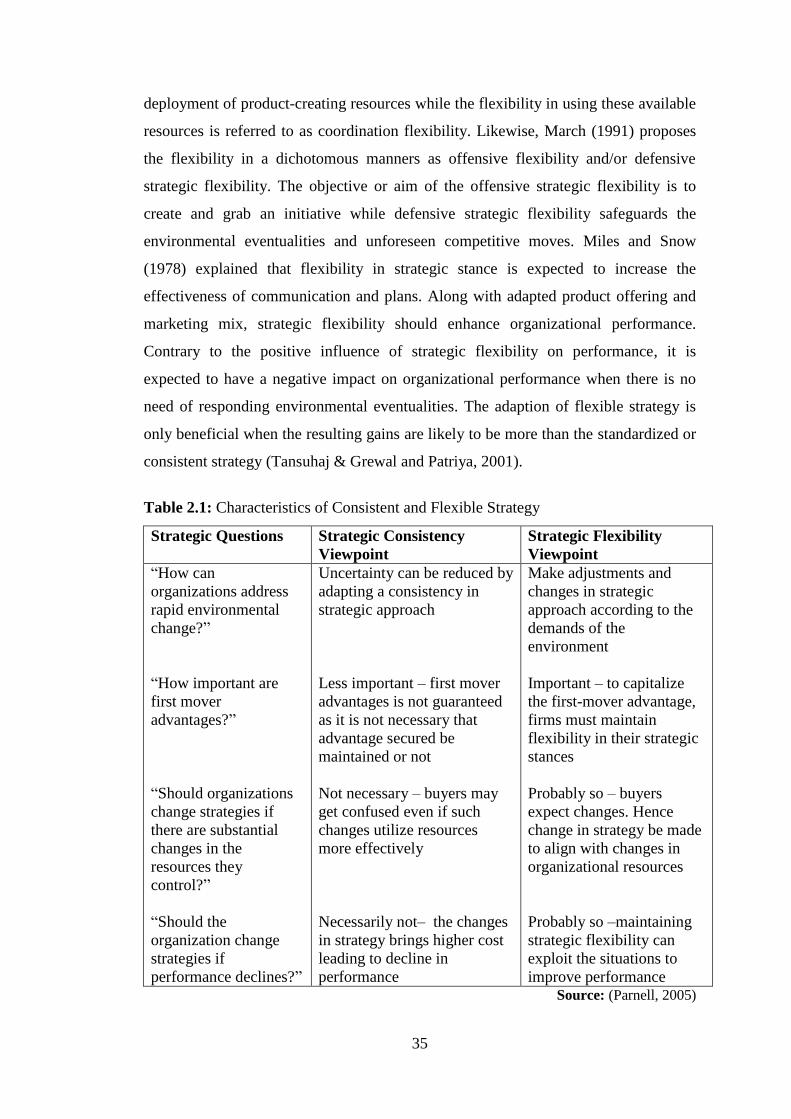
35
deployment of product-creating resources while the flexibility in using these available
resources is referred to as coordination flexibility. Likewise, March (1991) proposes
the flexibility in a dichotomous manners as offensive flexibility and/or defensive
strategic flexibility. The objective or aim of the offensive strategic flexibility is to
create and grab an initiative while defensive strategic flexibility safeguards the
environmental eventualities and unforeseen competitive moves. Miles and Snow
(1978) explained that flexibility in strategic stance is expected to increase the
effectiveness of communication and plans. Along with adapted product offering and
marketing mix, strategic flexibility should enhance organizational performance.
Contrary to the positive influence of strategic flexibility on performance, it is
expected to have a negative impact on organizational performance when there is no
need of responding environmental eventualities. The adaption of flexible strategy is
only beneficial when the resulting gains are likely to be more than the standardized or
consistent strategy (Tansuhaj & Grewal and Patriya, 2001).
Table 2.1: Characteristics of Consistent and Flexible Strategy
Strategic Questions Strategic Consistency
Viewpoint
Strategic Flexibility
Viewpoint
“How can
organizations address
rapid environmental
change?”
“How important are
first mover
advantages?”
“Should organizations
change strategies if
there are substantial
changes in the
resources they
control?”
“Should the
organization change
strategies if
performance declines?”
Uncertainty can be reduced by
adapting a consistency in
strategic approach
Less important – first mover
advantages is not guaranteed
as it is not necessary that
advantage secured be
maintained or not
Not necessary – buyers may
get confused even if such
changes utilize resources
more effectively
Necessarily not– the changes
in strategy brings higher cost
leading to decline in
performance
Make adjustments and
changes in strategic
approach according to the
demands of the
environment
Important – to capitalize
the first-mover advantage,
firms must maintain
flexibility in their strategic
stances
Probably so – buyers
expect changes. Hence
change in strategy be made
to align with changes in
organizational resources
Probably so –maintaining
strategic flexibility can
exploit the situations to
improve performance Source: (Parnell, 2005)
36
In real situations, strategic change is incremental as the firms are stuck to a successful
and predictable courses of action. Since, the environments are dynamics, the end
results are not always predictable. Therefore, a reasonably sound argument can be
established for most organizations to be flexible even when performance is not an
issue (Tansuhaj & Grewal and Patriya, 2001). Similarly, managers are pushed to
endorse flexibility and renewal in strategic stance to increase profitability when
organizations perform poorly by opting traditional strategies. On the other hand,
industry experts stress the managers to return to their core strategy when strategic
flexibility fail to produce the desired results. Based on the above discussion, it is easy
to be agreed with both stances as there is convincing and appealing arguments having
empirical and intuitive backing in favour of both strategic options (Parnell, 2005).
Parnell (2005) listed the broad strategic questions and response perspective in terms
of strategic consistency and flexibility (Table 2.1).
2.7 Strategy Levels
Strategic management deals with three levels of strategy. Corporate-level strategy
answers the question “In what industry or industries will we compete?” Business-
level strategy answers the question “How will we compete in each of our chosen
businesses?” The task of functional-level strategy is figuring out “How will each of
the organization’s functional areas support our business and corporate level
strategies?” To get the maximum out of the available resources, appropriate strategies
are designed and selected for three organizational levels: “corporate-level”, “business-
level”, and “functional-level”. Once a strategy is selected, it must be implemented.
Formulation without implementation is incomplete and once it is implemented, it
must be evaluated. And if it is not up to the required results, it must be modified or
even changed. The strategy levels are depicted in figure 2.2.
2.7.1 Corporate-Level Strategy
Andrews (1971), defined corporate strategy as "the pattern of major objectives,
purposes, or goals and essential policies and plans for achieving those goals stated in
such a way as to define what business the company is in or is to be in and the kind of
company it is or is to be". Corporate-level strategy is concerned primarily with
answering the question of what set of businesses should we be in. Corporate-level
37
strategy of an organization deals with the distribution of firm assets, employment,
capital-budget, and selection of market or industry. Most firms (generally with local
presence) have simple corporate-level strategies as they compete in only one industry.
The large firms with cross-boundaries presence e.g. Fortune 500 firms, typically
participate in several industries (Beard & Dess, 1981). Corporate strategy relates to
the choice of what products to produce and in which market to operate. Besides
product/market selection, corporate strategy deals with the goals and objectives of the
firm, the markets and the environment in which it will exist (Hatten, Schendel, &
Cooper, 1978).
Research on corporate-level strategy started mainly after the path-breaking work of
Alfred Chandler (1962) and others notably Richard Rumelt (1974). Chandler
presented the historic review of major U.S. corporations, tracing their archetypal
evolution of a firm from single product-market to vertically integrated organization to
a multi-business firm in scope. He argued that how these shifts in strategy influenced
the changes in structure. The examples of changes in structure refereed to the changes
from the functional form of structure to the divisional form. Rumelt extended
Chandler's ideas, primarily by developing a more refined system for classifying
diversification strategies. Basing his categories on the firm's overall degree of
diversification and the "relatedness" (in terms of product-market similarities) of the
firm's array of businesses, he categorizes the term corporate-strategy as single
business, dominant-vertical, related-constrained, related-linked, and unrelated. The
simple and compelling classification systems developed by Chandler and Rumelt
facilitated the researchers to investigate corporate-level strategy. The major job at
corporate level is to evaluate the relative attractiveness of businesses in the portfolio
of an organization (Hambrick, 2003).
2.7.2 Business-Level Strategy
Business strategy deals with competition within the same industry in which the firm is
doing business. It is defined in terms of variation in the relevant characteristics of the
firm in comparison to the competing firms’ success or failure in a given industry.
Hofer and Schendel (1978) provided a concise definition: “At the business level,
strategy focuses on how to compete in a particular industry or product-market
38
segment”. Competitive advantage and distinct competencies are generally the most
important components of business strategy (Beard & Dess, 1981). Porter called this as
the competitive strategy and characterized it as the relative positional or competitive
advantage of an organization that leads to outperform its competitors (Porter 1985).
Each organization applies a specific competitive strategy because its selection is
effected by the market structure and the economic environment (Bayraktar,
Hancerliogullari, Cetinguc, & Calisir, 2017). According to Kim & Mauborgne (2009),
the ultimate test of corporate strategy is whether it creates value for shareholders or
not. At corporate level strategy development, managers always begin with
environment scanning or analysis to find out opportunities and threats along with
assessing the internal strengths and weaknesses. With these external and internal
analyses findings, business strategy is developed to create a distinctive strategic
position where they can perform better than their competitors by building a
competitive advantage. To have a competitive advantage, an organization tries to
differentiate itself from others. This differentiation is based on differences in services,
price, and quality.
The main contribution in business strategy is based on typological research by
Michael Porter (1978); Miles and Snow (1978); Danny Miller (1990); March (1991);
and Treacy and Wiersema (1995). The theoretical insights of these authors stimulated
a large stream of subsequent research in the academic fields of strategic management,
organizational theory and behavior, HRM and organizational performance,
operational management, marketing and accounting etc (Bentley, Omer, & Sharp,
2013; Hambrick, 2003). According to Hambrick (2003), Miles and Snow bestowed
researchers interested in business-level strategy with their famous typology. They
helped to manifest the concept of strategic “equi-finality –the idea that there is more
than one way to prosper” within a particular industry or environment. They argue that
there are a number of patterns or groupings that organizations can choose in order to
achieve their goals and objectives. According to (Ketchen, 2003), the way Miles and
Snow examined business-level strategy is their greatest contribution.
The organization aligns its value chain according to the focus tailored at corporate and
business level strategies. This value chain is created by formulating and implementing
the strategies for manufacturing, marketing, and human resource management. On the
39
basis of these strategies, financial strategies are developed for making financing and
investing decisions.
2.7.3 Functional-Level Strategy
Functional-level strategy is the goal-directed decisions and actions of the organization
at its functional units. These decisions are usually for the short term, generally based
on yearly business plans. Each functional unit of the organization has a strategy for
achieving its own mission for helping the organization reach its overall vision.
Typical functional units include: production/operations or manufacturing; R&D,
marketing; HRMD (Human Resource Management and Development); financial
/accounting; and management information systems etc. These functional units are
different for different types of organizations. For example, universities have different
functional units than a manufacturing or an engineering firm. Functional-level
strategy utilizes unique resources, capabilities, competencies, and work activities that
are the source of organization’s business /competitive strategies. Functional strategies
support the business strategies (Coulter, 1998).
It is important to strategically manage the basic functional strategies to achieve
competitive advantage for organizations. Otherwise, the resources, capabilities, and
core competencies found in various organizations’ functions won’t be effectively
developed into any sustainable competitive advantage. The strategies must be
implemented once the strategic choices are made in each of the functional areas.
Strategy implementation involves five aspects: processes; budget; structure; and
culture. While strategy implementation at this level involves the specific use of these
aspects, it also involves the coordination of the functional units. The evaluation of
functional strategy involves specific performance measures for each of the functional
areas.
Functional strategy should be coordinated with business level and corporate level
strategies to get the required results, because choices made at business and corporate
levels do affect and are influenced by the implementation of functional strategies.
Since functional strategies play an important role in executing the vision, mission, and
goals of the organizations, it is necessary that this must be coordinated with other
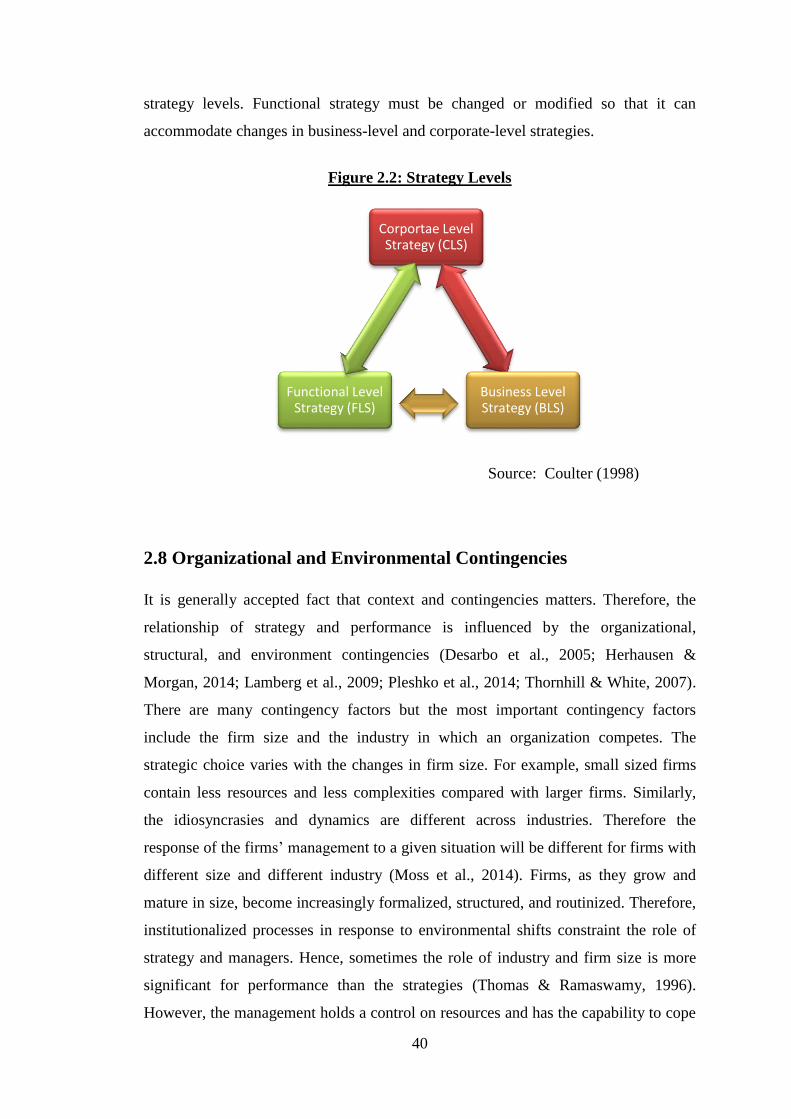
40
strategy levels. Functional strategy must be changed or modified so that it can
accommodate changes in business-level and corporate-level strategies.
Figure 2.2: Strategy Levels
Source: Coulter (1998)
2.8 Organizational and Environmental Contingencies
It is generally accepted fact that context and contingencies matters. Therefore, the
relationship of strategy and performance is influenced by the organizational,
structural, and environment contingencies (Desarbo et al., 2005; Herhausen &
Morgan, 2014; Lamberg et al., 2009; Pleshko et al., 2014; Thornhill & White, 2007).
There are many contingency factors but the most important contingency factors
include the firm size and the industry in which an organization competes. The
strategic choice varies with the changes in firm size. For example, small sized firms
contain less resources and less complexities compared with larger firms. Similarly,
the idiosyncrasies and dynamics are different across industries. Therefore the
response of the firms’ management to a given situation will be different for firms with
different size and different industry (Moss et al., 2014). Firms, as they grow and
mature in size, become increasingly formalized, structured, and routinized. Therefore,
institutionalized processes in response to environmental shifts constraint the role of
strategy and managers. Hence, sometimes the role of industry and firm size is more
significant for performance than the strategies (Thomas & Ramaswamy, 1996).
However, the management holds a control on resources and has the capability to cope
Corportae Level Strategy (CLS)
Business Level Strategy (BLS)
Functional Level Strategy (FLS)
41
with the environmental changes. This enables them to select an appropriate course of
action despite the limitation imposed by the contingencies. Also, the performance of
an organization is closely related with the performance of its industry which is
affected by number of components including cost of input, level of pricing, and
diversification of products etc.
Mintzberg (1979) names a number of important contingency factors such as age of the
firm, firm size, technical system, regulation, complexity, stability, diversity of the
environment, and firm ownership etc. He considered size, technology and
environment as the most influential contingency factors (Matyusz, 2012). Similarly,
Porter (1980) identified three crucial contingency variables: degree of industry
concentration, stage of product life cycle, and exposure to international competition
(Hambrick & Lei, 1985). Organizational strategy is also considered as an important
contingent factor because strategy concerns patterns of behavior used by firms in
adjusting to their context, with implications for the practices organizations adopt in
order to deal with competitive challenges (Lucianetti, 2018; Miles and Snow, 1978;
Snow and Hrebiniak, 1980). Delery & Doty (1996) and Matyusz (2012) considered
industry as an important contingent variable that need to be included while conducting
multi-industry analysis. Based on these arguments, we considered firm size and
industry as the two internal and external contingent factors besides strategy.
2.9 Strategic Groups and Typologies
Strategic groups emerge within most industries based on some common
characteristics. To create a competitive advantage, groups are formed on the basis of
organizations following a similar strategic choice (Lin et al., 2014). The analysis at
strategic group level contributes towards the understanding of strategy-performance
relationships. Within groups and across groups analyses helps to clarify the nature and
characteristics of strategic groups that contribute towards higher performance in a
given industry. The extensive research on strategic groups started in 1970s. The focus
of the research has been to know what types of groups exist in a given industry or set
of industries, what are the characteristics of distinct groups, how they influence the
performance of an organization, and what are the implications for such groupings
(Short, Jr., Palmer, & Hult, 2007). Earlier research on strategic groups focused only
on the implication for organizational performance. Later on, the dimensions of the
42
research has been extended to more broad topics such as to examine behavioral
distinctions of the firms, investigating how membership in a group explains
competitive position, how firms behave strategically, and what are the competitive
patterns (Parnell, 2011; Zamani, et all., 2013).
In literature, there are generally three streams of research on strategic group: the
presence of strategic groups; characteristics of strategic groups; and the linkages of
strategic groups with firm performance. For the first stream, there are many empirical
studies providing support that strategic groups exist. These studies are carried out in
varying nature of industries. These include brewing industry, pharmaceuticals,
computer equipment, banking sector, and insurance companies etc. The second stream
of research focuses on the dynamics and changing behavior of strategic group
membership and stability over time. The third wave of research examines strategy-
performance linkages to find out the similarities and differences in performance
among strategic groups. Subsequently, research is extended to investigate the effect of
contingent factors such as firm size and industry on the performance of strategic
groups (Murthi, Rasheed, & Goll, 2013).
Typologies are classification schemes that provide a mechanism for ordering,
comparing, and clustering the organizations into categorical types. Strategic
typologies provide frameworks for grouping organizations, make available the
description about the complexities of groups, and explain the results. Conceptually
driven, typologies are set of interrelated ideal strategic types that meet three criteria.
First, the strategic types or groups contain clearly defined constructs or paradigms that
can be quantified. Second, the relationships among the strategic types or clusters are
expressed in detail. Third, propositions, predictions, or assumptions accompanying
with the typology are testable and subject to rejection (Doty & Glick, 1994).
Typologies are one of the most commendable contributions in management. They
helps not only in organizing complex set of causal relationships but also provide key
tool to the theorist to reduce complexity existed in multiple causal relationships
(Delbridge & Fiss, 2013). A typology is worth value if its strategic types are
comprehensive and mutually exclusive. This means that the strategic types can be
measured in a valid and reliable manner. Also, the typology provides a clearly
articulated theoretical foundation while explaining the ideal strategic types. Ideally, a
43
typology should represent heterogeneity among strategic groups. This heterogeneity
should exist with respect to their capabilities, effectiveness, and their resulting
performance (Snow and Ketchen, 2014).
The literature on strategic management provides number of typologies for studying
business strategy. These typologies define how organizations compete and flourish in
their market environments. The most famous and applied work on strategic groups
and typologies is done by Chandler (1962), Rumelt (1974), Miles and Snow (1978),
Porter (1980), Danny Miller (1990), Treacy and Wiersema (1995) etc. Some other
examples of typologies in the realm of strategic management are: “strategic context”
by (Mintzberg, 1978); “views on strategy” by (Hamel & Prahalad, 1994); and
“strategic decision making types” by (Ansoff, 1965) etc. Among these, the most
influential typologies are presented in (Table 2.2). These typologies have had the
profound effect on the subsequent research on strategic management and related
fields. However, the typologies of Porter and Miles and Snow are the most widely
applied.
Porter (1980) proposed three types of generic strategies (“Cost Leadership;
Differentiation; and Focus”). Firms compete on the basis of the characteristics
attached to each strategic type for competitive advantage. Choosing the cost
leadership strategy, a firm intends to lead the market by offering low cost products in
its industry. Differentiation strategy is opted by an organization to be distinct in its
industry on the basis of key features such as product quality, design, brand name, and
improved service etc. In focus strategy, a firm creates a market niche and select either
the differentiation or a cost leadership strategy. This typology advocates for exploring
the proper fit between the strategic types and characteristics of an industry
environment which is composed of the forces that drive industry competition.
Although the typology of Porter is widely used, it has some limitations. For example,
relatively little explanation is provided regarding the structure of organization,
processes and programs that are necessary requirements for effective implementation
of each strategy. Such limitations provide little room for explanation if one, for
example, wants to explain the kinds of strategic actions undertaken by a firm while
deploying certain resources and capabilities (Walker & Ruekert, 1987).
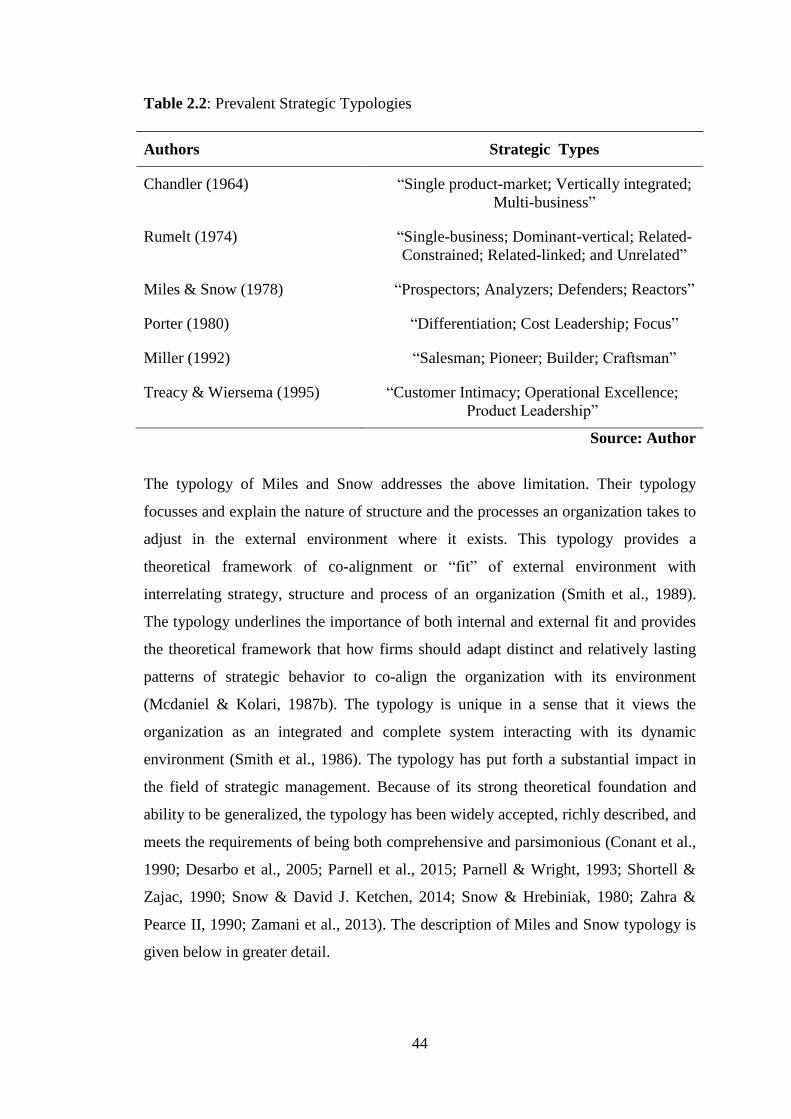
44
Table 2.2: Prevalent Strategic Typologies
Authors Strategic Types
Chandler (1964) “Single product-market; Vertically integrated;
Multi-business”
Rumelt (1974) “Single-business; Dominant-vertical; Related-
Constrained; Related-linked; and Unrelated”
Miles & Snow (1978) “Prospectors; Analyzers; Defenders; Reactors”
Porter (1980) “Differentiation; Cost Leadership; Focus”
Miller (1992) “Salesman; Pioneer; Builder; Craftsman”
Treacy & Wiersema (1995) “Customer Intimacy; Operational Excellence;
Product Leadership”
Source: Author
The typology of Miles and Snow addresses the above limitation. Their typology
focusses and explain the nature of structure and the processes an organization takes to
adjust in the external environment where it exists. This typology provides a
theoretical framework of co-alignment or “fit” of external environment with
interrelating strategy, structure and process of an organization (Smith et al., 1989).
The typology underlines the importance of both internal and external fit and provides
the theoretical framework that how firms should adapt distinct and relatively lasting
patterns of strategic behavior to co-align the organization with its environment
(Mcdaniel & Kolari, 1987b). The typology is unique in a sense that it views the
organization as an integrated and complete system interacting with its dynamic
environment (Smith et al., 1986). The typology has put forth a substantial impact in
the field of strategic management. Because of its strong theoretical foundation and
ability to be generalized, the typology has been widely accepted, richly described, and
meets the requirements of being both comprehensive and parsimonious (Conant et al.,
1990; Desarbo et al., 2005; Parnell et al., 2015; Parnell & Wright, 1993; Shortell &
Zajac, 1990; Snow & David J. Ketchen, 2014; Snow & Hrebiniak, 1980; Zahra &
Pearce II, 1990; Zamani et al., 2013). The description of Miles and Snow typology is
given below in greater detail.
45
2.10 Miles and Snow Typology
By 1978, the research on corporate-level strategy had made notable progress,
primarily due to the path-breaking work of Alfred Chandler (1962) and Rumelt
(1974). Miles and Snow (1978) bestowed a similar gift to researchers interested in
business-level strategy. Prior to their work, two opposing camps dominated scholarly
discourse about business-level strategy, but neither approach was generating much
intellectual or practical progress. On the one side were the "Situationalists," who saw
the design and implementation of business-level strategy as a situational art. No two
strategic settings are the same, and therefore strategies cannot be described in any
general way. Such a philosophy, of course, spelled trouble for scholars who were
interested in generalizability, theory, and prediction, and it was of little use for
managers who wanted to learn from the successes and failures of other firms. On the
other side were the "universalists." Members of this camp believe that there were
universal laws of strategy. For example, market share and superior product quality is
always a good thing etc. While the situationalists abhorred generalization, the
Universalists refused to acknowledge context or contingency. Miles and Snow entered
this conflict, and greatly helped to resolve it, by taking the middle ground (Hambrick,
2003).
Miles and Snow’s (1978) seminal work “Organizational Strategy, Structure, and
Process” has created a great level of interest and debate among scholars in the field of
organizational design and management. The framework of Miles and Snow has two
major components: adaptive cycle and strategic typology. According to Zahra &
Pearce II (1990), an “adaptive cycle” presents a broad functioning of organizational
behavior. The framework of Miles and Snow provides the means of conceptualizing
the major elements of strategic adaptation process. It also guides for visualizing the
relationships among these elements for an effective organization. The adaptive cycle
represents the methods taken by businesses with divergent viewpoints on the
environmental competition to address three fundamental problems relating to
entrepreneurial activities, administrative decisions, and engineering needs. The
solution of the entrepreneurial problems required the understanding and defining the
market-product domain. Engineering problems address the organizations’ technical
systems while administrative problems deals with the issues relating to the structure
46
and processes of organizations. The second part of Miles and Snow framework
identifies the existence of four strategic types known as defenders, analyzers,
prospectors, and reactors within a given industry. The fundamental difference among
these strategic types is the responsiveness in relation to the change in the domain of
an organization. The third premise of the framework is that viable strategic types
(defenders, analyzers and prospectors) can produce better performance if they are
properly understood and properly implemented. The corollary of this premise is that
the viable strategies outperform the non-viable strategy -reactors.
The adaptive cycle of Miles and Snow framework portrays business as continuously
cycling through the sets of decisions on three fronts: how to deal with entrepreneurial
problems, engineering problems, and the administrative problems. For example, if the
management of an organization while making the decisions in the entrepreneurial
domain (defining and selecting the product line for example) represent the
prospecting behavior, the decisions in the engineering and administration domains
will also be prospector-oriented. The cycle of such decision making will move on the
entrepreneurial domain again the cycle will continue. The same process will be for
analyzers and defender strategies. With enough cycles and insight, the strategic
orientation of a given business will be an effective, comprehensively aligned
prospector, analyzer, or defender. And if a business lacks the required insight, and if it
fails to get benefits of the alignment opportunities provided by the adaptive cycle, it
will lose the direction and will become an unrelated, poorly performing reactor. Of
course, the hyper-aligned business will face a major challenge if it needs to change its
strategy. But the adaptive-cycle concepts are even useful for assessing what is
required to change from one strategic profile to another. Miles and Snow’s ideas
provide great practical help to executives who attempt to implement strategies that are
needed to support the new strategic direction (Hambrick, 2003). Their typology
includes description of strategy, structure and process in detail along with the
managerial characteristics as depicted in the management theories. It explains how
strategies are identified through the study of the internally consistent set of attributes
including technology, domain definition, and administration. Hence, the typology has
theoretical foundations and offers a balanced view of the competitive strategies that
an organization opts (Thomas & Ramaswamy, 1996).
47
The typology has been applied widely to investigate a host of causal relationships. For
example, studies have investigated how the strategic orientation differs in selecting
administrative practices such as environmental scanning, organizational structures,
and reward systems etc.; in opting their functional profiles and policies - vertical
integration, R&D intensity, fixed assets configuration, sales force management
practices, and advertising etc.; and in their performance under various environmental
conditions etc. (Hambrick, 2003).
2.10.1 Miles and Snow’s Strategic Types
2.10.1.1 Prospector
Prospectors are innovative companies and they continuously seek to identify and
exploit the opportunities for the development of new products and markets.
Prospector’s budget is marketing oriented with the focus on research and development
(R&D). This innovation oriented focus of prospectors demands the development of
multiple technologies for creating a diverse product mix. The flexibility in adapting
technology allows prospectors to respond quickly to the rapid change. However, there
is a related cost as there is always a risk of not achieving the maximum efficiency in
their production and distribution processes. The effectiveness of prospectors depends
on product and market development. The growth for prospector may not be steady
rather it may occur in spurts. The administration of prospectors is decentralized for
deployment and coordination of resources among organizational units and projects.
Hence their structure is of organic nature which requires marketing experts in the top
management teams, R&D experts, planning broad horizon, low degree of
formalization, decentralized control, and horizontal as well as vertical communication
channels. Prospectors maintain a low degree of mechanization or routinization and
avoid lengthy commitments to a single technological process. They do this by
utilizing the knowledge and skills of their employees (Hambrick, 2003; Miles &
Snow, 1978; Robbins, Stephen P., Barnwell, 2006; Snow & David J. Ketchen, 2014;
Ven et al., 2013).
Strategically, prospectors respond with emphasis on new product development, new
market development, accelerating growth, and promoting existing brands to overcome
financial crunch. Known to be innovators and market leaders, prospectors concentrate
48
on offering the most innovative products or services. In search of new opportunities,
prospectors continuously examine and exploit their product and service related
markets. To improve their marketing management and enhance their R&D
capabilities, prospectors are always willing to invest more in latest technologies and
new markets (Evans & Green, 2000; Habib & Hasan, 2017; Ingram et al., 2016; Lin et
al., 2014; Ostos, Hinderer, & Bravo, 2017). For prospectors, innovation is the key
component of competitive advantage. Typically, prospectors offer a large range of
latest products targeted at a diverse market segments by monitoring a wide range of
environmental conditions. Flexibility in adapting technology is a vital aspect of this
strategy. Consequently, they rarely attain the level of efficiency that is required to
maximize the economies of scale. Prospector firms adopt decentralized structures and
control systems that facilitate change (Thomas & Ramaswamy, 1996). Prospectors
constantly seek new opportunities and stress product development and follow more
sophisticated and formal planning approaches (Koseoglu, Topaloglu, Parnell, &
Lester, 2013; Parnell, 2010; Parnell et al., 2015; Zahra & Pearce II, 1990).
2.10.1.2 Defender
Defenders firms focus on efficiency. They achieve this efficiency with narrow market
focus and through greater emphasis on production and distribution of goods and
services. Rather than pursuing new product and market opportunities, defenders
develop closely related products and services, which minimize their new product
development efforts. In contrast to prospectors’ efforts to “protect” the marketing and
R&D functions, defenders “protect” the finance and production functions. The growth
of defenders is steady, cautious, and incremental through market penetration. To
ensure efficiency, defenders maintain strict centralized organizational control.
Defenders invest heavily with special focus on “single core” cost-efficient technology
and continual improvement leading to high degree of routinization and mechanization
for achieving production, distribution, and technological efficiency. To maintain strict
control, they follow the mechanistic structure. The major characteristics of the
mechanistic organization include a team of production and cost-control specialists in
the top-management, less analysis of the environment for exploring new
opportunities, focused and intensive planning for cost reduction and efficiency
enhancement issues, extensive division of labor with formal structure form,
49
hierarchical communication channels, and centralized control etc. (Hambrick, 2003;
Miles & Snow, 1978; Robbins, Stephen P., Barnwell, 2006; Snow & David J.
Ketchen, 2014; Ven et al., 2013).
Defenders normally nurture growth by deploying their resources on current markets
instead of engaging in new product development. Defenders, in contrast to
prospectors, try to create market niches by improving their efficiency and
effectiveness and by bringing cost down. Their managers are production personnel
and focus on an established and stable market. They strive to effectively implement
formal procedures and standardized technical processes for quality production (Evans
& Green, 2000; Habib & Hasan, 2017; Ingram et al., 2016; Lin et al., 2014; Ostos et
al., 2017). Defenders stress on creation of a stable and narrow domain with a mix of
limited customers and products by making aggressive efforts to protect their domain
from the competitors (Miles and Snow, 1978). Defenders are inflexible in choosing
technology. They strive for cost-efficiency and integrate vertically to control costs.
Their emphasis on efficiency tends to narrow the range of environmental domains.
Formal work cultures and centralized organizational structures are the key attributes
for controlling operating costs. Research and development efforts of defenders are
related to process improvements instead of product development through innovation
(Thomas & Ramaswamy, 1996). Defenders maintain a narrow domain by controlling
secure (often premium) niches in their industries. They stress for efficiency in
operations, following informal planning methods (Koseoglu et al., 2013; Parnell,
2010; Parnell et al., 2015; Zahra & Pearce II, 1990).
2.10.1.3 Analyzers
Analyzers balance out the risks associated with prospectors and defenders strategies.
They take the middle position and enjoy the advantages of both prospectors and
defenders by combining their capabilities. Similar to prospectors, analyzers pay
attention to innovation and simultaneously focus on establishing products, as
defenders do in several stable businesses. Production, marketing, and R&D
capabilities are essential for implementing an analyzer strategy (Lin et al., 2014). The
analyzer strategy places a heavy emphasis on both marketing and engineering aspects.
Analyzers use the mixture of both the stable and entrepreneurial markets (Evans &
Green, 2000; Habib & Hasan, 2017; Ingram et al., 2016; Ostos et al., 2017). The
50
analyzers pursue hybrid strategies that exhibit some features of both prospectors and
defenders (Zahra & Pearce II, 1990). In rapidly evolving environments, analyzers
operate like prospectors while in the stable domains they adapt the defenders’
approach. They adopt dual core technologies that have both stable and flexible
components. Analyzers follow matrix structures which include the benefits of both
functional specialization and centralized control (Koseoglu et al., 2013; Parnell, 2010;
Parnell et al., 2015; Thomas & Ramaswamy, 1996; Zahra & Pearce II, 1990).
2.10.1.4 Reactors
The reactor is the residual strategy. Reactors exhibit an inconsistent and unstable
pattern of adjustment to its environment. They lack a clearly defined pattern of
response mechanism and their response to the changing environment is not
predictable. Reactors do not have long-term goals and have no patterns of decision.
They do not develop any functional capability for achieving competitive advantage.
As a consequence, this type exists in a state of perpetual instability, responding
inappropriately to environmental change and uncertainty. They behave reluctantly to
aggressive situation which leads to poor performance. Unless an organization exists in
a protected and highly regulated environment, they cannot continue to behave as a
reactor indefinitely. Hence, they must move toward one of the consistent and stable
strategies of defender, analyser, or prospector (Miles & Snow, 1978). Managers of
reactors are unable to pursue successful organizational strategies because their plans
are ambiguous and unfocused (Evans & Green, 2000). Reactors occasionally make
adjustments in their strategic stance until they are forced by the environment to react.
They lack effective control mechanisms on both internal and external environments.
Reactors do not possess the necessary capabilities to consistently peruse a strategy for
a longer period of time (Lin et al., 2014) and are viewed as dysfunctional
organizational type following informal planning methods (Ingram et al., 2016;
Koseoglu et al., 2013; Parnell et al., 2015; Zahra & Pearce II, 1990).
Conceptualization of reactor strategy varies in the literature. They are characterized
by extreme lethargic organizations behaviour (organizational inertia) by some
researchers (Conant et al., 1990) lacking a consistent strategic approach and respond
simply to the occasional environmental pressures (Mcdaniel & Kolari, 1987b). But
there is dearth of literature which clarifies the behaviour and time frame showing the
51
inconsistency of reactors in their strategic approach. It is also possible that the
behaviour of reactors may vary during varying time horizons to exhibit the
characteristics of a prospectors, defenders, and analyser. But according to Blackmore
& Nesbitt (2013), the operationalization of reactor strategy is a tough job as it is
difficult to identify the inconsistency in the behaviour of strategic orientation in a
single point in time particularly objective data is used. Hence, reactor strategy is
frequently omitted from studies.
The most insightful and lasting contribution of Miles and Snow lies in their
development of a classification scheme for firms based on the fact how they respond
to the adaptive challenge. Their scheme is based on a view of organizations as
“integrated whole in dynamic interaction with their environments”, in contrast to most
work on strategic and organizational “archetypes” that tend to be grounded in static
analysis of organizational snapshots. Another great contribution lies in how they
examined the organizations at business-level strategy. In this sense, the typology
offers understandings for what type of structure to adopt; what functional strategies to
pursue; how to improve the firm’s position in the industry; and how to make strategic
decisions (Ketchen, 2003). According to Smith, Guthrie, & Chen (1989) the typology
is generalizable across industrial settings in comparison to other typologies.
The characteristics of strategic types of Miles and Snow are common with other
famous typologies. For example, the characteristics of defender strategy are aligned
with “Cost Leadership” strategy of Porter (1980) and March’s “Exploitation”, and
“Operational Excellence” by Treacy & Wiersema (1995). Similarly, prospector
strategy is similar with Porter’s “Product Differentiation”, March’s “Exploration”,
and “Product Leadership” of Treacy & Wiersema (Bentley et al., 2013). Therefore,
the application of Miles and Snow typology does not provide an isolated outcomes,
rather they are widely conceptualized in the literature by the gurus of the subject.
2.11 Contingency Theory
One difficulty in studying business strategy is relating to the fact that the contexts of
the business where an organization operates are seldom identical i.e. they have some
distinct features which distinguish them from one another. To overcome this problem,
there are three approaches which are used to study business strategy. These
52
approaches are: “the situation-specific approach”; “universal approach”; and
“contingency approach”. in situation-specific view, strategy is seen as an purposeful
alignment of internal strengths and weaknesses, environmental opportunities and
threats, and the capabilities and values of management (Andrews, 1971). Supporters
of this view claim that researchers and analysts cannot draw a conclusion about the
strategic stance of a firm unless they comprehend the unique context of that
organization. Studies based on this approach tend to do case studies. There are
empirical evidences where it was demonstrated that strategic generalization is risky
beyond one or two firms (Hatten et al., 1978). Contrary to the situation-specific view,
there exists universal view approach. This approach profess that there are universal
laws of strategy. These universal laws exist and to some extent hold true in all
settings. For example, the Boston Consulting Group’s “universally observable view”
and “The Profit Impact of Market Strategies (PIMS)” program draws popularity to the
concepts implying its universal applicability. For example, BCG matrix is universally
applicable in each settings to each multi-unit (SBUs) organization. Such laws suggest
that there is only one universally accepted sound strategy and only one grand type of
competitive setting (Hambrick & David Lei, 1985). Contingency theories state that
the appropriateness of different strategies depends on the competitive settings of
businesses. Such theories differ from the universal view and state that context matters
by stressing that "it all depends." On the other hand, they differ from the situation-
specific view by arguing that there are categories of backgrounds for which
generalizations for strategic orientations can be made. Organizational and strategy
scholars can make their greatest contributions through the contingency view which
requires to have a basis on which to divide competitive settings into discrete classes
(Hambrick & Lei, 1985; Hofer, 1975).
The idea of contingency theory began in the academic discussion during 1950s and
1960s which was later utilized into organization theory. Contingency approach
challenged the traditional management belief: “finding the one best way to organize”.
Keeping intact the notions of subsystems, contingency theory attracted the attentions
of the management theorists and obtain general acceptance (Donaldson, 1996; Hatch
& Cunliffe, 2006). Contingency theory appears with the core idea "there is no one
best way". Rather firms constitute the organizational designs based on their internal
and external environments to achieve efficiency. This means that an organization will
53
be more efficient when its internal designs and structure meets the demands of
external environment. Contingency theorists assume that the performance of an
organization is dependent on the fit created between organizational characteristics and
internal and external contingencies. These contingencies include organizational
strategy, size, industry, technology and environment etc. (Chandler, 1962; Daft, 2015;
Donaldson, 2001; Madanoglu et al., 2014).
The important contingency factors include firm size and the industry of its business.
For example, smaller firms lack the resources which larger firms have. Similarly, the
peculiarities and dynamics of one industry are different from other industries. As a
firm grows in size and matures in age, it gradually becomes structured, formalized,
and routinized. Similarly, the industry can significantly constrain the managerial
influence the strategic decisions as the dynamics of an industry influence the
organizations to design and implement strategy for achievement of superior
performance in a proactive manner. Consequently, environmental shifts force the
management to reshape the institutionalized processes. Therefore, these contingencies
are important determinants of organizational performance (Hambrick & Lei, 1985;
Jennings et al., 2003; Donaldson, 2001; Moss et al., 2014; Thomas & Ramaswamy,
1996).
Almost all theories of strategy (corporate or business) are contingency-based. The
popularity of contingency theory research is due to its fundamental assumption that
“there is no one best way” to create a fit because there are many ways of organizing to
get organizational effectiveness. The reason of applying contingency theory
assumption to the strategy context is due to the fact that the concept of strategic
choice is embedded in creating the match between organizational resources and its
environment (Andrews, 1971; Chandler, 1962). The contingency approach to strategy
suggests that selection of optimal strategy is based on creating the right fit for a
certain set of organization’s internal and external conditions. The fit is represented by
the existence of an interactive relationship between two variables predicted by a third
variable. In accordance with this paradigm, the studies that focus on the contingent
relationship between an independent or contextual variable (for example strategic
orientation, firm size, and industry etc) and a dependent variable (for example
organizational performance) across different contexts are considered as legitimate
54
contingency based studies (Ginsberg & Venkatraman, 1985; Donaldson, 2001;
Pleshko et al., 2014).
The selection of a strategic choice is an important contingency for many
organizational decisions. These decisions involve the design for organizational
structure, deployment of human, financial, and physical resources, and management
systems. Selection of strategy influencing performance emphasizes the formulation
perspective of strategic management. The implementation perspective of strategy
influence the organizational context (such as structure) or influence performance
through organizational context. Because of interdependent nature of formulation and
implementation, they should be considered jointly within a managerial perspective.
However, strategy generally influence performance directly across different contexts
(Ginsberg & Venkatraman, 1985). Hofer (1983) highlighted the contingency theory
within a system model composed of input, process, and output. The input component
refers to the environmental dimensions. This include environmental uncertainty,
market structure, and product life cycle. The process component represent the
organizational dimensions and is composed of organizational systems and structure.
The output represent the outcomes, results, productivity, and organizational
performance.
Another aspect of contingency approach is that it views organizations as social
system. The continuous coordination within subsystems is achieved through the
implementation of management policies and practices (strategy). The interaction of
the resultant fit of coordination helps in achieving organizational goals and objectives
(Olson et al., 2005). Based on this argument, the performance of an organization is
dependent on the congruence of its elements (internal fit) and its alignment with the
external environment (external fit) (Wilden et al., 2013). Hence, to reach optimal
outcome (organizational performance or effectiveness), an organization should have a
functional (marketing, finance, HRM, R&D etc.) fit with environment, strategy, and
structure (Luoma, 2015). The contingency based research discloses that most of the
studies exhibit a statistically significant relationship between the moderating variable
and strategy/performance measures. It is also recommended that contingency based
research should first examine the contingency relationships within a single industry
55
followed by generalizations across the industries. This will help in advancing the
theory of organizational strategy (Ginsberg & Venkatraman, 1985).
The underlying idea for typologies is that organizations strive for internal consistency
and coherence which produce configurations. The configuration to which an
organization belongs has an impact on many aspects of organizational activity. These
different configurations are systematically related to variations in organizational
characteristics such as size and technology, and to environmental variations such as
uncertainty and complexity. The configuration perspective sees organizations in a
holistic way. Here, organizations are conceived as both a set of subsystems as well as
distinguished from components. These subcomponents are coherently related to each
other represented by an overall pattern called a work system. These configurations are
often named as modes, ideal types, and archetypes etc. Such configurations are
represented by conceptually developed typologies or captured by empirically derived
taxonomies. Contingencies pressurize the development of new legitimized
organizational configurations (archetypes). This configurational concept is aligned
with the contingency theory where the performance of an organization is maximized
by creating a fit and by minimizing the misfit (Amitabh & Gupta 2010; Van de Ven et
al. 2013). Strategic group research mainly through strategic typologies are used to
refine theory and test contingency models emphasizing how to create a fit between
strategy and other environmental and organizational variables (Parnell et al., 2015;
Parnell & Wright, 1993). The framework of Miles and Snow has been integrated into
contingency research in organizational theory and it has been extended by the
configurrists to other organizational processes as well (Farjoun, 2002).
2.12 Business Strategy and Organizational Performance
The assessment of organizational performance has been the subject of extensive and
increasing empirical and conceptual investigation. There are three levels on which the
focus of the analysis in research on performance has been. These levels are: strategic
group level; firm level; and industry level (Short et al., 2007). Luoma (2015)
discussed strategy-performance relationship in detail. He highlighted three important
dimensions of research on performance. These dimensions are: theoretical
dimensions; empirical dimensions; and managerial dimensions. In theoretical
reasoning, better performance is referred as the time tested outcome of a strategy
56
execution. This is a well-established argument. In empirical dimension, researchers
investigated the impact of strategy on performance through the quantitative analysis.
The importance of managerial dimension of performance is apparent from a number
of studies where it was investigated that how managers can improve the performance
of an organization. Luma (2015) identified three more aspects of performance as are
discussed in the literature on strategy. The first aspect of the performance is that it is
treated as the ultimate goal of management. This concept of ultimate goal or an end in
itself is investigated performance of managers or teams, businesses or corporate
performance etc. Second aspect of performance is its measurement perspective to
identify proper performance measures and indicators along with the some sort of
quantifying outcomes for an organization. The third aspect highlights performance as
a question of scope. It integrates all the previous aspects and comprise the totality of
performance.
Organizational performance is concerned with efficiency and effectiveness of the
conversion processes at each level of the organization. Performance is the extent to
which an organization is conditioned by to achieve its objectives. It is the degree to
which an organization is able to control its environment for desired objectives.
Performance is a multidimensional phenomenon that is not easy to comprehend and
measure. The concept of performance is different for different respondents. The
difference in the concept and meaning of any organizational outcome (performance)
is according to whose viewpoint is taken. For example, customers and stockholders
treat performance differently. The meaning of performance is different when the time
period observed is taken into account. The criteria of performance may give different
meanings, and so on. Similarly, there are number of ways to reach at the
organizational effectiveness. To achieve the desired results, an organization may
pursue a different strategy and course of action than its competitors (Snow &
Hrebiniak, 1980).
One difficulty with studying performance is its measurement which is not
straightforward. This difficulty is due to the fact that there is no universally accepted
single measure of organizational performance. For example, stakeholders use
financial performance measures such as revenue, earning per share (EPS), and stock
price as well as non-financial measures such as satisfaction level of customer,
57
employees, employee compensation, and relations with suppliers relative to the
competitors to assess overall performance of an organization. The evaluation of the
firm performance can be either objective or subjective (Bayraktar et al., 2017). There
is a disagreement about the criteria and indicators of performance that is who should
set the criteria of assessment and what characteristics and variables are pertinent to
investigate organizational performance? One of the most frequently offered
explanations for the disagreement is about the differences in the concepts of
performance. For example, the performance indicators such as supervisor appraisals,
self-perceptions, and other similar measures are known as "Soft" performance
measures whereas indicators such as production, sales, gross profit, commissions, and
services rendered are “Hard” measures of performance (Dalton et al., 1980).
Long-term and sustainable higher performance is linked with well thought strategy
(Lin et al., 2014). In strategy-performance relationship research, performance is
generally treated as an aggregate outcome of an organization (Luoma, 2015). The
fundamental domain that strategy addresses is the origin of differences in
performance among close competitors (Durand et al., 2017). In a study of 2,125
strategy articles between 1986-2005, performance was the most prominent used key
word (Furrer & Thomas 2008). Similarly, among 421 articles published in Strategic
Management Journal between 2009 and 2013, 46% dependent variables were relating
to performance dominated by financial performance with 37.5% (Durand et al., 2017).
The organizations use strategy by adapting novel combinations of circumstances to
deal with changing environments for sustained competitive advantage, generally
reflected in organizational performance. Rregarding performance measurement, it is
measured by many indicators. For example, performance in term of growth is
measured through growth in assets, employees, sales, and revenues etc. For
profitability, performance is generally measured by ROA, ROE, ROS, ROCE, and
earnings per share (EPS) etc.
Strategic group research argues that organizations are grouped into similar
competitive approaches that they adapt where some approaches produce better results
than others. This variation in performance may be due to the mobility barriers as the
availability of opportunities is different and is not equally available across industries.
This is because of the fact that potential for profit is better than others in some
58
industry segments. The variation in performance arises may be due to the reason that
an organization occupying one niche market may change its strategic stance or may
be tempted to expand its operations to exploit opportunities available in other
segments of the industry. But shifting to a new market segment or to a different
strategic group can be risky because there can be a substantial investment cost in
developing the required skill set and the products. On the other hand, the perceived
opportunities may not be available for longer period of time and disappear in short
time period. Because of the risk that expected gain will be less than the cost incurred,
organizations are generally stuck to their core stance and opt for not changing their
strategic group. Therefore, strategic groups that occupy rewarding segments of an
industry should outperform those strategic groups which are in less lucrative
segments. Similarly, members of less rewarding groups are hesitant to enter into more
fertile and rewarding strategic groups because of the fear that their decision to this
shift may not produce the desired results (Short et al., 2007).
Organizational performance in a strategy-performance relationship is generally taken
as dependent variable. Both hard or objective and soft or subjective measures of
performance have been used to investigate this relationship. The number and nature of
performance measures varies across studies. In objective measures, organizational
performance is measured in terms of profitability by measures such as ROA, ROI,
CFOI, ROS, ROCE, Annual stock return, Operating Income, and Market share etc.
Here, performance is also measured in term of growth by measures such as Assets
growth, Sales growth, Revenue or earning growth, Profit growth, and Employee
growth etc. On the other hand, in subjective measures, the performance of the
organization is generally determined by the measures such as competitive position,
general profitability, customer satisfaction, service quality etc. In this study, four
objective measures: ROA, ROS, ROE, and ROCE are used for measuring
organizational performance.
2.12.1 Miles and Snow’s Strategic Types and Organizational Performance
Miles and Snow assume that viable strategic types (defenders, analyzers and
prospectors) are expected to give equal performance in a given situation because they
are well articulated strategies and respond consistently to the change occurring in the
59
environment. They also assume that these three viable strategies will outperform
reactors because reactors respond inconsistently and inappropriately to the
environmental uncertainty and change that results in poor performance (Miles &
Snow, 1978). Hambrick (1983) pointed out that original model of Miles and Snow
does not predict that, under what circumstances, which of the strategic types would
give the highest performance. Rather 'performance' was not clearly defined in original
model. Therefore, more research was needed at that time on strategy-performance
relationship. However, subsequent empirical research have generally supported the
assumptions that the three viable strategic types would perform equally well (or
insignificant difference in performance) in the long-run and will outperform reactors
(Conant et al., 1990; Jennings et al., 2003; Parnell, 2010; Snow & Hambrick, 1980;
Woodside & Sullivan, 1999). At the same time, there are evidences where the
difference reported about the performance of viable strategies is significant
(Blackmore & Nesbitt, 2013; Hambrick, 1983; Parnell et al., 2015; Parnell & Wright,
1993; Smith et al., 1986).
2.12.2 Strategy and Performance: A Contingency Theory Perspective
Strategy is the major factor that shapes performance. At corporate level, strategy
guides for role of each part of the business. It determines the nature of the business for
organizations. At business level, strategy guides the managers for the development of
products and services in a way to achieve competitive advantage. Also, strategy is
thought to be the exclusive factor that affects structure for organizational
effectiveness. Weber (1946), Chandler (1962), Rumelt (1974), Miles and Snow
(1978), Portor (1980), and many others made a great contribution to strategy-
structure-performance (SSP) relationship.
In essence, a contingency theory proposes that the performance of an organization is
the result of the fit between the organization’s internal arrangements and its external
context. The performance can be improved by creating the external fit between the
organization’s environmental demands and its internal structural design. Similarly, the
performance can be enhanced by creating a fit among the key internal components of
organizational design that include organizational strategy, systems, structure, and
culture. In other words, the relationship between organizational strategy and
60
performance is moderated by organizational internal and external environments. And,
when a relationship is moderated by a third variable it falls in the domain of
contingency theory (Ostos et al., 2017; Ven et al., 2013).
The most influential research in this regard was pursued by Alfred Chandler (1962).
He observed that, companies often have one single product at the beginning of
operation with centralized decision making by the senior management. They follow
formal structures having low complexity. The structure is divisionalized when
companies evolve to multi products. Complexity increased both in structure and
processes as they are looking for growth and product diversification. Again strategy
plays its role in designing the appropriate structure that leads to the better
performance. Chandler’s argument is well established that organizational structure
follows organizational strategy. This means that strategy brings variation in
organization structure (Robbins et al., 2006) which in returns effect performance of
the organization. Rumelt (1974) examined the performance implications while
extending strategy-structure-performance argument. For example, Rumelt found that
alignment of diversification strategy with divisional structure of an organization
affects performance in a positive way. Specifically, organizations attained the highest
performance that follow controlled diversity as a strategic choice and adopted
divisional structures whereas organizations performed poorly that followed unrelated
diversification strategy.
Seeing differently, Organizations can be distinguished on the basis of their organic
and mechanistic nature of design. These two types of organizations presents the
opposite direction of a continuum. The organizations with organic design continually
adjusts and redefines their tasks. They follow both vertical and horizontal
communication styles and avoid formal role definitions, procedures, and formal rules.
On the other hand the mechanistic organizations (machines) have a bureaucratic style
with highly differentiated, clear (and rigid) definitions of roles, strong hierarchies
following vertical communication style and control. The mechanistic organization
performs well under conditions of certainty while organic firms perform better in high
levels of uncertainty. This means that there is no one optimum type of organization
and management which is the underlying concept of contingency theory (Ven et al.,
2013).
61
Miles and Snow typology is built on Chandler's foundations. The typology proposes
different organizational structure for each strategic type. Organizations adapting
defender strategies follow functional structures. On the other hand prospectors’ type
organizations follow divisional structures. Analyzer is the balancing strategy. They
use matrix structures to balance the functional and divisional form of structures. In
this sense, Miles and Snow launched the "configurational view" of strategy
(Hambrick 2003). The focus of configurational view is on creating fit of
organizational characteristics to complement each other. This strategy-structure-
performance paradigm holds that when the strategy and organizational structure are
congruent, the performance of that organization is likely to be higher than the
conditions where they do not match with each other (Wasserman, 2008). The
defenders are expected to maintain an environment where stable form of
organizations can flourish. They produce a limited set of products catering for the
needs of narrow market segment. Working aggressively on cost reduction and high
quality product development with a focus on single core technology are the hallmark
characteristics of defender strategy. To maintain strict control, they follow the
mechanistic structure. The major characteristics of the mechanistic organization
include a team of production and cost-control specialists in the top-management, less
analysis of the environment for exploring new opportunities, focused and intensive
planning for cost reduction and efficiency enhancement issues, extensive division of
labor with formal structure form, hierarchical communication channels, and
centralized control etc.
In contrast, the key point of prospector strategy is innovation and attempt. Prospectors
emphasize on new opportunities with large scale investigation through R&D, superior
product idea and product development. They are risk takers and not scared of
uncertainty. Rather, they can meet the demands of progressing society and settle
themselves in dynamic environment. The administration of prospectors is
decentralized for deployment and coordination of resources among organizational
units and projects. Hence their structure is of organic nature which requires marketing
experts in the top management teams, R&D experts, planning broad horizon, low
degree of formalization, decentralized control, and horizontal as well as vertical
communication channels. The third strategic type is analyzers which follows a unique
combination of the strengths of both prospectors and defenders. In order to eliminate
62
risks and obtain profit maximization, analyzers use their innovative ideas and
experience. They create the balance between the steady growth and flexibility to
achieve higher performance. This means that analyzers can have high level of
standardized products with routine manufacturing processes meanwhile they are
always ready to develop new products. This strategic type follows matrix
organizational structure. Product managers generally have more influence than
functional managers. Intensive planning, centralized control mechanism in the
functional division and decentralized control in the production units are the key
features. The residual strategic type is reactors. This type describes the organizations
which fail to respond the market appropriately and perform poorly. Thus,
configuration for each strategic type is made up of contextual, structural, and strategic
factors (Hambrick, 2003; Miles & Snow, 1978; Robbins, Stephen P., Barnwell, 2006;
Snow & David J. Ketchen, 2014; Ven et al., 2013).
The argument of Miles and Snow is an extension to the strategy-structure-
performance paradigm of Chandler (1962, and Rumelt (1974). Here structure and
hence performance of an organization is contingent upon the strategic choice. Miles
and Snow believe that the complexity of the adjustment process can be penetrated by
searching for patterns in the behavior of organizations. One of the key component of
their work is that management's strategic choices shape the organization's structure
and process. Hence strategy act as a contingency facto in this relationship.
The above discussion on contingency theory clearly indicates that the structure and
performance of an organization are contingent upon the strategy, firm size, and
industrial sector in which an organization operates besides other internal and external
contingencies. The application of contingency theory is, therefore, highly legitimate
in the study of strategy and performance relationship.
2.13 Summary
The logical developments in the domain of the topic is covered in this chapter. It starts
with a brief introduction on the purpose of the organization and the characteristics of
organizational effectiveness followed by a logical and analytical commentary on the
historical development of the field of strategic management. It highlights the swings
of the research’s focus from one area to another in theoretical and empirical research.
63
The development in the concept of strategy along with its various forms (intended,
realized, and emergent), behavior (consistent, flexible, pure, and hybrid), and its
levels in organization (corporate, business, and functional) is discussed. The strategy-
performance relationship is generally investigated by strategic groups and strategic
typologies. Therefore, the concept of strategic group in general and the typology of
Miles and Snow in particular are discussed in detail. Specifically, the theoretical
foundations and the subsequent developments based on empirical research on Miles
and Snow strategic types (defenders, analyzers, prospectors, and reactors) is presented
in length followed by discussion on contingency theory, its application and relevance
with strategy-performance relationship and with Miles and Snow typology. The last
section explains the business strategy and organizational performance in the context
and relevance of Miles and Snow typology and its application under contingency
theory.
The theoretical literature review suggest that the field of strategic management is
rapidly changing with the advent of technology and globalization. New challenges are
providing the opportunities for researchers and academicians to investigate strategy-
performance relationships and propose new models for future needs. The debate on
strategy-performance relationship in the context of strategic purity, hybridization,
consistency, flexibility, and their comparative relationship with organizational
performance is an area where intellectual investigation is needed both theoretically
and empirically.

64
Chapter 3
Empirical Literature Review
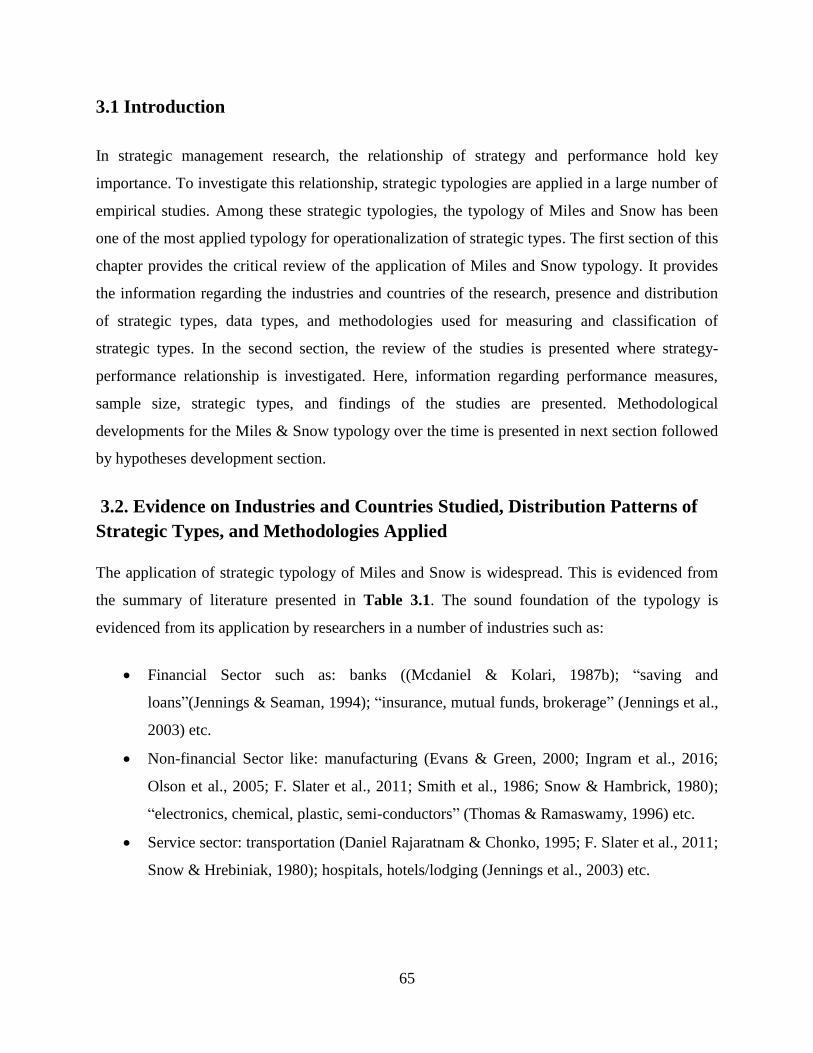
65
3.1 Introduction
In strategic management research, the relationship of strategy and performance hold key
importance. To investigate this relationship, strategic typologies are applied in a large number of
empirical studies. Among these strategic typologies, the typology of Miles and Snow has been
one of the most applied typology for operationalization of strategic types. The first section of this
chapter provides the critical review of the application of Miles and Snow typology. It provides
the information regarding the industries and countries of the research, presence and distribution
of strategic types, data types, and methodologies used for measuring and classification of
strategic types. In the second section, the review of the studies is presented where strategy-
performance relationship is investigated. Here, information regarding performance measures,
sample size, strategic types, and findings of the studies are presented. Methodological
developments for the Miles & Snow typology over the time is presented in next section followed
by hypotheses development section.
3.2. Evidence on Industries and Countries Studied, Distribution Patterns of
Strategic Types, and Methodologies Applied
The application of strategic typology of Miles and Snow is widespread. This is evidenced from
the summary of literature presented in Table 3.1. The sound foundation of the typology is
evidenced from its application by researchers in a number of industries such as:
Financial Sector such as: banks ((Mcdaniel & Kolari, 1987b); “saving and
loans”(Jennings & Seaman, 1994); “insurance, mutual funds, brokerage” (Jennings et al.,
2003) etc.
Non-financial Sector like: manufacturing (Evans & Green, 2000; Ingram et al., 2016;
Olson et al., 2005; F. Slater et al., 2011; Smith et al., 1986; Snow & Hambrick, 1980);
“electronics, chemical, plastic, semi-conductors” (Thomas & Ramaswamy, 1996) etc.
Service sector: transportation (Daniel Rajaratnam & Chonko, 1995; F. Slater et al., 2011;
Snow & Hrebiniak, 1980); hospitals, hotels/lodging (Jennings et al., 2003) etc.
66
Public sector organizations: “colleges, hospitals, local governments, nursing homes,
schools, state owned enterprises etc.” (Conant et al., 1990; Hambrick, 1982; Jennings et
al., 2003; Shortell & Zajac, 1990) etc; and
Other areas: “construction, churches, and retailing” etc.
One shortcoming of the applicability of Miles and Snow typology is its limited research in
developing countries. The mainstream research has been in USA. Other countries include UK,
Australia, China, and some other developed countries. Very few mainstream researches are from
developing countries like Pakistan. Since, the level of uncertainty of the external environment
and the inefficiency in strategy formulation and its implementation in developing countries is
quite different; it is needed to have rigorous research in developing countries for the validity and
applicability of the typology.
The percentage distribution of defenders, analyzers, prospectors, and reactors is different for
different studies. This means that there is no standard pattern of strategic orientation even among
the similar industries of a similar condition. Analyzers dominates in majority of the studies. The
reason for this trend can be due to the tendency of high neutral response by respondents in a
questionnaire based survey methods used for perceived data collection. Another reason can be
the fact that subjective cut-off points are used by different researchers when ranking techniques
are used for classification of strategic types. Hence, there is a need to set some criteria or limit
that can be applied as a standard for distribution of strategic types. One third of the studies of our
sample did not identify all four strategic types. When archived data is used, generally two
extreme strategies are operationalized repressing defender on one side of the continuum and the
prospector on the other side of the continuum. For example Hambrick (1981; 1982; and 1983)
studied hospitals, colleges, and insurance firms and categorized the firms in defenders and
prospectors types. Similarly, Thomas & Ramaswamy (1996) categorized electronic, chemical,
and petroleum refining firms into two extreme categories. Liang et al (2009) also classified
manufacturing firms into defenders and prospectors while using archived data.
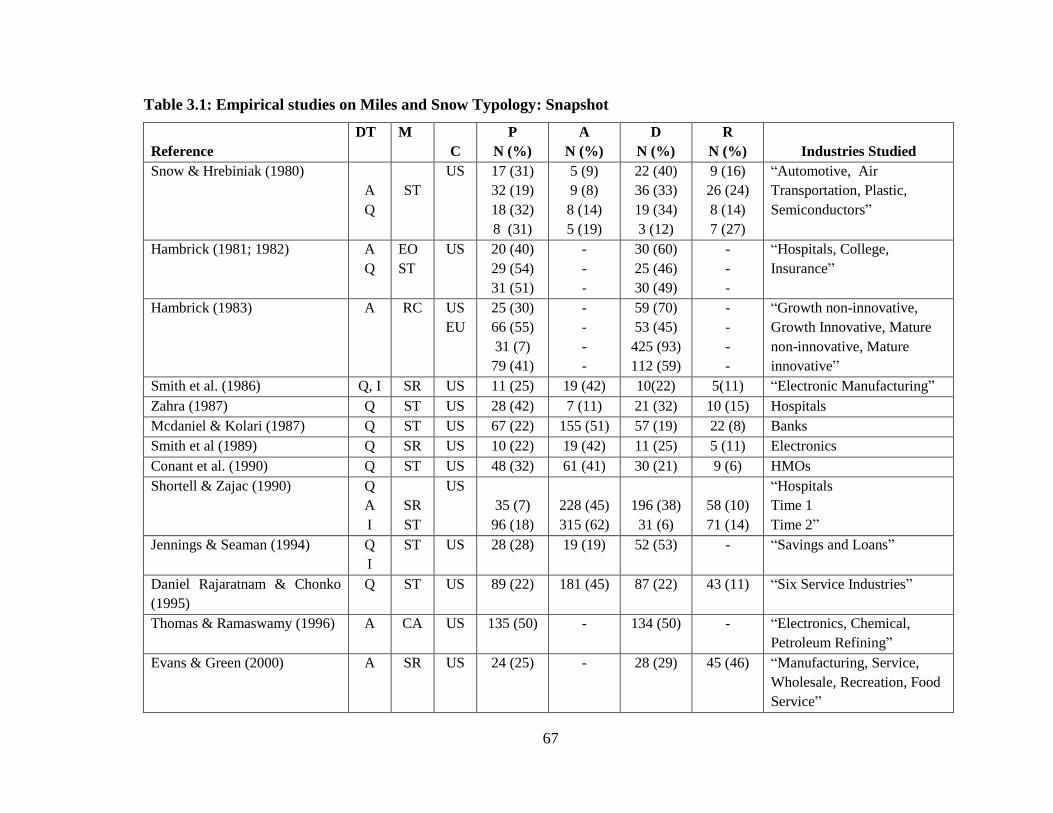
67
Table 3.1: Empirical studies on Miles and Snow Typology: Snapshot
Reference
DT M
C
P
N (%)
A
N (%)
D
N (%)
R
N (%)
Industries Studied
Snow & Hrebiniak (1980)
A
Q
ST
US 17 (31)
32 (19)
18 (32)
8 (31)
5 (9)
9 (8)
8 (14)
5 (19)
22 (40)
36 (33)
19 (34)
3 (12)
9 (16)
26 (24)
8 (14)
7 (27)
“Automotive, Air
Transportation, Plastic,
Semiconductors”
Hambrick (1981; 1982) A
Q
EO
ST
US
20 (40)
29 (54)
31 (51)
-
-
-
30 (60)
25 (46)
30 (49)
-
-
-
“Hospitals, College,
Insurance”
Hambrick (1983) A RC US
EU
25 (30)
66 (55)
31 (7)
79 (41)
-
-
-
-
59 (70)
53 (45)
425 (93)
112 (59)
-
-
-
-
“Growth non-innovative,
Growth Innovative, Mature
non-innovative, Mature
innovative”
Smith et al. (1986) Q, I SR US 11 (25) 19 (42) 10(22) 5(11) “Electronic Manufacturing”
Zahra (1987) Q ST US 28 (42) 7 (11) 21 (32) 10 (15) Hospitals
Mcdaniel & Kolari (1987) Q ST US 67 (22) 155 (51) 57 (19) 22 (8) Banks
Smith et al (1989) Q SR US 10 (22) 19 (42) 11 (25) 5 (11) Electronics
Conant et al. (1990) Q ST US 48 (32) 61 (41) 30 (21) 9 (6) HMOs
Shortell & Zajac (1990) Q
A
I
SR
ST
US
35 (7)
96 (18)
228 (45)
315 (62)
196 (38)
31 (6)
58 (10)
71 (14)
“Hospitals
Time 1
Time 2”
Jennings & Seaman (1994) Q
I
ST US
28 (28) 19 (19) 52 (53) - “Savings and Loans”
Daniel Rajaratnam & Chonko
(1995)
Q ST US
89 (22) 181 (45) 87 (22) 43 (11) “Six Service Industries”
Thomas & Ramaswamy (1996) A CA US
135 (50) - 134 (50) - “Electronics, Chemical,
Petroleum Refining”
Evans & Green (2000) A SR US
24 (25) - 28 (29) 45 (46) “Manufacturing, Service,
Wholesale, Recreation, Food
Service”
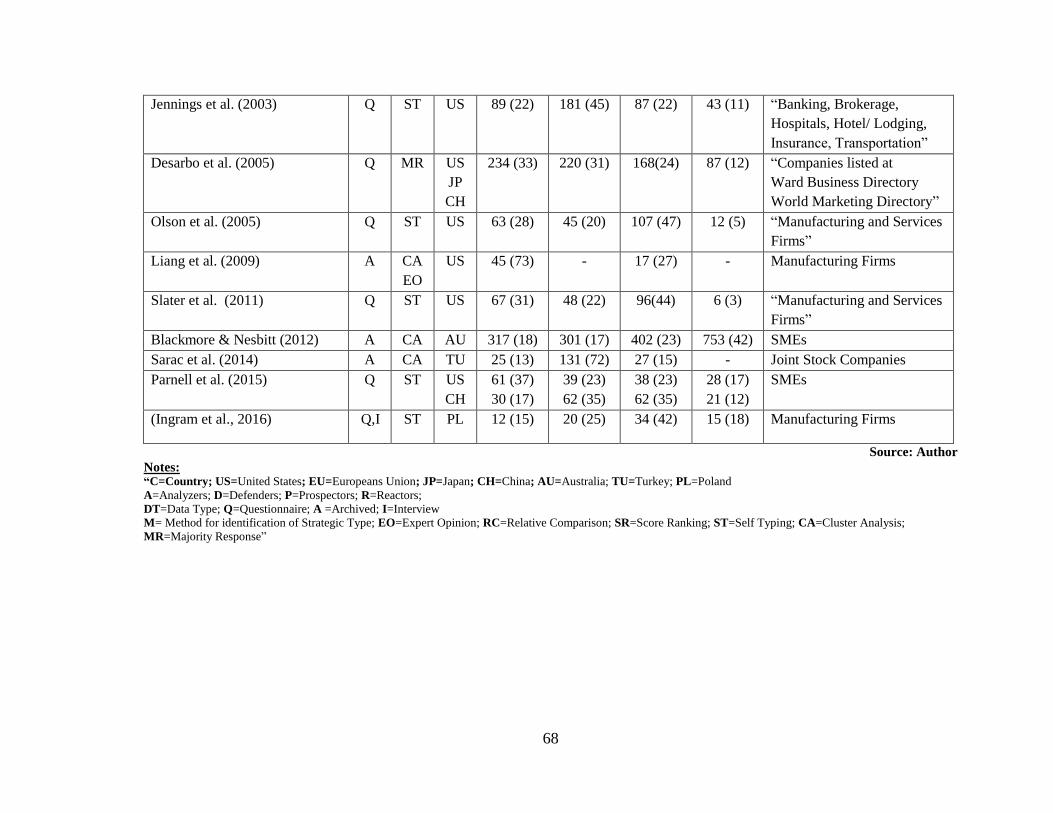
68
Jennings et al. (2003) Q ST US
89 (22) 181 (45) 87 (22) 43 (11) “Banking, Brokerage,
Hospitals, Hotel/ Lodging,
Insurance, Transportation”
Desarbo et al. (2005) Q MR
US
JP
CH
234 (33) 220 (31) 168(24) 87 (12) “Companies listed at
Ward Business Directory
World Marketing Directory”
Olson et al. (2005) Q ST US 63 (28) 45 (20) 107 (47) 12 (5) “Manufacturing and Services
Firms”
Liang et al. (2009) A CA
EO
US
45 (73) - 17 (27) - Manufacturing Firms
Slater et al. (2011) Q ST US 67 (31) 48 (22) 96(44) 6 (3) “Manufacturing and Services
Firms”
Blackmore & Nesbitt (2012) A CA AU 317 (18) 301 (17) 402 (23) 753 (42) SMEs
Sarac et al. (2014) A CA TU 25 (13) 131 (72) 27 (15) - Joint Stock Companies
Parnell et al. (2015) Q ST US
CH
61 (37)
30 (17)
39 (23)
62 (35)
38 (23)
62 (35)
28 (17)
21 (12)
SMEs
(Ingram et al., 2016) Q,I ST PL 12 (15) 20 (25) 34 (42) 15 (18) Manufacturing Firms
Source: Author
Notes: “C=Country; US=United States; EU=Europeans Union; JP=Japan; CH=China; AU=Australia; TU=Turkey; PL=Poland
A=Analyzers; D=Defenders; P=Prospectors; R=Reactors;
DT=Data Type; Q=Questionnaire; A =Archived; I=Interview
M= Method for identification of Strategic Type; EO=Expert Opinion; RC=Relative Comparison; SR=Score Ranking; ST=Self Typing; CA=Cluster Analysis;
MR=Majority Response”
69
In some studies analyzers were operationalized as the middle or balancing strategy while
defender and prospector strategies are taken at the extreme ends of the continuum (Bentley et
al., 2013; Jennings & Seaman, 1994). The operationalization of reactor strategy is generally
neglected in such studies mainly due to the difficulty in its identification and operationalization.
Contrary to the general research evidences, Evans & Green, (2000), took reactor strategy as the
balancing one.
Different methodologies are used for measuring and classifying the strategic types. For example,
more than 70% in our sample of studies are based on questionnaire using either paragraph
approach or self-typing approach (where top management of the selected firms were asked to
select the type of their firm from the four anonymous strategic types). Other methodologies
include interviews and archived data. Few studies (only 32%) used archival data for measuring
strategy. Cluster analysis, and some ranking techniques (quintiles, percentiles, scoring etc) are
used for identification and classification of strategic types. There is a lack of standardized
method of identifying strategic types specifically, when some type of scoring method is applied.
Hence this is the area where more work is needed to refine the methodology.
3.3 Strategy-Performance Relationships
The relationship of strategy and performance has been widely investigated theoretically as well
empirically. For empirical research, the strategy-performance linkage is operationalized by a
number of measures representing strategy and performance. The focus of this section is to review
the literature on this relationship where Miles and Snow typology is applied for
operationalization of strategic orientation. The summary of the studies in this regard is presented
in Table 3.2
One of the major assumption of Miles and Snow typology is that “viable strategies (prospectors,
analyzers, and defenders) perform equally well in the long-run”. That is the difference in their
performance is insignificant. The earlier research findings support this assumption in large scale
70
(Conant et al., 1990; Jennings et al., 2003; Parnell, 2010; Snow & Hambrick, 1980; Woodside &
Sullivan, 1999). On the other hand, there are sufficient evidences where this assumption of equal
performance is violated. For instances, the studies of Blackmore & Nesbitt (2013), Hambrick
(1983), Parnell et al. (2015), and Zamani et al. (2013) etc. found significant variation among the
performance of viable strategies. There are many reasons for these differences. One reason for
these differences is the different nature and scope of performance measures. The environmental
dynamics and contexts may also lead to this variation in performance. The example for these
variations are numerous. For instance, defenders outperformed prospectors when performance is
measured in term of current profitability while in the same study prospectors outperformed
defenders on the basis of market share (Hambrick, 1983). Similarly, when the performance was
compared on the basis of sales growth, prospectors showed highest growth in sales. In the same
study analyzers outperformed others on profitability measured by ROA (Parnell & Wright,
1993). Similar results were found in other studies as well (Sarac et al., 2014; Zamani et al., 2013)
etc. The differences in performance were also found when performance of viable strategies was
compared across countries (Parnell et al., 2012; Parnell et al., 2015).
The second part of Miles and Snow assumption is that reactor performs poorly and below viable
strategies. The support for this assumptions is also overwhelming. However, in some cases
reactors also outperformed even viable strategies. Snow & Hrebiniak (1980) found that reactors
performed better in highly regulated industry. Blackmore & Nesbitt (2013) also found that
reactor showed high profitability in terms of ROA. This shows that industry also impact the
strategic choice and in some industries one type of strategy may not performed well. The
performance of reactors in some situations and for some performance measures support the
understanding of Zahra & Pearce (1990) who argued that pre-assumed inferiority of reactors to
other viable strategies is questionable. According to Conant et al. (1990), the reactors can also
exploit the situations because they have the potential to improve incrementally.
Another interesting finding is the fact that viable strategies performed negatively in many
studies, although, they outperformed reactors. For example, the performance of prospectors and
analyzers were negative in Turkey and USA (Parnell et al., 2012; Parnell et al., 2015). Similarly,
71
in terms of growth in business and overall organizational performance measures, the
performance of defenders was found as negative (Zamani et al., 2013). Exploring the
contingency effect it was found that firm size affected performance significantly (Blackmore &
Nesbitt, 2013; Jennings et al., 2003). In some cases it was it was insignificant as well (Ingram et
al., 2016). The results for industry effect were mix. For example, in one study, the contingent
effect of industry on performance was found significant (Blackmore & Nesbitt, 2013) while in
another study this effect was found insignificant (Sarac et al., 2014). The studies support the
higher performance when there exist strategic clarity in the minds of management (Parnell et al.,
2015). Similarly, the findings were in favor of better performance when firms go for strategic
hybridization (Zamani et al., 2013).
Based on the above review, there is a need to further investigate the relationship in a different
country and environmental context, with refined methodology for identification and
classification of strategic types including reactors.
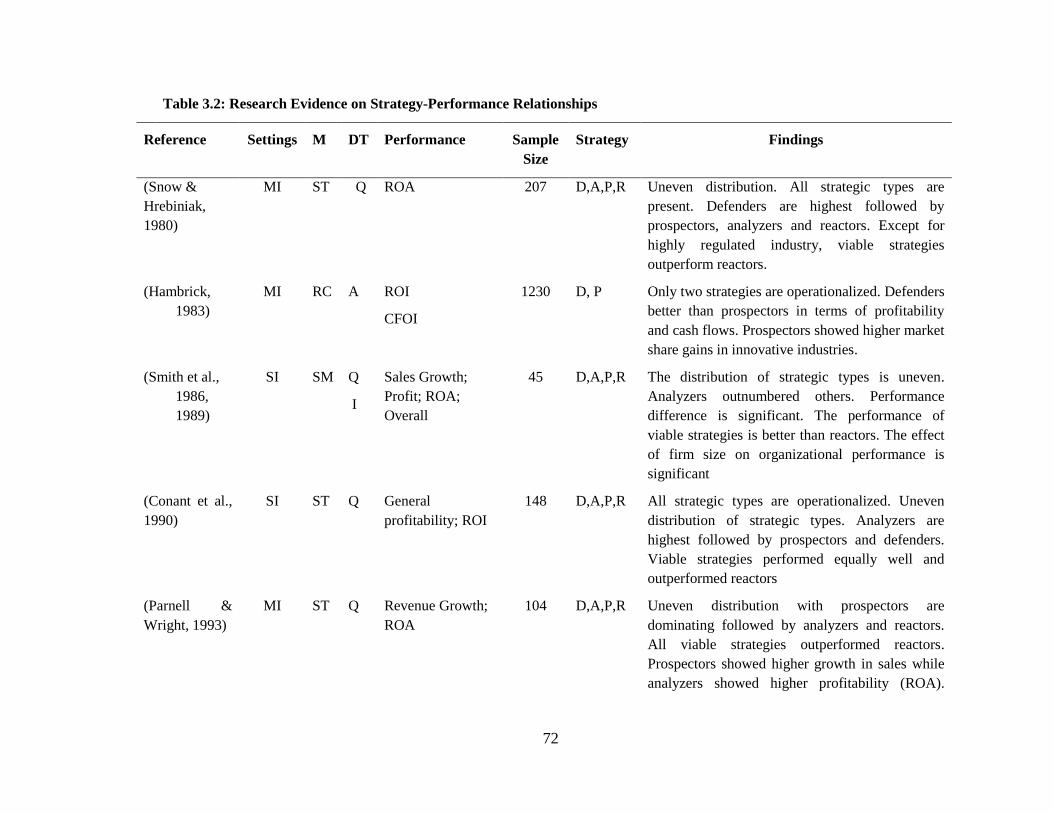
72
Table 3.2: Research Evidence on Strategy-Performance Relationships
Reference Settings M DT Performance Sample
Size
Strategy Findings
(Snow &
Hrebiniak,
1980)
MI ST Q ROA 207 D,A,P,R Uneven distribution. All strategic types are
present. Defenders are highest followed by
prospectors, analyzers and reactors. Except for
highly regulated industry, viable strategies
outperform reactors.
(Hambrick,
1983)
MI
RC A ROI
CFOI
1230 D, P Only two strategies are operationalized. Defenders
better than prospectors in terms of profitability
and cash flows. Prospectors showed higher market
share gains in innovative industries.
(Smith et al.,
1986,
1989)
SI SM Q
I
Sales Growth;
Profit; ROA;
Overall
45 D,A,P,R The distribution of strategic types is uneven.
Analyzers outnumbered others. Performance
difference is significant. The performance of
viable strategies is better than reactors. The effect
of firm size on organizational performance is
significant
(Conant et al.,
1990)
SI ST Q General
profitability; ROI
148 D,A,P,R All strategic types are operationalized. Uneven
distribution of strategic types. Analyzers are
highest followed by prospectors and defenders.
Viable strategies performed equally well and
outperformed reactors
(Parnell &
Wright, 1993)
MI ST Q Revenue Growth;
ROA
104 D,A,P,R Uneven distribution with prospectors are
dominating followed by analyzers and reactors.
All viable strategies outperformed reactors.
Prospectors showed higher growth in sales while
analyzers showed higher profitability (ROA).
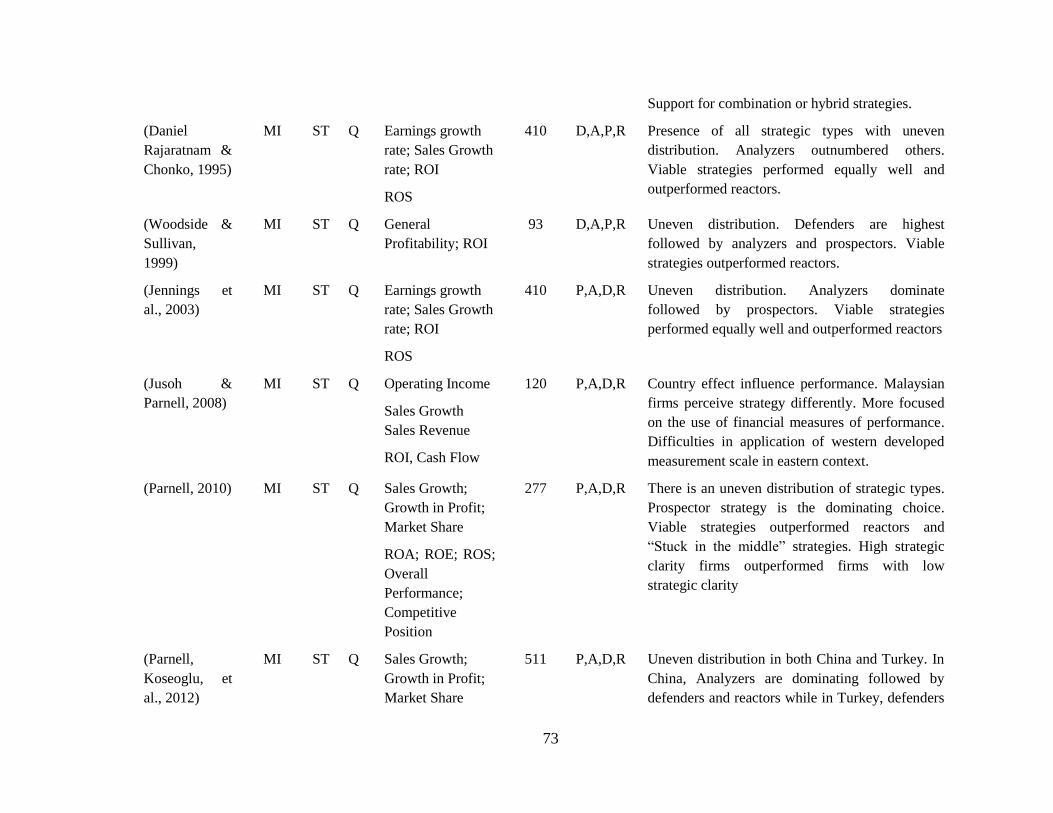
73
Support for combination or hybrid strategies.
(Daniel
Rajaratnam &
Chonko, 1995)
MI
ST Q Earnings growth
rate; Sales Growth
rate; ROI
ROS
410 D,A,P,R Presence of all strategic types with uneven
distribution. Analyzers outnumbered others.
Viable strategies performed equally well and
outperformed reactors.
(Woodside &
Sullivan,
1999)
MI ST Q General
Profitability; ROI
93 D,A,P,R Uneven distribution. Defenders are highest
followed by analyzers and prospectors. Viable
strategies outperformed reactors.
(Jennings et
al., 2003)
MI ST Q Earnings growth
rate; Sales Growth
rate; ROI
ROS
410 P,A,D,R Uneven distribution. Analyzers dominate
followed by prospectors. Viable strategies
performed equally well and outperformed reactors
(Jusoh &
Parnell, 2008)
MI ST Q Operating Income
Sales Growth
Sales Revenue
ROI, Cash Flow
120 P,A,D,R
Country effect influence performance. Malaysian
firms perceive strategy differently. More focused
on the use of financial measures of performance.
Difficulties in application of western developed
measurement scale in eastern context.
(Parnell, 2010) MI ST Q Sales Growth;
Growth in Profit;
Market Share
ROA; ROE; ROS;
Overall
Performance;
Competitive
Position
277 P,A,D,R There is an uneven distribution of strategic types.
Prospector strategy is the dominating choice.
Viable strategies outperformed reactors and
“Stuck in the middle” strategies. High strategic
clarity firms outperformed firms with low
strategic clarity
(Parnell,
Koseoglu, et
al., 2012)
MI ST Q Sales Growth;
Growth in Profit;
Market Share
511 P,A,D,R Uneven distribution in both China and Turkey. In
China, Analyzers are dominating followed by
defenders and reactors while in Turkey, defenders
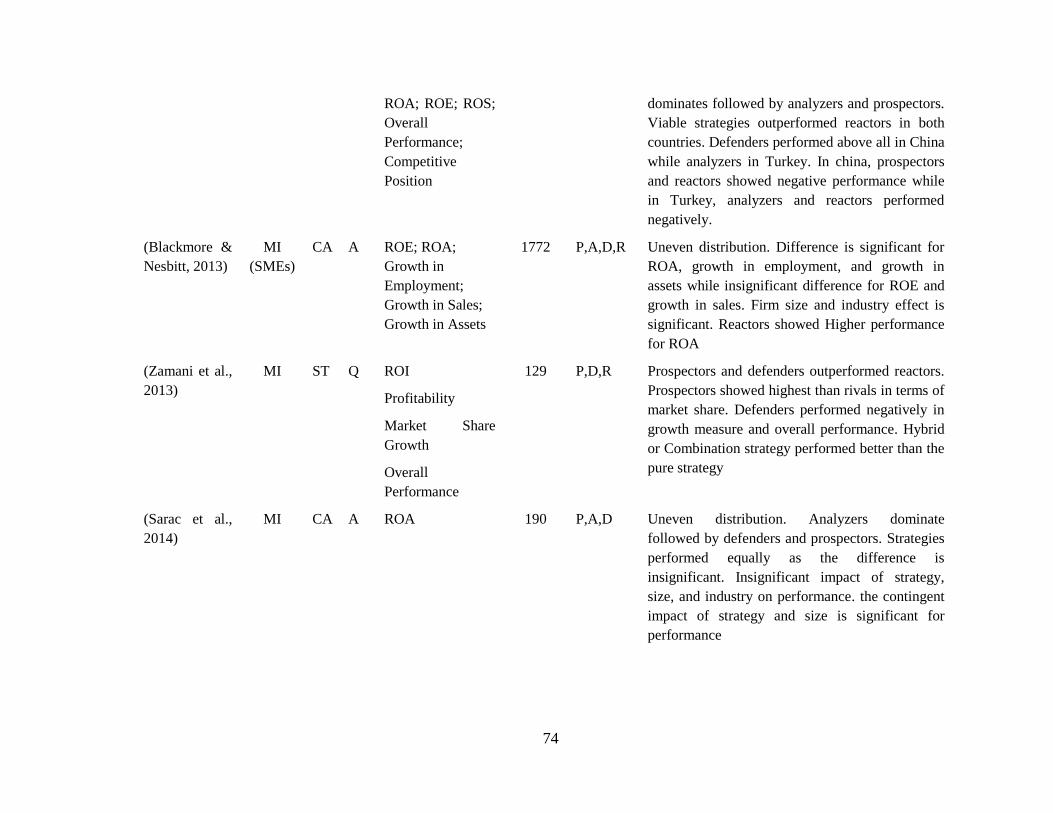
74
ROA; ROE; ROS;
Overall
Performance;
Competitive
Position
dominates followed by analyzers and prospectors.
Viable strategies outperformed reactors in both
countries. Defenders performed above all in China
while analyzers in Turkey. In china, prospectors
and reactors showed negative performance while
in Turkey, analyzers and reactors performed
negatively.
(Blackmore &
Nesbitt, 2013)
MI
(SMEs)
CA A ROE; ROA;
Growth in
Employment;
Growth in Sales;
Growth in Assets
1772 P,A,D,R Uneven distribution. Difference is significant for
ROA, growth in employment, and growth in
assets while insignificant difference for ROE and
growth in sales. Firm size and industry effect is
significant. Reactors showed Higher performance
for ROA
(Zamani et al.,
2013)
MI ST Q ROI
Profitability
Market Share
Growth
Overall
Performance
129 P,D,R Prospectors and defenders outperformed reactors.
Prospectors showed highest than rivals in terms of
market share. Defenders performed negatively in
growth measure and overall performance. Hybrid
or Combination strategy performed better than the
pure strategy
(Sarac et al.,
2014)
MI CA A ROA 190 P,A,D Uneven distribution. Analyzers dominate
followed by defenders and prospectors. Strategies
performed equally as the difference is
insignificant. Insignificant impact of strategy,
size, and industry on performance. the contingent
impact of strategy and size is significant for
performance
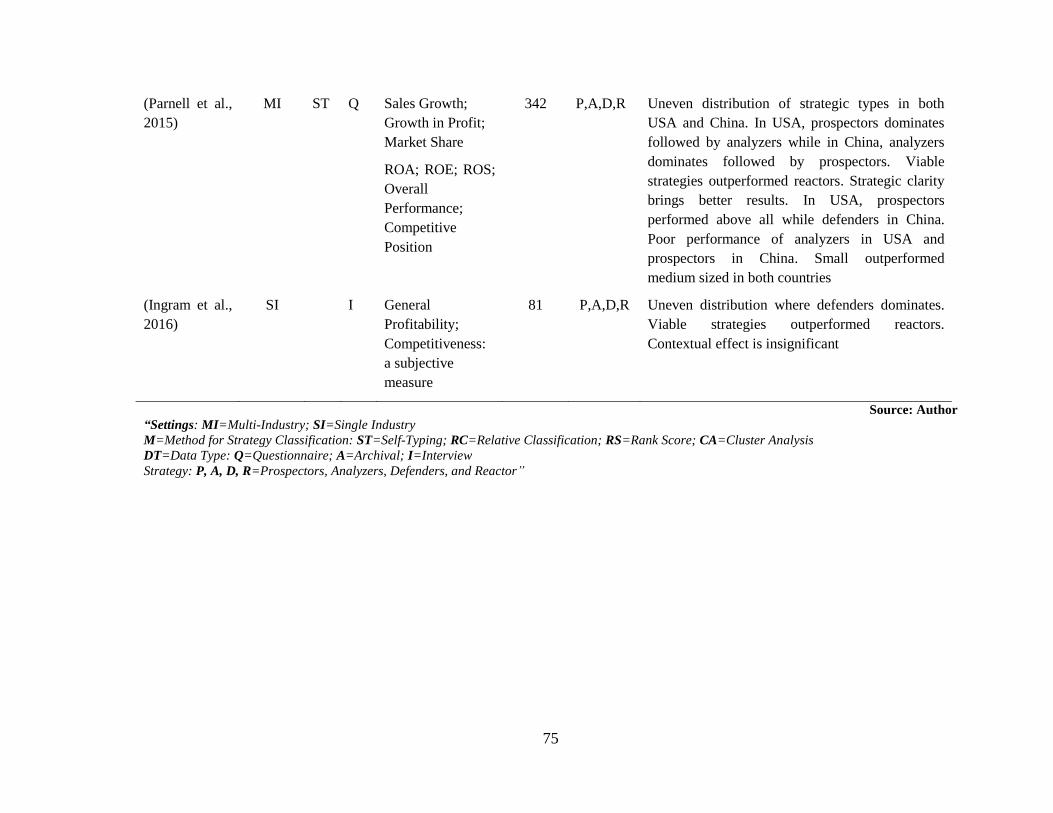
75
(Parnell et al.,
2015)
MI
ST Q Sales Growth;
Growth in Profit;
Market Share
ROA; ROE; ROS;
Overall
Performance;
Competitive
Position
342 P,A,D,R Uneven distribution of strategic types in both
USA and China. In USA, prospectors dominates
followed by analyzers while in China, analyzers
dominates followed by prospectors. Viable
strategies outperformed reactors. Strategic clarity
brings better results. In USA, prospectors
performed above all while defenders in China.
Poor performance of analyzers in USA and
prospectors in China. Small outperformed
medium sized in both countries
(Ingram et al.,
2016)
SI I General
Profitability;
Competitiveness:
a subjective
measure
81 P,A,D,R Uneven distribution where defenders dominates.
Viable strategies outperformed reactors.
Contextual effect is insignificant
Source: Author
“Settings: MI=Multi-Industry; SI=Single Industry
M=Method for Strategy Classification: ST=Self-Typing; RC=Relative Classification; RS=Rank Score; CA=Cluster Analysis
DT=Data Type: Q=Questionnaire; A=Archival; I=Interview
Strategy: P, A, D, R=Prospectors, Analyzers, Defenders, and Reactor”
76
3.4 Methodological Development for Application of Miles and Snow
Typology
One of the reasons of longevity of Miles and Snow typology is the continuous
development in the methodology, specifically for measuring and classifying the strategic
types. There are some major contributions in this regards. Some of the key
methodological developments and/or refinements are briefly presented below.
Snow & Hambrick (1980) conducted multiple studies of 200 firms in 10 industries to
explore the strategic behavior of organizations. The individual studies employed different
methods such as intensive interviews, mailed questionnaires, surveys and combination of
interviews and questionnaires. The purpose of their research was to address the
theoretical and methodological problems encountered in the attempts to arrive at valid
and reliable measures of organizational strategies. Specifically, they tried to find the
answers to the issues:
What constitutes the change in strategy instead of strategic adjustment?
Is there a difference between intended and realized strategy?
How do these different forms of strategies arise?
How can the investigator recognize which type of strategy is being observed?
What are some of the problems that can occur when industries and organizations
are being considered for inclusion in a research sample?
They suggested four distinct measures of strategies: (1) the Investigator inference
method in which the researchers use available information to assess the organizational
strategy, (2) the Self-typing method, where organization's managers (usually top
managers) are asked to select the best suited organization's strategy from the alternatives,
(3) the External assessment method, where an external expert panel assesses the
organizational strategy, and (4) the Objective indicators method, where proxies are used
to measure the strategic stance of an organization through archived data.
77
Three conclusions were drawn from the above study. First, the validity of strategy
measures can be enhanced if researchers rely on multiple sources of information. Second,
the opportunities for strengthening the connection between concepts and measures of
strategy are great. For example, the measures for classifying the intended and realized
strategies can be identified and used. Third, studies of organizational strategies across
industries for comparative analysis can be more useful. The subsequent research on Miles
and Snow typology is overwhelmingly based on one of the four methods explained
above.
Smith et al. (1986) classified the strategic types by scaling the questionnaire and a
content evaluation of each cluster. Questions were arranged on a continuum scaled from
0-8. Miles and Snow's four strategies were identified by summing the scores to the
questions asked within each cluster. Prospector firms were classified based on the highest
summed score of a cluster. The next cluster in score ranking was classified as following
an analyzer strategy followed by the defender strategy cluster. Reactor strategy cluster
was identified as the residual cluster or the cluster with the lowest score.
Segev (1989), systematically compared, analyzed and evaluated two widely used
business-level strategies of Porter (1980) and Miles and Snow (1978). Following a pilot
study and a review of literature on strategic, 31 strategic variables were evaluated on
scale of 1-7 for each strategy within a given typology and a strategic profile was
developed for each strategy. The analysis indicated similarities and differences between
two typologies. A synthesis of two typologies is also suggested. One important outcome
of the study is the list of strategic variables. The analysis shows that Defender strategy is
closest to Porter’s Cost-Focus; Prospector is nearer to Differentiation; Analyzer is to
Differentiation and Cost-Focus; and Reactor is closest to the Stuck-in-the-Middle
strategy. The results show high ranks of Prospector for market share; rate of growth,
number of technologies used; and product/market breadth. Analyzers ranks high for
quality; price level; active marketing; rate of growth; and proactive management style.
Defenders rank high in quality; centralization; organization age; proactive managerial
style and mechanism. Defenders are low risk strategies whereas prospectors are high risk
78
strategies for short time. However, the risk profile in the long run becomes identical for
all strategy types.
Conant, Mokwa, & Varadarajan (1990) developed and empirically tested a new multi-
item scale for operationalizing Miles and Snow's typology. The methodology is widely
used by researchers because it possess significant managerial and research potential. The
scale is theoretically anchored, easily administered, and possesses diagnostic value to
both strategists and their organizations.
Thomas & Ramaswamy (1996), operationalized the strategic types by using archival data
from annual reports and other published documents for analysis of realized strategy using
5 years averages. The ratios for marketing expenditure to sales, R&D expenditure to
sales, production expenditure to sales, and capital intensity measured by total assets per
employee were used to operationalize the strategic types along with firm age, firm size,
and industry are used as the contextual/contingency variables. Similarly, Ittner, Larcker,
& Rajan (1997), conducted analysis using cross-sectional latent variable regression
analysis. Strategy was measured using four variables: (1) the ratio of research and
development to sales, (2) market to book ratio, (3) the ratio of employees to sales, and (4)
the introduction of new product and services. These indicator ratios for each year are
averaged over 5 years. The subsequent studies, where archived financial data is used,
generally follow these proxies for measuring strategy.
Evans & Green (2000) used four proxy variables for measuring strategy. These proxies
measure the cost efficiency, the breadth of product and market mix, projected growth of
sales; and projected change in marketing expenditure. For classification of strategic
types, scoring method was used. The ranking for each firm was calculated based on the
scoring points representing the firms from strongest to weakest on each of four strategy
variables. Organizations were grouped on the basis of ranking using quintiles on a scale
of 1-5. The final scores were averaged. The firms which received mean score of less than
2 were classified as defenders. On the other side of the continuum, the prospector firms
were those who received mean score of greater than 4 while reactors were identified as
79
the firms having mean score within the range of 2 & 4. This is the betrayal of the general
rule where the balancing strategy is termed as analyzers.
Desarbo et al (2005) re-examined the typology of Miles and Snow and its
interrelationships with several theoretically relevant variables. This includes the SBU
strategic capabilities at SBU level, environmental uncertainty, and performance. Using
survey data, they used a modified multi-objective classification methodology to
empirically derive an alternative quantitative typology. They supported the Miles and
Snow typology for its durability and excellence to its inborn parsimony, industry
independent nature, and its correspondence with actual strategic postures of firms across
multiple industries and countries. Their methodology facilitates the selection of strategic
groups through data and provides the deeper insights about the actual strategic stance of
the firms and their relationship with performance across industries and across countries.
They argued that different strategic groups may emerge in different contexts when the
grouping is made empirically.
Bentley, Omer, & Sharp (2013) developed a scoring methodology by extending the
earlier concepts. The strategies (prospectors, analyzers, and defenders) are classified
based on the outcomes of six strategy measures. These measures are: R&D expenses to
sales ratio; number of employees to sales ratio; historical growth rate of total sales;
marketing expenses to sales ratio; employee fluctuations measured by standard deviation
of total employees; and capital intensity measured by net power, plant, and equipment
(PPE) to total assets ratio respectively. All variables are computed using a rolling average
of the preceding five years. This is consistent with Ittner et al. (1997). All of the six
variables were ranked individually using quintiles per industry and year. The variables
are ranked based on the hierarchy of quintiles. The variables with the highest quintiles
(i.e. top 20%) are ranked with a score of 5. The next 20% quintiles are given a score of 4,
and so on. The lowest score was 1, allotted to the least quintiles. For each company-year,
the the ranking scores were summed across the six variables. Resultantly, a firm could
receive a maximum score of 30 and a minimum score of 6 on a continuum of 6-30. The
firms were classified as prospectors having their scores within 24-30, the analyzers with
the scores 13-23, while defenders with the scores lying between 6 -12.
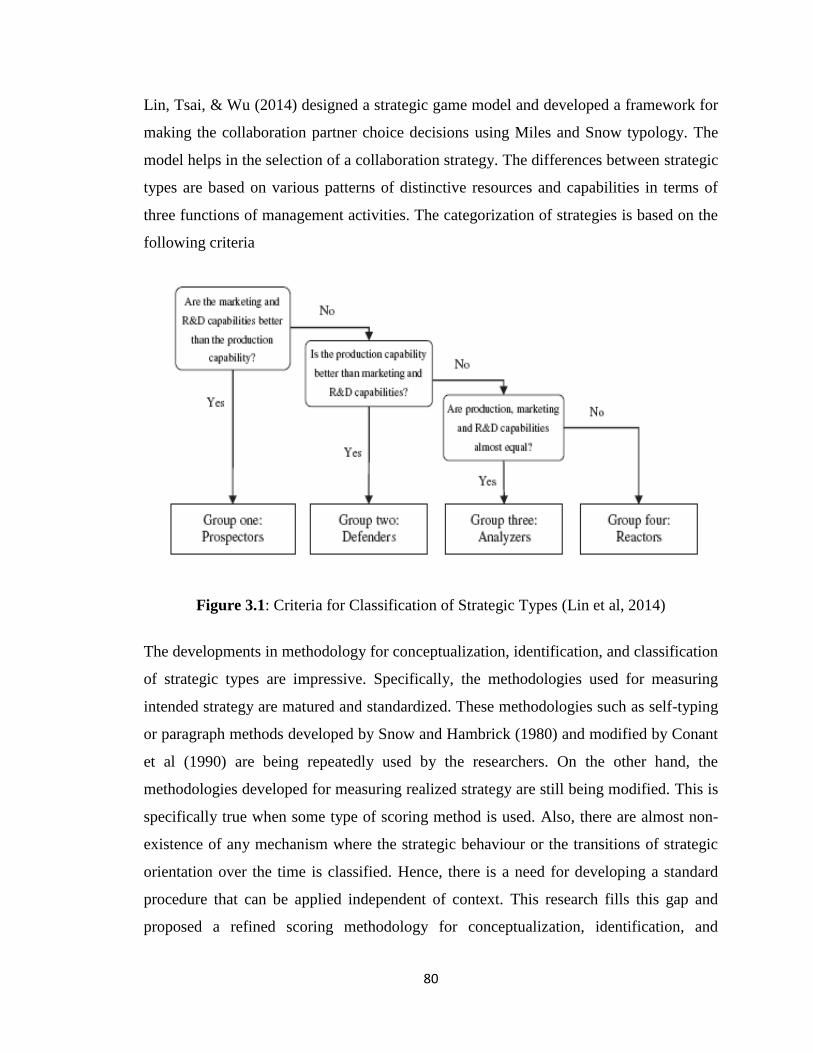
80
Lin, Tsai, & Wu (2014) designed a strategic game model and developed a framework for
making the collaboration partner choice decisions using Miles and Snow typology. The
model helps in the selection of a collaboration strategy. The differences between strategic
types are based on various patterns of distinctive resources and capabilities in terms of
three functions of management activities. The categorization of strategies is based on the
following criteria
Figure 3.1: Criteria for Classification of Strategic Types (Lin et al, 2014)
The developments in methodology for conceptualization, identification, and classification
of strategic types are impressive. Specifically, the methodologies used for measuring
intended strategy are matured and standardized. These methodologies such as self-typing
or paragraph methods developed by Snow and Hambrick (1980) and modified by Conant
et al (1990) are being repeatedly used by the researchers. On the other hand, the
methodologies developed for measuring realized strategy are still being modified. This is
specifically true when some type of scoring method is used. Also, there are almost non-
existence of any mechanism where the strategic behaviour or the transitions of strategic
orientation over the time is classified. Hence, there is a need for developing a standard
procedure that can be applied independent of context. This research fills this gap and
proposed a refined scoring methodology for conceptualization, identification, and
81
classification of strategic groups based on their strategic orientation and their strategic
behaviour over the time.
3.5 Strategic Management in Pakistan
The studies on strategy-performance relationships in Pakistani firms are not very large.
However, there are some studies in which this relationship is investigated directly or
through moderation and mediation of some contingent variables. These studies
investigated many aspects of strategic management such as strategic orientations, strategy
formulation and implementation, marketing strategies, strategic management concepts
and practices, strategic diversification, strategic change behavior, capital structure,
working capital policies and their relationships with organizational performance. A brief
explanation of these studies is presented below.
Khan et al., (2016) analyzed the strategy-performance relationship for private sector
organizations in Pakistan. Strategy formulation and strategy contents were used as the
independent variables where rational planning, logical instrumentalism and strategy
process absence were measured for strategy formulation and strategy content were
represented by the viable strategic types of Miles and Snow typology. The results show
that rational planning has a positive relationship while logical incrementalism and
strategy absence has negative relationship with performance. The relationship of
prospector, defenders and reactors strategies was positive and significant with
organizational performance. Hassan et al (2013) investigated the direct impact of
marketing strategy with performance. The study investigates a mediating role of the
effectiveness of marketing strategy implementation on the relationship between strategic
creativity and performance. The moderating role of environmental uncertainty is also
investigated to the above relationship. The strategic types used for this study were
classifies as prospectors, analyzers, differentiated defenders, low cost defenders and
reactors. A survey method is used to collect data from service and manufacturing
companies of Pakistan. Creativity in strategy and effective implementation leads to
higher performance as evidenced by the findings of this study. Within strategic types,
82
marketing strategic creativity and marketing strategy implementation effectiveness has
significant relationship with analyzers strategy only (Hassan et al., 2013).
Using Michael Porter (1980) typology, Afza & Ahmed (2017) examined the moderating
role of business strategy. The relationship between capital structure and firm performance
was investigated using the 8 years (2006-2013) data of 333 non-financial firms of
Pakistan. The results show that strategy has significant impact on the performance
measured by accounting and market performance measures. The relationship of unclear
or stuck in the middle strategy was negative with performance as expected. Furthermore,
the outcomes of cost leadership strategy show that debt financing is imperative both for
the accounting and market performance. The benefits of debt decreases along with
significant performance loss when firms follow the hybrid strategy, product
differentiation strategy, and stuck in the middle (unclear) strategy (Afza & Ahmed,
2017). Investigating the marketing aspects of strategy, Afzal (2009) found that marketing
practice regulates the relationship between marketing capabilities & business strategy and
organizational performance. The results show that adaption of marketing practices is
moderated by the market they serve. Strategy was measured by using Michael Porter’s
generic strategic types: Low Cost Leadership, Differentiation and Product Market Scope.
The results suggest that Marketing Capabilities and Strategy frame exist in the business
environment of Pakistan but there is a weak relationship with firm performance. Among
the various capabilities, marketing research capabilities have the highest impact on
performance. Comparing the impact of strategic types, it was found that low cost
leadership strategy is more successful than differentiated strategy in Pakistani
environment (Afzal, 2009).
There are more studies where different aspects of organizational strategies are
investigated. For example, Arif et al (2012), carried out a study to identify the nature of
strategic management concepts and practices in the construction firms in Pakistan.
Primary data from client, consultant, contractor and project management firms were
collected. It was found that there is a lack of commitment in the areas of strategy
evaluation, R&D, and the use of management information system as a decision tools
although, the importance of the strategic planning is felt at the top level. Also, operational
83
aspects of strategic management have been found in line with the strategic management
requirements, however, the effectiveness of quality control and inventory control
procedures are not up to the standards (Arif et al., 2012). Diversification is one of the
strategic choices and it continues to be an important strategy for corporate growth and
better organizational performance. Afza et al. (2008) investigated the relationship
between diversification and a firm’s financial performance for Pakistani firms where the
financial performance in terms of risk and return has been analyzed. The research found
that the performance of non-diversified firms is better than the diversified firms.
Interestingly, low risk is accompanied by high return for non-diversified firms while
diversified firms are more risky even their return is lower. Hence, they recommend that
the managers should be careful while selecting the degree of diversification (Afza et al.,
2008).
A qualitative study was carried out by Malik (2014) in a Public sector organization of
higher education to analyze the strategic change behavior. The behavior of top
management support, entrepreneurial spirit in organization; and project champion were
measures. Significant evidence of the presence of all three components of strategic
behavior were found to follow a successful change initiatives. Malik & Kotabe (2009)
developed and tested a model of the dynamic capability development mechanisms,
linking with performance, for Emerging Market manufacturing Firms (EMMF) in India
(54 firms) and Pakistan (39 firms) mainly involved in exports. Results showed that
organizational capabilities, organizational learning and government support has
significant impact on performance (Malik & Kotabe, 2009).
Analyzing the traditional relationship between working capital management policies and
firm performance, Nazir & Afza (2009) found that there is a negative relationship
between the profitability of the firms and degree of aggressiveness of working capital
investment and financing policies. The reason for this relationship may be the
inconsistent and volatile economic conditions of Pakistan (Nazir & Afza, 2009).
Keeping in the view the above literature survey, it is found that although there are many
studies on strategy-performance relationship in Pakistan, there is no study where the
performance of pure versus hybrid strategies and strategic consistency versus strategic
84
flexibility is compared along with the contingent effect of firm size and industry in one
settings. The mechanism of identifying the reactor strategy from financial archived data
is also an addition to the existing studies.
3.6 Hypotheses Development
One of the premises is that all strategic types do exist in an economy and similar pattern
may be followed in a given industry as well. However, because of the dynamics of
industries and the type of competition and external environment, this may not hold true.
The research evidence (see table 3.1) also supports the uneven distribution of the
strategic types both in single-industry and in multi-industry settings. Therefore, we state
the hypothesis (H1) as:
H1: There is a significant difference among the distribution of strategic types
within a given industry and overall in the economy.
One of the basic assumption of Miles and Snow (1978) is that viable strategies
(defenders, analyzers, and prospectors) produce better performance in the long run if they
stick to them for a longer period of time. This is because of the fact that these viable
strategies are well articulated and respond consistently to the environmental change. The
second part of the assumption is that all viable strategies will outperform the reactor firms
because the behaviour of the reactor organization is inconsistent and inappropriate to the
changes occurring in the environment. There is an overwhelming support in favor of
these assumptions (Conant et al., 1990; Jennings et al., 2003; Parnell, 2011b; Woodside
& Sullivan, 1999). In these cases, there is statistically insignificant difference among the
performance of viable strategies and they outperformed reactors. However, there is
sufficient evidences where viable strategic types performed significantly different
(Blackmore & Nesbitt, 2013; Jusoh & Parnell, 2008; Koseoglu et al., 2013; Parnell et al.,
2015; Smith et al., 1989; Zamani et al., 2013).
There are many reasons for these inconsistencies in performance. The differences in
performance among viable strategies may be due to the fact that different studies used
performance measures which are different in nature and scope from each other. For
85
instance, for current profitability measure, defenders performed than prospectors while in
another study prospectors performed better than defenders when performance was
measured as market share of the firms (Hambrick, 1983; Zamani et al., 2013). Similarly,
in terms of growth, prospectors performed better than analyzers when profitability was
measured by ROA (Parnell & Wright, 1993) etc. The variation of performance within
viable strategies may be due the differences in the environmental contexts of the studies.
For example, the variation in performance is found for cross-country studies (Parnell,
Koseoglu, et al., 2012; J. A. Parnell et al., 2015). That is why, Desarbo et al, (2005),
suggested for more rigours in research for investigating strategy-performance relationship
to find out whether the typology of Miles and Snow is universally applicable or is context
dependent. On the basis of above findings, we state the following hypotheses:
H2: There is an insignificant difference in the performance of viable strategies
H2a: Viable strategies outperform reactors
In practice, organizations hybridize the strategies because of certain problems and
difficulties related to the pursuance of pure strategies. For example, strategic purity may
ignore some important needs of the customers because of their stickiness to the specified
boundaries leading to some critical gaps in product development and offers. Second, pure
strategies may be easily imitated by the competitors whereas hybrid strategy is difficult to
imitate because it combines several factors related to pure strategies. Resultantly, hybrid
strategies may realize higher performance. Third, the competitors invent new challenges
because of changing behaviour of market, customer needs, and evolvement of
consumers’ tastes etc. This change makes pure strategies more vulnerable due to their
inherent rigidity to stick with the core. Firms reduce their resilience and adaptability
when they focus on a single strength. Keeping in view the above issues linked with pure
strategies, firms prefer to adapt the hybrid strategies. In this way, firms with hybrid
strategies can satisfy the customers in a better way. This is because of the fact that by
hybridizing their strategy, they are difficult to be imitated. They can be more flexible in
adapting the ongoing change (Pertusa-Ortega et al., 2009). Hybridization is therefore, not
only a viable option but it can also be more profitable choice as well (Claver-Cortés,
86
Pertusa-Ortega, & Molina-Azorín, 2012). There are number of challenges for firms to
remain competitive and successful. These challenges include: competition from foreign
firms; imports export liberalization policies; varying supply and demand conditions; and
technological advancements etc. Hybridization of strategy is expected to deal well with
these challenges and can lead the organization towards higher performance (Madanoglu
et al., 2014; Manev et al., 2015; Proff, 2000; Salavou, 2013). These arguments provide
the basis for the following hypothesis:
H3: Hybrid strategies are superior to the pure strategies both in adaptation and in
performance
The proponents of strategic consistency argue that strategic consistency is adapted by the
firms due to number of advantages. First, firms stick to the existing strategy and avoid
flexibility to avoid uncertainty. In this way they can beat the challenges of rapid changes.
Second, shift in strategy may require considerable expenses of capital. For example, a
shift from a growth oriented and innovative prospector or balancing analyser strategy to a
defender strategy may require investments in sophisticated production equipment to
lower production costs for effective implementation of a defender strategy (Miles &
Snow, 1978). Similarly, a shift from a defender or analyser strategy to a prospector
strategy may require expenditure to develop or improve R&D facilities. Third, quality
and price conscious consumer may get confused by rapid changes in firms’ strategic
stance. For instance, a shift from low-cost strategy to adapt differentiation strategy by a
firm may confuse its price-conscious customers. The customers may switch to other firms
and develop their relationship to another low cost strategy holder firm. At the same time,
the customers willing to purchase differentiated products and to pay a premium price may
not respond quickly to the low-cost products because of ignorance of the strategic move
of the organization. Fourth, sustaining and maintaining the success in new product and
service is always a challenging job for organizations because competitors are ready to
distort the consumer perception and divert their attention towards themselves to reap the
benefits of initial strategic change (Fehre et al., 2016; Moss et al., 2014; Parnell & Lester,
2003).
87
On the other hand, the proponents of strategic flexibility have their own arguments. First,
a flexibility in strategy may return when organizations are able to create fit between
strategic choice and organization’s internal and external environment (Parnell, 1997).
Second, by adapting flexibility an organization can benefits from first-mover advantages.
This move can help an organization to exploit scarce resources and increase the
knowledge base. This will lead to the long-term competitive advantage for the
organization. Third, when there is a shift in adapting of new resource base, the shift
towards strategic change adaptability becomes necessary. Fourth, when performance of
an organization is not picking up, strategic change become necessity (Parnell, 2005;
Parnell & Lester, 2003). Alternatively, flexibility can create problems as well. Flexibility
or rapid change in strategic stance may put the existence of the firms at risk. This may
lead to an imbalance situation between capabilities of an organization and recent strategic
change actions causing increasing costs and decline in competitive market position
(Lamberg et al., 2009).
Based on the above arguments, it can be concluded that given the highly competitive and
ever changing nature of business environments characterised by flexibility, adaptability,
and speed a strategic orientation toward consistency may not be a natural choice. Firms
with high adaptability would be able to exploit the given situation with flexibility in their
stance in a quick and speedy way in response to competitive environmental changes to
achieve higher performance (Lamberg et al., 2009; Moss et al., 2014). Therefore, for an
organization to remain competitive, flexibility is inevitable so that it should remain
committed to make improvements in products and services, market approaches, and
adaption of latest technology (Parnell, 2005).
One of the differences between the viable strategy and reactor strategy is the behaviour in
response to the market changes. The reactor strategy, according to Miles and Snow,
behave inconsistently while viable strategies remain consistent over the time to exploit
the situation based on their well thought strategy. That is why it is assumed that reactors
perform below the consistent strategy. Based on the arguments in favour of both strategic
consistency and strategic flexibility, we hypothesize as under:
88
H4: Strategic consistency and strategic flexibility performed equally well and
outperform reactors
The performance of the viable strategies is expected to have positive impact on
organizational performance. However, in many case viable strategies performed even
negatively showing losses although they outperformed reactors. For instance, in one
study in China, the performance of prospectors was negative. In the same way analyzers
showed losses in USA and Turkey (Parnell et al., 2015). Similarly, there are evidences
where viable strategies performed negatively such as performance of defenders was
found negative in terms of growth measures and in terms of overall performance (Zamani
et al., 2013). To test for the positive relationship of strategy with performance, the
following hypothesis is stated:
H5: Strategy has a positive relationship with performance
There are many contingent factors such as firm size and industry in which the
organization is placed in can influence the performance significantly. Firm size is one of
the widely used contingent variables (Smith et al., 1986). The performance and the choice
of strategy vary for small, medium, and large size because the structure, availability of
resources, and skill set varies with the variation in firm size. For example, larger
organizations have more resources available to pursue a variety of opportunities than
small firms. Large firms benefit by economies of scale but at the same time a growth in a
firm size exposes the firm to higher agency costs which rise the agency conflicts and
escalates the differences in the interests of contracting parties. Characteristics like the
ability to make use of scale economies, diverse capabilities, and formalization of
procedures help larger firms to produce better results than the smaller firms in terms of
financial performance. On the other hand, small sized firms are likely to get benefits from
the spirit of corporate entrepreneurship for growth (S. Shah, Tahir, Anwar, & Ahmad,
2016). Also, the strategy formulation process differs between small and large firms, with
smaller firms showing a preference for simplistic models. Smaller firms tend to abandon
their strategic planning process because they operate in less complex environments
(Ouakouak & Ammar, 2015; Parnell, 2008).
89
From above discussion, it is expected that firm size has a significant impact on
organizational performance. There are evidence for and against of this expectation. To
see the contingent impact of firm size on performance, the following hypothesis is stated:
H6: The Firm size has a significant impact on firm performance
Similarly, the industry, in which an organization operates, is one of the most often
mentioned influencing variables on performance in strategy-performance relationship
studies. According to Thomas and Ramswamy (1996), industry can significantly limit
managerial influence. The evolving structure of an industry due to market forces,
constrains the managers to proactively design or implement strategy in order to achieve
superior organizational performance. Although a multi-industry sample is considered to
enhance the external validity of findings, there is a substantial body of literature which
contends that industry factors can severely affect statistical results and interpretations.
Because of the industry dynamics, the profitability varies significantly across industries,
making the industry a significant predictor of firm profitability (Jennings et al., 2003;
Madanoglu et al., 2014; Thornhill & White 2007). Based on these arguments, the
hypothesis for testing the influence of industry on organizational performance is stated as
below:
H7: The Industry has a significant impact on firm performance
A firm should have a functional fit among the elements of its environment, strategy, and
structure to achieve competitive advantage (Luoma, 2015). In view of Miles and Snow,
strategy is relatively binding because it constrains the firms in its responses to the
environment. According to them, each of their three viable strategies can be found in any
industry. Each strategy can perform equally well if properly implemented. However, the
evidence from prior studies shows that the performance of an organization varies across
the firm size (Blackmore & Nesbitt, 2013; Jennings et al., 2003; Smith et al., 1989).
Similarly, the influence of industry was significant showing significant variation in the
performance due to industry impact (Blackmore & Nesbitt, 2013). To test the contingent
impact of both firm size and industry, the following hypothesis is formulated:
90
While Hambrick (1983) pointed out that the generic character of the Miles and Snow
typology ignores environmental and industry peculiarities, there are strong evidences that
the interaction between strategy, size, and industry significantly affect the organizational
performance. This means that the performance of viable strategic types varies for
different firm size and in different industries (Sarac et al., 2014; Smith et al., 1986, 1989).
In this context, Shortell & Zajac (1990) stressed for further investigation of Miles and
Snow’s conception of generic strategies tendency for their equal viability across
environmental contexts and time. Therefore, to test the contingent impact of firm size and
industry on strategy-performance relationship, we set the following hypotheses:
H8: The performance of strategic types varies with the change in industry and firm
size
Contingency approach views organizations as social systems. The continuous
coordination within sub-systems is achieved through the implementation of management
policies. The interaction of the resultant fit of coordination helps in achieving
organizational objectives and goals (Olson et al., 2005). Therefore, the performance of an
organization is dependent on the congruence of its internal fit (strategy and structure) and
its alignment with the external or environmental fit (Luoma, 2015; Wilden et al., 2013).
Hence, strategy, firm size, and industry when combined together have significant impact
on organizational performance. Therefore, the following hypothesis is stated for this
purpose:
H9: Combined together, strategy, size, and industry has a significant impact on firm
performance
The performance of an organization is influenced by the structural, organizational, and
environmental contingencies. The most important contingencies include firm size,
strategy, and industry. A specific strategic type force the management to modify the
structure which in turn influence the performance. Also, when a firm grows in size, it
gradually becomes structured, formalized, and routinized. At the same time industry can
significantly constraints the managerial influence for making strategic decisions due to
91
the dynamics and peculiarities prevailing in a specific industry (Jennings et al., 2003; Lex
Donaldson, 2001; Moss et al., 2014; Thomas & Ramaswamy, 1996). To test the
interactive impact of different combinations of strategy, size, and industry, the hypothesis
is stated as below:
H10: Interaction for possible combinations of strategy, size, and industry has a
significant impact on performance
When firms grow in size their structure becomes more formal and their processes are
routinized. Therefore, institutionalized processes in response to environmental shifts
minimize the role of managers and strategy. Similarly, the industry can significantly
constrain the managerial influence the strategic decisions of the managers. Also, the
performance of an organization is closely related with the performance of its industry
which is mostly affected by some structural components such as input costs, price level,
and product diversification etc. Hence, firm size and industry membership is sometimes
more significant drivers of performance than the strategy. However, the management
holds a control on resources and has the capability to cope with the environmental
changes. This enables them to select an appropriate course of action despite the limitation
imposed by firm size and the industry. Thus, strategic behaviour and resources of the
firms continue to play a significant part in shaping organizational fortune and hence
influencing performance despite the constraints of the environment (Jennings et al., 2003;
Moss et al., 2014; Thomas & Ramaswamy, 1996). Based on these arguments, we state
that strategy is the better predictor of the performance than firm size and industry. This is
tested through the following hypothesis:
H11: Strategy is a better predictor of performance than size and industry
3.7 Summary
The empirical review of the literature provides sufficient support in favor of applying the
Miles and Snow framework for current study. Also, there are number of opportunities
where more research can be done. The strong support for this typology is supported by
the increasing studies being done using this typology and its application in a variety of

92
industries and also in cross-country studies. These studies used data from a single
industry at a time as well as from multi-industry data. Similarly, research is done in a
single country as well as in cross-country settings. Generally, prospectors and defenders
strategies are operationalized in the studies where archived data (depicting realized
strategy) is used treating analyzers as the balancing strategy. Reactor strategy is mostly
ignored in these studies mainly due to methodological limitations. Similarly, little or no
research is available that investigate the behavior of firms’ strategic stance over the time
to check their consistency, flexibility, and inconsistency (reactor strategy). The increasing
demand for hybridization of strategy to have sustainable performance also demands the
separate and comparative study of pure versus hybrid strategies. The refinement in
methodology is also needed especially for having a standardized procedure to
operationalize and classify the firms into certain theoretically supported strategic groups.
The srategy-performance linkage applying Miles and Snow typology with archived
financial data is an under researched area in developing countries including Asia.
According to Parnell et al. (2015), the environments in developing countries are
fundamentally different as they lack many of essential resource, infrastructure and control
systems representing more risks and uncertainty than the developed countries although,
they represent attractive markets at the same time. Also, they have different demand
features and level of stability than their counterpart developed economies. Hence, it can
be expected that underlying assumptions of Miles and Snow typology regarding
performance and strategic behavior of the firms may be different from western developed
countries. Therefore, there is a great significance of doing research in environment like
Pakistan where the systems are not well established and supportive for designing and
implementing specific strategies on sustainable basis.

93
Chapter 4
Research Methodology
94
4.1 Introduction
This chapter presents the research paradigm, research design and methodology adapted
for this research. Research paradigm discusses the ontology and epistemology of the
positivists approach used for this research. Followed by the research design, selection of
sample size and collection of relevant strategic, performance, and contingent variables; a
detailed scoring methodology for operationalization of strategic orientation of the firms
using SAS codes; the categorization of strategic groups based on Miles and Snow’s
strategic types, strategic purity and hybridization, and strategic consistency and
flexibility; and explanation of the methodology for descriptive analysis and for ANOVA
and regression analysis.
4.2 Research Paradigm
A research paradigm is a systematic set of beliefs that dictates what researchers in a
particular discipline should study, how research should be conducted and how results
should be interpreted (Lincoln and Guba 1985; Bryman and Bell 2011). A research
paradigm consists of three elements: ontological, epistemological and methodological
question (Guba and Lincoln 1994). Ontology is concerned with the nature of reality and
existence and what can be known about it (Guba and Lincoln 1994; Thomas 2004;
Easterby-Smith et al. 2012). The ontological paradigm concerns with the essence of the
phenomena which is under research or investigation. Here, the fundamental questions
faced by the social researchers are “what is the nature of reality” or “what the nature of
the knowable is?” On the other hand, epistemology questions what might represent
knowledge or evidence of the entities or ‘reality’ that one wishes to investigate (Mason
2002). Epistemology concerns the relationship between the researcher and what can be
known (Guba and Lincoln 1994) and therefore provides assumptions guiding the
knowledge inquiry (Easterby-Smith 2012). Finally, methodology is a combination of
techniques used by the researcher in finding out what is believed or to be known (Guba
and Lincoln 1994) and stipulates how the research could be practically done (Bo Zhang,
2011). Hence, the selection of the appropriate research methodology is constrained by the
ontological and epistemological choice of the researcher (Mariyani Ahmad Husairi,
2014)
95
There are many research paradigms but two most widely applied paradigms are positivist
and interpretivist paradigms. In positivistic approaches, the study of human nature and
behaviors is carried similar to the research conducted in the pure sciences (Collis &
Hussey, 2003). Positivists make efforts to create a knowledge of a reality existence of
which is beyond the mind of human. Positivists consider that experiences of human about
the world is reflected as an objective reality. On the other hand, the interpretivist
paradigm was developed as a reaction to this approach by social scientists. They argue
that the scientific models are not applicable to the social sciences. According to Burr
(1995), interpretivist view human knowledge is reflected by specific goals, experience,
culture, and history of those things which were created by humans within social world
framework (SEBAA, 2010).
This study is an empirical investigation of causal relationship of strategy with
performance and the interactive effect of firm size and industry with strategy on
performance. The approach is deductive as hypotheses are developed on the basis of
existing literature and tested using secondary data. The research is, therefore, fall under
the positivist research paradigm which is explained in detail below.
4.2.1 Positivist Approach
The positivist viewpoint assumes that the individual should be free of subjectivity,
exempt of feelings, sentiments, or intuition. According to Gill and Johnson (1991, p. 32)
“the processes by which theories and hypotheses are tested are often rated as more
important than the source of such theories and the essence of positivism is the
identification of causal relationships”. According to Saunders et al (1997), a positivist
approach: deduct the hypothesis from the theory; express these hypothesis for
operationalization; tests the operational hypotheses; and examines the outcome. Besides,
if necessary, positivist approach modifies the theory in the light of the findings or
outcomes. Hence, a positivist approach is a highly structured methodology that facilitates
the replication of the methodology in other settings. There is clarity of research questions
and the methods that are used to test the models. Large sample size is with generally
96
quantitative data analysis techniques are used (Susana C. S. F. Rodrigues, 2002). The
positivistic approach emphasizes interdependence and causality, reductionism and
generalization.
The objectives of the common research in social science is to identify causal relationship
and their explanations to generate principles that explain consistency in human behavior
(Easterby-Smith et al., 1996) (Susana C. S. F. Rodrigues, 2002). Here, rather than human
interests and desires, the object of the research is defined by objective criteria. The
advocacy of the paradigm is to apply natural science methods to investigate and study the
social science reality. This is done by explaining and predicting the happening in the
social world by finding the causal relationships between constituent elements of the
research phenomena (Burrel and Morgan, 1994). Generally, five broad principles are
highlighted by Bryman & Bell (2007) for positivist paradigm.
1. The knowledge is said to be genuine only if that can be confirmed by the sense.
2. The purpose of theory is to generate hypotheses for explanations of laws to be
assessed.
3. Knowledge is based on the collection of facts that provide the basis for laws.
4. Scientific research must be conducted in a way that is value free.
5. Creating a clear distinction between normative statements and the scientific
statements with the belief that the scientific statements are the true domain of the
researchers
In positivist approach, data collection is relatively easy, clear theoretical foundation, the
control of researcher on the research process and the results are relatively easy to
compare with the findings of other studies.
This research follows deductive approach as it developed the research model and
hypotheses based on theory. The basic approach followed in this study is that of theory
testing through empirical research. A set of testable hypotheses have been formulated on
the basis of theoretical underpinnings and the findings of previous studies. These
hypotheses have been tested and conclusion are derived by using relevant statistical tools
and techniques in order to assess and model the relationships. The longitudinal archived
97
financial data of 307 joint stock companies listed at Pakistan Stock Exchange is used for
this purpose. The study operationalizes the concepts of Miles and Snow strategic types.
The strategies are further classified as pure and hybrid, consistent and flexible, and
reactors using measurable constructs. Firm size (small, medium, and large) and industry
(twelve economic groups) are used as contingent factors along with strategy. A multi-
industry and single industry analyses is done for generalization of the findings.
4.3 Research Design
There are number of methods used to measure the strategic orientation of an organization.
Snow and Hambrick (1980) introduced four main approaches which are most widely
applied:
1. Investigator inference method: In this method, the researcher uses all of the
available information about the strategic orientation of an organization and
assesses its strategic choice
2. Self-typing method: In this approach, the organization's management (usually top
management) is asked to categorize the organization's strategy from among
alternatives
3. External assessment method: Here, an expert panel is asked to assess the
strategic orientation of a given organization
4. Objective indicators method: It involves proxies for measuring parameters that
provide information about the strategic orientation of an organization
The first two methods are used to identify the intended strategy of the firm while the last
two methods are used for knowing the realized strategy. Since, this study investigates the
realized strategy of the selected firms, the first two methods are excluded from
consideration. Comparing the advantages and disadvantages of the last two methods, we
excluded the external assessment method because objective indicator method has certain
advantages over it. These advantages are aligned with the objectives of this study. The
advantages of objective indicator methods include:
98
The objective indicators method allows differentiation between strategic changes and
strategic adjustments if the data is available for sufficient time period (usually five
years or longer).
The objective indicators method is comparatively appropriate for identifying realized
strategies because it controls for perceptual and interpretive bias.
This method allows large, heterogeneous samples.
Snow and Hambrick (1980) provided a detail of advantages and disadvantages of all four
methods mentioned above. Keeping in view the number of advantages and the nature and
availability of data for sufficient time period, this study uses the objective indicators for
measuring strategy and performance.
4.4 Strategy and Performance Variables, Sample size, Tools and
Techniques
The information regarding the research where objective measures are used is summarized
in Table 4.1. It represent the list of the strategy and performance variables. It also
provides the information about the sample size of the studies, industry in which the
research is carried out, research methods used for the research, and tools and techniques
used to carry out the research where objective measure are applied.
The variables used for measuring and operationalizing strategy are related to the aspects
of strategic orientation and they are used to find: “the marketing and R&D focus”;
“growth and production capability”; “capital intensity”; “cost efficiency”; and
“diversification of the firms” etc. The common indicators used for measuring financial
performance are: ROA, ROE, ROS, and Growth Rates. Other financial performance
measures include “Return on Capital Employed –ROCE”, “Cash Flow on Investment -
CFOI” “Earning Per Share –EPS”, and “Annual Stock Return –ASR” etc. whereas
customer satisfaction and service quality are used as non-financial performance
measures.
Researchers used varying number of measures for operationalization of strategy and
performance. For example, Luoma (2015) used multiple performance measures based on
multiple categories such as: Profitability (Operating Margin, Profit Margin, Return on
99
Capital Employed, and Return on Total Capital); Growth (change of net sales); Solvency
(Equity Ratio, Net Gearing, Relative Indebtness); Liquidity (Quick Ratio, Current Ratio);
Cash Management and activity measures (Working Capital, Inventory to Sales ratio,
Sales Receivable Turnover, Accounts Payable Turnover). Hambrick et al. (1982) used
ROI, Cash flow on Investment (CFOI), Sales Growth, Return per Risk, and Market share
change as performance measures. Ittner et al. (1997) used both financial and non-
financial performance measures in the same study. For financial measures, they used
Sales, EPS, and ROA while for non-financial measures, customer satisfaction and service
quality were used. Blackmore & Nesbitt (2013) used ROA, ROE, Growth in
employment, Growth in sales, and Growth in assets in one study.
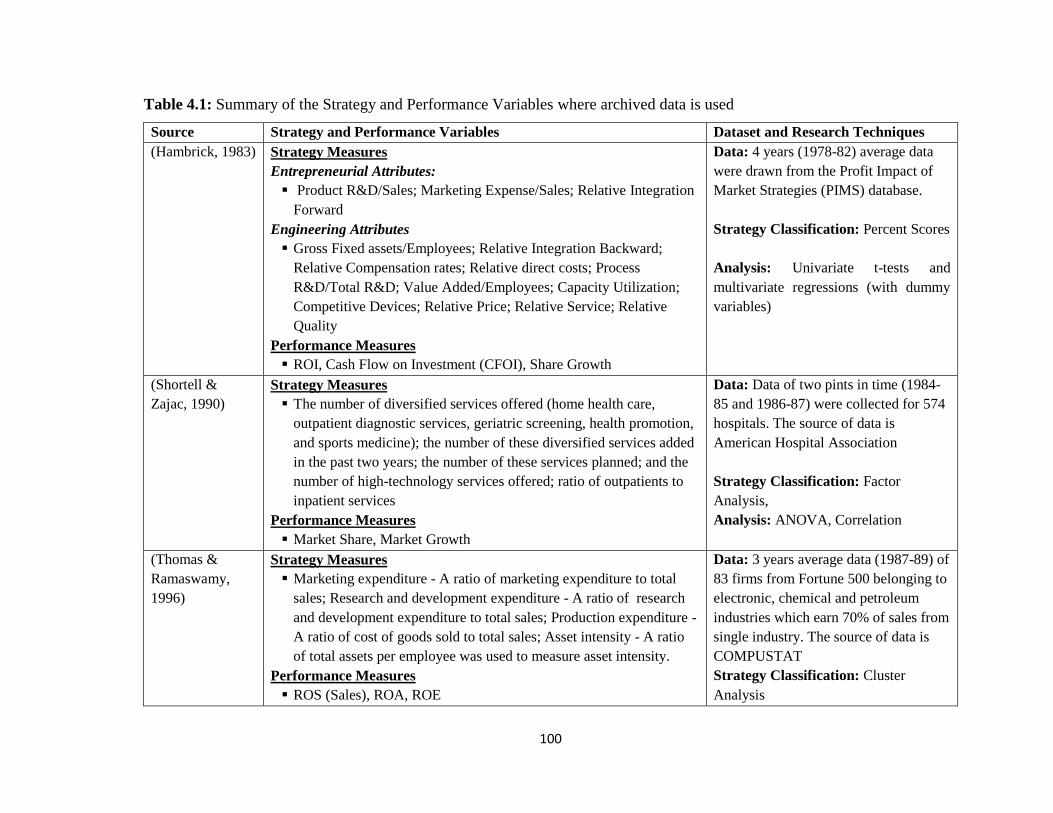
100
Table 4.1: Summary of the Strategy and Performance Variables where archived data is used
Source Strategy and Performance Variables Dataset and Research Techniques
(Hambrick, 1983) Strategy Measures
Entrepreneurial Attributes:
Product R&D/Sales; Marketing Expense/Sales; Relative Integration
Forward
Engineering Attributes
Gross Fixed assets/Employees; Relative Integration Backward;
Relative Compensation rates; Relative direct costs; Process
R&D/Total R&D; Value Added/Employees; Capacity Utilization;
Competitive Devices; Relative Price; Relative Service; Relative
Quality
Performance Measures
ROI, Cash Flow on Investment (CFOI), Share Growth
Data: 4 years (1978-82) average data
were drawn from the Profit Impact of
Market Strategies (PIMS) database.
Strategy Classification: Percent Scores
Analysis: Univariate t-tests and
multivariate regressions (with dummy
variables)
(Shortell &
Zajac, 1990)
Strategy Measures
The number of diversified services offered (home health care,
outpatient diagnostic services, geriatric screening, health promotion,
and sports medicine); the number of these diversified services added
in the past two years; the number of these services planned; and the
number of high-technology services offered; ratio of outpatients to
inpatient services
Performance Measures
Market Share, Market Growth
Data: Data of two pints in time (1984-
85 and 1986-87) were collected for 574
hospitals. The source of data is
American Hospital Association
Strategy Classification: Factor
Analysis,
Analysis: ANOVA, Correlation
(Thomas &
Ramaswamy,
1996)
Strategy Measures
Marketing expenditure - A ratio of marketing expenditure to total
sales; Research and development expenditure - A ratio of research
and development expenditure to total sales; Production expenditure -
A ratio of cost of goods sold to total sales; Asset intensity - A ratio
of total assets per employee was used to measure asset intensity.
Performance Measures
ROS (Sales), ROA, ROE
Data: 3 years average data (1987-89) of
83 firms from Fortune 500 belonging to
electronic, chemical and petroleum
industries which earn 70% of sales from
single industry. The source of data is
COMPUSTAT
Strategy Classification: Cluster
Analysis
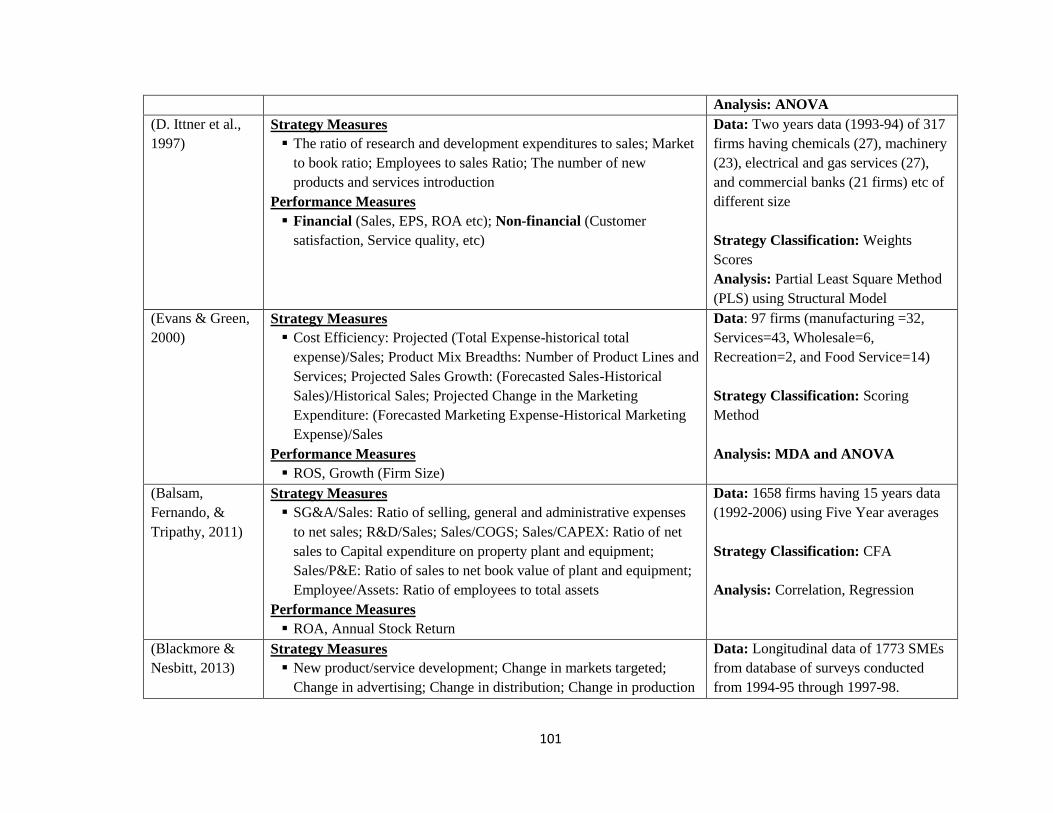
101
Analysis: ANOVA
(D. Ittner et al.,
1997)
Strategy Measures
The ratio of research and development expenditures to sales; Market
to book ratio; Employees to sales Ratio; The number of new
products and services introduction
Performance Measures
Financial (Sales, EPS, ROA etc); Non-financial (Customer
satisfaction, Service quality, etc)
Data: Two years data (1993-94) of 317
firms having chemicals (27), machinery
(23), electrical and gas services (27),
and commercial banks (21 firms) etc of
different size
Strategy Classification: Weights
Scores
Analysis: Partial Least Square Method
(PLS) using Structural Model
(Evans & Green,
2000)
Strategy Measures
Cost Efficiency: Projected (Total Expense-historical total
expense)/Sales; Product Mix Breadths: Number of Product Lines and
Services; Projected Sales Growth: (Forecasted Sales-Historical
Sales)/Historical Sales; Projected Change in the Marketing
Expenditure: (Forecasted Marketing Expense-Historical Marketing
Expense)/Sales
Performance Measures
ROS, Growth (Firm Size)
Data: 97 firms (manufacturing =32,
Services=43, Wholesale=6,
Recreation=2, and Food Service=14)
Strategy Classification: Scoring
Method
Analysis: MDA and ANOVA
(Balsam,
Fernando, &
Tripathy, 2011)
Strategy Measures
SG&A/Sales: Ratio of selling, general and administrative expenses
to net sales; R&D/Sales; Sales/COGS; Sales/CAPEX: Ratio of net
sales to Capital expenditure on property plant and equipment;
Sales/P&E: Ratio of sales to net book value of plant and equipment;
Employee/Assets: Ratio of employees to total assets
Performance Measures
ROA, Annual Stock Return
Data: 1658 firms having 15 years data
(1992-2006) using Five Year averages
Strategy Classification: CFA
Analysis: Correlation, Regression
(Blackmore &
Nesbitt, 2013)
Strategy Measures
New product/service development; Change in markets targeted;
Change in advertising; Change in distribution; Change in production
Data: Longitudinal data of 1773 SMEs
from database of surveys conducted
from 1994-95 through 1997-98.
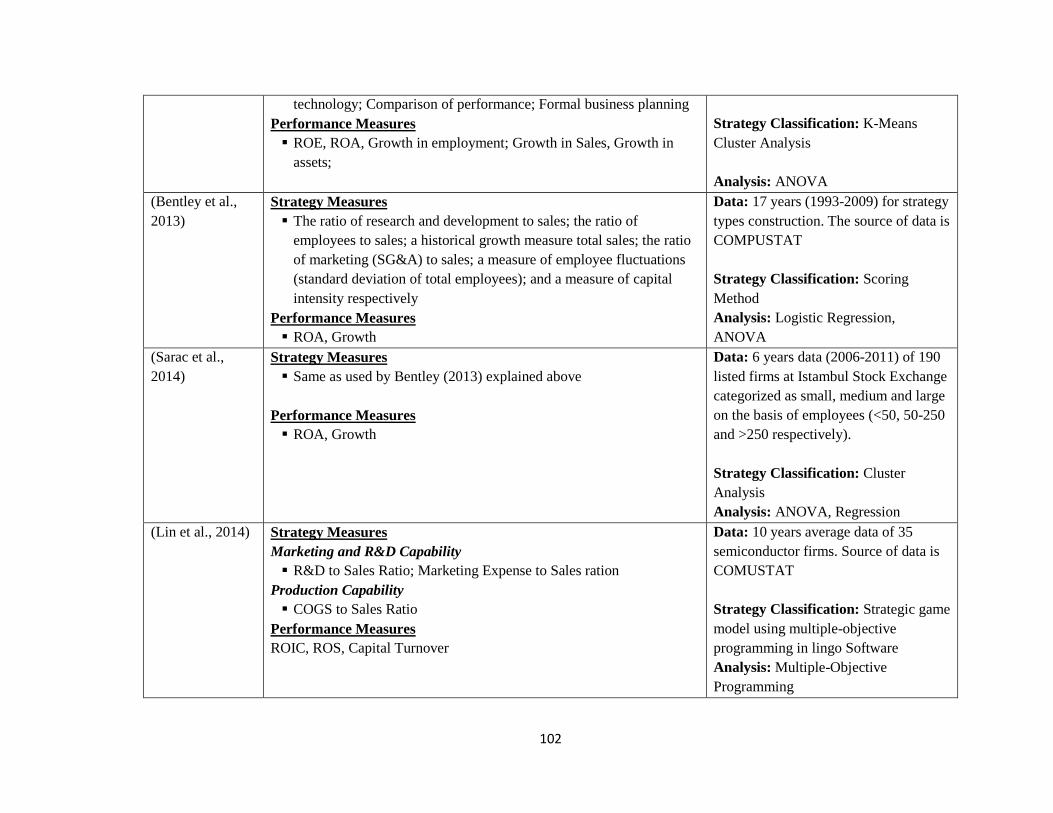
102
technology; Comparison of performance; Formal business planning
Performance Measures
ROE, ROA, Growth in employment; Growth in Sales, Growth in
assets;
Strategy Classification: K-Means
Cluster Analysis
Analysis: ANOVA
(Bentley et al.,
2013)
Strategy Measures
The ratio of research and development to sales; the ratio of
employees to sales; a historical growth measure total sales; the ratio
of marketing (SG&A) to sales; a measure of employee fluctuations
(standard deviation of total employees); and a measure of capital
intensity respectively
Performance Measures
ROA, Growth
Data: 17 years (1993-2009) for strategy
types construction. The source of data is
COMPUSTAT
Strategy Classification: Scoring
Method
Analysis: Logistic Regression,
ANOVA
(Sarac et al.,
2014)
Strategy Measures
Same as used by Bentley (2013) explained above
Performance Measures
ROA, Growth
Data: 6 years data (2006-2011) of 190
listed firms at Istambul Stock Exchange
categorized as small, medium and large
on the basis of employees (<50, 50-250
and >250 respectively).
Strategy Classification: Cluster
Analysis
Analysis: ANOVA, Regression
(Lin et al., 2014) Strategy Measures
Marketing and R&D Capability
R&D to Sales Ratio; Marketing Expense to Sales ration
Production Capability
COGS to Sales Ratio
Performance Measures
ROIC, ROS, Capital Turnover
Data: 10 years average data of 35
semiconductor firms. Source of data is
COMUSTAT
Strategy Classification: Strategic game
model using multiple-objective
programming in lingo Software
Analysis: Multiple-Objective
Programming
103
4.5 Sample and Data
A sound, stable and robust industrial base, represented by non-financial corporate sector,
is an important segment of a country’s economy and is, therefore, essential for economic
wellbeing of a country. In Pakistan, non-financial corporate sector is divided into 12
diversified nature of businesses/economic groups including: “Textile; Food; Chemical,
Chemical products, and Pharmaceuticals; Other Manufacturing; Non-metallic Mineral
Products; Motor Vehicles, Trailers and Auto parts; Fuel and Energy; Information;
Communication and Transport Services; Coke and Refined Petroleum products; Paper,
Paper board and Products; Electrical Machinery and Apparatus; Other Services
activities”.
The study uses seven years (2007-13) multi-industry data of joint stock companies in
Pakistan. The total number of firms listed on Pakistan Stock Exchange (PSE) formerly
known as Karachi Stock Exchange (KSE) at the end of year 2013 were 396 including
both public and private firms. The final list of 307 firms was based on the following
selection criteria:
1. A firm to be included for analysis must be listed for year 2013. This means that
the age of the firm must not be less than 7 years i.e. it must have remained listed
for the last seven consecutive years
2. The value of sales of a selected firm should not be zero for any years within study
time period i.e. for all 7 years of interest (from 2007-2013).
3. The firms with outlier numbers for one of the selected variables are also excluded
to have representative results
Based on the above selection criteria, a total of 33 firms (8% of total firms) were
excluded because of age factor (condition one above). On the basis of non-zero sale
criteria, 43 firms (about 11%) were excluded because of second condition while 13 firms
(3%) were dropped from the study because of third condition. Hence, the final list include
307 firms fulfilling the above selection criteria which is 78% of the total population. The
data is taken from the Central Bank of Pakistan’s (State Bank of Pakistan) publication
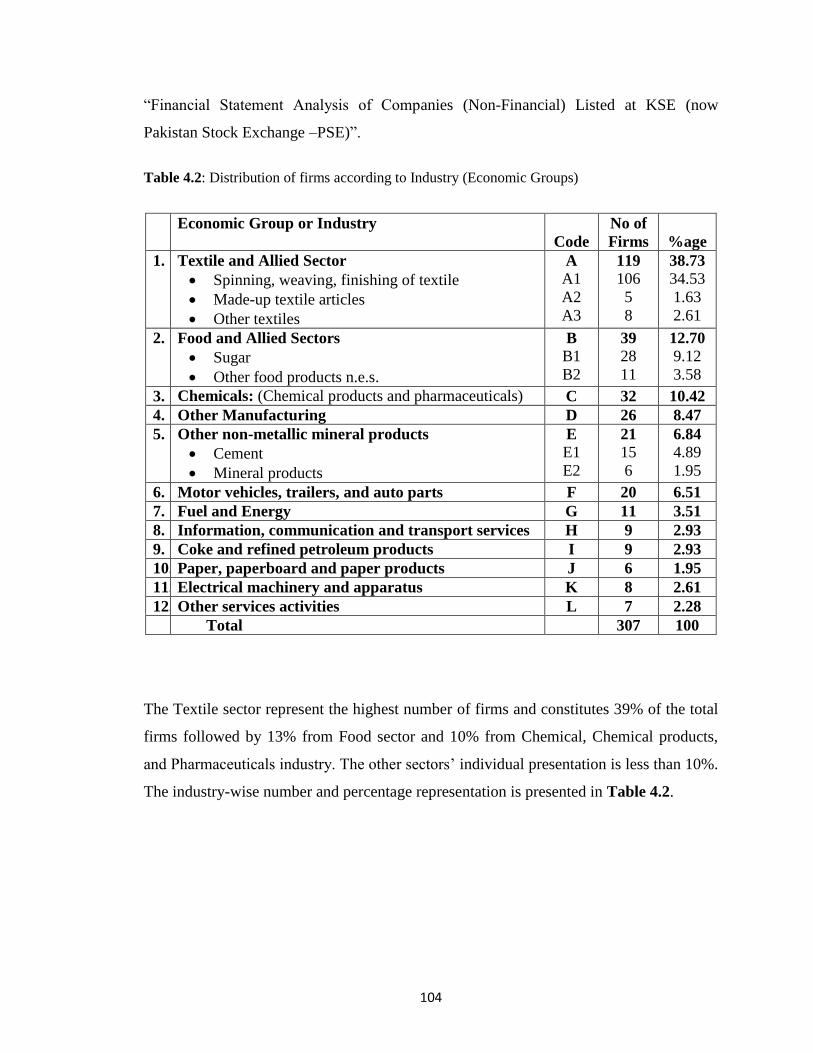
104
“Financial Statement Analysis of Companies (Non-Financial) Listed at KSE (now
Pakistan Stock Exchange –PSE)”.
Table 4.2: Distribution of firms according to Industry (Economic Groups)
Economic Group or Industry
Code
No of
Firms
%age
1. Textile and Allied Sector
Spinning, weaving, finishing of textile
Made-up textile articles
Other textiles
A
A1
A2
A3
119
106
5
8
38.73
34.53
1.63
2.61
2. Food and Allied Sectors
Sugar
Other food products n.e.s.
B
B1
B2
39
28
11
12.70
9.12
3.58
3. Chemicals: (Chemical products and pharmaceuticals) C 32 10.42
4. Other Manufacturing D 26 8.47
5. Other non-metallic mineral products
Cement
Mineral products
E
E1
E2
21
15
6
6.84
4.89
1.95
6. Motor vehicles, trailers, and auto parts F 20 6.51
7. Fuel and Energy G 11 3.51
8. Information, communication and transport services H 9 2.93
9. Coke and refined petroleum products I 9 2.93
10. Paper, paperboard and paper products J 6 1.95
11. Electrical machinery and apparatus K 8 2.61
12. Other services activities L 7 2.28
Total 307 100
The Textile sector represent the highest number of firms and constitutes 39% of the total
firms followed by 13% from Food sector and 10% from Chemical, Chemical products,
and Pharmaceuticals industry. The other sectors’ individual presentation is less than 10%.
The industry-wise number and percentage representation is presented in Table 4.2.
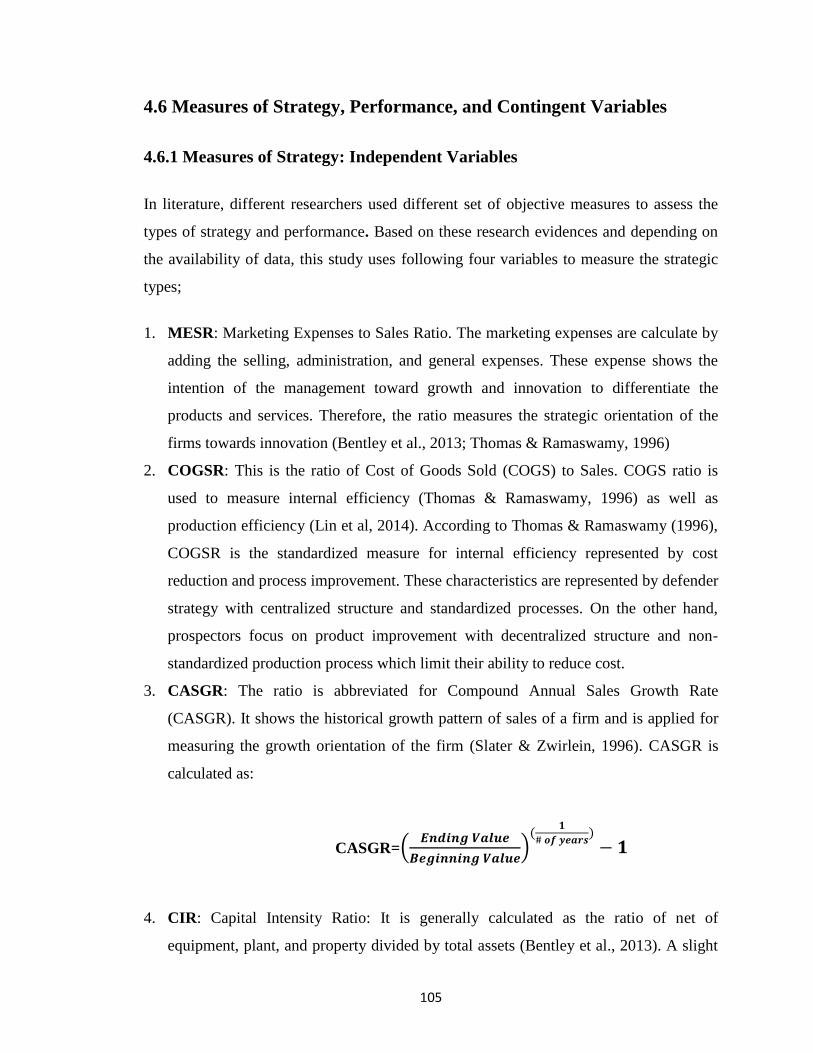
105
4.6 Measures of Strategy, Performance, and Contingent Variables
4.6.1 Measures of Strategy: Independent Variables
In literature, different researchers used different set of objective measures to assess the
types of strategy and performance. Based on these research evidences and depending on
the availability of data, this study uses following four variables to measure the strategic
types;
1. MESR: Marketing Expenses to Sales Ratio. The marketing expenses are calculate by
adding the selling, administration, and general expenses. These expense shows the
intention of the management toward growth and innovation to differentiate the
products and services. Therefore, the ratio measures the strategic orientation of the
firms towards innovation (Bentley et al., 2013; Thomas & Ramaswamy, 1996)
2. COGSR: This is the ratio of Cost of Goods Sold (COGS) to Sales. COGS ratio is
used to measure internal efficiency (Thomas & Ramaswamy, 1996) as well as
production efficiency (Lin et al, 2014). According to Thomas & Ramaswamy (1996),
COGSR is the standardized measure for internal efficiency represented by cost
reduction and process improvement. These characteristics are represented by defender
strategy with centralized structure and standardized processes. On the other hand,
prospectors focus on product improvement with decentralized structure and non-
standardized production process which limit their ability to reduce cost.
3. CASGR: The ratio is abbreviated for Compound Annual Sales Growth Rate
(CASGR). It shows the historical growth pattern of sales of a firm and is applied for
measuring the growth orientation of the firm (Slater & Zwirlein, 1996). CASGR is
calculated as:
CASGR=(𝑬𝒏𝒅𝒊𝒏𝒈 𝑽𝒂𝒍𝒖𝒆
𝑩𝒆𝒈𝒊𝒏𝒏𝒊𝒏𝒈 𝑽𝒂𝒍𝒖𝒆)
(𝟏
# 𝒐𝒇 𝒚𝒆𝒂𝒓𝒔)
− 𝟏
4. CIR: Capital Intensity Ratio: It is generally calculated as the ratio of net of
equipment, plant, and property divided by total assets (Bentley et al., 2013). A slight
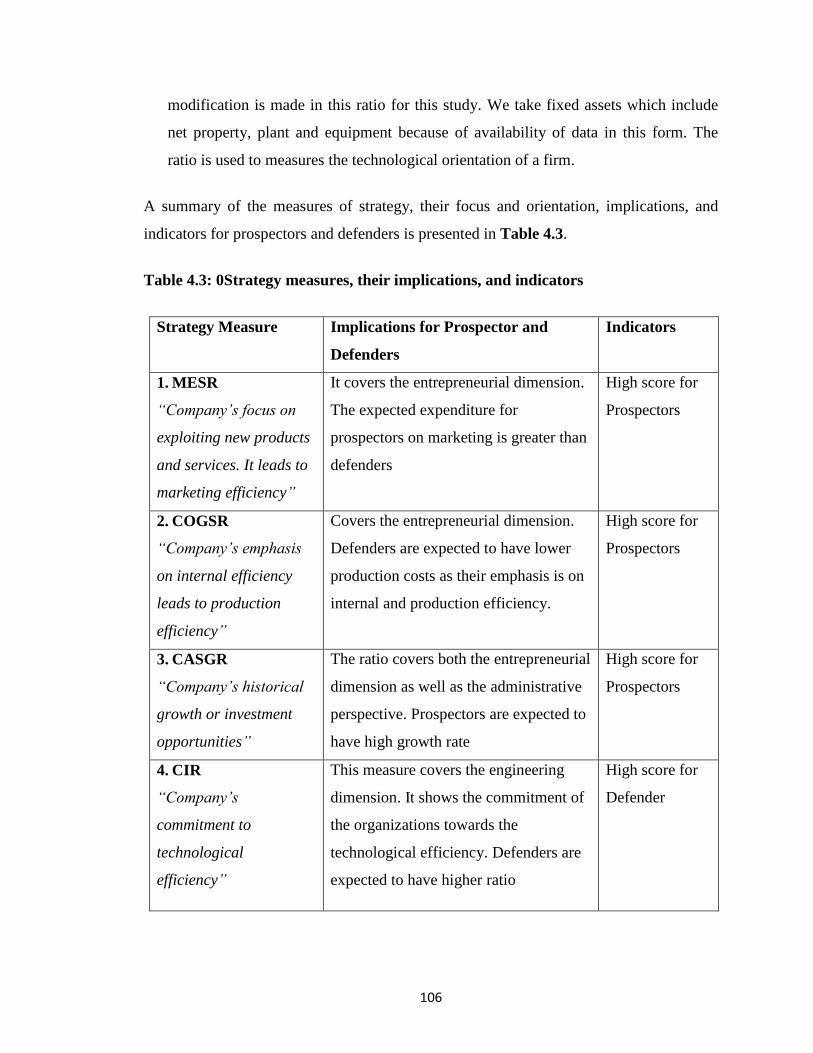
106
modification is made in this ratio for this study. We take fixed assets which include
net property, plant and equipment because of availability of data in this form. The
ratio is used to measures the technological orientation of a firm.
A summary of the measures of strategy, their focus and orientation, implications, and
indicators for prospectors and defenders is presented in Table 4.3.
Table 4.3: 0Strategy measures, their implications, and indicators
Strategy Measure Implications for Prospector and
Defenders
Indicators
1. MESR
“Company’s focus on
exploiting new products
and services. It leads to
marketing efficiency”
It covers the entrepreneurial dimension.
The expected expenditure for
prospectors on marketing is greater than
defenders
High score for
Prospectors
2. COGSR
“Company’s emphasis
on internal efficiency
leads to production
efficiency”
Covers the entrepreneurial dimension.
Defenders are expected to have lower
production costs as their emphasis is on
internal and production efficiency.
High score for
Prospectors
3. CASGR
“Company’s historical
growth or investment
opportunities”
The ratio covers both the entrepreneurial
dimension as well as the administrative
perspective. Prospectors are expected to
have high growth rate
High score for
Prospectors
4. CIR
“Company’s
commitment to
technological
efficiency”
This measure covers the engineering
dimension. It shows the commitment of
the organizations towards the
technological efficiency. Defenders are
expected to have higher ratio
High score for
Defender
107
4.6.2 Measuring Performance: Dependent Variables
Accounting and financial data is often the most used source for measuring strategic
performance when objective data collection methods are used. Within these measures,
most frequently used accounting-based performance indicators are: Return on Assets
(ROA), Return on Equity (ROE), Return on Sales (ROS) or Gross Profit, Net Profit
Margin (NPM) etc. In contrast, the market-based performance indicators use market data
as a source for performance measures. The market-based method is based on an ‘outside-
in’ approach to evaluate performance. “Market Share”, “Tobin’s Q”, “Jensen’s Alpha”,
and “Sharp Measure” etc. are the most commonly used market based performance
indicators (Eikelenboom, 2005).
Four performance measures (dependent variables) are used for this study. These measures
shows different aspects of profitability generated through the application of assets
(ROA), return generated in response to sales (ROS), return based on owners’ equity
(ROE), and return based on the overall capital employed (ROCE). The definitions and
calculation of these measures are based on the State Bank of Pakistan’s publication
“Financial Statement Analysis of Listed Companies” (State Bank of Pakistan, 2014) The
rationale behind the choice of multiple financial performance measures is to avoid
subjectivity in the data and to avoid a restricted and narrow view of performance
(Salavou, 2015). These measures are briefly explained below:
Return on Assets (ROA): ROA gives an idea about the efficiency of the management in
utilizing of an organization’s assets to generate profits. ROA is an indicator of how
profitable a company is relative to its total assets. Calculated by dividing a company's net
profit before tax (NPBT) by its total assets, ROA is displayed as a percentage. The assets
of the company are comprised of both current and non-current assets. The higher the
ROA, the better the performance is. The ROA is useful when the profitability of an
organization or a group of organizations is compared with the performance of another
firm or group of firms in the same industry or across industries.
108
Return on Equity (ROE): ROE measures a firm’s profitability in response to the money
invested by the owners or the shareholders of the firm. ROE is calculated as a ratio of net
profit before tax (NPBT) to Average Shareholder's Equity and is expressed as a
percentage. The ROE is useful when the profitability of an organization or a group of
organizations is compared with the performance of another firm or group of firms within
the same industry.
Return on Sales (ROS): ROS is a profitability ratio widely used to measure a firm’s
operational efficiency. It is also known as a firm's "Operating Profit Margin". This
measure helps management in knowing how much profit is being produced by per rupee
of sales. ROS is used to compare a company's performance over the time to look for
trends. It is also used to compare the performance of the firm with its competitors with in
the same industry. An increasing trends in ROS is the indicator of growth and efficiency.
ROS is calculated as the ratio of NPBT (Net Profit Before Tax) to Sales.
Return on Capital Employed (ROCE): ROCE, usually expressed in percentage
terms, measures the returns that a business generates from its employed capital.
Employed Capital is equal to a company's Equity plus Non-current liabilities (or Total
Assets − Current Liabilities). In other words, it is the long-term funds that a firm has
generated for business operations. ROCE indicates the efficiency and profitability of a
company's capital investments. To be efficient and to create shareholders’ value, ROCE
should always be higher than the rate at which the company borrows its capital. It is
calculated as the ratio of NPBT to Average Capital Employed.
4.6.3 Measuring Contingency Variables
The performance of an organization is the outcome of the fit that a firm creates between
certain organizational characteristics and the environmental context. The performance is
affected by the internal characteristics of an organization (e.g. firm size) as well the
environmental changes in technology, consumer behavior, and regulation etc. For
example, larger firms can outperform smaller firms as they can exploit the market
conditions due to economies of scale and bargaining power. Similarly, small firms can
109
perform better while exploring new ideas and switching quickly to the changes in the
market and technology. Also, when a firm grows in size, it becomes increasingly formal,
structured, and routinized making the adjustment in strategic orientation more complex
than the smaller firms. Looking at the external environmental influence, the industry can
significantly affect and influence the managerial choice because the ever changing
dynamics of an industry forces the management to make adjustments in designing or
implementing strategy proactively to achieve superior performance. Consequently,
environmental shifts force the management to reshape the institutionalized processes.
These arguments support the fact that industry membership and size of the firm are the
important and key determinants of organizational performance (Jennings et al., 2003;
Madanoglu et al., 2014;Thomas & Ramaswamy 1996; Sarac et al. 2014). Based on their
importance and influence on performance and strategy, firm size and industry are used as
the contingent variables for this study. These variables are briefly explained below:
Firm size –Size of the firm is one of the most important and widely used contingent
variables in strategy-performance studies. The performance and the choice of strategy
vary for small, medium, and large size because the structure, availability of resources,
and skill set varies with the variation in firm size. Strategy formulation process differs
between the firm sizes. For example, smaller firms showing a preference for simplistic
models (Parnell, 2008) while large firms are likely to adopt more comprehensive and
formal strategic processes because of their complex structures (Ouakouak & Ammar,
2015). There are many ways to divide the firms into sizes. Total assets, sales, and number
of employees are generally used for this purpose. For example, Smith et. al. (1989)
divided the number of employees into thirds to find out the cut-points for small, medium,
and large firms. Similarly, for this study total assets, based on the ranking of the total
assets of the firm, are divided into thirds, for categorizing the firms as small, medium and
large. The firms with the total assets falls in the lowest 33% are taken as small firms, the
next 33% as medium and the highest third as the large firms.
Industry– Industry is mostly used as the influencing variables on performance for multi-
industry analysis. The industry can significantly affect and influence the managerial
choice because the ever changing dynamics of an industry forces the management to
110
make adjustments in designing or implementing strategy proactively to achieve superior
performance. because of the peculiarities and distinguishing features of each industry,
performance varies significantly across industries, making the profitability of the industry
a significant predictor of firm performance (Jennings et al., 2003; Madanoglu et al., 2014;
Thomas & Ramaswamy, 1996; Thornhill & White, 2007). Keeping in view the
importance of industry in predicting the strategy and performance of an organization, it is
also taken a as contingency variable along with firm size.
4.7 Identification of Strategic Types
The strategic classification, when archived data is used, is based on cluster analysis and
scoring methods in majority research. Out of these two, cluster analysis is applied most of
the time. Although, this study applies scoring method, a brief on cluster analysis
technique is also provided.
4.7.1 Cluster Analysis
Cluster analysis is one of the widely used statistical techniques for the classification of
groups or clusters after sorting the observations into similar sets. It is often used in
strategy research to derive strategic classifications or taxonomies. It has been found to be
one of the most effective method for revealing known group structures in a data set.
Cluster Analysis became popular after its application by Hatten in a series of research
during 1974-1978. Cluster Analyses takes a sample of elements (e.g. organization) and
group them in a way that the variance or standard deviation among the groups is
minimized while it is maximized between the groups. However, according to Ketchen &
Shook, (1996), the application of cluster analysis is a multifaceted challenge because to
determine the quality of the clusters, it requires several methodological choices. Research
reveals that the implementation of cluster analysis has been often less than ideal because
of certain limitations. For example, extensive reliance on the researcher’s judgment;
lacking an underlying theoretical bases; the potential of not only to offer inaccurate
depiction of the grouping in a sample but also to impose grouping where none exists; and
it ignores time effect etc. (Ketchen & Shook, 1996).
111
To overcome these limitations and to provide researchers an alternative and easy to use
methodology, we propose the scoring methodology, discussed below, to identify the
strategic orientation of the firms.
4.7.2 Conceptual Development for Scoring Method
Literature review suggests that scoring method is one of the options available for
classification of strategic types. In this method, composite ranking score of proxies used
for operationalization and classification of strategic orientation of the firms into strategic
groups. One of the shortcoming of the scoring method used earlier is that there is no
standardized way to reach at the final classification of the firms. Different researchers
used different steps. Another, issue with this method is that not all four strategic types are
identified through this method. For instance, Conant et al. (1990), identified the
limitations of identifying only two strategy types as defenders and prospectors which are
placed on the opposite ends of a continuum while analyzer strategy is placed in the
middle treating it as a balancing strategy. Limited efforts were made to solve this
problem. Another shortcoming is the exclusion of reactor strategy from studies where
objective indicator method is used for classification of strategic types. Since reactors can
change their archetypal posture with incremental improvement in their strategic practices.
By doing so they can exploit market conditions and sustain their performance as well.
Therefore, the investigation of the reactor behavior and the classification of reactor
strategy to investigate their relationship with performance in comparison to viable
strategies an important aspect of this study.
Extension in the number of strategic types is another area of improvement because the
existing strategic types only discuss the pure strategies while in real situation firms make
some type of adjustments and make a combination of pure strategies to hybridize the
strategic choice. Specifically at the prospectors and defenders strategies can be divided
into pure and hybrid strategies. The concept of hybridization of pure strategies has been
discussed in literature but not extensively. Hambrick, (1981) used the terms “pure
defenders”, “pure prospectors” and “extreme defender/prospector” to differentiate the
strategic types. Later, Hambrick (1983) introduced the term defender-like and prospector-
112
like. The firms were labeled as “defender-like” that lags its industry in new product sales.
On the other side firms were labeled as “prospector-like” which surpasses its industry in
new product sales. Other researchers also used new terms for different strategic types
such as “pure defenders/prospectors” and “mixed strategies” (Valos and Felix, 2003) and
“low-cost defenders” and “differentiated defenders” (Slater et al., 2011) are used
subsequently. Madanoglu et al. (2014), classified the hybrid strategic types and named
them as “Prospector-Analyzers (PAs)” and “Analyzers-Defenders (DAs)”.
Taking into account the discussion above, hybrid strategies can be operationalized and
proposed for future investigation based on Miles and Snow typology. According to the
typology, defenders and prospectors are treated as pure strategies and are placed at the
extreme ends of the continuum when some type of archived data is used for
operationalization of strategic orientation. Doing so, a large area on the continuum is
either left for analyzers strategy or the extreme ends are extended towards the centre to
expand the range for prospectors and defenders making the selection somewhat
subjective or judgmental. This study argue that instead of expanding the boundaries of
pure strategies or the analyser strategy, the firms that lie between the upper limits of
analyzers and lower limits of pure prospector on a continuum may be called as
“Prospector-Analyzer-Like (PA-Like)” strategies on one side of the continuum while the
firms lying between the lower limits of analyzers and upper limits of pure defenders may
be classified as “Defender-Analyzer-Like (DA-Like)” strategies. This will separate the
pure defenders and pure prospectors from those firms which somehow hybridize the
strategies. Hence, in this study, the strategic types are extended to defender, DA-Like,
analyzers, PA-Like, prospectors and reactors.
The scoring method is developed for classification of strategic types based on the ranking
of the scores based on theoretical support. The ranking is generally based on quintiles or
percentiles. One problem with the ranking is the cut-off points because different
researchers used different cut-off points. Some of the examples are presented here. Smith
et al. (1986), used the ranking scale of 0-8 on the continuum. He used cluster analysis for
classification of strategic types. The clusters with highest score was categorized as
prospectors, followed by analyzers, and defenders. The cluster with lowest score was
113
classified as reactor. Evans & Green (2000) applied four measures “cost efficiency”,
“product mix breadth”, “projected sales growth”, and “projected change in marketing
expenditures” to classify the strategic types. Firms were given ranking scores on a scale
of strongest to weakest based on the values of above mentioned four strategy variables.
Firms were divided into quintiles groups where every firm received a score between 1
and 5 (1 = lowest; 5= highest) in such a way that firms in the lowest quintile (last 20%)
received a score of 1; the next 20% quintile group received a score of 2, and so forth. At
the end, scores were averaged. The firms with a mean score of greater than 4 were
categorized as prospectors while those with mean score less than 2 were classified as
defenders. The remaining firms having the mean score between 2 and 4 were treated as
reactor. In another study Bentley et al. (2013) used six proxies for measuring strategic
orientation of the firms. Discrete ranking scores were calculated on a scale of 6-30 on a
continuum. Firms were categorized into respective category as: defenders with score
between 6 and 12 while analyzers were categorized based on the score between 24 and
30. The remaining firms with scores in the range of 13-23 were termed as analyzers.
For this study, business strategy was operationalized on the basis of ranking scores
calculated from the values of four ratios used as proxies for measuring strategy (“MESR,
COGSR, CASGR, and CIR”). Quintiles are used for final scores. The highest quintiles
(top 20%) were given a score of 4 while observations in the lowest quintiles (bottom
20%) were given a score of 0 for three measures MESR, COGSR, CASGR. To
standardize the scoring, reverse ranking is calculated for capital intensity variable (CIR).
The scores are summed over the four measures. The maximum score a firm can receive is
16 and the minimum possible score is 0 making the continuum scale of 0-16. The pure
strategies are expected lie towards the extreme ends of the continuum while the rest of
the firms constituting the middle of the continuum. Specifically, the strategic types are
classified as: “Pure Defenders (0–3)”; “DA-Like (4-6)”; “Analyzers (7-9)”; “PA-Like
(10-12)”; and “Pure Prospectors (13–16)”. Because of the inconsistent nature of reactors
(as they change their stance from one strategic approach to another over the time), special
treatment was given to judge their behavior over the time (Figure 4.2).
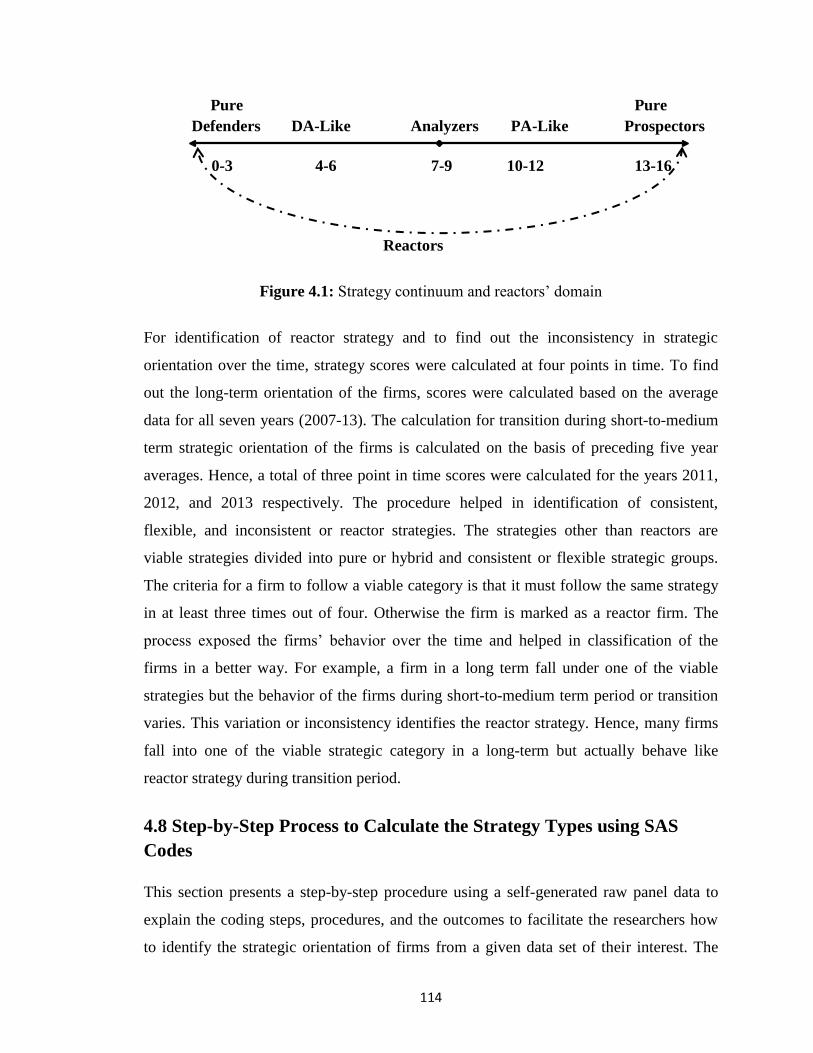
114
Pure Pure
Defenders DA-Like Analyzers PA-Like Prospectors
0-3 4-6 7-9 10-12 13-16
Reactors
Figure 4.1: Strategy continuum and reactors’ domain
For identification of reactor strategy and to find out the inconsistency in strategic
orientation over the time, strategy scores were calculated at four points in time. To find
out the long-term orientation of the firms, scores were calculated based on the average
data for all seven years (2007-13). The calculation for transition during short-to-medium
term strategic orientation of the firms is calculated on the basis of preceding five year
averages. Hence, a total of three point in time scores were calculated for the years 2011,
2012, and 2013 respectively. The procedure helped in identification of consistent,
flexible, and inconsistent or reactor strategies. The strategies other than reactors are
viable strategies divided into pure or hybrid and consistent or flexible strategic groups.
The criteria for a firm to follow a viable category is that it must follow the same strategy
in at least three times out of four. Otherwise the firm is marked as a reactor firm. The
process exposed the firms’ behavior over the time and helped in classification of the
firms in a better way. For example, a firm in a long term fall under one of the viable
strategies but the behavior of the firms during short-to-medium term period or transition
varies. This variation or inconsistency identifies the reactor strategy. Hence, many firms
fall into one of the viable strategic category in a long-term but actually behave like
reactor strategy during transition period.
4.8 Step-by-Step Process to Calculate the Strategy Types using SAS
Codes
This section presents a step-by-step procedure using a self-generated raw panel data to
explain the coding steps, procedures, and the outcomes to facilitate the researchers how
to identify the strategic orientation of firms from a given data set of their interest. The
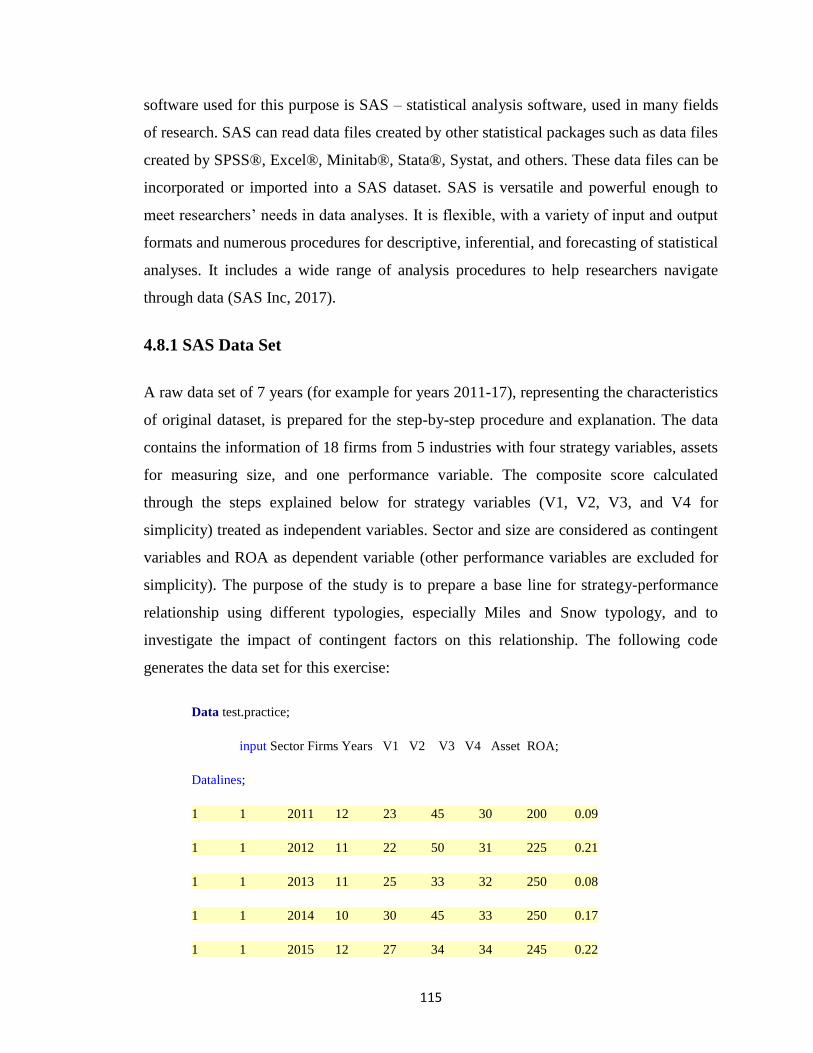
115
software used for this purpose is SAS – statistical analysis software, used in many fields
of research. SAS can read data files created by other statistical packages such as data files
created by SPSS®, Excel®, Minitab®, Stata®, Systat, and others. These data files can be
incorporated or imported into a SAS dataset. SAS is versatile and powerful enough to
meet researchers’ needs in data analyses. It is flexible, with a variety of input and output
formats and numerous procedures for descriptive, inferential, and forecasting of statistical
analyses. It includes a wide range of analysis procedures to help researchers navigate
through data (SAS Inc, 2017).
4.8.1 SAS Data Set
A raw data set of 7 years (for example for years 2011-17), representing the characteristics
of original dataset, is prepared for the step-by-step procedure and explanation. The data
contains the information of 18 firms from 5 industries with four strategy variables, assets
for measuring size, and one performance variable. The composite score calculated
through the steps explained below for strategy variables (V1, V2, V3, and V4 for
simplicity) treated as independent variables. Sector and size are considered as contingent
variables and ROA as dependent variable (other performance variables are excluded for
simplicity). The purpose of the study is to prepare a base line for strategy-performance
relationship using different typologies, especially Miles and Snow typology, and to
investigate the impact of contingent factors on this relationship. The following code
generates the data set for this exercise:
Data test.practice;
input Sector Firms Years V1 V2 V3 V4 Asset ROA;
Datalines;
1 1 2011 12 23 45 30 200 0.09
1 1 2012 11 22 50 31 225 0.21
1 1 2013 11 25 33 32 250 0.08
1 1 2014 10 30 45 33 250 0.17
1 1 2015 12 27 34 34 245 0.22
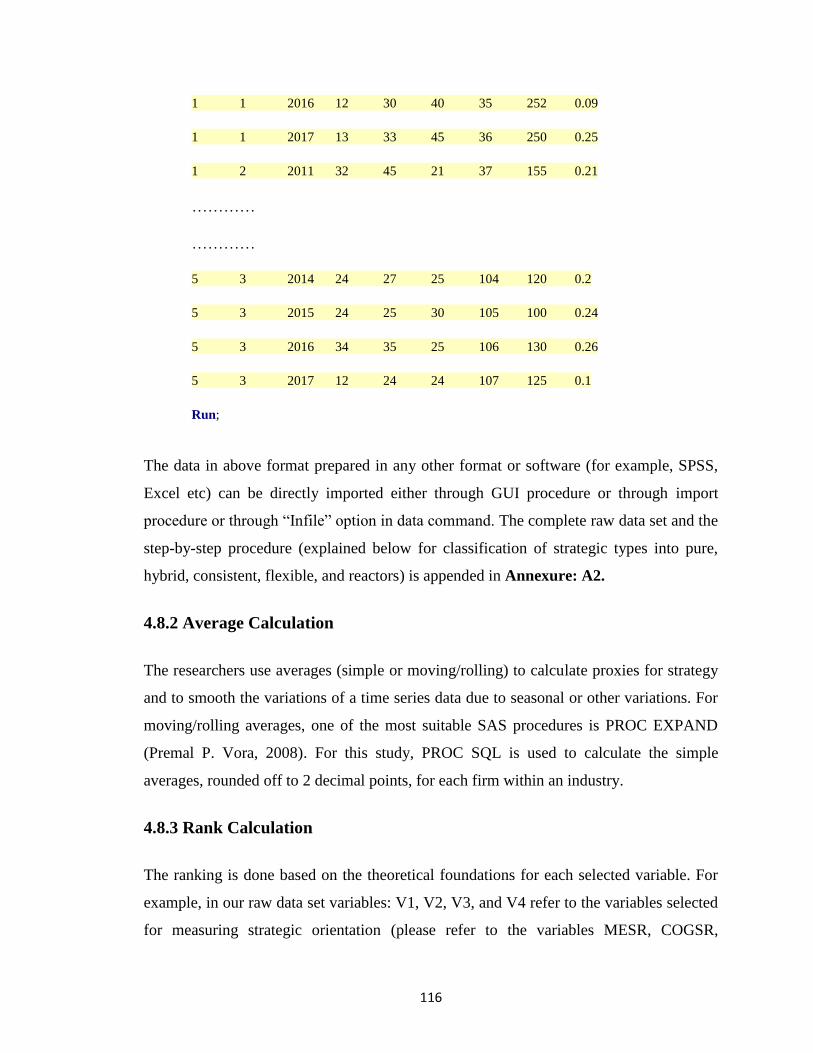
116
1 1 2016 12 30 40 35 252 0.09
1 1 2017 13 33 45 36 250 0.25
1 2 2011 32 45 21 37 155 0.21
…………
…………
5 3 2014 24 27 25 104 120 0.2
5 3 2015 24 25 30 105 100 0.24
5 3 2016 34 35 25 106 130 0.26
5 3 2017 12 24 24 107 125 0.1
Run;
The data in above format prepared in any other format or software (for example, SPSS,
Excel etc) can be directly imported either through GUI procedure or through import
procedure or through “Infile” option in data command. The complete raw data set and the
step-by-step procedure (explained below for classification of strategic types into pure,
hybrid, consistent, flexible, and reactors) is appended in Annexure: A2.
4.8.2 Average Calculation
The researchers use averages (simple or moving/rolling) to calculate proxies for strategy
and to smooth the variations of a time series data due to seasonal or other variations. For
moving/rolling averages, one of the most suitable SAS procedures is PROC EXPAND
(Premal P. Vora, 2008). For this study, PROC SQL is used to calculate the simple
averages, rounded off to 2 decimal points, for each firm within an industry.
4.8.3 Rank Calculation
The ranking is done based on the theoretical foundations for each selected variable. For
example, in our raw data set variables: V1, V2, V3, and V4 refer to the variables selected
for measuring strategic orientation (please refer to the variables MESR, COGSR,
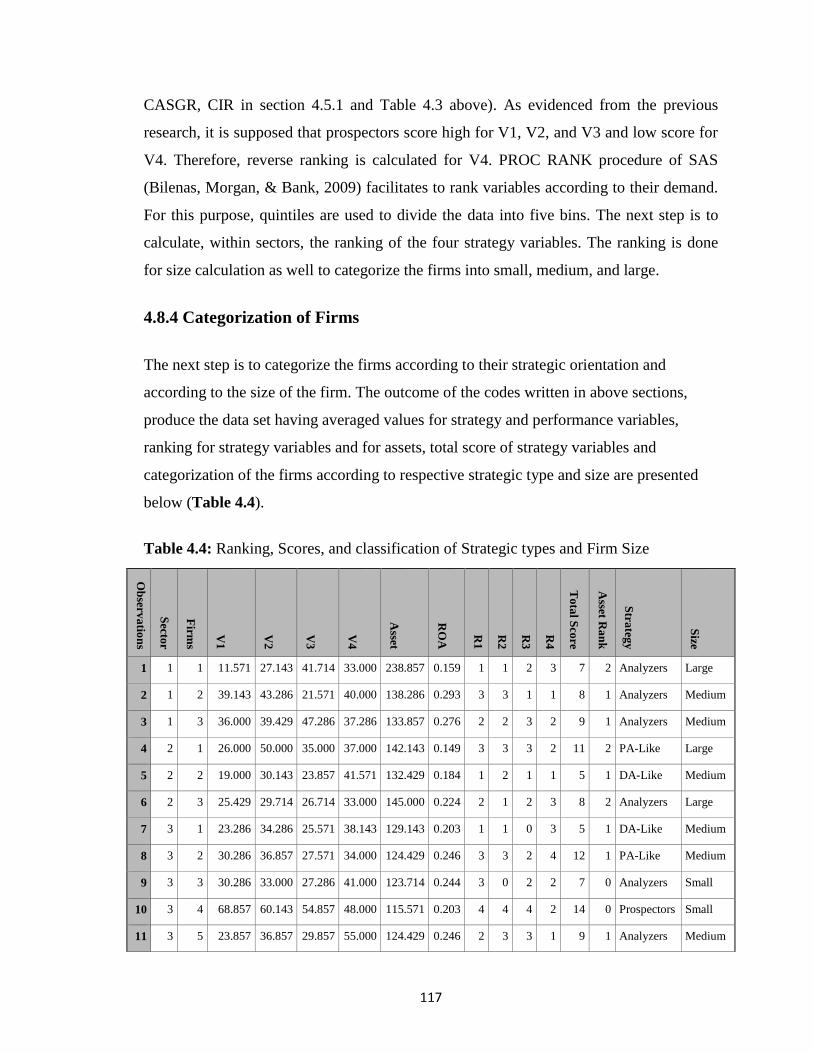
117
CASGR, CIR in section 4.5.1 and Table 4.3 above). As evidenced from the previous
research, it is supposed that prospectors score high for V1, V2, and V3 and low score for
V4. Therefore, reverse ranking is calculated for V4. PROC RANK procedure of SAS
(Bilenas, Morgan, & Bank, 2009) facilitates to rank variables according to their demand.
For this purpose, quintiles are used to divide the data into five bins. The next step is to
calculate, within sectors, the ranking of the four strategy variables. The ranking is done
for size calculation as well to categorize the firms into small, medium, and large.
4.8.4 Categorization of Firms
The next step is to categorize the firms according to their strategic orientation and
according to the size of the firm. The outcome of the codes written in above sections,
produce the data set having averaged values for strategy and performance variables,
ranking for strategy variables and for assets, total score of strategy variables and
categorization of the firms according to respective strategic type and size are presented
below (Table 4.4).
Table 4.4: Ranking, Scores, and classification of Strategic types and Firm Size
Ob
serva
tion
s
Secto
r
Firm
s
V1
V2
V3
V4
Asset
RO
A
R1
R2
R3
R4
To
tal S
core
Asset R
an
k
Stra
tegy
Size
1 1 1 11.571 27.143 41.714 33.000 238.857 0.159 1 1 2 3 7 2 Analyzers Large
2 1 2 39.143 43.286 21.571 40.000 138.286 0.293 3 3 1 1 8 1 Analyzers Medium
3 1 3 36.000 39.429 47.286 37.286 133.857 0.276 2 2 3 2 9 1 Analyzers Medium
4 2 1 26.000 50.000 35.000 37.000 142.143 0.149 3 3 3 2 11 2 PA-Like Large
5 2 2 19.000 30.143 23.857 41.571 132.429 0.184 1 2 1 1 5 1 DA-Like Medium
6 2 3 25.429 29.714 26.714 33.000 145.000 0.224 2 1 2 3 8 2 Analyzers Large
7 3 1 23.286 34.286 25.571 38.143 129.143 0.203 1 1 0 3 5 1 DA-Like Medium
8 3 2 30.286 36.857 27.571 34.000 124.429 0.246 3 3 2 4 12 1 PA-Like Medium
9 3 3 30.286 33.000 27.286 41.000 123.714 0.244 3 0 2 2 7 0 Analyzers Small
10 3 4 68.857 60.143 54.857 48.000 115.571 0.203 4 4 4 2 14 0 Prospectors Small
11 3 5 23.857 36.857 29.857 55.000 124.429 0.246 2 3 3 1 9 1 Analyzers Medium
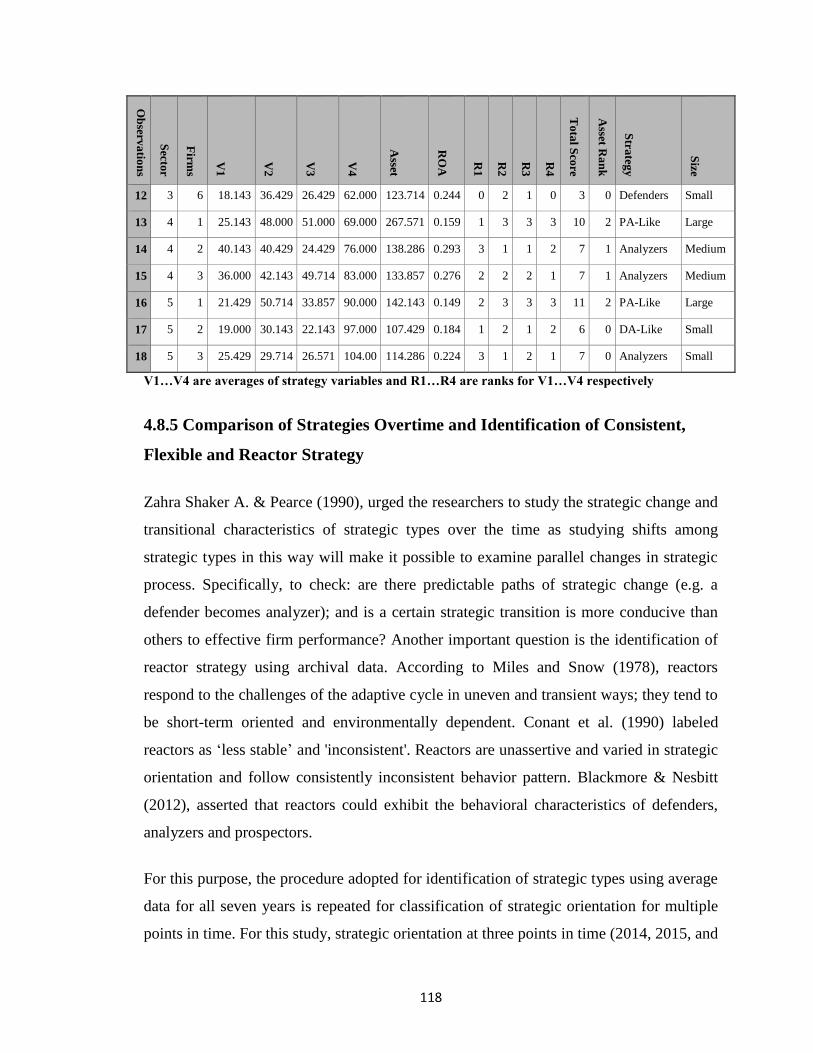
118
Ob
serva
tion
s
Secto
r
Firm
s
V1
V2
V3
V4
Asset
RO
A
R1
R2
R3
R4
To
tal S
core
Asset R
an
k
Stra
tegy
Size
12 3 6 18.143 36.429 26.429 62.000 123.714 0.244 0 2 1 0 3 0 Defenders Small
13 4 1 25.143 48.000 51.000 69.000 267.571 0.159 1 3 3 3 10 2 PA-Like Large
14 4 2 40.143 40.429 24.429 76.000 138.286 0.293 3 1 1 2 7 1 Analyzers Medium
15 4 3 36.000 42.143 49.714 83.000 133.857 0.276 2 2 2 1 7 1 Analyzers Medium
16 5 1 21.429 50.714 33.857 90.000 142.143 0.149 2 3 3 3 11 2 PA-Like Large
17 5 2 19.000 30.143 22.143 97.000 107.429 0.184 1 2 1 2 6 0 DA-Like Small
18 5 3 25.429 29.714 26.571 104.00 114.286 0.224 3 1 2 1 7 0 Analyzers Small
V1…V4 are averages of strategy variables and R1…R4 are ranks for V1…V4 respectively
4.8.5 Comparison of Strategies Overtime and Identification of Consistent,
Flexible and Reactor Strategy
Zahra Shaker A. & Pearce (1990), urged the researchers to study the strategic change and
transitional characteristics of strategic types over the time as studying shifts among
strategic types in this way will make it possible to examine parallel changes in strategic
process. Specifically, to check: are there predictable paths of strategic change (e.g. a
defender becomes analyzer); and is a certain strategic transition is more conducive than
others to effective firm performance? Another important question is the identification of
reactor strategy using archival data. According to Miles and Snow (1978), reactors
respond to the challenges of the adaptive cycle in uneven and transient ways; they tend to
be short-term oriented and environmentally dependent. Conant et al. (1990) labeled
reactors as ‘less stable’ and 'inconsistent'. Reactors are unassertive and varied in strategic
orientation and follow consistently inconsistent behavior pattern. Blackmore & Nesbitt
(2012), asserted that reactors could exhibit the behavioral characteristics of defenders,
analyzers and prospectors.
For this purpose, the procedure adopted for identification of strategic types using average
data for all seven years is repeated for classification of strategic orientation for multiple
points in time. For this study, strategic orientation at three points in time (2014, 2015, and
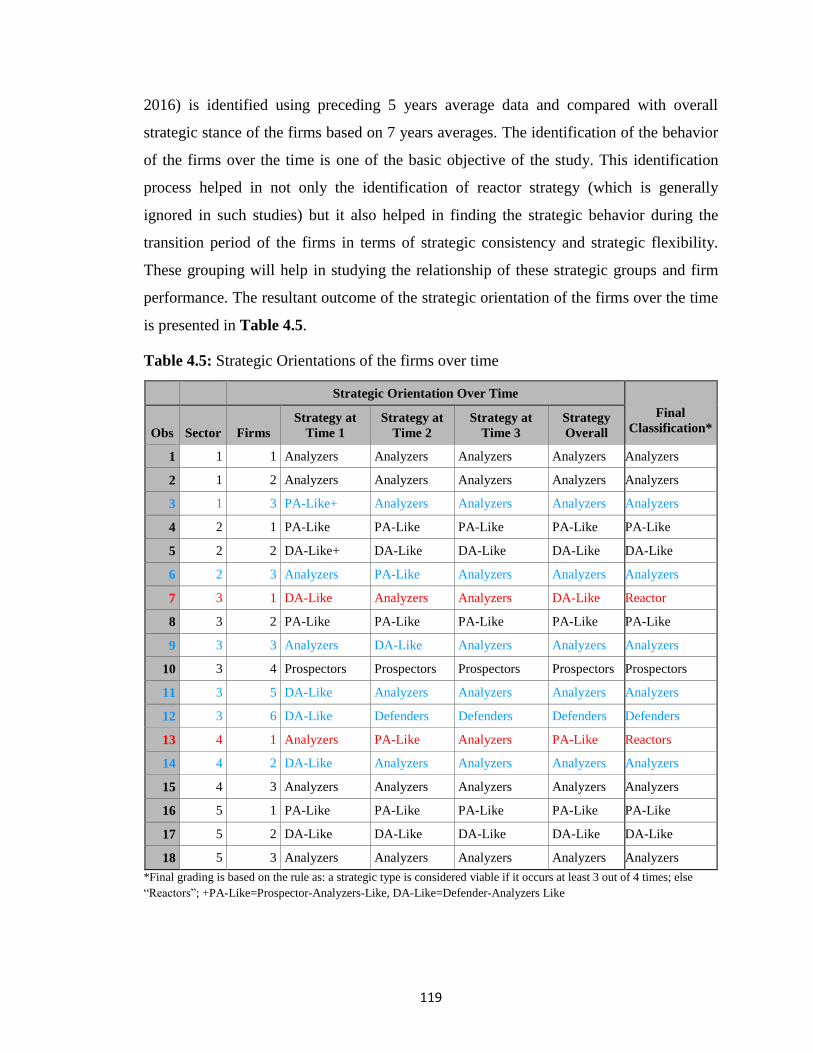
119
2016) is identified using preceding 5 years average data and compared with overall
strategic stance of the firms based on 7 years averages. The identification of the behavior
of the firms over the time is one of the basic objective of the study. This identification
process helped in not only the identification of reactor strategy (which is generally
ignored in such studies) but it also helped in finding the strategic behavior during the
transition period of the firms in terms of strategic consistency and strategic flexibility.
These grouping will help in studying the relationship of these strategic groups and firm
performance. The resultant outcome of the strategic orientation of the firms over the time
is presented in Table 4.5.
Table 4.5: Strategic Orientations of the firms over time
Strategic Orientation Over Time
Final
Classification* Obs Sector Firms
Strategy at
Time 1
Strategy at
Time 2
Strategy at
Time 3
Strategy
Overall
1 1 1 Analyzers Analyzers Analyzers Analyzers Analyzers
2 1 2 Analyzers Analyzers Analyzers Analyzers Analyzers
3 1 3 PA-Like+ Analyzers Analyzers Analyzers Analyzers
4 2 1 PA-Like PA-Like PA-Like PA-Like PA-Like
5 2 2 DA-Like+ DA-Like DA-Like DA-Like DA-Like
6 2 3 Analyzers PA-Like Analyzers Analyzers Analyzers
7 3 1 DA-Like Analyzers Analyzers DA-Like Reactor
8 3 2 PA-Like PA-Like PA-Like PA-Like PA-Like
9 3 3 Analyzers DA-Like Analyzers Analyzers Analyzers
10 3 4 Prospectors Prospectors Prospectors Prospectors Prospectors
11 3 5 DA-Like Analyzers Analyzers Analyzers Analyzers
12 3 6 DA-Like Defenders Defenders Defenders Defenders
13 4 1 Analyzers PA-Like Analyzers PA-Like Reactors
14 4 2 DA-Like Analyzers Analyzers Analyzers Analyzers
15 4 3 Analyzers Analyzers Analyzers Analyzers Analyzers
16 5 1 PA-Like PA-Like PA-Like PA-Like PA-Like
17 5 2 DA-Like DA-Like DA-Like DA-Like DA-Like
18 5 3 Analyzers Analyzers Analyzers Analyzers Analyzers
*Final grading is based on the rule as: a strategic type is considered viable if it occurs at least 3 out of 4 times; else
“Reactors”; +PA-Like=Prospector-Analyzers-Like, DA-Like=Defender-Analyzers Like
120
The identification of consistent, flexible and the reactor strategy is possible by
monitoring the movement of strategic orientation over time. For example, a strategy type
is considered as consistent if it remains same for all four time periods (see observation
number 1,2,4,5,8,10, and 15-18). A firm is set to follow the flexible strategy if it changes
its strategy only once for adjustment i.e it occurs for at least three times out of four (see
observation number 3,6,9,11,12 and 14). Otherwise, the firm is considered as inconsistent
or reactor firm (see observation number 7 and 13).
4.9 Data Analysis Techniques
4.9.1 Descriptive Statistics
The descriptive statistics such as number of observations, minimum, maximum, mean,
median, standard deviation, quartiles, quintiles, skewness, kurtosis, confidence interval,
etc can be calculated by using a number of SAS procedures. Procedures like “PROC
SUMMARY”, “PROC MEANS” and “PROC UNIVARIATE” etc provide descriptive
information by using their respective options and formats. Generally, these procedures
are used to find out the Univariate statistics. Bivariate statistics can be obtained by using
“PROC FREQ”, a very powerful procedure to get information of contingency tables
(cross classification), Chi-Square etc. PROC FREQ is well suited to dealing with nominal
or ordinal data. It is useful for tabulating frequencies of occurrences in each category,
while simultaneously converting frequencies into proportions.
4.9.2 ANOVA and Regression Analysis
Analysis of Variance (ANOVA) and regression analysis require special treatment and
attention for categorical variables which are essentially presented in nominal scale. Chi-
Square is used to find out the proportionate variation among the distribution of different
categories. ANOVA is used to test the variation among the group of categories for any
variable of interest. Regular OLS or least Square Dummy Variable (LSDV) regression
models are employed to estimate the coefficients when dependent variable is continuous
and one or more independent variables are categorical. For a categorical variable such as
strategy, firm size, and industry in this study, with k categories, k-1 dummy variables are
121
used for a common intercept and k dummy variables are used without a common
intercept. This is done to avoid dummy variable trap - a situation of perfect collinearity.
For investigating joint, interactive or contingent effect of two or more variables,
interactive dummies are used. The models without common intercept make the
interpretation of coefficients easier and straightforward. But, there are issues with the
interpretation of goodness of fit measures (F-statistics and R2 values). On the other side,
the interpretation of the estimates is complex for the models where intercepts are used.
But, the benefit of such modes is that they provide the correct measures of goodness of fit
(Damodar Gujarati, 2011; Park, 2009)). Keeping in view the advantage of using models
with common intercept, they are used for this study. For comparing the performance of
strategic types, the reactor strategy is used as the reference or the benchmark strategy.
Similarly, the reference categories for firm size and industry are also selected to
investigate the contingent effects. Univariate models are employed for investigating the
strategy-performance, size-performance, industry-performance relationships. Multivariate
models are used for combined and interaction impact of strategy, size, and industry on
performance. Hierarchical regression models are used for measuring the effect of
different combination of variables.
The application of regression methods often uses interaction effects (also called
moderator effects). The term “interaction effect” describes a situation in which the effect
of an independent variable on the dependent is conditional upon the value of another
variable, usually termed as moderator variable. Conceptualizing an interaction effect
involves three variables: the dependent variable, the “focal” independent variable and the
moderator variable. The effect of the focal independent variable on the dependent
variable is said to be moderated by the moderator variable if it effects the direction and or
strength of the relation between the independent and dependent variables (Baron &
Kenny, 1986; Gravelle, 2012; Hayes, Glynn, & Huge, 2012). Statistical interactions can
take many forms. One form is when the effect of one predictor is modified according to
the value of another predictor. In this case, although variables alone have no effect but
when they interact then there is a measurable effect. Or it may be that either variable
alone produces an effect but having both present does not increase the effect. More
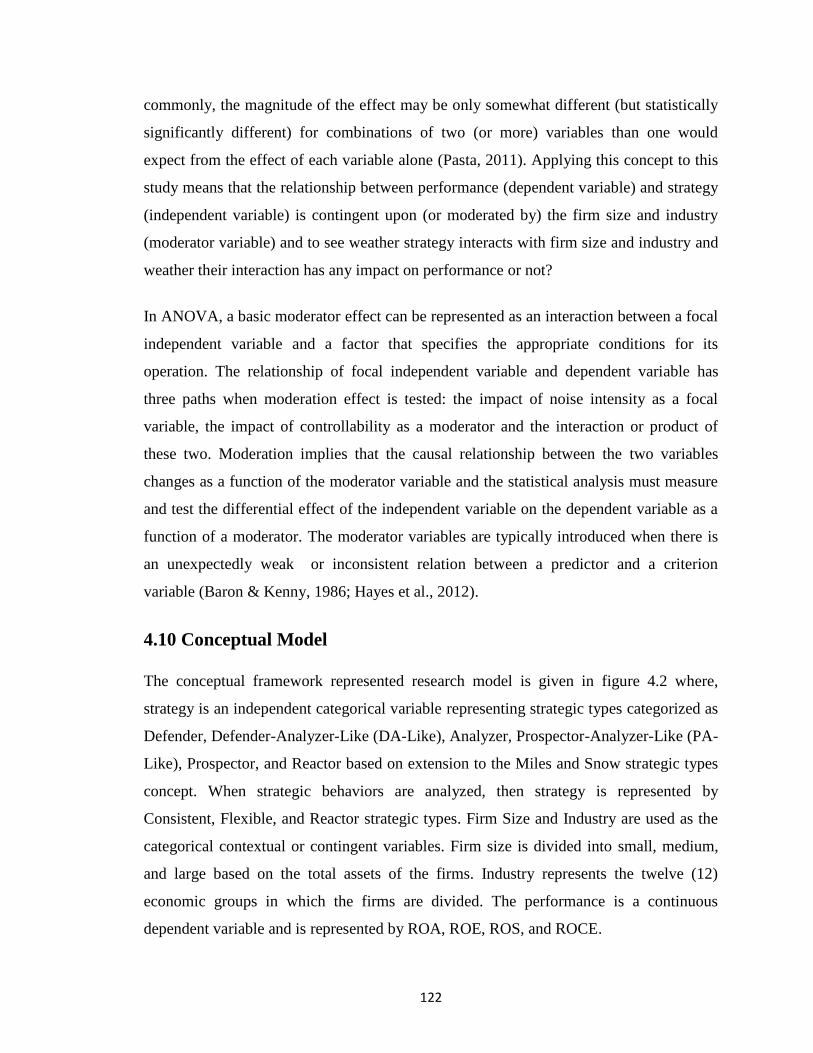
122
commonly, the magnitude of the effect may be only somewhat different (but statistically
significantly different) for combinations of two (or more) variables than one would
expect from the effect of each variable alone (Pasta, 2011). Applying this concept to this
study means that the relationship between performance (dependent variable) and strategy
(independent variable) is contingent upon (or moderated by) the firm size and industry
(moderator variable) and to see weather strategy interacts with firm size and industry and
weather their interaction has any impact on performance or not?
In ANOVA, a basic moderator effect can be represented as an interaction between a focal
independent variable and a factor that specifies the appropriate conditions for its
operation. The relationship of focal independent variable and dependent variable has
three paths when moderation effect is tested: the impact of noise intensity as a focal
variable, the impact of controllability as a moderator and the interaction or product of
these two. Moderation implies that the causal relationship between the two variables
changes as a function of the moderator variable and the statistical analysis must measure
and test the differential effect of the independent variable on the dependent variable as a
function of a moderator. The moderator variables are typically introduced when there is
an unexpectedly weak or inconsistent relation between a predictor and a criterion
variable (Baron & Kenny, 1986; Hayes et al., 2012).
4.10 Conceptual Model
The conceptual framework represented research model is given in figure 4.2 where,
strategy is an independent categorical variable representing strategic types categorized as
Defender, Defender-Analyzer-Like (DA-Like), Analyzer, Prospector-Analyzer-Like (PA-
Like), Prospector, and Reactor based on extension to the Miles and Snow strategic types
concept. When strategic behaviors are analyzed, then strategy is represented by
Consistent, Flexible, and Reactor strategic types. Firm Size and Industry are used as the
categorical contextual or contingent variables. Firm size is divided into small, medium,
and large based on the total assets of the firms. Industry represents the twelve (12)
economic groups in which the firms are divided. The performance is a continuous
dependent variable and is represented by ROA, ROE, ROS, and ROCE.
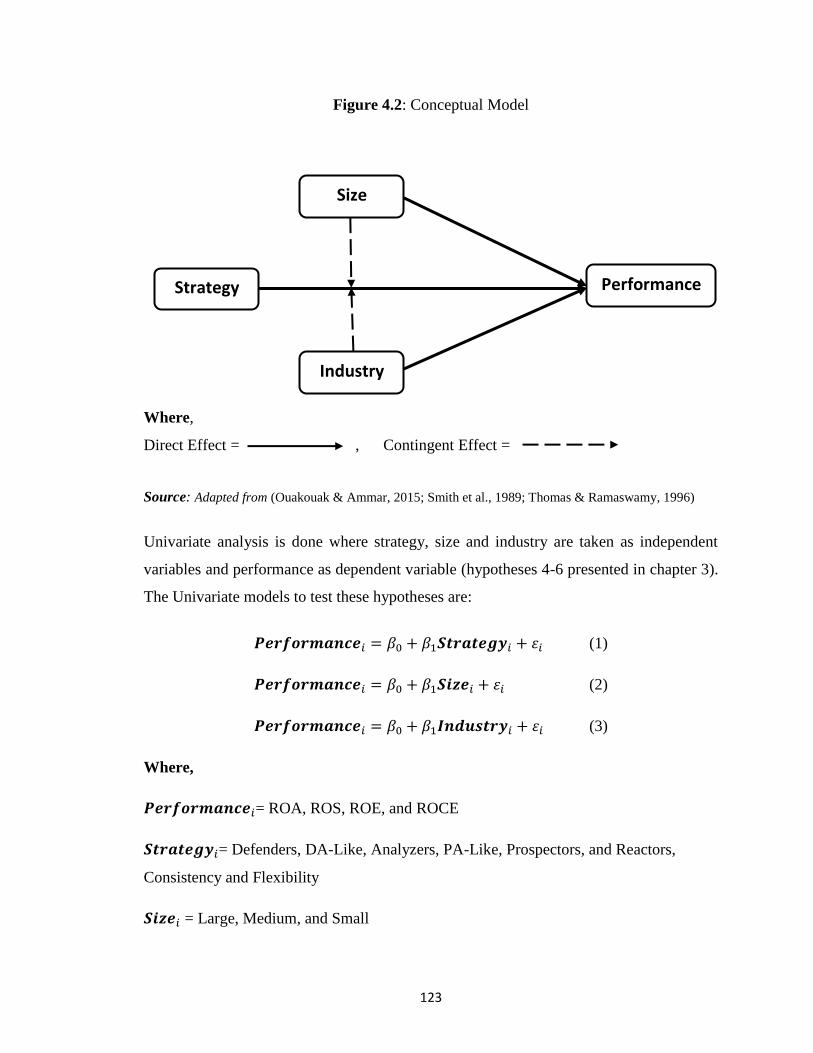
123
Figure 4.2: Conceptual Model
Where,
Direct Effect = , Contingent Effect =
Source: Adapted from (Ouakouak & Ammar, 2015; Smith et al., 1989; Thomas & Ramaswamy, 1996)
Univariate analysis is done where strategy, size and industry are taken as independent
variables and performance as dependent variable (hypotheses 4-6 presented in chapter 3).
The Univariate models to test these hypotheses are:
𝑷𝒆𝒓𝒇𝒐𝒓𝒎𝒂𝒏𝒄𝒆𝑖 = 𝛽0 + 𝛽1𝑺𝒕𝒓𝒂𝒕𝒆𝒈𝒚𝑖 + 𝜀𝑖 (1)
𝑷𝒆𝒓𝒇𝒐𝒓𝒎𝒂𝒏𝒄𝒆𝑖 = 𝛽0 + 𝛽1𝑺𝒊𝒛𝒆𝑖 + 𝜀𝑖 (2)
𝑷𝒆𝒓𝒇𝒐𝒓𝒎𝒂𝒏𝒄𝒆𝑖 = 𝛽0 + 𝛽1𝑰𝒏𝒅𝒖𝒔𝒕𝒓𝒚𝑖 + 𝜀𝑖 (3)
Where,
𝑷𝒆𝒓𝒇𝒐𝒓𝒎𝒂𝒏𝒄𝒆𝑖= ROA, ROS, ROE, and ROCE
𝑺𝒕𝒓𝒂𝒕𝒆𝒈𝒚𝑖= Defenders, DA-Like, Analyzers, PA-Like, Prospectors, and Reactors,
Consistency and Flexibility
𝑺𝒊𝒛𝒆𝑖 = Large, Medium, and Small
Size
Strategy
Industry
Performance
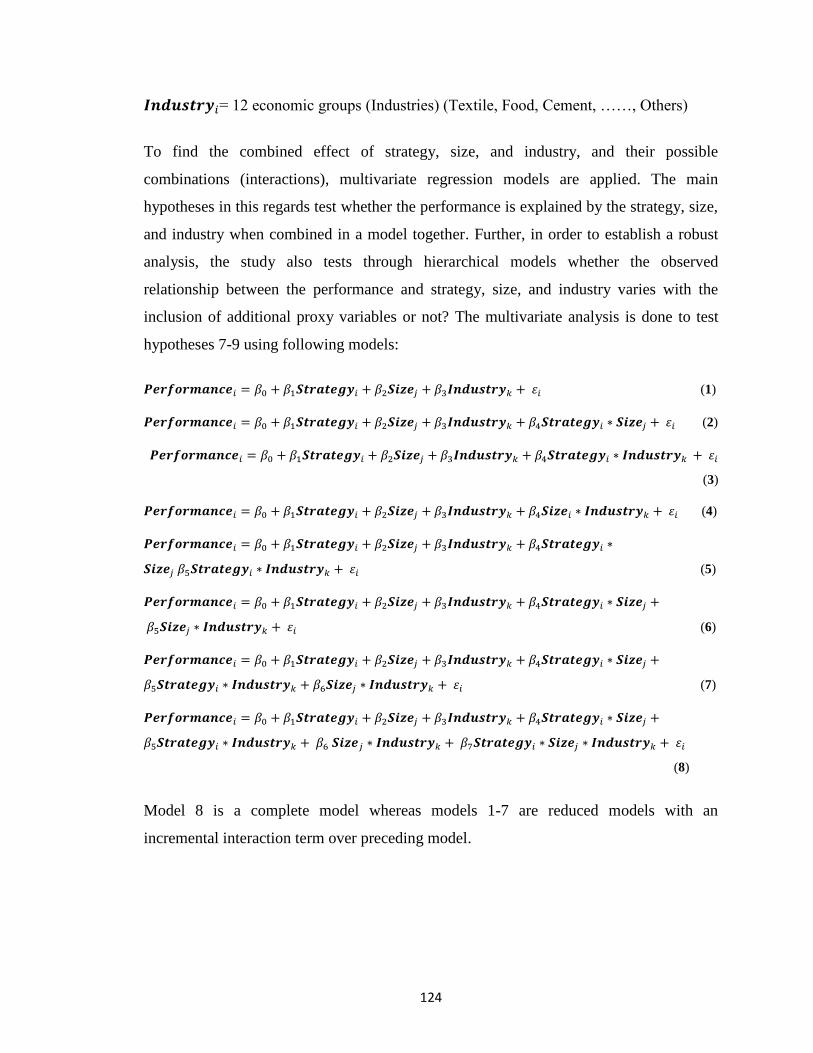
124
𝑰𝒏𝒅𝒖𝒔𝒕𝒓𝒚𝑖= 12 economic groups (Industries) (Textile, Food, Cement, ……, Others)
To find the combined effect of strategy, size, and industry, and their possible
combinations (interactions), multivariate regression models are applied. The main
hypotheses in this regards test whether the performance is explained by the strategy, size,
and industry when combined in a model together. Further, in order to establish a robust
analysis, the study also tests through hierarchical models whether the observed
relationship between the performance and strategy, size, and industry varies with the
inclusion of additional proxy variables or not? The multivariate analysis is done to test
hypotheses 7-9 using following models:
𝑷𝒆𝒓𝒇𝒐𝒓𝒎𝒂𝒏𝒄𝒆𝑖 = 𝛽0 + 𝛽1𝑺𝒕𝒓𝒂𝒕𝒆𝒈𝒚𝑖 + 𝛽2𝑺𝒊𝒛𝒆𝑗 + 𝛽3𝑰𝒏𝒅𝒖𝒔𝒕𝒓𝒚𝑘 + 𝜀𝑖 (1)
𝑷𝒆𝒓𝒇𝒐𝒓𝒎𝒂𝒏𝒄𝒆𝑖 = 𝛽0 + 𝛽1𝑺𝒕𝒓𝒂𝒕𝒆𝒈𝒚𝑖 + 𝛽2𝑺𝒊𝒛𝒆𝑗 + 𝛽3𝑰𝒏𝒅𝒖𝒔𝒕𝒓𝒚𝑘 + 𝛽4𝑺𝒕𝒓𝒂𝒕𝒆𝒈𝒚𝑖 ∗ 𝑺𝒊𝒛𝒆𝑗 + 𝜀𝑖 (2)
𝑷𝒆𝒓𝒇𝒐𝒓𝒎𝒂𝒏𝒄𝒆𝑖 = 𝛽0 + 𝛽1𝑺𝒕𝒓𝒂𝒕𝒆𝒈𝒚𝑖 + 𝛽2𝑺𝒊𝒛𝒆𝑗 + 𝛽3𝑰𝒏𝒅𝒖𝒔𝒕𝒓𝒚𝑘 + 𝛽4𝑺𝒕𝒓𝒂𝒕𝒆𝒈𝒚𝑖 ∗ 𝑰𝒏𝒅𝒖𝒔𝒕𝒓𝒚𝑘 + 𝜀𝑖
(3)
𝑷𝒆𝒓𝒇𝒐𝒓𝒎𝒂𝒏𝒄𝒆𝑖 = 𝛽0 + 𝛽1𝑺𝒕𝒓𝒂𝒕𝒆𝒈𝒚𝑖 + 𝛽2𝑺𝒊𝒛𝒆𝑗 + 𝛽3𝑰𝒏𝒅𝒖𝒔𝒕𝒓𝒚𝑘 + 𝛽4𝑺𝒊𝒛𝒆𝑖 ∗ 𝑰𝒏𝒅𝒖𝒔𝒕𝒓𝒚𝑘 + 𝜀𝑖 (4)
𝑷𝒆𝒓𝒇𝒐𝒓𝒎𝒂𝒏𝒄𝒆𝑖 = 𝛽0 + 𝛽1𝑺𝒕𝒓𝒂𝒕𝒆𝒈𝒚𝑖 + 𝛽2𝑺𝒊𝒛𝒆𝑗 + 𝛽3𝑰𝒏𝒅𝒖𝒔𝒕𝒓𝒚𝑘 + 𝛽4𝑺𝒕𝒓𝒂𝒕𝒆𝒈𝒚𝑖 ∗
𝑺𝒊𝒛𝒆𝑗 𝛽5𝑺𝒕𝒓𝒂𝒕𝒆𝒈𝒚𝑖 ∗ 𝑰𝒏𝒅𝒖𝒔𝒕𝒓𝒚𝑘 + 𝜀𝑖 (5)
𝑷𝒆𝒓𝒇𝒐𝒓𝒎𝒂𝒏𝒄𝒆𝑖 = 𝛽0 + 𝛽1𝑺𝒕𝒓𝒂𝒕𝒆𝒈𝒚𝑖 + 𝛽2𝑺𝒊𝒛𝒆𝑗 + 𝛽3𝑰𝒏𝒅𝒖𝒔𝒕𝒓𝒚𝑘 + 𝛽4𝑺𝒕𝒓𝒂𝒕𝒆𝒈𝒚𝑖 ∗ 𝑺𝒊𝒛𝒆𝑗 +
𝛽5𝑺𝒊𝒛𝒆𝑗 ∗ 𝑰𝒏𝒅𝒖𝒔𝒕𝒓𝒚𝑘 + 𝜀𝑖 (6)
𝑷𝒆𝒓𝒇𝒐𝒓𝒎𝒂𝒏𝒄𝒆𝑖 = 𝛽0 + 𝛽1𝑺𝒕𝒓𝒂𝒕𝒆𝒈𝒚𝑖 + 𝛽2𝑺𝒊𝒛𝒆𝑗 + 𝛽3𝑰𝒏𝒅𝒖𝒔𝒕𝒓𝒚𝑘 + 𝛽4𝑺𝒕𝒓𝒂𝒕𝒆𝒈𝒚𝑖 ∗ 𝑺𝒊𝒛𝒆𝑗 +
𝛽5𝑺𝒕𝒓𝒂𝒕𝒆𝒈𝒚𝑖 ∗ 𝑰𝒏𝒅𝒖𝒔𝒕𝒓𝒚𝑘 + 𝛽6𝑺𝒊𝒛𝒆𝑗 ∗ 𝑰𝒏𝒅𝒖𝒔𝒕𝒓𝒚𝑘 + 𝜀𝑖 (7)
𝑷𝒆𝒓𝒇𝒐𝒓𝒎𝒂𝒏𝒄𝒆𝑖 = 𝛽0 + 𝛽1𝑺𝒕𝒓𝒂𝒕𝒆𝒈𝒚𝑖 + 𝛽2𝑺𝒊𝒛𝒆𝑗 + 𝛽3𝑰𝒏𝒅𝒖𝒔𝒕𝒓𝒚𝑘 + 𝛽4𝑺𝒕𝒓𝒂𝒕𝒆𝒈𝒚𝑖 ∗ 𝑺𝒊𝒛𝒆𝑗 +
𝛽5𝑺𝒕𝒓𝒂𝒕𝒆𝒈𝒚𝑖 ∗ 𝑰𝒏𝒅𝒖𝒔𝒕𝒓𝒚𝑘 + 𝛽6 𝑺𝒊𝒛𝒆𝑗 ∗ 𝑰𝒏𝒅𝒖𝒔𝒕𝒓𝒚𝑘 + 𝛽7𝑺𝒕𝒓𝒂𝒕𝒆𝒈𝒚𝑖 ∗ 𝑺𝒊𝒛𝒆𝑗 ∗ 𝑰𝒏𝒅𝒖𝒔𝒕𝒓𝒚𝑘 + 𝜀𝑖
(8)
Model 8 is a complete model whereas models 1-7 are reduced models with an
incremental interaction term over preceding model.
125
4.11 Ethical Issues and their Resolution
4.11.1 Ethical Issues
Ethical considerations have become a cornerstone for conducting effective and
meaningful research because of its unprecedented scrutiny in recent times. As such, the
ethical behavior of individual researchers is under unprecedented scrutiny (Best & Kahn,
2006). There is huge amount of data that is collected through the management
information systems, surveys, and other data collection methods. Secondary data analysis
refers to the use of existing data to find answer to a question that was different from the
original work. It can be analyzed to generate new hypothesis along with critical research
questions. Permission for further use of data and analysis is implied if the data is freely
available on the Internet, books or other public fora. In this case, the ownership of the
original data must be acknowledged (Tripathy, 2013).
The ethical challenges related to the general research include: potentially difficult
considerations surround the purpose and value of the research; benefits and harm to
participants; privacy; informed consent; and confidentiality (Golder et al., 2017). Even if
you are not using human participants in your research, there is still the question of
honesty in the way you collect, analyze and interpret data. By explaining exactly how you
arrived at your conclusions you can avoid accusations of false reasoning (Walliman,
2011). According to Walliman (2011), there are two aspects of ethical issues in research:
1. Honesty and integrity of the researcher
2. The treatment of the researcher with the respondents of the data in terms of
informed consent, confidentiality, anonymity and courtesy.
These issues are resolved through the ethical committee within the organizations where
research is being carried out. The issue of honesty related to the claim of intellectual
ownership; plagiarism; non-acknowledgement of cited work; discrepancies and
biasedness in description of results and analysis; data set and its interpretations;
declaration of theoretical or epistemological perspective of the research etc. (Walliman,
2012).
126
4.11.2 Resolution of Ethical Issues
Author’s Declaration and undertaking: A declaration and undertaking by the
author is an integral part of the thesis where it is stated that the work is original
and solely done by the author and it has not been submitted elsewhere.
Intellectual ownership and plagiarism: A “Plagiarism Free Certificate” duly
signed by the author (student) and counter signed by the supervisor, head of the
department, chairman and Dean of the faculty is also part of the thesis. The
document certifies that the work is genuine and is plagiarism free.
Acknowledgement and citation: Obviously, in any field of research, one
cannot rely entirely on his own ideas, concepts and theories. Therefore, the
sources (journals, books, conferences, internet etc.) from where the ideas,
theories, and related material is used are properly acknowledged and cited
with full publication details provided at the end as references so that the
referred source can be identified. The assistance provided during data
collection, analysis, and thesis compilation is properly acknowledged in
the beginning of the thesis.
Responsibility and accountability of the researcher
Apart from correct attribution, honesty is essential in the substance of
what you write. For this purpose, the theoretical perspective and paradigm
is explained in methodology chapter in detail along with the descriptions
about the data set, variables, measures, tools and techniques. The results
are also presented in detail and extra information is provided in annexure
as well.
Data and interpretations
Personal judgment and subjective biasedness is avoided by clearly
referring for and against opinions from the literature in discussion part of
the research to maintain scientific objectivity as much as possible.
127
4.12 Summary
The chapter described in detail the methodology adopted for the study. It includes the
data collection procedure and the criteria of the selection of the firms for final analysis.
The variables used to measure the strategic orientation, performance, and contingencies,
along with the reason for their selection, are explained. The detail description of
conceptual and theoretical development of scoring method for categorization of strategic
types and a step-by-step SAS coding and the output is presented for data management
and analysis. The techniques for data analysis, the conceptual framework, and the models
for Univariate and multivariate analyses are also explained.

128
Chapter 5
Results and Discussion
129
5.1 Introduction
The chapter comprises two major parts. The results in the first part include the
categorization of firms in strategic groups as: strategic types according to Miles and
Snow typology; classification of firms according to strategic purity and hybridization;
strategic consistency and flexibility; firm size wise and industry wise etc. The
performance of the strategic groups according to various classification is also presented
in this part. The second part consist of the results relating to the testing of hypotheses.
Descriptive statistics, contingency tables, results of Chi-square, ANOVA, Univariate and
multivariate analysis are presented. The analysis of the single industry (Textile) is done to
find the commonality and differences in the findings of single industry versus multi-
industry analysis. The also chapter contains a synthesis of the results and discusses the
consistencies/inconsistencies of the findings with earlier research and the possible
reasons for these findings.
5.2 Identification of Strategic Types
Scoring method is used to categorize the strategic types according to the groupings based
on Miles and Snow typology. Other strategic groups are made on the basis of strategic
purity and hybridization and strategic consistency and strategic flexibility, and reactors.
As discussed in methodology, the criteria for a firm to follow a viable category is that it
must follow the same strategy in at least three times out of four. Otherwise the firm is
marked as a reactor firm. For example, a firm in a long term fall under one of the viable
strategies but the behavior of the firms during short-to-medium term period or transition
varies. This variation or inconsistency identifies the reactor strategy. To understand this
process, the example for categorization and behavior of firms for a selected industry –
“Other Non-Metallic Mineral Products” with two sub-sectors “Cement” and
“Mineral Products” is presented in Table 5.1. The last column of the table shows the
final classification of the strategy types according to our set criteria.
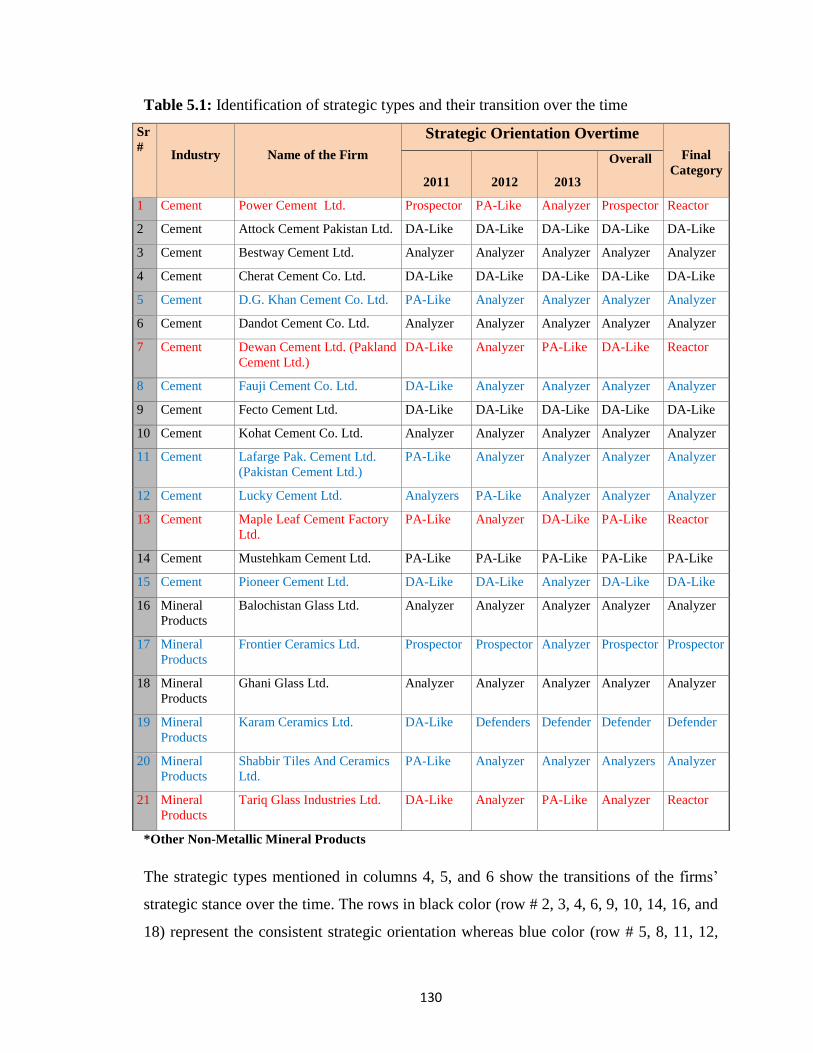
130
Table 5.1: Identification of strategic types and their transition over the time
Sr
#
Industry
Name of the Firm
Strategic Orientation Overtime
Final
Category
2011
2012
2013
Overall
1 Cement Power Cement Ltd. Prospector PA-Like Analyzer Prospector Reactor
2 Cement Attock Cement Pakistan Ltd. DA-Like DA-Like DA-Like DA-Like DA-Like
3 Cement Bestway Cement Ltd. Analyzer Analyzer Analyzer Analyzer Analyzer
4 Cement Cherat Cement Co. Ltd. DA-Like DA-Like DA-Like DA-Like DA-Like
5 Cement D.G. Khan Cement Co. Ltd. PA-Like Analyzer Analyzer Analyzer Analyzer
6 Cement Dandot Cement Co. Ltd. Analyzer Analyzer Analyzer Analyzer Analyzer
7 Cement Dewan Cement Ltd. (Pakland
Cement Ltd.)
DA-Like Analyzer PA-Like DA-Like Reactor
8 Cement Fauji Cement Co. Ltd. DA-Like Analyzer Analyzer Analyzer Analyzer
9 Cement Fecto Cement Ltd. DA-Like DA-Like DA-Like DA-Like DA-Like
10 Cement Kohat Cement Co. Ltd. Analyzer Analyzer Analyzer Analyzer Analyzer
11 Cement Lafarge Pak. Cement Ltd.
(Pakistan Cement Ltd.)
PA-Like Analyzer Analyzer Analyzer Analyzer
12 Cement Lucky Cement Ltd. Analyzers PA-Like Analyzer Analyzer Analyzer
13 Cement Maple Leaf Cement Factory
Ltd.
PA-Like Analyzer DA-Like PA-Like Reactor
14 Cement Mustehkam Cement Ltd. PA-Like PA-Like PA-Like PA-Like PA-Like
15 Cement Pioneer Cement Ltd. DA-Like DA-Like Analyzer DA-Like DA-Like
16 Mineral
Products
Balochistan Glass Ltd. Analyzer Analyzer Analyzer Analyzer Analyzer
17 Mineral
Products
Frontier Ceramics Ltd. Prospector Prospector Analyzer Prospector Prospector
18 Mineral
Products
Ghani Glass Ltd. Analyzer Analyzer Analyzer Analyzer Analyzer
19 Mineral
Products
Karam Ceramics Ltd. DA-Like Defenders Defender Defender Defender
20 Mineral
Products
Shabbir Tiles And Ceramics
Ltd.
PA-Like Analyzer Analyzer Analyzers Analyzer
21 Mineral
Products
Tariq Glass Industries Ltd. DA-Like Analyzer PA-Like Analyzer Reactor
*Other Non-Metallic Mineral Products
The strategic types mentioned in columns 4, 5, and 6 show the transitions of the firms’
strategic stance over the time. The rows in black color (row # 2, 3, 4, 6, 9, 10, 14, 16, and
18) represent the consistent strategic orientation whereas blue color (row # 5, 8, 11, 12,
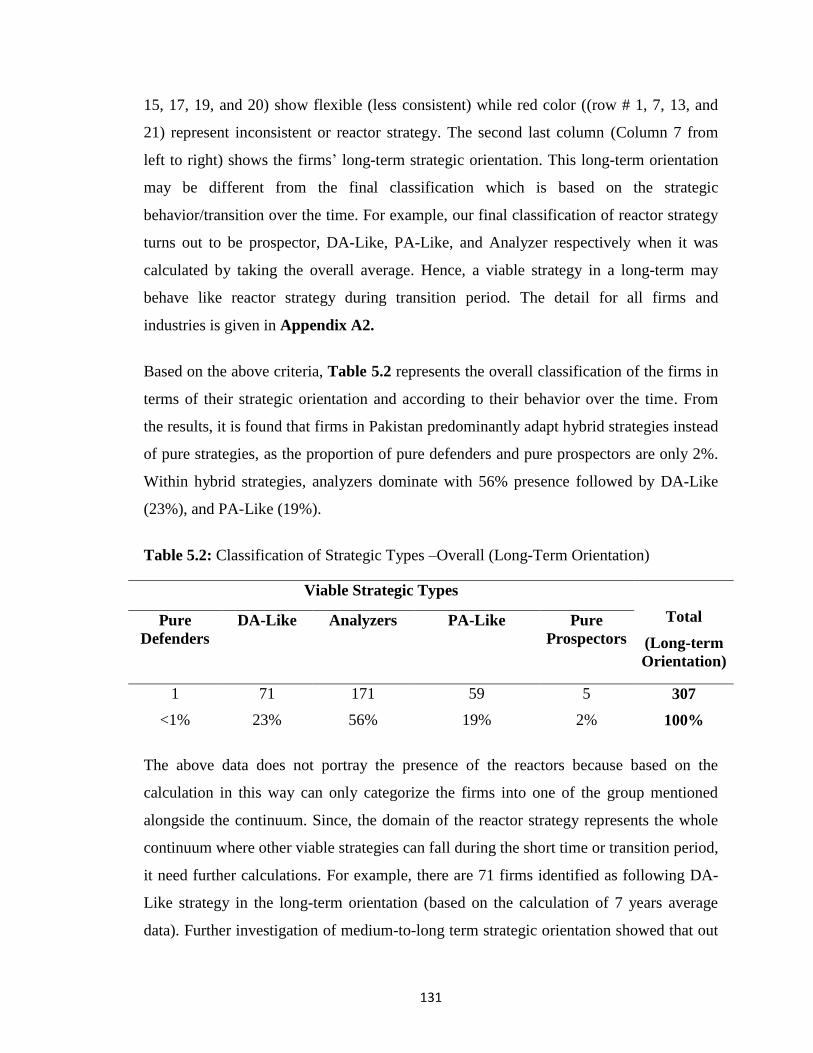
131
15, 17, 19, and 20) show flexible (less consistent) while red color ((row # 1, 7, 13, and
21) represent inconsistent or reactor strategy. The second last column (Column 7 from
left to right) shows the firms’ long-term strategic orientation. This long-term orientation
may be different from the final classification which is based on the strategic
behavior/transition over the time. For example, our final classification of reactor strategy
turns out to be prospector, DA-Like, PA-Like, and Analyzer respectively when it was
calculated by taking the overall average. Hence, a viable strategy in a long-term may
behave like reactor strategy during transition period. The detail for all firms and
industries is given in Appendix A2.
Based on the above criteria, Table 5.2 represents the overall classification of the firms in
terms of their strategic orientation and according to their behavior over the time. From
the results, it is found that firms in Pakistan predominantly adapt hybrid strategies instead
of pure strategies, as the proportion of pure defenders and pure prospectors are only 2%.
Within hybrid strategies, analyzers dominate with 56% presence followed by DA-Like
(23%), and PA-Like (19%).
Table 5.2: Classification of Strategic Types –Overall (Long-Term Orientation)
Viable Strategic Types
Total
(Long-term
Orientation)
Pure
Defenders
DA-Like Analyzers PA-Like Pure
Prospectors
1
<1%
71
23%
171
56%
59
19%
5
2%
307
100%
The above data does not portray the presence of the reactors because based on the
calculation in this way can only categorize the firms into one of the group mentioned
alongside the continuum. Since, the domain of the reactor strategy represents the whole
continuum where other viable strategies can fall during the short time or transition period,
it need further calculations. For example, there are 71 firms identified as following DA-
Like strategy in the long-term orientation (based on the calculation of 7 years average
data). Further investigation of medium-to-long term strategic orientation showed that out
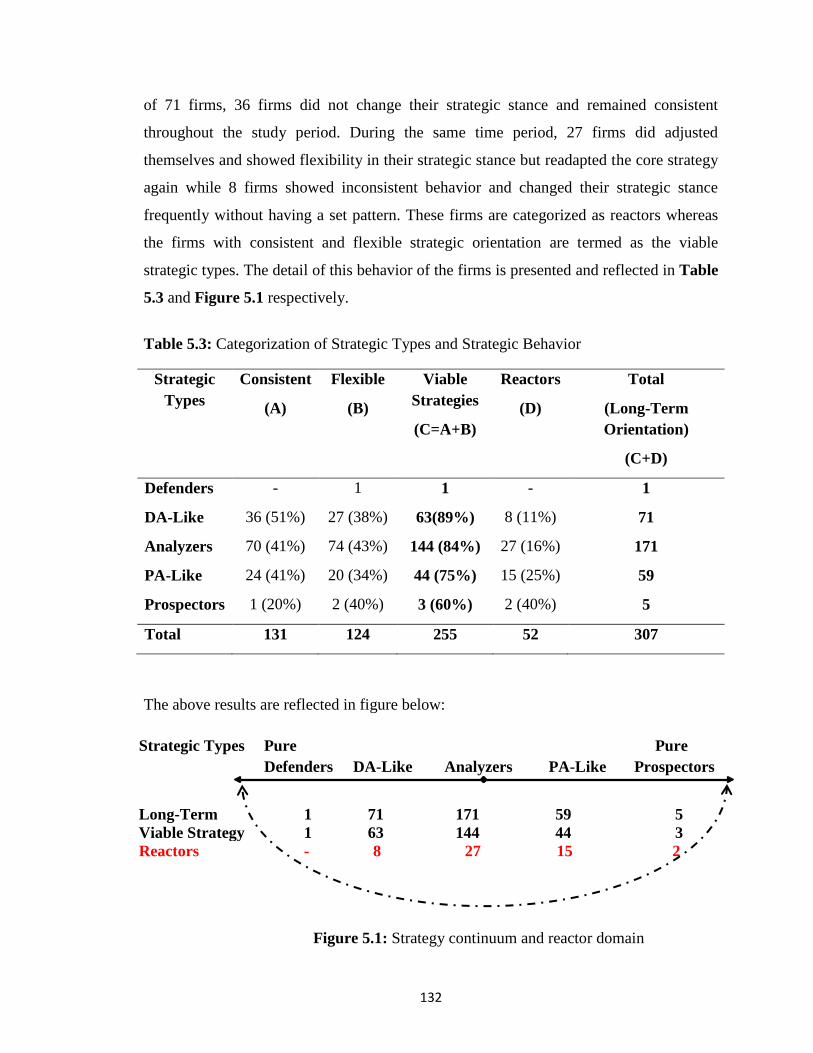
132
of 71 firms, 36 firms did not change their strategic stance and remained consistent
throughout the study period. During the same time period, 27 firms did adjusted
themselves and showed flexibility in their strategic stance but readapted the core strategy
again while 8 firms showed inconsistent behavior and changed their strategic stance
frequently without having a set pattern. These firms are categorized as reactors whereas
the firms with consistent and flexible strategic orientation are termed as the viable
strategic types. The detail of this behavior of the firms is presented and reflected in Table
5.3 and Figure 5.1 respectively.
Table 5.3: Categorization of Strategic Types and Strategic Behavior
Strategic
Types
Consistent
(A)
Flexible
(B)
Viable
Strategies
(C=A+B)
Reactors
(D)
Total
(Long-Term
Orientation)
(C+D)
Defenders - 1 1 - 1
DA-Like 36 (51%) 27 (38%) 63(89%) 8 (11%) 71
Analyzers 70 (41%) 74 (43%) 144 (84%) 27 (16%) 171
PA-Like 24 (41%) 20 (34%) 44 (75%) 15 (25%) 59
Prospectors 1 (20%) 2 (40%) 3 (60%) 2 (40%) 5
Total 131 124 255 52 307
The above results are reflected in figure below:
Strategic Types Pure Pure
Defenders DA-Like Analyzers PA-Like Prospectors
Long-Term 1 71 171 59 5
Viable Strategy 1 63 144 44 3
Reactors - 8 27 15 2
Figure 5.1: Strategy continuum and reactor domain
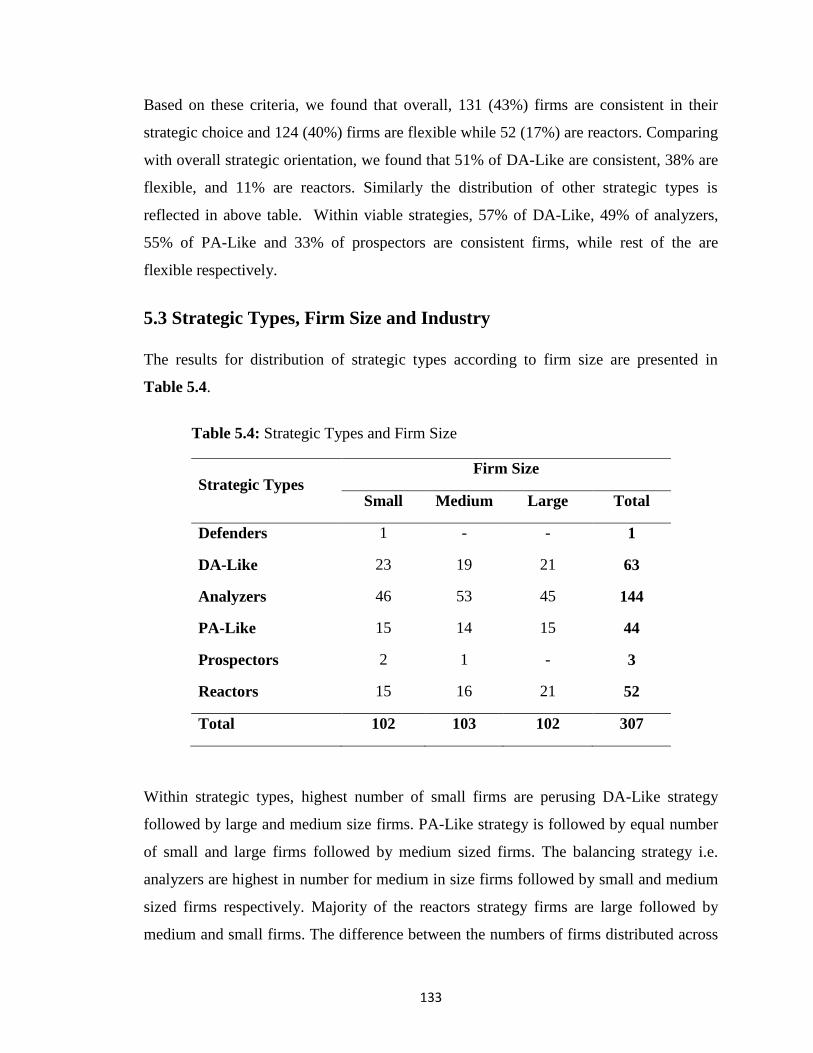
133
Based on these criteria, we found that overall, 131 (43%) firms are consistent in their
strategic choice and 124 (40%) firms are flexible while 52 (17%) are reactors. Comparing
with overall strategic orientation, we found that 51% of DA-Like are consistent, 38% are
flexible, and 11% are reactors. Similarly the distribution of other strategic types is
reflected in above table. Within viable strategies, 57% of DA-Like, 49% of analyzers,
55% of PA-Like and 33% of prospectors are consistent firms, while rest of the are
flexible respectively.
5.3 Strategic Types, Firm Size and Industry
The results for distribution of strategic types according to firm size are presented in
Table 5.4.
Table 5.4: Strategic Types and Firm Size
Strategic Types Firm Size
Small Medium Large Total
Defenders 1 - - 1
DA-Like 23 19 21 63
Analyzers 46 53 45 144
PA-Like 15 14 15 44
Prospectors 2 1 - 3
Reactors 15 16 21 52
Total 102 103 102 307
Within strategic types, highest number of small firms are perusing DA-Like strategy
followed by large and medium size firms. PA-Like strategy is followed by equal number
of small and large firms followed by medium sized firms. The balancing strategy i.e.
analyzers are highest in number for medium in size firms followed by small and medium
sized firms respectively. Majority of the reactors strategy firms are large followed by
medium and small firms. The difference between the numbers of firms distributed across
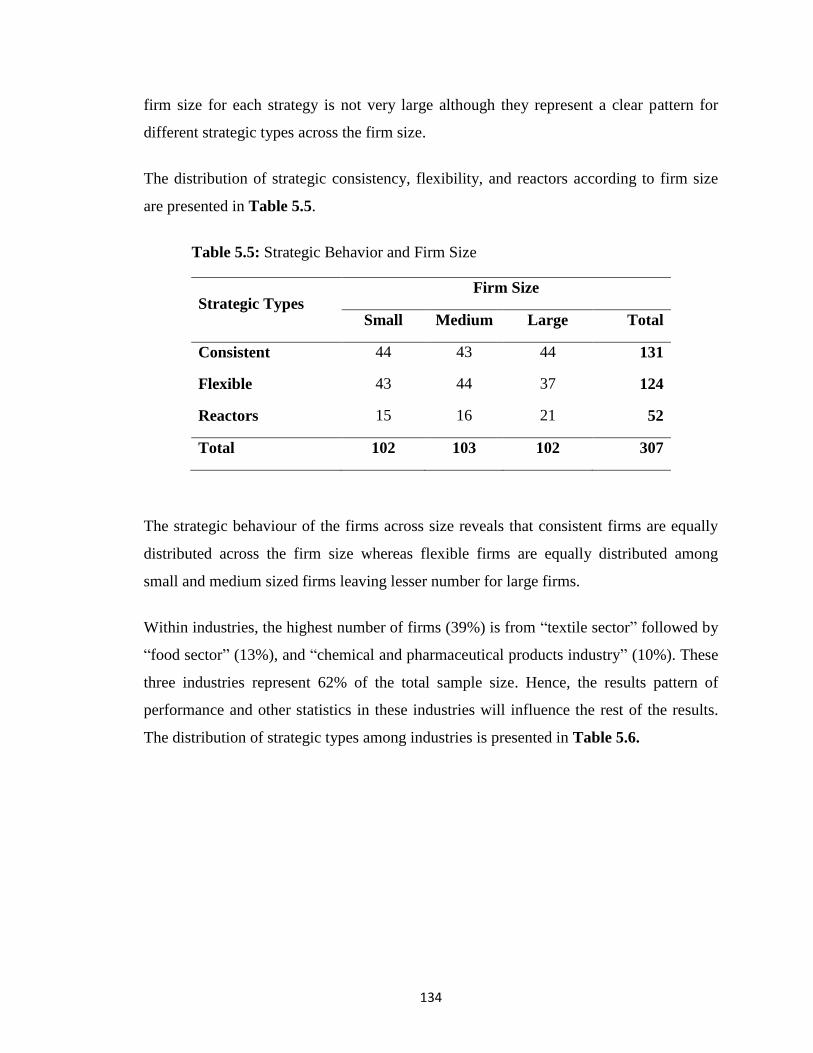
134
firm size for each strategy is not very large although they represent a clear pattern for
different strategic types across the firm size.
The distribution of strategic consistency, flexibility, and reactors according to firm size
are presented in Table 5.5.
Table 5.5: Strategic Behavior and Firm Size
Strategic Types Firm Size
Small Medium Large Total
Consistent 44 43 44 131
Flexible 43 44 37 124
Reactors 15 16 21 52
Total 102 103 102 307
The strategic behaviour of the firms across size reveals that consistent firms are equally
distributed across the firm size whereas flexible firms are equally distributed among
small and medium sized firms leaving lesser number for large firms.
Within industries, the highest number of firms (39%) is from “textile sector” followed by
“food sector” (13%), and “chemical and pharmaceutical products industry” (10%). These
three industries represent 62% of the total sample size. Hence, the results pattern of
performance and other statistics in these industries will influence the rest of the results.
The distribution of strategic types among industries is presented in Table 5.6.
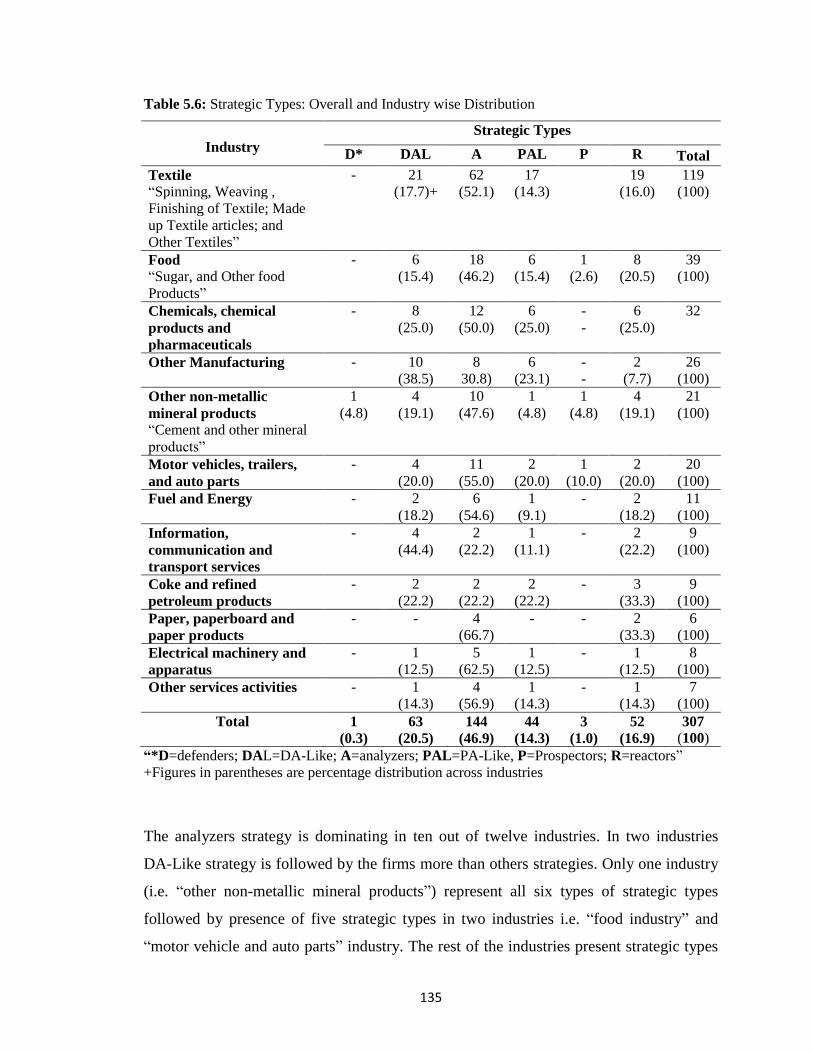
135
Table 5.6: Strategic Types: Overall and Industry wise Distribution
Industry
Strategic Types
D* DAL A PAL P R Total
Textile
“Spinning, Weaving ,
Finishing of Textile; Made
up Textile articles; and
Other Textiles”
- 21
(17.7)+
62
(52.1)
17
(14.3)
19
(16.0)
119
(100)
Food
“Sugar, and Other food
Products”
- 6
(15.4)
18
(46.2)
6
(15.4)
1
(2.6)
8
(20.5)
39
(100)
Chemicals, chemical
products and
pharmaceuticals
- 8
(25.0)
12
(50.0)
6
(25.0)
-
-
6
(25.0)
32
Other Manufacturing - 10
(38.5)
8
30.8)
6
(23.1)
-
-
2
(7.7)
26
(100)
Other non-metallic
mineral products
“Cement and other mineral
products”
1
(4.8)
4
(19.1)
10
(47.6)
1
(4.8)
1
(4.8)
4
(19.1)
21
(100)
Motor vehicles, trailers,
and auto parts
- 4
(20.0)
11
(55.0)
2
(20.0)
1
(10.0)
2
(20.0)
20
(100)
Fuel and Energy - 2
(18.2)
6
(54.6)
1
(9.1)
- 2
(18.2)
11
(100)
Information,
communication and
transport services
- 4
(44.4)
2
(22.2)
1
(11.1)
- 2
(22.2)
9
(100)
Coke and refined
petroleum products
- 2
(22.2)
2
(22.2)
2
(22.2)
- 3
(33.3)
9
(100)
Paper, paperboard and
paper products
- - 4
(66.7)
- - 2
(33.3)
6
(100)
Electrical machinery and
apparatus
- 1
(12.5)
5
(62.5)
1
(12.5)
- 1
(12.5)
8
(100)
Other services activities - 1
(14.3)
4
(56.9)
1
(14.3)
- 1
(14.3)
7
(100)
Total 1
(0.3)
63
(20.5)
144
(46.9)
44
(14.3)
3
(1.0)
52
(16.9)
307
(100)
“*D=defenders; DAL=DA-Like; A=analyzers; PAL=PA-Like, P=Prospectors; R=reactors”
+Figures in parentheses are percentage distribution across industries
The analyzers strategy is dominating in ten out of twelve industries. In two industries
DA-Like strategy is followed by the firms more than others strategies. Only one industry
(i.e. “other non-metallic mineral products”) represent all six types of strategic types
followed by presence of five strategic types in two industries i.e. “food industry” and
“motor vehicle and auto parts” industry. The rest of the industries present strategic types
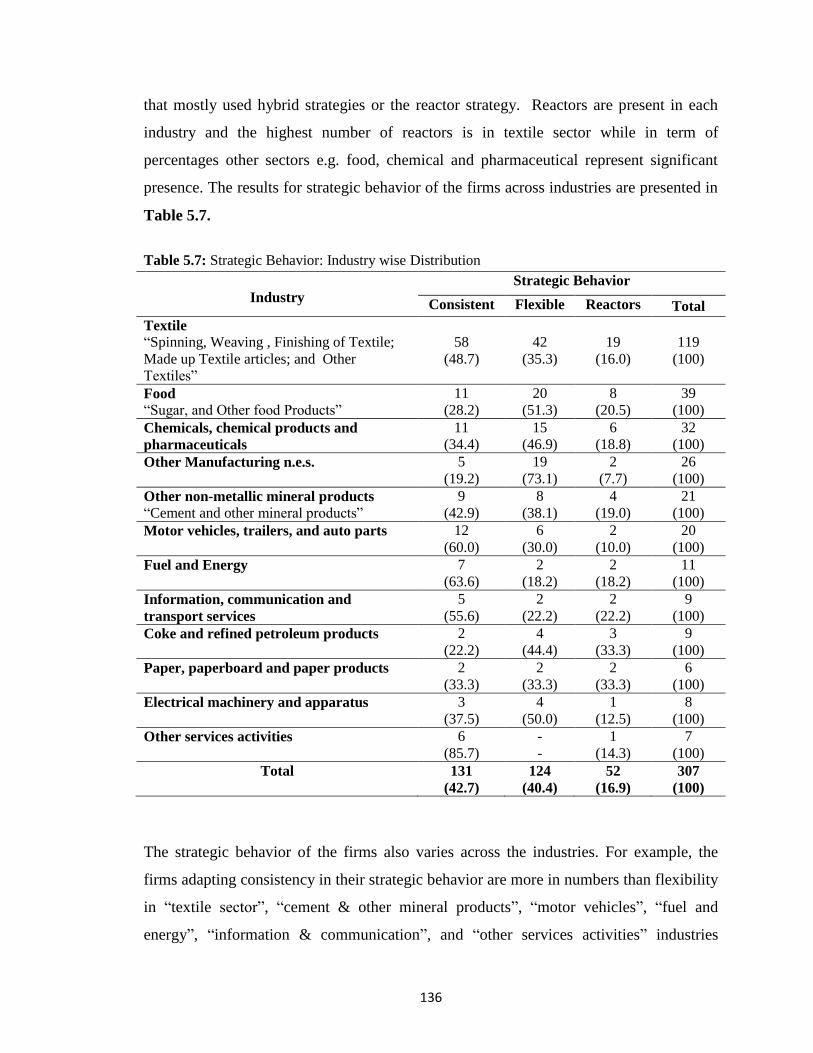
136
that mostly used hybrid strategies or the reactor strategy. Reactors are present in each
industry and the highest number of reactors is in textile sector while in term of
percentages other sectors e.g. food, chemical and pharmaceutical represent significant
presence. The results for strategic behavior of the firms across industries are presented in
Table 5.7.
Table 5.7: Strategic Behavior: Industry wise Distribution
Industry
Strategic Behavior
Consistent Flexible Reactors Total
Textile
“Spinning, Weaving , Finishing of Textile;
Made up Textile articles; and Other
Textiles”
58
(48.7)
42
(35.3)
19
(16.0)
119
(100)
Food
“Sugar, and Other food Products”
11
(28.2)
20
(51.3)
8
(20.5)
39
(100)
Chemicals, chemical products and
pharmaceuticals
11
(34.4)
15
(46.9)
6
(18.8)
32
(100)
Other Manufacturing n.e.s. 5
(19.2)
19
(73.1)
2
(7.7)
26
(100)
Other non-metallic mineral products
“Cement and other mineral products”
9
(42.9)
8
(38.1)
4
(19.0)
21
(100)
Motor vehicles, trailers, and auto parts 12
(60.0)
6
(30.0)
2
(10.0)
20
(100)
Fuel and Energy 7
(63.6)
2
(18.2)
2
(18.2)
11
(100)
Information, communication and
transport services
5
(55.6)
2
(22.2)
2
(22.2)
9
(100)
Coke and refined petroleum products 2
(22.2)
4
(44.4)
3
(33.3)
9
(100)
Paper, paperboard and paper products 2
(33.3)
2
(33.3)
2
(33.3)
6
(100)
Electrical machinery and apparatus 3
(37.5)
4
(50.0)
1
(12.5)
8
(100)
Other services activities 6
(85.7)
-
-
1
(14.3)
7
(100)
Total 131
(42.7)
124
(40.4)
52
(16.9)
307
(100)
The strategic behavior of the firms also varies across the industries. For example, the
firms adapting consistency in their strategic behavior are more in numbers than flexibility
in “textile sector”, “cement & other mineral products”, “motor vehicles”, “fuel and
energy”, “information & communication”, and “other services activities” industries
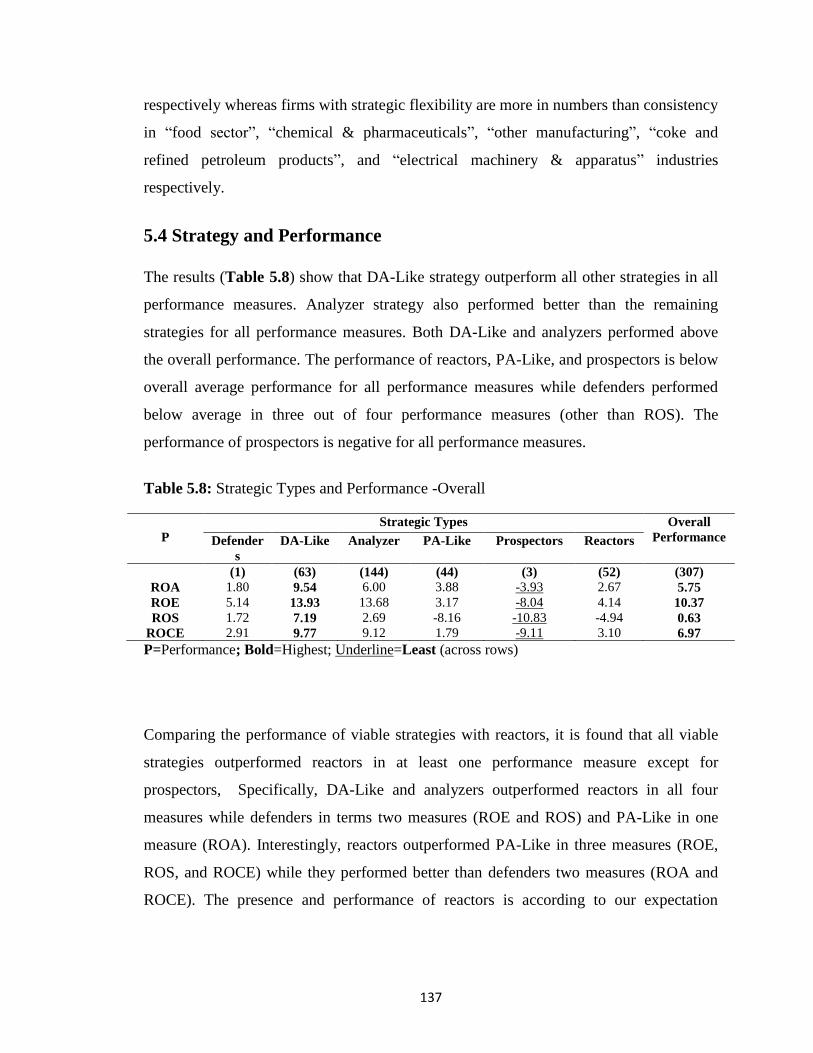
137
respectively whereas firms with strategic flexibility are more in numbers than consistency
in “food sector”, “chemical & pharmaceuticals”, “other manufacturing”, “coke and
refined petroleum products”, and “electrical machinery & apparatus” industries
respectively.
5.4 Strategy and Performance
The results (Table 5.8) show that DA-Like strategy outperform all other strategies in all
performance measures. Analyzer strategy also performed better than the remaining
strategies for all performance measures. Both DA-Like and analyzers performed above
the overall performance. The performance of reactors, PA-Like, and prospectors is below
overall average performance for all performance measures while defenders performed
below average in three out of four performance measures (other than ROS). The
performance of prospectors is negative for all performance measures.
Table 5.8: Strategic Types and Performance -Overall
P
Strategic Types Overall
Performance Defender
s
DA-Like Analyzer PA-Like Prospectors Reactors
ROA
ROE
ROS
ROCE
(1)
1.80
5.14
1.72
2.91
(63)
9.54
13.93
7.19
9.77
(144)
6.00
13.68
2.69
9.12
(44)
3.88
3.17
-8.16
1.79
(3)
-3.93
-8.04
-10.83
-9.11
(52)
2.67
4.14
-4.94
3.10
(307)
5.75
10.37
0.63
6.97
P=Performance; Bold=Highest; Underline=Least (across rows)
Comparing the performance of viable strategies with reactors, it is found that all viable
strategies outperformed reactors in at least one performance measure except for
prospectors, Specifically, DA-Like and analyzers outperformed reactors in all four
measures while defenders in terms two measures (ROE and ROS) and PA-Like in one
measure (ROA). Interestingly, reactors outperformed PA-Like in three measures (ROE,
ROS, and ROCE) while they performed better than defenders two measures (ROA and
ROCE). The presence and performance of reactors is according to our expectation
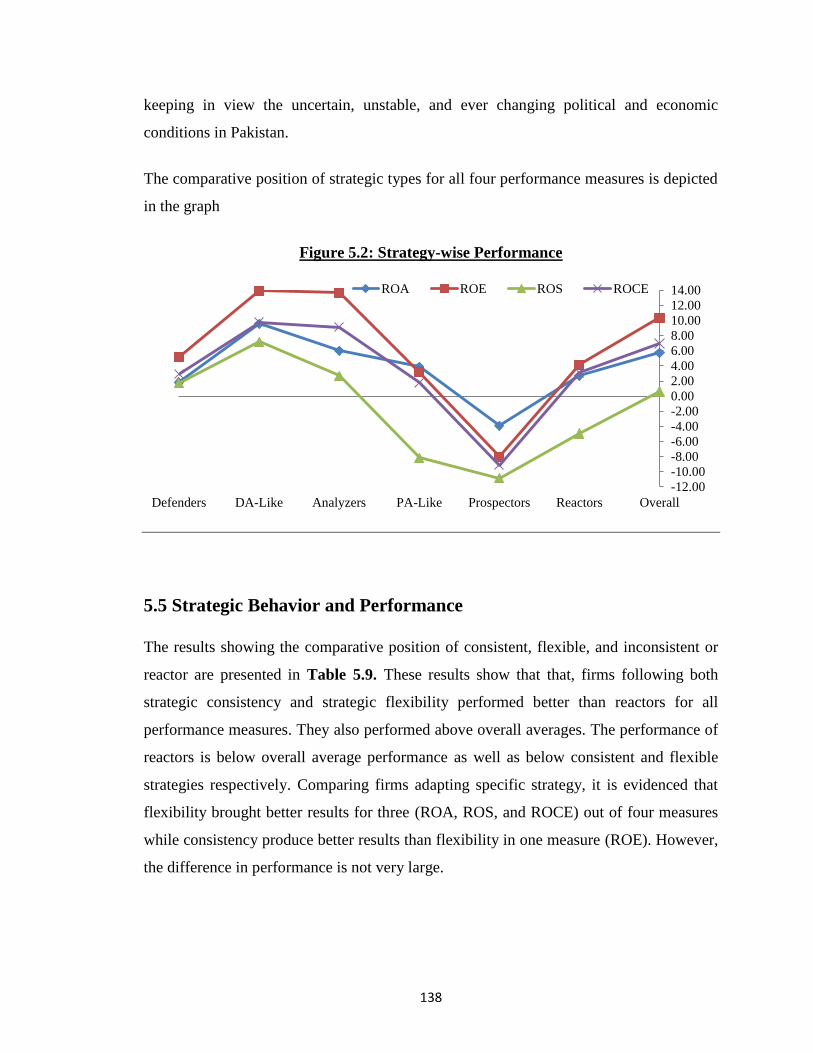
138
keeping in view the uncertain, unstable, and ever changing political and economic
conditions in Pakistan.
The comparative position of strategic types for all four performance measures is depicted
in the graph
Figure 5.2: Strategy-wise Performance
5.5 Strategic Behavior and Performance
The results showing the comparative position of consistent, flexible, and inconsistent or
reactor are presented in Table 5.9. These results show that that, firms following both
strategic consistency and strategic flexibility performed better than reactors for all
performance measures. They also performed above overall averages. The performance of
reactors is below overall average performance as well as below consistent and flexible
strategies respectively. Comparing firms adapting specific strategy, it is evidenced that
flexibility brought better results for three (ROA, ROS, and ROCE) out of four measures
while consistency produce better results than flexibility in one measure (ROE). However,
the difference in performance is not very large.
-12.00
-10.00
-8.00
-6.00
-4.00
-2.00
0.00
2.00
4.00
6.00
8.00
10.00
12.00
14.00
Defenders DA-Like Analyzers PA-Like Prospectors Reactors Overall
ROA ROE ROS ROCE
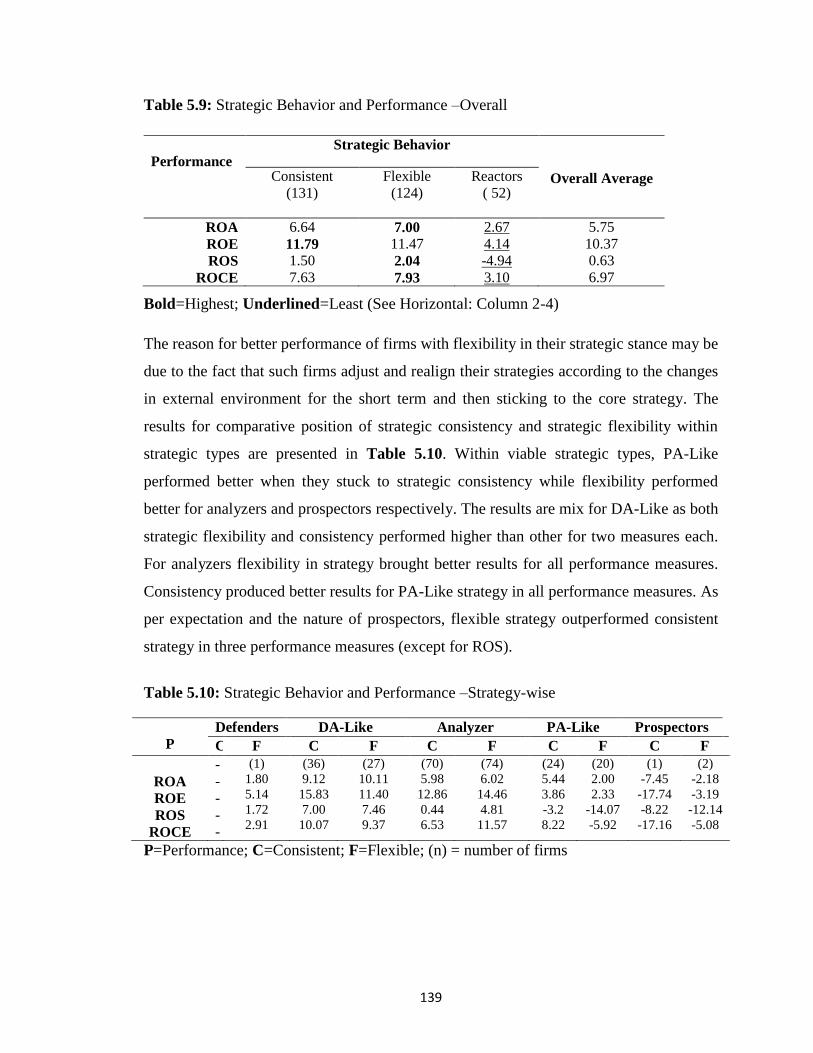
139
Table 5.9: Strategic Behavior and Performance –Overall
Performance
Strategic Behavior
Overall Average Consistent
(131)
Flexible
(124)
Reactors
( 52)
ROA 6.64 7.00 2.67 5.75
ROE 11.79 11.47 4.14 10.37
ROS 1.50 2.04 -4.94 0.63
ROCE 7.63 7.93 3.10 6.97
Bold=Highest; Underlined=Least (See Horizontal: Column 2-4)
The reason for better performance of firms with flexibility in their strategic stance may be
due to the fact that such firms adjust and realign their strategies according to the changes
in external environment for the short term and then sticking to the core strategy. The
results for comparative position of strategic consistency and strategic flexibility within
strategic types are presented in Table 5.10. Within viable strategic types, PA-Like
performed better when they stuck to strategic consistency while flexibility performed
better for analyzers and prospectors respectively. The results are mix for DA-Like as both
strategic flexibility and consistency performed higher than other for two measures each.
For analyzers flexibility in strategy brought better results for all performance measures.
Consistency produced better results for PA-Like strategy in all performance measures. As
per expectation and the nature of prospectors, flexible strategy outperformed consistent
strategy in three performance measures (except for ROS).
Table 5.10: Strategic Behavior and Performance –Strategy-wise
P
Defenders DA-Like Analyzer PA-Like Prospectors
C F C F C F C F C F
ROA
ROE
ROS
ROCE
-
-
-
-
-
(1)
1.80
5.14
1.72
2.91
(36)
9.12
15.83
7.00
10.07
(27)
10.11
11.40
7.46
9.37
(70)
5.98
12.86
0.44
6.53
(74)
6.02
14.46
4.81
11.57
(24)
5.44
3.86
-3.2
8.22
(20)
2.00
2.33
-14.07
-5.92
(1)
-7.45
-17.74
-8.22
-17.16
(2)
-2.18
-3.19
-12.14
-5.08
P=Performance; C=Consistent; F=Flexible; (n) = number of firms
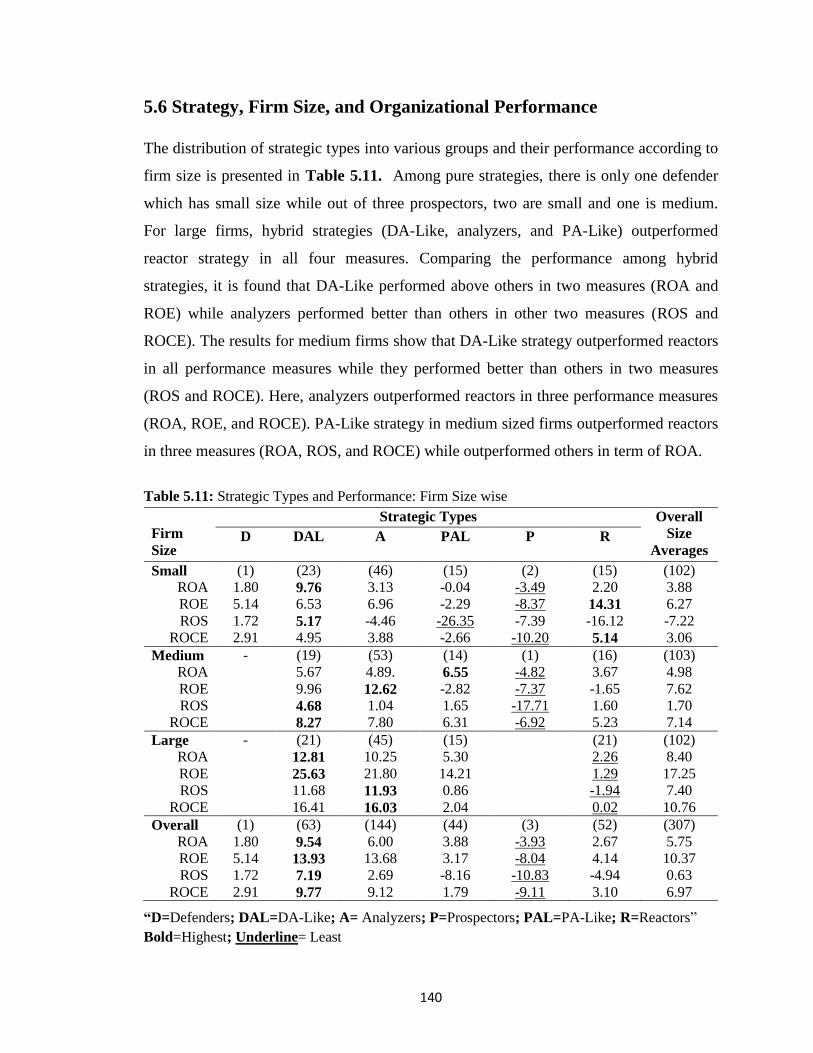
140
5.6 Strategy, Firm Size, and Organizational Performance
The distribution of strategic types into various groups and their performance according to
firm size is presented in Table 5.11. Among pure strategies, there is only one defender
which has small size while out of three prospectors, two are small and one is medium.
For large firms, hybrid strategies (DA-Like, analyzers, and PA-Like) outperformed
reactor strategy in all four measures. Comparing the performance among hybrid
strategies, it is found that DA-Like performed above others in two measures (ROA and
ROE) while analyzers performed better than others in other two measures (ROS and
ROCE). The results for medium firms show that DA-Like strategy outperformed reactors
in all performance measures while they performed better than others in two measures
(ROS and ROCE). Here, analyzers outperformed reactors in three performance measures
(ROA, ROE, and ROCE). PA-Like strategy in medium sized firms outperformed reactors
in three measures (ROA, ROS, and ROCE) while outperformed others in term of ROA.
Table 5.11: Strategic Types and Performance: Firm Size wise
Firm
Size
Strategic Types Overall
Size
Averages D
DAL
A
PAL
P
R
Small
ROA
ROE
ROS
ROCE
(1)
1.80
5.14
1.72
2.91
(23)
9.76 6.53
5.17 4.95
(46)
3.13
6.96
-4.46
3.88
(15)
-0.04
-2.29
-26.35
-2.66
(2)
-3.49
-8.37
-7.39
-10.20
(15)
2.20
14.31 -16.12
5.14
(102)
3.88
6.27
-7.22
3.06
Medium
ROA
ROE
ROS
ROCE
- (19)
5.67
9.96
4.68
8.27
(53)
4.89.
12.62 1.04
7.80
(14)
6.55 -2.82
1.65
6.31
(1)
-4.82
-7.37
-17.71
-6.92
(16)
3.67
-1.65
1.60
5.23
(103)
4.98
7.62
1.70
7.14
Large
ROA
ROE
ROS
ROCE
- (21)
12.81
25.63 11.68
16.41
(45)
10.25
21.80
11.93
16.03
(15)
5.30
14.21
0.86
2.04
(21)
2.26
1.29
-1.94
0.02
(102)
8.40
17.25
7.40
10.76
Overall
ROA
ROE
ROS
ROCE
(1)
1.80
5.14
1.72
2.91
(63)
9.54
13.93
7.19
9.77
(144)
6.00
13.68
2.69
9.12
(44)
3.88
3.17
-8.16
1.79
(3)
-3.93
-8.04
-10.83
-9.11
(52)
2.67
4.14
-4.94
3.10
(307)
5.75
10.37
0.63
6.97
“D=Defenders; DAL=DA-Like; A= Analyzers; P=Prospectors; PAL=PA-Like; R=Reactors”
Bold=Highest; Underline= Least
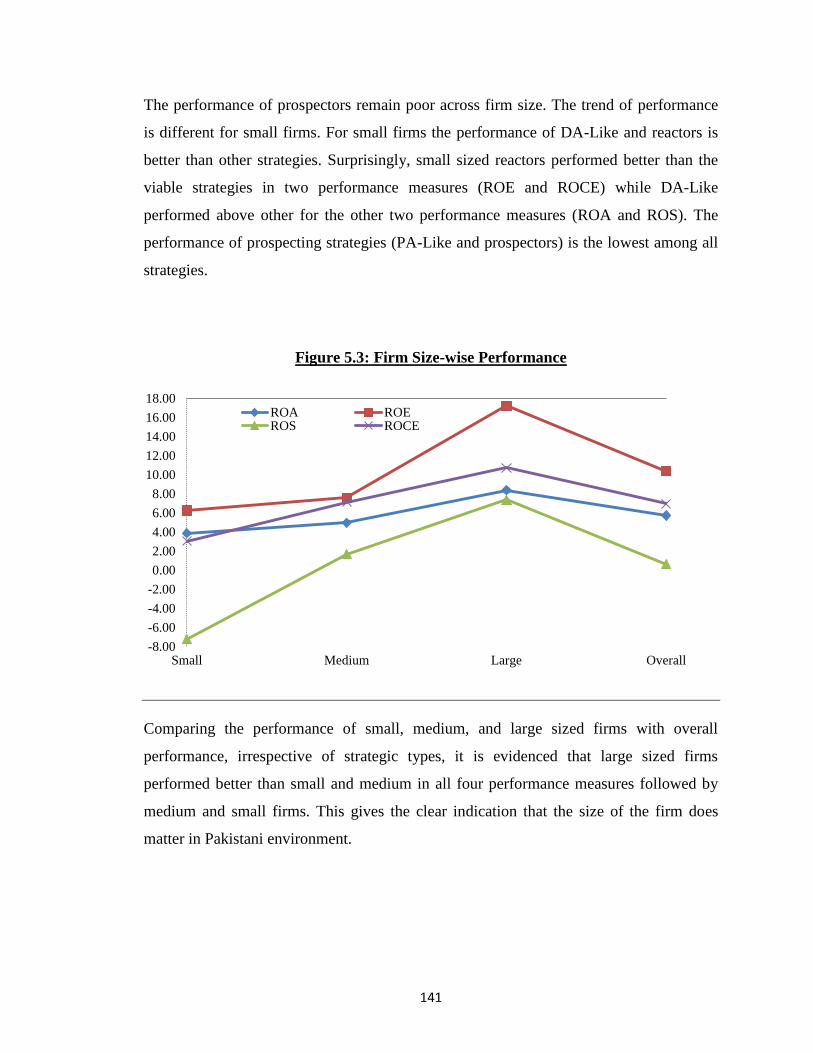
141
The performance of prospectors remain poor across firm size. The trend of performance
is different for small firms. For small firms the performance of DA-Like and reactors is
better than other strategies. Surprisingly, small sized reactors performed better than the
viable strategies in two performance measures (ROE and ROCE) while DA-Like
performed above other for the other two performance measures (ROA and ROS). The
performance of prospecting strategies (PA-Like and prospectors) is the lowest among all
strategies.
Figure 5.3: Firm Size-wise Performance
Comparing the performance of small, medium, and large sized firms with overall
performance, irrespective of strategic types, it is evidenced that large sized firms
performed better than small and medium in all four performance measures followed by
medium and small firms. This gives the clear indication that the size of the firm does
matter in Pakistani environment.
-8.00
-6.00
-4.00
-2.00
0.00
2.00
4.00
6.00
8.00
10.00
12.00
14.00
16.00
18.00
Small Medium Large Overall
ROA ROEROS ROCE
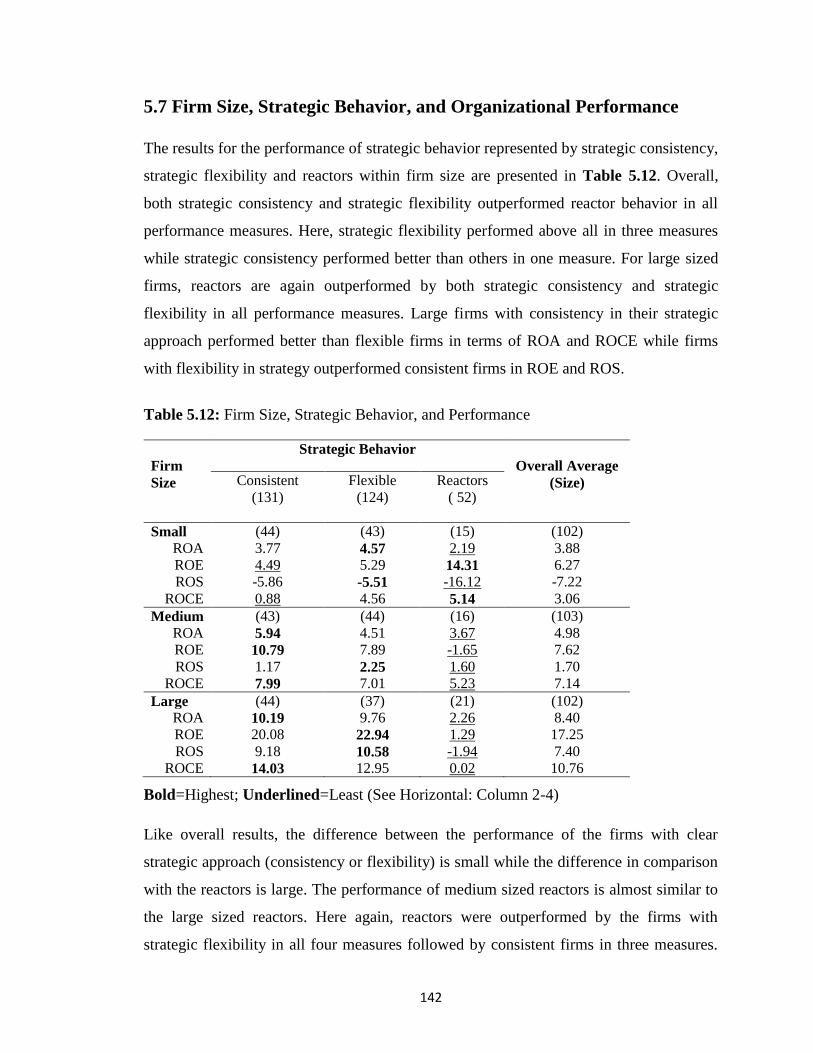
142
5.7 Firm Size, Strategic Behavior, and Organizational Performance
The results for the performance of strategic behavior represented by strategic consistency,
strategic flexibility and reactors within firm size are presented in Table 5.12. Overall,
both strategic consistency and strategic flexibility outperformed reactor behavior in all
performance measures. Here, strategic flexibility performed above all in three measures
while strategic consistency performed better than others in one measure. For large sized
firms, reactors are again outperformed by both strategic consistency and strategic
flexibility in all performance measures. Large firms with consistency in their strategic
approach performed better than flexible firms in terms of ROA and ROCE while firms
with flexibility in strategy outperformed consistent firms in ROE and ROS.
Table 5.12: Firm Size, Strategic Behavior, and Performance
Firm
Size
Strategic Behavior
Overall Average
(Size) Consistent
(131)
Flexible
(124)
Reactors
( 52)
Small
ROA
ROE
ROS
ROCE
(44)
3.77
4.49
-5.86
0.88
(43)
4.57
5.29
-5.51
4.56
(15)
2.19
14.31
-16.12
5.14
(102)
3.88
6.27
-7.22
3.06
Medium
ROA
ROE
ROS
ROCE
(43)
5.94
10.79
1.17
7.99
(44)
4.51
7.89
2.25
7.01
(16)
3.67
-1.65
1.60
5.23
(103)
4.98
7.62
1.70
7.14
Large
ROA
ROE
ROS
ROCE
(44)
10.19
20.08
9.18
14.03
(37)
9.76
22.94
10.58
12.95
(21)
2.26
1.29
-1.94
0.02
(102)
8.40
17.25
7.40
10.76
Bold=Highest; Underlined=Least (See Horizontal: Column 2-4)
Like overall results, the difference between the performance of the firms with clear
strategic approach (consistency or flexibility) is small while the difference in comparison
with the reactors is large. The performance of medium sized reactors is almost similar to
the large sized reactors. Here again, reactors were outperformed by the firms with
strategic flexibility in all four measures followed by consistent firms in three measures.
143
However, the performance of firms perusing consistency in their strategic behavior
outperformed the firms with flexible approach in three out of four measures. The results
are quite different for small sized firms where firms with flexible behavior performed
better followed by reactors. Here, the flexibility in strategic behavior outperformed others
in terms of ROA, and ROS while reactors performed better than others in terms of ROE
and ROCE. However, reactors were outperformed by others in terms of ROA and ROS.
Small sized firms with consistent behavior performed poorly for ROE and ROCE
measures. These results reveal that firms with conscious approach in their strategic
choice brings the fruits in terms of better performance whereas inconsistent or reactor
behavior may get some benefits but not all the time and not across the firm size.
5.8 Strategy, Industry, and Performance
The results for comparative position of strategy, industry, and performance are presented
in Table 5.13. The performance of four industries: “Food industry (sugar and other food
products)”, “Chemical, chemical products, and pharmaceuticals”, “Motor Vehicles,
trailers, and auto parts”, and “Coke and refined petroleum products” industries was found
above overall averages for all performance measures. Three industries i.e. “Other
manufacturing”, “Information, communication, & transport services”, and “Paper,
paperboard, and paper products” performed above overall average in three measures. The
performance of the largest industry i.e. “Textile” along with “cement and other non-
mineral products” industry performed below overall averages for all measures. Since,
these two industries represent 46% of overall sample size, the high performing industries
listed above becomes invisible if not analyzed separately.
The results for the performance of strategic types across the industries also provide
interesting and useful information. For example, the performance of DA-Like firms is
reported above the overall averages but when it is investigated across industries it was
found that there is a great variation in their performance from industry to industry. For
instance, in “Food”, and “Other non-metallic mineral products” industries, DA-Like
outperformed others for all measures while in “Textile”, “Other manufacturing”, and
“Coke and refined petroleum products” they performed better than others in two
144
measures only. The performance of analyzers also varies across industries. They
outperformed others in “Fuel and Energy” and “Paper paperboard and paper products”
for all performance measures while they performed better than others in three
performance measures in one industry (“Other services activities”) and by two measures
in two industries: “Textile”, “Chemical, chemical products, and pharmaceuticals”.
Although, the performance of PA-Like firms is below expectation in aggregate terms,
they performed better in two industries i.e. “Motor vehicles, trailers, and auto parts”, and
“Information, communication, and transport services” industries for three out of four
performance measures followed by in two measures in one industry (“Coke and refined
petroleum products”). Reactors also performed better than others in “Chemical, chemical
products, and pharmaceuticals” industry for two measures. The results also indicate that
although, the performance of DA-Like and analyzers strategies remain well across
industries, the performance of DA-Like strategy was better in large and medium sized
industries while the performance of analyzers strategy was better in medium to-small
scale industries.
The results clearly indicate that there is no best strategy applicable for all industries. The
nature, competition, and other dynamics demand different strategic stance in different
industries.
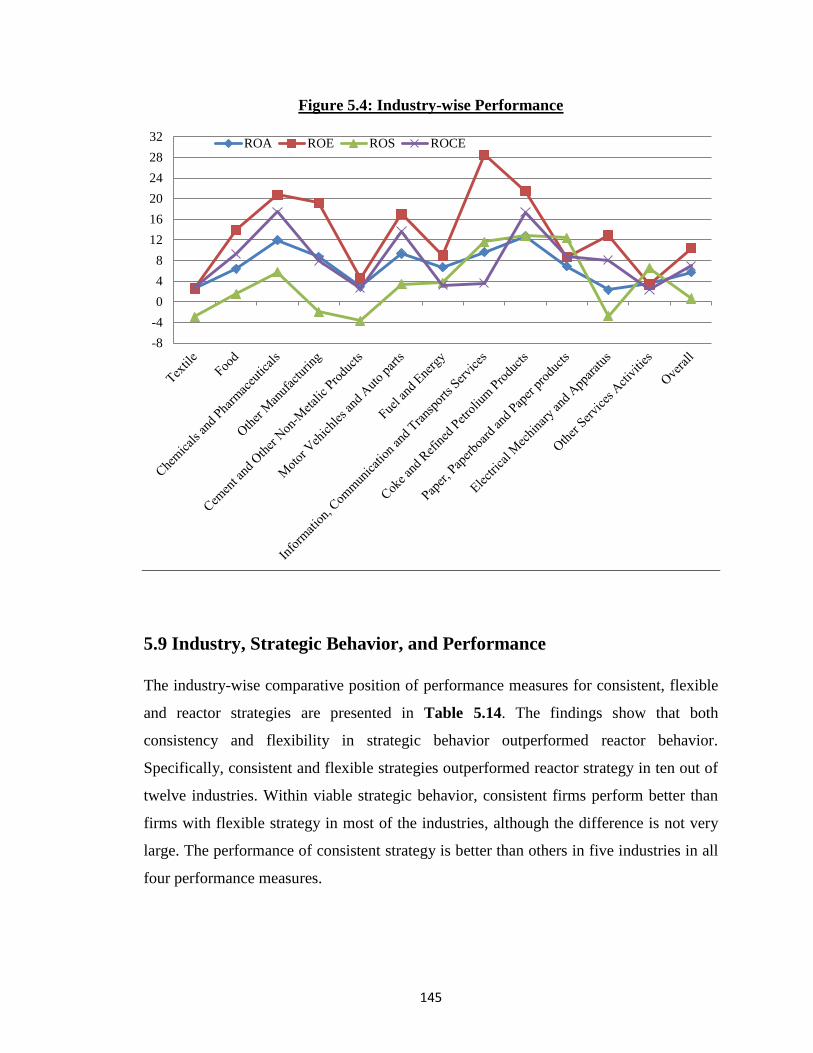
145
Figure 5.4: Industry-wise Performance
5.9 Industry, Strategic Behavior, and Performance
The industry-wise comparative position of performance measures for consistent, flexible
and reactor strategies are presented in Table 5.14. The findings show that both
consistency and flexibility in strategic behavior outperformed reactor behavior.
Specifically, consistent and flexible strategies outperformed reactor strategy in ten out of
twelve industries. Within viable strategic behavior, consistent firms perform better than
firms with flexible strategy in most of the industries, although the difference is not very
large. The performance of consistent strategy is better than others in five industries in all
four performance measures.
-8
-4
0
4
8
12
16
20
24
28
32ROA ROE ROS ROCE
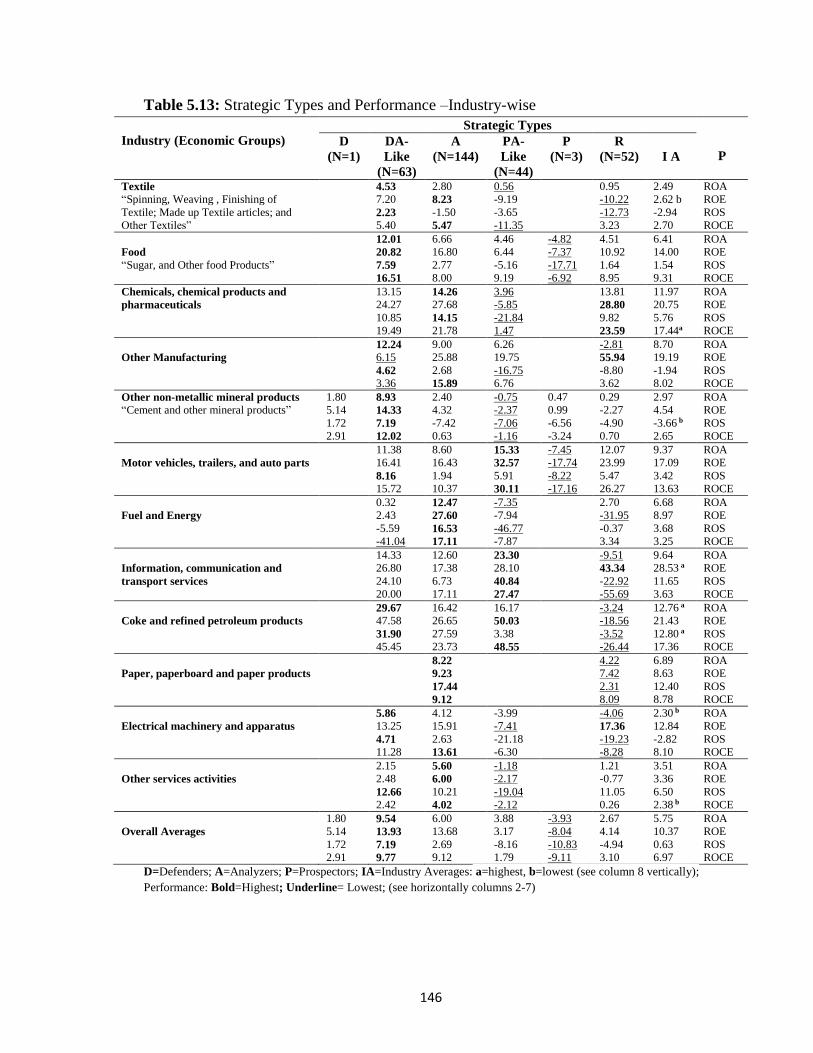
146
Table 5.13: Strategic Types and Performance –Industry-wise
Industry (Economic Groups)
Strategic Types
P D
(N=1)
DA-
Like
(N=63)
A
(N=144)
PA-
Like
(N=44)
P
(N=3)
R
(N=52) I A
Textile
“Spinning, Weaving , Finishing of
Textile; Made up Textile articles; and
Other Textiles”
4.53
7.20
2.23
5.40
2.80
8.23
-1.50
5.47
0.56
-9.19
-3.65
-11.35
0.95
-10.22
-12.73
3.23
2.49
2.62 b
-2.94
2.70
ROA
ROE
ROS
ROCE
Food
“Sugar, and Other food Products”
12.01
20.82
7.59
16.51
6.66
16.80
2.77
8.00
4.46
6.44
-5.16
9.19
-4.82
-7.37
-17.71
-6.92
4.51
10.92
1.64
8.95
6.41
14.00
1.54
9.31
ROA
ROE
ROS
ROCE
Chemicals, chemical products and
pharmaceuticals
13.15
24.27
10.85
19.49
14.26
27.68
14.15
21.78
3.96
-5.85
-21.84
1.47
13.81
28.80
9.82
23.59
11.97
20.75
5.76
17.44a
ROA
ROE
ROS
ROCE
Other Manufacturing
12.24
6.15
4.62
3.36
9.00
25.88
2.68
15.89
6.26
19.75
-16.75
6.76
-2.81
55.94
-8.80
3.62
8.70
19.19
-1.94
8.02
ROA
ROE
ROS
ROCE
Other non-metallic mineral products
“Cement and other mineral products”
1.80
5.14
1.72
2.91
8.93
14.33
7.19
12.02
2.40
4.32
-7.42
0.63
-0.75
-2.37
-7.06
-1.16
0.47
0.99
-6.56
-3.24
0.29
-2.27
-4.90
0.70
2.97
4.54
-3.66 b
2.65
ROA
ROE
ROS
ROCE
Motor vehicles, trailers, and auto parts
11.38
16.41
8.16
15.72
8.60
16.43
1.94
10.37
15.33
32.57
5.91
30.11
-7.45
-17.74
-8.22
-17.16
12.07
23.99
5.47
26.27
9.37
17.09
3.42
13.63
ROA
ROE
ROS
ROCE
Fuel and Energy
0.32
2.43
-5.59
-41.04
12.47
27.60
16.53
17.11
-7.35
-7.94
-46.77
-7.87
2.70
-31.95
-0.37
3.34
6.68
8.97
3.68
3.25
ROA
ROE
ROS
ROCE
Information, communication and
transport services
14.33
26.80
24.10
20.00
12.60
17.38
6.73
17.11
23.30
28.10
40.84
27.47
-9.51
43.34
-22.92
-55.69
9.64
28.53 a
11.65
3.63
ROA
ROE
ROS
ROCE
Coke and refined petroleum products
29.67
47.58
31.90
45.45
16.42
26.65
27.59
23.73
16.17
50.03
3.38
48.55
-3.24
-18.56
-3.52
-26.44
12.76 a
21.43
12.80 a
17.36
ROA
ROE
ROS
ROCE
Paper, paperboard and paper products
8.22
9.23
17.44
9.12
4.22
7.42
2.31
8.09
6.89
8.63
12.40
8.78
ROA
ROE
ROS
ROCE
Electrical machinery and apparatus
5.86
13.25
4.71
11.28
4.12
15.91
2.63
13.61
-3.99
-7.41
-21.18
-6.30
-4.06
17.36
-19.23
-8.28
2.30 b
12.84
-2.82
8.10
ROA
ROE
ROS
ROCE
Other services activities
2.15
2.48
12.66
2.42
5.60
6.00
10.21
4.02
-1.18
-2.17
-19.04
-2.12
1.21
-0.77
11.05
0.26
3.51
3.36
6.50
2.38 b
ROA
ROE
ROS
ROCE
Overall Averages
1.80
5.14
1.72
2.91
9.54
13.93
7.19
9.77
6.00
13.68
2.69
9.12
3.88
3.17
-8.16
1.79
-3.93
-8.04
-10.83
-9.11
2.67
4.14
-4.94
3.10
5.75
10.37
0.63
6.97
ROA
ROE
ROS
ROCE
D=Defenders; A=Analyzers; P=Prospectors; IA=Industry Averages: a=highest, b=lowest (see column 8 vertically);
Performance: Bold=Highest; Underline= Lowest; (see horizontally columns 2-7)
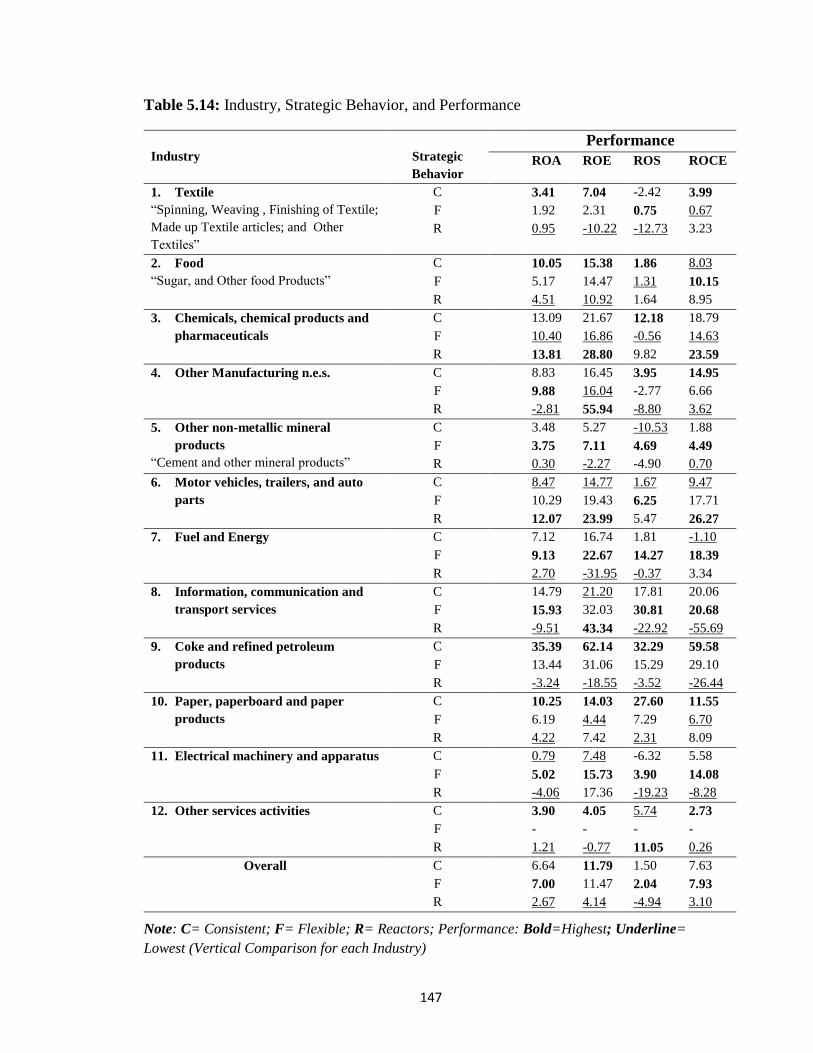
147
Table 5.14: Industry, Strategic Behavior, and Performance
Industry
Strategic
Behavior
Performance
ROA ROE ROS ROCE
1. Textile
“Spinning, Weaving , Finishing of Textile;
Made up Textile articles; and Other
Textiles”
C 3.41 7.04 -2.42 3.99
F 1.92 2.31 0.75 0.67
R 0.95 -10.22 -12.73 3.23
2. Food
“Sugar, and Other food Products”
C 10.05 15.38 1.86 8.03
F 5.17 14.47 1.31 10.15
R 4.51 10.92 1.64 8.95
3. Chemicals, chemical products and
pharmaceuticals
C 13.09 21.67 12.18 18.79
F 10.40 16.86 -0.56 14.63
R 13.81 28.80 9.82 23.59
4. Other Manufacturing n.e.s. C 8.83 16.45 3.95 14.95
F 9.88 16.04 -2.77 6.66
R -2.81 55.94 -8.80 3.62
5. Other non-metallic mineral
products
“Cement and other mineral products”
C 3.48 5.27 -10.53 1.88
F 3.75 7.11 4.69 4.49
R 0.30 -2.27 -4.90 0.70
6. Motor vehicles, trailers, and auto
parts
C 8.47 14.77 1.67 9.47
F 10.29 19.43 6.25 17.71
R 12.07 23.99 5.47 26.27
7. Fuel and Energy C 7.12 16.74 1.81 -1.10
F 9.13 22.67 14.27 18.39
R 2.70 -31.95 -0.37 3.34
8. Information, communication and
transport services
C 14.79 21.20 17.81 20.06
F 15.93 32.03 30.81 20.68
R -9.51 43.34 -22.92 -55.69
9. Coke and refined petroleum
products
C 35.39 62.14 32.29 59.58
F 13.44 31.06 15.29 29.10
R -3.24 -18.55 -3.52 -26.44
10. Paper, paperboard and paper
products
C 10.25 14.03 27.60 11.55
F 6.19 4.44 7.29 6.70
R 4.22 7.42 2.31 8.09
11. Electrical machinery and apparatus C 0.79 7.48 -6.32 5.58
F 5.02 15.73 3.90 14.08
R -4.06 17.36 -19.23 -8.28
12. Other services activities C 3.90 4.05 5.74 2.73
F - - - -
R 1.21 -0.77 11.05 0.26
Overall C 6.64 11.79 1.50 7.63
F 7.00 11.47 2.04 7.93
R 2.67 4.14 -4.94 3.10
Note: C= Consistent; F= Flexible; R= Reactors; Performance: Bold=Highest; Underline=
Lowest (Vertical Comparison for each Industry)
148
Firms following flexible strategy performed better than their counterparts in five
industries when performance was measured in terms of ROA and ROCE. They
performed better than others in two industries in terms of ROE while in six industries in
when performance measure was ROS. The performance of reactor strategy was also good
in many cases. For example they performed above other in terms of ROE in four
industries while for ROA it was better than others in two industries and for ROCE it was
in one industry.
5.10 Hypotheses Testing
This section provides the detailed results for hypotheses (H1 to H11).
5.10.1 Proportionate Distribution of Strategic Types
One of the premises is that all strategic types do exist in an economy and similar pattern
may be followed in a given industry as well. This may not hold true because of the
dynamics of industries and the type of competition and external environment for each
industry. Therefore, we stated the hypothesis (H1) as:
H1: There is a significant difference among the distribution of strategic types
within a given industry and overall in an economy.
To test that the strategic types are distributed in equal proportion within an economy and
within an industry, the Chi-square test is applied (Table 5.15).
Overall, the difference among the proportionate distribution of strategic types in economy
is statistically significant (χ2=266.71, p-value<0.0001). The results for difference within
industries indicate that there are insignificant differences in eight out of twelve industries
while there is statistically significant difference in four industries. The significant
difference in overall economy may be due to the difference exists in the two major
industries i.e. textile and food industries constituting 51% of the total firms. Therefore,
our first hypothesis is accepted for overall results along with four industries (“textile,
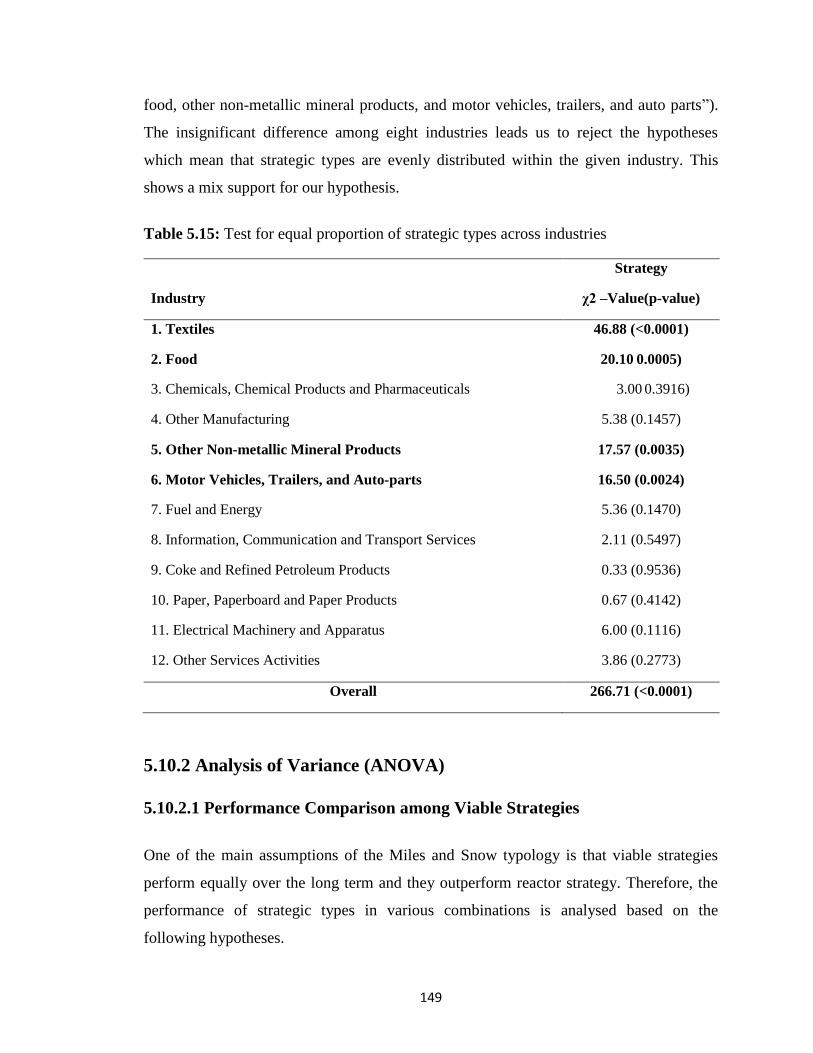
149
food, other non-metallic mineral products, and motor vehicles, trailers, and auto parts”).
The insignificant difference among eight industries leads us to reject the hypotheses
which mean that strategic types are evenly distributed within the given industry. This
shows a mix support for our hypothesis.
Table 5.15: Test for equal proportion of strategic types across industries
Industry
Strategy
χ2 –Value(p-value)
1. Textiles 46.88 (<0.0001)
2. Food 20.10 0.0005)
3. Chemicals, Chemical Products and Pharmaceuticals 3.00 0.3916)
4. Other Manufacturing 5.38 (0.1457)
5. Other Non-metallic Mineral Products 17.57 (0.0035)
6. Motor Vehicles, Trailers, and Auto-parts 16.50 (0.0024)
7. Fuel and Energy 5.36 (0.1470)
8. Information, Communication and Transport Services 2.11 (0.5497)
9. Coke and Refined Petroleum Products 0.33 (0.9536)
10. Paper, Paperboard and Paper Products 0.67 (0.4142)
11. Electrical Machinery and Apparatus 6.00 (0.1116)
12. Other Services Activities 3.86 (0.2773)
Overall 266.71 (<0.0001)
5.10.2 Analysis of Variance (ANOVA)
5.10.2.1 Performance Comparison among Viable Strategies
One of the main assumptions of the Miles and Snow typology is that viable strategies
perform equally over the long term and they outperform reactor strategy. Therefore, the
performance of strategic types in various combinations is analysed based on the
following hypotheses.
150
H2: There is an insignificant difference among the performance of viable
strategies
H2a: Viable strategies outperform reactors strategy
For comparison of performance of pure and hybrid strategies we stated the following
hypothesis
H3: Hybrid strategies are superior to the Pure strategies
To test the significance of differences in performance means among the viable strategies,
we used the one-way ANOVA. The models were run to test the differences in
performance means for all measures among viable strategies keeping prospectors as the
referenced strategy. The summary of the models with F-statistics and parameter estimates
with t-statistics are presented in Table 5.16a to Table 5.16d.
The model fits for ROE and ROCE have insignificant p-value which indicates that the
difference in the performance of viable strategies is insignificant while the model fit for
ROA and ROS are significant at 5% and 1% confidence level respectively indicating that
at least one strategy performs significantly different from others. The parameter estimates
for ROA show that except prospectors, all strategies have positive impact on
performance. The impact of DA-Like is significant at 5% confidence level. Although
statistically insignificant, the impact of analyzers is closer to DA-Like followed by PA-
Like and defenders. The parameter estimates for ROE, ROS, and ROCE also show a
positive impact of all strategies except for prospectors but the influence on performance
is insignificant. To know that which strategy is performing significantly different from
others, we run post hoc Tukey's Honest Significant Difference (HSD) test. The test is run
for ROA and ROS only because the F-statistics showed significant values indicating that
at least one of the strategies is performing differently. The results of pair wise
comparison for ROA show that there is insignificant difference among the performance
of strategies. However, the Adjustment for Multiple Comparisons: Tukey-Kramer through
Least Square Means (LSMEANS) shows significant difference (represented by blue line)
for the PA-Like strategy from other strategies (Figure 5.2).
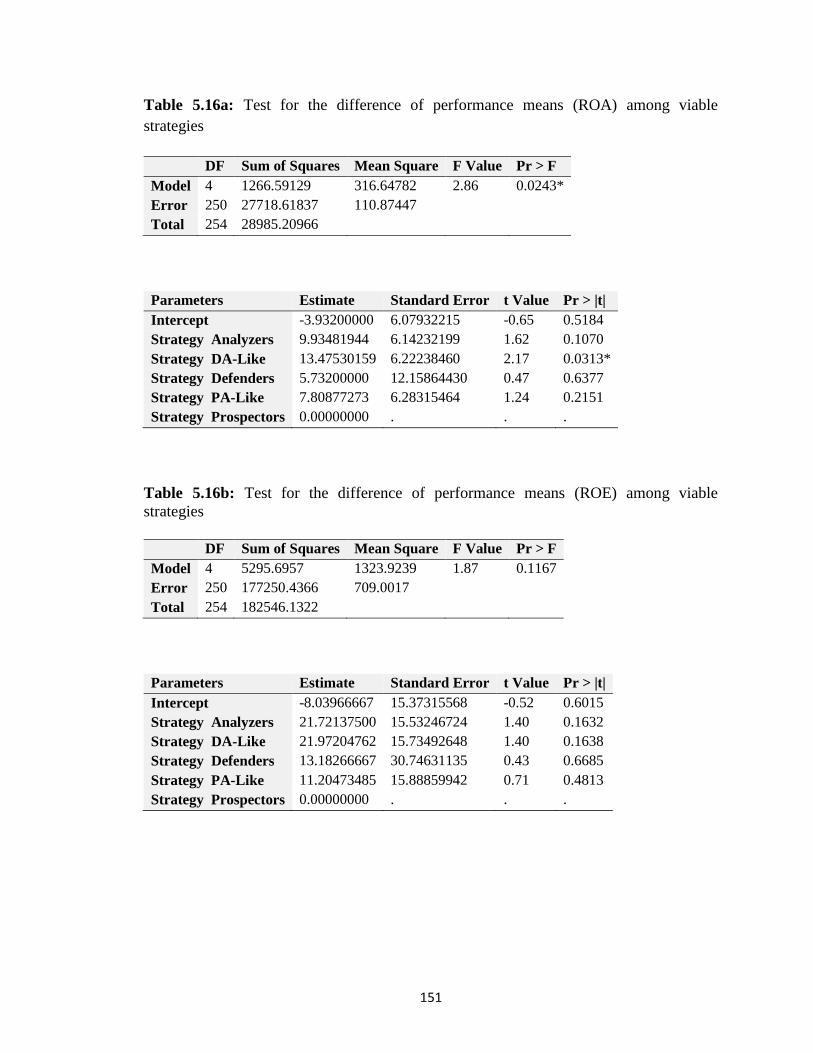
151
Table 5.16a: Test for the difference of performance means (ROA) among viable
strategies
DF Sum of Squares Mean Square F Value Pr > F
Model 4 1266.59129 316.64782 2.86 0.0243*
Error 250 27718.61837 110.87447
Total 254 28985.20966
Parameters Estimate Standard Error t Value Pr > |t|
Intercept -3.93200000 6.07932215 -0.65 0.5184
Strategy Analyzers 9.93481944 6.14232199 1.62 0.1070
Strategy DA-Like 13.47530159 6.22238460 2.17 0.0313*
Strategy Defenders 5.73200000 12.15864430 0.47 0.6377
Strategy PA-Like 7.80877273 6.28315464 1.24 0.2151
Strategy Prospectors 0.00000000 . . .
Table 5.16b: Test for the difference of performance means (ROE) among viable
strategies
DF Sum of Squares Mean Square F Value Pr > F
Model 4 5295.6957 1323.9239 1.87 0.1167
Error 250 177250.4366 709.0017
Total 254 182546.1322
Parameters Estimate Standard Error t Value Pr > |t|
Intercept -8.03966667 15.37315568 -0.52 0.6015
Strategy Analyzers 21.72137500 15.53246724 1.40 0.1632
Strategy DA-Like 21.97204762 15.73492648 1.40 0.1638
Strategy Defenders 13.18266667 30.74631135 0.43 0.6685
Strategy PA-Like 11.20473485 15.88859942 0.71 0.4813
Strategy Prospectors 0.00000000 . . .
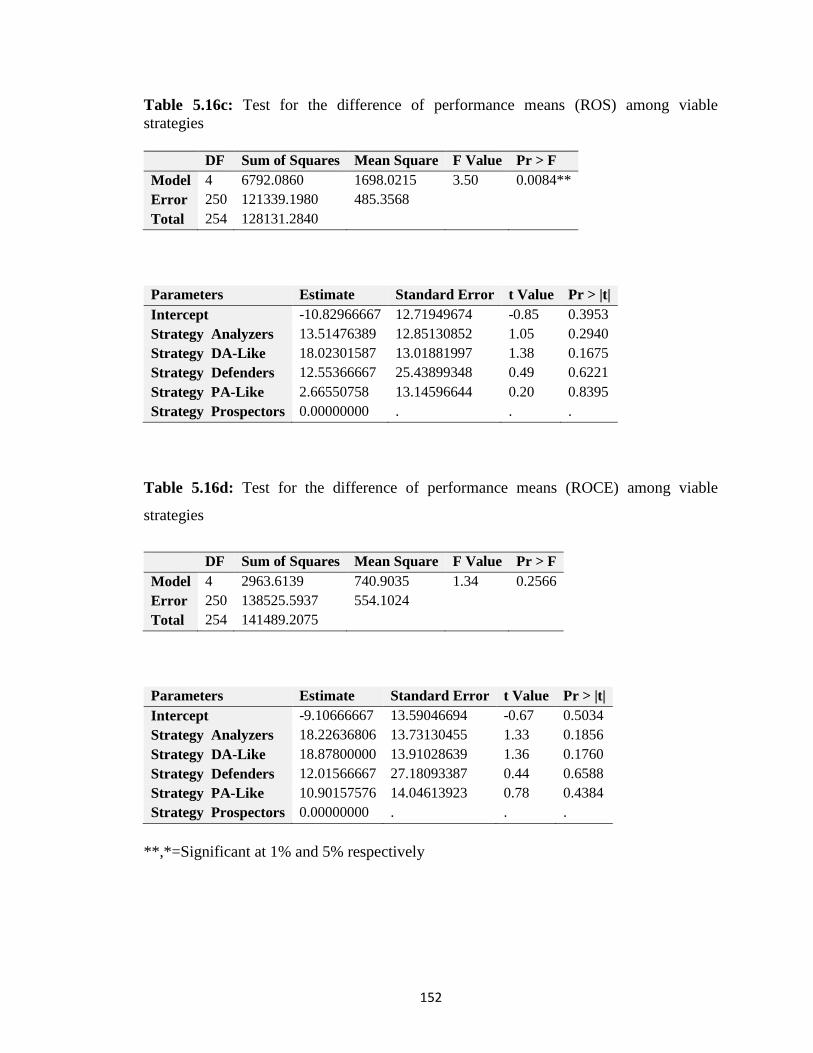
152
Table 5.16c: Test for the difference of performance means (ROS) among viable
strategies
DF Sum of Squares Mean Square F Value Pr > F
Model 4 6792.0860 1698.0215 3.50 0.0084**
Error 250 121339.1980 485.3568
Total 254 128131.2840
Parameters Estimate Standard Error t Value Pr > |t|
Intercept -10.82966667 12.71949674 -0.85 0.3953
Strategy Analyzers 13.51476389 12.85130852 1.05 0.2940
Strategy DA-Like 18.02301587 13.01881997 1.38 0.1675
Strategy Defenders 12.55366667 25.43899348 0.49 0.6221
Strategy PA-Like 2.66550758 13.14596644 0.20 0.8395
Strategy Prospectors 0.00000000 . . .
Table 5.16d: Test for the difference of performance means (ROCE) among viable
strategies
DF Sum of Squares Mean Square F Value Pr > F
Model 4 2963.6139 740.9035 1.34 0.2566
Error 250 138525.5937 554.1024
Total 254 141489.2075
Parameters Estimate Standard Error t Value Pr > |t|
Intercept -9.10666667 13.59046694 -0.67 0.5034
Strategy Analyzers 18.22636806 13.73130455 1.33 0.1856
Strategy DA-Like 18.87800000 13.91028639 1.36 0.1760
Strategy Defenders 12.01566667 27.18093387 0.44 0.6588
Strategy PA-Like 10.90157576 14.04613923 0.78 0.4384
Strategy Prospectors 0.00000000 . . .
**,*=Significant at 1% and 5% respectively
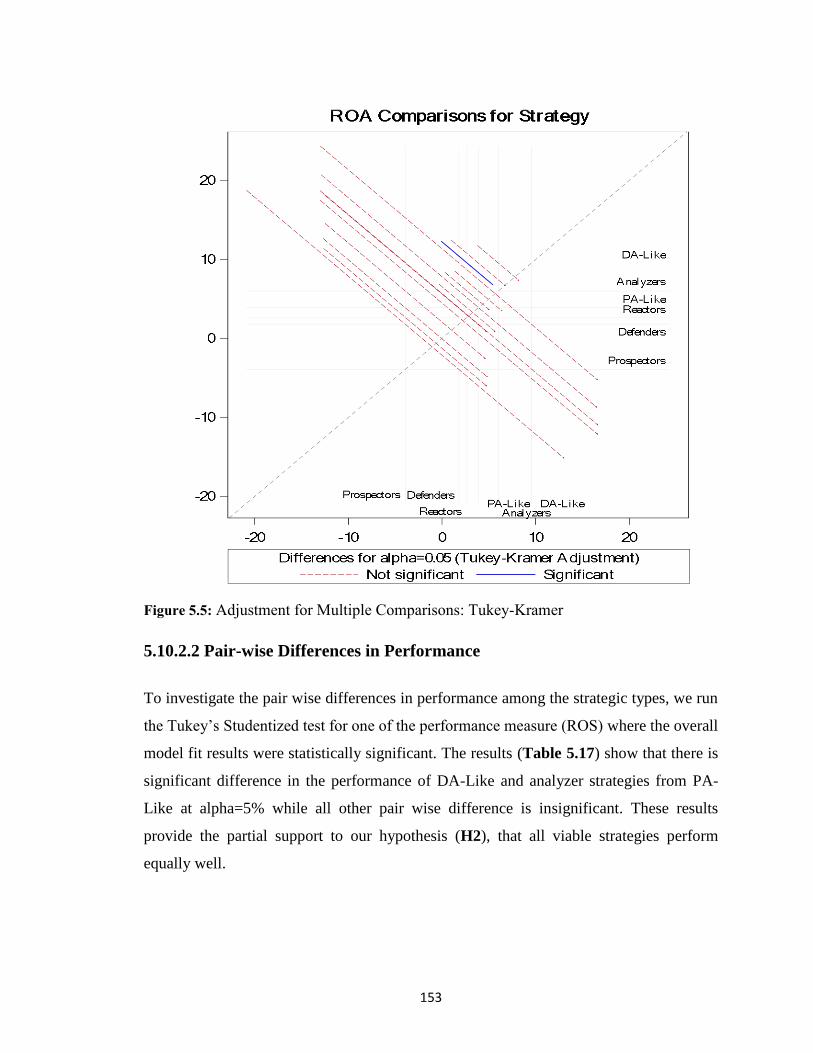
153
Figure 5.5: Adjustment for Multiple Comparisons: Tukey-Kramer
5.10.2.2 Pair-wise Differences in Performance
To investigate the pair wise differences in performance among the strategic types, we run
the Tukey’s Studentized test for one of the performance measure (ROS) where the overall
model fit results were statistically significant. The results (Table 5.17) show that there is
significant difference in the performance of DA-Like and analyzer strategies from PA-
Like at alpha=5% while all other pair wise difference is insignificant. These results
provide the partial support to our hypothesis (H2), that all viable strategies perform
equally well.
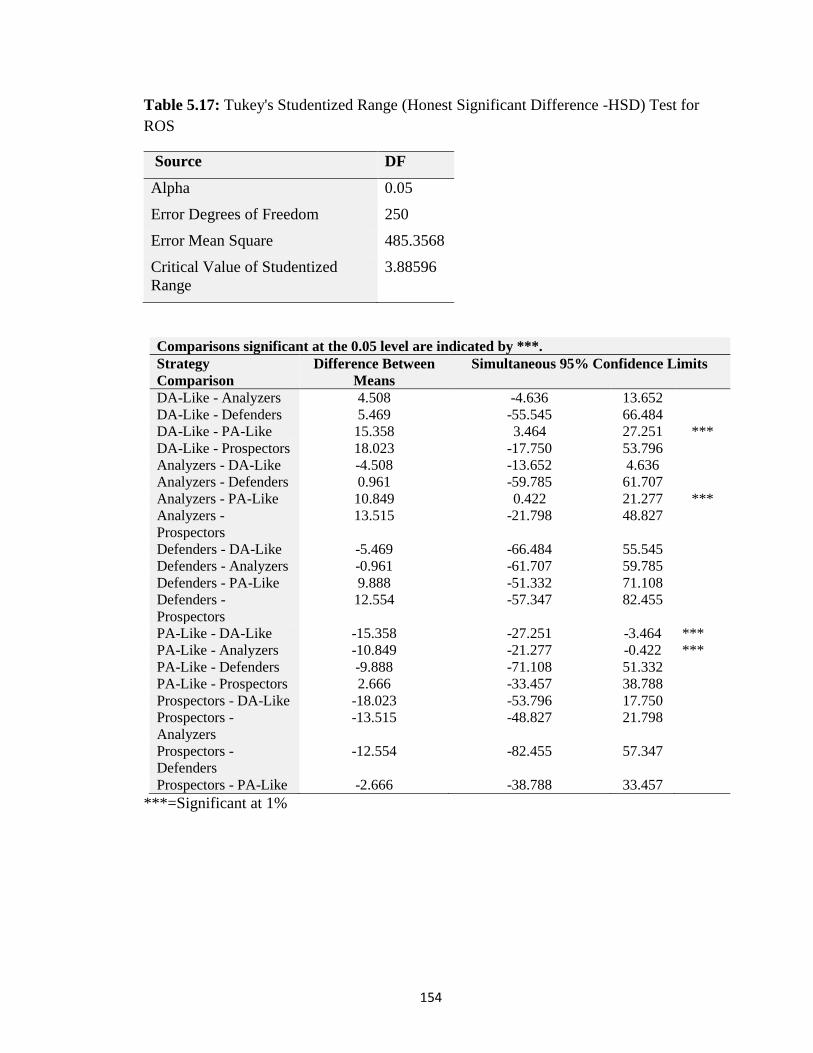
154
Table 5.17: Tukey's Studentized Range (Honest Significant Difference -HSD) Test for
ROS
Source DF
Alpha 0.05
Error Degrees of Freedom 250
Error Mean Square 485.3568
Critical Value of Studentized
Range
3.88596
Comparisons significant at the 0.05 level are indicated by ***.
Strategy
Comparison
Difference Between
Means
Simultaneous 95% Confidence Limits
DA-Like - Analyzers 4.508 -4.636 13.652
DA-Like - Defenders 5.469 -55.545 66.484
DA-Like - PA-Like 15.358 3.464 27.251 ***
DA-Like - Prospectors 18.023 -17.750 53.796
Analyzers - DA-Like -4.508 -13.652 4.636
Analyzers - Defenders 0.961 -59.785 61.707
Analyzers - PA-Like 10.849 0.422 21.277 ***
Analyzers -
Prospectors
13.515 -21.798 48.827
Defenders - DA-Like -5.469 -66.484 55.545
Defenders - Analyzers -0.961 -61.707 59.785
Defenders - PA-Like 9.888 -51.332 71.108
Defenders -
Prospectors
12.554 -57.347 82.455
PA-Like - DA-Like -15.358 -27.251 -3.464 ***
PA-Like - Analyzers -10.849 -21.277 -0.422 ***
PA-Like - Defenders -9.888 -71.108 51.332
PA-Like - Prospectors 2.666 -33.457 38.788
Prospectors - DA-Like -18.023 -53.796 17.750
Prospectors -
Analyzers
-13.515 -48.827 21.798
Prospectors -
Defenders
-12.554 -82.455 57.347
Prospectors - PA-Like -2.666 -38.788 33.457
***=Significant at 1%
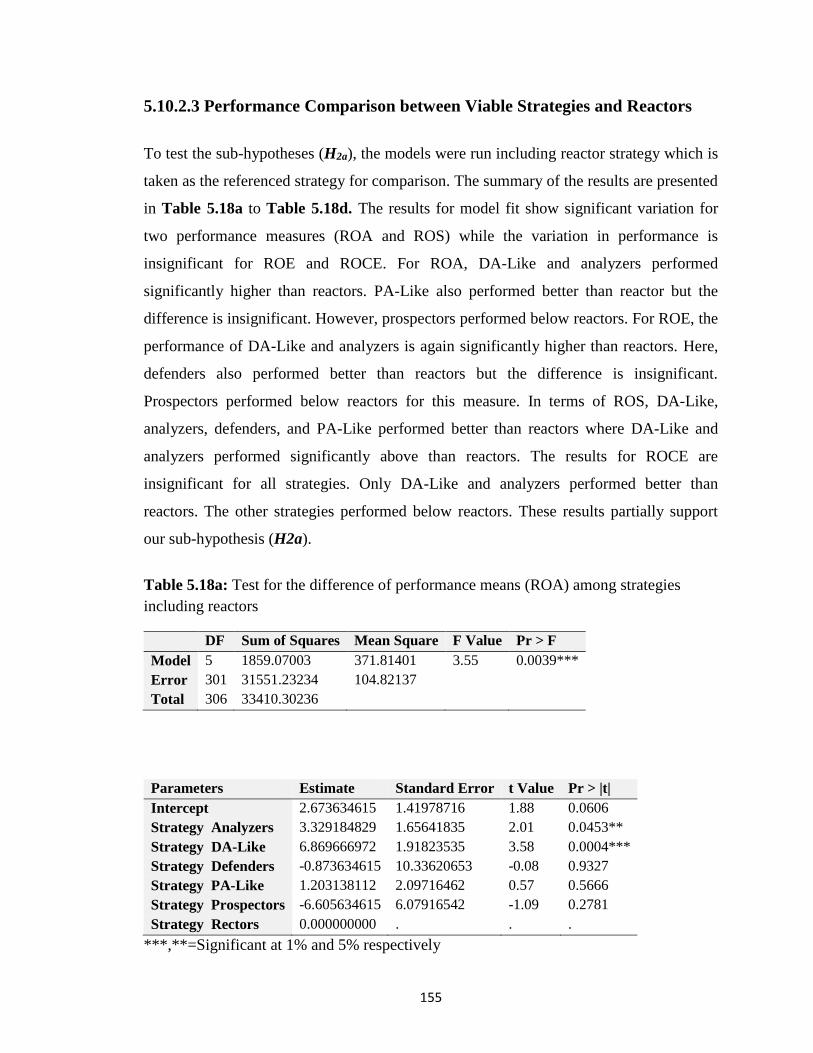
155
5.10.2.3 Performance Comparison between Viable Strategies and Reactors
To test the sub-hypotheses (H2a), the models were run including reactor strategy which is
taken as the referenced strategy for comparison. The summary of the results are presented
in Table 5.18a to Table 5.18d. The results for model fit show significant variation for
two performance measures (ROA and ROS) while the variation in performance is
insignificant for ROE and ROCE. For ROA, DA-Like and analyzers performed
significantly higher than reactors. PA-Like also performed better than reactor but the
difference is insignificant. However, prospectors performed below reactors. For ROE, the
performance of DA-Like and analyzers is again significantly higher than reactors. Here,
defenders also performed better than reactors but the difference is insignificant.
Prospectors performed below reactors for this measure. In terms of ROS, DA-Like,
analyzers, defenders, and PA-Like performed better than reactors where DA-Like and
analyzers performed significantly above than reactors. The results for ROCE are
insignificant for all strategies. Only DA-Like and analyzers performed better than
reactors. The other strategies performed below reactors. These results partially support
our sub-hypothesis (H2a).
Table 5.18a: Test for the difference of performance means (ROA) among strategies
including reactors
DF Sum of Squares Mean Square F Value Pr > F
Model 5 1859.07003 371.81401 3.55 0.0039***
Error 301 31551.23234 104.82137
Total 306 33410.30236
Parameters Estimate Standard Error t Value Pr > |t|
Intercept 2.673634615 1.41978716 1.88 0.0606
Strategy Analyzers 3.329184829 1.65641835 2.01 0.0453**
Strategy DA-Like 6.869666972 1.91823535 3.58 0.0004***
Strategy Defenders -0.873634615 10.33620653 -0.08 0.9327
Strategy PA-Like 1.203138112 2.09716462 0.57 0.5666
Strategy Prospectors -6.605634615 6.07916542 -1.09 0.2781
Strategy Rectors 0.000000000 . . .
***,**=Significant at 1% and 5% respectively
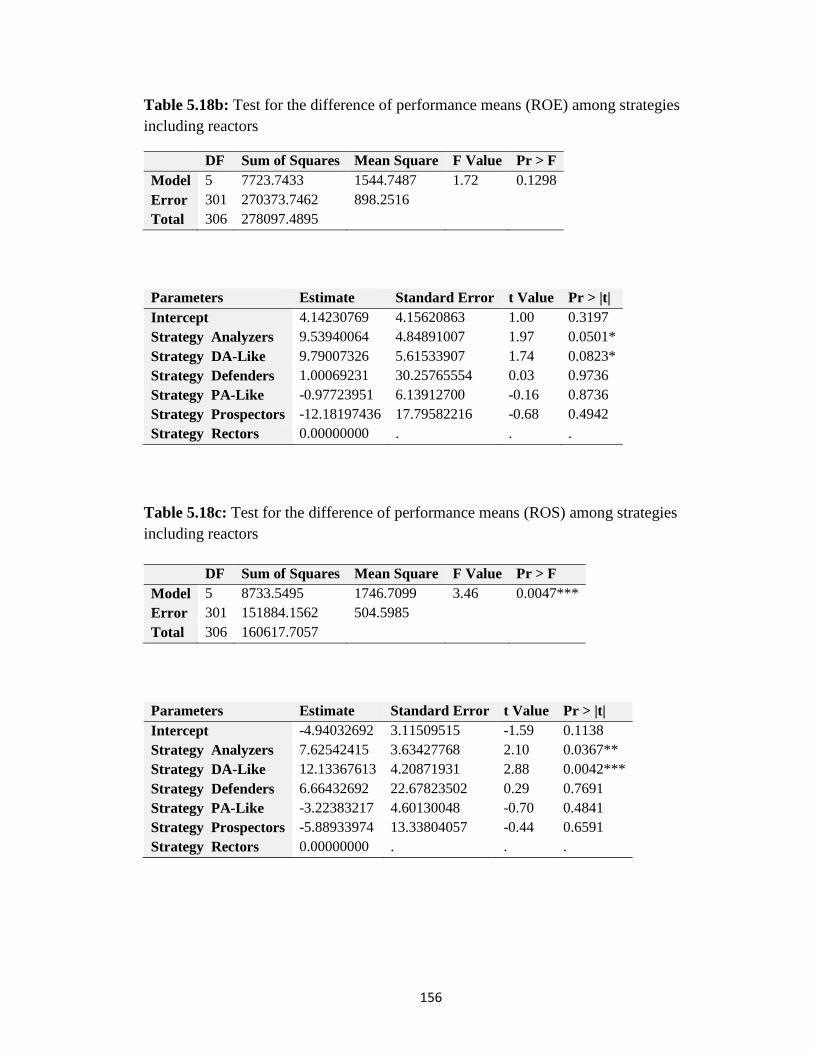
156
Table 5.18b: Test for the difference of performance means (ROE) among strategies
including reactors
DF Sum of Squares Mean Square F Value Pr > F
Model 5 7723.7433 1544.7487 1.72 0.1298
Error 301 270373.7462 898.2516
Total 306 278097.4895
Parameters Estimate Standard Error t Value Pr > |t|
Intercept 4.14230769 4.15620863 1.00 0.3197
Strategy Analyzers 9.53940064 4.84891007 1.97 0.0501*
Strategy DA-Like 9.79007326 5.61533907 1.74 0.0823*
Strategy Defenders 1.00069231 30.25765554 0.03 0.9736
Strategy PA-Like -0.97723951 6.13912700 -0.16 0.8736
Strategy Prospectors -12.18197436 17.79582216 -0.68 0.4942
Strategy Rectors 0.00000000 . . .
Table 5.18c: Test for the difference of performance means (ROS) among strategies
including reactors
DF Sum of Squares Mean Square F Value Pr > F
Model 5 8733.5495 1746.7099 3.46 0.0047***
Error 301 151884.1562 504.5985
Total 306 160617.7057
Parameters Estimate Standard Error t Value Pr > |t|
Intercept -4.94032692 3.11509515 -1.59 0.1138
Strategy Analyzers 7.62542415 3.63427768 2.10 0.0367**
Strategy DA-Like 12.13367613 4.20871931 2.88 0.0042***
Strategy Defenders 6.66432692 22.67823502 0.29 0.7691
Strategy PA-Like -3.22383217 4.60130048 -0.70 0.4841
Strategy Prospectors -5.88933974 13.33804057 -0.44 0.6591
Strategy Rectors 0.00000000 . . .
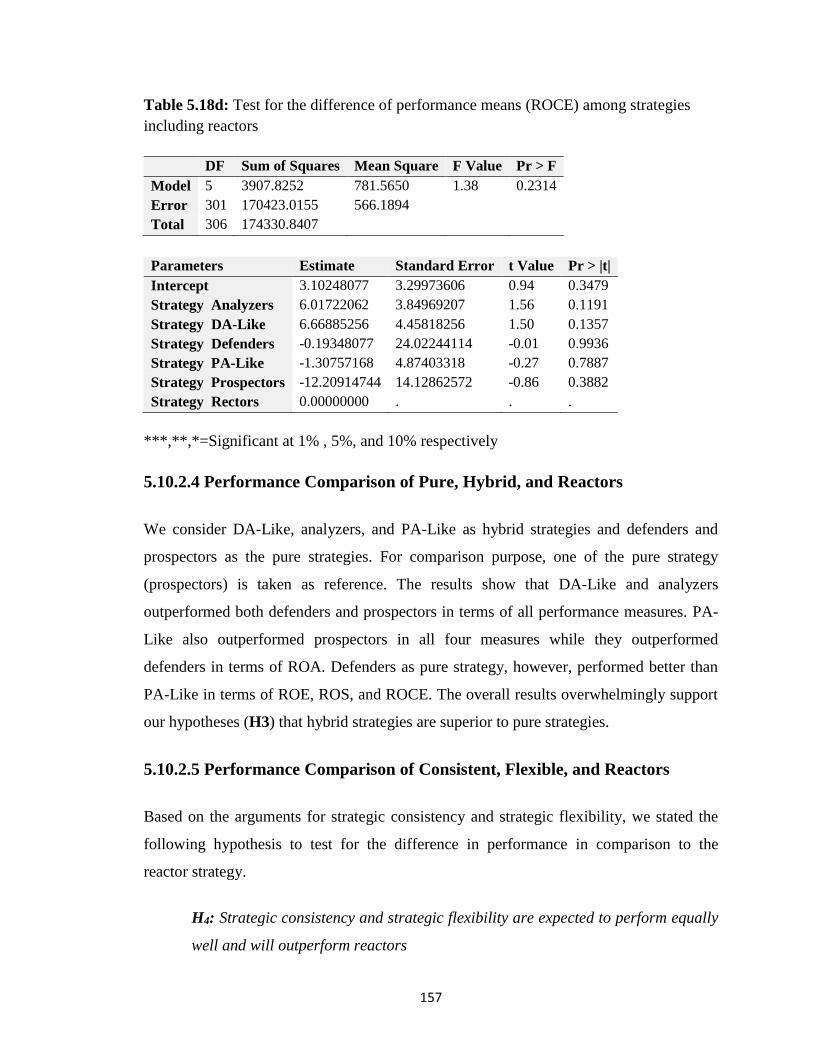
157
Table 5.18d: Test for the difference of performance means (ROCE) among strategies
including reactors
DF Sum of Squares Mean Square F Value Pr > F
Model 5 3907.8252 781.5650 1.38 0.2314
Error 301 170423.0155 566.1894
Total 306 174330.8407
Parameters Estimate Standard Error t Value Pr > |t|
Intercept 3.10248077 3.29973606 0.94 0.3479
Strategy Analyzers 6.01722062 3.84969207 1.56 0.1191
Strategy DA-Like 6.66885256 4.45818256 1.50 0.1357
Strategy Defenders -0.19348077 24.02244114 -0.01 0.9936
Strategy PA-Like -1.30757168 4.87403318 -0.27 0.7887
Strategy Prospectors -12.20914744 14.12862572 -0.86 0.3882
Strategy Rectors 0.00000000 . . .
***,**,*=Significant at 1% , 5%, and 10% respectively
5.10.2.4 Performance Comparison of Pure, Hybrid, and Reactors
We consider DA-Like, analyzers, and PA-Like as hybrid strategies and defenders and
prospectors as the pure strategies. For comparison purpose, one of the pure strategy
(prospectors) is taken as reference. The results show that DA-Like and analyzers
outperformed both defenders and prospectors in terms of all performance measures. PA-
Like also outperformed prospectors in all four measures while they outperformed
defenders in terms of ROA. Defenders as pure strategy, however, performed better than
PA-Like in terms of ROE, ROS, and ROCE. The overall results overwhelmingly support
our hypotheses (H3) that hybrid strategies are superior to pure strategies.
5.10.2.5 Performance Comparison of Consistent, Flexible, and Reactors
Based on the arguments for strategic consistency and strategic flexibility, we stated the
following hypothesis to test for the difference in performance in comparison to the
reactor strategy.
H4: Strategic consistency and strategic flexibility are expected to perform equally
well and will outperform reactors
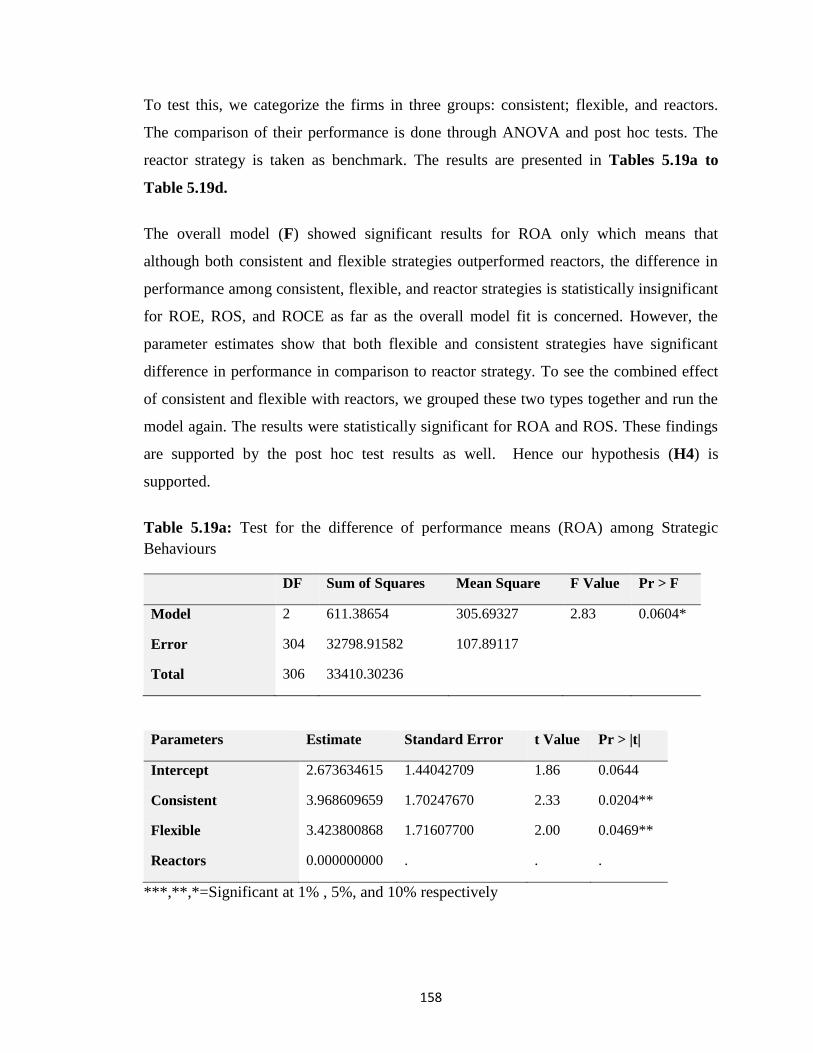
158
To test this, we categorize the firms in three groups: consistent; flexible, and reactors.
The comparison of their performance is done through ANOVA and post hoc tests. The
reactor strategy is taken as benchmark. The results are presented in Tables 5.19a to
Table 5.19d.
The overall model (F) showed significant results for ROA only which means that
although both consistent and flexible strategies outperformed reactors, the difference in
performance among consistent, flexible, and reactor strategies is statistically insignificant
for ROE, ROS, and ROCE as far as the overall model fit is concerned. However, the
parameter estimates show that both flexible and consistent strategies have significant
difference in performance in comparison to reactor strategy. To see the combined effect
of consistent and flexible with reactors, we grouped these two types together and run the
model again. The results were statistically significant for ROA and ROS. These findings
are supported by the post hoc test results as well. Hence our hypothesis (H4) is
supported.
Table 5.19a: Test for the difference of performance means (ROA) among Strategic
Behaviours
DF Sum of Squares Mean Square F Value Pr > F
Model 2 611.38654 305.69327 2.83 0.0604*
Error 304 32798.91582 107.89117
Total 306 33410.30236
Parameters Estimate Standard Error t Value Pr > |t|
Intercept 2.673634615 1.44042709 1.86 0.0644
Consistent 3.968609659 1.70247670 2.33 0.0204**
Flexible 3.423800868 1.71607700 2.00 0.0469**
Reactors 0.000000000 . . .
***,**,*=Significant at 1% , 5%, and 10% respectively
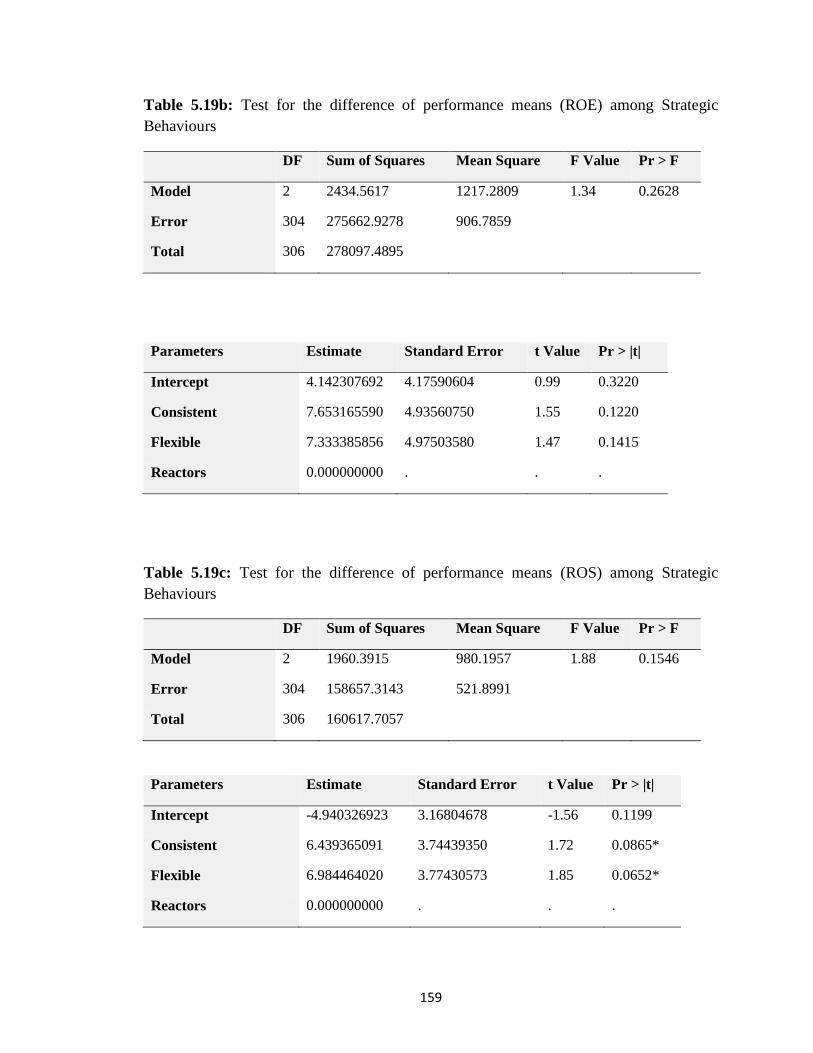
159
Table 5.19b: Test for the difference of performance means (ROE) among Strategic
Behaviours
DF Sum of Squares Mean Square F Value Pr > F
Model 2 2434.5617 1217.2809 1.34 0.2628
Error 304 275662.9278 906.7859
Total 306 278097.4895
Parameters Estimate Standard Error t Value Pr > |t|
Intercept 4.142307692 4.17590604 0.99 0.3220
Consistent 7.653165590 4.93560750 1.55 0.1220
Flexible 7.333385856 4.97503580 1.47 0.1415
Reactors 0.000000000 . . .
Table 5.19c: Test for the difference of performance means (ROS) among Strategic
Behaviours
DF Sum of Squares Mean Square F Value Pr > F
Model 2 1960.3915 980.1957 1.88 0.1546
Error 304 158657.3143 521.8991
Total 306 160617.7057
Parameters Estimate Standard Error t Value Pr > |t|
Intercept -4.940326923 3.16804678 -1.56 0.1199
Consistent 6.439365091 3.74439350 1.72 0.0865*
Flexible 6.984464020 3.77430573 1.85 0.0652*
Reactors 0.000000000 . . .
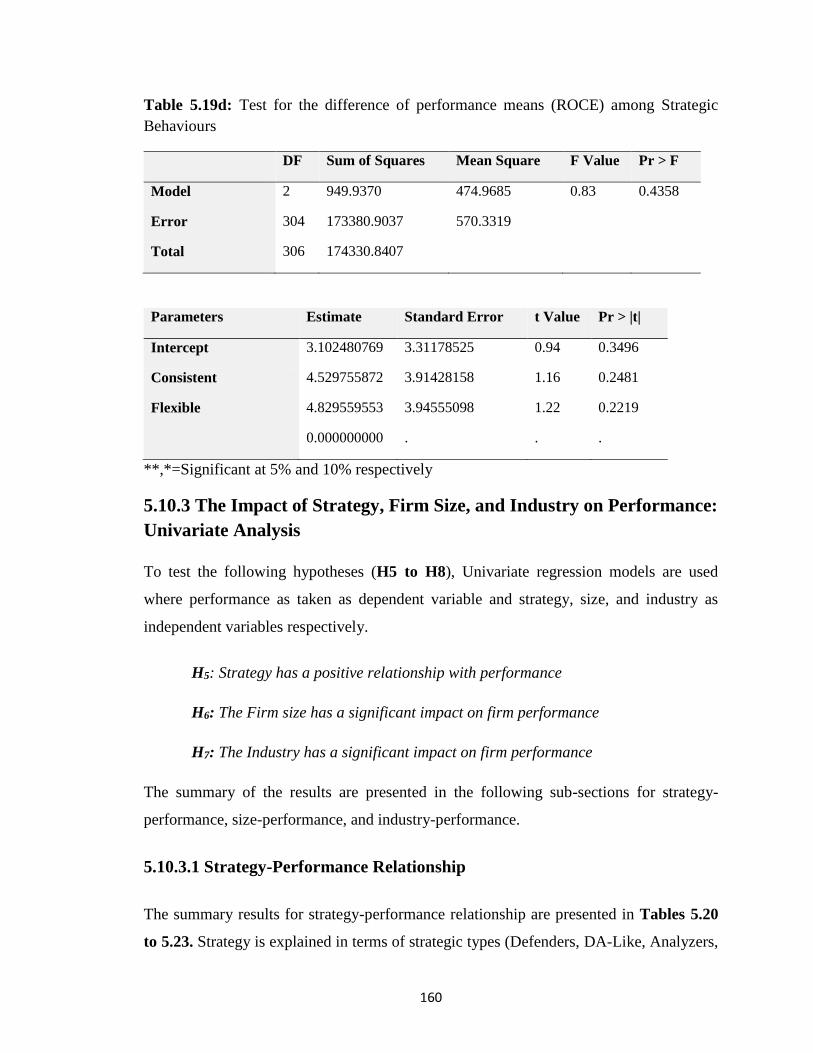
160
Table 5.19d: Test for the difference of performance means (ROCE) among Strategic
Behaviours
DF Sum of Squares Mean Square F Value Pr > F
Model 2 949.9370 474.9685 0.83 0.4358
Error 304 173380.9037 570.3319
Total 306 174330.8407
Parameters Estimate Standard Error t Value Pr > |t|
Intercept 3.102480769 3.31178525 0.94 0.3496
Consistent 4.529755872 3.91428158 1.16 0.2481
Flexible 4.829559553 3.94555098 1.22 0.2219
0.000000000 . . .
**,*=Significant at 5% and 10% respectively
5.10.3 The Impact of Strategy, Firm Size, and Industry on Performance:
Univariate Analysis
To test the following hypotheses (H5 to H8), Univariate regression models are used
where performance as taken as dependent variable and strategy, size, and industry as
independent variables respectively.
H5: Strategy has a positive relationship with performance
H6: The Firm size has a significant impact on firm performance
H7: The Industry has a significant impact on firm performance
The summary of the results are presented in the following sub-sections for strategy-
performance, size-performance, and industry-performance.
5.10.3.1 Strategy-Performance Relationship
The summary results for strategy-performance relationship are presented in Tables 5.20
to 5.23. Strategy is explained in terms of strategic types (Defenders, DA-Like, Analyzers,
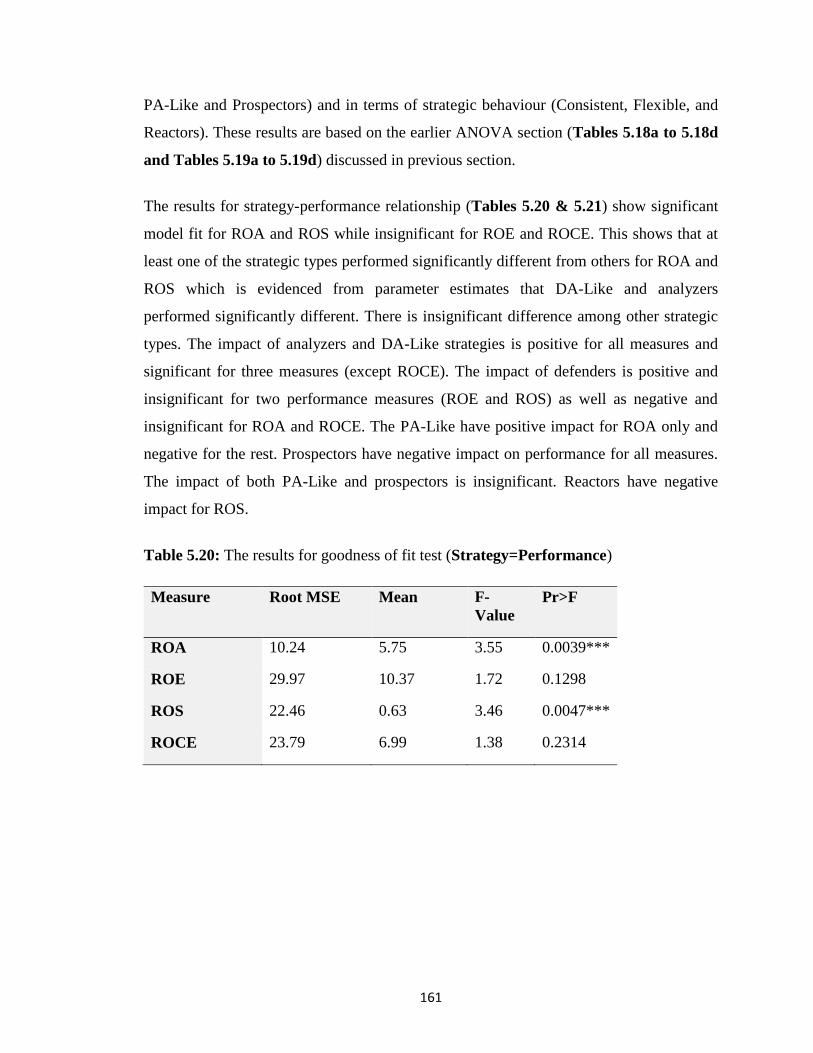
161
PA-Like and Prospectors) and in terms of strategic behaviour (Consistent, Flexible, and
Reactors). These results are based on the earlier ANOVA section (Tables 5.18a to 5.18d
and Tables 5.19a to 5.19d) discussed in previous section.
The results for strategy-performance relationship (Tables 5.20 & 5.21) show significant
model fit for ROA and ROS while insignificant for ROE and ROCE. This shows that at
least one of the strategic types performed significantly different from others for ROA and
ROS which is evidenced from parameter estimates that DA-Like and analyzers
performed significantly different. There is insignificant difference among other strategic
types. The impact of analyzers and DA-Like strategies is positive for all measures and
significant for three measures (except ROCE). The impact of defenders is positive and
insignificant for two performance measures (ROE and ROS) as well as negative and
insignificant for ROA and ROCE. The PA-Like have positive impact for ROA only and
negative for the rest. Prospectors have negative impact on performance for all measures.
The impact of both PA-Like and prospectors is insignificant. Reactors have negative
impact for ROS.
Table 5.20: The results for goodness of fit test (Strategy=Performance)
Measure Root MSE Mean F-
Value
Pr>F
ROA 10.24 5.75 3.55 0.0039***
ROE 29.97 10.37 1.72 0.1298
ROS 22.46 0.63 3.46 0.0047***
ROCE 23.79 6.99 1.38 0.2314
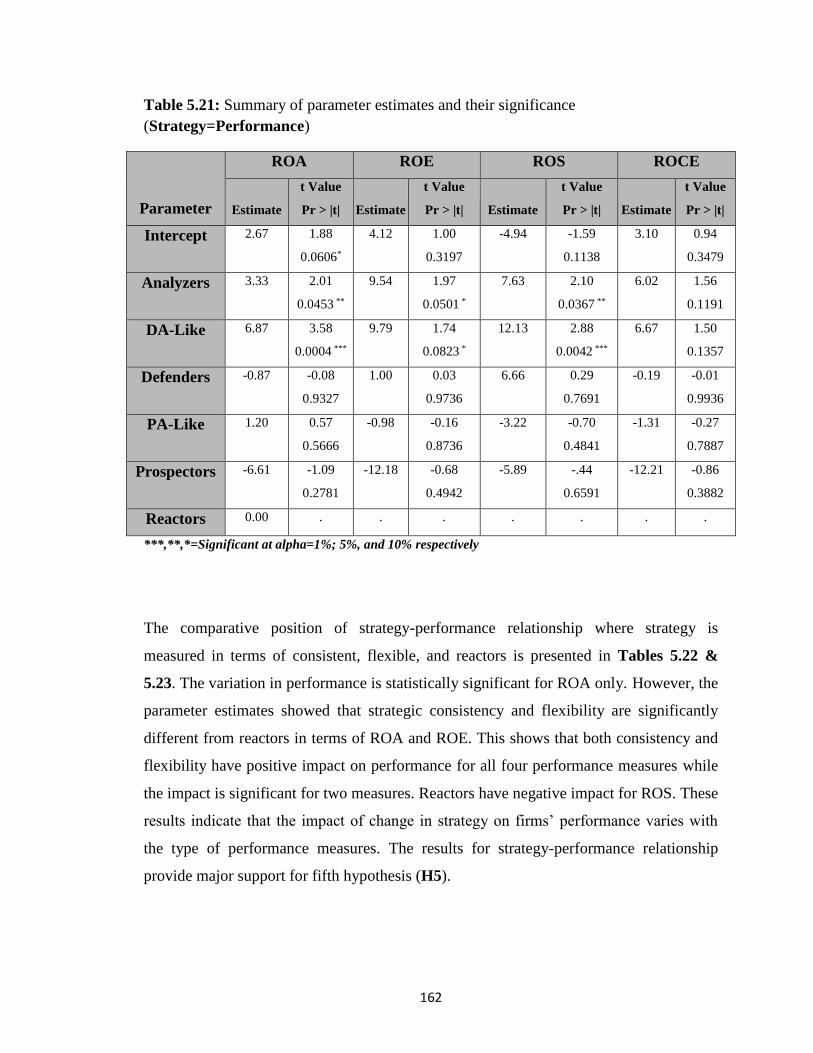
162
Table 5.21: Summary of parameter estimates and their significance
(Strategy=Performance)
Parameter
ROA ROE ROS ROCE
Estimate
t Value
Pr > |t| Estimate
t Value
Pr > |t| Estimate
t Value
Pr > |t| Estimate
t Value
Pr > |t|
Intercept 2.67 1.88
0.0606*
4.12 1.00
0.3197
-4.94 -1.59
0.1138
3.10 0.94
0.3479
Analyzers 3.33 2.01
0.0453 **
9.54 1.97
0.0501 *
7.63 2.10
0.0367 **
6.02 1.56
0.1191
DA-Like 6.87 3.58
0.0004 ***
9.79 1.74
0.0823 *
12.13 2.88
0.0042 ***
6.67 1.50
0.1357
Defenders -0.87 -0.08
0.9327
1.00 0.03
0.9736
6.66 0.29
0.7691
-0.19 -0.01
0.9936
PA-Like 1.20 0.57
0.5666
-0.98 -0.16
0.8736
-3.22 -0.70
0.4841
-1.31 -0.27
0.7887
Prospectors -6.61 -1.09
0.2781
-12.18 -0.68
0.4942
-5.89 -.44
0.6591
-12.21 -0.86
0.3882
Reactors 0.00 . . . . . . .
***,**,*=Significant at alpha=1%; 5%, and 10% respectively
The comparative position of strategy-performance relationship where strategy is
measured in terms of consistent, flexible, and reactors is presented in Tables 5.22 &
5.23. The variation in performance is statistically significant for ROA only. However, the
parameter estimates showed that strategic consistency and flexibility are significantly
different from reactors in terms of ROA and ROE. This shows that both consistency and
flexibility have positive impact on performance for all four performance measures while
the impact is significant for two measures. Reactors have negative impact for ROS. These
results indicate that the impact of change in strategy on firms’ performance varies with
the type of performance measures. The results for strategy-performance relationship
provide major support for fifth hypothesis (H5).
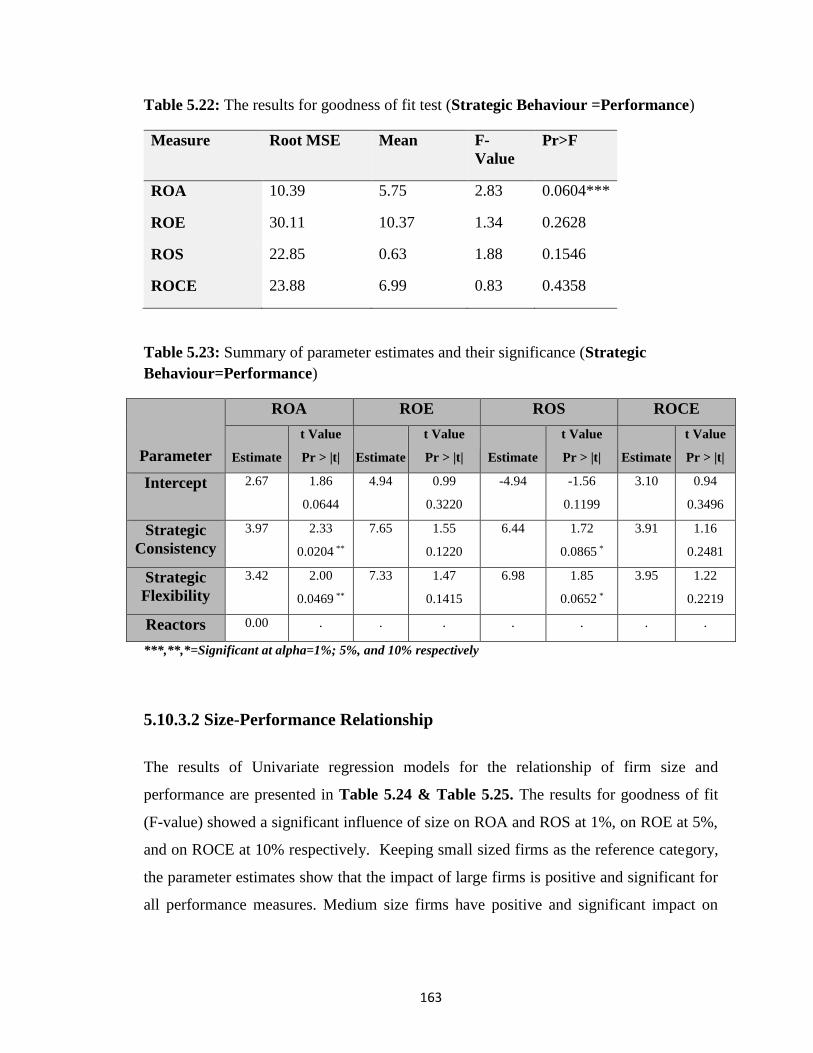
163
Table 5.22: The results for goodness of fit test (Strategic Behaviour =Performance)
Measure Root MSE Mean F-
Value
Pr>F
ROA 10.39 5.75 2.83 0.0604***
ROE 30.11 10.37 1.34 0.2628
ROS 22.85 0.63 1.88 0.1546
ROCE 23.88 6.99 0.83 0.4358
Table 5.23: Summary of parameter estimates and their significance (Strategic
Behaviour=Performance)
Parameter
ROA ROE ROS ROCE
Estimate
t Value
Pr > |t| Estimate
t Value
Pr > |t| Estimate
t Value
Pr > |t| Estimate
t Value
Pr > |t|
Intercept 2.67 1.86
0.0644
4.94 0.99
0.3220
-4.94 -1.56
0.1199
3.10 0.94
0.3496
Strategic
Consistency
3.97 2.33
0.0204 **
7.65 1.55
0.1220
6.44 1.72
0.0865 *
3.91 1.16
0.2481
Strategic
Flexibility
3.42 2.00
0.0469 **
7.33 1.47
0.1415
6.98 1.85
0.0652 *
3.95 1.22
0.2219
Reactors 0.00 . . . . . . .
***,**,*=Significant at alpha=1%; 5%, and 10% respectively
5.10.3.2 Size-Performance Relationship
The results of Univariate regression models for the relationship of firm size and
performance are presented in Table 5.24 & Table 5.25. The results for goodness of fit
(F-value) showed a significant influence of size on ROA and ROS at 1%, on ROE at 5%,
and on ROCE at 10% respectively. Keeping small sized firms as the reference category,
the parameter estimates show that the impact of large firms is positive and significant for
all performance measures. Medium size firms have positive and significant impact on
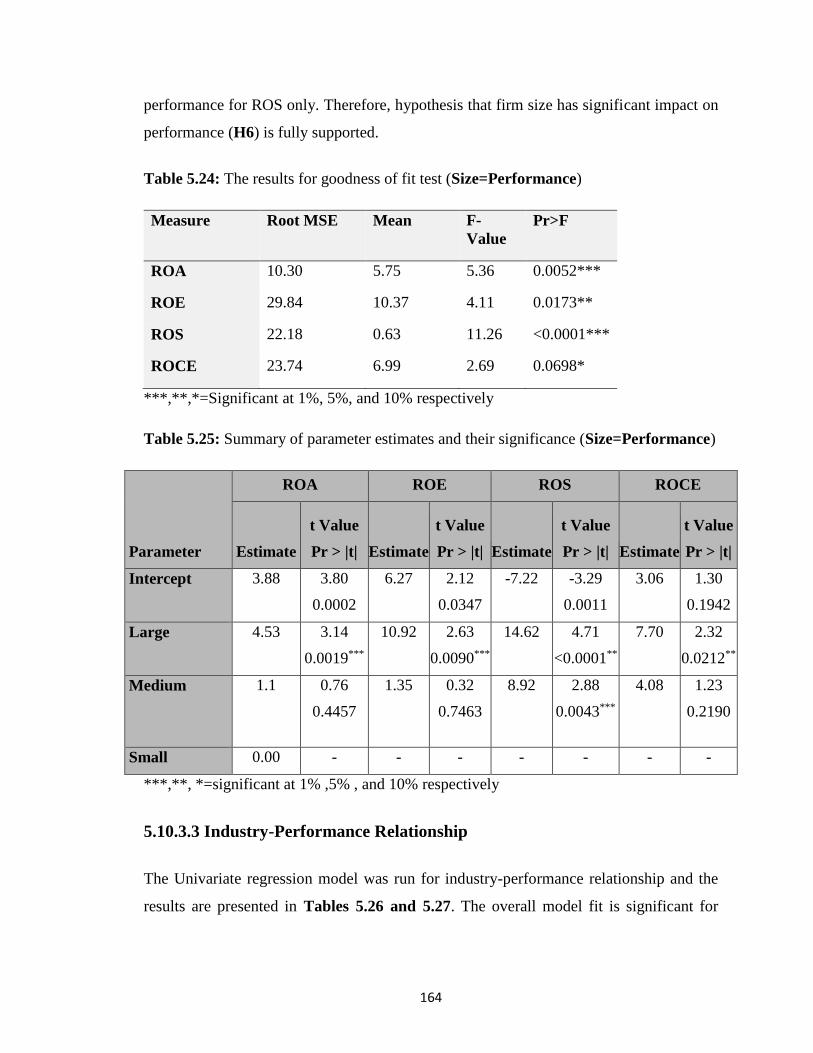
164
performance for ROS only. Therefore, hypothesis that firm size has significant impact on
performance (H6) is fully supported.
Table 5.24: The results for goodness of fit test (Size=Performance)
Measure Root MSE Mean F-
Value
Pr>F
ROA 10.30 5.75 5.36 0.0052***
ROE 29.84 10.37 4.11 0.0173**
ROS 22.18 0.63 11.26 <0.0001***
ROCE 23.74 6.99 2.69 0.0698*
***,**,*=Significant at 1%, 5%, and 10% respectively
Table 5.25: Summary of parameter estimates and their significance (Size=Performance)
Parameter
ROA ROE ROS ROCE
Estimate
t Value
Pr > |t| Estimate
t Value
Pr > |t| Estimate
t Value
Pr > |t| Estimate
t Value
Pr > |t|
Intercept 3.88 3.80
0.0002
6.27 2.12
0.0347
-7.22
-3.29
0.0011
3.06
1.30
0.1942
Large 4.53 3.14
0.0019***
10.92 2.63
0.0090***
14.62 4.71
<0.0001**
7.70 2.32
0.0212**
Medium 1.1
0.76
0.4457
1.35 0.32
0.7463
8.92 2.88
0.0043***
4.08 1.23
0.2190
Small 0.00 - - - - - - -
***,**, *=significant at 1% ,5% , and 10% respectively
5.10.3.3 Industry-Performance Relationship
The Univariate regression model was run for industry-performance relationship and the
results are presented in Tables 5.26 and 5.27. The overall model fit is significant for
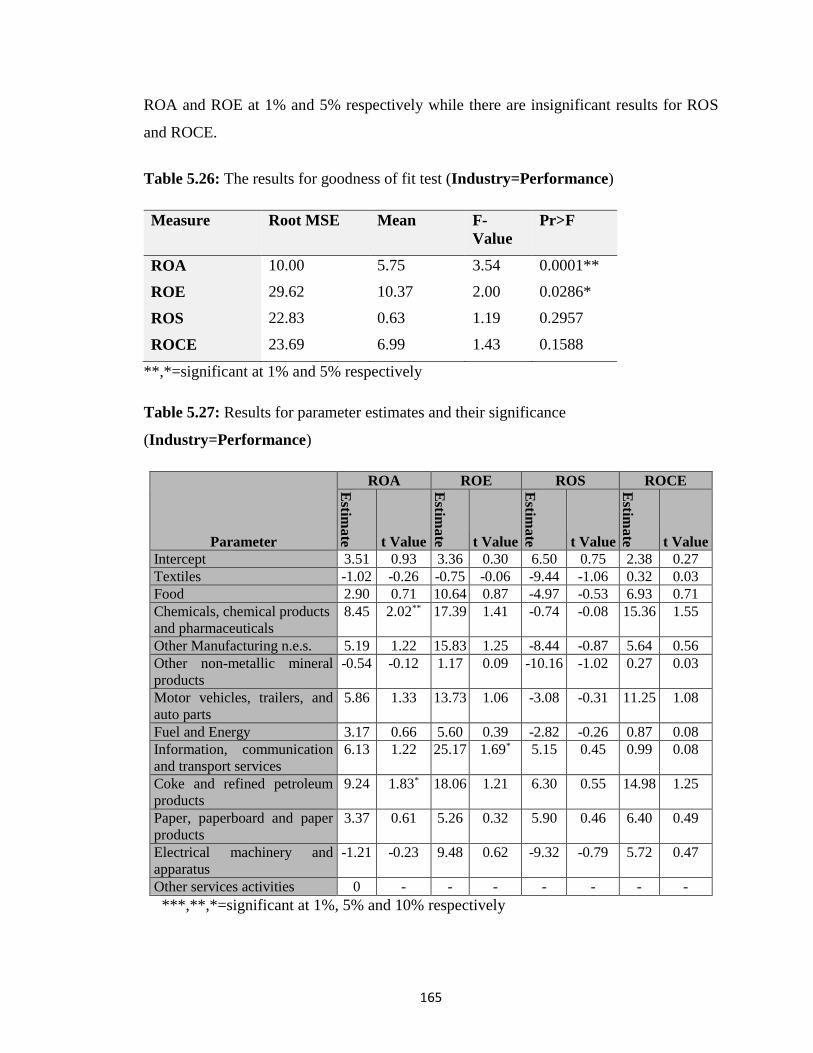
165
ROA and ROE at 1% and 5% respectively while there are insignificant results for ROS
and ROCE.
Table 5.26: The results for goodness of fit test (Industry=Performance)
Measure Root MSE Mean F-
Value
Pr>F
ROA 10.00 5.75 3.54 0.0001**
ROE 29.62 10.37 2.00 0.0286*
ROS 22.83 0.63 1.19 0.2957
ROCE 23.69 6.99 1.43 0.1588
**,*=significant at 1% and 5% respectively
Table 5.27: Results for parameter estimates and their significance
(Industry=Performance)
Parameter
ROA ROE ROS ROCE Estim
ate t Value
Estim
ate t Value
Estim
ate t Value
Estim
ate t Value
Intercept 3.51 0.93 3.36 0.30 6.50 0.75 2.38 0.27
Textiles -1.02 -0.26 -0.75 -0.06 -9.44 -1.06 0.32 0.03
Food 2.90 0.71 10.64 0.87 -4.97 -0.53 6.93 0.71
Chemicals, chemical products
and pharmaceuticals
8.45 2.02** 17.39 1.41 -0.74 -0.08 15.36 1.55
Other Manufacturing n.e.s. 5.19 1.22 15.83 1.25 -8.44 -0.87 5.64 0.56
Other non-metallic mineral
products
-0.54 -0.12 1.17 0.09 -10.16 -1.02 0.27 0.03
Motor vehicles, trailers, and
auto parts
5.86 1.33 13.73 1.06 -3.08 -0.31 11.25 1.08
Fuel and Energy 3.17 0.66 5.60 0.39 -2.82 -0.26 0.87 0.08
Information, communication
and transport services
6.13 1.22 25.17 1.69* 5.15 0.45 0.99 0.08
Coke and refined petroleum
products
9.24 1.83* 18.06 1.21 6.30 0.55 14.98 1.25
Paper, paperboard and paper
products
3.37 0.61 5.26 0.32 5.90 0.46 6.40 0.49
Electrical machinery and
apparatus
-1.21 -0.23 9.48 0.62 -9.32 -0.79 5.72 0.47
Other services activities 0 - - - - - - -
***,**,*=significant at 1%, 5% and 10% respectively
166
The parameter estimates show that, within industries, the impact of 10 out of 12
industries is positive for ROA where the impact of “ Chemical, chemical products, and
Pharmaceuticals” and “ Coke and refined petroleum products” is positively significant.
Here, the impact of Textile and Electrical machinery apparatus is negative on
performance. Overall, the impact of majority of industries on performance is positive but
insignificant. The relationship of textile with performance is negative for all measures
followed by “Other non-metallic mineral products” and “Electrical machinery apparatus”
in two measures. Therefore, hypothesis (H7) is partially supported
5.10.4 The impact of Strategy, Size, and Industry on Performance:
Multivariate Analysis
Since, the performance is influenced by strategy, size, and industry, as we found in
preceding sections, it is imperative to check the combined effect of these three variables
on performance. For this purpose, we state the following hypotheses:
H8: Combined together, strategy, size, and industry has a significant impact on
firm performance
H9: Interaction for possible combinations of strategy, size, and industry has a
significant impact on performance
H10: Strategy is a better predictor of performance than size and industry
The multivariate models were run to test the above hypotheses by investigating the joint
impact of strategy, size, and industry on performance. Interaction terms are added as
incremental variable to explore the robustness of the model for sensitivity analysis. A
total of eight multivariate regression models were run to see the impact of additive and
interactive variables on performance. To avoid space consumption, only p-values and R2
values for all regression models are presented for all performance measures in Table
5.28. According to the results, the combined impact of strategy, size, and industry
showed a significant influence over performance as was expected. The contingent or the
interactive impact is also significant foe overall model fit for all performance measures.
167
While comparing the results for performance measures, it is found that the impact is
significant in all (eight) models for ROA. The impact is statistically significant for ROS
and ROCE in six models and for ROE in four models respectively. Strategy is proved to
be the better predictor of performance in three performance measures when a combined
impact of strategy, size and industry was modeled. Firm size is followed by strategy
while industry has the weakest influence compared to strategy and firm size. The results
support our hypotheses (H8, H9, and H10). The values of R2 also showed visible
improvement when hierarchical regression models are run. This is seen in the increment
in its value from reduced models to the complete models as the explanatory power
improved from 19% to 53%, 12% to 36%, 17% to 35%, and 9% to 41% respectively for
four performance measures (ROA, ROE, ROS, and ROCE) respectively. The results also
show that the combine impact of strategy, size, and industry on performance is more than
their individual influence.
The multivariate model for interaction of strategy, size, and industry were run. The
results for the interaction of strategy and size reveal that large analyzers and large PA-
Like firms outperformed medium and small firms in their respective categories. Large
DA-Like firms performed better than small and medium sized DA-Like firms followed
by the small DA-Like firms keeping reactors as benchmark. For strategy and industry
interaction, analyzers and DA-Like performed well in “Information, Communication, and
Transportation Services” and “Coke, and Refined Petroleum Products” industries while
prospectors in “Other Non-metallic Mineral Products” in comparison to reactors who
performed well in “Motor Vehichle, Trailors, and Auto parts” and “Chemicals, Chemical
Products, and Pharmaceutical Products”. The results for interaction of size and strategy
show that large firms performed well in “Fuel and Energy” and “Chemicals, Chemical
Products, and Pharmaceutical Products” while medium firms in “Motor Vehicles,
Trailers, and Auto parts” and “Chemicals, Chemical Products, and Pharmaceutical
Products” in comparison to small firms who performed well in “Information,
Communication, and Transportation Services” and “Other Non-metallic Mineral
Products”.
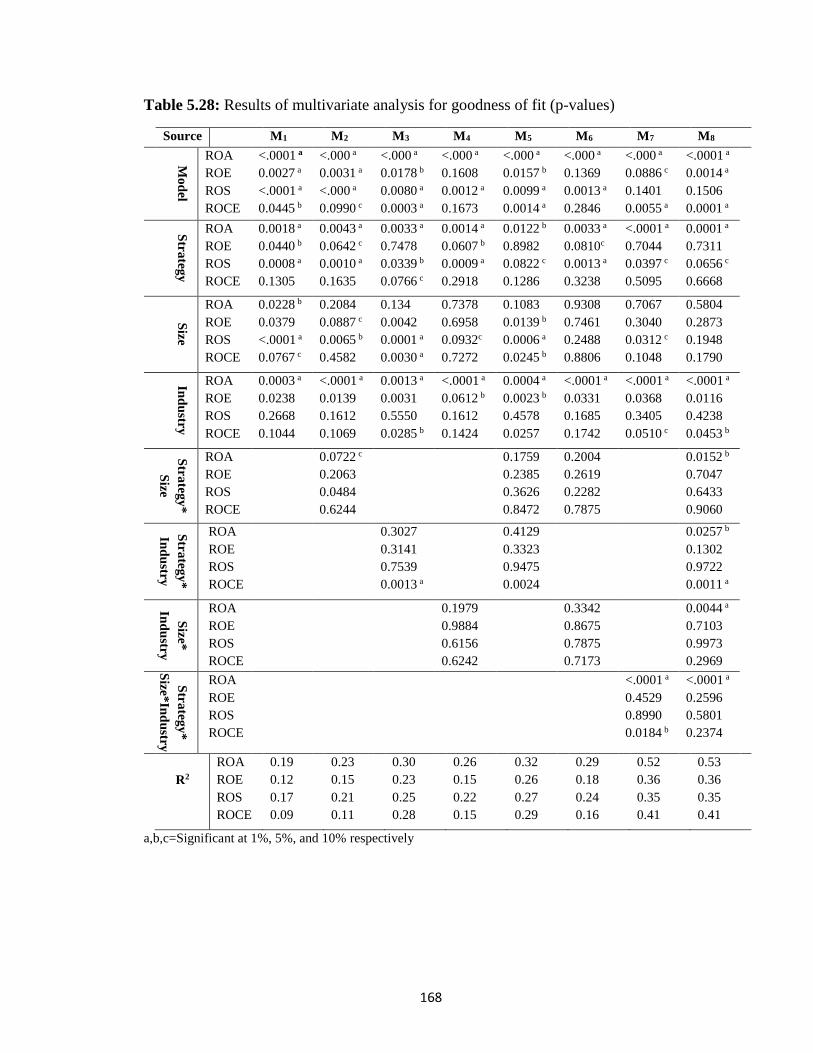
168
Table 5.28: Results of multivariate analysis for goodness of fit (p-values)
Source M1 M2 M3 M4 M5 M6 M7 M8
Mo
del
ROA
ROE
ROS
ROCE
<.0001 a
0.0027 a
<.0001 a
0.0445 b
<.000 a
0.0031 a
<.000 a
0.0990 c
<.000 a
0.0178 b
0.0080 a
0.0003 a
<.000 a
0.1608
0.0012 a
0.1673
<.000 a
0.0157 b
0.0099 a
0.0014 a
<.000 a
0.1369
0.0013 a
0.2846
<.000 a
0.0886 c
0.1401
0.0055 a
<.0001 a
0.0014 a
0.1506
0.0001 a
Str
ateg
y
ROA
ROE
ROS
ROCE
0.0018 a
0.0440 b
0.0008 a
0.1305
0.0043 a
0.0642 c
0.0010 a
0.1635
0.0033 a
0.7478
0.0339 b
0.0766 c
0.0014 a
0.0607 b
0.0009 a
0.2918
0.0122 b
0.8982
0.0822 c
0.1286
0.0033 a
0.0810c
0.0013 a
0.3238
<.0001 a
0.7044
0.0397 c
0.5095
0.0001 a
0.7311
0.0656 c
0.6668
Size
ROA
ROE
ROS
ROCE
0.0228 b
0.0379
<.0001 a
0.0767 c
0.2084
0.0887 c
0.0065 b
0.4582
0.134
0.0042
0.0001 a
0.0030 a
0.7378
0.6958
0.0932c
0.7272
0.1083
0.0139 b
0.0006 a
0.0245 b
0.9308
0.7461
0.2488
0.8806
0.7067
0.3040
0.0312 c
0.1048
0.5804
0.2873
0.1948
0.1790
Ind
ustry
ROA
ROE
ROS
ROCE
0.0003 a
0.0238
0.2668
0.1044
<.0001 a
0.0139
0.1612
0.1069
0.0013 a
0.0031
0.5550
0.0285 b
<.0001 a
0.0612 b
0.1612
0.1424
0.0004 a
0.0023 b
0.4578
0.0257
<.0001 a
0.0331
0.1685
0.1742
<.0001 a
0.0368
0.3405
0.0510 c
<.0001 a
0.0116
0.4238
0.0453 b
Str
ateg
y*
Size
ROA
ROE
ROS
ROCE
0.0722 c
0.2063
0.0484
0.6244
0.1759
0.2385
0.3626
0.8472
0.2004
0.2619
0.2282
0.7875
0.0152 b
0.7047
0.6433
0.9060
Str
ateg
y*
Ind
ustry
ROA
ROE
ROS
ROCE
0.3027
0.3141
0.7539
0.0013 a
0.4129
0.3323
0.9475
0.0024
0.0257 b
0.1302
0.9722
0.0011 a
Size*
Ind
ustry
ROA
ROE
ROS
ROCE
0.1979
0.9884
0.6156
0.6242
0.3342
0.8675
0.7875
0.7173
0.0044 a
0.7103
0.9973
0.2969
Str
ateg
y*
Size*
Ind
ustry
ROA
ROE
ROS
ROCE
<.0001 a
0.4529
0.8990
0.0184 b
<.0001 a
0.2596
0.5801
0.2374
R2
ROA
ROE
ROS
ROCE
0.19
0.12
0.17
0.09
0.23
0.15
0.21
0.11
0.30
0.23
0.25
0.28
0.26
0.15
0.22
0.15
0.32
0.26
0.27
0.29
0.29
0.18
0.24
0.16
0.52
0.36
0.35
0.41
0.53
0.36
0.35
0.41
a,b,c=Significant at 1%, 5%, and 10% respectively
169
5.11 Textile Industry Analysis and its Comparison with Overall Results
The studies on Miles and snow typology considered single industry as well as multi-
industries for analysis. One of the issues relating to single industry analysis is the
generalization of the findings while the issues with multi-industry analysis include the
differences in the structure and other dynamics relevant to specific industry due to which
the results may not reflect the true picture. To overcome this shortcoming, this study
analyzes the single industry along with multi industry to find the commonalities and
differences in the results so that the generalization of the findings can be suggested. For
this purpose, textile industry is selected for this study as it constitutes around 39% of the
sample size. Besides this, textile sector, compared to any other sector, has backward and
forward linkages with other sectors. For example, textile sector links agriculture with
industry hence contributing about 24 percent of the value added output of the industrial
sector, providing 40 percent of employment for industrial sector and contributing around
55 percent in Pakistan’s total exports, and consumes 40 percent of the banking sector
loans given to the industrial sector. The textile sector has sound production chain
spanning from the growth of cotton to ginning, processing, weaving and finishing
products. On the finished products the production chain include fabrics, home textiles and
apparel products. This production chains have indigenous footings and strong industry
linkages developed by Pakistan’s own industry (Pakistan Economic Survey, 2017; Tahir
& Anuar, 2015). The importance of textile sector along with intra-industry linkages and
influences make it an automatic choice for a single industry analysis.
Textile sector is passing through a stagnation phase over a decade due to a number of
internal and external factors. One of the factors for this stagnation is distorted prices due
to the government’s subsidy given to cotton farmers and other textiles products
producers. The other factors include global recession, marketing constraints, and
increasingly tough buyers’ conditions etc. The price of cotton from Pakistan in
international market decreased by 10 cents per pound due to the consistent resistance to
standardization and grading of cotton bales by ginners and spinners. At the same time,
170
there was a marginal growth of the value-added garments sector. There are many reasons
for this marginal growth. The reasons include the limited product range of finished
goods, the inability of manufacturing units of textile sector to update themselves to the
international requirements, and lesser degree of using manmade fibers. In addition, the
lack of skilled human resource, absence of modern management practices, and low
employment of women in the garment sector have thwarted the efforts for achieving the
high value-addition markets resulting in low exports from the entire textiles industry
supply chain (Government of Pakistan, 2015).
The selection of one industry is consistent with earlier studies (see Table 3.1). Jennings
& Seaman (1994) suggested two reasons for selection of single industry for analysis.
First, there should be enough information available publically to satisfy the measures of
performance. Second, there shoulld be evidence for adation of environmental changes by
the selected industry. The textile industry in Pakistan fulfills these requirements and
hence eligible for in depth analysis. Another reason for doing single industry analysis is
based on the argument by Snow & Hambrick (1980) that the selection of one industry
solve the issue of comparison of measures and other parameters because of the
environmental homogeneity. The main objective of this analysis is to make a comparative
analysis of single industry findings with the multi-industry results so that the common
findings can be generalized for strategy-performance relationships studies. The results for
textile sector analysis are presented in Annexure A3. However, the summary of the
results is presented below under sub-headings.
5.11.1 Strategic Types Distribution
Like overall findings, the dominance of analyzers strategy is also visible in textile sector
representing 52% of the total firms followed by DA-Like firms with 18%, Reactors with
16% and PA-Like with 14% respectively. There is non-existence of pure defenders and
pure prospectors. The percentage of analyzers is more in textile sector than the overall
presence (47%) and DA-Like are less than overall presence (21%). The distribution in
overall economy is almost identical for reactors and PA-Like. The results reveal that
firms in textile sector are mostly small and medium sized (39% each) whereas large firms
171
are only 22%. Within strategic types, DA-Like and reactors are mostly small firms,
analyzers are medium, and PA-Like are large firms. In comparison with overall pattern,
the findings are consistent for DA-Like, analyzers, and PA-Like firms. However, in
contrast to textile sector, the majority of reactors are large in overall findings. Comparing
the behavior of strategic types, it is found that consistent firms are more than the flexible
firms for all viable strategies in textile sector. The pattern is similar for overall findings
except for analyzers where consistent firms are more than the flexible firms.
5.11.2 Strategic Types and Performance
In textile sector, both DA-Like and analyzers outperformed reactors and PA-Like in all
four performance measures. Both of them also performed above industry averages. DA-
Like gave highest performance in terms of ROA and ROS while analyzers performed
above all in terms of ROE and ROCE. Reactors performed below industry averages in
three measures whereas PA-Like performed below industry averages in all four measures.
The performance of PA-Like is negative in three measures whereas that of reactors in two
measures. The results for PA-Like and reactors are similar with overall results. However,
the results for DA-Like and analyzers are slightly different.
5.11.3 Strategic Behavior and Performance
Strategic consistency returns better performance when results are compared for consistent
strategy with flexible and reactors. The performance of consistent strategy was better
than reactors in all four performance measures while flexible strategy firms outperformed
reactor in three performance measures. In contrast to overall results, firms with
consistency in their strategic stance performed better than firms having flexible strategy
in three performance measures whereas for overall results flexible firms perform better
than consistent firms in three measures.
Within strategic types there is no specific pattern as far strategic behavior of firms is
concerned. For example, among DA-Like and PA-Like firms, consistent firms performed
better for all performance measures. Among analyzers, consistent firms performed better
in terms of ROA and ROE and firms with flexible strategy performed better in terms of
172
ROS and ROCE. In comparison with overall results, it is found that for DA-Like,
consistent strategy outperformed flexible in three measures. For analyzers and PA-Like,
consistent performed better in all four measures. Hence the results for PA-Like are
similar for single industry and multi-industry analysis while they are different for other
strategic types.
5.11.4 Strategy, Size and Performance
Within small sized firms, DA-Like outperformed others in all measures while analyzers
in three measures. PA-Like performed poorly along with reactors. The performance of
small PA-Like is similar with overall results whereas small reactors’ performance is
below overall performance of small reactors. Similarly, medium DA-Like and analyzers
outperformed others in all performance measures. DA-Like showed highest performance
in three measures while analyzers in one measure. Reactors and PA-Like showed lowest
performance in two performance measures. The trend is different for large sized firms
where analyzers outperformed others including DA-Like. The performance of large PA-
Like is also improved while large reactors performed poorly. The performance of large
PA-Like and large reactors is aligned with overall performance results for large firms.
Comparing the performance of small, medium, and large sized firms with overall
performance of textile sector, irrespective of strategic types, it is evidenced that large
sized firms performed better than small and medium. These findings are also aligned with
overall results.
5.11.5 Strategic Behavior, Firm Size, and Performance
For medium sized firms, organizations with consistent and flexible strategies
outperformed reactors in all four performance measures. They outperformed large
reactors in three and small reactors in two performance measures. These results reveal
that consistency in strategic behavior brings the fruits in terms of better performance
whereas inconsistent or reactor behavior may get some benefits but not all the time and
not across the firm size. The results of firms following consistent and flexible strategies
173
are aligned with overall results but the pattern of results within firm size is different for
textile sector.
5.11.6 Strategy, Industry, and Performance
The textile sector is further divided into three sub-sectors: “Spinning, weaving, and
finishing of textile”, “made up of textile article”, and “other textile sub-sector”. Spinning,
weaving, and finishing of textile, the largest sub-sector in textile sector, performed better
in terms of ROS and ROCE while “made up of textile article” sub-sector performed
better in terms of ROA and ROE. The “other textile sub-sector” performed poorly. The
results for the performance of strategic types across the sub-sector show that DA-Like
firms performed better than others across the sub-sectors followed by analyzers. Despite
the poor performance of textile sector in comparison of overall performance, the
performance of sub-sector “made up of textile article” in terms of ROE and ROCE is
above the overall average.
5.11.7 Industry, Strategic Behavior, and Performance
The findings show that both consistency and flexibility in strategic behavior
outperformed reactor behavior. However, the performance of consistent strategy in textile
sector is better whereas in overall results, the performance of flexible firms is better.
However, within sub-sectors of the textiles industry, the pattern of the performance for
consistent and flexible firms is varying as in multi-industry analysis. The sub-sectors of
“spinning, weaving, and finishing of textile” and “other textile” consistent firms
outperformed reactors and flexible firms whereas in “made up of textile articles”, flexible
firms outperformed reactors and consistent firms. Reactors, performed poorly across sub-
sectors. Their performance is however better in “other textile” sub-sector.
5.11.8 Strategy-Performance Relationship
To test the hypothesis that viable strategies will perform equally well in single industry as
well, the test for equality of means was applied for viable strategies excluding reactor
strategy. The results suggest that viable strategies performed evenly for ROA and ROS
174
whereas the performance among the viable strategies is significantly different for ROE
and ROCE at 10% and 5% respectively. The parameter estimates show that analyzers and
DA-Like strategies are significantly better than the PA-Like strategy for ROE and ROCE
measures while DA-Like is also significantly better than PA-Like in terms of ROA. The
performance of the viable strategies among firm size is significant for ROS only. The
parameter estimates show that the performance of large size firms is better than small and
medium sized firms. Strategy is the better predictor of the performance as the influence
of strategy on performance is more than the influence of size for three out of four
measures which is in contrast with the results for overall findings where size is the better
predictor than strategy. The comparison of viable strategies with reactor strategy
performance is also made using one-way ANOVA and the effect of size on performance
is also tested. Again, the results show that strategy is the better predictor of the
performance as the influence of strategy on performance is more than the influence of
size for three out of four measures.
The parameter estimates show that all strategic types performed better than reactors in
two performance measures (ROE and ROS) while DA-Like and analyzers strategies
outperformed reactors in all four measures. The performance of reactors is found
negative for ROE and ROS. DA-Like performed significantly well in comparison to the
reactors in three measures while analyzers performed significantly different from reactor
in two measures. Contrary to the expectations, PA-Like performed significantly below
reactors in terms of ROCE. The post hoc test results show significant difference in
performance for the pair of analyzers and PA-Like firms only. Similarly the parameter
estimates for firm size for impact on performance show that large firms outperformed
small and medium sized textile sector firms in all performance measures but the
difference in performance is statistically significant for small size firms in terms of ROS
which is confirmed by the post hoc test results as well.
A two-way ANOVA was done to find the effect of strategy, size, and combined effect on
performance. For this purpose, two models (M3 and M4) were run in addition to models
M1 and M2. In model M3 the effect of strategy and size was tested on performance while
in model M4 the interaction term of strategy and size was added to see whether the
175
interaction has any significant effect on performance or not. Overall effect of strategy and
size on all performance measures is significant. The level of significance is 1% for ROS,
5% for ROA and ROCE while it is 10% for ROE. The model shows that strategy is better
predictor than firm size as the effect of strategy is statistically significant for all
performance measures while the effect of size is significant for only two measures. For
interaction model, the results are significant for only two performance measures (ROE
and ROS) for overall model while strategy has significant effect for only ROE. The effect
of interaction of strategy and size has also significant effect for ROE only while the effect
of size on performance for this model is insignificant for all performance measures.
However, the power of significance (R2) is more for interaction term model than without
interaction.
5.12 Comparative Summary of the Results: Multi-Industry (MI) versus
Single Industry (SI)
The findings from single-industry and multi-industry analysis are compared and
summarized in table 5.29. The comparison is made for each hypothesis (H1 to H11)
along with the major findings and decision about the consistency of the findings with the
prior research findings. The findings suggest that there is similarity in majority cases.
There are some instances, however, where there are dissimilarities in the results. This
summary of the results provides quick overview of the study and is helpful for
generalization of the results.
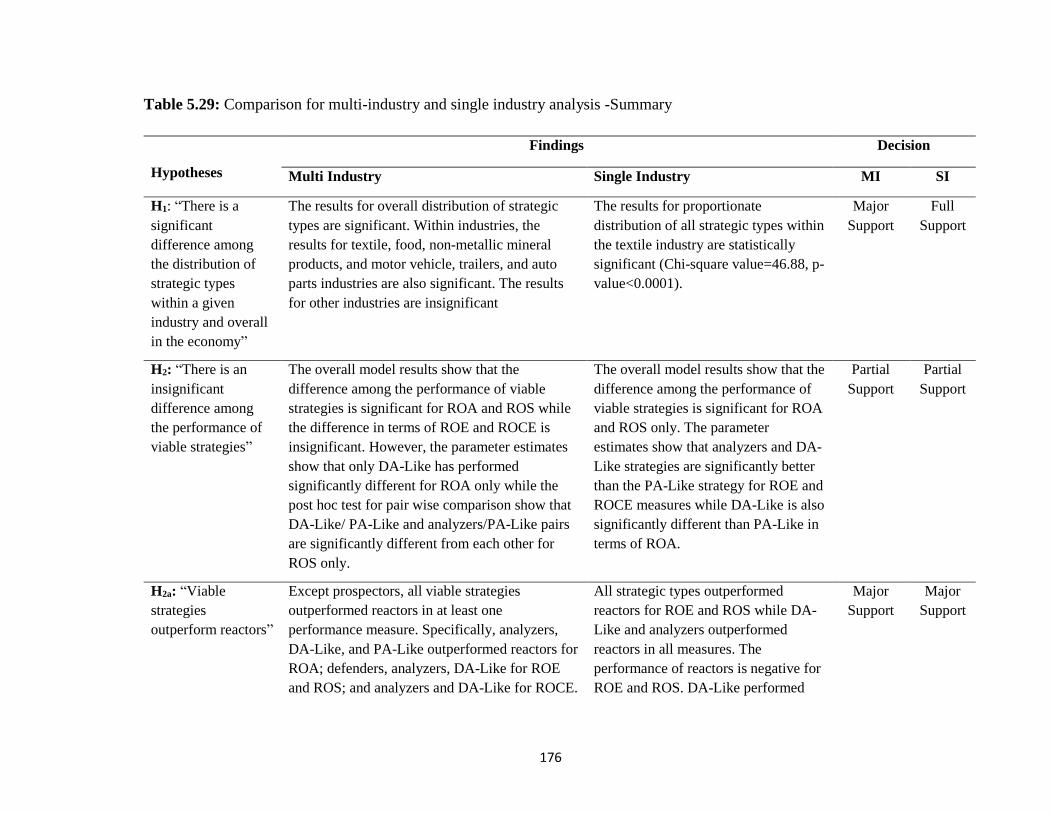
176
Table 5.29: Comparison for multi-industry and single industry analysis -Summary
Hypotheses
Findings Decision
Multi Industry Single Industry MI SI
H1: “There is a
significant
difference among
the distribution of
strategic types
within a given
industry and overall
in the economy”
The results for overall distribution of strategic
types are significant. Within industries, the
results for textile, food, non-metallic mineral
products, and motor vehicle, trailers, and auto
parts industries are also significant. The results
for other industries are insignificant
The results for proportionate
distribution of all strategic types within
the textile industry are statistically
significant (Chi-square value=46.88, p-
value<0.0001).
Major
Support
Full
Support
H2: “There is an
insignificant
difference among
the performance of
viable strategies”
The overall model results show that the
difference among the performance of viable
strategies is significant for ROA and ROS while
the difference in terms of ROE and ROCE is
insignificant. However, the parameter estimates
show that only DA-Like has performed
significantly different for ROA only while the
post hoc test for pair wise comparison show that
DA-Like/ PA-Like and analyzers/PA-Like pairs
are significantly different from each other for
ROS only.
The overall model results show that the
difference among the performance of
viable strategies is significant for ROA
and ROS only. The parameter
estimates show that analyzers and DA-
Like strategies are significantly better
than the PA-Like strategy for ROE and
ROCE measures while DA-Like is also
significantly different than PA-Like in
terms of ROA.
Partial
Support
Partial
Support
H2a: “Viable
strategies
outperform reactors”
Except prospectors, all viable strategies
outperformed reactors in at least one
performance measure. Specifically, analyzers,
DA-Like, and PA-Like outperformed reactors for
ROA; defenders, analyzers, DA-Like for ROE
and ROS; and analyzers and DA-Like for ROCE.
All strategic types outperformed
reactors for ROE and ROS while DA-
Like and analyzers outperformed
reactors in all measures. The
performance of reactors is negative for
ROE and ROS. DA-Like performed
Major
Support
Major
Support
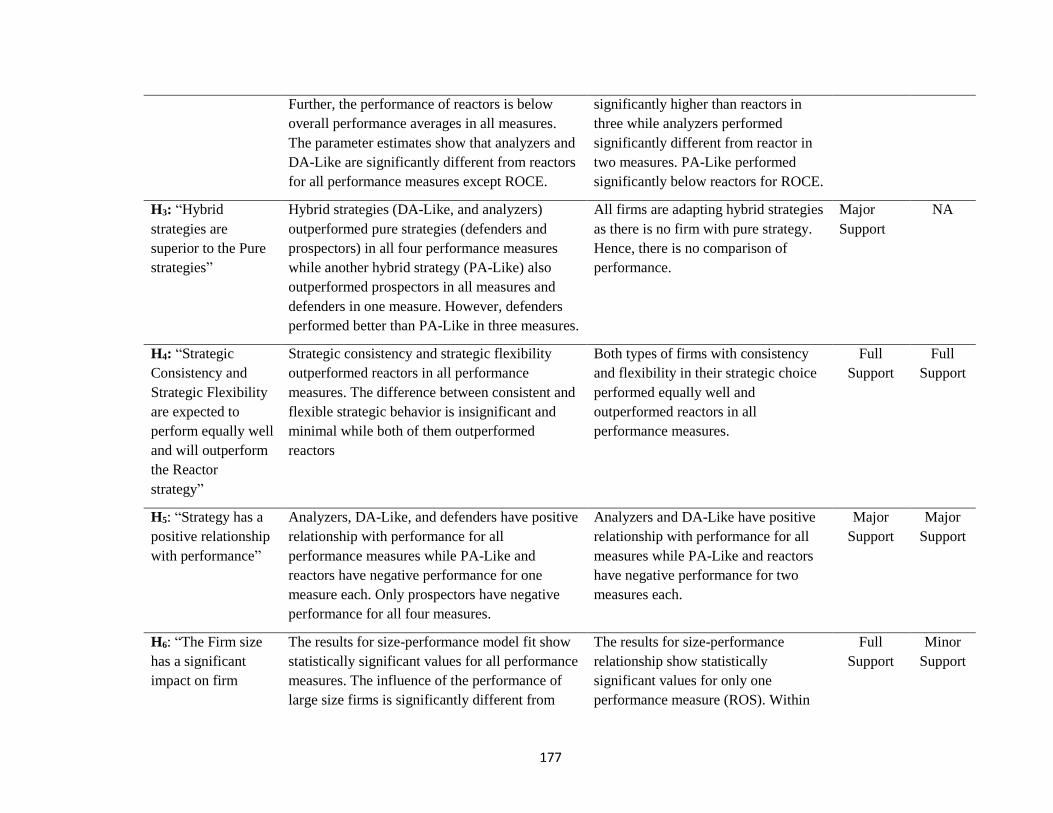
177
Further, the performance of reactors is below
overall performance averages in all measures.
The parameter estimates show that analyzers and
DA-Like are significantly different from reactors
for all performance measures except ROCE.
significantly higher than reactors in
three while analyzers performed
significantly different from reactor in
two measures. PA-Like performed
significantly below reactors for ROCE.
H3: “Hybrid
strategies are
superior to the Pure
strategies”
Hybrid strategies (DA-Like, and analyzers)
outperformed pure strategies (defenders and
prospectors) in all four performance measures
while another hybrid strategy (PA-Like) also
outperformed prospectors in all measures and
defenders in one measure. However, defenders
performed better than PA-Like in three measures.
All firms are adapting hybrid strategies
as there is no firm with pure strategy.
Hence, there is no comparison of
performance.
Major
Support
NA
H4: “Strategic
Consistency and
Strategic Flexibility
are expected to
perform equally well
and will outperform
the Reactor
strategy”
Strategic consistency and strategic flexibility
outperformed reactors in all performance
measures. The difference between consistent and
flexible strategic behavior is insignificant and
minimal while both of them outperformed
reactors
Both types of firms with consistency
and flexibility in their strategic choice
performed equally well and
outperformed reactors in all
performance measures.
Full
Support
Full
Support
H5: “Strategy has a
positive relationship
with performance”
Analyzers, DA-Like, and defenders have positive
relationship with performance for all
performance measures while PA-Like and
reactors have negative performance for one
measure each. Only prospectors have negative
performance for all four measures.
Analyzers and DA-Like have positive
relationship with performance for all
measures while PA-Like and reactors
have negative performance for two
measures each.
Major
Support
Major
Support
H6: “The Firm size
has a significant
impact on firm
The results for size-performance model fit show
statistically significant values for all performance
measures. The influence of the performance of
large size firms is significantly different from
The results for size-performance
relationship show statistically
significant values for only one
performance measure (ROS). Within
Full
Support
Minor
Support
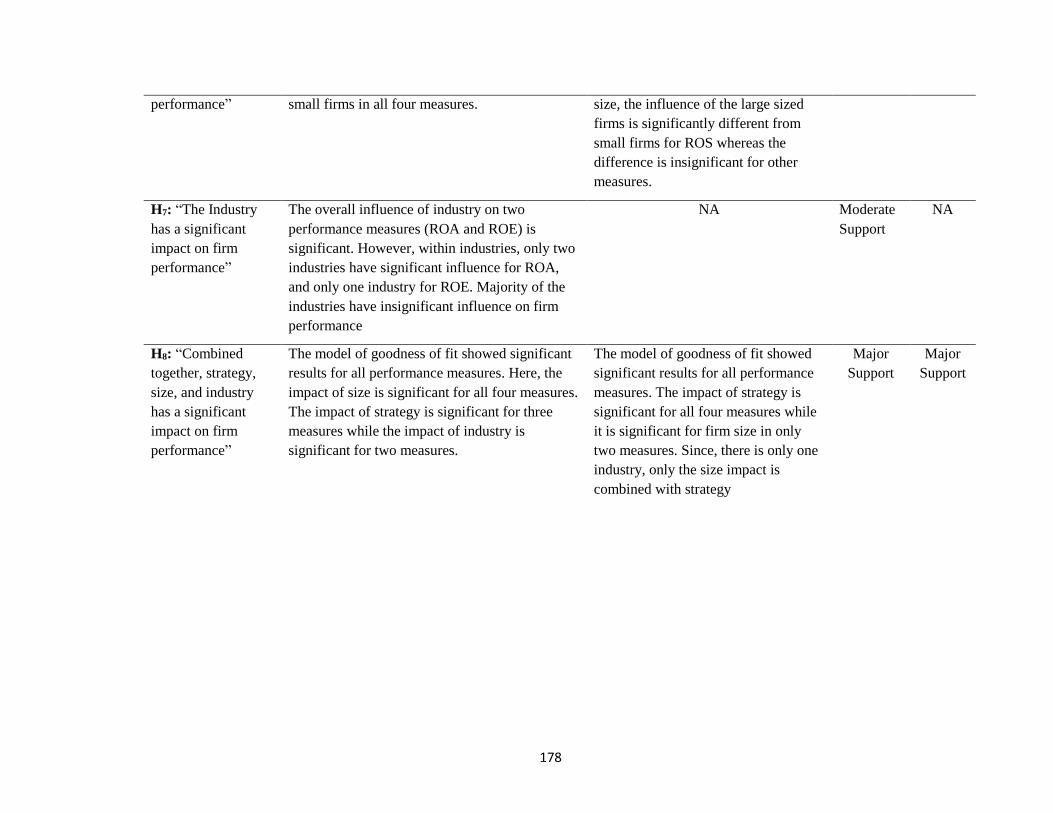
178
performance”
small firms in all four measures. size, the influence of the large sized
firms is significantly different from
small firms for ROS whereas the
difference is insignificant for other
measures.
H7: “The Industry
has a significant
impact on firm
performance”
The overall influence of industry on two
performance measures (ROA and ROE) is
significant. However, within industries, only two
industries have significant influence for ROA,
and only one industry for ROE. Majority of the
industries have insignificant influence on firm
performance
NA Moderate
Support
NA
H8: “Combined
together, strategy,
size, and industry
has a significant
impact on firm
performance”
The model of goodness of fit showed significant
results for all performance measures. Here, the
impact of size is significant for all four measures.
The impact of strategy is significant for three
measures while the impact of industry is
significant for two measures.
The model of goodness of fit showed
significant results for all performance
measures. The impact of strategy is
significant for all four measures while
it is significant for firm size in only
two measures. Since, there is only one
industry, only the size impact is
combined with strategy
Major
Support
Major
Support
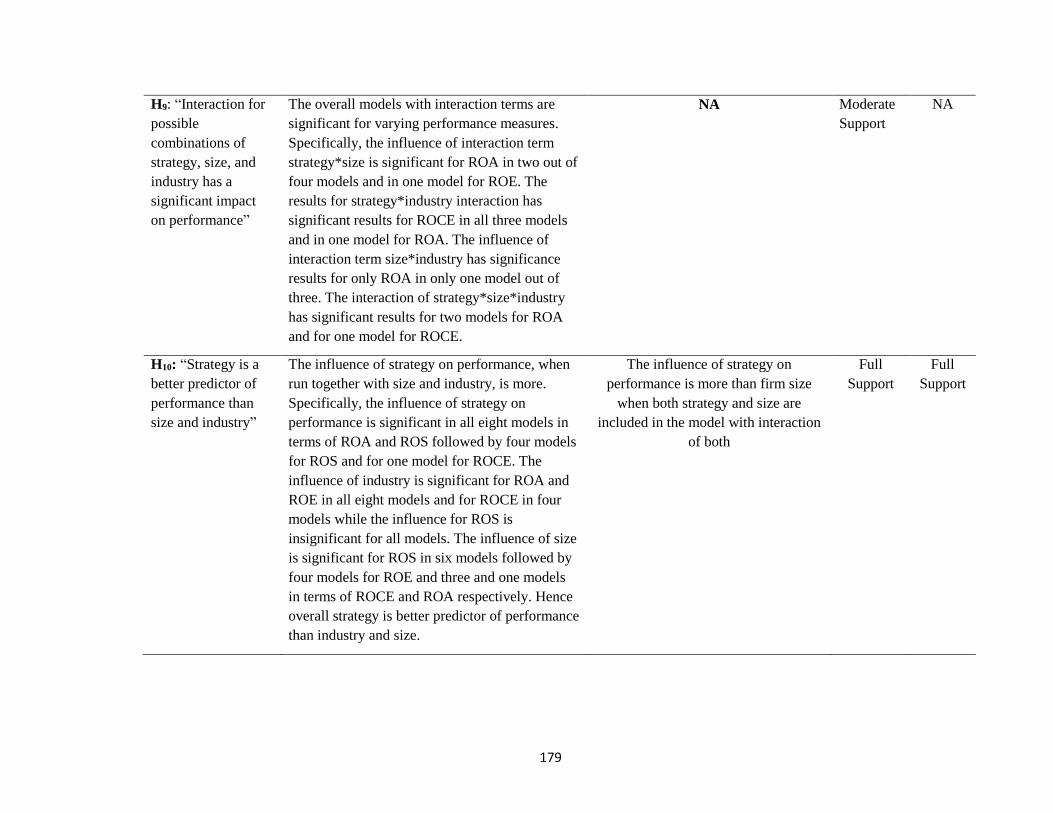
179
H9: “Interaction for
possible
combinations of
strategy, size, and
industry has a
significant impact
on performance”
The overall models with interaction terms are
significant for varying performance measures.
Specifically, the influence of interaction term
strategy*size is significant for ROA in two out of
four models and in one model for ROE. The
results for strategy*industry interaction has
significant results for ROCE in all three models
and in one model for ROA. The influence of
interaction term size*industry has significance
results for only ROA in only one model out of
three. The interaction of strategy*size*industry
has significant results for two models for ROA
and for one model for ROCE.
NA Moderate
Support
NA
H10: “Strategy is a
better predictor of
performance than
size and industry”
The influence of strategy on performance, when
run together with size and industry, is more.
Specifically, the influence of strategy on
performance is significant in all eight models in
terms of ROA and ROS followed by four models
for ROS and for one model for ROCE. The
influence of industry is significant for ROA and
ROE in all eight models and for ROCE in four
models while the influence for ROS is
insignificant for all models. The influence of size
is significant for ROS in six models followed by
four models for ROE and three and one models
in terms of ROCE and ROA respectively. Hence
overall strategy is better predictor of performance
than industry and size.
The influence of strategy on
performance is more than firm size
when both strategy and size are
included in the model with interaction
of both
Full
Support
Full
Support
180
5.13 Discussion
5.13.1 Refinement in Scoring Methodology
The scoring method is used for categorization of strategic types based on the ranking of
the scores theoretically calculated. The ranking is generally calculated on the basis of
quintiles or percentiles. One problem with the ranking is the cut-off points because
different researchers used different cut-off points. Some of the examples are presented
here. Smith et al. (1986), used the ranking scale of 0-8 on the continuum. He used cluster
analysis for classification of strategic types. The clusters with highest score was
categorized as prospectors, followed by analyzers, and defenders. The cluster with lowest
score was classified as reactor. Evans & Green (2000) categorize the strategic types on
the basis of mean ranking scores of quintiles. However, the firms constituting the middle
of the continuum are termed as reactors instead of analyzers. Bentley et al. (2013) also
used quintiles to rank the strategy variables and based on composite score firms are
categorized as prospectors with a range of scores on the higher side of the continuum,
defenders at the lower side and the analyzers as the balancing category. The reactor
strategy was not identified.
Extension in the number of strategic types was another area of improvement because the
existing strategic types only discuss the pure strategies while in real situation firms make
some type of adjustments and make a combination of pure strategies to hybridize the
strategic choice. For this purpose prospectors and defenders strategies were divided into
pure and hybrid strategies. The concept of hybridization of pure strategies has been
discussed in literature (Hambrick, 1981; Madanoglu et al.; 2014; Slater et al., 2011;
Valos & Fix, 2003) but less efforts were made towards the operationalization and
classification of such hybrid strategic types. To overcome these deficiencies, the scoring
methodology was refined that provides the mechanism to identify all strategic types as
proposed by Miles and Snow along with other strategic groups. One of the major
contribution of this study is the development of methodology for identification of
inconsistent behavior –a characteristics that define reactor strategy which is generally
omitted from the studies particularly when archived financial data is used. The other
181
contribution of the study in the methodology is the identification of pure versus hybrid
and consistent versus flexible strategic groups. The theoretical basis of these strategic
groups and the finding from empirical analysis in this study provides enough evidence for
the reliability and validity of the methodology.
5.13.2 Presence and Distribution of Strategic Types
The refined scoring methodology is used to categorize the strategic groups on the basis of
Miles and Snow typology; pure versus hybrid strategic types; and consistent versus
flexible strategic types. The distribution of strategic types within industry and across
industries is uneven which is consistent with earlier studies. In this study, among viable
strategies, analyzers is the dominating strategy followed by DA-Like, reactors, and PA-
Like strategies. The existence of pure strategies (prospectors and defenders) is negligible.
The overall distribution of firms following strategic consistency and strategic flexibility
is almost equal. Almost, same pattern was found for strategic consistency and flexibility
with in strategic types.
One of the fundamental premises of the Miles and Snow typology is that each of the
strategy types is considered to exist within an industry or industries (Zahra & Pearce II,
1990). A number of empirical studies validate this premise. The presence of strategic
types is supported by the studies both for multi-industry settings, single industry analysis,
and cross-country studies as reflected in Table 3.2. The dominance of analyzers in our
study is specifically consistent with those studies where archived data is used (Table
3.1). In most of these studies, the percentage of prospectors and defenders is less than the
analyzers. Also, there is a mixed support in the literature for the industry membership
proportions. Different researchers have reported significantly varied distribution of some
or all of the strategy types across different industries (Blackmore & Nesbitt, 2013;
Hambrick, 1981, 1982; James & Hatten, 1995; Snow & Hambrick, 1980; Zahra & Pearce
II, 1990). Hence, our findings are overwhelmingly consistent with the prior research as
far as the presence and distribution of the strategic types are concerned.
182
5.13.3 Strategy-Performance Relationship: Pure Versus Hybrid Strategies
There is growing discussion in the extant literature on the supremacy of pure strategy
over hybrid and vice versa. The results of this study show that in Pakistan, firms are
adapting hybrid strategies instead of pure strategies as the presence of pure strategies is
negligible. The results support the arguments of the extant literature that the
organizations are hybridizing or combining the pure strategies for competitive advantage.
The adaption of hybrid strategies is near to reality because by doing so organizations get
many strategic options to adapt irrespective of the industry they are in. The arguments in
favour of hybridization of strategic orientation is being discussed by the contemporary
literature more than before (Pertusa-Ortega et al., 2009; Salavou, 2015; Thornhill &
White, 2007). Theoretically, the adaption of hybrid strategy by the organizations is
because of some demerits associated with pure strategy. These problems are:
1. Sticking to the core and pure specialized strategy leads to ignoring the important
customer needs because of serious shortcomings in product offerings.
2. In contrast to hybrid form of strategy, there are more chances of imitation by the
competitors.
3. Market changes rapidly, customer needs and tastes are evolving quickly, and
competitors are inventing new products and services mechanisms.
The issue list above related with firms following pure strategies put them in a vulnerable
conditions to compete with the firms those are able to combine or hybridize the pure
strategies to gain superior performance through exploiting the market conditions (Claver-
Cortés et al., 2012; Pertusa-Ortega et al., 2009). Hence, to address customer needs in
better way, firms adapt hybrid strategies because their strategy is difficult to imitate and it
offers more flexibility in their approach to meet the changing environmental challenges
One of the research question for this study was whether pure strategy is still superior to
hybrid strategy? Our results do not support this question as the performance of hybrid
strategies better than pure strategies. According to the results, within defending strategies,
hybrid strategy (DA-Like) outperformed pure defenders in all performance measures.
183
Similarly, on prospecting side, PA-Like strategy outperformed pure prospectors in all
performance measures. This provides clear evidence that hybrid strategies are superior to
pure strategies. The analyser strategy, which is considered as balancing strategy and
hence is categorized as hybrid or combination strategy also outperformed both defenders
and prospectors in all performance measures.
Our results are in favour of the debate that in the given changing environment, the better
choice for organizations is to go for combination of strategies rather than sticking to the
pure strategy (Parnell et al., 2015; Salavou, 2015). The reason for higher performance of
hybrid strategies in Pakistan can be due to the fact that in uncertain and volatile
environment like ours, firms are more vigilant to combine the strategic options as
suggested by Gabrielsson et al. (2016) that firms that operate in an uncertain and dynamic
environment can realize a hybrid competitive strategy for higher performance. The
performance of DA-Like firms may be due to their relatively internally oriented posture.
This orientation requires the firms to focus on efficiency, price, and quality by offering
superior products, at a higher quality and better prices than their competitors instead of
developing new products and services. The performance of analyzers is linked with their
maintenance of product line along with tracking and adapting changes in production and
manufacturing process through a keen observation of strategies of the competitors.
The poor performance of the prospectors and defenders may be due to the fact that they
may not be able to respond the market changes. Also, they could not perhaps maintain
their agility and flexibility in offering products and services that left them in a
disadvantaged position compared to their counterparts.
5.13.4 Strategy-Performance Relationship: Consistency versus Flexibility
There is a debate in the literature about adaptation of strategic stance by the management
in a given environment. The researchers who are in favour of strategic consistency argue
that the performance of the organizations can be increased if the firms follow the same
strategy for a longer period of time (Fehre et al., 2016; Lamberg et al., 2009; Parnell &
Lester, 2003; Sanchez, 1995). On the other hand, the proponents of strategic flexibility
184
claim that it adjustment in strategic stance and to remain flexible for exploiting the
environmental conditions is a necessary condition to remain in the competition and hence
to achieve higher performance (Herhausen & Morgan, 2014; Ouakouak & Ammar, 2015;
Parnell, 2005). Our results does not out rightly support any one of the above argument
rather they provide the support for both arguments. This shows that both consistency and
flexibility can bring better results if the firms are consciously following them with spirit.
The result of this study reveal that, the performance of strategic consistency and strategic
flexibility were above overall average and the difference between consistency and
flexibility was insignificant. As expected, both consistent and flexible strategies
outperformed reactors in all performance measures. However, within viable strategies,
when overall results were compared, it was found that firms following flexible strategies
performed slightly better than the firms adapting consistent strategy in three out of four
measures.
Investigating the performance results for strategic types separately, it was revealed that
there are mix results and support for both strategic consistency (Anikeeff & Sriram, 1995;
Fehre et al., 2016; Lamberg et al., 2009; Pleshko et al., 2014) and flexibility (Herhausen
& Morgan, 2014; Ouakouak & Ammar, 2015; Parnell, 2005). There is variation in the
results for performance due to variation in strategic choice, firm size and industry for
both consistent and flexible strategies. For example, among DA-Like firms, strategic
flexibility performed well when performance was measured by ROA and ROS the
performance of strategic consistency was better in terms for other two measures (ROE
and ROCE). The performance of strategic flexibility were better for analyzers and
prospectors while consistency produced better performance for PA-Like firms. These
findings reflect the arguments by Pleshko et al. (2014) who classified the strategic
groups according to their response to the market changes. According to them, prospectors
and analyzers represent the aggressive behaviour and therefore expected to be more
flexible. On the other hand, defenders reflect less aggressive or consistent behaviour. The
results of this study are somewhat consistent with this argument as strategic flexibility
produced higher performance for analyzers and prospectors’ types. However, the results
185
are mix for DA-Like firms as they performed better by adapting both aggressive
(flexible) strategy as well as less aggressive (consistency) in their strategic choices.
Strategic consistency suits large firms as they perform better while adapting strategic
consistency while strategic flexibility produced higher performance from medium size
firms. Analysing industry performance, it was revealed that industries with large market
share and volume such as “Textile” and “Food” industry follow consistency in their
strategic stance while other industries such as “Chemicals, chemical products and
pharmaceuticals”; “Cement”; “Motor vehicle industries” preferred flexibility in their
strategic stance. These findings are aligned with the theory that for large and complex
industries, it is difficult to shift the focus in very quick time because of the complexities
and the cost attached to that shift.
The proponents of strategic consistency argue that the probability of survival of firms
without being consistent with their own history and with the rate and nature of change in
the environment is minimized. Firms operating in a relatively stable environment are
expected to have high level of strategic consistency where firms tend to preserve their
state of rest or uniform action (Lamberg et al., 2009) and a high level of strategic
consistency can signal the existence of strong competitive strategy (Porter, 1980). Firms
may adapt strategic consistency because of four major reasons:
1. Firms stick to the existing strategy to avoid uncertainty and flexibility because
coping with the constant changes in the environmental factors is a challenging job
for strategists.
2. Strategic change or shift may require substantial capital expenditure and other
costs. For example, a shift of focus from a growth oriented and innovative
strategy ( such as prospector) or balancing strategy (analyser or stuck in the
middle strategy) to a cost focus strategy (such as defender) may require huge
investments in sophisticated production equipment to lower costs for effective
implementation of a defender strategy (Miles & Snow, 1978). Similarly, a change
of strategic stance from a defender or analyser strategy to a prospector strategy
may require outlays of capital for R&D activities.
186
3. Rapid strategic changes may confuse the price and quality conscious consumers.
Hence, they may shift their relationship with those firms which remain consistent
in providing the quality product or services.
4. Achieving and maintaining the sustainability of the success in new product and
service is a challenging task. To overcome this challenge, firms stick to the core
strategy. In this way they are able to avoid the situation where competitors may
distort consumer perception to gain competitive advantage (Parnell, 2005).
The flexibility in strategic orientation is well adapted in dynamic environments to
exploit market opportunities that lead to improved performance and the firms capable
of coping with their environments quickly and efficiently are more successful
(Ouakouak & Ammar, 2015). Empirical findings are, however, incongruent
(Herhausen & Morgan, 2014). The supporters of strategic flexibility make certain
arguments in their favour as under:
1. An organization adapts flexibility and creates a fit with its internal and
external environment to exploit the opportunities for superior performance
(Parnell, 1997).
2. Flexibility provides the opportunities to reap the first-mover advantage.
Flexibility helps in securing scarce resources, increasing the knowledge base,
and long-term competitive advantage.
3. Because of flexible orientation, organizations modify their strategy to create
unique resources: human resources, physical resources, capital resources etc.
(Barney, 1991).
4. Strategic change becomes inevitable when the required performance is not
being achieved. Therefore, organizations believe that a shift in strategy will
increase the ability of the firm to generate returns, increase market share, and
improve overall performance (Parnell, 2005; Parnell & Lester, 2003).
Flexibility raises problems as well that may put the existence of the firms at risk.
Because rapid changes in strategic stance may lead to unwanted actions by the
stakeholders. The actions contrary to the past behaviour may lead to create an imbalance
187
between capabilities and competitive actions causing a quick increase in costs and decline
in competitive position (Lamberg et al., 2009).
5.13.5 Strategy-Performance Relationship: Miles and Snow Typology
Perspective
The assessment of strategy-performance relationship associated with varying strategy
types has reported extensively in studies where Miles and Snow typology is applied. One
of the fundamental assumptions of Miles and Snow typology is that all viable strategies,
if perused for a longer period of time, will perform equally well. The second part of the
assumption is that they are expected to outperform reactors –a non-viable strategy. The
results of this study showed partial support for this assumption in both multi-industry
analysis and single-industry analysis. For multi-industry analysis, the results for overall
model show that the difference among the performance of viable strategies is significant
for two measures (ROA and ROS) while the difference is insignificant for ROE and
ROCE. The post hoc test for pair wise comparison show that pairs of DA-Like/ PA-Like
and analyzers/PA-Like are significantly different from each other for ROS only.
Similarly, the results for overall model in single-industry also show that the insignificant
difference for ROE and ROCE.
Comparing the performance of strategic types in absolute terms show that DA-Like
strategy outperform all strategies in all four performance measures followed by analyzer
strategy. Both types of strategies also performed above the overall performance averages.
The performance of reactors, PA-Like and prospectors is below overall average for all
measures while pure defenders performed below average in three measures. The
performance of pure prospectors is negative for all performance measures. Comparing the
performance with reactors, it is revealed that except for prospectors, all viable strategies
performed better than reactors at least in one performance measure. However, reactors
also performed well in some instances. The presence and performance of reactors is
according to our expectation keeping in view the uncertain, unstable, and ever changing
political and economic conditions in Pakistan. If we exclude the results for prospectors
and defenders, since their numbers are negligible, the findings support our hypotheses.
188
The support for Miles and Snow’s this assumption is widespread. However, there are
number of instances, where inconsistent results are also found showing significant
differences in performance of viable strategies (Blackmore & Nesbitt, 2013; Parnell et
al., 2015; Parnell & Wright, 1993; Smith et al., 1989; Zamani et al., 2013). There are
many factors for the significant variation in performance among the viable strategies.
These factors include: the different nature and scope of performance measures; cultural
and environmental contexts; level of market efficiencies and/or deficiencies, level of
market competition, and market and product innovativeness (Blackmore & Nesbitt, 2013;
Snow & Hrebiniak, 1980; Zahra & Pearce, 1990). For example, in a study by Hambrick
(1983), defenders performed better than prospectors in terms of profitability measure
while in the same study prospectors performed better when performance is measured by
market share. In another study, prospectors performed better when performance was
measured as growth in sales while analyzers outperformed others in terms of ROA
(Parnell & Wright, 1993) etc. The country effect also cause the variation in performance
as was found in cross-country analysis. The performance of viable strategies is negative
or showed losses although viable strategies outperformed reactors in such cases (Parnell
et al., 2012; Parnell et al., 2015). These findings support the idea that context matters for
the performance variation among the strategic types. The results for contingent effect of
firm size and industry on performance are also inconclusive. For instance, firm size
influence firm performance significantly (Blackmore & Nesbitt, 2013; Jennings et al.,
2003) whereas Sarac et al. (2014) found it insignificant. Similarly, industry effect was
found significant by Blackmore & Nesbitt (2013) as well as insignificant by Sarac et al.
(2014).
Overall defending (DA-Like and defenders) and analyzing strategies performed better
than prospecting (PA-Like and prospectors) strategies. The poor performance of pure
prospectors and PA-Like can be due the facts supported by Hambrick (1983). He called it
"the liability of newness" and the “cost of innovation” and explained that the factors
responsible of creating these liabilities and costs are: new product development,
production, and their marketing; expansion or modification of plants, machinery, and
equipment; new supply chain establishment; inventory buildups; enhancement of skill set
189
of human resources etc. According to Miles and Snow (1978; 2003), many organizations
cannot prosper financially until and unless their markets continually seek new products
and services even if they become very adept at managing continual change. As Hambrick
(1983) argued, very few industries are able to be innovative consistently. They further
argue that pure prospector is relatively temporary and uncommon and hence represent a
very small share. These arguments favor the findings of this research since there are only
3 firms which could be categorized as pure prospectors. When their performance is
compared to other strategic types, it was found less than others as well.
The business environment and context of Pakistan also support our findings. According
to Haque et al. (2007), Pakistan lack entrepreneurial activities because of two problems:
absence of innovation and non-dynamic business environment. Businesses lack
innovation because most of the businessmen seem to be involved in inherited businesses
and they are based on imitation rather than innovation –the hallmark of prospectors. As
for dynamics of the businesses is concerned, the businessmen in Pakistan are content with
their present status as they seldom seem to develop their business to international
conglomerates. The factors responsible for poor performance are: lack of innovation and
non-dynamic business environment; lack of research and expert skills; poor legal
framework; lack of trust and social capital; and constraints in financing.
5.13.6 Strategy-Performance Relationship: Reactor Strategy
Reasonable number of firms in Pakistan are adapting reactor strategy. This is as per our
expectation since the environment in Pakistan is uncertain, unstable, and vibrant. The
operationalization of reactor strategy is not very common in the literature especially
through financial data. Therefore, its identification and the resultant performance is an
important outcome of the study. The underperforming nature of reactors is due to their
inconsistent strategic approach (Miles and Snow, 1978). Reactors often represent the
lethargic and inactive nature of organization (Conant et al., 1990), and “lack a consistent
strategy and simply respond to environmental pressures when forced to do so”, they are
frequently omitted from studies (Mcdaniel & Kolari, 1987) and due to this omission there
190
is scarcity of literature that refers to the frequency with which they engage in “reactive
activity” (Blackmore & Nesbitt, 2013).
The performance of reactor strategy is generally below viable, consistent, and flexible
strategies. However, their performance varies across industries. The variation in
performance also due to different nature of performance measures. For example, in this
reactors performed better than other in one industry in terms of ROA, ROE, and ROCE
while they outperformed others in terms of ROE in three industries and in two industries
in terms of ROCE. There are evidences in prior research e.g. Snow & Hrebiniak (1980)
where reactors performed better than others in a highly regulated air transportation
industry. The findings also supported by the arguments of Zahra & Pearce (1990) in
favour of reactors as they suggested that reactor strategy is viable in randomized
/unstable and in easygoing environment where change process is of low degree.
Similarly, Conant et al. (1990) suggested that reactors do not make grand strategy rather
they respond on some situations. Jennings et al. (2003) called reactors a unique type of
strategy. The findings of this study and the performance of reactors support these views.
Keeping in view the characteristics of reactor strategy and prevalent inconsistency in
Pakistani environment, the presence and performance of reactors firms is as per our
expectation.
5.13.7 Strategy-Performance Relationship: The Contingency Effect
The influence of firm size and industry on firm performance is visible supported by the
results of the study. Overall comparative results for the performance of strategic
consistency and strategic flexibility indicate that consistency achieved higher
performance in large and medium sized firms whereas the performance of strategic
flexibility are better in small firms. These findings make sense as it is not an easy job for
large and complex organizations to switch their strategic stance quickly. Hence they stick
to the consistent approach. For small firms, flexibility is the better option to exploit the
situation by quickly adapting to the environment. The performance of reactor strategy in
small firms is the indicator of quick reactions. Comparison of the intra size performance
of strategic groups indicates that large or medium sized firms follow consistency or
191
flexibility without compromising performance. Similarly, reactor strategy brought better
results for small firms. Hence, inconsistent or reactor behavior may get some benefits but
not all the time and not across the firm size. The results for goodness of fit (F-value)
showed a significant influence of size on ROA, ROS and on ROCE respectively.
Keeping small sized firms as the reference category, large firms performed significantly
different from medium and small for all performance measures.
There are interesting findings when the results for the performance of strategic types
across the industries were analyzed. Although, the performance of DA-Like firms is
better than all when compared with overall performance but there is variation when it was
investigated across industries. DA-Like outperformed others for all measures in two
industries and for two measures in three industries. Analyzers also outperformed others in
two industries in all measures. Similarly, the performance of PA-Like was better than
others for threes measures in two industries. Reactors also performed better than others in
two performance measures in two industries. DA-Like performed well in large and
medium sized industries while analyzers performed better in medium to-small industries.
Comparing the performance of strategic consistency and strategic flexibility across
industries it was found that firms with strategic consistency performed better than others
in five industries in all four performance measures whereas firms following flexible
strategies performed better than consistency in five industries for ROA and ROCE. In
two industries flexibility performed better in two industries for ROE and in six industries
for ROS. The model fit for industry-performance relationship is significant for ROA and
ROE while there are insignificant results for ROS and ROCE. Overall, the influence of
industry on two performance measures (ROA and ROE) is significant. However, within
industries, only two industries have significant influence for ROA while only one
industry has significant influence for ROE. Rest of the industries have insignificant
influence on firm performance.
The factorial ANOVA were run for combined impact of strategy, size, and industry on
performance along with the interaction or contingent effect on performance. The results
showed significant influence on overall model fit for all performance measures.
Comparing the influence of strategy, size, and industry on performance, it is proved that
192
strategy is the better predictor of performance than size and industry in three out of four
performance measures. The interaction of strategy and size reveal that large analyzers
and large PA-Like firms outperformed medium and small firms while large DA-Like
outperformed small which outperformed medium DA-Like firms keeping reactors as
benchmark. For strategy and industry interaction, analyzers and DA-Like performed well
in “Information, Communication, and Transportation Services” and “Coke, and Refined
Petroleum Products” industries while prospectors in “Other Non-metallic Mineral
Products” in comparison to reactors who performed well in “Motor Vehichle, Trailors,
and Auto parts” and “Chemicals, Chemical Products, and Pharmaceutical Products”. The
results for interaction of size and strategy show that large firms performed well in “Fuel
and Energy” and “Chemicals, Chemical Products, and Pharmaceutical Products” while
medium firms in “Motor Vehicles, Trailers, and Auto parts” and “Chemicals, Chemical
Products, and Pharmaceutical Products” in comparison to small firms who performed
well in “Information, Communication, and Transportation Services” and “Other Non-
metallic Mineral Products”.
These results are also supported by the earlier research where it was argued that context
matters. Hence strategy-performance relationship is also influenced by the environmental
contingencies (Thornhill & White, 2007). As firm size influence the strategic choice
because of changes in structure, design, and other complexities linked with size of the
firm, industry can also limit managerial influence as it constrains the managers to
proactively design or implement strategy for competitive performance. These responses
to environmental shifts reshape the organizational processes minimizing the role of
managers and strategy.
5.14 Summary
The chapter presented the analysis of results, findings and discussion. The results for
distribution of strategies according to their orientation in terms of: viable versus reactors;
hybrid versus pure; and consistent and flexible versus reactors are presented and
analyzed. The contingency tables along with performance for theses strategic groups are
also presented, analyzed and discussed. The comparison of these groups is made for all
193
performance measures. These grouping were also presented for each industry and for
small, medium, and large firm size. The hypotheses were tested and the results were
summarized. A detailed analysis of single industry (textile) was also made to find the
commonalities and the differences among the results.
The results for multi-industry analysis show that four out of eleven hypotheses are fully
supported by the results. Four hypotheses have major support while one have moderate
support. Only two hypotheses have minor support. Similarly for textile industry, four out
of eight hypotheses are fully supported by the results and three hypotheses have major
support. Only one hypothesis has minor support. This provides the grounds that there is a
support for the assumptions for Miles and Snow in Pakistani environment. Also, the
behavior of strategic types and their performance is comparable and generalizable for
single industry as well as for multi-industry analysis.

194
Chapter 6
Summary and Conclusion
195
6.1 Introduction
The chapter presents the conclusions regarding the objectives of the research, research
questions, and summary of the research. It also include the contributions of the research
for theory, researchers, and practitioners in the field of strategic management. The
limitations of the study are also mentioned along with the opportunities for future
research.
6.2 Summary of the Research
The study aimed to investigate the strategy-performance relationship in a multi-industry
setting. Literature on strategy and performance and contingency theory provides the
theoretical foundation of the research. Miles and snow typology framework was used to
operationalize and classify the strategic orientations of the firms into distinct strategic
groups such as pure and hybrid strategies, consistent, flexible, and reactor strategies.
The specific research questions were: What strategic type organizations chose in solving
their entrepreneurial, engineering, and administrative problems in Pakistan? The
subordinate questions include whether firms perusing pure strategies or hybrid strategies?
Is there consistency in their strategic stance over time or they adapt flexibility or have
inconsistent behavior? How the strategic types perform and is there any significant
difference in the performance of the firms adapting viable and reactor strategies? Is
strategic purity and consistency performing better than hybrid and flexible strategy? Why
firms perform higher than other firms although they are in same industry and are under
similar conditions? Is there any significant contingent effect of firm size and industry on
organizational strategy and performance? And what is the current state of literature
regarding strategy-performance relationships, measures, methodologies, and future
research direction?
The specific objectives of the study to address above research questions were: to develop
a detailed scoring methodology using archived financial data to operationalize the
strategic orientation of the firms by applying the typology of Miles and Snow. In
addition, pure, hybrid, consistent, and flexible strategic groups were to be identified for
extended analysis. A detailed analysis of strategic groups/types and their relationship
196
with performance across firm sizes and industries is performed. A number of hypotheses
for causal relationships of strategy and performance were tested. The contingent or
interactive influence or impact of firm size and industry on strategy and performance was
also investigated.
In this context, the study examined the proportionate presence of the strategic groups
across firm size and across industries. Extensive comparative analysis of performance of
strategic groups/types in multiple industries having different firm size were also made.
Strategic groups based on Miles and Snow’s strategic types, strategic purity and
hybridization, strategic consistency and flexibility, and reactor strategy are
conceptualized and operationalized through scoring method. The presence and
performance of these strategic groups is compared across the industries and across firm
size. The methodological refinements helped in identifying and classifying the reactor
strategy which is usually left out particularly in archived and longitudinal studies.
The prior studies on Miles and Snow typology considered single industry as well as
multi-industries for analysis. One of the issues relating to single industry analysis is the
generalization of the findings while the issues with multi-industry analysis include the
differences in the structure and other dynamics relevant to specific industry due to which
the results may not reflect the true picture. For this purpose, the study analyzed the single
industry as well as multi industry results to find the commonalities and differences in the
results. Most of the findings for multi-industry analysis and single-industry analysis are
similar. However, there are some differences as well. For example, although analyzers
are dominating in both cases followed by DA-Like firms, the percentage of presence of
analyzers is more in textile industry while the percentage for DA-Like is more for multi-
industry analysis. Another difference is that the influence of firm size in textile sector is
minimum as the results are significant for only one performance measure whereas for
multi-industry, the influence of firm size is significant for all performance measures.
Similarly, large firms in multi-industry analysis performed significantly different from
small and medium sized firms while large firms’ performance is significantly different
from others in only one measure. Also, it was found that all firms in textile industry are
adapting some type of hybrid strategies. The findings provide the sufficient evidence that
197
the behavior of strategic types and their performance is comparable and generalizable for
single industry as well as for multi-industry analysis.
6.2.1 Conclusion
The findings indicate that firms in Pakistan adapt hybrid strategies instead of pure
strategies. There are reasonable number of reactor firms as well. Hybrid strategies
performed better than pure strategies. The performance of the defending and analyzing or
balanced strategies is much better than the performance of prospecting strategies. In some
instance, the performance of reactors is also commendable. The firms are equally
distribute for choosing the consistency as well as flexibility in strategic choice i.e. the
number of firms adapting consistency in their strategic choice is almost equal to the firms
opting strategic flexibility. The performance of firms with strategic consistency is not
significantly different from those firms having strategic flexibility. However, both
consistency and flexibility outperformed reactors for all performance measures. Overall,
the performance of flexible strategy firms is slightly higher than the firms with
consistency in strategic choice in three performance measures while the pattern is not the
same within firm size and industries. When individual impact of strategy, size, and
industry on performance was investigated, firm size showed the highest influence on
performance followed by strategy and industry. However, strategy was the best predictor
of performance when all three factors are combined together through interactions.
In contingency predictions, the successful implementation of business strategy relies
heavily on suitable organizational design and structure. Similarly, the firm size influence
the strategic choice because of the incremental complexities linked with the firm as it
grows. Also, the industry peculiarities and dynamics effect the choice of strategic
orientation. Therefore, the choice of a strategic options should be aligned with the
demands of firm size complexities and the industry dynamics in which the firms compete
in order to achieve higher performance. Following these guidelines, this research
investigated the contingent impact of firm size and industry (considered as most
important factors by Mintzberg, 1979) on firm strategy to find out their joint effect on
organizational performance. These contingency predictions were evaluated by
198
determining whether size-strategy interaction, industry-strategy interaction, and size-
industry-strategy interaction term significantly increases the level of explained variation
in a hierarchical regression analysis? The results of hierarchical regression models (Table
5.28) for all four performance measures (ROA, ROE, ROS, and ROCE) indicate the
major support for contingency relationships as the value of R2 increased significantly for
all performance measures with the addition of incremental variable in the base model.
This shows that the contingency perspective hold true in this research. The analysis for
single industry (textile industry) and multi-industry is done separately. The findings of
both analyses helped in generalizations of the results and provide the foundations for
further developments of strategy-structure-performance paradigms where strategy is
categorized as pure, hybrid, consistent, flexible, and reactors.
6.2.2 Contributions and Implications of the Study
The study brings benefits both at the theoretical level and at practical level. The
contributions and implications of the research are divided as: contributions to the
literature; contribution to the researchers; and contributions to the practitioners are
presented below:
6.2.2.1 Contributions and Implications for theory
The research extends the contemporary understanding about the typological
research. The research methodology refined for the identification and
operationalization of strategic types can be replicated where strategic groups are
to be studied. Typological classification is beneficial because the systematic
ordering of core elements of a phenomenon provides the building blocks for
future development in theory.
From a theoretical perspective, the research considers organizational strategy as a
contingency factor, which guides for organizational structure for improved
performance. Firm size and industry are other contingent factors that influence
the strategic choice of the management and also impact the performance. A direct
impact of strategy, size of the firm, and industry on performance is tested. Here,
strategy is classified into various categories such as pure strategies: defenders and

199
prospectors; hybrid strategies: DA-Like, Analyzers, and PA-Like; consistent and
flexible; and reactor strategies. These classifications of strategy and their results
for relationship with performance extends the current debate such as: does
strategic purity matters or organizations should adapt hybrid strategy; does
strategic consistency provides superior performance or organizations should
adapt flexible strategy for improved performance; does reactor is can be some
time a viable strategy or it is a residual term representing no strategy etc.
Hypothesis H2 has partial support in both multi-industry and single industry. The
theoretical implications for these findings suggest that different performance
measures may respond differently for certain strategic types. This is evidence
from the fact that the difference among the viable strategic types is significant for
ROA and ROS and insignificant for ROE and ROCE showing a visible
difference of response towards profit generation. The insignificant difference for
performance measures with capital employed whether in terms of equity or
equity plus long-term debt may imply that some firms are employing more equity
or depending more on long-term debt than required level. Similarly, hypothesis
H6 has minor support in single industry while has full support for multi-industry.
The reason for this dissimilarity can be due to the fact that since the overall
industry competition, industry peculiarities, and homogeneity of the firms’
internal and external characteristics of textile industry remain same across firm
sizes. Therefore, the variation in performance does not vary significantly with
the change in size. The impact of size on performance is different when multi-
industry data is analyzed together. Therefore, the interpretation for such
comparative results sometimes can be misleading. Theoretical discussion should
be generated why there is such behavior of one of the key internal contingent
factors.
Hypothesis H8 and H9 states that the relationships of firm size and industry with
performance are contingent on business strategy. These contingency predictions
were evaluated by determining whether size-strategy interaction, industry-
strategy interaction, and size-industry-strategy interaction term significantly
increases the level of explained variation in a hierarchical regression analysis?
200
The results for hierarchical regression models (Table 5.28), indicate the major
support for contingency relationships as the value of R2 increased significantly
for all performance measures with the addition of incremental variable in the
base model. This shows that the contingency perspective hold true in this
research.
6.2.2.2 Contributions and Implications for Researchers
The proposed scoring methodology will help the researchers in identification of
multiple strategic groups based on varying characteristics of the firms. A standard
scale is developed for classification of pure and hybrid strategic types on a
continuum. Secondly, a mechanism is developed for identification of behavior of
the firms’ strategic orientation over the time to classify the firms into consistent,
flexible, and inconsistent (reactors) types. In this context, this study is the
pioneering work in a longitudinal research. The empirical findings validate the
theoretical underpinning associated with these strategic groups.
The original work of Miles and Snow suggests four mutually exclusive and static
strategic types. In actual, the firms hybridize the pure strategies by combining the
characteristics of pure strategies. Also, when viewed through the lenses of
strategic fit, they are better presented as the changing behavior over the time. This
means that an organization reconfigures its processes and deploys resources in
reply to changes in its internal and external environment. Doing so, the
organization reposition itself into one of the viable strategic types. The
investigation of strategic transition over time and their classification into
consistent, flexible, and specifically reactors provides a new dimension to the
researchers to explore and study the strategy-performance relationship in this
context.
The conceptualization and operationalization of strategic orientation and the
investigation of their relationship with organizational performance acknowledges
the argument for the existence of multiple mutually exclusive strategic groups in
the industries. Hence, various strategic groups can be conceptualized if there exist
a theoretical support for such groups.
201
The study presents a detailed comparative analysis of single-industry and multi
industries in the same settings. The applicability of the methodology in both
settings and the conformity of most of the results provide sufficient evidence to
the researchers who study the firms in multiple industries.
6.2.2.3 Contributions and Implications for Practitioners
It is found that there are very few pure defenders and pure prospectors. This
means that firms hybridize the strategies. However, only hybridization does not
guarantee the better performance. Performance is based on creating the right fit.
Managers should understand these contingencies while creating the right fit for
higher performance.
Given the cultural and environmental characteristics and based on the
performance of certain strategic types, manages in Pakistan are recommended to
go for hybrid strategic choice. Doing so, managers should focus on stable and a
narrow product line to compete on the basis of quality, service, price, and
operational excellence. A balance of innovation and core product feature can be
fruitful for organization to generate higher performance. This can be done by
sticking to a limited but quality product line while carefully analyzing the
competitors moves.
Managers should carefully adapt strategies for new product development,
innovation, and growth. However, such initiatives can be carefully taken in
industries such as “motor vehicles, trailers, and auto parts”; “information,
communication, and transport services”; and “coke and refined petroleum
products”. Therefore, the managers should study the dynamics of these industries
while adapting the prospecting strategies.
For higher performance, managers are recommended to adapt consistent strategy
for large industries such as textile and food industries. On the other hand,
performance can be increased by adapting strategic flexibility in small to medium
level industries such as “fuel and energy” sector. These findings also provide
guidance for government and other regulatory bodies for devising policies to get
maximum fruits for economic development. For example, the government and
202
regulators should stick to a long-term policies for textile and food industries
because the strategic behavior of these industries is consistent to their previously
adapted strategic orientation. These industries are unable to reap the benefits if
the policies at government level are rapidly changing. This may be due to their
slow response or due to the heavy cost involved in the shifting from one strategy
to another in shorter period of time.
6.2.4 Limitations of the Study
There are certain limitation of the study. These limitations are:
The research only operationalized the realized strategy based on past financial
data. The intended strategy (current and future) of the management was not
considered. Hence, there are possibilities that the current intension of the
management about the future strategic orientation may not be aligned with the
strategic orientation found based on past financial data.
Only four ratios or proxies are used to measure the strategic orientation of the
firms. This may not fully reflect the real picture of the firms about their strategic
orientation. The use of more proxies, in addition to these four, may more
accurately explain the strategic orientation and behavior of the firms.
Seven year data was used for analysis and for measuring the strategic behavior of
the firms over the time. Extended data for more years can be used for more
robust results
Organizational performance was measured through financial measures only.
Subjective performance measures can be added with the objective measures to
get clearer picture of the strategic orientation and their relationship with
performance.
Presence of very few pure strategies (prospectors and defenders) makes the
generalization somewhat difficult. Therefore, the results of the study may not
reflect the true understanding about pure strategies.
203
6.2.5 Opportunities for Future Research
The opportunities for future research are:
One of the promising area for theoretical development is to have a renewed
emphasis on typology-driven theorizing. Since, typological classification is
beneficial for developing a systematic order of core elements of a phenomena
which provides the building blocks for theory development.
As suggested by Snow and Ketchen (2014), the application of typologies is
needed in both fundamental and emerging subject areas of organizations and
management. Topics related to fundamental organizational involve organization
structure and context. While the emergent management areas include the topics
that involve control and coordination mechanisms. Future research can be to
develop such typologies that can address the topic like governance structure and
industry dynamics.
More work is needed for operationalization of the strategic types into multiple
groups like was done for this study for investigating strategy-performance
relationship. Currently, this relationship is predominantly investigated through the
application of Miles and Snow Porter’s typologies where pure strategies are
studied.
The findings of the current study can be further investigated by exploratory study
of the selected firms or industries. These studies can incorporate the intention of
the management about strategy and performance, organization capabilities,
organization structure and other characteristics.

204
Chapter 7
References
205
Acquaah, M., & Yasai-Ardekani, M. (2008). Does the implementation of a combination
competitive strategy yield incremental performance benefits? A new perspective
from a transition economy in Sub-Saharan Africa. Journal of Business Research,
61(4), 346–354. https://doi.org/10.1016/j.jbusres.2007.06.021
Afza, T., & Ahmed, N. (2017). Capital Structure , Business Strategy and firm ’ s
performance : Evidence from. European Online Journal of Natural and Social
Sciences, 6(2), 302–328.
Afza, T., Slahudin, C., & Nazir, M. S. (2008). Diversification and Corporate
Performance: An Evaluation of Pakistani Firms. South Asian Journal of
Management, 15(3), 7–18. Retrieved from
http://search.ebscohost.com/login.aspx?direct=true&db=bth&AN=36788796&site=e
host-live
Afzal, S. (2009). Marketing Capability, Strategy and Business Performance in Emerging
market of Pakistan. IUB Journal of Social Sciences and Humanities, 7(2), 88–102.
Ali Ahmad SEBAA. (2010). The Importance of Aligning Managerial Characteristics to
Functional Strtegy in Public Sector Organizations: An Empirical Study of Dubai
Government. University of Bradford.
Amitabh, M., & Gupta, R. K. (2010). Research in strategy-structure-performance
construct: Review of trends, paradigms and methodologies. Journal of Management
and Organization, 16(5), 744–763.
Andrews, R. (1971). The Concept of Corporate Strategy. Homewood, III: Dow Jones -
Irwin.
Anikeeff, M. A., & Sriram, V. (1995). Strategic consistency and performance: an analysis
of real estate developers. Journal of Managerial Issues, 7(4), 435–448.
Arif, F., Azhar, N., & Bayraktar, M. E. (2012). Strategic Management Concepts and
Practices in Pakistan: A Construction Industry Perspective. In Construction
Research Congress 2012 (pp. 1530–1539).
https://doi.org/10.1061/9780784412329.154
Balsam, S., Fernando, G. D., & Tripathy, A. (2011). The impact of firm strategy on
206
performance measures used in executive compensation. Journal of Business
Research, 64(2), 187–193. https://doi.org/10.1016/j.jbusres.2010.01.006
Barney, J. (1991). Firm Resources and Sustained Competitive Advantage. Journal of
Management, 17(1), 99–120. https://doi.org/10.1177/014920639101700108
Baron, R. M., & Kenny, D. A. (1986). The Moderator-Mediator Variable Distinction in
Social Psychological Research: Conceptual, Strategic, and Statistical
Considerations. Alcohol and Alcoholism, 51(6), 1173–1182.
https://doi.org/10.1093/alcalc/34.2.197
Bayraktar, C. A., Hancerliogullari, G., Cetinguc, B., & Calisir, F. (2017). Competitive
strategies , innovation , and firm performance : an empirical study in a developing
economy environment. Technology Analysis and Strategic Management, 29(1), 38–
52. https://doi.org/10.1080/09537325.2016.1194973
Beard, D. W., & Dess, G. G. (1981). Corporate-Level Strategy , Business-Level Strategy
, and Firm Performance. The Academy of Management Journal, 24(4), 663–688.
Bentley, K. A., Omer, T. C., & Sharp, N. Y. (2013). Business Strategy, Financial
Reporting Irregularities, and Audit Effort. Contemporary Accounting Research,
30(2), 780–817. https://doi.org/10.1111/j.1911-3846.2012.01174.x
Best, J., & Kahn, J. (2006). Research in Education. New Dehli: Prentice Hall of India Pvt
Ltd.
Bilenas, J. V, Morgan, J. P., & Bank, C. (2009). PROC RANK and PROC
UNIVARIATE to Rank or Decile Variables. Applications Big and Small: NESUG
2009, 1–16.
Blackmore, K., & Nesbitt, K. (2013). Verifying the Miles and Snow strategy types in
Australian small- and medium-size enterprises. Australian Journal of Management,
38(1), 171–190. https://doi.org/10.1177/0312896212444692
Bo Zhang. (2011). Business Strategies , HRM Policies and Organizational Performance :
Evidence from the Peoples Republic of China by. Cardiff University.
Boyd, B. K., Haynes, K. T., Hitt, M. A., Bergh, D. D., & Ketchen, D. J. (2012).
Contingency hypotheses in strategic management research: Use, disuse, or misuse?
207
Journal of Management (Vol. 38). https://doi.org/10.1177/0149206311418662
BYCO Petrolium. (2015). Long Term Business Financing Strategy For A Pakistan
Business. Retrieved from http://www.icap.org.pk/nfo/pdf/BYCO.pdf
Chaffee, E. E. (1985). Three Models of Strategy. Academy of Management Review,
10(1), 89–98. https://doi.org/10.2307/258215
Chandler, A.D., J. (1962). Strategy and Structure. Cambridge, MA: MIT Press.
Claver-Cortés, E., Pertusa-Ortega, E. M., & Molina-Azorín, J. F. (2012). Characteristics
of organizational structure relating to hybrid competitive strategy: Implications for
performance. Journal of Business Research, 65(7), 993–1002.
https://doi.org/10.1016/j.jbusres.2011.04.012
Conant, J. S., Mokwa, M. P., & Varadarajan, P. R. (1990). Strategic Types, Distinctive
Marketing Competencies and Organizational Performance: A Multiple Measures-
Based Study. Strategic Management Journal, 11(5), 365–383.
D. Ittner, Larcker, D. F., & Rajan, M. V. (1997). The Choice Performance Measures in
Annual Bonus Contracts. The Accounting Review, 72(2), 231–255.
Daft, R. L. (2015). Organization Theory and Design (12th ed.). Cengage Learning.
Damodar Gujarati. (2011). Econometrics by Example. Hampshire RG21 6XS: Palgrave
Macmillan.
Daniel Rajaratnam, & Chonko, L. B. (1995). The Effect of Business Strategy Type on
Marketing Organization Design, Product-market Growth Strategy, Relative
Marketing Effort, and Organization Performance. Journal of Marketing Theory and
Practice, 3(3), 60–75.
Danny Miller. (1990). Icarus Paradox: How Exceptional Companies Bring About Their
own Downfall. New York: Harper Business.
Delbridge, R., & Fiss, P. C. (2013). Editors ’ Comments : Styles of Theorizing and the
Social Organization of Knowledge. Academy of Management Review, 38(3), 325–
331.
Delery, J. E., & Doty, D. H. (1996). Modes of Theorizing in Strategic Human Resource
208
Management : Tests of Universalistic , Contingency , and Configurational
Performance Predictions Author ( s ): John E . Delery and D . Harold Doty
Published by : Academy of Management Stable URL : http://www. The Academy of
Management Journal, 39(4), 802–835. https://doi.org/10.2307/256713
Desarbo, W. S., Benedetto, C. A. Di, Song, M., & Sinha, I. (2005). Revisiting the Miles
and Snow Strategic Framework: Uncovering Interrelationships between Strategic
Types , Capabilities , Environmental Uncertainty , and Firm Performance. Strategic
Management Journal, 26(1), 47–74.
DeSarbo, W. S., Grewal, R., & Wang, R. (2009). Dynamic strategic groups: deriving
spatial evolutionary paths. Strategic Management Journal, 30(13), 1420–1439.
https://doi.org/10.1002/smj.788
Donaldson, L. (1996). For Positivist Organization Theory: Proving the Hard Core.
Cambridge, MA: Cambridge University Press.
Doty, D. H., & Glick, W. H. (1994). Typologies as a Unique Form of Theory Building:
Toward Improved Understanding and Modeling. The Academy of Management
Review, 19(2), 230–251.
Durand, R., Grant, R. M., & Madsen, T. L. (2017). The Expanding Domain of Strategic
Management Research and the Quest for Integration. Strategic Management
Journal, 38(1), 4–16. https://doi.org/10.1002/smj
Eikelenboom, B. (2005). Organizational capabilities and bottom line performance :The
relationship between organizational architecture and strategic performance of
business units in Dutch headquartered multinationals. Universiteit Nyenrode.
Evans, J. D., & Green, C. L. (2000). Marketing Strategy, Constituent Influence, and
Resource Allocation: An Application of the Miles and Snow Typology to Closely
Held Firms in Chapter 11 Bankruptcy. Journal of Business Research, 50(2), 225–
231.
Farjoun, M. (2002). Towards an Organic Perspective on Strategy. Strategic Management
Journal, 23(7), 561–594. https://doi.org/10.1002/smj.239
Fehre, K., Kronenwett, D., & Lindsta, H. (2016). Lost in transaction ? The transfer effect
209
of strategic consistency. Business Research, 9(1), 101–131.
https://doi.org/10.1007/s40685-015-0024-1
Fiss, Peer, C. (2011). Building Better Causal Theories: A Fuzzy Set Approach to
Typologies in Organization Research. Academy of Management Journal, 54(2),
393–420.
Furrer, O., & Thomas, H. (2008). The structure and evolution of the strategic
management field : A content analysis of 26 years of strategic management research.
International Journal of Management Reviews, 10(1), 1–23.
https://doi.org/10.1111/j.1468-2370.2007.00217.x
Gabrielsson, M., Seppala, T., & Gabrielsson, P. (2016). Realizing a hybrid competitive
strategy and achieving superior financial performance while internationalizing in the
high-technology market. Industrial Marketing Management, 54, 141–153.
https://doi.org/10.1016/j.indmarman.2015.07.001
Ghoshal, S. (2003). Miles and Snow : Enduring insights for managers. Academy of
Management Executive, 17(4), 109–114.
Ginsberg, A., & Venkatraman, N. (1985). Contingency Perspectives of Organizational
Strategy: A Critical Review of the Empirical Research. Academy of Management
Review, 10(3), 421–434. https://doi.org/10.2307/258125
Golder, S., Ahmad, S., Norman, G., & Booth, A. (2017). Attitudes Toward the Ethics of
Research Using Social Media: A Systematic Review. Journal of Medical Internet
Research, 19(6).
Government of Pakistan. (2015). Pakistan Textile Policy: 2014-19. Islamabad. Retrieved
from http://www.textile.gov.pk/moti/userfiles1/file/Textile Policy 2014-19.pdf
Government of Pakistan. (2017a). China Pakistan Economic Corridor (CPEC). Retrieved
August 6, 2017, from http://cpec.gov.pk/introduction/1
Government of Pakistan. (2017b). Overview of the Economy. Islamabad.
Gravelle, T. B. (2012). Using SAS to Test, Probe and Display Interaction Effects in
Linear Models. In Northeast SAS Users Group Conference (Vol. 2011, pp. 1–16). 40
University Avenue, Suite 200 Toronto, Ontario: PriceMetrix Inc. Retrieved from
210
www.lexjansen.com/nesug/nesug12/sa/sa08.pdf
Habib, A., & Hasan, M. M. (2017). Business strategy, overvalued equities, and stock
price crash risk. Research in International Business and Finance, 39(January), 389–
405. https://doi.org/10.1016/j.ribaf.2016.09.011
Hambrick, D. C. (1981). Strategic Awareness within Top Management Teams. Strategic
Management Journal, 2(3), 263–279.
Hambrick, D. C. (1982). Environmental Scanning and Organizational Strategy. Strategic
Management Journal, 3(2), 159–174.
Hambrick, D. C. (1983). Some Tests of the Effectiveness and Functional Attributes of
Miles and Snow’s Strateic Types. The Academy of Management Journal, 26(1), 5–
26.
Hambrick, D. C. (1984). Taxonomic Approaches to Studying Strategy : Some Conceptual
and Methodological Issues. Journal Of Management, 10(1), 27–41.
Hambrick, D. C. (2003). On the Staying Power of Defenders , Analyzers , and
Prospectors. The Academy of Management Executive, 17(4), 115–118.
Hambrick, D. C., & David Lei. (1985). Towards an Empirical Prioritization of
Contingency Variables for Business Strategy. The Academy of Management
Journal, 28(4), 763–788.
Hamel, G., & Prahalad, C. . (1989). Strategic Intent.pdf. Haevard Business Review,
(May-June), 63–76.
Haque, N. ul, Idrees, K., & Ahmed, S. (2007). Entrepreneurship in Pakistan. Islamabad.
Harrigan, K. R. (1980). The effect of exit barriers upon strategic flexibility. Strategic
Management Journal, 1(2), 165–176. https://doi.org/10.1002/smj.4250010206
Hassan Askari Rizvi. (2015). The China-Pakistan Economic Corridor: Regional
Cooperation and Socio-Economic Development. Strategic Studies, 34(4), 1–17.
Hassan, M. U., Qureshi, S. U., Sharif, S., & Mukhtar, A. (2013). Impact of Marketing
Strategy Creativity on Organizational Performance via Marketing Strategy
Implementation Effectiveness : Empirical Evidence from Pakistani Organizations.
211
Middle-East Journal of Scientific Research, 16(2), 264–273.
https://doi.org/10.5829/idosi.mejsr.2013.16.02.11641
Hatch, M. J., & Cunliffe, A. L. (2006). Organization Theory: Modern, Symbolic, and
Post Modern Perspectives. Oxford, NY: Oxford University Press.
Hatten, K. J., Schendel, D. E., & Cooper, A. C. (1978). A Strategic Model of the U.S.
Brewing Industry : 1952-1971. Academy of Management Journal, 21(4), 592–660.
Hayes, A. F., Glynn, C. J., & Huge, M. E. (2012). Cautions Regarding the Interpretation
of Regression Coefficients and Hypothesis Tests in Linear Models with Interactions.
Communication Methods and Measures, 6(1), 1–11.
https://doi.org/10.1080/19312458.2012.651415
Herhausen, D., & Morgan, R. E. (2014). A Meta-Analysis of the Antecedents and
Consequences of Strategic Flexibility. Academy of Management Best Papers
Proceedings, 1–6.
Hofer, C. W. (1975). Toward Contingency Theory of Business Strategy. The Academy of
Management Executive, 18(4), 784–810.
Hofstede, G. (2017). The Hofstede Center: Strategy, Culture, Change. Retrieved March
29, 2017, from http://geert-hofstede.com/pakistan.html
Hoskisson, R. E., Michael A. Hitt, William P. Wan, & Daphne Yiu. (1999). Theory and
research in strategic management: Swings of a pendulum. Journal of Management,
25(3), 417–456. https://doi.org/10.1177/014920639902500307
Ingram, T., Kraśnicka, T., Wronka-pośpiech, M., Gtod, G., & Gtod, W. (2016).
Relationships Between Miles and Snow Strategic Types and Organizational
Performance in Polish Production Companies. Journal of Management and Business
Administration, Central Europe, 24(1), 17–45.
https://doi.org/10.7206/jmba.ce.2450-7814.162
Ishrat Hussain. (2016). China Pakistan Econimic Corridor. Defense Journal, 19(6), 13.
James, W. L., & Hatten, K. J. (1995). Further Evidence on the Validity Self Typing
Paragraph Approach: Miles and Snow Strategic Archetypes in Banking. Strategic
Management Journal, 16(2), 161–168.
212
Janjua, S. Y., & Sobia, J. (2010). The Change Drivers in Business Context : Evidence
from Pakistan. World Journal of Management, 2(3), 101–114.
Jennings, D. F., Rajaratnam, D., & Lawrence, F. B. (2003). Strategy-Performance
Relationships In Service Firms : A Test For Equifinality. Journal of Managerial
Issues, 15(2), 208–220.
Jennings, D. F., & Seaman, S. L. (1994). High and Low Levels of Organizational
Adaptation: An Empirical Analysis of Strategy, Structure, and Performance.
Strategic Management Journal, 15(6), 459–475.
Jusoh, R., & Parnell, J. a. (2008). Competitive strategy and performance measurement in
the Malaysian context: An exploratory study. Management Decision, 46(1), 5–31.
https://doi.org/10.1108/00251740810846716
Ketchen, D. J. (2003). Introduction : Raymond E . Miles and Charles C . Snow ’ s
Organizational Strategy , Structure , and Process. Academy of Management
Executive, 17(4), 95–96.
Ketchen, D. J., & Shook, J. and C. L. (1996). The Application of Cluster Analysis in
Strategi Management Research: An Analysis and Critique. Strategic Management
Journal, 17(6), 441–458.
Khan, S. N., Zeeshantahir, M., & Zafar, S. (2016). Strategy Formulation , Strategy
Content and Performance : Empirical Evidence From Private Sector. Pakistan
Business Review, 18(2), 357–376.
Kim, W. C., & Mauborgne, R. (2009). How Strategy Shapes Structure. Haevard Business
Review, (September), 1–12.
Koch, R. (2011). Financial Time Guide to Strategy: How to Create, Persue and Deliver a
Winning Strategy (Fourth). Edenburgh Gate, Harlow CM20 2JE: Pearson Education
Ltd.
Koseoglu, M. A., Topaloglu, C., Parnell, J. A., & Lester, D. L. (2013). Linkages among
business strategy , uncertainty and performance in the hospitality industry : Evidence
from an emerging economy. International Journal of Hospitality Management,
34(9), 81–91. https://doi.org/10.1016/j.ijhm.2013.03.001
213
Lamberg, J.-A., Tikkanen, H., & Nokelainen, T. (2009). Competitive Dynamics,
Strategic Consistency, and Oorganizational Survival. Strategic Management
Journal, 30(1), 45–60. https://doi.org/10.1002/smj
Lex Donaldson. (2001). The contingency theory of organizations. Thousand Oaks, CA:
Sage.
Liang, X., Musteen, M., & Datta, D. K. (2009). Strategic Orientation and the Choice of
Foreign Market Entry Mode: An Empirical Examination. Management International
Review, 49(3), 269–290. https://doi.org/10.1007/S11575-009-0143-Z
Lin, C., Tsai, H.-L., & Wu, J.-C. (2014). Collaboration strategy decision-making using
the Miles and Snow typology. Journal of Business Research, 67(9), 1979–1990.
https://doi.org/10.1016/j.jbusres.2013.10.013
Luoma, M. A. (2015). Revisiting the strategy-performance linkage: An application of an
empirically derived typology of strategy content areas. Management Decision,
53(5), 1083–1106.
Madanoglu, M., Okumus, F., & Avci, U. (2014). Building a case against strategic
equifinality: Hybrid Ideal Type Service Organizations in a Developing Country.
Management Decision, 52(6), 1174–1193. https://doi.org/10.1108/MD-03-2013-
0131
Malik, O. R., & Kotabe, M. (2009). Dynamic Capabilities , Government Policies , and
Performance in Firms from Emerging Economies : Evidence from India and
Pakistan. Journal of Management Studies, 46(3), 421–450.
Malik, S. Z. (2014). Strategic Change and Organizational Reforms: Case of a Pakistani
University. Journal of Research and Reflections in Education, 8(1), 34–47.
Manev, I. M., Manolova, T. S., Harkins, J. A., & Gyoshev, B. S. (2015). Are pure or
hybrid strategies right for new ventures in transition economies? International Small
Business Journal, 33(8), 951–973. https://doi.org/10.1177/0266242614550322
March, J. G. (1991). Exploration and Exploitation in Organizational Learning.
Organization Science, 2(1), 71–87.
Mariyani Ahmad Husairi. (2014). Imitative market Entry Strategies: The Role of
214
Strategic Orientation, Resources, Capabilities, and Absorptive Capacity. Cardiff
University.
Martín-Alcázar, F., Romero-Fernández, P. M., & Sánchez-Gardey, G. (2005). Strategic
human resource management: Integrating the universalistic, contingent,
configurational and contextual perspectives. International Journal of Human
Resource Management, 16(5), 633–659.
https://doi.org/10.1080/09585190500082519
Mary k. Coulter. (1998). Strategic Management in Action. New Jersey 074: Prentice-Hall
Inc. Upper Saddle River.
Matyusz, Z. (2012). The effect of contingency factors on the use of manufacturing
practices and operations performance. PhD Thesis. Corvinus University of
Budapest Institute.
Mcdaniel, S. W., & Kolari, J. W. (1987a). Implications Marketing Strategy and of the
Strategic Typology. Journal of Marketing, 51(4), 19–30.
Mcdaniel, S. W., & Kolari, J. W. (1987b). Marketing Strategy Implications of the Miles
and Snow Strategic Typology. Journal of Marketing, 51(4), 19–30.
Micheal Treacy, & Fred Wiersema. (1995). The Discipline of Market Leaders: Chose
Your Customers, Narrow our Focus, Dominate Your Market. Reading, MA:
Addison-Wesley.
Miles, R. E., & Snow, C. C. (1978). Organizational Strategy, Structure and Process.
New York: MacGraw Hill.
Miles, R. E., Snow, C. C., Meyer, A. D., & Coleman Jr, H. J. (1978). Organizational
Strategy, Structure and Process. Academy of Management Review, 3(3), 546–562.
Mintzberg, H. (1978). Patterns in Strategy Formation. Management Science, 24, 934–
948.
Moss, T. W., Payne, G. T., & Moore, C. B. (2014). Strategic Consistency of Exploration
and Exploitation in Family Businesses. Family Business Review, 27(1), 51–71.
https://doi.org/10.1177/0894486513504434
215
Murthi, B. P. ., Rasheed, A. A., & Goll, I. (2013). An Empirical Analysis of Strategic
Groups in the Airline Industry using Latent Class Regressions. Managerial and
Decision Economics, 34(2), 59–73. https://doi.org/10.1002/mde
Nazir, M. S., & Afza, T. (2009). Impact of Aggressive Working Capital Management
Policy on Firms ’ Profitability Impact of Aggressive Working Capital Management
Policy on Firms ’ Profitability. IUP Journal of Applied Finance, 15(8), 19–31.
Olson, E. M., Slater, S. F., & Hult, G. T. M. (2005). The Performance Implication of Fit
among Business Strategy , Marketing Organization Structure and Strategic
Behavior. Journal of Marketing, 69(3), 49–65.
Ostos, J., Hinderer, H., & Bravo, E. (2017). Relationship between the Business
Environment and Business Strategy Types : Evidence in Peruvian Companies.
Universidad & Empresa, 19(32), 61–86.
Ouakouak, M. L., & Ammar, O. (2015). How does strategic flexibility pay off in terms of
financial performance ? International Journal of Business Performance
Management, 16(4), 442–456.
Pakistan Economic Survey. (2017). Islamabad: Finance Division, Government of
Pakistan.
Park, H. M. (2009). Linear Regression Models for Panel Data Using SAS , Stata
,LIMDEP, and SPSS. Bloomington, IN 47408.
Parnell, J. A. (1997). New Evidence in the Generic Strategy and Business Performance
Debate : A Research Note. British Journal of Management, 8(2), 175–181.
Parnell, J. A. (2005). Strategic philosophy and management level. Management Decision,
43(2), 157–170. https://doi.org/10.1108/00251740510581894
Parnell, J. A. (2008). Strategy execution in emerging economies: assessing strategic
diffusion in Mexico and Peru. Management Decision, 46(9), 1277–1298.
https://doi.org/10.1108/00251740810911948
Parnell, J. A. (2010). Strategic clarity, business strategy and performance. Journal of
Strategy and Management, 3(4), 304–324.
https://doi.org/10.1108/17554251011092683
216
Parnell, J. A. (2011a). Competitive strategy orientation in Egypt and Peru. African
Journal of Business Management, 5(14), 5489–5499.
https://doi.org/10.5897/AJBM10.486
Parnell, J. A. (2011b). Strategic capabilities, competitive strategy, and performance
among retailers in Argentina, Peru and the United States. Management Decision,
49(1), 139–155. https://doi.org/10.1108/00251741111094482
Parnell, J. A., Koseoglu, M. A., Long, Z., & Spillan, J. E. (2012). Competitive Strategy,
Uncertainty, and Performance: An Exploratory Assessment of China and Turkey.
Journal of Transnational Management, 17(2), 91–117.
https://doi.org/10.1080/15475778.2012.676957
Parnell, J. A., & Lester, D. L. (2003). Towards a philosophy of strategy: reassessing five
critical dilemmas in strategy formulation and change. Strategic Change, 12(6), 291–
303. https://doi.org/10.1002/jsc.639
Parnell, J. A., Lester, D. L., Long, Z., & Köseoglu, M. A. (2012). How environmental
uncertainty affects the link between business strategy and performance in SMEs:
Evidence from China, Turkey, and the USA. Management Decision, 50(4), 546–
568. https://doi.org/10.1108/00251741211220129
Parnell, J. A., Long, Z., & Lester, D. (2015). Competitive strategy, capabilities and
uncertainty in small and medium sized enterprises (SMEs) in China and the United
States. Management Decision, 53(2), 402–431.
Parnell, J. A., & Wright, P. (1993). Generic Strategy and Performance: an Empirical Test
of the Miles and Snow Typology. British Journal of Management, 4(1), 29–36.
Pasta, D. J. (2011). Those Confounded Interactions : Building and Interpreting a Model
with Many Potential Confounders and Interactions. In SAS Global Forum (pp. 1–
13). San Francisco, CA: SAS Institute Inc. USA.
Pertusa-Ortega, E. M., Molina-AzorÃn, J. F., & Claver-Cortes, E. (2009). Competitive
Strategies and Firm Performance: a Comparative Analysis of Pure, Hybrid and
Stuck-in-the-middle Strategies in Spanish Firms. British Journal of Management,
20(4), 508–523. https://doi.org/10.1111/j.1467-8551.2008.00597.x
217
Pertusa-Ortega, E. M., Molina-Azorín, J. F., & Claver-Cortés, E. (2010). Competitive
strategy, structure and firm performance. Management Decision, 48(8), 1282–1303.
https://doi.org/10.1108/00251741011076799
Pleshko, L. P., Heiens, R. A., & Peev, P. (2014). The impact of strategic consistency on
market share and ROA. International Journal of Bank Marketing, 32(3), 176–193.
https://doi.org/10.1108/IJBM-06-2013-0057
Porter, M. E. (1980). Competitive Strategy. New York: The Free Press.
Porter, M. E., & Roach, S. S. (1996). What is Strategy ? Haevard Business Review,
(November-December), 61–78.
Premal P. Vora. (2008). Easy Rolling Statistics with PROC EXPAND Penn State
Harrisburg , Middletown , PA . SAS Global Forum 2008 Applications Development,
1–6.
Proff, H. (2000). Hybrid strategies as a strategic challenge — the case of the German
automotive industry. Omega, 28(5), 541–553. https://doi.org/10.1016/S0305-
0483(00)00018-9
Review. (2018a). Does strategic purity matter?: How strategic typology affects
organizational performance. Strategic Direction, 34(1), 22–24.
https://doi.org/10.1108/SD-10-2017-0154
Review. (2018b). How to enhance performance effectiveness: Finding the right strategy
type. Strategic Direction, 34(24–6). https://doi.org/10.1108/SD-11-2017-0169
Ritzinger, L. (2015). The China-Pakistan Economic Corridor Regional Dynamics and
China’s Geopolitical Ambitions. The National Bureau of Asian Research Journal,
10(2), 1–4.
Robbins, Stephen P., Barnwell, N. (2006). Organisation Theory: Concepts and Cases
(5th ed.). Pearson Academic.
Rozell, D. E., & Terpstra Elizbeth J. (1993). The Relationship of Staffing Practices to
Organizational Level Measures of Performance. Personnel Psychology, 46, 8–27.
Salavou, H. E. (2013). Hybrid strategies in Greece: a pleasant surprise. European
218
Business Review, 25(3), 301–314. https://doi.org/10.1108/09555341311314834
Salavou, H. E. (2015). Competitive strategies and their shift to the future. European
Business Review, 27(1), 80–99.
Sanchez, R. O. N. (1995). Strategic Competition in Product Flexibility. Strategic
Management Journal, 16(S1), 135–159.
Sarac, M., Ertan, Y., & Yucel, E. (2014). How Do Business Strategies Predict Firm
Performance ? An Investigation On Borsa Istanbul 100 Index. The Journal of
Accounting and Finance, 61(1), 121–134.
SAS Inc. (2017). About SAS. Retrieved April 1, 2016, from
https://www.sas.com/en_us/company-information.html
SBP. (2018). Summary of Foreign Investment in Pakistan. Karachi. Retrieved from
http://www.sbp.org.pk/ecodata/NetinflowSummary.pdf
Segev, E. (1989). A Systematic Comparative Analysis and Synthesis of Two Business-
Level Strategic Typologies. Strategic Management Journal, 10(5), 487–505.
Shah, S. A. M., & Amjad, S. (2011). Cultural Diversity in Pakistan : National vs
Provincial. Mediterranean Journal of Social Sciences, 2(2), 331–344.
Shah, S., Tahir, S. H., Anwar, J., & Ahmad, M. (2016). Does Size Matter in Determining
Firms ’ Performance? A Comparative Analysis of Listed Companies. City
University Research Journal, 06(02), 344–353.
Short, J. C., Jr., D. J. K., Palmer, T. B., & Hult, G. T. M. (2007). Firm Strategic Group,
and Industry Influence on Performance. Strategic Management Journal, 28(2), 147–
167.
Shortell, S. M., & Zajac, E. J. (1990). Perceptual and Archival Measures of Miles and
Snow’s Strategic Types: A Comprehensive Assesment of Reliability and Validity.
The Academy of Management Journal, 33(4), 817–832.
Slater, F., Olson, E. m., & Finnegan, C. (2011). Business strategy , marketing
organization culture , and performance. Marketting Letters, 22(3), 227–242.
https://doi.org/10.1007/sl
219
Slater, S. F., & Zwirlein, T. J. (1996). The Structure of Financial Strategy : Patterns in
Financial Decision Making. Managerial and Decision Economics, 17(3), 253–266.
Smith, K. G., Guthrie, I. P., Chen, M., Gannon, M., Olian, J., & Miller, A. (1986). Miles
and Snow ’ s Typology of Strategy , Organizational Size and Organizational
Performance. Academy of Management Proceedings, 33(1), 45–49.
Smith, K. G., Guthrie, J. P., & Chen, M. (1989). Strategy, Size and Performance.
Organization Studies, 10(1), 63–81.
Snow, C. C., & David J. Ketchen, J. (2014). Typology-Driven Theorizing : A Response
to Delbridge and Fiss. Academy of Management Review, 39(2), 231–233. Retrieved
from AR14
Snow, C. C., & Hambrick, D. C. (1980). Measuring Organizational Strategies : Some
Theoretical and Methodological Problems. Academy of Management Review, 5(4),
527–538.
Snow, C. C., & Hrebiniak, L. G. (1980). Strategy , Distinctive Competence , and
Organizational Performance. Administrative Science Quarterly, 25(2), 317–336.
State Bank of Pakistan. (2014). Financial Statements Analysis of Companies (Non-
Financial) listed at Karachi Stock Exchange. Karachi.
Susana C. S. F. Rodrigues. (2002). Business Strtegy and Organizational Performance: An
Analysis of the Portuguese Industry. University of Wolverhampton.
Tahir, M., & Anuar, M. B. A. (2015). The determinants of working capital management
and firms performance of textile sector in Pakistan. Quality Quantity, 49, 1–14.
Tansuhaj, R., & Grewal and Patriya. (2001). Building Organizational Capabilities for
Managing Economic Crisis : The Role of Market Orientation and Strategic
Flexibility. Jpurnal of Marketing, 65(2), 67–80.
Thomas, A. S., & Ramaswamy, K. (1996). Matching Managers to Strategy: Further Tests
of the Miles and Snow Typology. British Journal of Management, 7(3), 247–261.
https://doi.org/10.1111/j.1467-8551.1996.tb00118.x
Thornhill, S., & White, R. E. (2007). Stratigic Purity: A Multy-Industry Evaluation Of
220
Pure vs. Hybrid Business Strategies. Strategic Management Journal, 28(5), 553–
561. https://doi.org/10.1002/smj.606
Tripathy, J. P. (2013). Secondary data analysis: Ethical issues and challenges. Iranian
Journal of Public Health, 42(12), 1478–1479.
Ven, A. H. Van De, Ganco, M., & Hinings, C. R. (2013). Returning to the Frontier of
Contingency Theory of Organizational and Institutional Designs. The Academy of
Management Annals, 7(1), 393–440. https://doi.org/10.1080/19416520.2013.774981
Walliman, N. (2011). Research Methods (1st ed.). New York, NY 10016: Routledge.
Wasserman, N. (2008). Revisiting the Strategy , Structure , and Performance Paradigm :
The Case of Venture Capital. Organization Science, 19(2), 241–259.
Wilden, Ralf, Gudergan, Siegfried, P., Nielsen, Bo, B., & Lings, I. (2013). Dynamic
Capabilities and Performance : Strategy , Structure and Environment. Long Range
Planning, 46(1–2), 72–96.
Woodside, A. G., & Sullivan, D. P. (1999). Assessing Relationships among Strategic
Types, Distinctive Marketing Competencies, and Organizational Performance.
Journal of Business Research, 45(2), 135–146.
World Bank. (2013). Enterprise Surveys: Pakistan Country Profile 2013. Retrieved July
1, 2016, from http://data.worldbank.org/country/pakistan
World Bank. (2017). Doing Business 2017: Economy Profile 2017 Pakistan. Washington
DC. https://doi.org/10.1596/978-1-4648-0948-4
Zahra, S. A. (1987). Corporate strategic types, environmental perceptions, managerial
philosophies, and goals: An empirical study. Akron Blusiness and Economic Review,
18(2), 64–77.
Zahra, S. A., & Pearce II, J. A. (1990). Research Evidence on Miles and Snow Typology.
Journal Of Management, 16(4), 751–768.
Zamani, S., Parnell, J. A., Labbaf, H., & O’Regan, N. (2013). Strategic Change and
Decision Making in an Emerging Nation: An Exploratory Assesment of Iranian
Manufacturing Firms. Strategic Change, 22(5–6), 355–370.

221
https://doi.org/10.1002/jsc

222
Appendices
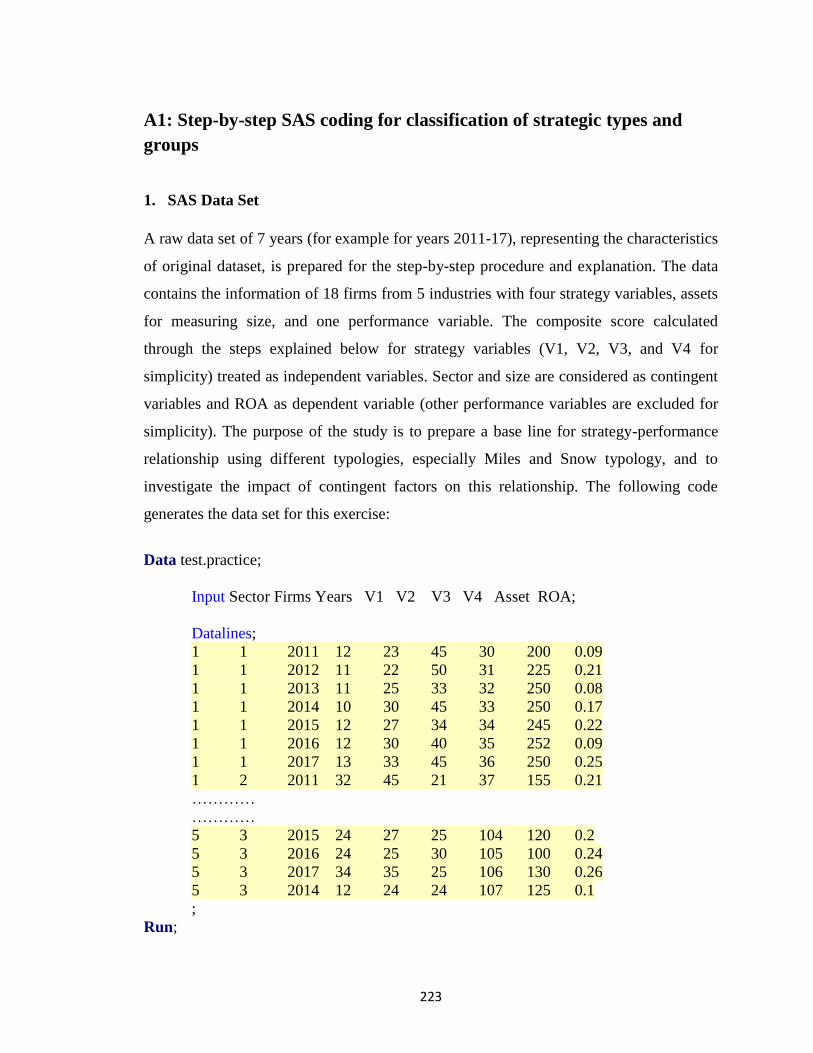
223
A1: Step-by-step SAS coding for classification of strategic types and
groups
1. SAS Data Set
A raw data set of 7 years (for example for years 2011-17), representing the characteristics
of original dataset, is prepared for the step-by-step procedure and explanation. The data
contains the information of 18 firms from 5 industries with four strategy variables, assets
for measuring size, and one performance variable. The composite score calculated
through the steps explained below for strategy variables (V1, V2, V3, and V4 for
simplicity) treated as independent variables. Sector and size are considered as contingent
variables and ROA as dependent variable (other performance variables are excluded for
simplicity). The purpose of the study is to prepare a base line for strategy-performance
relationship using different typologies, especially Miles and Snow typology, and to
investigate the impact of contingent factors on this relationship. The following code
generates the data set for this exercise:
Data test.practice;
Input Sector Firms Years V1 V2 V3 V4 Asset ROA;
Datalines;
1 1 2011 12 23 45 30 200 0.09
1 1 2012 11 22 50 31 225 0.21
1 1 2013 11 25 33 32 250 0.08
1 1 2014 10 30 45 33 250 0.17
1 1 2015 12 27 34 34 245 0.22
1 1 2016 12 30 40 35 252 0.09
1 1 2017 13 33 45 36 250 0.25
1 2 2011 32 45 21 37 155 0.21
…………
…………
5 3 2015 24 27 25 104 120 0.2
5 3 2016 24 25 30 105 100 0.24
5 3 2017 34 35 25 106 130 0.26
5 3 2014 12 24 24 107 125 0.1
;
Run;
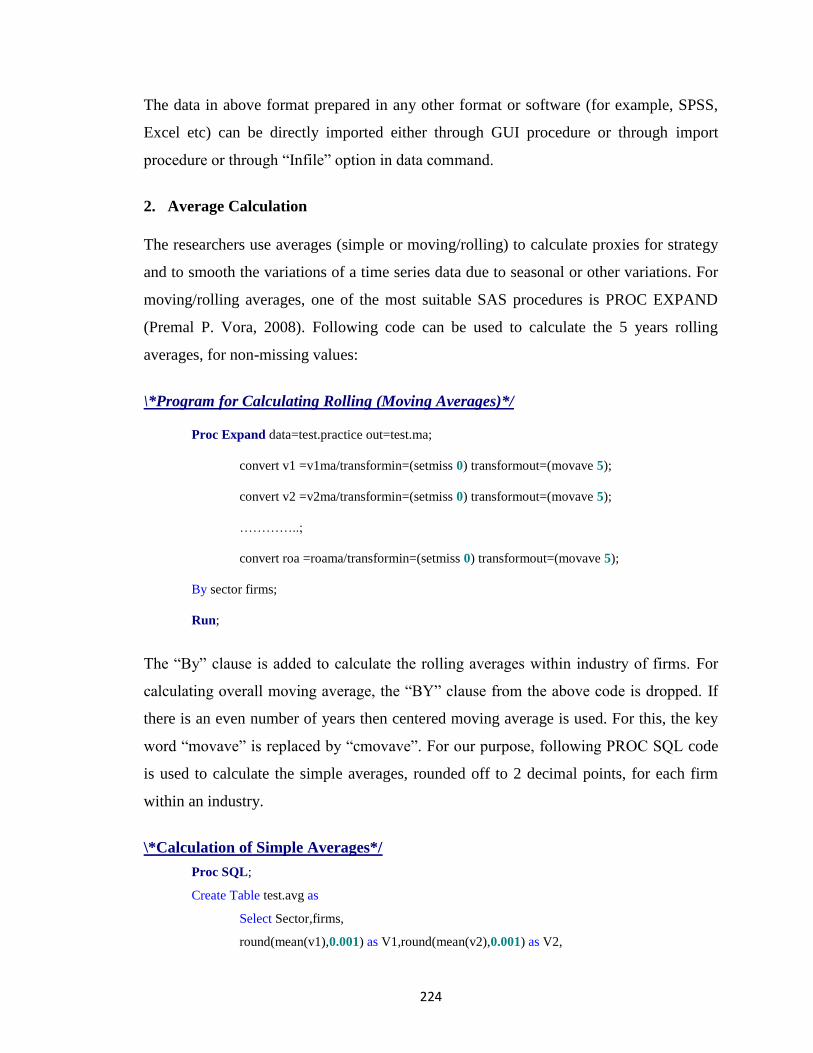
224
The data in above format prepared in any other format or software (for example, SPSS,
Excel etc) can be directly imported either through GUI procedure or through import
procedure or through “Infile” option in data command.
2. Average Calculation
The researchers use averages (simple or moving/rolling) to calculate proxies for strategy
and to smooth the variations of a time series data due to seasonal or other variations. For
moving/rolling averages, one of the most suitable SAS procedures is PROC EXPAND
(Premal P. Vora, 2008). Following code can be used to calculate the 5 years rolling
averages, for non-missing values:
\*Program for Calculating Rolling (Moving Averages)*/
Proc Expand data=test.practice out=test.ma;
convert v1 =v1ma/transformin=(setmiss 0) transformout=(movave 5);
convert v2 =v2ma/transformin=(setmiss 0) transformout=(movave 5);
…………..;
convert roa =roama/transformin=(setmiss 0) transformout=(movave 5);
By sector firms;
Run;
The “By” clause is added to calculate the rolling averages within industry of firms. For
calculating overall moving average, the “BY” clause from the above code is dropped. If
there is an even number of years then centered moving average is used. For this, the key
word “movave” is replaced by “cmovave”. For our purpose, following PROC SQL code
is used to calculate the simple averages, rounded off to 2 decimal points, for each firm
within an industry.
\*Calculation of Simple Averages*/
Proc SQL;
Create Table test.avg as
Select Sector,firms,
round(mean(v1),0.001) as V1,round(mean(v2),0.001) as V2,
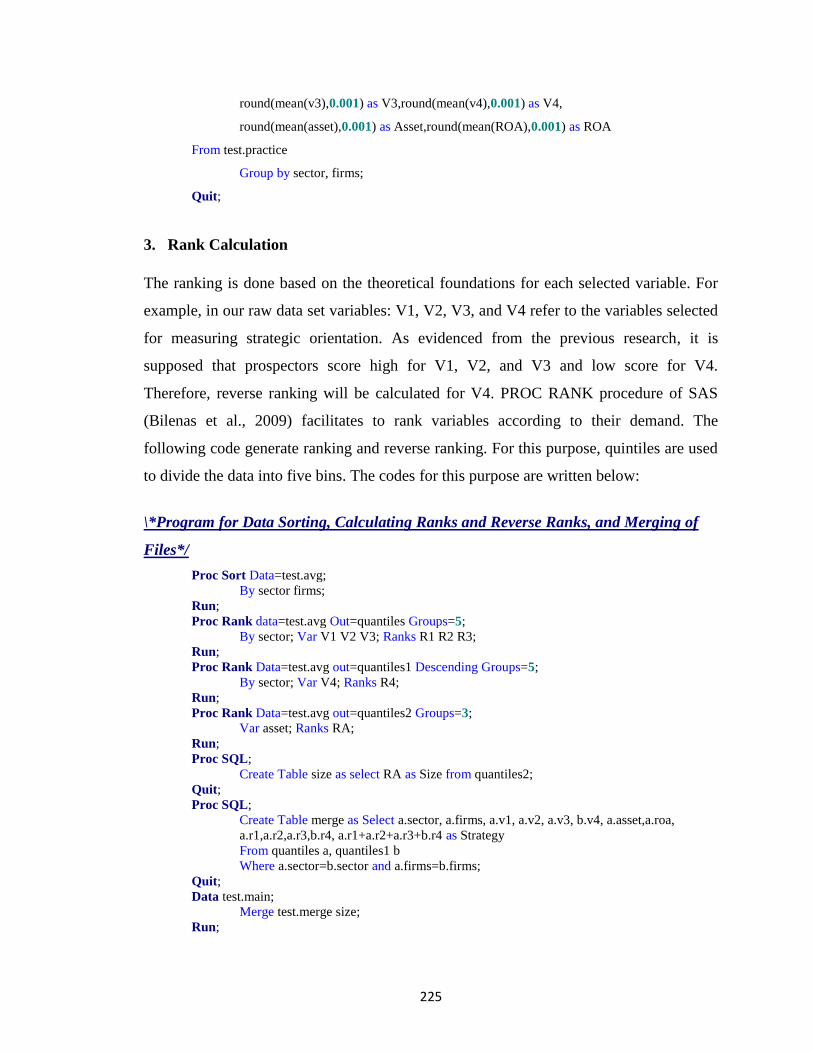
225
round(mean(v3),0.001) as V3,round(mean(v4),0.001) as V4,
round(mean(asset),0.001) as Asset,round(mean(ROA),0.001) as ROA
From test.practice
Group by sector, firms;
Quit;
3. Rank Calculation
The ranking is done based on the theoretical foundations for each selected variable. For
example, in our raw data set variables: V1, V2, V3, and V4 refer to the variables selected
for measuring strategic orientation. As evidenced from the previous research, it is
supposed that prospectors score high for V1, V2, and V3 and low score for V4.
Therefore, reverse ranking will be calculated for V4. PROC RANK procedure of SAS
(Bilenas et al., 2009) facilitates to rank variables according to their demand. The
following code generate ranking and reverse ranking. For this purpose, quintiles are used
to divide the data into five bins. The codes for this purpose are written below:
\*Program for Data Sorting, Calculating Ranks and Reverse Ranks, and Merging of
Files*/
Proc Sort Data=test.avg;
By sector firms;
Run;
Proc Rank data=test.avg Out=quantiles Groups=5;
By sector; Var V1 V2 V3; Ranks R1 R2 R3;
Run;
Proc Rank Data=test.avg out=quantiles1 Descending Groups=5;
By sector; Var V4; Ranks R4;
Run;
Proc Rank Data=test.avg out=quantiles2 Groups=3;
Var asset; Ranks RA;
Run;
Proc SQL;
Create Table size as select RA as Size from quantiles2;
Quit;
Proc SQL;
Create Table merge as Select a.sector, a.firms, a.v1, a.v2, a.v3, b.v4, a.asset,a.roa,
a.r1,a.r2,a.r3,b.r4, a.r1+a.r2+a.r3+b.r4 as Strategy
From quantiles a, quantiles1 b
Where a.sector=b.sector and a.firms=b.firms;
Quit;
Data test.main;
Merge test.merge size;
Run;
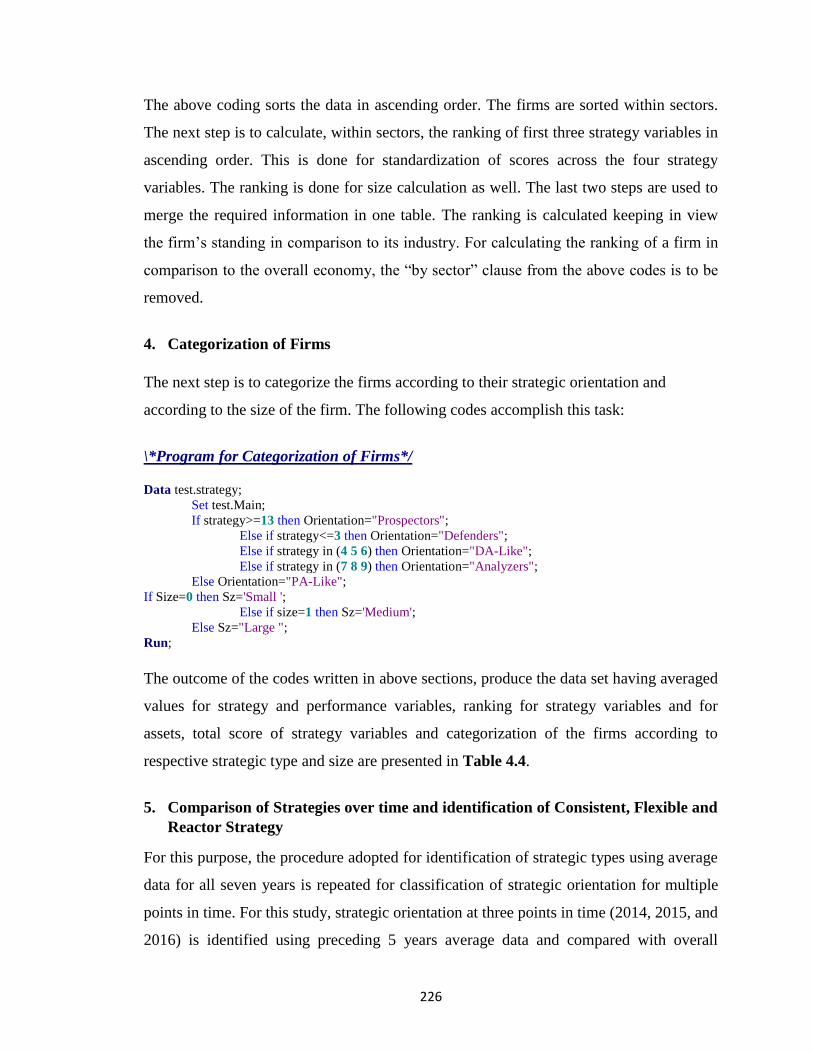
226
The above coding sorts the data in ascending order. The firms are sorted within sectors.
The next step is to calculate, within sectors, the ranking of first three strategy variables in
ascending order. This is done for standardization of scores across the four strategy
variables. The ranking is done for size calculation as well. The last two steps are used to
merge the required information in one table. The ranking is calculated keeping in view
the firm’s standing in comparison to its industry. For calculating the ranking of a firm in
comparison to the overall economy, the “by sector” clause from the above codes is to be
removed.
4. Categorization of Firms
The next step is to categorize the firms according to their strategic orientation and
according to the size of the firm. The following codes accomplish this task:
\*Program for Categorization of Firms*/
Data test.strategy;
Set test.Main;
If strategy>=13 then Orientation="Prospectors";
Else if strategy<=3 then Orientation="Defenders";
Else if strategy in (4 5 6) then Orientation="DA-Like";
Else if strategy in (7 8 9) then Orientation="Analyzers";
Else Orientation="PA-Like";
If Size=0 then Sz='Small ';
Else if size=1 then Sz='Medium';
Else Sz="Large ";
Run;
The outcome of the codes written in above sections, produce the data set having averaged
values for strategy and performance variables, ranking for strategy variables and for
assets, total score of strategy variables and categorization of the firms according to
respective strategic type and size are presented in Table 4.4.
5. Comparison of Strategies over time and identification of Consistent, Flexible and
Reactor Strategy
For this purpose, the procedure adopted for identification of strategic types using average
data for all seven years is repeated for classification of strategic orientation for multiple
points in time. For this study, strategic orientation at three points in time (2014, 2015, and
2016) is identified using preceding 5 years average data and compared with overall
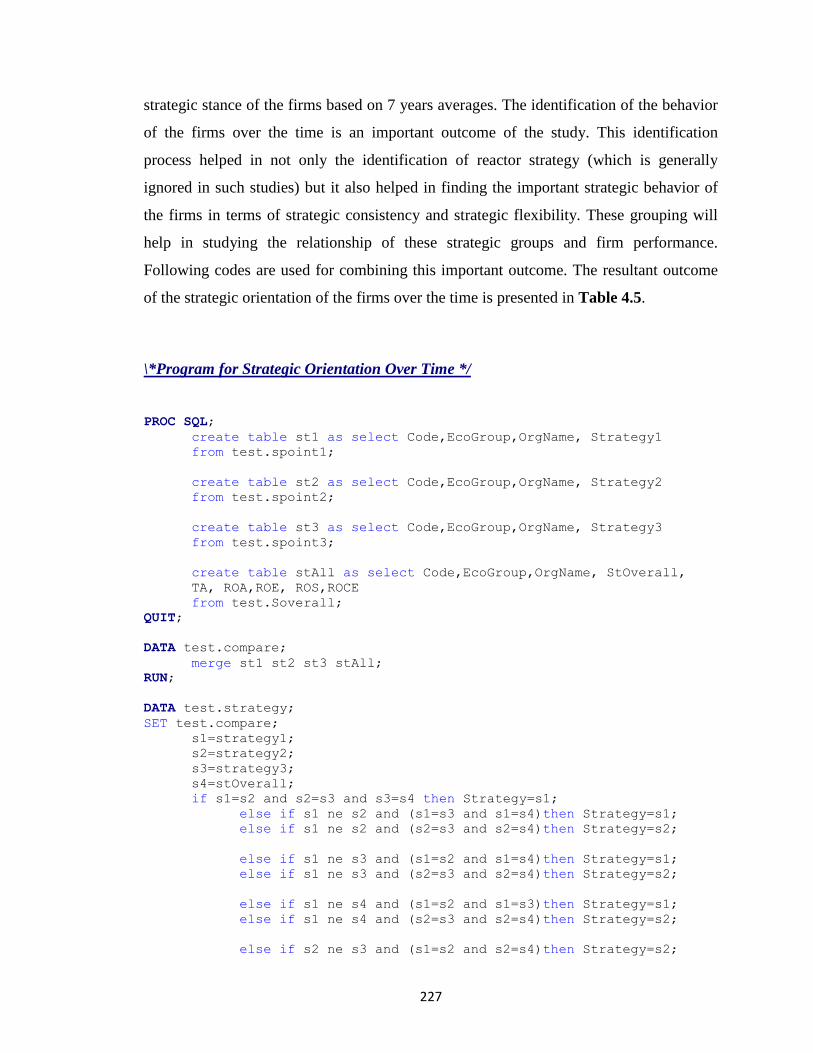
227
strategic stance of the firms based on 7 years averages. The identification of the behavior
of the firms over the time is an important outcome of the study. This identification
process helped in not only the identification of reactor strategy (which is generally
ignored in such studies) but it also helped in finding the important strategic behavior of
the firms in terms of strategic consistency and strategic flexibility. These grouping will
help in studying the relationship of these strategic groups and firm performance.
Following codes are used for combining this important outcome. The resultant outcome
of the strategic orientation of the firms over the time is presented in Table 4.5.
\*Program for Strategic Orientation Over Time */
PROC SQL;
create table st1 as select Code,EcoGroup,OrgName, Strategy1
from test.spoint1;
create table st2 as select Code,EcoGroup,OrgName, Strategy2
from test.spoint2;
create table st3 as select Code,EcoGroup,OrgName, Strategy3
from test.spoint3;
create table stAll as select Code,EcoGroup,OrgName, StOverall,
TA, ROA,ROE, ROS,ROCE
from test.Soverall;
QUIT;
DATA test.compare;
merge st1 st2 st3 stAll;
RUN;
DATA test.strategy;
SET test.compare;
s1=strategy1;
s2=strategy2;
s3=strategy3;
s4=stOverall;
if s1=s2 and s2=s3 and s3=s4 then Strategy=s1;
else if s1 ne s2 and (s1=s3 and s1=s4)then Strategy=s1;
else if s1 ne s2 and (s2=s3 and s2=s4)then Strategy=s2;
else if s1 ne s3 and (s1=s2 and s1=s4)then Strategy=s1;
else if s1 ne s3 and (s2=s3 and s2=s4)then Strategy=s2;
else if s1 ne s4 and (s1=s2 and s1=s3)then Strategy=s1;
else if s1 ne s4 and (s2=s3 and s2=s4)then Strategy=s2;
else if s2 ne s3 and (s1=s2 and s2=s4)then Strategy=s2;
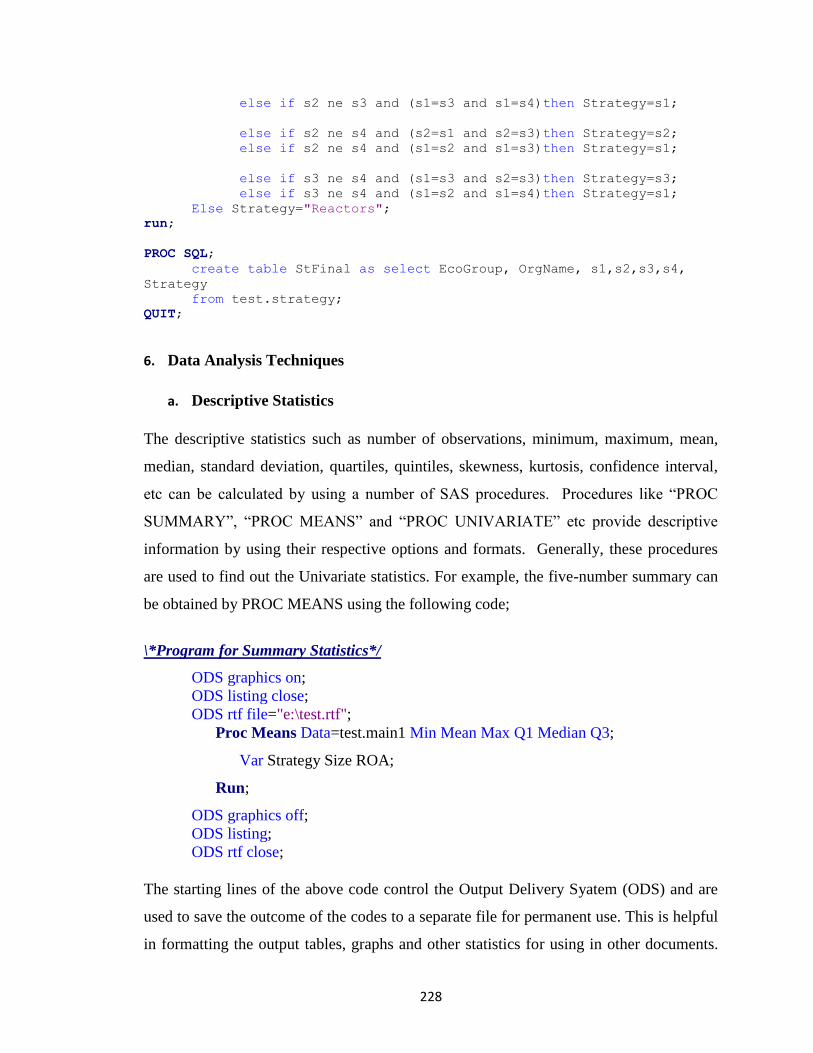
228
else if s2 ne s3 and (s1=s3 and s1=s4)then Strategy=s1;
else if s2 ne s4 and (s2=s1 and s2=s3)then Strategy=s2;
else if s2 ne s4 and (s1=s2 and s1=s3)then Strategy=s1;
else if s3 ne s4 and (s1=s3 and s2=s3)then Strategy=s3;
else if s3 ne s4 and (s1=s2 and s1=s4)then Strategy=s1;
Else Strategy="Reactors";
run;
PROC SQL;
create table StFinal as select EcoGroup, OrgName, s1,s2,s3,s4,
Strategy
from test.strategy;
QUIT;
6. Data Analysis Techniques
a. Descriptive Statistics
The descriptive statistics such as number of observations, minimum, maximum, mean,
median, standard deviation, quartiles, quintiles, skewness, kurtosis, confidence interval,
etc can be calculated by using a number of SAS procedures. Procedures like “PROC
SUMMARY”, “PROC MEANS” and “PROC UNIVARIATE” etc provide descriptive
information by using their respective options and formats. Generally, these procedures
are used to find out the Univariate statistics. For example, the five-number summary can
be obtained by PROC MEANS using the following code;
\*Program for Summary Statistics*/
ODS graphics on;
ODS listing close;
ODS rtf file="e:\test.rtf";
Proc Means Data=test.main1 Min Mean Max Q1 Median Q3;
Var Strategy Size ROA;
Run;
ODS graphics off;
ODS listing;
ODS rtf close;
The starting lines of the above code control the Output Delivery Syatem (ODS) and are
used to save the outcome of the codes to a separate file for permanent use. This is helpful
in formatting the output tables, graphs and other statistics for using in other documents.
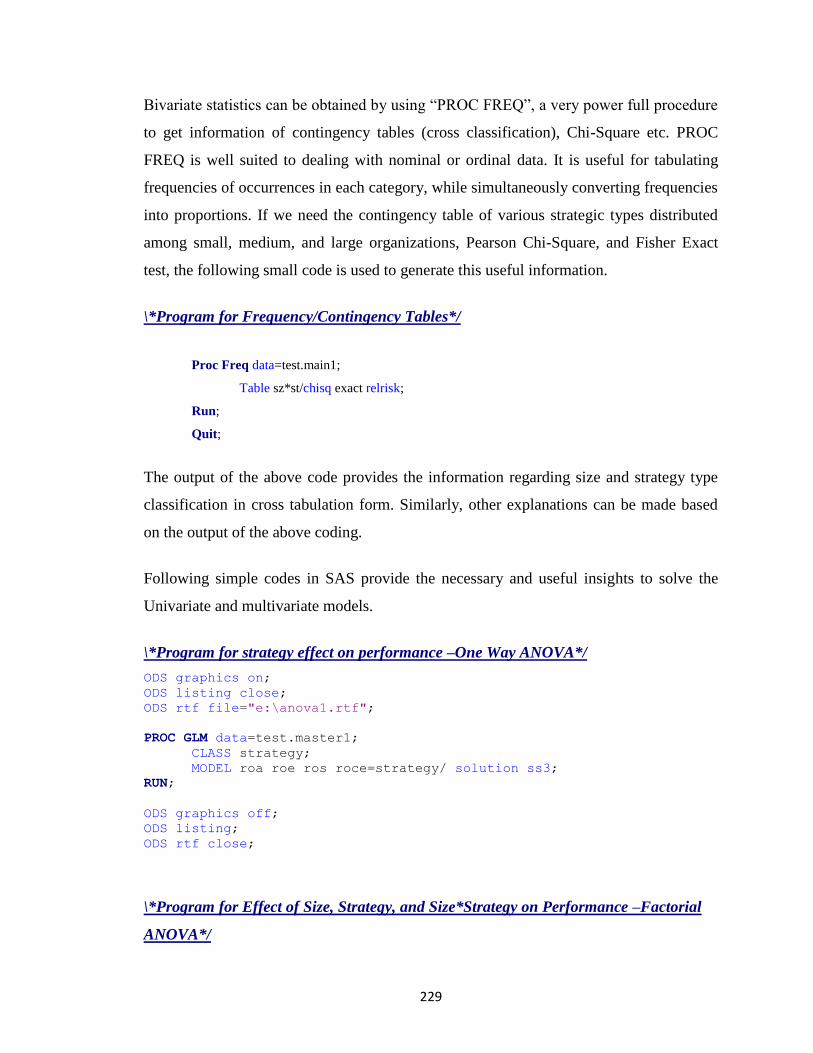
229
Bivariate statistics can be obtained by using “PROC FREQ”, a very power full procedure
to get information of contingency tables (cross classification), Chi-Square etc. PROC
FREQ is well suited to dealing with nominal or ordinal data. It is useful for tabulating
frequencies of occurrences in each category, while simultaneously converting frequencies
into proportions. If we need the contingency table of various strategic types distributed
among small, medium, and large organizations, Pearson Chi-Square, and Fisher Exact
test, the following small code is used to generate this useful information.
\*Program for Frequency/Contingency Tables*/
Proc Freq data=test.main1;
Table sz*st/chisq exact relrisk;
Run;
Quit;
The output of the above code provides the information regarding size and strategy type
classification in cross tabulation form. Similarly, other explanations can be made based
on the output of the above coding.
Following simple codes in SAS provide the necessary and useful insights to solve the
Univariate and multivariate models.
\*Program for strategy effect on performance –One Way ANOVA*/
ODS graphics on;
ODS listing close;
ODS rtf file="e:\anova1.rtf";
PROC GLM data=test.master1;
CLASS strategy;
MODEL roa roe ros roce=strategy/ solution ss3;
RUN;
ODS graphics off;
ODS listing;
ODS rtf close;
\*Program for Effect of Size, Strategy, and Size*Strategy on Performance –Factorial
ANOVA*/

230
ODS graphics on;
ODS listing close;
ODS rtf file="e:\anova2.rtf";
PROC GLM data=test.master1;
CLASS strategy Size Industry;
MODEL roa roe ros roce=strategy|size|industry/ solution ss3;
RUN;
ODS graphics off;
ODS listing;
ODS rtf close;
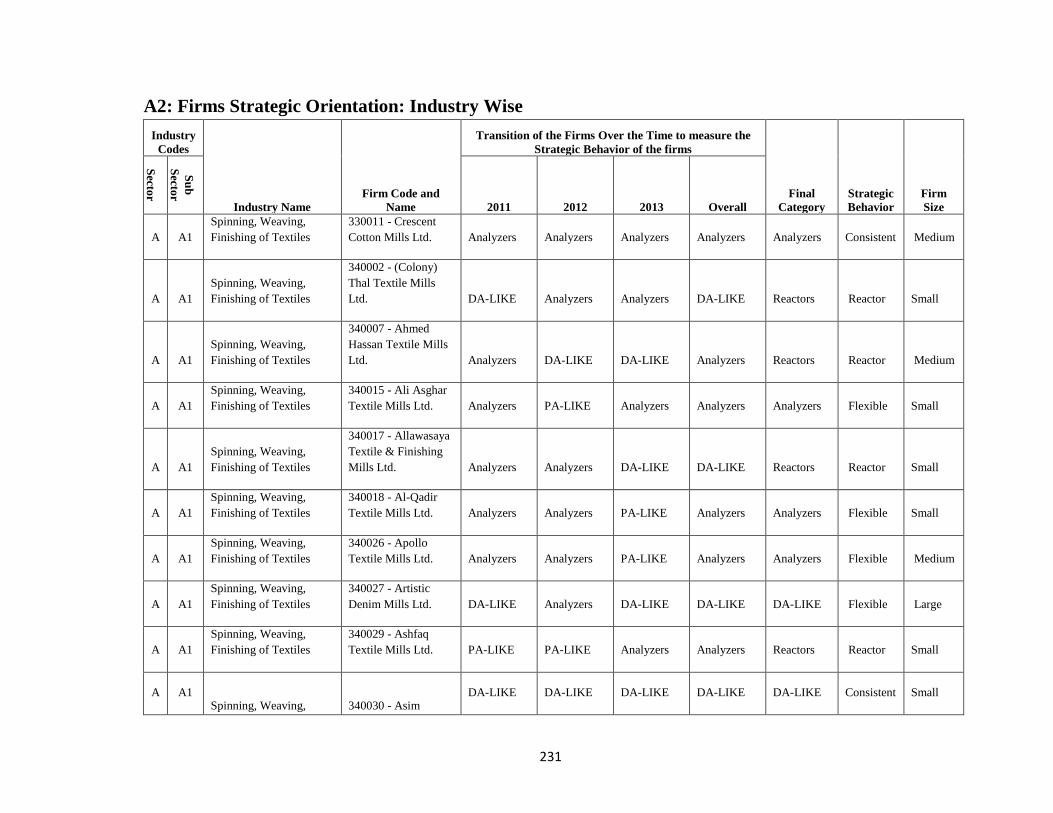
231
A2: Firms Strategic Orientation: Industry Wise
Industry
Codes
Industry Name
Firm Code and
Name
Transition of the Firms Over the Time to measure the
Strategic Behavior of the firms
Final
Category
Strategic
Behavior
Firm
Size
Secto
r
Su
b
Secto
r
2011 2012 2013 Overall
A A1
Spinning, Weaving,
Finishing of Textiles
330011 - Crescent
Cotton Mills Ltd. Analyzers Analyzers Analyzers Analyzers Analyzers Consistent Medium
A A1
Spinning, Weaving,
Finishing of Textiles
340002 - (Colony)
Thal Textile Mills
Ltd. DA-LIKE Analyzers Analyzers DA-LIKE Reactors Reactor Small
A A1
Spinning, Weaving,
Finishing of Textiles
340007 - Ahmed
Hassan Textile Mills
Ltd. Analyzers DA-LIKE DA-LIKE Analyzers Reactors Reactor Medium
A A1
Spinning, Weaving,
Finishing of Textiles
340015 - Ali Asghar
Textile Mills Ltd. Analyzers PA-LIKE Analyzers Analyzers Analyzers Flexible Small
A A1
Spinning, Weaving,
Finishing of Textiles
340017 - Allawasaya
Textile & Finishing
Mills Ltd. Analyzers Analyzers DA-LIKE DA-LIKE Reactors Reactor Small
A A1
Spinning, Weaving,
Finishing of Textiles
340018 - Al-Qadir
Textile Mills Ltd. Analyzers Analyzers PA-LIKE Analyzers Analyzers Flexible Small
A A1
Spinning, Weaving,
Finishing of Textiles
340026 - Apollo
Textile Mills Ltd. Analyzers Analyzers PA-LIKE Analyzers Analyzers Flexible Medium
A A1
Spinning, Weaving,
Finishing of Textiles
340027 - Artistic
Denim Mills Ltd. DA-LIKE Analyzers DA-LIKE DA-LIKE DA-LIKE Flexible Large
A A1
Spinning, Weaving,
Finishing of Textiles
340029 - Ashfaq
Textile Mills Ltd. PA-LIKE PA-LIKE Analyzers Analyzers Reactors Reactor Small
A A1 Spinning, Weaving, 340030 - Asim
DA-LIKE DA-LIKE DA-LIKE DA-LIKE DA-LIKE Consistent Small
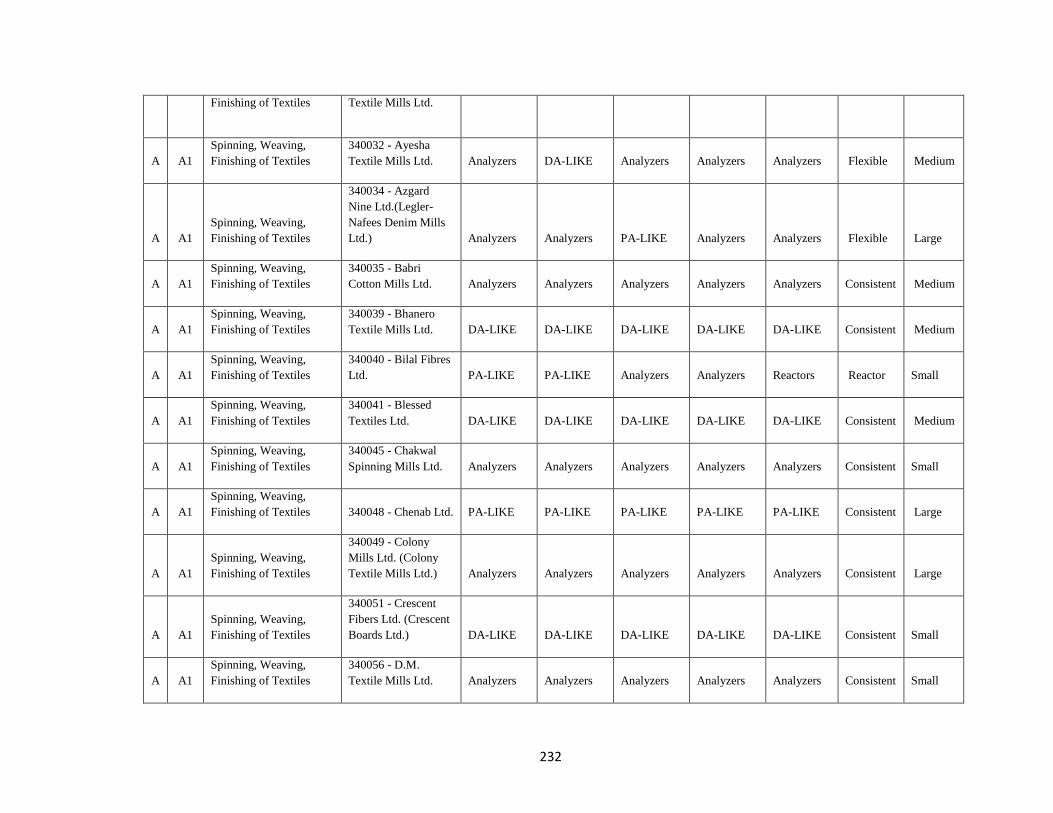
232
Finishing of Textiles Textile Mills Ltd.
A A1
Spinning, Weaving,
Finishing of Textiles
340032 - Ayesha
Textile Mills Ltd. Analyzers DA-LIKE Analyzers Analyzers Analyzers Flexible Medium
A A1
Spinning, Weaving,
Finishing of Textiles
340034 - Azgard
Nine Ltd.(Legler-
Nafees Denim Mills
Ltd.) Analyzers Analyzers PA-LIKE Analyzers Analyzers Flexible Large
A A1
Spinning, Weaving,
Finishing of Textiles
340035 - Babri
Cotton Mills Ltd. Analyzers Analyzers Analyzers Analyzers Analyzers Consistent Medium
A A1
Spinning, Weaving,
Finishing of Textiles
340039 - Bhanero
Textile Mills Ltd. DA-LIKE DA-LIKE DA-LIKE DA-LIKE DA-LIKE Consistent Medium
A A1
Spinning, Weaving,
Finishing of Textiles
340040 - Bilal Fibres
Ltd. PA-LIKE PA-LIKE Analyzers Analyzers Reactors Reactor Small
A A1
Spinning, Weaving,
Finishing of Textiles
340041 - Blessed
Textiles Ltd. DA-LIKE DA-LIKE DA-LIKE DA-LIKE DA-LIKE Consistent Medium
A A1
Spinning, Weaving,
Finishing of Textiles
340045 - Chakwal
Spinning Mills Ltd. Analyzers Analyzers Analyzers Analyzers Analyzers Consistent Small
A A1
Spinning, Weaving,
Finishing of Textiles 340048 - Chenab Ltd. PA-LIKE PA-LIKE PA-LIKE PA-LIKE PA-LIKE Consistent Large
A A1
Spinning, Weaving,
Finishing of Textiles
340049 - Colony
Mills Ltd. (Colony
Textile Mills Ltd.) Analyzers Analyzers Analyzers Analyzers Analyzers Consistent Large
A A1
Spinning, Weaving,
Finishing of Textiles
340051 - Crescent
Fibers Ltd. (Crescent
Boards Ltd.) DA-LIKE DA-LIKE DA-LIKE DA-LIKE DA-LIKE Consistent Small
A A1
Spinning, Weaving,
Finishing of Textiles
340056 - D.M.
Textile Mills Ltd. Analyzers Analyzers Analyzers Analyzers Analyzers Consistent Small
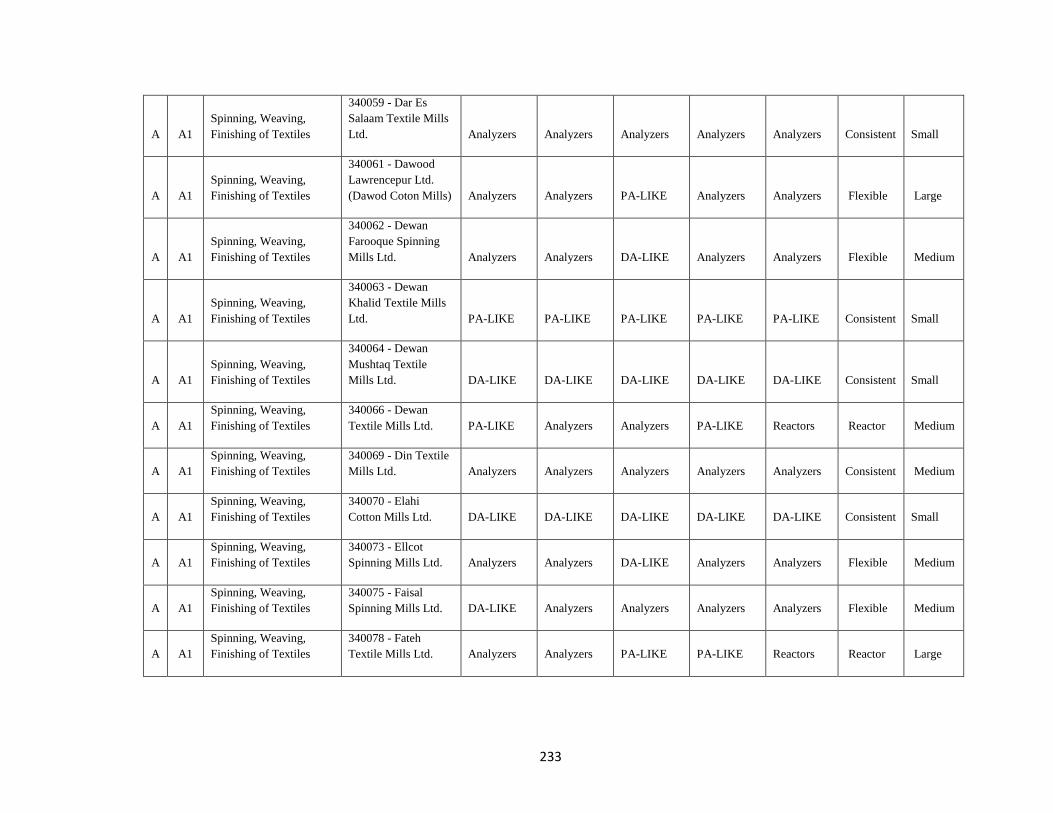
233
A A1
Spinning, Weaving,
Finishing of Textiles
340059 - Dar Es
Salaam Textile Mills
Ltd. Analyzers Analyzers Analyzers Analyzers Analyzers Consistent Small
A A1
Spinning, Weaving,
Finishing of Textiles
340061 - Dawood
Lawrencepur Ltd.
(Dawod Coton Mills) Analyzers Analyzers PA-LIKE Analyzers Analyzers Flexible Large
A A1
Spinning, Weaving,
Finishing of Textiles
340062 - Dewan
Farooque Spinning
Mills Ltd. Analyzers Analyzers DA-LIKE Analyzers Analyzers Flexible Medium
A A1
Spinning, Weaving,
Finishing of Textiles
340063 - Dewan
Khalid Textile Mills
Ltd. PA-LIKE PA-LIKE PA-LIKE PA-LIKE PA-LIKE Consistent Small
A A1
Spinning, Weaving,
Finishing of Textiles
340064 - Dewan
Mushtaq Textile
Mills Ltd. DA-LIKE DA-LIKE DA-LIKE DA-LIKE DA-LIKE Consistent Small
A A1
Spinning, Weaving,
Finishing of Textiles
340066 - Dewan
Textile Mills Ltd. PA-LIKE Analyzers Analyzers PA-LIKE Reactors Reactor Medium
A A1
Spinning, Weaving,
Finishing of Textiles
340069 - Din Textile
Mills Ltd. Analyzers Analyzers Analyzers Analyzers Analyzers Consistent Medium
A A1
Spinning, Weaving,
Finishing of Textiles
340070 - Elahi
Cotton Mills Ltd. DA-LIKE DA-LIKE DA-LIKE DA-LIKE DA-LIKE Consistent Small
A A1
Spinning, Weaving,
Finishing of Textiles
340073 - Ellcot
Spinning Mills Ltd. Analyzers Analyzers DA-LIKE Analyzers Analyzers Flexible Medium
A A1
Spinning, Weaving,
Finishing of Textiles
340075 - Faisal
Spinning Mills Ltd. DA-LIKE Analyzers Analyzers Analyzers Analyzers Flexible Medium
A A1
Spinning, Weaving,
Finishing of Textiles
340078 - Fateh
Textile Mills Ltd. Analyzers Analyzers PA-LIKE PA-LIKE Reactors Reactor Large
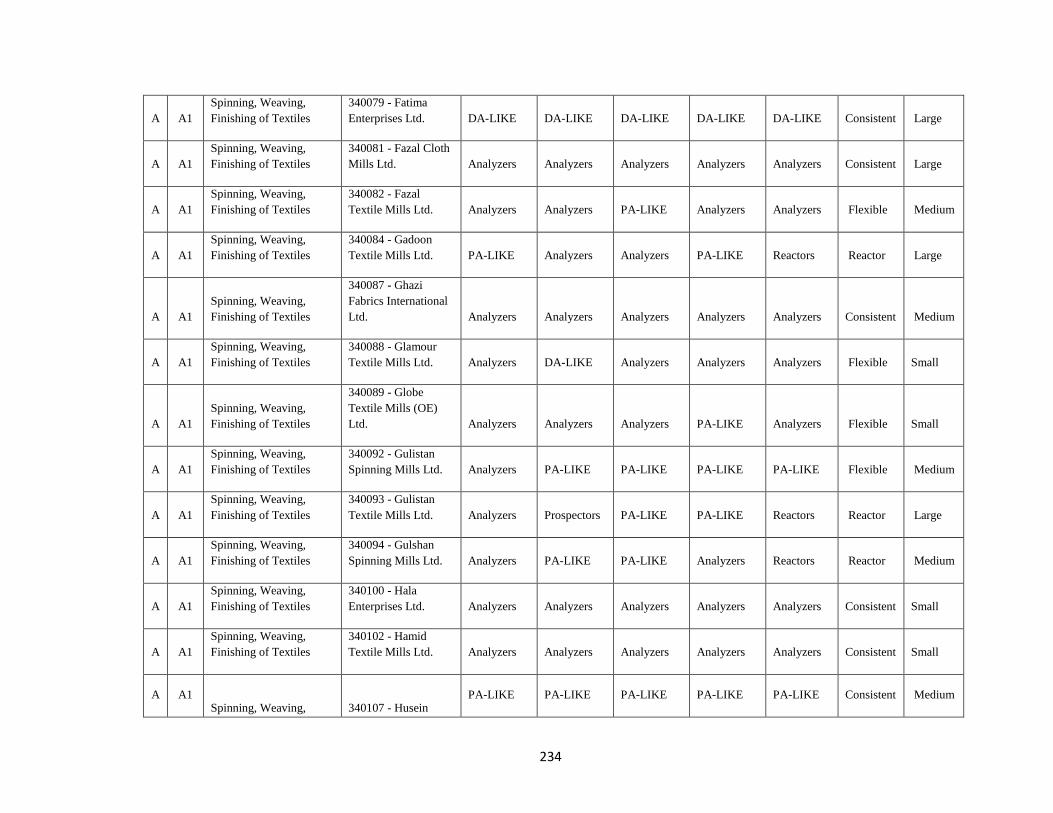
234
A A1
Spinning, Weaving,
Finishing of Textiles
340079 - Fatima
Enterprises Ltd. DA-LIKE DA-LIKE DA-LIKE DA-LIKE DA-LIKE Consistent Large
A A1
Spinning, Weaving,
Finishing of Textiles
340081 - Fazal Cloth
Mills Ltd. Analyzers Analyzers Analyzers Analyzers Analyzers Consistent Large
A A1
Spinning, Weaving,
Finishing of Textiles
340082 - Fazal
Textile Mills Ltd. Analyzers Analyzers PA-LIKE Analyzers Analyzers Flexible Medium
A A1
Spinning, Weaving,
Finishing of Textiles
340084 - Gadoon
Textile Mills Ltd. PA-LIKE Analyzers Analyzers PA-LIKE Reactors Reactor Large
A A1
Spinning, Weaving,
Finishing of Textiles
340087 - Ghazi
Fabrics International
Ltd. Analyzers Analyzers Analyzers Analyzers Analyzers Consistent Medium
A A1
Spinning, Weaving,
Finishing of Textiles
340088 - Glamour
Textile Mills Ltd. Analyzers DA-LIKE Analyzers Analyzers Analyzers Flexible Small
A A1
Spinning, Weaving,
Finishing of Textiles
340089 - Globe
Textile Mills (OE)
Ltd. Analyzers Analyzers Analyzers PA-LIKE Analyzers Flexible Small
A A1
Spinning, Weaving,
Finishing of Textiles
340092 - Gulistan
Spinning Mills Ltd. Analyzers PA-LIKE PA-LIKE PA-LIKE PA-LIKE Flexible Medium
A A1
Spinning, Weaving,
Finishing of Textiles
340093 - Gulistan
Textile Mills Ltd. Analyzers Prospectors PA-LIKE PA-LIKE Reactors Reactor Large
A A1
Spinning, Weaving,
Finishing of Textiles
340094 - Gulshan
Spinning Mills Ltd. Analyzers PA-LIKE PA-LIKE Analyzers Reactors Reactor Medium
A A1
Spinning, Weaving,
Finishing of Textiles
340100 - Hala
Enterprises Ltd. Analyzers Analyzers Analyzers Analyzers Analyzers Consistent Small
A A1
Spinning, Weaving,
Finishing of Textiles
340102 - Hamid
Textile Mills Ltd. Analyzers Analyzers Analyzers Analyzers Analyzers Consistent Small
A A1 Spinning, Weaving, 340107 - Husein
PA-LIKE PA-LIKE PA-LIKE PA-LIKE PA-LIKE Consistent Medium
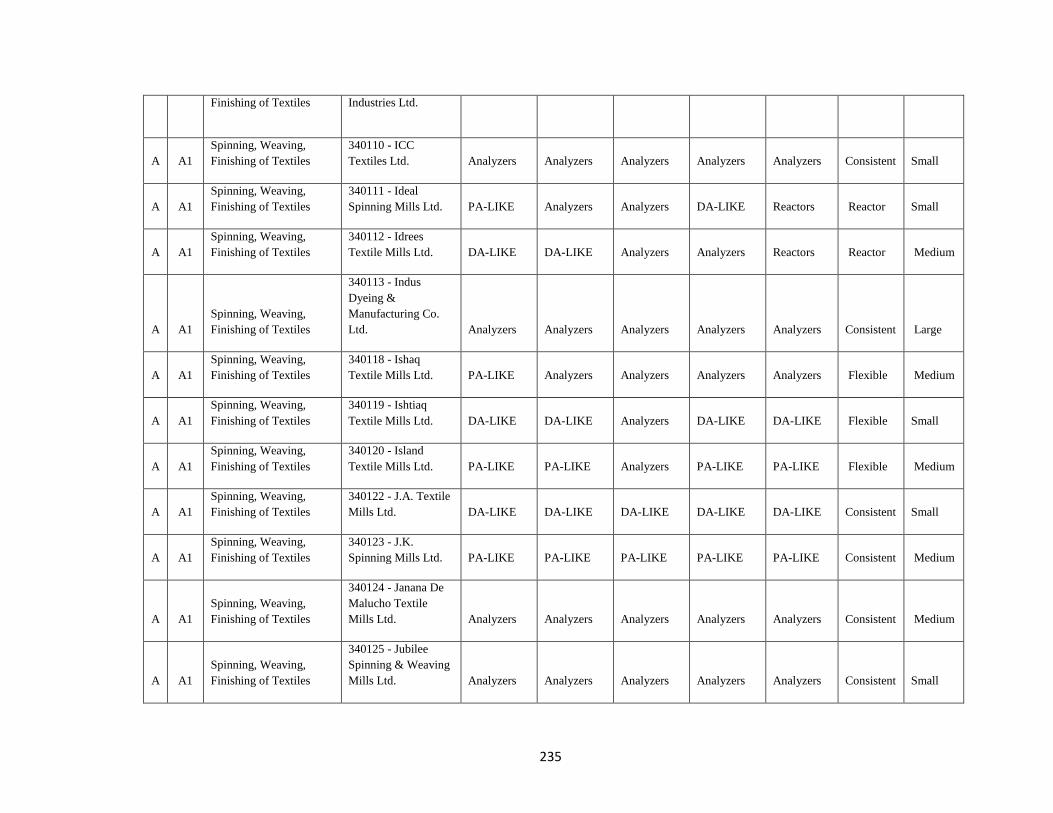
235
Finishing of Textiles Industries Ltd.
A A1
Spinning, Weaving,
Finishing of Textiles
340110 - ICC
Textiles Ltd. Analyzers Analyzers Analyzers Analyzers Analyzers Consistent Small
A A1
Spinning, Weaving,
Finishing of Textiles
340111 - Ideal
Spinning Mills Ltd. PA-LIKE Analyzers Analyzers DA-LIKE Reactors Reactor Small
A A1
Spinning, Weaving,
Finishing of Textiles
340112 - Idrees
Textile Mills Ltd. DA-LIKE DA-LIKE Analyzers Analyzers Reactors Reactor Medium
A A1
Spinning, Weaving,
Finishing of Textiles
340113 - Indus
Dyeing &
Manufacturing Co.
Ltd. Analyzers Analyzers Analyzers Analyzers Analyzers Consistent Large
A A1
Spinning, Weaving,
Finishing of Textiles
340118 - Ishaq
Textile Mills Ltd. PA-LIKE Analyzers Analyzers Analyzers Analyzers Flexible Medium
A A1
Spinning, Weaving,
Finishing of Textiles
340119 - Ishtiaq
Textile Mills Ltd. DA-LIKE DA-LIKE Analyzers DA-LIKE DA-LIKE Flexible Small
A A1
Spinning, Weaving,
Finishing of Textiles
340120 - Island
Textile Mills Ltd. PA-LIKE PA-LIKE Analyzers PA-LIKE PA-LIKE Flexible Medium
A A1
Spinning, Weaving,
Finishing of Textiles
340122 - J.A. Textile
Mills Ltd. DA-LIKE DA-LIKE DA-LIKE DA-LIKE DA-LIKE Consistent Small
A A1
Spinning, Weaving,
Finishing of Textiles
340123 - J.K.
Spinning Mills Ltd. PA-LIKE PA-LIKE PA-LIKE PA-LIKE PA-LIKE Consistent Medium
A A1
Spinning, Weaving,
Finishing of Textiles
340124 - Janana De
Malucho Textile
Mills Ltd. Analyzers Analyzers Analyzers Analyzers Analyzers Consistent Medium
A A1
Spinning, Weaving,
Finishing of Textiles
340125 - Jubilee
Spinning & Weaving
Mills Ltd. Analyzers Analyzers Analyzers Analyzers Analyzers Consistent Small
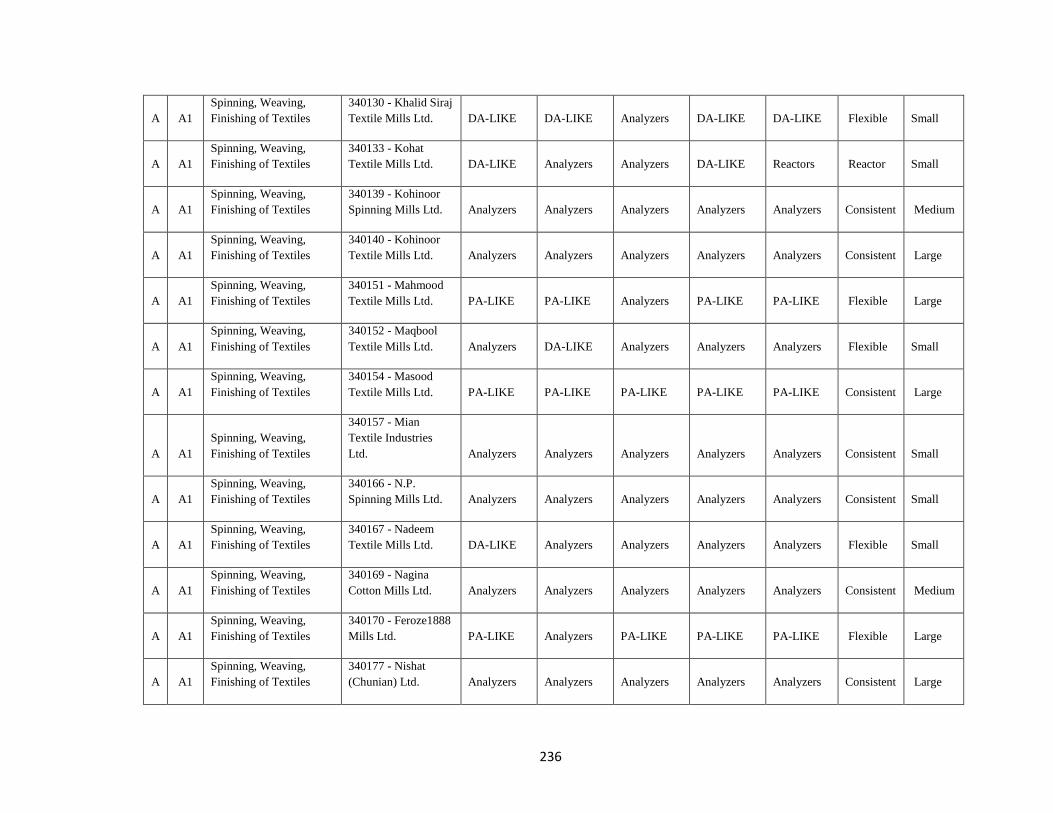
236
A A1
Spinning, Weaving,
Finishing of Textiles
340130 - Khalid Siraj
Textile Mills Ltd. DA-LIKE DA-LIKE Analyzers DA-LIKE DA-LIKE Flexible Small
A A1
Spinning, Weaving,
Finishing of Textiles
340133 - Kohat
Textile Mills Ltd. DA-LIKE Analyzers Analyzers DA-LIKE Reactors Reactor Small
A A1
Spinning, Weaving,
Finishing of Textiles
340139 - Kohinoor
Spinning Mills Ltd. Analyzers Analyzers Analyzers Analyzers Analyzers Consistent Medium
A A1
Spinning, Weaving,
Finishing of Textiles
340140 - Kohinoor
Textile Mills Ltd. Analyzers Analyzers Analyzers Analyzers Analyzers Consistent Large
A A1
Spinning, Weaving,
Finishing of Textiles
340151 - Mahmood
Textile Mills Ltd. PA-LIKE PA-LIKE Analyzers PA-LIKE PA-LIKE Flexible Large
A A1
Spinning, Weaving,
Finishing of Textiles
340152 - Maqbool
Textile Mills Ltd. Analyzers DA-LIKE Analyzers Analyzers Analyzers Flexible Small
A A1
Spinning, Weaving,
Finishing of Textiles
340154 - Masood
Textile Mills Ltd. PA-LIKE PA-LIKE PA-LIKE PA-LIKE PA-LIKE Consistent Large
A A1
Spinning, Weaving,
Finishing of Textiles
340157 - Mian
Textile Industries
Ltd. Analyzers Analyzers Analyzers Analyzers Analyzers Consistent Small
A A1
Spinning, Weaving,
Finishing of Textiles
340166 - N.P.
Spinning Mills Ltd. Analyzers Analyzers Analyzers Analyzers Analyzers Consistent Small
A A1
Spinning, Weaving,
Finishing of Textiles
340167 - Nadeem
Textile Mills Ltd. DA-LIKE Analyzers Analyzers Analyzers Analyzers Flexible Small
A A1
Spinning, Weaving,
Finishing of Textiles
340169 - Nagina
Cotton Mills Ltd. Analyzers Analyzers Analyzers Analyzers Analyzers Consistent Medium
A A1
Spinning, Weaving,
Finishing of Textiles
340170 - Feroze1888
Mills Ltd. PA-LIKE Analyzers PA-LIKE PA-LIKE PA-LIKE Flexible Large
A A1
Spinning, Weaving,
Finishing of Textiles
340177 - Nishat
(Chunian) Ltd. Analyzers Analyzers Analyzers Analyzers Analyzers Consistent Large
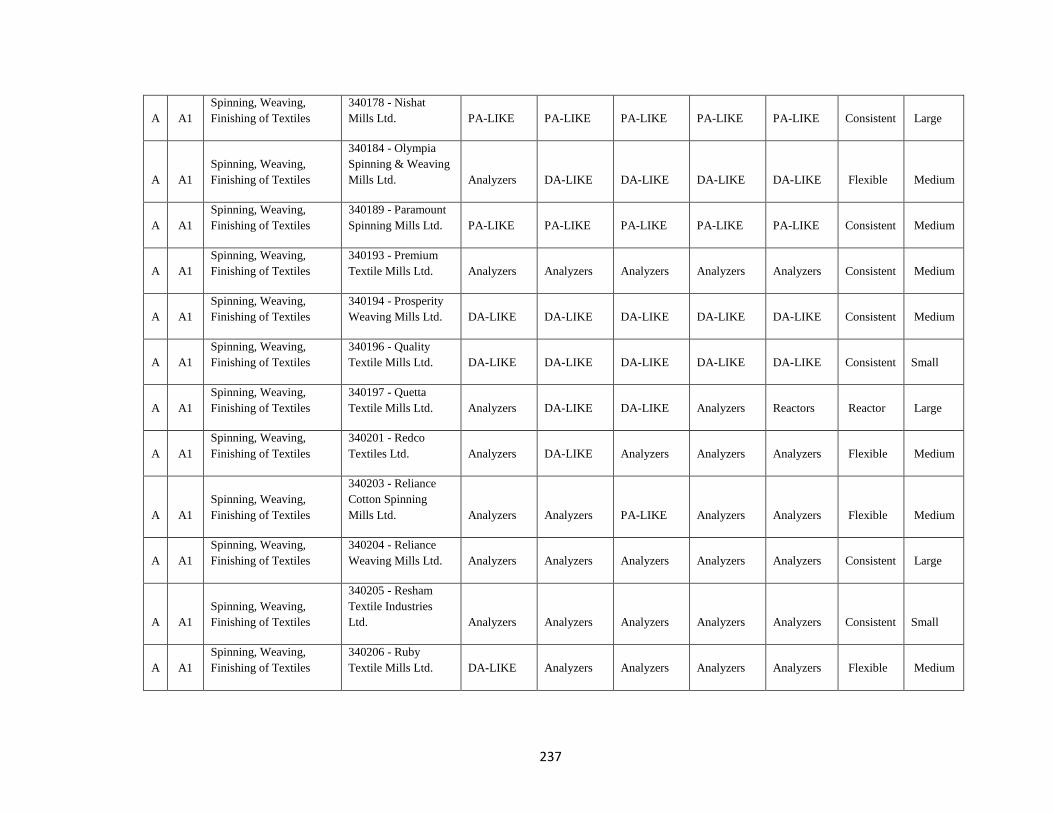
237
A A1
Spinning, Weaving,
Finishing of Textiles
340178 - Nishat
Mills Ltd. PA-LIKE PA-LIKE PA-LIKE PA-LIKE PA-LIKE Consistent Large
A A1
Spinning, Weaving,
Finishing of Textiles
340184 - Olympia
Spinning & Weaving
Mills Ltd. Analyzers DA-LIKE DA-LIKE DA-LIKE DA-LIKE Flexible Medium
A A1
Spinning, Weaving,
Finishing of Textiles
340189 - Paramount
Spinning Mills Ltd. PA-LIKE PA-LIKE PA-LIKE PA-LIKE PA-LIKE Consistent Medium
A A1
Spinning, Weaving,
Finishing of Textiles
340193 - Premium
Textile Mills Ltd. Analyzers Analyzers Analyzers Analyzers Analyzers Consistent Medium
A A1
Spinning, Weaving,
Finishing of Textiles
340194 - Prosperity
Weaving Mills Ltd. DA-LIKE DA-LIKE DA-LIKE DA-LIKE DA-LIKE Consistent Medium
A A1
Spinning, Weaving,
Finishing of Textiles
340196 - Quality
Textile Mills Ltd. DA-LIKE DA-LIKE DA-LIKE DA-LIKE DA-LIKE Consistent Small
A A1
Spinning, Weaving,
Finishing of Textiles
340197 - Quetta
Textile Mills Ltd. Analyzers DA-LIKE DA-LIKE Analyzers Reactors Reactor Large
A A1
Spinning, Weaving,
Finishing of Textiles
340201 - Redco
Textiles Ltd. Analyzers DA-LIKE Analyzers Analyzers Analyzers Flexible Medium
A A1
Spinning, Weaving,
Finishing of Textiles
340203 - Reliance
Cotton Spinning
Mills Ltd. Analyzers Analyzers PA-LIKE Analyzers Analyzers Flexible Medium
A A1
Spinning, Weaving,
Finishing of Textiles
340204 - Reliance
Weaving Mills Ltd. Analyzers Analyzers Analyzers Analyzers Analyzers Consistent Large
A A1
Spinning, Weaving,
Finishing of Textiles
340205 - Resham
Textile Industries
Ltd. Analyzers Analyzers Analyzers Analyzers Analyzers Consistent Small
A A1
Spinning, Weaving,
Finishing of Textiles
340206 - Ruby
Textile Mills Ltd. DA-LIKE Analyzers Analyzers Analyzers Analyzers Flexible Medium
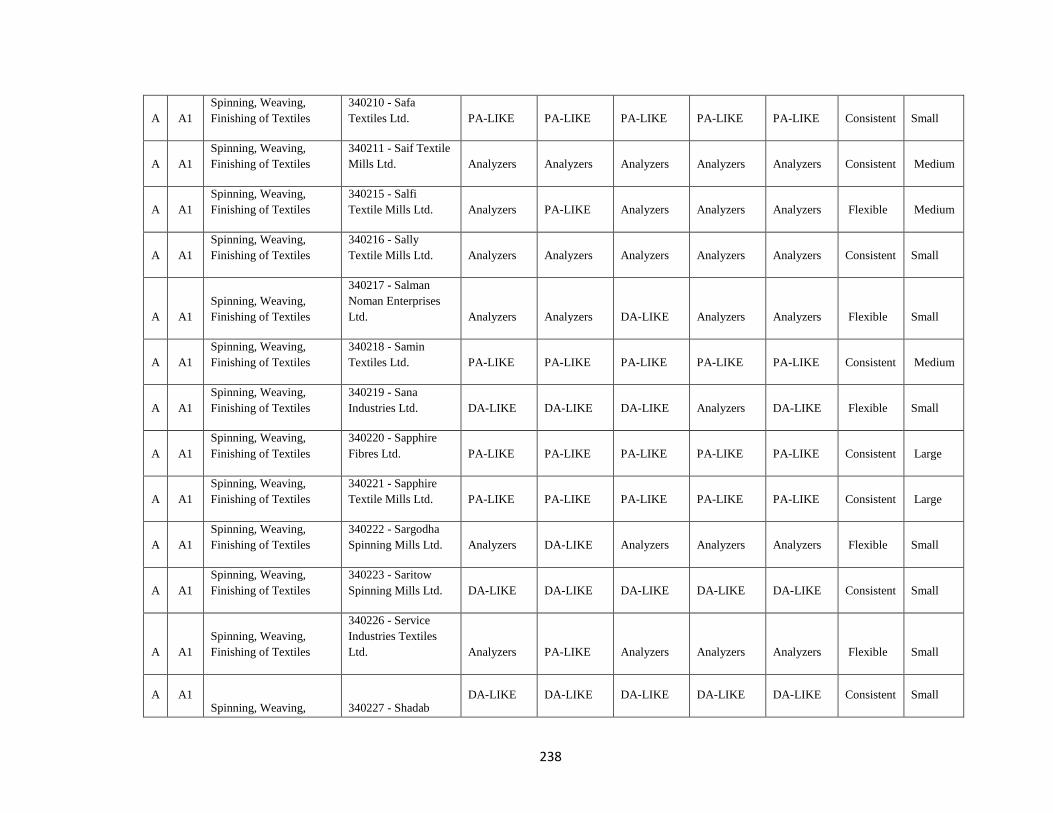
238
A A1
Spinning, Weaving,
Finishing of Textiles
340210 - Safa
Textiles Ltd. PA-LIKE PA-LIKE PA-LIKE PA-LIKE PA-LIKE Consistent Small
A A1
Spinning, Weaving,
Finishing of Textiles
340211 - Saif Textile
Mills Ltd. Analyzers Analyzers Analyzers Analyzers Analyzers Consistent Medium
A A1
Spinning, Weaving,
Finishing of Textiles
340215 - Salfi
Textile Mills Ltd. Analyzers PA-LIKE Analyzers Analyzers Analyzers Flexible Medium
A A1
Spinning, Weaving,
Finishing of Textiles
340216 - Sally
Textile Mills Ltd. Analyzers Analyzers Analyzers Analyzers Analyzers Consistent Small
A A1
Spinning, Weaving,
Finishing of Textiles
340217 - Salman
Noman Enterprises
Ltd. Analyzers Analyzers DA-LIKE Analyzers Analyzers Flexible Small
A A1
Spinning, Weaving,
Finishing of Textiles
340218 - Samin
Textiles Ltd. PA-LIKE PA-LIKE PA-LIKE PA-LIKE PA-LIKE Consistent Medium
A A1
Spinning, Weaving,
Finishing of Textiles
340219 - Sana
Industries Ltd. DA-LIKE DA-LIKE DA-LIKE Analyzers DA-LIKE Flexible Small
A A1
Spinning, Weaving,
Finishing of Textiles
340220 - Sapphire
Fibres Ltd. PA-LIKE PA-LIKE PA-LIKE PA-LIKE PA-LIKE Consistent Large
A A1
Spinning, Weaving,
Finishing of Textiles
340221 - Sapphire
Textile Mills Ltd. PA-LIKE PA-LIKE PA-LIKE PA-LIKE PA-LIKE Consistent Large
A A1
Spinning, Weaving,
Finishing of Textiles
340222 - Sargodha
Spinning Mills Ltd. Analyzers DA-LIKE Analyzers Analyzers Analyzers Flexible Small
A A1
Spinning, Weaving,
Finishing of Textiles
340223 - Saritow
Spinning Mills Ltd. DA-LIKE DA-LIKE DA-LIKE DA-LIKE DA-LIKE Consistent Small
A A1
Spinning, Weaving,
Finishing of Textiles
340226 - Service
Industries Textiles
Ltd. Analyzers PA-LIKE Analyzers Analyzers Analyzers Flexible Small
A A1 Spinning, Weaving, 340227 - Shadab
DA-LIKE DA-LIKE DA-LIKE DA-LIKE DA-LIKE Consistent Small
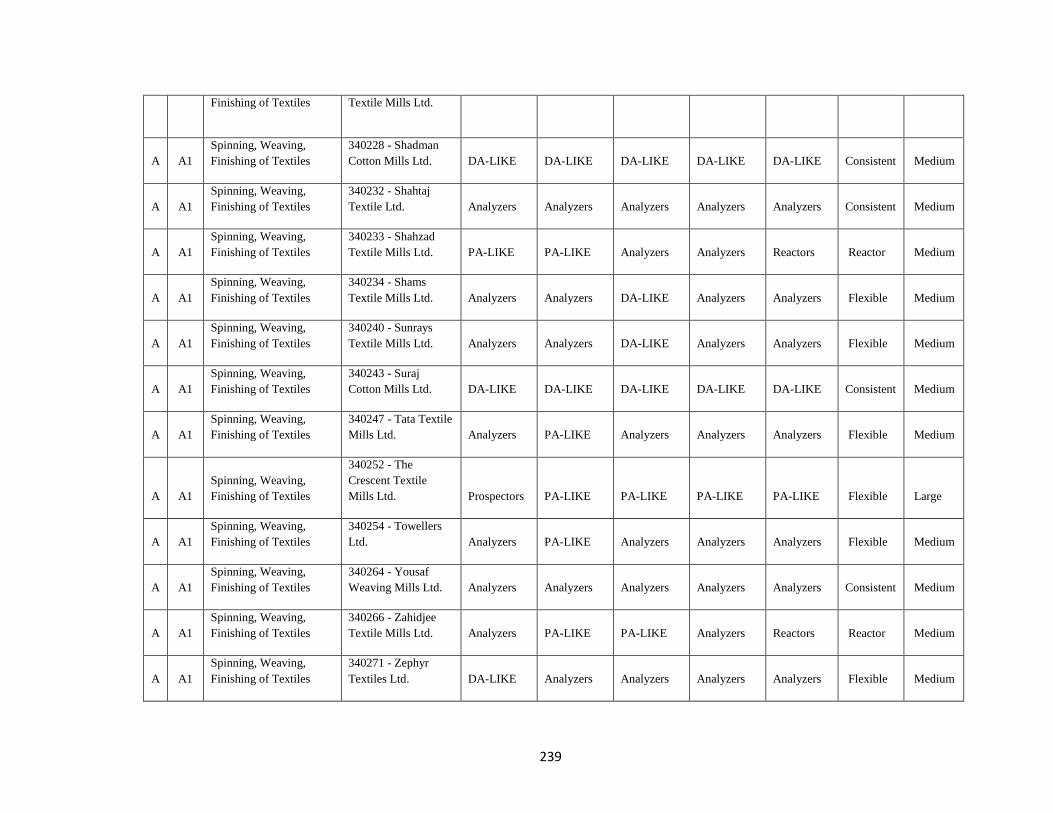
239
Finishing of Textiles Textile Mills Ltd.
A A1
Spinning, Weaving,
Finishing of Textiles
340228 - Shadman
Cotton Mills Ltd. DA-LIKE DA-LIKE DA-LIKE DA-LIKE DA-LIKE Consistent Medium
A A1
Spinning, Weaving,
Finishing of Textiles
340232 - Shahtaj
Textile Ltd. Analyzers Analyzers Analyzers Analyzers Analyzers Consistent Medium
A A1
Spinning, Weaving,
Finishing of Textiles
340233 - Shahzad
Textile Mills Ltd. PA-LIKE PA-LIKE Analyzers Analyzers Reactors Reactor Medium
A A1
Spinning, Weaving,
Finishing of Textiles
340234 - Shams
Textile Mills Ltd. Analyzers Analyzers DA-LIKE Analyzers Analyzers Flexible Medium
A A1
Spinning, Weaving,
Finishing of Textiles
340240 - Sunrays
Textile Mills Ltd. Analyzers Analyzers DA-LIKE Analyzers Analyzers Flexible Medium
A A1
Spinning, Weaving,
Finishing of Textiles
340243 - Suraj
Cotton Mills Ltd. DA-LIKE DA-LIKE DA-LIKE DA-LIKE DA-LIKE Consistent Medium
A A1
Spinning, Weaving,
Finishing of Textiles
340247 - Tata Textile
Mills Ltd. Analyzers PA-LIKE Analyzers Analyzers Analyzers Flexible Medium
A A1
Spinning, Weaving,
Finishing of Textiles
340252 - The
Crescent Textile
Mills Ltd. Prospectors PA-LIKE PA-LIKE PA-LIKE PA-LIKE Flexible Large
A A1
Spinning, Weaving,
Finishing of Textiles
340254 - Towellers
Ltd. Analyzers PA-LIKE Analyzers Analyzers Analyzers Flexible Medium
A A1
Spinning, Weaving,
Finishing of Textiles
340264 - Yousaf
Weaving Mills Ltd. Analyzers Analyzers Analyzers Analyzers Analyzers Consistent Medium
A A1
Spinning, Weaving,
Finishing of Textiles
340266 - Zahidjee
Textile Mills Ltd. Analyzers PA-LIKE PA-LIKE Analyzers Reactors Reactor Medium
A A1
Spinning, Weaving,
Finishing of Textiles
340271 - Zephyr
Textiles Ltd. DA-LIKE Analyzers Analyzers Analyzers Analyzers Flexible Medium
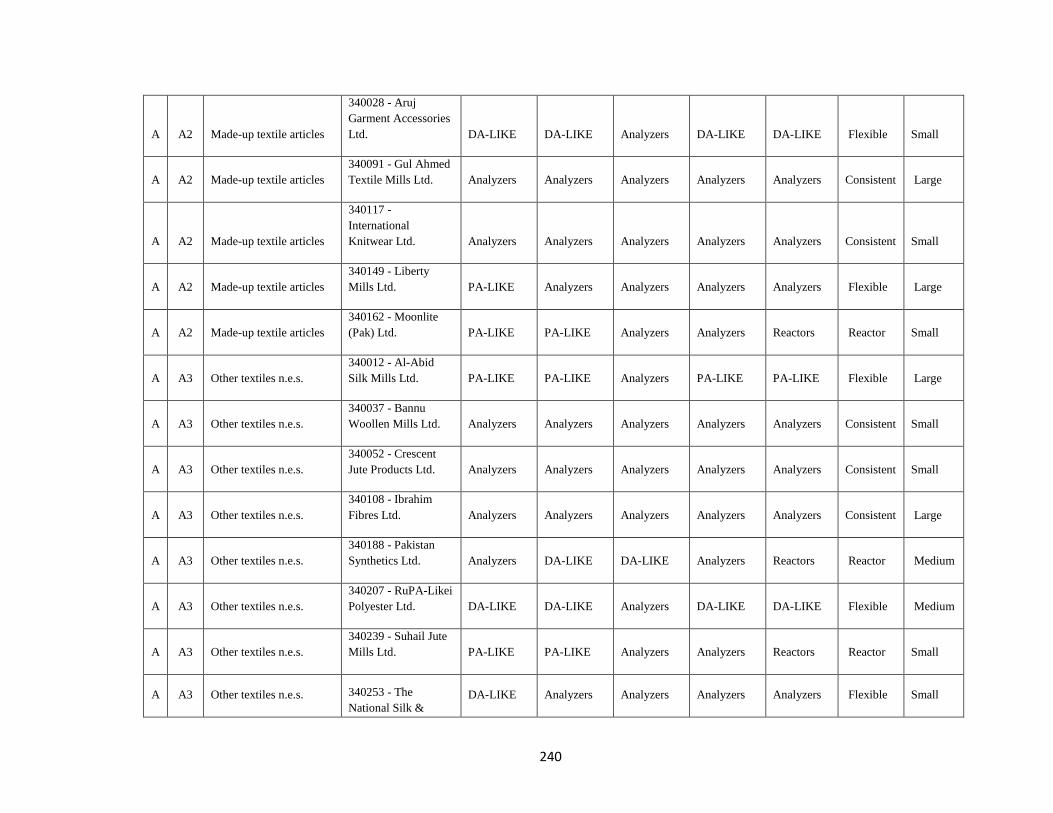
240
A A2 Made-up textile articles
340028 - Aruj
Garment Accessories
Ltd. DA-LIKE DA-LIKE Analyzers DA-LIKE DA-LIKE Flexible Small
A A2 Made-up textile articles
340091 - Gul Ahmed
Textile Mills Ltd. Analyzers Analyzers Analyzers Analyzers Analyzers Consistent Large
A A2 Made-up textile articles
340117 -
International
Knitwear Ltd. Analyzers Analyzers Analyzers Analyzers Analyzers Consistent Small
A A2 Made-up textile articles
340149 - Liberty
Mills Ltd. PA-LIKE Analyzers Analyzers Analyzers Analyzers Flexible Large
A A2 Made-up textile articles
340162 - Moonlite
(Pak) Ltd. PA-LIKE PA-LIKE Analyzers Analyzers Reactors Reactor Small
A A3 Other textiles n.e.s.
340012 - Al-Abid
Silk Mills Ltd. PA-LIKE PA-LIKE Analyzers PA-LIKE PA-LIKE Flexible Large
A A3 Other textiles n.e.s.
340037 - Bannu
Woollen Mills Ltd. Analyzers Analyzers Analyzers Analyzers Analyzers Consistent Small
A A3 Other textiles n.e.s.
340052 - Crescent
Jute Products Ltd. Analyzers Analyzers Analyzers Analyzers Analyzers Consistent Small
A A3 Other textiles n.e.s.
340108 - Ibrahim
Fibres Ltd. Analyzers Analyzers Analyzers Analyzers Analyzers Consistent Large
A A3 Other textiles n.e.s.
340188 - Pakistan
Synthetics Ltd. Analyzers DA-LIKE DA-LIKE Analyzers Reactors Reactor Medium
A A3 Other textiles n.e.s.
340207 - RuPA-Likei
Polyester Ltd. DA-LIKE DA-LIKE Analyzers DA-LIKE DA-LIKE Flexible Medium
A A3 Other textiles n.e.s.
340239 - Suhail Jute
Mills Ltd. PA-LIKE PA-LIKE Analyzers Analyzers Reactors Reactor Small
A A3 Other textiles n.e.s. 340253 - The
National Silk & DA-LIKE Analyzers Analyzers Analyzers Analyzers Flexible Small
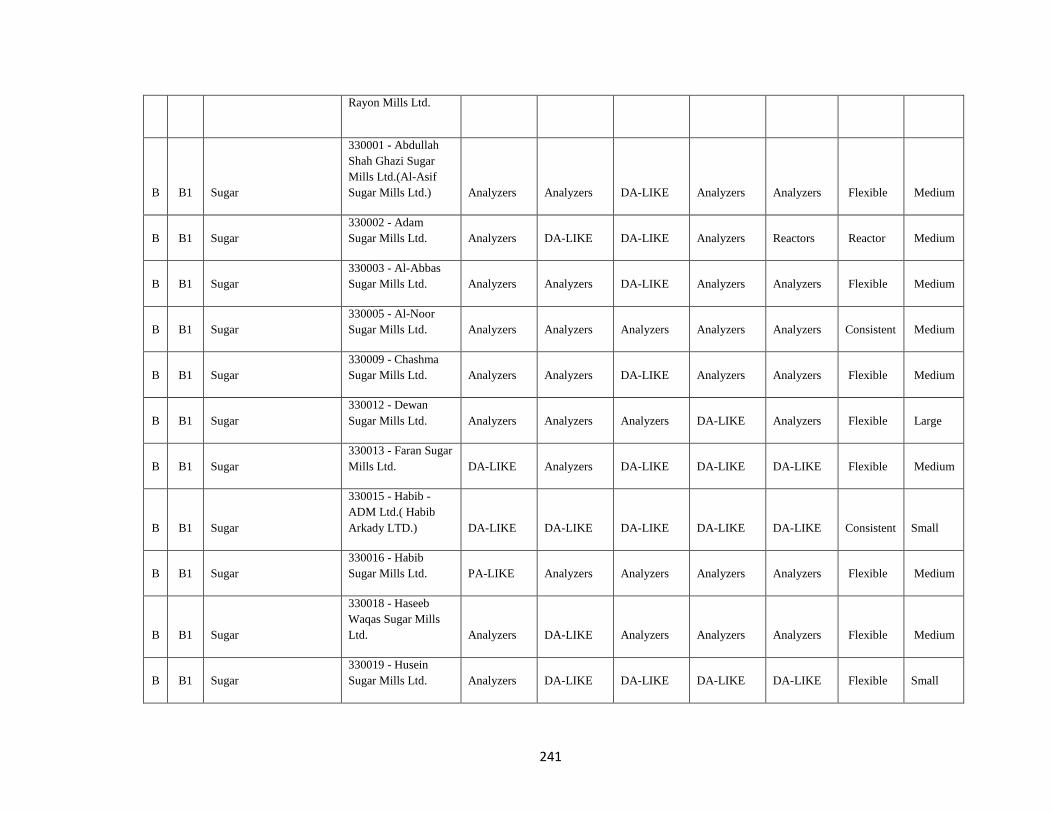
241
Rayon Mills Ltd.
B B1 Sugar
330001 - Abdullah
Shah Ghazi Sugar
Mills Ltd.(Al-Asif
Sugar Mills Ltd.) Analyzers Analyzers DA-LIKE Analyzers Analyzers Flexible Medium
B B1 Sugar
330002 - Adam
Sugar Mills Ltd. Analyzers DA-LIKE DA-LIKE Analyzers Reactors Reactor Medium
B B1 Sugar
330003 - Al-Abbas
Sugar Mills Ltd. Analyzers Analyzers DA-LIKE Analyzers Analyzers Flexible Medium
B B1 Sugar
330005 - Al-Noor
Sugar Mills Ltd. Analyzers Analyzers Analyzers Analyzers Analyzers Consistent Medium
B B1 Sugar
330009 - Chashma
Sugar Mills Ltd. Analyzers Analyzers DA-LIKE Analyzers Analyzers Flexible Medium
B B1 Sugar
330012 - Dewan
Sugar Mills Ltd. Analyzers Analyzers Analyzers DA-LIKE Analyzers Flexible Large
B B1 Sugar
330013 - Faran Sugar
Mills Ltd. DA-LIKE Analyzers DA-LIKE DA-LIKE DA-LIKE Flexible Medium
B B1 Sugar
330015 - Habib -
ADM Ltd.( Habib
Arkady LTD.) DA-LIKE DA-LIKE DA-LIKE DA-LIKE DA-LIKE Consistent Small
B B1 Sugar
330016 - Habib
Sugar Mills Ltd. PA-LIKE Analyzers Analyzers Analyzers Analyzers Flexible Medium
B B1 Sugar
330018 - Haseeb
Waqas Sugar Mills
Ltd. Analyzers DA-LIKE Analyzers Analyzers Analyzers Flexible Medium
B B1 Sugar
330019 - Husein
Sugar Mills Ltd. Analyzers DA-LIKE DA-LIKE DA-LIKE DA-LIKE Flexible Small
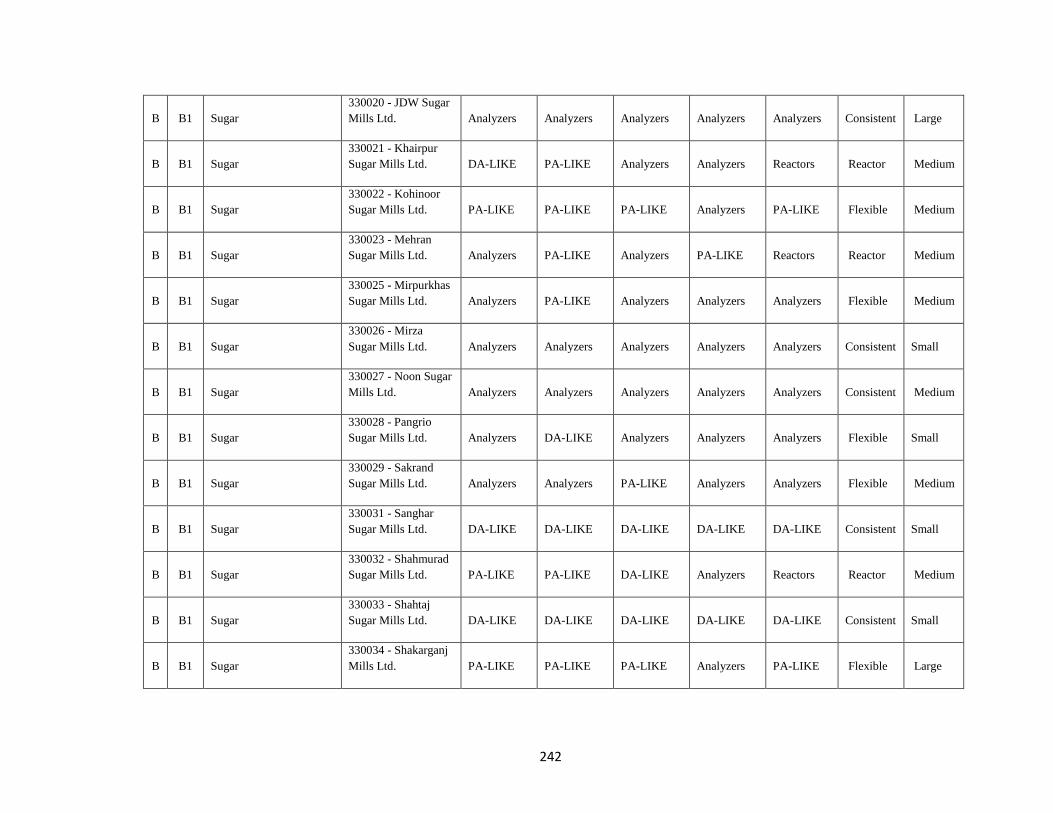
242
B B1 Sugar
330020 - JDW Sugar
Mills Ltd. Analyzers Analyzers Analyzers Analyzers Analyzers Consistent Large
B B1 Sugar
330021 - Khairpur
Sugar Mills Ltd. DA-LIKE PA-LIKE Analyzers Analyzers Reactors Reactor Medium
B B1 Sugar
330022 - Kohinoor
Sugar Mills Ltd. PA-LIKE PA-LIKE PA-LIKE Analyzers PA-LIKE Flexible Medium
B B1 Sugar
330023 - Mehran
Sugar Mills Ltd. Analyzers PA-LIKE Analyzers PA-LIKE Reactors Reactor Medium
B B1 Sugar
330025 - Mirpurkhas
Sugar Mills Ltd. Analyzers PA-LIKE Analyzers Analyzers Analyzers Flexible Medium
B B1 Sugar
330026 - Mirza
Sugar Mills Ltd. Analyzers Analyzers Analyzers Analyzers Analyzers Consistent Small
B B1 Sugar
330027 - Noon Sugar
Mills Ltd. Analyzers Analyzers Analyzers Analyzers Analyzers Consistent Medium
B B1 Sugar
330028 - Pangrio
Sugar Mills Ltd. Analyzers DA-LIKE Analyzers Analyzers Analyzers Flexible Small
B B1 Sugar
330029 - Sakrand
Sugar Mills Ltd. Analyzers Analyzers PA-LIKE Analyzers Analyzers Flexible Medium
B B1 Sugar
330031 - Sanghar
Sugar Mills Ltd. DA-LIKE DA-LIKE DA-LIKE DA-LIKE DA-LIKE Consistent Small
B B1 Sugar
330032 - Shahmurad
Sugar Mills Ltd. PA-LIKE PA-LIKE DA-LIKE Analyzers Reactors Reactor Medium
B B1 Sugar
330033 - Shahtaj
Sugar Mills Ltd. DA-LIKE DA-LIKE DA-LIKE DA-LIKE DA-LIKE Consistent Small
B B1 Sugar
330034 - Shakarganj
Mills Ltd. PA-LIKE PA-LIKE PA-LIKE Analyzers PA-LIKE Flexible Large
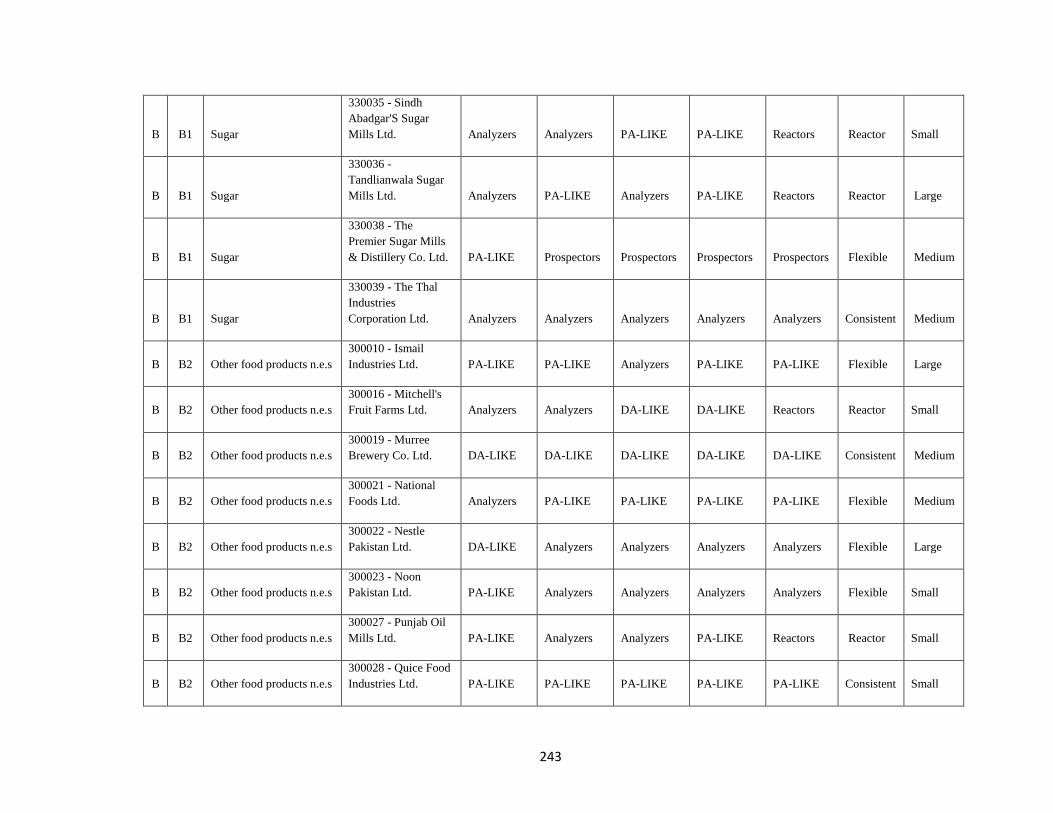
243
B B1 Sugar
330035 - Sindh
Abadgar'S Sugar
Mills Ltd. Analyzers Analyzers PA-LIKE PA-LIKE Reactors Reactor Small
B B1 Sugar
330036 -
Tandlianwala Sugar
Mills Ltd. Analyzers PA-LIKE Analyzers PA-LIKE Reactors Reactor Large
B B1 Sugar
330038 - The
Premier Sugar Mills
& Distillery Co. Ltd. PA-LIKE Prospectors Prospectors Prospectors Prospectors Flexible Medium
B B1 Sugar
330039 - The Thal
Industries
Corporation Ltd. Analyzers Analyzers Analyzers Analyzers Analyzers Consistent Medium
B B2 Other food products n.e.s
300010 - Ismail
Industries Ltd. PA-LIKE PA-LIKE Analyzers PA-LIKE PA-LIKE Flexible Large
B B2 Other food products n.e.s
300016 - Mitchell's
Fruit Farms Ltd. Analyzers Analyzers DA-LIKE DA-LIKE Reactors Reactor Small
B B2 Other food products n.e.s
300019 - Murree
Brewery Co. Ltd. DA-LIKE DA-LIKE DA-LIKE DA-LIKE DA-LIKE Consistent Medium
B B2 Other food products n.e.s
300021 - National
Foods Ltd. Analyzers PA-LIKE PA-LIKE PA-LIKE PA-LIKE Flexible Medium
B B2 Other food products n.e.s
300022 - Nestle
Pakistan Ltd. DA-LIKE Analyzers Analyzers Analyzers Analyzers Flexible Large
B B2 Other food products n.e.s
300023 - Noon
Pakistan Ltd. PA-LIKE Analyzers Analyzers Analyzers Analyzers Flexible Small
B B2 Other food products n.e.s
300027 - Punjab Oil
Mills Ltd. PA-LIKE Analyzers Analyzers PA-LIKE Reactors Reactor Small
B B2 Other food products n.e.s
300028 - Quice Food
Industries Ltd. PA-LIKE PA-LIKE PA-LIKE PA-LIKE PA-LIKE Consistent Small
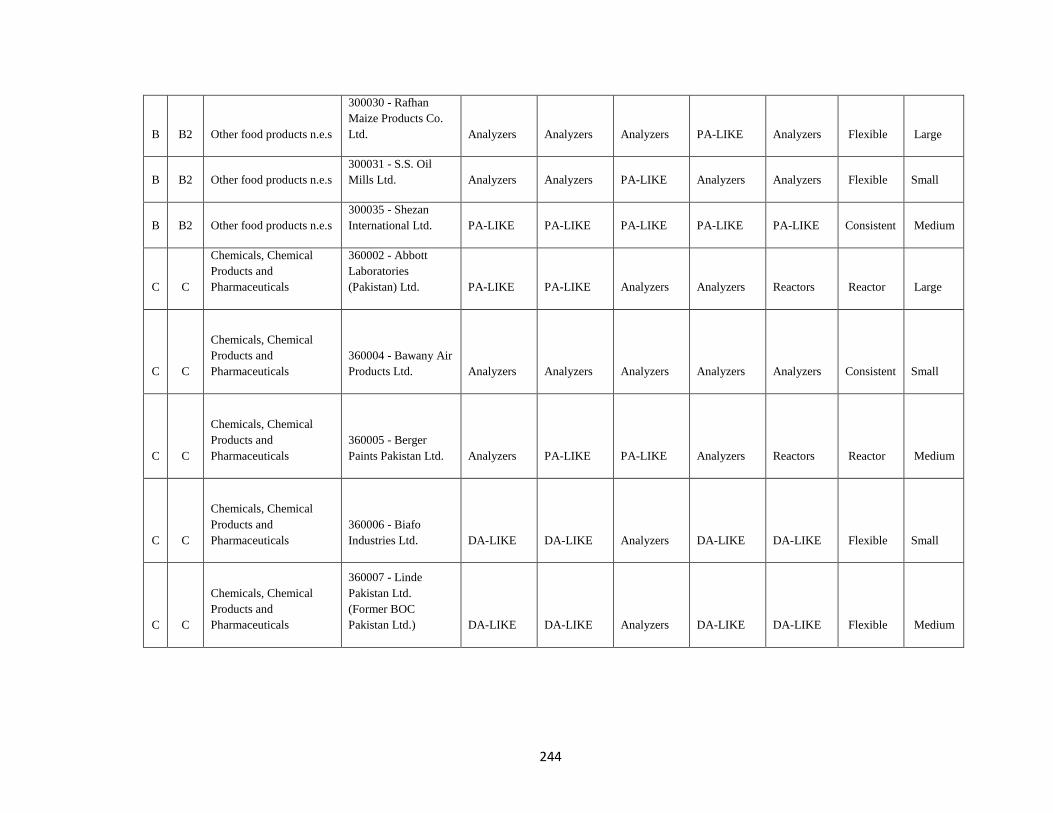
244
B B2 Other food products n.e.s
300030 - Rafhan
Maize Products Co.
Ltd. Analyzers Analyzers Analyzers PA-LIKE Analyzers Flexible Large
B B2 Other food products n.e.s
300031 - S.S. Oil
Mills Ltd. Analyzers Analyzers PA-LIKE Analyzers Analyzers Flexible Small
B B2 Other food products n.e.s
300035 - Shezan
International Ltd. PA-LIKE PA-LIKE PA-LIKE PA-LIKE PA-LIKE Consistent Medium
C C
Chemicals, Chemical
Products and
Pharmaceuticals
360002 - Abbott
Laboratories
(Pakistan) Ltd. PA-LIKE PA-LIKE Analyzers Analyzers Reactors Reactor Large
C C
Chemicals, Chemical
Products and
Pharmaceuticals
360004 - Bawany Air
Products Ltd. Analyzers Analyzers Analyzers Analyzers Analyzers Consistent Small
C C
Chemicals, Chemical
Products and
Pharmaceuticals
360005 - Berger
Paints Pakistan Ltd. Analyzers PA-LIKE PA-LIKE Analyzers Reactors Reactor Medium
C C
Chemicals, Chemical
Products and
Pharmaceuticals
360006 - Biafo
Industries Ltd. DA-LIKE DA-LIKE Analyzers DA-LIKE DA-LIKE Flexible Small
C C
Chemicals, Chemical
Products and
Pharmaceuticals
360007 - Linde
Pakistan Ltd.
(Former BOC
Pakistan Ltd.) DA-LIKE DA-LIKE Analyzers DA-LIKE DA-LIKE Flexible Medium
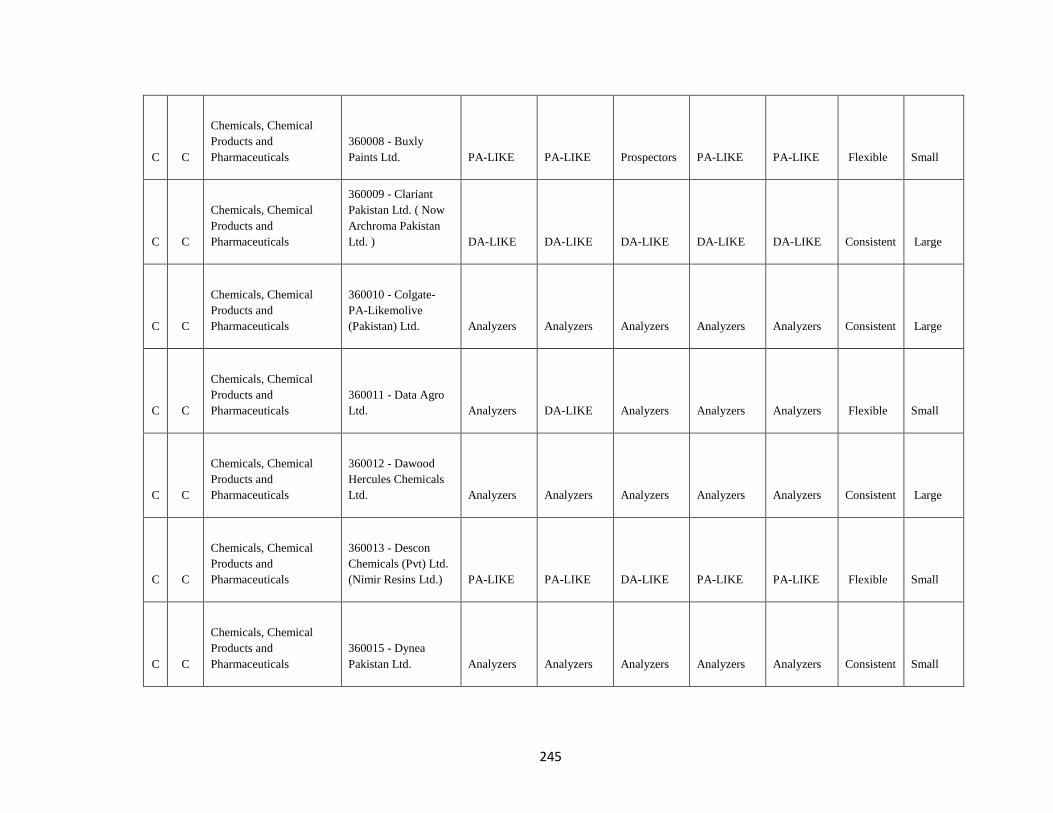
245
C C
Chemicals, Chemical
Products and
Pharmaceuticals
360008 - Buxly
Paints Ltd. PA-LIKE PA-LIKE Prospectors PA-LIKE PA-LIKE Flexible Small
C C
Chemicals, Chemical
Products and
Pharmaceuticals
360009 - Clariant
Pakistan Ltd. ( Now
Archroma Pakistan
Ltd. ) DA-LIKE DA-LIKE DA-LIKE DA-LIKE DA-LIKE Consistent Large
C C
Chemicals, Chemical
Products and
Pharmaceuticals
360010 - Colgate-
PA-Likemolive
(Pakistan) Ltd. Analyzers Analyzers Analyzers Analyzers Analyzers Consistent Large
C C
Chemicals, Chemical
Products and
Pharmaceuticals
360011 - Data Agro
Ltd. Analyzers DA-LIKE Analyzers Analyzers Analyzers Flexible Small
C C
Chemicals, Chemical
Products and
Pharmaceuticals
360012 - Dawood
Hercules Chemicals
Ltd. Analyzers Analyzers Analyzers Analyzers Analyzers Consistent Large
C C
Chemicals, Chemical
Products and
Pharmaceuticals
360013 - Descon
Chemicals (Pvt) Ltd.
(Nimir Resins Ltd.) PA-LIKE PA-LIKE DA-LIKE PA-LIKE PA-LIKE Flexible Small
C C
Chemicals, Chemical
Products and
Pharmaceuticals
360015 - Dynea
Pakistan Ltd. Analyzers Analyzers Analyzers Analyzers Analyzers Consistent Small
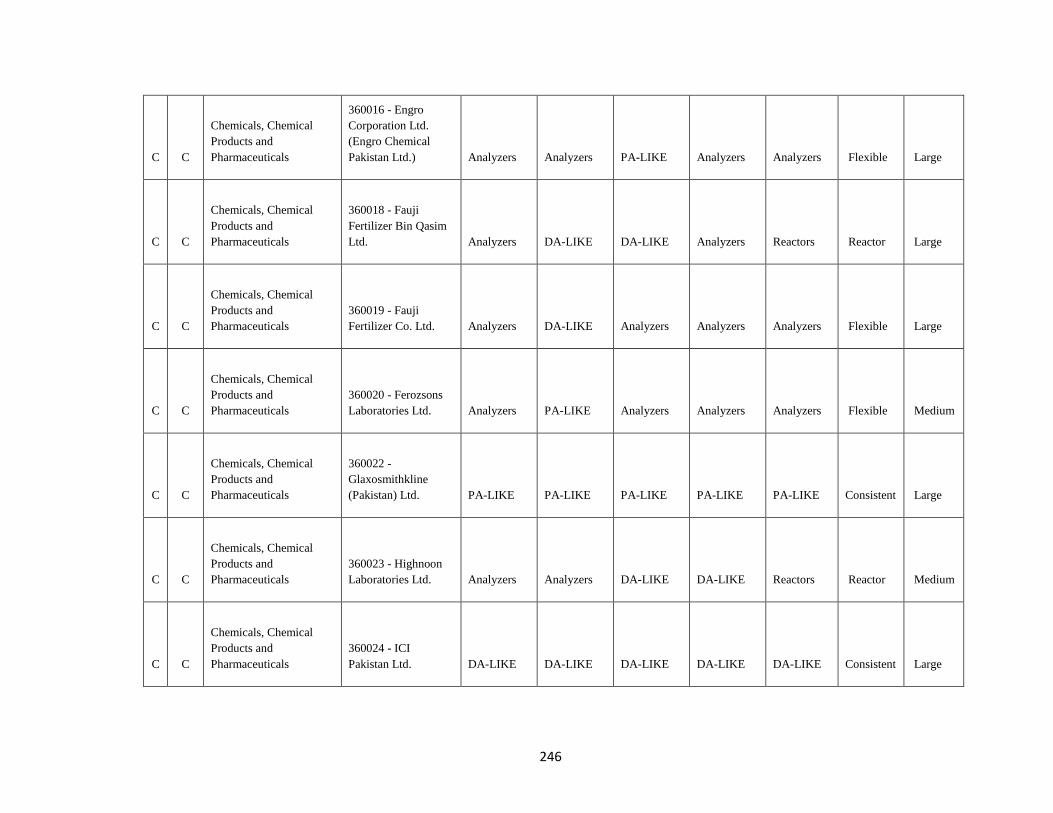
246
C C
Chemicals, Chemical
Products and
Pharmaceuticals
360016 - Engro
Corporation Ltd.
(Engro Chemical
Pakistan Ltd.) Analyzers Analyzers PA-LIKE Analyzers Analyzers Flexible Large
C C
Chemicals, Chemical
Products and
Pharmaceuticals
360018 - Fauji
Fertilizer Bin Qasim
Ltd. Analyzers DA-LIKE DA-LIKE Analyzers Reactors Reactor Large
C C
Chemicals, Chemical
Products and
Pharmaceuticals
360019 - Fauji
Fertilizer Co. Ltd. Analyzers DA-LIKE Analyzers Analyzers Analyzers Flexible Large
C C
Chemicals, Chemical
Products and
Pharmaceuticals
360020 - Ferozsons
Laboratories Ltd. Analyzers PA-LIKE Analyzers Analyzers Analyzers Flexible Medium
C C
Chemicals, Chemical
Products and
Pharmaceuticals
360022 -
Glaxosmithkline
(Pakistan) Ltd. PA-LIKE PA-LIKE PA-LIKE PA-LIKE PA-LIKE Consistent Large
C C
Chemicals, Chemical
Products and
Pharmaceuticals
360023 - Highnoon
Laboratories Ltd. Analyzers Analyzers DA-LIKE DA-LIKE Reactors Reactor Medium
C C
Chemicals, Chemical
Products and
Pharmaceuticals
360024 - ICI
Pakistan Ltd. DA-LIKE DA-LIKE DA-LIKE DA-LIKE DA-LIKE Consistent Large
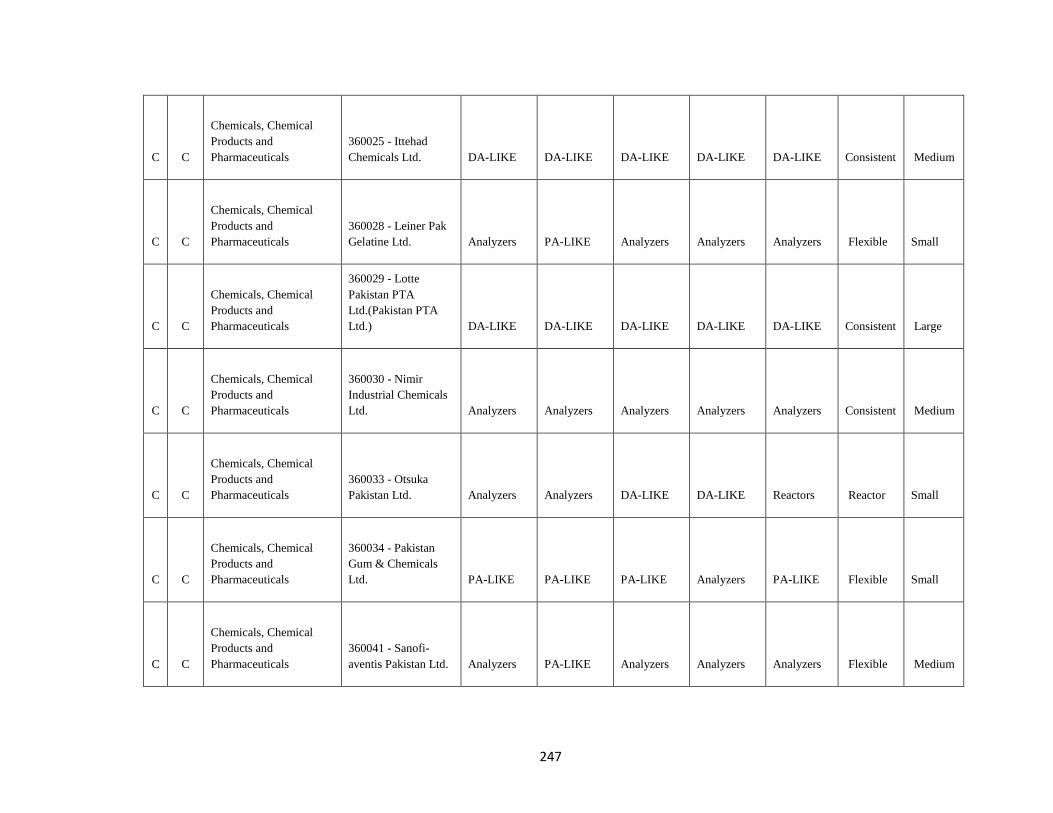
247
C C
Chemicals, Chemical
Products and
Pharmaceuticals
360025 - Ittehad
Chemicals Ltd. DA-LIKE DA-LIKE DA-LIKE DA-LIKE DA-LIKE Consistent Medium
C C
Chemicals, Chemical
Products and
Pharmaceuticals
360028 - Leiner Pak
Gelatine Ltd. Analyzers PA-LIKE Analyzers Analyzers Analyzers Flexible Small
C C
Chemicals, Chemical
Products and
Pharmaceuticals
360029 - Lotte
Pakistan PTA
Ltd.(Pakistan PTA
Ltd.) DA-LIKE DA-LIKE DA-LIKE DA-LIKE DA-LIKE Consistent Large
C C
Chemicals, Chemical
Products and
Pharmaceuticals
360030 - Nimir
Industrial Chemicals
Ltd. Analyzers Analyzers Analyzers Analyzers Analyzers Consistent Medium
C C
Chemicals, Chemical
Products and
Pharmaceuticals
360033 - Otsuka
Pakistan Ltd. Analyzers Analyzers DA-LIKE DA-LIKE Reactors Reactor Small
C C
Chemicals, Chemical
Products and
Pharmaceuticals
360034 - Pakistan
Gum & Chemicals
Ltd. PA-LIKE PA-LIKE PA-LIKE Analyzers PA-LIKE Flexible Small
C C
Chemicals, Chemical
Products and
Pharmaceuticals
360041 - Sanofi-
aventis Pakistan Ltd. Analyzers PA-LIKE Analyzers Analyzers Analyzers Flexible Medium
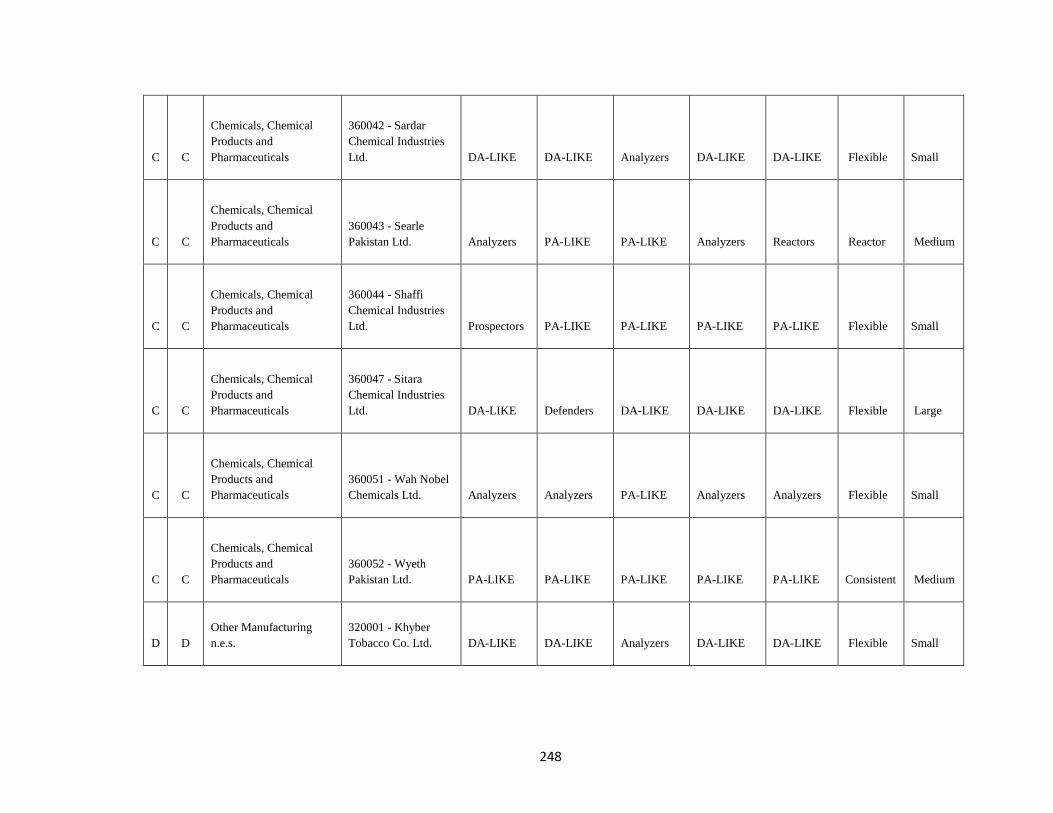
248
C C
Chemicals, Chemical
Products and
Pharmaceuticals
360042 - Sardar
Chemical Industries
Ltd. DA-LIKE DA-LIKE Analyzers DA-LIKE DA-LIKE Flexible Small
C C
Chemicals, Chemical
Products and
Pharmaceuticals
360043 - Searle
Pakistan Ltd. Analyzers PA-LIKE PA-LIKE Analyzers Reactors Reactor Medium
C C
Chemicals, Chemical
Products and
Pharmaceuticals
360044 - Shaffi
Chemical Industries
Ltd. Prospectors PA-LIKE PA-LIKE PA-LIKE PA-LIKE Flexible Small
C C
Chemicals, Chemical
Products and
Pharmaceuticals
360047 - Sitara
Chemical Industries
Ltd. DA-LIKE Defenders DA-LIKE DA-LIKE DA-LIKE Flexible Large
C C
Chemicals, Chemical
Products and
Pharmaceuticals
360051 - Wah Nobel
Chemicals Ltd. Analyzers Analyzers PA-LIKE Analyzers Analyzers Flexible Small
C C
Chemicals, Chemical
Products and
Pharmaceuticals
360052 - Wyeth
Pakistan Ltd. PA-LIKE PA-LIKE PA-LIKE PA-LIKE PA-LIKE Consistent Medium
D D
Other Manufacturing
n.e.s.
320001 - Khyber
Tobacco Co. Ltd. DA-LIKE DA-LIKE Analyzers DA-LIKE DA-LIKE Flexible Small
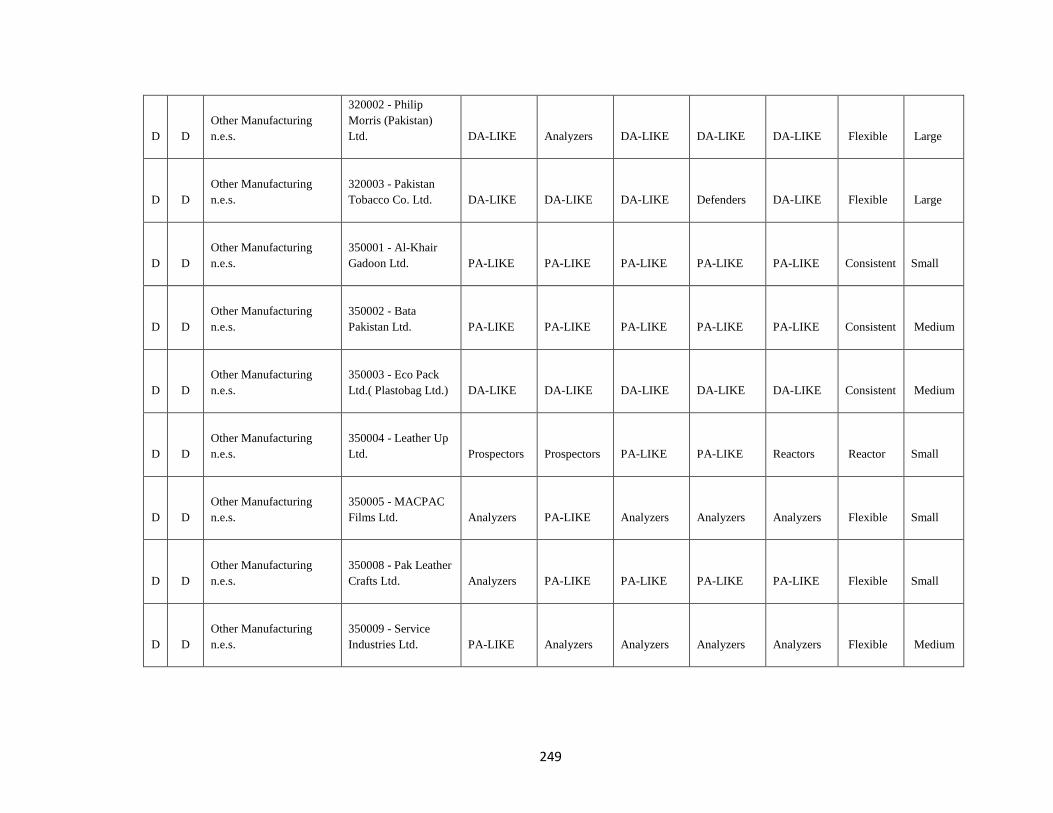
249
D D
Other Manufacturing
n.e.s.
320002 - Philip
Morris (Pakistan)
Ltd. DA-LIKE Analyzers DA-LIKE DA-LIKE DA-LIKE Flexible Large
D D
Other Manufacturing
n.e.s.
320003 - Pakistan
Tobacco Co. Ltd. DA-LIKE DA-LIKE DA-LIKE Defenders DA-LIKE Flexible Large
D D
Other Manufacturing
n.e.s.
350001 - Al-Khair
Gadoon Ltd. PA-LIKE PA-LIKE PA-LIKE PA-LIKE PA-LIKE Consistent Small
D D
Other Manufacturing
n.e.s.
350002 - Bata
Pakistan Ltd. PA-LIKE PA-LIKE PA-LIKE PA-LIKE PA-LIKE Consistent Medium
D D
Other Manufacturing
n.e.s.
350003 - Eco Pack
Ltd.( Plastobag Ltd.) DA-LIKE DA-LIKE DA-LIKE DA-LIKE DA-LIKE Consistent Medium
D D
Other Manufacturing
n.e.s.
350004 - Leather Up
Ltd. Prospectors Prospectors PA-LIKE PA-LIKE Reactors Reactor Small
D D
Other Manufacturing
n.e.s.
350005 - MACPAC
Films Ltd. Analyzers PA-LIKE Analyzers Analyzers Analyzers Flexible Small
D D
Other Manufacturing
n.e.s.
350008 - Pak Leather
Crafts Ltd. Analyzers PA-LIKE PA-LIKE PA-LIKE PA-LIKE Flexible Small
D D
Other Manufacturing
n.e.s.
350009 - Service
Industries Ltd. PA-LIKE Analyzers Analyzers Analyzers Analyzers Flexible Medium
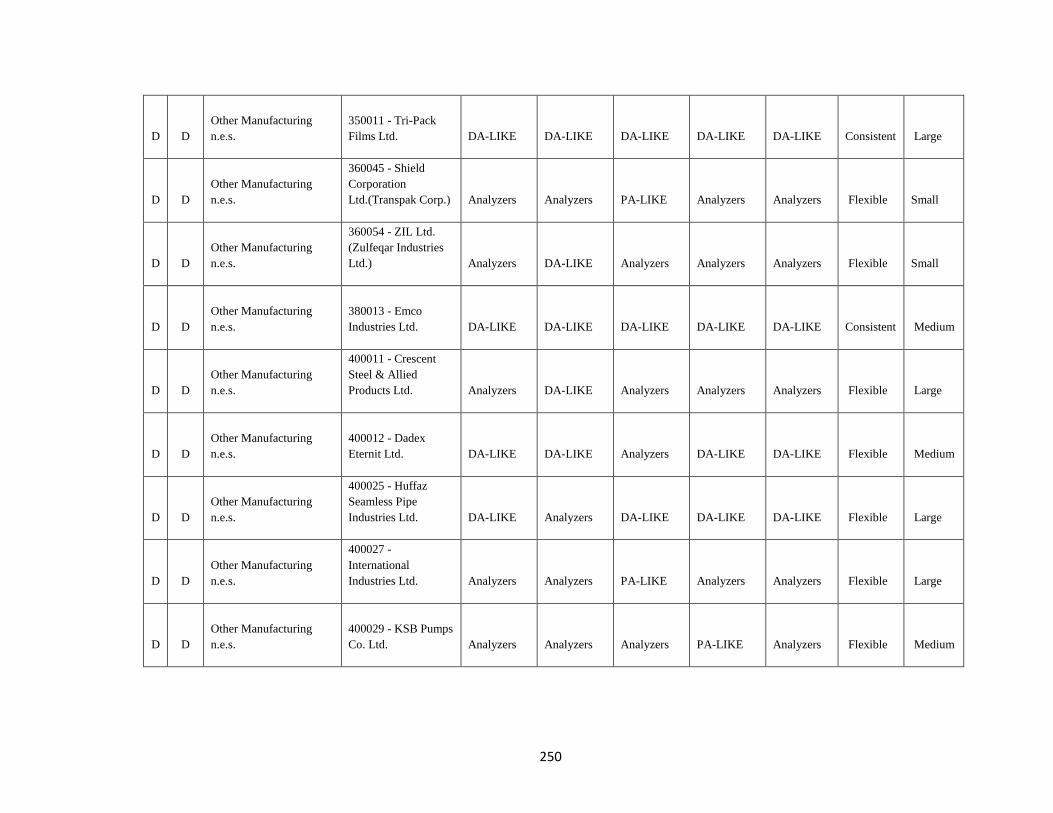
250
D D
Other Manufacturing
n.e.s.
350011 - Tri-Pack
Films Ltd. DA-LIKE DA-LIKE DA-LIKE DA-LIKE DA-LIKE Consistent Large
D D
Other Manufacturing
n.e.s.
360045 - Shield
Corporation
Ltd.(Transpak Corp.) Analyzers Analyzers PA-LIKE Analyzers Analyzers Flexible Small
D D
Other Manufacturing
n.e.s.
360054 - ZIL Ltd.
(Zulfeqar Industries
Ltd.) Analyzers DA-LIKE Analyzers Analyzers Analyzers Flexible Small
D D
Other Manufacturing
n.e.s.
380013 - Emco
Industries Ltd. DA-LIKE DA-LIKE DA-LIKE DA-LIKE DA-LIKE Consistent Medium
D D
Other Manufacturing
n.e.s.
400011 - Crescent
Steel & Allied
Products Ltd. Analyzers DA-LIKE Analyzers Analyzers Analyzers Flexible Large
D D
Other Manufacturing
n.e.s.
400012 - Dadex
Eternit Ltd. DA-LIKE DA-LIKE Analyzers DA-LIKE DA-LIKE Flexible Medium
D D
Other Manufacturing
n.e.s.
400025 - Huffaz
Seamless Pipe
Industries Ltd. DA-LIKE Analyzers DA-LIKE DA-LIKE DA-LIKE Flexible Large
D D
Other Manufacturing
n.e.s.
400027 -
International
Industries Ltd. Analyzers Analyzers PA-LIKE Analyzers Analyzers Flexible Large
D D
Other Manufacturing
n.e.s.
400029 - KSB Pumps
Co. Ltd. Analyzers Analyzers Analyzers PA-LIKE Analyzers Flexible Medium
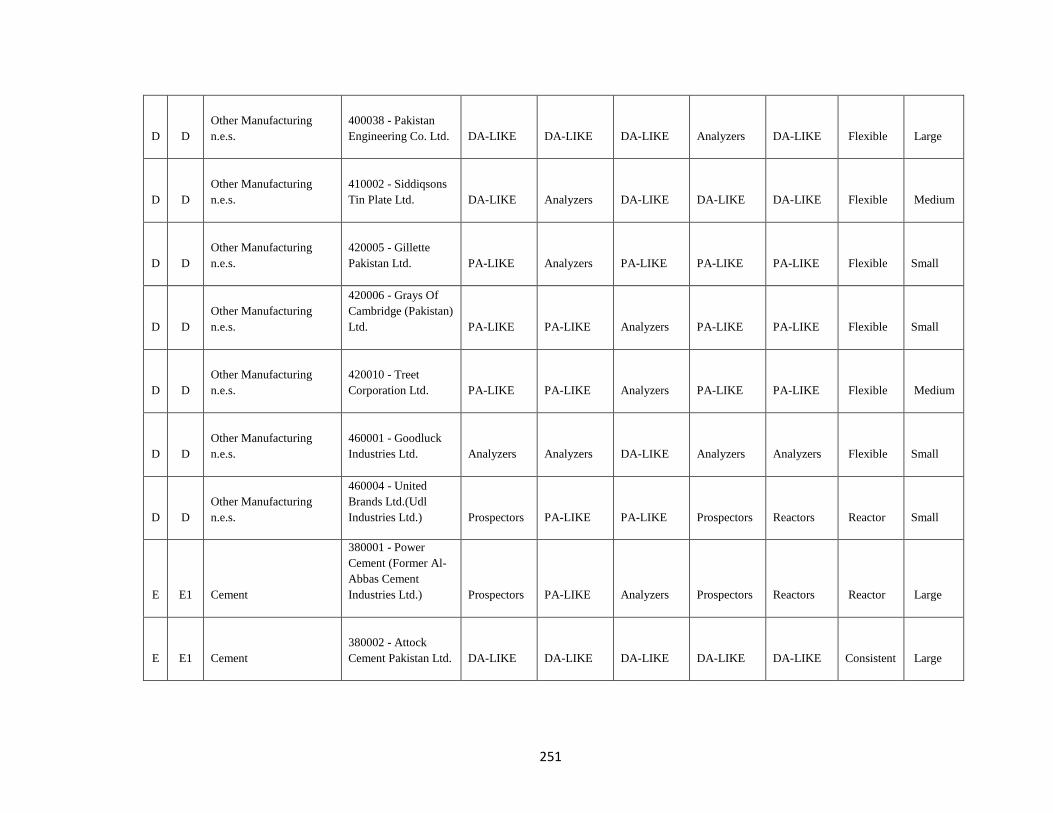
251
D D
Other Manufacturing
n.e.s.
400038 - Pakistan
Engineering Co. Ltd. DA-LIKE DA-LIKE DA-LIKE Analyzers DA-LIKE Flexible Large
D D
Other Manufacturing
n.e.s.
410002 - Siddiqsons
Tin Plate Ltd. DA-LIKE Analyzers DA-LIKE DA-LIKE DA-LIKE Flexible Medium
D D
Other Manufacturing
n.e.s.
420005 - Gillette
Pakistan Ltd. PA-LIKE Analyzers PA-LIKE PA-LIKE PA-LIKE Flexible Small
D D
Other Manufacturing
n.e.s.
420006 - Grays Of
Cambridge (Pakistan)
Ltd. PA-LIKE PA-LIKE Analyzers PA-LIKE PA-LIKE Flexible Small
D D
Other Manufacturing
n.e.s.
420010 - Treet
Corporation Ltd. PA-LIKE PA-LIKE Analyzers PA-LIKE PA-LIKE Flexible Medium
D D
Other Manufacturing
n.e.s.
460001 - Goodluck
Industries Ltd. Analyzers Analyzers DA-LIKE Analyzers Analyzers Flexible Small
D D
Other Manufacturing
n.e.s.
460004 - United
Brands Ltd.(Udl
Industries Ltd.) Prospectors PA-LIKE PA-LIKE Prospectors Reactors Reactor Small
E E1 Cement
380001 - Power
Cement (Former Al-
Abbas Cement
Industries Ltd.) Prospectors PA-LIKE Analyzers Prospectors Reactors Reactor Large
E E1 Cement
380002 - Attock
Cement Pakistan Ltd. DA-LIKE DA-LIKE DA-LIKE DA-LIKE DA-LIKE Consistent Large
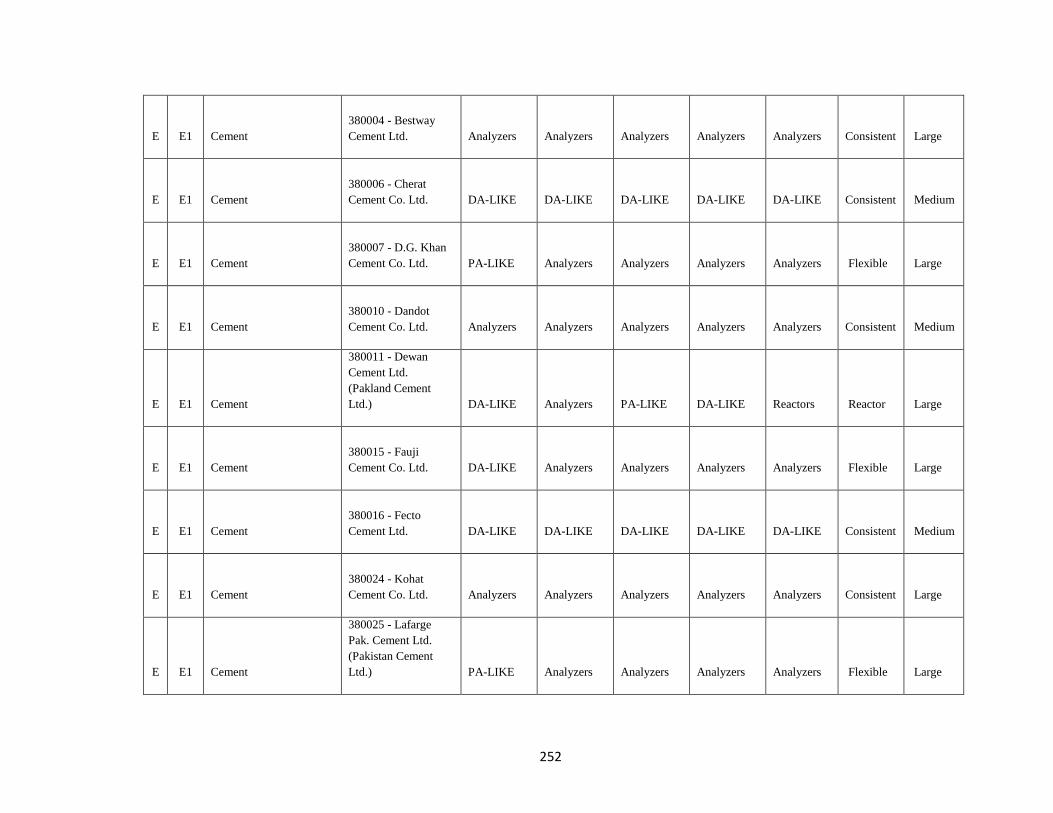
252
E E1 Cement
380004 - Bestway
Cement Ltd. Analyzers Analyzers Analyzers Analyzers Analyzers Consistent Large
E E1 Cement
380006 - Cherat
Cement Co. Ltd. DA-LIKE DA-LIKE DA-LIKE DA-LIKE DA-LIKE Consistent Medium
E E1 Cement
380007 - D.G. Khan
Cement Co. Ltd. PA-LIKE Analyzers Analyzers Analyzers Analyzers Flexible Large
E E1 Cement
380010 - Dandot
Cement Co. Ltd. Analyzers Analyzers Analyzers Analyzers Analyzers Consistent Medium
E E1 Cement
380011 - Dewan
Cement Ltd.
(Pakland Cement
Ltd.) DA-LIKE Analyzers PA-LIKE DA-LIKE Reactors Reactor Large
E E1 Cement
380015 - Fauji
Cement Co. Ltd. DA-LIKE Analyzers Analyzers Analyzers Analyzers Flexible Large
E E1 Cement
380016 - Fecto
Cement Ltd. DA-LIKE DA-LIKE DA-LIKE DA-LIKE DA-LIKE Consistent Medium
E E1 Cement
380024 - Kohat
Cement Co. Ltd. Analyzers Analyzers Analyzers Analyzers Analyzers Consistent Large
E E1 Cement
380025 - Lafarge
Pak. Cement Ltd.
(Pakistan Cement
Ltd.) PA-LIKE Analyzers Analyzers Analyzers Analyzers Flexible Large
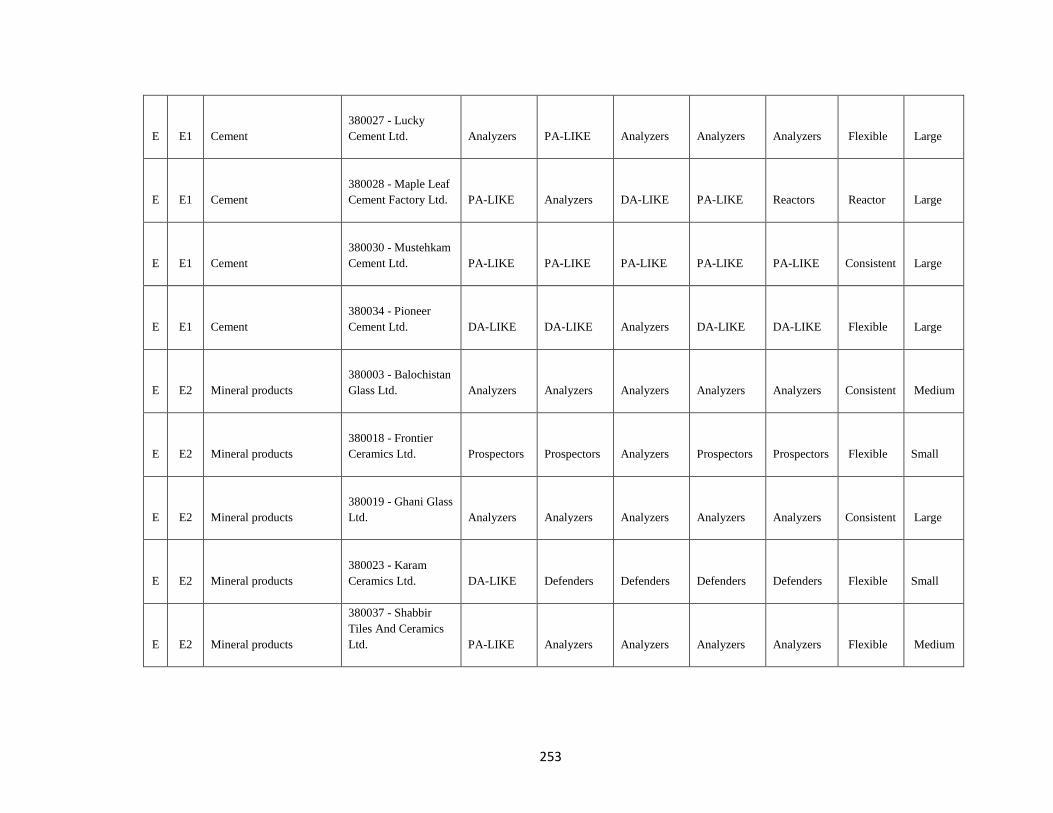
253
E E1 Cement
380027 - Lucky
Cement Ltd. Analyzers PA-LIKE Analyzers Analyzers Analyzers Flexible Large
E E1 Cement
380028 - Maple Leaf
Cement Factory Ltd. PA-LIKE Analyzers DA-LIKE PA-LIKE Reactors Reactor Large
E E1 Cement
380030 - Mustehkam
Cement Ltd. PA-LIKE PA-LIKE PA-LIKE PA-LIKE PA-LIKE Consistent Large
E E1 Cement
380034 - Pioneer
Cement Ltd. DA-LIKE DA-LIKE Analyzers DA-LIKE DA-LIKE Flexible Large
E E2 Mineral products
380003 - Balochistan
Glass Ltd. Analyzers Analyzers Analyzers Analyzers Analyzers Consistent Medium
E E2 Mineral products
380018 - Frontier
Ceramics Ltd. Prospectors Prospectors Analyzers Prospectors Prospectors Flexible Small
E E2 Mineral products
380019 - Ghani Glass
Ltd. Analyzers Analyzers Analyzers Analyzers Analyzers Consistent Large
E E2 Mineral products
380023 - Karam
Ceramics Ltd. DA-LIKE Defenders Defenders Defenders Defenders Flexible Small
E E2 Mineral products
380037 - Shabbir
Tiles And Ceramics
Ltd. PA-LIKE Analyzers Analyzers Analyzers Analyzers Flexible Medium
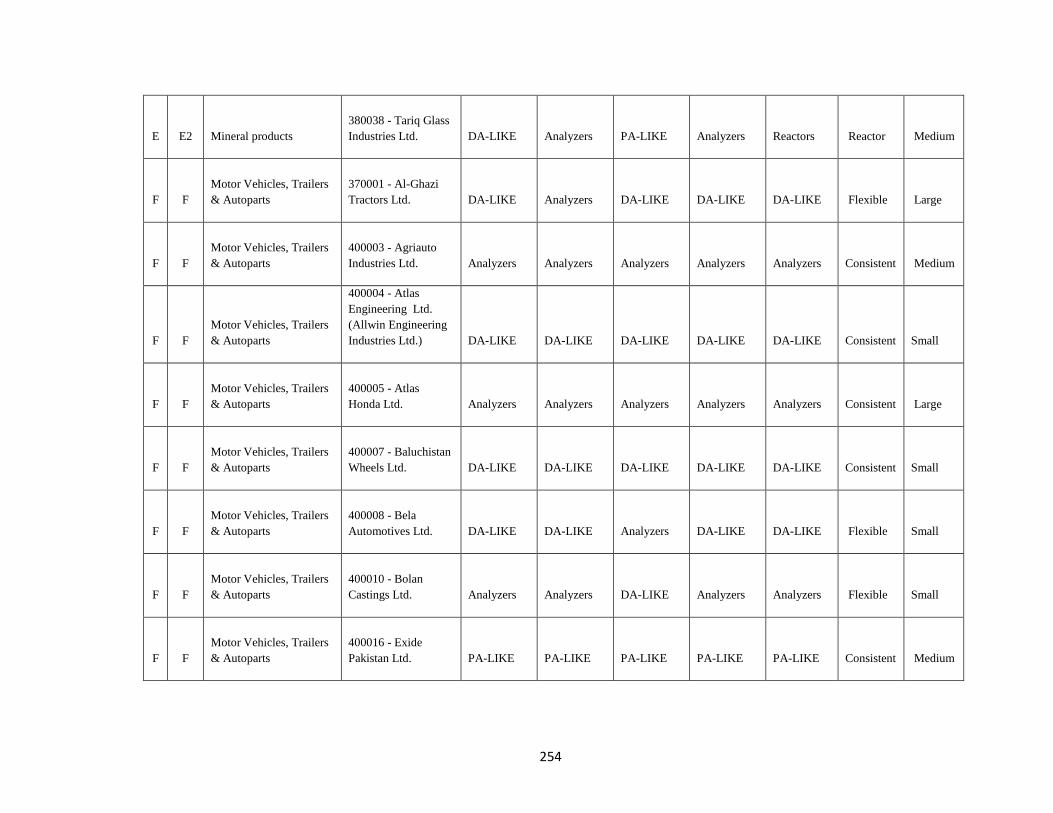
254
E E2 Mineral products
380038 - Tariq Glass
Industries Ltd. DA-LIKE Analyzers PA-LIKE Analyzers Reactors Reactor Medium
F F
Motor Vehicles, Trailers
& Autoparts
370001 - Al-Ghazi
Tractors Ltd. DA-LIKE Analyzers DA-LIKE DA-LIKE DA-LIKE Flexible Large
F F
Motor Vehicles, Trailers
& Autoparts
400003 - Agriauto
Industries Ltd. Analyzers Analyzers Analyzers Analyzers Analyzers Consistent Medium
F F
Motor Vehicles, Trailers
& Autoparts
400004 - Atlas
Engineering Ltd.
(Allwin Engineering
Industries Ltd.) DA-LIKE DA-LIKE DA-LIKE DA-LIKE DA-LIKE Consistent Small
F F
Motor Vehicles, Trailers
& Autoparts
400005 - Atlas
Honda Ltd. Analyzers Analyzers Analyzers Analyzers Analyzers Consistent Large
F F
Motor Vehicles, Trailers
& Autoparts
400007 - Baluchistan
Wheels Ltd. DA-LIKE DA-LIKE DA-LIKE DA-LIKE DA-LIKE Consistent Small
F F
Motor Vehicles, Trailers
& Autoparts
400008 - Bela
Automotives Ltd. DA-LIKE DA-LIKE Analyzers DA-LIKE DA-LIKE Flexible Small
F F
Motor Vehicles, Trailers
& Autoparts
400010 - Bolan
Castings Ltd. Analyzers Analyzers DA-LIKE Analyzers Analyzers Flexible Small
F F
Motor Vehicles, Trailers
& Autoparts
400016 - Exide
Pakistan Ltd. PA-LIKE PA-LIKE PA-LIKE PA-LIKE PA-LIKE Consistent Medium
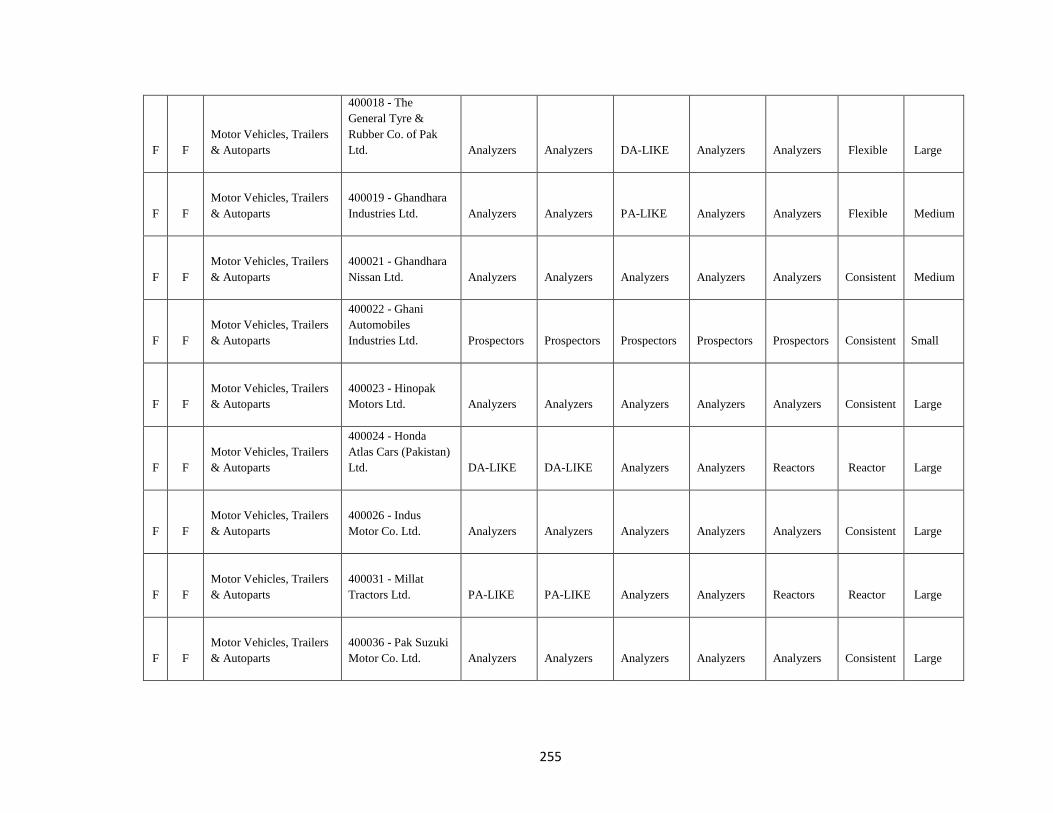
255
F F
Motor Vehicles, Trailers
& Autoparts
400018 - The
General Tyre &
Rubber Co. of Pak
Ltd. Analyzers Analyzers DA-LIKE Analyzers Analyzers Flexible Large
F F
Motor Vehicles, Trailers
& Autoparts
400019 - Ghandhara
Industries Ltd. Analyzers Analyzers PA-LIKE Analyzers Analyzers Flexible Medium
F F
Motor Vehicles, Trailers
& Autoparts
400021 - Ghandhara
Nissan Ltd. Analyzers Analyzers Analyzers Analyzers Analyzers Consistent Medium
F F
Motor Vehicles, Trailers
& Autoparts
400022 - Ghani
Automobiles
Industries Ltd. Prospectors Prospectors Prospectors Prospectors Prospectors Consistent Small
F F
Motor Vehicles, Trailers
& Autoparts
400023 - Hinopak
Motors Ltd. Analyzers Analyzers Analyzers Analyzers Analyzers Consistent Large
F F
Motor Vehicles, Trailers
& Autoparts
400024 - Honda
Atlas Cars (Pakistan)
Ltd. DA-LIKE DA-LIKE Analyzers Analyzers Reactors Reactor Large
F F
Motor Vehicles, Trailers
& Autoparts
400026 - Indus
Motor Co. Ltd. Analyzers Analyzers Analyzers Analyzers Analyzers Consistent Large
F F
Motor Vehicles, Trailers
& Autoparts
400031 - Millat
Tractors Ltd. PA-LIKE PA-LIKE Analyzers Analyzers Reactors Reactor Large
F F
Motor Vehicles, Trailers
& Autoparts
400036 - Pak Suzuki
Motor Co. Ltd. Analyzers Analyzers Analyzers Analyzers Analyzers Consistent Large
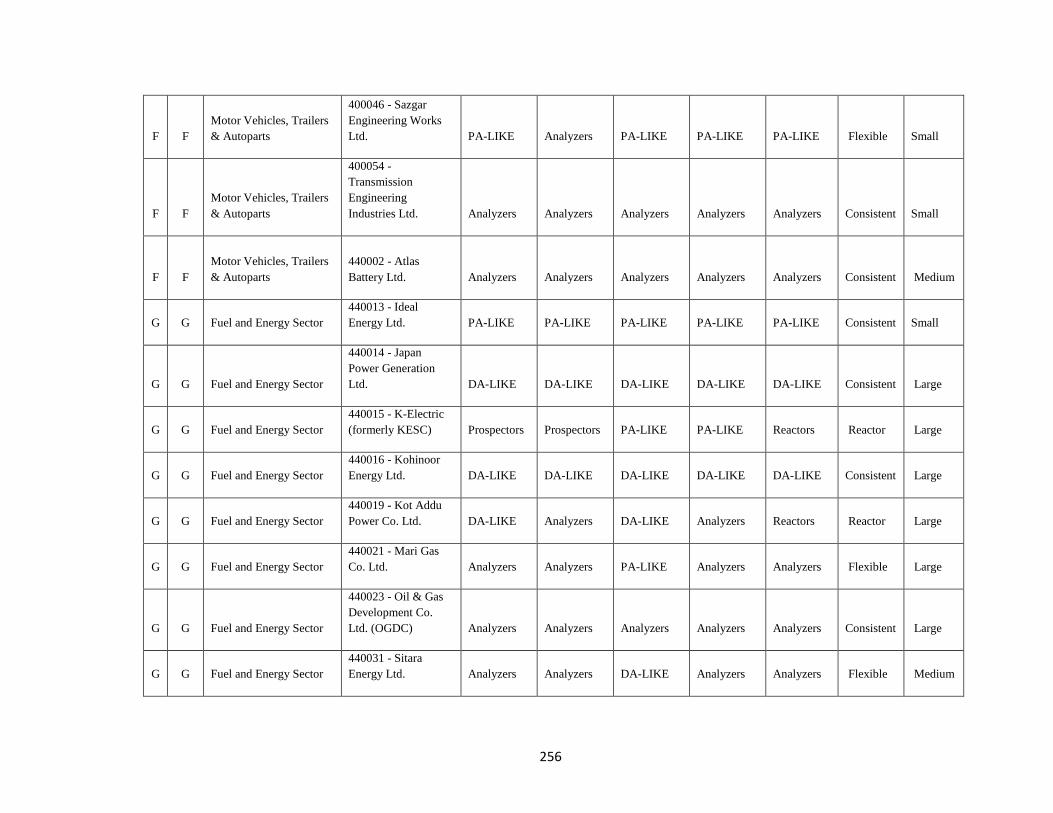
256
F F
Motor Vehicles, Trailers
& Autoparts
400046 - Sazgar
Engineering Works
Ltd. PA-LIKE Analyzers PA-LIKE PA-LIKE PA-LIKE Flexible Small
F F
Motor Vehicles, Trailers
& Autoparts
400054 -
Transmission
Engineering
Industries Ltd. Analyzers Analyzers Analyzers Analyzers Analyzers Consistent Small
F F
Motor Vehicles, Trailers
& Autoparts
440002 - Atlas
Battery Ltd. Analyzers Analyzers Analyzers Analyzers Analyzers Consistent Medium
G G Fuel and Energy Sector
440013 - Ideal
Energy Ltd. PA-LIKE PA-LIKE PA-LIKE PA-LIKE PA-LIKE Consistent Small
G G Fuel and Energy Sector
440014 - Japan
Power Generation
Ltd. DA-LIKE DA-LIKE DA-LIKE DA-LIKE DA-LIKE Consistent Large
G G Fuel and Energy Sector
440015 - K-Electric
(formerly KESC) Prospectors Prospectors PA-LIKE PA-LIKE Reactors Reactor Large
G G Fuel and Energy Sector
440016 - Kohinoor
Energy Ltd. DA-LIKE DA-LIKE DA-LIKE DA-LIKE DA-LIKE Consistent Large
G G Fuel and Energy Sector
440019 - Kot Addu
Power Co. Ltd. DA-LIKE Analyzers DA-LIKE Analyzers Reactors Reactor Large
G G Fuel and Energy Sector
440021 - Mari Gas
Co. Ltd. Analyzers Analyzers PA-LIKE Analyzers Analyzers Flexible Large
G G Fuel and Energy Sector
440023 - Oil & Gas
Development Co.
Ltd. (OGDC) Analyzers Analyzers Analyzers Analyzers Analyzers Consistent Large
G G Fuel and Energy Sector
440031 - Sitara
Energy Ltd. Analyzers Analyzers DA-LIKE Analyzers Analyzers Flexible Medium
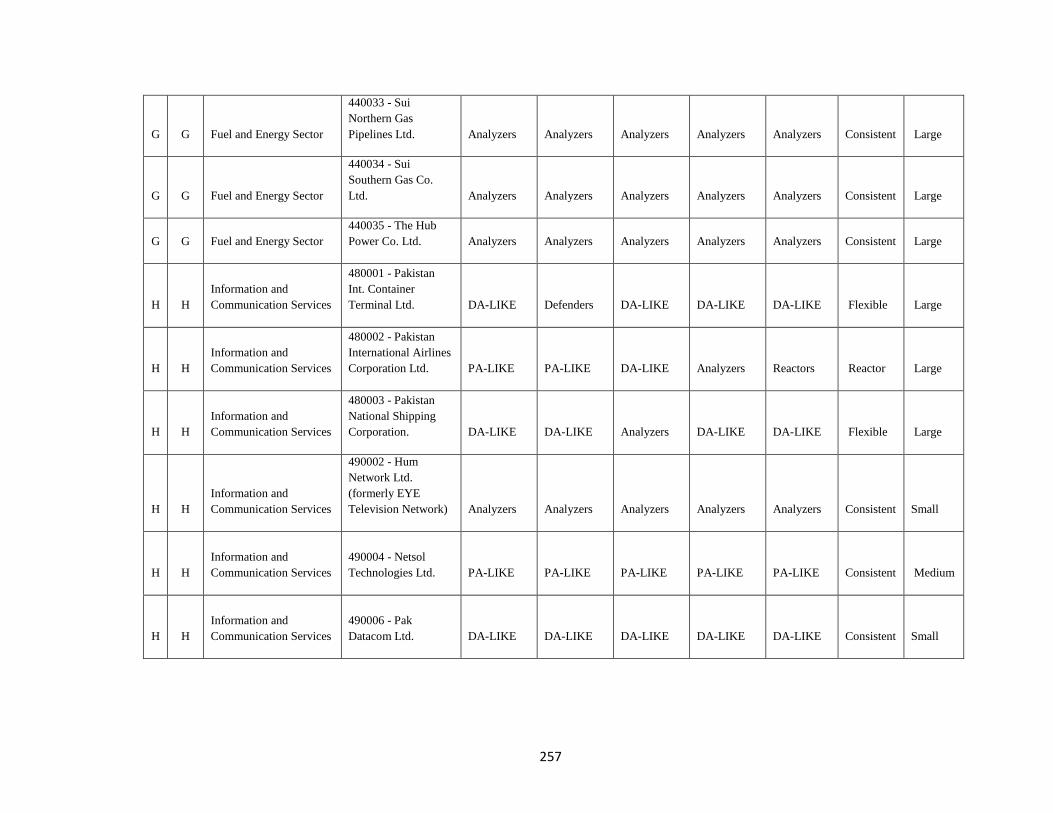
257
G G Fuel and Energy Sector
440033 - Sui
Northern Gas
Pipelines Ltd. Analyzers Analyzers Analyzers Analyzers Analyzers Consistent Large
G G Fuel and Energy Sector
440034 - Sui
Southern Gas Co.
Ltd. Analyzers Analyzers Analyzers Analyzers Analyzers Consistent Large
G G Fuel and Energy Sector
440035 - The Hub
Power Co. Ltd. Analyzers Analyzers Analyzers Analyzers Analyzers Consistent Large
H H
Information and
Communication Services
480001 - Pakistan
Int. Container
Terminal Ltd. DA-LIKE Defenders DA-LIKE DA-LIKE DA-LIKE Flexible Large
H H
Information and
Communication Services
480002 - Pakistan
International Airlines
Corporation Ltd. PA-LIKE PA-LIKE DA-LIKE Analyzers Reactors Reactor Large
H H
Information and
Communication Services
480003 - Pakistan
National Shipping
Corporation. DA-LIKE DA-LIKE Analyzers DA-LIKE DA-LIKE Flexible Large
H H
Information and
Communication Services
490002 - Hum
Network Ltd.
(formerly EYE
Television Network) Analyzers Analyzers Analyzers Analyzers Analyzers Consistent Small
H H
Information and
Communication Services
490004 - Netsol
Technologies Ltd. PA-LIKE PA-LIKE PA-LIKE PA-LIKE PA-LIKE Consistent Medium
H H
Information and
Communication Services
490006 - Pak
Datacom Ltd. DA-LIKE DA-LIKE DA-LIKE DA-LIKE DA-LIKE Consistent Small
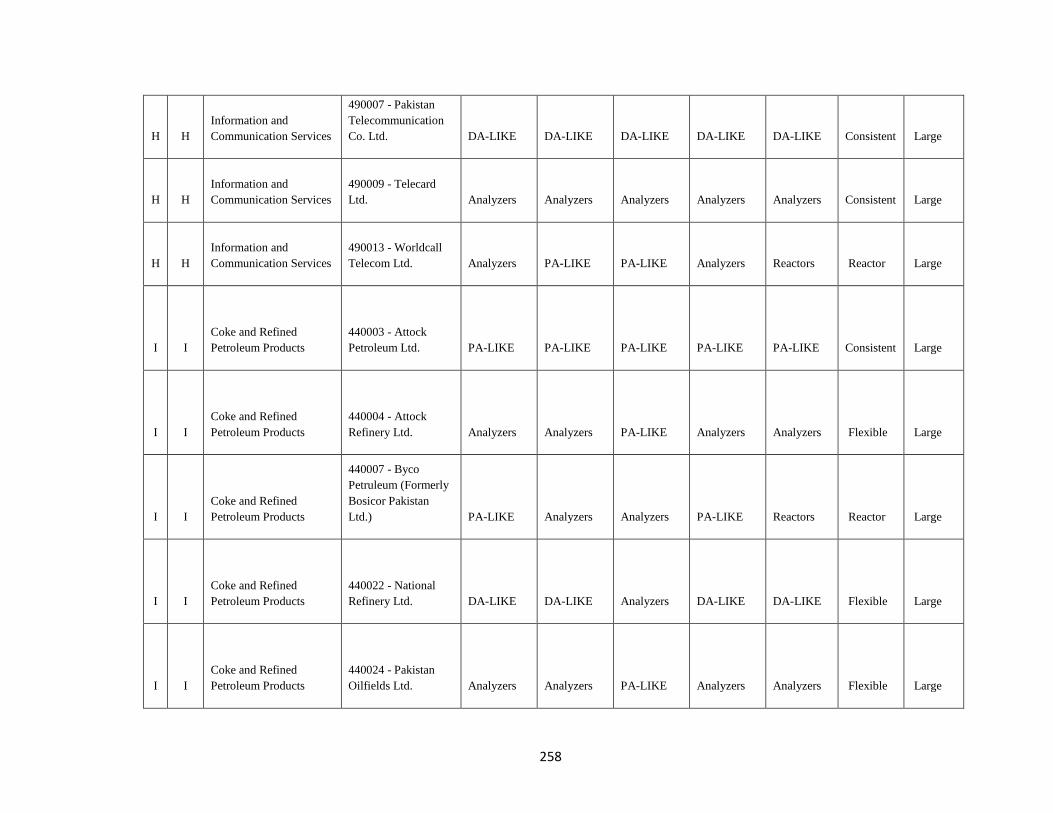
258
H H
Information and
Communication Services
490007 - Pakistan
Telecommunication
Co. Ltd. DA-LIKE DA-LIKE DA-LIKE DA-LIKE DA-LIKE Consistent Large
H H
Information and
Communication Services
490009 - Telecard
Ltd. Analyzers Analyzers Analyzers Analyzers Analyzers Consistent Large
H H
Information and
Communication Services
490013 - Worldcall
Telecom Ltd. Analyzers PA-LIKE PA-LIKE Analyzers Reactors Reactor Large
I I
Coke and Refined
Petroleum Products
440003 - Attock
Petroleum Ltd. PA-LIKE PA-LIKE PA-LIKE PA-LIKE PA-LIKE Consistent Large
I I
Coke and Refined
Petroleum Products
440004 - Attock
Refinery Ltd. Analyzers Analyzers PA-LIKE Analyzers Analyzers Flexible Large
I I
Coke and Refined
Petroleum Products
440007 - Byco
Petruleum (Formerly
Bosicor Pakistan
Ltd.) PA-LIKE Analyzers Analyzers PA-LIKE Reactors Reactor Large
I I
Coke and Refined
Petroleum Products
440022 - National
Refinery Ltd. DA-LIKE DA-LIKE Analyzers DA-LIKE DA-LIKE Flexible Large
I I
Coke and Refined
Petroleum Products
440024 - Pakistan
Oilfields Ltd. Analyzers Analyzers PA-LIKE Analyzers Analyzers Flexible Large
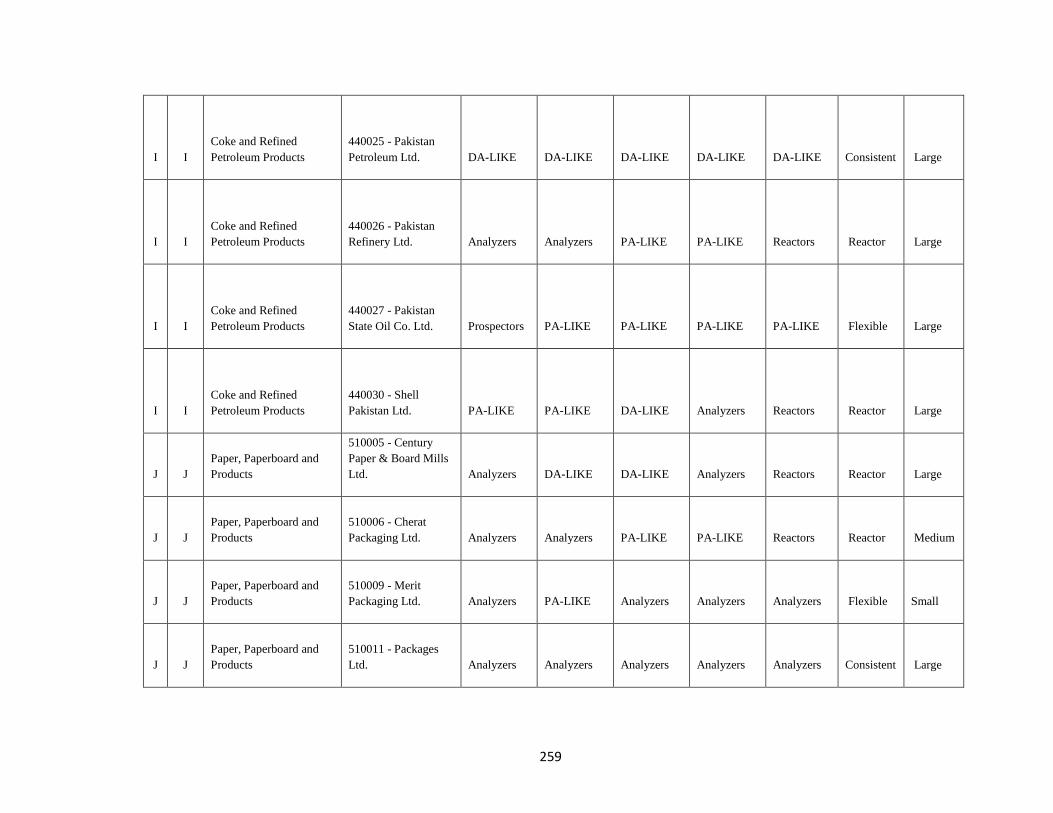
259
I I
Coke and Refined
Petroleum Products
440025 - Pakistan
Petroleum Ltd. DA-LIKE DA-LIKE DA-LIKE DA-LIKE DA-LIKE Consistent Large
I I
Coke and Refined
Petroleum Products
440026 - Pakistan
Refinery Ltd. Analyzers Analyzers PA-LIKE PA-LIKE Reactors Reactor Large
I I
Coke and Refined
Petroleum Products
440027 - Pakistan
State Oil Co. Ltd. Prospectors PA-LIKE PA-LIKE PA-LIKE PA-LIKE Flexible Large
I I
Coke and Refined
Petroleum Products
440030 - Shell
Pakistan Ltd. PA-LIKE PA-LIKE DA-LIKE Analyzers Reactors Reactor Large
J J
Paper, Paperboard and
Products
510005 - Century
Paper & Board Mills
Ltd. Analyzers DA-LIKE DA-LIKE Analyzers Reactors Reactor Large
J J
Paper, Paperboard and
Products
510006 - Cherat
Packaging Ltd. Analyzers Analyzers PA-LIKE PA-LIKE Reactors Reactor Medium
J J
Paper, Paperboard and
Products
510009 - Merit
Packaging Ltd. Analyzers PA-LIKE Analyzers Analyzers Analyzers Flexible Small
J J
Paper, Paperboard and
Products
510011 - Packages
Ltd. Analyzers Analyzers Analyzers Analyzers Analyzers Consistent Large
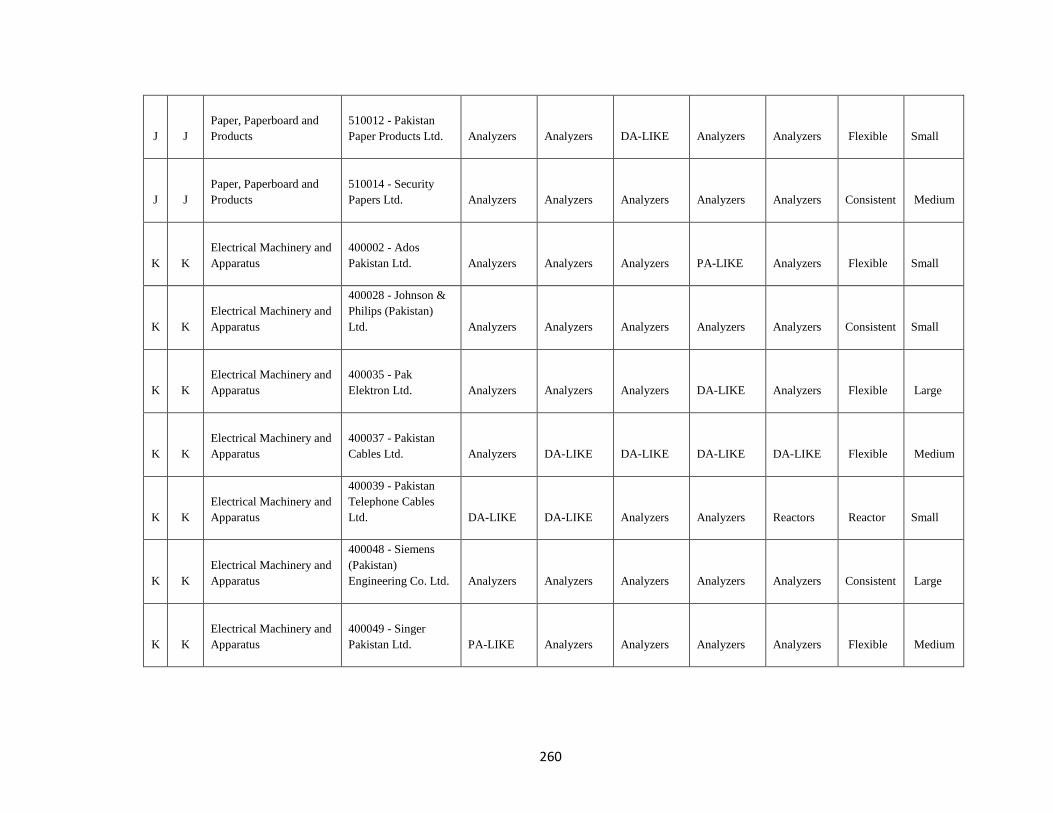
260
J J
Paper, Paperboard and
Products
510012 - Pakistan
Paper Products Ltd. Analyzers Analyzers DA-LIKE Analyzers Analyzers Flexible Small
J J
Paper, Paperboard and
Products
510014 - Security
Papers Ltd. Analyzers Analyzers Analyzers Analyzers Analyzers Consistent Medium
K K
Electrical Machinery and
Apparatus
400002 - Ados
Pakistan Ltd. Analyzers Analyzers Analyzers PA-LIKE Analyzers Flexible Small
K K
Electrical Machinery and
Apparatus
400028 - Johnson &
Philips (Pakistan)
Ltd. Analyzers Analyzers Analyzers Analyzers Analyzers Consistent Small
K K
Electrical Machinery and
Apparatus
400035 - Pak
Elektron Ltd. Analyzers Analyzers Analyzers DA-LIKE Analyzers Flexible Large
K K
Electrical Machinery and
Apparatus
400037 - Pakistan
Cables Ltd. Analyzers DA-LIKE DA-LIKE DA-LIKE DA-LIKE Flexible Medium
K K
Electrical Machinery and
Apparatus
400039 - Pakistan
Telephone Cables
Ltd. DA-LIKE DA-LIKE Analyzers Analyzers Reactors Reactor Small
K K
Electrical Machinery and
Apparatus
400048 - Siemens
(Pakistan)
Engineering Co. Ltd. Analyzers Analyzers Analyzers Analyzers Analyzers Consistent Large
K K
Electrical Machinery and
Apparatus
400049 - Singer
Pakistan Ltd. PA-LIKE Analyzers Analyzers Analyzers Analyzers Flexible Medium
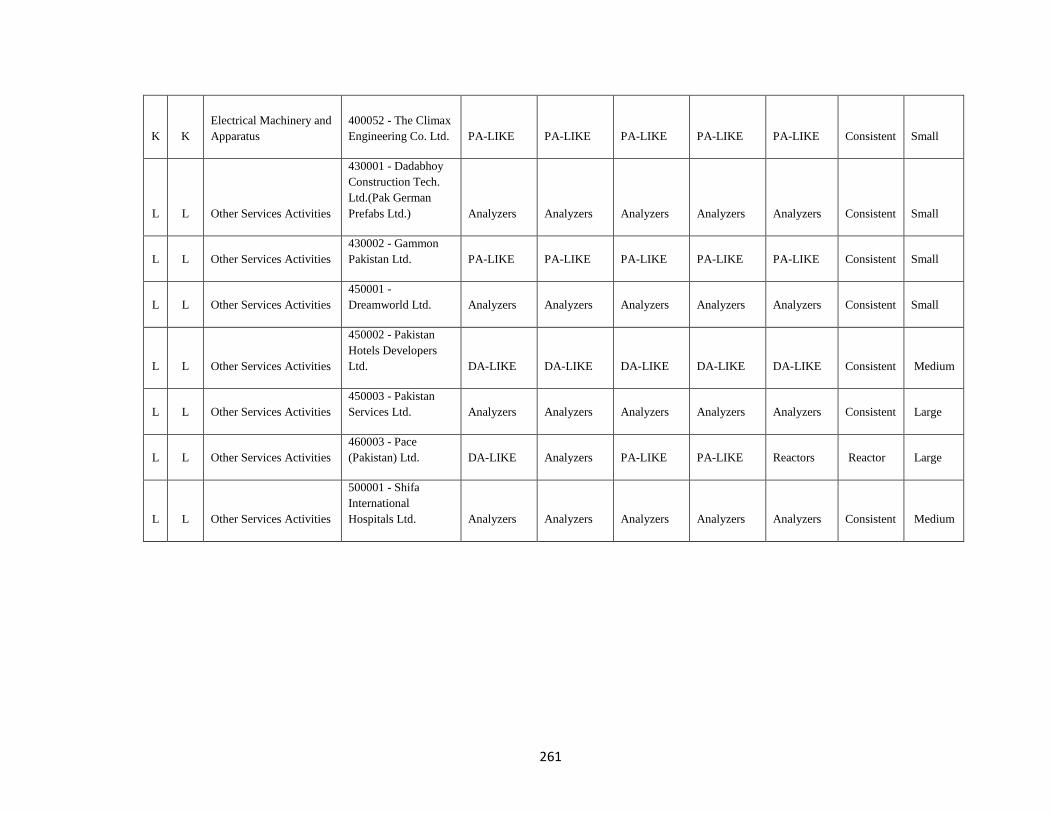
261
K K
Electrical Machinery and
Apparatus
400052 - The Climax
Engineering Co. Ltd. PA-LIKE PA-LIKE PA-LIKE PA-LIKE PA-LIKE Consistent Small
L L Other Services Activities
430001 - Dadabhoy
Construction Tech.
Ltd.(Pak German
Prefabs Ltd.) Analyzers Analyzers Analyzers Analyzers Analyzers Consistent Small
L L Other Services Activities
430002 - Gammon
Pakistan Ltd. PA-LIKE PA-LIKE PA-LIKE PA-LIKE PA-LIKE Consistent Small
L L Other Services Activities
450001 -
Dreamworld Ltd. Analyzers Analyzers Analyzers Analyzers Analyzers Consistent Small
L L Other Services Activities
450002 - Pakistan
Hotels Developers
Ltd. DA-LIKE DA-LIKE DA-LIKE DA-LIKE DA-LIKE Consistent Medium
L L Other Services Activities
450003 - Pakistan
Services Ltd. Analyzers Analyzers Analyzers Analyzers Analyzers Consistent Large
L L Other Services Activities
460003 - Pace
(Pakistan) Ltd. DA-LIKE Analyzers PA-LIKE PA-LIKE Reactors Reactor Large
L L Other Services Activities
500001 - Shifa
International
Hospitals Ltd. Analyzers Analyzers Analyzers Analyzers Analyzers Consistent Medium
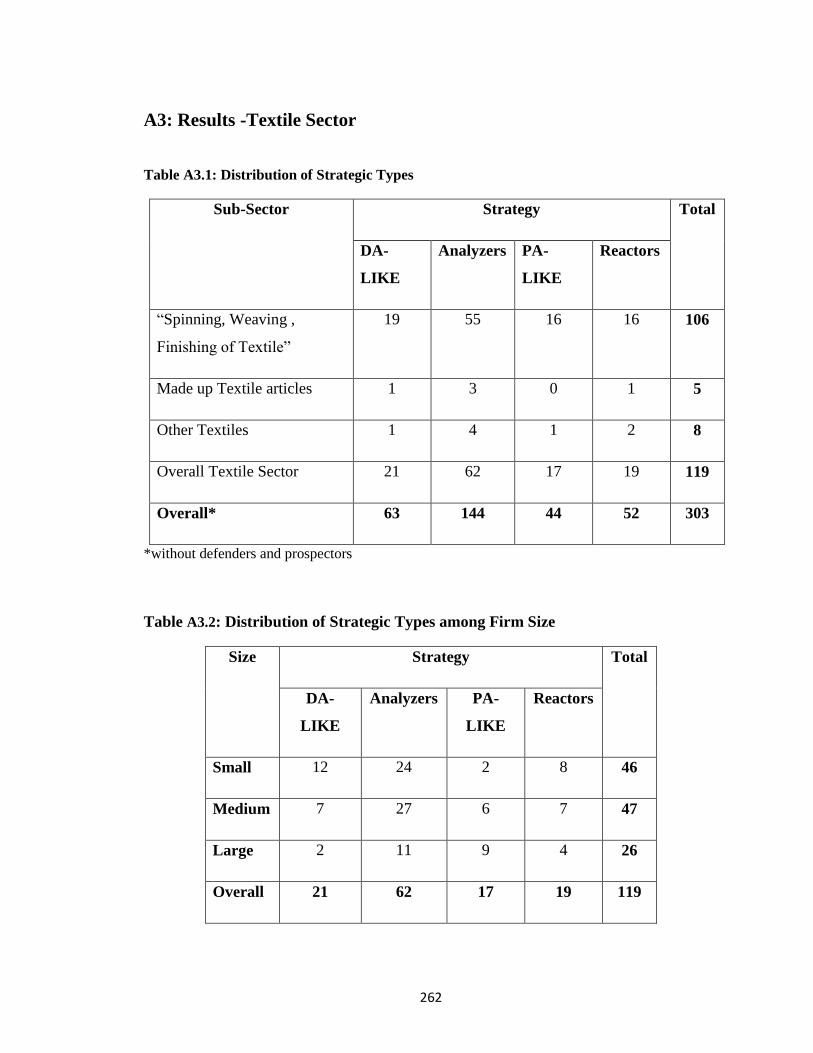
262
A3: Results -Textile Sector
Table A3.1: Distribution of Strategic Types
Sub-Sector Strategy Total
DA-
LIKE
Analyzers PA-
LIKE
Reactors
“Spinning, Weaving ,
Finishing of Textile”
19 55 16 16 106
Made up Textile articles 1 3 0 1 5
Other Textiles 1 4 1 2 8
Overall Textile Sector 21 62 17 19 119
Overall* 63 144 44 52 303
*without defenders and prospectors
Table A3.2: Distribution of Strategic Types among Firm Size
Size Strategy Total
DA-
LIKE
Analyzers PA-
LIKE
Reactors
Small 12 24 2 8 46
Medium 7 27 6 7 47
Large 2 11 9 4 26
Overall 21 62 17 19 119
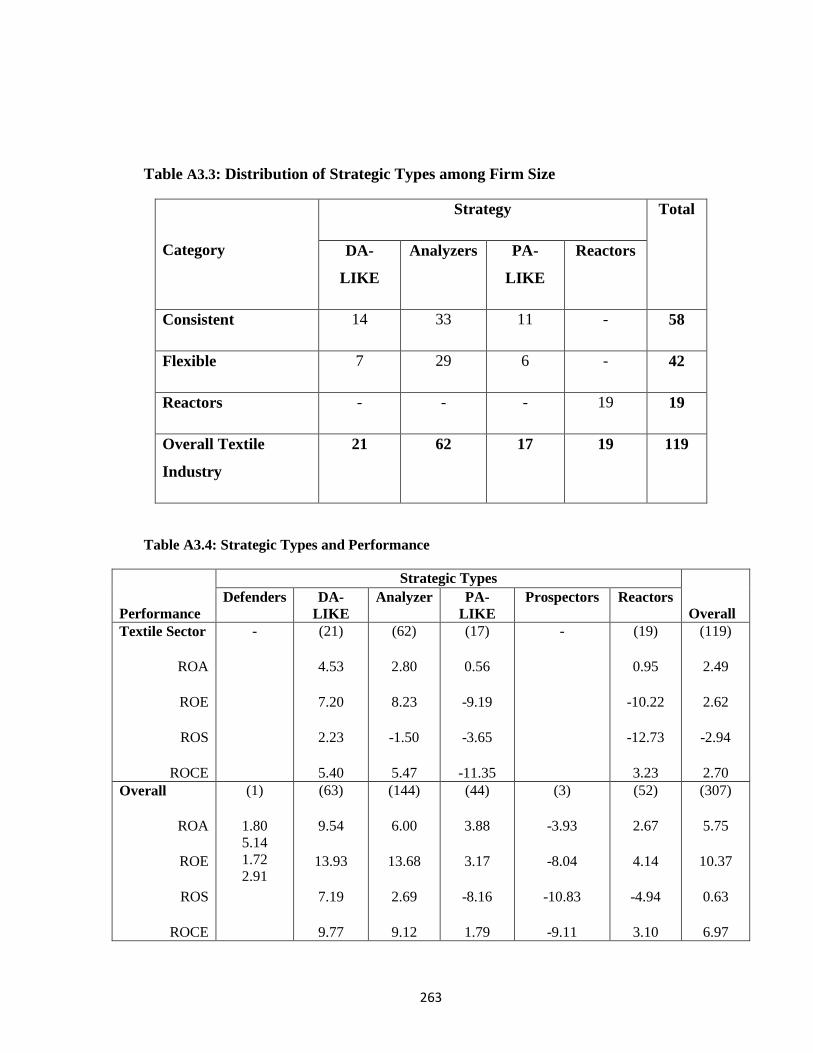
263
Table A3.3: Distribution of Strategic Types among Firm Size
Category
Strategy Total
DA-
LIKE
Analyzers PA-
LIKE
Reactors
Consistent 14 33 11 - 58
Flexible 7 29 6 - 42
Reactors - - - 19 19
Overall Textile
Industry
21 62 17 19 119
Table A3.4: Strategic Types and Performance
Performance
Strategic Types
Overall
Defenders DA-
LIKE
Analyzer PA-
LIKE
Prospectors Reactors
Textile Sector
ROA
ROE
ROS
ROCE
- (21)
4.53
7.20
2.23
5.40
(62)
2.80
8.23
-1.50
5.47
(17)
0.56
-9.19
-3.65
-11.35
- (19)
0.95
-10.22
-12.73
3.23
(119)
2.49
2.62
-2.94
2.70
Overall
ROA
ROE
ROS
ROCE
(1)
1.80
5.14
1.72
2.91
(63)
9.54
13.93
7.19
9.77
(144)
6.00
13.68
2.69
9.12
(44)
3.88
3.17
-8.16
1.79
(3)
-3.93
-8.04
-10.83
-9.11
(52)
2.67
4.14
-4.94
3.10
(307)
5.75
10.37
0.63
6.97
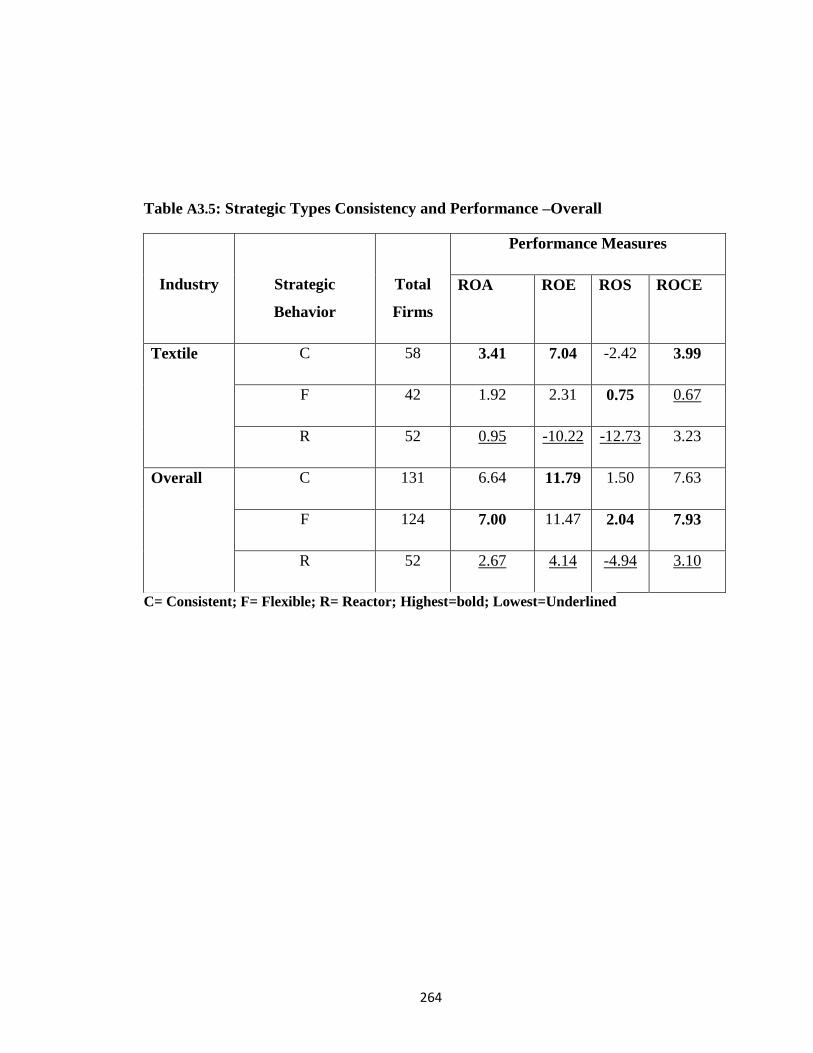
264
Table A3.5: Strategic Types Consistency and Performance –Overall
Industry
Strategic
Behavior
Total
Firms
Performance Measures
ROA ROE ROS ROCE
Textile C 58 3.41 7.04 -2.42 3.99
F 42 1.92 2.31 0.75 0.67
R 52 0.95 -10.22 -12.73 3.23
Overall C 131 6.64 11.79 1.50 7.63
F 124 7.00 11.47 2.04 7.93
R 52 2.67 4.14 -4.94 3.10
C= Consistent; F= Flexible; R= Reactor; Highest=bold; Lowest=Underlined
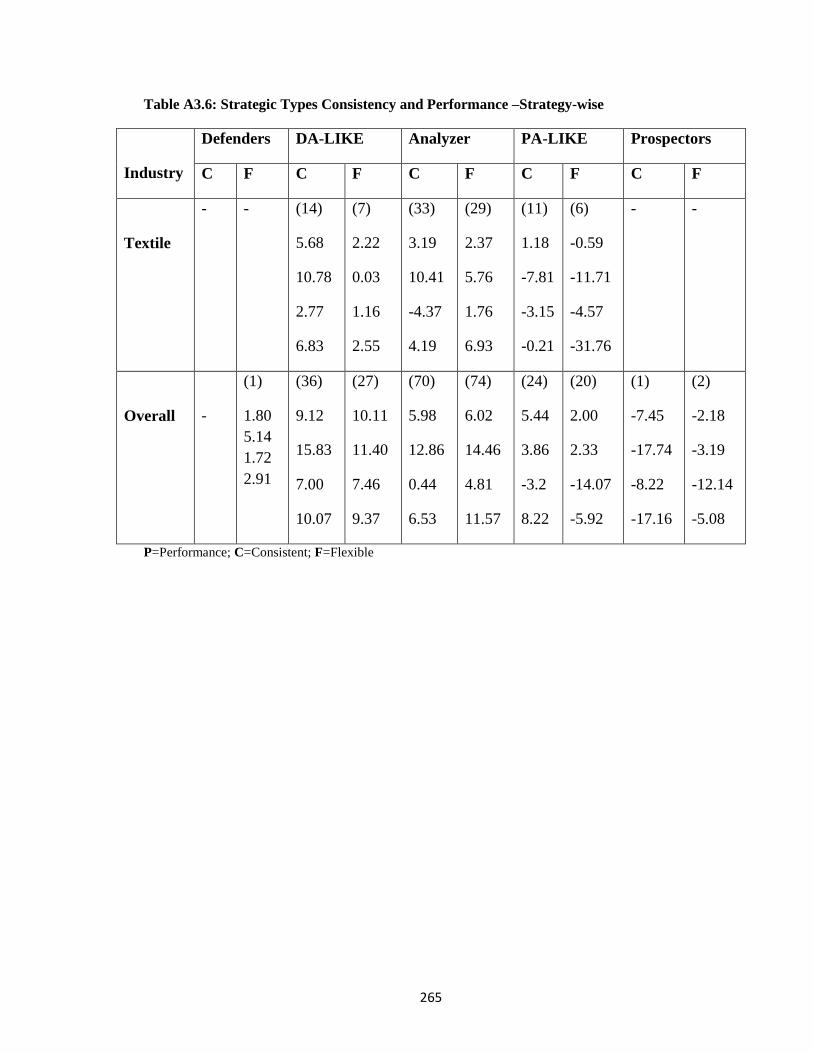
265
Table A3.6: Strategic Types Consistency and Performance –Strategy-wise
Industry
Defenders DA-LIKE Analyzer PA-LIKE Prospectors
C F C F C F C F C F
Textile
- - (14)
5.68
10.78
2.77
6.83
(7)
2.22
0.03
1.16
2.55
(33)
3.19
10.41
-4.37
4.19
(29)
2.37
5.76
1.76
6.93
(11)
1.18
-7.81
-3.15
-0.21
(6)
-0.59
-11.71
-4.57
-31.76
-
-
Overall
-
(1)
1.80
5.14
1.72
2.91
(36)
9.12
15.83
7.00
10.07
(27)
10.11
11.40
7.46
9.37
(70)
5.98
12.86
0.44
6.53
(74)
6.02
14.46
4.81
11.57
(24)
5.44
3.86
-3.2
8.22
(20)
2.00
2.33
-14.07
-5.92
(1)
-7.45
-17.74
-8.22
-17.16
(2)
-2.18
-3.19
-12.14
-5.08
P=Performance; C=Consistent; F=Flexible
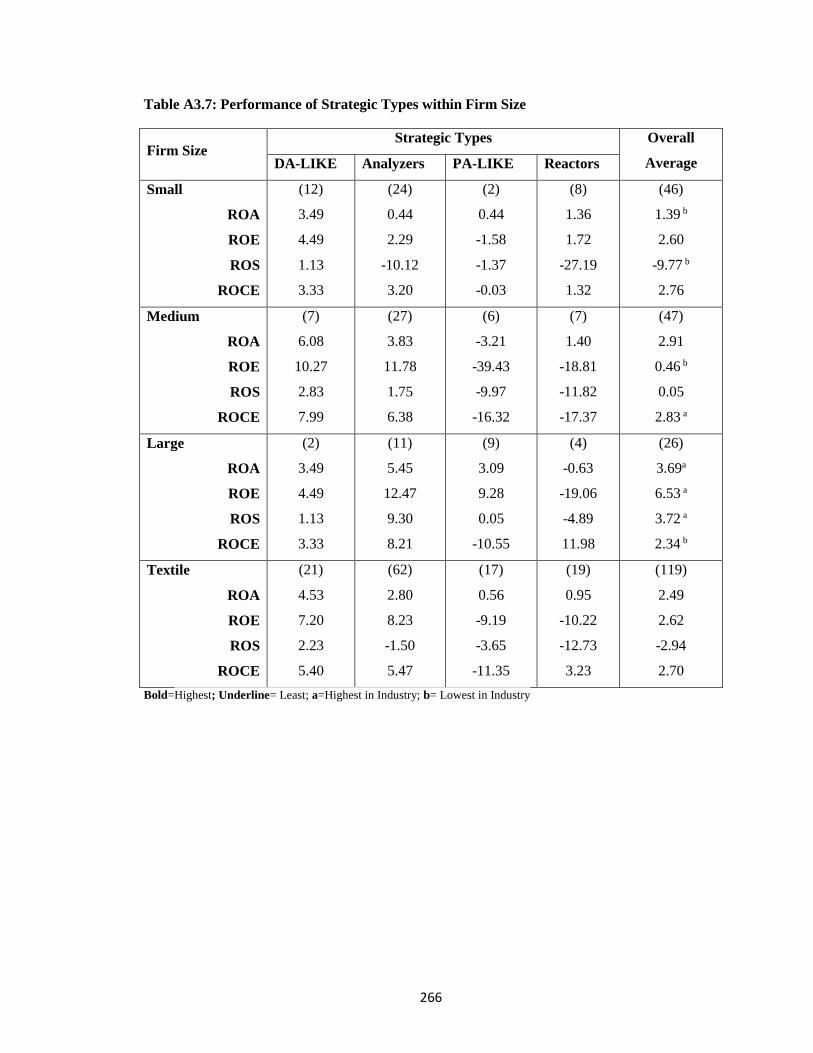
266
Table A3.7: Performance of Strategic Types within Firm Size
Firm Size Strategic Types Overall
Average DA-LIKE Analyzers PA-LIKE Reactors
Small
ROA
ROE
ROS
ROCE
(12)
3.49
4.49
1.13
3.33
(24)
0.44
2.29
-10.12
3.20
(2)
0.44
-1.58
-1.37
-0.03
(8)
1.36
1.72
-27.19
1.32
(46)
1.39 b
2.60
-9.77 b
2.76
Medium
ROA
ROE
ROS
ROCE
(7)
6.08
10.27
2.83
7.99
(27)
3.83
11.78
1.75
6.38
(6)
-3.21
-39.43
-9.97
-16.32
(7)
1.40
-18.81
-11.82
-17.37
(47)
2.91
0.46 b
0.05
2.83 a
Large
ROA
ROE
ROS
ROCE
(2)
3.49
4.49
1.13
3.33
(11)
5.45
12.47
9.30
8.21
(9)
3.09
9.28
0.05
-10.55
(4)
-0.63
-19.06
-4.89
11.98
(26)
3.69a
6.53 a
3.72 a
2.34 b
Textile
ROA
ROE
ROS
ROCE
(21)
4.53
7.20
2.23
5.40
(62)
2.80
8.23
-1.50
5.47
(17)
0.56
-9.19
-3.65
-11.35
(19)
0.95
-10.22
-12.73
3.23
(119)
2.49
2.62
-2.94
2.70
Bold=Highest; Underline= Least; a=Highest in Industry; b= Lowest in Industry
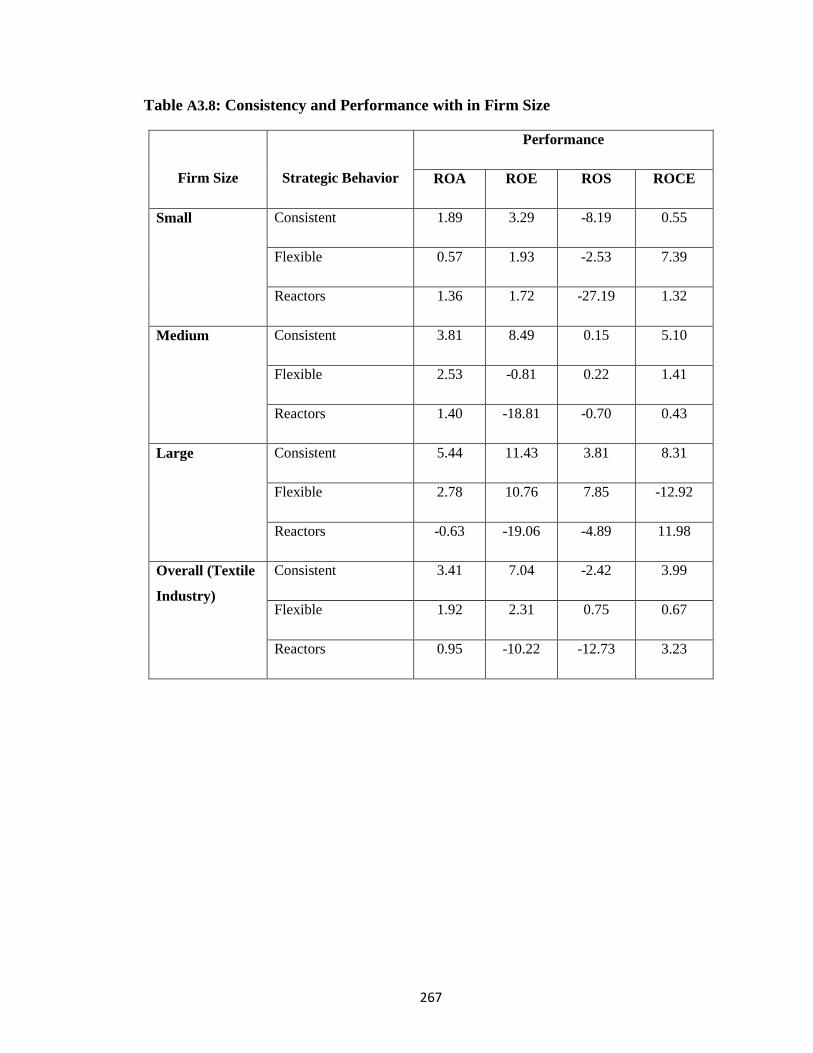
267
Table A3.8: Consistency and Performance with in Firm Size
Firm Size
Strategic Behavior
Performance
ROA ROE ROS ROCE
Small Consistent 1.89 3.29 -8.19 0.55
Flexible 0.57 1.93 -2.53 7.39
Reactors 1.36 1.72 -27.19 1.32
Medium Consistent 3.81 8.49 0.15 5.10
Flexible 2.53 -0.81 0.22 1.41
Reactors 1.40 -18.81 -0.70 0.43
Large Consistent 5.44 11.43 3.81 8.31
Flexible 2.78 10.76 7.85 -12.92
Reactors -0.63 -19.06 -4.89 11.98
Overall (Textile
Industry)
Consistent 3.41 7.04 -2.42 3.99
Flexible 1.92 2.31 0.75 0.67
Reactors 0.95 -10.22 -12.73 3.23
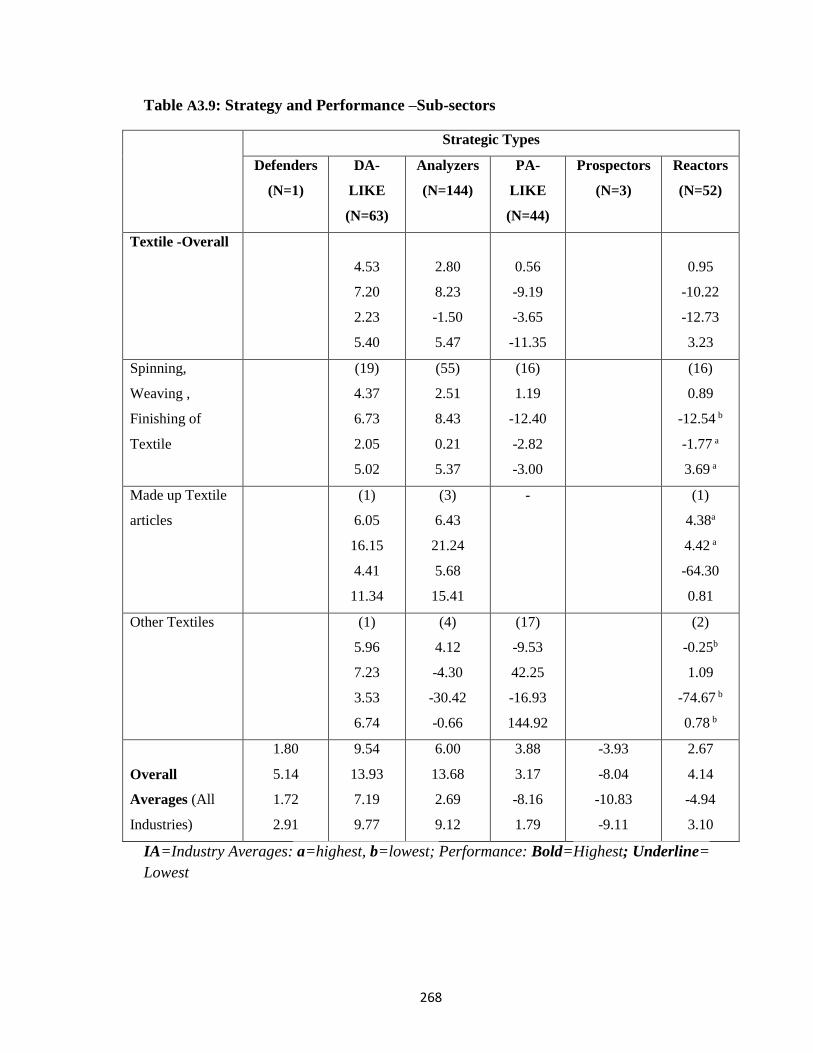
268
Table A3.9: Strategy and Performance –Sub-sectors
Strategic Types
Defenders
(N=1)
DA-
LIKE
(N=63)
Analyzers
(N=144)
PA-
LIKE
(N=44)
Prospectors
(N=3)
Reactors
(N=52)
Textile -Overall
4.53
7.20
2.23
5.40
2.80
8.23
-1.50
5.47
0.56
-9.19
-3.65
-11.35
0.95
-10.22
-12.73
3.23
Spinning,
Weaving ,
Finishing of
Textile
(19)
4.37
6.73
2.05
5.02
(55)
2.51
8.43
0.21
5.37
(16)
1.19
-12.40
-2.82
-3.00
(16)
0.89
-12.54 b
-1.77 a
3.69 a
Made up Textile
articles
(1)
6.05
16.15
4.41
11.34
(3)
6.43
21.24
5.68
15.41
- (1)
4.38a
4.42 a
-64.30
0.81
Other Textiles (1)
5.96
7.23
3.53
6.74
(4)
4.12
-4.30
-30.42
-0.66
(17)
-9.53
42.25
-16.93
144.92
(2)
-0.25b
1.09
-74.67 b
0.78 b
Overall
Averages (All
Industries)
1.80
5.14
1.72
2.91
9.54
13.93
7.19
9.77
6.00
13.68
2.69
9.12
3.88
3.17
-8.16
1.79
-3.93
-8.04
-10.83
-9.11
2.67
4.14
-4.94
3.10
IA=Industry Averages: a=highest, b=lowest; Performance: Bold=Highest; Underline=
Lowest
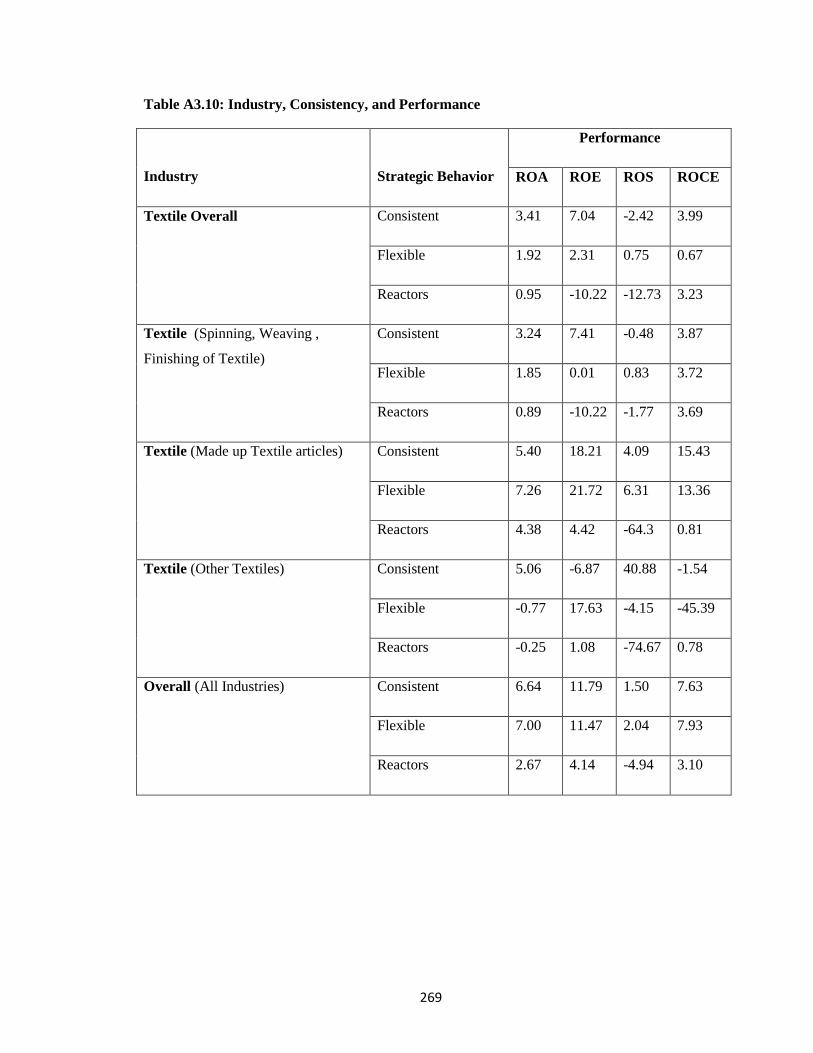
269
Table A3.10: Industry, Consistency, and Performance
Industry
Strategic Behavior
Performance
ROA ROE ROS ROCE
Textile Overall Consistent 3.41 7.04 -2.42 3.99
Flexible 1.92 2.31 0.75 0.67
Reactors 0.95 -10.22 -12.73 3.23
Textile (Spinning, Weaving ,
Finishing of Textile)
Consistent 3.24 7.41 -0.48 3.87
Flexible 1.85 0.01 0.83 3.72
Reactors 0.89 -10.22 -1.77 3.69
Textile (Made up Textile articles) Consistent 5.40 18.21 4.09 15.43
Flexible 7.26 21.72 6.31 13.36
Reactors 4.38 4.42 -64.3 0.81
Textile (Other Textiles) Consistent 5.06 -6.87 40.88 -1.54
Flexible -0.77 17.63 -4.15 -45.39
Reactors -0.25 1.08 -74.67 0.78
Overall (All Industries) Consistent 6.64 11.79 1.50 7.63
Flexible 7.00 11.47 2.04 7.93
Reactors 2.67 4.14 -4.94 3.10
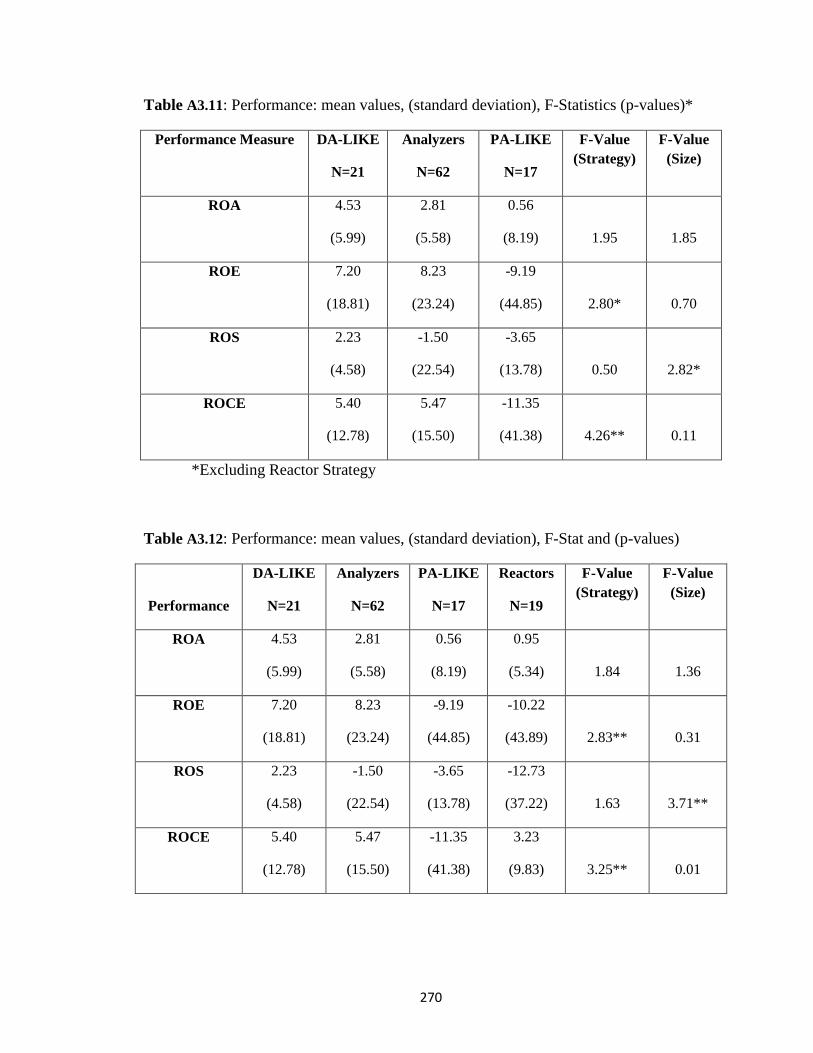
270
Table A3.11: Performance: mean values, (standard deviation), F-Statistics (p-values)*
Performance Measure DA-LIKE
N=21
Analyzers
N=62
PA-LIKE
N=17
F-Value
(Strategy)
F-Value
(Size)
ROA 4.53
(5.99)
2.81
(5.58)
0.56
(8.19)
1.95
1.85
ROE 7.20
(18.81)
8.23
(23.24)
-9.19
(44.85)
2.80*
0.70
ROS 2.23
(4.58)
-1.50
(22.54)
-3.65
(13.78)
0.50
2.82*
ROCE 5.40
(12.78)
5.47
(15.50)
-11.35
(41.38)
4.26**
0.11
*Excluding Reactor Strategy
Table A3.12: Performance: mean values, (standard deviation), F-Stat and (p-values)
Performance
DA-LIKE
N=21
Analyzers
N=62
PA-LIKE
N=17
Reactors
N=19
F-Value
(Strategy)
F-Value
(Size)
ROA 4.53
(5.99)
2.81
(5.58)
0.56
(8.19)
0.95
(5.34)
1.84
1.36
ROE 7.20
(18.81)
8.23
(23.24)
-9.19
(44.85)
-10.22
(43.89)
2.83**
0.31
ROS 2.23
(4.58)
-1.50
(22.54)
-3.65
(13.78)
-12.73
(37.22)
1.63
3.71**
ROCE 5.40
(12.78)
5.47
(15.50)
-11.35
(41.38)
3.23
(9.83)
3.25**
0.01
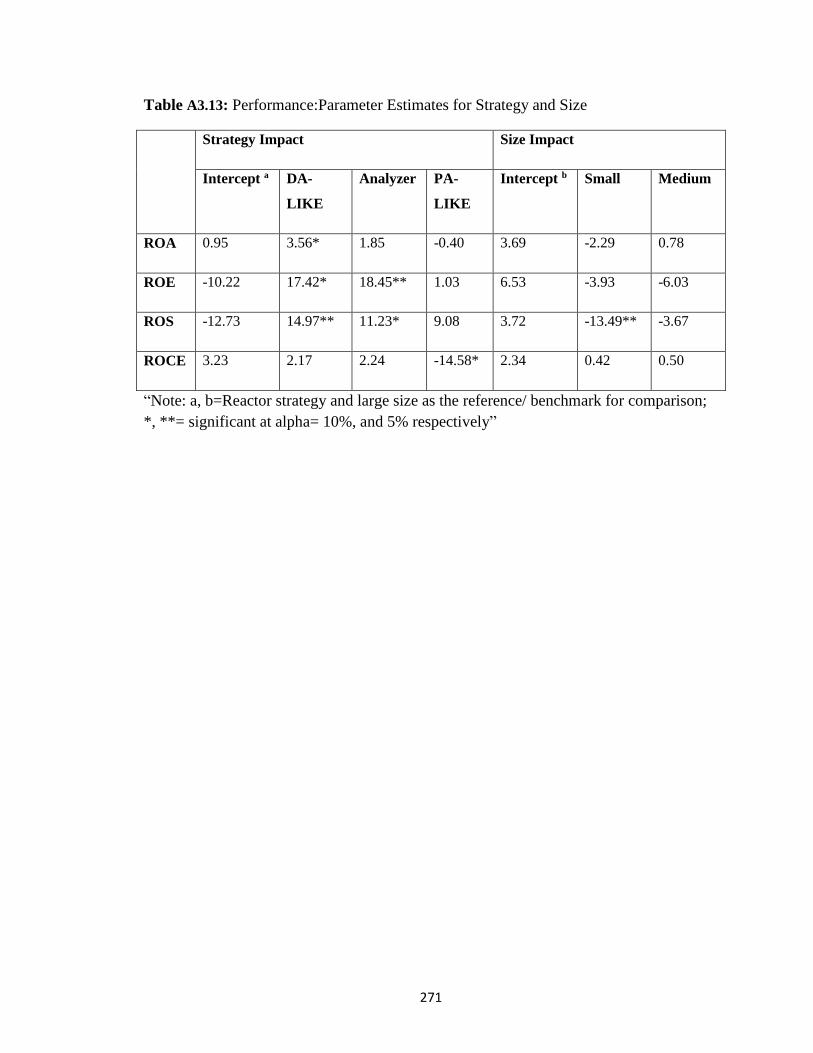
271
Table A3.13: Performance:Parameter Estimates for Strategy and Size
Strategy Impact Size Impact
Intercept a DA-
LIKE
Analyzer PA-
LIKE
Intercept b Small Medium
ROA 0.95 3.56* 1.85 -0.40 3.69 -2.29 0.78
ROE -10.22 17.42* 18.45** 1.03 6.53 -3.93 -6.03
ROS -12.73 14.97** 11.23* 9.08 3.72 -13.49** -3.67
ROCE 3.23 2.17 2.24 -14.58* 2.34 0.42 0.50
“Note: a, b=Reactor strategy and large size as the reference/ benchmark for comparison;
*, **= significant at alpha= 10%, and 5% respectively”
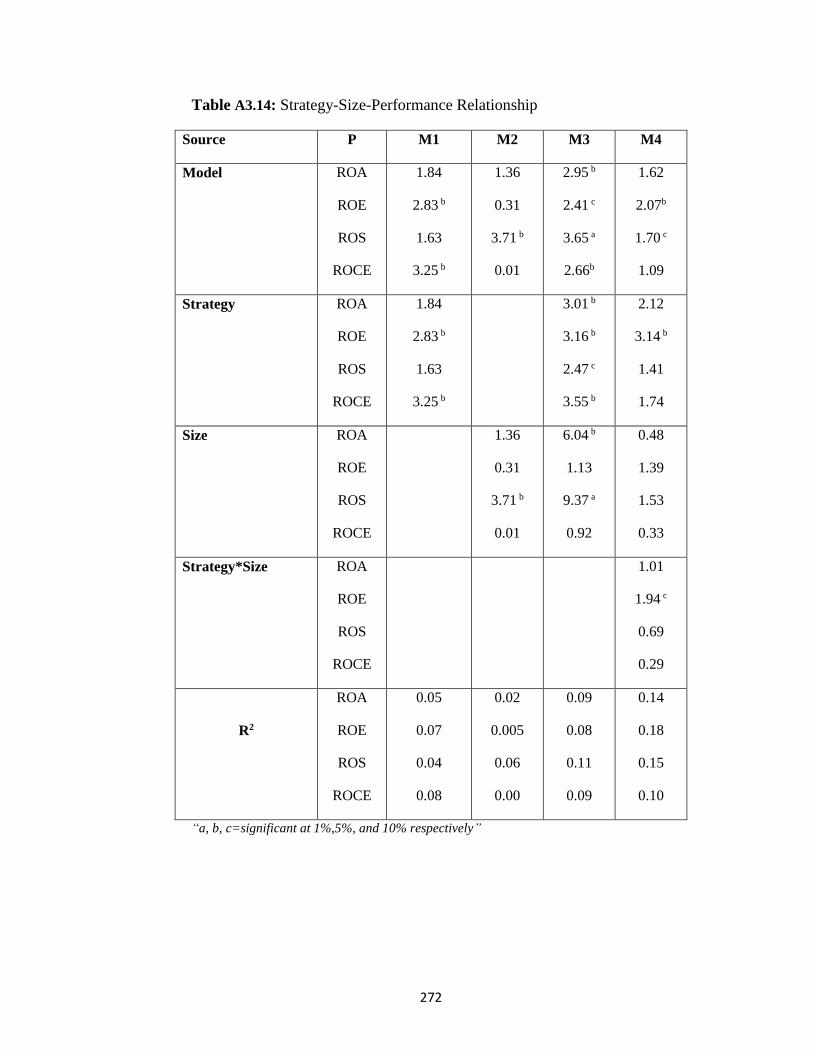
272
Table A3.14: Strategy-Size-Performance Relationship
Source P M1 M2 M3 M4
Model ROA
ROE
ROS
ROCE
1.84
2.83 b
1.63
3.25 b
1.36
0.31
3.71 b
0.01
2.95 b
2.41 c
3.65 a
2.66b
1.62
2.07b
1.70 c
1.09
Strategy ROA
ROE
ROS
ROCE
1.84
2.83 b
1.63
3.25 b
3.01 b
3.16 b
2.47 c
3.55 b
2.12
3.14 b
1.41
1.74
Size ROA
ROE
ROS
ROCE
1.36
0.31
3.71 b
0.01
6.04 b
1.13
9.37 a
0.92
0.48
1.39
1.53
0.33
Strategy*Size ROA
ROE
ROS
ROCE
1.01
1.94 c
0.69
0.29
R2
ROA
ROE
ROS
ROCE
0.05
0.07
0.04
0.08
0.02
0.005
0.06
0.00
0.09
0.08
0.11
0.09
0.14
0.18
0.15
0.10
“a, b, c=significant at 1%,5%, and 10% respectively”
Related Documents