COLORADO BREWERS GUILD Craft Brewers Industry Overview and Economic Impact 2014 and 2015 BUSINESS RESEARCH DIVISION Leeds School of Business University of Colorado Boulder 420 UCB Boulder, CO 80309-0420 Colorado.edu/business/brd Final Report June 2016

Welcome message from author
This document is posted to help you gain knowledge. Please leave a comment to let me know what you think about it! Share it to your friends and learn new things together.
Transcript

COLORADO BREWERS GUILD Craft Brewers Industry Overview and Economic Impact 2014 and 2015
BUSINESS RESEARCH DIVISION Leeds School of Business
University of Colorado Boulder 420 UCB
Boulder, CO 80309-0420 Colorado.edu/business/brd
Final Report June 2016

This page intentionally left blank.

Business Research Division │ Leeds School of Business │ University of Colorado Boulder i
TABLE OF CONTENTS Table of Contents ........................................................................................................................................... i Executive Summary ....................................................................................................................................... 1 Economic Impact Infographic ....................................................................................................................... 3 Project Overview ........................................................................................................................................... 4 Methodology ................................................................................................................................................. 4 Definitions ..................................................................................................................................................... 5 Literature Review .......................................................................................................................................... 6 History of Brewing in Colorado ..................................................................................................................... 7 Survey Results ............................................................................................................................................... 8
Employment, Benefits, and Wages........................................................................................................... 9 Revenues ................................................................................................................................................ 10
Economic Impact ......................................................................................................................................... 10 Brewer Challenges ...................................................................................................................................... 12 Brewer Community Impacts ....................................................................................................................... 13 Conclusion ................................................................................................................................................... 14 Bibliography ................................................................................................................................................ 15 Appendix 1: Full Literature Review ............................................................................................................. 18

Business Research Division │ Leeds School of Business │ University of Colorado Boulder 1
EXECUTIVE SUMMARY Colorado remains at the forefront of the craft brewing industry, ranking among the top states for number
of breweries, per capita production, economic impacts, and favorable excise taxes. The Colorado Liquor
Enforcement Division identified 350 manufacturing brewery and brewpub licenses as of May 2016—a
tripling of growth in the number of breweries in less than a decade. By count, Colorado ranks third in the
number of breweries, behind only California and Washington according to data from the Brewers
Association, and third in breweries per capita. In terms of state excise taxes on production, Colorado is
tied for fourth-lowest nationally.
Craft breweries, and especially brewpubs, are inherently labor intensive, making the economic impacts
fundamentally local. While labor, as an input cost, is sourced 100% locally, only a fraction of other inputs
is purchased in Colorado (weighted average)—8% of hops are sourced within the state and 9.3% of
grains. However, other inputs are more local—electricity (94%), packaging (36%), and marketing (28%)
are sourced from within the state. The industry is fragmented by size; some small brewers have little
reach throughout the state while others are on such a growth trajectory that they cannot meet current
national demand. Regardless of size, sales, brand recognition, and expansion plans, all industry players
have an important role in Colorado’s culture and economy.
This study quantifies the economic impacts of the craft brewing industry on the state of Colorado,
including both breweries and brewpubs. The report details the direct, indirect, and induced economic
impacts in terms of output, employment, and income. Primary data were collected from the craft brewers
in an online survey.
TABLE 1: COLORADO’S CRAFT BREWING INDUSTRY
Metrics Number
Breweries and Brew Pubs* 350
Number of Cities 94
Colorado Employment 7,776 jobs
Industry Sales $882 million
Economic Impact $1.7 billion
*As of May 2016.
Through the buying and selling of goods in Colorado, the industry recorded total economic benefits of
$1.66 billion in 2014. Converting mostly raw materials inputs such as hops and water into the craft beers
sold domestically and internationally, the industry tallied $369 million in direct value added in 2015.
Contributing to this economic impact are the workers—in 2014 workers totaled an estimated 6,911 and in
2015, workers on both the brewery and restaurant sides of the business totaled 7,777. Industry wages
Business Research Division │ Leeds School of Business │ University of Colorado Boulder 2
averaged $25,833 in 2014 and $27,930 in 2015, partially lower due to the part-time nature of restaurant
jobs and the ramping up phase of start-up breweries. Many brewers offer employee benefits.
In addition to the economic benefits that include employee wages and buying and selling goods in
Colorado, survey responses indicate that, as a whole, craft brewers and brewpubs are very active
philanthropists in their respective communities. Nearly 94% of responding breweries reported donating to
charity; 94%, fundraising; and 71%, volunteering. Brewers were also surveyed about the impact their
businesses have within their respective communities.
Nearly 49% of respondents project growth in excess of 20% in 2016, and 45% expect to exceed this level
in 2017. Compared to the 2015 report, there was a 10 percentage point decrease in the most robust growth
(>20%) outlook for 2016. When asked about industry challenges, the responses included a mix of both
micro- and macro-scale challenges facing brewers. Small-scale challenges appeared to be the most
common, including a lack of brewing and storage space, insufficient capital and cash, issues with
workers, and problems sourcing raw materials and brewing equipment. Among large-scale challenges
were the entire competitive environment, distribution networks, government regulations, and taxes.
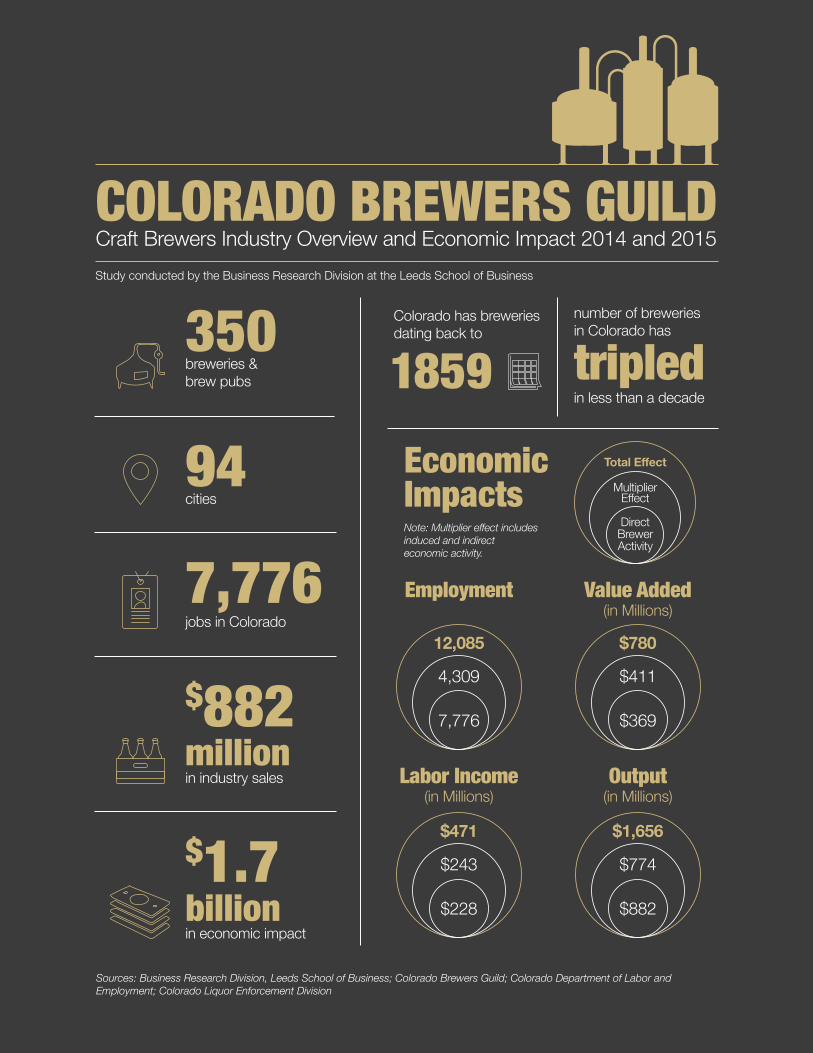
94 cities
350 breweries & brew pubs
7,776jobs in Colorado
$1.7billionin economic impact
$882 millionin industry sales
COLORADO BREWERS GUILDCraft Brewers Industry Overview and Economic Impact 2014 and 2015
Direct Brewer Activity
Multiplier Effect
Total Effect
7,776
4,309
12,085
Employment
$228
$243
$471
Labor Income (in Millions)
$369
$411
$780
Value Added(in Millions)
Output (in Millions)
$882
$774
$1,656
Economic Impacts
number of breweries in Colorado has
tripled in less than a decade
1859Colorado has breweries dating back to
Note: Multiplier effect includes induced and indirect economic activity.
Sources: Business Research Division, Leeds School of Business; Colorado Brewers Guild; Colorado Department of Labor and Employment; Colorado Liquor Enforcement Division
Study conducted by the Business Research Division at the Leeds School of Business

Business Research Division │ Leeds School of Business │ University of Colorado Boulder 4
PROJECT OVERVIEW
The Business Research Division conducted a study of the economic impact of the craft brewing industry
in Colorado in 2012, 2014, and 2015. This study provides an update of the economic impact of an
industry that is in a rapid state of change. The report quantifies the economic contributions related to craft
brewing in the state of Colorado by collecting publicly available secondary data and primary data
obtained from a survey of Colorado brewers, primarily Colorado Brewers Guild members. This study
estimates direct industry sales, employment, average wages, and fiscal impacts. Input-output analysis is
used to illustrate the supply chain impacts of the industry and demonstrates the scope and reach of the
industry within the state. This study does not include the large international brewers located in the state.
METHODOLOGY This study was conducted in cooperation with the Colorado Brewers Guild and with 82 craft brewers
across the state of Colorado representing 148 locations. Economic impacts on Colorado were estimated
by examining data provided on revenues, operating expenditures, employee salaries and benefits, and
production in the state. This approach accounted for the leakage that occurs when brewers and brewpubs
make purchases outside the state. Furthermore, this study estimated the multiplicative impacts of direct
expenditures on other industries in the economy through input-output modeling by using IMPLAN, a
widely used economic modeling software. Intangible benefits, including community service, charitable
giving, and fundraising, are described to illustrate additional community benefits derived from the
presence of craft brewers, but are not directly quantified when determining the overall economic
contribution
Data requests were made directly to craft brewers and brewpubs to obtain information on revenue,
expenditures, employment, salaries, benefits, and production, as well as factors that influence or deter
growth. Information was collected through an online survey sent directly to points-of-contact within each
brewery. More than three-quarters of the survey responses were directly from people in ownership or top
leadership positions (e.g., CEOs); the remainder were from other high-level positions (e.g., brewmasters,
COOs, VPs, etc.). Additional information was gathered from other public and private sources to verify
and augment data.
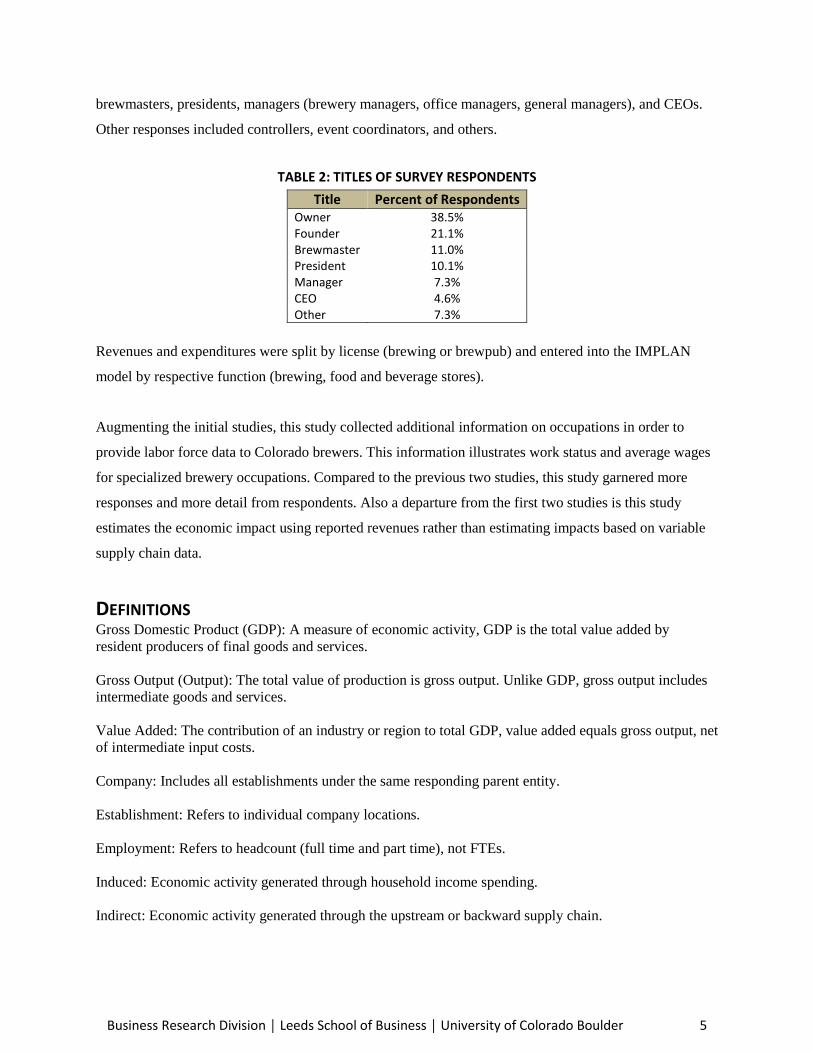
In order to determine the mix of survey respondents, brewers were asked to provide their title. A number
of respondents reported that they had multiple titles (e.g., president and founder) but the most frequent
response was owners; they made up more than 38% of all responses. Also common were founders,
Business Research Division │ Leeds School of Business │ University of Colorado Boulder 5
brewmasters, presidents, managers (brewery managers, office managers, general managers), and CEOs.
Other responses included controllers, event coordinators, and others.
TABLE 2: TITLES OF SURVEY RESPONDENTS
Title Percent of Respondents Owner 38.5% Founder 21.1% Brewmaster 11.0% President 10.1% Manager 7.3% CEO 4.6% Other 7.3%
Revenues and expenditures were split by license (brewing or brewpub) and entered into the IMPLAN
model by respective function (brewing, food and beverage stores).
Augmenting the initial studies, this study collected additional information on occupations in order to
provide labor force data to Colorado brewers. This information illustrates work status and average wages
for specialized brewery occupations. Compared to the previous two studies, this study garnered more
responses and more detail from respondents. Also a departure from the first two studies is this study
estimates the economic impact using reported revenues rather than estimating impacts based on variable
supply chain data.
DEFINITIONS Gross Domestic Product (GDP): A measure of economic activity, GDP is the total value added by
resident producers of final goods and services.
Gross Output (Output): The total value of production is gross output. Unlike GDP, gross output includes
intermediate goods and services.
Value Added: The contribution of an industry or region to total GDP, value added equals gross output, net
of intermediate input costs.
Company: Includes all establishments under the same responding parent entity.
Establishment: Refers to individual company locations.
Employment: Refers to headcount (full time and part time), not FTEs.
Induced: Economic activity generated through household income spending.
Indirect: Economic activity generated through the upstream or backward supply chain.
Business Research Division │ Leeds School of Business │ University of Colorado Boulder 6
LITERATURE REVIEW Many studies have quantified the economic contributions of the U.S. beer industry nationally and in select
markets. Most of these have been conducted on behalf of industry associations, including the America’s
Beer Distributors and the Brewers Association, which have a national constituency, and the California
Craft Brewers Guild and the Montana Craft Brewers Association, which serve their respective states.
According to a report conducted on behalf of the National Beer Wholesalers Association (2013), U.S.
beer distributors directly employ approximately 130,000 full-time equivalent positions. When multiplier
effects are considered, beer distributors generate more than 345,000 jobs across the nation. Beer
distributor operations generate a total of $10.3 billion in federal, state, and local taxes.
According to the study From Farm to Glass: The Value of Beer in Canada, craft beer is also growing in
other countries, including Canada. The beer economy supports 1 out of every 100 jobs in Canada and
generates $5.8 billion in government revenue in the form of product, income, and corporate taxes. The
brewing industry is more than three times larger than the winery and distillery industries combined.
Regionally, craft breweries have tremendous impacts on their local communities. A study of Montana
breweries conducted by the University of Montana found that beer production rose 49% from 2010 to
2013. In the same period, brewery employment in the state more than doubled, from 231 to 486 jobs, and
compensation climbed 84%.
According to a study conducted on behalf of the California Craft Brewers Association, the craft brewing
industry increased production by 21% in 2012, generated approximately $4.7 billion in total economic
impact, and supported 45,000 jobs.
A study published by the Brewers Association reported the top five states for total output in 2014 were
California ($6.9 billion), Pennsylvania ($4.5 billion), Texas ($3.8 billion), New York ($2.9 billion), and
Colorado ($2.7 billion). The Brewers Association study is broader than this report; it includes
downstream wholesale and retail activities. According to the report,
The [economic impact] figure is derived from the total impact of beer brewed by craft brewers as it moves
through the three-tier system (breweries, wholesalers and retailers), as well as all non-beer products like
food and merchandise that brewpub restaurants and brewery taprooms sell.1
Additional studies are summarized in Appendix 1 to provide more detail on the economic impacts in
other areas.
1 https://www.brewersassociation.org/statistics/economic-impact-data/, accessed May 17, 2016.

Business Research Division │ Leeds School of Business │ University of Colorado Boulder 7
HISTORY OF BREWING IN COLORADO Colorado has a long brewing history, with breweries dating back to 1859—before Colorado was a state.
Brewing grew as miners, farmers, and ranchers made the territory home. The number of breweries
expanded across the state and barrelage increased. Pre-prohibition, the number of breweries peaked in
1875, at 58. In 1916, Prohibition made breweries obsolete in Colorado. Five Colorado breweries survived
an 18-year period without selling beer. Alternatives like ice, ice cream, ceramics, and malted milk
products were made instead. Prohibition was repealed in 1933.
Nonetheless, the decline of breweries continued a slow descent to one brewer in 1976.2 In 1988, Carver
Brewing Company in Durango and Wynkoop Brewing Company in Denver began brewing beer and
selling it in their attached restaurants. A brewpub industry segment was born in Colorado. In 1996, a
Colorado brewpub license was created, blending aspects of a traditional brewery, restaurant, and beer
wholesaler. The industry has been rapidly building breweries, growing to 350 licenses in May 2016.3 The
1990s and the 2000s experienced profound growth in breweries, and this trend has accelerated in the
2010s. This growth in breweries is by and large craft brewers.
FIGURE 1: COLORADO BREWER GROWTH, 1859-2016
2Excluding prohibition. 3Not all licenses represent an active operating brewery. Some breweries have been issued licenses, but were not yet active.

Business Research Division │ Leeds School of Business │ University of Colorado Boulder 8
Colorado’s beer industry, by law, operates under a three-tier system that includes legally separate
manufacturers, distributors, and retailers for the production, distribution, and sales of beer and other
alcoholic beverages. This study examines the craft brewers within the first tier; thus, this study does not
directly examine distribution or sales, which alone account for thousands of employees and millions of
dollars in economic activity.
Along with the industry impacts that range from agriculture and manufacturing to marketing,
transportation, and sales, the industry plays a role in tourism in the state. Visitors tour Colorado
breweries, as well as take part in the Great American Beer Festival, which boasts the nation’s largest and
oldest gathering of brewers and 60,000 visitors annually.
SURVEY RESULTS The Business Research Division received survey responses from 82 brewers and brewpubs representing
148 locations in Colorado. Of the 82 returned surveys, 73% reported being licensed with the Colorado
Liquor Enforcement Division as a brewery and 27% as a brewpub. In Colorado, 62% of producers are
manufacturing breweries according to published statistics from the Liquor Enforcement Division. Most
beer was reportedly packaged in bottles (61%), followed by kegs (25%), cans (13%), and growlers (<1%).
Colorado craft brewers are largely serving the Colorado market—only 18% of respondents ship outside
the state, and 12% ship internationally. National sales posted a slight decrease from the prior survey,
which may reflect industry growth in small breweries primarily serving a local market. The craft brewers
who did report domestic exports collectively identified 50 states and Washington D.C. as destinations.
Colorado, like the nation, has seen a rapid increase in the number of craft brewers in recent years. Survey
respondents illustrate this rapid increase—nearly 78% of responding companies formed over the past 10
years. Nearly 49% of respondents project growth in excess of 20% in 2016, and 45% expect to exceed
this level in 2017. Compared to the 2015 report, there was a 10 percentage point decrease in the most
robust growth (>20%) outlook for 2016.
TABLE 3: EXPECTED GROWTH
Percentage Growth 2016 2017
<0 1.3% 1.3% 0–5% 6.3% 5.0% 5–10% 12.5% 15.0% 10–15% 15.0% 20.0% 15–20% 16.3% 13.8% >20% 48.8% 45.0%

Business Research Division │ Leeds School of Business │ University of Colorado Boulder 9
The average tasting-room size reported by craft brewers was 1,770 square feet, and 87% of survey
respondents indicated having seasonal outdoor seating.
EMPLOYMENT, BENEFITS, AND WAGES Colorado breweries and brewpubs employed an estimated 6,912 workers in 2014, paying nearly $179
million in total wages. This averages $25,834 per employee, diluted by the many restaurant and bartender
jobs that are less than full time. In 2015, the industry recorded 7,776 workers earning $217 million, or
$27,930 per worker. Full-time workers represented 60% of employment, based on a weighted average
from 82 responding breweries.
Employment is concentrated in the largest firms—55 establishments have more than 60 employees and
represent 53% of total sector employment. Firms with fewer than 20 employees represent 19% of
employment. Mid-size firms (21–60 employees) account for the remaining 27% of employment.
Wages, too, are concentrated in large firms. Wages in the largest size class (more than 60 employees)
averaged $33,433 in 2015. Wages in the medium- and small-size class averaged $23,574 and $19,041,
respectively.
More than 45% of responding brewers and brewpubs offer employee benefits. Of the respondents
indicating employee benefits, 78% offer paid annual leave, 73% offer health insurance, 65% offer paid
sick leave, and 51% offer dental insurance. However, other benefits, such as retirement, life insurance,
and disability, are available less frequently to employees. Beyond traditional benefits, additional noted
benefits range from ski passes and public transit passes to beer allowances and profit sharing.
TABLE 4: CRAFT BREWER BENEFITS
Benefit Percentage
Paid Annual Leave 78%
Health Insurance 73%
Paid Sick Leave 65%
Dental Insurance 51%
Retirement 46%
Other 30%
Life Insurance 27%
Short-Term Disability 22%
Long-Term Disability 19%

Business Research Division │ Leeds School of Business │ University of Colorado Boulder 10
REVENUES Of the 77 craft breweries reporting both revenues and employment for 2015, average Colorado revenues
per employee were $66,000. Differentiating by size class, the smallest size class averaged $66,000 in
2015, the medium-size class averaged $111,000, and the largest size class averaged $225,000.
Extrapolating revenue per employee to total employment in the industry by size class, direct sales are
estimated at $882 million for 2015.
Large brewers/brew pubs are also the largest exporters (domestic and international), both in absolute and
percentage terms. About 91% of small brewers indicated 100% of sales occurred within Colorado,
compared to 77% of medium brewers and 46% of large brewers/brew pubs. This is even more
pronounced for manufacturing breweries exclusively—nearly 90% of small manufacturing breweries
indicated 100% of sales from within Colorado, but only 50% of medium manufacturing breweries and no
large manufacturing breweries record solely Colorado sales.
Manufacturing brewer respondents indicated that 90% of industry revenue is derived from brewing;
brewpubs indicated 40% of revenue was from brewing, with the restaurant side of the business recording
the majority of sales.
ECONOMIC IMPACT Based on Colorado brewery and brewpub sales, labor income, and employment, the craft brewing
industry yielded total economic benefits of $1.7 billion in 2015. More than $471 million of the 2015 total
was in direct value added. Craft brewers directly employed 7,776 workers in 2015. An additional 4,309
indirect and induced workers brings the total employment impact to 12,085 Colorado employees. Total
income to Colorado workers topped $471 million, of which $228 million went directly to craft brewery
employees.
Based on this level of activity, direct state and local fiscal impacts are estimated at $134 million, and
federal impacts are estimated at $115 million in 2015, excluding excise taxes.4
TABLE 5: ECONOMIC IMPACTS, 2015
Impact Type Employment Labor Income (In Millions)
Value Added (In Millions)
Output (In Millions)
Direct Brewery Activity 7,776 $228 $369 $882 Multiplier Effect 4,309 $243 $411 $774 Total Effect 12,085 $471 $780 $1,656
Note: Multiplier effect includes induced and indirect economic activity.
4Estimated from the IMPLAN model. Includes such taxes and fees related to dividends, social insurance, sales, property, excise, motor vehicle licensing, severance, and others.

Business Research Division │ Leeds School of Business │ University of Colorado Boulder 11
The Colorado excise tax rates are $0.08 per gallon for 3.2% beer and malt liquor (beer). The federal
excise tax on beer is $7.00 per barrel, or approximately $0.23 per gallon, for production of 60,000 or less
barrels.5 Production in excess of 60,000 barrels is taxed at $18 per barrel, or approximately $0.58 per
gallon.6 The tax per package is $0.05 per 12 ounce can ($0.02 per 12 ounce can for production under
60,000 barrels). Most craft brewers produce fewer than 60,000 barrels, resulting in a combined state and
federal beer tax of $0.31 per gallon, or $0.038 per pint. For production in excess of 60,000 barrels, this is
$0.66 per gallon, or $0.083 per pint.7
According to the Tax Foundation, Colorado’s $0.08 beer excise tax was among the lowest in the nation in
2015. Colorado ranked fifth, behind Wyoming ($0.02), Missouri ($0.06), and Wisconsin ($0.06), and tied
with Pennsylvania ($0.08). High beer excise tax states include Tennessee ($1.29), Alaska ($1.07),
Alabama ($1.05), and Georgia ($1.01)—the only four states in excess of $1. The Colorado Department of
Revenue reports alcoholic beverage excise taxes and license fees for 3.2% beer and “repeal” beer (i.e.,
full-strength beer). For fiscal year 2015, 3.2% beer taxes totaled $361,497 and repeal beer totaled $8.5
million for a combined total of nearly $8.9 million. These taxes are generated from the entire beer
industry, not only craft brewers. According to the Colorado Department of Revenue, Division of
Taxation, the excise tax is applied to beer that is sold from a manufacturer to a licensed wholesaler or a
consumer in the state.
TABLE 6: COLORADO BEER EXCISE TAX
Tax 3.2%
Beer Tax Full-Strength
Beer Tax Total
FY2007 $582,595 $8,146,423 $8,729,018
FY2008 $571,021 $8,289,409 $8,860,430
FY2009 $438,158 $8,711,253 $9,149,411
FY2010 $413,657 $8,186,066 $8,599,723
FY2011 $478,445 $8,514,422 $8,992,867
FY2012 $463,382 $8,436,052 $8,899,434
FY2013 $374,155 $8,466,726 $8,840,881
FY2014 $366,469 $8,418,506 $8,784,975
FY2015 $361,497 $8,519,127 $8,881,349 Source: Colorado Department of Revenue, Liquor Enforcement Division (LED).
Low beer excise taxes do not necessarily equate to more breweries. According to the Brewers
Association, the lowest tax states ranked 39th (Wyoming), 18th (Missouri), and 13th (Wisconsin) in the
5The federal beer excise tax was originated in 1862 to help fund the Civil War and was never repealed. 6One barrel of beer equals 31 gallons. 7One gallon of beer equals 8 pints.

Business Research Division │ Leeds School of Business │ University of Colorado Boulder 12
number of breweries. The highest tax states ranked 27th (Tennessee), 35th (Alaska), 39th (Alabama), and
24th (Georgia) in the number of breweries. Colorado ranked 3rd.
BREWER CHALLENGES The survey of craft brewers asked respondents to list the top three challenges currently facing their
businesses. Their responses offer an overall look at the challenges facing the industry. The top eight most
frequently mentioned responses, which accounted for 81.7% of total question responses, are listed in
Table 7.
TABLE 7: BREWERY CHALLENGES
Challenge Rank Lack of Space 1 Insufficient Capital 2 Labor and Wages 3 Growing Competition 4 Distribution T-5 Raw Materials and Equipment T-5 Regulations T-7 Taxes T-7
The responses included a mix of both micro- and macro-scale challenges facing brewers. Small scale
challenges appeared to be the most common, including a lack of brewing and storage space, insufficient
capital and cash, issues with workers, and problems sourcing raw materials and brewing equipment.
Large-scale challenges included the competitive environment, distribution networks, government
regulations, and taxes.
Although taxes and regulations were tied as for the seventh-most significant challenge among brewers,
they continue to be a significant challenge for all small businesses. According to an April 2016 report
from the National Federation of Independent Businesses (NFIB), 41% of surveyed small businesses
ranked taxes or government regulations/red tape as most important problems facing their businesses.
Brewers are especially affected by excise taxes on beer, in which the state and federal rate totals $0.083
per pint of beer. The state income tax for individuals and businesses is 4.63%. Colorado sales taxes are
shared among the state, county, and city and can reach more than 8% depending on the location.
Labor and wage related challenges ranked third in the survey of brewers. Common responses indicated
that wages and salaries were too high, or brewers struggled to find skilled labor to run brewing
operations. Labor-related challenges were also reflected in the NFIB report. Eighteen percent of
businesses reported that either cost of labor or quality of labor were their top problems.

Business Research Division │ Leeds School of Business │ University of Colorado Boulder 13
BREWER COMMUNITY IMPACTS Nearly 94% of responding breweries reported donating to charity, 94% participating in fundraising, and
71% volunteering. Brewers were also surveyed about the impact their businesses had within their
respective communities. Responses to the greatest impact the business has on the community were
organized into seven categories. Ninety-one percent of all responses fit into these categories.
The most frequent community impact was donations to charities, or providing fundraising opportunities
for charitable organizations. More than 30% of breweries indicated that some type of charitable giving
was their most important community impact. The second-most frequent response was community
improvement, including neighborhood development and locally sourcing raw materials, followed by
creating jobs.
TABLE 8: BREWERY COMMUNITY IMPACTS
Community Impact Rank Charitable Giving/Fundraising 1 Community Improvement 2 Creating Jobs 3 Event Sponsorship and Beer Donation T-4 Community Gathering Space T-4 Volunteering 6 Tax Revenue 7
Other popular responses to this question were sponsoring and/or donating beer to local events, creating a
new community gathering space, directly volunteering for organizations, and providing tax revenue to the
local community.
The brewers were also asked to provide an example of their participation in a community activity. These
were classified into the six most common responses; 93.4% of all responses were in these categories.
TABLE 9: BREWERY COMMUNITY ACTIVITIES
Participation in Community Activity Rank Charitable Giving/Fundraising 1 Sponsored/Organized Community Event T-2 Beer Donation T-2 Volunteering 4 Beer Festivals T-5 Food Drives T-5

Business Research Division │ Leeds School of Business │ University of Colorado Boulder 14
Similar to the previous question, the top response was donations and fundraising for charitable
organizations. Responses were tied for sponsoring/organizing a community event and donating beer to
local businesses, fundraisers, or events.
The other responses included volunteering for charities and non-profits, participating in beer festivals, and
collecting food or volunteering in food drives.
CONCLUSION Craft brewers are a source of economic benefits totaling $1.66 billion in output in 2015 disbursed
throughout Colorado’s urban cities and rural communities. More than 53% of this is in direct brewer and
brewpub economic activity. Direct industry employment totaled a revised 6,911 in 2014 and 7,776 in
2015, and wages totaled an estimated $179 million and $217 million, respectively. While wages average
less than the average for all industries in Colorado, the less than full-time nature of many of these jobs
dilutes average wages. Nonetheless, many brewers offer employee benefits, ranging from the traditional
(health, dental, etc.) to the creative benefits that speak to the culture of the state and industry (beer, ski
passes, EcoPasses, etc.). Additionally, brewers continue to be growing and thriving contributors to the
economy and to their respective communities through donations, volunteerism, and special events.

Business Research Division │ Leeds School of Business │ University of Colorado Boulder 15
BIBLIOGRAPHY Beer Institute. 2014. Economic Impact. http://www.beerinstitute.org/br/economic-impact, accessed May
17, 2016.
Brewers Association. 2014, Total Economic Impact 2012, State by State Data,
http://www.brewersassociation.org/attachments/0001/3790/State_by_State_Data.pdf, accessed
July 15, 2015.
Brewers Association. State Craft Beer Sales & Production Statistics, 2015.
https://www.brewersassociation.org/statistics/by-state/, retrieved May 24, 2016.
Brewers Association. 2014, State Craft Beer Sales and Production Statistics, 2014,
https://www.brewersassociation.org/statistics/by-state/, accessed July 13, 2015.
Brewers Association. 2014, Statistics, Economic Impact,
https://www.brewersassociation.org/statistics/economic-impact-data/.
Brewers Association. Economic Impact, The Craft Brewing Industry Contributed $33.9 Billion to the
U.S. Economy in 2012, more than 360,000 Jobs (n.d.),
https://www.brewersassociation.org/statistics/economic-impact-data/, accessed June 29, 2015.
California Craft Brewing Association (2012). California Craft Brewing Industry: An Economic Impact
Study. UC Berkeley Goldman School of Public Policy, http://www.californiacraftbeer.com/ccba-
announces-economic-impact-of-the-california-craft-brewing-industry/.
Colorado Department of Local Affairs, 2015 Annual Report,
https://www.colorado.gov/pacific/sites/default/files/2015%20Annual%20Report_1.pdf, accessed
May 24, 2016.
Colorado Department of Local Affairs, Division of Property Taxation. 2014 Annual Report,
http://www.colorado.gov/cs/Satellite?c=Page&childpagename=DOLA-
Main%2FCBONLayout&cid=1251591547549&pagename=CBONWrapper, accessed July 14,
2015.
Colorado Department of Revenue, Enforcement Division, All State Liquor Licenses,
https://www.colorado.gov/pacific/enforcement/liquor-licenses, accessed August 10, 2015.
Colorado Department of Revenue, Colorado Liquor Excise Taxes,
https://www.colorado.gov/pacific/sites/default/files/Liquor%20Excise%20Tax%200615.pdf, accessed May 24, 2016.
Colorado Department of Revenue, Colorado Liquor Excise Taxes,
https://www.colorado.gov/pacific/revenue/colorado-liquor-excise-taxes, accessed July 14, 2015.
Colorado Department of Revenue (July 1, 2010). Colorado Liquor Excise Tax Report,
https://www.colorado.gov/pacific/sites/default/files/June%202010_0.pdf, accessed June 26, 2015.
Colorado Department of Revenue (July 1, 2011). Colorado Liquor Excise Tax Report,
https://www.colorado.gov/pacific/sites/default/files/June%202011_0.pdf, accessed June 26, 2015.

Business Research Division │ Leeds School of Business │ University of Colorado Boulder 16
Colorado Department of Revenue (July 1, 2012). Colorado Liquor Excise Tax Report,
https://www.colorado.gov/pacific/sites/default/files/June%202012_2.pdf, accessed June 26, 2015.
Colorado Department of Revenue (July 1, 2013). Colorado Liquor Excise Tax Report,
https://www.colorado.gov/pacific/sites/default/files/June%202013_3.pdf, accessed June 26, 2015.
Colorado Department of Revenue (July 1, 2014). Colorado Liquor Excise Tax Report,
https://www.colorado.gov/pacific/sites/default/files/June%202014.pdf, accessed June 26, 2015.
Colorado Department of Revenue (March 1, 2015). Colorado Liquor Excise Tax Report,
https://www.colorado.gov/pacific/sites/default/files/Liquor%20Excise%20Tax%200215.pdf,
accessed June 26, 2015.
Combrink, Tom, Cheryl Cothran, and Jeff Peterson (January 2012). Economic Contributions of the Craft
Brewing Industry to the State of Arizona. The W.A. Franke College of Business, Northern
Arizona University.
John Dunham & Associates (July 2015). The Beer Institute Economic Contribution Study, Methodology
and Documentation. http://www.beerservesamerica.org/assets/uploads/general-upload/BSA-
2015-Report.pdf, accessed May 17, 2013.
Infogroup, Inc. (2012). Hershey Company. Retrieved January 30, 2012, from ReferenceUSA database.
Latham, W. and K. Lewis (2015). America’s Beer Distributors: Fueling Jobs, Generating Economic
Growth & Delivering Value to Local Communities, https://www.nbwa.org/resources/economic-
impact, accessed May 17, 2016.
Marturana, Michael and Martin Shields (2011). The Economic Impacts of Breweries on Larimer County.
Fort Collins: Regional Economics Institute, Colorado State University.
Metzger, Scott (July 2012). Economic Impact of the Texas Craft Brewing Industry 2012 Annual Update.
National Beer Wholesalers Association (March 2011). “New Study Shows Beer Industry Contributes
$33.2 Billion Annually to California Economy,” PRNewswire.
http://www.prnewswire.com/news-releases/new-study-shows-beer-industry-contributes-332-
billion-annually-to-california-economy-117604543.html, accessed January 27, 2012.
National Federation of Independent Business (June 2015). National Small Business Economic Trends.
http://www.nfib.com/Portals/0/PDF/sbet/sbet201507.pdf, accessed July 14, 2015.
National University System Institute for Policy Research. 2015 [?]. The Economic Impact of Craft
Breweries in San Diego-2015 Update. La Jolla, California.
Oregon Craft Beer. Economic Impact, http://oregoncraftbeer.org/oregon-beer/economic-impact/, accessed
July 16, 2015.
Palladini, J. and M. Armstrong (2013). From Farm to Glass: The Value of Beer in Canada,
http://www.conferenceboard.ca/e-library/abstract.aspx?did=5847, accessed June 29, 2015.

Business Research Division │ Leeds School of Business │ University of Colorado Boulder 17
Richey, David and Bart Watson (2013). California Craft Brewing Industry Economic Impact Report.
California Craft Brewers Association, http://www.californiacraftbeer.com/files/Economic-
Impact-Study-FINAL.pdf.
Roach, Travis (2016). Oklahoma Craft Brewing Economic Impact Report.
http://www.travisroach.com/uploads/7/7/3/0/7730267/craft_brewing_eis_21.pdf, accessed May
17, 2016.
Sorenson, C. (2014). The Growing Economic Impact of Craft Brewing in Montana,
http://bber.umt.edu/pubs/econ/MtBrewers.pdf, accessed June 29, 2015.
Sorenson, Colin B., Todd A. Morgan, and Shannon Furniss (2012). “The Economic Impact of Craft
Brewing in Montana,” Montana Business Quarterly, Winter,
http://www.bber.umt.edu/pubs/econ/craftbrewing.pdf.
Tax Foundation. Beer Excise Tax Rates by State, 2015. http://taxfoundation.org/blog/how-high-are-beer-taxes-your-state, accessed May 24, 2016.
U.S. Department of the Treasury, Alcohol and Tobacco Tax and Trade Bureau. Taxes and Fee Rates.
http://www.ttb.gov/tax_audit/atftaxes.shtml, accessed July 14, 2015.
Washington Beer Commission. 2012 Annual Report, http://washingtonbeer.com/about-wbc/.

Business Research Division │ Leeds School of Business │ University of Colorado Boulder 18
APPENDIX 1: FULL LITERATURE REVIEW The following summary of reports on the craft brewing industry are presented in chronological order of
their publication date.
The Growing Economic Impact of Craft Brewing in Montana This study investigates Montana craft brewing trends during 2012 and 2013, building on the previous
2010 and 2011 study. Forty breweries were operating in Montana by the end of 2013, with another 11
breweries in the planning stage. Montana ranks third in the nation in breweries per 100,000 adults over
age 21 according to the Brewers Association. Montana craft beer production increased 49% from 2010 to
2013. Brewery employment in the state more than doubled, from 231 to 486 jobs, and compensation
increased 84%. Other economic benefits resulting from brewer operations include 673 additional
permanent, year-round jobs in the Montana economy; more than $18 million in income for Montana
households; an increase of $60 million in sales from business and organizations based in Montana; and an
increase of $4 million in tax and nontax revenues. Most of the employment impacts are in the
manufacturing sector. The analysis used the REMI model to estimate the impact of the industry.
(Sorenson 2014)
Beer Industry Economic Impact The total economic impact of the Colorado beer industry is 50,256 industry-related jobs, $2.7 billion in
wages, and a total contribution of $10.3 billion. On a national level, the U.S. beer industry’s total
economic impact was more than $252.5 billion. It directly and indirectly employs more than 1.7 million
people. (Beer Institute 2014)
California Craft Brewing Industry: An Economic Impact Study The craft brewing industry in California increased production by 21% in 2012. One in five craft beers
brewed in the United States is from California. The breweries in the study generated approximately $4.7
billion in total economic impact in the state. In 2012, California’s craft brewers supported 45,000 jobs and
paid more than $850 million in total local, state, and federal taxes. (Richey and Watson 2013)
America’s Beer Distributors: Fueling Jobs, Generating Economic Growth & Delivering Value to Local Communities U.S. beer distributors directly employ approximately 135,300 full-time equivalent positions. When
multiplier effects are considered, beer distributors generate more than 338,000 jobs across the nation and
generate a total of $12.5 billion in federal, state, and local taxes. (Latham and Lewis 2015)

Business Research Division │ Leeds School of Business │ University of Colorado Boulder 19
From Farm to Glass: The Value of Beer in Canada The beer economy supports 1 out of every 100 jobs in Canada and generates $5.8 billion in government
revenue in the form of product, income, and corporate taxes. The brewing industry is more than three
times larger than the wineries and distilleries industries combined. Beer’s supply chain stretches across
the country. The industries that support the beer industry generate multiplier effects. For every $1 spent
on beer in Canada, $1.12 in GDP is generated across the country. If Canadian beer exports were increased
by $10 million, the result would be a $10.54 million boost to GDP and would support 70 jobs. (Palladini
and Armstrong 2013)
The Economic Impact of Craft Breweries in San Diego – 2015 Update The fastest-growing business sector in San Diego this decade has been craft brewing. Since 2011, the total
number of craft breweries in the region has doubled. In addition, San Diego’s craft brewers contribute to
the region’s tourism industry dollars by hosting year-round events, festivals, and facility tours. In 2014,
brewers and brewpubs generated a $599.4 million direct economic impact in San Diego County. The
industry made over $847 million in sales, and sustained or created 6,203 jobs that year. At the end of
2014, there were 97 breweries in San Diego County, with growth from both new businesses and
expansions of larger established breweries. (National University System Institute for Policy Research
2015)
The Beer Institute Economic Contribution Study, Methodology and Documentation The Beer Institute conducted a study to determine economic impacts by the malt beverage industry within
the United States during 2014. The malt beverage industry is defined to include brewing, wholesaling,
importing, exporting, and retailing, as well as malt liquor and flavored malt beverages. For 2014, the
industry employed 1.75 million Americans—49,576 were involved in craft brewing. The malt beverage
industry accounted for 1.5% of U.S. GDP, or $252.6 billion. The malt beverage industry is divided into
three tiers: brewing, wholesaling, and retailing. The wholesale sector employed 131,300 people from
6,830 firms, while the retail sector employed 805,300 people. Considering taxes, the industry and
employees paid $37.5 billion in direct federal, state, and local tax, while the consumption of the beer
created $5.4 billion in federal and state excise tax revenues, $5.2 billion in state sales tax revenues, and
$384.5 million in other beer-specific local tax revenues. The induced impact from the industry totaled
$60.8 billion and 384,870 jobs. The study also defined industry suppliers to include companies that
supply ingredients, packaging, fuel, sales displays, transportation, and machinery, and provide services.
Government enterprises that work on regulation for the industry were also included. The economic
activity of the malt beverage industry suppliers totaled $83.2 billion and 383,190 jobs in 2014. (John
Dunham & Associates 2015)
Business Research Division │ Leeds School of Business │ University of Colorado Boulder 20
The Washington Beer Commission, 2012 Annual Report In 2012, the direct economic impact of the brewing industry in Washington, when combined with the
revenue generated by distributors and retailers, totaled more than $1.2 billion in 2010 according to the
Washington Beer Commission. Business and personal tax revenue in the same year topped $500 million.
In addition, $200 million was paid in federal, state, and local consumption taxes as a result of beer
industry-related transactions in Washington. In 2012, craft breweries in the state totaled 162. Washington
brewers have experienced five-straight years of increased barrels of beer produced, logging just under
275,000 barrels of beer produced in 2012. (Washington Beer Commission 2012)
The Economic Impact of Craft Brewing in Montana Production at Montana breweries increased from just over 87,000 barrels in 2010 to around 103,000
barrels in 2011. Beer sales increased from slightly less than $22 million to more than $26 million.
Employment, including both full- and part-time jobs rose 39% from 2010 to 2011. Compensation (wages
and salaries plus benefits) climbed from $5.2 million to $6.4 million, a 23% gain. Expenditures increased
from $15.6 million to $18.8 million, a 21% overall gain. The percentage of expenditures made within the
state varied widely among brewers, ranging from 2% to 90%. (Sorenson, Morgan, and Furniss 2012)
Economic Impact of Texas Craft Beer The Texas Beer Freedom conducted an economic impact study on the Texas craft brewing industry for
the Texas Craft Brewers Guild. Texas had 78 actively licensed small manufactures of craft beer at the end
of 2011 compared to 52 at year-end 2010. Texas craft brewers represent approximately 133,000 barrels of
beer in 2011, a 46% increase from 2010. Texas craft brewers represent an estimated 12.3% of craft beer
and 0.7% of all beer consumed in Texas. Nationally, in 2011 craft beer’s market share was 5.7% by
volume and 9.1% by dollars. Survey respondents plan on spending $29 million in capital investment over
the next five years, adding 184,512 barrels of capacity. The Texas craft brewing industry could have an
economic impact estimated at $5.6 billion if certain statutory reforms were enacted and craft beer
followed the same trajectory as Texas wine. (Metzger 2012)
California Craft Brewing Industry: An Economic Impact Study The craft brewing industry in California is thriving due to rising consumer demand despite being on the
heels of the most significant recession since the Great Depression. The industry produced approximately
2.2 million barrels in 2011, which equates to one in five craft beers brewed in the United States. In 2011,
the 243 breweries in this study generated approximately $3 billion in total economic impact in California
contributing significantly to the state’s total economy. In 2011, California’s craft brewers created 22,000
jobs in a state facing double-digit unemployment. In 2011, craft breweries in California paid more than

Business Research Division │ Leeds School of Business │ University of Colorado Boulder 21
$400 million in total local, state, and federal taxes, estimated at 52% of the cost of a craft beer at point of
purchase. (California Craft Brewing Association 2012)
Oregon Craft Beer, Economic Impact As of July 1, 2015, brewing facilities totaled 234 in Oregon, operated by 194 brewing companies in 72
cities across the state. According to the Oregon Brewers Guild, Oregonians bought nearly 585,000 barrels
of beer in 2014, a 14.3% increase over 2013. Oregon continues to lead the nation in percentage of dollars
spent on craft beer. Oregon craft brewers shipped 1.056 million barrel outside of Oregon to all 50 states
and all U.S. territories. In 2014, the craft beer industry’s economic impact on the state totaled $2.83
billion and created more than 30,000 direct and indirect jobs. (Oregon Craft Beer n.d.)
Economic Contributions of the Craft Brewing Industry to the State of Arizona The study was commissioned by the Arizona Craft Brewer’s Guild to estimate the size and economic
impact of locally owned in-state breweries on Arizona’s economy in terms of their production output,
gross sales, employment, and tax revenues. The total economic impact of Arizona craft brewing on
Arizona in 2011 was $278 million. Overall, Arizona craft brewers had a direct economic contribution of
$152 million, an indirect economic contribution of $59.1 million, and an induced economic contribution
of $66.9 million. This economic activity produced a total of 3,486 jobs (direct, indirect, and induced). In
2011, Arizona had a total of 33 active craft breweries. These craft brewers produced more than 119,000
barrels of beer in 2011, an increase of 22% over 2010; production grew more than 20% per year over each
of the previous three years. In 2011, Arizona craft brewers paid almost $9.69 million in state sales taxes
and an additional $1.4 million in federal and state excise or luxury taxes. The total annual payroll in 2011
by Arizona craft brewers was an estimated $23 million. Most Arizona craft brewers do not currently offer
employee benefits, although 30% offer health benefits, about 15% offer dental, vision and 401(k)
benefits. Just over one-quarter (26%) give their employees free product. Arizona craft brewers are
positive about their growth potential; 70% say they plan to increase hiring in 2012. (Combrink, Cothran,
and Peterson 2012)
The Economic Impacts of Breweries on Larimer County Conducted by the Regional Economics Institute at Colorado State University, this study estimated the
economic impact of the 10 breweries located in Larimer County in 2010. Ranging from large-scale
operations to small craft brewers and mom-and-pop businesses, Larimer County breweries directly
generated $263.1 million in local output—translating into $106.0 million in value-added activity—and
added $83.2 million to county payrolls. The industry supported a total of 938 direct jobs, with average
compensation per worker of $88,700. These direct jobs support an additional 1,550 spin-off jobs with an
average compensation per worker of $37,900. Between the years 2000 and 2010, Larimer County
Business Research Division │ Leeds School of Business │ University of Colorado Boulder 22
breweries expanded their employment by a total of 22.1% while the county’s employment grew by 0.6%
per annum. Taking into account direct and spin-off jobs, the breweries add a total of $141.9 million to
county payrolls. Local breweries supported $309.9 million in county output in 2010 (direct and spin-off
impacts), translating into $178.1 million in value-added activity and 2,488 jobs. (Marturana and Shields
2011)
Brewers Association: Statistics Small and independent American craft brewers contributed $55.7 billion to the U.S. economy in 2014.
This figure includes the total impact that comes from breweries, wholesalers, and retailers, as well as
nonbeer products such as food and merchandise that brewpub restaurants and brewery taprooms sell. The
industry provided more than 424,000 jobs, with over 115,000 direct jobs at breweries and brewpubs,
including serving staff at brewpubs. The top five states in 2012 for total output are California ($6.9
billion), Pennsylvania ($4.5 billion), Texas ($3.8 billion), New York ($2.9 billion), and Colorado ($2.7
billion). (Brewers Association 2014)
Oklahoma Craft Brewing Economic Impact Report Although the Oklahoma craft brewing industry is still in its earliest stages, it already has had significant
economic impact within the state. Despite being the 47th-largest state in total craft beer production,
Oklahoma’s craft beer industry had the 33rd-highest economic impact in the country. A major reason for
Oklahoma’s success has been its employment and compensation. The average pay per employee ranks
sixth nationally, at $49,870 per year. In 2014, Oklahoma’s craft brewing industry had a $415.7 million
economic impact. For each 12-oz pint of beer sold, nearly $66 of economic activity was generated.
Oklahoma currently has restrictive state laws that limit the production and consumption of alcohol, thus
the full potential of the industry has not yet been realized. (Roach 2016)
Related Documents