Business Report April, 2017 to June, 2017 (Q1, FY ending March 31, 2018) Wacom Co., Ltd. (TSE 1st Sec. Code: 6727)

Welcome message from author
This document is posted to help you gain knowledge. Please leave a comment to let me know what you think about it! Share it to your friends and learn new things together.
Transcript

Business ReportApril, 2017 to June, 2017 (Q1, FY ending March 31, 2018)
Wacom Co., Ltd.
(TSE 1st Sec. Code: 6727)
All Rights Reserved. Copyright © 2017 Wacom Co., Ltd. 22
Contents Index
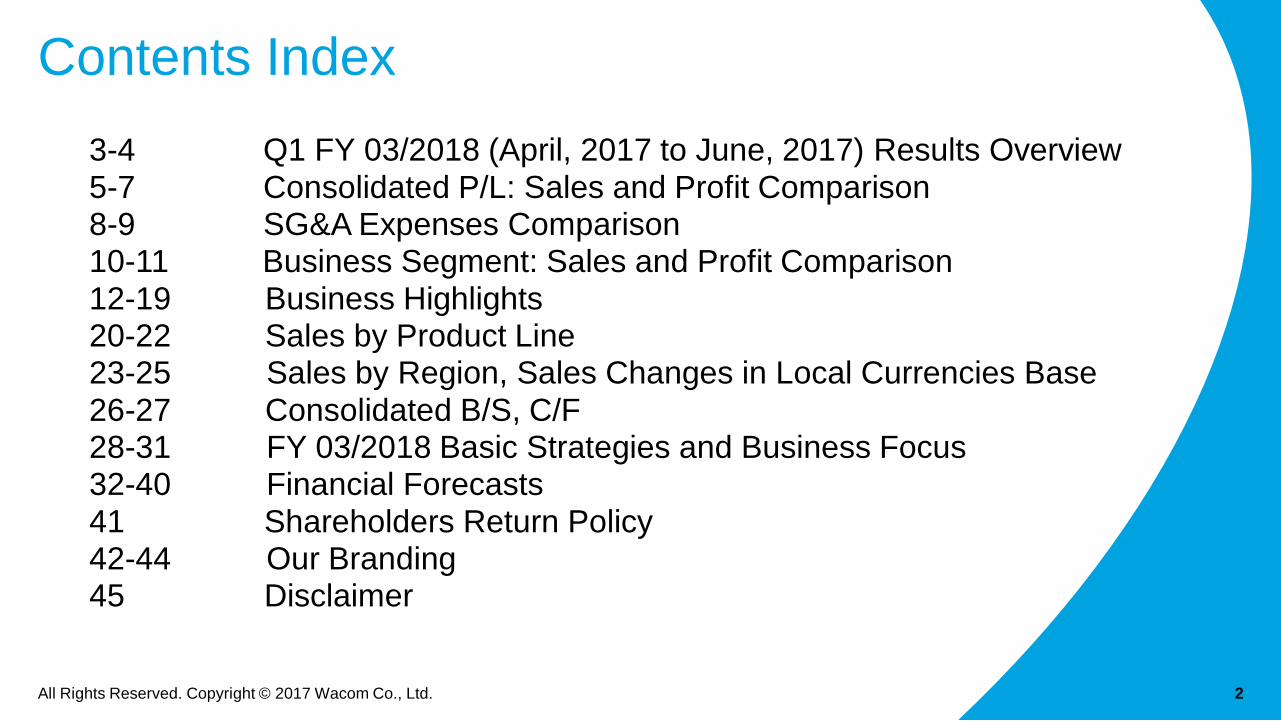
3-4 Q1 FY 03/2018 (April, 2017 to June, 2017) Results Overview5-7 Consolidated P/L: Sales and Profit Comparison8-9 SG&A Expenses Comparison10-11 Business Segment: Sales and Profit Comparison 12-19 Business Highlights20-22 Sales by Product Line23-25 Sales by Region, Sales Changes in Local Currencies Base26-27 Consolidated B/S, C/F28-31 FY 03/2018 Basic Strategies and Business Focus32-40 Financial Forecasts41 Shareholders Return Policy42-44 Our Branding45 Disclaimer
All Rights Reserved. Copyright © 2017 Wacom Co., Ltd. 33
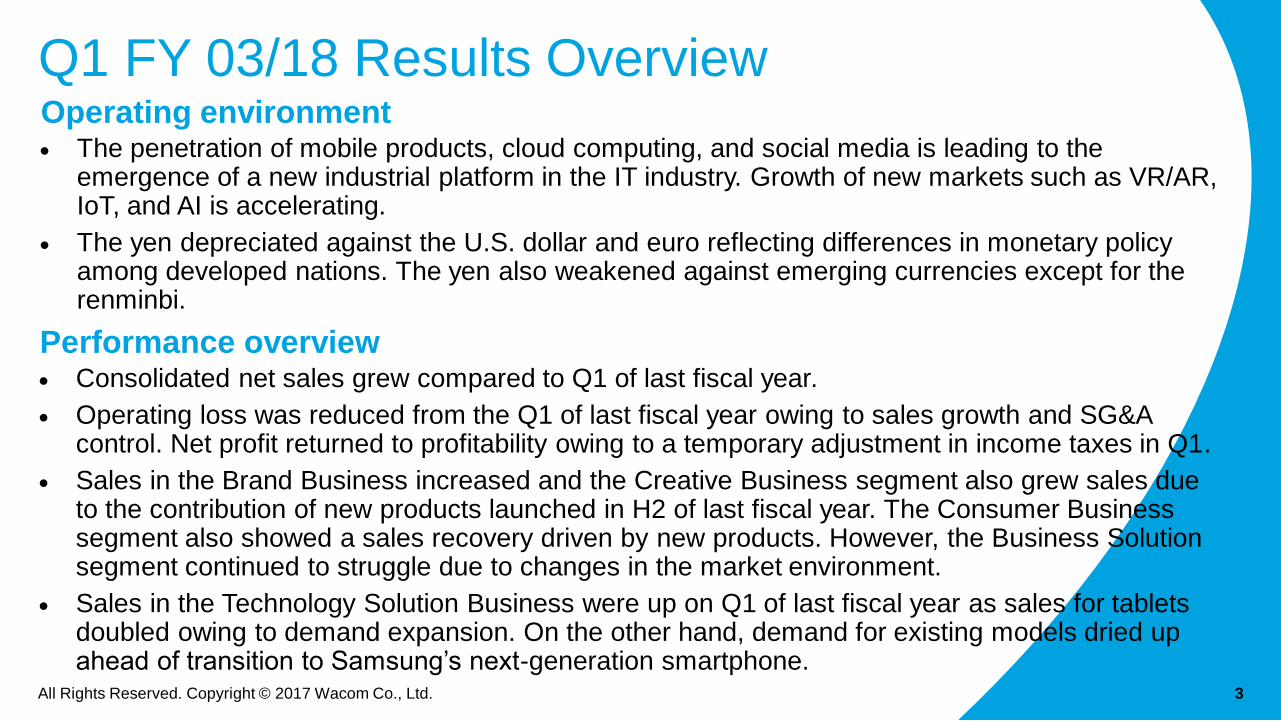
Q1 FY 03/18 Results OverviewOperating environment• The penetration of mobile products, cloud computing, and social media is leading to the
emergence of a new industrial platform in the IT industry. Growth of new markets such as VR/AR, IoT, and AI is accelerating.
• The yen depreciated against the U.S. dollar and euro reflecting differences in monetary policy among developed nations. The yen also weakened against emerging currencies except for the renminbi.
Performance overview• Consolidated net sales grew compared to Q1 of last fiscal year.
• Operating loss was reduced from the Q1 of last fiscal year owing to sales growth and SG&A control. Net profit returned to profitability owing to a temporary adjustment in income taxes in Q1.
• Sales in the Brand Business increased and the Creative Business segment also grew sales due to the contribution of new products launched in H2 of last fiscal year. The Consumer Businesssegment also showed a sales recovery driven by new products. However, the Business Solution segment continued to struggle due to changes in the market environment.
• Sales in the Technology Solution Business were up on Q1 of last fiscal year as sales for tablets doubled owing to demand expansion. On the other hand, demand for existing models dried up ahead of transition to Samsung’s next-generation smartphone.
All Rights Reserved. Copyright © 2017 Wacom Co., Ltd. 4
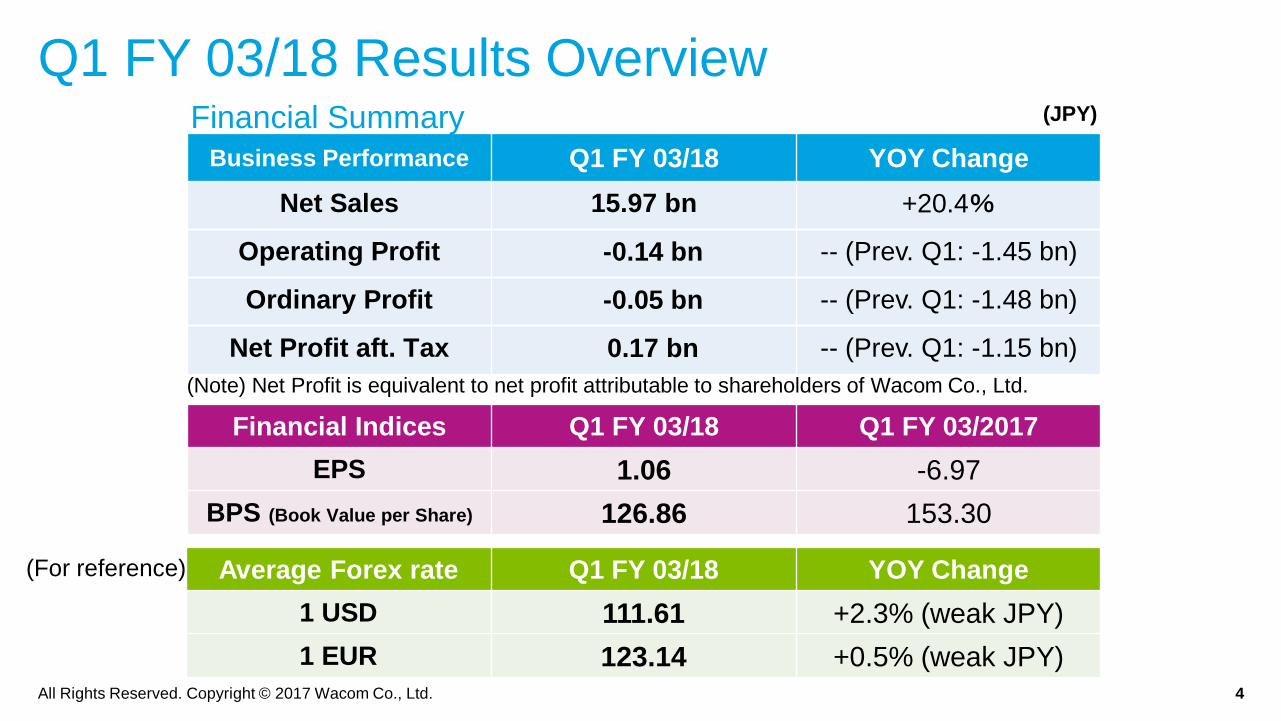
Average Forex rate Q1 FY 03/18 YOY Change
1 USD 111.61 +2.3% (weak JPY)
1 EUR 123.14 +0.5% (weak JPY)
Q1 FY 03/18 Results Overview
Business Performance Q1 FY 03/18 YOY Change
Net Sales 15.97 bn +20.4%
Operating Profit -0.14 bn -- (Prev. Q1: -1.45 bn)
Ordinary Profit -0.05 bn -- (Prev. Q1: -1.48 bn)
Net Profit aft. Tax 0.17 bn -- (Prev. Q1: -1.15 bn)
Financial Indices Q1 FY 03/18 Q1 FY 03/2017
EPS 1.06 -6.97
BPS (Book Value per Share) 126.86 153.30
Financial Summary (JPY)
(Note) Net Profit is equivalent to net profit attributable to shareholders of Wacom Co., Ltd.
(For reference)

All Rights Reserved. Copyright © 2017 Wacom Co., Ltd. 5
Consolidated P/L
Q1 FY 03/17 Q1 FY 03/18 YOY Change
04/16-06/16 04/17-06/17 Amount Ratio
Net Sales 13,261 15,966 2,705 20.4%
Gross Profit 5,271 6,693 1,422 27.0%
profit margin % 39.8% 41.9%
SG&A 6,718 6,831 113 1.7%
Operating Profit -1,447 -138 1,309 --
profit margin % -10.9% -0.9%
Ordinary Profit -1,481 -46 1,435 --
Net Profit after Tax -1,147 172 1,319 --
(Unit: Million JPY)
All Rights Reserved. Copyright © 2017 Wacom Co., Ltd. 6
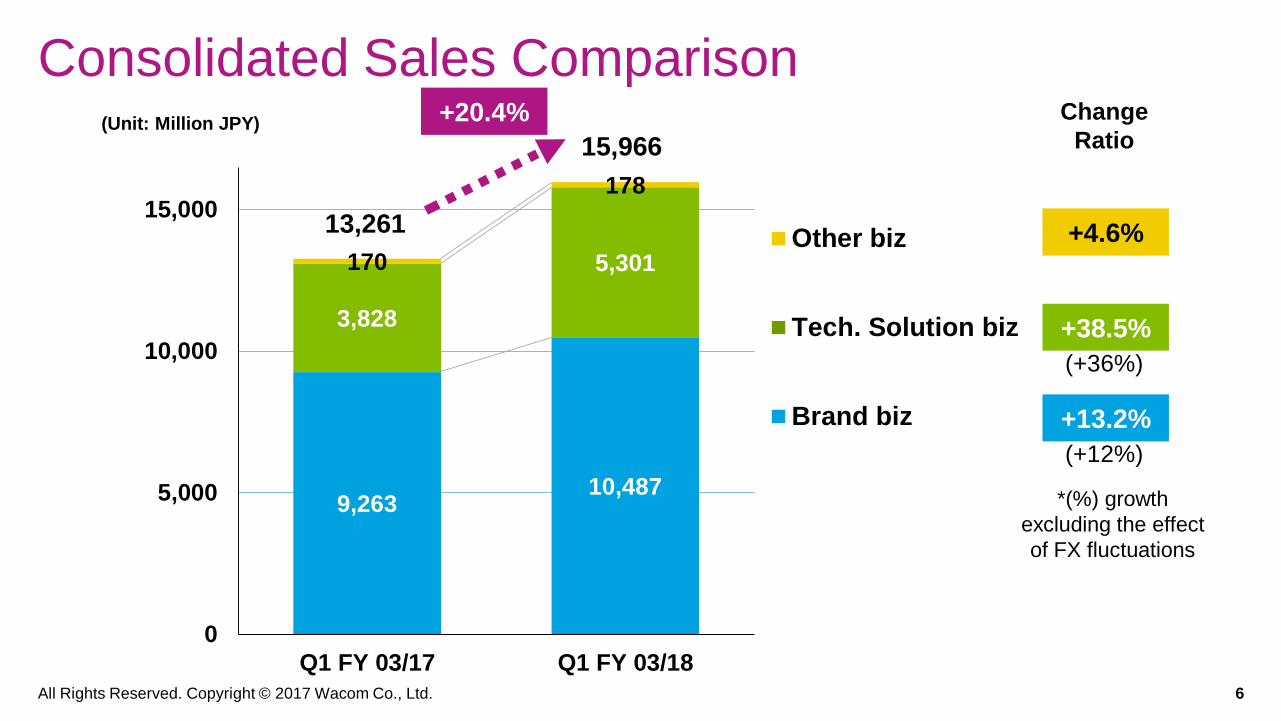
Consolidated Sales Comparison
9,26310,487
3,828
5,301170
178
0
5,000
10,000
15,000
Q1 FY 03/17 Q1 FY 03/18
Other biz
Tech. Solution biz
Brand biz
13,261
15,966
(+12%)
(+36%)
+20.4%
+4.6%
+38.5%
+13.2%
(Unit: Million JPY)Change
Ratio
*(%) growth
excluding the effect
of FX fluctuations

All Rights Reserved. Copyright © 2017 Wacom Co., Ltd. 7
Consolidated Profit Comparison
-1,447
-138
-1,481
-46
-1,147
172
-1,800
-1,500
-1,200
-900
-600
-300
0
300
Q1 FY 03/17 Q1 FY 03/18
OperatingProfit
OrdinaryProfit
Net Profit
--
--
--
*
Net profit returned to profitability
owing to a temporary adjustment
of 0.2 billion yen in income taxes
*
(Unit: Million JPY)Change
Ratio
All Rights Reserved. Copyright © 2017 Wacom Co., Ltd. 8
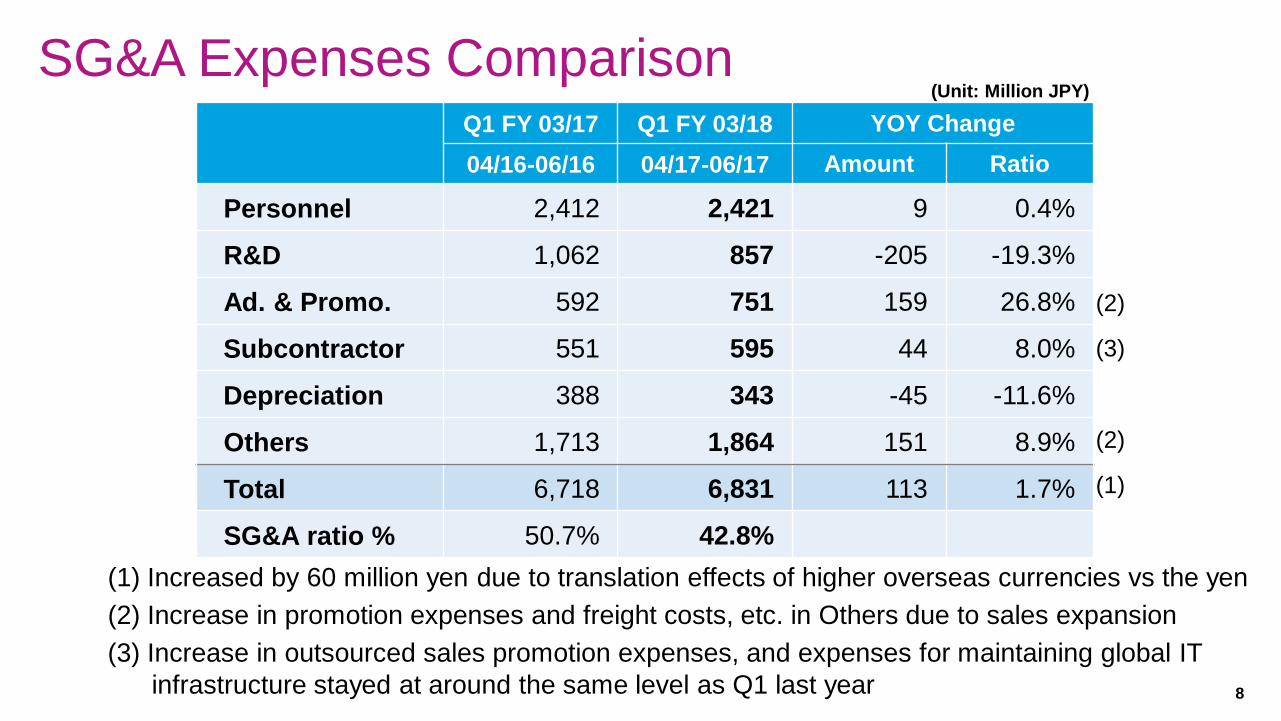
SG&A Expenses ComparisonQ1 FY 03/17 Q1 FY 03/18 YOY Change
04/16-06/16 04/17-06/17 Amount Ratio
Personnel 2,412 2,421 9 0.4%
R&D 1,062 857 -205 -19.3%
Ad. & Promo. 592 751 159 26.8%
Subcontractor 551 595 44 8.0%
Depreciation 388 343 -45 -11.6%
Others 1,713 1,864 151 8.9%
Total 6,718 6,831 113 1.7%
SG&A ratio % 50.7% 42.8%
(2)
(2)
(1)
(3)
(Unit: Million JPY)
(2) Increase in promotion expenses and freight costs, etc. in Others due to sales expansion
(1) Increased by 60 million yen due to translation effects of higher overseas currencies vs the yen
(3) Increase in outsourced sales promotion expenses, and expenses for maintaining global IT
infrastructure stayed at around the same level as Q1 last year

All Rights Reserved. Copyright © 2017 Wacom Co., Ltd. 9
Consolidated P/L (For Reference)
Currencies Changes of forex Sales OP
1 USD +2.54 JPY (weak yen) +190 mil. -40 mil.
1 EUR +0.67 JPY (weak yen) +10 mil. +10 mil.
Asian currencies total
(Renminbi) (-0.34 JPY, strong yen)
+40 mil.(-30 mil.)
+30 mil.(-20 mil.)
Grand Total +240 mil. +0 mil.
• Sensitivity to currency fluctuations (year on year)
• Reason for operating profit increase (year on year)(1) Tech. Solution Business: sales increase and profitability increase* for tablets (* due to an
increase in sales composition for customers’ new models) +0.8 bn (ex. forex impact)
(2) Brand Business: sales increase and profitability increase +0.4 bn (ex. forex impact)
(3) Corporate and other functions: limited rise of SG&A expenses
• Reason for return to profitability in Net ProfitTemporary adjustment in income taxes: +0.2 bn
(JPY)

All Rights Reserved. Copyright © 2017 Wacom Co., Ltd. 10
Business Segment & Business Unit
Technology Solution Business• Pen sensor systems for Smartphones and Tablets• EMR, AES pen components & modules (feelTM)
Other Business Engineering Solution・ECAD series
Consumer Business• Makes daily lives more creative and enjoyable
• Product Lines: Digital Stationery, etc.
Business Solution• Serves society by providing innovative solutions
• Product lines: Signature Tablet, Pen Display, etc.
Creative Business• Serves the passion of professional and consumer creativity
• Product Lines: Pen Tablet, Mobile, Display
Bra
nd
Bu
sin
es
s
Platform &applications
• Provides
technology,
apps and
platforms
• Cloud Apps
& Services,
WILL(digital
Ink solution)
All Rights Reserved. Copyright © 2017 Wacom Co., Ltd. 11
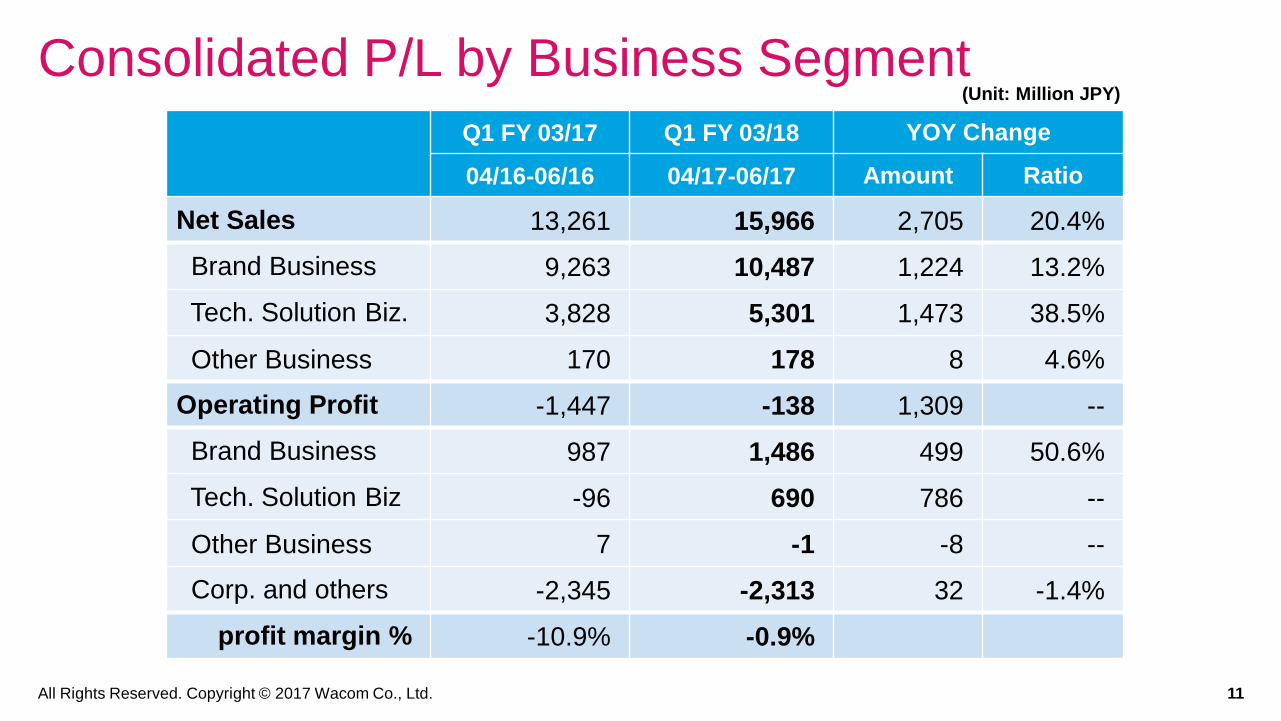
Consolidated P/L by Business Segment
Q1 FY 03/17 Q1 FY 03/18 YOY Change
04/16-06/16 04/17-06/17 Amount Ratio
Net Sales 13,261 15,966 2,705 20.4%
Brand Business 9,263 10,487 1,224 13.2%
Tech. Solution Biz. 3,828 5,301 1,473 38.5%
Other Business 170 178 8 4.6%
Operating Profit -1,447 -138 1,309 --
Brand Business 987 1,486 499 50.6%
Tech. Solution Biz -96 690 786 --
Other Business 7 -1 -8 --
Corp. and others -2,345 -2,313 32 -1.4%
profit margin % -10.9% -0.9%
(Unit: Million JPY)
All Rights Reserved. Copyright © 2017 Wacom Co., Ltd. 12
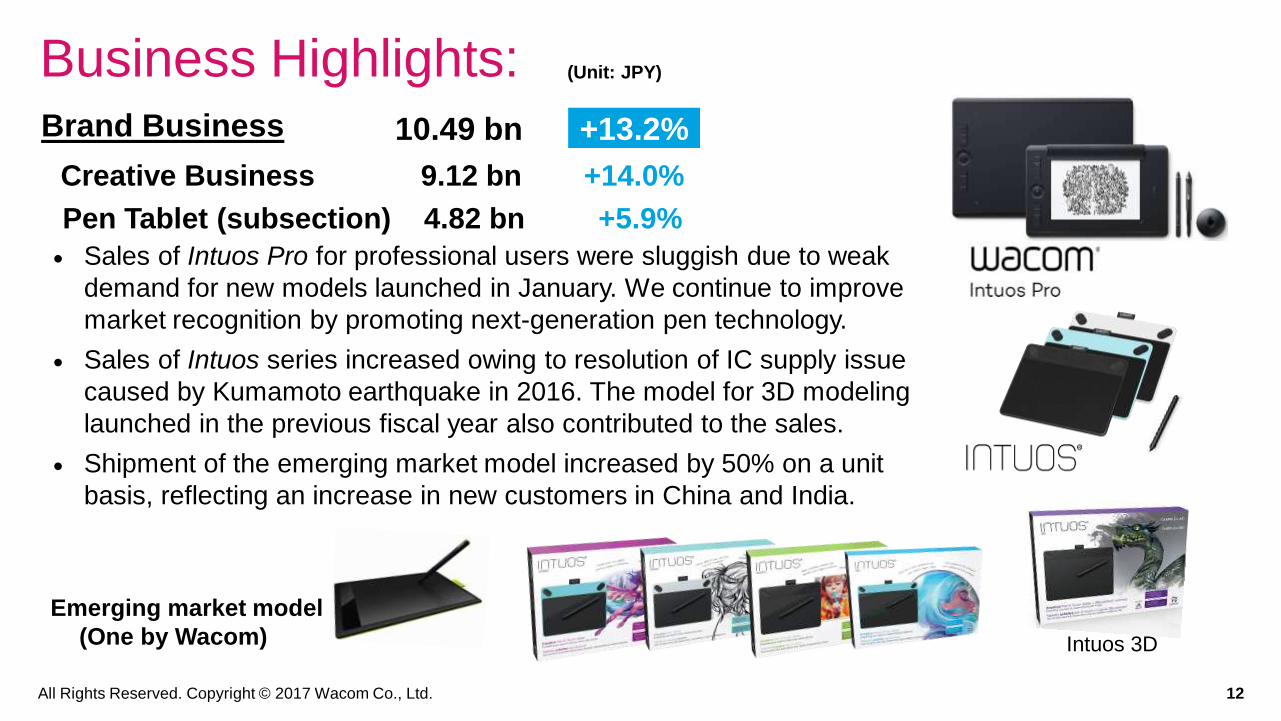
Brand Business
Creative Business 9.12 bn +14.0%
Pen Tablet (subsection) 4.82 bn +5.9%
• Sales of Intuos Pro for professional users were sluggish due to weak
demand for new models launched in January. We continue to improve
market recognition by promoting next-generation pen technology.
• Sales of Intuos series increased owing to resolution of IC supply issue
caused by Kumamoto earthquake in 2016. The model for 3D modeling
launched in the previous fiscal year also contributed to the sales.
• Shipment of the emerging market model increased by 50% on a unit
basis, reflecting an increase in new customers in China and India.
10.49 bn +13.2%
Intuos 3D
Business Highlights: (Unit: JPY)
Emerging market model
(One by Wacom)
All Rights Reserved. Copyright © 2017 Wacom Co., Ltd. 13
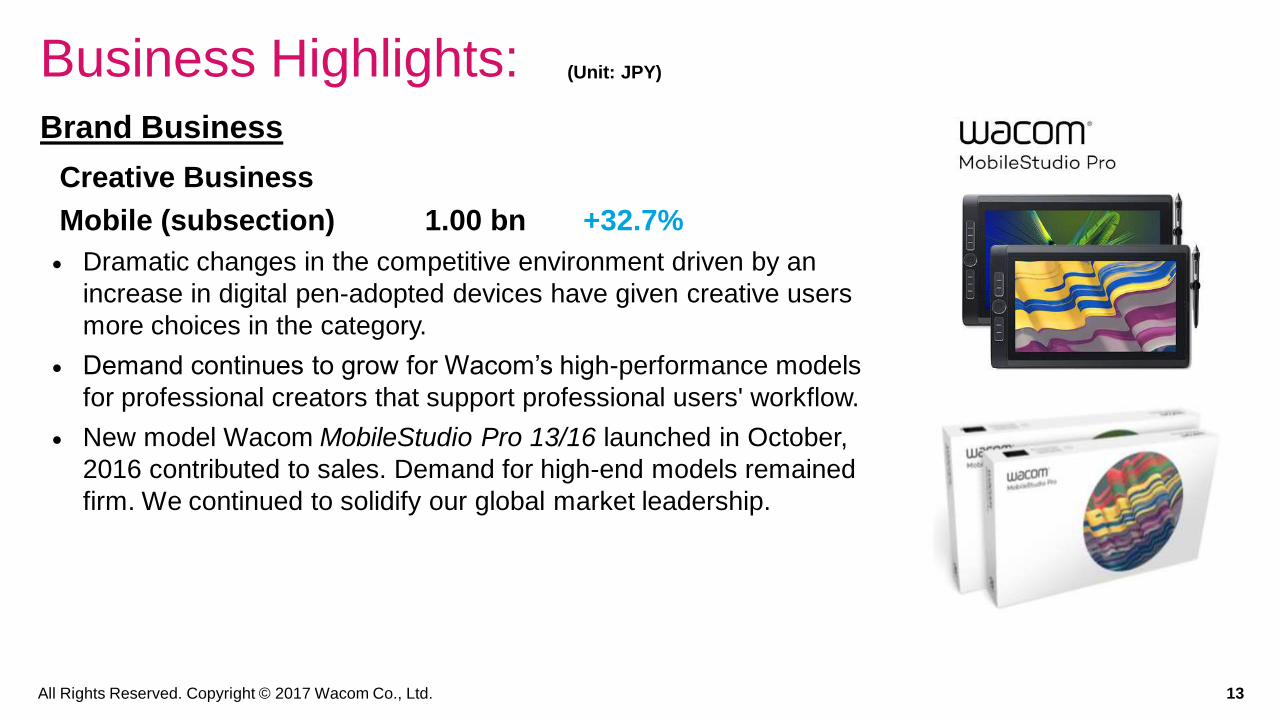
Brand Business
Creative Business
Mobile (subsection) 1.00 bn +32.7%
• Dramatic changes in the competitive environment driven by an
increase in digital pen-adopted devices have given creative users
more choices in the category.
• Demand continues to grow for Wacom’s high-performance models
for professional creators that support professional users' workflow.
• New model Wacom MobileStudio Pro 13/16 launched in October,
2016 contributed to sales. Demand for high-end models remained
firm. We continued to solidify our global market leadership.
Business Highlights: (Unit: JPY)

All Rights Reserved. Copyright © 2017 Wacom Co., Ltd. 14
Brand Business
Creative Business
Display (subsection) 3.30 bn +22.5%
• New models Wacom Cintiq Pro13/16 equipped with next-generation
digital pen technology, 4K high-resolution and wide gamut display
contributed to the sales.
• Sales of the existing model Cintiq 13 steadily continued, acquiring
entry user base. On the other hand, sales of existing large size
models decreased due to product life cycle transitions.
27 QHD13HD
13
16
Business Highlights: (Unit: JPY)

All Rights Reserved. Copyright © 2017 Wacom Co., Ltd. 15
Brand Business
Consumer Business 0.58 bn +148.0%
• We launched Bamboo Ink, a new stylus product developed with
Microsoft and optimized for Windows OS tablets in June. Sales
started in the U.S. and contributed to overall sales.
• We launched smart stylus product Bamboo Sketch for iPad in June,
which contributed to overall sales.
• Bamboo Slate and Bamboo Folio launched in September, 2016 and
exceeded the sales level of the previous models. We continued
efforts to establish the digital stationery category.
• We provided Wacom Cloud to store and utilize digital ink through
cloud services.
Wacom InkLayer Language
Inkspace,Bamboo Paper Apps
Business Highlights: (Unit: JPY)

All Rights Reserved. Copyright © 2017 Wacom Co., Ltd. 16
DTU-1031DTU-1141
STUシリーズSTU-540/430
Brand Business
Business Solution 0.79 bn -23.3%
• Large decline in sales in the Eurozone due to continued effects of changes
in the market environment including competition with mobile devices.
• Sales of STU series significantly decreased due to sales decline in the
Eurozone and reaction from large scale public institution sale in India last
fiscal year.
• Sales of the DT series increased owing to the adoption by a financial
institution in the U.S.
• We launched new product Wacom Clipboard in June and started sales
promotion as a B2B solution that digitizes handwritten content on paper in
real-time.
DTK-1651
PHU-111
Business Highlights: (Unit: JPY)

All Rights Reserved. Copyright © 2017 Wacom Co., Ltd. 17
5.3bnTech. Solution Business
Pen Sensor System
for Smartphones 0.21bn -83.5%
• Demand for Samsung’s existing smartphone models dried up
before transitioning to the next-gen model.
• Continued pen volume production for the next generation
model.
• Focused on automation of a new cartridge-type digital pen.
• Continued efforts for new customer development.
+38.5%
Business Highlights: (Unit: JPY)
Smartphone models

All Rights Reserved. Copyright © 2017 Wacom Co., Ltd. 18
Tech. Solution Business
Pen Sensor System for Tablets
and Notebook PCs 5.09 bn +97.9%
• Sales of Active-ES pen solution increased due to expanding adoption.
• Sales of EMR pen solution increased due to growing demand for
educational PCs such as Google Chromebook.
• Developed a standardized digital pen for Windows10 OS tablets with
Microsoft.
• Making efforts to expand digital stationery business.
Business Highlights: (Unit: JPY)
Tablet ・PC models

All Rights Reserved. Copyright © 2017 Wacom Co., Ltd. 19
Business Highlights: (Unit: JPY)
Other Business
CAD software and others 0.18 bn +4.6%
• Sales of major product ECAD series increased.
0.18 bn
F&A (Corporate)
• Launched “Wacom Innovation Hub” in May as a new support program for startup companies to
encourage new and innovative applications based on the WILL platform as digital ink standard.
• Held “Connected Ink” digital ink promotion event in Shanghai in June.
• Continued development of growing markets such as 3D and VR/AR.
• Proceeded with planning of new strategic initiatives to optimize cost structure and address
management issues. We established a Nominating Committee in April to improve business
decision-making and started criteria formulation for selecting executives of Wacom group
(Representative Director, Directors, and executive officers).
+4.6%

All Rights Reserved. Copyright © 2017 Wacom Co., Ltd. 20
Sales by Product Line in Brand Business
4,555 4,821
7531,000
2,696
3,301
233
578
1,026
787
0
2,000
4,000
6,000
8,000
10,000
Q1 FY 03/17 Q1 FY 03/18
Business Solution
Consumer
Creative・Display
Creative・Mobile
Creative・Pen
tablet
10,487
9,263
Creative
biz
9,122
+14.0%
+13.2%
-23.3%
+32.7%
+5.9%
+148.0%
+22.5%
Creative
biz
8,004
(Unit: Million JPY)Change
Ratio

All Rights Reserved. Copyright © 2017 Wacom Co., Ltd. 21
Sales by Product Line in Tech. Solution Business
1,255
207
2,5735,094
0
1,000
2,000
3,000
4,000
5,000
Q1 FY 03/17 Q1 FY 03/18
Pen for Tablet,others
Pen forSmartphone
5,301
3,828
+38.5%
-83.5%
+97.9%
(Unit: Million JPY)Change
Ratio

All Rights Reserved. Copyright © 2017 Wacom Co., Ltd. 22
0
5000
10000
15000
20000
25000
14/7-9 14/10-12 15/1-3 15/4-6 15/7-9 15/10-12 16/1-3 16/4-6 16/7-9 16/10-12 17/1-3 17/4-6
Creative Consumer(Stylus, etc.) Business Solution Tech. Solution CAD, etc.
Quarterly Trend by Product Line
18,342
24,954
17,592
15,142
23,814
21,936
16,676
13,261
20,535 20,943
16,57515,966
(Unit: Million JPY)
All Rights Reserved. Copyright © 2017 Wacom Co., Ltd. 23
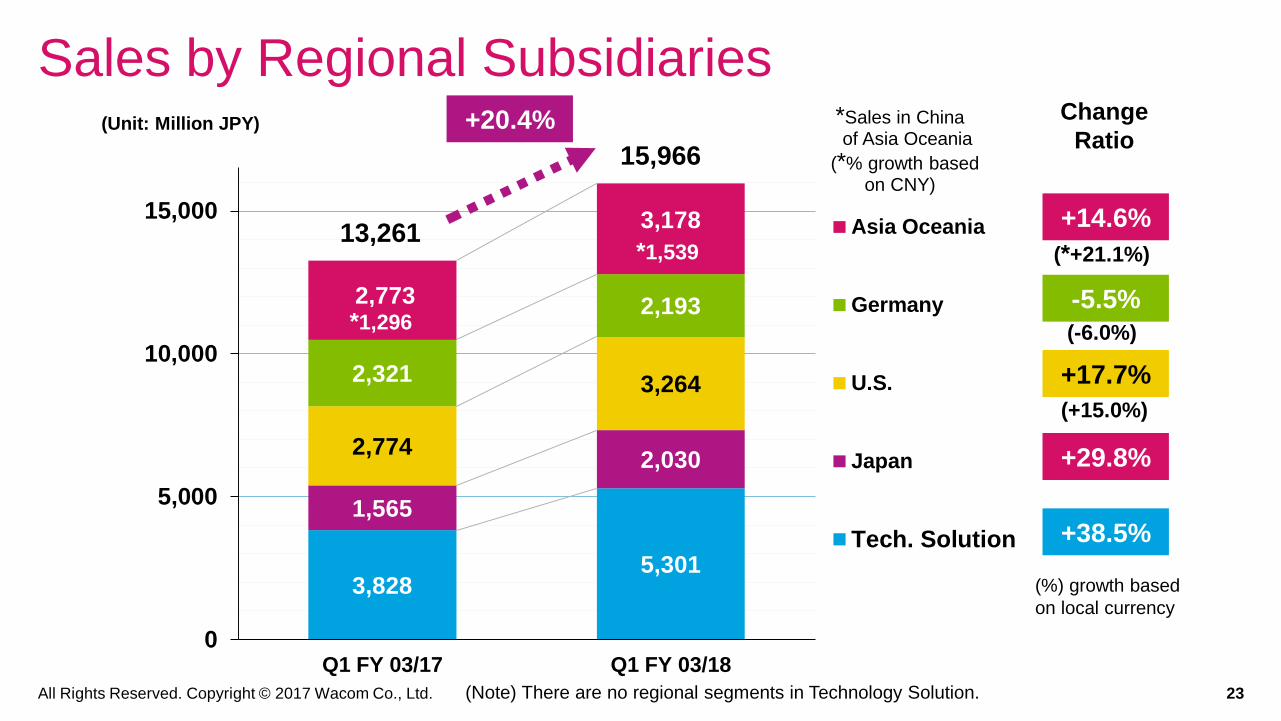
Sales by Regional Subsidiaries
3,8285,301
1,565
2,0302,774
3,2642,321
2,1932,773
3,178
0
5,000
10,000
15,000
Q1 FY 03/17 Q1 FY 03/18
Asia Oceania
Germany
U.S.
Japan
Tech. Solution
(+15.0%)
(-6.0%)
*1,539
*1,296
(*+21.1%)13,261
15,966
+20.4%
+14.6%
+29.8%
+38.5%
-5.5%
+17.7%
(Unit: Million JPY)Change
Ratio*Sales in China of Asia Oceania
(*% growth based on CNY)
(%) growth based
on local currency
(Note) There are no regional segments in Technology Solution.

All Rights Reserved. Copyright © 2017 Wacom Co., Ltd. 24
(Ref.) Sales Changes in Local Currency Base
Region CurrencyYOY
Change Ratio
Japan(excluding Technology Solution)
JPY +29.8%
U.S. USD +15.0%
Europe EUR -6.0%
China CNY +21.2%
Korea KRW +23.1%
Australia AUD +7.0%
Singapore USD -6.6%
Hong Kong USD +15.3%
Taiwan NTD +8.1%
India INR -33.1%

All Rights Reserved. Copyright © 2017 Wacom Co., Ltd. 25
0
5,000
10,000
15,000
20,000
25,000
14/7-9 14/10-12 15/1-3 15/4-6 15/7-9 15/10-12 16/1-3 16/4-6 16/7-9 16/10-12 17/1-3 17/4-6
Tech. Solution Japan U.S. Germany Asia Oceania
Quarterly Trend by Regional Subsidiaries
18,342
24,954
17,592
15,142
23,814
21,936
16,676
13,261
20,53520,943
16,57515,966
(Unit: Million JPY)
(Note) There are no regional segments in Technology Solution.
All Rights Reserved. Copyright © 2017 Wacom Co., Ltd. 26
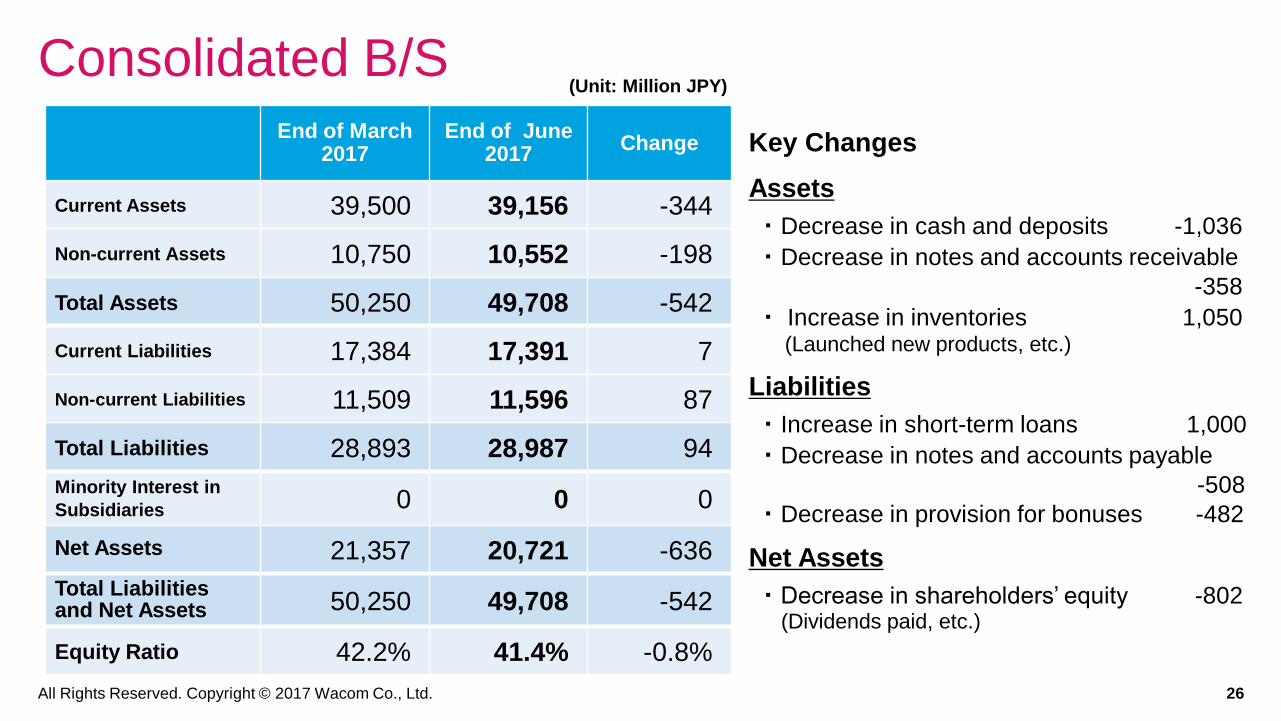
Consolidated B/SEnd of March
2017End of June
2017Change
Current Assets 39,500 39,156 -344
Non-current Assets 10,750 10,552 -198
Total Assets 50,250 49,708 -542
Current Liabilities 17,384 17,391 7
Non-current Liabilities 11,509 11,596 87
Total Liabilities 28,893 28,987 94
Minority Interest in
Subsidiaries 0 0 0
Net Assets 21,357 20,721 -636
Total Liabilities and Net Assets 50,250 49,708 -542
Equity Ratio 42.2% 41.4% -0.8%
(Unit: Million JPY)
Key Changes
Assets
・ Decrease in cash and deposits -1,036
・ Decrease in notes and accounts receivable
-358
・ Increase in inventories 1,050(Launched new products, etc.)
Liabilities
・ Increase in short-term loans 1,000
・ Decrease in notes and accounts payable
-508
・ Decrease in provision for bonuses -482
Net Assets
・ Decrease in shareholders’ equity -802(Dividends paid, etc.)

All Rights Reserved. Copyright © 2017 Wacom Co., Ltd. 27
Consolidated C/FQ1
FY 03/17
Q1
FY 03/18
YoY
Change
04/16-06/16 04/17-06/17 Amount
C/F from operating
activities-237 -1,204 -967
C/F from investing
activities-368 -279 89
C/F from financing
activities43 124 81
Effect of change in
exchange rate -866 324 1,190
Increase-decrease of
cash & cash equivalent -1,428 -1,036 392
Beginning balance of
cash & cash equivalent 14,365 14,205 -160
Ending balance of cash
and cash equivalent 12,937 13,169 232
(Unit: Million JPY)
Major Activities in Q1 FY 03/18
C/F from operating activities
・ Increase in inventories -819
・ Decrease in notes and accounts
payable-trade -597
・ Decrease in provision for bonuses -481
・ Depreciation 633
C/F from investing activities
・ Purchase of fixed assets -288(Mold, etc.)
C/F from financing activities
・ Increase in short-term loans payable 1,000
・ Cash dividends paid -876

FY 03/2018
Basic Strategies and
Business Focus

All Rights Reserved. Copyright © 2017 Wacom Co., Ltd. 29
Assumptions for FY 03/18 Business EnvironmentThe Global Economy
• The global economy is expected to expand driven by favorable growth in U.S. and sustaining growth in China.
• High uncertainty will be observed reflecting political developments such as a protectionist U.S. trade policy and instability in the EU.
• Geopolitical risk is expected to increase due to changing Middle East affairs and prolonged military tension in Far East.
• Instability in currency exchange rates is expected to persist.
The IT Industry and our Business Environment
• The IT industry is set to shift to a new industrial platform based on cloud services, big data, mobile communication services, and SNS. 5G and virtualization technology will accelerate innovation.
• IoT, VR/AR, 3D printing, and security-related business will continue to be key to our business. Creative markets will continue to expand and competition increases among major global IT players.
• Mobility, education, enterprise, and emerging countries are new business growth segments.
• Digital stationery linked with cloud services is expected to gain broader category awareness.
• Digital ink adoption is expanding to Windows, Chrome, and the other OS platforms.

All Rights Reserved. Copyright © 2017 Wacom Co., Ltd. 30
Basic Strategies and Initiatives -1-Basic Strategy
• Recover profitability through optimization of our global organization and cost structure.
• Achieve sustainable growth by enhancing Wacom’s leadership in the digital pen and ink market.
• Plan new medium-term strategies to evolve our business model under a new management team.
• Improve user experience, enhance the relationship with customers
Key Initiatives
Brand Product Business
• Extend 3D design functions and develop enterprise markets (3D, VR/AR, CAD, Multimedia, etc.).
• Build strong relationship with customers and communities by enhancing regional marketing functions.
• Promote creative workflow solutions from ideas on paper to digital design and contents.
• Develop and expand emerging market business (China, Asia/Pacific, LATAM).
• Expand the digital stationery market, and build brand awareness through collaboration with partners.
• Expand business solutions for enhancing efficiency in workflow and data security by digital signature technology

All Rights Reserved. Copyright © 2017 Wacom Co., Ltd. 31
Basic Strategies and Initiatives -2- Technology Solution Business
• Establish the de-facto-standard of digital pen technologies with EMR and AES for tablets.
• Support the transition to Samsung’s next-generation smartphone models.
• Develop and expand business opportunities through pen adoption for the education market with partner companies.
• Expand the digital stationery market in collaboration with various partner companies.
Corporate
• Enhance global organization and optimize cost structure and organization.
• Promote WILL through DSC and establish effective business structure utilizing digital ink with partner companies.
Risks and Opportunities
Risk
• Brand Business: Slow sales, delay of development and launch, and quality issues of new products.
• Technology Solution Business: Slow sales for Samsung’s next model smartphone.
Opportunities• Demand increase for new products and new technology (AES).
• Further progress in cost reduction.

All Rights Reserved. Copyright © 2017 Wacom Co., Ltd. 32
Assumptions for FY 03/18 Financial Forecast
(Unit:
Million JPY)
Unit of sensitivity In case of stronger JPY 1.00
FY 03/18 (forecast) (for ref.) FY 03/17 (result)
Currency USD EUR USD EUR
Sales -520 (-410) -140 -500 (-380) -110
Operating Profit +30 (+100) -100 -30 (+50) -70
Note: In case of the weaker JPY, read the above signs of plus and minus the other way round.
USD sensitivity reflects exposure of Asian currencies supposing they synchronize with USD.
Each figure in brackets above in USD shows sensitivity excluding exposure of Asian currencies, namely USD only.
• Reflected business update reviewing market trend as of mid July, 2017.
• In Technology Solution Business, actual results may materially differ from forecast in short term due to its business nature.
• Forex rate assumptions USD 1 = JPY 110 (YOY +0.9% weaker JPY)EUR 1 = JPY 118 (YOY -1.1% stronger JPY)
• Sensitivity to currency fluctuations: 12-month forecast
The financial forecasts as of May 10, 2017 were unchanged.
All Rights Reserved. Copyright © 2017 Wacom Co., Ltd. 33
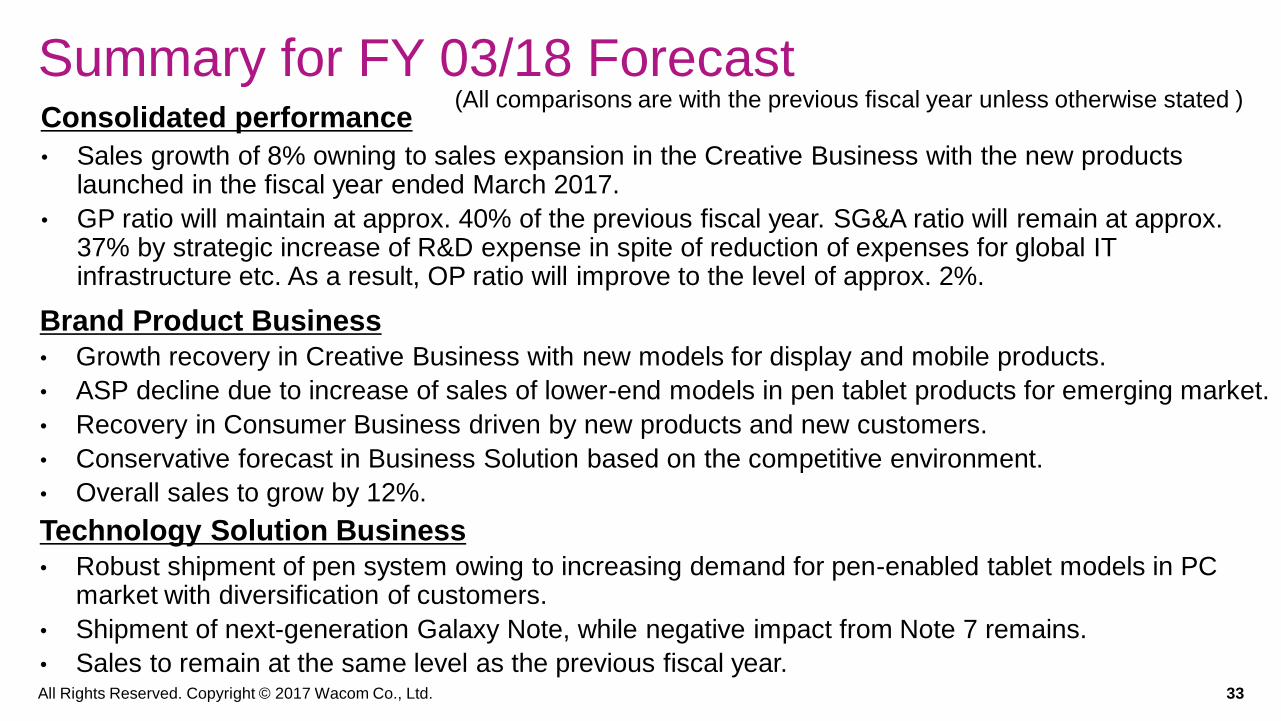
Summary for FY 03/18 ForecastConsolidated performance
• Sales growth of 8% owning to sales expansion in the Creative Business with the new products launched in the fiscal year ended March 2017.
• GP ratio will maintain at approx. 40% of the previous fiscal year. SG&A ratio will remain at approx. 37% by strategic increase of R&D expense in spite of reduction of expenses for global IT infrastructure etc. As a result, OP ratio will improve to the level of approx. 2%.
Brand Product Business
• Growth recovery in Creative Business with new models for display and mobile products.
• ASP decline due to increase of sales of lower-end models in pen tablet products for emerging market.
• Recovery in Consumer Business driven by new products and new customers.
• Conservative forecast in Business Solution based on the competitive environment.
• Overall sales to grow by 12%.
Technology Solution Business
• Robust shipment of pen system owing to increasing demand for pen-enabled tablet models in PC market with diversification of customers.
• Shipment of next-generation Galaxy Note, while negative impact from Note 7 remains.
• Sales to remain at the same level as the previous fiscal year.
(All comparisons are with the previous fiscal year unless otherwise stated )

All Rights Reserved. Copyright © 2017 Wacom Co., Ltd. 34
Summary for FY 03/18 Forecast1H FY 03/17 (rslt) 1H FY 03/18 (frct) YOY
04/16-09/16 04/17-09/17 Growth rate
Sales 33,797 35,180 1,383
Operating Profit -898 -2.7% -470 -1.3% 428
Ordinary Profit -1,021 -3.0% -500 -1.4% 521
Net Profit aft. tax -1,226 -3.6% -100 -0.3% 1,126
FY 03/17 (result) FY 03/18 (forecast) YOY
04/16-03/17 04/17-03/18 Growth rate
Sales 71,314 76,800 5,486
Operating Profit -1,171 -1.6% 1,800 2.3% 2,971
Ordinary Profit -870 -1.2% 1,740 2.3% 2,610
Net Profit aft. tax -5,534 -7.8% 1,130 1.5% 6,664
ROE -- 5.3% --
• We forecast a decrease in
operating loss in 1H owing to
the sales contribution of new
products in Brand Product
Business introduced in 2H for
FY 03/17.
• We forecast an YOY growth in
operating profit in 2H owing to
higher sales in both Brand
Product and Technology
Solution Businesses driven by
new products and business
seasonality.
• We forecast the growth both in
sales and profits.
(Unit: Million JPY)

All Rights Reserved. Copyright © 2017 Wacom Co., Ltd. 35
(Note) Due to risks and uncertainties involved in the forecast of market and customer trends in Technology Solution Business,
actual results may materially differ from forward-looking statements in the short term.
Forecast by Business Segment
FY 03/17 (rslt) FY 03/18 (fcst) YOY Change
04/16-03/17 04/17-03/18 Amount Ratio
Net Sales 71,314 76,800 5,486 7.7%
Brand biz 43,874 49,200 5,326 12.1%
Tech. Solution biz 26,758 26,900 142 0.5%
Other biz 682 700 18 2.6%
Operating Profit -1,171 1,800 2,971 --
Brand biz 5,685 8,100 2,415 42.5%
Tech. Solution biz 2,443 2,260 -183 -7.5%
Other biz -32 40 72 --
Corp. and others -9,267 -8,600 667 -7.2%
profit margin % -1.6% 2.3%
(Unit: Mil JPY)

All Rights Reserved. Copyright © 2017 Wacom Co., Ltd. 36
Sales Forecast by Business Segment
43,87449,200
26,75826,900
682700
0
10,000
20,000
30,000
40,000
50,000
60,000
70,000
80,000
FY 03/17 (result) FY 03/18 (forecast)
Brand biz Tech. Solution biz Other biz
+2.6%
+12.1%
+0.5%
+7.7 %
71,31476,800
(Unit: Million JPY)
Change
Ratio
(YOY change)
All Rights Reserved. Copyright © 2017 Wacom Co., Ltd. 37
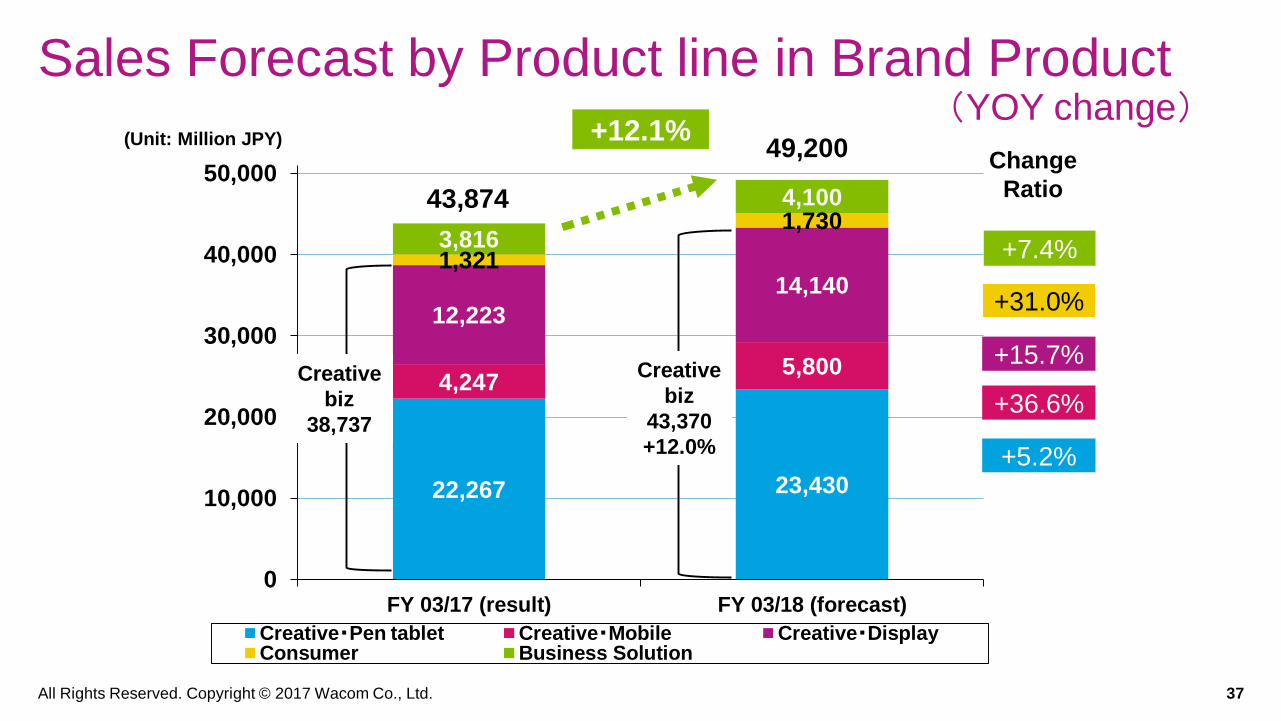
Sales Forecast by Product line in Brand Product
22,267 23,430
4,2475,800
12,223
14,1401,321
1,7303,816
4,100
0
10,000
20,000
30,000
40,000
50,000
FY 03/17 (result) FY 03/18 (forecast)
Creative・Pen tablet Creative・Mobile Creative・DisplayConsumer Business Solution
+31.0%
+36.6%
+5.2%
+15.7%
+7.4%
49,200
43,874
+12.1%(YOY change)
(Unit: Million JPY)
Change
Ratio
Creative
biz
38,737
Creative
biz
43,370
+12.0%

All Rights Reserved. Copyright © 2017 Wacom Co., Ltd. 38
Sales Forecast by Product line in Tech. Solution
13,20811,000
13,55015,900
0
5,000
10,000
15,000
20,000
25,000
FY 03/17 (result) FY 03/18 (forecast)
Pen for Smartphone Pen for Tablet, Others
+17.3%
-16.7%
26,90026,758
+0.5%
(Note) “For tablets, others” is integrated with “For notebook PCs” categorized as a product line in FY03/17.
(YOY change)(Unit: Million JPY)
Change
Ratio
All Rights Reserved. Copyright © 2017 Wacom Co., Ltd. 39
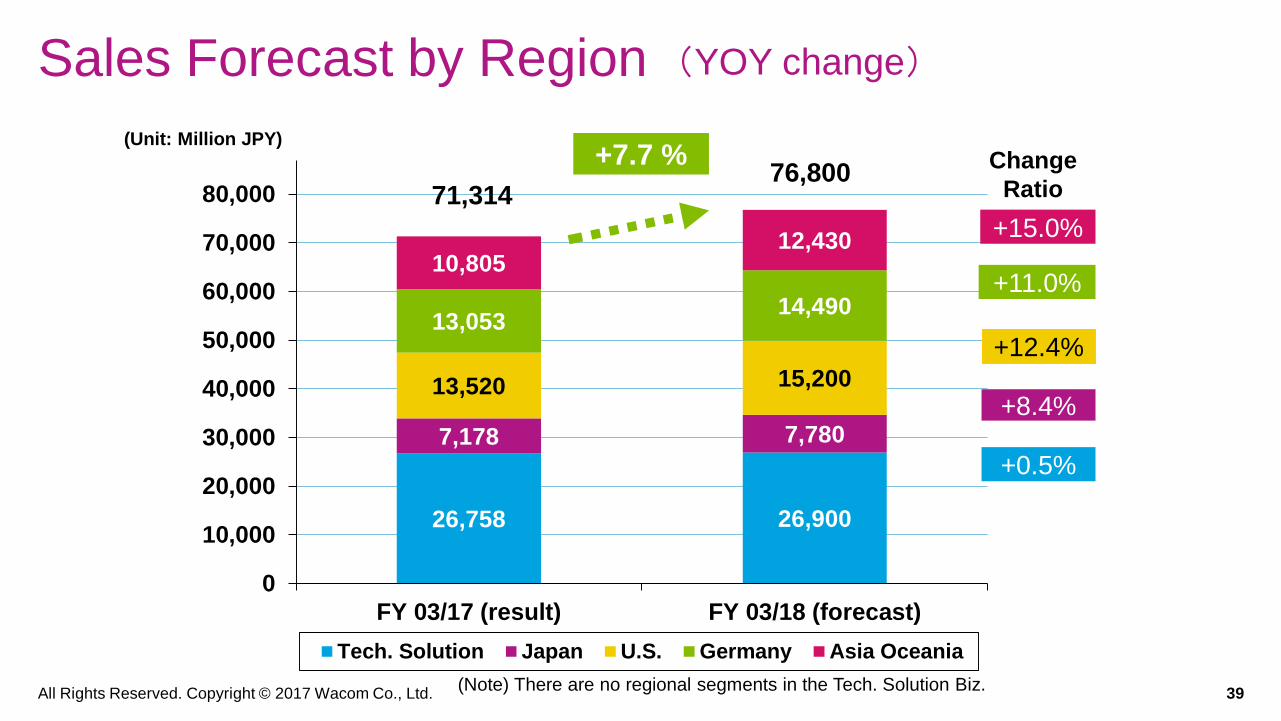
Sales Forecast by Region
26,758 26,900
7,178 7,780
13,520 15,200
13,05314,490
10,80512,430
0
10,000
20,000
30,000
40,000
50,000
60,000
70,000
80,000
FY 03/17 (result) FY 03/18 (forecast)
Tech. Solution Japan U.S. Germany Asia Oceania
+15.0%
+12.4%
+8.4%
+0.5%
+11.0%
+7.7 %
71,31476,800
(YOY change)
(Unit: Million JPY)
Change
Ratio
(Note) There are no regional segments in the Tech. Solution Biz.

All Rights Reserved. Copyright © 2017 Wacom Co., Ltd. 40
Investment, depreciation and R&D
Capital expenditure
2.40 bn JPY (YOY -33.0%)
• Key items: Metallic mold for products in Brand Product Business and Technology Solution
Business, etc.
Depreciation
2.80 bn JPY (YOY +8.8% )
• Key items: Depreciation of global IT infrastructure and metallic mold for products
R&D expense
4.90 bn JPY (YOY +11.4%)
• Key items: New products development and next-generation technology research, etc.

All Rights Reserved. Copyright © 2017 Wacom Co., Ltd. 41
Shareholders Return Policy for FY 03/18
Dividend policy
• Continue steady dividend payout to shareholders while maintaining a stable financial base necessary for future business development.
• Target payout ratio maintains approximately 40% or more to attract global investment.
Dividend per share
• JPY 6.00 JPY per share for FY 03/18 (JPY 6.00 for FY 03/17)
• Payout ratio 86.2% (--% for FY 03/17)

All Rights Reserved. Copyright © 2017 Wacom Co., Ltd. 424
2

All Rights Reserved. Copyright © 2017 Wacom Co., Ltd. 43our mission

All Rights Reserved. Copyright © 2017 Wacom Co., Ltd. 44
our brand

DisclaimerForward-looking statements regarding future events and
performance contained in this presentation are based on currently
available information and involve risks and uncertainties, including
macroeconomic conditions, trends of the industry in which the
company is engaged and progress in new technologies. Please
note that actual results could materially differ from those expressed
or implied by the forward-looking statements in this presentation
due to these risks and uncertainties.
Investor Relations Inquiries
TEL: +81-3-5337-6502 FAX: +81-3-5337-6519
Wacom Co., Ltd.
Sumitomo Fudosan Shinjuku Grand Tower 31F,
8-17-1 Nishi-Shinjuku, Shinjuku-ku, Tokyo
160-6131, Japan
Wacom Co., Ltd.
http://www.wacom.com
Related Documents
![Cognosec AB Q1 2018 Interim Report[2] - CYBER 1 · Q1 2018 Q1 2017 FY 2017 FY 2016 Total Group Income €('000s) 3,355 3,760 17,193 14,636 ... The financial results demonstrate that](https://static.cupdf.com/doc/110x72/5f6992319fcdf30d5d578cae/cognosec-ab-q1-2018-interim-report2-cyber-1-q1-2018-q1-2017-fy-2017-fy-2016.jpg)