BUSINESS PLAN UPDATE 2020 - 2022 March, 2020 Photo: Left, Castilla Solar Park; Right, Ocean Black Rhino 1

Welcome message from author
This document is posted to help you gain knowledge. Please leave a comment to let me know what you think about it! Share it to your friends and learn new things together.
Transcript
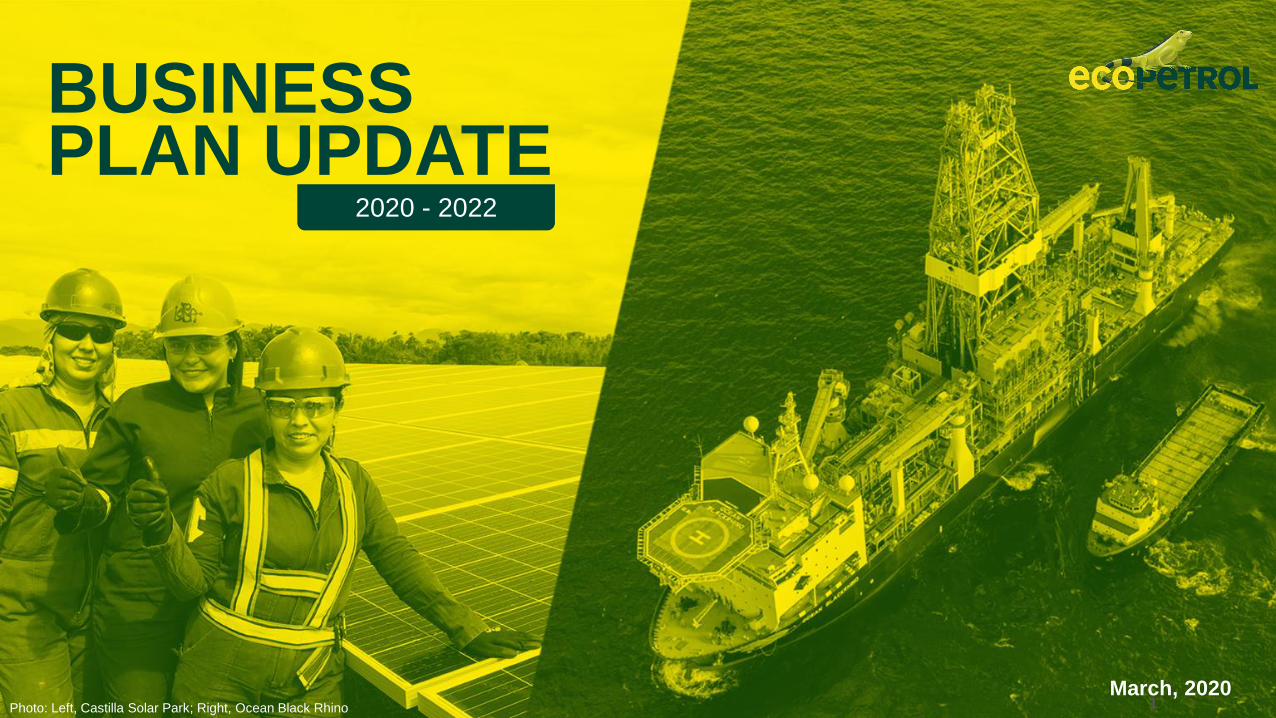
BUSINESS PLAN UPDATE
2020 - 2022
March, 2020Photo: Left, Castilla Solar Park; Right, Ocean Black Rhino 1

LEGAL DISCLOSURE
This document was prepared by Ecopetrol S.A. (the “Company” or “Ecopetrol”) with
the purpose of providing the market and interested parties certain financial and other
information of the Company.
This document may include strategy discussions and forward-looking statements
regarding the probable development of Ecopetrol’s business. Said projections and
statements include references to estimates or expectations of the Company regarding
its future and operational results. Potential investors and the market in general should
be aware that the information provided herein does not constitute any guarantee of its
performance, risks or uncertainties that may occur or materialize. Actual results may
fluctuate and differ from those provided herein due to several factors outside of the
control of the Company. Such forward-looking statements speak only as at the date in
which they are made and neither Ecopetrol nor its advisors, officers, employees,
directors or agents, make any representation nor shall assume any responsibility in
the event actual performance of the Company differs from what is provided herein.
Moreover, Ecopetrol, its advisors, officers, employees, directors or agents shall not
have any obligation whatsoever to update, correct, amend or adjust this presentation
based on new information or events occurring after its disclosure. Additional factors
that may affect the future results of Ecopetrol are set forth in the section entitled “Risk
Factors” in the Company’s Report on Form 20-F for the year ended December 31,
2018 and in the Company’s other filings with Securities and Exchange Commission
(the “SEC”), which are available at www.sec.gov.
This presentation is for discussion purposes only and is incomplete without reference
to, and should be viewed solely in conjunction with, the oral briefing provided by
Ecopetrol. Neither this presentation nor any of its contents may be used for any other
purpose without the prior written consent of Ecopetrol.
2Photo: Independence Rig

Key Messages
Strategy on Track
Focused
Growth
Value Creation
to Society
Delivery ahead of our plans
Disciplined capex execution, strong
ROACE and robust capital structure
Leader in mature and emerging basins
in Colombia
Expanding international footprint in
highly prospective basins with world
class partners
Responsible with the environment and
committed to creating shared
prosperity in the communities where
we operate
3

Creating Value to Society
Republic of Colombia
Shareholders Community* Employees* Suppliers*
8.0 US$ B
0.5 US$ B
*Ecopetrol S.A. figures. **Includes: Health and Safety, Education, Loans, Savings and Investments. Calculated with an average exchange rate for 2019 of 3,281 COP/US$.
0.3 US$ B
0.9 US$ B
3.9 US$ B
Dividends
Taxes
Royalties
Dividends
Salaries
Variable Compensation
Benefits**
Training
Local
Procurement
Social &
Environmental
Investment
Contributed in 201913.7US$ B
4

Existing Fields
UnconventionalExploration
in Colombia
International
Reserves and
Production
Growth
Cash Protection
and Cost Efficiency
Strict Capital
Discipline
Competitiveness
and
Sustainability
Strategy Remains Focused on Value Generation
5
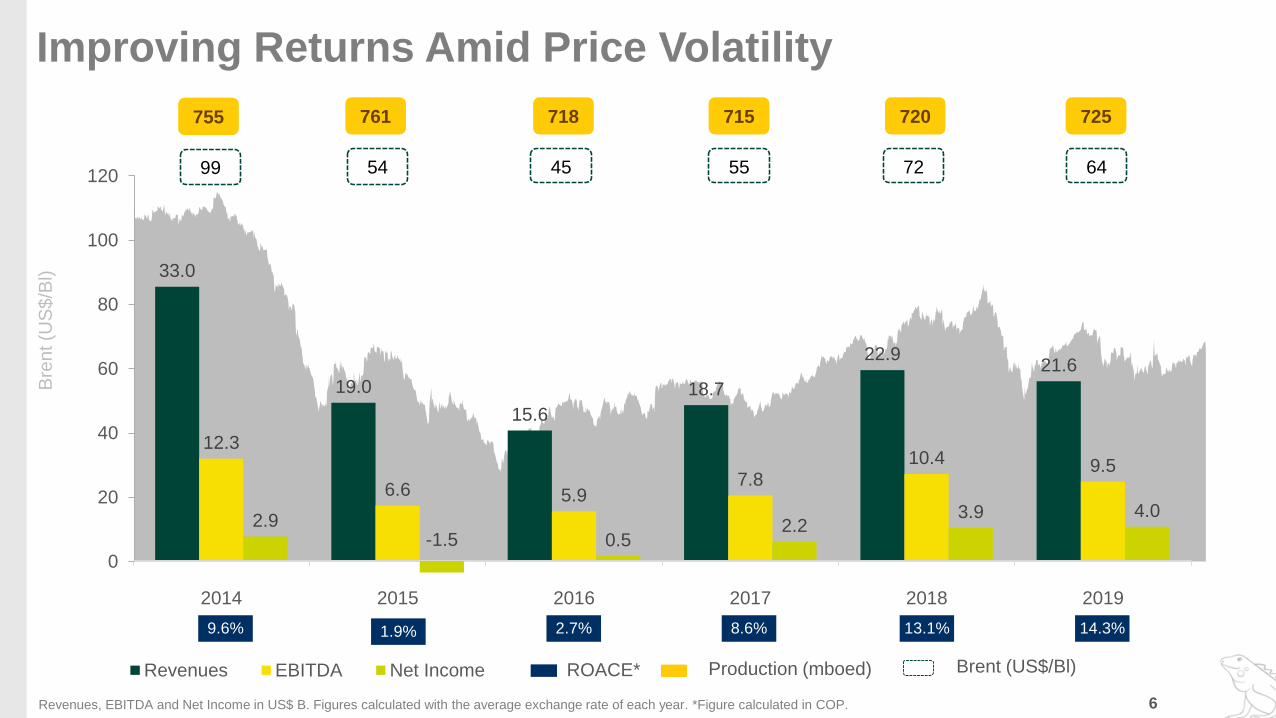
0
20
40
60
80
100
120
33.0
19.0
15.6
18.7
22.921.6
12.3
6.6 5.97.8
10.4 9.5
2.9-1.5 0.5
2.23.9 4.0
2014 2015 2016 2017 2018 2019
Revenues EBITDA Net Income
Improving Returns Amid Price Volatility
14.3%13.1%9.6% 2.7% 8.6%
ROACE*
761 718 715
54 45 55
720
72
725
64
Production (mboed) Brent (US$/Bl)
Bre
nt (U
S$/B
l)
Revenues, EBITDA and Net Income in US$ B. Figures calculated with the average exchange rate of each year. *Figure calculated in COP. 6
1.9%
755
99
Fulfilling the Value Promise
0.7Transformation Plan Savings
(US$ B)
100%
12
720 - 730
370 - 400
1,100 - 1,250
Reserves Replacement Ratio (%)
Exploratory Wells
Production (mboed)
Throughput (mbd)
Transported Volume (mbd)
169%
20
725
374
1,153Operational
> 11
< 1.5
EBITDA (US$ B)
Net Income (US$ B)
ROACE* (%)
Gross Debt / EBITDA (x)
Dividend Payment 2019 (US$/Share)
9.5
4.0
14.3
1.2
0.10
Financial
2019 TargetMetric 2019 Real
1.0
7Figures calculated with an average exchange rate for 2019 of 3,281 COP/US$. *Figure calculated in COP.

0.3
1.2
2.1
1.8
2016 2017 2018 2019
US
$ B
Extraordinary Dividend
Ordinary Dividend
Financial Delivery: Our Track Record
32.1 36.1 37.429.9
4555
7264
0
10
20
30
40
50
60
70
80
0.0
10.0
20.0
30.0
40.0
50.0
60.0
70.0
80.0
90.0
2016 2017 2018 2019
US
$/B
l
23.330.0
39.635.8
2016 2017 2018 2019
US
$/B
l37.7%41.8% 45.4% 43.9%
2016 2017 2018 2019
Net Income
Break Even
EBITDA Margin
ROACE*
Brent
Gross Debt / EBITDAEBITDA / Bl
35.843.9% 1.2x
14.3%
2.7%
8.6%
13.1% 14.3%
> 11.0%
2016 2017 2018 2019 Target2019-2021
2.9
1.9
1.2 1.2
1.0
1.5
2016 2017 2018 2019 Target2019-2021
Dividend
Distribution
3.9
Breakeven without impairments. *Figure calculated in COP.
0% 7% 22% 58%
Total Dividend / CFFO
8
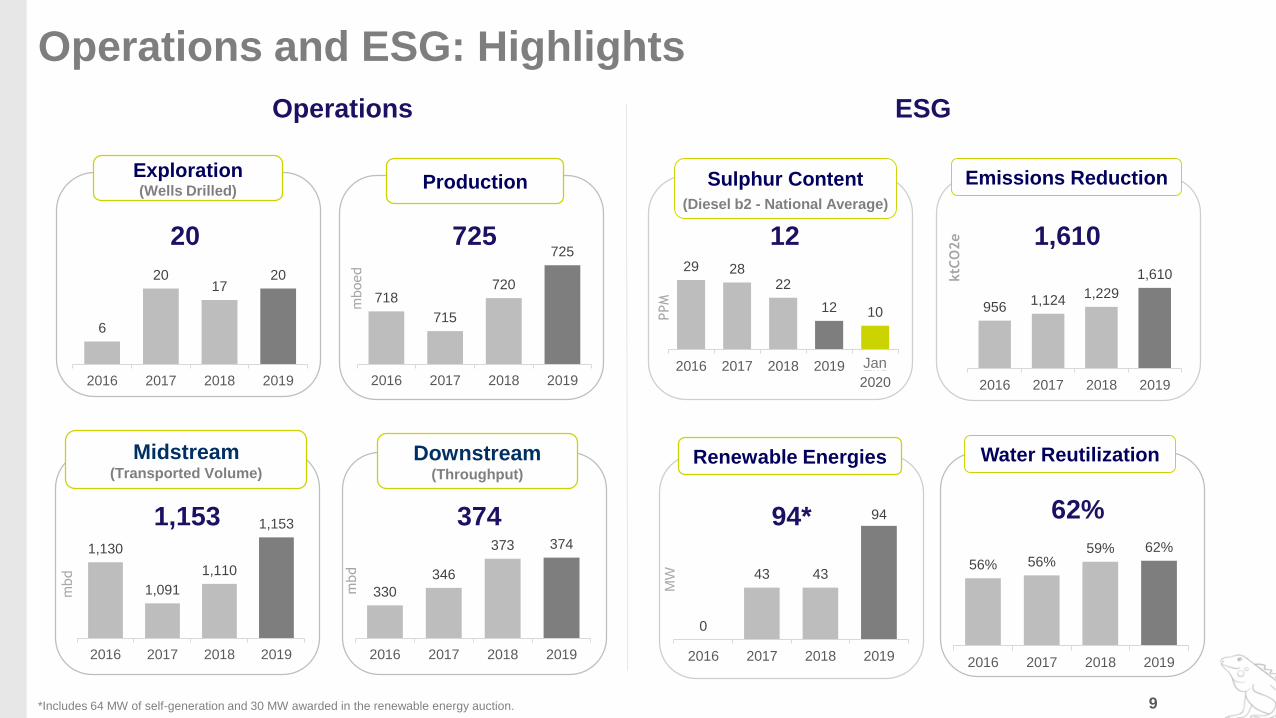
718
715
720
725
2016 2017 2018 2019
mboed
330
346
373 374
2016 2017 2018 2019
mbd
Downstream(Throughput)
Production
725
Operations and ESG: Highlights
Midstream(Transported Volume)
Sulphur Content
Water Reutilization
1,130
1,091
1,110
1,153
2016 2017 2018 2019
mbd
3741,153
29 2822
12 10
2016 2017 2018 2019 Ene2020
PPM
(Diesel b2 - National Average)
9561,124
1,229
1,610
2016 2017 2018 2019
ktC
O2e
Emissions Reduction
Renewable Energies
Operations ESG
12 1,610
9
Exploration(Wells Drilled)
20
6
2017
20
2016 2017 2018 2019
0
43 43
94
2016 2017 2018 2019M
W
56% 56%59% 62%
2016 2017 2018 2019
62%94*
*Includes 64 MW of self-generation and 30 MW awarded in the renewable energy auction.
Jan

* Subject to regulatory approvals. ** Includes Permian and Gato do Mato at plan price
JV with OXY
164 mmboe 1P Reserves
90-100 mboed in 2027Agreement
with Shell*
Acquisition of the
Gato do Matodiscovery
90 mmboe contingent
resources
20-30 mboed in 2025
Acquisition of the
Chuchupa and Ballena
fields to Chevron*
Farm-in agreement in the
Esox discovenry
Incremental EBITDA and
ROACE*** (e) per year**
Unconvencional
Offshore
Value Accretive Inorganic Growth Aligned With Strategy
50% 50% 100%
EBITDAinorganic
ROACEinorganic
+ US$ 0.2 B2020 - 2022
+ US$ 1.1 B2023 - 2027
+ 0.2%
2023 - 2027
51% 49%
21.43% 57.14% 42.86%
30% 50%20%
10
Permian(Rodeo JV)

1,7271,893
24294 67 103
164 20
Balance 2018 Production2019
EnhancedRecovery
Extensions andDiscoveries
Projects InorganicGrowth
Price Effect Balance 2019
Technical and Commercial Management
264 MMBOE
428 MMBOE
Consistent Reserves Growth
Disciplined organic and inorganic incorporation
+33% vs. 2018 incorporation
Reserves
Replacement Ratio
169%
Average Reserve
Life
7.8 Years
Incorporated Proven
Reserves
408 MMBOE
Rodeo JV
Permian Basin
11
2020 – 2022 Business Plan
12Photo: Front Crown Vessel
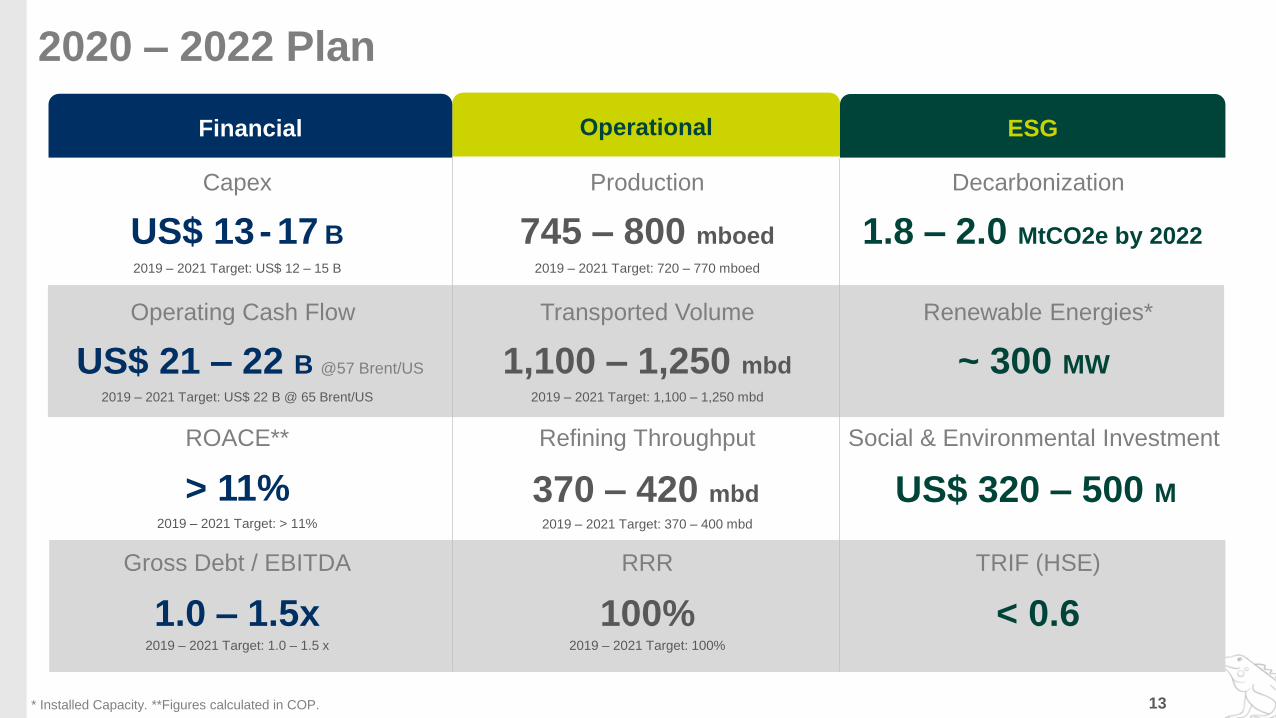
13
Operational
US$ 13- 17 B
US$ 21 – 22 B @57 Brent/US
> 11%
1.0 – 1.5x
745 – 800 mboed
1,100 – 1,250 mbd
370 – 420 mbd
100%
1.8 – 2.0 MtCO2e by 2022
~ 300 MW
US$ 320 – 500 M
< 0.6
2019 – 2021 Target: US$ 12 – 15 B
2019 – 2021 Target: US$ 22 B @ 65 Brent/US
2019 – 2021 Target: > 11%
2019 – 2021 Target: 1.0 – 1.5 x
2019 – 2021 Target: 720 – 770 mboed
2019 – 2021 Target: 1,100 – 1,250 mbd
2019 – 2021 Target: 370 – 400 mbd
2019 – 2021 Target: 100%
Capex
Operating Cash Flow
ROACE**
Gross Debt / EBITDA
Production
Transported Volume
Financial
Refining Throughput
RRR TRIF (HSE)
Social & Environmental Investment
Renewable Energies*
Decarbonization
ESG
2020 – 2022 Plan
* Installed Capacity. **Figures calculated in COP.

Upstream
14Photo: Rubiales Field
2019 2020 2021 2022
mboed
Colombia US
725745 - 760 760 - 780 790 - 800
+ 10%
New production on track
Managing declining rates via EOR
Expected 10% Production Growth by 2022, Underpinned by Incumbent Position in Colombia and Growth in the US
15
62% 60% 52% 45%
30% 30%34%
37%
<1% 2% 2% 3%
8% 8% 10% 13%
2% 2%
2019 2020 2021 2022
Primary Secondary Tertiary Subsidiaries Exploration
92% 89%71%
55%
8% 11% 29% 45%
2019 2020 2021 2022
Basic Incremental

• 3.4 bboe beyond 3P reserves
* Potential not risked by volume, neither participation nor royalty percentages. Opportunities with medium-high level of uncertainty. Studies, pilots or analogies are needed before
materializing an expansion.
33.635.4
39.2
45.7 46.649.1
51.253.3 53.9 53.7 53.8
55.356.7
60
19 1918
16
18 1819
1819 19
20 19 19
0
2
4
6
8
10
12
14
16
18
20
20
25
30
35
40
45
50
55
60
65
2007 2008 2009 2010 2011 2012 2013 2014 2015 2016 2017 2018 2019 2021 E
Recovery
Facto
r in
%
HC
IIP
in b
boe
HCIIP and Recovery Factor Ecopetrol S.A.
OOIP Factor Recobro
Sustained Increase in HCIIP Demonstrates Potential of Current Fields
16
• 68.5% increase in HCIIP from 2007 to 2019
• Expected Recovery Factor of 21% in 2022
Recovery FactorHCIIP
926
850
588
414 414
145
48
WaterInjection
In SituCombustion
CEOR Primary ContinuousSteam
Injection
GasInjection
CyclicSteam
Stimulation
mm
boe
Potential* Progress to Reserves

Campaign 315 Wells
1 Sidetrack
Campaign 33 Laterals1 Deepening
Campaign 23 Wells
2 Laterals
Campaign 12 Wells
4 Laterals
Basic production
Production profile
BASE TTRD CAM.1 NW CAM.1 NW CAM.2TTRD CAM.2 TTRD CAM.3 NW CAM.3
mb
oed
Piedemonte Secondary Development Plan
17
• Expected gas recovery factor* to 63% from 27%
• Expected crude oil recovery factor* to 51% from 44%
• Investments 2020-2022: U$724 M
• Incremental oil between 30 - 90 MMBO
• Incremental gas between 0.3 - 0.5 TCF
Key figures
*Expected Recovery Factor was calculated with Dec 2019 In Place Volumes, without taking into account new appraisal areas
Drilling rig # 1: Pauto-Floreña
Drilling rig # 2: Pauto-Floreña
TTRD Rig
Drilling rig # 3: Cupiagua-Recetor
Drilling rig # 4: Cupiagua-Recetor
23
new wells
9
new entries
Approved
Activity
Activity
to be
approved
Activity under
evaluation
Contingent
ActivityNFE Prospects under Evaluation
NFE Upsides depending on exploration success
Type of intervention
Near Field Exploration (NFE) Drilling
NFE Drilling – Upsides

Beyond Successful Pilot Tests: Unconventional Potential in the Middle Magdalena
Prospective Area
1.3 m acres
Anchor Play
0.4 - 0.5 bboe
All horizons
1.1 - 1.3 bboe
MMV Basin
4 - 7.4 bboe
Unconventional Colombia
7 - 12 bboe
8 - 100 TCF
Ecopetrol´s Area
~730 k acresProduction in the MMV basin could be
estimated at ~ 330 mboed in 2030
Middle
Magdalena
Valley (MMV)State Council
Clarification
2019 2020 2021 2022
Preparation, planning and execution of
PPIRRegulatory
Framework
MME
Ecopetrol prepares for PPIR
Unconventional
Potential
150 km
50 km
18
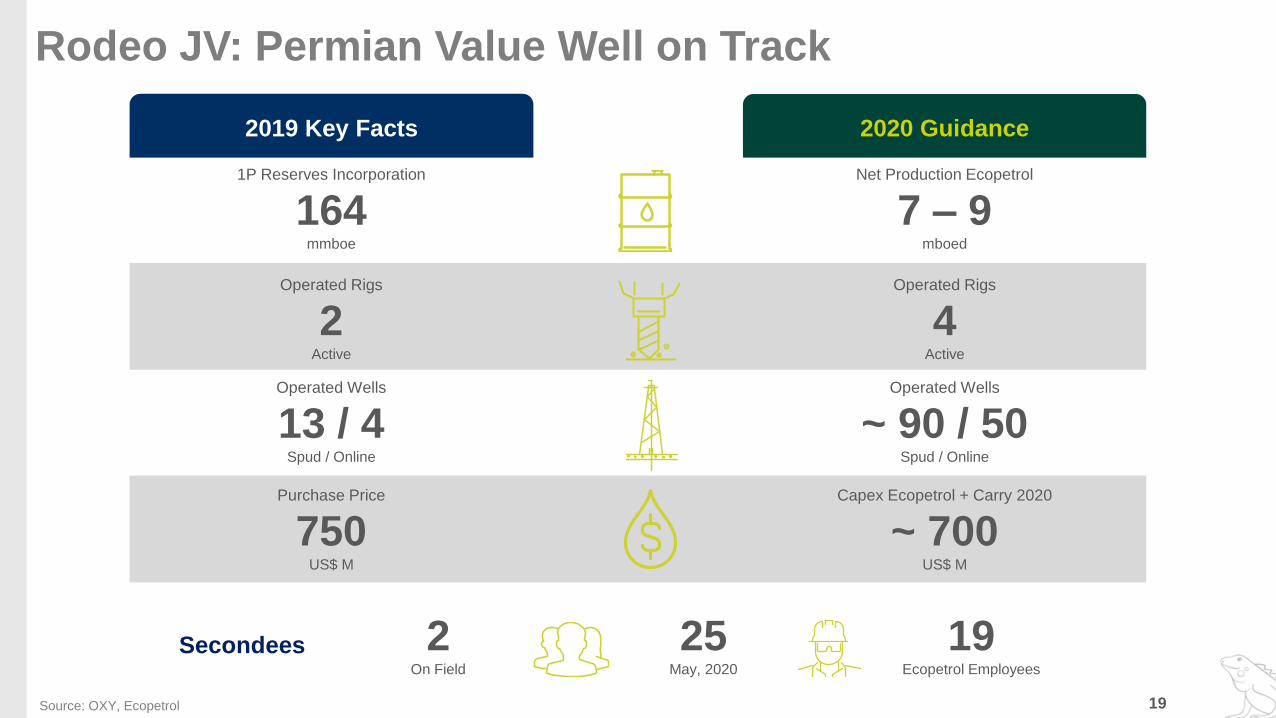
Rodeo JV: Permian Value Well on Track
2019 Key Facts 2020 Guidance
1P Reserves Incorporation
164mmboe
Operated Rigs
2Active
Operated Wells
13 / 4Spud / Online
Purchase Price
750 US$ M
Net Production Ecopetrol
7 – 9mboed
Operated Rigs
4Active
Operated Wells
~ 90 / 50Spud / Online
Capex Ecopetrol + Carry 2020
~ 700 US$ M
19
2 On Field
25 May, 2020
19 Ecopetrol Employees
Secondees
Source: OXY, Ecopetrol

• CAPEX: ~ US$ 115 – 150 M
• 3 Wells
• CAPEX: ~ US$ 117 – 150 M
• 2 Wells
• CAPEX: ~ US$ 700 – 940
MUSD
• 3 Wells
International Activity
Exploration Emphasis on Domestic NFE, Strengthening Natural Gas and Selected International Opportunities
• CAPEX: ~ US$ 45 – 60 M
• 1 Well
Caguan - Putumayo
• CAPEX: ~ US$ 120 – 160 M
• 9 - 12 Wells
Northern Colombia
• CAPEX: ~ US$ 360 – 480 M
• 9 - 12 Wells
Middle Magdalena Valley
• CAPEX: ~ US$ 180 – 230 M
• 4 - 5 Wells
Piedemonte
• CAPEX: ~ US$ 75 – 100 M
• 3 - 4 Wells
Llanos
• CAPEX: ~ US$ 180 – 240 M
• 2 - 3 Wells
Colombia Offshore
20
+30
Exploratory WellsResources to Delimit
530 - 715 mmboe
2021 ~ 13 – 15
2022 ~ 17 – 19
2D (kms) ~ 375 – 500
3D (kms2) ~ 3,000 – 4,000
Seismic ActivityProduction (mboed)
Midstream
21Photo: Oleoducto de Los Llanos

867 823 836 878
263 268 273 275
2016 2017 2018 2019
Transported Volume (mbd)
Crude Products
1,130 1,091 1,109 1,153
Crude Transportation Tariff
NegotiationAssures segment’s stability
4 years period: until June 30, 2023
32% Contribution to the
Group’s EBITDA Constant cash contributor
Stable results with low uncertainty
32%
Commercial Strategy Increase volumes
through pipelines versus trucks
Proven Track Record of Profitable Growth
22
2019 Milestones
3.5
3.6
3.8
4.0
2016 2017 2018 2019
Revenues (US$ B)
2.6
2.7
3.0
3.1
2016 2017 2018 2019
EBITDA (US$ B)
73% 75% 77% 77%
EBITDA Margin
Figures calculated with the average exchange rate of each year.

Transported Volumes (mbd)
Ensuring a continuous, reliable,
efficient and safe operation
1,100 – 1,250
EBITDA Margin
Maintaining profitability
75% – 80%Capex
Capex Growth and
Operational Continuity
US$ 0.7 - 0.9 B
Growth
Opportunities
• Support demand growth (CAGR 2%)
• Pipeline operating plan that allows a 2% increase in the service factor
• Protect market share and increase reliability through strategic
investments
Pursuing Higher Efficiency and Growth Opportunities in Multipurpose Pipelines
2020 – 2022 Targets
Multipurpose Pipelines
23

Downstream
24Photo: Barrancabermeja Refinery
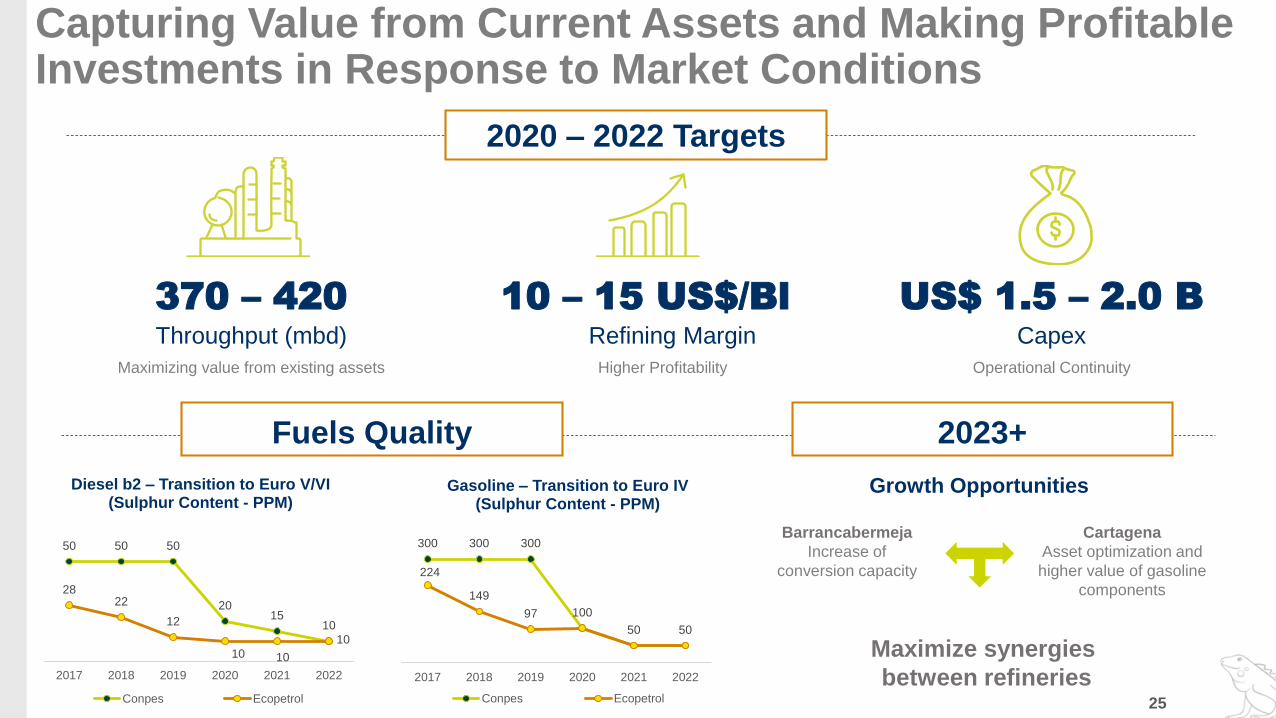
Throughput (mbd)
370 – 420
Maximizing value from existing assets
Refining Margin
10 – 15 US$/Bl
Higher Profitability
Capex
US$ 1.5 – 2.0 B
Operational Continuity
50 50 50
2015
10
2822
12
10 10
10
2017 2018 2019 2020 2021 2022
Diesel b2 – Transition to Euro V/VI (Sulphur Content - PPM)
Conpes Ecopetrol
300 300 300
100
50 50
224
149
97
2017 2018 2019 2020 2021 2022
Gasoline – Transition to Euro IV(Sulphur Content - PPM)
Conpes Ecopetrol
Growth Opportunities
Barrancabermeja
Increase of
conversion capacity
Cartagena
Asset optimization and
higher value of gasoline
components
Maximize synergies
between refineries
2020 – 2022 Targets
Capturing Value from Current Assets and Making Profitable Investments in Response to Market Conditions
25
Fuels Quality 2023+

TO DOCKS
EXPORTS OF ULSD
AND FUEL
ORIGINAL CRUDE
DISTILLATION
UNIT
ORIGINAL CRUDE
UNIT TANK
NEW BLENDING
U-001
COQUER
UNIT
NEW AREA
NEW CRUDE
DISTILLATION
UNIT
PRODUCT STORAGE
TANKS
IPCC Project*:
Capex by 2022
US$ 140 - 150 M
Conversion
Slate
Type of Crudes
Process Units
Medium
74% - 76%
80 mbd 150 mbd 200 mbd
High
95% - 97%
High
90% - 92%
Light and
Medium
Medium
and Heavy
8 34 35
Medium
and Heavy
Year 1957 - 2013 2016 - 2020 2021+ with IPCC
*IPCC: Interconnection of Cartagena Crude Units 26
New
Existing
DIESEL
HYDROTREATING
UNIT

Financials
27Source: iStock Photo. Pictures Bank.
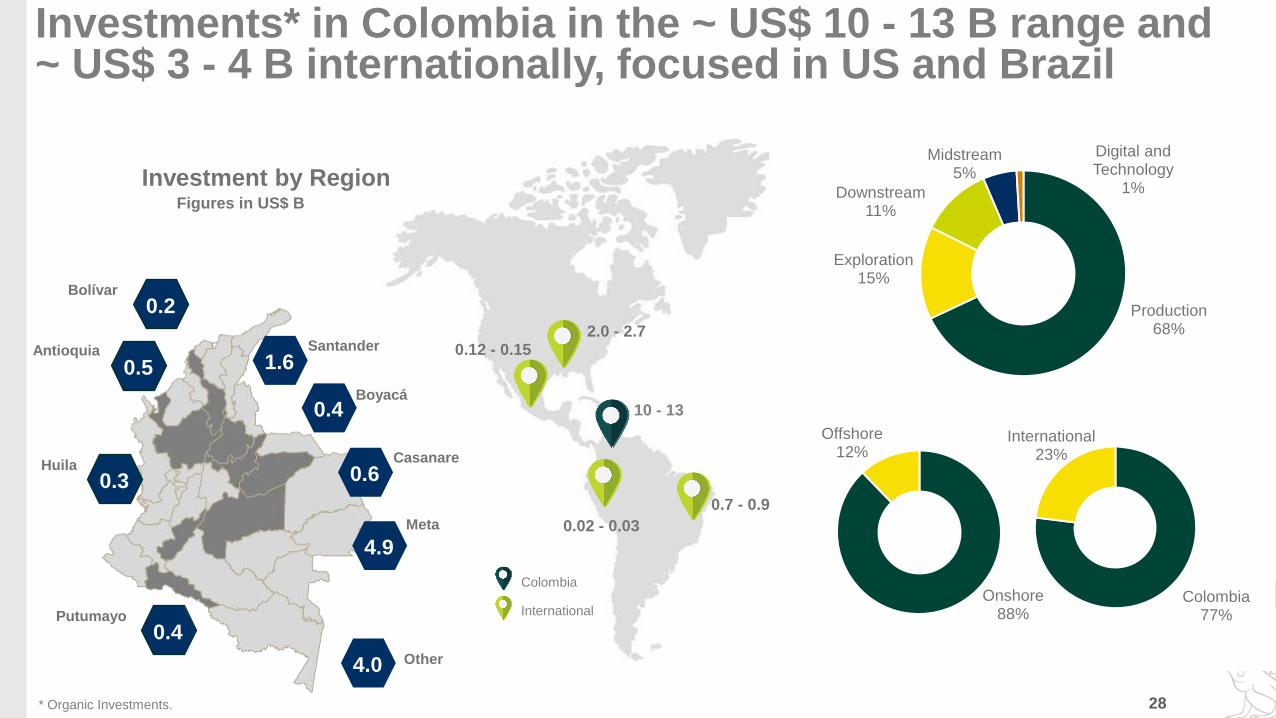
Figures in US$ B
Investment by Region
Production68%
Exploration15%
Downstream11%
Midstream5%
Digital and Technology
1%
Colombia 77%
International23%
Onshore 88%
Offshore12%
Investments* in Colombia in the ~ US$ 10 - 13 B range and ~ US$ 3 - 4 B internationally, focused in US and Brazil
10 - 13
2.0 - 2.70.12 - 0.15
0.02 - 0.03
0.7 - 0.9
Colombia
InternationalPutumayo
0.4
Huila
0.3
Antioquia
0.5
Bolívar
0.2
Santander
1.6
Boyacá0.4
Meta
4.9
Casanare
0.6
Other4.0
28* Organic Investments.
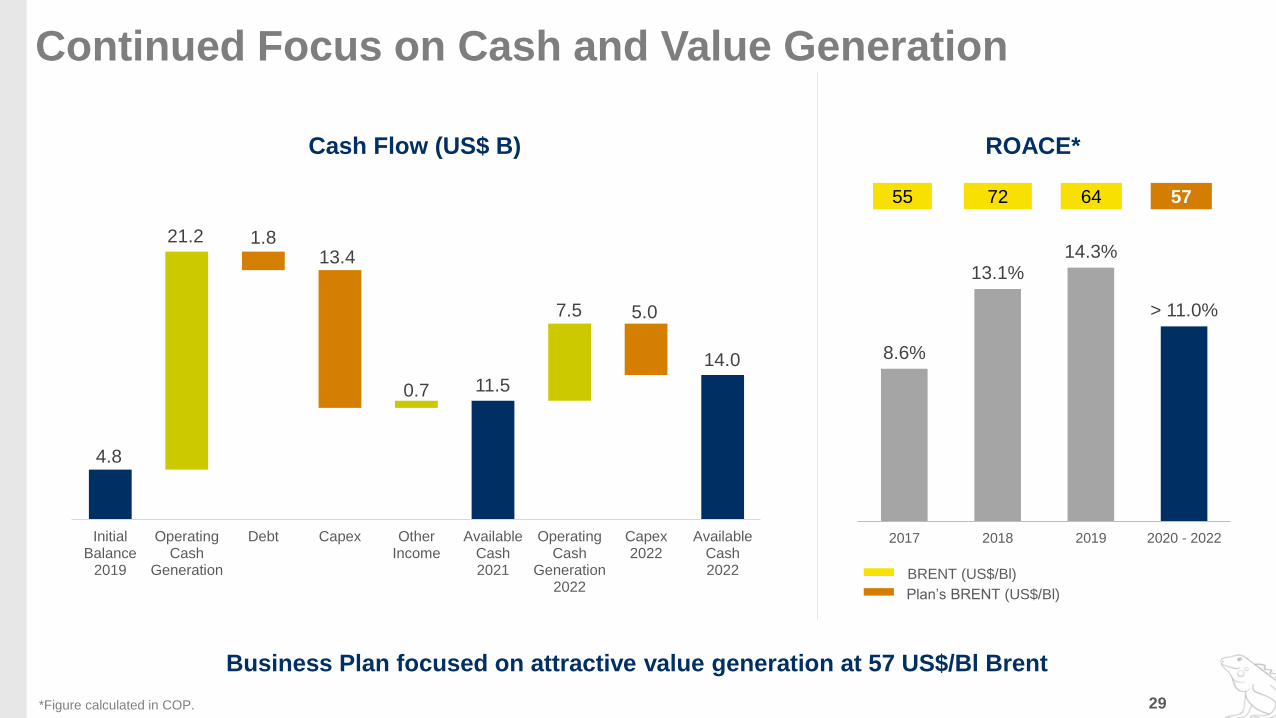
Continued Focus on Cash and Value Generation
29
8.6%
13.1%14.3%
> 11.0%
2017 2018 2019 2020 - 2022
55 72 64
BRENT (US$/Bl)
ROACE*
Business Plan focused on attractive value generation at 57 US$/Bl Brent
Cash Flow (US$ B)
57
Plan’s BRENT (US$/Bl)
4.8
11.5
14.0
21.2 1.813.4
0.7
7.5 5.0
InitialBalance
2019
OperatingCash
Generation
Debt Capex OtherIncome
AvailableCash2021
OperatingCash
Generation2022
Capex2022
AvailableCash2022
*Figure calculated in COP.
54
4
87
7
47
0
2,2
73
411
1,4
80
1,6
75
61
12
3
18
19
22
7
- - - - - - - 87
- - 93
0
- 2,0
00
2,1
34
48
0
15
1
15
1
70
35
202
0
202
1
202
2
202
3
202
4
202
5
202
6
202
7
202
8
202
9
203
0
203
1
203
2
203
3
203
4
203
5
203
6
203
7
203
8
203
9
204
0
204
1
204
2
204
3
204
4
204
5
US
$ M
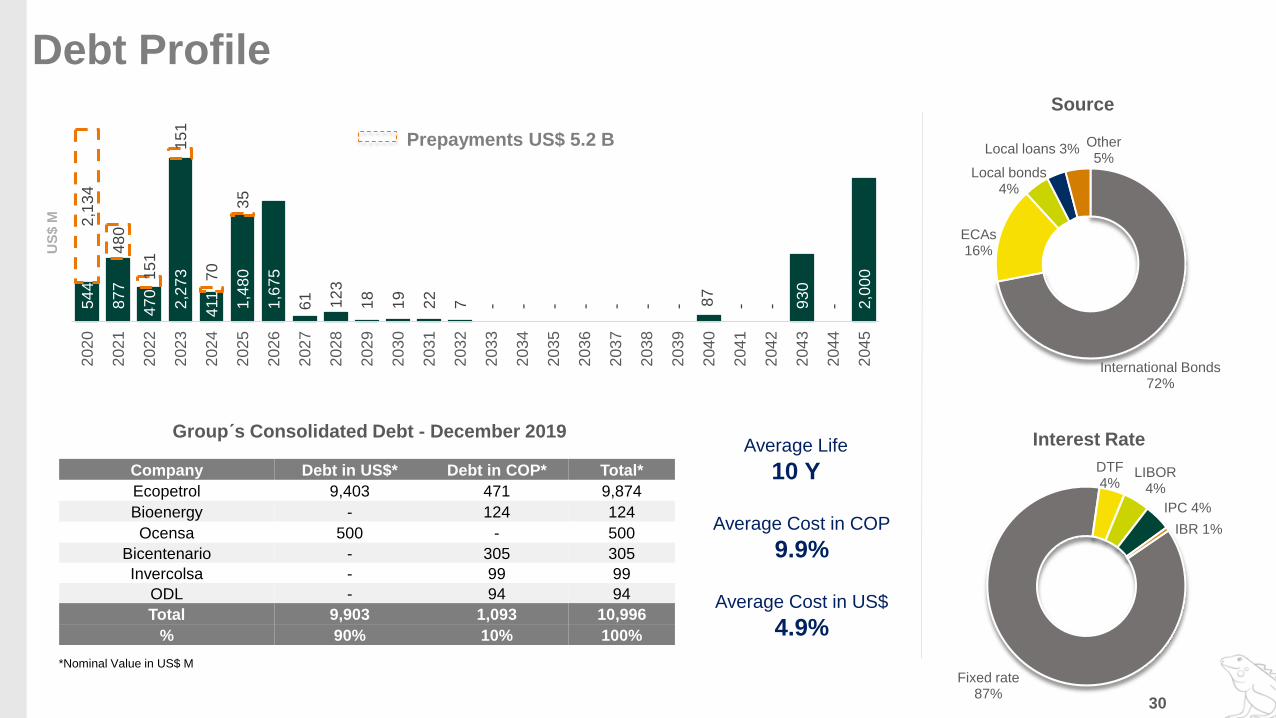
Source
Interest RateGroup´s Consolidated Debt - December 2019
*Nominal Value in US$ M
Prepayments US$ 5.2 B
International Bonds 72%
ECAs16%
Local bonds4%
Local loans 3%Other5%
Fixed rate 87%
DTF4%
LIBOR4%
IPC 4%
IBR 1%
Debt Profile
Average Life
10 Y
Average Cost in COP
9.9%
Average Cost in US$
4.9%
30
Company Debt in US$* Debt in COP* Total*
Ecopetrol 9,403 471 9,874
Bioenergy - 124 124
Ocensa 500 - 500
Bicentenario - 305 305
Invercolsa - 99 99
ODL - 94 94
Total 9,903 1,093 10,996
% 90% 10% 100%
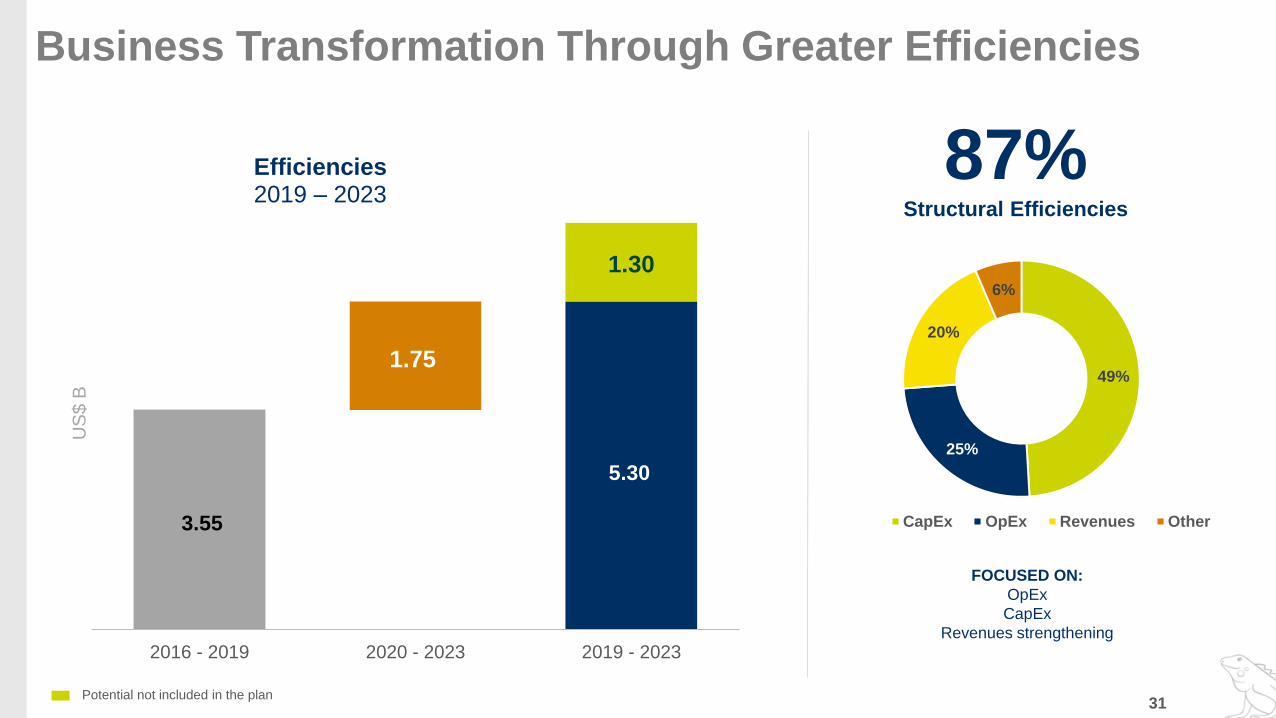
Potential not included in the plan
Business Transformation Through Greater Efficiencies
3.55
5.30
1.75
1.30
2016 - 2019 2020 - 2023 2019 - 2023
US
$ B
Efficiencies2019 – 2023
87%Structural Efficiencies
49%
25%
20%
6%
CapEx OpEx Revenues Other
FOCUSED ON:
OpEx
CapEx
Revenues strengthening
31

Operational efficiencies and capture of synergies between both
refineries
Efficiencies in operational processes (Energy, Subsurface and
Dilution) and entry of new production facilities
Following the premises of the business transformation planCosts and expenses optimization
* Includes: Cost of Transport, Operational Expenses, Operational Costs. Calculated over Barrels Sold.
Continue Focus on Cost Efficiency
5.0 4.8 4.8
4.0
5.0
2017 2018 2019 2020 - 2022
US
$/B
l
Refining Cash Cost
3.3 3.3 3.3
2.7
3.3
2017 2018 2019 2020 - 2022
US
$/B
l
Transported Barrel Cost
30.8
36.9 34.8
30.0
33.0
2017 2018 2019 2020 - 2022
US
$/B
l
Total Cost*
7.78.7 8.6
7.6
8.6
2017 2018 2019 2020 - 2022
US
$/B
l
Lifting Cost
32
Enablers
33Photo: Cartagena Refinery
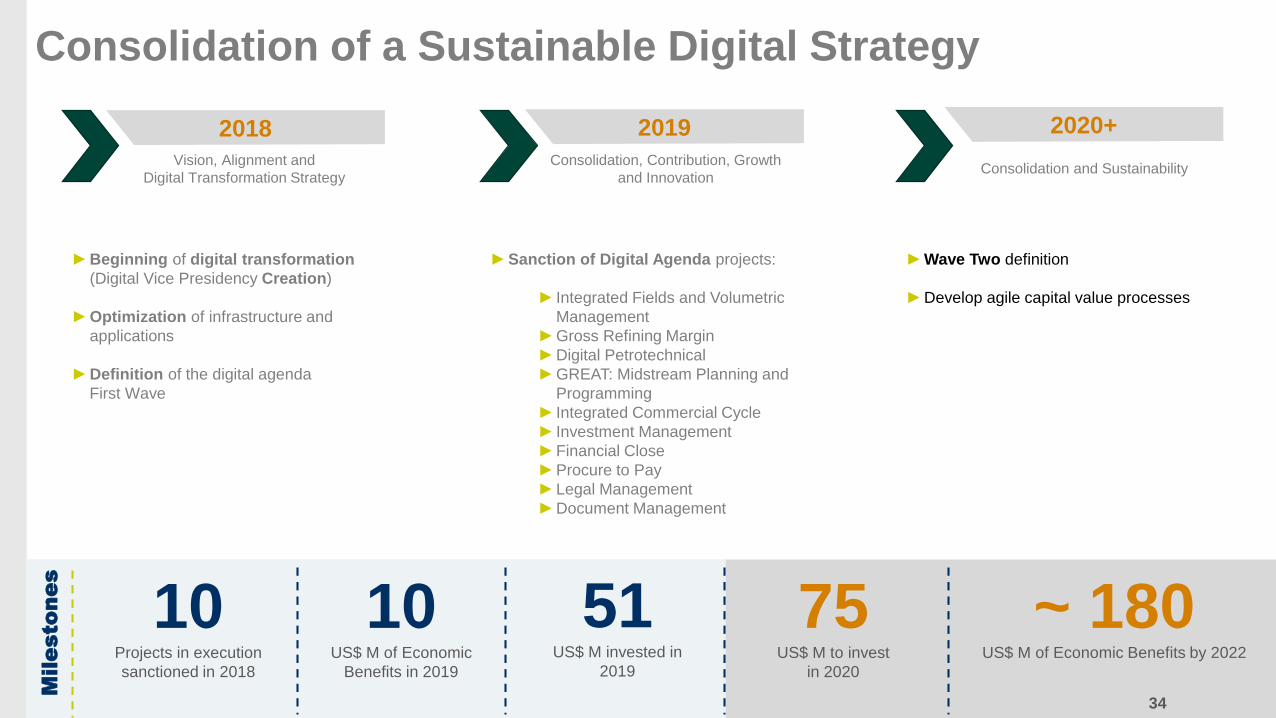
Consolidation of a Sustainable Digital Strategy
Vision, Alignment and
Digital Transformation Strategy
Consolidation, Contribution, Growth
and InnovationConsolidation and Sustainability
2018 2019 2020+
► Beginning of digital transformation
(Digital Vice Presidency Creation)
► Optimization of infrastructure and
applications
► Definition of the digital agenda
First Wave
► Sanction of Digital Agenda projects:
► Integrated Fields and Volumetric
Management
►Gross Refining Margin
► Digital Petrotechnical
► GREAT: Midstream Planning and
Programming
► Integrated Commercial Cycle
► Investment Management
► Financial Close
► Procure to Pay
► Legal Management
► Document Management
► Wave Two definition
► Develop agile capital value processes
Mile
sto
ne
s
10US$ M of Economic
Benefits in 2019
~ 180US$ M of Economic Benefits by 2022
51US$ M invested in
2019
34
75US$ M to invest
in 2020
10Projects in execution
sanctioned in 2018
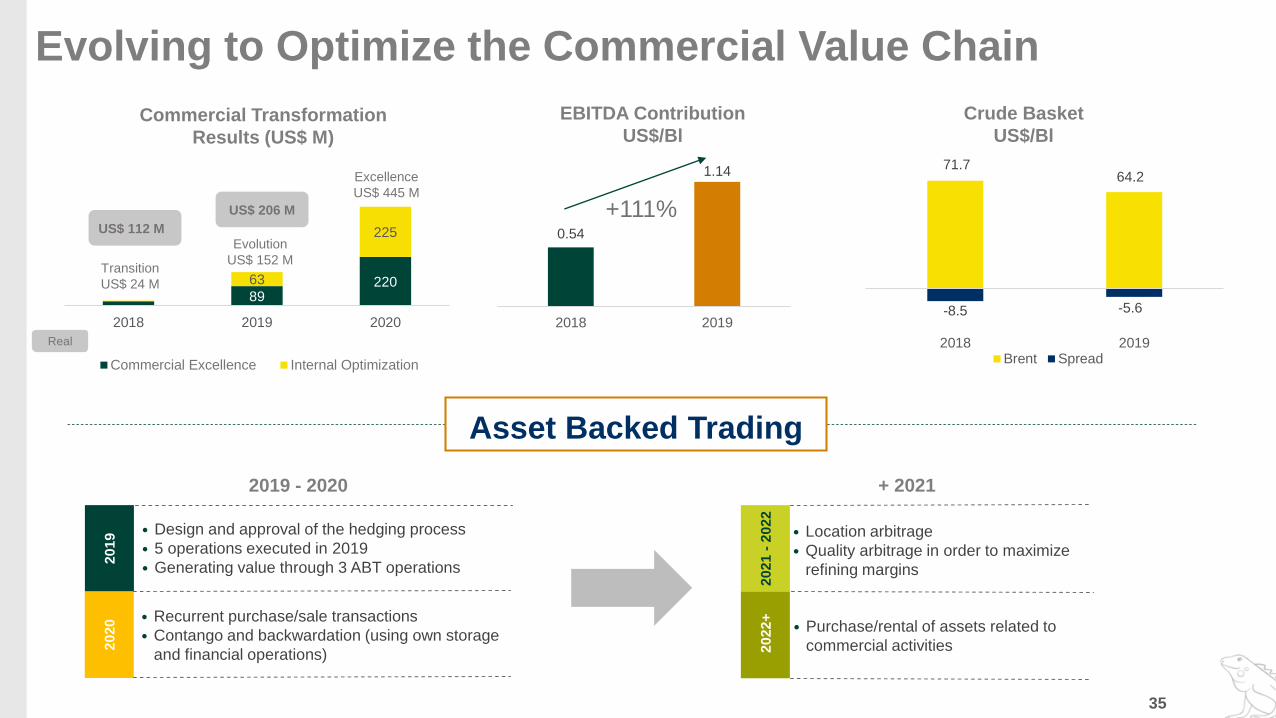
Evolving to Optimize the Commercial Value Chain
8922063
225
2018 2019 2020
Commercial Excellence Internal Optimization
Transition
US$ 24 M
Evolution
US$ 152 M
Excellence
US$ 445 M
2019 - 2020
• Design and approval of the hedging process
• 5 operations executed in 2019
• Generating value through 3 ABT operations
US$ 112 M
US$ 206 M
0.54
1.14
2018 2019
EBITDA Contribution
US$/BlCommercial Transformation
Results (US$ M)
Real
+111%
Crude Basket
US$/Bl
• Location arbitrage
• Quality arbitrage in order to maximize
refining margins
20
21
-2
02
22
02
2+
• Purchase/rental of assets related to
commercial activities
2019
• Recurrent purchase/sale transactions
• Contango and backwardation (using own storage
and financial operations)
20
20
+ 2021
Asset Backed Trading
35
71.764.2
-8.5 -5.6
2018 2019Brent Spread
0
500
1,000
1,500
2,000
2,500
3,000
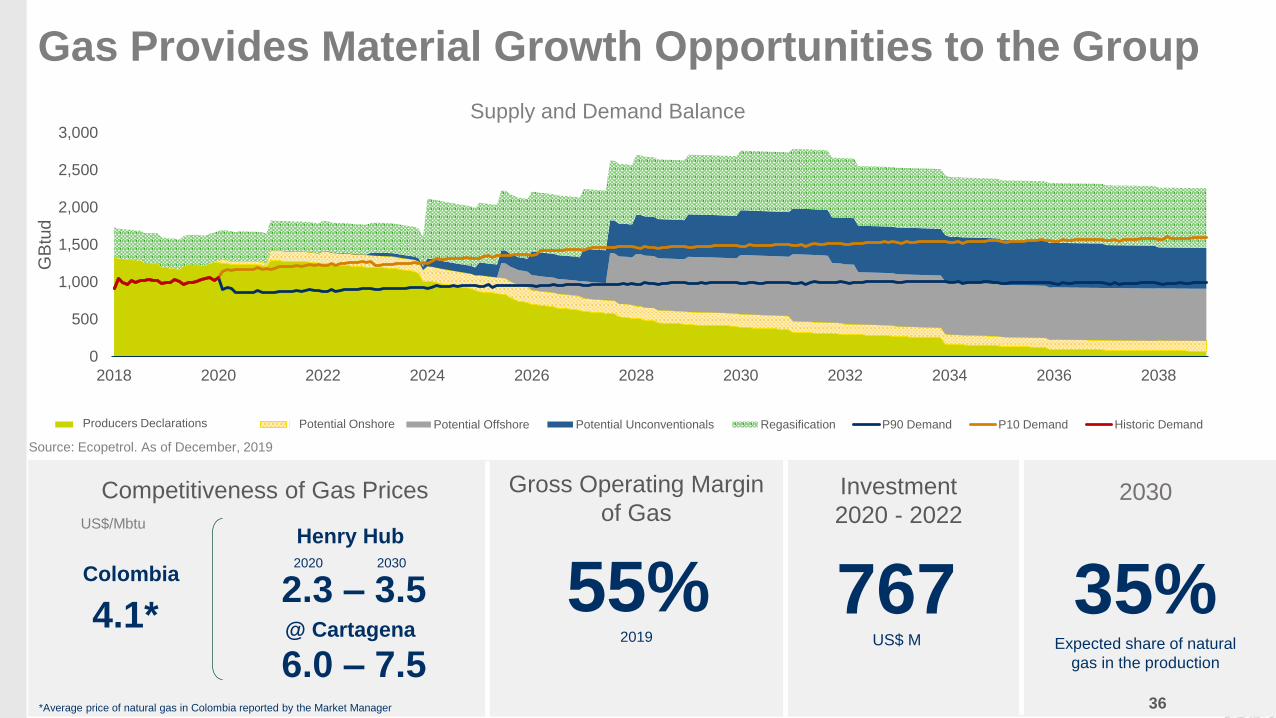
2018 2020 2022 2024 2026 2028 2030 2032 2034 2036 2038
GB
tud
Declaraciones de productores Potencial Onshore Potential Offshore Potential Unconventionals Regasification P90 Demand P10 Demand Historic Demand
Gas Provides Material Growth Opportunities to the Group
Source: Ecopetrol. As of December, 2019
Supply and Demand Balance
36
4.1*2.3 – 3.5
6.0 – 7.5
Henry Hub
@ Cartagena
2020 2030
55%2019
Colombia
*Average price of natural gas in Colombia reported by the Market Manager
Investment
2020 - 2022
767US$ M
Gross Operating Margin
of GasCompetitiveness of Gas Prices
35%Expected share of natural
gas in the production
2030
US$/Mbtu
Producers Declarations Potential Onshore
ESG Initiatives
37Photo: Kiara Abello, Jorge Pérez and Javier Salazar; Yopal, Casanare

20 66140
281
511
725
956
11241229
1610
1800-2000
2010 2011 2012 2013 2014 2015 2016 2017 2018 2019 2020 2021 2022
Reducciones
Reducciones potenciales porverificar (2018-2022)
Progress in the Decarbonization Plan
• Zero routine flaring
• 20% reduction of CO2e
• Nature based solutions portfolio in place
94
168
80
Autogeneración+Compras Solar Eólica
• Annual reduction between 1.8 - 2.0 MtCO2e of greenhouse
gas emissions in 2022
• Significant reduction in gas flaring
• 20% self-generation capacity with renewable energy
• Increase of between 2% and 3% in energy efficiency2030
Reduction of Greenhouse EmissionsKtCO2e
Renewable Energies in the
Energy Matrix by 2022 (MW)
Total Generation Capacity (MW)
Strong Growth in Renewables
1,227
1,521
2019 2022+
+24%
2020 -
2022
38
Reductions
Potential Reductions to
Verify (2018 – 2022)
Self-generation + Purchases WindSolar

• Awareness, training and information
• Friendly labor places for SOGI community free of discrimination
• Equal opportunities
• Cultural awareness
• Equal opportunities and entrepreneurship
• Economic, social and cultural inclusion
• Equal opportunities
• Inclusive labor environment
• Taking care of Caregivers
• Moving from integration to inclusion
• Women participation in leadership and core positions
• Work/life balance
• Gender based violence prevention
72%Vacancies of leadership
positions with women as
final candidates
38% in 2018
7.6%People with disability*
2.9%Victims of
internal
conflict*
4.0%of people identify
themselves as part of an
ethnic minority group*
6Ongoing initiatives with
28 volunteers
Making Progress in Diversity and Inclusion
0.2%Veterans*
Gender Disability
Victims of
Internal Conflict,
Veterans and
Ex-Combats
Ethnicity and
Other Social
Conditions
Sexual
Orientation
39* Of the personnel

Fully Committed to Best Corporate Governance Practices
40
Orlando Ayala
Independent
Luis Guillermo Echeverri
Independent
Juan Emilio Posada
Independent
Sergio Restrepo
Independent
Luis Santiago Perdomo
Independent
Esteban Piedrahita
Independent
Germán Quintero
Non Independent
Hernando Ramírez
Independent
Carlos Gustavo Cano
Independent
Board Oversight
• Best Corporate Governance Practices
• Remuneration and Nomination
• HSE
• Innovation and transformation to digital leadership
• Strategy and New Business
• Succession planning policy
Ethics and Compliance
• Commitment to Transparency
• Training in Ethics aspects
• Multiple venues to look for guidance or whistleblowing
• Preventive surveillance to prevent money laundering and terrorism financing
.
• Fair and confidential investigation process
Protection of Minority
Shareholders
• Independent directors: from four in 2008 to eight in 2019
• A position in the Board of Directors nominated by the ten largest minority shareholders
• A position in the Board of Directors nominated by hydrocarbon producing regions in Colombia
•No director with ministerial rank following OECD recommendations
• Clear and timely information to shareholders
•Shareholder´s Office
Corporate Governance Model
• New Corporate Governance Model that underpins the execution of the business plan
Board of Directors
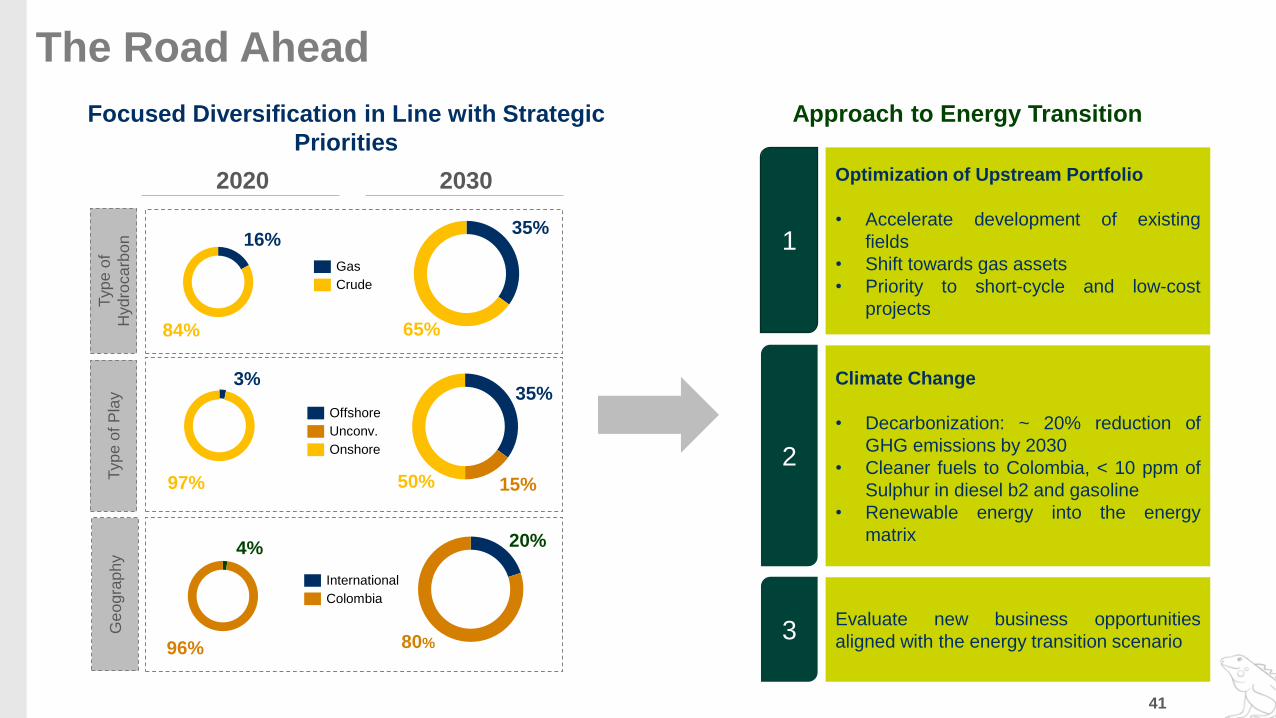
The Road Ahead
Focused Diversification in Line with Strategic
Priorities
Approach to Energy Transition
20302020
Typ
e o
f
Hyd
roca
rbo
nT
yp
e o
f P
lay
Ge
ogra
ph
y
35%
65%
35%
15%50%
80%
20%
Gas
Crude
Offshore
Unconv.
Onshore
Colombia
International
1
Optimization of Upstream Portfolio
• Accelerate development of existing
fields
• Shift towards gas assets
• Priority to short-cycle and low-cost
projects
Climate Change
• Decarbonization: ~ 20% reduction of
GHG emissions by 2030
• Cleaner fuels to Colombia, < 10 ppm of
Sulphur in diesel b2 and gasoline
• Renewable energy into the energy
matrix
3Evaluate new business opportunities
aligned with the energy transition scenario
2
16%
84%
3%
97%
4%
96%
41
Definitions
42
Acronym Definition
bboe Billion barrels of oil equivalent
Bl Barrel
boed Barrels of oil equivalent per day
CAGR Compound Annual Growth Rate
CEOR Chemical Enhanced Oil Recovery
CFFO Cash Flow From Operations
EOR Enhanced Oil Recovery
ESG Environmental, Social and Governance
Gbtud Giga BTU per day
GHG Greenhouse Gas
HCIIP Hydrocarbons Initially In Place
JV Joint Venture
KtCO2e Thousand Metric Tons of Carbon Dioxide equivalent
mbd Thousand barrels per day
mboe Thousand barrels of oil equivalent
mboed Thousand barrels of oil equivalent per day
Mbtu Million BTU
MMSTB Million Stock Tank Barrels
mm3 Million Cubic Meters
MtCO2e Million Metric Tons of Carbon Dioxide equivalent
MW Megawatts
NFE Near Field Exploration
PPIR Pilot Projects for Integral Research
PPM Parts Per Million
ROACE Return on Average Capital Employed
RRR Reserves Replacement Ratio
SOGI Sexual Orientation and Gender Identity
TCF Trillion Cubic Feet
TRIF Total Recordable Case Frequency
US$ B Billion dollars
US$ M Million dollars
43
Related Documents