Marcie Van Auken MS Technology Management, Capstone 2020 School of Professional Studies Columbia University Business Plan & Proposal • August 2020

Welcome message from author
This document is posted to help you gain knowledge. Please leave a comment to let me know what you think about it! Share it to your friends and learn new things together.
Transcript
Marcie Van Auken
MS Technology Management, Capstone 2020
School of Professional Studies
Columbia University
Business Plan & Proposal • August 2020
Marcie Van Auken | Columbia University | [email protected]
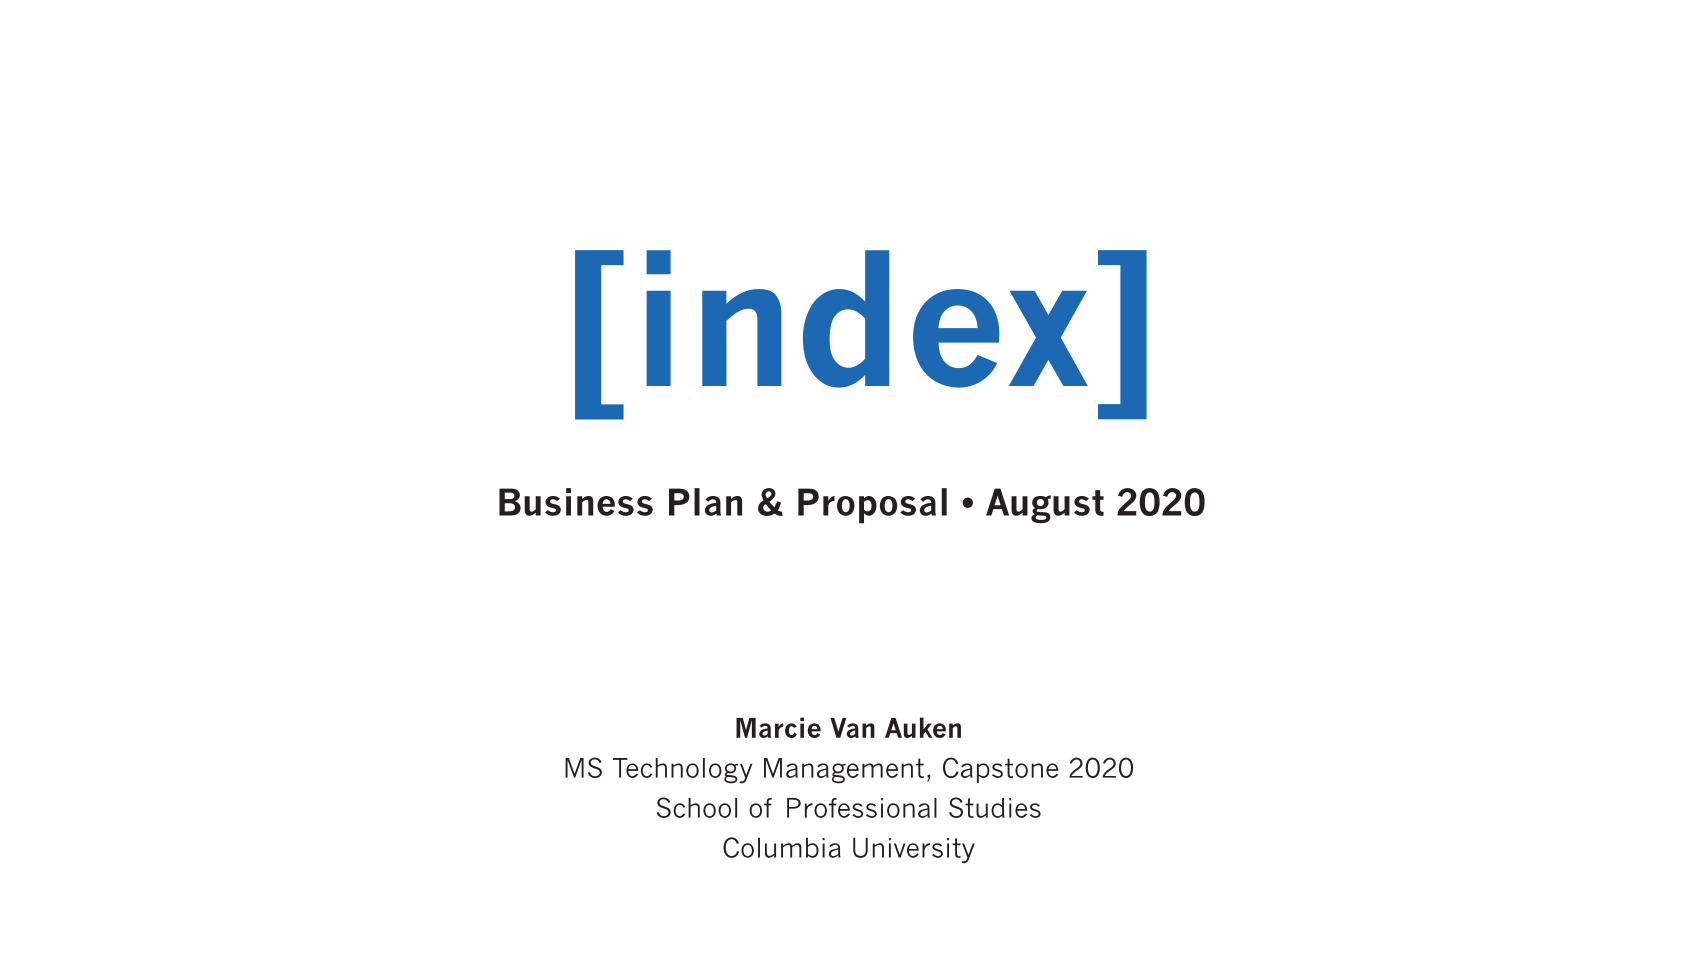
What we’re talking about
A Tunnel To Your Digital Workflow
Value Proposition & Opportunity
Competition, Differentiation, & GTM Strategy
Financials, Returns, & Risks
Ask & Next Steps
Marcie Van Auken | Columbia University | [email protected]
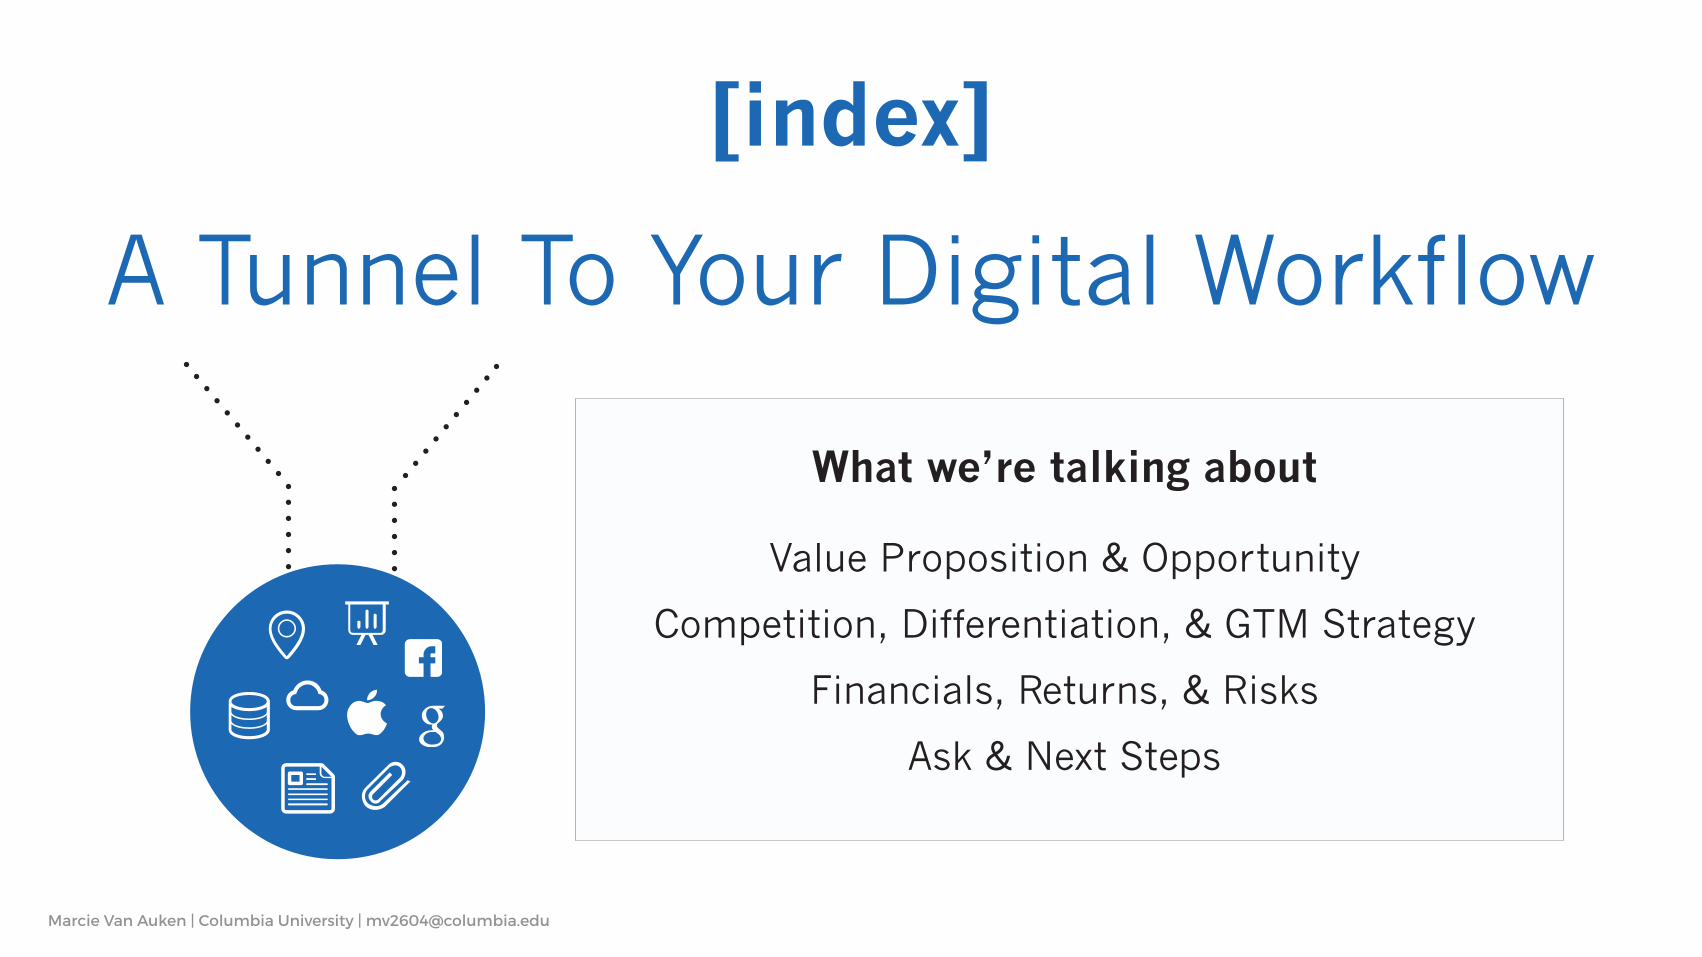
Centralized Digital Space
Digital Data Check
Informs & Teaches
Avg Time Searching: Google Info per User: Index Insights
2.5 hrs/day per employee4
1,000 @ $80,000
$25 Million / Year5
Connects our digital assets
Transparency between user and
platform
Interpret activity and information
Value Proposition
2GB =1.5 Million Documents3
Data trends and pattern aggregations
1. Have An Ask 2. Index Interprets Ask 3. Tailored Response
Figure 1: How Index Works
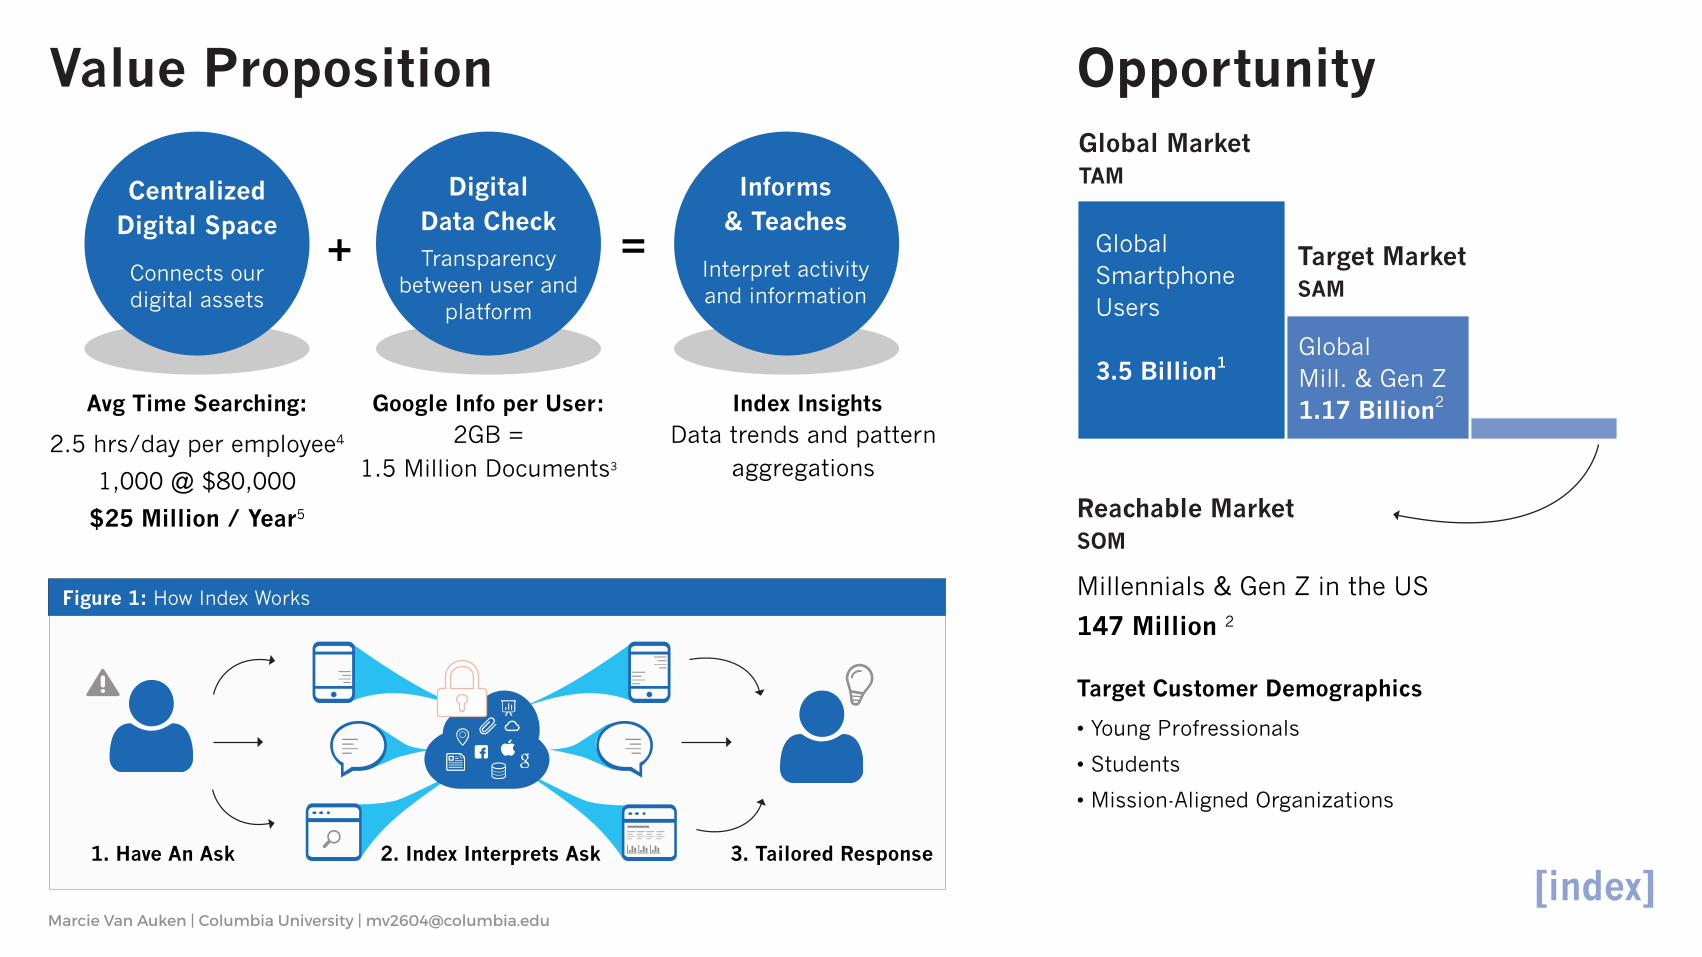
Opportunity
Global Smartphone Users
3.5 Billion1
Global Market TAM
Target MarketSAM
Global Mill. & Gen Z1.17 Billion2
Reachable Market SOM
Millennials & Gen Z in the US
147 Million 2
• Young Profressionals
• Students
• Mission-Aligned Organizations
Target Customer Demographics
Marcie Van Auken | Columbia University | [email protected]
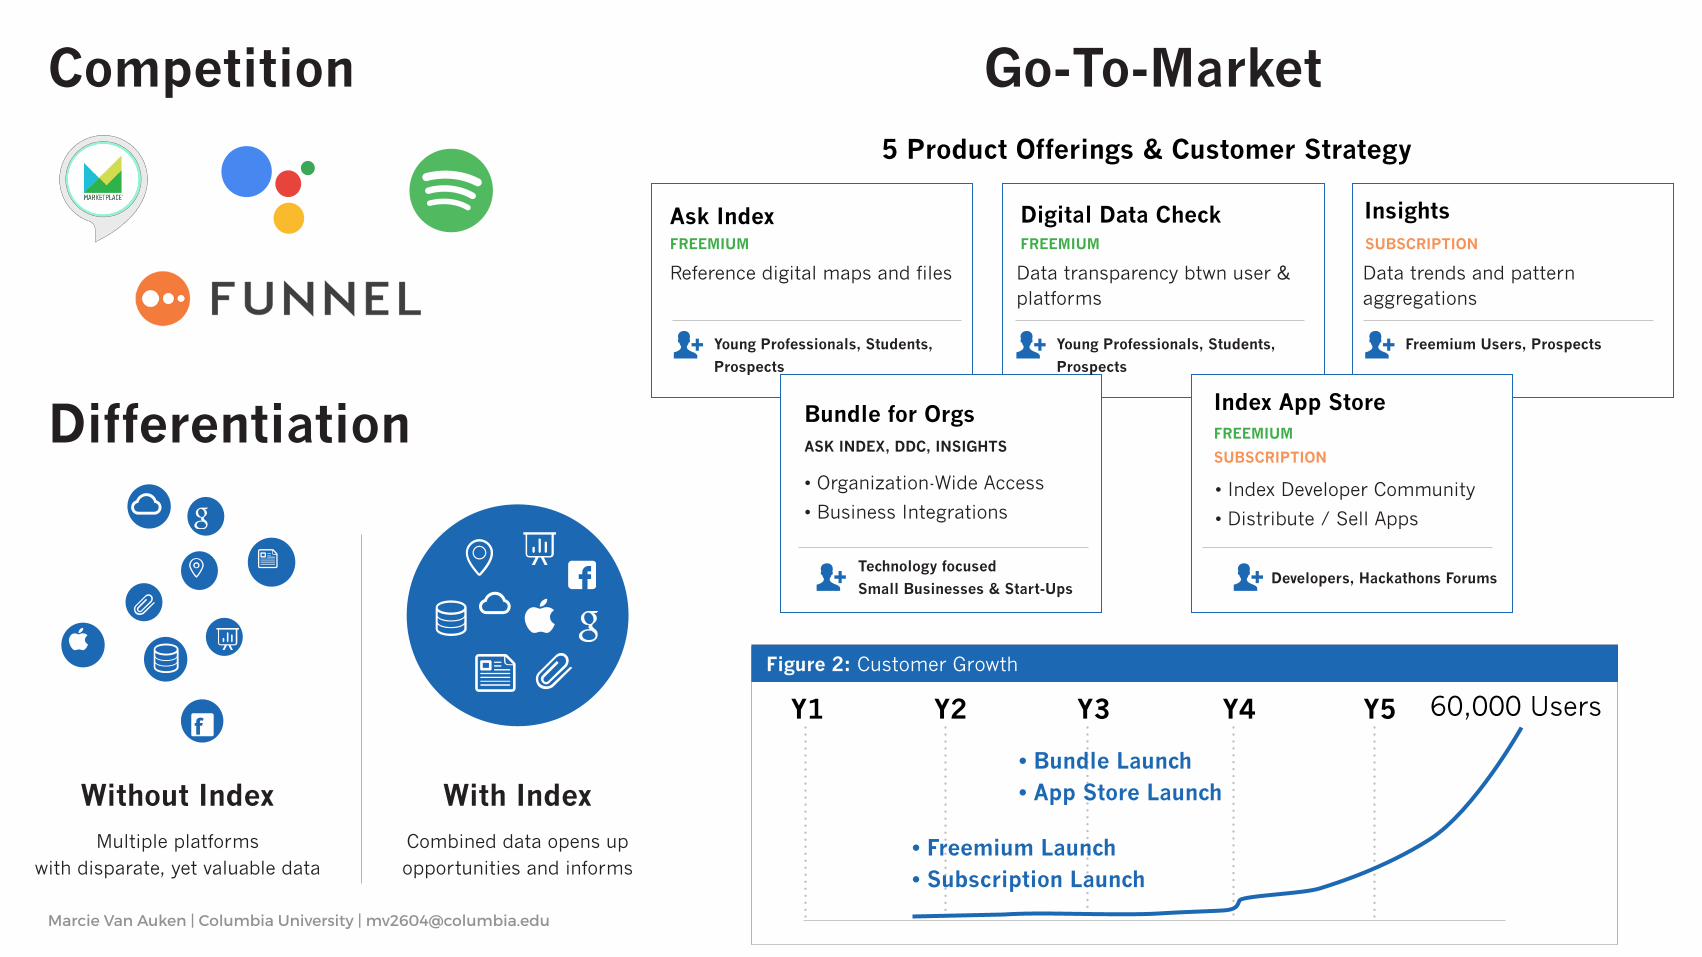
Multiple platformswith disparate, yet valuable data
Without IndexCombined data opens up opportunities and informs
With Index
Competition Go-To-Market
Differentiation
Ask Index Digital Data CheckFREEMIUM FREEMIUM SUBSCRIPTION
Insights
5 Product Offerings & Customer Strategy
Y1 60,000 UsersY2 Y3 Y4 Y5
• Bundle Launch• App Store Launch
Figure 2: Customer Growth
Index App StoreBundle for Orgs
• Organization-Wide Access
• Business Integrations• Index Developer Community
• Distribute / Sell Apps
Reference digital maps and files Data transparency btwn user & platforms
Data trends and pattern aggregations
ASK INDEX, DDC, INSIGHTS
Technology focused
Small Businesses & Start-UpsDevelopers, Hackathons Forums
Young Professionals, Students,
Prospects
Young Professionals, Students,
Prospects
Freemium Users, Prospects
FREEMIUM
SUBSCRIPTION
• Freemium Launch• Subscription Launch
Marcie Van Auken | Columbia University | [email protected]
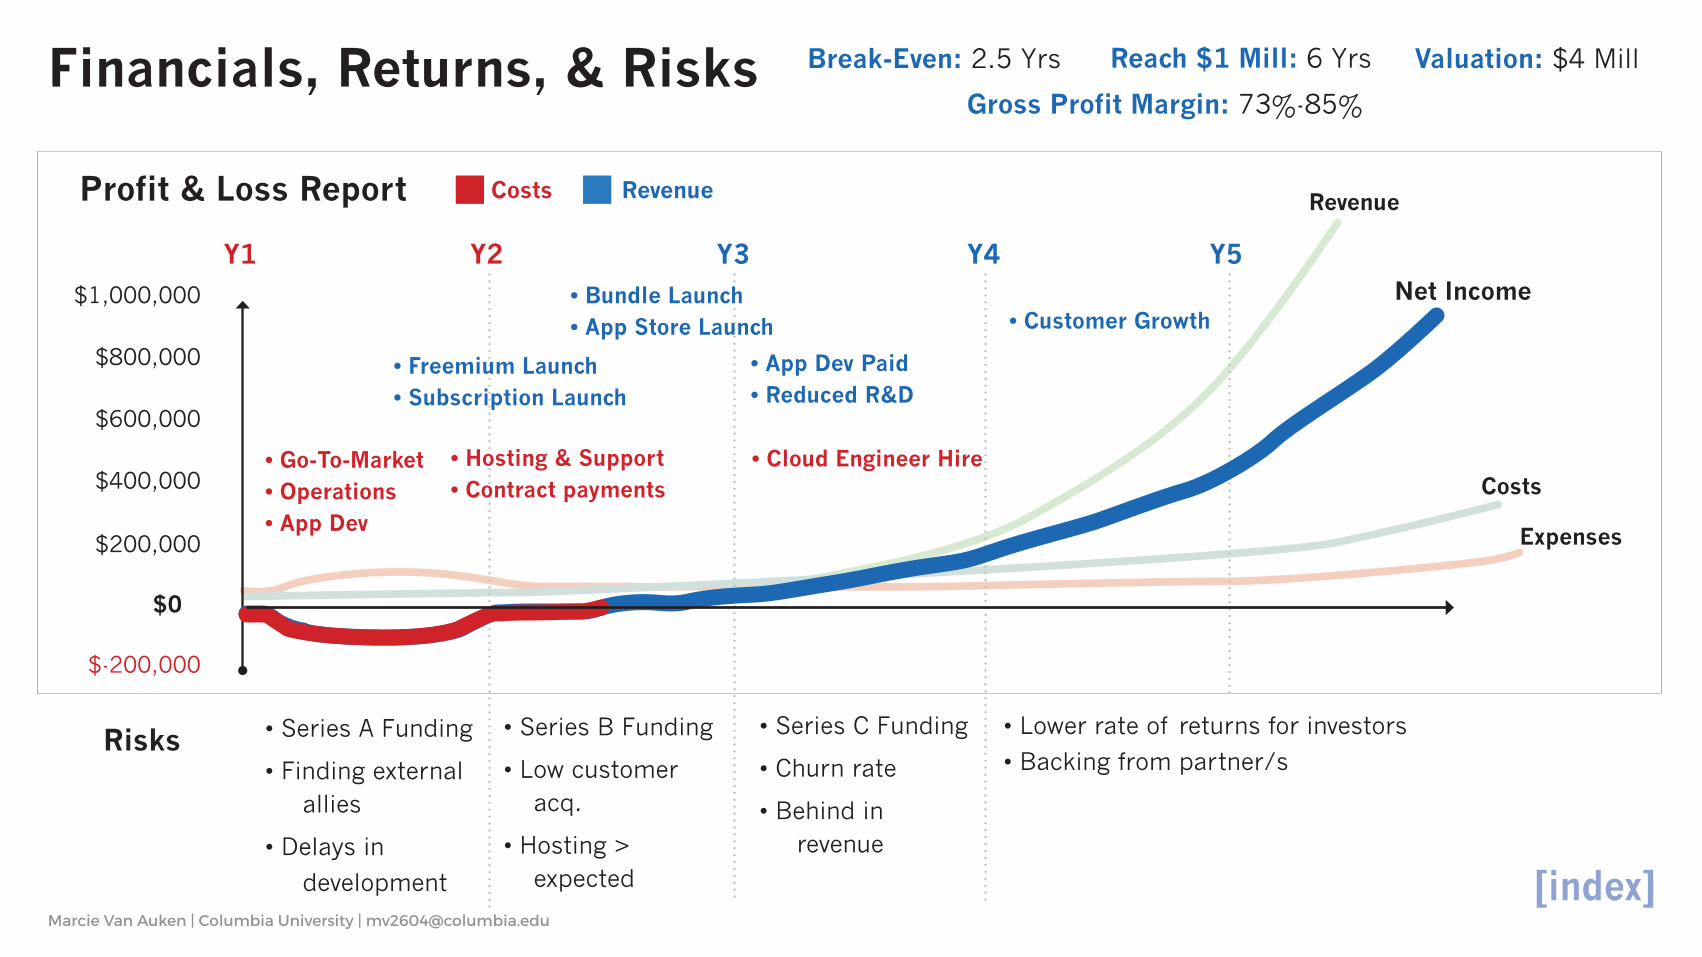
Financials, Returns, & Risks
$0
$-200,000
$200,000
Y1 Y2 Y3 Y4 Y5
$400,000
$600,000
$800,000
$1,000,000 Net Income
Revenue
Costs
Expenses
Risks • Series A Funding
• Finding external allies
• Delays in
development
• Bundle Launch• App Store Launch
Profit & Loss Report
• App Dev Paid• Reduced R&D
• Customer Growth
• Go-To-Market• Operations• App Dev
Costs Revenue
• Lower rate of returns for investors
• Backing from partner/s
• Series C Funding
• Churn rate
• Behind in revenue
• Series B Funding
• Low customer acq.
• Hosting > expected
• Freemium Launch• Subscription Launch
• Hosting & Support• Contract payments
• Cloud Engineer Hire
Break-Even: 2.5 Yrs
Gross Profit Margin: 73%-85%
Reach $1 Mill: 6 Yrs Valuation: $4 Mill
Marcie Van Auken | Columbia University | [email protected]
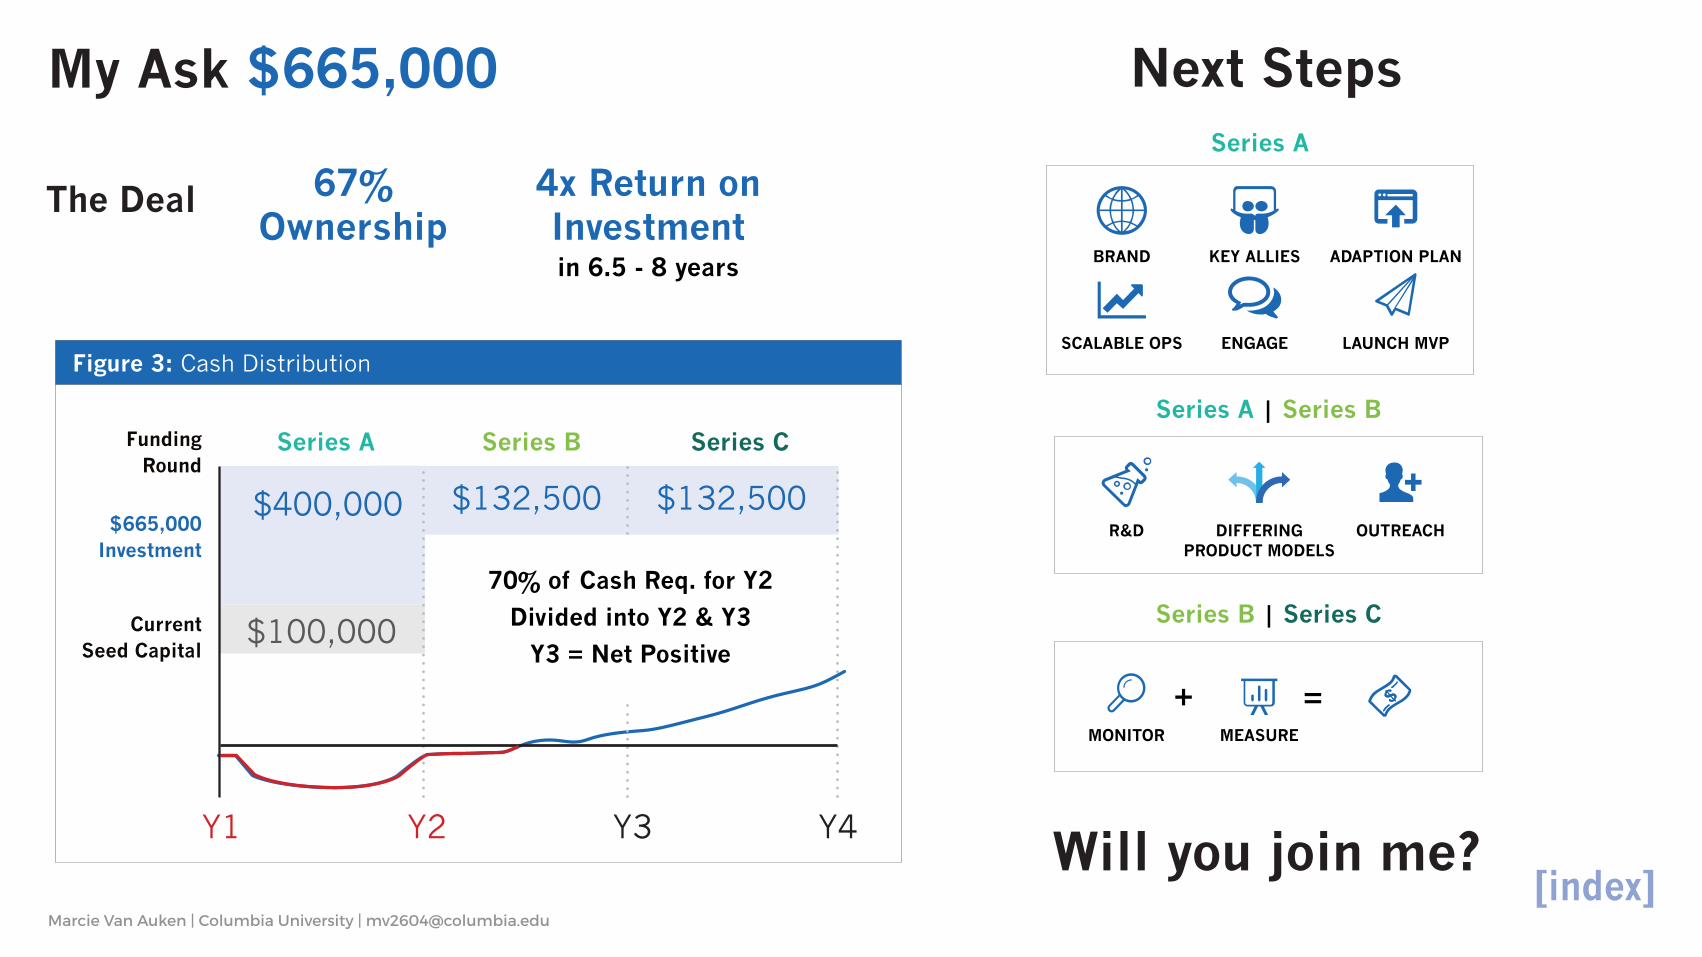
Next StepsMy Ask $665,000
The Deal
Will you join me?
Series B | Series C
MONITOR MEASURE
Series A | Series B
R&D OUTREACHDIFFERING PRODUCT MODELS
Series A
ADAPTION PLAN
LAUNCH MVP
KEY ALLIES
ENGAGE
BRAND
SCALABLE OPS
67%Ownership
in 6.5 - 8 years
4x Return on Investment
$132,500
Y1 Y2 Y3 Y4
Series A Series B Series C
$400,000
$100,000
$132,500$665,000
Investment
Current Seed Capital
Funding Round
70% of Cash Req. for Y2
Divided into Y2 & Y3
Y3 = Net Positive
Figure 3: Cash Distribution
Marcie Van Auken | Columbia University | [email protected]
References
1 Deyan, G 160+ Revealing Statistics about Smartphone Statistics in 2020. (2020, July 02)
2 Generations-Demographic Trends in Population and Workforce: Quick Take. (n.d.). Retrieved from https://
www.catalyst.org/research/generations-demographic-trends-in-population-and-workforce/
3 Martin, N. M. (2019, March 11). How Much Does Google Really Know About Us. Forbes.Com. https://
www.forbes.com/sites/nicolemartin1/2019/03/11/how-much-does-google-really-know-about-you-a-
lot/#3eadbb557f5d
4 Diamond Inc. (2018, April 25). Productivity, Lost Time, and the Power of AI to Make Search Easier.
Medium. https://medium.com/@diamond_io/productivity-lost-time-and-the-power-of-ai-to-make-search-
easier
5 Noi, D. (2018). Do workers still waste time searching for information? Xenit.Eu. https://blog.xenit.eu/
blog/do-workers-still-waste-time-searching-for-information
Marcie Van Auken | Columbia University | [email protected]
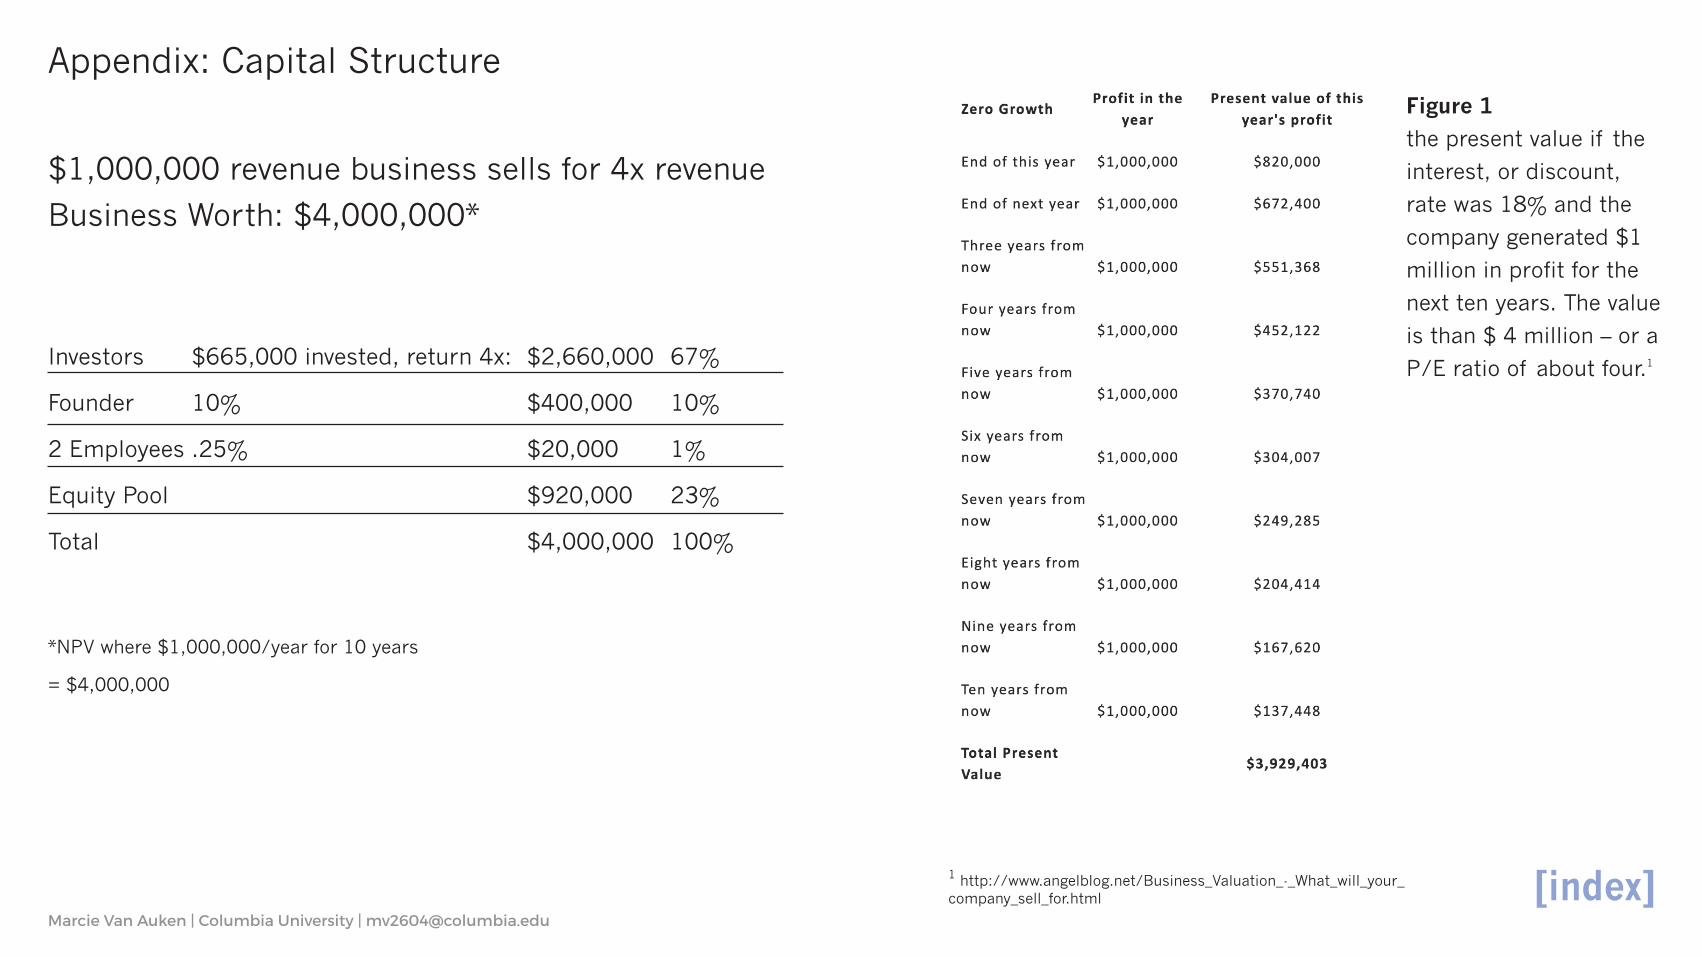
$1,000,000 revenue business sells for 4x revenue
Business Worth: $4,000,000*
Investors $665,000 invested, return 4x: $2,660,000 67%
Founder 10% $400,000 10%
2 Employees .25% $20,000 1%
Equity Pool $920,000 23%
Total $4,000,000 100%
*NPV where $1,000,000/year for 10 years
= $4,000,000
1 http://www.angelblog.net/Business_Valuation_-_What_will_your_company_sell_for.html
Figure 1
the present value if the
interest, or discount,
rate was 18% and the
company generated $1
million in profit for the
next ten years. The value
is than $ 4 million – or a
P/E ratio of about four.1
Appendix: Capital Structure
Marcie Van Auken | Columbia University | [email protected]
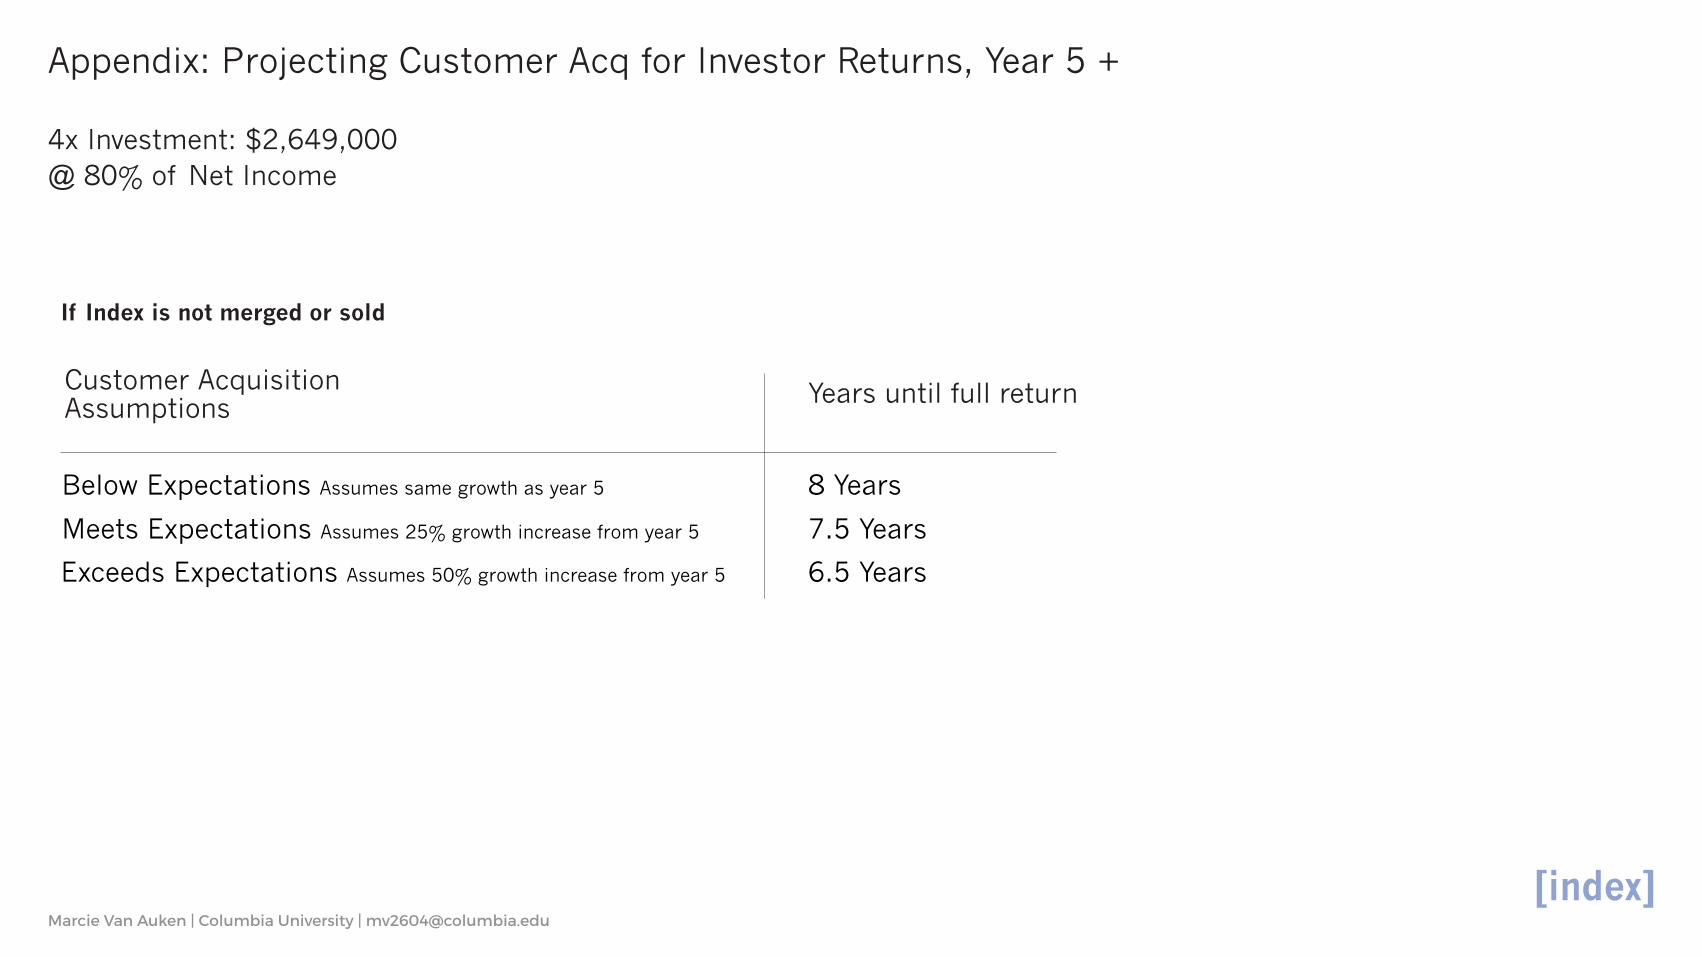
Appendix: Projecting Customer Acq for Investor Returns, Year 5 +
Below Expectations Assumes same growth as year 5 8 Years
7.5 Years
6.5 Years
Customer AcquisitionAssumptions Years until full return
4x Investment: $2,649,000@ 80% of Net Income
Meets Expectations Assumes 25% growth increase from year 5
Exceeds Expectations Assumes 50% growth increase from year 5
If Index is not merged or sold
Marcie Van Auken | Columbia University | [email protected]
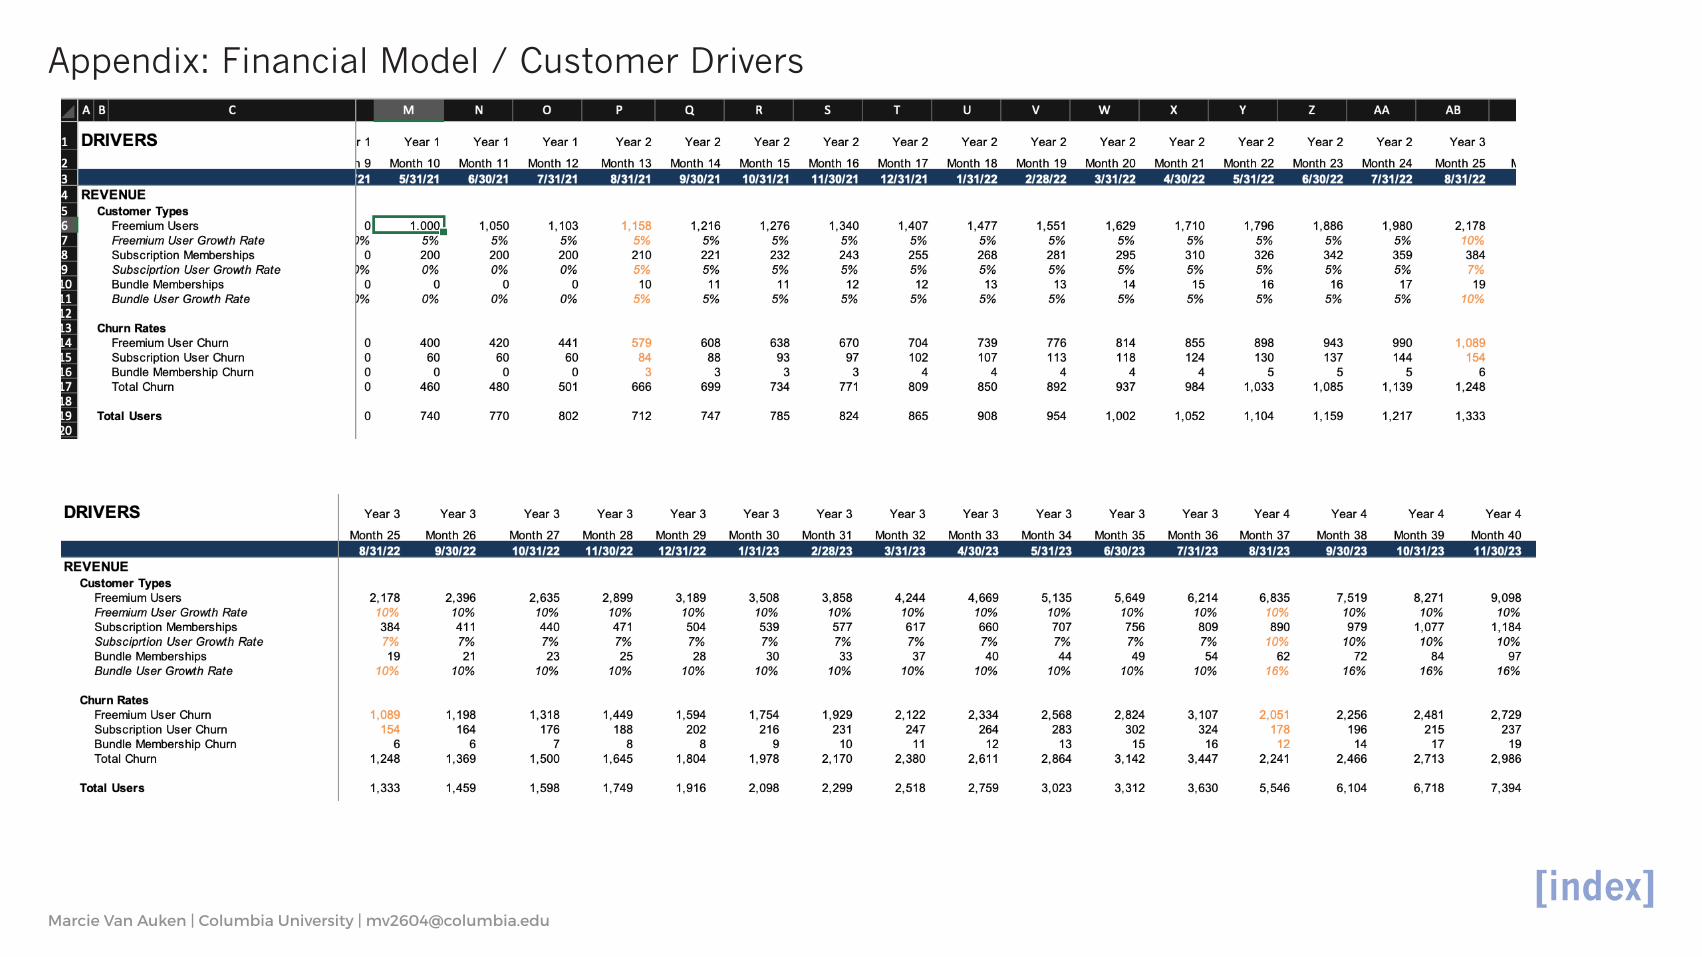
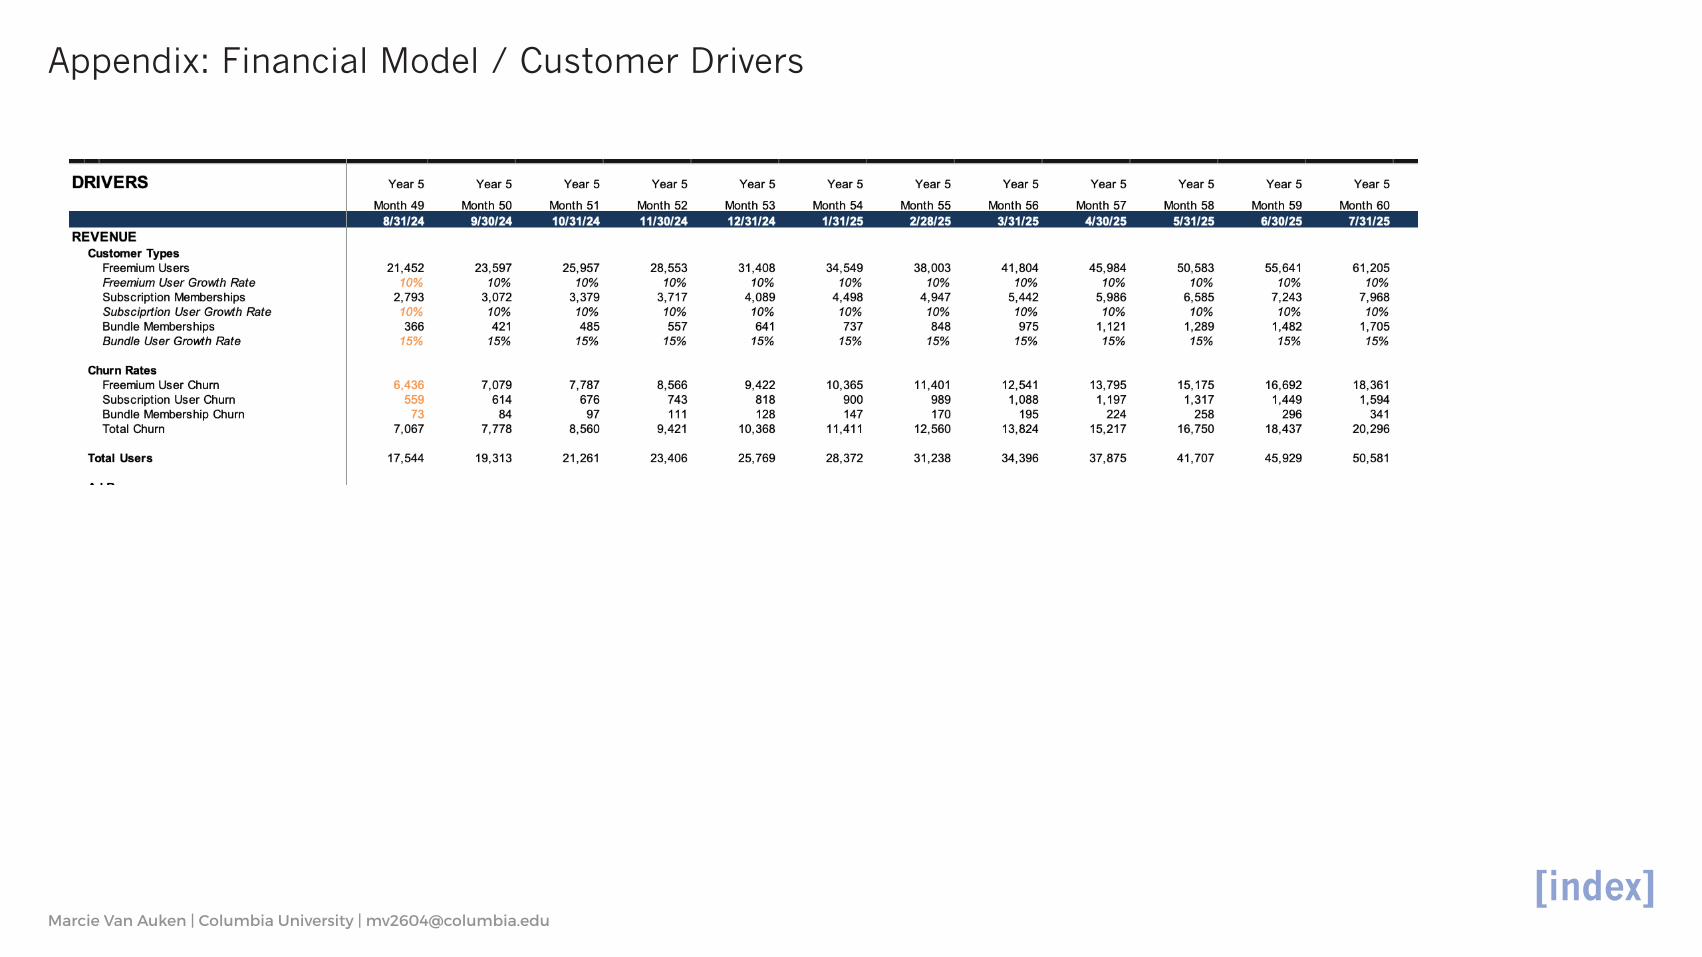
Appendix: Financial Model / Customer Drivers
Marcie Van Auken | Columbia University | [email protected]
Appendix: Financial Model / Customer Drivers
Marcie Van Auken | Columbia University | [email protected]
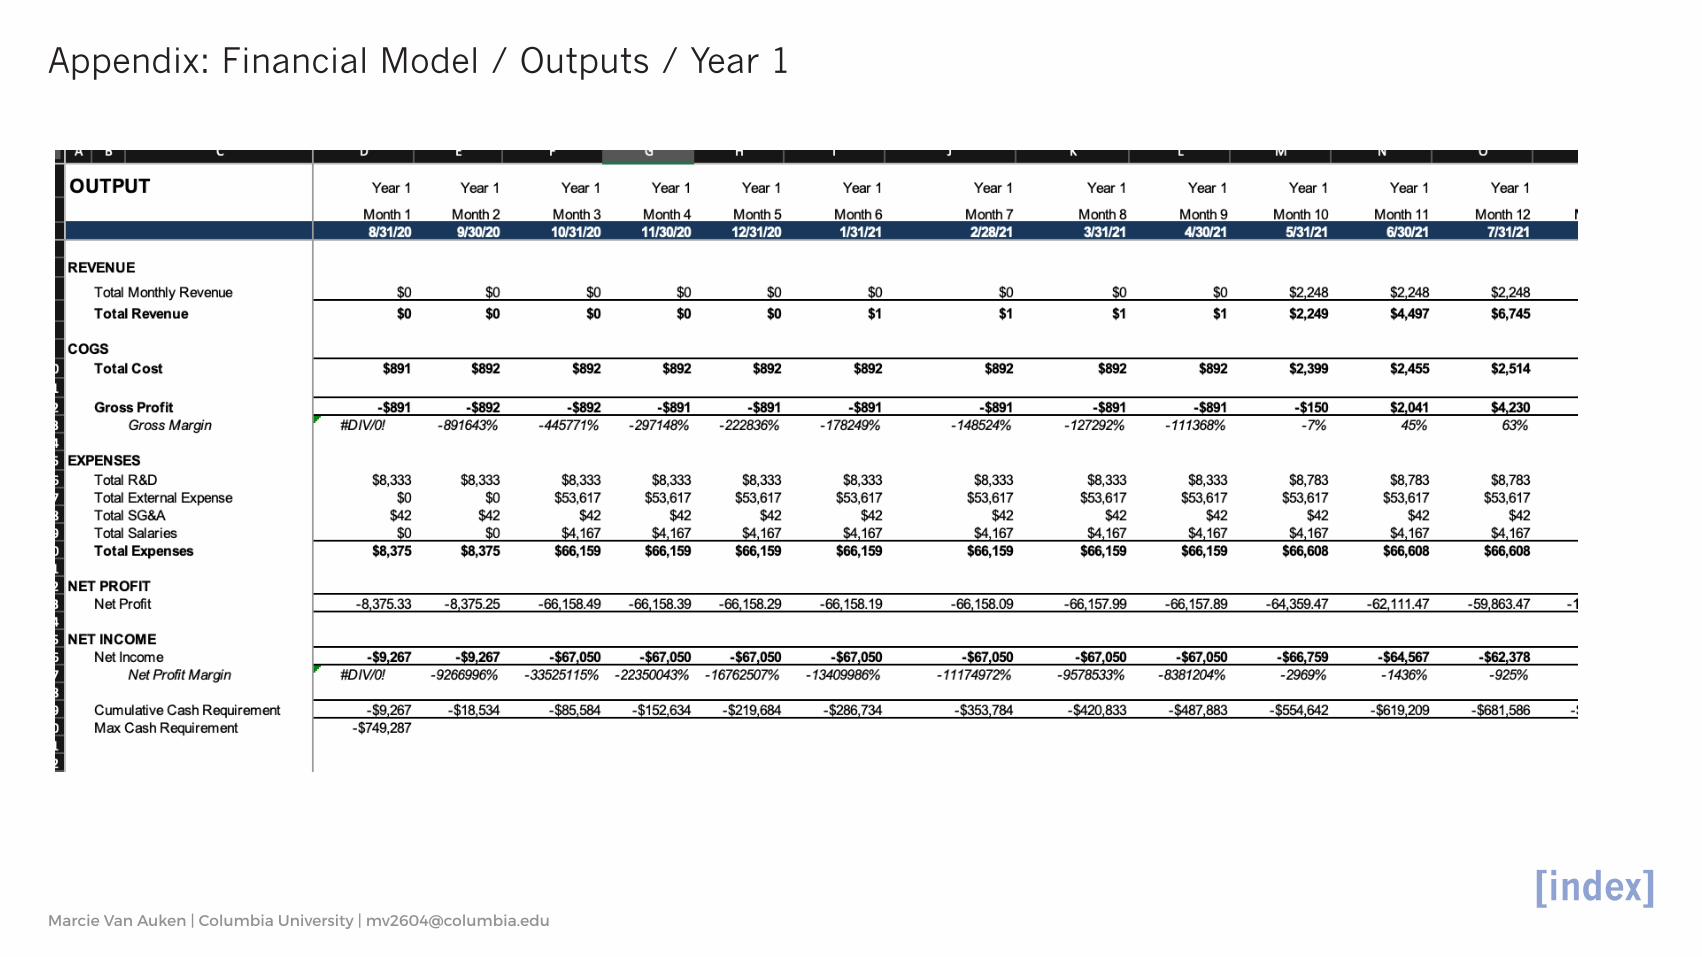
Appendix: Financial Model / Outputs / Year 1
Marcie Van Auken | Columbia University | [email protected]
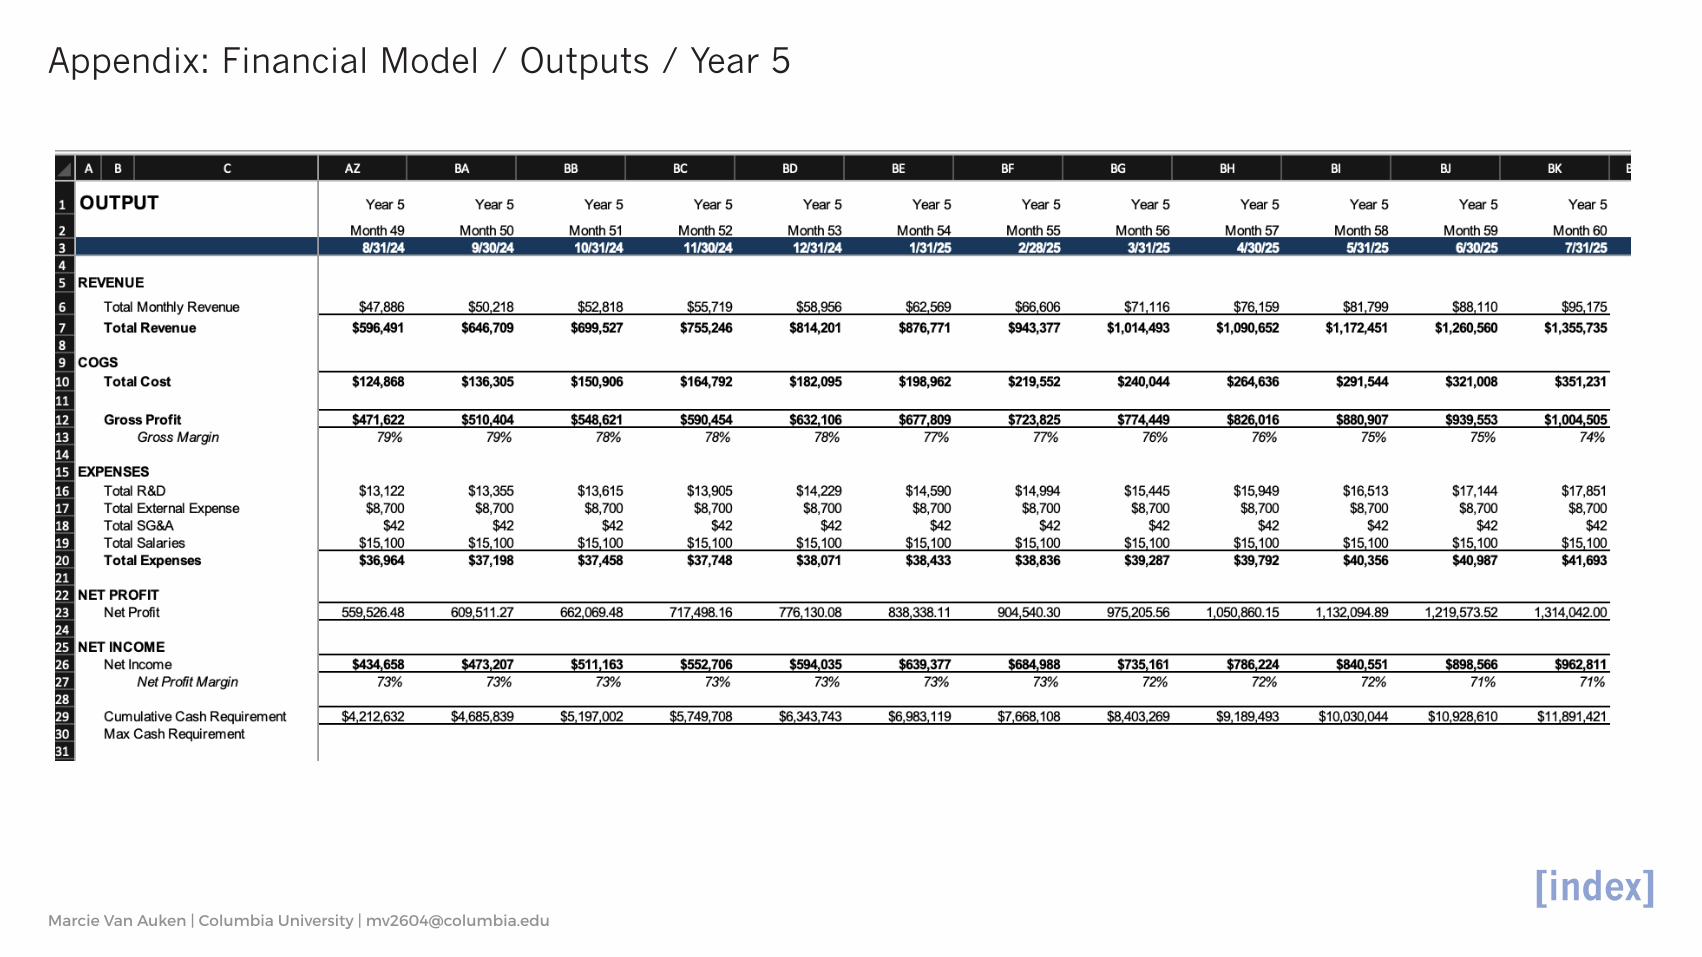
Appendix: Financial Model / Outputs / Year 5
Marcie Van Auken | Columbia University | [email protected]
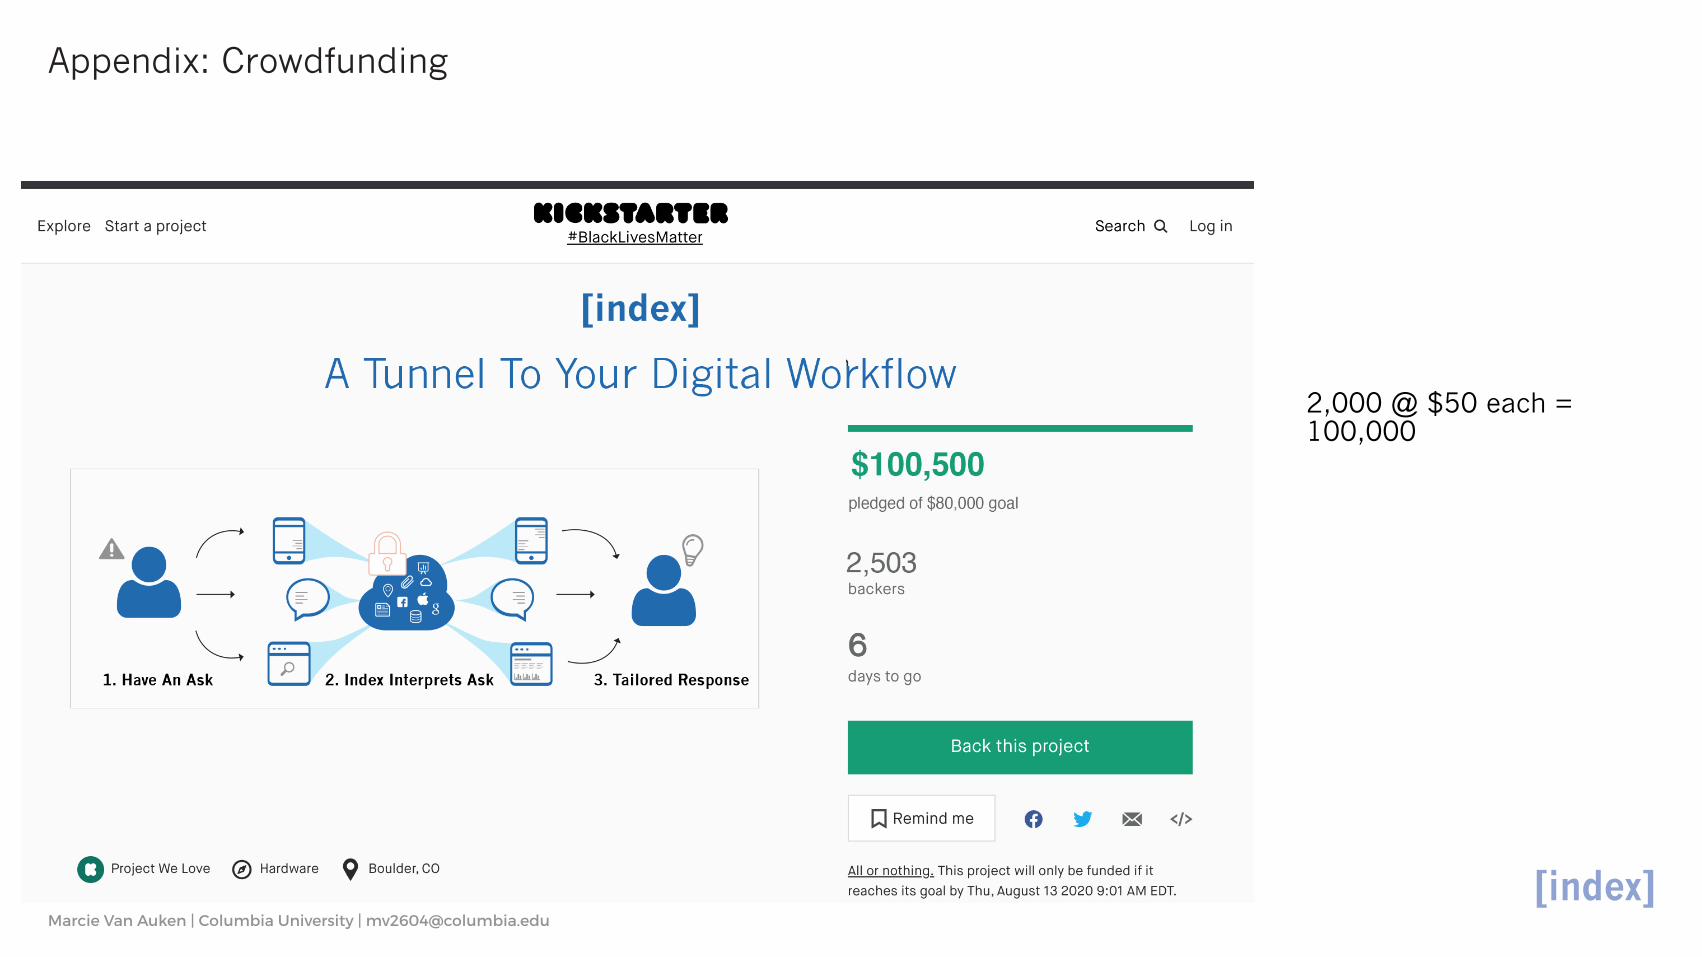
Appendix: Crowdfunding
2,000 @ $50 each = 100,000
Marcie Van Auken | Columbia University | [email protected]
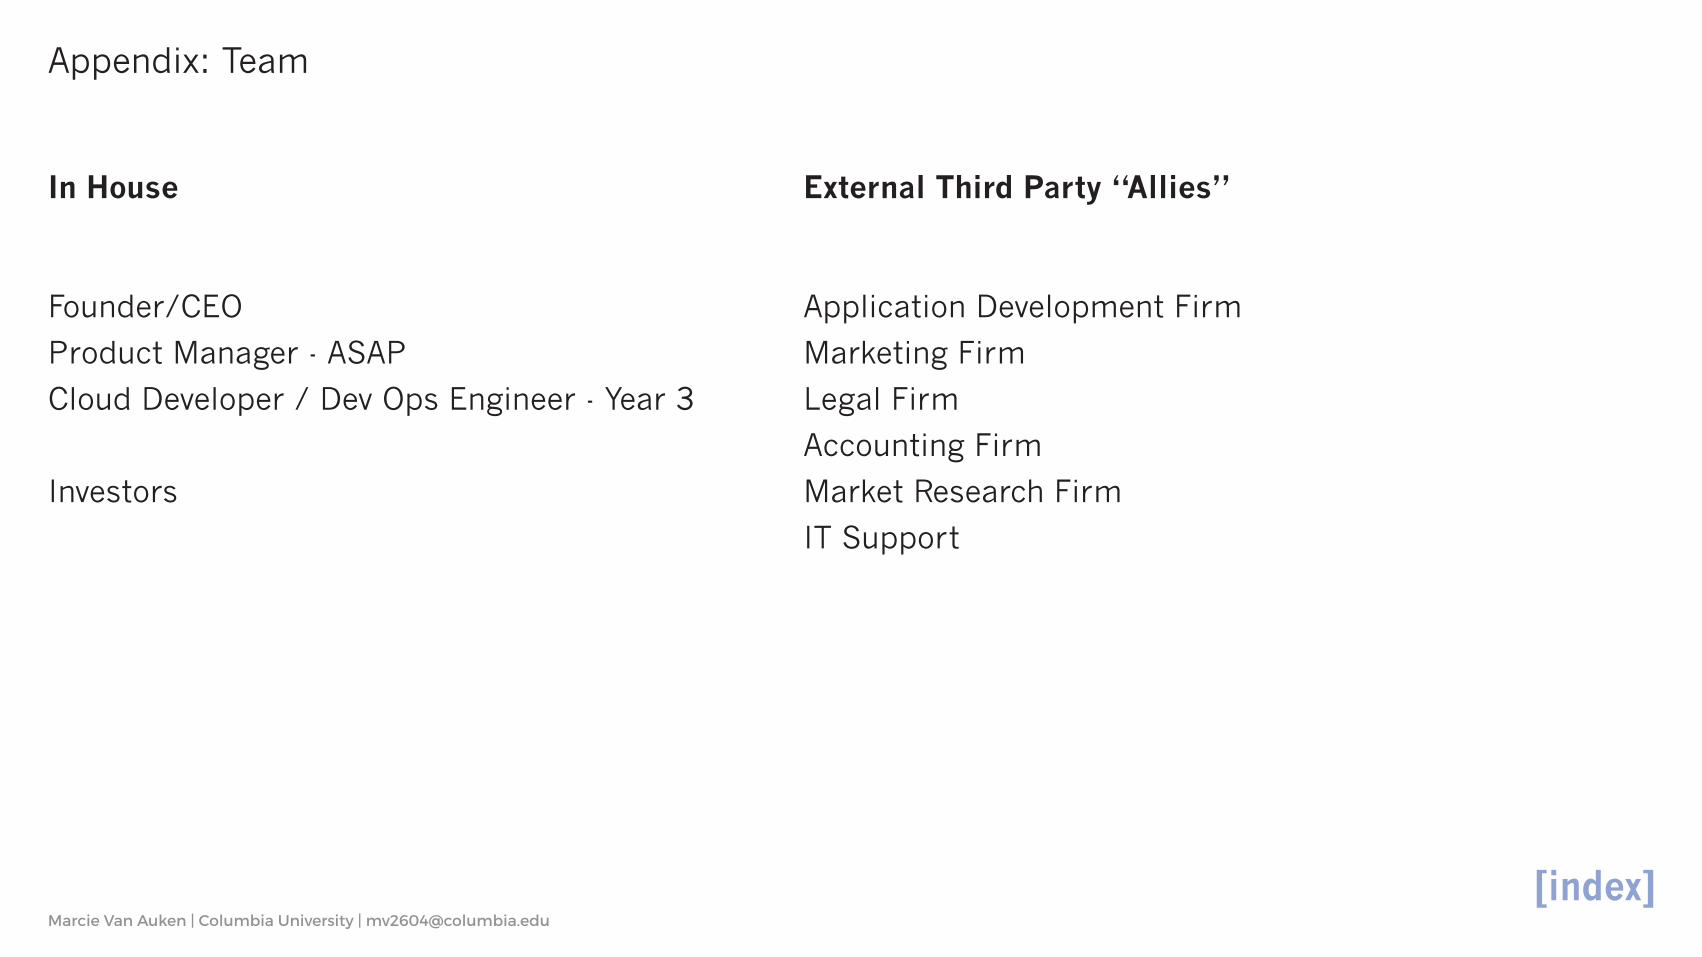
Appendix: Team
In House
Founder/CEO
Product Manager - ASAP
Cloud Developer / Dev Ops Engineer - Year 3
Investors
Application Development Firm
Marketing Firm
Legal Firm
Accounting Firm
Market Research Firm
IT Support
External Third Party “Allies”
Marcie Van Auken | Columbia University | [email protected]
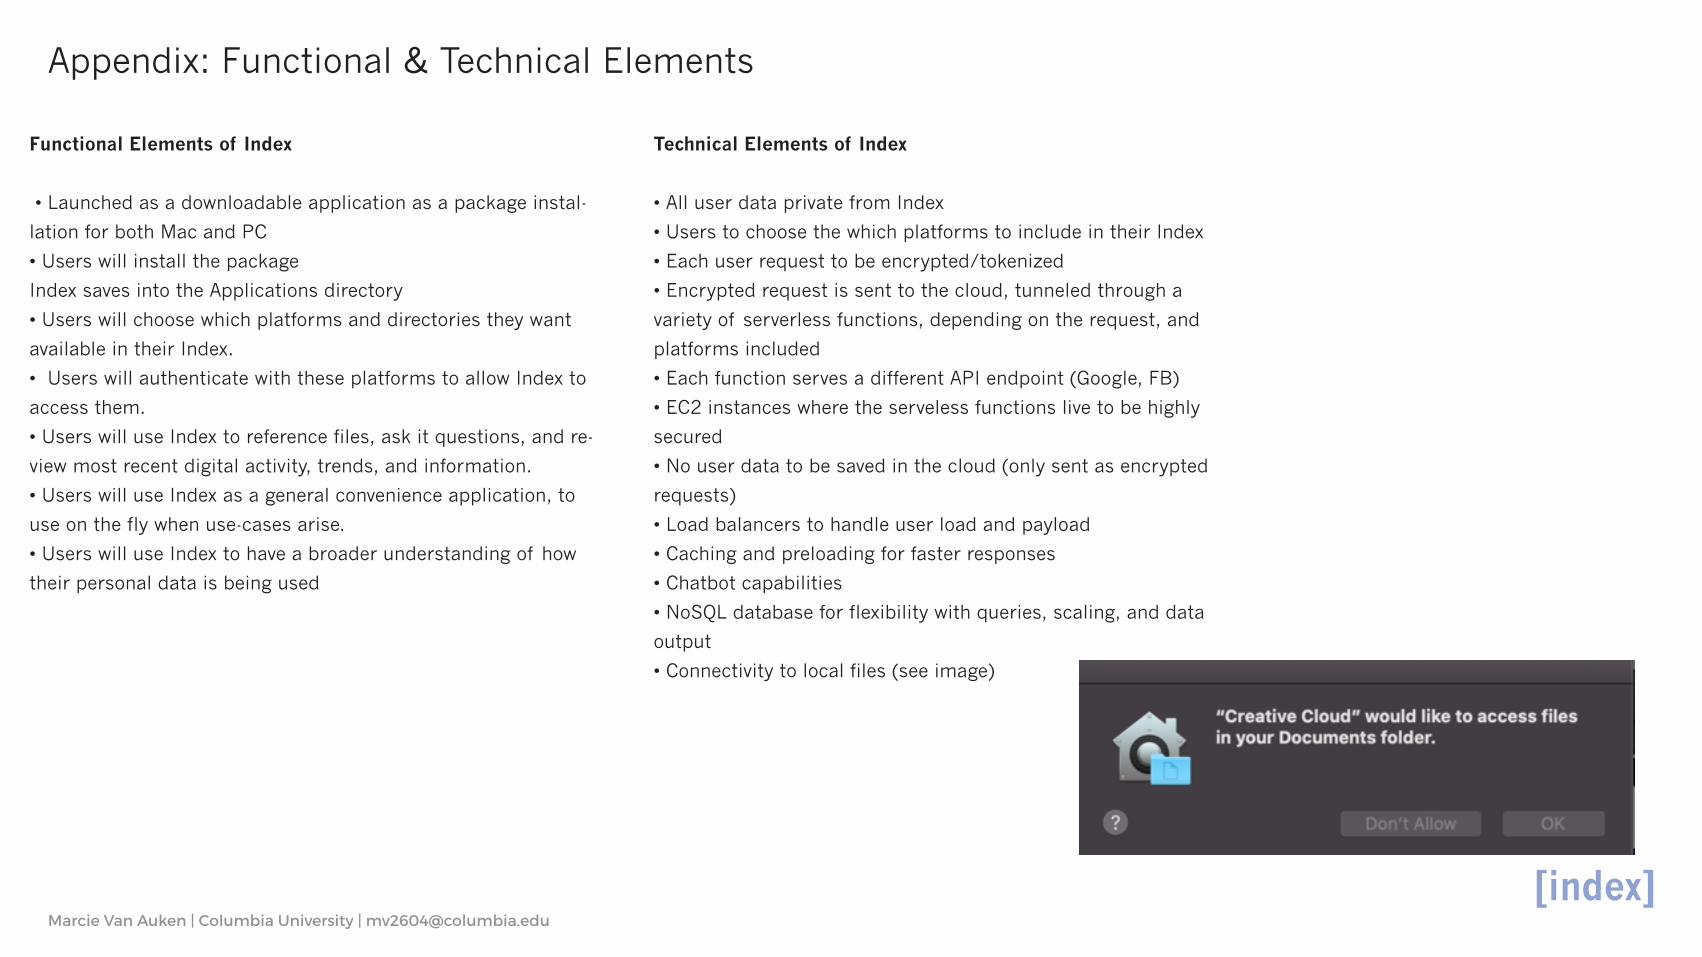
Appendix: Functional & Technical Elements
Functional Elements of Index
• Launched as a downloadable application as a package instal-
lation for both Mac and PC
• Users will install the package
Index saves into the Applications directory
• Users will choose which platforms and directories they want
available in their Index.
• Users will authenticate with these platforms to allow Index to
access them.
• Users will use Index to reference files, ask it questions, and re-
view most recent digital activity, trends, and information.
• Users will use Index as a general convenience application, to
use on the fly when use-cases arise.
• Users will use Index to have a broader understanding of how
their personal data is being used
Technical Elements of Index
• All user data private from Index
• Users to choose the which platforms to include in their Index
• Each user request to be encrypted/tokenized
• Encrypted request is sent to the cloud, tunneled through a
variety of serverless functions, depending on the request, and
platforms included
• Each function serves a different API endpoint (Google, FB)
• EC2 instances where the serveless functions live to be highly
secured
• No user data to be saved in the cloud (only sent as encrypted
requests)
• Load balancers to handle user load and payload
• Caching and preloading for faster responses
• Chatbot capabilities
• NoSQL database for flexibility with queries, scaling, and data
output
• Connectivity to local files (see image)
Marcie Van Auken | Columbia University | [email protected]
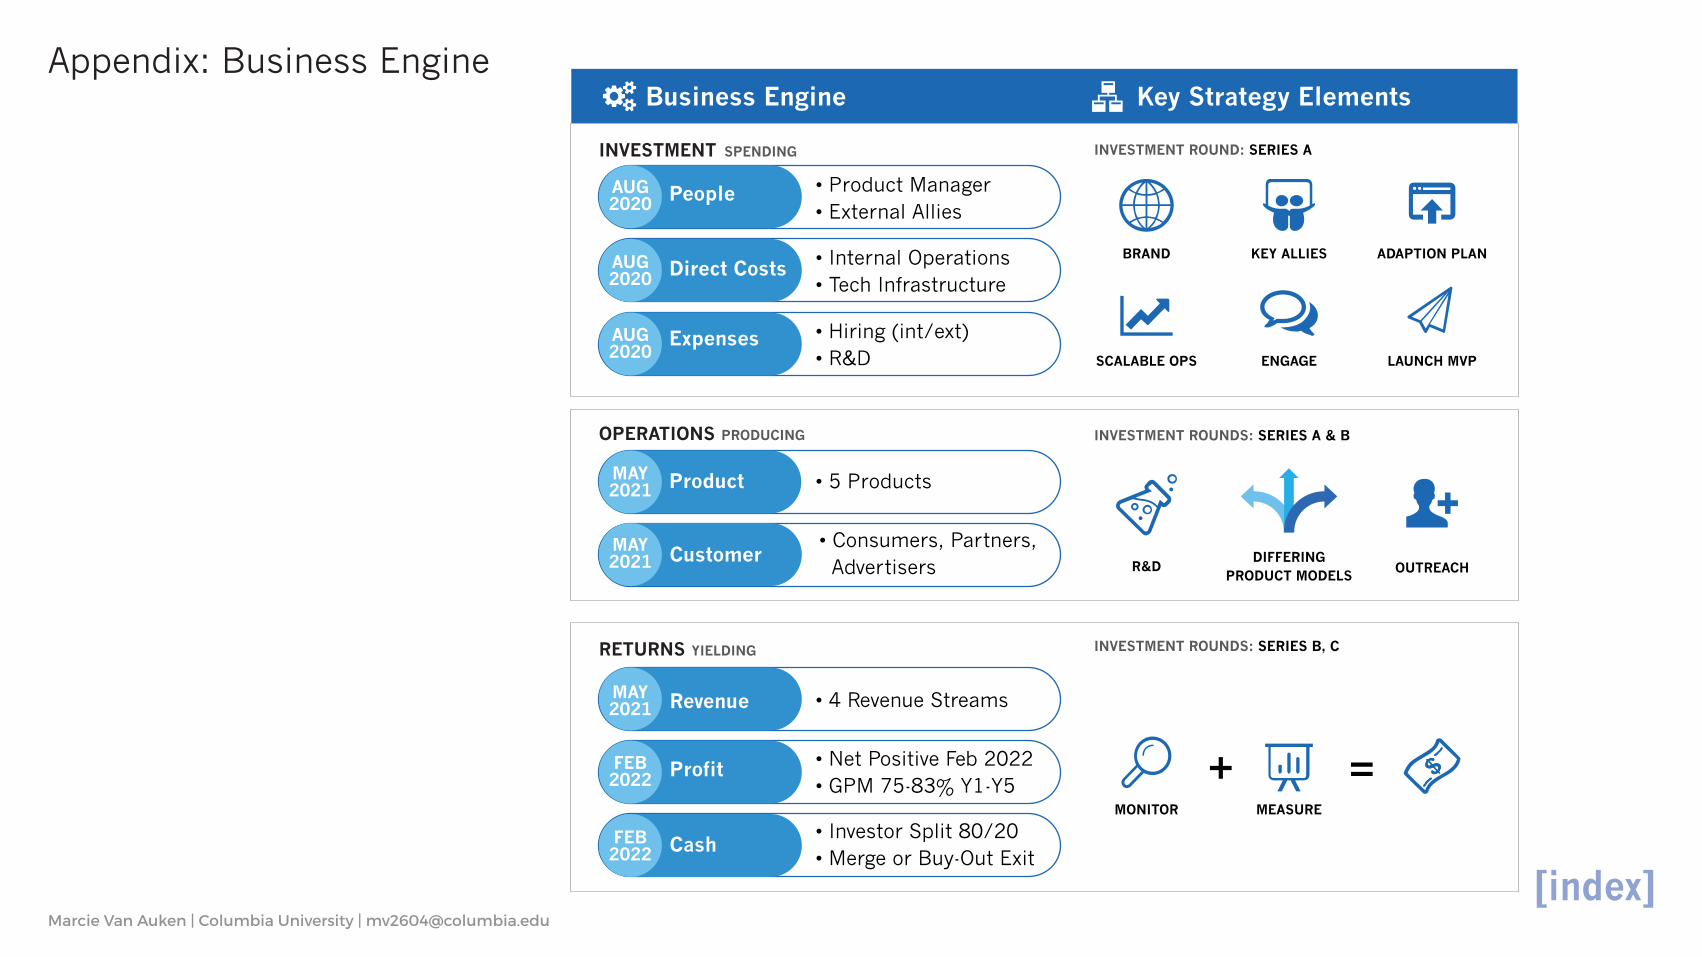
Appendix: Business EngineBusiness Engine Key Strategy Elements
INVESTMENT SPENDING
OPERATIONS PRODUCING
RETURNS YIELDING
Product
PeopleAUG2020
AUG2020
AUG2020
MAY2021
• Product Manager• External Allies
• Hiring (int/ext) • R&D
• Internal Operations• Tech Infrastructure
• 5 Products
• 4 Revenue Streams
• Net Positive Feb 2022• GPM 75-83% Y1-Y5
• Investor Split 80/20• Merge or Buy-Out Exit
Direct Costs
Expenses
Customer
Revenue
Profit
Cash
• Consumers, Partners, Advertisers
INVESTMENT ROUND: SERIES A
INVESTMENT ROUNDS: SERIES A & B
INVESTMENT ROUNDS: SERIES B, C
MAY2021
MAY2021
FEB2022
FEB2022
OUTREACH
ADAPTION PLAN
LAUNCH MVP
MEASURE
DIFFERING PRODUCT MODELS
KEY ALLIES
ENGAGE
BRAND
MONITOR
SCALABLE OPS
R&D
Related Documents