NEW WAYS USER MANUAL Business Objects XI (BOXI) Web Intelligence Guide Version 2.0 (Mar 2010)

Welcome message from author
This document is posted to help you gain knowledge. Please leave a comment to let me know what you think about it! Share it to your friends and learn new things together.
Transcript

NEW WAYS USER MANUAL
Business Objects XI (BOXI) Web Intelligence Guide
Version 2.0 (Mar 2010)

Prepared by: Stephen Bush – ISD Waiting Times Programme
Distributed:
Review Date:
Version Control
Version Date Change Author
1.0 20.05.09 - Stephen Bush
1.1 14.12.09 Updated sections / screenshots following
implementation of Refresh.
Stephen Bush
2.0 24.03.10 Updates to existing sections and inclusion
of new content – background information,
scheduling reports
Stephen Bush

Contents 1. Introduction.......................................................................................................... 1
1.1 Background to New Ways ............................................................................ 2
1.2 About Business Objects XI Web Intelligence (BOXI).................................... 3
1.2.1 What is BOXI?....................................................................................... 3
1.2.2 Core functionality .................................................................................. 5
1.3. Process for loading data to the warehouse and reporting on the results...... 7
1.3.1 Validation stage..................................................................................... 8
1.3.2 Load stage ............................................................................................ 9
1.3.3 Snapshot / Publication .......................................................................... 9
1.3.4 Other Resources ................................................................................. 10
2. New Ways on BOXI........................................................................................... 11
2.1 Logging in and out of BOXI ........................................................................ 11
2.2 Navigation in BOXI ..................................................................................... 13
2.2.1 My Folders .......................................................................................... 13
2.2.2 Public Folders ..................................................................................... 13
2.2.2.1 ‘Board User Reports’ folder.......................................................... 14
2.2.2.2 ‘Waiting Times’ folder................................................................... 15
2.2.3 Navigation summary ........................................................................... 17
3. Working with the existing reports......................................................................... 18
3.1 Refreshing the reports ............................................................................ 18
3.2 Filtering the results ................................................................................. 23
3.3 More detail using linked reports .............................................................. 25
3.4 Saving your results….............................................................................. 26
3.4.1 …as a Business Objects report............................................................ 27
3.4.2 …as Excel / CSV / PDF ....................................................................... 28
3.5 Printing your results ................................................................................ 29
3.6 Scheduling Reports ................................................................................ 29
3.6.1 Setting up a scheduled report.......................................................... 29
3.6.2 Emailing the results in Excel / PDF format ...................................... 34
3.6.3 Deleting an instance ........................................................................ 38
4. Modifying Reports ............................................................................................. 39
4.1 Adding objects to existing reports............................................................... 41
4.2 Adding objects as drill filters....................................................................... 42
4.3 Checking the results of your modifications ................................................. 44

4.4 Removing objects from existing reports ..................................................... 45
4.5 Saving your modified reports...................................................................... 46
4.6 Deleting reports .......................................................................................... 47
5. Editing the query behind a report ...................................................................... 49
5.1 The Query panel......................................................................................... 52
5.2 Adding Result Objects................................................................................ 53
5.3 Adding objects as filters/prompts in the query............................................ 55
6. Contact details................................................................................................... 59

1
1. Introduction This manual is aimed at new users of Business Objects XI Web Intelligence for New
Ways. The aim is to summarise the steps required to do the following:
• Logging in and out of Business Objects XI Web Intelligence
• Refresh reports and apply filters to the results
• Save reports to personal folders and/or users area
• Automate the running of reports
• Modify the ‘standard reports’ in order to personalise the results
This should provide users with a basis of knowledge that will allow them to begin to
explore the contents of the New Ways ‘universe’ in Business Objects XI, the
information available through running the existing reports and start to think about the
type of reports that would be useful to them in their own area of work.
The following rules will apply in the use of this manual:
(i) Business Objects XI Web Intelligence will be referred to as ‘BOXI’ from this
point onwards.
(ii) This manual should not be considered as a comprehensive step-by-step guide
to the use of BOXI as an application however we will cover many of the
important points with regard to running and modifying a New Ways report
using one of the ‘Standard Reports’ as an example throughout. It is hoped
that you will take what you learn in the following pages and apply this
knowledge to working with the other reports that are available.
(iii) The manual hopefully explains the key points in a manner that is easy for you
to understand however, should this not be the case, further support will be
available to you from ISD by using the contact details which you will find at the
end of the manual.
2
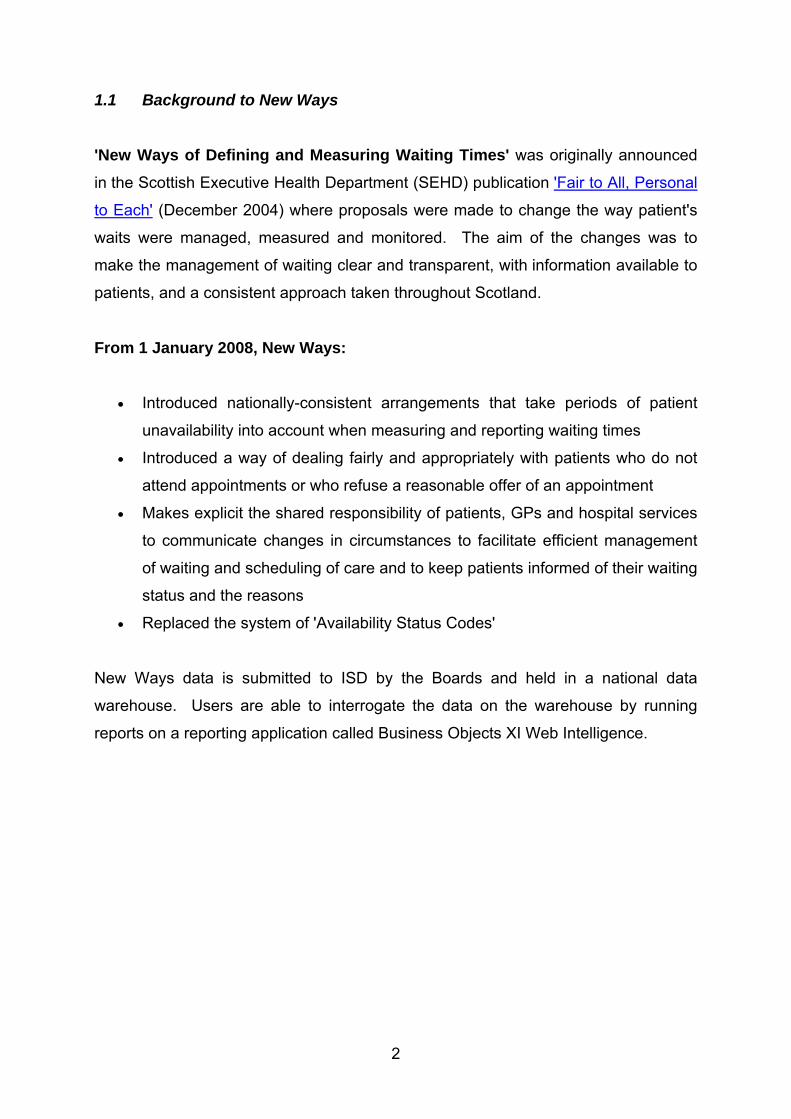
1.1 Background to New Ways
'New Ways of Defining and Measuring Waiting Times' was originally announced
in the Scottish Executive Health Department (SEHD) publication 'Fair to All, Personal
to Each' (December 2004) where proposals were made to change the way patient's
waits were managed, measured and monitored. The aim of the changes was to
make the management of waiting clear and transparent, with information available to
patients, and a consistent approach taken throughout Scotland.
From 1 January 2008, New Ways:
• Introduced nationally-consistent arrangements that take periods of patient
unavailability into account when measuring and reporting waiting times
• Introduced a way of dealing fairly and appropriately with patients who do not
attend appointments or who refuse a reasonable offer of an appointment
• Makes explicit the shared responsibility of patients, GPs and hospital services
to communicate changes in circumstances to facilitate efficient management
of waiting and scheduling of care and to keep patients informed of their waiting
status and the reasons
• Replaced the system of 'Availability Status Codes'
New Ways data is submitted to ISD by the Boards and held in a national data
warehouse. Users are able to interrogate the data on the warehouse by running
reports on a reporting application called Business Objects XI Web Intelligence.

3
1.2 About Business Objects XI Web Intelligence (BOXI)
1.2.1 What is BOXI?
BOXI is an internet browser based tool which provides an interactive and flexible
user interface for building and analysing reports on data which is held on the New
Ways Data Mart in the National Data Warehouse.
There are a number of common terms in use when talking about BOXI:
1. Universe A universe is a semantic layer which is placed between the user and the data mart.
The universe maps to the data items in a data mart but presents the data using
everyday terms. Universes are made up of a series of Objects and Classes
2. Objects
These are named components of the universe that map directly to data (or derived
data) in the data mart. Objects are used in the query to retrieve data for the report.
There are two main types of object in use for New Ways and these are as follows
(with symbols):
Dimensions
Retrieve data that will provide the basis for the report. Usually character type
data e.g. names, dates, codes etc.
Measures
Retrieve numeric data that is the result of calculations on data held in the data
warehouse.
Other common items that can be found in the universe alongside the various
Dimension and Measure objects are:

Predefined filters.
Created by the universe designer in order to capture the most common (often
complex) set of restrictions that are used when querying the data (e.g. waiting
target case) and such filters are made available in the universe so that the user
does not have to recreate the filters in every report.
3. Classes
These are a logical grouping of related objects / measures / filters. Each class can
also contain one or more sub-classes.
The screenshot below shows some of the Classes (with sub-classes) and Objects
currently in use within the New Ways universe:
Figure 1 – Classes and Objects in the New Ways universe
Dimensions
Measures
Classes and
sub-classes
Predefined
filters
Classes and Objects will be covered in greater detail in the third module which deals
with modifying BOXI reports.
4
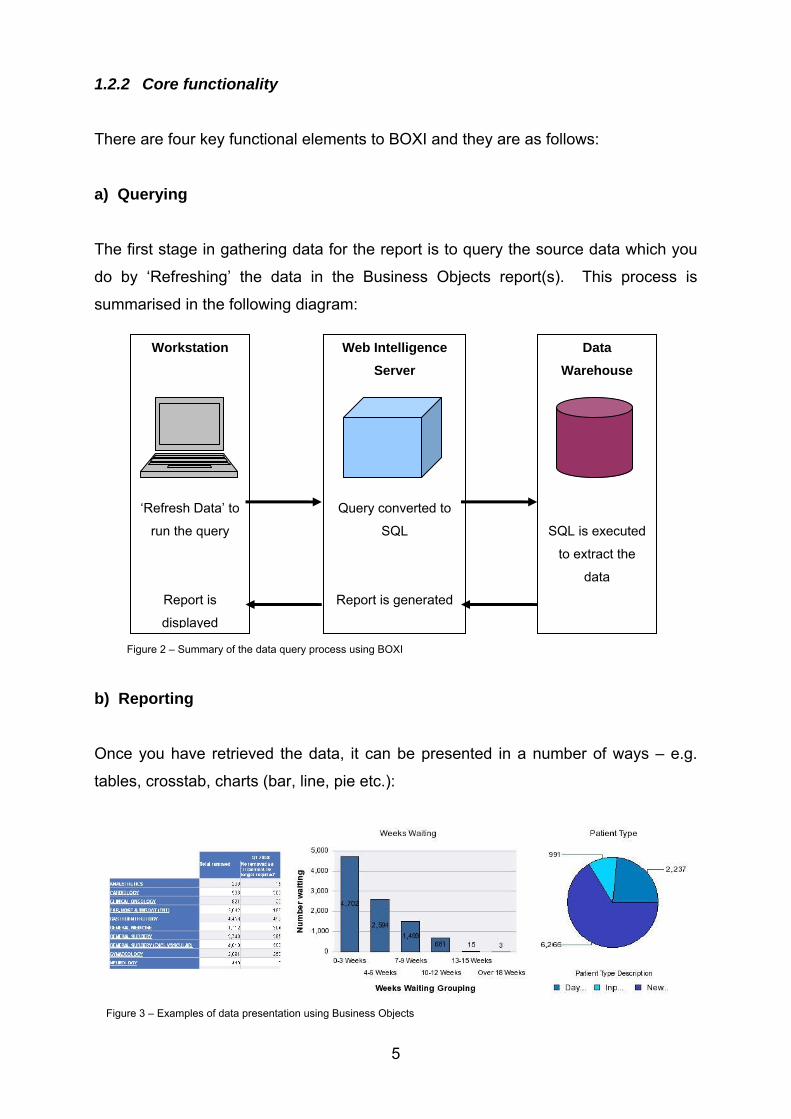
1.2.2 Core functionality
There are four key functional elements to BOXI and they are as follows:
a) Querying
The first stage in gathering data for the report is to query the source data which you
do by ‘Refreshing’ the data in the Business Objects report(s). This process is
summarised in the following diagram:
Workstation
‘Refresh Data’ to
run the query
Report is
displayed
Web Intelligence Server
Query converted to
SQL
Report is generated
Data Warehouse
SQL is executed
to extract the
data
Figure 2 – Summary of the data query process using BOXI
b) Reporting
Once you have retrieved the data, it can be presented in a number of ways – e.g.
tables, crosstab, charts (bar, line, pie etc.):
Figure 3 – Examples of data presentation using Business Objects
5

c) Analysing
Data can be analysed at different levels (e.g. aggregated figures, lists, individual
records etc.) depending upon the needs of the user. It is also possible to link reports
so that you can ‘drill down’ to more detailed information (e.g. from an aggregated
number to individual cases etc.)
Figure 4 – ‘Drilling down’ for more detailed information
d) Sharing
BOXI gives the user the ability to share reports with other users in their Board (and
also ISD users should there be a need for this). Sharing reports can be done within
BOXI itself or, alternatively, the output of the reports can be saved as Excel or PDF
documents so that the results can be shared with non-BOXI users. It is even
possible for BOXI to be set to run reports automatically and for the results to be sent
out to users by email.
6

1.3. Process for loading data to the warehouse and reporting on the results
Before we begin to look at BOXI in more detail it may be helpful to learn about the
process of how the waiting times data extract from your hospital PAS/HISS reaches
the data warehouse and where BOXI fits in to the process. The validation / load
process is summarised in the diagram below:
Figure 5 – Summary of the validation and load process for New Ways
The solid line running from SWIFT to the New Ways Data Mart represents the
passage of data from the hospital PAS / HISS through validation and into the data
warehouse. The dotted lines in the middle of the diagram represent the passage of
the automated emails that are sent out by the system at key stages to selected
recipients. The dashed lines running towards Business Objects represent the access
to the data once it has been loaded.
As can be seen from the diagram, there are two key stages involved in loading a
New Ways extract once it has been submitted – validation and load – and we will
take a closer look at each stage as this has a bearing on the point that you can run
certain reports in BOXI.
7

1.3.1 Validation stage
Once a file has been validated, an automated validation email is sent out to specified
users with a summary of the results (number / type / severity of errors etc.) and the
user is invited to run the error reports in BOXI. Note that the validated data has not yet been loaded to the warehouse at this stage, only details of the errors.
The validation has two main error types - Schema Errors and Data Errors. Schema
Errors indicate a fundamental flaw with the extract (e.g. file format, record type etc.)
which will probably require input from your IT dept. / PAS supplier in order for the
problem to be resolved. Data errors are caused by incorrect recording of data items
(e.g. offer dates, specialty, etc). You will be more likely to be dealing with Data
Errors as these are far more common.
Each individual error is assigned a ‘flag’ to indicate an appropriate level of error
severity. The diagram below outlines the different flag types in use for Data Errors:
Figure 6 –Data error flags
8

9
Note that a record can have more than one error as each record in an extract will be
checked against the full set of validation rules – i.e. if an error is found on a record
the validation continues to check the record against the remaining rules in order to
highlight any further errors before moving on to check the next record.
The flag that is applied to a record is a reflection of the most serious error which is
attached to the record (e.g. a record with a flag 3 error as well as a flag 1 error will be
assigned a flag 3 overall as this is a more serious error as it affects the calculation of
a waiting time for the record).
1.3.2 Load stage
A separate automated email is sent to Board contacts and ISD to confirm the load.
Once this has been received, users are able to run the Standard Reports in BOXI to
check the effects of their updated file on their figures.
1.3.3 Snapshot / Publication
Waiting times figures for NHS Boards in Scotland are published nationally every
quarter and the figures are based on a ‘snapshot’ of the New Ways data which is
taken from the national data warehouse around one month prior to the publication.
The snapshot provides a fixed position on which the figures can be analysed by ISD,
checked by Boards and then published. The ‘snapshot’ data is held in a separate
area from the ‘current’ data in the warehouse meaning that the Boards can continue
to submit updates to the warehouse without affecting the figures that are to be
published.
The figures that are published are based on Flag 0 + 1 data and therefore ISD advise
that any analysis that is carried out for management purposes should also be
restricted to flags 0 + 1. Flag 2 data should only be used (in combination with flags 0
and 1) when carrying out high level analysis of waiting times (e.g. number of patients
waiting over 12 weeks). Flag 3 data should only be used (in combination with flags
0, 1 and 2) when analysing activity at the most general level (e.g. number of patients
added to the list) where a waiting time calculation is not required.
10
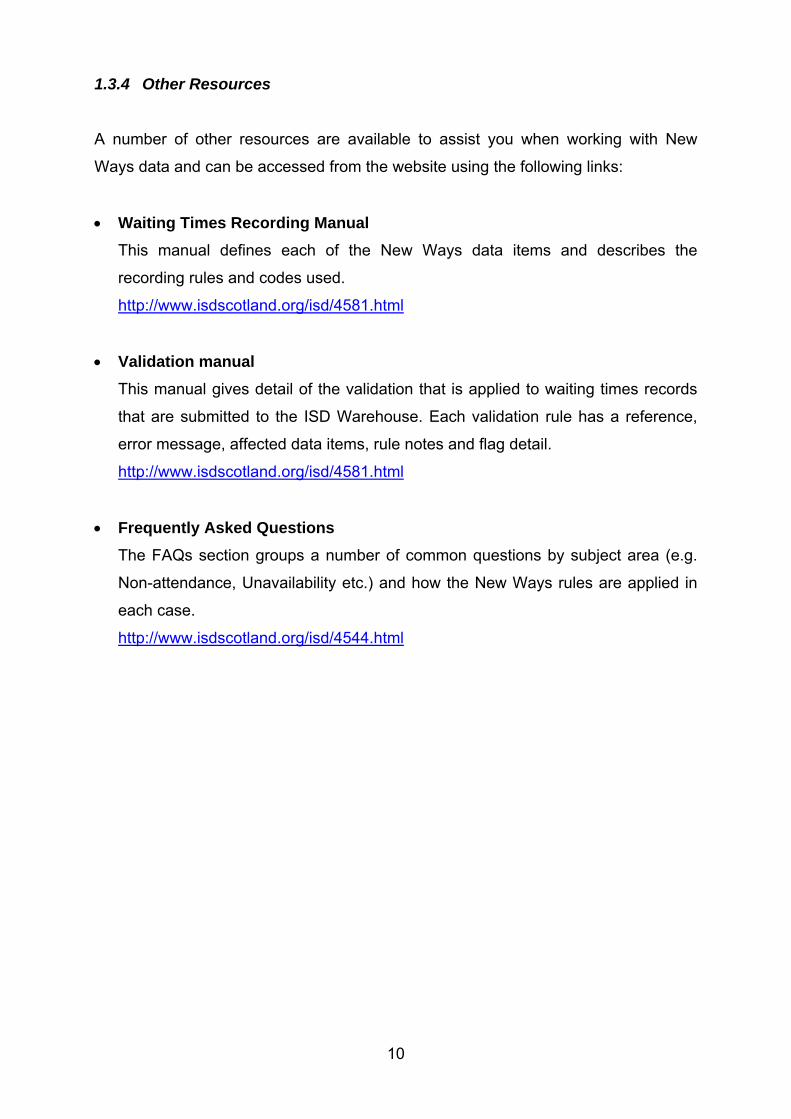
1.3.4 Other Resources
A number of other resources are available to assist you when working with New
Ways data and can be accessed from the website using the following links:
• Waiting Times Recording Manual This manual defines each of the New Ways data items and describes the
recording rules and codes used.
http://www.isdscotland.org/isd/4581.html
• Validation manual This manual gives detail of the validation that is applied to waiting times records
that are submitted to the ISD Warehouse. Each validation rule has a reference,
error message, affected data items, rule notes and flag detail.
http://www.isdscotland.org/isd/4581.html
• Frequently Asked Questions The FAQs section groups a number of common questions by subject area (e.g.
Non-attendance, Unavailability etc.) and how the New Ways rules are applied in
each case.
http://www.isdscotland.org/isd/4544.html

2. New Ways on BOXI
BOXI can be accessed by ISD and NHS Board users for refreshing and editing
standard reports and creating their own reports. The web address for access is as
follows:
https://www.bic.scot.nhs.uk/
2.1 Logging in and out of BOXI
Having followed the above link, clicking on ‘Login’ will show the following screen (it
would be a good idea to save a link to this screen as a favourite / bookmark in your
browser or on your desktop if you are going to be using BOXI on a regular basis):
Figure 7 – Log on for the Production version of BOXI.
When logging in for the first time you should ensure that ‘LDAP’ is selected from the
available list for Authentication before entering your username and password and
clicking Log On. Once logged in, you will see the following screen which is
effectively the ‘homepage’ for BOXI:
11
12
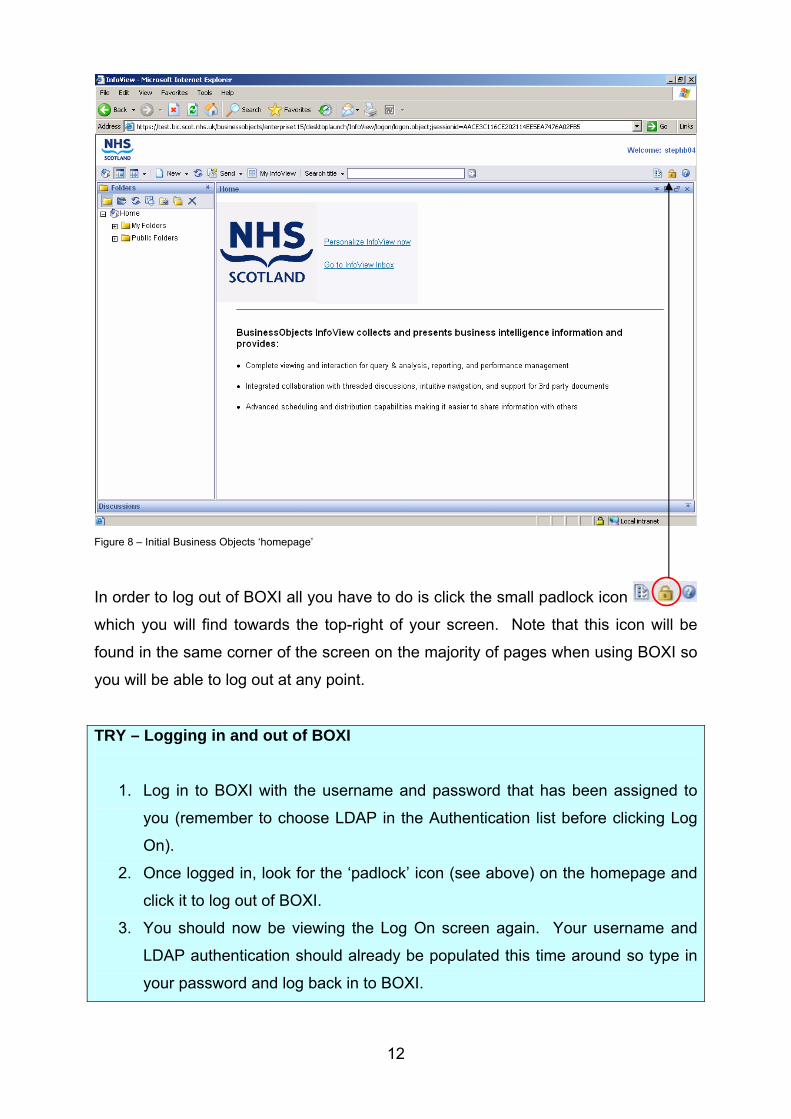
Figure 8 – Initial Business Objects ‘homepage’
In order to log out of BOXI all you have to do is click the small padlock icon
which you will find towards the top-right of your screen. Note that this icon will be
found in the same corner of the screen on the majority of pages when using BOXI so
you will be able to log out at any point.
TRY – Logging in and out of BOXI
1. Log in to BOXI with the username and password that has been assigned to
you (remember to choose LDAP in the Authentication list before clicking Log
On).
2. Once logged in, look for the ‘padlock’ icon (see above) on the homepage and
click it to log out of BOXI.
3. You should now be viewing the Log On screen again. Your username and
LDAP authentication should already be populated this time around so type in
your password and log back in to BOXI.

2.2 Navigation in BOXI
Having logged in to BOXI you will notice that the ‘homepage’ is split into two parts.
On the left-hand side is a list of folders and on the right-hand side is the welcome
screen. First time users should see an identical screen to that shown in Figure 8
though other users may have a slightly different view if you have previously used
BOXI for working on other applications (e.g. A&E data, HEAT, System Watch etc.).
However, for the majority of users, the initial folder list on the left should be the same,
giving you a choice of two folders – ‘My Folders’ and ‘Public Folders’. This folder list
is the main method of navigation in BOXI and this section will provide a brief
summary on how you can find your way around by using this list.
2.2.1 My Folders
As you might expect from the name, ‘My Folders’ is a personal area that can only be
accessed by the user. Clicking on the + symbol beside will reveal two sub-folders –
‘Favorites’ and ‘Inbox’ – as in the diagram below:
Figure 9 – Navigating ‘My Folders’
The ‘Favorites’ folder is where a user can save copies (or results) of reports that they
may be working on (running and saving reports will be covered in a later section).
The Inbox folder also has a use – BOXI effectively has an ‘internal email system’
between users – but this will not be covered in this manual.
2.2.2 Public Folders
‘Public folders’ contain areas that are common to all Board users and also areas
which are common to all BOXI users.
13
Clicking on the + symbol beside ‘Public Folders’ and then continuing to navigate
through the folder ‘tree’ by clicking the + symbol beside ‘Scotland’ and then ‘NHS’ will
reveal two sub-folders – one with the name of your Board and the other called
‘Waiting Times’. Note that each Board will have their own folder at this stage which
can only be viewed by their own users.
2.2.2.1 ‘Board User Reports’ folder
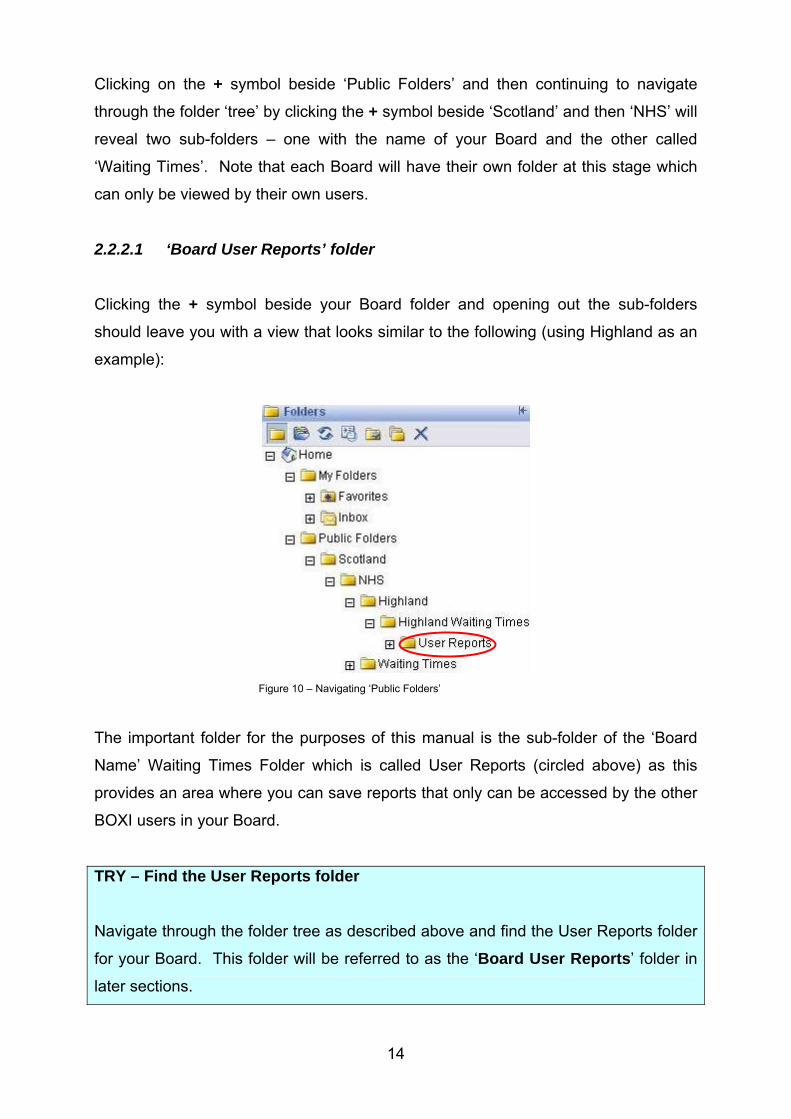
Clicking the + symbol beside your Board folder and opening out the sub-folders
should leave you with a view that looks similar to the following (using Highland as an
example):
Figure 10 – Navigating ‘Public Folders’
The important folder for the purposes of this manual is the sub-folder of the ‘Board
Name’ Waiting Times Folder which is called User Reports (circled above) as this
provides an area where you can save reports that only can be accessed by the other
BOXI users in your Board.
TRY – Find the User Reports folder Navigate through the folder tree as described above and find the User Reports folder
for your Board. This folder will be referred to as the ‘Board User Reports’ folder in
later sections.
14

15
2.2.2.2 ‘Waiting Times’ folder
The ‘Waiting Times’ folder is where the centrally designed reports that are common
to all users of the New Ways BO Universe – regardless of their Board – are to be
found. Note that Board users will only be able to see the data from their own Board
when using these reports.
Clicking the + symbol beside ‘Waiting Times’ will reveal four sub folders – ‘Error
Reporting’, ‘Snapshot Reports’, ‘Standard Reports’ and ‘Viewing Gallery’.
• Error Reporting – Contains the central error reports that allow a user to look at a
summary breakdown or detailed list of errors once a file has been validated.
• Snapshot Reports – The reports in this folder will return figures that are based
on the most recent ‘snapshot’ of data and will not take into account any changes
made by submissions between snapshot dates.
For example, let’s say that a snapshot of data was taken on 28th January and the
next snapshot was not due until 28th April. A file submitted and loaded to the
warehouse on 15th February would have no effect on the figures produced by the
reports in this folder as the data it looks at is fixed until the next snapshot date –
28th April in this example – and will not be updated before then. If a user wanted
to see what effect the new submission had on their Board’s figures they would
have to run the equivalent reports in the Standard Reports folder.
• Standard Reports – The reports in this folder will return figures that are based on
the most recently loaded files to the warehouse so will change depending upon
the frequency of submissions.
In the example given above, the figures produced by the reports in this folder
would update once the file submitted on 15th February had been loaded to the
warehouse. This is an important difference between the reports in the two
folders and users should be aware of this as there are reports that are common to
both folders e.g. Full Patient Waiting List.

• Viewing Gallery – This folder acts as a ‘showcase’ for modified reports that may
be examples of best practice or could provide a model that other Boards may
wish to adopt depending on their own reporting needs. All Board users can view
and run the reports in this folder.
TRY – Check out the central reports Click on the folder names to view the contents of each of the ‘Waiting Times’ sub
folders. Look through the list in each sub folder and read the names and descriptions
in order to familiarise yourself with the reports.
The eagle-eyed amongst you may also have spotted that Error Reporting, Snapshot
Reports and Standard Reports all have a further sub folder with the words ‘…Drill
Down…’ in the title. Note that the reports in these folders are components of several
of the reports in the main folders and should not be used on their own.
16
TIP: You can personalise your BOXI homepage in a number of ways. One way is to
set preferences so that you do not have to navigate the ‘folder tree’ every time you
log on but instead be directed straight to the reports that you will use the most often
(whether that be in ‘Standard Reports’, ‘Error Reporting’ or even your Board User
Reports folder – this will become clearer as you start to work with BOXI).
To do this click on the preferences icon , which you can find near the top
right of the browser window, and select Yes if you are prompted for a response.
On the following screen you will see a list of options under the heading My initial view is… Choose ‘the folder:’ and then click the Browse… button.
Select the folder from the list which contains the reports that you wish to see first
when you log in to BOXI and then click OK. This will take you back to the main
preferences screen.
Scroll down to the bottom of the preferences page and click OK. This will set your
preferences so that in future you will be directed to your chosen folder when you next
log on to BOXI.

2.2.3 Navigation summary
Section 2.2 has covered the steps required to navigate your way around the folder
structure in BOXI. In doing so it was mentioned that there are three distinct areas
which offer different levels of access to particular groups of users and these are
summarised in the diagram below:
Folders containing reports that are only accessible
by the individual user
Folders containing reports that are accessible by all
BOXI New Ways users.
Board users can only see their own data when using
these reports; ISD users can see data for all Boards.
Folders containing reports that are only accessible
by Board users (each Board will have their own set
of folder(s) which only they can see)
Figure 11 – Navigating BOXI – highlighting key areas
These three areas all have a part to play in the following section so please ensure
that you are comfortable with the differences between them before moving on to the
next section.
17

3. Working with the existing reports
This section will demonstrate how to refresh the existing central reports and refine
the results using the ‘drill filters’ that are provided. We will use the example of the
‘Full Patient Waiting List’ report from the ‘Standard Reports’ folder throughout the
following sections as many of the steps that we will cover are common to all reports.
This particular report is designed to return information on all patients that are on a
waiting list (i.e. still waiting) at a given time
Figure 12 – Contents of the Standard Reports folder
18
3.1 Refreshing the reports
To open the Full Patient Waiting List report, you need to click on the report name in
the list of Standard Reports. Once open, you will see the following screen:

Figure 13 – Initial screen in Full Patient Waiting List report
TIP: Depending upon the resolution of your monitor you may notice that that the
table is too big for your screen. If you have this problem you can maximise the
results screen by hiding the folder list. To do this click the ‘Toggle Navigation’ icon
which you will find near the top left of the browser window. To bring the
folder list back into view simply click the icon again.
Note that most screenshots in the remaining sections of this guide will have the folder
list hidden from view.
You will notice that you are initially met with an empty screen or a blank table outline
with no results. This is a feature when opening all the Standard reports in BOXI.
Another area to note is the series of what looks like drop-down lists above the main
results screen. These are the ‘drill filters’ that were mentioned earlier and will allow
the user to drill down to more specific cohorts / groups of data depending upon what
options are chosen. At the moment you will see that the default for each drill filter is
set to ‘(No value)’. Again, this is because the report does not contain any data.
19

In order to populate the table and activate the drill filters, the report must be
‘refreshed’ with new data. To begin this process you need to click the
icon towards the top right of the browser window (circled in Figure 14 below).
In the case of this report you are prompted to enter information on ‘Report Date’,
‘Patient Type Description’ and ‘Health Board’:
Figure 14 – prompt screen - users must enter information before proceeding
Note that all central reports are generally set up to prompt for information (e.g. dates,
patient type etc.) prior to running the query. For some of the reports you will notice
that the ‘prompt fields’ are already populated – this will be the last set of criteria used
by the report designer prior to its release as a ‘Standard Report’. You should just
ignore what is there as you will be entering your own details as follows:
In this report the first prompt is for a ‘Report Date’ so that the report can return the list
of patients still waiting on the list at the time of the chosen date (e.g. 31/12/2009).
The date can either be typed directly into the text box provided or by clicking the
20

calendar icon to the right of the text box, navigating your way through the
month/years and clicking on your chosen date.
The next item of information that is requested is the ‘Patient Type Description’. Here
you are presented with the following options:
Figure 15 – Options available when prompted for Patient Type Description
The list on the left shows the options available to you and the list on the right shows
the options that have been chosen to be part of the query.
TIP: Note that the above set up – available options on the left, chosen options on the
right – will also be the case for most non-date prompts in other reports – it is not just
specific to Patient Type.
It is also worth noting the search box at the bottom left of prompt screen (marked by
the ‘binoculars icon). It has no real purpose in this instance as the left hand list only
contains seven options but in other reports you could be faced with a long list of
options here (e.g. the Waiting Times Error Report where you are prompted for a
filename). You can use this search facility to home in on the particular file ID or
location code (part of the filename) to help you find the one that you are interested in.
When you are working with other reports you may find that the list on the left may
occasionally be empty when prompted for information. If you come across this then
simply click the icon above the left-hand list and this should populate
the list with the appropriate information. If that doesn’t work then call ISD!!
21

As you will see, the default in this report is that all available patient types will be part
of the query. However we are only interested in Day case, Inpatient and New
outpatient so the other options need to be removed.
In order to do this select each of the unwanted patient types in the right-hand list by
clicking on them with your left mouse button and then click the arrow symbol
between the two lists to remove them. If, in another report, you were adding items to
the query then the reverse would be true – you would choose the item(s) on the left-
hand list and use the opposite arrow symbol to add them to the right-hand list.
Finally you are prompted to select the name of your Health Board from the list.
Once all the prompts have been updated the next step is to click . You will
see the following window showing up:
Figure 16 – Time bar shown when refreshing a report
Note that when you run a report for the first time, the ‘Last refresh time’ shown is
rarely an accurate guide to how long it will take for results to be shown so it is best to
just let the query run its course. If you run the report again then the ‘Last Refresh
time’ will have updated and should be a more accurate guide if you choose to refresh
the report for a second time.
When the ‘Refresh’ process is complete the results will be displayed as follows:
22
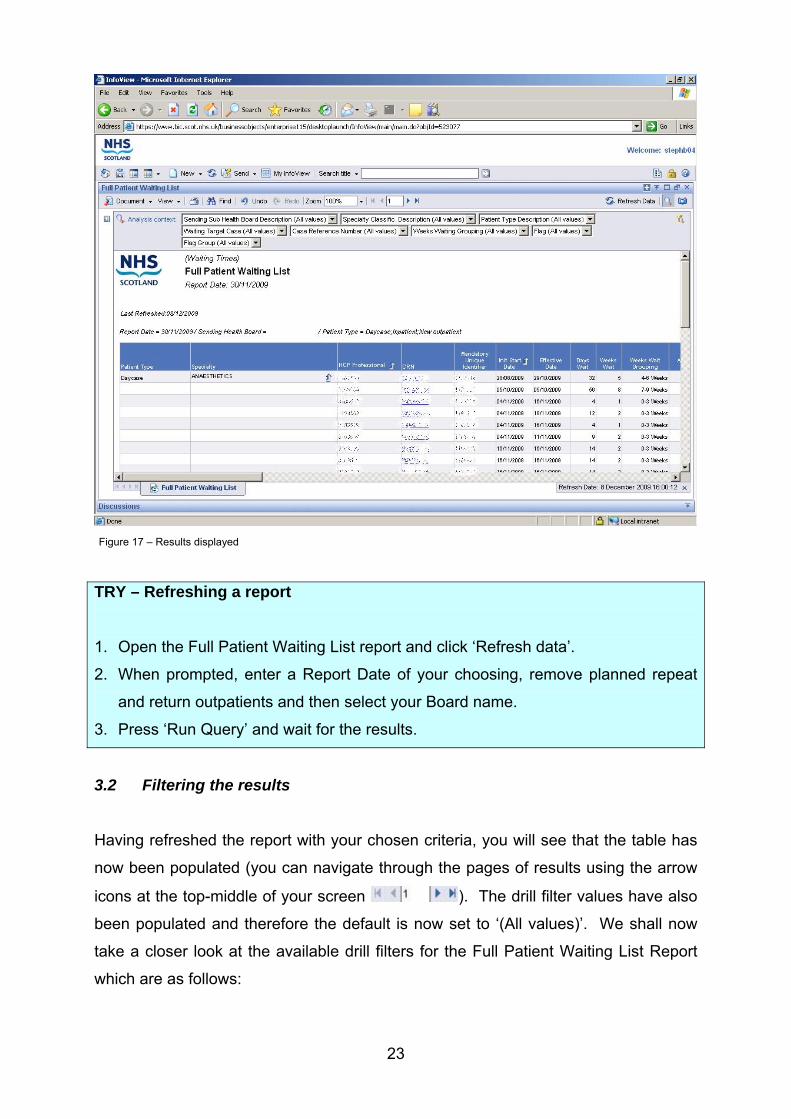
Figure 17 – Results displayed
TRY – Refreshing a report
1. Open the Full Patient Waiting List report and click ‘Refresh data’.
2. When prompted, enter a Report Date of your choosing, remove planned repeat
and return outpatients and then select your Board name.
3. Press ‘Run Query’ and wait for the results.
3.2 Filtering the results
Having refreshed the report with your chosen criteria, you will see that the table has
now been populated (you can navigate through the pages of results using the arrow
icons at the top-middle of your screen ). The drill filter values have also
been populated and therefore the default is now set to ‘(All values)’. We shall now
take a closer look at the available drill filters for the Full Patient Waiting List Report
which are as follows:
23

24
Sending Sub Health Board Description An option that will only be of use to NHS Greater
Glasgow & Clyde and NHS Highland as it allows
those Boards to split out the component parts of
the Board that resulted from the merger of sites
when NHS Argyll & Clyde was split up (e.g. NHS
Highland can view their figures in two parts - the
previous Highland configuration (pre-2006) and
‘Argyll & Bute’ – as well as viewing their
combined figures).
Specialty Classific. Description A list of the specialties that are in the results.
Choosing one from the list will allow the user to
look at the waiting list for a particular specialty
Patient Type Description A list of the patient types in the results. Note that
this filter will essentially be redundant if the user
has only selected one patient type when
prompted for this information on refreshing the
report..
Waiting Target Case
This is a filter that is found on many of the central
reports and the options presented here are All values, Y and N. Choosing Y allows the user to
strip out only those cases that are covered by the
general waiting times standard (not the same as
the separate cataract or cardiac whole journey
targets). N will show only those cases that are
not covered by the guarantee.
Case Reference Number A list of all the CRNs that are included in the
results. A user can use this filter to isolate a
particular case if they know the CRN beforehand.
Weeks Waiting Grouping Allows you to look at the results in different 3
week ‘time bands’ – 0-3 weeks (inclusive), 4-6
weeks,…, through to Over 18 weeks.
Flag A marker that is assigned to a record in order to
indicate whether it is in error and also the level of
severity of the error (see section 1.3.1). User can
choose between flag 0 or 1 or 2 (or 3 where this
is appropriate).
Flag Group Allows the user to view the figures by grouping
flags 0+ 1 together (i.e. ‘publishable’ figures)

25
Now that the report has been refreshed, you will find that if you select any of these
drill filters you now have a list of options to choose from. Changing any of the filters
will update the data in the table to reflect the new criteria.
TRY – Working with drill filters
1. Select the following options using the appropriate drill filters:
Specialty: Trauma & Orthopaedic Surgery
Patient Type: New outpatient
Waiting Target Case: Y
Flag Group: 0&1
This will return a list of patients that are/were still on the waiting list at your chosen
Report Date for a first outpatient appointment with a Trauma & Orthopaedic
Surgery consultant, are subject to the current waiting times standard and where
the records do not contain an error which will prevent them from being included in
the Board’s publishable figures.
2. Explore other combinations using the drill filters. Are you getting the results that
you expect to see?
3.3 More detail using linked reports
You may have noticed that when you ran the Full Patient Waiting List report, part of
the results are in blue and underlined – similar to the appearance of a web link. This
allows the user to link to a report which shows more detail directly from the initial
results. This functionality was briefly described earlier in section 1.2.2 (see figure 4).
Sticking with the Full Patient Waiting List report to illustrate this point, you will notice
that (once refreshed) the CRN in each of the records in the results is shown as a link.
If you click the CRN then a new window will open and every item of information (as
on the warehouse) for that particular record will be displayed. This ‘drill-down’ facility
removes the need for the user to run a separate report should they require more
detailed information on any particular case(s).

As you explore the various reports in the New Ways Business Objects environment
you will notice that several of them have ‘drill-down’ links such as this. It is a good
idea for the user to familiarise themselves with each of the centralised reports (in the
Error, Snapshot and Standard Report folders) and the level of information that is
shown when a drill-down link has been activated.
3.4 Saving your results…
Once the report has been refreshed or amended (e.g. by using the available filters)
the results can now be saved either within Business Objects or, perhaps more
commonly, saved to your PC as an Excel workbook, a CSV file or as a PDF file.
Click the ‘Document’ icon will reveal the list of saving options available to you:
26
Figure 18 – Options for saving results

3.4.1 …as a Business Objects report
To save the results in the format of a Business Objects report choose ‘Save as’ from
the options under ‘Document’ – this will take you to another screen. From here you
can change the name (and description) of the report by typing directly into the text
boxes and also choose the location you want to save the report to, by clicking on the
+ or – symbols beside the folders in the list:
Figure 19 – The ‘Save Document’ screen
Note that users are unable to save their reports to any of the Waiting Times sub
folders – Error Reporting, Snapshot Reports, Standard Reports and Viewing Gallery
– as only administrators have the rights to do this. You can however save your
reports in your Board User Reports folder or in your own personal Favorites folder.
Once you are happy with your settings click OK to save (you may need to scroll to
the bottom of the browser window to find this).
TRY – Save the results as a BOXI report to your Favorites folder
27

3.4.2 …as Excel / CSV / PDF
To save the results of a report to your computer in another format (using Excel as an
example) click on Document / Save to my computer as and select Excel from the list
that appears (options as in Figure 18 earlier). A dialog box will then appear (as in
figure 20 below) giving you the option of opening direct to Excel or saving as an
Excel file to your chosen destination (e.g. your desktop or a network drive). If you
have chosen the Excel option by mistake you can also select Cancel at this point.
Figure 20 – Prompt for destination when saving a report
The same method also applies when saving the results as a CSV or a PDF file.
TRY – Save the results to your desktop in Excel format
28

3.5 Printing your results
If you are planning to print out the results of a report then you will find that you are
unable to do this directly from BOXI. Instead you will have to save the results in
either Excel or PDF form by following the steps outlined in the previous section and
then print the results from there.
3.6 Scheduling Reports
Scheduling a report allows you to run a report in the background while you carry on
doing other work. You can even schedule reports to run outside of office hours e.g.
evening / late night / early morning. This is particularly useful when you have large or
complex queries which may take a long time to run.
3.6.1 Setting up a scheduled report
To begin setting up a report for scheduled running you first of all need to locate the
appropriate link. This is found underneath the report name on the list of reports:
29
Figure 21 – Schedule report link

The ‘Schedule’ link is found alongside three other links under the report name. We
will take a closer look at ‘History’ later as it also has a part to play when scheduling
reports. ‘Modify’ and ‘Properties’ will be covered in the next section.
Clicking the ‘Schedule’ link for the Full Patient Waiting List report will reveal the
Schedule screen with the following options:
• When
• Destination
• Format
• Caching Options
• Server Group
• Events
• Prompts
Caching Options, Server Group and Events will not be used but clicking the + symbol
beside the other four options should result in the following screen:
Figure 22 – Options for scheduling a report
30

31
The first setting is for the user to specify When to run the report. The default value is
‘Now’ but clicking the arrow icon will display a list of all available options (e.g. ‘Daily’,
‘Weekly’, ‘Nth day of the Month’ etc.). This gives the user a great deal of flexibility
when setting up a scheduled report and the chosen option will depend on the type of
report and how often the data is updated.
The next setting is Destination (i.e. where does the user want to send the results?).
The options available here are:
• Default Enterprise location – this is effectively where the report sits at the moment
(‘Standard Reports’ in the case of the Full Patient Waiting List report).
• Inbox – located in My Folders (see section 2.2.1). Will send a copy of the results
to the BOXI Inbox of your chosen recipients (you would need to know their
username to be able to do this)
• Email recipients – will deliver the results externally to email addresses which are
set by the user.
Note that if the user wants to maintain the BOXI functionality (e.g. prompts, drill filters
etc.) then you must keep the default option. If the user prefers working with fixed
data or simply viewing tables/charts in another format then you can choose to email
the results.
The next setting is Format. The options available here are:
• Web Intelligence (i.e. keeping the results in the same format as the report)
• Microsoft Excel
• Adobe Acrobat (i.e. PDF).
However, as highlighted earlier, the drill filter functionality will not be carried over if
you choose to save the results in either Excel or PDF format so, although you are
able to view the results in Excel/PDF formats from within the BOXI interface, you will
not be able to drill down into the resulting data any further.
Finally the user has to set the Prompts for the report. Clicking the ‘Modify values’
button will reveal the prompt screen which should be familiar to users as it is almost

identical to what is presented when the ‘Refresh Data’ button is clicked when running
a report normally. Once the required details have been entered the user must click
the ‘Apply’ button to return to the Schedule screen
For the purposes of demonstrating the Schedule facility in the following pages we will
retain the default options for When (Now), Destination (Default Enterprise location)
and Format (Web Intelligence). Once happy with the Prompt options that have been
chosen, clicking the Schedule button will create an ‘instance’ of the query and display
the details on the History page:
Figure 23 – History page – list of scheduled reports
An instance is a version of the report containing the data that was available at the
time the report was run. As you will see from the History page, the details that are
presented for each instance are
• Instance time – when the instance was created
• Title – the name of the report which has been scheduled
• Run By – the username of the person who created the instance
• Parameters – contains the details entered by the user when setting the Prompts
• Format – the chosen format for the results (Web Intelligence / Excel / Adobe)
• Status – see below
• Reschedule – allows the user to create another instance of the report without re-
entering much of the detail
32

The Status field can contain a number of options depending upon the stage of
running the report:
• Pending – i.e. waiting to run
• Running – currently running
• Success – report has run successfully
• Failed – report has not run successfully.
When you first view the instance on the History page the Status is likely to be set at
‘Pending’ (as in Figure 23). However, if you have chosen to schedule the report to
run now, clicking the Refresh icon at the top right of the table should change the
Status to ‘Running’. Depending upon the size of the report you are running it could
take anywhere from a few seconds to an hour for the results to be returned.
At this stage you can go off and do a number of things (e.g. schedule another report,
run a report manually or even log out for the day). The scheduled report will continue
to run in the background and the results will be stored until you go back to view the
History page.
You can check if a report has run successfully by looking at the Status column beside
the instance on the History page – it should be set to ‘Success’. Note that the
‘Instance time’ will have been updated with the time that the report was successfully
completed and that it will also have been converted from a text field to a link.
Clicking on this link will bring up the results of your report at the time that it was run.
33
Figure 24 – A successful scheduled run

34
TRY – Setting up a scheduled report in BOXI
1. Select the ‘Schedule’ link under the Full Patient Waiting list report.
2. Leave the default options for When, Destination and Format. 3. Modify the Prompts and select chosen values before clicking Apply
4. Click the ‘Schedule’ button. You will be taken to the History page where you will
see the instance that you have created.
5. Spend 5-10 minutes doing another task then return to the History page and check
to see if the report has run successfully (you may need to click the Refresh
icon to update the Status field).
6. If successful, click the ‘Instance time’ to open up the results.
3.6.2 Emailing the results in Excel / PDF format
The scheduling functionality can be extended so that it emails the results out to users
and other colleagues who may not have access to BOXI once the run has been
completed. This can be achieved by choosing different options in Destination and
Format when setting up a scheduled report. In the previous example, the default
options for both sections – ‘Default Enterprise location’ and ‘Web Intelligence’
respectively – were kept however these are not suitable if the user wishes to send
out the results by email.
As Web Intelligence documents can only be viewed in BOXI this format cannot be
used in this case which leaves the user to choose between ‘Microsoft Excel’ and
‘Adobe Acrobat’ (PDF). The choice here will depend on the type of report and also
what the recipient(s) of the emailed results will want to be able to do with the results.
If the recipient only needs to view the tables/lists/charts on the report then either
option could be chosen. However if the recipient wishes to work with the results (e.g.
annotate/highlight figures, create a Pivot table from a list of data etc.) then Excel is
the only option. Note that the same process will apply no matter which of the two
formats is chosen.
The default option or second option (‘Inbox’) for Destination cannot be used as we
want the results to be sent outside of BOXI. Instead the remaining option ‘Email
recipients’ should be chosen. Please note you may notice that there a couple of

extra options for the Destination – ‘File location’ and ‘FTP server’ – if you have
already changed the format to either Excel or Adobe Acrobat. However these
options cannot be used because the Web Intelligence server is on a separate
network from the Boards and therefore security issues will prevent these options from
working correctly.
Once the ‘Email recipients’ option has been chosen, a checkbox appears with the
statement ‘Use the Job Server’s defaults’. Removing the tick will result in the
following:
Figure 25 – Setting up Email recipients for posting results from a scheduled report
From this point on it is similar to writing an email. You should put your email address
or a description with no spaces (e.g. Current_Waiting_List) in the ‘From’ field, the
email address(es) of the recipient(s) in the ‘To’ field (or ‘Cc’ if multiple recipients), a
meaningful ‘Subject’ and then enter any text that you want to accompany the results
in the ‘Message’ field.
35

Be sure to click the checkbox beside ‘Add attachment’ so that a tick appears. If you
do not do this then the results will not be sent out along with the email when the
scheduled run is completed. Next, it is best to select ‘Specific name’ from the
‘Attachment’ options as this gives the user control over the name of the results file
that will be sent out (choosing ‘Automatically generated’ leads to a filename like
c~0a45jkgu57js2.xls when the results are sent out!). Finally please ensure that you
click the checkbox beside ‘Add file extension’ so that a tick appears otherwise the file
that is emailed will be meaningless. The screenshot below outlines an example of
the completed sections:
Figure 26 – Completed email section
After selecting the appropriate options for When and Prompts, clicking the Schedule
button will create an instance of the report as before. Once the scheduled run is
complete, the results will be emailed out to your chosen recipients and they will
receive an email message that will be similar to the following (depending upon what
has been entered in the ‘Subject’ and ‘Message’ fields):
36

Figure 27 – Email received following scheduled run of a report
Note the attached Excel file and the same message text that was used when setting
up the scheduled report in the above example.
This facility is a powerful feature of BOXI and means that you can automatically run
reports and send out the results to specific users, even those who do not have
access to BOXI themselves.
TRY – Emailing the results from a scheduled report in Excel / PDF format
1. Select the ‘Schedule’ link under the Full Patient Waiting list report.
2. Leave the default option for When, but choose ‘Microsoft Excel’ or ‘Adobe
Acrobat’ for Format and ‘Email recipients’ for Destination.
3. Fill out the details in the Email form as described above, putting your own email
address in the ‘To’ field in order to test out the process.
4. Modify the Prompts and select chosen values before clicking Apply
5. Click the ‘Schedule’ button. You will be taken to the History page where you will
see the instance that you have created.
6. Spend 5-10 minutes doing another task then return to the History page and check
to see if the report has run successfully (you may need to click the Refresh
icon to update the Status field).
7. If successful, check your email inbox for the results. Note that it may take a few
minutes from the time the scheduled report was completed successfully to the
resulting email appearing in your inbox.
37

3.6.3 Deleting an instance
An instance of the report (and the data held within it) will remain available to users on
the History page until it has been deleted (NB. this can only be done by the user who
created the instance – username displayed in the ‘Run By’ column). This is done by
clicking the checkbox to the left of the instance on the History page until a tick
appears (you can do this for more than one instance) and then clicking the Delete
button at the top of the table.
Figure 28 – Deleting an instance of a report
TRY – Deleting an ‘instance’ 1. Select the History link under the Full Patient Waiting List report.
2. Locate the instance that you want to delete and click the checkbox next to it so
that a tick appears.
3. Click the Delete button.
38

4. Modifying Reports
The centrally designed reports were created to be of use to the Boards but it is likely
that they do not cover everything that you, as a user, would like them to do. Luckily
BOXI offers the opportunity for users to take an existing report and modify it for their
own needs (e.g. add/remove details, prompt for other information when refreshing
etc.).
Continuing with the example of the ‘Full Patient Waiting List’ report, if you felt that
there was an important piece of information that was missing from the report results,
you can start the process of adding this by going back to the list of reports (in this
case you would choose the Standard Reports folder) and clicking on the ‘Modify’
option underneath the title of the report as demonstrated in the figure below:
39
Figure 29 – Location of the ‘Modify’ option on a report
Once you have clicked on ‘Modify’, you should get the following screen:

Figure 30 – Report in ‘Modify’ mode
You should notice immediate differences from the previous view of the report. You
still have a blank results screen but there are a number of new icons that allow you to
format and edit the report directly and you can also now see the list of Objects on the
left hand side of the screen that are part of the query for the report.
You may also notice that several of the objects in the list, although part of the query,
are not directly represented in the results. However the underlying data for these
objects are available to the user when the report is refreshed which allows users to
make a number of changes to the central reports so that they fit better with their
requirements.
40

4.1 Adding objects to existing reports
To add an object to the report, choose one from the list (in this example we will use
‘Location of Treatment Name) and click and hold down the left mouse button to
select it. Drag the chosen object to the position on the table where you want it to go -
you will notice a blue bar appearing at various positions within cells as you drag the
object across the existing report. This is important as it will help to guide you to the
position where you want to insert the object as in the illustration below:
- will place object to the left of ‘Specialty’
- will replace Specialty in the table
- will place object to the right of ‘Specialty’ Figure 31 – Positioning guide for adding an object to the results table
Once you have chosen the position for the object then release the mouse button and
it will appear in the report. Repeat this process to add other objects if you wish.
TRY – Adding an object to a report
1. Open the Full Patient Waiting List report in Modify mode.
2. Find ‘Location of Treatment Name’ in the list of objects on the left hand side
3. Click and hold the left mouse button to select the object and drag it over to the
existing table
4. Place the new object in between ‘Specialty’ and ‘HCP Professional’.
41
4.2 Adding objects as drill filters
Another option that is open to you is to add a data item as a drill filter rather than into
the table directly. Continuing the example used above, it may be that you would
prefer to look at the data by each individual Location of Treatment rather than having
all locations in the same table. In this instance it would make more sense for you to
have the ability to pick each location in turn which is why adding this object as a filter
would be better.
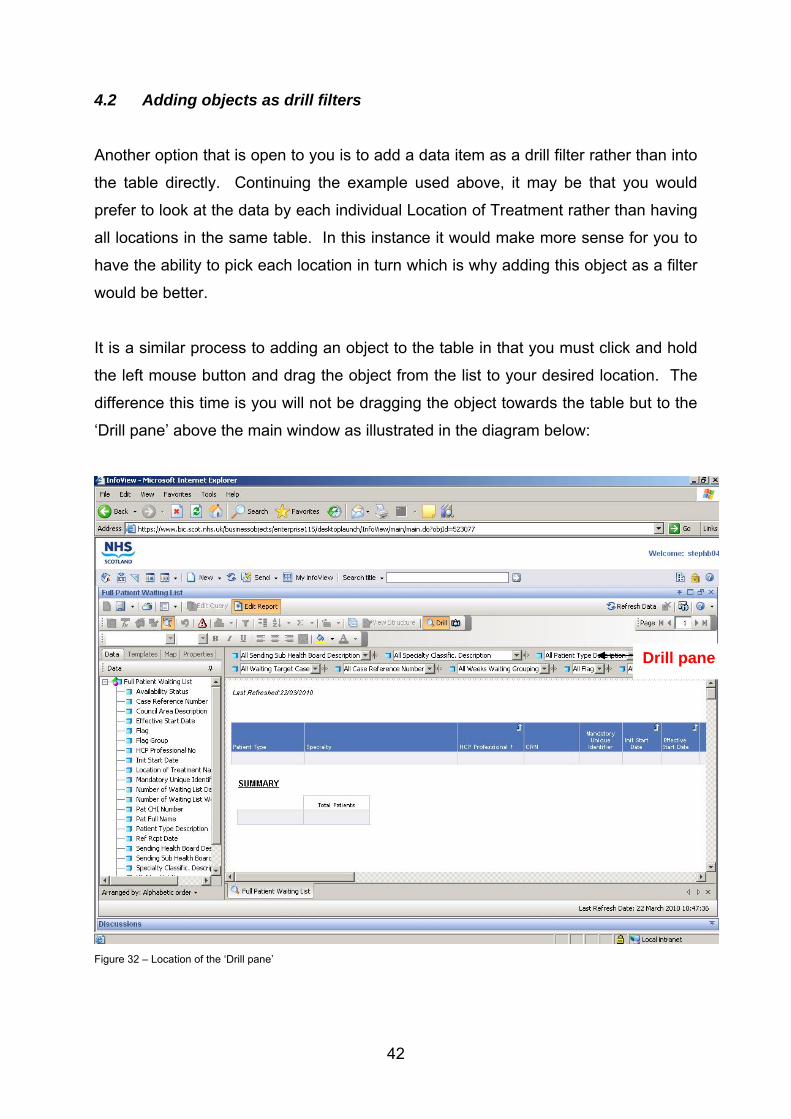
It is a similar process to adding an object to the table in that you must click and hold
the left mouse button and drag the object from the list to your desired location. The
difference this time is you will not be dragging the object towards the table but to the
‘Drill pane’ above the main window as illustrated in the diagram below:
Drill pane
Figure 32 – Location of the ‘Drill pane’
42

As before there will be an icon to help you position the new filter though this time a
cursor ( ) is used rather than a blue bar:
– will place a new filter to the left
– will replace the existing filter
– will place a new filter to the rightFigure 33 – Positioning guide for adding an object to the ‘Drill pane’ to be used as filters for the results
TIP: Initially you may find that you are not able to add filters to your report as the
‘Drill pane’ may not be active (depending on the report that you are trying to modify).
A quick check that you can do is to look for the Drill button which you will find near
the top-middle of the report. If the Drill pane is active then this button will have an
orange background , if it is not active then the button will have a grey
background . If the Drill pane is inactive then simply click the Drill button and
you can then add filters to your copy of the report as described above.
TRY – Adding a drill filter to a report 1. Open the Full Patient Waiting List report in Modify mode.
2. Find ‘Location of Treatment Name’ in the list of objects on the left hand side.
3. Click and hold the left mouse button to select the object and drag it over to the
‘Drill pane’.
4. Place the new object in between ‘Sending Sub Health Board’ and ‘Specialty
Classification’.
43

4.3 Checking the results of your modifications
You also have the ability to run reports within the ‘Modify’ environment which allows
you to test the effects of your changes prior to saving a final version of your modified
report. To do this simply click on as you would do normally.
Figure 34 – Prompt screen when in ‘Modify’ mode
Note that the prompt screens in Modify mode can look different to what you used
previously though they will still ask you to enter the same information.
TRY – Checking your modifications
1. Click Refresh Data to bring up the Prompts screen and enter the prompts as
normal.
2. Click the Refresh Data button to run the report and view the changes you have
made.
44

4.4 Removing objects from existing reports
Having added objects to the report (either to the results or to act as filters) and
viewed the results of your modifications, you may decide to remove the objects that
you have just added (or any others that you do need to see) on your version of the
report. In order to do this right-click on the title of the object in the table and select
‘Remove’ from the list that pops up as shown in Figure 28:
Figure 35 – Options available when removing an object from the report
Occasionally this action may remove the data but not the column (or row) itself. If
this occurs then right-click on the column (or row) again and select ‘Remove column’
(or ‘Remove row’ for other reports where this is appropriate) from the list.
In order to remove objects from the drill pane simply drag and drop the items back
into the list of objects on the left hand side.
45

TRY – Removing objects from a report Find ‘Location of Treatment Name’ in the results table and remove this by right-
clicking on the column and selecting the appropriate option from the list
OR Find ‘Location of Treatment Name’ in the ‘Drill pane’ and remove this by clicking and
dragging the drill filter back to the list of objects.
4.5 Saving your modified reports
Once you are happy with the modifications that you have made to your version you
should then think about saving the report. However, before you do that you should
‘purge’ (i.e. remove) any data from your report prior to saving.
TIP: Saving your modified reports to your own Favourites folder means that you
know that only you can view the data/figures the next time you open the report. If
however you are saving the report to your Board User Reports folder then this opens
it up to all other users in your Board so you may wish to ensure that your report is
blank when opened like the central reports. In order for you to do this it is important
that you save your final version at the right point.
• If you were to modify a report, refresh the data to check that it works and then
save and close the report, the data/figures would be displayed every time the
report is opened.
• If you were to modify a report, refresh the data to check that it works, purge the data from the report and then save and close the report, the report would be
blank every time the report is opened.
Purging the data in a report when in ‘Modify’ mode is very straightforward. All you
have to do is click the icon to the right of the button and answer ‘Yes’
when prompted by a pop-up window. This will clear the data from your report and
saving the report at this stage will ensure that your report will always be blank when it
is opened.
46

The process for saving a report in Modify mode is very similar to that outlined earlier
in section 3.4.1 – the only real difference being the icon that you have to click on to
save a report (or the results of running a report). Whereas before you first had to
click the ‘Document’ icon in order to save the report, in Modify mode you must
choose the disk icon (i.e. similar to Excel / Word etc.). Once you have clicked on
the disk icon the steps (and screenshots) are identical to those outlined in the earlier
section.
TRY – Purging the data and saving a modified report
1. Run the report to ensure that the table is populated.
2. Click the Purge Data icon to clear the contents of the table.
3. Save the report to your chosen location.
4.6 Deleting reports
Having modifed a report (or saved a copy of a colleague’s report in your Favourites
folder) you may decide that you do not wish to keep it and would therefore like to
delete the report. Note that you can only delete a report if you are marked as the
owner so you will be able to delete your modifed copies of the reports but not the
original versions in the Standard / Snapshot / Error Reports folders.
To delete a report, click the ‘Toggle navigation’ button towards the top left
of your screen to bring up the folder navigation list (if it is not already showing) and
then click on the name of the folder containing the report that you would like to
delete. The reports contained in this folder will now be listed in the main part of the
screen. To the left of each report in the list you will notice a checkbox. Locate the
report that you want to delete and click the checkbox next to it so that a tick is
displayed as in figure 36 (you can repeat this step if you are planning to delete more
than one report).
47
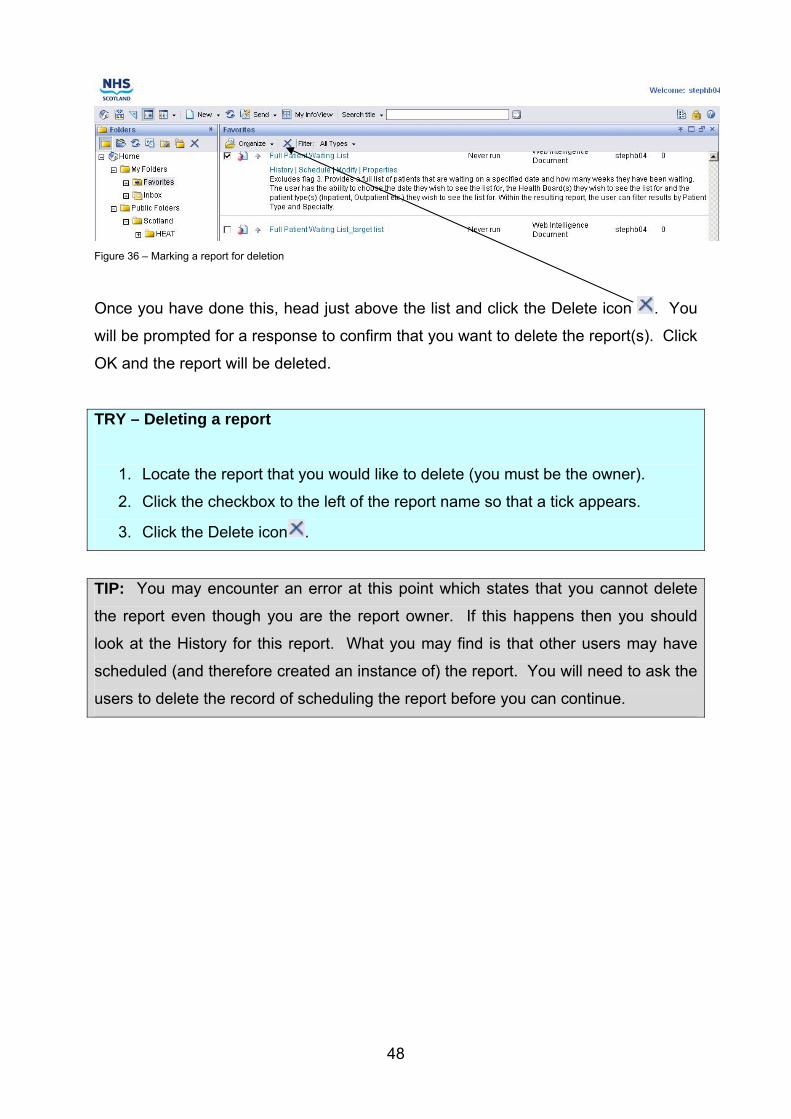
Figure 36 – Marking a report for deletion
Once you have done this, head just above the list and click the Delete icon . You
will be prompted for a response to confirm that you want to delete the report(s). Click
OK and the report will be deleted.
TRY – Deleting a report
1. Locate the report that you would like to delete (you must be the owner).
2. Click the checkbox to the left of the report name so that a tick appears.
3. Click the Delete icon .
TIP: You may encounter an error at this point which states that you cannot delete
the report even though you are the report owner. If this happens then you should
look at the History for this report. What you may find is that other users may have
scheduled (and therefore created an instance of) the report. You will need to ask the
users to delete the record of scheduling the report before you can continue.
48

5. Editing the query behind a report
In most cases you will be looking to modify an existing Standard Report and while
you have the ability to add and remove objects that form part of the original report
query, you are constrained by the number of objects that are brought back in the
results of the query. What do you do if you want to add an object that is not part of
the original query? The obvious answer is that you need to add more objects to the
query. However, if you look towards the top of the screen when you are modifying a
Standard Report you will see that ‘Edit Report’ is highlighted but ‘Edit Query’ is
greyed out.
Figure 37 – Edit Query ‘greyed out’ in report
In order to activate the ‘Edit Query’ button you must first save a copy of the central
report that you wish to modify into your own area.
TIP: At this stage you could choose to save the report to your Board User Reports
folder however this would mean that other users in your Board would be able to see
your ‘work in progress’ which you may not want. Therefore it is advisable for users to
save a copy to their Favorites folder initially while working on a report. The finished
report could then be moved to your Board User Reports folder at a later stage once
the modifications have been completed.
49
There are a couple of ways of saving a copy of the central report to your Favourites
folder. The first is as described earlier in section 3.4.1 where you open the report
and then save a copy from within the report. The second option allows you to save a
copy of a central report without having to open it first.
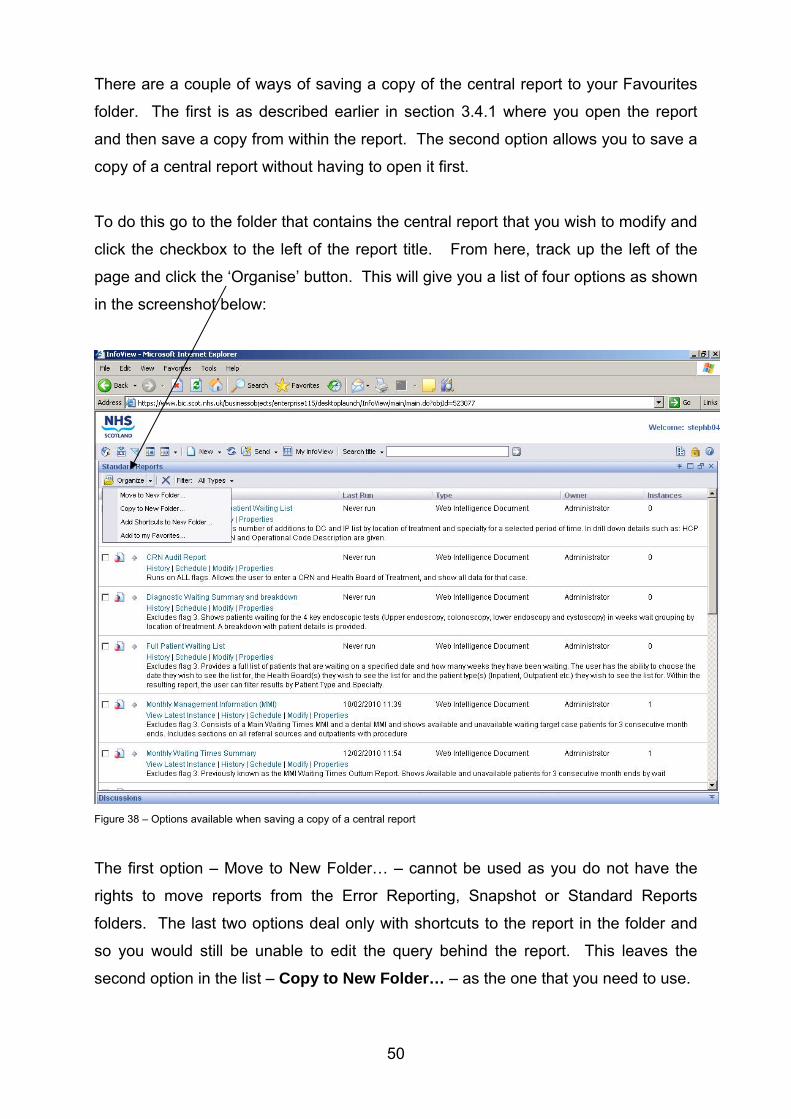
To do this go to the folder that contains the central report that you wish to modify and
click the checkbox to the left of the report title. From here, track up the left of the
page and click the ‘Organise’ button. This will give you a list of four options as shown
in the screenshot below:
50
Figure 38 – Options available when saving a copy of a central report
The first option – Move to New Folder… – cannot be used as you do not have the
rights to move reports from the Error Reporting, Snapshot or Standard Reports
folders. The last two options deal only with shortcuts to the report in the folder and
so you would still be unable to edit the query behind the report. This leaves the
second option in the list – Copy to New Folder… – as the one that you need to use.
Ignore the fact that the option mentions ‘New Folder’ as, once selected, a new screen
will open and you will see that BOXI allows you to save a copy of the report to the
existing folders. Ensure that you click the Favorites folder before selecting OK.
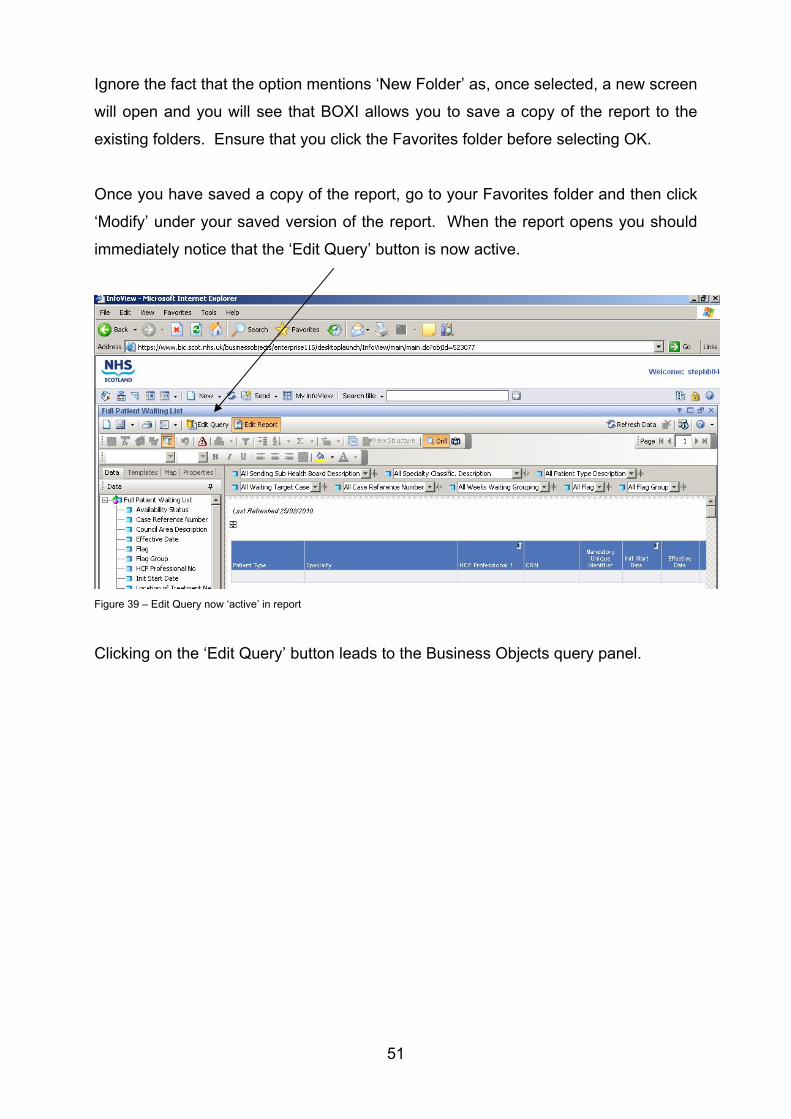
Once you have saved a copy of the report, go to your Favorites folder and then click
‘Modify’ under your saved version of the report. When the report opens you should
immediately notice that the ‘Edit Query’ button is now active.
Figure 39 – Edit Query now ‘active’ in report
Clicking on the ‘Edit Query’ button leads to the Business Objects query panel.
51

5.1 The Query panel
The query panel is split into three sections (as illustrated below):
3
2
1
Figure 40 – The Business Objects Query Panel
1. Data – contains all available dimensions, measures and predefined filters /
prompts (including New Ways, derived and reference data items), and
organised into ‘classes’ in the New Ways Universe.
2. Result Objects – these are the data/derived/reference objects that have been
chosen from the New Ways universe to be part of the query behind the report.
3. Query Filters – Objects placed in this area will act as a restriction in the query.
The range of classes from Time down to Record Details contains objects that can be
used in any query. The following five classes – Waiting at Report Date, Completed
Waits, Offers & Appointments, Unavailability and Exclusions – contain objects that
can only be used in the correct context. For example, if you were creating a report
that was going to show details of patients that had been seen and therefore removed
52

53
from the waiting list, you could use the objects in the Completed Waits class in the
query (alongside the ‘universal’ objects as described above) but could not use the
objects in the Waiting at Report Date class as they can only be used to report on
patients that are still waiting etc. Similarly the sub-classes of the Prompts and Filters
classes are clearly labeled so it should be obvious which of the ‘pre-canned’ filters
and prompts can be used in any given context.
5.2 Adding Result Objects
In order to add a new object to the Result Objects for an existing query you must first
locate the object in the Data section by navigating through the appropriate folders.
As an example for the Full Patient Waiting List Report you may wish to add the
Sending Location Name to the query as you plan to use this as a drop-down filter.
TIP: There is an alternative way to locate an object if you are not already familiar
with its location in the folders within the Data section. Click on any of the folder
names in the Data section and then start typing the name of the object that you are
looking for. What you should see is a temporary search box appearing at the top of
the Data section and the highlighted folder / object changing based on what you are
typing until it settles on the object that you were looking for.
Note that if you type the wrong name then the colour of the text in the temporary
search box will turn red and (no match) will appear alongside what you have typed.
To remove this press the backspace button until you have removed what you had
typed and then try another name.
Once you have found the chosen object, it can be dragged and dropped into the
Result Objects (the position of the object is not important here, only that it is included
as one of the Result Objects) as in the following screenshot:
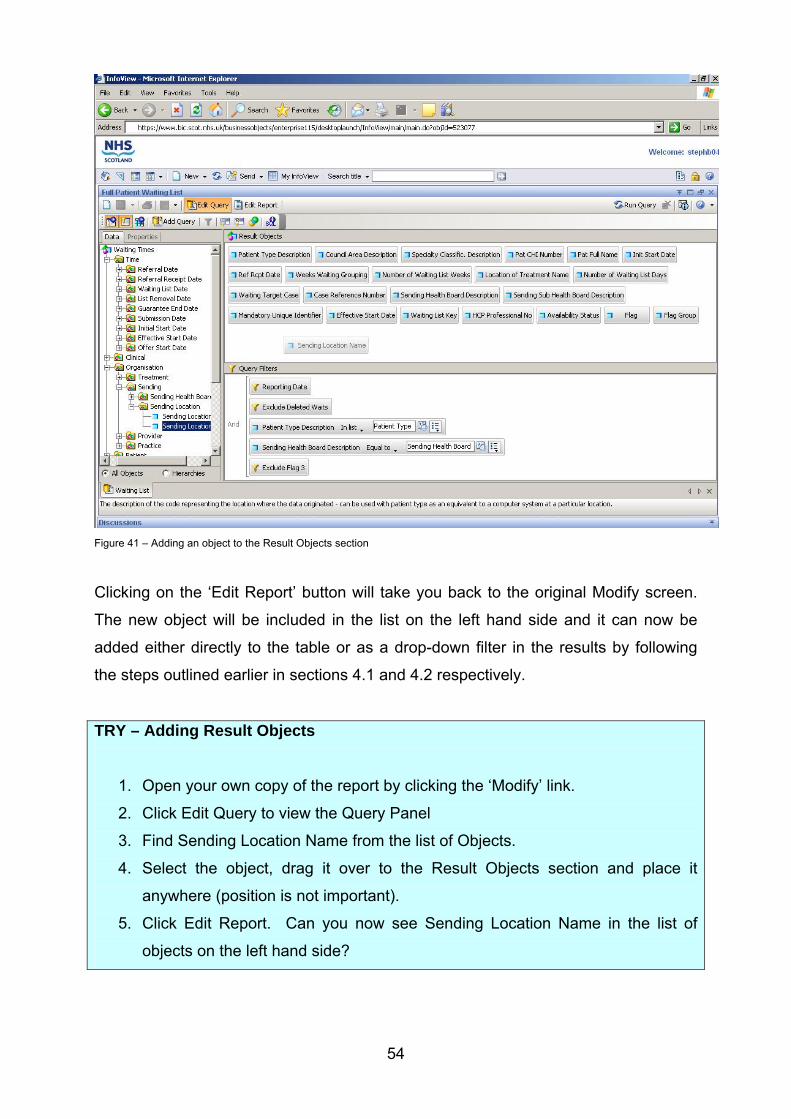
Figure 41 – Adding an object to the Result Objects section
Clicking on the ‘Edit Report’ button will take you back to the original Modify screen.
The new object will be included in the list on the left hand side and it can now be
added either directly to the table or as a drop-down filter in the results by following
the steps outlined earlier in sections 4.1 and 4.2 respectively.
TRY – Adding Result Objects
1. Open your own copy of the report by clicking the ‘Modify’ link.
2. Click Edit Query to view the Query Panel
3. Find Sending Location Name from the list of Objects.
4. Select the object, drag it over to the Result Objects section and place it
anywhere (position is not important).
5. Click Edit Report. Can you now see Sending Location Name in the list of
objects on the left hand side?
54

55
5.3 Adding objects as filters/prompts in the query
If you look at the previous figure you will see that the results of the Full Patient
Waiting List report will exclude deleted waits and any records with Flag 3 errors.
Prompts have also been specified for Report Date (predefined prompt), Patient Type
Description and also Sending Health Board Description thus further specifying the
results that are to be displayed when it has been refreshed. There are a number of
other filters/prompts that can be added (or removed from) here – it all depends on
what results that you want from a report
For example, it may be that you want to look at the number of patients on a waiting
list that are waiting over ‘X’ weeks where ‘X’ is a user-defined value. To do this with
the Full Patient Waiting List Report you would need to add a prompt to the Query
Filters (section 3 as shown in Figure 33) that asks the user to enter a value for the
number of weeks when refreshing the report.
To do this you will first of all need to locate the appropriate object and ‘drag and drop’
it into the Query Filters section. In this case we do not need to look through the
folders in the Data section as the object that we need – Number of Waiting List
Weeks – is already one of the Results Objects. When moving the object across the
Query Filters section you may notice ‘blue bars’ appearing over the the other Query
Filters (similar to what was described in section 4.1). Again these are designed to
help with the positioning however we want to place it at the same level as the other
prompt / filters and therefore you should look for a thin, horizontal black line between
the existing Query Filters as highlighted in the screenshot below:
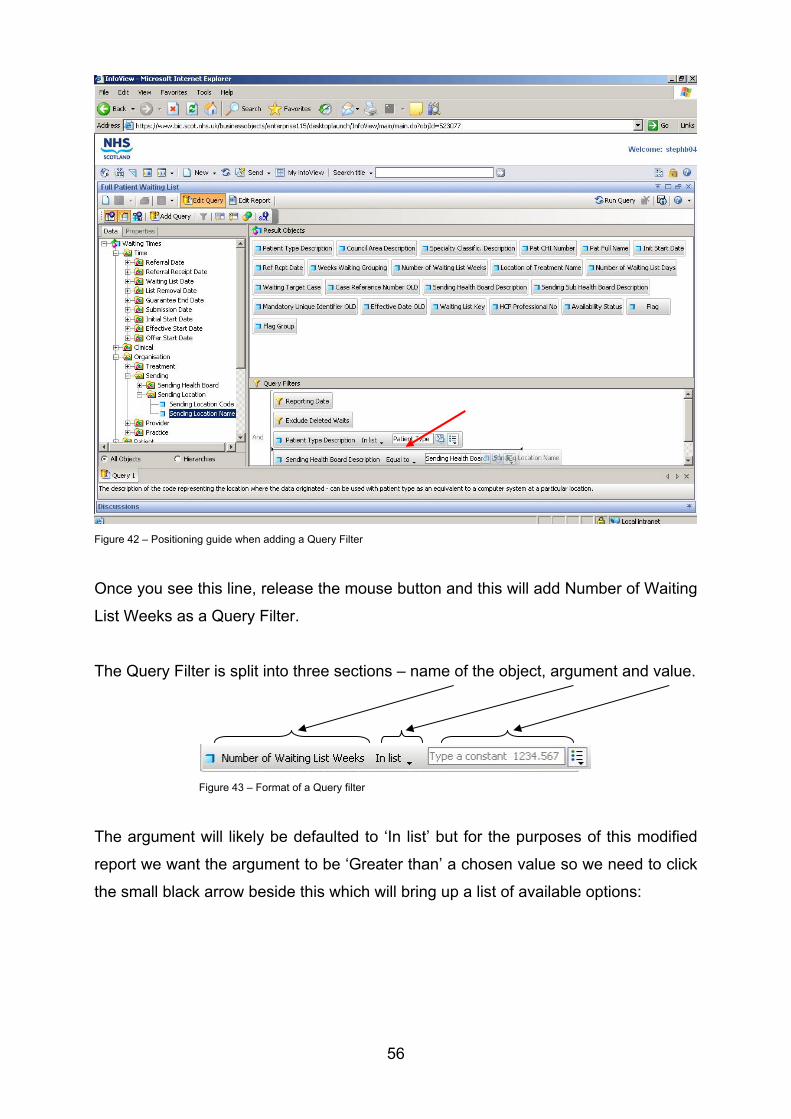
Figure 42 – Positioning guide when adding a Query Filter
Once you see this line, release the mouse button and this will add Number of Waiting
List Weeks as a Query Filter.
The Query Filter is split into three sections – name of the object, argument and value.
Figure 43 – Format of a Query filter
The argument will likely be defaulted to ‘In list’ but for the purposes of this modified
report we want the argument to be ‘Greater than’ a chosen value so we need to click
the small black arrow beside this which will bring up a list of available options:
56

Figure 44 – Options available when specifying an ‘argument’
Choose ‘Greater than’ from the list and then click the icon to the right of the empty
text box to bring up another list:
Figure 45 – Options available when setting how the Value will be collected
Here you can choose to enter a Constant (i.e. a hard-coded value), Prompt or
another Object. In this example we would like for the query to ask for a value for the
number of weeks so the best option to choose here is Prompt. You will notice when
you choose this that BOXI automatically enters a prompt into the empty text box –
Number of Waiting List Weeks: – but you can amend this text as you see fit (e.g. in
57

58
this example you may want to change the prompt to ‘Number of weeks greater
than:’).
Once you have done this then refresh the report by clicking the Run Query button.
You should see that you are now prompted for four items of information – Report
Date, Patient Type, Health Board as before and now the Number of Waiting List
Weeks. When you are happy with your changes you can follow the steps as outlined
earlier in section 4 to further modify and then save your report.
TRY – Adding a prompt to a report
1. Click Edit Query
2. Find ‘Number of Waiting List Weeks’ in Result Objects.
3. Click and hold the left mouse button to select the object and drag it down to
Report Filter.
4. Place the new object in between the existing ‘Patient Type’ and ‘Sending Health
Board’ prompts (remember the black horizontal line for positioning).
5. Change the argument to ‘Greater than’ and then change the value to Prompt (you
can change the wording of the prompt if you wish).
6. Press ‘Run Query’. What do you see?
7. Enter the required information and press Run Query again to get your results.
There are many other aspects to editing the queries behind reports and you can also
start from a ‘blank sheet’ and build a report from scratch using the Waiting Times
universe. However this goes beyond the scope of this manual.
Hopefully, by following the content and trying out some of the exercises you are now
at the stage where you are comfortable with working with BOXI (from a New Ways
perspective) and are able to achieve the aims that were set out at the start.

59
6. Contact details
Should you wish to contact ISD for further assistance in relation to using BOXI for
running New Ways reports then please feel free to contact us on the appropriate
number below:
General Business Objects Queries:
Stephen Bush Jane Goodall
[email protected] [email protected]
0131 275 6809 0131 275 6183
Stuart Kerr
0131 275 6363
Technical problems / Application errors: Customer Support Desk
0131 275 7777
Related Documents