Page 1 of 29 Business Objects 4.1 Quick User Guide Log into SCEIS Business Objects (BOBJ) 1. https://sceisreporting.sc.gov 2. Choose Windows AD for Authentication. 3. Enter your SCEIS User Name and Password: Home Screen View: This is the view that will appear once you login:

Welcome message from author
This document is posted to help you gain knowledge. Please leave a comment to let me know what you think about it! Share it to your friends and learn new things together.
Transcript
Page 1 of 29
Business Objects 4.1 Quick User Guide
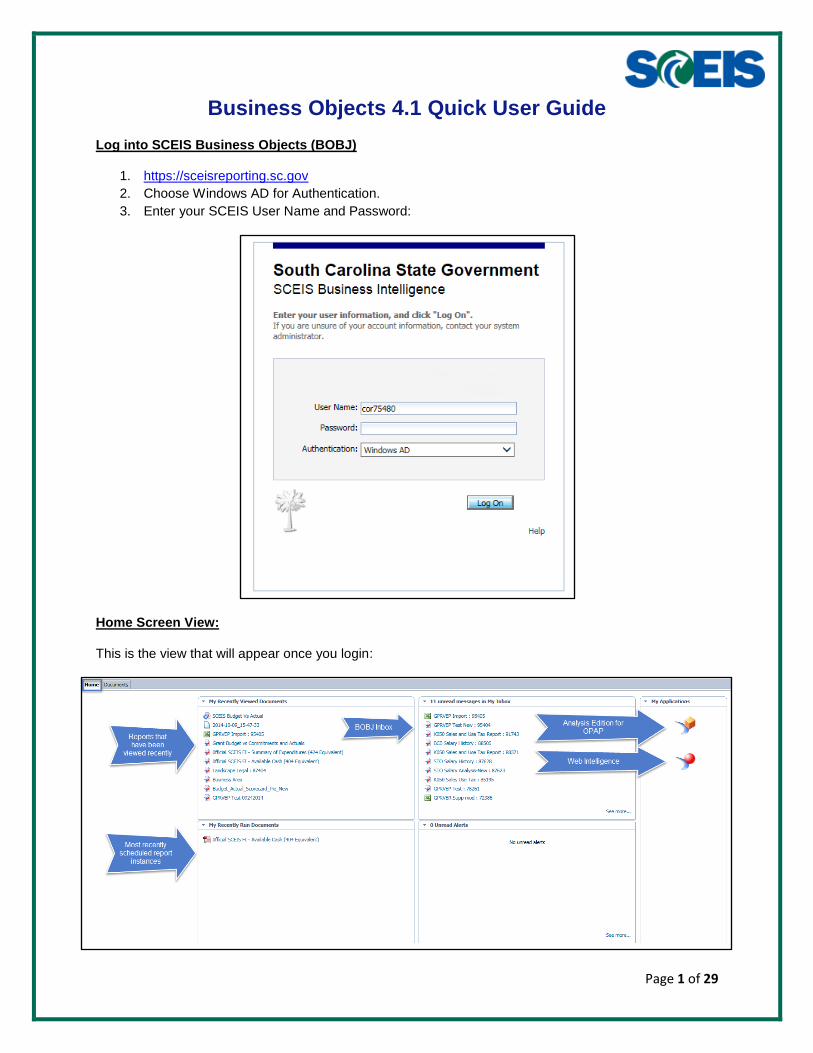
Log into SCEIS Business Objects (BOBJ)
1. https://sceisreporting.sc.gov
2. Choose Windows AD for Authentication.
3. Enter your SCEIS User Name and Password:
Home Screen View:
This is the view that will appear once you login:
Page 2 of 29
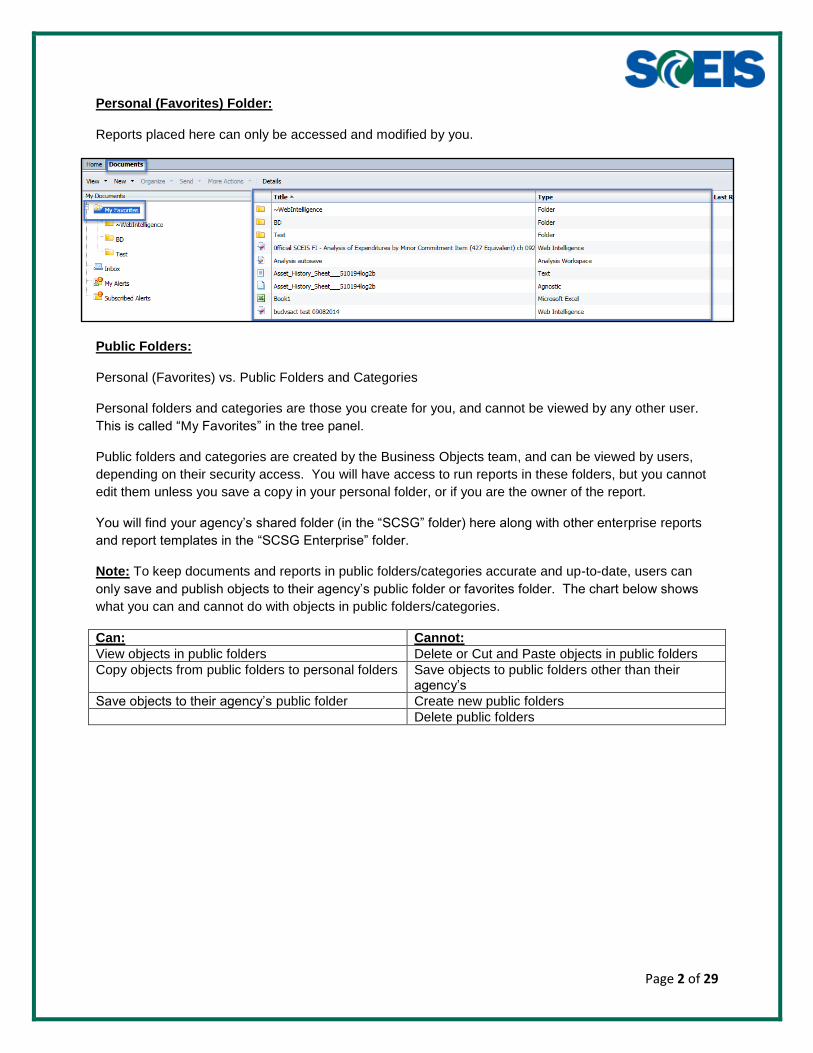
Personal (Favorites) Folder:
Reports placed here can only be accessed and modified by you.
Public Folders:
Personal (Favorites) vs. Public Folders and Categories
Personal folders and categories are those you create for you, and cannot be viewed by any other user.
This is called “My Favorites” in the tree panel.
Public folders and categories are created by the Business Objects team, and can be viewed by users,
depending on their security access. You will have access to run reports in these folders, but you cannot
edit them unless you save a copy in your personal folder, or if you are the owner of the report.
You will find your agency’s shared folder (in the “SCSG” folder) here along with other enterprise reports
and report templates in the “SCSG Enterprise” folder.
Note: To keep documents and reports in public folders/categories accurate and up-to-date, users can
only save and publish objects to their agency’s public folder or favorites folder. The chart below shows
what you can and cannot do with objects in public folders/categories.
Can: Cannot:
View objects in public folders Delete or Cut and Paste objects in public folders
Copy objects from public folders to personal folders Save objects to public folders other than their agency’s
Save objects to their agency’s public folder Create new public folders
Delete public folders
Page 3 of 29
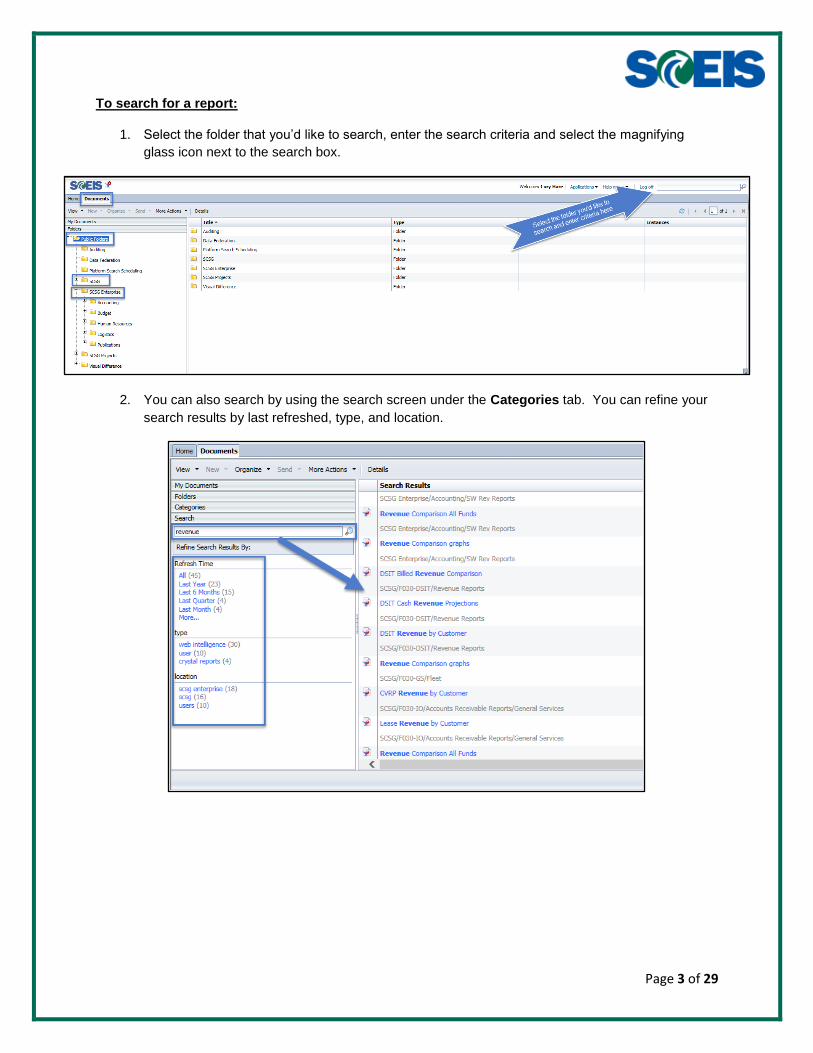
To search for a report:
1. Select the folder that you’d like to search, enter the search criteria and select the magnifying
glass icon next to the search box.
2. You can also search by using the search screen under the Categories tab. You can refine your
search results by last refreshed, type, and location.
Page 4 of 29
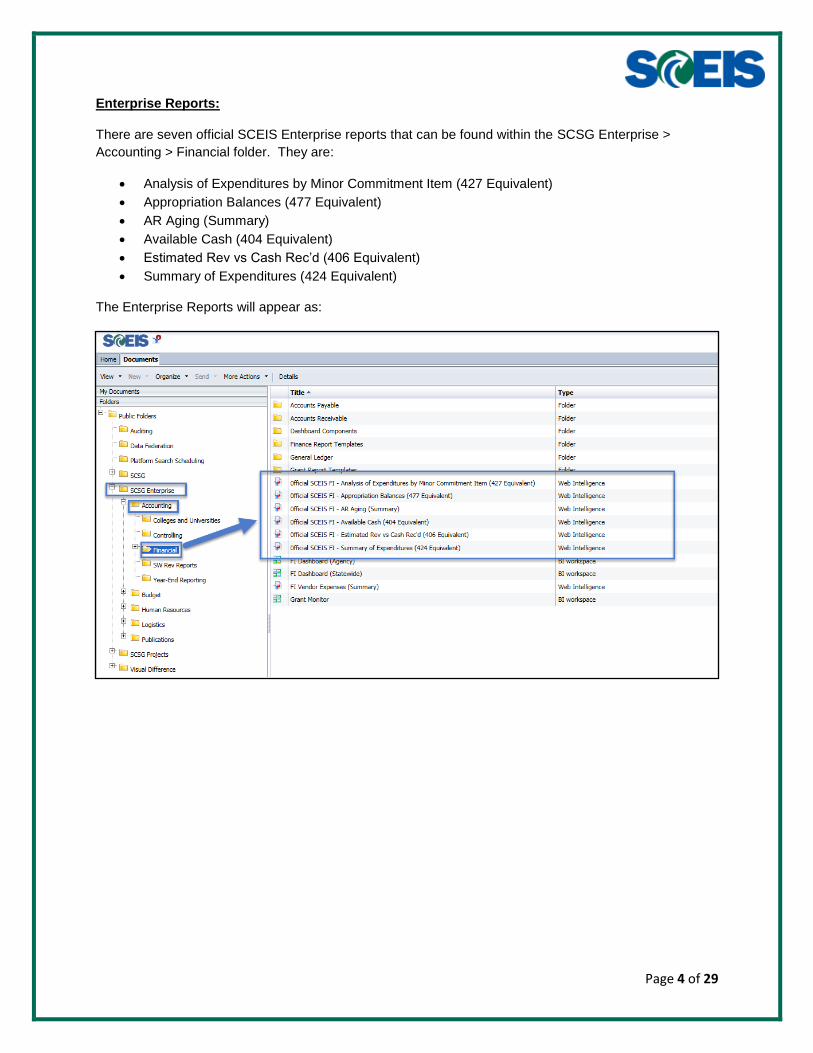
Enterprise Reports:
There are seven official SCEIS Enterprise reports that can be found within the SCSG Enterprise >
Accounting > Financial folder. They are:
Analysis of Expenditures by Minor Commitment Item (427 Equivalent)
Appropriation Balances (477 Equivalent)
AR Aging (Summary)
Available Cash (404 Equivalent)
Estimated Rev vs Cash Rec’d (406 Equivalent)
Summary of Expenditures (424 Equivalent)
The Enterprise Reports will appear as:

Page 5 of 29
To run an enterprise report:
1. Navigate to Public Folders > SCSG Enterprise > Accounting > Financial.
2. Right-click on the report and select View.
3. Enter the criteria for which the report should be run by entering your agency’s business area in
the From and To Business Area fields and select the binocular icon next to the search box.
Select the right arrow make your selection.

Page 6 of 29
Note: Some reports require you to have Search in Keys checked next to the search box when you enter
a key (such as F030 for Business Area or 10010000 for Fund):
4. Enter values for any required fields (For example, Posting Period and Fiscal Year) and any other
optional fields. And click OK to run the report.
Exporting Reports:
Reports can be exported as CSV, Excel, PDF, or Text files. Once the report has run, click the drop-down
arrow next to the Export icon and select Export Document As. (Selecting Export Current Report As will
export only the current tab of the report). Then choose the desired format.
Note: You will only see the export option if you’re in View mode. If you go into the report in Modify
mode, you’ll have to save the file to a location to convert the file into an Excel, PDF, CSV or text file.
Page 7 of 29
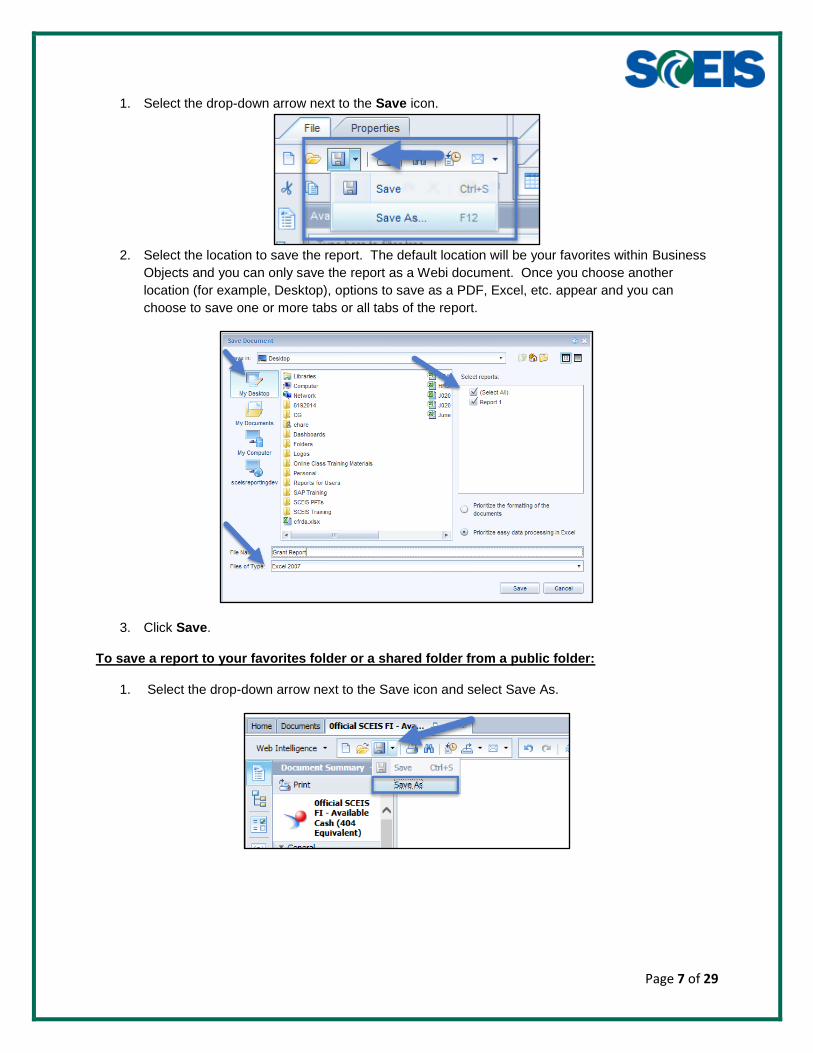
1. Select the drop-down arrow next to the Save icon.
2. Select the location to save the report. The default location will be your favorites within Business
Objects and you can only save the report as a Webi document. Once you choose another
location (for example, Desktop), options to save as a PDF, Excel, etc. appear and you can
choose to save one or more tabs or all tabs of the report.
3. Click Save.
To save a report to your favorites folder or a shared folder from a public folder:
1. Select the drop-down arrow next to the Save icon and select Save As.

Page 8 of 29
2. Select the folder location and report name and click Save.
Note: If you select the double arrows under file type, you can add a Description to the report and set the
Refresh on open option:
To add a simple drop-down filter in View Mode:
1. Select the Filter Bar icon at the top of the page:
Page 9 of 29
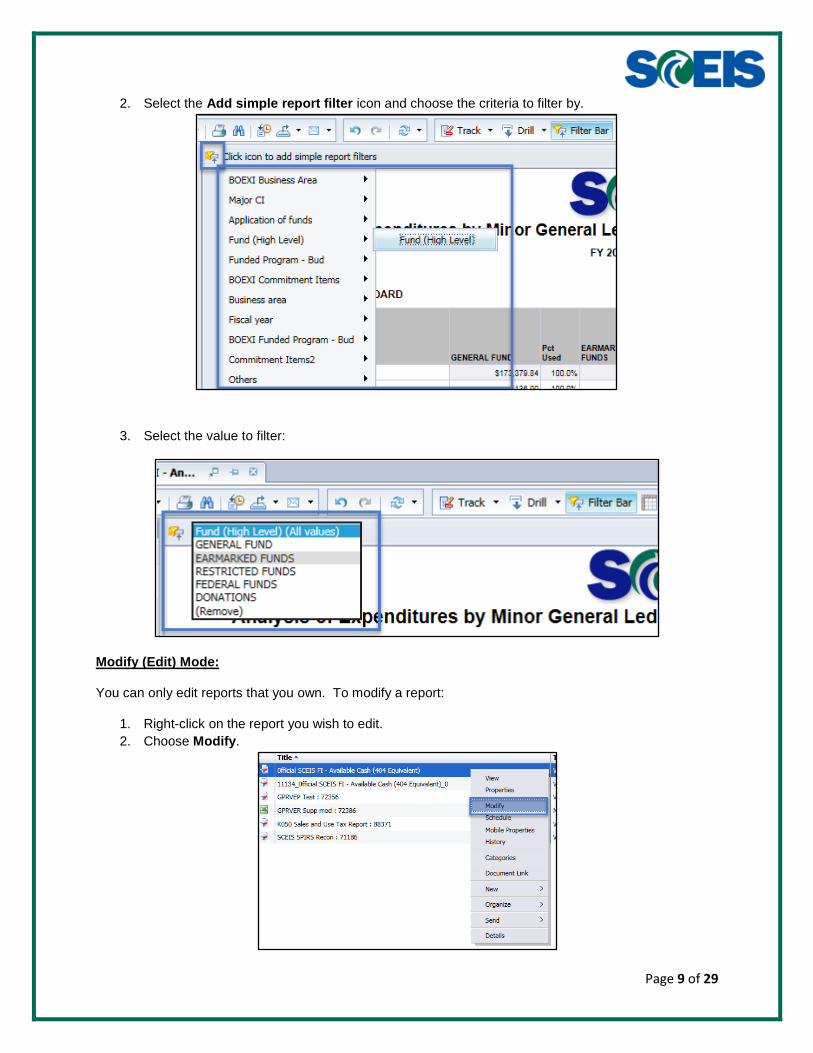
2. Select the Add simple report filter icon and choose the criteria to filter by.
3. Select the value to filter:
Modify (Edit) Mode:
You can only edit reports that you own. To modify a report:
1. Right-click on the report you wish to edit.
2. Choose Modify.
Page 10 of 29
Note: If you are already in View mode (or reading mode), you can switch to Design mode by selecting
Design at the top, right corner of the report. If you first enter the report in View mode, then go into Design
mode, you will be able to make modifications to the report, but won’t be able to edit the query. To add
objects into the query or make any changes to the query within the query panel, you’ll need to right-click
on the report name in the document list and select Modify.
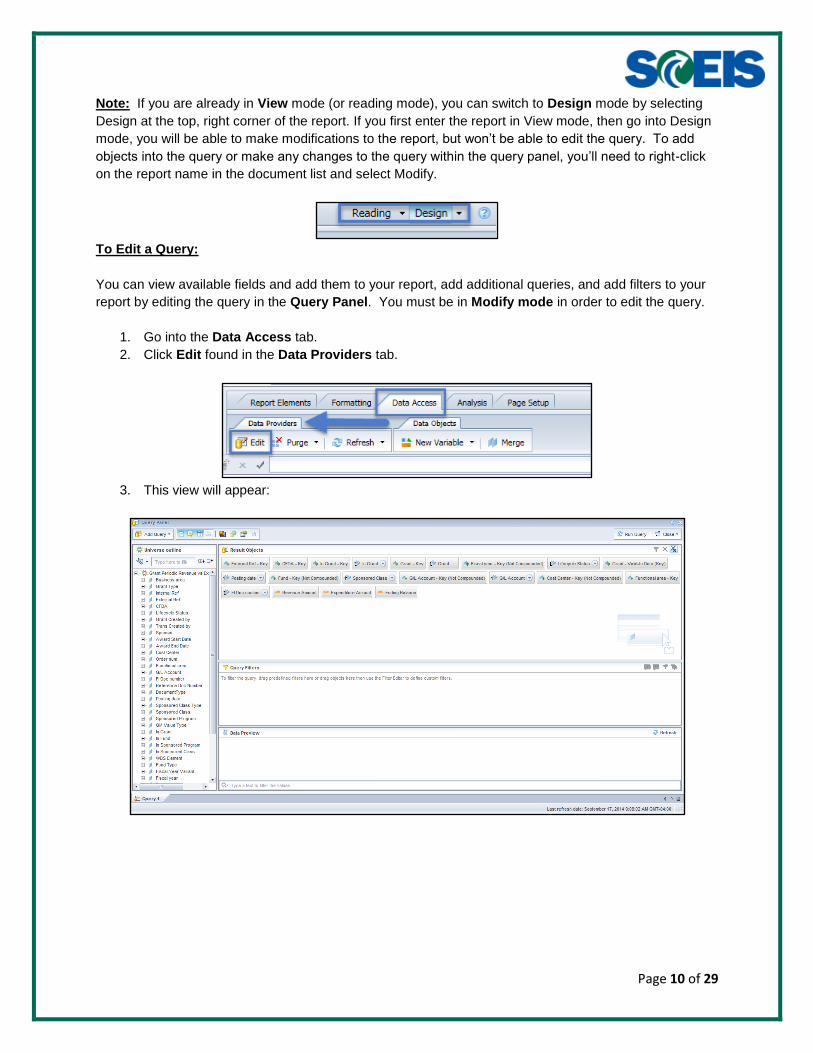
To Edit a Query:
You can view available fields and add them to your report, add additional queries, and add filters to your
report by editing the query in the Query Panel. You must be in Modify mode in order to edit the query.
1. Go into the Data Access tab.
2. Click Edit found in the Data Providers tab.
3. This view will appear:
Page 11 of 29
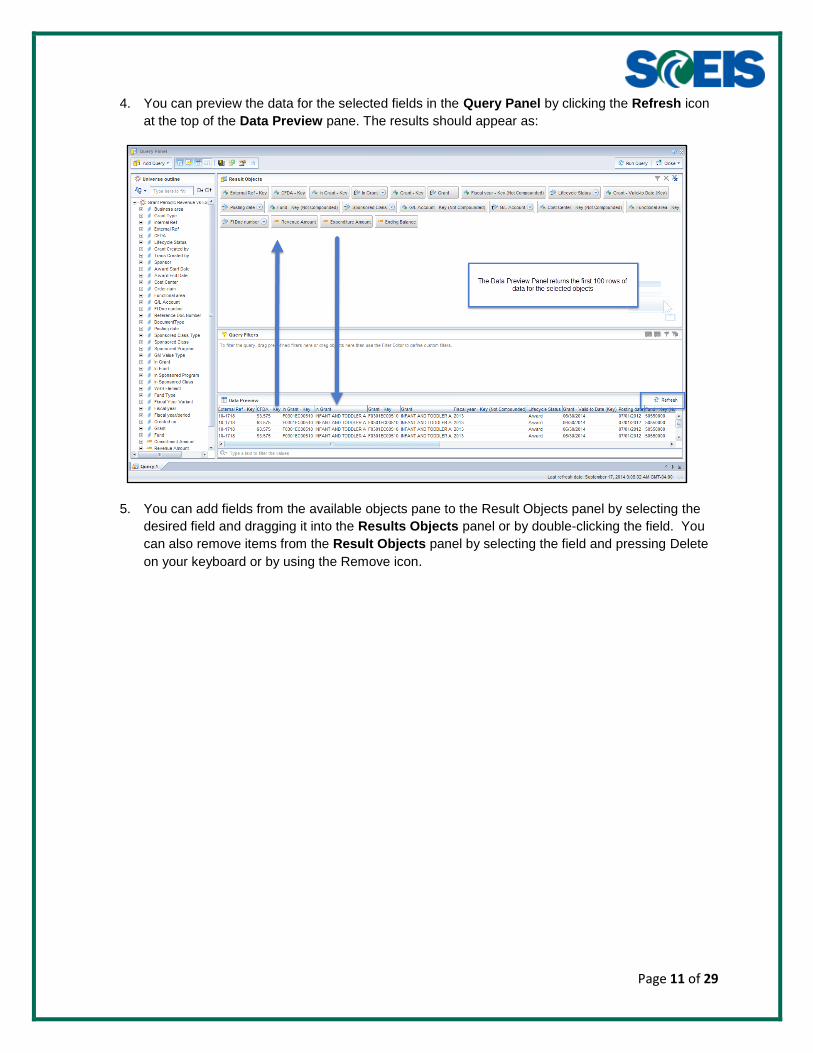
4. You can preview the data for the selected fields in the Query Panel by clicking the Refresh icon
at the top of the Data Preview pane. The results should appear as:
5. You can add fields from the available objects pane to the Result Objects panel by selecting the
desired field and dragging it into the Results Objects panel or by double-clicking the field. You
can also remove items from the Result Objects panel by selecting the field and pressing Delete
on your keyboard or by using the Remove icon.

Page 12 of 29
Note: You can add no more than 50 objects from a query into a report or an error will occur.
Filters
Filters can be applied to the entire report (document) to limit the returned results by using the criteria
fields in the prompt box or by placing a filter in the Query Filters pane in the Query Panel. Filters can
also be applied at the report level (tab) or on the tables.
To add a filter to the query in the Query Panel:
Note: When using a BEx query as a data provider, you cannot filter on Keys ( ) or Key Figures ( ).
You can place these filters at the report (tab) level or on the block (table), but not in the Query Filters
section.
1. Access the Query Panel by going to the Data Access ribbon and in the Data Providers tab,
choose Edit.

Page 13 of 29
2. Chose the field that you’d like to filter and drag and drop the object into the Query Filters pane.
3. Once you’ve selected the field to filter the query, you can choose the operand needed and select
the values by choosing from a list of values, typing a constant or adding the filter to the prompt
box.
To add a filter to a report (tab):
1. Go to the Analysis tab at the top of the page.
Page 14 of 29
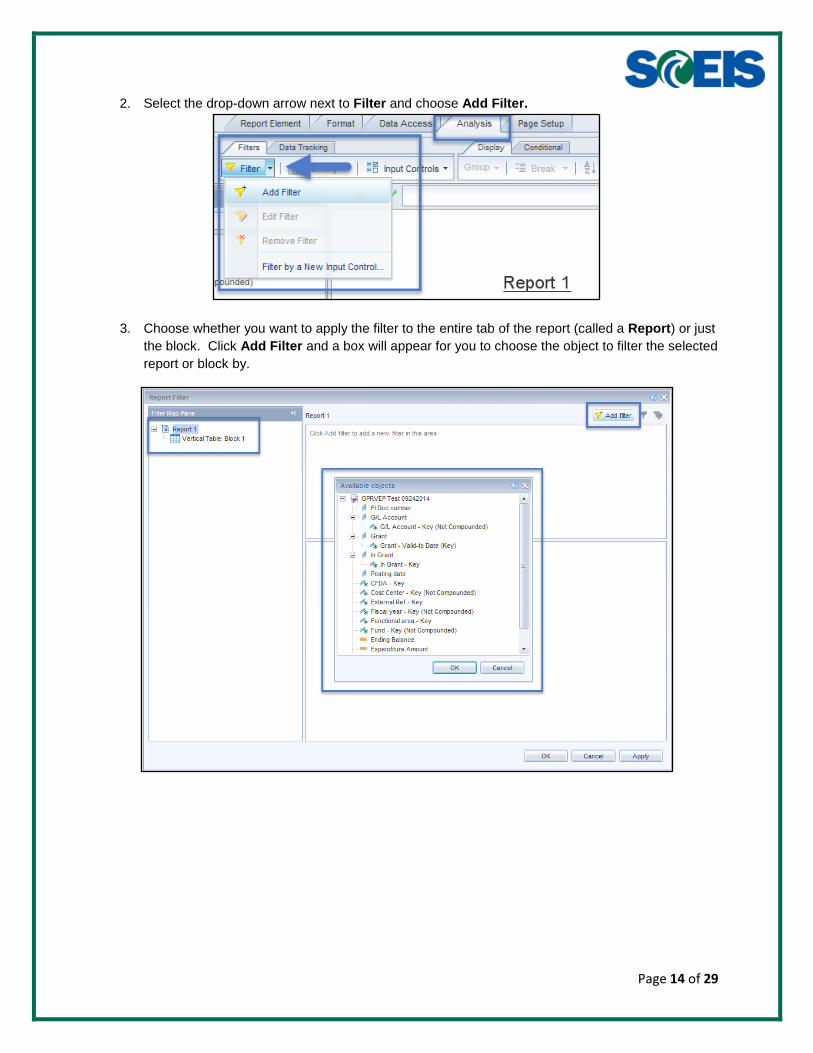
2. Select the drop-down arrow next to Filter and choose Add Filter.
3. Choose whether you want to apply the filter to the entire tab of the report (called a Report) or just
the block. Click Add Filter and a box will appear for you to choose the object to filter the selected
report or block by.

Page 15 of 29
4. Once the object to filter is chosen, you’ll see familiar operands and a list of values to choose from.
Note: To quickly add a filter to a table, you can right-click in the column of the object that you would like
to filter by and choose Filter and Add Filter.

Page 16 of 29
You will then see the filter panel for the block and be given the choice to choose an operand and list of
values for the selected column.
To remove filters from a report:
1. To remove all filters from a table, select the table by clicking the edges of the table. Place the
crosshairs of the mouse over the edge of the table and left-click. The table should appear with
darker lines around the edge and should look like:
Page 17 of 29
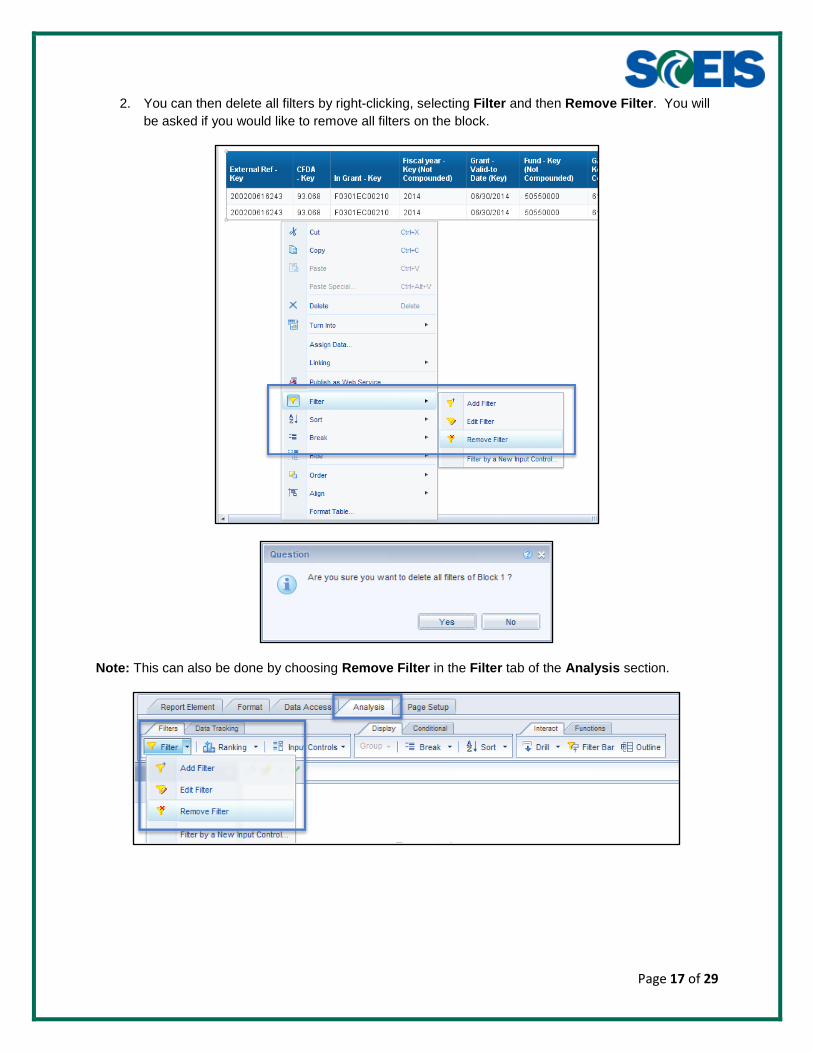
2. You can then delete all filters by right-clicking, selecting Filter and then Remove Filter. You will
be asked if you would like to remove all filters on the block.
Note: This can also be done by choosing Remove Filter in the Filter tab of the Analysis section.
Page 18 of 29
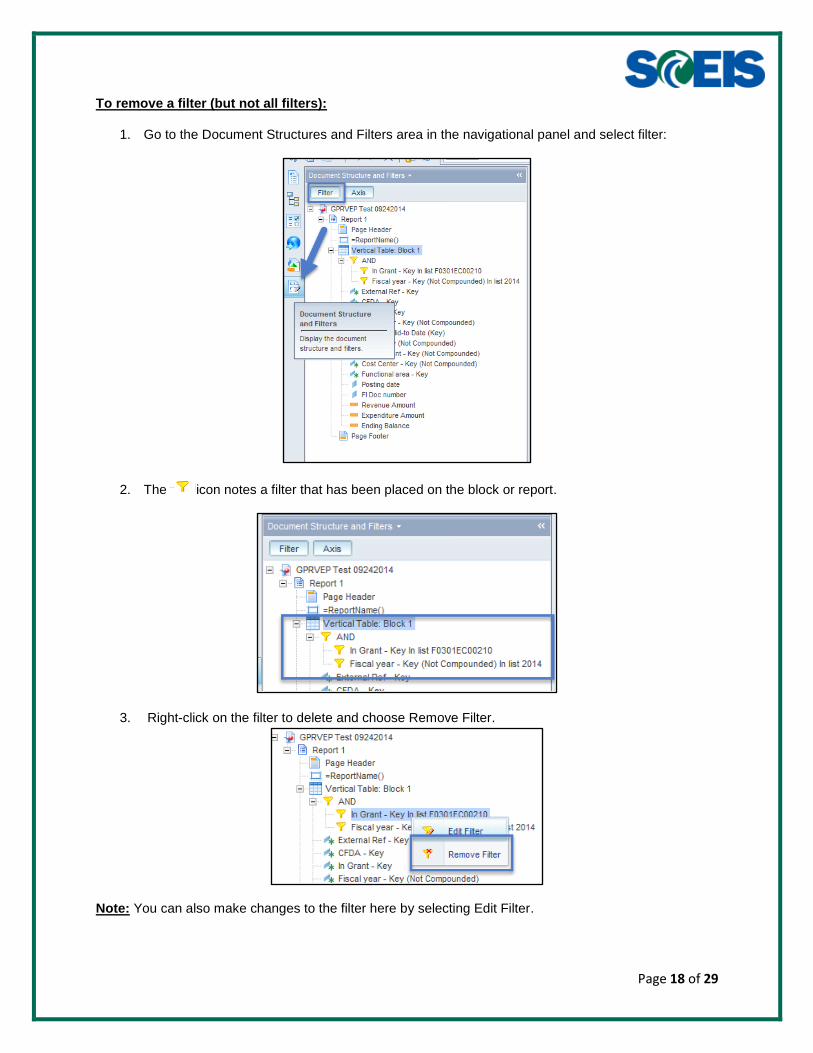
To remove a filter (but not all filters):
1. Go to the Document Structures and Filters area in the navigational panel and select filter:
2. The icon notes a filter that has been placed on the block or report.
3. Right-click on the filter to delete and choose Remove Filter.
Note: You can also make changes to the filter here by selecting Edit Filter.

Page 19 of 29
Variables:
Variables can be created just as in the previous version of Business Objects by selecting the Create
Variable icon next to the toolbar.
1. After you choose the Create Variable icon, the Variable Editor will appear and you can create a
variable using the functions, available objects, and operators listed.

Page 20 of 29
Note: If you are unsure how to use a particular function or what it does, the description below the
functions and the More on this function link is very helpful. The link will provide examples of uses for
the function and the syntax needed to use it.
Breaks
You can add breaks to any field to add subtotals.
1. Select the column that you’d like to add the break.
2. Select the Break icon within the Display tab in the Analysis ribbon.

Page 21 of 29
3. You can then subtotal your key figures using the Sum function.
4. You can also manage your break and change properties such as display first, display all, start on
a new page, avoid page breaks in block, etc by selecting the column with the break, selecting the
arrow next to the Break icon and choosing Manage.

Page 22 of 29
Note: To delete the header row for each break:
1. Select the table by right-clicking on any edge and go to Format Table.
2. Select the option Show table headers in the general tab of the properties box. The first header
row will then display duplicate headers.

Page 23 of 29
3. Select the duplicate header row by right-clicking and then choose Delete and Remove Row.
Quick Functions
Quick functions allow you to Sum, Count, Average, find the Min and Max, and Percentage of a column.
1. Select the column that you’d like to perform a calculation.
2. In the Analysis ribbon, go to the Functions tab and choose your desired function.
Page 24 of 29
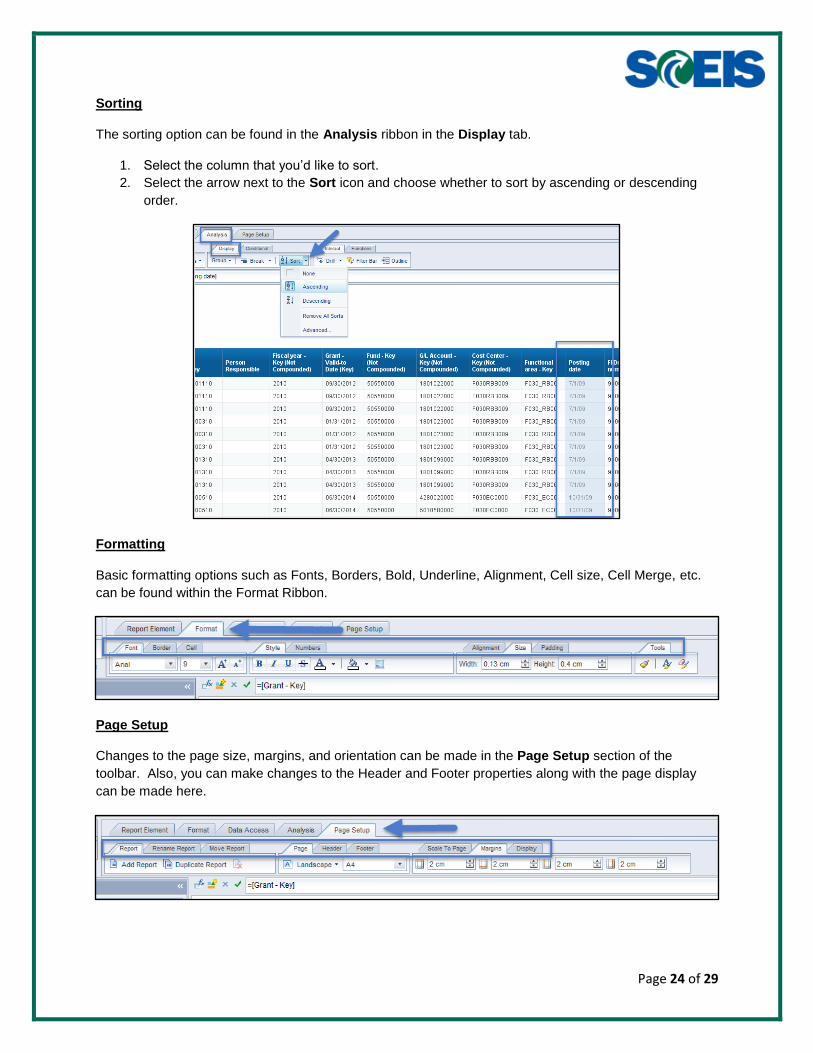
Sorting
The sorting option can be found in the Analysis ribbon in the Display tab.
1. Select the column that you’d like to sort.
2. Select the arrow next to the Sort icon and choose whether to sort by ascending or descending
order.
Formatting
Basic formatting options such as Fonts, Borders, Bold, Underline, Alignment, Cell size, Cell Merge, etc.
can be found within the Format Ribbon.
Page Setup
Changes to the page size, margins, and orientation can be made in the Page Setup section of the
toolbar. Also, you can make changes to the Header and Footer properties along with the page display
can be made here.

Page 25 of 29
Charts
Charts can easily be created from tables.
1. Once you have the data that you would like displayed within your table, select the table by right-
clicking on the outer portion of the table.
2. Go to Turn Into and select the type of chart that you need.

Page 26 of 29
3. Changes can then be made to the chart properties by right-clicking on the edge of the chart and
choosing Format Chart.

Page 27 of 29
Creating new reports and adding additional queries to existing report
To create a new report:
1. Select the Web Intelligence icon on the Homepage.
2. Select the New icon.
3. You will then be given the choice of type of data source. You can choose the Universes that
were used in Business Objects 3.1, an Excel spreadsheet, or use a BEx query directly. It is
suggested that you use BEx queries rather than Universes.
4. If you choose BEx as your data source, you will see all the available queries within their
associated Infoprovider once you expand CommonConnections. When you click on an
Infoprovider, you will see the available queries.
Page 28 of 29
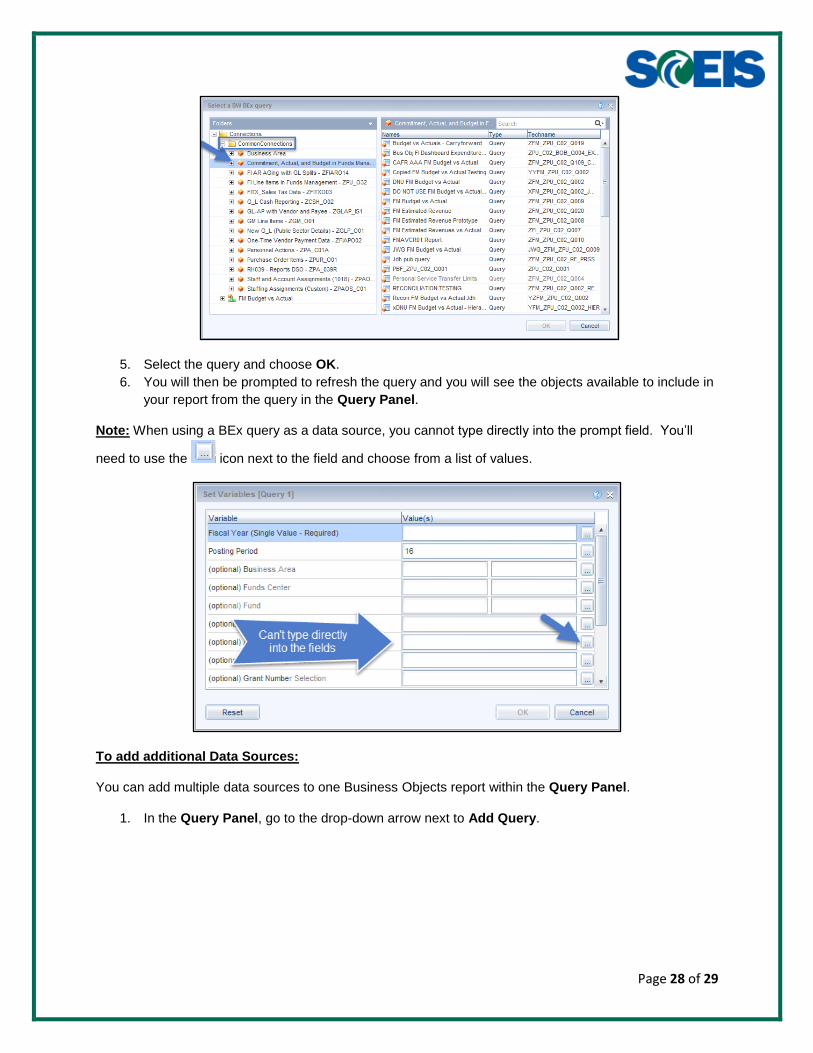
5. Select the query and choose OK.
6. You will then be prompted to refresh the query and you will see the objects available to include in
your report from the query in the Query Panel.
Note: When using a BEx query as a data source, you cannot type directly into the prompt field. You’ll
need to use the icon next to the field and choose from a list of values.
To add additional Data Sources:
You can add multiple data sources to one Business Objects report within the Query Panel.
1. In the Query Panel, go to the drop-down arrow next to Add Query.

Page 29 of 29
2. Select the desired data source.
Note: You must always include at least one key figure in the Result Objects pane in order for it to run.
You do not have to include it in your report, but it must be added to the Result Objects pane. Once you
add your data source, you can then add the information into your report.
Related Documents