Front cover

Welcome message from author
This document is posted to help you gain knowledge. Please leave a comment to let me know what you think about it! Share it to your friends and learn new things together.
Transcript
Front cover
2
Contents
1. Executive summary ....................................................................... 3
2. Business performance and outlook ................................................... 10
3. The business environment ............................................................. 26
4. The cost of doing business ............................................................. 30
5. Cross border postal services ........................................................... 33
6. The economy ............................................................................ 35
7. Business support initiatives ............................................................ 43
Appendix A – Methodology .................................................................. 51
Appendix B - Business confidence and economic trends ............................... 52
Draft submitted 4 February 2011
This report is protected under the copyright laws of the United Kingdom. It contains information that is proprietary and confidential to Perceptive Insight Market Research Ltd, and shall not be disclosed outside the recipient's company or duplicated, used or disclosed in whole or in part by the recipient for any purpose other than to evaluate this report. Any other use or disclosure in whole or in part of this information without the express written permission of Perceptive Insight Market Research Ltd is prohibited. © 2011 Perceptive Insight Market Research Ltd
3
1. Executive summary
InterTradeIreland has commissioned Perceptive Insight and Oxford Economics to conduct its
quarterly business monitor. The objectives for this project are:
∙ For the business monitor to act as a topical indicator of business confidence, cross-
border trade and business activity across the island of Ireland; and
∙ For the survey results to act as an evidence base on a variety of themes of interest to
business and policy makers, themes on which InterTradeIreland can build future
initiatives.
Approach Each quarter telephone interviews were conducted with over 1,000 business managers on
the island of Ireland. The sample is stratified by number of employees, sector and region
(Ireland/Northern Ireland) and the data weighted at the overall reporting level to reflect the
profile of businesses.
The interviewing for Q4 2010 took place during January 2011.
Business performance Sales levels While 19% have seen an increase in sales over the past quarter (Q4), 28% report no change
and 52% say that sales have decreased giving a net difference of -33% points. This
compares with a net difference of -15% in Q3. The trend data shows that after six months of
‘less harsh trading’, businesses are now facing sales conditions similar to Q1 2010 (Figure
1.1).
Similar to previous quarters, those most likely to be affected by a decrease in sales are
smaller businesses (54%). The leisure, hotel and catering sector appears to have been hit
quite hard in the past quarter with 71% saying sales have declined.
The sector which, on balance, is fairing better than others at the moment is manufacturing,
possibly because of its export activity. While 27% have reported an increase in sales, 46%
have reported a decline giving a net difference of -19% points. Indeed the net difference
among export companies is -18% points compared with -41% points for those that do not
export.
The findings North and South are similar with a net difference of -32% points for NI business
and -34% points for those in Ireland.

InterTradeIreland Business Monitor Q4 2010
4
Figure 1.1: Changes in quarterly sales
Net difference in those reporting an increase or decrease in sales in last quarter
Weighted data
Pe
rce
nta
ge
poin
t diffe
ren
ce
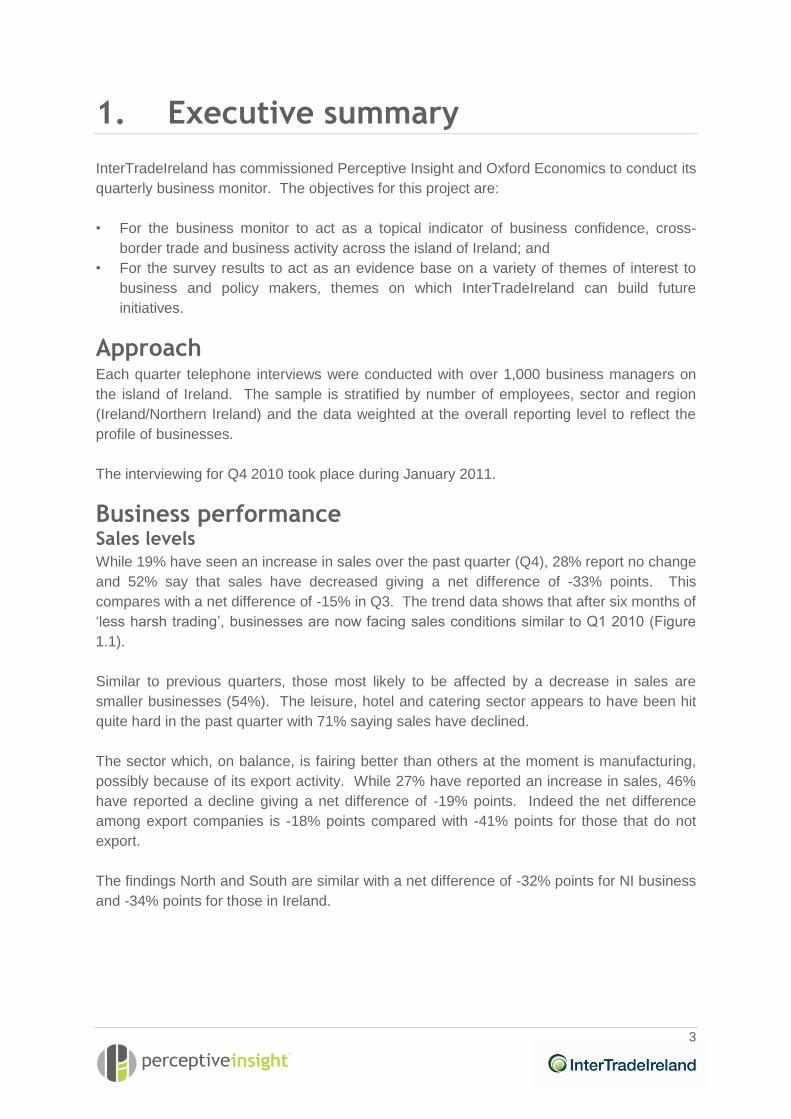
Employment levels While 5% report that they have taken on new employees in the last quarter, 18% say they
have made a reduction in staffing levels, giving a net balance of -13% points. Quarterly
trends in employment levels show a little negative movement since last quarter, with the
percentage hiring decreasing from 8% to 5%. The percentage reducing staff numbers has
changed from 16% to 18% (Figure 1.2).
Analysis by sector shows that it is those in construction (-18% point net difference) and
leisure, hotels and catering (-25% point net difference) who are most likely to have reduced
employee levels. Also those who do not export (-16% point net difference) are more likely
to have reduced numbers than those who export (-6% point net difference).
InterTradeIreland Business Monitor Q4 2010
5
Figure 1.2: Changes in quarterly employment levels
Net difference in those reporting an increase or decrease in employment levels
in last quarterWeighted data
Pe
rce
nta
ge
poin
t diffe
ren
ce
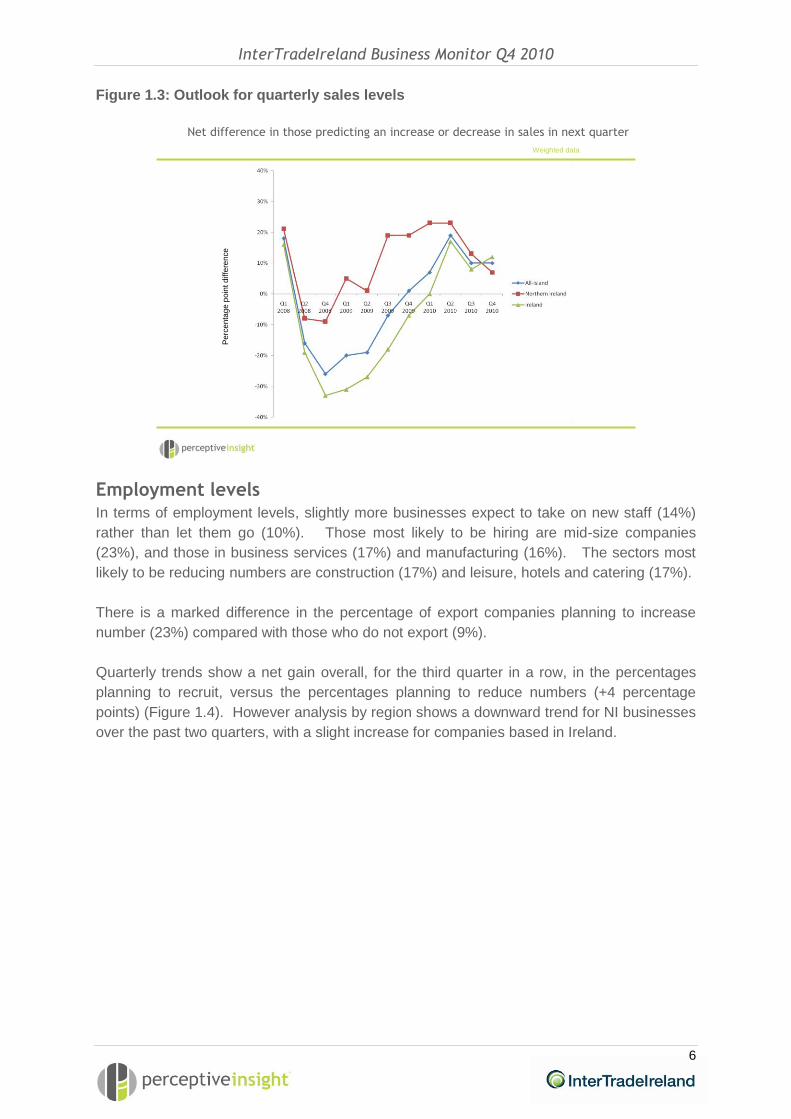
Business outlook Sales levels Looking forward to the next 12 months, 32% of businesses are optimistic that their level of
sales will increase, with 22% expecting a decrease. Large and mid-size businesses are
more positive than smaller enterprises, as are those who export and those who operate in
business services.
Those based in NI are slightly more likely to be positive than Southern companies, with 33%
expecting an increase compared with 31% in Ireland. However, it should be noted that when
looking at the net percentage point difference, sales optimism among NI businesses has
been decreasing over the past two quarters.
Analysis of the quarterly trends shows the percentages expecting their sales to increase or
decrease remain at similar levels to Q3 2010. Figure 1.3 shows the percentage point net
difference between those expecting sales to increase and those predicting a decrease.
InterTradeIreland Business Monitor Q4 2010
6
Figure 1.3: Outlook for quarterly sales levels
Net difference in those predicting an increase or decrease in sales in next quarter
Weighted data
Pe
rce
nta
ge
poin
t diffe
ren
ce
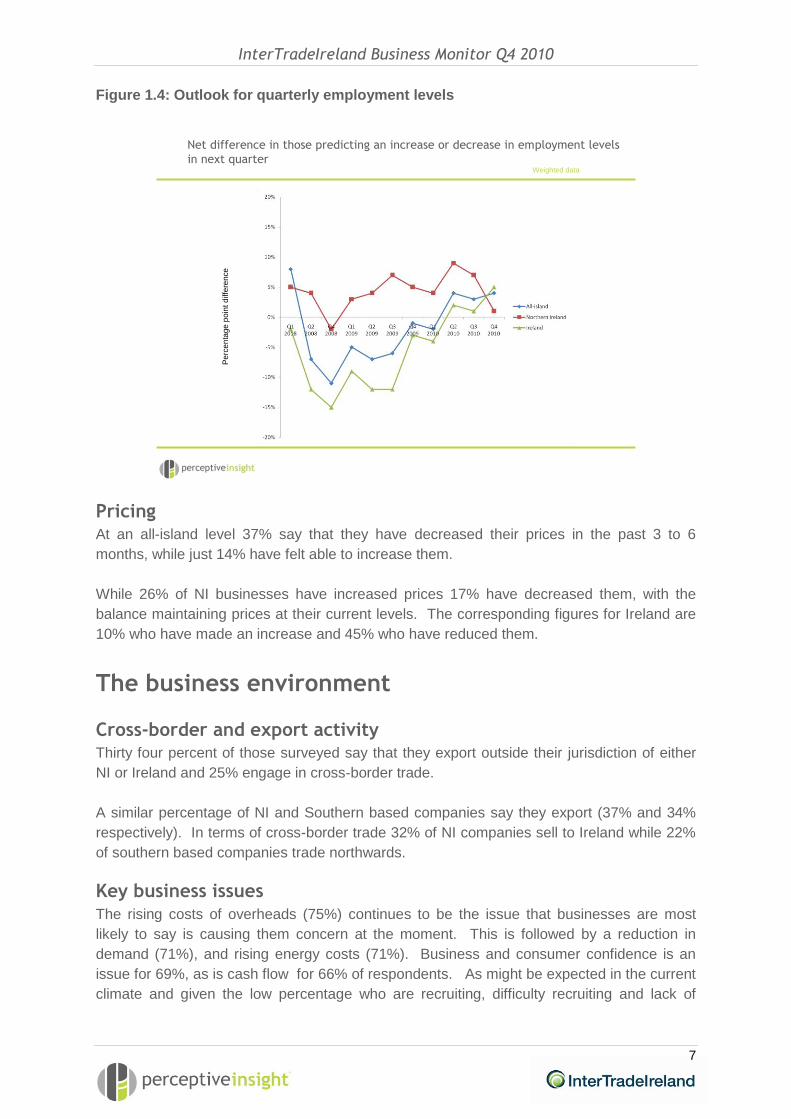
Employment levels In terms of employment levels, slightly more businesses expect to take on new staff (14%)
rather than let them go (10%). Those most likely to be hiring are mid-size companies
(23%), and those in business services (17%) and manufacturing (16%). The sectors most
likely to be reducing numbers are construction (17%) and leisure, hotels and catering (17%).
There is a marked difference in the percentage of export companies planning to increase
number (23%) compared with those who do not export (9%).
Quarterly trends show a net gain overall, for the third quarter in a row, in the percentages
planning to recruit, versus the percentages planning to reduce numbers (+4 percentage
points) (Figure 1.4). However analysis by region shows a downward trend for NI businesses
over the past two quarters, with a slight increase for companies based in Ireland.
InterTradeIreland Business Monitor Q4 2010
7
Figure 1.4: Outlook for quarterly employment levels
Net difference in those predicting an increase or decrease in employment levels
in next quarterWeighted data
Pe
rce
nta
ge
poin
t diffe
ren
ce
Pricing At an all-island level 37% say that they have decreased their prices in the past 3 to 6
months, while just 14% have felt able to increase them.
While 26% of NI businesses have increased prices 17% have decreased them, with the
balance maintaining prices at their current levels. The corresponding figures for Ireland are
10% who have made an increase and 45% who have reduced them.
The business environment Cross-border and export activity Thirty four percent of those surveyed say that they export outside their jurisdiction of either
NI or Ireland and 25% engage in cross-border trade.
A similar percentage of NI and Southern based companies say they export (37% and 34%
respectively). In terms of cross-border trade 32% of NI companies sell to Ireland while 22%
of southern based companies trade northwards.
Key business issues The rising costs of overheads (75%) continues to be the issue that businesses are most
likely to say is causing them concern at the moment. This is followed by a reduction in
demand (71%), and rising energy costs (71%). Business and consumer confidence is an
issue for 69%, as is cash flow for 66% of respondents. As might be expected in the current
climate and given the low percentage who are recruiting, difficulty recruiting and lack of
InterTradeIreland Business Monitor Q4 2010
8
appropriate skills in the workforce are much less of an issue than they would have been
previously.
The costs of doing business In relation to the costs of overheads, businesses are most likely to have witnessed an
increase in energy costs (69%) and transport costs (59%). (This is most likely linked to the
rising price of oil. Also December has been one of the coldest months on record for quite a
number of businesses on the island of Ireland). Half of businesses have also witnessed an
increase in supplier costs compared with 12 months ago, while 49% have seen an increase
in the cost of insurance and professional fees. Few businesses report that they have
reduced costs across the range of business areas. The areas were cost reductions are most
common are staff (16%) and rent and building costs (13%). It should be noted that
businesses in Northern Ireland were more likely than those in the South to say that costs
have increased significantly in each of the areas.
Looking ahead to the next 12 months approximately one third of businesses are expecting a
significant increase in their energy and transport costs; 38% expect no significant increase in
any area. In terms of cost reductions, the majority (82%) predict no significant decreases
although 7% are expecting to significantly reduce staff costs.
Interestingly, businesses in the South are more likely than those in NI to have switched
supplier for electricity (37% vs 18%), telecoms (30% vs 16%) and insurance (20% vs 17%),
even though those in NI are more likely to have reported a significant increase in costs for
each of these products.
Cross border postal services Cross border postal services are used by 12% of businesses, with 16% of NI businesses
using them compared with 10% in the South. The majority of those that use cross-border
postal services are satisfied with the service overall (75%), the reliability (78%), the time of
day mail is delivered (77%), with approximately one in ten dissatisfied with each of these
aspects. However 27% report that they are dissatisfied with pricing. Businesses based in NI
are much more likely to be dissatisfied with all aspects, apart from pricing, where
dissatisfaction levels are similar in each region.
The economy The impact of the economy on business Nine out of ten businesses report that the economic downturn has had either a severe or
moderate adverse impact on their business. Just 3% of businesses say that the economic
downturn has had a positive impact on their business while 6% believe it has had no impact
at all. Over half say they have been severely affected (54%). Those based in Ireland are
much more likely to have been severely affected (61%) compared with NI businesses (38%).

InterTradeIreland Business Monitor Q4 2010
9
Profitability In terms of profitability 28% of businesses report that they have not been able to remain
profitable in the past 12 months, down from 30% in Q2. This issue has affected 21% of NI
business and 30% of Irish businesses.
Payment terms As a consequence of the economic downturn, 37% report that customers have requested
longer payment terms, 62% lower prices and 62% discounts. These requests are much
more likely to have been made to those based in Ireland compared to NI companies.
Impact of the ‘bail out’ in the South Businesses were asked what impact they thought the bail out would have on both the
economy in their jurisdiction and on their own business. While 65% predicted an adverse
impact on the economy just 46% thought it would have an adverse impact on their business.
As might be expected those in the South were more likely to say there would be an adverse
impact on the economy there (69%) compared with 52% who thought it would adversely
impact the NI economy. While 54% of businesses in the South predicted an adverse impact
from the bail out on their business, 30% of NI businesses thought the same.
Business support initiatives While one third of businesses (34%) are aware of InterTradeIreland as an organisation fewer
are aware that they provide business support (27%). Awareness levels for support are lower
among those based in the South (25%) compared with NI businesses (32%).
As a benchmark, 84% of NI businesses are aware that Invest NI provides business support
and 90% of Southern businesses are aware of this role by Enterprise Ireland.
Use of the various agencies for business support was low. In NI 9% of businesses had used
Invest NI, 5% their local enterprise agency and 1% InterTradeIreland. In the South 8% had
used Enterprise Ireland, 3% FAS and 1% InterTradeIreland.
The areas that businesses are most likely to be interested in for support are sales
development and, strategy development and business planning. Larger businesses are
more likely to want support for innovation. Those who currently export are much more likely
than those who do not to want support on importing and exporting.
The main difficulty that businesses have encountered when seeking business support from
government agencies is the volume of bureaucracy.
Conclusions <to be discussed>
InterTradeIreland Business Monitor Q4 2010
10
2. Business performance and outlook
In this section we detail how businesses have performed in the fourth quarter of 2010
(October to December) and their future performance expectations. We compare the change
in sales and employment levels during the quarter and provide an indication of how
businesses expect both to change in the next twelve months.
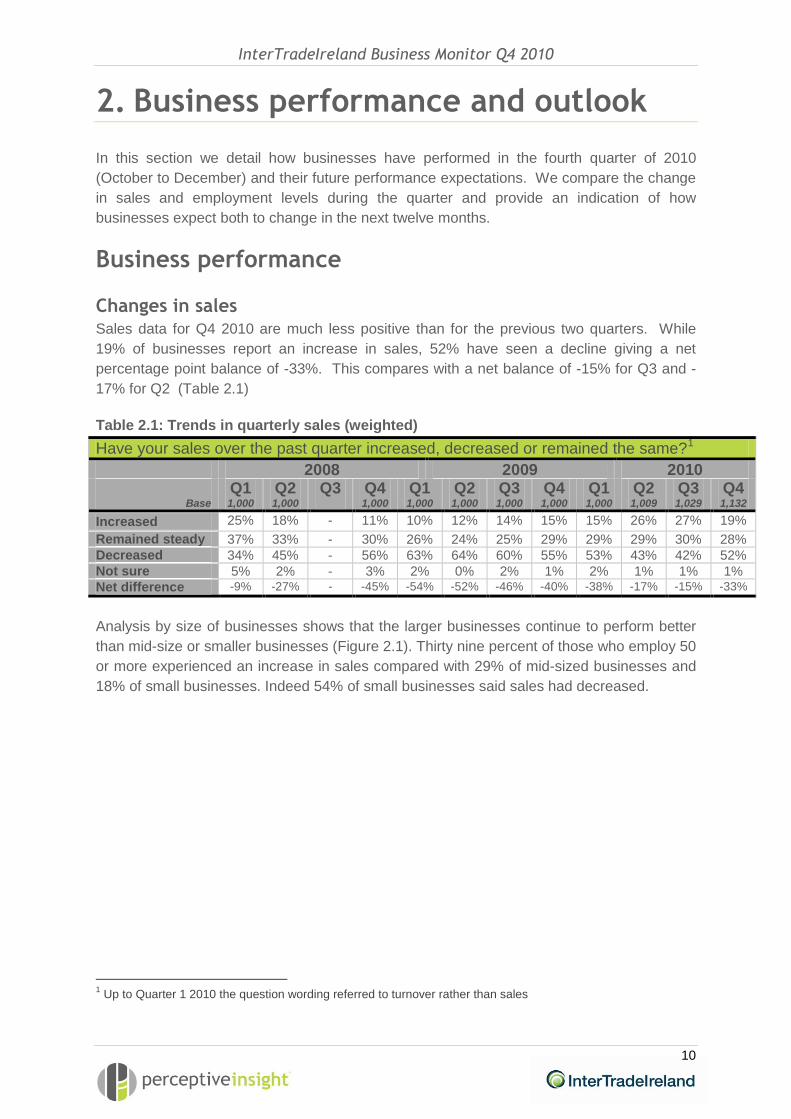
Business performance Changes in sales Sales data for Q4 2010 are much less positive than for the previous two quarters. While
19% of businesses report an increase in sales, 52% have seen a decline giving a net
percentage point balance of -33%. This compares with a net balance of -15% for Q3 and -
17% for Q2 (Table 2.1)
Table 2.1: Trends in quarterly sales (weighted)
Have your sales over the past quarter increased, decreased or remained the same?1
2008 2009 2010 Q1 Q2 Q3 Q4 Q1 Q2 Q3 Q4 Q1 Q2 Q3 Q4
Base 1,000 1,000 1,000 1,000 1,000 1,000 1,000 1,000 1,009 1,029 1,132
Increased 25% 18% - 11% 10% 12% 14% 15% 15% 26% 27% 19%
Remained steady 37% 33% - 30% 26% 24% 25% 29% 29% 29% 30% 28%
Decreased 34% 45% - 56% 63% 64% 60% 55% 53% 43% 42% 52%
Not sure 5% 2% - 3% 2% 0% 2% 1% 2% 1% 1% 1%
Net difference -9% -27% - -45% -54% -52% -46% -40% -38% -17% -15% -33%
Analysis by size of businesses shows that the larger businesses continue to perform better
than mid-size or smaller businesses (Figure 2.1). Thirty nine percent of those who employ 50
or more experienced an increase in sales compared with 29% of mid-sized businesses and
18% of small businesses. Indeed 54% of small businesses said sales had decreased.
1 Up to Quarter 1 2010 the question wording referred to turnover rather than sales

InterTradeIreland Business Monitor Q4 2010
11
Figure 2.1: Changes in quarterly sales by size
-54
-40
-29
-52
18
29
39
19
-50 -30 -10 10 30 50
Have your sales over the past quarter increased, decreased or remained the same
Decreased Net differenceIncreased
-33%
+10%
-11%
-36%
OverallBase: 1132 / 1132
50 or more employeesBase: 128 / 31
11 to 49 employeesBase: 226 / 105
10 or fewer employeesBase: 778 / 996
Weighted data
%
Base: unweighted /weighted
The sectors most likely to be experiencing a decrease in sales are leisure, hotels and
catering (71%), and other services (59%) and retail and distribution (56%). The sector hit
least is business services (40%). No sector experienced positive net change in sales.
However it is the manufacturing sector that is reporting the smallest net percentage point
difference (-19%).
Figure 2.2: Changes in quarterly sales by sector
-59
-56
-71
-40
-46
-46
-46
-52
20
21
12
20
12
27
20
19
-80 -60 -40 -20 0 20
Decreased Net
difference
Increased
-33%
-26%
-19%
-34%
-20%
-59%
-35%
-39%
Have your sales over the past quarter increased, decreased or remained the same
OverallBase: 1132/ 1132
AgricultureBase: 56 / 63
ConstructionBase: 103 / 106
Leisure, hotels, cateringBase: 168 / 156
ManufacturingBase: 201 /170
Business servicesBase: 213 / 224
Retail, distributionBase: 275 / 285
Other servicesBase: 116 / 128
Base: unweighted /weighted
Weighted data
%
InterTradeIreland Business Monitor Q4 2010
12
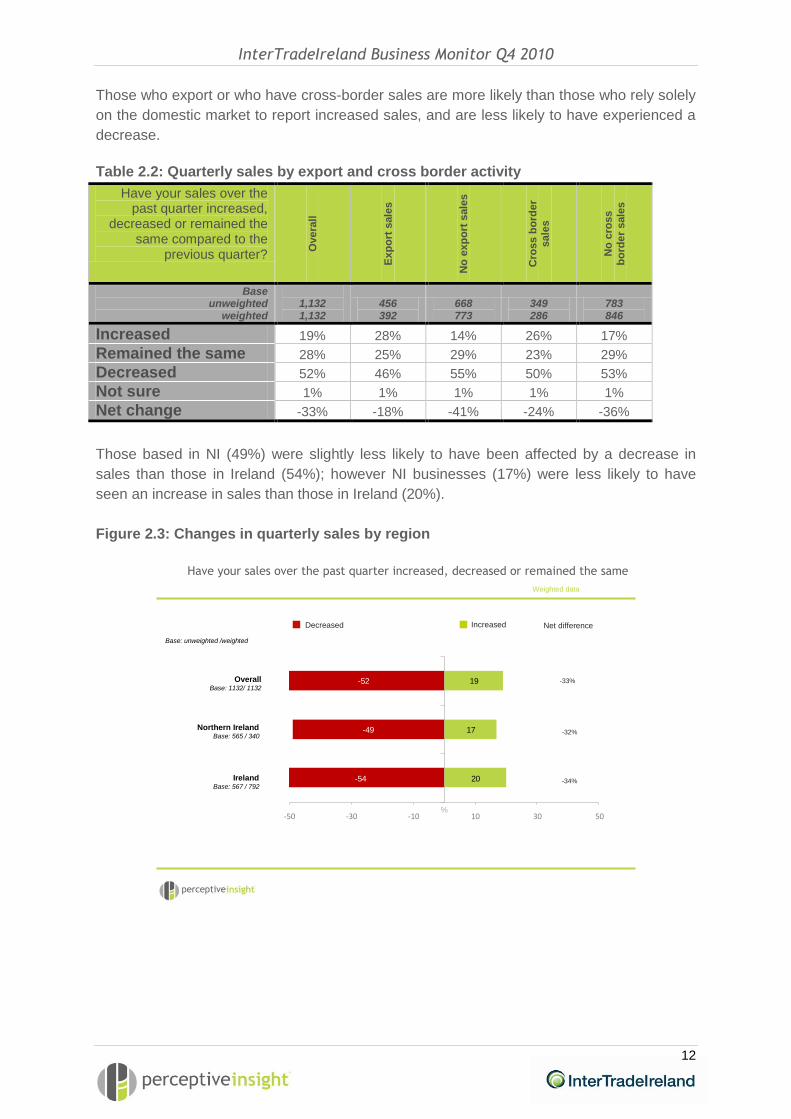
Those who export or who have cross-border sales are more likely than those who rely solely
on the domestic market to report increased sales, and are less likely to have experienced a
decrease.
Table 2.2: Quarterly sales by export and cross border activity
Have your sales over the past quarter increased,
decreased or remained the same compared to the
previous quarter?
Overa
ll
Exp
ort
sale
s
No
exp
ort
sale
s
Cro
ss b
ord
er
sale
s
No
cro
ss
bo
rde
r s
ale
s
Base unweighted
weighted
1,132 1,132
456 392
668 773
349 286
783 846
Increased 19% 28% 14% 26% 17%
Remained the same 28% 25% 29% 23% 29%
Decreased 52% 46% 55% 50% 53%
Not sure 1% 1% 1% 1% 1%
Net change -33% -18% -41% -24% -36%
Those based in NI (49%) were slightly less likely to have been affected by a decrease in
sales than those in Ireland (54%); however NI businesses (17%) were less likely to have
seen an increase in sales than those in Ireland (20%).
Figure 2.3: Changes in quarterly sales by region
-54
-49
-52
20
17
19
-50 -30 -10 10 30 50
Decreased Net differenceIncreased
-33%
-32%
-34%
Have your sales over the past quarter increased, decreased or remained the same
OverallBase: 1132/ 1132
Northern IrelandBase: 565 / 340
IrelandBase: 567 / 792
Base: unweighted /weighted
Weighted data
%
InterTradeIreland Business Monitor Q4 2010
13
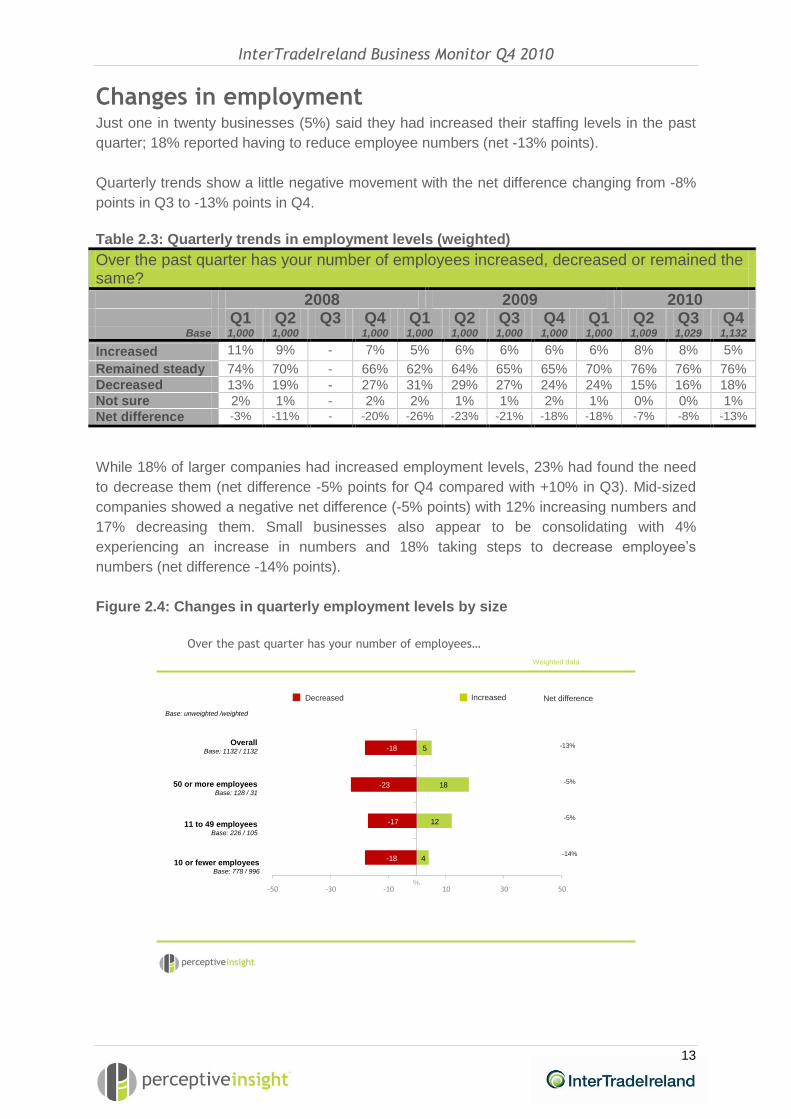
Changes in employment Just one in twenty businesses (5%) said they had increased their staffing levels in the past
quarter; 18% reported having to reduce employee numbers (net -13% points).
Quarterly trends show a little negative movement with the net difference changing from -8%
points in Q3 to -13% points in Q4.
Table 2.3: Quarterly trends in employment levels (weighted)
Over the past quarter has your number of employees increased, decreased or remained the same?
2008 2009 2010 Q1 Q2 Q3 Q4 Q1 Q2 Q3 Q4 Q1 Q2 Q3 Q4
Base 1,000 1,000 1,000 1,000 1,000 1,000 1,000 1,000 1,009 1,029 1,132
Increased 11% 9% - 7% 5% 6% 6% 6% 6% 8% 8% 5%
Remained steady 74% 70% - 66% 62% 64% 65% 65% 70% 76% 76% 76%
Decreased 13% 19% - 27% 31% 29% 27% 24% 24% 15% 16% 18%
Not sure 2% 1% - 2% 2% 1% 1% 2% 1% 0% 0% 1%
Net difference -3% -11% - -20% -26% -23% -21% -18% -18% -7% -8% -13%
While 18% of larger companies had increased employment levels, 23% had found the need
to decrease them (net difference -5% points for Q4 compared with +10% in Q3). Mid-sized
companies showed a negative net difference (-5% points) with 12% increasing numbers and
17% decreasing them. Small businesses also appear to be consolidating with 4%
experiencing an increase in numbers and 18% taking steps to decrease employee’s
numbers (net difference -14% points).
Figure 2.4: Changes in quarterly employment levels by size
Over the past quarter has your number of employees…
-18
-17
-23
-18
4
12
18
5
-50 -30 -10 10 30 50
Decreased Net differenceIncreased
-13%
-5%
-5%
-14%
Weighted data
Base: unweighted /weighted
%
OverallBase: 1132 / 1132
50 or more employeesBase: 128 / 31
11 to 49 employeesBase: 226 / 105
10 or fewer employeesBase: 778 / 996
InterTradeIreland Business Monitor Q4 2010
14
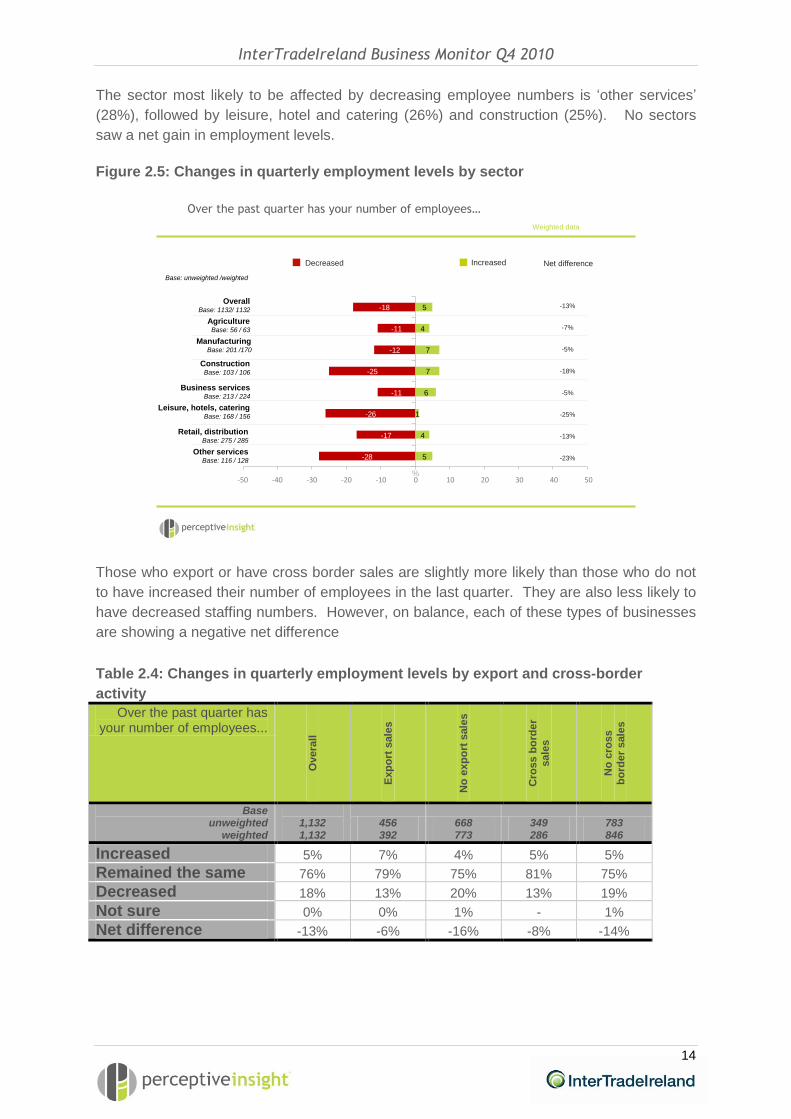
The sector most likely to be affected by decreasing employee numbers is ‘other services’
(28%), followed by leisure, hotel and catering (26%) and construction (25%). No sectors
saw a net gain in employment levels.
Figure 2.5: Changes in quarterly employment levels by sector
Over the past quarter has your number of employees…
-28
-17
-26
-11
-25
-12
-11
-18
5
4
1
6
7
7
4
5
-50 -40 -30 -20 -10 0 10 20 30 40 50
Decreased Net differenceIncreased
-13%
-7%
-5%
-18%
-5%
-25%
-13%
-23%
Weighted data
Base: unweighted /weighted
%
OverallBase: 1132/ 1132
AgricultureBase: 56 / 63
ConstructionBase: 103 / 106
Leisure, hotels, cateringBase: 168 / 156
ManufacturingBase: 201 /170
Business servicesBase: 213 / 224
Retail, distributionBase: 275 / 285
Other servicesBase: 116 / 128
Those who export or have cross border sales are slightly more likely than those who do not
to have increased their number of employees in the last quarter. They are also less likely to
have decreased staffing numbers. However, on balance, each of these types of businesses
are showing a negative net difference
Table 2.4: Changes in quarterly employment levels by export and cross-border
activity
Over the past quarter has your number of employees...
Overa
ll
Exp
ort
sale
s
No
exp
ort
sale
s
Cro
ss b
ord
er
sale
s
No
cro
ss
bo
rde
r s
ale
s
Base unweighted
weighted
1,132 1,132
456 392
668 773
349 286
783 846
Increased 5% 7% 4% 5% 5%
Remained the same 76% 79% 75% 81% 75%
Decreased 18% 13% 20% 13% 19%
Not sure 0% 0% 1% - 1%
Net difference -13% -6% -16% -8% -14%
InterTradeIreland Business Monitor Q4 2010
15
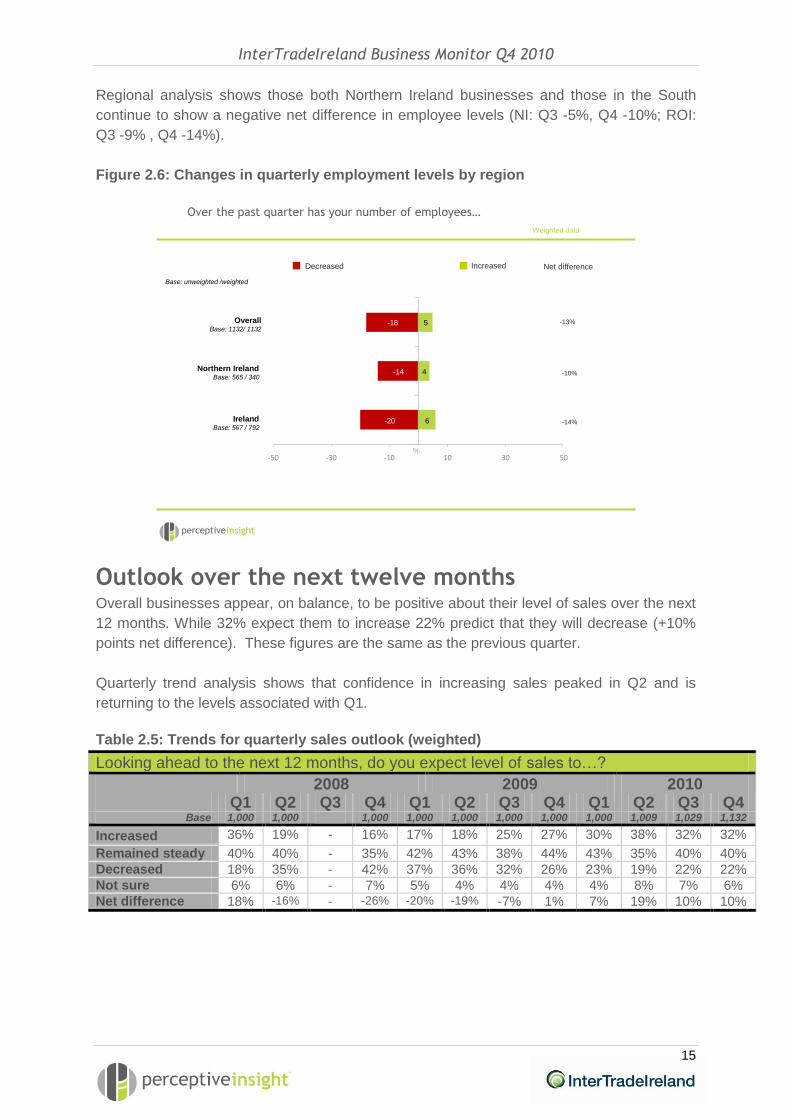
Regional analysis shows those both Northern Ireland businesses and those in the South
continue to show a negative net difference in employee levels (NI: Q3 -5%, Q4 -10%; ROI:
Q3 -9% , Q4 -14%).
Figure 2.6: Changes in quarterly employment levels by region
Over the past quarter has your number of employees…
-20
-14
-18
6
4
5
-50 -30 -10 10 30 50
Decreased Net differenceIncreased
-13%
-10%
-14%
Weighted data
Base: unweighted /weighted
%
OverallBase: 1132/ 1132
Northern IrelandBase: 565 / 340
IrelandBase: 567 / 792
Outlook over the next twelve months Overall businesses appear, on balance, to be positive about their level of sales over the next
12 months. While 32% expect them to increase 22% predict that they will decrease (+10%
points net difference). These figures are the same as the previous quarter.
Quarterly trend analysis shows that confidence in increasing sales peaked in Q2 and is
returning to the levels associated with Q1.
Table 2.5: Trends for quarterly sales outlook (weighted)
Looking ahead to the next 12 months, do you expect level of sales to…?
2008 2009 2010 Q1 Q2 Q3 Q4 Q1 Q2 Q3 Q4 Q1 Q2 Q3 Q4
Base 1,000 1,000 1,000 1,000 1,000 1,000 1,000 1,000 1,009 1,029 1,132
Increased 36% 19% - 16% 17% 18% 25% 27% 30% 38% 32% 32%
Remained steady 40% 40% - 35% 42% 43% 38% 44% 43% 35% 40% 40%
Decreased 18% 35% - 42% 37% 36% 32% 26% 23% 19% 22% 22%
Not sure 6% 6% - 7% 5% 4% 4% 4% 4% 8% 7% 6%
Net difference 18% -16% - -26% -20% -19% -7% 1% 7% 19% 10% 10%

InterTradeIreland Business Monitor Q4 2010
16
The large and mid-sized companies are more likely to be optimistic about future sales with
the net results showing +30% points for those with 50+ employees (up from +19% in Q3).
The net differences for mid-sized businesses are +29% (down from +36% in Q3) and +8%
for those employing 10 or fewer (up slightly from +6% in Q3).
Figure 2.7: Outlook for quarterly sales by size
Looking ahead to the next 12 months, do you expect level of sales to …
-23
-14
-17
-22
31
43
47
32
-50 -30 -10 10 30 50
Decrease Net differenceIncrease
+10%
+30%
+29%
+8%
Weighted data
Base: unweighted /weighted
%
OverallBase: 1132 / 1132
50 or more employeesBase: 128 / 31
11 to 49 employeesBase: 226 / 105
10 or fewer employeesBase: 778 / 996
The net difference in those predicting an increase or decrease in sales shows that the
business services and agriculture sectors are the most positive sectors (with net gains of
+26% points, and +16% points respectively). The construction sector is least positive with
-4% point net difference between those predicting a decrease or increase in sales.

InterTradeIreland Business Monitor Q4 2010
17
Figure 2.8: Outlook for quarterly sales by sector
Looking ahead to the next 12 months, do you expect level of sales to …
-22
-19
-34
-15
-27
-22
-20
-22
29
30
34
40
23
33
36
32
-50 -40 -30 -20 -10 0 10 20 30 40 50
Decrease Net differenceIncrease
+10%
+16%
+11%
-4%
+25%
0%
+11%
+7%
Weighted data
Base: unweighted /weighted
%
OverallBase: 1132/ 1132
AgricultureBase: 56 / 63
ConstructionBase: 103 / 106
Leisure, hotels, cateringBase: 168 / 156
ManufacturingBase: 201 /170
Business servicesBase: 213 / 224
Retail, distributionBase: 275 / 285
Other servicesBase: 116 / 128
Those who export or who have cross border sales are much more likely to be optimistic
about increasing sales in the next quarter than those who do not.
Table 2.6: Outlook for quarterly sales by export and cross border activity
Do you expect your level of sales to increase, decrease
or remain the same compared to the past year?
Overa
ll
Exp
ort
sale
s
No
exp
ort
sale
s
Cro
ss b
ord
er
sale
s
No
cro
ss
bo
rde
r s
ale
s
Base unweighted
weighted
1,132 1,132
456 392
668 773
349 286
783 846
Increased 32% 44% 26% 41% 29%
Remained the same 40% 35% 42% 37% 41%
Decreased 22% 18% 24% 20% 23%
Not sure 6% 3% 7% 3% 7%
Net change 10% 26% 2% 21% 6%
NI based businesses are almost equally positive in their outlook as those in Ireland, with
33% expecting growth compared to 31% in Ireland. The percentages predicting increased
sales are similar in both regions when compared to the Q3 figures (35% and 30%
respectively predicted growth in Q3).

InterTradeIreland Business Monitor Q4 2010
18
Figure 2.9: Outlook for quarterly sales by region
Looking ahead to the next 12 months, do you expect level of sales to …
-24
-21
-22
31
33
32
-50 -30 -10 10 30 50
Decrease Net differenceIncrease
+10%
+12%
+7%
Weighted data
Base: unweighted /weighted
%
OverallBase: 1132/ 1132
Northern IrelandBase: 565 / 340
IrelandBase: 567 / 792
Looking ahead to the next 12 months, on balance companies are slightly more positive in
terms of employee numbers. While 10% expect their numbers to decrease 14% are planning
an increase (+4% points net difference). These figures are very similar to Q2 and Q3.
Table 2.7: Trends in quarterly employment levels outlook (weighted)
Looking ahead to the next 12 months, do you expect number of employees to…
2008 2009 2010 Q1 Q2 Q3 Q4 Q1 Q2 Q3 Q4 Q1 Q2 Q3 Q4
Base 1,000 1,000 1,000 1,000 1,000 1,000 1,000 1,000 1,009 1,029 1,132
Increased 14% 7% - 5% 7% 6% 8% 9% 8% 14% 13% 14%
Remained steady 79% 76% - 77% 76% 77% 74% 78% 80% 73% 74% 71%
Decreased 6% 14% - 16% 13% 13% 15% 10% 10% 10% 10% 10%
Not sure 2% 3% - 4% 4% 3% 3% 3% 2% 4% 3% 5%
Net difference 8% -7% - -11% -5% -7% -6% -1% -2% 4% 3% 4%
InterTradeIreland Business Monitor Q4 2010
19
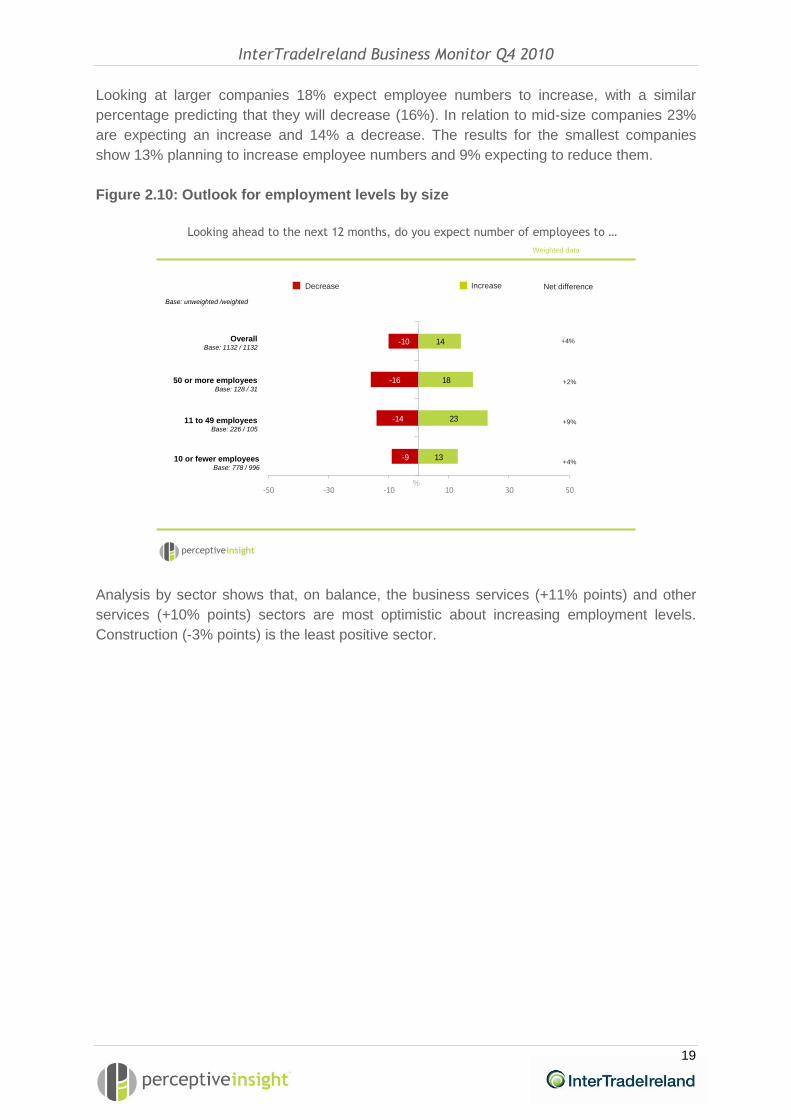
Looking at larger companies 18% expect employee numbers to increase, with a similar
percentage predicting that they will decrease (16%). In relation to mid-size companies 23%
are expecting an increase and 14% a decrease. The results for the smallest companies
show 13% planning to increase employee numbers and 9% expecting to reduce them.
Figure 2.10: Outlook for employment levels by size
Looking ahead to the next 12 months, do you expect number of employees to …
-9
-14
-16
-10
13
23
18
14
-50 -30 -10 10 30 50
Decrease Net differenceIncrease
+4%
+2%
+9%
+4%
Weighted data
Base: unweighted /weighted
%
OverallBase: 1132 / 1132
50 or more employeesBase: 128 / 31
11 to 49 employeesBase: 226 / 105
10 or fewer employeesBase: 778 / 996
Analysis by sector shows that, on balance, the business services (+11% points) and other
services (+10% points) sectors are most optimistic about increasing employment levels.
Construction (-3% points) is the least positive sector.

InterTradeIreland Business Monitor Q4 2010
20
Figure 2.11: Outlook for employment levels by sector
-8
-7
-17
-6
-17
-11
-5
-10
18
12
10
17
14
16
7
14
-50 -40 -30 -20 -10 0 10 20 30 40 50
Decrease Increase
+4%
+2%
+5%
-3%
+11%
-7%
+5%
+10%
Looking ahead to the next 12 months, do you expect number of employees to …
Weighted data
Net difference
Base: unweighted /weighted
%
OverallBase: 1132/ 1132
AgricultureBase: 56 / 63
ConstructionBase: 103 / 106
Leisure, hotels, cateringBase: 168 / 156
ManufacturingBase: 201 /170
Business servicesBase: 213 / 224
Retail, distributionBase: 275 / 285
Other servicesBase: 116 / 128
Exporters and those with cross border sales are more likely than those who rely solely on
the domestic market to say that they expect to increase employee numbers in the next
quarter.
Table 2.8: Outlook for employment levels by export and cross border activity
And do you expect the number of people you
employ to increase, decrease or remain the
same compared to the past year?
Overa
ll
Exp
ort
sale
s
No
exp
ort
sale
s
Cro
ss b
ord
er
sale
s
No
cro
ss
bo
rde
r s
ale
s
Base unweighted
weighted
1,132 1,132
456 392
668 773
349 286
783 846
Increased 14% 23% 9% 22% 11%
Remained the same 71% 67% 73% 68% 72%
Decreased 10% 7% 11% 8% 11%
Not sure 5% 3% 6% 3% 6%
Net change 4% 16% -2% 14% 0%
InterTradeIreland Business Monitor Q4 2010
21
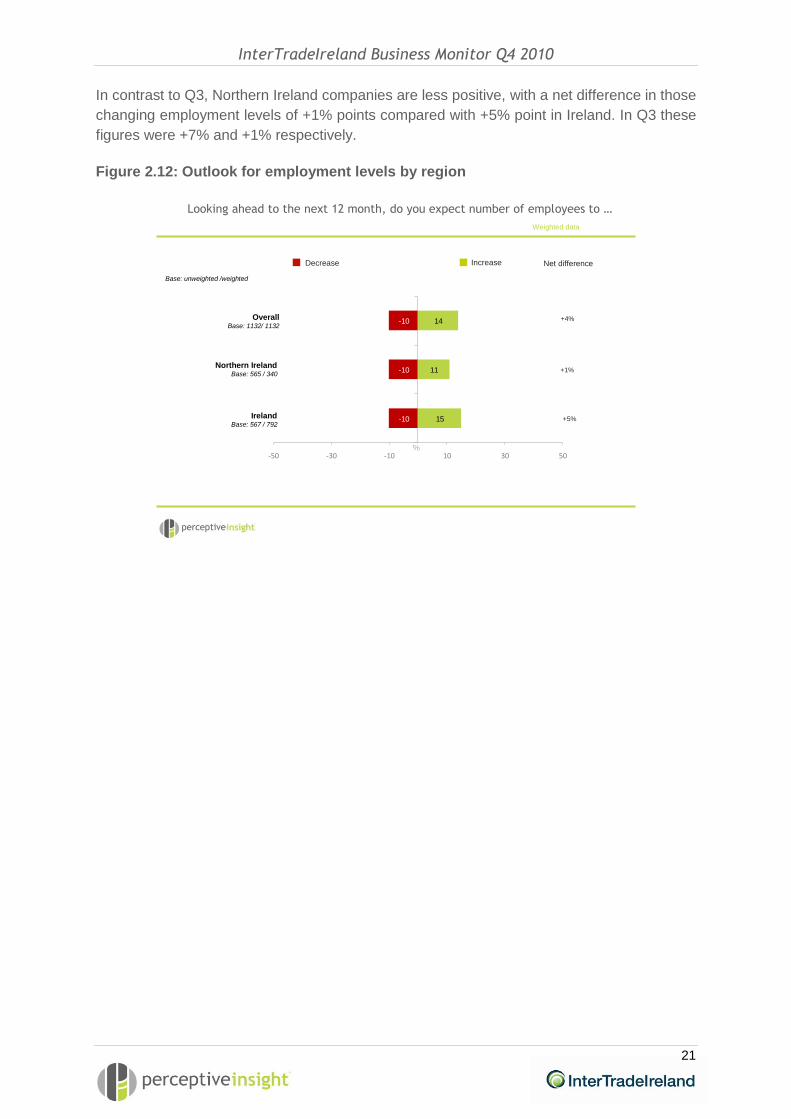
In contrast to Q3, Northern Ireland companies are less positive, with a net difference in those
changing employment levels of +1% points compared with +5% point in Ireland. In Q3 these
figures were +7% and +1% respectively.
Figure 2.12: Outlook for employment levels by region
-10
-10
-10
15
11
14
-50 -30 -10 10 30 50
Decrease Net differenceIncrease
+4%
+1%
+5%
Looking ahead to the next 12 month, do you expect number of employees to …
Weighted data
Base: unweighted /weighted
%
OverallBase: 1132/ 1132
Northern IrelandBase: 565 / 340
IrelandBase: 567 / 792
InterTradeIreland Business Monitor Q4 2010
22
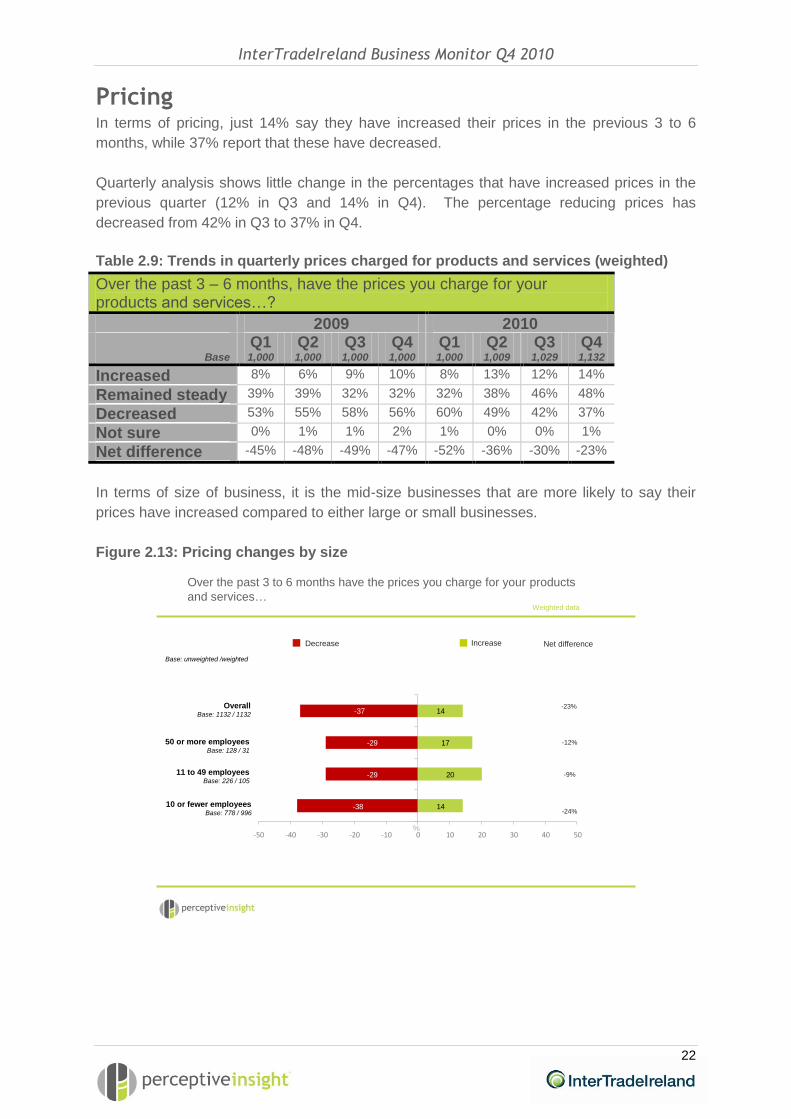
Pricing In terms of pricing, just 14% say they have increased their prices in the previous 3 to 6
months, while 37% report that these have decreased.
Quarterly analysis shows little change in the percentages that have increased prices in the
previous quarter (12% in Q3 and 14% in Q4). The percentage reducing prices has
decreased from 42% in Q3 to 37% in Q4.
Table 2.9: Trends in quarterly prices charged for products and services (weighted)
Over the past 3 – 6 months, have the prices you charge for your products and services…?
2009 2010 Q1 Q2 Q3 Q4 Q1 Q2 Q3 Q4
Base 1,000 1,000 1,000 1,000 1,000 1,009 1,029 1,132
Increased 8% 6% 9% 10% 8% 13% 12% 14%
Remained steady 39% 39% 32% 32% 32% 38% 46% 48%
Decreased 53% 55% 58% 56% 60% 49% 42% 37%
Not sure 0% 1% 1% 2% 1% 0% 0% 1%
Net difference -45% -48% -49% -47% -52% -36% -30% -23%
In terms of size of business, it is the mid-size businesses that are more likely to say their
prices have increased compared to either large or small businesses.
Figure 2.13: Pricing changes by size
Over the past 3 to 6 months have the prices you charge for your products
and services…
-38
-29
-29
-37
14
20
17
14
-50 -40 -30 -20 -10 0 10 20 30 40 50
Decrease Net differenceIncrease
-23%
-12%
-9%
-24%
Weighted data
Base: unweighted /weighted
%
OverallBase: 1132 / 1132
50 or more employeesBase: 128 / 31
11 to 49 employeesBase: 226 / 105
10 or fewer employeesBase: 778 / 996
InterTradeIreland Business Monitor Q4 2010
23
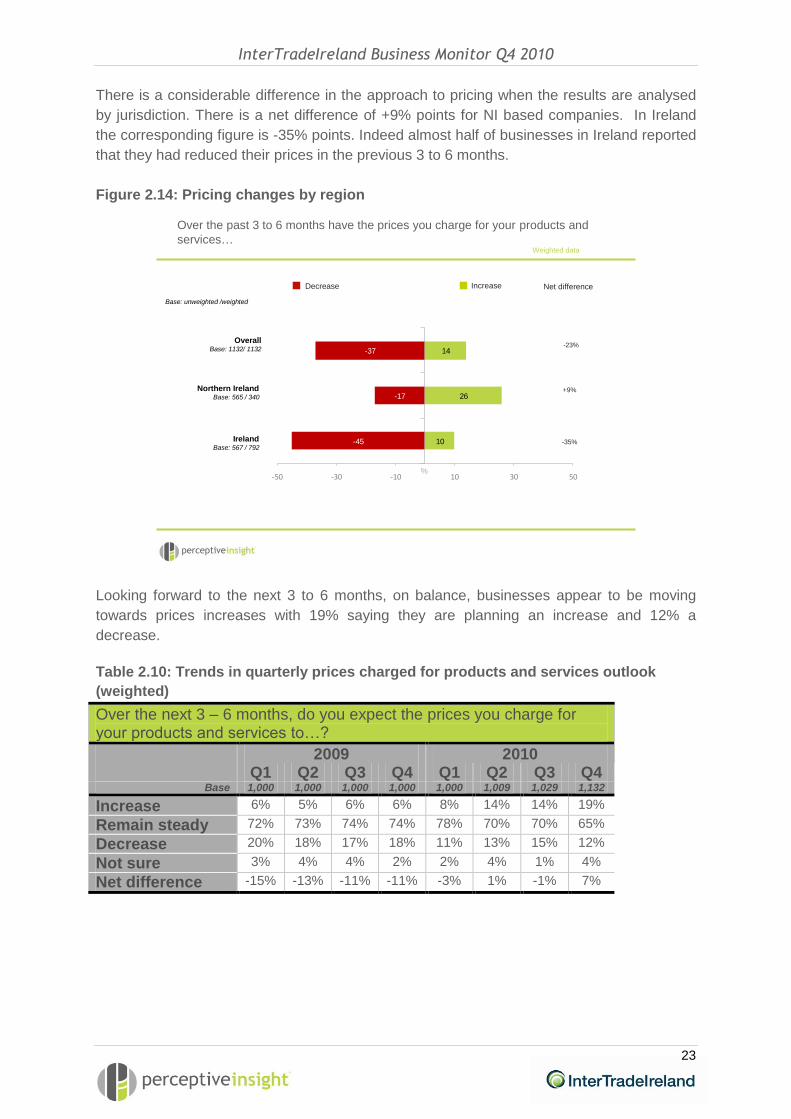
There is a considerable difference in the approach to pricing when the results are analysed
by jurisdiction. There is a net difference of +9% points for NI based companies. In Ireland
the corresponding figure is -35% points. Indeed almost half of businesses in Ireland reported
that they had reduced their prices in the previous 3 to 6 months.
Figure 2.14: Pricing changes by region
-45
-17
-37
10
26
14
-50 -30 -10 10 30 50
Decrease Net differenceIncrease
-23%
+9%
-35%
Weighted data
Base: unweighted /weighted
%
Over the past 3 to 6 months have the prices you charge for your products and
services…
OverallBase: 1132/ 1132
Northern IrelandBase: 565 / 340
IrelandBase: 567 / 792
Looking forward to the next 3 to 6 months, on balance, businesses appear to be moving
towards prices increases with 19% saying they are planning an increase and 12% a
decrease.
Table 2.10: Trends in quarterly prices charged for products and services outlook
(weighted)
Over the next 3 – 6 months, do you expect the prices you charge for your products and services to…?
2009 2010 Q1 Q2 Q3 Q4 Q1 Q2 Q3 Q4
Base 1,000 1,000 1,000 1,000 1,000 1,009 1,029 1,132
Increase 6% 5% 6% 6% 8% 14% 14% 19%
Remain steady 72% 73% 74% 74% 78% 70% 70% 65%
Decrease 20% 18% 17% 18% 11% 13% 15% 12%
Not sure 3% 4% 4% 2% 2% 4% 1% 4%
Net difference -15% -13% -11% -11% -3% 1% -1% 7%
InterTradeIreland Business Monitor Q4 2010
24
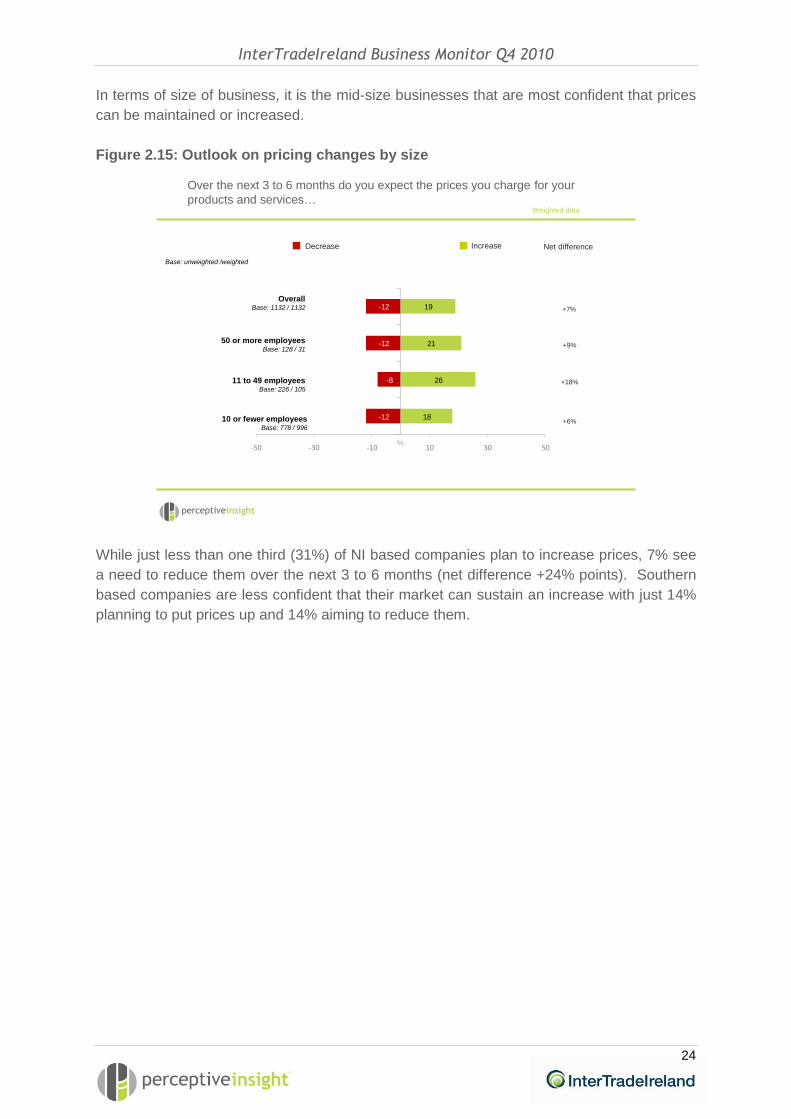
In terms of size of business, it is the mid-size businesses that are most confident that prices
can be maintained or increased.
Figure 2.15: Outlook on pricing changes by size
-12
-8
-12
-12
18
26
21
19
-50 -30 -10 10 30 50
Decrease Net differenceIncrease
+7%
+9%
+18%
+6%
Weighted data
Base: unweighted /weighted
%
Over the next 3 to 6 months do you expect the prices you charge for your
products and services…
OverallBase: 1132 / 1132
50 or more employeesBase: 128 / 31
11 to 49 employeesBase: 226 / 105
10 or fewer employeesBase: 778 / 996
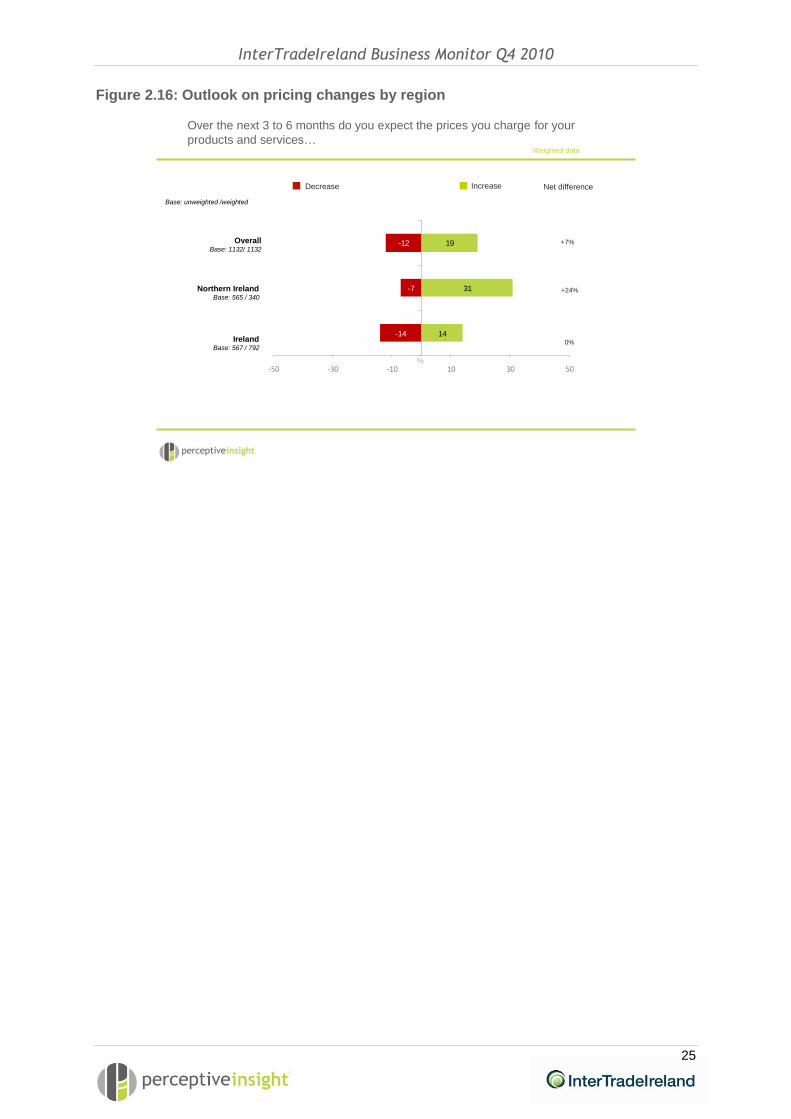
While just less than one third (31%) of NI based companies plan to increase prices, 7% see
a need to reduce them over the next 3 to 6 months (net difference +24% points). Southern
based companies are less confident that their market can sustain an increase with just 14%
planning to put prices up and 14% aiming to reduce them.
InterTradeIreland Business Monitor Q4 2010
25
Figure 2.16: Outlook on pricing changes by region
-14
-7
-12
14
31
19
-50 -30 -10 10 30 50
Decrease Net differenceIncrease
+7%
+24%
0%
Weighted data
Base: unweighted /weighted
%
Over the next 3 to 6 months do you expect the prices you charge for your
products and services…
OverallBase: 1132/ 1132
Northern IrelandBase: 565 / 340
IrelandBase: 567 / 792
26
3. The business environment
In this section we outline the types of businesses that engage in cross-border and export
sales and assess the main issues affecting businesses in the current climate.
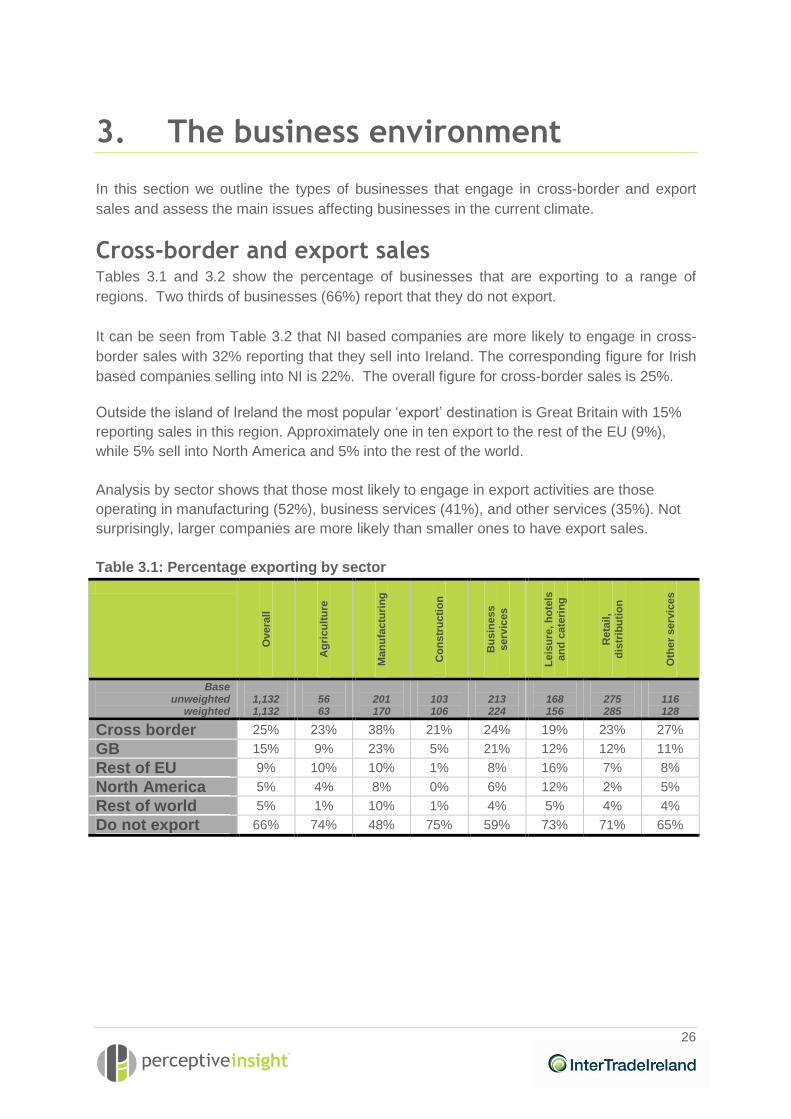
Cross-border and export sales Tables 3.1 and 3.2 show the percentage of businesses that are exporting to a range of
regions. Two thirds of businesses (66%) report that they do not export.
It can be seen from Table 3.2 that NI based companies are more likely to engage in cross-
border sales with 32% reporting that they sell into Ireland. The corresponding figure for Irish
based companies selling into NI is 22%. The overall figure for cross-border sales is 25%.
Outside the island of Ireland the most popular ‘export’ destination is Great Britain with 15%
reporting sales in this region. Approximately one in ten export to the rest of the EU (9%),
while 5% sell into North America and 5% into the rest of the world.
Analysis by sector shows that those most likely to engage in export activities are those
operating in manufacturing (52%), business services (41%), and other services (35%). Not
surprisingly, larger companies are more likely than smaller ones to have export sales.
Table 3.1: Percentage exporting by sector
Overa
ll
Ag
ricu
ltu
re
Ma
nu
factu
rin
g
Co
ns
tru
cti
on
Bu
sin
ess
serv
ices
Le
isu
re, h
ote
ls
an
d c
ate
rin
g
Reta
il,
dis
trib
uti
on
Oth
er
serv
ices
Base unweighted
weighted
1,132 1,132
56 63
201 170
103 106
213 224
168 156
275 285
116 128
Cross border 25% 23% 38% 21% 24% 19% 23% 27%
GB 15% 9% 23% 5% 21% 12% 12% 11%
Rest of EU 9% 10% 10% 1% 8% 16% 7% 8%
North America 5% 4% 8% 0% 6% 12% 2% 5%
Rest of world 5% 1% 10% 1% 4% 5% 4% 4%
Do not export 66% 74% 48% 75% 59% 73% 71% 65%

InterTradeIreland Business Monitor Q4 2010
27
Table 3.2: Percentage exporting by size and region
Overa
ll
50 o
r m
ore
em
plo
yees
11 t
o 4
9
em
plo
yees
10 o
r le
ss
em
plo
yees
Irela
nd
NI
Base unweighted
weighted
1,132 1,132
128 31
226 105
778 996
567 792
565 340
Cross border 25% 46% 37% 23% 22% 32%
GB 15% 31% 26% 13% 14% 15%
Rest of EU 9% 21% 16% 7% 10% 5%
North America 5% 7% 7% 5% 7% 3%
Rest of world 5% 12% 9% 4% 6% 2%
Do not export 66% 41% 44% 68% 66% 63%
Key business issues Respondents were given a range of issues and asked to rate them from 1 to 5 in terms of
the impact they are having on their business currently.
Rising cost of overheads, rising energy costs and a reduction in demand were rated highest
in terms of impact. This is followed by business and consumer confidence and cash flow
issues. Over one quarter (27%) said that late payment by customers was a very large issue
for them. Less likely to be issues were difficulty recruiting skills and lack of appropriate skills
in the workforce.
Figure 3.1: Current business issues by sector
10
13
19
18
22
20
19
10
9
24
18
17
16
7
17
9
22
23
21
7
5
11
24
19
27
8
18
11
25
32
31
6
3
9
29
30
0 20 40 60 80 100
Late payments from customers
Current exchange rates between sterling …
Discounting by competitors
New competitors in your market
Business and consumer confidence
Rising costs from other overheads
Rising energy costs
Difficulty recruiting appropriate skills
Lack of appropriate skills in workforce
Keeping up with innovation in the …
A reduction in demand
Cashflow
Base 1132: All respondents Weighted data
Very large issueLarge issue
%
To what extent are each of the following an issue for your business currently?
Somewhat of an issue
InterTradeIreland Business Monitor Q4 2010
28
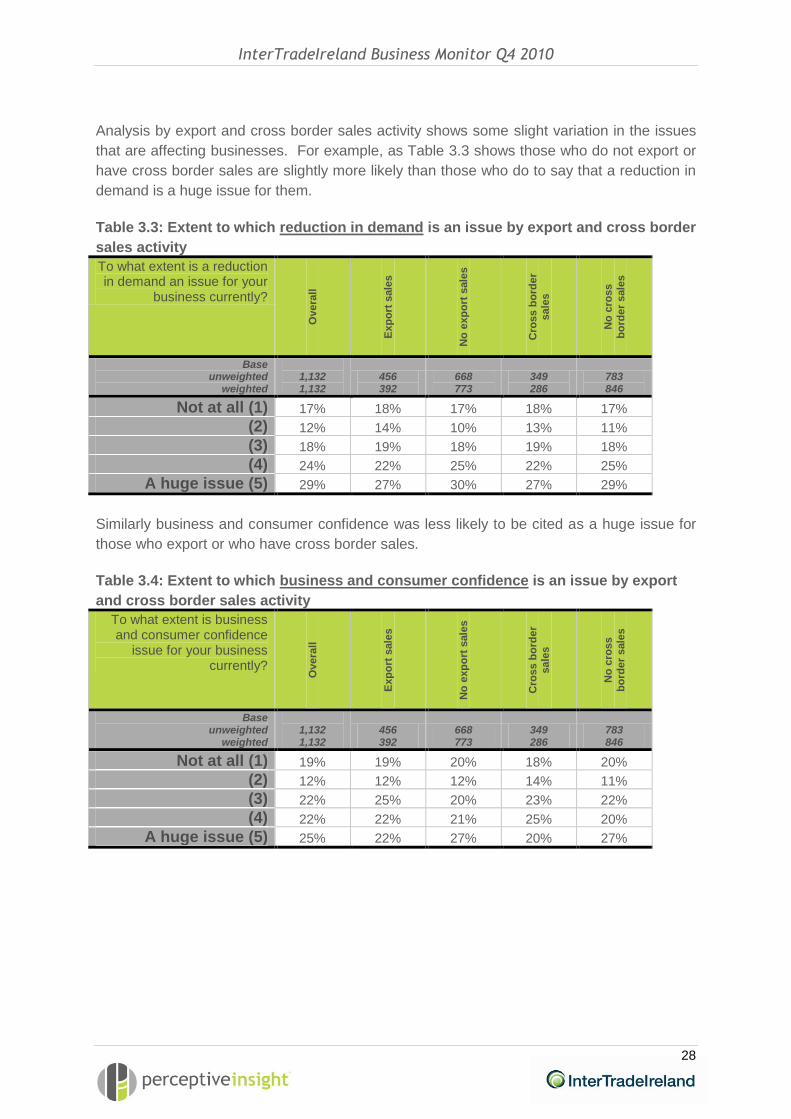
Analysis by export and cross border sales activity shows some slight variation in the issues
that are affecting businesses. For example, as Table 3.3 shows those who do not export or
have cross border sales are slightly more likely than those who do to say that a reduction in
demand is a huge issue for them.
Table 3.3: Extent to which reduction in demand is an issue by export and cross border
sales activity
To what extent is a reduction in demand an issue for your
business currently? O
vera
ll
Exp
ort
sale
s
No
exp
ort
sale
s
Cro
ss b
ord
er
sale
s
No
cro
ss
bo
rde
r s
ale
s
Base unweighted
weighted
1,132 1,132
456 392
668 773
349 286
783 846
Not at all (1) 17% 18% 17% 18% 17%
(2) 12% 14% 10% 13% 11%
(3) 18% 19% 18% 19% 18%
(4) 24% 22% 25% 22% 25%
A huge issue (5) 29% 27% 30% 27% 29%
Similarly business and consumer confidence was less likely to be cited as a huge issue for
those who export or who have cross border sales.
Table 3.4: Extent to which business and consumer confidence is an issue by export
and cross border sales activity
To what extent is business and consumer confidence
issue for your business currently?
Overa
ll
Exp
ort
sale
s
No
exp
ort
sale
s
Cro
ss b
ord
er
sale
s
No
cro
ss
bo
rde
r s
ale
s
Base unweighted
weighted
1,132 1,132
456 392
668 773
349 286
783 846
Not at all (1) 19% 19% 20% 18% 20%
(2) 12% 12% 12% 14% 11%
(3) 22% 25% 20% 23% 22%
(4) 22% 22% 21% 25% 20%
A huge issue (5) 25% 22% 27% 20% 27%

InterTradeIreland Business Monitor Q4 2010
29
However, those who export or who have cross border sales are more likely to say that
exchange rates are an issue for their business.
Table 3.5: Extent to which exchange rates is an issue by export and cross border
sales activity
To what extent are exchange rates an issue for your
business currently?
Overa
ll
Exp
ort
sale
s
No
exp
ort
sale
s
Cro
ss b
ord
er
sale
s
No
cro
ss
bo
rde
r s
ale
s
Base unweighted
weighted
1,132 1,132
456 392
668 773
349 286
783 846
Not at all (1) 62% 39% 75% 34% 71%
(2) 10% 16% 7% 18% 8%
(3) 13% 20% 9% 22% 10%
(4) 7% 13% 4% 14% 4%
A huge issue (5) 8% 12% 6% 12% 7%
They are also slightly more likely to be affected by late payments.
Table 3.6: Extent to which late payments is an issue by export and cross border sales
activity
To what extent are late payments an issue for your
business currently?
Overa
ll
Exp
ort
sale
s
No
exp
ort
sale
s
Cro
ss b
ord
er
sale
s
No
cro
ss
bo
rde
r s
ale
s
Base unweighted
weighted
1,132 1,132
456 392
668 773
349 286
783 846
Not at all (1) 36% 23% 44% 20% 42%
(2) 11% 16% 8% 15% 10%
(3) 10% 13% 9% 13% 9%
(4) 16% 21% 13% 23% 13%
A huge issue (5) 27% 28% 26% 30% 26%

30
4. The cost of doing business In the Q3 2010 business monitor we found that businesses were becoming increasingly
concerned about the costs of doing business and this continues to be a issue in Q4 (see
Figure 4.2). This quarter we explored this area in more depth to provide an understanding of
the areas of concern for businesses.
Respondents were given a list of areas, and asked to what extent their costs had changed in
these areas compared with 12 months ago. The areas which businesses were most likely to
have reported as having increased were energy costs (69%), transport costs (59%) and
rates and taxes (57%). The areas where businesses were most likely to have experienced
cost savings were staffing and employee costs (16%) and rent or building costs (13%).
Figure 4.1: Extent that costs had changed in certain areas
Increased a lotDecreased a little
%
To what extent have your costs changed in each of the following areas?
Decreased a lot
-9
-14
-10
-10
0
-3
-6
-4
-2
-1
-1
-4
-1
-1
9
14
33
32
40
28
41
5
4
16
18
17
31
28
-50 -30 -10 10 30 50 70 90
Rent/building costs
Energy costs
Transport costs
Staffing/employee costs
Supplier costs
Insurance and
professional fees
Rates and taxes
Increased a littleRemained
the same
Do not have
costs in these
areas
62%
22%
23%
57%
38%
37%
10%
2%
15%
8%
5%
2%
2%
35%
Base 1132: All respondents Weighted data
Thinking ahead to 2011, respondents were asked if they were expecting any significant
increases in costs (ie greater than 10%) in the same areas. Thirty-eight per cent were not
expecting any significant increases. However energy (36%), transport (34%),rates and taxes
(29%) and supplier costs (25%) were the areas in which respondents were most likely to
expect a rise in costs.

InterTradeIreland Business Monitor Q4 2010
31
Figure 4.2: Increases in costs in 2011
38
29
17
25
5
34
36
3
0 20 40 60 80 100
Thinking ahead to 2011 are you expecting any significant increases in costs in
any of the following areas?
Rent/building costs
Energy costs
No significant increases
%
% saying yes
Transport costs
Staffing/employee costs
Supplier costs
Insurance and professional fees
Rates and taxes
Base 1132: All respondents Weighted data
82% expected not to be able to reduce costs in any of the area in the year ahead. The areas
were savings were most likely to be made was staffing/employee costs (7%) and energy
costs (5%).
Figure 4.3: Decreases in costs in 2011
82
2
3
4
7
2
5
4
0 20 40 60 80 100
Thinking ahead to 2011 are you expecting to be able to reduce costs in any of
the following areas?
Rent/building costs
Energy costs
No significant decreases
%
% saying yes
Transport costs
Staffing/employee costs
Supplier costs
Insurance and professional fees
Rates and taxes
Base 1132: All respondents Weighted data
InterTradeIreland Business Monitor Q4 2010
32
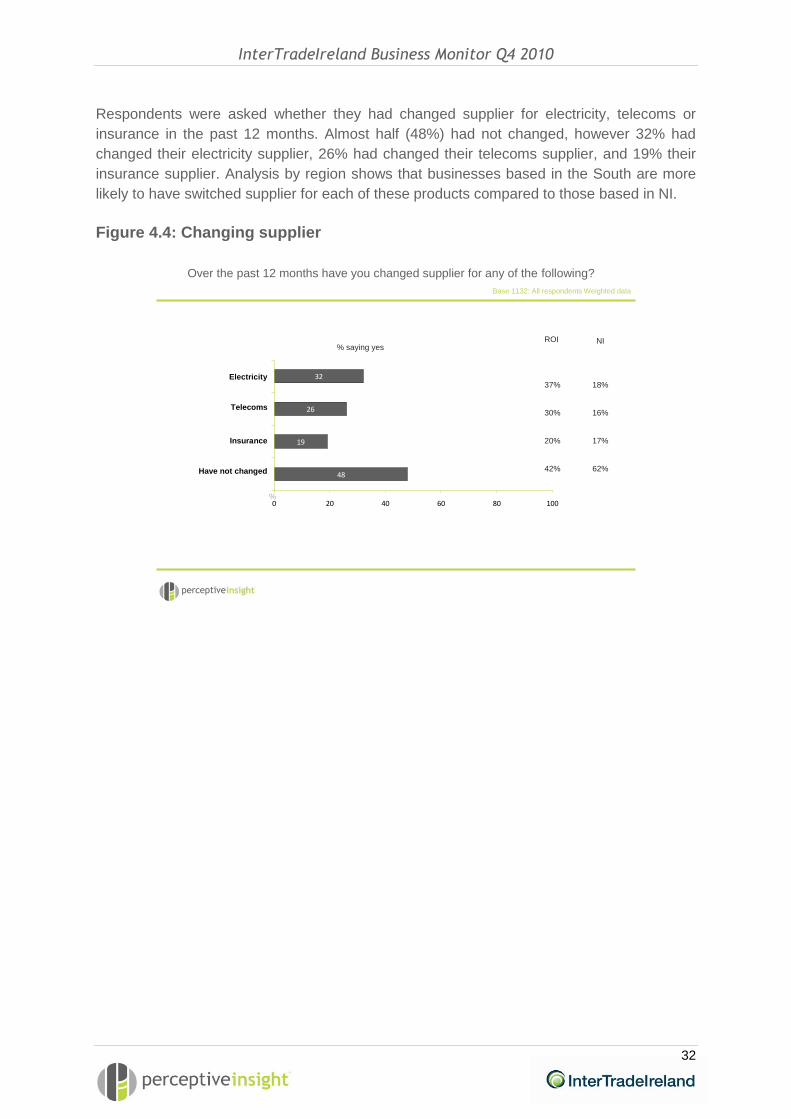
Respondents were asked whether they had changed supplier for electricity, telecoms or
insurance in the past 12 months. Almost half (48%) had not changed, however 32% had
changed their electricity supplier, 26% had changed their telecoms supplier, and 19% their
insurance supplier. Analysis by region shows that businesses based in the South are more
likely to have switched supplier for each of these products compared to those based in NI.
Figure 4.4: Changing supplier
48
19
26
32
0 20 40 60 80 100
Over the past 12 months have you changed supplier for any of the following?
Electricity
Telecoms
%
% saying yes
Insurance
Have not changed
Base 1132: All respondents Weighted data
NIROI
37%
30%
20%
42%
18%
16%
17%
62%
InterTradeIreland Business Monitor Q4 2010
33
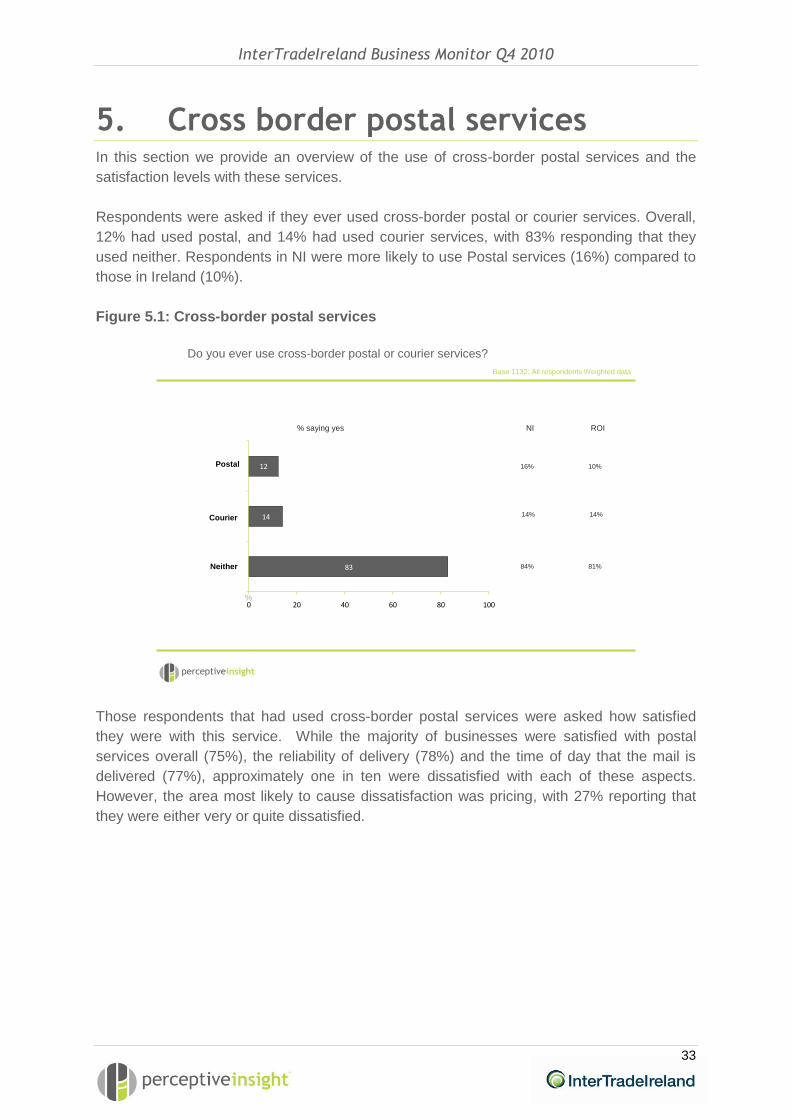
5. Cross border postal services In this section we provide an overview of the use of cross-border postal services and the
satisfaction levels with these services.
Respondents were asked if they ever used cross-border postal or courier services. Overall,
12% had used postal, and 14% had used courier services, with 83% responding that they
used neither. Respondents in NI were more likely to use Postal services (16%) compared to
those in Ireland (10%).
Figure 5.1: Cross-border postal services
83
14
12
0 20 40 60 80 100
Do you ever use cross-border postal or courier services?
Postal
Courier
Neither
%
% saying yes
Base 1132: All respondents Weighted data
ROI
10%
14%
81%
NI
16%
14%
84%
Those respondents that had used cross-border postal services were asked how satisfied
they were with this service. While the majority of businesses were satisfied with postal
services overall (75%), the reliability of delivery (78%) and the time of day that the mail is
delivered (77%), approximately one in ten were dissatisfied with each of these aspects.
However, the area most likely to cause dissatisfaction was pricing, with 27% reporting that
they were either very or quite dissatisfied.

InterTradeIreland Business Monitor Q4 2010
34
Figure 5.2: Satisfaction with cross-border postal services
To what extend are you satisfied or dissatisfied with each of the following
cross-border postal services
-6
-19
-6
-7
-4
-8
-5
-5
49
33
47
44
28
18
31
31
-30 -10 10 30 50 70
Don’t know
Postal services overall
Reliability of delivery
Pricing
The time of day that
your mail is delivered
0%
0%
0%
2%
%
Very satisfiedQuite dissatisfiedVery dissatisfied Quite satisfiedNeither/
nor
14%
11%
22%
11%
Base 226: Respondents who have used cross-border postal services
Weighted data
Satisfaction levels differ most clearly between locations. Overall, those businesses in NI are
approximately five times (24%) as likely to report that they were either quite dissatisfied or
very dissatisfied than those in Ireland (5%). This extends to all areas of postal services with
the exception of pricing, where those in Ireland were more likely to be dissatisfied (32%)
than those in NI (27%).
Table 5.1: Dissatisfaction with cross-border postal services
To what extent are you dissatisfied with each of the
following cross border postal services?
Overa
ll
Irela
nd
NI
% dissatisfied
Base unweighted
weighted
1,132 1,132
567 792
565 340
Postal services overall 12% 5% 24%
Reliability of delivery 11% 8% 19%
Pricing 27% 22% 27%
The time that your mail is delivered
10% 2% 25%

InterTradeIreland Business Monitor Q4 2010
35
6. The economy In this section we explore what impact the economy has been having on business, assess
changes in payment times that potentially create cash flow issues and detail the steps that
businesses believe government should be taking to assist them during the downturn.
Impact of the economy on business The vast majority (90%) say that the economic downturn has had either a severe or
moderate impact on their business. Just 6% report that there has been no impact and 3%
have benefited from it.
The quarterly analysis shows a similar trend to Q2 and Q3 in those who say they have
experienced a severe adverse impact as a result of the downturn. Table 6.1: Trends in quarterly impact of the economic downturn (weighted)
To date, what impact if any, has the economic downturn had on your business…?
2009 2010 Q1 Q2 Q3 Q4 Q1 Q2 Q3 Q4
Base 1,000 1,000 1,000 1,000 1,000 1,009 1,029 1,132
Severe adverse impact 33% 29% 35% 35% 37% 51% 53% 54%
Moderate adverse impact
52% 57% 51% 53% 50% 38% 36% 36%
Positive impact 3% 3% 4% 4% 3% 4% 4% 3%
No impact at all 11% 10% 10% 7% 8% 6% 6% 6%
Don’t know 0% 1% 0% 1% 2% 1% 0% 1%
The pattern of those impacted is similar when analysed by size of business, although smaller
businesses are slightly more likely to say there has been a severe impact.

InterTradeIreland Business Monitor Q4 2010
36
Figure 6.1: Impact of economic downturn by size
-36
-38
-47
-36
-55
-51
-46
-54
6
6
6
6
3
5
0
3
-100 -80 -60 -40 -20 0 20
Don’t know
1%
0%
1%
0%
Weighted data
Base: unweighted /weighted
%
To date, what impact has the economic downturn had on your business?
Positive impactModerate
adverse impact
Severe adverse
impactNo impact
OverallBase: 1132 / 1132
50 or more employeesBase: 128 / 31
11 to 49 employeesBase: 226 / 105
10 or fewer employeesBase: 778 / 996
Businesses in Ireland are much more likely than those in NI to say that they have been
severely impacted by the economic downturn (61% compared with 38%). Just 3% of both NI
and Ireland companies report that the downturn has had a positive impact.
Figure 6.2: Impact of economic downturn by region
-32
-47
-36
-61
-38
-54
4
11
6
3
3
3
-100 -80 -60 -40 -20 0 20
1%
1%
0%
Weighted data
Base: unweighted /weighted
%
To date, what impact has the economic downturn had on your business?
Don’t knowPositive impactModerate
adverse impact
Severe adverse
impactNo impact
OverallBase: 1132/ 1132
Northern IrelandBase: 565 / 340
IrelandBase: 567 / 792

InterTradeIreland Business Monitor Q4 2010
37
Profitability Overall 28% report that their business was not profitable in the previous year, a slight
decrease from 30% in Q3. Almost one third of businesses in Ireland (30%) did not show a
profit in the previous 12 months compared with 21% in NI.
Figure 6.3: Incidence of businesses not remaining profitable by region
30
21
28
0 20 40 60 80 100
Weighted data
Base: unweighted /weighted
%
% saying NO
During the past 12 months has your business managed to remain profitable?
OverallBase: 1132/ 1132
Northern IrelandBase: 565 / 340
IrelandBase: 567 / 792
Businesses in the construction sector (36%) were most likely to state their business had not
remained profitable in the past 12 months. It is worth noting the sectoral performance by
region. In particular the leisure, hotels and catering sector in the South has been
particularly hard hit with 43% saying their business was not profitable in the last 12 months.
Table 6.2: Incidence of businesses NOT remaining profitable by sector
Overa
ll
Ag
ricu
ltu
re
Ma
nu
factu
rin
g
Co
ns
tru
cti
on
Bu
sin
ess
serv
ices
Le
isu
re, h
ote
ls
an
d c
ate
rin
g
Reta
il,
dis
trib
uti
on
Oth
er
serv
ices
Base unweighted
weighted
1,132 1,132
56 63
201 170
103 106
213 224
168 156
275 285
116 128
All-island Base 1,132/1,132
28% 14% 26% 32% 21% 36% 30% 30%
Northern Ireland Base 523/308
21% 15% 19% 28% 14% 23% 21% 31%
Ireland Base 506/719
31% 14% 28% 34% 25% 43% 33% 30%
InterTradeIreland Business Monitor Q4 2010
38
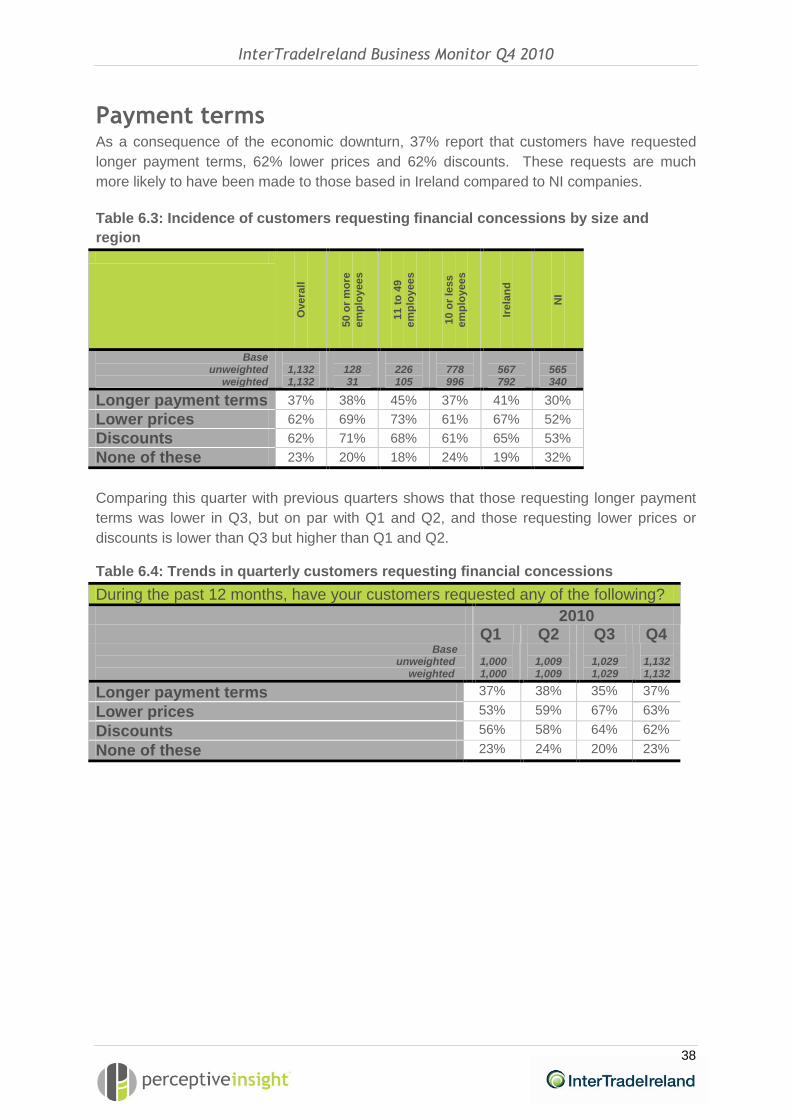
Payment terms As a consequence of the economic downturn, 37% report that customers have requested
longer payment terms, 62% lower prices and 62% discounts. These requests are much
more likely to have been made to those based in Ireland compared to NI companies.
Table 6.3: Incidence of customers requesting financial concessions by size and
region
Overa
ll
50 o
r m
ore
em
plo
yees
11 t
o 4
9
em
plo
yees
10 o
r le
ss
em
plo
yees
Irela
nd
NI
Base unweighted
weighted
1,132 1,132
128 31
226 105
778 996
567 792
565 340
Longer payment terms 37% 38% 45% 37% 41% 30%
Lower prices 62% 69% 73% 61% 67% 52%
Discounts 62% 71% 68% 61% 65% 53%
None of these 23% 20% 18% 24% 19% 32%
Comparing this quarter with previous quarters shows that those requesting longer payment
terms was lower in Q3, but on par with Q1 and Q2, and those requesting lower prices or
discounts is lower than Q3 but higher than Q1 and Q2. Table 6.4: Trends in quarterly customers requesting financial concessions
During the past 12 months, have your customers requested any of the following?
2010 Q1 Q2 Q3 Q4
Base unweighted weighted
1,000 1,000
1,009 1,009
1,029 1,029
1,132 1,132
Longer payment terms 37% 38% 35% 37%
Lower prices 53% 59% 67% 63%
Discounts 56% 58% 64% 62%
None of these 23% 24% 20% 23%
InterTradeIreland Business Monitor Q4 2010
39
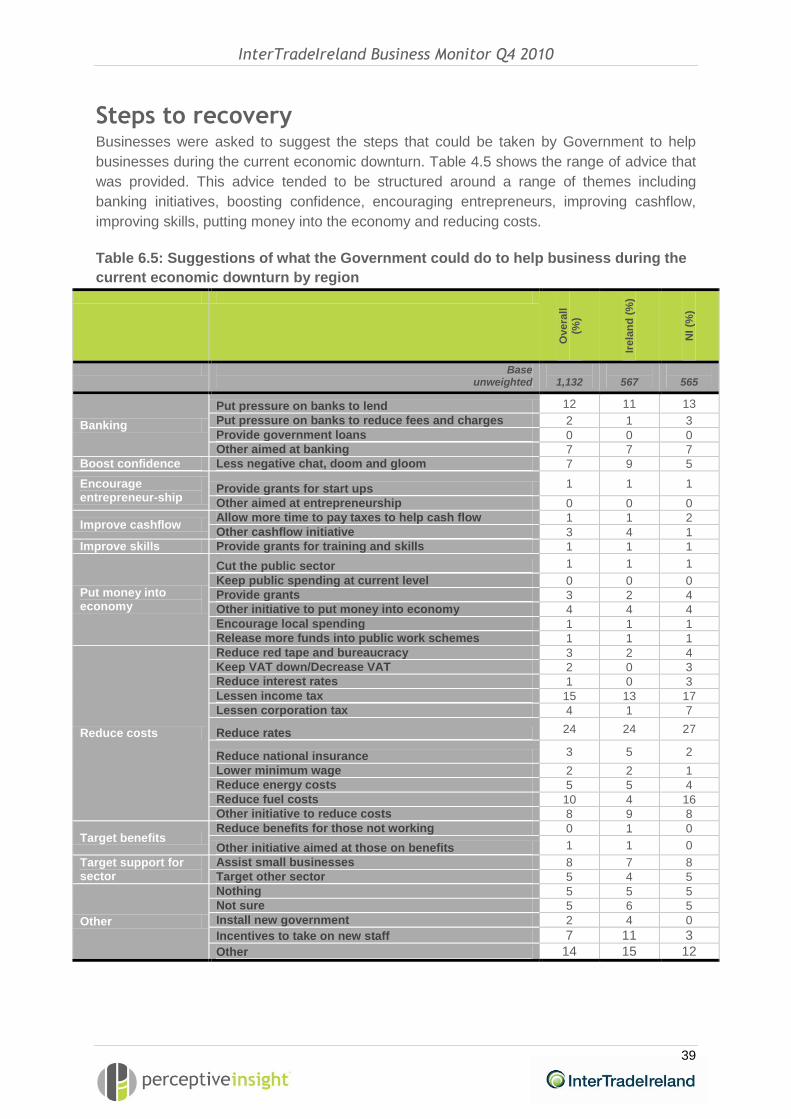
Steps to recovery Businesses were asked to suggest the steps that could be taken by Government to help
businesses during the current economic downturn. Table 4.5 shows the range of advice that
was provided. This advice tended to be structured around a range of themes including
banking initiatives, boosting confidence, encouraging entrepreneurs, improving cashflow,
improving skills, putting money into the economy and reducing costs.
Table 6.5: Suggestions of what the Government could do to help business during the
current economic downturn by region
Overa
ll
(%)
Irela
nd
(%
)
NI
(%)
Base unweighted
1,132
567
565
Banking
Put pressure on banks to lend 12 11 13
Put pressure on banks to reduce fees and charges 2 1 3
Provide government loans 0 0 0
Other aimed at banking 7 7 7
Boost confidence Less negative chat, doom and gloom 7 9 5
Encourage entrepreneur-ship
Provide grants for start ups 1 1 1
Other aimed at entrepreneurship 0 0 0
Improve cashflow Allow more time to pay taxes to help cash flow 1 1 2
Other cashflow initiative 3 4 1
Improve skills Provide grants for training and skills 1 1 1
Put money into economy
Cut the public sector 1 1 1
Keep public spending at current level 0 0 0
Provide grants 3 2 4
Other initiative to put money into economy 4 4 4
Encourage local spending 1 1 1
Release more funds into public work schemes 1 1 1
Reduce costs
Reduce red tape and bureaucracy 3 2 4
Keep VAT down/Decrease VAT 2 0 3
Reduce interest rates 1 0 3
Lessen income tax 15 13 17
Lessen corporation tax 4 1 7
Reduce rates 24 24 27
Reduce national insurance 3 5 2
Lower minimum wage 2 2 1
Reduce energy costs 5 5 4
Reduce fuel costs 10 4 16
Other initiative to reduce costs 8 9 8
Target benefits Reduce benefits for those not working 0 1 0
Other initiative aimed at those on benefits 1 1 0
Target support for sector
Assist small businesses 8 7 8
Target other sector 5 4 5
Other
Nothing 5 5 5
Not sure 5 6 5
Install new government 2 4 0
Incentives to take on new staff 7 11 3
Other 14 15 12
InterTradeIreland Business Monitor Q4 2010
40
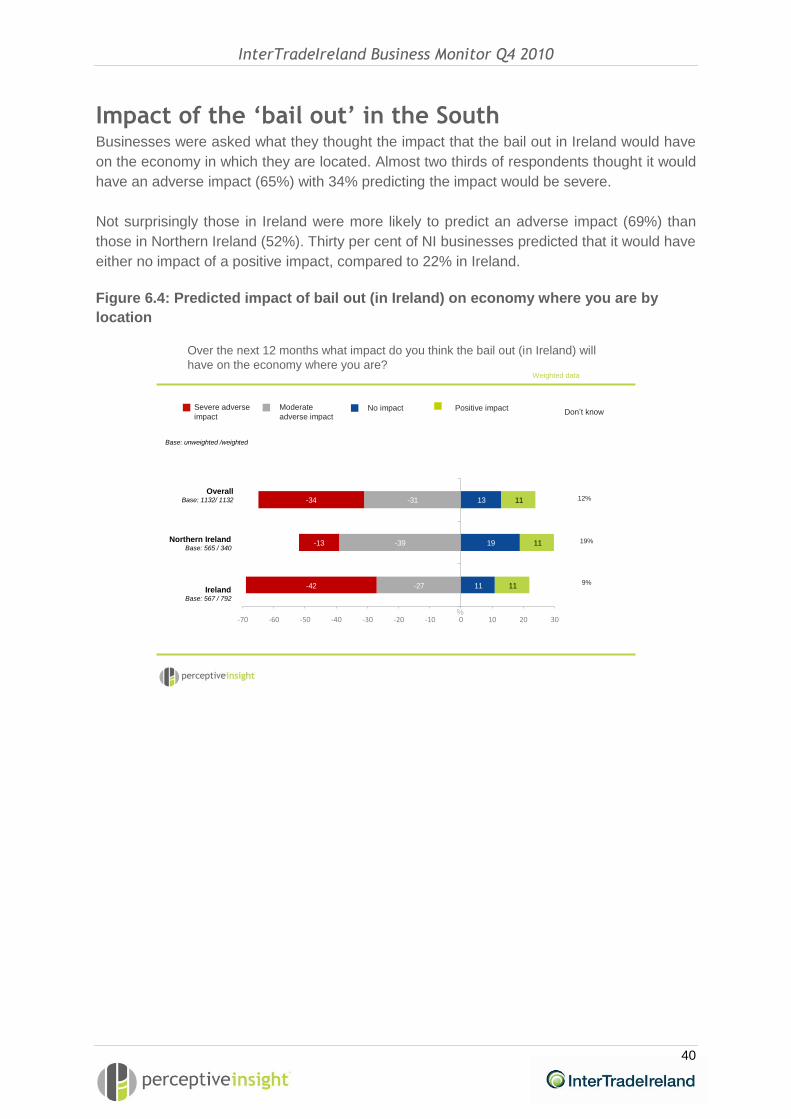
Impact of the ‘bail out’ in the South Businesses were asked what they thought the impact that the bail out in Ireland would have
on the economy in which they are located. Almost two thirds of respondents thought it would
have an adverse impact (65%) with 34% predicting the impact would be severe.
Not surprisingly those in Ireland were more likely to predict an adverse impact (69%) than
those in Northern Ireland (52%). Thirty per cent of NI businesses predicted that it would have
either no impact of a positive impact, compared to 22% in Ireland.
Figure 6.4: Predicted impact of bail out (in Ireland) on economy where you are by
location
-27
-39
-31
-42
-13
-34
11
19
13
11
11
11
-70 -60 -50 -40 -30 -20 -10 0 10 20 30
12%
19%
9%
Weighted data
Base: unweighted /weighted
%
Don’t knowPositive impactModerate
adverse impact
Severe adverse
impactNo impact
Over the next 12 months what impact do you think the bail out (in Ireland) will
have on the economy where you are?
OverallBase: 1132/ 1132
Northern IrelandBase: 565 / 340
IrelandBase: 567 / 792
InterTradeIreland Business Monitor Q4 2010
41
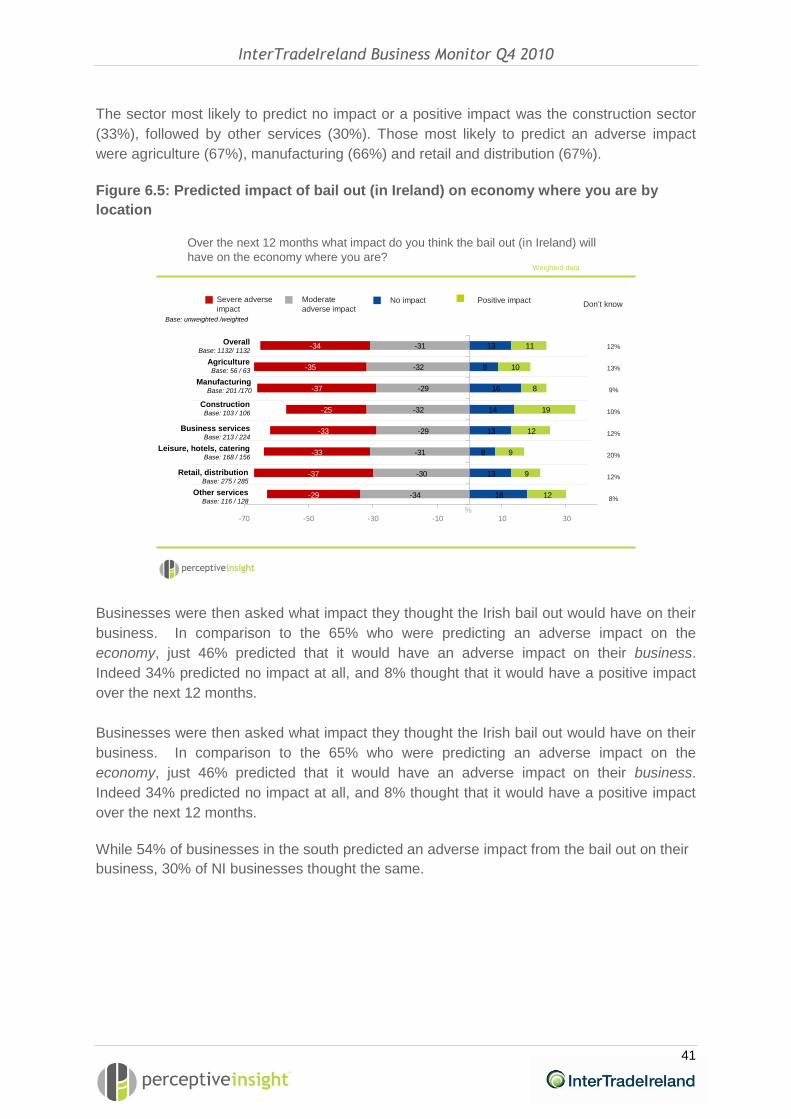
The sector most likely to predict no impact or a positive impact was the construction sector
(33%), followed by other services (30%). Those most likely to predict an adverse impact
were agriculture (67%), manufacturing (66%) and retail and distribution (67%).
Figure 6.5: Predicted impact of bail out (in Ireland) on economy where you are by
location
-34
-30
-31
-29
-32
-29
-32
-31
-29
-37
-33
-33
-25
-37
-35
-34
18
13
8
13
14
16
9
13
12
9
9
12
19
8
10
11
-70 -50 -30 -10 10 30
12%
13%
9%
10%
12%
20%
12%
8%
Weighted data
Base: unweighted /weighted
%
Don’t knowPositive impactModerate
adverse impact
Severe adverse
impactNo impact
Over the next 12 months what impact do you think the bail out (in Ireland) will
have on the economy where you are?
OverallBase: 1132/ 1132
AgricultureBase: 56 / 63
ConstructionBase: 103 / 106
Leisure, hotels, cateringBase: 168 / 156
ManufacturingBase: 201 /170
Business servicesBase: 213 / 224
Retail, distributionBase: 275 / 285
Other servicesBase: 116 / 128
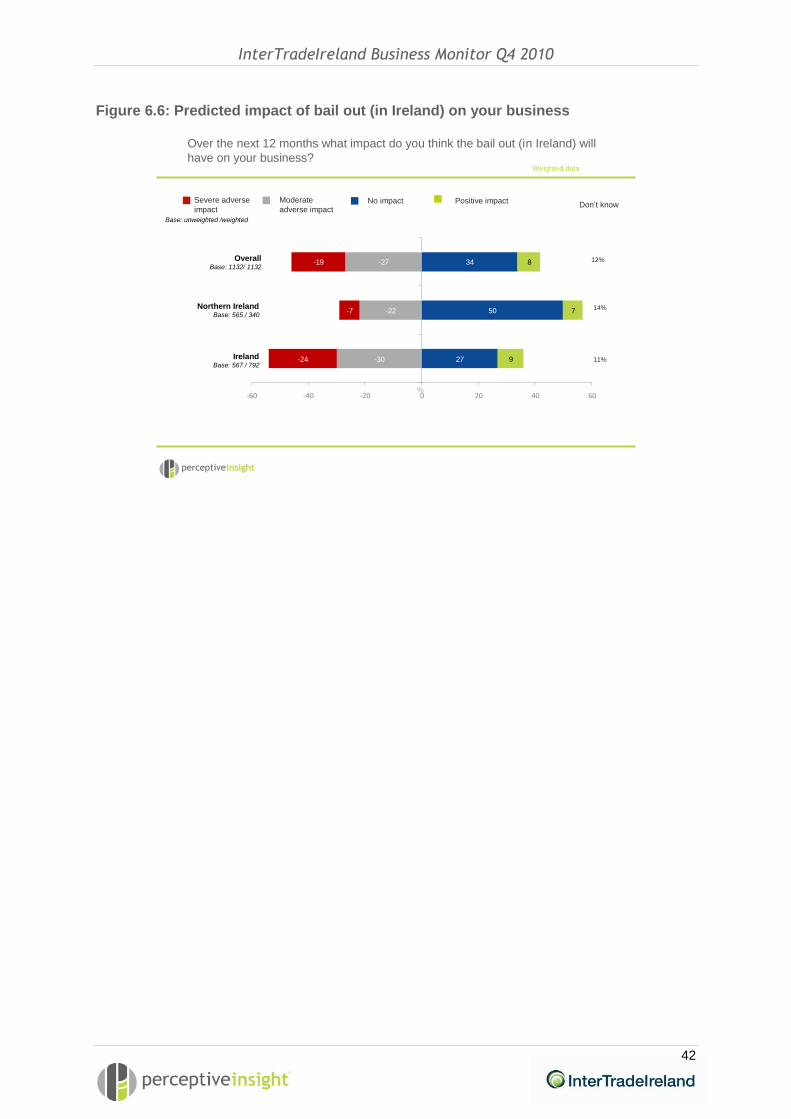
Businesses were then asked what impact they thought the Irish bail out would have on their
business. In comparison to the 65% who were predicting an adverse impact on the
economy, just 46% predicted that it would have an adverse impact on their business.
Indeed 34% predicted no impact at all, and 8% thought that it would have a positive impact
over the next 12 months.
While 54% of businesses in the south predicted an adverse impact from the bail out on their
business, 30% of NI businesses thought the same.
InterTradeIreland Business Monitor Q4 2010
42
Figure 6.6: Predicted impact of bail out (in Ireland) on your business
-30
-22
-27
-24
-7
-19
27
50
34
9
7
8
-60 -40 -20 0 20 40 60
12%
14%
11%
Weighted data
Base: unweighted /weighted
%
Don’t knowPositive impactModerate
adverse impact
Severe adverse
impactNo impact
Over the next 12 months what impact do you think the bail out (in Ireland) will
have on your business?
OverallBase: 1132/ 1132
Northern IrelandBase: 565 / 340
IrelandBase: 567 / 792
51
Appendix A – Methodology
Background InterTradeIreland has commissioned Perceptive Insight Market Research to undertake its
business monitor research. The InterTradeIreland study is unique in scope, scale and
regularity and has helped to fill a void in All-Island economic intelligence, especially during
the recent turbulent economic times. The objectives for this project are:
∙ For the Business Monitor to act as a topical indicator of business confidence, cross-
border trade and business activity across the island of Ireland; and
∙ For the survey results to act as an evidence base on a variety of themes of interest to
business and policy makers, themes on which InterTradeIreland can build future
initiatives.
Approach The core features of the approach are:
∙ A telephone survey of 1,132 businesses, which was undertaken during January 2011;
∙ The sample is structured to allow sub-groups analysis by region, sector and size of
business, with the data weighted to reflect the overall population of businesses on the
island when reporting at the overall level.
∙ The questionnaire contains both a set of consistent or ‘core’ questions, to allow the
monitoring of trends, as well as additional themes and topical questions that vary by
quarter.
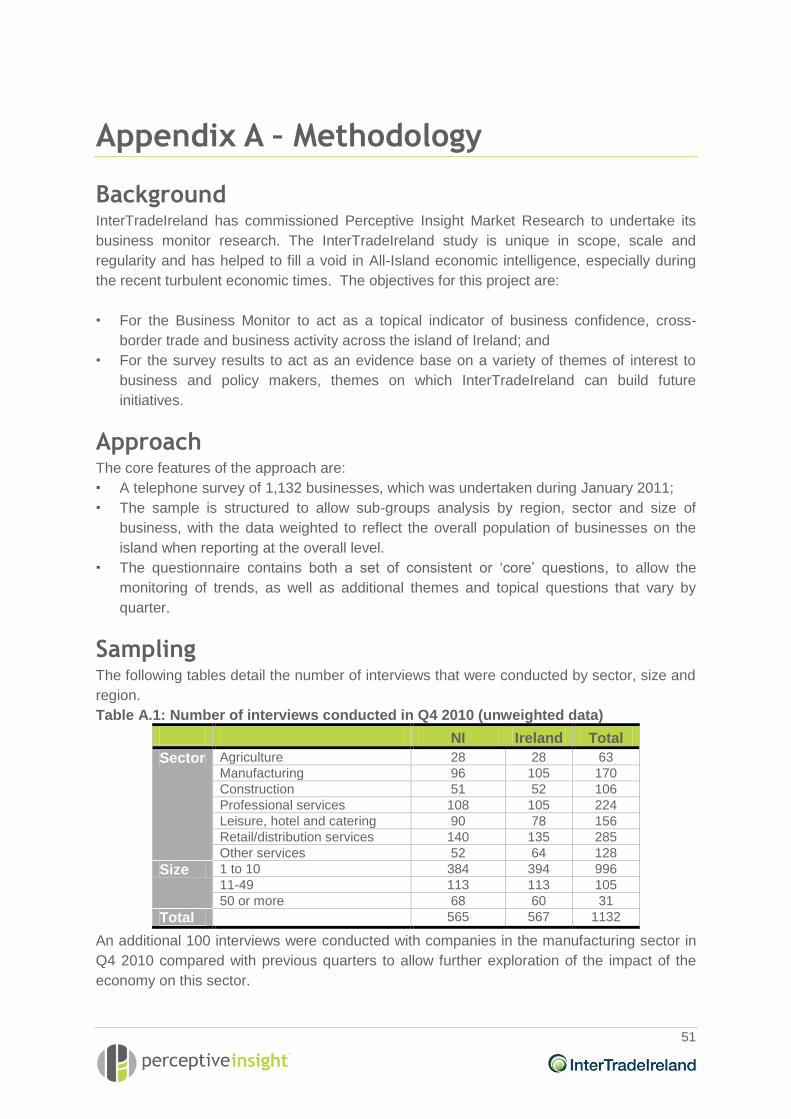
Sampling The following tables detail the number of interviews that were conducted by sector, size and
region.
Table A.1: Number of interviews conducted in Q4 2010 (unweighted data)
NI Ireland Total
Sector Agriculture 28 28 63
Manufacturing 96 105 170
Construction 51 52 106
Professional services 108 105 224
Leisure, hotel and catering 90 78 156
Retail/distribution services 140 135 285
Other services 52 64 128
Size 1 to 10 384 394 996
11-49 113 113 105
50 or more 68 60 31
Total 565 567 1132
An additional 100 interviews were conducted with companies in the manufacturing sector in
Q4 2010 compared with previous quarters to allow further exploration of the impact of the
economy on this sector.
52
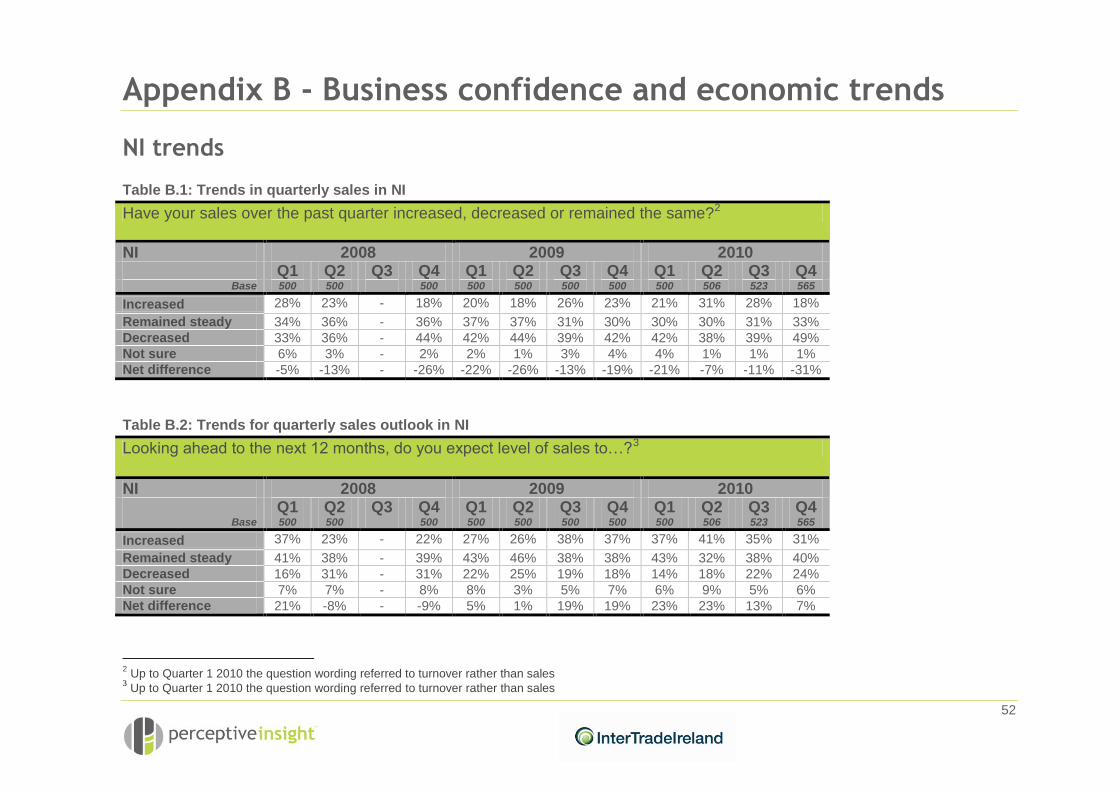
Appendix B - Business confidence and economic trends
NI trends
Table B.1: Trends in quarterly sales in NI
Have your sales over the past quarter increased, decreased or remained the same?2
NI 2008 2009 2010 Q1 Q2 Q3 Q4 Q1 Q2 Q3 Q4 Q1 Q2 Q3 Q4
Base 500 500 500 500 500 500 500 500 506 523 565
Increased 28% 23% - 18% 20% 18% 26% 23% 21% 31% 28% 18%
Remained steady 34% 36% - 36% 37% 37% 31% 30% 30% 30% 31% 33%
Decreased 33% 36% - 44% 42% 44% 39% 42% 42% 38% 39% 49%
Not sure 6% 3% - 2% 2% 1% 3% 4% 4% 1% 1% 1%
Net difference -5% -13% - -26% -22% -26% -13% -19% -21% -7% -11% -31%
Table B.2: Trends for quarterly sales outlook in NI
Looking ahead to the next 12 months, do you expect level of sales to…?3
NI 2008 2009 2010 Q1 Q2 Q3 Q4 Q1 Q2 Q3 Q4 Q1 Q2 Q3 Q4
Base 500 500 500 500 500 500 500 500 506 523 565
Increased 37% 23% - 22% 27% 26% 38% 37% 37% 41% 35% 31%
Remained steady 41% 38% - 39% 43% 46% 38% 38% 43% 32% 38% 40%
Decreased 16% 31% - 31% 22% 25% 19% 18% 14% 18% 22% 24%
Not sure 7% 7% - 8% 8% 3% 5% 7% 6% 9% 5% 6%
Net difference 21% -8% - -9% 5% 1% 19% 19% 23% 23% 13% 7%
2 Up to Quarter 1 2010 the question wording referred to turnover rather than sales
3 Up to Quarter 1 2010 the question wording referred to turnover rather than sales

InterTradeIreland Business Monitor Q3 2010
53
Table B.3: Quarterly trends in employment levels in NI
Over the past quarter has your number of employees increased, decreased or remained the same?
NI 2008 2009 2010 Q1 Q2 Q3 Q4 Q1 Q2 Q3 Q4 Q1 Q2 Q3 Q4
Base 500 500 500 500 500 500 500 500 506 523 565
Increased 12% 8% - 8% 8% 8% 14% 8% 8% 12% 7% 4%
Remained steady 73% 75% - 72% 76% 72% 71% 71% 73% 76% 81% 81%
Decreased 14% 15% - 19% 14% 19% 13% 17% 18% 11% 12% 14%
Not sure 2% 2% - 1% 1% 2% 2% 4% 1% 1% 0% 1%
Net difference -2% -7% - -11% -6% -11% 1% -9% -10% 1% -5% -10%
Table B.4: Trends in quarterly employment levels outlook in NI
Looking ahead to the next 12 months, do you expect number of employees to…
NI 2008 2009 2010 Q1 Q2 Q3 Q4 Q1 Q2 Q3 Q4 Q1 Q2 Q3 Q4
Base 500 500 500 500 500 500 500 500 506 523 565
Increased 11% 11% - 8% 8% 9% 14% 11% 11% 18% 15% 11%
Remained steady 82% 79% - 80% 83% 85% 77% 79% 80% 69% 75% 75%
Decreased 6% 7% - 10% 5% 5% 7% 6% 7% 9% 8% 10%
Not sure 1% 2% - 3% 4% 2% 2% 3% 2% 3% 3% 3%
Net difference 5% 4% - -2% 3% 4% 7% 5% 4% 9% 7% 1%

InterTradeIreland Business Monitor Q3 2010
54
Ireland trends
Table B.5: Trends in quarterly sales in Ireland
Have your sales over the past quarter increased, decreased or remained the same?4
Ireland 2008 2009 2010 Q1 Q2 Q3 Q4 Q1 Q2 Q3 Q4 Q1 Q2 Q3 Q4
Base 500 500 500 500 500 500 500 500 503 506 567
Increased 24% 16% - 8% 5% 9% 9% 11% 13% 25% 27% 20%
Remained steady 38% 32% - 28% 21% 18% 22% 29% 28% 28% 29% 25%
Decreased 34% 49% - 61% 72% 72% 69% 60% 58% 46% 43% 53%
Not sure 4% 2% - 3% 2% 0% 2% 0% 1% 1% 1% 1%
Net difference -10% -33% - -53% -67% -63% -60% -49% -45% -21% -16% -33%
Table B.6: Trends for quarterly sales outlook in Ireland
Looking ahead to the next 12 months, do you expect level of sales to…?5
Ireland 2008 2009 2010 Q1 Q2 Q3 Q4 Q1 Q2 Q3 Q4 Q1 Q2 Q3 Q4
Base 500 500 500 500 500 500 500 500 503 506 567
Increased 35% 17% - 14% 12% 14% 20% 22% 27% 37% 30% 33%
Remained steady 40% 41% - 33% 41% 41% 38% 46% 43% 36% 40% 40%
Decreased 19% 36% - 47% 43% 41% 38% 29% 27% 20% 22% 21%
Not sure 6% 6% - 6% 4% 4% 4% 3% 3% 8% 7% 6%
Net difference 16% -19% - -33% -31% -27% -18% -7% 0% 17% 8% 12%
4 Up to Quarter 1 2010 the question wording referred to turnover rather than sales
5 Up to Quarter 1 2010 the question wording referred to turnover rather than sales
InterTradeIreland Business Monitor Q3 2010
55
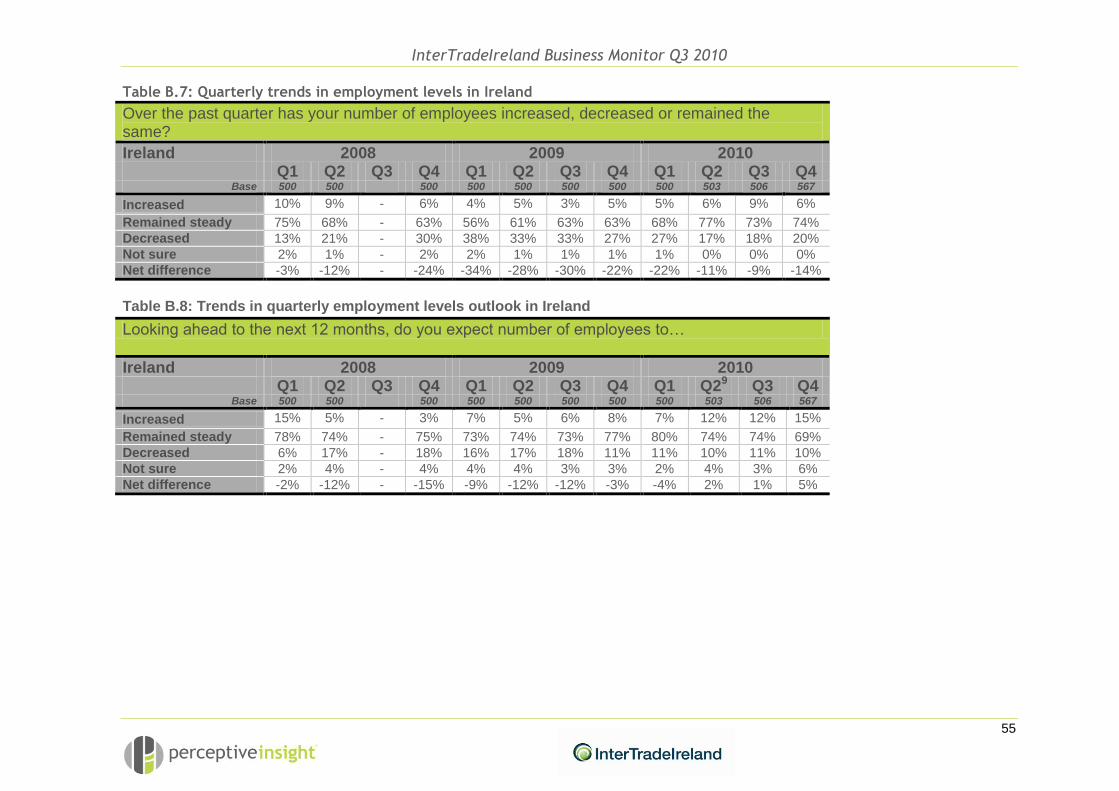
Table B.7: Quarterly trends in employment levels in Ireland
Over the past quarter has your number of employees increased, decreased or remained the same?
Ireland 2008 2009 2010 Q1 Q2 Q3 Q4 Q1 Q2 Q3 Q4 Q1 Q2 Q3 Q4
Base 500 500 500 500 500 500 500 500 503 506 567
Increased 10% 9% - 6% 4% 5% 3% 5% 5% 6% 9% 6%
Remained steady 75% 68% - 63% 56% 61% 63% 63% 68% 77% 73% 74%
Decreased 13% 21% - 30% 38% 33% 33% 27% 27% 17% 18% 20%
Not sure 2% 1% - 2% 2% 1% 1% 1% 1% 0% 0% 0%
Net difference -3% -12% - -24% -34% -28% -30% -22% -22% -11% -9% -14%
Table B.8: Trends in quarterly employment levels outlook in Ireland
Looking ahead to the next 12 months, do you expect number of employees to…
Ireland 2008 2009 2010 Q1 Q2 Q3 Q4 Q1 Q2 Q3 Q4 Q1 Q29 Q3 Q4
Base 500 500 500 500 500 500 500 500 503 506 567
Increased 15% 5% - 3% 7% 5% 6% 8% 7% 12% 12% 15%
Remained steady 78% 74% - 75% 73% 74% 73% 77% 80% 74% 74% 69%
Decreased 6% 17% - 18% 16% 17% 18% 11% 11% 10% 11% 10%
Not sure 2% 4% - 4% 4% 4% 3% 3% 2% 4% 3% 6%
Net difference -2% -12% - -15% -9% -12% -12% -3% -4% 2% 1% 5%
Related Documents
![Insperity Business Confidence Survey: Q4 2014 [Infographic]](https://static.cupdf.com/doc/110x72/55a700761a28abf75e8b4787/insperity-business-confidence-survey-q4-2014-infographic.jpg)